User login
Investigating the cause of infant leukemias
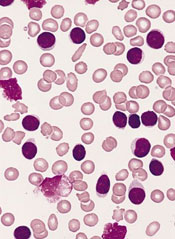
Infants who develop leukemia during the first year of life inherit a combination of genetic variations that can make them highly susceptible to the disease, according to a study published in Leukemia.
Results of whole-exome sequencing suggested that infants with leukemia inherited genetic variants from both parents that, by themselves, would not cause leukemia but, in combination, put the infants at high risk of developing the disease.
“We sequenced every single gene and found that infants with leukemia were born with an excess of damaging changes in genes known to be linked to leukemia,” said study author Todd Druley, MD, PhD, of Washington University School of Medicine in St Louis, Missouri.
“For each child, both parents carried a few harmful genetic variations in their DNA, and, just by chance, their child inherited all of these changes.”
However, it’s unlikely that the inherited variations alone cause leukemia, Dr Druley said. The infants likely needed to accumulate a few additional variations.
To uncover these findings, Dr Druley and his colleagues performed whole-exome sequencing in infants with acute myeloid leukemia (AML), infants with acute lymphoblastic leukemia (ALL), and the mothers of these children. The researchers used the process of elimination to determine a father’s contribution to a child’s DNA.
Among the 23 families studied, there was no history of pediatric cancers. As a comparison, the researchers also sequenced the DNA of 25 healthy children.
The team found the average amount of congenital coding variations was higher in infants with leukemia than in their mothers or the control subjects. The average total variants per exome was 1264.4 in infants with ALL, 1112.6 in their mothers, 2549.9 in infants with AML, 1225.0 in their mothers, and 582.8 in healthy controls.
The researchers then decided to home in on variants that were likely to impart a functional effect associated with leukemia. Using the COSMIC database, the team identified 126 ALL-associated genes and 655 AML-associated genes.
They found an average of 12.1 variants per ALL patient in the ALL-associated genes and 163.4 variants per AML patient in the AML-associated genes. There were 6.4 ALL-associated variants in the ALL patients’ mothers, 132.5 AML-associated variants in the AML patients’ mothers, 1.9 ALL variants in controls, and 27.5 AML variants in controls.
To prioritize genes that might be most relevant to infant leukemia, the researchers looked for compound heterozygous genes and the genes that were most commonly variant in all patients.
All of the infants with AML and 50% of the infants with ALL were compound heterozygotes for MLL3. Sixty-seven percent of AML patients were compound heterozygotes for RYR1 and FLG, and 50% of ALL patients were compound heterozygotes for RBMX.
The most variant (but not necessarily compound heterozygous) AML-associated genes in infants with AML were TTN, MLL3, and FLG. But the ALL-associated genes MDN1, SYNE1, and MLL2 were frequently variable in AML patients as well.
For infants with ALL, MDN1 was the most variable ALL-associated gene. But these infants also had frequent variations in the AML-associated genes TTN, RBMX, and MLL3.
Dr Druley and his colleagues plan to study these variations in more detail to understand how they contribute to infant leukemia development. ![]()
Malaria maps show progress, room for improvement

Credit: CDC
Malaria prevalence maps indicate that, in 2010, nearly 184 million Africans were still living in areas where there is a high risk of contracting malaria, despite a decade of efforts to control the spread of the disease.
The maps showed that 40 African countries experienced reductions in childhood malaria transmission between 2000 and 2010.
Despite this progress, 57% of the population in malaria-endemic countries continued to live in areas of moderate to intense malaria transmission, with infection rates higher than 10%.
These findings are published in The Lancet.
Researchers compiled data from a collection of 26,746 community-based surveys of Plasmodium falciparum prevalence. The surveys covered 3,575,418 person observations from 44 malaria-endemic countries and territories in Africa since 1980.
“Health information systems in many African countries are weak, and it has been difficult to reliably estimate how many people get sick or die of malaria,” said study author Abdisalan Mohamed Noor, PhD, of the Kenya Medical Research Institute-Wellcome Trust Research Programme in Nairobi and the University of Oxford in the UK.
“The population surveys we used in this study are a more reliable indicator for tracking, and we hope our study will help countries assess their progress and adapt their strategies for more effective malaria control.”
Using model-based geostatistics, Dr Noor and his colleagues estimated the proportion of the population, aged 2 to 10 years old, infected with different levels of P falciparum across Africa in 2000 and 2010.
The researchers wanted to evaluate the effects of the Roll Back Malaria Partnership, which was launched in 2000 and resulted in a large increase in investments targeting malaria control.
The team found that the number of people living in high-risk areas, where more than 50% of the population is likely to carry infections, fell from 218.6 million in 2000 to 183.5 million in 2010—a 16% decrease.
But the population living in areas where the risk of infection is considered moderate to high grew from 178.6 million to 280.1 million—a 57% increase.
And the population living in areas where risk is regarded as very low grew from 78.2 million to 128.2 million—a 64% increase.
The researchers also discovered that 10 countries harbor 87% of the population remaining at high risk of malaria transmission. These countries are Guinea, Togo, Mali, Mozambique, Burkina Faso, Ghana, Côte d’Ivoire, Uganda, Nigeria, and the Democratic Republic of Congo.
On the other hand, the team noted that 7 countries have levels of malaria transmission so low that eliminating the disease is a realistic goal. These countries are Cape Verde, Eritrea, South Africa, Ethiopia, Swaziland, Djibouti, and Mayotte.
“The results of our analysis are pause for thought,” said study author Robert Snow, PhD, also of the Kenya Medical Research Institute-Wellcome Trust Research Programme and the University of Oxford.
“On the one hand, it’s a glass half full, with several countries showing significant reductions in malaria transmission. And on the other, it’s a glass half empty, where, despite a decade of massive investment in malaria control, the populations living in several African countries are as likely to be infected with malaria in 2000 as they were 10 years later.” ![]()
How Bcl-2 helps cancer cells survive treatment
Researchers believe they’ve discovered how the Bcl-2 protein helps leukemia and lymphoma cells survive anticancer treatment.
The team found that Bcl-2 alters the level of calcium ions in cancer cells, and this promotes the cells’ survival.
The group thinks these findings, published in PNAS, could help spur the development of drugs that effectively inhibit Bcl-2 and produce better outcomes for cancer patients.
“Since 1993, our team has been conducting research on key mechanisms by which the protein Bcl-2 keeps cancer cells alive,” said study author Clark W. Distelhorst, MD, of Case Western Reserve School of Medicine in Cleveland, Ohio.
“Now, for the first time, we have evidence of how Bcl-2 is promoting abnormally long survival of the cancer cells by regulating calcium levels within cells, and [we] will use the discovery and data to deliver therapies designed to attack the Bcl-2 protein and inhibit its impact.”
More than a decade ago, researchers in Dr Distelhorst’s lab discovered that Bcl-2 binds to the inositol 1,4,5-trisphosphate receptor (InsP3R) channel and regulates the release of calcium ions.
In the current study, the team found that when Bcl-2 binds to the InsP3R channel, it initiates a complex feedback mechanism that blocks the release of calcium ions intended to induce cell death. Instead of dying, the cancer cells continue to proliferate.
Specifically, the researchers discovered that Bcl-2 interacts with the Ca2+-activated protein phosphatase calcineurin (CaN) and dopamine- and cAMP-regulated phosphoprotein of 32 kDa (DARPP-32), a CaN-regulated inhibitor of protein phosphatase 1.
Bcl-2 docks DARPP-32 and CaN on the InsP3R, creating a negative feedback loop that responds to InsP3R-mediated Ca2+ release by inhibiting InsP3R phosphorylation at Ser1755. And this prevents the excessive Ca2+ elevation that induces cell death.
The team theorized that cancer cells overexpressing Bcl-2 may exploit this mechanism to prevent apoptosis. And experiments in chronic lymphocytic leukemia cells appeared to confirm this theory.
The researchers treated the cells with the peptide TAT-IDPDD/AA, which inhibits Bcl-2–InsP3R interaction. This increased P-Ser1755 InsP3R-1 levels and elevated Ca2+, which induced apoptosis.
“We have recognized for decades that cancer cells grow and forget to die,” said Stanton Gerson, MD, director of the Case Comprehensive Cancer Center, who was not involved in this study.
“[N]ow, we understand why. I predict that this work will focus the discovery of new drugs against the Bcl-2-calcium-flow system.” ![]()
VIDEO: Coffee Break 2: What did you learn at the meeting?
WAIKOLOA, HAWAII – Our editor, Heidi Splete, catches up with attendees at the Hawaii Dermatology Seminar to find out what they learned at the meeting that they will take back to their practices.
During a coffee break video interview, doctors said they enjoyed presentations on tips to treat fine lines around the eyes and mouth, the link between psoriasis and increased cardiovascular risks, and the "two Cs" of potential leather allergies.
The video associated with this article is no longer available on this site. Please view all of our videos on the MDedge YouTube channel
FROM SDEF HAWAII DERMATOLOGY SYMPOSIUM

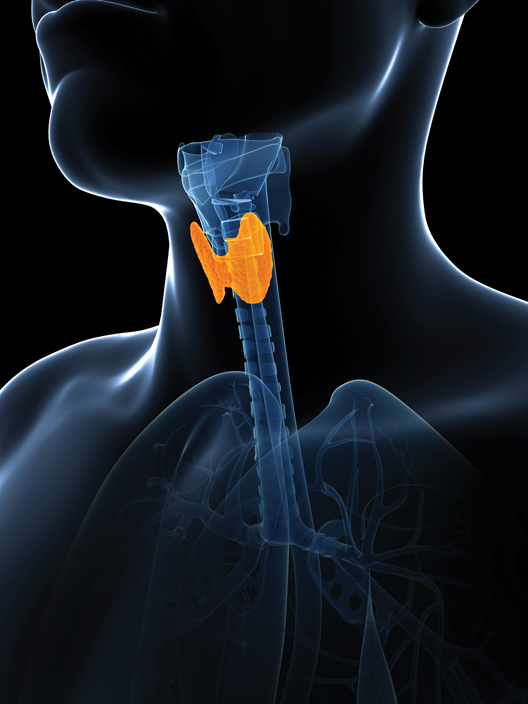
Thyroid cancer rise mostly overdiagnosis
The incidence of thyroid cancer has nearly tripled in the United States since the 1970s. However, this is mainly an epidemic of diagnosis, researchers reported.
Small papillary cancers are not likely to cause death or disease, and women are four times more likely to receive a diagnosis than men, even though autopsy findings show that these cancers occur more frequently in men.
For the research, published online Feb. 20 in JAMA Otolaryngology–Head & Neck Surgery, Dr. Louise Davies and Dr. H. Gilbert Welch reviewed diagnostic trends from the population-based Surveillance, Epidemiology, and End Results (SEER) 9 program, which covers four large U.S. metropolitan areas along with five states. They also reviewed mortality records from the National Vital Statistics System between 1975 and 2009 for the same areas, reported Dr. Davies of the Veterans Affairs Medical Center in White River Junction, Vt., and Dr. Welch of the Dartmouth Institute for Health Policy and Clinical Practice in Hanover, N.H.

The researchers found that thyroid cancer incidence nearly tripled, from 4.9 to 14.3 per 100,000 individuals, in that time period (relative rate, 2.9) and that nearly all of the increase was attributable to diagnoses of small papillary cancers, the least aggressive form of thyroid cancer. The mortality rate from thyroid cancer remained stable – at 0.5 deaths per 100,000 – during the same time, Dr. Davies and Dr. Welch reported (JAMA Otolaryngol. Head Neck Surg. 2014 Feb. 20 [doi: 10.1001/jamaoto.2014.1]).
The investigators saw a much greater absolute increase in thyroid cancer in women, at 3.3-fold (from 6.5 to 21.4 cases per 100,000), than in men, at 2.2-fold (from 3.1 to 6.9), during the study period, which suggests that the burden of overdiagnosis fell heavily on women, they wrote.
Moreover, most thyroid cancers are treated "as though they are destined to cause real problems for the people who have them," Dr. Davies and Dr. Welch wrote, usually with total thyroidectomy, radiation, or both, putting patients at risk for complications and secondary cancers.
Patients – particularly women – might be better served with a less intensive diagnostic and treatment approach to these cancers, and even by relabeling them using a term other than cancer. Clinicians should take care to advise patients of the uncertainty surrounding the small papillary cancers and encourage them to consider the risks of treatment compared with active surveillance, the researchers said.
Dr. Davies and Dr. Welch received support from their institutions for their research; neither declared conflicts of interest.
This is an interesting and important study, but one that is difficult to interpret. We don't yet know which of these cancers, no matter what size, will ultimately prove to be important. Once a diagnosis of cancer is made, it is difficult for patients and doctors to simply continue to observe the cancer. Most patients and doctors are uncomfortable with that.
In addition, the follow-up itself becomes burdensome, with annual ultrasounds and, possibly, multiple needle biopsies over time. Although much of this increased incidence seems related to increased use of imaging studies, several authors have also reported an absolute increase in the incidence of thyroid cancer.
Other issues related to this topic are the extent of surgery that is necessary for these small early cancers. The authors point out that many surgeons perform total thyroidectomy and postoperative radioactive iodine ablation, but there are some who advocate for lesser surgery. This becomes problematic when patients have other smaller nodules in the opposite lobe of the thyroid of uncertain significance. Some national guidelines recommend total or near-total thyroidectomy for T1 and T2 well-differentiated thyroid cancers, and it is difficult to go against these guidelines. What is really needed are better molecular and genetic tests to better define which well-differentiated thyroid cancers are likely to act in a more aggressive manner, and which are not.
Mark C. Weissler, M.D., FACS, is the J.P. Riddle Distinguished Professor of Otolaryngology-Head and Neck Surgery at the University of North Carolina, Chapel Hill. Dr. Weissler had no disclosures.
The incidence of thyroid cancer has nearly tripled in the United States since the 1970s. However, this is mainly an epidemic of diagnosis, researchers reported.
Small papillary cancers are not likely to cause death or disease, and women are four times more likely to receive a diagnosis than men, even though autopsy findings show that these cancers occur more frequently in men.
For the research, published online Feb. 20 in JAMA Otolaryngology–Head & Neck Surgery, Dr. Louise Davies and Dr. H. Gilbert Welch reviewed diagnostic trends from the population-based Surveillance, Epidemiology, and End Results (SEER) 9 program, which covers four large U.S. metropolitan areas along with five states. They also reviewed mortality records from the National Vital Statistics System between 1975 and 2009 for the same areas, reported Dr. Davies of the Veterans Affairs Medical Center in White River Junction, Vt., and Dr. Welch of the Dartmouth Institute for Health Policy and Clinical Practice in Hanover, N.H.
The researchers found that thyroid cancer incidence nearly tripled, from 4.9 to 14.3 per 100,000 individuals, in that time period (relative rate, 2.9) and that nearly all of the increase was attributable to diagnoses of small papillary cancers, the least aggressive form of thyroid cancer. The mortality rate from thyroid cancer remained stable – at 0.5 deaths per 100,000 – during the same time, Dr. Davies and Dr. Welch reported (JAMA Otolaryngol. Head Neck Surg. 2014 Feb. 20 [doi: 10.1001/jamaoto.2014.1]).
The investigators saw a much greater absolute increase in thyroid cancer in women, at 3.3-fold (from 6.5 to 21.4 cases per 100,000), than in men, at 2.2-fold (from 3.1 to 6.9), during the study period, which suggests that the burden of overdiagnosis fell heavily on women, they wrote.
Moreover, most thyroid cancers are treated "as though they are destined to cause real problems for the people who have them," Dr. Davies and Dr. Welch wrote, usually with total thyroidectomy, radiation, or both, putting patients at risk for complications and secondary cancers.
Patients – particularly women – might be better served with a less intensive diagnostic and treatment approach to these cancers, and even by relabeling them using a term other than cancer. Clinicians should take care to advise patients of the uncertainty surrounding the small papillary cancers and encourage them to consider the risks of treatment compared with active surveillance, the researchers said.
Dr. Davies and Dr. Welch received support from their institutions for their research; neither declared conflicts of interest.
FROM JAMA OTOLARYNGOLOGY – HEAD & NECK SURGERY
Bridging the gap: a palliative care consultation service in a hematological malignancy–bone marrow transplant unit
Background There is often a lack of collaboration between hematological malignancy–bone marrow transplantation (HM-BMT) units and palliative care (PC) services. In this paper, we describe a quality improvement project that sought to close this gap at a tertiary care hospital in Pittsburgh, Pennsylvania, from August 2006 to May 2010.
Design and methods Through a needs assessment, didactic lectures, clinical consultation, and the informal presence of PC clinicians, the team created a palliative care service in HM-BMT unit of the Western Pennsylvania Hospital in Pittsburgh. The following data were collected for each consult: referral reason, daily pain assessments, whether or not a “goals of care” conversation took place, and hospice enrollment. Lastly, satisfaction surveys were administered.
Results During the program, 392 PC consultations were provided to 256 unique patients. Of these 256 patients, the PC clinicians documented the first goals of care conversations in 67% of patients (n = 172). Of the 278 consults referred for pain, 70% (n = 194) involved reports of unacceptable or very unacceptable pain at baseline. Sixty-six percent (n = 129) of these 194 consults involved reports of pain that was acceptable or very acceptable within 48 hours of consultation. In addition, the hospice referral rate grew from a pre-implementation rate of 5% to 41% (n = 67) of 165 patients who died during the period of program implementation. Lastly, hematological oncologists reported high levels of satisfaction with the program.
Limitations The main limitation of this project is that it was a single institution study.
Conclusion The successful integration of a PC team into a hematological malignancy unit suggests great potential for positive interdisciplinary collaboration between these two fields.
Click on the PDF icon at the top of this introduction to read the full article.
Implementing inpatient, evidence-based, antihistamine-transfusion premedication guidelines at a single academic US hospital
Allergic transfusion reactions (ATRs) are a common complication of blood transfusions. Advances in transfusion medicine have significantly decreased the incidence of ATRs; however, ATRs continue to be burdensome for patients and problematic for providers who regularly order packed red blood cells and platelet transfusions. To further decrease the frequency of ATRs, routine premedication with diphenhydramine is common practice and is part of “transfusion culture” in a majority of institutions. In this article, we review the history, practice, and literature of transfusion premedication, specifically antihistamines given the adverse-effect profile. We discuss the rationale and original academic studies, which have supported the use of premedication for transfusions for decades.
Click on the PDF icon at the top of this introduction to read the full article.
Certitude and humility in rheumatology
In the wake of the actor Philip Seymour Hoffman’s death, I’ve been thinking a lot about the movie Doubt. In it, Hoffman plays Father Brendan Flynn, a Catholic priest newly assigned to a parish in the Bronx. The school attached to the parish is run by the strict Sister Aloysius Beauvier, played by Meryl Streep. She is suspicious of the priest’s motives behind his befriending a boy, who happens to be the school’s only black student. The boy’s mother welcomes the friendship, as it provides shelter from his abusive father, and begs Sister Beauvier to leave things alone. But the nun doggedly pursues the issue, and in the end she succeeds in getting the priest removed from the parish.
Being relatively new to private practice, I constantly reflect on my methods. I have gotten the diagnosis wrong sometimes, and while I understand that this happens to even the most seasoned among us, when it happens to me, I cannot help but feel like an impostor, unqualified and incompetent. When I risk doing harm to a patient by giving them medications that may not work, I feel like curling up under the covers and not ever coming out. Steroids and chronic immunosuppression don’t exactly inspire confidence. It does not help that rheumatology isn’t the most exact of specialties and the diseases that we diagnose and treat are nebulous by nature.
Therefore, I would venture to say that rheumatologists are probably more comfortable with ambiguity than most other specialists. That’s not easy for a scientist to say; the object of science, after all, is to find answers. Certitude is comforting. Patients expect that from us, and we do our best to provide it. But it is not always possible through no fault of our own, but as a limitation of the field itself. In such situations, it can be very humbling to acknowledge that there are gaps in our knowledge.
I am learning to be comfortable with saying, "I don’t know. I need help. I cannot figure this out on my own." If I do not allow myself to question my judgment, I run the risk of harming this person who trusts me implicitly. Humility and certitude are, in our imperfect science, two sides of the same patient care coin that can spell the difference in a patient’s outcome.
After all, questioning is integral to the pursuit of knowledge. Great science is not possible without curiosity. The philosopher Simon Critchley says that "knowledge is precise, but that precision is confined within a certain toleration of uncertainty." Therefore, just as there is comfort in certitude, there is also some comfort in doubt.
At the end of the movie, we are left wondering if Father Flynn is guilty of abusing the young boy. But we’re not meant to know. In fact, the cast, except for Hoffman, did not know either. Not knowing is the point. We are meant to examine our attitudes toward conviction, toward truth, to the extent that it is limited by what is knowable. As Father Flynn in the movie says: "Doubt can be a bond as powerful and sustaining as certainty. When you are lost, you are not alone."
Dr. Chan practices rheumatology in Pawtucket, R.I.
Practice Question Answers: Closure Materials
1. Which of the following suture properties is most responsible for accommodation of edema postoperatively?
a. memory
b. plasticity
c. pliability
d. size
e. stretching
2. Which of the following has the highest memory?
a. coated polyester (Ethibond Excel)
b. poliglecaprone 25 (Monocryl)
c. polyglactin 910 (Vicryl)
d. silk
e. stainless steel
3. The most worrisome consequence of capillarity is:
a. increased potential of translocation of bacterium in a wound
b. increased reactivity
c. increased spitting of suture
d. increased wound edema
e. decreased tensile strength
4. Which of the following would be an excellent choice for closing the mucosal surface on an Abbe flap repair?
a. 2-octyl cyanoacrylate (Dermabond Advanced)
b. 5-0 chromic gut
c. 5-0 coated polyester (Ethibond Excel)
d. 5-0 polybutester (Novafil)
e. polypropylene (Prolene)
5. Knot security is thought to be most directly related to which property of suture:
a. coefficient of friction
b. configuration
c. memory
d. size
e. tensile strength