User login
Old gout drug learns new cardiac tricks
SAN FRANCISCO – The venerable antihyperuricemic agent allopurinol has shown early promise for two novel cardiovascular applications: prevention of atrial fibrillation in the setting of heart failure and reduction of left ventricular hypertrophy in patients with type 2 diabetes.
Allopurinol is a xanthine oxidase inhibitor and antigout drug. The rationale for the drug’s use in reducing the incidence of atrial fibrillation in patients with heart failure lies in the observation that serum uric acid has emerged as an independent marker of mortality and a predictor of new-onset atrial fibrillation in heart failure. Xanthine oxidase is not only a source of reactive oxygen species that adversely affect myocardial function, but it also catalyzes the conversion of xanthine to uric acid, Dr. Fernando E. Hernandez explained at the annual meeting of the American College of Cardiology.
He presented a retrospective cohort study involving 603 patients enrolled in the Miami Veterans Affairs heart failure clinic. The 103 on allopurinol, and the 500 who were not, matched up well in terms of baseline characteristics including age, prevalence of coronary artery disease, median left ventricular ejection, left atrial size, and use of guideline-recommended ACE inhibitors and beta-blockers.
During up to 5 years of follow-up, the incidence of new-onset atrial fibrillation was 184 cases/1,000 person-years in the allopurinol users compared with 252/1,000 person-years in controls. In a Cox proportional hazards analysis adjusted for small differences in potential confounders, the use of allopurinol was independently associated with a 47% reduction in the risk of atrial fibrillation (P = .04), reported Dr. Hernandez of the University of Miami.
This intriguing finding needs to be confirmed in randomized prospective trials, he noted.
In a separate presentation, Dr. Benjamin R. Szwejkowski noted that left ventricular hypertrophy (LVH) is common in patients with type 2 diabetes and contributes to their elevated risk of cardiovascular morbidity and mortality.
Based on their hypothesis that LVH is related in part to oxidative stress and reducing that stress via xanthine oxidase inhibition using allopurinol can cause LVH regression, the investigators conducted a randomized, double-blind placebo-controlled clinical trial. Sixty-six patients with type 2 diabetes and echocardiographic evidence of LVH were randomized to allopurinol at 600 mg/day or placebo for 9 months.
The primary study endpoint was change in left ventricular mass between baseline and 9 months, as measured by cardiac MRI. Allopurinol resulted in a significant mean 2.65-g reduction in LV mass, while in the control group LV mass increased by 1.21 g. Similarly, LV mass indexed to body surface area fell significantly by 1.32 g/m2 in the allopurinol group while increasing by 0.65 g/m2 in the placebo arm, reported Dr. Szwejkowski of the University of Dundee(Scotland).
"Allopurinol may be a useful therapy to reduce cardiovascular risk in type 2 diabetic patients with LVH," according to the cardiologist.
Flow-mediated dilatation didn’t change significantly over time in either study group.
Dr. Szwejkowski and Dr. Hernandez reported having no relevant financial conflicts.
AT ACC 13
Major finding: At the end of 5 years of allopurinol use, the incidence of new-onset atrial fibrillation was 184 cases/1,000 person-years in the allopurinol users compared with 252/1,000 person-years in controls.
Data source: A retrospective cohort study involving 603 patients with heart failure.
Disclosures: The study presenters reported having no relevant financial conflicts.
New concussion guidelines stress individualized approach
Any athlete with a possible concussion should be immediately removed from play pending an evaluation by a licensed health care provider trained in assessing concussions and traumatic brain injury, according to a new guideline from the American Academy of Neurology.
The guideline for evaluating and managing athletes with concussion was published online in the journal Neurology on March 18 (doi:10.1212/WNL.0b013e31828d57dd) in conjunction with the annual meeting of the AAN. The guideline replaces the Academy’s 1997 recommendations, which stressed using a grading system to try to predict concussion outcomes.

The new guideline takes a more individualized and conservative approach, especially for younger athletes. The new approach comes as many states have enacted legislation regulating when young athletes can return to play following a concussion.
"If in doubt, sit it out," Dr. Jeffrey S. Kutcher, coauthor of the guideline and a neurologist at the University of Michigan in Ann Arbor, said in a statement. "Being seen by a trained professional is extremely important after a concussion. If headaches or other symptoms return with the start of exercise, stop the activity and consult a doctor. You only get one brain; treat it well."
The new guideline calls for athletes to stay off the field until they are asymptomatic off medication. High school athletes and younger players with a concussion should be managed more conservatively since they take longer to recover than older athletes, according to the AAN.
But there is not enough evidence to support complete rest after a concussion. Activities that do not worsen symptoms and don’t pose a risk of another concussion can be part of the management of the injury, according to the guideline.
"We’re moved away from the concussion grading systems we first established in 1997 and are now recommending concussion and return to play be assessed in each athlete individually," Dr. Christopher C. Giza, the co–lead guideline author and a neurologist at Mattel Children’s Hospital at the University of California, Los Angeles, said in a statement. "There is no set timeline for safe return to play."
The AAN expert panel recommends that sideline providers use symptom checklists such as the Standardized Assessment of Concussion to help identify suspected concussion and that the scores be shared with the physicians involved in the athletes’ care off the field. But these checklists should not be the only tool used in making a diagnosis, according to the guidelines. Also, the checklist scores may be more useful if they are compared against preinjury individual scores, especially in younger athletes and those with prior concussions.
CT imaging should not be used to diagnose a suspected sport-related concussion, according to the guideline. But imaging might be used to rule out more serious traumatic brain injuries, such as intracranial hemorrhage in athletes with a suspected concussion who also have a loss of consciousness, posttraumatic amnesia, persistently altered mental status, focal neurologic deficit, evidence of skull fracture, or signs of clinical deterioration.
Athletes are at greater risk of concussion if they have a history of concussion. The first 10 days after a concussion pose the greatest risk for a repeat injury.
The AAN advises physicians to be on the lookout for ongoing symptoms that are linked to a longer recovery, such as continued headache or fogginess. Athletes with a history of concussions and younger players also tend to have a longer recovery.
The guideline also include level C recommendations stating that health care providers "might" develop individualized graded plans for returning to physical and cognitive activity. They might also provide cognitive restructuring counseling in an effort to shorten the duration of symptoms and the likelihood of developing chronic post-concussion syndrome, according to the guideline.
The guideline also included a number of recommendations on areas for future research, including studies of pre–high school age athletes to determine the natural history of concussion and recovery time for this age group, as well as the best assessment tools. The expert panel also called for clinical trials of different postconcussion management strategies and return-to-play protocols.
The guidelines were developed by a multidisciplinary expert committee that included representatives from neurology, athletic training, neuropsychology, epidemiology and biostatistics, neurosurgery, physical medicine and rehabilitation, and sports medicine. Many of the authors reported serving as consultants for professional sports associations, receiving honoraria and funding for travel for lectures on sports concussion, receiving research support from various foundations and organizations, and providing expert testimony in legal cases involving traumatic brain injury or concussion.
One of the most important statements in the new guideline
is that providers should not rely on a single diagnostic test when evaluating
an athlete, said Dr. Barry Jordan, the assistant medical director and attending
neurologist at the Burke Rehabilitation Hospital in White Plains, N.Y. Dr.
Jordan, who is an expert on sports concussions, said he’s seen too many
providers using a single computerized screening tool to assess whether an
athlete is well enough to return to play.
The new
guideline calls on providers to combine screening checklists with clinical
findings when making the determination about whether an athlete is well enough
to return to the field. Dr. Jordan
said this comprehensive approach is the way to go. And physicians who are
knowledgeable about concussions must be involved with that evaluation, he said.

|
| Dr. Barry Jordan |
The new guideline is an important update reflecting
the movement away from grading concussions to a more individualized approach. "You can't grade the severity until the concussion is over," he said.
Dr. Jordan
said the AAN guideline is "clear and easy to follow" and will results in better
care if followed.
Dr.
Barry Jordan is the director of the Brain Injury Program at Burke
Rehabilitation Hospital in White Plains, N.Y. He works with several sports
organizations including the New York State Athletic Commission, U.S.A. Boxing, and the National
Football League Players Association. He also writes a bimonthly column for
Clinical Neurology News called “On the Sidelines.”
One of the most important statements in the new guideline
is that providers should not rely on a single diagnostic test when evaluating
an athlete, said Dr. Barry Jordan, the assistant medical director and attending
neurologist at the Burke Rehabilitation Hospital in White Plains, N.Y. Dr.
Jordan, who is an expert on sports concussions, said he’s seen too many
providers using a single computerized screening tool to assess whether an
athlete is well enough to return to play.
The new
guideline calls on providers to combine screening checklists with clinical
findings when making the determination about whether an athlete is well enough
to return to the field. Dr. Jordan
said this comprehensive approach is the way to go. And physicians who are
knowledgeable about concussions must be involved with that evaluation, he said.
|
|
| Dr. Barry Jordan |
The new guideline is an important update reflecting
the movement away from grading concussions to a more individualized approach. "You can't grade the severity until the concussion is over," he said.
Dr. Jordan
said the AAN guideline is "clear and easy to follow" and will results in better
care if followed.
Dr.
Barry Jordan is the director of the Brain Injury Program at Burke
Rehabilitation Hospital in White Plains, N.Y. He works with several sports
organizations including the New York State Athletic Commission, U.S.A. Boxing, and the National
Football League Players Association. He also writes a bimonthly column for
Clinical Neurology News called “On the Sidelines.”
Any athlete with a possible concussion should be immediately removed from play pending an evaluation by a licensed health care provider trained in assessing concussions and traumatic brain injury, according to a new guideline from the American Academy of Neurology.
The guideline for evaluating and managing athletes with concussion was published online in the journal Neurology on March 18 (doi:10.1212/WNL.0b013e31828d57dd) in conjunction with the annual meeting of the AAN. The guideline replaces the Academy’s 1997 recommendations, which stressed using a grading system to try to predict concussion outcomes.
The new guideline takes a more individualized and conservative approach, especially for younger athletes. The new approach comes as many states have enacted legislation regulating when young athletes can return to play following a concussion.
"If in doubt, sit it out," Dr. Jeffrey S. Kutcher, coauthor of the guideline and a neurologist at the University of Michigan in Ann Arbor, said in a statement. "Being seen by a trained professional is extremely important after a concussion. If headaches or other symptoms return with the start of exercise, stop the activity and consult a doctor. You only get one brain; treat it well."
The new guideline calls for athletes to stay off the field until they are asymptomatic off medication. High school athletes and younger players with a concussion should be managed more conservatively since they take longer to recover than older athletes, according to the AAN.
But there is not enough evidence to support complete rest after a concussion. Activities that do not worsen symptoms and don’t pose a risk of another concussion can be part of the management of the injury, according to the guideline.
"We’re moved away from the concussion grading systems we first established in 1997 and are now recommending concussion and return to play be assessed in each athlete individually," Dr. Christopher C. Giza, the co–lead guideline author and a neurologist at Mattel Children’s Hospital at the University of California, Los Angeles, said in a statement. "There is no set timeline for safe return to play."
The AAN expert panel recommends that sideline providers use symptom checklists such as the Standardized Assessment of Concussion to help identify suspected concussion and that the scores be shared with the physicians involved in the athletes’ care off the field. But these checklists should not be the only tool used in making a diagnosis, according to the guidelines. Also, the checklist scores may be more useful if they are compared against preinjury individual scores, especially in younger athletes and those with prior concussions.
CT imaging should not be used to diagnose a suspected sport-related concussion, according to the guideline. But imaging might be used to rule out more serious traumatic brain injuries, such as intracranial hemorrhage in athletes with a suspected concussion who also have a loss of consciousness, posttraumatic amnesia, persistently altered mental status, focal neurologic deficit, evidence of skull fracture, or signs of clinical deterioration.
Athletes are at greater risk of concussion if they have a history of concussion. The first 10 days after a concussion pose the greatest risk for a repeat injury.
The AAN advises physicians to be on the lookout for ongoing symptoms that are linked to a longer recovery, such as continued headache or fogginess. Athletes with a history of concussions and younger players also tend to have a longer recovery.
The guideline also include level C recommendations stating that health care providers "might" develop individualized graded plans for returning to physical and cognitive activity. They might also provide cognitive restructuring counseling in an effort to shorten the duration of symptoms and the likelihood of developing chronic post-concussion syndrome, according to the guideline.
The guideline also included a number of recommendations on areas for future research, including studies of pre–high school age athletes to determine the natural history of concussion and recovery time for this age group, as well as the best assessment tools. The expert panel also called for clinical trials of different postconcussion management strategies and return-to-play protocols.
The guidelines were developed by a multidisciplinary expert committee that included representatives from neurology, athletic training, neuropsychology, epidemiology and biostatistics, neurosurgery, physical medicine and rehabilitation, and sports medicine. Many of the authors reported serving as consultants for professional sports associations, receiving honoraria and funding for travel for lectures on sports concussion, receiving research support from various foundations and organizations, and providing expert testimony in legal cases involving traumatic brain injury or concussion.
FROM NEUROLOGY

Sleep in Hospitalized Adults
Lack of sleep is a common problem in hospitalized patients and is associated with poorer health outcomes, especially in older patients.[1, 2, 3] Prior studies highlight a multitude of factors that can result in sleep loss in the hospital[3, 4, 5, 6] with 1 of the most common causes of sleep disruption in the hospital being noise.[7, 8, 9]
In addition to external factors, such as hospital noise, there may be inherent characteristics that predispose certain patients to greater sleep loss when hospitalized. One such measure is the construct of perceived control or the psychological measure of how much individuals expect themselves to be capable of bringing about desired outcomes.[10] Among older patients, low perceived control is associated with increased rates of physician visits, hospitalizations, and death.[11, 12] In contrast, patients who feel more in control of their environment may experience positive health benefits.[13]
Yet, when patients are placed in a hospital setting, they experience a significant reduction in control over their environment along with an increase in dependency on medical staff and therapies.[14, 15] For example, hospitalized patients are restricted in their personal decisions, such as what clothes they can wear and what they can eat and are not in charge of their own schedules, including their sleep time.
Although prior studies suggest that perceived control over sleep is related to actual sleep among community‐dwelling adults,[16, 17] no study has examined this relationship in hospitalized adults. Therefore, the aim of our study was to examine the possible association between perceived control, noise levels, and sleep in hospitalized middle‐aged and older patients.
METHODS
Study Design
We conducted a prospective cohort study of subjects recruited from a large ongoing study of admitted patients at the University of Chicago inpatient general medicine service.[18] Because we were interested in middle‐aged and older adults who are most sensitive to sleep disruptions, patients who were age 50 years and over, ambulatory, and living in the community were eligible for the study.[19] Exclusion criteria were cognitive impairment (telephone version of the Mini‐Mental State Exam <17 out of 22), preexisting sleeping disorders identified via patient charts, such as obstructive sleep apnea and narcolepsy, transfer from the intensive care unit (ICU), and admission to the hospital more than 72 hours prior to enrollment.[20] These inclusion and exclusion criteria were selected to identify a patient population with minimal sleep disturbances at baseline. Patients under isolation were excluded because they are not visited as frequently by the healthcare team.[21, 22] Most general medicine rooms were double occupancy but efforts were made to make patient rooms single when possible or required (ie, isolation for infection control). The study was approved by the University of Chicago Institutional Review Board.
Subjective Data Collection
Baseline levels of perceived control over sleep, or the amount of control patients believe they have over their sleep, were assessed using 2 different scales. The first tool was the 8‐item Sleep Locus of Control (SLOC) scale,[17] which ranges from 8 to 48, with higher values corresponding to a greater internal locus of control over sleep. An internal sleep locus of control indicates beliefs that patients feel that they are primarily responsible for their own sleep as opposed to an external locus of control which indicates beliefs that good sleep is due to luck or chance. For example, patients were asked how strongly they agree or disagree with statements, such as, If I take care of myself, I can avoid insomnia and People who never get insomnia are just plain lucky (see Supporting Information, Appendix 2, in the online version of this article). The second tool was the 9‐item Sleep Self‐Efficacy (SSE) scale,[23] which ranges from 9 to 45, with higher values corresponding to greater confidence patients have in their ability to sleep. One of the items asks, How confident are you that you can lie in bed feeling physically relaxed (see Supporting Information, Appendix 1, in the online version of this article)? Both instruments have been validated in an outpatient setting.[23] These surveys were given immediately on enrollment in the study to measure baseline perceived control.
Baseline sleep habits were also collected on enrollment using the Epworth Sleepiness Scale,[24, 25] a standard validated survey that assesses excess daytime sleepiness in various common situations. For each day in the hospital, patients were asked to report in‐hospital sleep quality using the Karolinska Sleep Log.[26] The Karolinska Sleep Quality Index (KSQI) is calculated from 4 items on the Karolinska Sleep Log (sleep quality, sleep restlessness, slept throughout the night, ease of falling asleep). The questions are on a 5‐point scale and the 4 items are averaged for a final score out of 5 with a higher number indicating better subjective sleep quality. The item How much was your sleep disturbed by noise? on the Karolinska Sleep Log was used to assess the degree to which noise was a disruptor of sleep. This question was also on a 5‐point scale with higher scores indicating greater disruptiveness of noise. Patients were also asked how disruptive noise from roommates was on a nightly basis using this same scale.
Objective Data Collection
Wrist activity monitors (Actiwatch 2; Respironics, Inc., Murrysville, PA)[27, 28, 29, 30] were used to measure patient sleep. Actiware 5 software (Respironics, Inc.)[31] was used to estimate quantitative measures of sleep time and efficiency. Sleep time is defined as the total duration of time spent sleeping at night and sleep efficiency is defined as the fraction of time, reported as a percentage, spent sleeping by actigraphy out of the total time patients reported they were sleeping.
Sound levels in patient rooms were recorded using Larson Davis 720 Sound Level Monitors (Larson Davis, Inc., Provo, UT). These monitors store functional average sound pressure levels in A‐weighted decibels called the Leq over 1‐hour intervals. The Leq is the average sound level over the given time interval. Minimum (Lmin) and maximum (Lmax) sound levels are also stored. The LD SLM Utility Program (Larson Davis, Inc.) was used to extract the sound level measurements recorded by the monitors.
Demographic information (age, gender, race, ethnicity, highest level of education, length of stay in the hospital, and comorbidities) was obtained from hospital charts via an ongoing study of admitted patients at the University of Chicago Medical Center inpatient general medicine service.[18] Chart audits were performed to determine whether patients received pharmacologic sleep aids in the hospital.
Data Analysis
Descriptive statistics were used to summarize mean sleep duration and sleep efficiency in the hospital as well as SLOC and SSE. Because the SSE scores were not normally distributed, the scores were dichotomized at the median to create a variable denoting high and low SSE. Additionally, because the distribution of responses to the noise disruption question was skewed to the right, reports of noise disruptions were grouped into not disruptive (score=1) and disruptive (score>1).
Two‐sample t tests with equal variances were used to assess the relationship between perceived control measures (high/low SLOC, SSE) and objective sleep measures (sleep time, sleep efficiency). Multivariate linear regression was used to test the association between high SSE (independent variable) and sleep time (dependent variable), clustering for multiple nights of data within the subject. Multivariate logistic regression, also adjusting for subject, was used to test the association between high SSE and noise disruptiveness and the association between high SSE and Karolinska scores. Leq, Lmax, and Lmin were all tested using stepwise forward regression. Because our prior work[9] demonstrated that noise levels separated into tertiles were significantly associated with sleep time, our analysis also used noise levels separated into tertiles. Stepwise forward regression was used to add basic patient demographics (gender, race, age) to the models. Statistical significance was defined as P<0.05, and all statistical analysis was done using Stata 11.0 (StataCorp, College Station, TX).
RESULTS
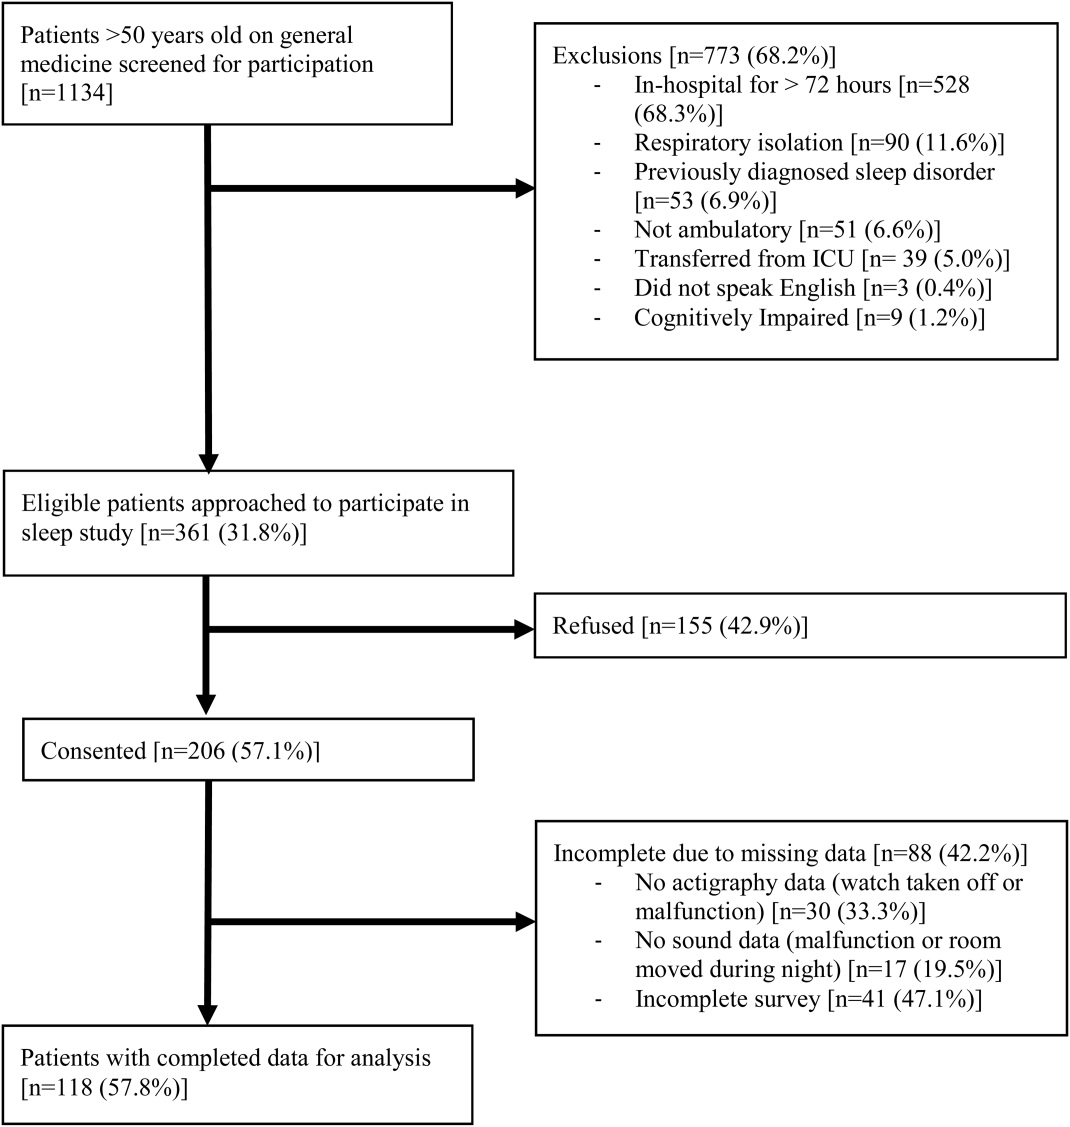
From April 2010 to May 2012, 1134 patients were screened by study personnel for this study via an ongoing study of hospitalized patients on the inpatient general medicine ward. Of the 361 (31.8%) eligible patients, 206 (57.1%) consented to participate. Of the subjects enrolled in the study, 118 were able to complete at least 1 night of actigraphy, sound monitoring, and subjective assessment for a total of 185 patient nights (Figure 1).
The majority of patients were female (57%), African American (67%), and non‐Hispanic (97%). The mean age was 65 years (standard deviation [SD], 11.6 years), and the median length of stay was 4 days (interquartile range [IQR], 36). The majority of patients also had hypertension (67%), with chronic obstructive pulmonary disease [COPD] (31%) and congestive heart failure (31%) being the next most common comorbidities. About two‐thirds of subjects (64%) were characterized as average or above average sleepers with Epworth Sleepiness Scale scores 9[20] (Table 1). Only 5% of patients received pharmacological sleep aids.
| Value, n (%)a | |
|---|---|
| |
| Patient characteristics | |
| Age, mean (SD), y | 63 (12) |
| Length of stay, median (IQR), db | 4 (36) |
| Female | 67 (57) |
| African American | 79 (67) |
| Hispanic | 3 (3) |
| High school graduate | 92 (78) |
| Comorbidities | |
| Hypertension | 79 (66) |
| Chronic obstructive pulmonary disease | 37 (31) |
| Congestive heart failure | 37 (31) |
| Diabetes | 36 (30) |
| End stage renal disease | 23 (19) |
| Baseline sleep characteristics | |
| Sleep duration, mean (SD), minc | 333 (128) |
| Epworth Sleepiness Scale, score 9d | 73 (64) |
The mean baseline SLOC score was 30.4 (SD, 6.7), with a median of 31 (IQR, 2735). The mean baseline SSE score was 32.1 (SD, 9.4), with a median of 34 (IQR, 2441). Fifty‐four patients were categorized as having high sleep self‐efficacy (high SSE), which we defined as scoring above the median of 34.
Average in‐hospital sleep was 5.5 hours (333 minutes; SD, 128 minutes) which was significantly shorter than the self‐reported sleep duration of 6.5 hours prior to admission (387 minutes, SD, 125 minutes; P=0.0001). The mean sleep efficiency was 73% (SD, 19%) with 55% of actigraphy nights below the normal range of 80% efficiency for adults.[19] Median KSQI was 3.5 (IQR, 2.254.75), with 41% of the patients with a KSQI 3, putting them in the insomniac range.[32] The median score on the noise disruptiveness question was 1 (IQR, 14) with 42% of reports coded as disruptive defined as a score >1 on the 5‐point scale. The median score on the roommate disruptiveness question was 1 (IQR, 11) with 77% of responses coded as not disruptive defined as a score of 1 on the 5‐point scale.
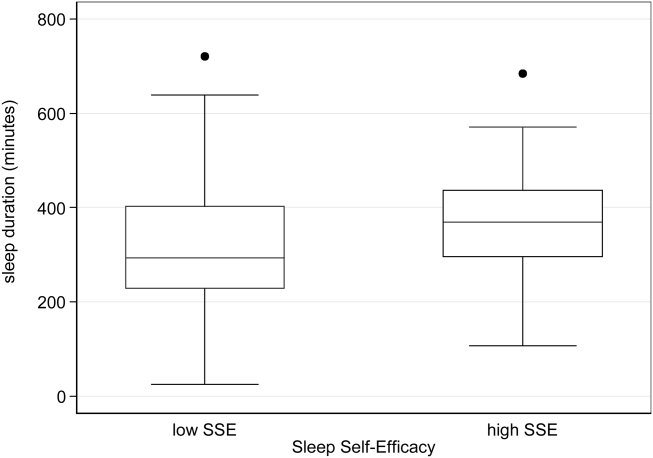
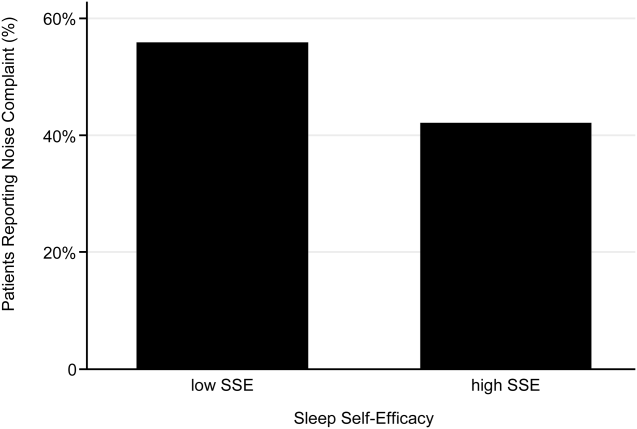
A 2‐sample t test with equal variances showed that those patients reporting high SSE were more likely to sleep longer in the hospital than those reporting low SSE (364 minutes 95% confidence interval [CI]: 340, 388 vs 309 minutes 95% CI: 283, 336; P=0.003) (Figure 2). Patients with high SSE were also more likely to have a normal sleep efficiency (above 80%) compared to those with low SSE (54% 95% CI: 43, 65 vs 38% 95% CI: 28,47; P=0.028). Last, there was a trend toward patients reporting higher SSE to also report less noise disruption compared to those patients with low SSE ([42%] 95% CI: 31, 53 vs [56%] 95% CI: 46, 65; P=0.063) (Figure 3).
Linear regression clustered by subject showed that high SSE was associated with longer sleep duration (55 minutes 95% CI: 14, 97; P=0.010). Furthermore, high SSE was significantly associated with longer sleep duration after controlling for both objective noise level and patient demographics in the model using stepwise forward regression (50 minutes 95% CI: 11, 90; P=0.014) (Table 2).
| Sleep Duration (min) | Model 1 Beta [95% CI]a | Model 2 Beta [95% CI]a |
|---|---|---|
| ||
| High SSE | 55 [14, 97]b | 50 [11, 90]b |
| Lmin tert 3 | 14 [59, 29] | |
| Lmin tert 2 | 21 [65, 23] | |
| Female | 49 [10, 89]b | |
| African American | 16 [59, 27] | |
| Age | 1 [0.9, 3] | |
| Karolinska Sleep Quality | Model 1 OR [95% CI]c | Model 2 OR [95% CI]c |
| High SSE | 2.04 [1.12, 3.71]b | 2.01 [1.06, 3.79]b |
| Lmin tert 3 | 0.90 [0.37, 2.2] | |
| Lmin tert 2 | 0.86 [0.38, 1.94] | |
| Female | 1.78 [0.90, 3.52] | |
| African American | 1.19 [0.60, 2.38] | |
| Age | 1.02 [0.99, 1.05] | |
| Noise Complaints | Model 1 OR [95% CI]d | Model 2 OR [95% CI]d |
| High SSE | 0.57 [0.30, 1.12] | 0.49 [0.25, 0.96]b |
| Lmin tert 3 | 0.85 [0.39, 1.84] | |
| Lmin tert 2 | 0.91 [0.43, 1.93] | |
| Female | 1.40 [0.71, 2.78] | |
| African American | 0.35 [0.17, 0.70] | |
| Age | 1.00 [0.96, 1.03] | |
| Age2e | 1.00 [1.00, 1.00] | |
Logistic regression clustered by subject demonstrated that patients with high SSE had 2 times higher odds of having a KSQI score above 3 (95% CI: 1.12, 3.71; P=0.020). This association was still significant after controlling for noise and patient demographics (OR: 2.01; 95% CI: 1.06, 3.79; P=0.032). After controlling for noise levels and patient demographics, there was a statistically significant association between high SSE and lower odds of noise complaints (OR: 0.49; 95% CI: 0.25, 0.96; P=0.039) (Table 2). Although demographic characteristics were not associated with high SSE, those patients with high SSE had lower odds of being in the loudest tertile rooms (OR: 0.34; 95% CI: 0.15, 0.74; P=0.007).
In multivariate linear regression analyses, there were no significant relationships between SLOC scores and KSQI, reported noise disruptiveness, and markers of sleep (sleep duration or sleep efficiency).
DISCUSSION
This study is the first to examine the relationship between perceived control, noise levels, and objective measurements of sleep in a hospital setting. One measure of perceived control, namely SSE, was associated with objective sleep duration, subjective and objective sleep quality, noise levels in patient rooms, and perhaps also patient complaints of noise. These associations remained significant after controlling for objective noise levels and patient demographics, suggesting that SSE is independently related to sleep.
In contrast to SSE, SLOC was not found to be significantly associated with either subjective or objective measures of sleep quality. The lack of association may be due to the fact that the SLOC questionnaire does not translate as well to the inpatient setting as the SSE questionnaire. The SLOC questionnaire focuses on general beliefs about sleep whereas the SSE questionnaire focuses on personal beliefs about one's own ability sleep in the immediate future, which may make it more relevant in the inpatient setting (see Supporting Information, Appendix 1 and 2, in the online version of this article).
Given our findings, it is important to identify why patients with high SSE have better sleep and fewer noise complaints. One possibility is that sleep self‐efficacy is an inherited trait unique to each person that is also predictive of a patient's sleep patterns. However, is it also possible that those patients with high SSE feel more empowered to take control of their environment, allowing them to advocate for better sleep? This hypothesis is further strengthened by the finding that those patients with high SSE on study entry were less likely to be in the noisiest rooms. This raises the possibility that at least 1 of the mechanisms by which high SSE may be protective against sleep loss is through patients taking an active role in noise reduction, such as closing the door or advocating for their sleep with staff. However, we did not directly observe or ask patients whether doors of patient rooms were open or closed or whether the patients took other measures to advocate for their own sleep. Thus, further work is necessary to understand the mechanisms by which sleep self‐efficacy may influence sleep.
One potential avenue for future research is to explore possible interventions for boosting sleep self‐efficacy in the hospital. Although most interventions have focused on environmental noise and staff‐based education, empowering patients through boosting SSE may be a helpful adjunct to improving hospital sleep.[33, 34] Currently, the SSE scale is not commonly used in the inpatient setting. Motivational interviewing and patient coaching could be explored as potential tools for boosting SSE. Furthermore, even if SSE is not easily changed, measuring SSE in patients newly admitted to the hospital may be useful in identifying patients most susceptible to sleep disruptions. Efforts to identify patients with low SSE should go hand‐in‐hand with measures to reduce noise. Addressing both patient‐level and environmental factors simultaneously may be the best strategy for improving sleep in an inpatient hospital setting.
In contrast to our prior study, it is worth noting that we did not find any significant relationships between overall noise levels and sleep.[9] In this dataset, nighttime noise is still a predictor of sleep loss in the hospital. However, when we restrict our sample to those who answered the SSE questionnaire and had nighttime noise recorded, we lose a significant number of observations. Because of our interest in testing the relationship between SSE and sleep, we chose to control for overall noise (which enabled us to retain more observations). We also did not find any interactions between SSE and noise in our regression models. Further work is warranted with larger sample sizes to better understand the role of SSE in the context of sleep and noise levels. In addition, females also received more sleep than males in our study.
There are several limitations to this study. This study was carried out at a single service at a single institution, limiting the ability to generalize the findings to other hospital settings. This study had a relatively high rate of patients who were unable to complete at least 1 night of data collection (42%), often due to watch removal for imaging or procedures, which may also affect the representativeness of our sample. Moreover, we can only examine associations and not causal relationships. The SSE scale has never been used in hospitalized patients, making comparisons between scores from hospitalized patients and population controls difficult. In addition, the SSE scale also has not been dichotomized in previous studies into high and low SSE. However, a sensitivity analysis with raw SSE scores did not change the results of our study. It can be difficult to perform actigraphy measurements in the hospital because many patients spend most of their time in bed. Because we chose a relatively healthy cohort of patients without significant limitations in mobility, actigraphy could still be used to differentiate time spent awake from time spent sleeping. Because we did not perform polysomnography, we cannot explore the role of sleep architecture which is an important component of sleep quality. Although the use of pharmacologic sleep aids is a potential confounding factor, the rate of use was very low in our cohort and unlikely to significantly affect our results. Continued study of this patient population is warranted to further develop the findings.
In conclusion, patients with high SSE sleep better in the hospital, tend to be in quieter rooms, and may report fewer noise complaints. Our findings suggest that a greater confidence in the ability to sleep may be beneficial in hospitalized adults. In addition to noise control, hospitals should also consider targeting patients with low SSE when designing novel interventions to improve in‐hospital sleep.
Disclosures
This work was supported by funding from the National Institute on Aging through a Short‐Term Aging‐Related Research Program (1 T35 AG029795), National Institute on Aging career development award (K23AG033763), a midcareer career development award (1K24AG031326), a program project (P01AG‐11412), an Agency for Healthcare Research and Quality Centers for Education and Research on Therapeutics grant (1U18HS016967), and a National Institute on Aging Clinical Translational Sciences award (UL1 RR024999). Dr. Arora had full access to all of the data in the study and takes responsibility for the integrity of the data and the accuracy of the statistical analysis. The funding agencies had no role in the design of the study; the collection, analysis, and interpretation of the data; or the decision to approve publication of the finished manuscript. The authors report no conflicts of interest.
- , , , . The metabolic consequences of sleep deprivation. Sleep Med Rev. 2007;11(3):163–178.
- , , , , , . Poor self‐reported sleep quality predicts mortality within one year of inpatient post‐acute rehabilitation among older adults. Sleep. 2011;34(12):1715–1721.
- , , , et al. The sleep of older people in hospital and nursing homes. J Clin Nurs. 1999;8:360–368.
- , , et al. Sleep in hospitalized medical patients, part 1: factors affecting sleep. J Hosp Med. 2008; 3:473–482.
- , , , et al. Nocturnal care interactions with patients in critical care units. Am J Crit Care. 2004;13:102–112; quiz 114–115.
- , , . Patient perception of sleep quality and etiology of sleep disruption in the intensive care unit. Am J Respir Crit Care Med. 1999;159:1155–1162.
- . Sleep in acute care settings: an integrative review. J Nurs Scholarsh. 2000;32(1):31–38.
- , , , et al. Sleep disruption due to hospital noises: a prospective evaluation. Ann Int Med. 2012;157(3): 170–179.
- , , , et al. Noise and sleep among adult medical inpatients: far from a quiet night. Arch Intern Med. 2012;172:68–70.
- . Generalized expectancies for internal versus external control of reinforcement. Psychol Monogr. 1966;80:1–28.
- , . Psychosocial risk factors and mortality: a prospective study with special focus on social support, social participation, and locus of control in Norway. J Epidemiol Community Health. 1998;52:476–481.
- , . The interactive effect of perceived control and functional status on health and mortality among young‐old and old‐old adults. J Gerontol B Psychol Sci Soc Sci. 1997;52:P118–P126.
- , . Role‐specific feelings of control and mortality. Psychol Aging. 2000;15:617–626.
- , , . Patient empowerment in intensive care—an interview study. Intensive Crit Care Nurs. 2006;22:370–377.
- , , . Exploring the relationship between personal control and the hospital environment. J Clin Nurs. 2008;17:1601–1609.
- , , , et al. Effects of volitional lifestyle on sleep‐life habits in the aged. Psychiatry Clin Neurosci. 1998;52:183–184.
- , , , et al. Sleep locus of control: report on a new scale. Behav Sleep Med. 2004;2:79–93.
- , , , et al. Effects of physician experience on costs and outcomes on an academic general medicine service: results of a trial of hospitalists. Ann Intern Med. 2002;137:866–874.
- , , , et al. The effects of age, sex, ethnicity, and sleep‐disordered breathing on sleep architecture. Arch Intern Med. 2004;164:406–418.
- , , , et al. Validation of a telephone version of the mini‐mental state examination. J Am Geriatr Soc. 1992;40:697–702.
- , , , et al. Contact isolation in surgical patients: a barrier to care? Surgery. 2003;134:180–188.
- , . Adverse effects of contact isolation. Lancet. 1999;354:1177–1178.
- . Behavioral Treatment for Persistent Insomnia. Elmsford, NY: Pergamon Press; 1987.
- . A new method for measuring daytime sleepiness: the Epworth sleepiness scale. Sleep. 1991;14:540–545.
- . Reliability and factor analysis of the Epworth Sleepiness Scale. Sleep. 1992;15:376–381.
- , . Objective components of individual differences in subjective sleep quality. J Sleep Res. 1997;6:217–220.
- , , , et al. The role of actigraphy in the study of sleep and circadian rhythms. Sleep. 2003;26:342–392.
- , , , et al. Practice parameters for the use of actigraphy in the assessment of sleep and sleep disorders: an update for 2007. Sleep. 2007;30:519–529.
- , , , et al. The role of actigraphy in the evaluation of sleep disorders. Sleep. 1995;18:288–302.
- , , , et al. Clinical review: sleep measurement in critical care patients: research and clinical implications. Crit Care. 2007;11:226.
- , , , et al. Evaluation of immobility time for sleep latency in actigraphy. Sleep Med. 2009;10:621–625.
- , , , et al. The subjective meaning of sleep quality: a comparison of individuals with and without insomnia. Sleep. 2008;31:383–393.
- , , , et al. Sleep in hospitalized medical patients, part 2: behavioral and pharmacological management of sleep disturbances. J Hosp Med. 2009;4:50–59.
- , , , . A nonpharmacologic sleep protocol for hospitalized older patients. J Am Geriatr Soc. 1998;46(6):700–705.
Lack of sleep is a common problem in hospitalized patients and is associated with poorer health outcomes, especially in older patients.[1, 2, 3] Prior studies highlight a multitude of factors that can result in sleep loss in the hospital[3, 4, 5, 6] with 1 of the most common causes of sleep disruption in the hospital being noise.[7, 8, 9]
In addition to external factors, such as hospital noise, there may be inherent characteristics that predispose certain patients to greater sleep loss when hospitalized. One such measure is the construct of perceived control or the psychological measure of how much individuals expect themselves to be capable of bringing about desired outcomes.[10] Among older patients, low perceived control is associated with increased rates of physician visits, hospitalizations, and death.[11, 12] In contrast, patients who feel more in control of their environment may experience positive health benefits.[13]
Yet, when patients are placed in a hospital setting, they experience a significant reduction in control over their environment along with an increase in dependency on medical staff and therapies.[14, 15] For example, hospitalized patients are restricted in their personal decisions, such as what clothes they can wear and what they can eat and are not in charge of their own schedules, including their sleep time.
Although prior studies suggest that perceived control over sleep is related to actual sleep among community‐dwelling adults,[16, 17] no study has examined this relationship in hospitalized adults. Therefore, the aim of our study was to examine the possible association between perceived control, noise levels, and sleep in hospitalized middle‐aged and older patients.
METHODS
Study Design
We conducted a prospective cohort study of subjects recruited from a large ongoing study of admitted patients at the University of Chicago inpatient general medicine service.[18] Because we were interested in middle‐aged and older adults who are most sensitive to sleep disruptions, patients who were age 50 years and over, ambulatory, and living in the community were eligible for the study.[19] Exclusion criteria were cognitive impairment (telephone version of the Mini‐Mental State Exam <17 out of 22), preexisting sleeping disorders identified via patient charts, such as obstructive sleep apnea and narcolepsy, transfer from the intensive care unit (ICU), and admission to the hospital more than 72 hours prior to enrollment.[20] These inclusion and exclusion criteria were selected to identify a patient population with minimal sleep disturbances at baseline. Patients under isolation were excluded because they are not visited as frequently by the healthcare team.[21, 22] Most general medicine rooms were double occupancy but efforts were made to make patient rooms single when possible or required (ie, isolation for infection control). The study was approved by the University of Chicago Institutional Review Board.
Subjective Data Collection
Baseline levels of perceived control over sleep, or the amount of control patients believe they have over their sleep, were assessed using 2 different scales. The first tool was the 8‐item Sleep Locus of Control (SLOC) scale,[17] which ranges from 8 to 48, with higher values corresponding to a greater internal locus of control over sleep. An internal sleep locus of control indicates beliefs that patients feel that they are primarily responsible for their own sleep as opposed to an external locus of control which indicates beliefs that good sleep is due to luck or chance. For example, patients were asked how strongly they agree or disagree with statements, such as, If I take care of myself, I can avoid insomnia and People who never get insomnia are just plain lucky (see Supporting Information, Appendix 2, in the online version of this article). The second tool was the 9‐item Sleep Self‐Efficacy (SSE) scale,[23] which ranges from 9 to 45, with higher values corresponding to greater confidence patients have in their ability to sleep. One of the items asks, How confident are you that you can lie in bed feeling physically relaxed (see Supporting Information, Appendix 1, in the online version of this article)? Both instruments have been validated in an outpatient setting.[23] These surveys were given immediately on enrollment in the study to measure baseline perceived control.
Baseline sleep habits were also collected on enrollment using the Epworth Sleepiness Scale,[24, 25] a standard validated survey that assesses excess daytime sleepiness in various common situations. For each day in the hospital, patients were asked to report in‐hospital sleep quality using the Karolinska Sleep Log.[26] The Karolinska Sleep Quality Index (KSQI) is calculated from 4 items on the Karolinska Sleep Log (sleep quality, sleep restlessness, slept throughout the night, ease of falling asleep). The questions are on a 5‐point scale and the 4 items are averaged for a final score out of 5 with a higher number indicating better subjective sleep quality. The item How much was your sleep disturbed by noise? on the Karolinska Sleep Log was used to assess the degree to which noise was a disruptor of sleep. This question was also on a 5‐point scale with higher scores indicating greater disruptiveness of noise. Patients were also asked how disruptive noise from roommates was on a nightly basis using this same scale.
Objective Data Collection
Wrist activity monitors (Actiwatch 2; Respironics, Inc., Murrysville, PA)[27, 28, 29, 30] were used to measure patient sleep. Actiware 5 software (Respironics, Inc.)[31] was used to estimate quantitative measures of sleep time and efficiency. Sleep time is defined as the total duration of time spent sleeping at night and sleep efficiency is defined as the fraction of time, reported as a percentage, spent sleeping by actigraphy out of the total time patients reported they were sleeping.
Sound levels in patient rooms were recorded using Larson Davis 720 Sound Level Monitors (Larson Davis, Inc., Provo, UT). These monitors store functional average sound pressure levels in A‐weighted decibels called the Leq over 1‐hour intervals. The Leq is the average sound level over the given time interval. Minimum (Lmin) and maximum (Lmax) sound levels are also stored. The LD SLM Utility Program (Larson Davis, Inc.) was used to extract the sound level measurements recorded by the monitors.
Demographic information (age, gender, race, ethnicity, highest level of education, length of stay in the hospital, and comorbidities) was obtained from hospital charts via an ongoing study of admitted patients at the University of Chicago Medical Center inpatient general medicine service.[18] Chart audits were performed to determine whether patients received pharmacologic sleep aids in the hospital.
Data Analysis
Descriptive statistics were used to summarize mean sleep duration and sleep efficiency in the hospital as well as SLOC and SSE. Because the SSE scores were not normally distributed, the scores were dichotomized at the median to create a variable denoting high and low SSE. Additionally, because the distribution of responses to the noise disruption question was skewed to the right, reports of noise disruptions were grouped into not disruptive (score=1) and disruptive (score>1).
Two‐sample t tests with equal variances were used to assess the relationship between perceived control measures (high/low SLOC, SSE) and objective sleep measures (sleep time, sleep efficiency). Multivariate linear regression was used to test the association between high SSE (independent variable) and sleep time (dependent variable), clustering for multiple nights of data within the subject. Multivariate logistic regression, also adjusting for subject, was used to test the association between high SSE and noise disruptiveness and the association between high SSE and Karolinska scores. Leq, Lmax, and Lmin were all tested using stepwise forward regression. Because our prior work[9] demonstrated that noise levels separated into tertiles were significantly associated with sleep time, our analysis also used noise levels separated into tertiles. Stepwise forward regression was used to add basic patient demographics (gender, race, age) to the models. Statistical significance was defined as P<0.05, and all statistical analysis was done using Stata 11.0 (StataCorp, College Station, TX).
RESULTS
From April 2010 to May 2012, 1134 patients were screened by study personnel for this study via an ongoing study of hospitalized patients on the inpatient general medicine ward. Of the 361 (31.8%) eligible patients, 206 (57.1%) consented to participate. Of the subjects enrolled in the study, 118 were able to complete at least 1 night of actigraphy, sound monitoring, and subjective assessment for a total of 185 patient nights (Figure 1).
The majority of patients were female (57%), African American (67%), and non‐Hispanic (97%). The mean age was 65 years (standard deviation [SD], 11.6 years), and the median length of stay was 4 days (interquartile range [IQR], 36). The majority of patients also had hypertension (67%), with chronic obstructive pulmonary disease [COPD] (31%) and congestive heart failure (31%) being the next most common comorbidities. About two‐thirds of subjects (64%) were characterized as average or above average sleepers with Epworth Sleepiness Scale scores 9[20] (Table 1). Only 5% of patients received pharmacological sleep aids.
| Value, n (%)a | |
|---|---|
| |
| Patient characteristics | |
| Age, mean (SD), y | 63 (12) |
| Length of stay, median (IQR), db | 4 (36) |
| Female | 67 (57) |
| African American | 79 (67) |
| Hispanic | 3 (3) |
| High school graduate | 92 (78) |
| Comorbidities | |
| Hypertension | 79 (66) |
| Chronic obstructive pulmonary disease | 37 (31) |
| Congestive heart failure | 37 (31) |
| Diabetes | 36 (30) |
| End stage renal disease | 23 (19) |
| Baseline sleep characteristics | |
| Sleep duration, mean (SD), minc | 333 (128) |
| Epworth Sleepiness Scale, score 9d | 73 (64) |
The mean baseline SLOC score was 30.4 (SD, 6.7), with a median of 31 (IQR, 2735). The mean baseline SSE score was 32.1 (SD, 9.4), with a median of 34 (IQR, 2441). Fifty‐four patients were categorized as having high sleep self‐efficacy (high SSE), which we defined as scoring above the median of 34.
Average in‐hospital sleep was 5.5 hours (333 minutes; SD, 128 minutes) which was significantly shorter than the self‐reported sleep duration of 6.5 hours prior to admission (387 minutes, SD, 125 minutes; P=0.0001). The mean sleep efficiency was 73% (SD, 19%) with 55% of actigraphy nights below the normal range of 80% efficiency for adults.[19] Median KSQI was 3.5 (IQR, 2.254.75), with 41% of the patients with a KSQI 3, putting them in the insomniac range.[32] The median score on the noise disruptiveness question was 1 (IQR, 14) with 42% of reports coded as disruptive defined as a score >1 on the 5‐point scale. The median score on the roommate disruptiveness question was 1 (IQR, 11) with 77% of responses coded as not disruptive defined as a score of 1 on the 5‐point scale.
A 2‐sample t test with equal variances showed that those patients reporting high SSE were more likely to sleep longer in the hospital than those reporting low SSE (364 minutes 95% confidence interval [CI]: 340, 388 vs 309 minutes 95% CI: 283, 336; P=0.003) (Figure 2). Patients with high SSE were also more likely to have a normal sleep efficiency (above 80%) compared to those with low SSE (54% 95% CI: 43, 65 vs 38% 95% CI: 28,47; P=0.028). Last, there was a trend toward patients reporting higher SSE to also report less noise disruption compared to those patients with low SSE ([42%] 95% CI: 31, 53 vs [56%] 95% CI: 46, 65; P=0.063) (Figure 3).
Linear regression clustered by subject showed that high SSE was associated with longer sleep duration (55 minutes 95% CI: 14, 97; P=0.010). Furthermore, high SSE was significantly associated with longer sleep duration after controlling for both objective noise level and patient demographics in the model using stepwise forward regression (50 minutes 95% CI: 11, 90; P=0.014) (Table 2).
| Sleep Duration (min) | Model 1 Beta [95% CI]a | Model 2 Beta [95% CI]a |
|---|---|---|
| ||
| High SSE | 55 [14, 97]b | 50 [11, 90]b |
| Lmin tert 3 | 14 [59, 29] | |
| Lmin tert 2 | 21 [65, 23] | |
| Female | 49 [10, 89]b | |
| African American | 16 [59, 27] | |
| Age | 1 [0.9, 3] | |
| Karolinska Sleep Quality | Model 1 OR [95% CI]c | Model 2 OR [95% CI]c |
| High SSE | 2.04 [1.12, 3.71]b | 2.01 [1.06, 3.79]b |
| Lmin tert 3 | 0.90 [0.37, 2.2] | |
| Lmin tert 2 | 0.86 [0.38, 1.94] | |
| Female | 1.78 [0.90, 3.52] | |
| African American | 1.19 [0.60, 2.38] | |
| Age | 1.02 [0.99, 1.05] | |
| Noise Complaints | Model 1 OR [95% CI]d | Model 2 OR [95% CI]d |
| High SSE | 0.57 [0.30, 1.12] | 0.49 [0.25, 0.96]b |
| Lmin tert 3 | 0.85 [0.39, 1.84] | |
| Lmin tert 2 | 0.91 [0.43, 1.93] | |
| Female | 1.40 [0.71, 2.78] | |
| African American | 0.35 [0.17, 0.70] | |
| Age | 1.00 [0.96, 1.03] | |
| Age2e | 1.00 [1.00, 1.00] | |
Logistic regression clustered by subject demonstrated that patients with high SSE had 2 times higher odds of having a KSQI score above 3 (95% CI: 1.12, 3.71; P=0.020). This association was still significant after controlling for noise and patient demographics (OR: 2.01; 95% CI: 1.06, 3.79; P=0.032). After controlling for noise levels and patient demographics, there was a statistically significant association between high SSE and lower odds of noise complaints (OR: 0.49; 95% CI: 0.25, 0.96; P=0.039) (Table 2). Although demographic characteristics were not associated with high SSE, those patients with high SSE had lower odds of being in the loudest tertile rooms (OR: 0.34; 95% CI: 0.15, 0.74; P=0.007).
In multivariate linear regression analyses, there were no significant relationships between SLOC scores and KSQI, reported noise disruptiveness, and markers of sleep (sleep duration or sleep efficiency).
DISCUSSION
This study is the first to examine the relationship between perceived control, noise levels, and objective measurements of sleep in a hospital setting. One measure of perceived control, namely SSE, was associated with objective sleep duration, subjective and objective sleep quality, noise levels in patient rooms, and perhaps also patient complaints of noise. These associations remained significant after controlling for objective noise levels and patient demographics, suggesting that SSE is independently related to sleep.
In contrast to SSE, SLOC was not found to be significantly associated with either subjective or objective measures of sleep quality. The lack of association may be due to the fact that the SLOC questionnaire does not translate as well to the inpatient setting as the SSE questionnaire. The SLOC questionnaire focuses on general beliefs about sleep whereas the SSE questionnaire focuses on personal beliefs about one's own ability sleep in the immediate future, which may make it more relevant in the inpatient setting (see Supporting Information, Appendix 1 and 2, in the online version of this article).
Given our findings, it is important to identify why patients with high SSE have better sleep and fewer noise complaints. One possibility is that sleep self‐efficacy is an inherited trait unique to each person that is also predictive of a patient's sleep patterns. However, is it also possible that those patients with high SSE feel more empowered to take control of their environment, allowing them to advocate for better sleep? This hypothesis is further strengthened by the finding that those patients with high SSE on study entry were less likely to be in the noisiest rooms. This raises the possibility that at least 1 of the mechanisms by which high SSE may be protective against sleep loss is through patients taking an active role in noise reduction, such as closing the door or advocating for their sleep with staff. However, we did not directly observe or ask patients whether doors of patient rooms were open or closed or whether the patients took other measures to advocate for their own sleep. Thus, further work is necessary to understand the mechanisms by which sleep self‐efficacy may influence sleep.
One potential avenue for future research is to explore possible interventions for boosting sleep self‐efficacy in the hospital. Although most interventions have focused on environmental noise and staff‐based education, empowering patients through boosting SSE may be a helpful adjunct to improving hospital sleep.[33, 34] Currently, the SSE scale is not commonly used in the inpatient setting. Motivational interviewing and patient coaching could be explored as potential tools for boosting SSE. Furthermore, even if SSE is not easily changed, measuring SSE in patients newly admitted to the hospital may be useful in identifying patients most susceptible to sleep disruptions. Efforts to identify patients with low SSE should go hand‐in‐hand with measures to reduce noise. Addressing both patient‐level and environmental factors simultaneously may be the best strategy for improving sleep in an inpatient hospital setting.
In contrast to our prior study, it is worth noting that we did not find any significant relationships between overall noise levels and sleep.[9] In this dataset, nighttime noise is still a predictor of sleep loss in the hospital. However, when we restrict our sample to those who answered the SSE questionnaire and had nighttime noise recorded, we lose a significant number of observations. Because of our interest in testing the relationship between SSE and sleep, we chose to control for overall noise (which enabled us to retain more observations). We also did not find any interactions between SSE and noise in our regression models. Further work is warranted with larger sample sizes to better understand the role of SSE in the context of sleep and noise levels. In addition, females also received more sleep than males in our study.
There are several limitations to this study. This study was carried out at a single service at a single institution, limiting the ability to generalize the findings to other hospital settings. This study had a relatively high rate of patients who were unable to complete at least 1 night of data collection (42%), often due to watch removal for imaging or procedures, which may also affect the representativeness of our sample. Moreover, we can only examine associations and not causal relationships. The SSE scale has never been used in hospitalized patients, making comparisons between scores from hospitalized patients and population controls difficult. In addition, the SSE scale also has not been dichotomized in previous studies into high and low SSE. However, a sensitivity analysis with raw SSE scores did not change the results of our study. It can be difficult to perform actigraphy measurements in the hospital because many patients spend most of their time in bed. Because we chose a relatively healthy cohort of patients without significant limitations in mobility, actigraphy could still be used to differentiate time spent awake from time spent sleeping. Because we did not perform polysomnography, we cannot explore the role of sleep architecture which is an important component of sleep quality. Although the use of pharmacologic sleep aids is a potential confounding factor, the rate of use was very low in our cohort and unlikely to significantly affect our results. Continued study of this patient population is warranted to further develop the findings.
In conclusion, patients with high SSE sleep better in the hospital, tend to be in quieter rooms, and may report fewer noise complaints. Our findings suggest that a greater confidence in the ability to sleep may be beneficial in hospitalized adults. In addition to noise control, hospitals should also consider targeting patients with low SSE when designing novel interventions to improve in‐hospital sleep.
Disclosures
This work was supported by funding from the National Institute on Aging through a Short‐Term Aging‐Related Research Program (1 T35 AG029795), National Institute on Aging career development award (K23AG033763), a midcareer career development award (1K24AG031326), a program project (P01AG‐11412), an Agency for Healthcare Research and Quality Centers for Education and Research on Therapeutics grant (1U18HS016967), and a National Institute on Aging Clinical Translational Sciences award (UL1 RR024999). Dr. Arora had full access to all of the data in the study and takes responsibility for the integrity of the data and the accuracy of the statistical analysis. The funding agencies had no role in the design of the study; the collection, analysis, and interpretation of the data; or the decision to approve publication of the finished manuscript. The authors report no conflicts of interest.
- , , , . The metabolic consequences of sleep deprivation. Sleep Med Rev. 2007;11(3):163–178.
- , , , , , . Poor self‐reported sleep quality predicts mortality within one year of inpatient post‐acute rehabilitation among older adults. Sleep. 2011;34(12):1715–1721.
- , , , et al. The sleep of older people in hospital and nursing homes. J Clin Nurs. 1999;8:360–368.
- , , et al. Sleep in hospitalized medical patients, part 1: factors affecting sleep. J Hosp Med. 2008; 3:473–482.
- , , , et al. Nocturnal care interactions with patients in critical care units. Am J Crit Care. 2004;13:102–112; quiz 114–115.
- , , . Patient perception of sleep quality and etiology of sleep disruption in the intensive care unit. Am J Respir Crit Care Med. 1999;159:1155–1162.
- . Sleep in acute care settings: an integrative review. J Nurs Scholarsh. 2000;32(1):31–38.
- , , , et al. Sleep disruption due to hospital noises: a prospective evaluation. Ann Int Med. 2012;157(3): 170–179.
- , , , et al. Noise and sleep among adult medical inpatients: far from a quiet night. Arch Intern Med. 2012;172:68–70.
- . Generalized expectancies for internal versus external control of reinforcement. Psychol Monogr. 1966;80:1–28.
- , . Psychosocial risk factors and mortality: a prospective study with special focus on social support, social participation, and locus of control in Norway. J Epidemiol Community Health. 1998;52:476–481.
- , . The interactive effect of perceived control and functional status on health and mortality among young‐old and old‐old adults. J Gerontol B Psychol Sci Soc Sci. 1997;52:P118–P126.
- , . Role‐specific feelings of control and mortality. Psychol Aging. 2000;15:617–626.
- , , . Patient empowerment in intensive care—an interview study. Intensive Crit Care Nurs. 2006;22:370–377.
- , , . Exploring the relationship between personal control and the hospital environment. J Clin Nurs. 2008;17:1601–1609.
- , , , et al. Effects of volitional lifestyle on sleep‐life habits in the aged. Psychiatry Clin Neurosci. 1998;52:183–184.
- , , , et al. Sleep locus of control: report on a new scale. Behav Sleep Med. 2004;2:79–93.
- , , , et al. Effects of physician experience on costs and outcomes on an academic general medicine service: results of a trial of hospitalists. Ann Intern Med. 2002;137:866–874.
- , , , et al. The effects of age, sex, ethnicity, and sleep‐disordered breathing on sleep architecture. Arch Intern Med. 2004;164:406–418.
- , , , et al. Validation of a telephone version of the mini‐mental state examination. J Am Geriatr Soc. 1992;40:697–702.
- , , , et al. Contact isolation in surgical patients: a barrier to care? Surgery. 2003;134:180–188.
- , . Adverse effects of contact isolation. Lancet. 1999;354:1177–1178.
- . Behavioral Treatment for Persistent Insomnia. Elmsford, NY: Pergamon Press; 1987.
- . A new method for measuring daytime sleepiness: the Epworth sleepiness scale. Sleep. 1991;14:540–545.
- . Reliability and factor analysis of the Epworth Sleepiness Scale. Sleep. 1992;15:376–381.
- , . Objective components of individual differences in subjective sleep quality. J Sleep Res. 1997;6:217–220.
- , , , et al. The role of actigraphy in the study of sleep and circadian rhythms. Sleep. 2003;26:342–392.
- , , , et al. Practice parameters for the use of actigraphy in the assessment of sleep and sleep disorders: an update for 2007. Sleep. 2007;30:519–529.
- , , , et al. The role of actigraphy in the evaluation of sleep disorders. Sleep. 1995;18:288–302.
- , , , et al. Clinical review: sleep measurement in critical care patients: research and clinical implications. Crit Care. 2007;11:226.
- , , , et al. Evaluation of immobility time for sleep latency in actigraphy. Sleep Med. 2009;10:621–625.
- , , , et al. The subjective meaning of sleep quality: a comparison of individuals with and without insomnia. Sleep. 2008;31:383–393.
- , , , et al. Sleep in hospitalized medical patients, part 2: behavioral and pharmacological management of sleep disturbances. J Hosp Med. 2009;4:50–59.
- , , , . A nonpharmacologic sleep protocol for hospitalized older patients. J Am Geriatr Soc. 1998;46(6):700–705.
Copyright © 2013 Society of Hospital Medicine

Hospitalists on Alert as CRE Infections Spike
Hospitalists should be on the lookout for carbapenem-resistant Enterobacteriaceae (CRE) infections, says one author of a CDC report that noted a three-fold increase in the proportion of Enterobacteriaceae bugs that proved resistant to carbapenem within the past decade.
Earlier this month, the CDC's Morbidity and Mortality Weekly Report revealed that the percentage of CRE infections jumped to 4.2% in 2011 from 1.2% in 2001, according to data from the National Nosocomial Infection Surveillance system.
"It is a very serious public health threat," says co-author Alex Kallen, MD, MPH, a medical epidemiologist and outbreak response coordinator in the CDC's Division of Healthcare Quality Promotion. "Maybe it's not that common now, but with no action, it has the potential to become much more common, like a lot of the other MDROs [multidrug-resistant organisms] that hospitalists see regularly. [Hospitalists] have a lot of control over some of the things that could potentially lead to increased transmission."
Dr. Kallen says HM groups can help reduce the spread of CRE through antibiotic stewardship, the review of detailed patient histories to ferret out risk factors, and dedication to contact precautions and hand hygiene. Hospitalists also play a leadership role in coordinating efforts for patients transferring between hospitals and other institutions, such as skilled-nursing or assisted-living facilities, he says.
Dr. Kallen added that hospitalists should not dismiss CRE, even if they rarely encounter it.
"If you're a place that doesn't see this very often, and you see one, that's a big deal," he adds. "It needs to be acted on aggressively. Being proactive is much more effective than waiting until it's common and then trying to intervene."
Visit our website for more information on hospital-acquired infections.
Foundation Chips in to Reduce 30-Day Readmissions
The Robert Wood Johnson Foundation of Princeton, N.J., the country’s largest healthcare-focused philanthropy, has undertaken a number of initiatives to improve care transitions and reduce preventable hospital readmissions.
One of the key conclusions from these initiatives, says Anne Weiss, MPP, director of the foundation's Quality/Equality Health Care Team, is that hospitals and hospitalists can't do it alone. "Hospitals are now being held financially accountable for something they can't possibly control," Weiss says, referring to whether or not the discharged patient returns to the hospital within 30 days.
The foundation has mobilized broad community coalitions through its Aligning Forces for Quality campaign, bringing together healthcare providers, purchasers, consumers, and other stakeholders to improve care transitions. One such coalition, Better Health Greater Cleveland of Ohio, announced a 10.7% reduction in avoidable hospitalizations for common cardiac conditions in 2011.
Successful care transitions also require healthcare providers to appreciate the need for patients and their families to engage in their plans for post-discharge care, Weiss says. "I have been stunned to learn the kinds of medical tasks patients and families are now expected to conduct when they go home," she adds. "I hear them say, 'Nobody told us we would have to flush IVs.'"
Through another initiative, the foundation produced an interactive map that displays the percentage of patients readmitted to hospitals within 30 days of discharge; it has supported research that found improvements in nurses' work environments helped to reduce avoidable hospital readmissions. It also has produced a "Transitions to Better Care" video contest for hospitals, as well as a national publicity campaign about these issues called "Care About Your Care."
Visit our website for more information about patient care transitions.
Head, neck infections rising among children
Pediatricians in the emergency room are seeing more complicated head and neck infections, and more often. That's according to Dr. Keith Borg, emergency medicine physician and assistant professor at the Medical University of South Carolina. He gave some tips to choosing the best course of diagnosis and treatment.
Pediatricians in the emergency room are seeing more complicated head and neck infections, and more often. That's according to Dr. Keith Borg, emergency medicine physician and assistant professor at the Medical University of South Carolina. He gave some tips to choosing the best course of diagnosis and treatment.
Pediatricians in the emergency room are seeing more complicated head and neck infections, and more often. That's according to Dr. Keith Borg, emergency medicine physician and assistant professor at the Medical University of South Carolina. He gave some tips to choosing the best course of diagnosis and treatment.

Outpatient antibiotics ABRS vs. AOM
Acute bacterial rhinosinusitis (ABRS) has been suggested as a parallel pyogenic infection to acute otitis media (AOM). Like AOM, ABRS is due to obstruction of the normal drainage system into the nasopharynx from a normally aerated pouch(es) within the bone of the skull. Potential pathogens from the nasopharynx, having refluxed into the aerated spaces, begin to replicate and induce inflammation, at least in part due to the obstruction and the inflammation-induced deficiency of the normal cleansing system. For the middle ear, this system is the eustachian tube complex. For the sinuses, it is the osteomeatal complex. The similarities have led some to designate ABRS as "AOM in the middle of the face."
Other parallels are striking, including the microbiology, although 21st century data are less available for the microbiology of ABRS compared with AOM. The table lists some comparisons between the 2013 American Academy of Pediatrics (AAP) guidelines on managing AOM (Pediatrics 2013;131;e964-e999) and the 2012 Infectious Diseases Society of America (IDSA) ABRS guidelines (Clin. Infect. Dis. 2012;54:e72-e112).

So the question arises: Why was high-dose amoxicillin reaffirmed as the drug of choice for uncomplicated AOM in normal hosts in the 2013 AAP AOM guidelines, whereas the most recent guidelines for ABRS (2012 from IDSA) recommend standard-dose amoxicillin plus clavulanate? Amoxicillin is an inexpensive and reasonably palatable drug with a low adverse effect (AE) profile. Amoxicillin-clavulanate is a broader-spectrum, more expensive, somewhat bitter-tasting drug with a moderate AE profile. When the extra spectrum is needed, the added expense and AEs are acceptable. But they seem excessive for a first-line drug.
Do differences in diagnostic criteria lessen the impact on antimicrobial resistance from use of a broader-spectrum first-line drug for ABRS compared to AOM?
Compared with the 2013 AAP otitis media guidelines, which provide objective, clear, and simple criteria, the 2012 IDSA ABRS Guidelines have less objective and less precise criteria. For an AOM diagnosis, the tympanic membrane (TM) must be bulging or be perforated with purulent drainage. Both result from an expanding inflammatory process that stretches the TM. Using this single criterion in the presence of an effusion, clinicians have a clear understanding of what constitutes AOM. No more need to rely on history of acute onset, or a particular color or opacity, or lack of mobility on pneumatic otoscopy. One need only see a bulging TM and note that there is an inflammatory effusion. Bingo – this is AOM.
So, diagnosis of AOM is easier and can be more precise, eliminating "uncertain AOM" from the options. With these firm diagnostic criteria, the question then is whether the AOM episode requires antibiotics. That question is also addressed in the 2013 guidelines and will not be discussed here. The end result is that the 2013 AOM guidelines should decrease the number of AOM diagnoses and thereby antibiotic overuse.
Based on the 2012 IDSA Guideline for ABRS, in contrast, there are three sets of circumstances whereby an ABRS diagnosis can be made. For the most part these involve historical data about duration and intensity of symptoms reported by patients or parents. Thus these are varied, mostly subjective, and more complex with multiple nuances. There is more art and no real reliance on objective physical findings in diagnosing ABRS. This is due to there being no reliable physical findings to diagnose uncomplicated ABRS. There also is no reliable, inexpensive, and safe laboratory or radiological modality for ABRS diagnosis. This results in considerable wiggle room and subjective clinical judgment about the diagnosis.
And the 2012 IDSA ABRS guidelines state that antibiotic treatment should begin whenever an ABRS diagnosis is made. There is some verbiage that one could consider observation without antibiotics if the symptoms are mild, but there are no specifics about what constitutes "mild." This seems like the perfect storm for potential overdiagnosis and overuse of antibiotics, so a broader-spectrum drug would be less desirable from an antibiotic stewardship perspective.
Are pathogens in routine uncomplicated ABRS more resistant to amoxicillin than in AOM so that addition of clavulanate to neutralize beta-lactamase is warranted?
The 2012 ABRS guidelines indicate that the basis for recommending amoxicillin-clavulanate was the microbiology of AOM. There has been little pediatric ABRS microbiology in the past 25 years because sinus punctures are needed to have the best data. Such punctures have not been used in controlled trials in decades. So it is logical to use AOM data, given that pneumococcal conjugate vaccines (PCVs) have produced shifts in pneumococcal serotypes, and there continues to be an evolving distribution of serotypes and their accompanying antibiotic resistance patterns since the 2010 shift to PCV13.
The current expectation is that serotype 19A, the most frequently multidrug-resistant serotype that emerged after PCV7 was introduced in 2000, will decline by the end of 2013. Other classic pneumococcal otopathogen serotypes expressing resistance to amoxicillin have declined since 2004, as has the overall prevalence of AOM due to pneumococcus. Since 2004, more than 50% of recently antibiotic-treated or recurrent AOM appear to be due to nontypeable Haemophilus influenzae (ntHi), and more than half of these produce beta-lactamase. (Pediatr. Infect. Dis. J. 2004;23:829-33; Pediatr. Infect Dis. J. 2010;29:304-9). So more than 25% of recently antibiotic-treated AOM patients would be expected to have amoxicillin-resistant pathogens by virtue of beta-lactamase.
Is this a reasonable rationale for the first-line therapy for both AOM and ABRS to be standard (some would call low) dose, but beta-lactamase stable, amoxicillin-clavulanate at 45 mg/kg per day divided twice daily? This is the argument utilized in the 2012 IDSA ABRS guidelines. However, based on the same data, the AAP 2013 AOM guidelines conclude that high-dose amoxicillin without clavulanate should be used for first-line empiric therapy of AOM.
A powerful argument for the AAP AOM guidelines is the expectation that half of all ntHi, including those that produce beta-lactamase, will spontaneously clear without antibiotics. This is more frequent than for pneumococcus, which has only a 20% spontaneous remission. Data from our laboratory in Kansas City showed that up to 50% of the ntHi in persistent or recurrent AOM produce beta-lactamase; however, less than 15% do so in AOM when not recently treated with antibiotics (Harrison, C.J. The Changing Microbiology of Acute Otitis Media, in "Acute Otitis Media: Translating Science into Clinical Practice," International Congress and Symposium Series. 265:22-35. Royal Society of Medicine Press, London, 2007). How powerful then is the argument to add clavulanate and to use low-dose amoxicillin?
ntHi considered
First consider the contribution to amoxicillin failures by ntHi. Choosing a worst-case scenario of all ABRS having the microbiology of recently treated AOM, we will assume that 60% of persistent/recurrent AOM (and by extrapolation ABRS) is due to ntHi, and 50% of these produce beta-lactamase. Now factor in that 50% of all ntHi clear without antibiotics. The overall expected clinical failure rate for amoxicillin due to beta-lactamase producing ntHi in recurrent/persistent AOM (and by extrapolation ABRS) is 15% (0.6 × 0.5 × 0.5 = 0.15).
In contrast, let us assume that recently untreated ABRS has the same microbiology as recently untreated AOM. Then 45% would be due to ntHi, and 15% of those produce beta-lactamase. Again 50% of all the ntHi spontaneously clear without antibiotics. The expected clinical failure rate for amoxicillin would be 3%-4% due to beta-lactamase–producing ntHi (0.45 × 0.15 × 0.50 = 0.034). This relatively low rate of expected amoxicillin failure for a noninvasive AOM or ABRS pathogen does not seem to mandate addition of clavulanate.
Further, the higher resistance based on beta-lactamase production in ntHi that was quoted in the ABRS 2012 IDSA guidelines were from isolates of children who had tympanocentesis mostly for persistent or recurrent AOM. So, my deduction is that it is logical to use the beta-lactamase–stable drug combination as second-line therapy, that is, in persistent or recurrent AOM and by extrapolation, also in persistent or recurrent ABRS, but not as first-line therapy.
I also am concerned about using a lower dose of amoxicillin because this regimen would be expected to cover less than half of pneumococci with intermediate resistance to penicillin and none with high levels of penicillin resistance. Because pneumococcus is the potentially invasive and yet still common oto- and sinus pathogen, it seems logical to optimize coverage for pneumococcus rather than ntHi in as many young children as possible, particularly those not yet fully PCV13 immunized. This means high-dose amoxicillin, not standard-dose amoxicillin.
This high-dose amoxicillin is what is recommended in the 2013 AAP AOM guidelines. So I feel comfortable, based on the available AOM data, using high-dose amoxicillin (90 mg/kg per day divided in two daily doses) as empiric first-line therapy for non–penicillin-allergic ABRS patients. I would, however, use high-dose amoxicillin-clavulanate as second-line therapy for recurrent or persistent ABRS.
Summary
Most of us wish to follow rules and recommendations from groups of experts who laboriously review the literature and work many hours crafting them. However, sometimes we must remember that such rules are, as was stated in "Pirates of the Caribbean" in regard to "parlay," still only guidelines. When guidelines conflict and practicing clinicians are caught in the middle, we must consider the data and reasons underpinning the conflicting recommendations. Given the AAP AOM 2013 guidelines and examination of the available data, I am comfortable and feel that I am doing my part for antibiotic stewardship by using the same first- and second-line drugs for ABRS as recommended for AOM in the 2013 AOM guidelines.
Dr. Harrison is a professor of pediatrics and pediatric infectious diseases at Children’s Mercy Hospitals and Clinics, Kansas City, Mo. Dr. Harrison said he has no relevant financial disclosures.
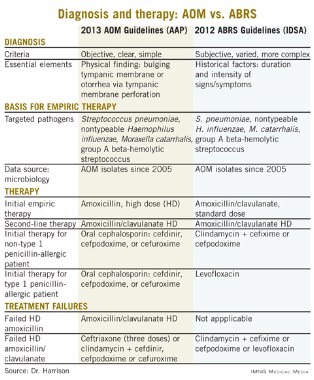
Acute bacterial rhinosinusitis (ABRS) has been suggested as a parallel pyogenic infection to acute otitis media (AOM). Like AOM, ABRS is due to obstruction of the normal drainage system into the nasopharynx from a normally aerated pouch(es) within the bone of the skull. Potential pathogens from the nasopharynx, having refluxed into the aerated spaces, begin to replicate and induce inflammation, at least in part due to the obstruction and the inflammation-induced deficiency of the normal cleansing system. For the middle ear, this system is the eustachian tube complex. For the sinuses, it is the osteomeatal complex. The similarities have led some to designate ABRS as "AOM in the middle of the face."
Other parallels are striking, including the microbiology, although 21st century data are less available for the microbiology of ABRS compared with AOM. The table lists some comparisons between the 2013 American Academy of Pediatrics (AAP) guidelines on managing AOM (Pediatrics 2013;131;e964-e999) and the 2012 Infectious Diseases Society of America (IDSA) ABRS guidelines (Clin. Infect. Dis. 2012;54:e72-e112).
So the question arises: Why was high-dose amoxicillin reaffirmed as the drug of choice for uncomplicated AOM in normal hosts in the 2013 AAP AOM guidelines, whereas the most recent guidelines for ABRS (2012 from IDSA) recommend standard-dose amoxicillin plus clavulanate? Amoxicillin is an inexpensive and reasonably palatable drug with a low adverse effect (AE) profile. Amoxicillin-clavulanate is a broader-spectrum, more expensive, somewhat bitter-tasting drug with a moderate AE profile. When the extra spectrum is needed, the added expense and AEs are acceptable. But they seem excessive for a first-line drug.
Do differences in diagnostic criteria lessen the impact on antimicrobial resistance from use of a broader-spectrum first-line drug for ABRS compared to AOM?
Compared with the 2013 AAP otitis media guidelines, which provide objective, clear, and simple criteria, the 2012 IDSA ABRS Guidelines have less objective and less precise criteria. For an AOM diagnosis, the tympanic membrane (TM) must be bulging or be perforated with purulent drainage. Both result from an expanding inflammatory process that stretches the TM. Using this single criterion in the presence of an effusion, clinicians have a clear understanding of what constitutes AOM. No more need to rely on history of acute onset, or a particular color or opacity, or lack of mobility on pneumatic otoscopy. One need only see a bulging TM and note that there is an inflammatory effusion. Bingo – this is AOM.
So, diagnosis of AOM is easier and can be more precise, eliminating "uncertain AOM" from the options. With these firm diagnostic criteria, the question then is whether the AOM episode requires antibiotics. That question is also addressed in the 2013 guidelines and will not be discussed here. The end result is that the 2013 AOM guidelines should decrease the number of AOM diagnoses and thereby antibiotic overuse.
Based on the 2012 IDSA Guideline for ABRS, in contrast, there are three sets of circumstances whereby an ABRS diagnosis can be made. For the most part these involve historical data about duration and intensity of symptoms reported by patients or parents. Thus these are varied, mostly subjective, and more complex with multiple nuances. There is more art and no real reliance on objective physical findings in diagnosing ABRS. This is due to there being no reliable physical findings to diagnose uncomplicated ABRS. There also is no reliable, inexpensive, and safe laboratory or radiological modality for ABRS diagnosis. This results in considerable wiggle room and subjective clinical judgment about the diagnosis.
And the 2012 IDSA ABRS guidelines state that antibiotic treatment should begin whenever an ABRS diagnosis is made. There is some verbiage that one could consider observation without antibiotics if the symptoms are mild, but there are no specifics about what constitutes "mild." This seems like the perfect storm for potential overdiagnosis and overuse of antibiotics, so a broader-spectrum drug would be less desirable from an antibiotic stewardship perspective.
Are pathogens in routine uncomplicated ABRS more resistant to amoxicillin than in AOM so that addition of clavulanate to neutralize beta-lactamase is warranted?
The 2012 ABRS guidelines indicate that the basis for recommending amoxicillin-clavulanate was the microbiology of AOM. There has been little pediatric ABRS microbiology in the past 25 years because sinus punctures are needed to have the best data. Such punctures have not been used in controlled trials in decades. So it is logical to use AOM data, given that pneumococcal conjugate vaccines (PCVs) have produced shifts in pneumococcal serotypes, and there continues to be an evolving distribution of serotypes and their accompanying antibiotic resistance patterns since the 2010 shift to PCV13.
The current expectation is that serotype 19A, the most frequently multidrug-resistant serotype that emerged after PCV7 was introduced in 2000, will decline by the end of 2013. Other classic pneumococcal otopathogen serotypes expressing resistance to amoxicillin have declined since 2004, as has the overall prevalence of AOM due to pneumococcus. Since 2004, more than 50% of recently antibiotic-treated or recurrent AOM appear to be due to nontypeable Haemophilus influenzae (ntHi), and more than half of these produce beta-lactamase. (Pediatr. Infect. Dis. J. 2004;23:829-33; Pediatr. Infect Dis. J. 2010;29:304-9). So more than 25% of recently antibiotic-treated AOM patients would be expected to have amoxicillin-resistant pathogens by virtue of beta-lactamase.
Is this a reasonable rationale for the first-line therapy for both AOM and ABRS to be standard (some would call low) dose, but beta-lactamase stable, amoxicillin-clavulanate at 45 mg/kg per day divided twice daily? This is the argument utilized in the 2012 IDSA ABRS guidelines. However, based on the same data, the AAP 2013 AOM guidelines conclude that high-dose amoxicillin without clavulanate should be used for first-line empiric therapy of AOM.
A powerful argument for the AAP AOM guidelines is the expectation that half of all ntHi, including those that produce beta-lactamase, will spontaneously clear without antibiotics. This is more frequent than for pneumococcus, which has only a 20% spontaneous remission. Data from our laboratory in Kansas City showed that up to 50% of the ntHi in persistent or recurrent AOM produce beta-lactamase; however, less than 15% do so in AOM when not recently treated with antibiotics (Harrison, C.J. The Changing Microbiology of Acute Otitis Media, in "Acute Otitis Media: Translating Science into Clinical Practice," International Congress and Symposium Series. 265:22-35. Royal Society of Medicine Press, London, 2007). How powerful then is the argument to add clavulanate and to use low-dose amoxicillin?
ntHi considered
First consider the contribution to amoxicillin failures by ntHi. Choosing a worst-case scenario of all ABRS having the microbiology of recently treated AOM, we will assume that 60% of persistent/recurrent AOM (and by extrapolation ABRS) is due to ntHi, and 50% of these produce beta-lactamase. Now factor in that 50% of all ntHi clear without antibiotics. The overall expected clinical failure rate for amoxicillin due to beta-lactamase producing ntHi in recurrent/persistent AOM (and by extrapolation ABRS) is 15% (0.6 × 0.5 × 0.5 = 0.15).
In contrast, let us assume that recently untreated ABRS has the same microbiology as recently untreated AOM. Then 45% would be due to ntHi, and 15% of those produce beta-lactamase. Again 50% of all the ntHi spontaneously clear without antibiotics. The expected clinical failure rate for amoxicillin would be 3%-4% due to beta-lactamase–producing ntHi (0.45 × 0.15 × 0.50 = 0.034). This relatively low rate of expected amoxicillin failure for a noninvasive AOM or ABRS pathogen does not seem to mandate addition of clavulanate.
Further, the higher resistance based on beta-lactamase production in ntHi that was quoted in the ABRS 2012 IDSA guidelines were from isolates of children who had tympanocentesis mostly for persistent or recurrent AOM. So, my deduction is that it is logical to use the beta-lactamase–stable drug combination as second-line therapy, that is, in persistent or recurrent AOM and by extrapolation, also in persistent or recurrent ABRS, but not as first-line therapy.
I also am concerned about using a lower dose of amoxicillin because this regimen would be expected to cover less than half of pneumococci with intermediate resistance to penicillin and none with high levels of penicillin resistance. Because pneumococcus is the potentially invasive and yet still common oto- and sinus pathogen, it seems logical to optimize coverage for pneumococcus rather than ntHi in as many young children as possible, particularly those not yet fully PCV13 immunized. This means high-dose amoxicillin, not standard-dose amoxicillin.
This high-dose amoxicillin is what is recommended in the 2013 AAP AOM guidelines. So I feel comfortable, based on the available AOM data, using high-dose amoxicillin (90 mg/kg per day divided in two daily doses) as empiric first-line therapy for non–penicillin-allergic ABRS patients. I would, however, use high-dose amoxicillin-clavulanate as second-line therapy for recurrent or persistent ABRS.
Summary
Most of us wish to follow rules and recommendations from groups of experts who laboriously review the literature and work many hours crafting them. However, sometimes we must remember that such rules are, as was stated in "Pirates of the Caribbean" in regard to "parlay," still only guidelines. When guidelines conflict and practicing clinicians are caught in the middle, we must consider the data and reasons underpinning the conflicting recommendations. Given the AAP AOM 2013 guidelines and examination of the available data, I am comfortable and feel that I am doing my part for antibiotic stewardship by using the same first- and second-line drugs for ABRS as recommended for AOM in the 2013 AOM guidelines.
Dr. Harrison is a professor of pediatrics and pediatric infectious diseases at Children’s Mercy Hospitals and Clinics, Kansas City, Mo. Dr. Harrison said he has no relevant financial disclosures.

Analysis of exhaled volatile organic compounds may accurately detect NASH
The analysis of volatile organic compounds in exhaled breath may provide a noninvasive and accurate test for diagnosing nonalcoholic steatohepatitis, according to results from a pilot study published in March.
This test could reduce the number of unnecessary liver biopsies and missed diagnoses associated with assessing plasma transaminase levels, reported Dr. Froukje J. Verdam of Maastricht (the Netherlands) University Medical Center and her associates (J. Hepatol. 2013;58:543-8).
Researchers evaluated breath samples with gas chromatography–mass spectrometry from 65 consecutive overweight or obese patients before they underwent laparoscopic abdominal surgery, between October 2007 and May 2011. These results were compared with histologic analysis of liver biopsies taken intraoperatively and assessments of plasma levels of alanine aminotransferase (ALT) and aspartate aminotransferase (AST).
Overall, liver biopsies showed that 39 patients (60%) had nonalcoholic steatohepatitis (NASH), defined as "showing signs of steatosis and inflammation." Additionally, ALT and AST levels were significantly higher in patients with the disease than without. However, "parameters such as gender, age, BMI, and HbA1c did not differ significantly," reported the study authors.
The analysis of three volatile organic compounds (VOCs) – n-tridecane, 3-methylbutanonitrile, and 1-propanol – enabled investigators to distinguish between patients with and without NASH, with a sensitivity of 90%, a specificity of 69%, and an area under the receiver operating characteristic (ROC) curve of 0.77 plus or minus 0.07. The positive predictive value of using VOC analysis for NASH was 81%, while the negative predictive value was 82%.
In comparison, in 61 patients from whom plasma was available, the sensitivity of measuring ALT was 19%, while the specificity was 96%. The positive and negative predictive values of ALT were 88% and 43%, respectively.
Further evaluation of the AST/ALT ratio found that it was 32% sensitive and 79% specific, while positive and negative predictive values were 70% and 43%, respectively.
"It can be concluded that the diagnostic value of VOC is much higher than that of plasma transaminases, resulting in less misdiagnosed patients," wrote the study authors. Prediction of NASH using VOC, ALT, and the AST/ALT ratio did not reflect liver biopsy results in 18%, 51%, and 49% of subjects, respectively.
Using VOC evaluation rather than histologic testing has several other advantages, according to the researchers. "The analysis of exhaled breath can identify NASH presence at an early stage, and early identification in a mild stage is pivotal to enhance the chances of cure," they wrote. "Furthermore, whereas a small part of the liver is considered in the evaluation of biopsies, the breath test used in this study noninvasively reflects total liver function."
Funding for this pilot study was provided by grants from the Dutch SenterNovem Innovation Oriented Research Program on Genomics and the Transnational University Limburg, Belgium. The study authors reported no conflicts of interest.
Dr. Scott L. Friedman comments: The study findings are
"intriguing," and the performance metrics of the analysis of exhaled
VOCs "are promising but not exceptional," wrote Dr. Scott L. Friedman.
However, "they well exceed the predictive values of transaminases, so
that the technology has value and merits further refinement and
validation."
The investigators do "not indicate through what
metabolic pathways and in which cells these specific organic compounds
are generated, and why they might correlate with disease activity," he
added. "Without such insight, the test is a correlative marker rather
than a true biomarker since there is no mechanistic link to a
disease-related pathway, which is a key requirement for a biomarker."
Dr.
Friedman is professor of medicine, liver diseases, at the Mount Sinai
School of Medicine in New York. These remarks were adapted from his
editorial accompanying this article and another on fatty liver disease
and telomerase length (J. Hepatol. 2013;58:j407-8 ). He is a consultant
for Exalenz Biosciences, which produces the methacetin breath test.
The analysis of volatile organic compounds in exhaled breath may provide a noninvasive and accurate test for diagnosing nonalcoholic steatohepatitis, according to results from a pilot study published in March.
This test could reduce the number of unnecessary liver biopsies and missed diagnoses associated with assessing plasma transaminase levels, reported Dr. Froukje J. Verdam of Maastricht (the Netherlands) University Medical Center and her associates (J. Hepatol. 2013;58:543-8).
Researchers evaluated breath samples with gas chromatography–mass spectrometry from 65 consecutive overweight or obese patients before they underwent laparoscopic abdominal surgery, between October 2007 and May 2011. These results were compared with histologic analysis of liver biopsies taken intraoperatively and assessments of plasma levels of alanine aminotransferase (ALT) and aspartate aminotransferase (AST).
Overall, liver biopsies showed that 39 patients (60%) had nonalcoholic steatohepatitis (NASH), defined as "showing signs of steatosis and inflammation." Additionally, ALT and AST levels were significantly higher in patients with the disease than without. However, "parameters such as gender, age, BMI, and HbA1c did not differ significantly," reported the study authors.
The analysis of three volatile organic compounds (VOCs) – n-tridecane, 3-methylbutanonitrile, and 1-propanol – enabled investigators to distinguish between patients with and without NASH, with a sensitivity of 90%, a specificity of 69%, and an area under the receiver operating characteristic (ROC) curve of 0.77 plus or minus 0.07. The positive predictive value of using VOC analysis for NASH was 81%, while the negative predictive value was 82%.
In comparison, in 61 patients from whom plasma was available, the sensitivity of measuring ALT was 19%, while the specificity was 96%. The positive and negative predictive values of ALT were 88% and 43%, respectively.
Further evaluation of the AST/ALT ratio found that it was 32% sensitive and 79% specific, while positive and negative predictive values were 70% and 43%, respectively.
"It can be concluded that the diagnostic value of VOC is much higher than that of plasma transaminases, resulting in less misdiagnosed patients," wrote the study authors. Prediction of NASH using VOC, ALT, and the AST/ALT ratio did not reflect liver biopsy results in 18%, 51%, and 49% of subjects, respectively.
Using VOC evaluation rather than histologic testing has several other advantages, according to the researchers. "The analysis of exhaled breath can identify NASH presence at an early stage, and early identification in a mild stage is pivotal to enhance the chances of cure," they wrote. "Furthermore, whereas a small part of the liver is considered in the evaluation of biopsies, the breath test used in this study noninvasively reflects total liver function."
Funding for this pilot study was provided by grants from the Dutch SenterNovem Innovation Oriented Research Program on Genomics and the Transnational University Limburg, Belgium. The study authors reported no conflicts of interest.
Major finding: Analysis of volatile organic compounds (VOCs) in exhaled breath to diagnose NASH was 90% sensitive and 69% specific.
Data source: A pilot study of 65 consecutive patients comparing VOC analysis of exhaled breath with plasma transaminase levels and liver biopsy.
Disclosures: Funding for this pilot study was provided by grants from the Dutch SenterNovem Innovation Oriented Research Program on Genomics and the Transnational University Limburg, Belgium. The study authors reported no conflicts of interest.
New antiplatelet drug seems more effective than standard
Credit: Andre E.X. Brown
SAN FRANCISCO—The novel antiplatelet agent cangrelor is more effective than clopidogrel as thromboprophylaxis for patients undergoing coronary stent procedures, results of the CHAMPION PHOENIX trial suggest.
Researchers found that intravenous cangrelor reduced the overall odds of complications from stenting procedures, including death, myocardial infarction, ischemia-driven revascularization, and stent thrombosis.
Treatment with cangrelor also resulted in significantly higher rates of major and minor bleeding as compared to clopidogrel. But the rates of severe bleeding were similar between the treatment arms.
These data were presented on March 10 at the 2013 American College of Cardiology Scientific Session and simultaneously published in NEJM. The study was sponsored by The Medicines Company, the makers of cangrelor.
“We are very excited about the potential for this new medication to reduce complications in patients receiving coronary stents for a wide variety of indications,” said investigator Deepak L. Bhatt, MD, MPH, of Brigham and Women’s Hospital in Boston.
“In addition to being much quicker to take effect and more potent than currently available treatment options, this intravenous drug is reversible and has a fast offset of action, which could be an advantage if emergency surgery is needed.”
In this randomized, double-blind trial, Dr Bhatt and his colleagues compared cangrelor to clopidogrel in 11,145 patients treated at 153 centers around the world.
The study included patients who were undergoing elective or urgent percutaneous coronary intervention. Patients with a high risk of bleeding or recent exposure to other anticoagulants were excluded.
The study’s primary efficacy endpoint was the incidence of death, myocardial infarction, ischemia-driven revascularization, or stent thrombosis.
At 48 hours, 4.7% of patients in the cangrelor arm had met this endpoint, compared to 5.9% of patients in the clopidogrel arm (P=0.005). At 30 days, the incidence was 6.0% in the cangrelor arm and 7.0% in the clopidogrel arm (P=0.03).
A secondary endpoint was the rate of stent thrombosis alone. At 48 hours, 0.8% of patients in the cangrelor arm had stent thrombosis, as did 1.4% of patients in the clopidogrel arm (P=0.01). At 30 days, the rate was 1.3% in the cangrelor arm and 1.9% in the clopidogrel arm (P=0.01).
The primary safety endpoint was severe bleeding according to GUSTO criteria. At 48 hours, it measured 0.16% in the cangrelor arm and 0.11% in the clopidogrel arm (P=0.44).
Secondary endpoints included major and minor bleeding (not related to coronary artery bypass grafting) according to ACUITY criteria.
Major bleeding occurred in 4.3% of patients on cangrelor and 2.5% of patients on clopidogrel (P<0.001). And minor bleeding occurred in 11.8% of patients on cangrelor and 8.6% of patients on clopidogrel (P<0.001).
Other treatment-emergent adverse events included agitation, diarrhea, chest pain, dyspnea, and procedural pain. There were significantly more cases of transient dyspnea with cangrelor
than with clopidogrel, at 1.2% and 0.3%, respectively (P<0.001). But there were no statistically significant differences with regard to adverse events other than those mentioned here.
The overall rate of treatment-related adverse events was 20.2% in the cangrelor arm and 19.1% in the clopidogrel arm (P=0.13). And these events led to treatment discontinuation in 0.5% of patients in the cangrelor arm and 0.4% of patients in the clopidogrel arm.
“The investigators feel the data are compelling,” Dr Bhatt concluded. “The data we’ve shown are clear and consistent across all relevant subgroups or patient populations. [Cangrelor] has several advantages, and nothing out there right now has quite the same biological properties.” ![]()
A Sheep in Wolf's Clothing
A 51‐year‐old man presented with severe pain and swelling in the lower anterior right thigh. He stated that the symptoms limited his movement, and began 4 days prior to this presentation. He rated the pain severity a 10 on a 10‐point scale. He denied fevers, chills, or history of trauma or weight loss.
Cellulitis of the lower extremity is the most likely possibility, but the presence of severe pain and swelling of an extremity in the absence of trauma should always make the clinician consider deep‐seated infections such as myositis or necrotizing fasciitis. An early clue for necrotizing fasciitis is severe pain that is disproportionate to the physical examination findings. Erythema, bullous lesions, or crepitus can develop later in the course. The absence of fever and chills also raises the possibility of noninfectious causes such as unrecognized trauma, deep vein thrombosis, or tumor.
The patient had a 15‐year history of type 2 diabetes complicated by end‐stage renal disease secondary to diabetic nephropathy for which he had been on hemodialysis for 5 months, proliferative diabetic retinopathy that rendered him legally blind, hypertension, and anemia. He stated that his diabetes had been poorly controlled, especially after he started dialysis.
A history of poorly controlled diabetes mellitus certainly increases the risk of the infectious disorders mentioned above. The patient's long‐standing history of diabetes mellitus with secondary nephropathy and retinopathy puts him at higher risk of atherosclerosis and vascular insufficiency, which consequently increase his risk for ischemic myonecrosis. Diabetic amyotrophy (diabetic lumbosacral plexopathy) is also a possibility, as it usually manifests with acute, unilateral, and focal tenderness followed by weakness involving a proximal leg. However, it typically occurs in patients who have been recently diagnosed with type 2 diabetes mellitus or whose disease has been under fairly good control and usually is associated with significant weight loss.
The patient was on oral medications for his diabetes until 1year before his presentation, at which point he was switched to insulin therapy. His other medications were amlodipine, lisinopril, aspirin, sevelamer, calcitriol, and calcium and iron supplements. He denied using alcohol, tobacco, or illicit drugs. He lives in Chicago and denies a recent travel history. His family history was significant for type 2 diabetes in multiple family members.
The absence of drugs, tobacco, and alcohol lowers the risk of some infectious and ischemic conditions. Patients with alcoholic liver disease who live in the southern United States are predisposed to developing Vibrio vulnificus myositis and fasciitis after ingesting contaminated oysters during the summer months. However, the clinical presentation of Vibrio usually includes septic shock and bullous lesions on the lower extremity. Also, the patient denies any recent travel to the southern United States, which makes Vibrio myositis and fasciitis less likely. Tobacco abuse increases the risk of atherosclerosis, peripheral vascular insufficiency, and ischemic myonecrosis.
The patient had a temperature of 99.1F, blood pressure of 139/85 mm Hg, pulse of 97 beats/minute, and respiratory rate of 18 breaths/minute. His body mass index was 31 kg/m2. Physical examination revealed a firm, warm, severely tender area of swelling in the inferomedial aspect of the right thigh. The knee was also swollen, and effusion could not be ruled out. The range of motion of the knee was markedly limited by pain. The skin overlying the swelling was erythematous but not broken. No crepitus was noted. The strength of the right lower extremity muscles could not be accurately assessed because of the patient's excruciating pain, but the patient was able to move his foot and toes against gravity. Sensation was absent in most of the tested points in the feet but was normal in the legs. The deep tendon reflexes in both ankles were normal. The pedal pulses were mildly decreased in both feet. He also had extremely decreased visual acuity, which has been chronic. The rest of the physical examination was unremarkable.
The absence of fever does not rule out a serious infection in a diabetic patient but does raise the possibility of a noninfectious cause. Also, over‐the‐counter acetaminophen or nonsteroidal anti‐inflammatory drugs could mask a fever. The patient's physical examination was significant for obesity, a risk factor for developing deep‐seated infections, and a firm and severely tender area of swelling near the right knee that limited range of motion. Septic arthritis of the knee is one possibility; arthrocentesis should be performed as soon as possible. The absence of crepitus, because it is a late physical examination finding, does not rule out myositis or necrotizing fasciitis. The presence of unilateral lower extremity swelling also raises the suspicion for a deep vein thrombosis, which warrants compression ultrasonography. The localized tenderness and the lack of dermatological manifestations, such as Gottron's papules, makes an inflammatory myositis such as dermatomyositis much less likely.
Laboratory studies demonstrated a hemoglobin A1C of 13.0% (reference range, 4.36.1%), fasting blood glucose level of 224 mg/dL (reference range, 7099 mg/dL), white blood cell count of 8300 cells/mm3 (reference range, 450011,000 cells/mm3) without band forms, erythrocyte sedimentation rate of 81 mm/hr (reference range, 14 mm/hr), and creatinine kinase level of 582 IU/L (reference range, 30200 IU/L). Routine chemistries were normal otherwise. An x‐ray of the right knee revealed soft tissue edema. The right knee was aspirated, and fluid analysis revealed a white blood cell count of 106 cells/mm3 (reference range, 200 cell/mm3). Compression ultrasonography of the right lower extremity did not reveal thrombosis.
Poor glycemic control, as evidenced by a high hemoglobin A1C level, is associated with a higher probability of infectious complications. An elevated sedimentation rate is compatible with an infection, and an increased creatinine kinase intensifies suspicion of myositis or myonecrosis. A normal white blood cell count decreases, but does not eliminate, the likelihood of a serious bacterial infection. The fluid analysis rules out septic arthritis, and the compression ultrasonography findings make deep vein thrombosis very unlikely. However, the differential diagnosis still includes myositis, clostridial myonecrosis, cellulitis, and necrotizing fasciitis. The patient should undergo magnetic resonance imaging (MRI) of the lower extremity, and a surgical consultation should be obtained to consider the possibility of surgical exploration.
Blood and the aspirated fluids were sent for culturing, and the patient was started on empiric antibiotics. MRI of his right thigh revealed extensive edema involving the vastus medialis and lateralis of the quadriceps as well as subcutaneous edema without fascial enhancement or gas (Figure 1).
The absence of gas and fascial enhancement makes clostridial myonecrosis or necrotizing fasciitis less likely. The absence of a fluid collection in the muscle makes pyomyositis due to Staphylococci unlikely. Broad‐spectrum antibiotic coverage (usually vancomycin and either piperacillin/tazobactam or a carbapenem) targeting methicillin‐resistant Staphylococcus aureus, anaerobes, Streptococci, and Enterobacteriaceae should be empirically started as soon as cultures are obtained. Clindamycin should be part of the empiric antibiotic regimen to block toxin production in the event that Streptococcus pyogenes is responsible.
Surgical biopsy of the right vastus medialis muscle was performed, and tissue was sent for Gram staining, culture, and routine histopathological analysis. Gram staining was negative, and histopathological analysis revealed ischemic skeletal muscle fibers with areas of necrosis (Figure 2). Cultures from blood, fluid from the right knee, and muscular tissue samples did not grow any bacteria.
The muscle biopsy results are consistent with myonecrosis. Clostridial myonecrosis is possible but usually is associated with gas in tissues or occurs in the setting of intra‐abdominal pathology or severe trauma, and tissue culture was negative. Ischemic myonecrosis due to severe vascular insufficiency would be unlikely given the presence of pedal pulses and the absence of toes or forefoot cyanosis. A vasculitis syndrome is also unlikely because of the focal nature of the findings and the absence of weight loss, muscle weakness, and chronic joint pain in the patient's history. Calciphylaxis (calcific uremic arteriolopathy) might be considered in a patient with end‐stage renal disease who presents with a thigh pain; however, this condition is usually characterized by areas of ischemic necrosis that develop in the dermis and/or subcutaneous fat and infrequently involve muscles. The absence of the painful subcutaneous nodules typical of calciphylaxis makes it an unlikely diagnosis.
A diagnosis of diabetic myonecrosis was made. Antibiotics were discontinued, and the patient was treated symptomatically. His symptoms improved during the next few days. The patient was discharged from the hospital, and conservative management with bed rest and analgesics for 4 weeks was prescribed. Four months later, however, the patient returned with similar symptoms in the contralateral thigh. The patient was diagnosed with recurrent diabetic myonecrosis by MRI and muscle biopsy findings. Conservative management was advised, and the patient became pain‐free in a few weeks.
DISCUSSION
Diabetic myonecrosis (also known as diabetic muscle infarction) is a rare disorder initially described in 1965[1] that typically presents spontaneously as an acute, localized, severely painful swelling that limits the mobility of the affected extremity, usually without systemic signs of infection. It affects the thighs in 83% of patients and the calves in 17% of patients.[2, 3] Bilateral involvement, which is usually asynchronous, occurs in one‐third of patients.[4] The upper limbs are rarely involved. Diabetic myonecrosis affects patients who have a relatively longstanding history of diabetes. It is commonly associated with the microvascular complications of diabetes, including nephropathy (80% of patients), retinopathy (60% of patents), and/or neuropathy (64% of patients).[3, 5] The pathogenesis of diabetic myonecrosis is unclear, but the disease is likely due to a diffuse microangiopathy and atherosclerosis.[2, 5] Some authors have suggested that abnormalities in the clotting or fibrinolytic pathways play a role in the etiology of the disorder.[6]
Clinical and MRI findings can be used to make the diagnosis with reasonable certainty.[3, 5] Although both ultrasonography and MRI have been used to assess patients with diabetic myonecrosis, MRI with intravenous contrast enhancement appears to be the most useful diagnostic technique. It demonstrates extensive edema within the muscle(s), muscle enlargement, subcutaneous and interfascial edema, a patchwork pattern of involvement, and a high signal intensity on T2‐weighted images.[4, 7] Gadolinium enhancement may reveal an enhanced margin of the infarcted muscle with a central nonenhancing area of necrotic tissue.[4, 5] Muscle biopsy is not typically indicated because it may prolong recovery time and lead to infections.[8, 9, 10, 11] When performed, however, muscle biopsy reveals ischemic muscle fibers in different stages of degeneration and regeneration, with areas of necrosis and edema. Occlusion of arterioles and capillaries by fibrin could also be seen.[1] Although the patient underwent a muscle biopsy because infection could not be excluded definitively on clinical grounds, we believe that repeating the biopsy 4 months later was inappropriate.
Diabetic myonecrosis should be considered in a diabetic patient who presents with severe localized muscle pain and swelling of an extremity, especially if the clinical features favoring infection are absent. The differential diagnosis should include infection (eg, clostridial myonecrosis, myositis, cellulitis, abscess, necrotizing fasciitis, osteomyelitis), trauma (eg, hematoma, muscle rupture, myositis ossificans), peripheral neuropathy (particularly lumbosacral plexopathy), vascular disorders (deep vein thrombosis, and compartment syndrome), tumors, inflammatory muscle diseases, and drug‐related myositis.
No evidence‐based recommendations regarding the management of diabetic myonecrosis are available, although the findings of one retrospective analysis support conservative management with bed rest, leg elevation, and analgesics.[12] Physiotherapy may cause the condition to worsen,[13, 14] but routine daily activity, although often painful, is not harmful.[14] Some authors suggest a cautious use of antiplatelet or anti‐inflammatory medications.[12] We would also recommend achieving good glycemic control during the illness. Owing to the rarity of the disease, however, no studies have definitively shown that this hastens recovery or prevents recurrent diabetic myonecrosis. Surgery may prolong the recovery period; one study found that the recovery period of patients with diabetic myonecrosis who underwent surgery was longer than that of those who were treated conservatively (13 weeks vs 5.5 weeks).[12] Patients with diabetic myonecrosis have a good short‐term prognosis. Longer‐term, however, they have a poor prognosis; their recurrence rate is as high as 40%, and their 2‐year mortality rate is 10%, even after one episode of the disease. Death in these patients is mainly due to macrovascular events.[12]
TEACHING POINTS
- Diabetic myonecrosis is a rare complication of longstanding and poorly controlled diabetes. It usually presents with acute localized muscular pain in the lower extremities.
- Although a definitive diagnosis of diabetic myonecrosis is histopathologic, a clinical diagnosis can be made with reasonable certainty for patients with compatible MRI findings and no clinical or laboratory features suggesting infection.
- Conservative management with bed rest, analgesics, and antiplatelets is recommended. Surgery should be avoided, as it may prolong recovery.
Disclosure
Nothing to report.
- , . Tumoriform focal muscular degeneration in two diabetic patients. Diabetologia. 1965;1:39–42.
- . Diabetic muscle infarction: an underdiagnosed complication of long‐standing diabetes. Diabetes Care. 2003;26:211–215.
- , , . Diabetic muscle infarction: case report and review. J Rheumatol. 2004;31:190–194.
- , , , , , . Muscle infarction in patients with diabetes mellitus: MR imaging findings. Radiology. 1999;211:241–247.
- , , , . Skeletal muscle infarction in diabetes mellitus. J Rheumatol. 2000;27:1063–1068.
- Case records of the Massachusetts General Hospital. Weekly clinicopathological exercises. Case 29–1997. A 54‐year‐old diabetic woman with pain and swelling of the leg. N Engl J Med. 1997;337:839–845.
- , , . Clinical and radiological aspects of idiopathic diabetic muscle infarction. Rational approach to diagnosis and treatment. J Bone Joint Surg Br. 1999;81:323–326.
- , , . Diabetic muscular infarction. Preventing morbidity by avoiding excisional biopsy. Arch Intern Med. 1997;157:1611.
- , . Case‐of‐the‐month: painful thigh mass in a young woman: diabetic muscle infarction. Muscle Nerve. 1992;15:850–855.
- . Diabetic muscle infarction: magnetic resonance imaging (MRI) avoids the need for biopsy. Muscle Nerve. 1995;18:129–130.
- , , , . Skeletal muscle infarction in diabetes: MR findings. J Comput Assist Tomogr. 1993;17:986–988.
- , . Treatment and outcomes of diabetic muscle infarction. J Clin Rheumatol. 2005;11:8–12.
- , , . Diabetic muscular infarction. Semin Arthritis Rheum. 1993;22:280–287.
- , . Focal infarction of muscle in diabetics. Diabetes Care. 1986;9:623–630.
A 51‐year‐old man presented with severe pain and swelling in the lower anterior right thigh. He stated that the symptoms limited his movement, and began 4 days prior to this presentation. He rated the pain severity a 10 on a 10‐point scale. He denied fevers, chills, or history of trauma or weight loss.
Cellulitis of the lower extremity is the most likely possibility, but the presence of severe pain and swelling of an extremity in the absence of trauma should always make the clinician consider deep‐seated infections such as myositis or necrotizing fasciitis. An early clue for necrotizing fasciitis is severe pain that is disproportionate to the physical examination findings. Erythema, bullous lesions, or crepitus can develop later in the course. The absence of fever and chills also raises the possibility of noninfectious causes such as unrecognized trauma, deep vein thrombosis, or tumor.
The patient had a 15‐year history of type 2 diabetes complicated by end‐stage renal disease secondary to diabetic nephropathy for which he had been on hemodialysis for 5 months, proliferative diabetic retinopathy that rendered him legally blind, hypertension, and anemia. He stated that his diabetes had been poorly controlled, especially after he started dialysis.
A history of poorly controlled diabetes mellitus certainly increases the risk of the infectious disorders mentioned above. The patient's long‐standing history of diabetes mellitus with secondary nephropathy and retinopathy puts him at higher risk of atherosclerosis and vascular insufficiency, which consequently increase his risk for ischemic myonecrosis. Diabetic amyotrophy (diabetic lumbosacral plexopathy) is also a possibility, as it usually manifests with acute, unilateral, and focal tenderness followed by weakness involving a proximal leg. However, it typically occurs in patients who have been recently diagnosed with type 2 diabetes mellitus or whose disease has been under fairly good control and usually is associated with significant weight loss.
The patient was on oral medications for his diabetes until 1year before his presentation, at which point he was switched to insulin therapy. His other medications were amlodipine, lisinopril, aspirin, sevelamer, calcitriol, and calcium and iron supplements. He denied using alcohol, tobacco, or illicit drugs. He lives in Chicago and denies a recent travel history. His family history was significant for type 2 diabetes in multiple family members.
The absence of drugs, tobacco, and alcohol lowers the risk of some infectious and ischemic conditions. Patients with alcoholic liver disease who live in the southern United States are predisposed to developing Vibrio vulnificus myositis and fasciitis after ingesting contaminated oysters during the summer months. However, the clinical presentation of Vibrio usually includes septic shock and bullous lesions on the lower extremity. Also, the patient denies any recent travel to the southern United States, which makes Vibrio myositis and fasciitis less likely. Tobacco abuse increases the risk of atherosclerosis, peripheral vascular insufficiency, and ischemic myonecrosis.
The patient had a temperature of 99.1F, blood pressure of 139/85 mm Hg, pulse of 97 beats/minute, and respiratory rate of 18 breaths/minute. His body mass index was 31 kg/m2. Physical examination revealed a firm, warm, severely tender area of swelling in the inferomedial aspect of the right thigh. The knee was also swollen, and effusion could not be ruled out. The range of motion of the knee was markedly limited by pain. The skin overlying the swelling was erythematous but not broken. No crepitus was noted. The strength of the right lower extremity muscles could not be accurately assessed because of the patient's excruciating pain, but the patient was able to move his foot and toes against gravity. Sensation was absent in most of the tested points in the feet but was normal in the legs. The deep tendon reflexes in both ankles were normal. The pedal pulses were mildly decreased in both feet. He also had extremely decreased visual acuity, which has been chronic. The rest of the physical examination was unremarkable.
The absence of fever does not rule out a serious infection in a diabetic patient but does raise the possibility of a noninfectious cause. Also, over‐the‐counter acetaminophen or nonsteroidal anti‐inflammatory drugs could mask a fever. The patient's physical examination was significant for obesity, a risk factor for developing deep‐seated infections, and a firm and severely tender area of swelling near the right knee that limited range of motion. Septic arthritis of the knee is one possibility; arthrocentesis should be performed as soon as possible. The absence of crepitus, because it is a late physical examination finding, does not rule out myositis or necrotizing fasciitis. The presence of unilateral lower extremity swelling also raises the suspicion for a deep vein thrombosis, which warrants compression ultrasonography. The localized tenderness and the lack of dermatological manifestations, such as Gottron's papules, makes an inflammatory myositis such as dermatomyositis much less likely.
Laboratory studies demonstrated a hemoglobin A1C of 13.0% (reference range, 4.36.1%), fasting blood glucose level of 224 mg/dL (reference range, 7099 mg/dL), white blood cell count of 8300 cells/mm3 (reference range, 450011,000 cells/mm3) without band forms, erythrocyte sedimentation rate of 81 mm/hr (reference range, 14 mm/hr), and creatinine kinase level of 582 IU/L (reference range, 30200 IU/L). Routine chemistries were normal otherwise. An x‐ray of the right knee revealed soft tissue edema. The right knee was aspirated, and fluid analysis revealed a white blood cell count of 106 cells/mm3 (reference range, 200 cell/mm3). Compression ultrasonography of the right lower extremity did not reveal thrombosis.
Poor glycemic control, as evidenced by a high hemoglobin A1C level, is associated with a higher probability of infectious complications. An elevated sedimentation rate is compatible with an infection, and an increased creatinine kinase intensifies suspicion of myositis or myonecrosis. A normal white blood cell count decreases, but does not eliminate, the likelihood of a serious bacterial infection. The fluid analysis rules out septic arthritis, and the compression ultrasonography findings make deep vein thrombosis very unlikely. However, the differential diagnosis still includes myositis, clostridial myonecrosis, cellulitis, and necrotizing fasciitis. The patient should undergo magnetic resonance imaging (MRI) of the lower extremity, and a surgical consultation should be obtained to consider the possibility of surgical exploration.
Blood and the aspirated fluids were sent for culturing, and the patient was started on empiric antibiotics. MRI of his right thigh revealed extensive edema involving the vastus medialis and lateralis of the quadriceps as well as subcutaneous edema without fascial enhancement or gas (Figure 1).
The absence of gas and fascial enhancement makes clostridial myonecrosis or necrotizing fasciitis less likely. The absence of a fluid collection in the muscle makes pyomyositis due to Staphylococci unlikely. Broad‐spectrum antibiotic coverage (usually vancomycin and either piperacillin/tazobactam or a carbapenem) targeting methicillin‐resistant Staphylococcus aureus, anaerobes, Streptococci, and Enterobacteriaceae should be empirically started as soon as cultures are obtained. Clindamycin should be part of the empiric antibiotic regimen to block toxin production in the event that Streptococcus pyogenes is responsible.
Surgical biopsy of the right vastus medialis muscle was performed, and tissue was sent for Gram staining, culture, and routine histopathological analysis. Gram staining was negative, and histopathological analysis revealed ischemic skeletal muscle fibers with areas of necrosis (Figure 2). Cultures from blood, fluid from the right knee, and muscular tissue samples did not grow any bacteria.
The muscle biopsy results are consistent with myonecrosis. Clostridial myonecrosis is possible but usually is associated with gas in tissues or occurs in the setting of intra‐abdominal pathology or severe trauma, and tissue culture was negative. Ischemic myonecrosis due to severe vascular insufficiency would be unlikely given the presence of pedal pulses and the absence of toes or forefoot cyanosis. A vasculitis syndrome is also unlikely because of the focal nature of the findings and the absence of weight loss, muscle weakness, and chronic joint pain in the patient's history. Calciphylaxis (calcific uremic arteriolopathy) might be considered in a patient with end‐stage renal disease who presents with a thigh pain; however, this condition is usually characterized by areas of ischemic necrosis that develop in the dermis and/or subcutaneous fat and infrequently involve muscles. The absence of the painful subcutaneous nodules typical of calciphylaxis makes it an unlikely diagnosis.
A diagnosis of diabetic myonecrosis was made. Antibiotics were discontinued, and the patient was treated symptomatically. His symptoms improved during the next few days. The patient was discharged from the hospital, and conservative management with bed rest and analgesics for 4 weeks was prescribed. Four months later, however, the patient returned with similar symptoms in the contralateral thigh. The patient was diagnosed with recurrent diabetic myonecrosis by MRI and muscle biopsy findings. Conservative management was advised, and the patient became pain‐free in a few weeks.
DISCUSSION
Diabetic myonecrosis (also known as diabetic muscle infarction) is a rare disorder initially described in 1965[1] that typically presents spontaneously as an acute, localized, severely painful swelling that limits the mobility of the affected extremity, usually without systemic signs of infection. It affects the thighs in 83% of patients and the calves in 17% of patients.[2, 3] Bilateral involvement, which is usually asynchronous, occurs in one‐third of patients.[4] The upper limbs are rarely involved. Diabetic myonecrosis affects patients who have a relatively longstanding history of diabetes. It is commonly associated with the microvascular complications of diabetes, including nephropathy (80% of patients), retinopathy (60% of patents), and/or neuropathy (64% of patients).[3, 5] The pathogenesis of diabetic myonecrosis is unclear, but the disease is likely due to a diffuse microangiopathy and atherosclerosis.[2, 5] Some authors have suggested that abnormalities in the clotting or fibrinolytic pathways play a role in the etiology of the disorder.[6]
Clinical and MRI findings can be used to make the diagnosis with reasonable certainty.[3, 5] Although both ultrasonography and MRI have been used to assess patients with diabetic myonecrosis, MRI with intravenous contrast enhancement appears to be the most useful diagnostic technique. It demonstrates extensive edema within the muscle(s), muscle enlargement, subcutaneous and interfascial edema, a patchwork pattern of involvement, and a high signal intensity on T2‐weighted images.[4, 7] Gadolinium enhancement may reveal an enhanced margin of the infarcted muscle with a central nonenhancing area of necrotic tissue.[4, 5] Muscle biopsy is not typically indicated because it may prolong recovery time and lead to infections.[8, 9, 10, 11] When performed, however, muscle biopsy reveals ischemic muscle fibers in different stages of degeneration and regeneration, with areas of necrosis and edema. Occlusion of arterioles and capillaries by fibrin could also be seen.[1] Although the patient underwent a muscle biopsy because infection could not be excluded definitively on clinical grounds, we believe that repeating the biopsy 4 months later was inappropriate.
Diabetic myonecrosis should be considered in a diabetic patient who presents with severe localized muscle pain and swelling of an extremity, especially if the clinical features favoring infection are absent. The differential diagnosis should include infection (eg, clostridial myonecrosis, myositis, cellulitis, abscess, necrotizing fasciitis, osteomyelitis), trauma (eg, hematoma, muscle rupture, myositis ossificans), peripheral neuropathy (particularly lumbosacral plexopathy), vascular disorders (deep vein thrombosis, and compartment syndrome), tumors, inflammatory muscle diseases, and drug‐related myositis.
No evidence‐based recommendations regarding the management of diabetic myonecrosis are available, although the findings of one retrospective analysis support conservative management with bed rest, leg elevation, and analgesics.[12] Physiotherapy may cause the condition to worsen,[13, 14] but routine daily activity, although often painful, is not harmful.[14] Some authors suggest a cautious use of antiplatelet or anti‐inflammatory medications.[12] We would also recommend achieving good glycemic control during the illness. Owing to the rarity of the disease, however, no studies have definitively shown that this hastens recovery or prevents recurrent diabetic myonecrosis. Surgery may prolong the recovery period; one study found that the recovery period of patients with diabetic myonecrosis who underwent surgery was longer than that of those who were treated conservatively (13 weeks vs 5.5 weeks).[12] Patients with diabetic myonecrosis have a good short‐term prognosis. Longer‐term, however, they have a poor prognosis; their recurrence rate is as high as 40%, and their 2‐year mortality rate is 10%, even after one episode of the disease. Death in these patients is mainly due to macrovascular events.[12]
TEACHING POINTS
- Diabetic myonecrosis is a rare complication of longstanding and poorly controlled diabetes. It usually presents with acute localized muscular pain in the lower extremities.
- Although a definitive diagnosis of diabetic myonecrosis is histopathologic, a clinical diagnosis can be made with reasonable certainty for patients with compatible MRI findings and no clinical or laboratory features suggesting infection.
- Conservative management with bed rest, analgesics, and antiplatelets is recommended. Surgery should be avoided, as it may prolong recovery.
Disclosure
Nothing to report.
- , . Tumoriform focal muscular degeneration in two diabetic patients. Diabetologia. 1965;1:39–42.
- . Diabetic muscle infarction: an underdiagnosed complication of long‐standing diabetes. Diabetes Care. 2003;26:211–215.
- , , . Diabetic muscle infarction: case report and review. J Rheumatol. 2004;31:190–194.
- , , , , , . Muscle infarction in patients with diabetes mellitus: MR imaging findings. Radiology. 1999;211:241–247.
- , , , . Skeletal muscle infarction in diabetes mellitus. J Rheumatol. 2000;27:1063–1068.
- Case records of the Massachusetts General Hospital. Weekly clinicopathological exercises. Case 29–1997. A 54‐year‐old diabetic woman with pain and swelling of the leg. N Engl J Med. 1997;337:839–845.
- , , . Clinical and radiological aspects of idiopathic diabetic muscle infarction. Rational approach to diagnosis and treatment. J Bone Joint Surg Br. 1999;81:323–326.
- , , . Diabetic muscular infarction. Preventing morbidity by avoiding excisional biopsy. Arch Intern Med. 1997;157:1611.
- , . Case‐of‐the‐month: painful thigh mass in a young woman: diabetic muscle infarction. Muscle Nerve. 1992;15:850–855.
- . Diabetic muscle infarction: magnetic resonance imaging (MRI) avoids the need for biopsy. Muscle Nerve. 1995;18:129–130.
- , , , . Skeletal muscle infarction in diabetes: MR findings. J Comput Assist Tomogr. 1993;17:986–988.
- , . Treatment and outcomes of diabetic muscle infarction. J Clin Rheumatol. 2005;11:8–12.
- , , . Diabetic muscular infarction. Semin Arthritis Rheum. 1993;22:280–287.
- , . Focal infarction of muscle in diabetics. Diabetes Care. 1986;9:623–630.
