User login
Seal of Approval
A report in this month's Journal of Hospital Medicine suggests that hospitals accredited by the Joint Commission outperform those that aren't when it comes to treatment of acute myocardial infarction (AMI), heart failure (HF), and pneumonia.
The study, "Hospital Performance Trends on National Quality Measures and the Association with Joint Commission Accreditation," also found that over a five-year reporting period, accredited institutions improved more than their non-accredited counterparts. HM pioneer Robert Wachter, MD, MHM, chief of the Division of Hospital Medicine at the University of California at San Francisco, was a coauthor of the study.
Joint Commission staffers and fellow coauthors Jerod Loeb, PhD, executive vice president of the Division of Healthcare Quality Evaluation at the Joint Commission, and Stephen Schmaltz, MPH, PhD, associate director of the Department of Health Services Research, say that researchers were not able to compare hospitals based on accreditation and quality control until the commission and the Centers for Medicare & Medicaid Services (CMS) adopted identical measures in 2004.
"We had a strong suspicion that accredited facilities would perform better, which was demonstrable in a statistically significant manner," Dr. Loeb says. "Of course, we worried that one of the questions that reviewers or others who read this might ask is, 'Sure, this is what we might expect from the Joint Commission to say that.' This is why the data is publically available, from us and CMS. Anyone can do the same type of analyses we’ve done and clearly come up with the very same conclusion.”
The next step of the research, Drs. Loeb and Schmaltz say, is to try to delineate whether the "gold seal" of accreditation is what "actually promotes improved performance or is a marker for other characteristics associated with such performance."
"There is something to this broad rubric associated with accreditation that is actually making a difference in the context of measures that matter...to clinical outcomes," Dr. Loeb adds. "This isn't the end of the game for us by any stretch of the imagination. It's clear that more research is needed."
QI-Focused Microsite Aims to Educate Hospitalists
Gregory Maynard, MD, MSc, SFHM, has high hopes for SHM's new Center for Hospital Innovation and Improvement. Dr. Maynard, recently appointed senior vice president of "The Center," believes The Center's tools, resources, and initiatives in QI and patient safety will advance hospitalists' understanding of the implications of healthcare reform and how recent legislative changes will directly affect their jobs.
Through its Web portal, The Center aims to bring together a wide variety of resources, not only such SHM-branded initiatives as VTE Prevention and Project BOOST (Better Outcomes for Older Adults through Safe Transitions), but also relevant tools from other sources.
"The Center has grown because there's a bigger demand all the time for the skills, knowledge, and leadership required for quality and patient safety," Dr. Maynard says. "We recognize that frontline hospitalists are very busy with day-to-day clinical care. On the other hand, quality and safety efforts increasingly will be tied to hospital reimbursement."
Hospital administrators are paying attention to those trends, and hospitalists are well situated to lead their response, he adds.
New quality developments at the center include:
- eQUIPS, SHM’s online toolkit for hospital QI, with a data registry and tools for comparing performance with other hospitals;
- Hospitalists and In-Hospital Resuscitation, a multidisciplinary project for standardizing resuscitation practice;
- A new initiative for atrial fibrillation and transitions of care; and
- In-hospital best practices in diabetes care for hospitalist extenders.
Dr. Maynard is director of hospital medicine and chair of the Patient Safety Committee at the University of California at San Diego (UCSD). He expects to spend one week per month at SHM's Philadelphia office while retaining his leadership position at UCSD.
Frequent Hot Flashes? Check Lipid Levels
NATIONAL HARBOR, Md. – Frequent hot flashes in menopausal women were significantly associated with higher levels of low-density lipoproteins, high-density lipoproteins, and triglycerides during a 7-year follow-up study of 3,201 women enrolled in an ongoing longitudinal study.
Women who reported 1-5 days of hot flashes or 6 or more days of hot flashes during the past 2 weeks were significantly more likely to have elevated levels of LDL cholesterol.
Previous investigations using the Study of Women’s Health Across the Nation (SWAN) database have shown that women with more hot flashes have an elevated risk for subclinical cardiovascular disease, said Rebecca Thurston, Ph.D., of the University of Pittsburgh. But "there is a lot we don’t know about this association, including what could possibly explain this," she said at the annual meeting of the North American Menopause Society.
Dr. Thurston and colleagues examined hot flashes as they related to lipid profiles in women enrolled in SWAN. The subjects’ median age was 46 years, 48% were white, 46% were in early or perimenopause, and 26% reported hot flashes within the past two weeks.
Hot flashes were analyzed in relation to six lipid profiles, after controlling for age, race, menopausal status/cycle day, alcohol use, physical activity, smoking, anxiety, body mass index, cardiovascular disease status and medications, lipid lowering medications, and estradiol.
Compared to women who reported no hot flashes, women who reported 1-5 days of hot flashes or 6 or more days of hot flashes during the past 2 weeks were significantly more likely to have elevated levels of LDL cholesterol, triglycerides, apolipoprotein B, and apolipoprotein A1. For example, LDL levels among women with 6 or more days of hot flashes peaked at approximately 125 mg/dL during a 2-week period, compared with a peak of approximately 120 mg/dL among women with 1-5 days of hot flashes and a peak of approximately 118 mg/dL among women with no reported days of hot flashes.
Levels of HDL cholesterol were significantly higher in women who reported 6 or more days of hot flashes during the past 2 weeks, compared with those who reported no hot flashes, but HDL levels were not significantly different between women who reported 1-5 days of hot flashes and those who reported no hot flashes.
By contrast, levels of lipoprotein(a) were not significantly different among women who reported no hot flashes, women who reported 1 to 5 days of hot flashes, and women who reported 6 or more days of hot flashes.
The positive relationships between hot flashes and lipoprotein(a), and between hot flashes and HDL in some women, were surprising, Dr. Thurston said. "The cardioprotective nature of HDL may depend on particle size," she noted. HDL particles become smaller as women transition through menopause, she added, which might explain the differences.
Additional studies are needed to address the findings on HDL and lipoprotein(a) and to explore how vasomotor symptoms may provide additional information about women’s vascular health, Dr. Thurston said. Future studies should be designed with improved measures of vasomotor symptoms, she added.
The study was supported by a grant from the National Institutes of Health. Dr. Thurston had no financial conflicts to disclose.
FROM THE ANNUAL MEETING OF THE NORTH AMERICAN MENOPAUSE SOCIETY
Major Finding: LDL levels among women with 6 or more days of hot flashes peaked at approximately 125 mg/dL during a 2-week period, compared with a peak of approximately 120 mg/dL among women with 1-5 days of hot flashes and a peak of approximately 118 mg/dL among women with no reported days of hot flashes.
Data Source: Data from 3,201 women enrolled in the Study of Women’s Health Across the Nation (SWAN).
Disclosures: The study was supported by a grant from the National Institutes of Health. Dr. Thurston had no financial conflicts to disclose.
Reliability of CXR for Pneumonia
The chest radiograph (CXR) is the most commonly used diagnostic imaging modality in children, and is considered to be the gold standard for the diagnosis of pneumonia. As such, physicians in developed countries rely on chest radiography to establish the diagnosis of pneumonia.13 However, there are limited data investigating the reliability of this test for the diagnosis of pneumonia in children.2, 46
Prior investigations have noted poor overall agreement by emergency medicine, infectious diseases, and pulmonary medicine physicians, and even radiologists, in their interpretation of chest radiographs for the diagnosis of pneumonia.2, 5, 710 The World Health Organization (WHO) developed criteria to standardize CXR interpretation for the diagnosis of pneumonia in children for use in epidemiologic studies.11 These standardized definitions of pneumonia have been formally evaluated by the WHO6 and utilized in epidemiologic studies of vaccine efficacy,12 but the overall reliability of these radiographic criteria have not been studied outside of these forums.
We conducted this prospective case‐based study to evaluate the reliability of the radiographic diagnosis of pneumonia among children presenting to a pediatric emergency department with clinical suspicion of pneumonia. We were primarily interested in assessing the overall reliability in CXR interpretation for the diagnosis of pneumonia, and identifying which radiographic features of pneumonia were consistently identified by radiologists.
MATERIALS AND METHODS
Study Subjects
We evaluated the reliability of CXR interpretation with respect to the diagnosis of pneumonia among radiologists. Six board‐certified radiologists at 2 academic children's hospitals (Children's Hospital of Philadelphia, Philadelphia, PA [n = 3] and Children's Hospital, Boston, Boston, MA [n = 3]) interpreted the same 110 chest radiographs in a blinded fashion. The radiologists varied with respect to the number of years practicing pediatric radiology (median 8 years, range 3‐36 years). Clinical information such as age, gender, clinical indication for obtaining the radiograph, history, and physical examination findings were not provided. Aside from the study form which stated the WHO classification scheme for radiographic pneumonia, no other information or training was provided to the radiologists as part of this study.
Radiographs were selected among a population of children presenting to the emergency department at Children's Hospital, Boston, who had a radiograph obtained for concern of pneumonia. From this cohort, we selected children who had radiographs which encompassed the spectrum of respiratory disease processes encountered in a pediatric population. The radiographs selected for review included 50 radiographs with a final reading in the medical record without suspicion for pneumonia, and 50 radiographs in which the diagnosis of pneumonia could not be excluded. In the latter group, 25 radiographs had a final reading suggestive of an alveolar infiltrate, and 25 radiographs had a final reading suggestive of an interstitial infiltrate. Ten duplicate radiographs were included to permit assessment of intra‐rater reliability.
Radiograph Interpretation
Radiologists at both sites interpreted the identical 110 radiographs (both anteroposterior [AP] and lateral views for each subject). Digital Imaging and Communications in Medicine (DICOM) images were downloaded from a registry at Children's Hospital, Boston, and were copied to DVDs which were provided to each radiologist. Standardized radiographic imaging software (eFilm Lite [Mississauga, Canada]) was used by each radiologist to view and interpret the radiographs.
Each radiologist completed a study questionnaire for each radiograph interpreted (see Supporting Appendix A in the online version of this article). The questionnaire utilized radiographic descriptors of primary end‐point pneumonia described by the WHO which were procured to standardize the radiographic diagnosis of pneumonia.11, 12 The main outcome of interest was the presence or absence of an infiltrate. Among radiographs in which an infiltrate was identified, radiologists selected whether there was an alveolar infiltrate, interstitial infiltrate, or both. An alveolar infiltrate was defined as a dense or fluffy opacity that occupies a portion or whole of a lobe, or of the entire lung, that may or may not contain air bronchograms.11, 12 An interstitial infiltrate was defined by a lacy pattern involving both lungs, featuring peribronchial thickening and multiple areas of atelectasis.11, 12 It also included minor patchy infiltrates that were not of sufficient magnitude to constitute consolidation, and small areas of atelectasis that in children may be difficult to distinguish from consolidation. Among interstitial infiltrates, radiologists were asked to distinguish infiltrate from atelectasis. A radiograph classified as having either an alveolar infiltrate or interstitial infiltrate (not atelectasis) was considered to have any infiltrate. Additional findings including air bronchograms, hilar adenopathy, pleural effusion, and location of abnormalities were also recorded.
Statistical Analysis
Inter‐rater reliability was assessed using the kappa statistic to determine the overall agreement between the 6 radiologists for each binary outcome (ie, presence or absence of alveolar infiltrate). To calculate 95% confidence intervals (CI) for kappa statistics with more than 2 raters, we employed a bootstrapping method with 1000 replications of samples equal in size to the study sample, using the kapci program as implemented by STATA software (version 10.1, STATA Corp, College Station, TX). Also, intra‐rater reliability was evaluated by examining the agreement within each radiologist upon review of 10 duplicate radiographs that had been randomly inserted into the case‐mix. We used the benchmarks proposed by Landis and Koch to classify the strength of agreement measured by the kappa statistic, as follows: poor (<0.0); slight (0‐0.20); fair (0.21‐0.40); moderate (0.41‐0.60); substantial (0.61‐0.80); almost perfect (0.81‐1.0).13
The study was approved by the institutional review boards at Children's Hospital, Boston and Children's Hospital of Philadelphia.
RESULTS
Patient Sample
The sample of 110 radiographs was obtained from 100 children presenting to the emergency department at Children's Hospital, Boston, with concern of pneumonia. These patients ranged in age from 1 week to 19 years (median, 3.5 years; interquartile range [IQR], 1.6‐6.0 years). Fifty (50%) of these patients were male. As stated above, the sample comprised 50 radiographs with a final reading in the medical record without suspicion for pneumonia, and 50 radiographs in which the diagnosis of pneumonia could not be excluded. The 10 duplicate radiographs encompassed a similar spectrum of findings.
Inter‐Rater Reliability
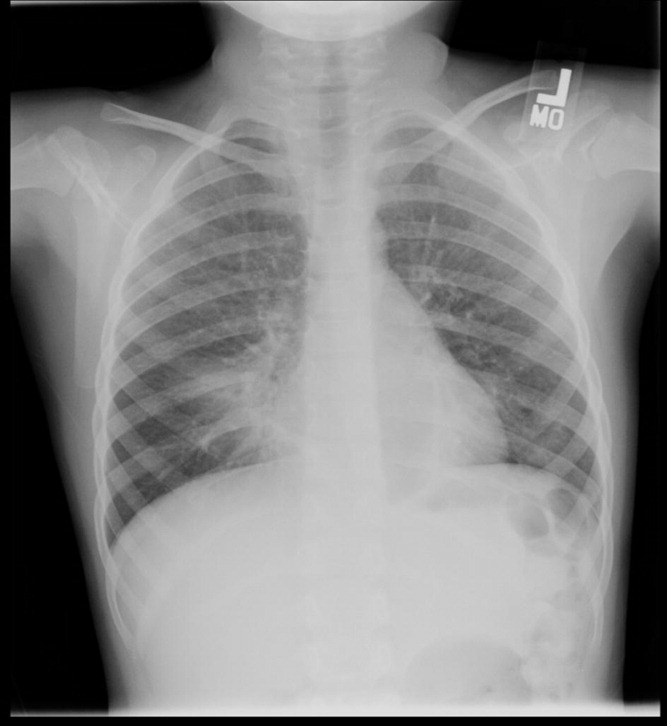
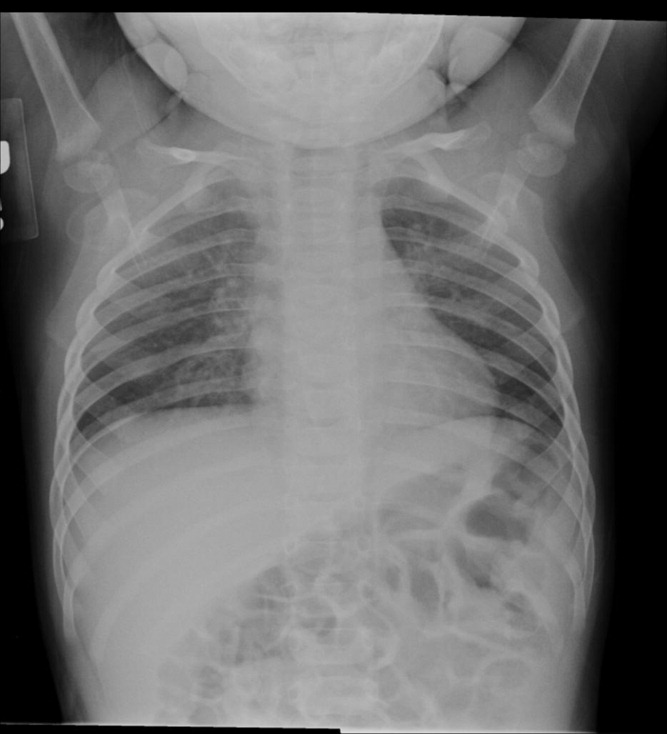
The kappa coefficients of inter‐rater reliability between the radiologists across the 6 clinical measures of interest are displayed in Table 1. As shown, the most reliable measure was that of alveolar infiltrate (Figure 1), which attained a substantial degree of agreement between the radiologists. Two other measures, any infiltrate and pleural effusion, attained moderate reliability, while bronchograms and hilar adenopathy were each classified as having fair reliability. However, interstitial infiltrate (Figure 2) was found to have the lowest kappa estimate, with a slight degree of reliability. When examining inter‐rater reliability among the radiologists separately from each institution, the pattern of results was similar.
| All Radiologists (n = 6) | Kappa | 95% Confidence Interval |
|---|---|---|
| ||
| Any infiltrate | 0.47 | 0.39, 0.56 |
| Alveolar infiltrate | 0.69 | 0.60, 0.78 |
| Interstitial infiltrate | 0.14 | 0.05, 0.23 |
| Air bronchograms | 0.32 | 0.24, 0.42 |
| Hilar adenopathy | 0.21 | 0.08, 0.39 |
| Pleural effusion | 0.45 | 0.29, 0.61 |
At least 4 of the 6 radiologists agreed on the presence or absence of an alveolar infiltrate for 95 of the 100 unique CXRs; all 6 radiologists agreed regarding the presence or absence of an alveolar infiltrate in 72 of the 100 unique CXRs. At least 4 of the 6 radiologists agreed on the presence or absence of any infiltrate and interstitial infiltrate 96% and 90% of the time, respectively. All 6 of the radiologists agreed on the presence or absence of any infiltrate and interstitial infiltrate 35% and 27% of the time, respectively.
Intra‐Rater Reliability
Estimates of intra‐rater reliability on the primary clinical outcomes (alveolar infiltrate, interstitial infiltrate, and any infiltrate) are found in Table 2. Across the 6 raters, the kappa estimates for alveolar infiltrate were all classified as substantial or almost perfect. The kappa estimates for interstitial infiltrate varied widely, ranging from fair to almost perfect, while for any infiltrate, reliability ranged from moderate to almost perfect.
| Kappa | 95% Confidence Interval | |
|---|---|---|
| ||
| Any infiltrate | ||
| Rater 1 | 1.00 | 1.00, 1.00 |
| Rater 2 | 0.60 | 0.10, 1.00 |
| Rater 3 | 0.80 | 0.44, 1.00 |
| Rater 4 | 1.00 | 1.00, 1.00 |
| Rater 5 | n/a* | |
| Rater 6 | 1.00 | 1.00, 1.00 |
| Alveolar infiltrate | ||
| Rater 1 | 1.00 | 1.00, 1.00 |
| Rater 2 | 1.00 | 1.00, 1.00 |
| Rater 3 | 1.00 | 1.00, 1.00 |
| Rater 4 | 1.00 | 1.00, 1.00 |
| Rater 5 | 0.78 | 0.39, 1.00 |
| Rater 6 | 0.74 | 0.27, 1.00 |
| Interstitial infiltrate | ||
| Rater 1 | 1.00 | 1.00, 1.00 |
| Rater 2 | 0.21 | 0.43, 0.85 |
| Rater 3 | 0.74 | 0.27, 1.00 |
| Rater 4 | n/a | |
| Rater 5 | 0.58 | 0.07, 1.00 |
| Rater 6 | 0.62 | 0.5, 1.00 |
DISCUSSION
The chest radiograph serves as an integral component of the reference standard for the diagnosis of childhood pneumonia. Few prior studies have assessed the reliability of chest radiograph findings in children.3, 5, 12, 14, 15 We found a high degree of agreement among radiologists for radiologic findings consistent with bacterial pneumonia when standardized interpretation criteria were applied. In this study, we identified radiographic features of pneumonia, such as alveolar infiltrate and pleural effusion, that were consistently identified by different radiologists reviewing the same radiograph and by the same radiologist reviewing the same radiograph. These data support the notion that radiographic features most suggestive of bacterial pneumonia are consistently identified by radiologists.16, 17 There was less consistency in the identification of other radiographic findings, such as interstitial infiltrates, air bronchograms, and hilar lymphadenopathy.
Prior studies have found high levels of disagreement among radiologists in the interpretation of chest radiographs.2, 3, 15, 18 Many of these prior studies emphasized variation in detection of radiographic findings that would not typically alter clinical management. We observed high intra‐rater, and inter‐rater reliability among radiologists for the findings of alveolar infiltrate and pleural effusion. These are the radiographic findings most consistent with a bacterial etiologic agent for pneumonia.19 Other studies have also found that the presence of an alveolar infiltrate is a reliable radiographic finding in children18 and adults.7, 9, 10 These findings support the use of the WHO definition of primary endpoint pneumonia for use in epidemiologic studies.4, 6, 11
This study also confirms a previous report by Cherian et al. that findings of many children with asthma, reactive airways disease, bronchiolitis, and viral infections interstitial infiltrates are less reliable.6 This is not surprising considering the fact that these patients often have radiographic findings due to small airway disease and atelectasis.19, 20 The differentiation between atelectasis and interstitial infiltrate is difficult, particularly in young children. A prior study conducted among neonates observed wide variability in the interpretation of chest radiographs, and that the differentiation of pneumonia from atelectasis was difficult for this patient population.5 The decisions around antimicrobial treatment of children with radiographic findings of interstitial infiltrates should be made in the context of the clinical history and physical examination findings, and clinicians should realize that these radiographic features demonstrate poor reliability for the diagnosis of pneumonia.
Overall reliability for the presence of any infiltrate, and its converse, no infiltrate was considered moderate. This is driven by the low reliability and variability around the radiographic diagnosis of interstitial infiltrates. Our findings are similar to those observed in adults with lower respiratory tract infections.9 The low reliability in identification of interstitial infiltrates may explain why prior studies have demonstrated that the CXR results rarely change management in children who have radiographs performed for suspicion of pneumonia.1, 21 Our study highlights the importance of quantifying CXR findings to include specific comments regarding the presence or absence of alveolar infiltrates, rather than the presence or absence of any infiltrate.
The WHO has procured definitions the radiographic diagnosis of pneumonia, and this definition has been utilized to help standardize the interpretation of chest radiographs for the conduct of epidemiological studies.6, 11 Specifically, the definitions utilized not only define the presence or absence of pneumonia, but also attempt to differentiate a primarily bacterial infection (consolidation or pleural effusion), from a viral or atypical presentation (interstitial pattern). Even under the best of circumstances, the differentiation of viral versus bacterial pneumonia is not always possible, and again, is often made by the treating physician by incorporating the clinical setting within which the radiograph was obtained.
This study had several limitations. Firstly, the included radiographs did not reflect the frequency with which certain radiographic findings would be identified in children evaluated for pneumonia in a pediatric emergency department setting. Radiographs were purposefully selected to encompass a broad spectrum of radiologic findings, including less common findings such as hilar lymphadenopathy and pleural effusions. Thus, the prevalence of pneumonia and other abnormal findings in this study was artificially higher than typically observed among a cohort of children for whom pneumonia is considered, a factor that may limit the generalizability of our results. Secondly, the clinical history was not provided to the radiologists to avoid bias by indication. For this study, we notified the radiologists that all radiographs were performed for clinical suspicion of pneumonia without providing details about the subjects' signs and symptoms. The absence of clinical history, however, does not mirror the real world scenario in which the interpretation of the chest radiograph is frequently made in the context of the clinical history. The relevance of this latter issue is unclear, as Tudor et al. found a nonstatistically significant improvement in the overall accuracy in chest radiograph interpretation when radiologists were provided clinical details.10 The radiologists recruited for this study all practice in an academic children's hospital setting, and thus, the generalizability of our findings may be limited to this type of practice setting. Finally, reproducibility does not imply accuracy, and reliability in identifying specific findings does not necessarily lead to improved or different management. Thus, while the reliability of radiographic findings of alveolar infiltrate and pleural effusion is reassuringly high, the validity of these radiographic features for bacterial pneumonia is not known. Ascertainment of validity can only be assessed through the use of invasive testing such as lung biopsy, as the yield from bacterial testing such as blood cultures is low, and the results of other studies such as viral testing of nasopharyngeal washings do not prove an etiologic cause of pneumonia.
CONCLUSIONS
Radiographic findings of alveolar infiltrates and pleural effusions are highly reliable among radiologists. Radiographic interpretation of interstitial infiltrates appears to be less reliable.
- ,,, et al.Usefulness of chest radiographs in children with acute lower respiratory tract disease.J Pediatr.1987;111:187–193.
- ,,, et al.Disagreement in the interpretation of chest radiographs among specialists and clinical outcomes of patients hospitalized with suspected pneumonia.Eur J Intern Med.2006;17:43–47.
- ,,.Problems in the clinical and roentgenographic diagnosis of pneumonia in young children.Clin Pediatr (Phila).1984;23:398–399.
- WHO guidelines on detecting pneumonia in children.Lancet.1991;338:1453–1454.
- ,,, et al.Inter‐ and intra‐observer variability in the assessment of atelectasis and consolidation in neonatal chest radiographs.Pediatr Radiol.1999;29:459–462.
- ,,, et al.Standardized interpretation of paediatric chest radiographs for the diagnosis of pneumonia in epidemiological studies.Bull World Health Organ.2005;83:353–359.
- ,,, et al.Interobserver reliability of the chest radiograph in community‐acquired pneumonia. PORT Investigators.Chest.1996;110:343–350.
- ,,, et al.Chest radiographs in the emergency department: is the radiologist really necessary?Postgrad Med J.2003;79:214–217.
- ,,, et al.Inter‐observer variation in the interpretation of chest radiographs for pneumonia in community‐acquired lower respiratory tract infections.Clin Radiol.2004;59:743–752.
- ,,.An assessment of inter‐observer agreement and accuracy when reporting plain radiographs.Clin Radiol.1997;52:235–238.
- Standardization of interpretation of chest radiographs for the diagnosis of pneumonia in children. In:World Health Organization: Pneumonia Vaccine Trial Investigators' Group.Geneva:Department of Vaccine and Biologics;2001.
- ,,, et al.Effectiveness of heptavalent pneumococcal conjugate vaccine in children younger than 5 years of age for prevention of pneumonia: updated analysis using World Health Organization standardized interpretation of chest radiographs.Pediatr Infect Dis J.2006;25:779–781.
- ,.The measurement of observer agreement for categorical data.Biometrics.1977;33:159–174.
- ,.Clinical, laboratory, and radiological information in the diagnosis of pneumonia in children.Ann Emerg Med.1988;17:43–46.
- ,.Intraobserver and interobserver agreement of the interpretation of pediatric chest radiographs.Emerg Radiol.17:285–290.
- ,,, et al.Practice guidelines for the management of community‐acquired pneumonia in adults. Infectious Diseases Society of America.Clin Infect Dis.2000;31:347–382.
- ,,, et al.Guidelines for the management of adults with community‐acquired pneumonia. Diagnosis, assessment of severity, antimicrobial therapy, and prevention.Am J Respir Crit Care Med.2001;163:1730–1754.
- ,,, et al.Comparison of radiological findings and microbial aetiology of childhood pneumonia.Acta Paediatr.1993;82:360–363.
- Kuhn JP, Slovis TL, Haller JO, eds.Caffey's Pediatric Diagnostic Imaging.10th ed.Philadelphia, PA:Mosby;2004.
- ,,, et al.Clinical predictors of pneumonia among children with wheezing.Pediatrics.2009;124:e29–e36.
- ,,, et al.The clinical impact of the radiology report in wheezing and nonwheezing febrile children: a survey of clinicians.Pediatr Radiol.2009;39:348–353.
The chest radiograph (CXR) is the most commonly used diagnostic imaging modality in children, and is considered to be the gold standard for the diagnosis of pneumonia. As such, physicians in developed countries rely on chest radiography to establish the diagnosis of pneumonia.13 However, there are limited data investigating the reliability of this test for the diagnosis of pneumonia in children.2, 46
Prior investigations have noted poor overall agreement by emergency medicine, infectious diseases, and pulmonary medicine physicians, and even radiologists, in their interpretation of chest radiographs for the diagnosis of pneumonia.2, 5, 710 The World Health Organization (WHO) developed criteria to standardize CXR interpretation for the diagnosis of pneumonia in children for use in epidemiologic studies.11 These standardized definitions of pneumonia have been formally evaluated by the WHO6 and utilized in epidemiologic studies of vaccine efficacy,12 but the overall reliability of these radiographic criteria have not been studied outside of these forums.
We conducted this prospective case‐based study to evaluate the reliability of the radiographic diagnosis of pneumonia among children presenting to a pediatric emergency department with clinical suspicion of pneumonia. We were primarily interested in assessing the overall reliability in CXR interpretation for the diagnosis of pneumonia, and identifying which radiographic features of pneumonia were consistently identified by radiologists.
MATERIALS AND METHODS
Study Subjects
We evaluated the reliability of CXR interpretation with respect to the diagnosis of pneumonia among radiologists. Six board‐certified radiologists at 2 academic children's hospitals (Children's Hospital of Philadelphia, Philadelphia, PA [n = 3] and Children's Hospital, Boston, Boston, MA [n = 3]) interpreted the same 110 chest radiographs in a blinded fashion. The radiologists varied with respect to the number of years practicing pediatric radiology (median 8 years, range 3‐36 years). Clinical information such as age, gender, clinical indication for obtaining the radiograph, history, and physical examination findings were not provided. Aside from the study form which stated the WHO classification scheme for radiographic pneumonia, no other information or training was provided to the radiologists as part of this study.
Radiographs were selected among a population of children presenting to the emergency department at Children's Hospital, Boston, who had a radiograph obtained for concern of pneumonia. From this cohort, we selected children who had radiographs which encompassed the spectrum of respiratory disease processes encountered in a pediatric population. The radiographs selected for review included 50 radiographs with a final reading in the medical record without suspicion for pneumonia, and 50 radiographs in which the diagnosis of pneumonia could not be excluded. In the latter group, 25 radiographs had a final reading suggestive of an alveolar infiltrate, and 25 radiographs had a final reading suggestive of an interstitial infiltrate. Ten duplicate radiographs were included to permit assessment of intra‐rater reliability.
Radiograph Interpretation
Radiologists at both sites interpreted the identical 110 radiographs (both anteroposterior [AP] and lateral views for each subject). Digital Imaging and Communications in Medicine (DICOM) images were downloaded from a registry at Children's Hospital, Boston, and were copied to DVDs which were provided to each radiologist. Standardized radiographic imaging software (eFilm Lite [Mississauga, Canada]) was used by each radiologist to view and interpret the radiographs.
Each radiologist completed a study questionnaire for each radiograph interpreted (see Supporting Appendix A in the online version of this article). The questionnaire utilized radiographic descriptors of primary end‐point pneumonia described by the WHO which were procured to standardize the radiographic diagnosis of pneumonia.11, 12 The main outcome of interest was the presence or absence of an infiltrate. Among radiographs in which an infiltrate was identified, radiologists selected whether there was an alveolar infiltrate, interstitial infiltrate, or both. An alveolar infiltrate was defined as a dense or fluffy opacity that occupies a portion or whole of a lobe, or of the entire lung, that may or may not contain air bronchograms.11, 12 An interstitial infiltrate was defined by a lacy pattern involving both lungs, featuring peribronchial thickening and multiple areas of atelectasis.11, 12 It also included minor patchy infiltrates that were not of sufficient magnitude to constitute consolidation, and small areas of atelectasis that in children may be difficult to distinguish from consolidation. Among interstitial infiltrates, radiologists were asked to distinguish infiltrate from atelectasis. A radiograph classified as having either an alveolar infiltrate or interstitial infiltrate (not atelectasis) was considered to have any infiltrate. Additional findings including air bronchograms, hilar adenopathy, pleural effusion, and location of abnormalities were also recorded.
Statistical Analysis
Inter‐rater reliability was assessed using the kappa statistic to determine the overall agreement between the 6 radiologists for each binary outcome (ie, presence or absence of alveolar infiltrate). To calculate 95% confidence intervals (CI) for kappa statistics with more than 2 raters, we employed a bootstrapping method with 1000 replications of samples equal in size to the study sample, using the kapci program as implemented by STATA software (version 10.1, STATA Corp, College Station, TX). Also, intra‐rater reliability was evaluated by examining the agreement within each radiologist upon review of 10 duplicate radiographs that had been randomly inserted into the case‐mix. We used the benchmarks proposed by Landis and Koch to classify the strength of agreement measured by the kappa statistic, as follows: poor (<0.0); slight (0‐0.20); fair (0.21‐0.40); moderate (0.41‐0.60); substantial (0.61‐0.80); almost perfect (0.81‐1.0).13
The study was approved by the institutional review boards at Children's Hospital, Boston and Children's Hospital of Philadelphia.
RESULTS
Patient Sample
The sample of 110 radiographs was obtained from 100 children presenting to the emergency department at Children's Hospital, Boston, with concern of pneumonia. These patients ranged in age from 1 week to 19 years (median, 3.5 years; interquartile range [IQR], 1.6‐6.0 years). Fifty (50%) of these patients were male. As stated above, the sample comprised 50 radiographs with a final reading in the medical record without suspicion for pneumonia, and 50 radiographs in which the diagnosis of pneumonia could not be excluded. The 10 duplicate radiographs encompassed a similar spectrum of findings.
Inter‐Rater Reliability
The kappa coefficients of inter‐rater reliability between the radiologists across the 6 clinical measures of interest are displayed in Table 1. As shown, the most reliable measure was that of alveolar infiltrate (Figure 1), which attained a substantial degree of agreement between the radiologists. Two other measures, any infiltrate and pleural effusion, attained moderate reliability, while bronchograms and hilar adenopathy were each classified as having fair reliability. However, interstitial infiltrate (Figure 2) was found to have the lowest kappa estimate, with a slight degree of reliability. When examining inter‐rater reliability among the radiologists separately from each institution, the pattern of results was similar.
| All Radiologists (n = 6) | Kappa | 95% Confidence Interval |
|---|---|---|
| ||
| Any infiltrate | 0.47 | 0.39, 0.56 |
| Alveolar infiltrate | 0.69 | 0.60, 0.78 |
| Interstitial infiltrate | 0.14 | 0.05, 0.23 |
| Air bronchograms | 0.32 | 0.24, 0.42 |
| Hilar adenopathy | 0.21 | 0.08, 0.39 |
| Pleural effusion | 0.45 | 0.29, 0.61 |
At least 4 of the 6 radiologists agreed on the presence or absence of an alveolar infiltrate for 95 of the 100 unique CXRs; all 6 radiologists agreed regarding the presence or absence of an alveolar infiltrate in 72 of the 100 unique CXRs. At least 4 of the 6 radiologists agreed on the presence or absence of any infiltrate and interstitial infiltrate 96% and 90% of the time, respectively. All 6 of the radiologists agreed on the presence or absence of any infiltrate and interstitial infiltrate 35% and 27% of the time, respectively.
Intra‐Rater Reliability
Estimates of intra‐rater reliability on the primary clinical outcomes (alveolar infiltrate, interstitial infiltrate, and any infiltrate) are found in Table 2. Across the 6 raters, the kappa estimates for alveolar infiltrate were all classified as substantial or almost perfect. The kappa estimates for interstitial infiltrate varied widely, ranging from fair to almost perfect, while for any infiltrate, reliability ranged from moderate to almost perfect.
| Kappa | 95% Confidence Interval | |
|---|---|---|
| ||
| Any infiltrate | ||
| Rater 1 | 1.00 | 1.00, 1.00 |
| Rater 2 | 0.60 | 0.10, 1.00 |
| Rater 3 | 0.80 | 0.44, 1.00 |
| Rater 4 | 1.00 | 1.00, 1.00 |
| Rater 5 | n/a* | |
| Rater 6 | 1.00 | 1.00, 1.00 |
| Alveolar infiltrate | ||
| Rater 1 | 1.00 | 1.00, 1.00 |
| Rater 2 | 1.00 | 1.00, 1.00 |
| Rater 3 | 1.00 | 1.00, 1.00 |
| Rater 4 | 1.00 | 1.00, 1.00 |
| Rater 5 | 0.78 | 0.39, 1.00 |
| Rater 6 | 0.74 | 0.27, 1.00 |
| Interstitial infiltrate | ||
| Rater 1 | 1.00 | 1.00, 1.00 |
| Rater 2 | 0.21 | 0.43, 0.85 |
| Rater 3 | 0.74 | 0.27, 1.00 |
| Rater 4 | n/a | |
| Rater 5 | 0.58 | 0.07, 1.00 |
| Rater 6 | 0.62 | 0.5, 1.00 |
DISCUSSION
The chest radiograph serves as an integral component of the reference standard for the diagnosis of childhood pneumonia. Few prior studies have assessed the reliability of chest radiograph findings in children.3, 5, 12, 14, 15 We found a high degree of agreement among radiologists for radiologic findings consistent with bacterial pneumonia when standardized interpretation criteria were applied. In this study, we identified radiographic features of pneumonia, such as alveolar infiltrate and pleural effusion, that were consistently identified by different radiologists reviewing the same radiograph and by the same radiologist reviewing the same radiograph. These data support the notion that radiographic features most suggestive of bacterial pneumonia are consistently identified by radiologists.16, 17 There was less consistency in the identification of other radiographic findings, such as interstitial infiltrates, air bronchograms, and hilar lymphadenopathy.
Prior studies have found high levels of disagreement among radiologists in the interpretation of chest radiographs.2, 3, 15, 18 Many of these prior studies emphasized variation in detection of radiographic findings that would not typically alter clinical management. We observed high intra‐rater, and inter‐rater reliability among radiologists for the findings of alveolar infiltrate and pleural effusion. These are the radiographic findings most consistent with a bacterial etiologic agent for pneumonia.19 Other studies have also found that the presence of an alveolar infiltrate is a reliable radiographic finding in children18 and adults.7, 9, 10 These findings support the use of the WHO definition of primary endpoint pneumonia for use in epidemiologic studies.4, 6, 11
This study also confirms a previous report by Cherian et al. that findings of many children with asthma, reactive airways disease, bronchiolitis, and viral infections interstitial infiltrates are less reliable.6 This is not surprising considering the fact that these patients often have radiographic findings due to small airway disease and atelectasis.19, 20 The differentiation between atelectasis and interstitial infiltrate is difficult, particularly in young children. A prior study conducted among neonates observed wide variability in the interpretation of chest radiographs, and that the differentiation of pneumonia from atelectasis was difficult for this patient population.5 The decisions around antimicrobial treatment of children with radiographic findings of interstitial infiltrates should be made in the context of the clinical history and physical examination findings, and clinicians should realize that these radiographic features demonstrate poor reliability for the diagnosis of pneumonia.
Overall reliability for the presence of any infiltrate, and its converse, no infiltrate was considered moderate. This is driven by the low reliability and variability around the radiographic diagnosis of interstitial infiltrates. Our findings are similar to those observed in adults with lower respiratory tract infections.9 The low reliability in identification of interstitial infiltrates may explain why prior studies have demonstrated that the CXR results rarely change management in children who have radiographs performed for suspicion of pneumonia.1, 21 Our study highlights the importance of quantifying CXR findings to include specific comments regarding the presence or absence of alveolar infiltrates, rather than the presence or absence of any infiltrate.
The WHO has procured definitions the radiographic diagnosis of pneumonia, and this definition has been utilized to help standardize the interpretation of chest radiographs for the conduct of epidemiological studies.6, 11 Specifically, the definitions utilized not only define the presence or absence of pneumonia, but also attempt to differentiate a primarily bacterial infection (consolidation or pleural effusion), from a viral or atypical presentation (interstitial pattern). Even under the best of circumstances, the differentiation of viral versus bacterial pneumonia is not always possible, and again, is often made by the treating physician by incorporating the clinical setting within which the radiograph was obtained.
This study had several limitations. Firstly, the included radiographs did not reflect the frequency with which certain radiographic findings would be identified in children evaluated for pneumonia in a pediatric emergency department setting. Radiographs were purposefully selected to encompass a broad spectrum of radiologic findings, including less common findings such as hilar lymphadenopathy and pleural effusions. Thus, the prevalence of pneumonia and other abnormal findings in this study was artificially higher than typically observed among a cohort of children for whom pneumonia is considered, a factor that may limit the generalizability of our results. Secondly, the clinical history was not provided to the radiologists to avoid bias by indication. For this study, we notified the radiologists that all radiographs were performed for clinical suspicion of pneumonia without providing details about the subjects' signs and symptoms. The absence of clinical history, however, does not mirror the real world scenario in which the interpretation of the chest radiograph is frequently made in the context of the clinical history. The relevance of this latter issue is unclear, as Tudor et al. found a nonstatistically significant improvement in the overall accuracy in chest radiograph interpretation when radiologists were provided clinical details.10 The radiologists recruited for this study all practice in an academic children's hospital setting, and thus, the generalizability of our findings may be limited to this type of practice setting. Finally, reproducibility does not imply accuracy, and reliability in identifying specific findings does not necessarily lead to improved or different management. Thus, while the reliability of radiographic findings of alveolar infiltrate and pleural effusion is reassuringly high, the validity of these radiographic features for bacterial pneumonia is not known. Ascertainment of validity can only be assessed through the use of invasive testing such as lung biopsy, as the yield from bacterial testing such as blood cultures is low, and the results of other studies such as viral testing of nasopharyngeal washings do not prove an etiologic cause of pneumonia.
CONCLUSIONS
Radiographic findings of alveolar infiltrates and pleural effusions are highly reliable among radiologists. Radiographic interpretation of interstitial infiltrates appears to be less reliable.
- ,,, et al.Usefulness of chest radiographs in children with acute lower respiratory tract disease.J Pediatr.1987;111:187–193.
- ,,, et al.Disagreement in the interpretation of chest radiographs among specialists and clinical outcomes of patients hospitalized with suspected pneumonia.Eur J Intern Med.2006;17:43–47.
- ,,.Problems in the clinical and roentgenographic diagnosis of pneumonia in young children.Clin Pediatr (Phila).1984;23:398–399.
- WHO guidelines on detecting pneumonia in children.Lancet.1991;338:1453–1454.
- ,,, et al.Inter‐ and intra‐observer variability in the assessment of atelectasis and consolidation in neonatal chest radiographs.Pediatr Radiol.1999;29:459–462.
- ,,, et al.Standardized interpretation of paediatric chest radiographs for the diagnosis of pneumonia in epidemiological studies.Bull World Health Organ.2005;83:353–359.
- ,,, et al.Interobserver reliability of the chest radiograph in community‐acquired pneumonia. PORT Investigators.Chest.1996;110:343–350.
- ,,, et al.Chest radiographs in the emergency department: is the radiologist really necessary?Postgrad Med J.2003;79:214–217.
- ,,, et al.Inter‐observer variation in the interpretation of chest radiographs for pneumonia in community‐acquired lower respiratory tract infections.Clin Radiol.2004;59:743–752.
- ,,.An assessment of inter‐observer agreement and accuracy when reporting plain radiographs.Clin Radiol.1997;52:235–238.
- Standardization of interpretation of chest radiographs for the diagnosis of pneumonia in children. In:World Health Organization: Pneumonia Vaccine Trial Investigators' Group.Geneva:Department of Vaccine and Biologics;2001.
- ,,, et al.Effectiveness of heptavalent pneumococcal conjugate vaccine in children younger than 5 years of age for prevention of pneumonia: updated analysis using World Health Organization standardized interpretation of chest radiographs.Pediatr Infect Dis J.2006;25:779–781.
- ,.The measurement of observer agreement for categorical data.Biometrics.1977;33:159–174.
- ,.Clinical, laboratory, and radiological information in the diagnosis of pneumonia in children.Ann Emerg Med.1988;17:43–46.
- ,.Intraobserver and interobserver agreement of the interpretation of pediatric chest radiographs.Emerg Radiol.17:285–290.
- ,,, et al.Practice guidelines for the management of community‐acquired pneumonia in adults. Infectious Diseases Society of America.Clin Infect Dis.2000;31:347–382.
- ,,, et al.Guidelines for the management of adults with community‐acquired pneumonia. Diagnosis, assessment of severity, antimicrobial therapy, and prevention.Am J Respir Crit Care Med.2001;163:1730–1754.
- ,,, et al.Comparison of radiological findings and microbial aetiology of childhood pneumonia.Acta Paediatr.1993;82:360–363.
- Kuhn JP, Slovis TL, Haller JO, eds.Caffey's Pediatric Diagnostic Imaging.10th ed.Philadelphia, PA:Mosby;2004.
- ,,, et al.Clinical predictors of pneumonia among children with wheezing.Pediatrics.2009;124:e29–e36.
- ,,, et al.The clinical impact of the radiology report in wheezing and nonwheezing febrile children: a survey of clinicians.Pediatr Radiol.2009;39:348–353.
Copyright © 2011 Society of Hospital Medicine

FDA approves deferiprone to treat iron overload
thalassemia
The FDA has approved deferiprone (Ferriprox) to treat iron overload in thalassemia patients who had an inadequate response to prior chelation therapy.
Deferiprone is the first treatment for transfusional iron overload to be approved since 2005, said Richard Pazdur, MD, director of the Office of Hematology and Oncology Products in the FDA’s Center for Drug Evaluation and Research.
The drug’s approval is based on a review of data from 12 clinical studies in 236 patients. Patients participating in the studies did not respond to prior iron chelation therapy.
Deferiprone was considered a success if patients experienced at least a 20% decrease in serum ferritin. And half of the patients included in the review experienced at least a 20% decrease in ferritin levels.
The most common side effects of the drug were nausea, vomiting, abdominal and joint pain, chromaturia, neutropenia, and an increase in the level of a liver enzyme that may be indicative of tissue or liver damage at unsafe amounts. The most serious side effect, seen in about 2% of patients, was the development of agranulocytosis.
Deferiprone has been approved under the FDA’s accelerated approval program, which was designed to provide patients with earlier access to promising new drugs, followed by further studies to confirm the drug’s clinical benefit.
ApoPharma, the company that manufactures deferiprone, has agreed to several post-marketing requirements and commitments. One commitment includes further study of the use of deferiprone in patients with sickle cell disease who have transfusional iron overload. ![]()
FDA Approves Deferiprone for Transfusional Iron Overload
Deferiprone is approved as a second-line treatment for transfusional iron overload when the condition has not been resolved by chelation therapy in patients with thalassemia, the Food and Drug Administration announced Oct. 14.
The new agent will be marketed as Ferriprox by ApoPharma. The FDA said the Toronto-based company has agreed to several postmarketing requirements and commitments, including further study in patients who have transfusional iron overload after treatment for sickle cell disease.
The FDA’s Oncologic Drugs Advisory Committee recently voted 10-2 that treatment with deferiprone had a favorable benefit-risk profile for treatment of patients with transfusional iron overload when current chelation therapy is inadequate.
As the decision date approached, however, the consumer advocacy group Public Citizen announced that it had sent the FDA a letter opposing approval. Public Citizen contended that APO Pharma had failed to demonstrate the drug is safe and effective in its intended population. The group noted that the FDA had refused to approve deferiprone in 2009 without an additional prospective, randomized, controlled study, but that no such study had been conducted.
"Ferriprox represents the first new FDA-approved treatment for this disorder since 2005."
The FDA announcement said its decision on safety and effectiveness was based on 12 clinical studies in which participating patients had not responded to prior iron chelation therapy.
"Ferriprox was considered a successful treatment for patients who experienced at least a 20% decrease in serum ferritin, a protein that stores iron in the body for later use. Half of the patients in the study experienced at least a 20% decrease in ferritin levels," the agency said.
Thalassemia is a genetic blood disorder that causes anemia. It is treated with frequent blood transfusions, but these can lead to excess iron in the body, a serious, potentially fatal condition. Chelation therapy, a process in which chemical agents remove heavy metals from the body, is the standard of care for transfusional iron overload.
"Ferriprox represents the first new FDA-approved treatment for this disorder since 2005," Dr. Richard Pazdur, director of the Office of Hematology and Oncology Products in the FDA’s Center for Drug Evaluation and Research, said in the FDA announcement.
Deferoxamine (Desferal), an iron chelator administered via a subcutaneous infusion pump (usually 6 nights a week), was approved in 1968, and deferasirox (Exjade), an oral chelator, in 2005. The new agent was approved in Europe in 1999, but had not been able to secure a U.S. go-ahead until the current "accelerated approval."
Ferriprox’s most common side effects have included nausea, vomiting, abdominal and joint pain, chromaturia, neutropenia, and "an increase in the level of a liver enzyme that may be indicative of tissue or liver damage at unsafe amounts," according to the FDA.
The agency said the most serious side effect was the development of agranulocytosis in about 2% of patients treated with Ferriprox.
Reconceptualizing Family
Bob is in the kitchen, settling down his family to preparing a celebration dinner with produce from the communal garden. He is a tall, wiry man with a gray beard and kind gentle eyes. His current family includes his wife, who is a therapist in a nearby town; a tall, blonde Scandinavian man who is spending time "finding himself"; a young, eager couple who tend the garden and teach the intricacies of organic farming; and a reclusive artist who works with metals and found objects.
Bob bought the dilapidated commune buildings several years ago, after retiring from his fast-paced, stressful life as an internist in California. He has meticulously restored the adobe buildings using the expertise of traditional builders. There are different types of adobe throughout the compound, sparkling mica walls in the bedrooms, and deep, rich brown in the large circular communal living room. Bob conceptualizes this historic setting as a retreat for meditation and a place to teach organic farming to the next generation. As I observed during my visit a few months ago, Bob is the elder and wise man of this communal family who gently quiets the demons in the spider-phobic Scandinavian.
This is a "family" in the best sense: a group of people who share a spiritual belief in their connection to the land, the goodness of the human spirit, and the importance of connection between people. Like the hippies before them who established New Buffalo in Arroyo Hondo, N.M., the residents reject many Western values, at least for a few years, and try out this alternative way of living. The community’s website says it is no longer a commune but that members are "connected by a common sense of ideals and a strong sense of place."
Communes have always existed in the United States. Native Americans live communally but are not recognized as communes. The largest recognized U.S. communal living group is the Hutterite community. About 42,000 people live in rural Hutterite communities across the United States. They are derived from the Anabaptists, a Christian sect dating back to 16th century Austria, which also spawned Amish and Mennonite communities.
Whatever type of family our patients live in, be it a religious sect, a down-to-earth commune, or a traditional family, to run well, that family needs to be organized, to communicate well and to have good boundaries (Fam. Process 2003;42:1-18).
Why is this important to psychiatry? Good family functioning is associated with good outcomes for patients with all kinds of illnesses from medical to psychiatric (Families, Health, and Behavior: A Section of the Commissioned Report by the Committee on Health and Behavior, Institute of Medicine [Families, Systems & Health 2002;20:7-46]). In addition, "a growing body of research finds that healthy family processes ... matter more than family form for effective functioning...," writes Froma Walsh, Ph.D., (Normal Family Process [N.Y.: Guilford Press, 2003]). To cope well with illness, families need to be able to problem solve, communicate, and stay connected. However, good family functioning looks different in different cultures, from the highly organized rigid religious sects to the looser counterculture New Buffalo community. So how do we describe families and their functioning?
One easy approach is to look at the Global Assessment of Relational Functioning, or the GARF Scale, found in Appendix B of the DSM IV-TR (Washington: American Psychiatric Association, 2000). It has three subscales: problem solving, organization, and emotional climate. The choices for rating families range from 1-20 "Relational unit has become too dysfunctional to retain continuity of contact and attachment," to the 81-100 range in which the "relational unit is functioning satisfactorily from self-report of participants and from the perspective of observers." This scale is easy to learn and use. Also, the scale is independent of culture and can be used for any group of people who call themselves a family. So yes, after observing the New Buffalo community for a few days, I would rank it a solid 88.
Ambulatory Encounters for Hematology/Oncology Unchanged Since 2007
Hematologist/oncologists in group practice had a median of 2,719 ambulatory encounters in 2010, up just 0.3% since 2007, according to a survey by the Medical Group Management Association.
Hematologist/oncologists in hospital-owned practices averaged 2,362 ambulatory encounters in 2010, compared with 2,864 for those who were not in hospital-owned practices, the MGMA reported. Male hematologist/oncologists had a median of 2,864 ambulatory encounters, while the median for females was 2,240. Geographically speaking, those in the western United States had the highest number of ambulatory encounters, 3,027, while those in East, with 2,295 encounters, had the lowest.
The MGMA considered an ambulatory encounter to be "documented, face-to-face contact between a patient and a provider" that did not take place in an inpatient hospital and did not involve a surgical procedure.
The 2010 edition of the annual survey, conducted among MGMA members and nonmembers, includes data from 2,846 group practices representing 59,375 physician and nonphysician providers. The MGMA presents survey highlights in its In Practice blog.
Methylnaltrexone for Acute OIC
The management of postoperative pain is essential to perioperative care, and adequate postoperative analgesia has been associated with several key clinical benefits, including fewer postoperative complications, earlier patient ambulation, reduced costs due to shorter hospital stays, and improved rehabilitation.1, 2 While opioids have long been central to postoperative analgesia, they have been associated with various adverse effects, including sedation, dizziness, nausea, vomiting, constipation, dependence, tolerance, and respiratory depression.2, 3 Constipation, one of the most common adverse effects resulting from opioid therapy, can be debilitating. Indeed, opioid effects on gut motility can occur even after a single dose.3 The consequences of opioid‐induced constipation (OIC) may be severe enough to warrant a dosage reduction of the opioid; however, this may lead to compromised analgesia, which can hinder recovery.4, 5 Thus, effective treatment of OIC is an important clinical consideration in patients undergoing pain management with opioids. Unfortunately, laxatives and other treatment strategies can have unpredictable or suboptimal results for many patients with OIC; therefore, other options are needed for the treatment of OIC.6, 7
Opioid receptor agonists cause constipation by adversely altering many aspects of intestinal function, including fluid dynamics, gastric emptying, propulsive motor activity, and transit time.3 Opioid receptors are widely distributed in the central nervous system and throughout the intestinal system. The mechanism of OIC may have both peripherally and centrally mediated components.8 Nonselective opioid receptor antagonists block the undesired effects on the gut, but because they cross the blood‐brain barrier, they also interfere with analgesia and may lead to symptoms of withdrawal. Methylnaltrexone is a selective, peripherally acting mu‐opioid receptor antagonist,9 formed by the addition of a methyl group to the amine ring of the mu‐opioid receptor antagonist naltrexone. The resulting quarternary amine has greater polarity, lower lipid solubility, and restricted ability to cross the blood‐brain barrier.10 Thus, methylnaltrexone was designed to decrease the peripheral adverse effects of opioids without interfering with centrally mediated analgesia.
Investigations of methylnaltrexone effects in healthy volunteers showed that methylnaltrexone attenuated morphine‐induced delays in gastric emptying and oral‐cecal transit without affecting analgesia.1113 Further studies of methylnaltrexone for the treatment of constipation due to methadone use demonstrated rapid laxation response.1416 Two randomized, double‐blind, placebo‐controlled studies of methylnaltrexone in 288 patients with advanced illness and OIC showed that methylnaltrexone rapidly induced laxation without compromising analgesia.17, 18 Methylnaltrexone is currently approved for the treatment of OIC in patients with advanced illness who are receiving palliative care, when response to laxative therapy has not been sufficient.19
Recently, the use of methylnaltrexone for the treatment of OIC in patients with chronic, nonmalignant pain was assessed in a randomized, double‐blind, placebo‐controlled trial of more than 400 patients. Investigators found that methylnaltrexone induced laxation and was generally well tolerated (Blonsky et al., 28th Annual Scientific Meeting of the American Pain Society, May 7‐9, 2009, San Diego, CA; Duerden et al., 29th Annual Scientific Meeting of the American Pain Society, May 6‐10, 2010, Baltimore, MD), supporting the safety and efficacy of methylnaltrexone in the setting of OIC resulting from chronic opioid treatment. The present study aimed to assess the activity of methylnaltrexone in patients receiving mu‐agonist opioid analgesics during rehabilitation, following an orthopedic surgical procedure, who were experiencing acute OIC.
METHODS
Patients
Patients who had undergone orthopedic procedures within 4 to 10 days were screened for eligibility. Adults aged 18 years or older were considered eligible if they were acutely constipated, were receiving mu‐agonist opioid analgesics, and were expected to require daily opioid analgesics for at least 7 days following randomization. Acute constipation was defined as having no bowel movement for at least 48 hours prior to randomization, difficulty in having a spontaneous bowel movement (straining or sensation of incomplete evacuation or hard, lumpy stools), or the inability to have a spontaneous bowel movement. Exclusion criteria included fecal impaction, mechanical bowel obstruction, constipation not attributed to postprocedure opioid use, calculated creatinine clearance less than 50 mL/min, and corrected QT interval greater than 500 msec on a 12‐lead screening electrocardiogram (ECG). Patients with a known hypersensitivity to methylnaltrexone, naltrexone, or naloxone, who were pregnant or lactating, who had a history of alcohol or drug abuse within the past 2 years, or who had a spinal cord injury or gastrointestinal ostomy were also excluded. Any laxatives, enemas, and/or promotility agents being used must have been discontinued at least 48 hours prior to first dose of study medication and were not permitted during the study, but stool softener use was permitted if it had been administered at least 24 hours prior to screening and a stable dose was maintained throughout the study.
Study Design
This randomized, double‐blind, placebo‐controlled, parallel‐group, hypothesis‐generating phase 2 study was conducted from October 2007 to January 2009 at 16 US hospitals and rehabilitation facilities in accordance with the International Conference on Harmonisation Good Clinical Practice Guidelines and the Declaration of Helsinki, and was approved by the Institutional Review Board and/or Independent Ethics Committee at each of the participating investigational centers. All patients provided written informed consent prior to study participation.
Eligible patients were randomized by interactive voice response system in a 1:1 ratio to receive once‐daily subcutaneous (SC) injections of either 12 mg methylnaltrexone or placebo (Figure 1). The chosen 12‐mg unit dosing corresponds to approximately 0.15 mg/kg (assuming an 80‐kg patient) and was found to be both efficacious and well tolerated in the treatment of OIC in prior studies, including studies in advanced‐illness patients17, 18 and in patients with chronic, nonmalignant pain (Blonsky et al., 28th Annual Scientific Meeting of the American Pain Society, May 7‐9, 2009, San Diego, CA; Duerden et al., 29th Annual Scientific Meeting of the American Pain Society, May 6‐10, 2010, Baltimore, MD.20 The first dose of study medication was administered on the day of randomization or on the next calendar day. Once enrolled, the patient received once‐daily doses of methylnaltrexone for up to 4 or 7 days. Dosing continued until the patient received the maximum number of doses allowed, no longer needed opioid medication, or was discharged from the medical facility. Each patient completed a follow‐up safety visit at 14 3 days following the last dose.
Evaluations
All efficacy variables were considered exploratory and included the occurrence of laxation within 2 and 4 hours of the first dose of study drug, time to laxation, and a questionnaire assessing patient global satisfaction. Patients recorded the date, time, and assessment of each bowel movement in diaries.
Safety variables included adverse events (AEs), serious AEs (SAEs), clinical laboratory parameters, physical examinations, vital signs, ECGs, concomitant medications, Objective and Subjective Opioid Withdrawal Scales (OOWS and SOWS),21 and Numeric Rating Scales for Pain ([NRSP] 0 = no pain, 10 = worst pain possible).
Statistical Analysis
Enrolled patients were defined as all patients who consented to participate in the study. Both the modified intent‐to‐treat (mITT) population and the safety population were defined as all patients who were randomized and received at least 1 injection of study drug. All study results are based on the mITT population.
Categorical variables were summarized using frequency and percentage, while descriptive statistics for continuous variables included sample size, mean, median, standard deviation, and minimum and maximum values. All inferential statistical tests were 2‐tailed and used a tolerance for nominal type I error (alpha, ) of 0.05. There was no correction for multiplicity and no imputations were performed to account for missing data.
Fisher's exact test was used for comparisons between the proportion of patients with laxation within 2 hours and 4 hours of the first dose in the methylnaltrexone group versus the placebo group. The time to first laxation analysis was performed using the log‐rank test and Kaplan‐Meier method.
RESULTS
Patient Populations
The flow of patients through the study is summarized in Figure 2. A total of 51 patients were enrolled. Of these, 33 received at least 1 dose of study treatment following double‐blind randomization and comprised both the mITT and safety populations. Seventeen of these patients were enrolled under the original protocol and could receive study drug for up to 7 days, while 16 patients enrolled under a subsequent protocol revision could receive study drug for up to 4 days. This change from a 7‐day to a 4‐day treatment protocol allowed for the capture of more study patients in view of the time pressures of short lengths of stay in postoperative settings. In total, 31 patients received at least 2 doses, and 26 patients received at least 4 doses of study drug. A total of 27 patients completed the study. Baseline demographics and prestudy surgical procedures were similar in both treatment groups (Table 1).
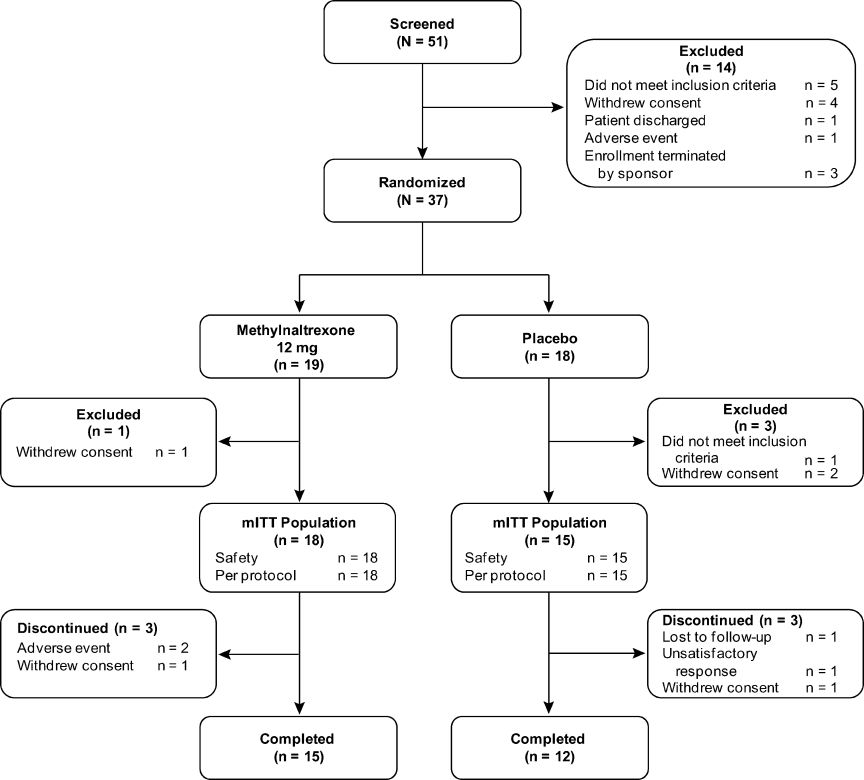
| Characteristic | Methylnaltrexone (n = 18) | Placebo (n = 15) |
|---|---|---|
| ||
| Mean age, yr (SD) | 64.2 (9.0) | 65.2 (11.6) |
| Mean weight, kg (SD) | 92.5 (22.5) | 91.0 (20.2) |
| Mean BMI, kg/m2 (SD) | 32.3 (7.2) | 34.2 (6.41) |
| Sex, n (%) | ||
| Female | 11 (61.1) | 11 (73.3) |
| Male | 7 (38.9) | 4 (26.7) |
| Race, n (%) | ||
| White | 14 (77.8) | 10 (66.7) |
| Black | 4 (22.2) | 5 (33.3) |
| Type of surgery, n (%) | ||
| Total knee replacement | 8 (44.4) | 7 (46.7) |
| Total hip replacement | 6 (33.3) | 6 (40.0) |
| Spinal fusion | 2 (11.1) | 0 |
| Fracture reduction | 2 (11.1) | 2 (13.3) |
| Median opioid use,* mg (range) | 28.00 (6.75‐168.01) | 25.00 (9.00‐75.00) |
| Median time from surgery to study drug administration, days (range) | 4 (3‐6) | 4 (3‐6) |
Efficacy
A significantly greater percentage of patients had a bowel movement within 2 hours (P = 0.021) and 4 hours (P = 0.046) of the first dose of methylnaltrexone compared with patients who received placebo (Figure 3). Within 2 hours, 6 patients (33.3%; 95% confidence interval [CI], 13.34‐59.01) who received methylnaltrexone achieved laxation, while laxation did not occur in any patient who received placebo. By 4 hours posttreatment, 7 patients (38.9%; 95% CI, 17.30‐64.25) in the methylnaltrexone group achieved laxation compared with only 1 patient (6.7%; 95% CI, 0.17‐31.95) on placebo. Three patients in each treatment group received rescue laxatives.
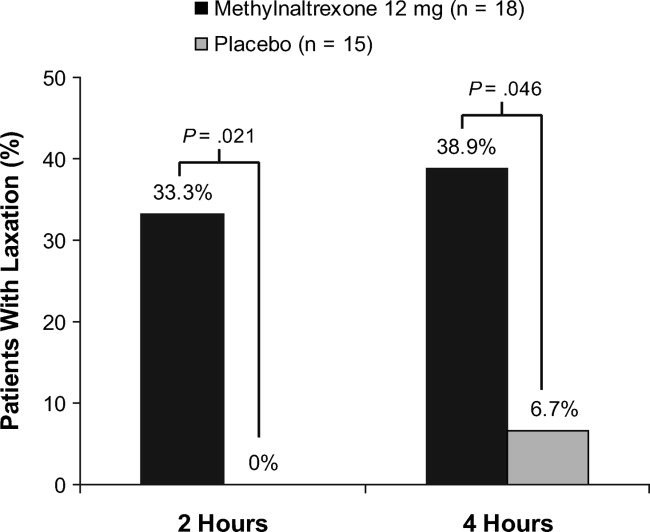
The time to first laxation (Figure 4) was significantly shorter in patients who received methylnaltrexone compared with those in the placebo group. Patients on methylnaltrexone achieved laxation in a median time of 15.8 hours, compared with a median time of 50.9 hours for patients in the placebo group (P = 0.02, log‐rank test). The median time to laxation was less than 1 hour in the 7 methylnaltrexone‐treated patients who experienced laxation within 4 hours following the first dose. Of the remaining 11 methylnaltrexone‐treated patients, one experienced no laxation after 6 doses, and the median time to laxation for the others was 29.9 hours (not shown in figure).
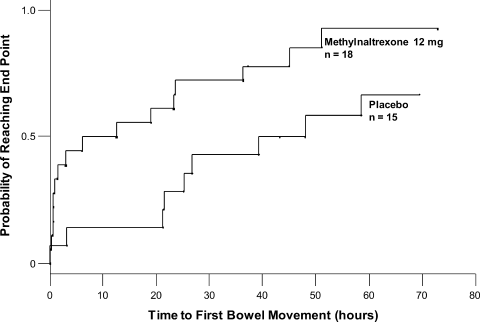
Analysis of the Global Satisfaction With Treatment Scale revealed that more patients expressed overall treatment satisfaction (defined as very satisfied, satisfied, or minimally satisfied) with methylnaltrexone assessed 4 hours ( 30 minutes) after the first dose, compared with patients on placebo (83.3% vs 60.0%, respectively). At the study endpoint, overall treatment satisfaction with methylnaltrexone remained high (83.3%), whereas satisfaction with placebo was 53.3%. Additionally, no patients in the methylnaltrexone group expressed any dissatisfaction with treatment (defined as minimally dissatisfied, dissatisfied, or very dissatisfied) at endpoint, compared with 26.7% of patients in the placebo group who expressed some degree of dissatisfaction.
Safety
Overall AE rates were similar between treatment groups (Table 2), with at least 1 treatment‐emergent AE reported in 6 patients (33.3%) in the methylnaltrexone group and 4 patients (26.7%) in the placebo group. The most common AEs reported during the study were classified as gastrointestinal in nature; 3 (nausea, abdominal pain, and diarrhea) were considered by the investigator to be possibly related to study medication. Two patients receiving methylnaltrexone discontinued the study because of AEs (one with moderate constipation, one with mild diarrhea) compared with none of the placebo group patients. No treatment‐emergent SAEs or deaths were reported during this study. Analysis of clinical laboratory parameters, vital signs, and ECGs revealed no safety signals and showed no pattern of concern related to methylnaltrexone exposure.
| Adverse Event* | Methylnaltrexone 12 mg (n = 18) n (%) | Placebo (n = 15) n (%) |
|---|---|---|
| ||
| Any | 6 (33.3) | 4 (26.7) |
| Anemia | 1 (5.6) | 0 |
| Gastrointestinal disorders | 3 (16.7) | 1 (6.7) |
| Abdominal discomfort | 0 | 1 (6.7) |
| Abdominal distension | 1 (5.6) | 0 |
| Abdominal pain | 1 (5.6) | 0 |
| Abdominal tenderness | 1 (5.6) | 0 |
| Constipation | 1 (5.6) | 0 |
| Diarrhea | 1 (5.6) | 0 |
| Nausea | 1 (5.6) | 0 |
| Headache | 1 (5.6) | 0 |
| Hypotension | 1 (5.6) | 0 |
| Joint swelling | 0 | 1 (6.7) |
| Peripheral edema | 0 | 2 (13.3) |
| Procedural pain | 0 | 1 (6.7) |
| Skin ulcer | 0 | 1 (6.7) |
| Somnolence | 0 | 1 (6.7) |
| Urinary tract infection | 1 (5.6) | 0 |
| Wound infection | 1 (5.6) | 0 |
Pain and Opioid Withdrawal
Results from the SOWS and OOWS measures indicated that signs and symptoms of withdrawal did not increase over time in patients treated with methylnaltrexone, and no discernable differences were found between study groups. Pain was assessed using a numeric rating scale ranging from 0 to 10, with higher scores indicating greater severity. Baseline pain scores were not significantly different between treatment groups, with a mean of 5.7 2.7 for placebo, and 5.4 3.0 for the methylnaltrexone group. At 1 day postdose, mean pain scores did not increase from baseline in the placebo (0.9 2.33) or methylnaltrexone group (0.5 2.5), and no significant between‐group differences were found. Similar results were observed at the end of the study. Thus, pain did not appear to increase in patients treated with methylnaltrexone, and changes in pain scores were indistinguishable between the 2 treatment groups.
DISCUSSION
This pilot study suggests that methylnaltrexone actively induces laxation and is generally well tolerated in patients receiving mu‐opioid analgesia, following orthopedic surgery, who develop OIC acutely. It was the first study, to our knowledge, to investigate the efficacy of methylnaltrexone for the treatment of OIC in an acute postoperative setting. The protocol amendment changing the duration of treatment from 7 days to 4 days did not materially affect the results of the study. The response to methylnaltrexone was rapid, with 33.3% experiencing laxation within 2 hours. The median time to laxation was nearly 1.5 days shorter in patients treated with methylnaltrexone compared with those receiving placebo. Correspondingly, overall patient satisfaction was high in the methylnaltrexone group. Efficacy was attained without diminishing opioid analgesia, and without inducing signs or symptoms of opioid withdrawal. The incidence of AEs was similar between groups, and no treatment‐emergent SAEs were reported in this study.
Previous clinical trials investigated the safety and efficacy of methylnaltrexone for the treatment of OIC in patients with advanced illness and with chronic, nonmalignant pain. The present study extends those findings to a population of patients experiencing acute OIC following orthopedic surgery. Previous studies showed that approximately 48% to 62% of advanced‐illness patients experienced laxation within 4 hours of receiving SC methylnaltrexone,17, 18 compared with 38.9% of acute OIC patients in this study. In a clinical trial of patients with chronic, nonmalignant pain, 34.2% of patients experienced laxation within 4 hours of SC methylnaltrexone injection (Blonsky et al., 28th Annual Scientific Meeting of the American Pain Society, May 7‐9, 2009, San Diego, CA). The differences in laxation response between these trials may be attributable to differences in the patient populations or to methodologic differences between the studies.
Similar to findings demonstrated in a clinical study evaluating methylnaltrexone for OIC in a different patient population, those with advanced illness,22 this study supports the premise that future laxation response with prolonged use is most likely to occur when a laxation response was achieved after the first or second initial administrations of methylnaltrexone. In contradistinction, if laxation does not occur with these early doses, continued methylnaltrexone dosing is less likely to produce a response later.
This study has some limitations that must be considered. First, as this was a hypothesis‐generating study, all efficacy parameters investigated were exploratory in nature. The results reported herein warrant careful consideration, owing to a small sample size that may limit their generalizability, prior to replication in a more rigorously designed study with prespecified efficacy endpoints. Likewise, the assessment of health outcome parameters is limited. Another limitation is the small sample size utilized in this study, potentially resulting in a type II error.
Subcutaneous administration potentially offers a considerable benefit over oral therapies for OIC in this patient population post‐orthopedic surgery. Nausea and vomiting can occur as a consequence of anesthesia and of postoperative opioid analgesia, and may compromise adequate dosing of oral medications prescribed to treat OIC. Subcutaneous delivery of methylnaltrexone may circumvent this potential drawback while providing potentially rapid, effective treatment for OIC. Once‐daily dosing may also help to minimize caregiver burden and patient discomfort by preventing the need for more frequent or unpleasant treatments for OIC, such as enemas.
This study provides an initial positive signal for a broader, albeit off‐label use for methylnaltrexonethat being for the treatment of acute constipation that occurs as a consequence of postoperative opioid‐mediated analgesia in patients following orthopedic procedures. Adequate treatment of OIC, even in the acute postoperative setting, is likely to lead to better overall pain management and improved patient outcomes. Additionally, effective management of acute OIC is likely to be cost‐effective in terms of reducing the duration of hospital stays, reducing the need for nursing resources and the time spent administering rescue treatments for OIC (eg, enemas), and avoiding returns to an acute setting (eg, the emergency department) for treatment. The results presented herein suggest that methylnaltrexone may be effective and have a good safety profile in the treatment of acute OIC following orthopedic surgery. Validation of these results in larger well‐controlled trials would be welcome.
Acknowledgements
The authors thank the patients and clinical personnel involved in this study; John Charity, NP, for data collection and management, and John H. Simmons, MD, of Peloton Advantage, LLC, for assistance with manuscript preparation, which was funded by Pfizer Inc.
In addition to the authors, the following investigators participated in this trial: David Nathan Feldman, MD, Holy Name Hospital, Teaneck, NJ; Sam Hakki, MD, Bay Pines VA Healthcare System, Bay Pines, FL; Forrest A. Hanke, MD, Trover Health System, Madisonville, KY; William H. Horton, Jr, MD, Palmetto Clinical Research, Greenville, SC; M. Jay Jazayeri, MD, Pacific Hospital of Long Beach, Long Beach, CA; John F. Peppin, DO, The Pain Treatment Center of the Bluegrass, Lexington, KY; Bruce Pomeranz, MD, Kessler Institute for Rehabilitation, Saddle Brook, NJ, and Chester, NJ; Alan C. Schwartz, MD, Helping Hands Medical Associates, Santa Ana, CA; Michael J. Skyhar, MD, CORE Orthopaedic Medical Center, Encinitas, CA; Lex A. Simpson, MD, CORE Orthopaedic Medical Center, Encinitas, CA; James Slover, MD, New York University Hospital for Joint Disease, New York, NY; Dilip Tapadiya, MD, Fountain Valley Regional Hospital, Fountain Valley, CA; Stanley J. Waters, MD, PhD, Americana Orthopedics, Boise, ID.
- ,.Postoperative pain management.Chest Surg Clin N Am.1997;7:773–799.
- ,.Strategies for effective postoperative pain management.Minerva Anestesiol.2006;72:145–150.
- ,,.Are peripheral opioid antagonists the solution to opioid side effects?Anesth Analg.2004;98:116–122.
- ,.Neuroplasticity—an important factor in acute and chronic pain.Swiss Med Wkly.2002;132:273–278.
- ,,,,.The burden of acute postoperative pain and the potential role of the COX‐2‐specific inhibitors.Rheumatology (Oxford).2003;42(suppl 3):iii40–iii52.
- .Incidence, prevalence, and management of opioid bowel dysfunction.Am J Surg.2001;182(suppl 5A):11S–18S.
- ,.Management of common opioid‐induced adverse effects.Am Fam Physician.2006;74:1347–1354.
- ,.Antagonism of gastrointestinal opioid effects.Reg Anesth Pain Med.2000;25:639–642.
- .Methylnaltrexone mechanisms of action and effects on opioid bowel dysfunction and other opioid adverse effects.Ann Pharmacother.2007;41:984–993.
- ,.Methylnaltrexone: investigation of clinical applications.Drug Dev Res.2000;50:133–141.
- ,,,.Opioid‐induced delay in gastric emptying: a peripheral mechanism in humans.Anesthesiology.1997;87:765–770.
- ,,, et al.Effects of enteric‐coated methylnaltrexone in preventing opioid‐induced delay in oral‐cecal transit time.Clin Pharmacol Ther.2000;67:398–404.
- ,,,,,.Methylnaltrexone prevents morphine‐induced delay in oral‐cecal transit time without affecting analgesia: a double‐blind randomized placebo‐controlled trial.Clin Pharmacol Ther.1996;59:469–475.
- ,,,,,.Effects of intravenous methylnaltrexone on opioid‐induced gut motility and transit time changes in subjects receiving chronic methadone therapy: a pilot study.Pain.1999;83:631–635.
- ,,, et al.Methylnaltrexone for reversal of constipation due to chronic methadone use: a randomized controlled trial.JAMA.2000;283:367–372.
- ,.Oral methylnaltrexone for opioid‐induced constipation.JAMA.2000;284:1383–1384.
- ,,, et al.Methylnaltrexone for opioid‐induced constipation in advanced illness.N Engl J Med.2008;328:2332–2343.
- ,,, et al.Methylnaltrexone for treatment of opioid‐induced constipation in advanced illness patients.J Support Oncol.2009;7:39–46.
- Relistor [package insert].Philadelphia, PA, and Tarrytown, NY:Wyeth Pharmaceuticals Inc and Progenics Pharmaceuticals;2009.
- ,,, et al.Subcutaneous methylnaltrexone for treatment of opioid‐induced constipation in patients with chronic, nonmalignant pain: a randomized controlled study.J Pain.2011;12:554–562.
- ,,,,,.Two new rating scales for opiate withdrawal.Am J Drug Alcohol Abuse.1987;13:293–308.
- ,,, et al.Methylnaltrexone treatment of opioid‐induced constipation in patients with advanced illness.J Pain Symptom Manage.2009;38:683–690.
The management of postoperative pain is essential to perioperative care, and adequate postoperative analgesia has been associated with several key clinical benefits, including fewer postoperative complications, earlier patient ambulation, reduced costs due to shorter hospital stays, and improved rehabilitation.1, 2 While opioids have long been central to postoperative analgesia, they have been associated with various adverse effects, including sedation, dizziness, nausea, vomiting, constipation, dependence, tolerance, and respiratory depression.2, 3 Constipation, one of the most common adverse effects resulting from opioid therapy, can be debilitating. Indeed, opioid effects on gut motility can occur even after a single dose.3 The consequences of opioid‐induced constipation (OIC) may be severe enough to warrant a dosage reduction of the opioid; however, this may lead to compromised analgesia, which can hinder recovery.4, 5 Thus, effective treatment of OIC is an important clinical consideration in patients undergoing pain management with opioids. Unfortunately, laxatives and other treatment strategies can have unpredictable or suboptimal results for many patients with OIC; therefore, other options are needed for the treatment of OIC.6, 7
Opioid receptor agonists cause constipation by adversely altering many aspects of intestinal function, including fluid dynamics, gastric emptying, propulsive motor activity, and transit time.3 Opioid receptors are widely distributed in the central nervous system and throughout the intestinal system. The mechanism of OIC may have both peripherally and centrally mediated components.8 Nonselective opioid receptor antagonists block the undesired effects on the gut, but because they cross the blood‐brain barrier, they also interfere with analgesia and may lead to symptoms of withdrawal. Methylnaltrexone is a selective, peripherally acting mu‐opioid receptor antagonist,9 formed by the addition of a methyl group to the amine ring of the mu‐opioid receptor antagonist naltrexone. The resulting quarternary amine has greater polarity, lower lipid solubility, and restricted ability to cross the blood‐brain barrier.10 Thus, methylnaltrexone was designed to decrease the peripheral adverse effects of opioids without interfering with centrally mediated analgesia.
Investigations of methylnaltrexone effects in healthy volunteers showed that methylnaltrexone attenuated morphine‐induced delays in gastric emptying and oral‐cecal transit without affecting analgesia.1113 Further studies of methylnaltrexone for the treatment of constipation due to methadone use demonstrated rapid laxation response.1416 Two randomized, double‐blind, placebo‐controlled studies of methylnaltrexone in 288 patients with advanced illness and OIC showed that methylnaltrexone rapidly induced laxation without compromising analgesia.17, 18 Methylnaltrexone is currently approved for the treatment of OIC in patients with advanced illness who are receiving palliative care, when response to laxative therapy has not been sufficient.19
Recently, the use of methylnaltrexone for the treatment of OIC in patients with chronic, nonmalignant pain was assessed in a randomized, double‐blind, placebo‐controlled trial of more than 400 patients. Investigators found that methylnaltrexone induced laxation and was generally well tolerated (Blonsky et al., 28th Annual Scientific Meeting of the American Pain Society, May 7‐9, 2009, San Diego, CA; Duerden et al., 29th Annual Scientific Meeting of the American Pain Society, May 6‐10, 2010, Baltimore, MD), supporting the safety and efficacy of methylnaltrexone in the setting of OIC resulting from chronic opioid treatment. The present study aimed to assess the activity of methylnaltrexone in patients receiving mu‐agonist opioid analgesics during rehabilitation, following an orthopedic surgical procedure, who were experiencing acute OIC.
METHODS
Patients
Patients who had undergone orthopedic procedures within 4 to 10 days were screened for eligibility. Adults aged 18 years or older were considered eligible if they were acutely constipated, were receiving mu‐agonist opioid analgesics, and were expected to require daily opioid analgesics for at least 7 days following randomization. Acute constipation was defined as having no bowel movement for at least 48 hours prior to randomization, difficulty in having a spontaneous bowel movement (straining or sensation of incomplete evacuation or hard, lumpy stools), or the inability to have a spontaneous bowel movement. Exclusion criteria included fecal impaction, mechanical bowel obstruction, constipation not attributed to postprocedure opioid use, calculated creatinine clearance less than 50 mL/min, and corrected QT interval greater than 500 msec on a 12‐lead screening electrocardiogram (ECG). Patients with a known hypersensitivity to methylnaltrexone, naltrexone, or naloxone, who were pregnant or lactating, who had a history of alcohol or drug abuse within the past 2 years, or who had a spinal cord injury or gastrointestinal ostomy were also excluded. Any laxatives, enemas, and/or promotility agents being used must have been discontinued at least 48 hours prior to first dose of study medication and were not permitted during the study, but stool softener use was permitted if it had been administered at least 24 hours prior to screening and a stable dose was maintained throughout the study.
Study Design
This randomized, double‐blind, placebo‐controlled, parallel‐group, hypothesis‐generating phase 2 study was conducted from October 2007 to January 2009 at 16 US hospitals and rehabilitation facilities in accordance with the International Conference on Harmonisation Good Clinical Practice Guidelines and the Declaration of Helsinki, and was approved by the Institutional Review Board and/or Independent Ethics Committee at each of the participating investigational centers. All patients provided written informed consent prior to study participation.
Eligible patients were randomized by interactive voice response system in a 1:1 ratio to receive once‐daily subcutaneous (SC) injections of either 12 mg methylnaltrexone or placebo (Figure 1). The chosen 12‐mg unit dosing corresponds to approximately 0.15 mg/kg (assuming an 80‐kg patient) and was found to be both efficacious and well tolerated in the treatment of OIC in prior studies, including studies in advanced‐illness patients17, 18 and in patients with chronic, nonmalignant pain (Blonsky et al., 28th Annual Scientific Meeting of the American Pain Society, May 7‐9, 2009, San Diego, CA; Duerden et al., 29th Annual Scientific Meeting of the American Pain Society, May 6‐10, 2010, Baltimore, MD.20 The first dose of study medication was administered on the day of randomization or on the next calendar day. Once enrolled, the patient received once‐daily doses of methylnaltrexone for up to 4 or 7 days. Dosing continued until the patient received the maximum number of doses allowed, no longer needed opioid medication, or was discharged from the medical facility. Each patient completed a follow‐up safety visit at 14 3 days following the last dose.
Evaluations
All efficacy variables were considered exploratory and included the occurrence of laxation within 2 and 4 hours of the first dose of study drug, time to laxation, and a questionnaire assessing patient global satisfaction. Patients recorded the date, time, and assessment of each bowel movement in diaries.
Safety variables included adverse events (AEs), serious AEs (SAEs), clinical laboratory parameters, physical examinations, vital signs, ECGs, concomitant medications, Objective and Subjective Opioid Withdrawal Scales (OOWS and SOWS),21 and Numeric Rating Scales for Pain ([NRSP] 0 = no pain, 10 = worst pain possible).
Statistical Analysis
Enrolled patients were defined as all patients who consented to participate in the study. Both the modified intent‐to‐treat (mITT) population and the safety population were defined as all patients who were randomized and received at least 1 injection of study drug. All study results are based on the mITT population.
Categorical variables were summarized using frequency and percentage, while descriptive statistics for continuous variables included sample size, mean, median, standard deviation, and minimum and maximum values. All inferential statistical tests were 2‐tailed and used a tolerance for nominal type I error (alpha, ) of 0.05. There was no correction for multiplicity and no imputations were performed to account for missing data.
Fisher's exact test was used for comparisons between the proportion of patients with laxation within 2 hours and 4 hours of the first dose in the methylnaltrexone group versus the placebo group. The time to first laxation analysis was performed using the log‐rank test and Kaplan‐Meier method.
RESULTS
Patient Populations
The flow of patients through the study is summarized in Figure 2. A total of 51 patients were enrolled. Of these, 33 received at least 1 dose of study treatment following double‐blind randomization and comprised both the mITT and safety populations. Seventeen of these patients were enrolled under the original protocol and could receive study drug for up to 7 days, while 16 patients enrolled under a subsequent protocol revision could receive study drug for up to 4 days. This change from a 7‐day to a 4‐day treatment protocol allowed for the capture of more study patients in view of the time pressures of short lengths of stay in postoperative settings. In total, 31 patients received at least 2 doses, and 26 patients received at least 4 doses of study drug. A total of 27 patients completed the study. Baseline demographics and prestudy surgical procedures were similar in both treatment groups (Table 1).
| Characteristic | Methylnaltrexone (n = 18) | Placebo (n = 15) |
|---|---|---|
| ||
| Mean age, yr (SD) | 64.2 (9.0) | 65.2 (11.6) |
| Mean weight, kg (SD) | 92.5 (22.5) | 91.0 (20.2) |
| Mean BMI, kg/m2 (SD) | 32.3 (7.2) | 34.2 (6.41) |
| Sex, n (%) | ||
| Female | 11 (61.1) | 11 (73.3) |
| Male | 7 (38.9) | 4 (26.7) |
| Race, n (%) | ||
| White | 14 (77.8) | 10 (66.7) |
| Black | 4 (22.2) | 5 (33.3) |
| Type of surgery, n (%) | ||
| Total knee replacement | 8 (44.4) | 7 (46.7) |
| Total hip replacement | 6 (33.3) | 6 (40.0) |
| Spinal fusion | 2 (11.1) | 0 |
| Fracture reduction | 2 (11.1) | 2 (13.3) |
| Median opioid use,* mg (range) | 28.00 (6.75‐168.01) | 25.00 (9.00‐75.00) |
| Median time from surgery to study drug administration, days (range) | 4 (3‐6) | 4 (3‐6) |
Efficacy
A significantly greater percentage of patients had a bowel movement within 2 hours (P = 0.021) and 4 hours (P = 0.046) of the first dose of methylnaltrexone compared with patients who received placebo (Figure 3). Within 2 hours, 6 patients (33.3%; 95% confidence interval [CI], 13.34‐59.01) who received methylnaltrexone achieved laxation, while laxation did not occur in any patient who received placebo. By 4 hours posttreatment, 7 patients (38.9%; 95% CI, 17.30‐64.25) in the methylnaltrexone group achieved laxation compared with only 1 patient (6.7%; 95% CI, 0.17‐31.95) on placebo. Three patients in each treatment group received rescue laxatives.
The time to first laxation (Figure 4) was significantly shorter in patients who received methylnaltrexone compared with those in the placebo group. Patients on methylnaltrexone achieved laxation in a median time of 15.8 hours, compared with a median time of 50.9 hours for patients in the placebo group (P = 0.02, log‐rank test). The median time to laxation was less than 1 hour in the 7 methylnaltrexone‐treated patients who experienced laxation within 4 hours following the first dose. Of the remaining 11 methylnaltrexone‐treated patients, one experienced no laxation after 6 doses, and the median time to laxation for the others was 29.9 hours (not shown in figure).
Analysis of the Global Satisfaction With Treatment Scale revealed that more patients expressed overall treatment satisfaction (defined as very satisfied, satisfied, or minimally satisfied) with methylnaltrexone assessed 4 hours ( 30 minutes) after the first dose, compared with patients on placebo (83.3% vs 60.0%, respectively). At the study endpoint, overall treatment satisfaction with methylnaltrexone remained high (83.3%), whereas satisfaction with placebo was 53.3%. Additionally, no patients in the methylnaltrexone group expressed any dissatisfaction with treatment (defined as minimally dissatisfied, dissatisfied, or very dissatisfied) at endpoint, compared with 26.7% of patients in the placebo group who expressed some degree of dissatisfaction.
Safety
Overall AE rates were similar between treatment groups (Table 2), with at least 1 treatment‐emergent AE reported in 6 patients (33.3%) in the methylnaltrexone group and 4 patients (26.7%) in the placebo group. The most common AEs reported during the study were classified as gastrointestinal in nature; 3 (nausea, abdominal pain, and diarrhea) were considered by the investigator to be possibly related to study medication. Two patients receiving methylnaltrexone discontinued the study because of AEs (one with moderate constipation, one with mild diarrhea) compared with none of the placebo group patients. No treatment‐emergent SAEs or deaths were reported during this study. Analysis of clinical laboratory parameters, vital signs, and ECGs revealed no safety signals and showed no pattern of concern related to methylnaltrexone exposure.
| Adverse Event* | Methylnaltrexone 12 mg (n = 18) n (%) | Placebo (n = 15) n (%) |
|---|---|---|
| ||
| Any | 6 (33.3) | 4 (26.7) |
| Anemia | 1 (5.6) | 0 |
| Gastrointestinal disorders | 3 (16.7) | 1 (6.7) |
| Abdominal discomfort | 0 | 1 (6.7) |
| Abdominal distension | 1 (5.6) | 0 |
| Abdominal pain | 1 (5.6) | 0 |
| Abdominal tenderness | 1 (5.6) | 0 |
| Constipation | 1 (5.6) | 0 |
| Diarrhea | 1 (5.6) | 0 |
| Nausea | 1 (5.6) | 0 |
| Headache | 1 (5.6) | 0 |
| Hypotension | 1 (5.6) | 0 |
| Joint swelling | 0 | 1 (6.7) |
| Peripheral edema | 0 | 2 (13.3) |
| Procedural pain | 0 | 1 (6.7) |
| Skin ulcer | 0 | 1 (6.7) |
| Somnolence | 0 | 1 (6.7) |
| Urinary tract infection | 1 (5.6) | 0 |
| Wound infection | 1 (5.6) | 0 |
Pain and Opioid Withdrawal
Results from the SOWS and OOWS measures indicated that signs and symptoms of withdrawal did not increase over time in patients treated with methylnaltrexone, and no discernable differences were found between study groups. Pain was assessed using a numeric rating scale ranging from 0 to 10, with higher scores indicating greater severity. Baseline pain scores were not significantly different between treatment groups, with a mean of 5.7 2.7 for placebo, and 5.4 3.0 for the methylnaltrexone group. At 1 day postdose, mean pain scores did not increase from baseline in the placebo (0.9 2.33) or methylnaltrexone group (0.5 2.5), and no significant between‐group differences were found. Similar results were observed at the end of the study. Thus, pain did not appear to increase in patients treated with methylnaltrexone, and changes in pain scores were indistinguishable between the 2 treatment groups.
DISCUSSION
This pilot study suggests that methylnaltrexone actively induces laxation and is generally well tolerated in patients receiving mu‐opioid analgesia, following orthopedic surgery, who develop OIC acutely. It was the first study, to our knowledge, to investigate the efficacy of methylnaltrexone for the treatment of OIC in an acute postoperative setting. The protocol amendment changing the duration of treatment from 7 days to 4 days did not materially affect the results of the study. The response to methylnaltrexone was rapid, with 33.3% experiencing laxation within 2 hours. The median time to laxation was nearly 1.5 days shorter in patients treated with methylnaltrexone compared with those receiving placebo. Correspondingly, overall patient satisfaction was high in the methylnaltrexone group. Efficacy was attained without diminishing opioid analgesia, and without inducing signs or symptoms of opioid withdrawal. The incidence of AEs was similar between groups, and no treatment‐emergent SAEs were reported in this study.
Previous clinical trials investigated the safety and efficacy of methylnaltrexone for the treatment of OIC in patients with advanced illness and with chronic, nonmalignant pain. The present study extends those findings to a population of patients experiencing acute OIC following orthopedic surgery. Previous studies showed that approximately 48% to 62% of advanced‐illness patients experienced laxation within 4 hours of receiving SC methylnaltrexone,17, 18 compared with 38.9% of acute OIC patients in this study. In a clinical trial of patients with chronic, nonmalignant pain, 34.2% of patients experienced laxation within 4 hours of SC methylnaltrexone injection (Blonsky et al., 28th Annual Scientific Meeting of the American Pain Society, May 7‐9, 2009, San Diego, CA). The differences in laxation response between these trials may be attributable to differences in the patient populations or to methodologic differences between the studies.
Similar to findings demonstrated in a clinical study evaluating methylnaltrexone for OIC in a different patient population, those with advanced illness,22 this study supports the premise that future laxation response with prolonged use is most likely to occur when a laxation response was achieved after the first or second initial administrations of methylnaltrexone. In contradistinction, if laxation does not occur with these early doses, continued methylnaltrexone dosing is less likely to produce a response later.
This study has some limitations that must be considered. First, as this was a hypothesis‐generating study, all efficacy parameters investigated were exploratory in nature. The results reported herein warrant careful consideration, owing to a small sample size that may limit their generalizability, prior to replication in a more rigorously designed study with prespecified efficacy endpoints. Likewise, the assessment of health outcome parameters is limited. Another limitation is the small sample size utilized in this study, potentially resulting in a type II error.
Subcutaneous administration potentially offers a considerable benefit over oral therapies for OIC in this patient population post‐orthopedic surgery. Nausea and vomiting can occur as a consequence of anesthesia and of postoperative opioid analgesia, and may compromise adequate dosing of oral medications prescribed to treat OIC. Subcutaneous delivery of methylnaltrexone may circumvent this potential drawback while providing potentially rapid, effective treatment for OIC. Once‐daily dosing may also help to minimize caregiver burden and patient discomfort by preventing the need for more frequent or unpleasant treatments for OIC, such as enemas.
This study provides an initial positive signal for a broader, albeit off‐label use for methylnaltrexonethat being for the treatment of acute constipation that occurs as a consequence of postoperative opioid‐mediated analgesia in patients following orthopedic procedures. Adequate treatment of OIC, even in the acute postoperative setting, is likely to lead to better overall pain management and improved patient outcomes. Additionally, effective management of acute OIC is likely to be cost‐effective in terms of reducing the duration of hospital stays, reducing the need for nursing resources and the time spent administering rescue treatments for OIC (eg, enemas), and avoiding returns to an acute setting (eg, the emergency department) for treatment. The results presented herein suggest that methylnaltrexone may be effective and have a good safety profile in the treatment of acute OIC following orthopedic surgery. Validation of these results in larger well‐controlled trials would be welcome.
Acknowledgements
The authors thank the patients and clinical personnel involved in this study; John Charity, NP, for data collection and management, and John H. Simmons, MD, of Peloton Advantage, LLC, for assistance with manuscript preparation, which was funded by Pfizer Inc.
In addition to the authors, the following investigators participated in this trial: David Nathan Feldman, MD, Holy Name Hospital, Teaneck, NJ; Sam Hakki, MD, Bay Pines VA Healthcare System, Bay Pines, FL; Forrest A. Hanke, MD, Trover Health System, Madisonville, KY; William H. Horton, Jr, MD, Palmetto Clinical Research, Greenville, SC; M. Jay Jazayeri, MD, Pacific Hospital of Long Beach, Long Beach, CA; John F. Peppin, DO, The Pain Treatment Center of the Bluegrass, Lexington, KY; Bruce Pomeranz, MD, Kessler Institute for Rehabilitation, Saddle Brook, NJ, and Chester, NJ; Alan C. Schwartz, MD, Helping Hands Medical Associates, Santa Ana, CA; Michael J. Skyhar, MD, CORE Orthopaedic Medical Center, Encinitas, CA; Lex A. Simpson, MD, CORE Orthopaedic Medical Center, Encinitas, CA; James Slover, MD, New York University Hospital for Joint Disease, New York, NY; Dilip Tapadiya, MD, Fountain Valley Regional Hospital, Fountain Valley, CA; Stanley J. Waters, MD, PhD, Americana Orthopedics, Boise, ID.
- ,.Postoperative pain management.Chest Surg Clin N Am.1997;7:773–799.
- ,.Strategies for effective postoperative pain management.Minerva Anestesiol.2006;72:145–150.
- ,,.Are peripheral opioid antagonists the solution to opioid side effects?Anesth Analg.2004;98:116–122.
- ,.Neuroplasticity—an important factor in acute and chronic pain.Swiss Med Wkly.2002;132:273–278.
- ,,,,.The burden of acute postoperative pain and the potential role of the COX‐2‐specific inhibitors.Rheumatology (Oxford).2003;42(suppl 3):iii40–iii52.
- .Incidence, prevalence, and management of opioid bowel dysfunction.Am J Surg.2001;182(suppl 5A):11S–18S.
- ,.Management of common opioid‐induced adverse effects.Am Fam Physician.2006;74:1347–1354.
- ,.Antagonism of gastrointestinal opioid effects.Reg Anesth Pain Med.2000;25:639–642.
- .Methylnaltrexone mechanisms of action and effects on opioid bowel dysfunction and other opioid adverse effects.Ann Pharmacother.2007;41:984–993.
- ,.Methylnaltrexone: investigation of clinical applications.Drug Dev Res.2000;50:133–141.
- ,,,.Opioid‐induced delay in gastric emptying: a peripheral mechanism in humans.Anesthesiology.1997;87:765–770.
- ,,, et al.Effects of enteric‐coated methylnaltrexone in preventing opioid‐induced delay in oral‐cecal transit time.Clin Pharmacol Ther.2000;67:398–404.
- ,,,,,.Methylnaltrexone prevents morphine‐induced delay in oral‐cecal transit time without affecting analgesia: a double‐blind randomized placebo‐controlled trial.Clin Pharmacol Ther.1996;59:469–475.
- ,,,,,.Effects of intravenous methylnaltrexone on opioid‐induced gut motility and transit time changes in subjects receiving chronic methadone therapy: a pilot study.Pain.1999;83:631–635.
- ,,, et al.Methylnaltrexone for reversal of constipation due to chronic methadone use: a randomized controlled trial.JAMA.2000;283:367–372.
- ,.Oral methylnaltrexone for opioid‐induced constipation.JAMA.2000;284:1383–1384.
- ,,, et al.Methylnaltrexone for opioid‐induced constipation in advanced illness.N Engl J Med.2008;328:2332–2343.
- ,,, et al.Methylnaltrexone for treatment of opioid‐induced constipation in advanced illness patients.J Support Oncol.2009;7:39–46.
- Relistor [package insert].Philadelphia, PA, and Tarrytown, NY:Wyeth Pharmaceuticals Inc and Progenics Pharmaceuticals;2009.
- ,,, et al.Subcutaneous methylnaltrexone for treatment of opioid‐induced constipation in patients with chronic, nonmalignant pain: a randomized controlled study.J Pain.2011;12:554–562.
- ,,,,,.Two new rating scales for opiate withdrawal.Am J Drug Alcohol Abuse.1987;13:293–308.
- ,,, et al.Methylnaltrexone treatment of opioid‐induced constipation in patients with advanced illness.J Pain Symptom Manage.2009;38:683–690.
Copyright © 2011 Society of Hospital Medicine

BMI‐Related Outcome in Minority Patients
Obesity affects all segments of the American population. However, it imposes a larger burden and poses a greater threat to minority populations.1 The increase in overall prevalence of obesity and obesity‐related diseases are especially pronounced in ethnic minorities,2 and the outlook for minorities who develop obesity‐associated diseases such as stroke and chronic renal disease is worse than in their Caucasian counterparts.3
Despite the higher prevalence of obesity in ethnic minorities, the majority of research on the relationship between body mass index (BMI) and mortality has been conducted among Caucasians in the United States. This is due largely to the small number of minority participants in most studies, which makes for low statistical power.4
A curious epidemiologic paradox has been the observation, in many studies, that black adults have lower morbidity and mortality associated with obesity compared to Caucasians.5 In fact, some authors suggest that high BMI among black and other minorities may not be as strong a risk factor for mortality as it is in others.6, 7
Very few studies have specifically examined the contribution of BMI to postoperative outcome in a large cohort of minority patients.8, 9 Similarly, the authors are unaware of any previous studies describing the clinical relevance of being overweight and obese in minority patients undergoing surgery. Therefore, the primary objective of this observational study was to describe the prevalence of overweight and obesity in a large cohort of minority surgical patients, and the impact of BMI class on their postoperative outcome. Our a priori hypothesis was that obese minority surgical patients would have a poorer postoperative outcome and have higher 30‐day all‐cause mortality than normal weight individuals.
METHODS
Study data were derived from the Participant Use Data File of the American College of Surgeons (ACS) National Surgical Quality Improvement Program (NSQIP) for the calendar years 2005 to 2008. This multi‐institutional (186 participating centers) reporting system was designed to provide risk‐adjusted surgical outcome data from throughout the United States.
The methodology for collecting these data, including their accuracy and reproducibility, has been detailed in previous publications.10, 11 It is briefly reviewed here. Dedicated nurse clinical reviewers at each hospital prospectively enrolled patients and collected data in a standardized fashion according to strict ACS‐NSQIP definitions. A systematic sample was obtained by taking the first 40 cases per nurse reviewer on an 8‐day cycle from the operating room log, ensuring that no particular operating room day block time would bias the weighting of cases. Nurse reviewers had completed comprehensive training regarding definitions and data extraction, as well as continuing education and monitoring through the ACS‐NSQIP program. They are assessed for inter‐rater reliability during biennial site visits. Information was obtained from patient medical records, physician office records, and telephone interviews. Patients were followed through their hospital course and after discharge from hospital up to 30 days postoperatively. A high level of accuracy and reproducibility of the data have been previously demonstrated.12
Race was defined as African American, Hispanic, Asian or Pacific Islander, or American Indian/Alaskan native, as identified by the clinical care provider, or within the medical record. Patients were excluded if race was coded as white, or not recorded. We also excluded patients with missing record of height and/or weight. The final study cohort consisted of 119,619 minority patients. We then computed BMI as weight in kilograms divided by the square of the height in meters (BMI = kg/m2). Patients were classified as underweight (BMI 18.5 kg/m2), normal weight (BMI = 18.6‐24.9 kg/m2), overweight (BMI = 25‐29.9 kg/m2), obese (BMI = 30‐39.9 kg/m2), and morbidly obese (BMI 40 kg/m2) in accordance with National Institute of Health (NIH) standards.13
Outcomes
The primary outcome was death within 30 days of the index surgery. Secondary outcomes were the occurrence of major or minor complications. Major complications were grouped as the occurrence of at least one of following: organ space infection, wound disruption, sepsis or septic shock, bleeding requiring transfusion, postoperative pneumonia, delayed ventilator wean, unplanned reintubation, myocardial infarction, deep venous thrombosis, cardiac arrest, coma, acute renal failure, progressive renal insufficiency, and return to the operating room. We then computed a composite morbidity variable defined as the occurrence of 1 or more of these major postoperative complications. Minor complications included occurrence of urinary tract infection, superficial surgical site infection, and superficial thrombophlebitis.
Statistical Analysis
Data analysis was carried out with SPSS v.16.0 (SPSS, Chicago, IL). Basic descriptive statistics, including means, standard deviations, and percentages were calculated for demographic and anthropometric data. Prevalence of overweight and obesity were described as simple proportions and compared along gender lines. Pearson's chi‐square analysis of categorical variables and 1‐way ANOVA of continuous variables were used to examine baseline clinical and perioperative differences between BMI categories. Pair‐wise comparisons, with the normal BMI class serving as the reference, were performed using the Bonferroni multiple comparison of means method. The overall mortality rate was calculated as well as the distribution of mortality across BMI classes. We also compared mortality rate in patients who developed at least 1 major postoperative complicationdefined as failure to rescue14 across the BMI classes.
Multivariate logistic regression models were fitted to the data to explore the relationship between BMI category and death within 30 days of surgery. Odds ratios for 30‐day all‐cause mortality were calculated in the BMI categories using the normal BMI group as reference. The following characteristics were included in the model as covariates based on a priori statistical significance or clinical relevance: age (<65 years vs 65 years), American Society of Anesthesiology (ASA) status (I‐II vs III), racial groups, and urgency of surgery (elective vs emergent). Other covariates included the presence of multiple medical conditions (coded as yes or no), surgical complexity, need for reoperation, reintubation, and preoperative functional status. A model fit was measured with the Hosmer and Lemeshow test.15 All reported P values were 2‐sided and a P value of 0.05 was considered to be significant.
RESULTS
The study cohort included 119,619 surgical patients (Table 1). Their mean (standard deviation [SD]) age was 50.4 (16.9), and the mean (SD) BMI of 30.3 (8.9) kg/m2 was in the obese range. The overall prevalence of high BMI (overweight or obese) was 70.8%. A very small proportion, 2.7%, of patients was classified as underweight. Sex‐stratified demographic and behavioral characteristics differed significantly across all the variables in our study cohort. Men were more likely to be overweight, whereas women were more likely to be obese or severely obese. A majority (77.4%) of the patients were non‐elderly adults (<65years) undergoing elective (85.9%) surgical procedures. The minority patients in this study were African American (50%), Hispanic (36%), Asian and Pacific Islander (10%), and American Indian and Alaskan native (4%).
| Baseline Characteristics | All Patients (N = 119,619) | Men (N = 44,922) | Women (N = 74,695) | P Value |
|---|---|---|---|---|
| ||||
| Age (yr) | 50.4 16.9 | 51.6 17.1 | 49.6 16.7 | <0.001 |
| Age 65 yr | 22.6 | 25.5 | 20.8 | <0.001 |
| Current smoker | 22.2 | 28.8 | 18.2 | <0.001 |
| >2 Drinks/day | 37.6 | 4.1 | 0.8 | <0.001 |
| BMI | 30.3 8.8 | 28.4 7.3 | 31.4 9.5 | <0.001 |
| Underweight | 2.7 | 2.9 | 2.6 | 0.001 |
| Overweight | 29.2 | 35.5 | 25.4 | <0.001 |
| Obese | 28.8 | 24.9 | 31.2 | <0.001 |
| Severely obese | 12.8 | 6.2 | 16.8 | <0.001 |
| Ethnic categories | ||||
| Black | 50.4 | 48.0 | 51.7 | <0.001 |
| Hispanic | 36.2 | 38.2 | 35.2 | <0.001 |
| Asian* | 9.7 | 10.3 | 9.3 | <0.001 |
| American Indian | 3.6 | 3.5 | 5.8 | <0.001 |
| Surgical specialties | ||||
| General surgery | 77.9 | |||
| Vascular surgery | 10.3 | |||
| Orthopedics | 4.0 | |||
| Gynecology | 3.4 | |||
| Urology | 1.1 | |||
| Others! | 3.3 | |||
The distribution of baseline preoperative clinical characteristics by BMI class revealed many significant differences (Table 2). Age was significantly different among the BMI classes, with the severely obese group being about 8 years younger than the underweight or normal weight group. Similarly, severely obese patients were more likely to be women, less likely to smoke, more likely to be hypertensive, diabetic, have a history of dyspnea at rest, and more likely to belong to high ASA class. On the other hand, underweight patients were more likely to have disseminated cancer, be current smokers, consume more than 2 alcoholic drinks per day, have active chronic obstructive pulmonary disease (COPD), and have ascites. They were also more likely to be on dialysis and have cardiac disease, as well as a history of stroke. Urgency of surgery also varied significantly across the BMI categories, with the underweight group having the highest incidence of emergency surgery (20.6%) and the severely obese group being the least likely to present for emergency surgery (8.2%).
| BMI range (kg/m2) Characteristics | Mean SD or (%) | P Value | ||||
|---|---|---|---|---|---|---|
| UW (18.5) | NW (18.5‐24.9) | OVW (25‐29.9) | OB (30‐39.9) | SevOB (40) | ||
| ||||||
| Age (yr) | 53.4 19.3 | 51.1 18.4 | 51.8 16.9 | 50.4 15.5 | 45.2 13.4 | <0.001 |
| Female | 59.8 | 56.7 | 54.4 | 67.5 | 81.7 | <0.001 |
| Current smoker | 32.1 | 25.6 | 22.1 | 20.4 | 17.1 | <0.001 |
| >2 Drinks/day | 4.1 | 2.7 | 2.2 | 1.6 | 0.7 | <0.001 |
| Hypertension | 41.7 | 38.4 | 44.0 | 51.0 | 56.0 | <0.001 |
| DM (insulin or oral agents) | 12.5 | 13.1 | 16.4 | 22.3 | 26.3 | <0.001 |
| COPD | 7.7 | 3.3 | 2.5 | 2.7 | 2.5 | <0.001 |
| Dyspnea at rest | 10.5 | 7.1 | 7.2 | 9.9 | 20.2 | <0.001 |
| ASA III | 59.0 | 39.5 | 35.6 | 39.8 | 62.2 | <0.001 |
| Emergency surgery | 20.6 | 17.6 | 15.2 | 11.9 | 8.2 | <0.001 |
| Active CHF | 2.2 | 1.3 | 1.1 | 1.1 | 1.1 | <0.001 |
| Recent MI | 1.1 | 0.8 | 0.8 | 0.6 | 0.4 | <0.001 |
| Recent angina | 1.2 | 1.1 | 1.1 | 1.2 | 0.7 | <0.001 |
| Disseminated cancer | 4.3 | 2.5 | 1.6 | 1.3 | 0.6 | <0.001 |
| Recent 10% weight loss | 15.2 | 4.2 | 1.7 | 1.0 | 0.5 | <0.001 |
| Ascites | 4.4 | 2.1 | 1.2 | 0.9 | 0.5 | <0.001 |
| Currently on dialysis | 9.7 | 6.7 | 4.9 | 4.1 | 2.9 | <0.001 |
| Stroke history | 5.6 | 3.5 | 2.9 | 2.6 | 1.3 | <0.001 |
Perioperative outcomes according to BMI classes documented significant differences (Table 3). Work relative value unit (Work RVU, a measure of surgical complexity), as well as total anesthesia and operation time decreased in a stepwise fashion across the BMI classes to the obese group, followed by increase in these parameters in the severely obese group. Following a decrease to the normal BMI category, there was a positive association between BMI and the incidence of postoperative superficial and deep wound infection, as well as wound disruption.
| BMI (kg/m2) Events | Mean SD or (%) | P Value | ||||
|---|---|---|---|---|---|---|
| UW (18.5) | NW (18.5‐24.9) | OVW (25‐29.9) | OB (30‐39.9) | SevOB (40) | ||
| ||||||
| Work RVU | 16.3 9.5 | 14.5 9.1 | 14.0 8.4 | 13.8 7.9 | 17.3 9.1 | <0.001 |
| Anesthesia time (hr) | 2.7 1.9 | 2.5 1.7 | 2.5 1.6 | 2.5 1.6 | 2.7 1.5 | <0.001 |
| Pre‐incision time (min) | 35.9 21.3 | 33.1 21.1 | 33.2 22.5 | 32.5 19.3 | 34.9 21.1 | <0.001 |
| Operation time (hr) | 1.8 1.6 | 1.6 1.4 | 1.7 1.4 | 1.7 1.4 | 1.8 1.2 | <0.001 |
| Transfused intra‐op | 12.8 | 7.1 | 5.3 | 4.4 | 2.9 | <0.001 |
| Superficial wound SSI | 2.9 | 2.5 | 2.6 | 2.8 | 3.1 | <0.001 |
| Deep wound SSI | 1.5 | 0.7 | 0.8 | 0.9 | 1.0 | <0.001 |
| Wound disruption | 1.5 | 0.6 | 0.6 | 0.6 | 0.7 | <0.001 |
| Post‐op sepsis | 5.7 | 2.9 | 2.2 | 2.1 | 2.0 | <0.001 |
| Septic shock | 3.1 | 1.7 | 1.3 | 1.2 | 1.1 | <0.001 |
| Reintubation | 3.8 | 1.8 | 1.2 | 1.0 | 1.0 | <0.001 |
| Delayed ventilator wean | 5.5 | 2.8 | 2.1 | 2.0 | 2.0 | <0.001 |
| Pneumonia | 4.3 | 2.1 | 1.3 | 1.2 | 1.2 | <0.001 |
| Cardiac arrest/CPR | 1.5 | 0.7 | 0.5 | 0.4 | 0.4 | <0.001 |
| Urinary tract infection | 3.4 | 1.8 | 1.5 | 1.6 | 1.6 | <0.001 |
| Post‐op ARF | 2.1 | 1.1 | 0.8 | 0.9 | 0.7 | <0.001 |
| Return to OR | 11.2 | 6.9 | 5.8 | 5.5 | 4.9 | <0.001 |
| Post‐op coma | 0.4 | 0.2 | 0.1 | 0.1 | 0.1 | <0.001 |
| Post‐op transfusion | 1.6 | 0.7 | 0.5 | 0.4 | 0.5 | <0.001 |
| Composite morbidities | 25.2 | 15.3 | 13.0 | 12.8 | 12.1 | <0.001 |
There was a negative association between BMI class and the likelihood of postoperative sepsis, septic shock, reintubation, delayed ventilator wean, and postoperative pneumonia. Similarly, the proportions of patients who developed postoperative acute renal failure, cardiac arrest, and those who required postoperative blood transfusion or needed reoperation, decreased significantly across the BMI classes, with the highest proportion of cases being in the underweight group and the lowest in the severely obese group. Overall composite morbidity was twice as high in the underweight compared to the severely obese group.
There were 1758 deaths among the study's 119,619 patients, resulting in an overall mortality rate of 1.5%. The overall major complication rate was 13.8%. The distribution of total mortality rate as well as mortality in patients with at least 1 major postoperative complication across BMI classes revealed consistent differences (Figure 1). Over the entire range of BMI classes, there was a progressive, stepwise decrease in the proportion of deaths with increasing BMI. This pattern also occurred among patients who developed at least 1 major postoperative complication, indicating a reduced likelihood of death after a major complication. This is reflective of a reduced likelihood of death after a major complication (failure to rescue) with increasing BMI.

Multivariate logistic regression defined a number of factors associated with 30‐day mortality (Table 4). The Hosmer and Lemeshow goodness‐of‐fit test for this model was not statistically significant (2 = 17.8, df = 8, P = 0.23). High ASA physical status was associated with high odds of mortality. Specifically, when controlling for the other covariates in the model, ASA status was associated with a 5‐fold increased relative odds of death (adjusted odds ratio [OR] = 5.30; 95% confidence interval = 4.96‐5.79, P < 0.001). Similarly, occurrence of 1 or more major postoperative complication was associated with 6‐fold increased relative odds of mortality. The paradoxical effect of BMI category observed on univariate analysis was maintained in the multivariate model. Specifically, underweight patients had the highest relative odds of mortality, while severely obese patients had the lowest, compared with patients at a healthy weight (Table 4). Interestingly, smoking had no significant effect on the odds of mortality after controlling for other factors. Similarly, the specific racial group and the timing of the surgical intervention had no significant effect on mortality.
| Variables in the equation | Coefficient () | Wald (2) | P Value | Odds Ratio | 95% CI |
|---|---|---|---|---|---|
| |||||
| ASA status III | 1.67 | 233.0 | <0.001 | 5.31 | 4.96‐5.79 |
| Emergency operation | 0.89 | 241 | <0.001 | 2.43 | 2.17‐2.72 |
| Reoperation | 0.77 | 155.9 | <0.001 | 2.10 | 1.91‐2.44 |
| Reintubation | 0.4 | 51.4 | <0.001 | 1.63 | 1.41‐1.82 |
| Dependent functional status | 1.2 | 422.5 | <0.001 | 3.44 | 3.01‐3.79 |
| Cumulative comorbidity* | 0.09 | 12.37 | <0.001 | 1.18 | 1.03‐1.14 |
| Major POP complication | 1.8 | 686.1 | <0.001 | 6.43 | 5.59‐7.39 |
| Age 65 yr | 0.56 | 95.3 | <0.001 | 1.75 | 1.56‐1.96 |
| Work RVU | 0.17 | 49.7 | <0.001 | 1.02 | 1.01‐1.02 |
| Severely obese | Reference | 1.00 | |||
| Underweight | 0.76 | 30.9 | <0.001 | 2.13 | 1.63‐2.78 |
| Normal BMI | 0.42 | 15.4 | <0.001 | 1.52 | 1.23‐1.87 |
| Overweight | 0.28 | 6.9 | 0.009 | 1.33 | 1.08‐1.65 |
| Obese | 0.19 | 2.86 | 0.091 | 1.20 | 0.97‐1.49 |
| Dyspnea | 0.41 | 40.0 | <0.001 | 1.51 | 1.33‐1.72 |
| Active CHF | 0.60 | 39.6 | <0.001 | 1.83 | 1.52‐2.21 |
| Chronic renal failure (dialysis) | 0.70 | 102.2 | <0.001 | 2.01 | 1.76‐2.30 |
DISCUSSION
In this large, study of minority surgical patients, the impact of BMI on the 30‐day morbidity and mortality was unexpected. The working hypothesis was that overweight and obese patients would have a worse outcome after surgery. However, contrary to this hypothesis, the lowest all‐cause mortality rate was found in the severely obese (BMI 40 kg/m2) group in both men and women. Death rates decreased progressively in a stepwise fashion from the underweight to the severely obese group. Similarly, even in patients who developed at least 1 major postoperative complication, the likelihood of death was still negatively associated with BMI. This negative association of mortality with BMI was observed despite the higher prevalence of chronic diseases, such as hypertension, diabetes, and dyspnea at rest, in the increasing BMI classes.
Controversy remains regarding the association between BMI and mortality, in particular about the shape of the curve for the association between BMI and mortality. Epidemiologic studies have variously described J‐shaped, U‐shaped, monotonic, or linear relationships.16, 17 In the surgical population, a reverse J‐shaped relationship between BMI category and mortality has been described.18, 19 Sometimes this is referred to as obesity paradox or reverse epidemiology: a trend whereby overweight and moderately obese patients have better outcomes and lower risk of death than leaner patients.18 This phenomenon is particularly well described in adult20 and elderly heart failure and hypertensive patients.21 Many of these studies either had very few minority patients,21 or mortality pattern was not analyzed along ethnic lines.
Few studies10 have focused exclusively on minority surgical patients. Some investigators have determined that high BMI in black adults may not be as important a risk factor for mortality6, 7 as in whites. Our data suggest that among minority surgical patients, the relationship appeared to be a downward trend in mortality from low to high BMI, thus revealing the obesity paradox. This pattern was evident even in patients who developed 1 major complication in the postoperative period, suggesting that high BMI also protects against failure to rescueor death after a major complication.
Despite decades of research, the mechanisms underlying the obesity paradox remain speculative.20, 22. Many have posited that adiposity may confer protection against cytokines and various inflammatory mediators in heart failure patients by the production of buffering lipoproteins.23, 24 It is conceivable that similar protection against inflammatory response to surgical tissue trauma is operational in minority patients with high BMI. Another possible reason for the obesity paradox is the clinical presentation and disease progression at the time of surgery. Perhaps, similar to the observation in obese patients with heart failure,25 obese minority patients are symptomatic at an earlier stage of their disease than lean patients, making for earlier diagnosis and treatment. Thus, obesity may simply be a marker of less severe disease at the time of presentation.
Obese patients may also be more aggressively monitored and treated in the perioperative period than lean patients, because of the general perception that they are a high‐risk group.10 This may partly explain the decreased likelihood of failure to rescue with increasing BMI in our patients. Increased vigilance and prompt treatment of complications should reduce the overall morbidity and mortality rate in this group. It is also conceivable that a therapeutic selection bias is operational in the patients we studied. This describes scenarios where relatively healthy obese minority patients were operated upon, while sicker, morbidly obese patients were denied surgery due to perceived prohibitive risks. However, we would have expected a higher proportion of severely obese patients to present for emergency surgery, which is contrary to our finding of the lowest incidence of emergency surgery in the severely obese group. It is also possible that severe obesity may be associated with a higher attrition rate, such that the extremely obese patients did not live long enough to present for surgery. This is somewhat likely, given the significantly younger age of the severely obese patients in our study cohort. It is, however, impossible to determine survival effect from a cross‐sectional hospital‐based study design. Clearly, mechanisms used to explain the obesity paradox in minority surgical patients are likely to remain speculative, owing to the interaction of several factors such as concomitant comorbidities, disease progression at the time of presentation, patients' weight history, and regional fat distribution.
The current study confirms the findings of previous investigators26 about the importance of reducing major postoperative complications in surgical patients. While this may seem axiomatic, it deserves reiteration because the risk of postoperative mortality increases considerably in all the BMI categories following 1 or more major postoperative complication. However, it is not clear why obese and morbidly obese patients had a lower incidence of failure to rescue. This may be related to greater physiologic reserve in the obese and morbidly obese group, especially because patients in the higher BMI groups were significantly younger than the normal weight or lean patients. For the same reason, these younger, severely obese patients may have been more aggressively monitored and treated, thereby increasing the likelihood of being rescued following a major complication. It is also possible that the lower proportion of emergency procedures performed in obese and severely obese groups was somewhat protective, especially because emergency surgery was an independent predictor of overall mortality in this cohort of patients. In fact, when we stratified the patients according to urgency of surgery and explored the bivariate relationship between BMI category and mortality (data not shown) among those undergoing urgent surgery, the geometrical distribution of mortality did show a reverse‐J pattern with the highest proportion of cases in the underweight group, declining in the normal BMI and overweight group, and increasing steadily in obese and severely obese group. To this end, caution should be exercised when interpreting the association of BMI group with postoperative mortality for procedures performed as an emergency.
Smoking and antecedent illness are 2 confounding factors commonly criticized in studies attempting to associated BMI with mortality. This is because smokers tend to weigh less and have higher mortality rates than nonsmokers. The present investigation did not find a significant contribution of smoking to mortality when other factors included in a logistic regression model were considered. The current study's findings are consistent with those of previous data in African American patients,27 and contrasts with the excess mortality described in currently smoking Caucasian men and women.28 It is possible that smoking is not an important effect modifier when considering the relevance of BMI to postoperative mortality in minority patients.
Study Limitations
Although considerable information on several perioperative variables existed, there was a lack of detailed, disease‐specific clinical information for the individual surgical procedures. Likewise, information was unavailable regarding the process of care, such as decision to operate, when to operate, and intraoperative and the postoperative care, which are some of the factors that may determine postoperative outcome. Similarly, we did not have information on surgical experience or hospital caseload, both of which are known to affect postoperative outcome.29
In addition, the anthropometric parameters used to calculate BMI for this study are self‐reported values. Although directly measured height and weight values are preferable for calculating BMI, previous studies have shown that correlations between BMI based on measured height and weight and that based on self‐report are typically greater than 0.9.30 Given the reported strong correlation between self‐reported and measured anthropometric parameters, the reporting error on the observed association between BMI and mortality in our study is likely minimal. The limitations of BMI as a measure of adiposity is well described.31, 32 This study had no information on body fat distribution, which has been shown to have a direct correlation with mortality when BMI did not.33 Additionally, documented weight may be less accurate in the extremely obese group in that they may not have been weighed, either at home or in the hospital, due to lack of adequate weighing scales.
Conclusions
This study demonstrated that among minority surgical patients, higher BMI categories were associated with lower risk of postoperative death. This relationship was maintained, even in patients who developed 1 or more postoperative major complications, such that obese and severely obese patients had better survival compared with underweight and healthy weight patients. Mechanisms underlying this paradoxical survival advantage deserve further elucidation. It is important to emphasize that our findings in no way diminish the long‐term dangers associated with excessive adiposity, but may serve to discard the preconceived notions that overweight and obese minority patients have poorer outcome after surgery than lean patients.
- ,,,.Increasing trends in waist circumference and abdominal obesity among US adults.Obesity.2007;15:216–224.
- ,,,,,.Prevalence of overweight and obesity in the United States, 1999–2004.JAMA.2006;295:1549–1555.
- ,,,,.Ethnic disparities in stroke epidemiology, acute care, and post‐acute outcomes.Stroke.2005;36:374–387.
- ,,,,,.Body mass index and body girths as predictors of mortality in black and white women.Arch Intern Med.1992;152:1257–1262.
- ,,,,,.Relative weight and mortality in U.S. blacks and whites: findings from representative national population samples.Ann Epidemiol.1997;7:383–395.
- ,,,,.Body‐mass index and mortality in a prospective cohort of U.S. adults.N Engl J Med.1999;341:1097–1105.
- ,,, et al.Body mass index and body girths as predictors of mortality in black and white men.Am J Epidemiol.1992;135:1137–1146.
- ,,.Morbidity in obese and non‐obese patients following gynecologic surgery for cancer.J Natl Med Assoc.1988;80:417–420.
- ,,, et al.The influence of obesity on perioperative morbidity: retrospective study of 502 aorto‐coronary bypass operations.Thorac Cardiovasc Surg.1992;40:126–129.
- ,,,,.The impact of high body mass index on postoperative complications and resource utilization in minority patients.J Natl Med Assoc.2011;103:9–15.
- ,,, et al.The patient safety in surgery study: background, study design, and patient populations.J Am Coll Surg.2007;204:1089–1102.
- ,,, et al.The assessment of the reliability of data collected for the Department of Veterans Affairs' National Surgical Quality Improvement Program (NSQIP).J Am Coll Surg.2007;204:550–560.
- Expert Panel on the Identification, Evaluation, and Treatment of Overweight in Adults. Clinical guidelines on the identification, evaluation, and treatment of overweight and obesity in adults: executive summary.Am J Clin Nutr.1998;68:899–917.
- ,,,.Hospital and patient characteristics associated with death after surgery: a study of adverse occurrence and failure to rescue.Med Care.1992;30:615–629.
- ,,,.Multivariate Data Analysis.5th ed.London:Prentice Hall International;1998.
- ,,,,,.Estimating the number of deaths due to obesity: can the divergent findings be reconciled?J Women's Health.2007;16(2):168–176.
- ,,, et al.Body mass index and mortality among US male physicians.Ann Epidemiol.2004;14/10:731–739.
- ,,.The obesity paradox: body mass index and outcomes in patients undergoing non‐bariatric general surgery.Ann Surg.2009;250:166–172.
- ,,,,,.The influence of body mass index obesity status on vascular surgery 30‐day morbidity and mortality.J Vasc Surg.2009;49:140–147.
- ,,, et al.Risk factor paradox in wasting diseases.Curr Opin Clin Nutr Metab Care.2007;10:433–442.
- ,,, et al.The relationship between obesity and mortality in patients with heart failure.J Am Coll Cardiol.2001;38:789–795.
- ,.Reverse epidemiology beyond dialysis patients: chronic heart failure, geriatrics, rheumatoid arthritis, COPD, and AIDS.Semin Dial.2007;20:549–553.
- ,,.The endotoxin‐lipoprotein hypothesis.Lancet.2000;356:930–933.
- ,,, et al.Adiponectin and cardiovascular disease: state of the art?Am J Physiol Heart Circ Physiol.2007;292:H1655–H1663.
- ,,,.Body composition and prognosis in chronic systolic heart failure: the obesity paradox.Am J Cardiol.2003;91:891–894.
- ,,.Variation in hospital mortality associated with inpatient surgery.N Engl J Med.2009;361:1368–1375.
- ,,.Body mass index and 15‐year mortality in a cohort of black men and women.J Clin Epidemiol.1990;43:949–960.
- ,,.Thinness and mortality.Am J Public Health.1987;77:317–322.
- ,,.Operative mortality and procedure volume as predictors of subsequent hospital performance.Ann Surg.2006;243:411–417.
- .Nutritional Epidemiology.2nd ed.Monographs in Epidemiology and Biostatistics; vol30.New York:Oxford University Press,1998:514.
- ,,, et al.Association of general and abdominal obesity with multiple health outcomes in older women: the Iowa Women's Health study.Arch Intern Med.2000;160:2117–2128.
- ,,.Does body mass index adequately capture the relation of body composition and body size to health outcomes?Am J Epidemiol.1998;147:167–172.
- ,,,.Intra‐abdominal adiposity, abdominal obesity, and cardio‐metabolic risk.Eur Heart J Suppl.2008;10(suppl B):B4–10.
Obesity affects all segments of the American population. However, it imposes a larger burden and poses a greater threat to minority populations.1 The increase in overall prevalence of obesity and obesity‐related diseases are especially pronounced in ethnic minorities,2 and the outlook for minorities who develop obesity‐associated diseases such as stroke and chronic renal disease is worse than in their Caucasian counterparts.3
Despite the higher prevalence of obesity in ethnic minorities, the majority of research on the relationship between body mass index (BMI) and mortality has been conducted among Caucasians in the United States. This is due largely to the small number of minority participants in most studies, which makes for low statistical power.4
A curious epidemiologic paradox has been the observation, in many studies, that black adults have lower morbidity and mortality associated with obesity compared to Caucasians.5 In fact, some authors suggest that high BMI among black and other minorities may not be as strong a risk factor for mortality as it is in others.6, 7
Very few studies have specifically examined the contribution of BMI to postoperative outcome in a large cohort of minority patients.8, 9 Similarly, the authors are unaware of any previous studies describing the clinical relevance of being overweight and obese in minority patients undergoing surgery. Therefore, the primary objective of this observational study was to describe the prevalence of overweight and obesity in a large cohort of minority surgical patients, and the impact of BMI class on their postoperative outcome. Our a priori hypothesis was that obese minority surgical patients would have a poorer postoperative outcome and have higher 30‐day all‐cause mortality than normal weight individuals.
METHODS
Study data were derived from the Participant Use Data File of the American College of Surgeons (ACS) National Surgical Quality Improvement Program (NSQIP) for the calendar years 2005 to 2008. This multi‐institutional (186 participating centers) reporting system was designed to provide risk‐adjusted surgical outcome data from throughout the United States.
The methodology for collecting these data, including their accuracy and reproducibility, has been detailed in previous publications.10, 11 It is briefly reviewed here. Dedicated nurse clinical reviewers at each hospital prospectively enrolled patients and collected data in a standardized fashion according to strict ACS‐NSQIP definitions. A systematic sample was obtained by taking the first 40 cases per nurse reviewer on an 8‐day cycle from the operating room log, ensuring that no particular operating room day block time would bias the weighting of cases. Nurse reviewers had completed comprehensive training regarding definitions and data extraction, as well as continuing education and monitoring through the ACS‐NSQIP program. They are assessed for inter‐rater reliability during biennial site visits. Information was obtained from patient medical records, physician office records, and telephone interviews. Patients were followed through their hospital course and after discharge from hospital up to 30 days postoperatively. A high level of accuracy and reproducibility of the data have been previously demonstrated.12
Race was defined as African American, Hispanic, Asian or Pacific Islander, or American Indian/Alaskan native, as identified by the clinical care provider, or within the medical record. Patients were excluded if race was coded as white, or not recorded. We also excluded patients with missing record of height and/or weight. The final study cohort consisted of 119,619 minority patients. We then computed BMI as weight in kilograms divided by the square of the height in meters (BMI = kg/m2). Patients were classified as underweight (BMI 18.5 kg/m2), normal weight (BMI = 18.6‐24.9 kg/m2), overweight (BMI = 25‐29.9 kg/m2), obese (BMI = 30‐39.9 kg/m2), and morbidly obese (BMI 40 kg/m2) in accordance with National Institute of Health (NIH) standards.13
Outcomes
The primary outcome was death within 30 days of the index surgery. Secondary outcomes were the occurrence of major or minor complications. Major complications were grouped as the occurrence of at least one of following: organ space infection, wound disruption, sepsis or septic shock, bleeding requiring transfusion, postoperative pneumonia, delayed ventilator wean, unplanned reintubation, myocardial infarction, deep venous thrombosis, cardiac arrest, coma, acute renal failure, progressive renal insufficiency, and return to the operating room. We then computed a composite morbidity variable defined as the occurrence of 1 or more of these major postoperative complications. Minor complications included occurrence of urinary tract infection, superficial surgical site infection, and superficial thrombophlebitis.
Statistical Analysis
Data analysis was carried out with SPSS v.16.0 (SPSS, Chicago, IL). Basic descriptive statistics, including means, standard deviations, and percentages were calculated for demographic and anthropometric data. Prevalence of overweight and obesity were described as simple proportions and compared along gender lines. Pearson's chi‐square analysis of categorical variables and 1‐way ANOVA of continuous variables were used to examine baseline clinical and perioperative differences between BMI categories. Pair‐wise comparisons, with the normal BMI class serving as the reference, were performed using the Bonferroni multiple comparison of means method. The overall mortality rate was calculated as well as the distribution of mortality across BMI classes. We also compared mortality rate in patients who developed at least 1 major postoperative complicationdefined as failure to rescue14 across the BMI classes.
Multivariate logistic regression models were fitted to the data to explore the relationship between BMI category and death within 30 days of surgery. Odds ratios for 30‐day all‐cause mortality were calculated in the BMI categories using the normal BMI group as reference. The following characteristics were included in the model as covariates based on a priori statistical significance or clinical relevance: age (<65 years vs 65 years), American Society of Anesthesiology (ASA) status (I‐II vs III), racial groups, and urgency of surgery (elective vs emergent). Other covariates included the presence of multiple medical conditions (coded as yes or no), surgical complexity, need for reoperation, reintubation, and preoperative functional status. A model fit was measured with the Hosmer and Lemeshow test.15 All reported P values were 2‐sided and a P value of 0.05 was considered to be significant.
RESULTS
The study cohort included 119,619 surgical patients (Table 1). Their mean (standard deviation [SD]) age was 50.4 (16.9), and the mean (SD) BMI of 30.3 (8.9) kg/m2 was in the obese range. The overall prevalence of high BMI (overweight or obese) was 70.8%. A very small proportion, 2.7%, of patients was classified as underweight. Sex‐stratified demographic and behavioral characteristics differed significantly across all the variables in our study cohort. Men were more likely to be overweight, whereas women were more likely to be obese or severely obese. A majority (77.4%) of the patients were non‐elderly adults (<65years) undergoing elective (85.9%) surgical procedures. The minority patients in this study were African American (50%), Hispanic (36%), Asian and Pacific Islander (10%), and American Indian and Alaskan native (4%).
| Baseline Characteristics | All Patients (N = 119,619) | Men (N = 44,922) | Women (N = 74,695) | P Value |
|---|---|---|---|---|
| ||||
| Age (yr) | 50.4 16.9 | 51.6 17.1 | 49.6 16.7 | <0.001 |
| Age 65 yr | 22.6 | 25.5 | 20.8 | <0.001 |
| Current smoker | 22.2 | 28.8 | 18.2 | <0.001 |
| >2 Drinks/day | 37.6 | 4.1 | 0.8 | <0.001 |
| BMI | 30.3 8.8 | 28.4 7.3 | 31.4 9.5 | <0.001 |
| Underweight | 2.7 | 2.9 | 2.6 | 0.001 |
| Overweight | 29.2 | 35.5 | 25.4 | <0.001 |
| Obese | 28.8 | 24.9 | 31.2 | <0.001 |
| Severely obese | 12.8 | 6.2 | 16.8 | <0.001 |
| Ethnic categories | ||||
| Black | 50.4 | 48.0 | 51.7 | <0.001 |
| Hispanic | 36.2 | 38.2 | 35.2 | <0.001 |
| Asian* | 9.7 | 10.3 | 9.3 | <0.001 |
| American Indian | 3.6 | 3.5 | 5.8 | <0.001 |
| Surgical specialties | ||||
| General surgery | 77.9 | |||
| Vascular surgery | 10.3 | |||
| Orthopedics | 4.0 | |||
| Gynecology | 3.4 | |||
| Urology | 1.1 | |||
| Others! | 3.3 | |||
The distribution of baseline preoperative clinical characteristics by BMI class revealed many significant differences (Table 2). Age was significantly different among the BMI classes, with the severely obese group being about 8 years younger than the underweight or normal weight group. Similarly, severely obese patients were more likely to be women, less likely to smoke, more likely to be hypertensive, diabetic, have a history of dyspnea at rest, and more likely to belong to high ASA class. On the other hand, underweight patients were more likely to have disseminated cancer, be current smokers, consume more than 2 alcoholic drinks per day, have active chronic obstructive pulmonary disease (COPD), and have ascites. They were also more likely to be on dialysis and have cardiac disease, as well as a history of stroke. Urgency of surgery also varied significantly across the BMI categories, with the underweight group having the highest incidence of emergency surgery (20.6%) and the severely obese group being the least likely to present for emergency surgery (8.2%).
| BMI range (kg/m2) Characteristics | Mean SD or (%) | P Value | ||||
|---|---|---|---|---|---|---|
| UW (18.5) | NW (18.5‐24.9) | OVW (25‐29.9) | OB (30‐39.9) | SevOB (40) | ||
| ||||||
| Age (yr) | 53.4 19.3 | 51.1 18.4 | 51.8 16.9 | 50.4 15.5 | 45.2 13.4 | <0.001 |
| Female | 59.8 | 56.7 | 54.4 | 67.5 | 81.7 | <0.001 |
| Current smoker | 32.1 | 25.6 | 22.1 | 20.4 | 17.1 | <0.001 |
| >2 Drinks/day | 4.1 | 2.7 | 2.2 | 1.6 | 0.7 | <0.001 |
| Hypertension | 41.7 | 38.4 | 44.0 | 51.0 | 56.0 | <0.001 |
| DM (insulin or oral agents) | 12.5 | 13.1 | 16.4 | 22.3 | 26.3 | <0.001 |
| COPD | 7.7 | 3.3 | 2.5 | 2.7 | 2.5 | <0.001 |
| Dyspnea at rest | 10.5 | 7.1 | 7.2 | 9.9 | 20.2 | <0.001 |
| ASA III | 59.0 | 39.5 | 35.6 | 39.8 | 62.2 | <0.001 |
| Emergency surgery | 20.6 | 17.6 | 15.2 | 11.9 | 8.2 | <0.001 |
| Active CHF | 2.2 | 1.3 | 1.1 | 1.1 | 1.1 | <0.001 |
| Recent MI | 1.1 | 0.8 | 0.8 | 0.6 | 0.4 | <0.001 |
| Recent angina | 1.2 | 1.1 | 1.1 | 1.2 | 0.7 | <0.001 |
| Disseminated cancer | 4.3 | 2.5 | 1.6 | 1.3 | 0.6 | <0.001 |
| Recent 10% weight loss | 15.2 | 4.2 | 1.7 | 1.0 | 0.5 | <0.001 |
| Ascites | 4.4 | 2.1 | 1.2 | 0.9 | 0.5 | <0.001 |
| Currently on dialysis | 9.7 | 6.7 | 4.9 | 4.1 | 2.9 | <0.001 |
| Stroke history | 5.6 | 3.5 | 2.9 | 2.6 | 1.3 | <0.001 |
Perioperative outcomes according to BMI classes documented significant differences (Table 3). Work relative value unit (Work RVU, a measure of surgical complexity), as well as total anesthesia and operation time decreased in a stepwise fashion across the BMI classes to the obese group, followed by increase in these parameters in the severely obese group. Following a decrease to the normal BMI category, there was a positive association between BMI and the incidence of postoperative superficial and deep wound infection, as well as wound disruption.
| BMI (kg/m2) Events | Mean SD or (%) | P Value | ||||
|---|---|---|---|---|---|---|
| UW (18.5) | NW (18.5‐24.9) | OVW (25‐29.9) | OB (30‐39.9) | SevOB (40) | ||
| ||||||
| Work RVU | 16.3 9.5 | 14.5 9.1 | 14.0 8.4 | 13.8 7.9 | 17.3 9.1 | <0.001 |
| Anesthesia time (hr) | 2.7 1.9 | 2.5 1.7 | 2.5 1.6 | 2.5 1.6 | 2.7 1.5 | <0.001 |
| Pre‐incision time (min) | 35.9 21.3 | 33.1 21.1 | 33.2 22.5 | 32.5 19.3 | 34.9 21.1 | <0.001 |
| Operation time (hr) | 1.8 1.6 | 1.6 1.4 | 1.7 1.4 | 1.7 1.4 | 1.8 1.2 | <0.001 |
| Transfused intra‐op | 12.8 | 7.1 | 5.3 | 4.4 | 2.9 | <0.001 |
| Superficial wound SSI | 2.9 | 2.5 | 2.6 | 2.8 | 3.1 | <0.001 |
| Deep wound SSI | 1.5 | 0.7 | 0.8 | 0.9 | 1.0 | <0.001 |
| Wound disruption | 1.5 | 0.6 | 0.6 | 0.6 | 0.7 | <0.001 |
| Post‐op sepsis | 5.7 | 2.9 | 2.2 | 2.1 | 2.0 | <0.001 |
| Septic shock | 3.1 | 1.7 | 1.3 | 1.2 | 1.1 | <0.001 |
| Reintubation | 3.8 | 1.8 | 1.2 | 1.0 | 1.0 | <0.001 |
| Delayed ventilator wean | 5.5 | 2.8 | 2.1 | 2.0 | 2.0 | <0.001 |
| Pneumonia | 4.3 | 2.1 | 1.3 | 1.2 | 1.2 | <0.001 |
| Cardiac arrest/CPR | 1.5 | 0.7 | 0.5 | 0.4 | 0.4 | <0.001 |
| Urinary tract infection | 3.4 | 1.8 | 1.5 | 1.6 | 1.6 | <0.001 |
| Post‐op ARF | 2.1 | 1.1 | 0.8 | 0.9 | 0.7 | <0.001 |
| Return to OR | 11.2 | 6.9 | 5.8 | 5.5 | 4.9 | <0.001 |
| Post‐op coma | 0.4 | 0.2 | 0.1 | 0.1 | 0.1 | <0.001 |
| Post‐op transfusion | 1.6 | 0.7 | 0.5 | 0.4 | 0.5 | <0.001 |
| Composite morbidities | 25.2 | 15.3 | 13.0 | 12.8 | 12.1 | <0.001 |
There was a negative association between BMI class and the likelihood of postoperative sepsis, septic shock, reintubation, delayed ventilator wean, and postoperative pneumonia. Similarly, the proportions of patients who developed postoperative acute renal failure, cardiac arrest, and those who required postoperative blood transfusion or needed reoperation, decreased significantly across the BMI classes, with the highest proportion of cases being in the underweight group and the lowest in the severely obese group. Overall composite morbidity was twice as high in the underweight compared to the severely obese group.
There were 1758 deaths among the study's 119,619 patients, resulting in an overall mortality rate of 1.5%. The overall major complication rate was 13.8%. The distribution of total mortality rate as well as mortality in patients with at least 1 major postoperative complication across BMI classes revealed consistent differences (Figure 1). Over the entire range of BMI classes, there was a progressive, stepwise decrease in the proportion of deaths with increasing BMI. This pattern also occurred among patients who developed at least 1 major postoperative complication, indicating a reduced likelihood of death after a major complication. This is reflective of a reduced likelihood of death after a major complication (failure to rescue) with increasing BMI.
Multivariate logistic regression defined a number of factors associated with 30‐day mortality (Table 4). The Hosmer and Lemeshow goodness‐of‐fit test for this model was not statistically significant (2 = 17.8, df = 8, P = 0.23). High ASA physical status was associated with high odds of mortality. Specifically, when controlling for the other covariates in the model, ASA status was associated with a 5‐fold increased relative odds of death (adjusted odds ratio [OR] = 5.30; 95% confidence interval = 4.96‐5.79, P < 0.001). Similarly, occurrence of 1 or more major postoperative complication was associated with 6‐fold increased relative odds of mortality. The paradoxical effect of BMI category observed on univariate analysis was maintained in the multivariate model. Specifically, underweight patients had the highest relative odds of mortality, while severely obese patients had the lowest, compared with patients at a healthy weight (Table 4). Interestingly, smoking had no significant effect on the odds of mortality after controlling for other factors. Similarly, the specific racial group and the timing of the surgical intervention had no significant effect on mortality.
| Variables in the equation | Coefficient () | Wald (2) | P Value | Odds Ratio | 95% CI |
|---|---|---|---|---|---|
| |||||
| ASA status III | 1.67 | 233.0 | <0.001 | 5.31 | 4.96‐5.79 |
| Emergency operation | 0.89 | 241 | <0.001 | 2.43 | 2.17‐2.72 |
| Reoperation | 0.77 | 155.9 | <0.001 | 2.10 | 1.91‐2.44 |
| Reintubation | 0.4 | 51.4 | <0.001 | 1.63 | 1.41‐1.82 |
| Dependent functional status | 1.2 | 422.5 | <0.001 | 3.44 | 3.01‐3.79 |
| Cumulative comorbidity* | 0.09 | 12.37 | <0.001 | 1.18 | 1.03‐1.14 |
| Major POP complication | 1.8 | 686.1 | <0.001 | 6.43 | 5.59‐7.39 |
| Age 65 yr | 0.56 | 95.3 | <0.001 | 1.75 | 1.56‐1.96 |
| Work RVU | 0.17 | 49.7 | <0.001 | 1.02 | 1.01‐1.02 |
| Severely obese | Reference | 1.00 | |||
| Underweight | 0.76 | 30.9 | <0.001 | 2.13 | 1.63‐2.78 |
| Normal BMI | 0.42 | 15.4 | <0.001 | 1.52 | 1.23‐1.87 |
| Overweight | 0.28 | 6.9 | 0.009 | 1.33 | 1.08‐1.65 |
| Obese | 0.19 | 2.86 | 0.091 | 1.20 | 0.97‐1.49 |
| Dyspnea | 0.41 | 40.0 | <0.001 | 1.51 | 1.33‐1.72 |
| Active CHF | 0.60 | 39.6 | <0.001 | 1.83 | 1.52‐2.21 |
| Chronic renal failure (dialysis) | 0.70 | 102.2 | <0.001 | 2.01 | 1.76‐2.30 |
DISCUSSION
In this large, study of minority surgical patients, the impact of BMI on the 30‐day morbidity and mortality was unexpected. The working hypothesis was that overweight and obese patients would have a worse outcome after surgery. However, contrary to this hypothesis, the lowest all‐cause mortality rate was found in the severely obese (BMI 40 kg/m2) group in both men and women. Death rates decreased progressively in a stepwise fashion from the underweight to the severely obese group. Similarly, even in patients who developed at least 1 major postoperative complication, the likelihood of death was still negatively associated with BMI. This negative association of mortality with BMI was observed despite the higher prevalence of chronic diseases, such as hypertension, diabetes, and dyspnea at rest, in the increasing BMI classes.
Controversy remains regarding the association between BMI and mortality, in particular about the shape of the curve for the association between BMI and mortality. Epidemiologic studies have variously described J‐shaped, U‐shaped, monotonic, or linear relationships.16, 17 In the surgical population, a reverse J‐shaped relationship between BMI category and mortality has been described.18, 19 Sometimes this is referred to as obesity paradox or reverse epidemiology: a trend whereby overweight and moderately obese patients have better outcomes and lower risk of death than leaner patients.18 This phenomenon is particularly well described in adult20 and elderly heart failure and hypertensive patients.21 Many of these studies either had very few minority patients,21 or mortality pattern was not analyzed along ethnic lines.
Few studies10 have focused exclusively on minority surgical patients. Some investigators have determined that high BMI in black adults may not be as important a risk factor for mortality6, 7 as in whites. Our data suggest that among minority surgical patients, the relationship appeared to be a downward trend in mortality from low to high BMI, thus revealing the obesity paradox. This pattern was evident even in patients who developed 1 major complication in the postoperative period, suggesting that high BMI also protects against failure to rescueor death after a major complication.
Despite decades of research, the mechanisms underlying the obesity paradox remain speculative.20, 22. Many have posited that adiposity may confer protection against cytokines and various inflammatory mediators in heart failure patients by the production of buffering lipoproteins.23, 24 It is conceivable that similar protection against inflammatory response to surgical tissue trauma is operational in minority patients with high BMI. Another possible reason for the obesity paradox is the clinical presentation and disease progression at the time of surgery. Perhaps, similar to the observation in obese patients with heart failure,25 obese minority patients are symptomatic at an earlier stage of their disease than lean patients, making for earlier diagnosis and treatment. Thus, obesity may simply be a marker of less severe disease at the time of presentation.
Obese patients may also be more aggressively monitored and treated in the perioperative period than lean patients, because of the general perception that they are a high‐risk group.10 This may partly explain the decreased likelihood of failure to rescue with increasing BMI in our patients. Increased vigilance and prompt treatment of complications should reduce the overall morbidity and mortality rate in this group. It is also conceivable that a therapeutic selection bias is operational in the patients we studied. This describes scenarios where relatively healthy obese minority patients were operated upon, while sicker, morbidly obese patients were denied surgery due to perceived prohibitive risks. However, we would have expected a higher proportion of severely obese patients to present for emergency surgery, which is contrary to our finding of the lowest incidence of emergency surgery in the severely obese group. It is also possible that severe obesity may be associated with a higher attrition rate, such that the extremely obese patients did not live long enough to present for surgery. This is somewhat likely, given the significantly younger age of the severely obese patients in our study cohort. It is, however, impossible to determine survival effect from a cross‐sectional hospital‐based study design. Clearly, mechanisms used to explain the obesity paradox in minority surgical patients are likely to remain speculative, owing to the interaction of several factors such as concomitant comorbidities, disease progression at the time of presentation, patients' weight history, and regional fat distribution.
The current study confirms the findings of previous investigators26 about the importance of reducing major postoperative complications in surgical patients. While this may seem axiomatic, it deserves reiteration because the risk of postoperative mortality increases considerably in all the BMI categories following 1 or more major postoperative complication. However, it is not clear why obese and morbidly obese patients had a lower incidence of failure to rescue. This may be related to greater physiologic reserve in the obese and morbidly obese group, especially because patients in the higher BMI groups were significantly younger than the normal weight or lean patients. For the same reason, these younger, severely obese patients may have been more aggressively monitored and treated, thereby increasing the likelihood of being rescued following a major complication. It is also possible that the lower proportion of emergency procedures performed in obese and severely obese groups was somewhat protective, especially because emergency surgery was an independent predictor of overall mortality in this cohort of patients. In fact, when we stratified the patients according to urgency of surgery and explored the bivariate relationship between BMI category and mortality (data not shown) among those undergoing urgent surgery, the geometrical distribution of mortality did show a reverse‐J pattern with the highest proportion of cases in the underweight group, declining in the normal BMI and overweight group, and increasing steadily in obese and severely obese group. To this end, caution should be exercised when interpreting the association of BMI group with postoperative mortality for procedures performed as an emergency.
Smoking and antecedent illness are 2 confounding factors commonly criticized in studies attempting to associated BMI with mortality. This is because smokers tend to weigh less and have higher mortality rates than nonsmokers. The present investigation did not find a significant contribution of smoking to mortality when other factors included in a logistic regression model were considered. The current study's findings are consistent with those of previous data in African American patients,27 and contrasts with the excess mortality described in currently smoking Caucasian men and women.28 It is possible that smoking is not an important effect modifier when considering the relevance of BMI to postoperative mortality in minority patients.
Study Limitations
Although considerable information on several perioperative variables existed, there was a lack of detailed, disease‐specific clinical information for the individual surgical procedures. Likewise, information was unavailable regarding the process of care, such as decision to operate, when to operate, and intraoperative and the postoperative care, which are some of the factors that may determine postoperative outcome. Similarly, we did not have information on surgical experience or hospital caseload, both of which are known to affect postoperative outcome.29
In addition, the anthropometric parameters used to calculate BMI for this study are self‐reported values. Although directly measured height and weight values are preferable for calculating BMI, previous studies have shown that correlations between BMI based on measured height and weight and that based on self‐report are typically greater than 0.9.30 Given the reported strong correlation between self‐reported and measured anthropometric parameters, the reporting error on the observed association between BMI and mortality in our study is likely minimal. The limitations of BMI as a measure of adiposity is well described.31, 32 This study had no information on body fat distribution, which has been shown to have a direct correlation with mortality when BMI did not.33 Additionally, documented weight may be less accurate in the extremely obese group in that they may not have been weighed, either at home or in the hospital, due to lack of adequate weighing scales.
Conclusions
This study demonstrated that among minority surgical patients, higher BMI categories were associated with lower risk of postoperative death. This relationship was maintained, even in patients who developed 1 or more postoperative major complications, such that obese and severely obese patients had better survival compared with underweight and healthy weight patients. Mechanisms underlying this paradoxical survival advantage deserve further elucidation. It is important to emphasize that our findings in no way diminish the long‐term dangers associated with excessive adiposity, but may serve to discard the preconceived notions that overweight and obese minority patients have poorer outcome after surgery than lean patients.
- ,,,.Increasing trends in waist circumference and abdominal obesity among US adults.Obesity.2007;15:216–224.
- ,,,,,.Prevalence of overweight and obesity in the United States, 1999–2004.JAMA.2006;295:1549–1555.
- ,,,,.Ethnic disparities in stroke epidemiology, acute care, and post‐acute outcomes.Stroke.2005;36:374–387.
- ,,,,,.Body mass index and body girths as predictors of mortality in black and white women.Arch Intern Med.1992;152:1257–1262.
- ,,,,,.Relative weight and mortality in U.S. blacks and whites: findings from representative national population samples.Ann Epidemiol.1997;7:383–395.
- ,,,,.Body‐mass index and mortality in a prospective cohort of U.S. adults.N Engl J Med.1999;341:1097–1105.
- ,,, et al.Body mass index and body girths as predictors of mortality in black and white men.Am J Epidemiol.1992;135:1137–1146.
- ,,.Morbidity in obese and non‐obese patients following gynecologic surgery for cancer.J Natl Med Assoc.1988;80:417–420.
- ,,, et al.The influence of obesity on perioperative morbidity: retrospective study of 502 aorto‐coronary bypass operations.Thorac Cardiovasc Surg.1992;40:126–129.
- ,,,,.The impact of high body mass index on postoperative complications and resource utilization in minority patients.J Natl Med Assoc.2011;103:9–15.
- ,,, et al.The patient safety in surgery study: background, study design, and patient populations.J Am Coll Surg.2007;204:1089–1102.
- ,,, et al.The assessment of the reliability of data collected for the Department of Veterans Affairs' National Surgical Quality Improvement Program (NSQIP).J Am Coll Surg.2007;204:550–560.
- Expert Panel on the Identification, Evaluation, and Treatment of Overweight in Adults. Clinical guidelines on the identification, evaluation, and treatment of overweight and obesity in adults: executive summary.Am J Clin Nutr.1998;68:899–917.
- ,,,.Hospital and patient characteristics associated with death after surgery: a study of adverse occurrence and failure to rescue.Med Care.1992;30:615–629.
- ,,,.Multivariate Data Analysis.5th ed.London:Prentice Hall International;1998.
- ,,,,,.Estimating the number of deaths due to obesity: can the divergent findings be reconciled?J Women's Health.2007;16(2):168–176.
- ,,, et al.Body mass index and mortality among US male physicians.Ann Epidemiol.2004;14/10:731–739.
- ,,.The obesity paradox: body mass index and outcomes in patients undergoing non‐bariatric general surgery.Ann Surg.2009;250:166–172.
- ,,,,,.The influence of body mass index obesity status on vascular surgery 30‐day morbidity and mortality.J Vasc Surg.2009;49:140–147.
- ,,, et al.Risk factor paradox in wasting diseases.Curr Opin Clin Nutr Metab Care.2007;10:433–442.
- ,,, et al.The relationship between obesity and mortality in patients with heart failure.J Am Coll Cardiol.2001;38:789–795.
- ,.Reverse epidemiology beyond dialysis patients: chronic heart failure, geriatrics, rheumatoid arthritis, COPD, and AIDS.Semin Dial.2007;20:549–553.
- ,,.The endotoxin‐lipoprotein hypothesis.Lancet.2000;356:930–933.
- ,,, et al.Adiponectin and cardiovascular disease: state of the art?Am J Physiol Heart Circ Physiol.2007;292:H1655–H1663.
- ,,,.Body composition and prognosis in chronic systolic heart failure: the obesity paradox.Am J Cardiol.2003;91:891–894.
- ,,.Variation in hospital mortality associated with inpatient surgery.N Engl J Med.2009;361:1368–1375.
- ,,.Body mass index and 15‐year mortality in a cohort of black men and women.J Clin Epidemiol.1990;43:949–960.
- ,,.Thinness and mortality.Am J Public Health.1987;77:317–322.
- ,,.Operative mortality and procedure volume as predictors of subsequent hospital performance.Ann Surg.2006;243:411–417.
- .Nutritional Epidemiology.2nd ed.Monographs in Epidemiology and Biostatistics; vol30.New York:Oxford University Press,1998:514.
- ,,, et al.Association of general and abdominal obesity with multiple health outcomes in older women: the Iowa Women's Health study.Arch Intern Med.2000;160:2117–2128.
- ,,.Does body mass index adequately capture the relation of body composition and body size to health outcomes?Am J Epidemiol.1998;147:167–172.
- ,,,.Intra‐abdominal adiposity, abdominal obesity, and cardio‐metabolic risk.Eur Heart J Suppl.2008;10(suppl B):B4–10.
Copyright © 2011 Society of Hospital Medicine
