User login
Transferring “Boarders” Could Save Millions
A pilot project that transferred “boarded” patients from one hospital’s ED to an inpatient bed at another nearby hospital in the same health system suggests that the concept could save hospitals millions.
“Improvement in Emergency Department Treatment Capacity: A Health System Integration Approach” was the subject of an oral presentation at HM11 in Dallas. Lead researcher Diego Martinez-Vasquez, MD, MPH, FACP, CPE, medical director for clinical resource utilization at Franklin Square Hospital Center in Baltimore, conducted the research in the University of Maryland medical system.
In the project, 265 patients who consented were transferred 1.3 miles to a sister hospital. Without “boarders”—admitted patients held in the ED—Dr. Martinez-Vasquez’s team found that the referring hospital could have regained enough capacity for an additional 2.9 patients per day. The project also showed median net revenue of $520,000 for the referring hospital and $1.9 million for the accepting hospital.
“The hospitalist group at the receiving hospital was the instrument that facilitated this program,” Dr. Martinez-Vasquez says. “But really what kept my attention was that healthcare systems sometimes don’t use resources effectively. So when I looked at the problem that this particular hospital was having regarding increased boarding time and decreased treatment capacity, I said, ‘Well, one way to resolve this issue is to develop a process that connects two system hospitals and their bed resources.’ ”
High-Performing Hospitals Invest in QI Infrastructure
A new study evaluating outcomes for hospitals participating in the American Heart Association’s Get with the Guidelines program found no correlation between high performance on adhering to measures and care standards for acute myocardial infarction and for heart failure despite overlap between the sets of care processes (J Am Coll Cardio. 2011;58:637-644).
A total of 400,000 heart patients were studied, and 283 participating hospitals were stratified into thirds based on their adherence to core quality measures for each disease, with the upper third labeled superior in performance. Lead author Tracy Wang, MD, MHS, MSc, of the Duke Clinical Research Institute in Durham, N.C., and colleagues found that superior performance for only one of the two diseases led to such end-result outcomes as in-hospital mortality that were no better than for hospitals that were not high performers for either condition. But hospitals with superior performance for both conditions had lower in-hospital mortality rates.
“Perhaps quality is more than just following checklists,” Dr. Wang says. “There’s something special about these high-performing hospitals across the board, with better QI, perhaps a little more investment in infrastructure for quality.”
This result, Dr. Wang says, should give ammunition for hospitalists and other physicians to go to their hospital administrators to request more investment in quality improvement overall, not just for specific conditions.
Joint Commission Launches Certification for Hospital Palliative Care
A new Joint Commission program offering advanced certification for hospital-based palliative-care services is accepting applications and conducting daylong surveys through the end of this month. As with the Joint Commission’s reviews of other specialty services (e.g. primary stroke centers), certification is narrower in scope, with service-specific evaluation of care and outcomes, than a full accreditation survey—which is an organizationwide evaluation of core processes and functions.
Advanced certification in palliative care is voluntary for the steadily growing number of acute-care hospitals offering palliative-care services (1,568, according to the latest count by the American Hospital Association), but the hospital seeking it must be accredited by the Joint Commission.1 Certification is intended for formal, defined, inpatient palliative care, whether dedicated units or consultation services, with the ability to direct clinical management of patients.
The core palliative-care team includes “licensed independent practitioners” (typically physicians), registered nurses, chaplains, and social workers.2 The service should follow palliative-care guidelines and evidence-based practice, and it must collect quality data on four performance measures—two of them clinical—and use these data to improve performance.
According to Michelle Sacco, the Joint Commission’s executive director for palliative care, evidence-based practice includes ensuring appropriate transitions to other community resources, such as hospices. She thinks the program is perfect for hospitalists, as HM increasingly is participating in palliative care in their hospitals. “This is also an opportunity to change the mindset that palliative care is for the end-stage only,” Sacco says.
Two-year certification costs $9,655, including the onsite review. For more information, visit the Joint Commission website (www.jointcommission.org/certification) or the Center to Advance Palliative Care’s site (www.capc.org).
References
- Palliative care in hospitals continues rapid growth for 10th straight year, according to latest analysis. Center to Advance Palliative Care website. Available at: www.capc.org/news-and-events/releases/07-14-11. Accessed Aug. 30, 2011.
- The National Consensus Project’s Clinical Practice Guidelines for Quality Palliative Care. The National Consensus Project website. Available at: www.nationalconsensusproject.org/. Accessed Aug. 31, 2011.
PET Scans Key to Less Radiation for Hodgkin's Lymphoma
MIAMI BEACH – Patients with Hodgkin’s lymphoma may be spared additional radiotherapy following chemotherapy if they have a negative positron-emission tomography result, investigators from the German Hodgkin Study Group reported.
The negative predictive value for FDG (18fluorodeoxyglucose)–PET at 1 year was 94%, said Dr. Rolf P. Mueller of the University of Cologne (Germany). Among patients who had residual tumors measuring 2.5 cm or greater in diameter following chemotherapy, only 4% of those who were negative for residual disease on FDG-PET scans relapsed or required additional radiotherapy, compared with 11% of FDG-PET–positive patients.

"Thus, only those advanced-stage Hodgkin lymphoma patients with residual disease who are PET-positive patients might need additional radiotherapy," Dr. Mueller said at the annual meeting of the American Society of Radiation Oncology (ASTRO).
The investigators also found a significant difference in time-to-progression favoring PET-negative patients (P =.008) with Hodgkin’s lymphoma, also known as Hodgkin’s disease.
The percentage of patients who received radiation in this clinical trial, designated GHSG (German Hodgkin Study Group) HD-15, was 11%, compared with 70% of patients in the group’s GHSG-9 trial, Mueller noted. GHSG-15 studied the role of FDG-PET for evaluating residual disease and relapse risk among patients with advanced-stage Hodgkin’s lymphoma who had undergone six to eight cycles of chemotherapy with the BEACOPP regimen (bleomycin, etoposide, doxorubicin, cyclophosphamide, vincristine, procarbazine, and prednisone) (J. Clin. Oncol. 2003;21:1734-9).
Early results were published in 2008 (Blood 2008;112: 3989-94). In the current report, Mueller presented data on a larger cohort.
All patients with a partial response or better and a residual mass measuring 2.5 cm or greater received FDG-PET scans. Of the 728 patients with residual disease following BEACOPP, 540 (74.2%) were PET negative, and 188 were PET positive. Mueller presented data on 701 patients who had at least 1 year of follow-up.
At 1 year, 96% (522) of PET-negative patients had neither progression nor relapse, compared with 11% of those who were PET positive. Of the PET-negative patients, 23 experienced disease progression (eight in the residual mass, six with new disease outside of the mass, and nine with progression/relapse in both areas). An additional eight PET-negative patients required additional radiotherapy.
The study was funded by the member centers of the GSHG. Dr. Mueller had no conflict of interest disclosures.
MIAMI BEACH – Patients with Hodgkin’s lymphoma may be spared additional radiotherapy following chemotherapy if they have a negative positron-emission tomography result, investigators from the German Hodgkin Study Group reported.
The negative predictive value for FDG (18fluorodeoxyglucose)–PET at 1 year was 94%, said Dr. Rolf P. Mueller of the University of Cologne (Germany). Among patients who had residual tumors measuring 2.5 cm or greater in diameter following chemotherapy, only 4% of those who were negative for residual disease on FDG-PET scans relapsed or required additional radiotherapy, compared with 11% of FDG-PET–positive patients.
"Thus, only those advanced-stage Hodgkin lymphoma patients with residual disease who are PET-positive patients might need additional radiotherapy," Dr. Mueller said at the annual meeting of the American Society of Radiation Oncology (ASTRO).
The investigators also found a significant difference in time-to-progression favoring PET-negative patients (P =.008) with Hodgkin’s lymphoma, also known as Hodgkin’s disease.
The percentage of patients who received radiation in this clinical trial, designated GHSG (German Hodgkin Study Group) HD-15, was 11%, compared with 70% of patients in the group’s GHSG-9 trial, Mueller noted. GHSG-15 studied the role of FDG-PET for evaluating residual disease and relapse risk among patients with advanced-stage Hodgkin’s lymphoma who had undergone six to eight cycles of chemotherapy with the BEACOPP regimen (bleomycin, etoposide, doxorubicin, cyclophosphamide, vincristine, procarbazine, and prednisone) (J. Clin. Oncol. 2003;21:1734-9).
Early results were published in 2008 (Blood 2008;112: 3989-94). In the current report, Mueller presented data on a larger cohort.
All patients with a partial response or better and a residual mass measuring 2.5 cm or greater received FDG-PET scans. Of the 728 patients with residual disease following BEACOPP, 540 (74.2%) were PET negative, and 188 were PET positive. Mueller presented data on 701 patients who had at least 1 year of follow-up.
At 1 year, 96% (522) of PET-negative patients had neither progression nor relapse, compared with 11% of those who were PET positive. Of the PET-negative patients, 23 experienced disease progression (eight in the residual mass, six with new disease outside of the mass, and nine with progression/relapse in both areas). An additional eight PET-negative patients required additional radiotherapy.
The study was funded by the member centers of the GSHG. Dr. Mueller had no conflict of interest disclosures.
FROM THE ANNUAL MEETING OF THE AMERICAN SOCIETY FOR RADIATION ONCOLOGY
Major Finding: FDG-PET scans following chemotherapy in patients with advanced-stage Hodgkin’s lymphoma have a negative predictive value of 94%.
Data Source: The prospective GHSG HD-15 trial involving 701 patients.
Disclosures: The study was funded by the GSHG. Dr. Mueller had no conflict of interest disclosures.
Academic Hospitalists Gear Up for Learning
The challenges of academic HM are different from other sectors of the specialty. Academic hospitalists, division chiefs, and administrators at academic teaching hospitals contend with the pressure of receiving grants, presenting at grand rounds, and reserving time for research and educational projects.
While it can be overwhelming, especially for academic hospitalists early in their careers, the Academic Hospitalist Academy helps untangle those challenges and turn them into long-term professional opportunities. Hosted jointly by SHM, the Society of General Internal Medicine (SGIM), and the Association of Chiefs and Leaders of General Internal Medicine (ACLGIM), the academy is a three-day course dedicated to education, scholarship, and professional success for academic hospitalists.
In addition to helping them become better hospitalists, Academic Hospitalist Academy uses didactic sessions, small-group exercises, and other interactive techniques to help academic hospitalists become better teachers, create and publish scholarly work, and get first in line for promotions.
Now in its third year, Academic Hospitalist Academy is consistently met with rave reviews from attendees. According to evaluations from the 2010 academy, attendees unanimously felt the course was worth their time and money; 99% said they would recommend it to a colleague.
HM12 Research and Award Submissions Deadline Nears
Hospitalists interested in promoting their research still have time to submit applications for SHM’s Research, Innovation, and Clinical Vignettes (RIV) competition. RIV abstracts will be presented at HM12 in San Diego.
SHM also is accepting nominations for its annual awards program, which honors hospitalists who demonstrate excellence in clinical work, teaching, scholarly research, and service to the specialty.
Applications for both programs can be obtained at www.hospitalmedicine.org. The deadline for SHM’s annual award submissions is Nov. 1; applications for RIV abstracts will be accepted until Dec. 1.
Both sets of awards will be presented live on stage at HM12.
The annual awards often are a precursor to even more prestige within the specialty. In 2005, SHM’s immediate past president Jeff Wiese, MD, SFHM, FACP won the “Excellence in Teaching” award, SHM president Joseph Ming-Wah Li, MD, SFHM, won for “Outstanding Service in Hospital Medicine,” and SHM president-elect Shaun Frost, MD, won for “Clinical Excellence.”
How Hospitalists Can Team with Nursing to Improve Patient Care
Establishing mutual respect and trust between hospitalists and nurses is an important part of ensuring patient safety, whether you’re on your first job or your 20th, says Angela Beck, RN, director of critical-care services at Nebraska Medical Center in Omaha.
“Nurses are important coordinators of care,” she says. “Recognizing and valuing nurses for that is truly the most important thing for the patient, and can also help hospitalists build relationships.”
Key Partners
Forming a collaborative relationship with the nursing service might depend on where you start. At Northwestern Memorial Hospital in Chicago, the nursing service enjoys a “close and collaborative relationship” with hospitalists, according to Kristin Ramsey, RN, MSN, MPPM, NE-BC, associate chief nurse and executive director of operations. New hospitalists are oriented to the care-delivery models on the inpatient care units. In addition, hospitalists are acculturated into the hospital’s coleadership model.
“We have partnered with our hospitalists to create a model in which the physician and nurse leader collaboratively lead the development of multidisciplinary, subspecialty teams to ensure quality outcomes,” Ramsey says. “The model is so successful with the hospitalists that we are now extending it to other areas in the organization.”
Round Sharing
Absent a formalized training protocol for partnering with nursing, hospitalists still can learn a great deal by listening to and communicating with the nursing staff, says Connie Ogden, RN, MSN, NEA-BC, executive director of adult acute services at Nebraska Medical Center. “Nurses are there around the clock caring for patients and may have a different insight” about patients’ evolving conditions, she says.
Care for the patient improves if everyone is on the same page, Ogden adds. That’s why it makes sense, she says, to include nurses during rounds. Beck agrees: “If nurses aren’t there to hear how the plan of care comes about, there is no reason to believe they can effectively describe it once the physician turns around and walks away to see another patient.”
In critical-care units, according to Beck, nurses can function as a bridge between patients and physicians. For example, they can help patients define and express their goals. Some of these goals can be incremental, she notes, such as “I really want to get out of bed this afternoon,” or “I really want my family here to listen to this message.”
Different Role, Same Goal
As director of adult acute services, Ogden often receives complaints from physicians about calls they receive from nurses. Often, these calls emanate from a concern for the patient (e.g. a 2 a.m. call for a Tylenol order to address a headache) or from the requirement that nurses follow policy and clarify orders. If hospitalists understand the back story of the call, their perception of its purpose can change.
Although there have been strides toward better nurse-physician collaboration, “we still have a lot of opportunities for improvement,” Beck asserts.
Establishing mutual respect and trust is not an overnight accomplishment. As Ogden explains, physicians and nurses have different roles, but they share the same goal: quality outcomes in patient care.
Gretchen Henkel is a freelance writer based in southern California.
Best Ways to Improve Hospitalist-Nursing Collaboration
“A good portion of nurses are relationship builders,” says Beck, director of critical-care services at Nebraska Medical Center. She urges hospitalists on a new job to just “be physically present, in the beginning, on inpatient units” whenever possible. “Acting like you care is really important, and nurses will respond to that,” she says. “You can create an environment in which nurses’ feedback is valued.”
She also recommends, especially for new hospitalists, Dr. Peter J. Pronovost’s three-part talk “The Science of Safety,” delivered to incoming residents at Johns Hopkins University Medical Center in Baltimore, where Dr. Provonost is medical director of the quality and safety research group.—GH
Cost‐Related Medication Underuse
The affordability of prescription medications continues to be one of the most pressing public health issues in the United States. Many patients reduce their prescribed doses to make medications last longer or do not fill prescriptions because of cost.1 Cost‐related medication underuse affects patients with and without drug insurance coverage,2 and is likely to become even more problematic as employers scale back on drug benefits3 and drug prices continue to increase.4 The landmark Patient Protection and Affordability Act passed in March 2010 does little to address this issue.5
Existing estimates of cost‐related medication underuse come largely from surveys of ambulatory patients. For example, using data from the Medicare Current Beneficiary Survey, Maden et al. estimated that 11% to 15% of patients reduced medication use in the past year because of cost.6 Tseng and colleagues found very similar rates of cost‐related underuse in managed care beneficiaries with diabetes.7
Hospitalized patients, who have a high burden of disease and tend to use more medications than their ambulatory counterparts, may be particularly vulnerable to cost‐related underuse but, thus far, have been subject to little investigation. New medications, which are frequently prescribed at the time of discharge, may exacerbate these issues further and contribute to preventable readmissions. Accordingly, we surveyed a cohort of medical inpatients at a large academic medical center to estimate the prevalence and predictors of cost‐related medication underuse for hospitalized managed care patients, and to identify strategies that patients perceive as helpful to make medications more affordable.
METHODS
Study Sample
We identified consecutive patients newly admitted to the general medicine, cardiology, or oncology services at Brigham and Women's Hospital from November 2008 to December 2009. For our survey, we included only those patients who received medical benefits through 1 of 3 large insurers with whom our hospital has pay‐for‐performance contracts. Annually, there are approximately 4000 patients covered by these insurers admitted to the 3 clinical services we evaluated, We focused on patients who had a primary care physician at one of the hospital's outpatient practices because of the existence of an automated infrastructure to identify these managed care beneficiaries of these insurers who are newly hospitalized, and because patients covered by commercial insurance plans likely represent a conservative lower‐bound of cost‐related medication underuse among hospitalized patients.
Patients were surveyed on the first non‐holiday weekday after admission. We excluded patients who had been discharged prior to the daily admission list being generated, or who, on a previous admission, had completed our survey or declined to be surveyed. We also excluded several patients who were not beneficiaries of the target insurers and were erroneously included on the managed care admission roster.
Potentially eligible patients were approached on the hospital ward by 1 of 3 study care coordinators (2 nurses and 1 pharmacist) and were asked if they were willing to participate in a research project about medication use that involved a short verbally delivered in‐person (inpatient) survey, a brief postdischarge telephone call, and a review of their electronic health record. The Institutional Review Board of Brigham and Women's Hospital approved this study.
Inpatient Survey
Our survey instrument was developed iteratively and pilot‐tested to improve face validity. Questions about cost‐related underuse were based on validated measures.8, 9 Specifically, we asked whether in the past year patients had: (1) not filled a prescription because it was too expensive, (2) skipped doses to make medicines last longer, (3) took less medicine than prescribed to make the medicine last longer, or (4) split pills to make the medication last longer.
Questions about strategies to improve medication affordability assessed whether patients thought it would be helpful to: (1) discuss medication affordability with healthcare workers (inpatient doctors, outpatient doctors, nurses, pharmacists, or social workers); (2) have their medications reviewed by a nurse or pharmacist; (3) receive information about lower cost but equally effective medication options, or about programs that provide medications at reduced costs; and/or (4) have their copayments/coinsurance lowered. Possible responses to all of these questions were binary, ie, yes or no.
In addition, patients were asked about the nature of their drug insurance coverage, the prescription medications that they currently use, whether they know their copayment levels (for generic and brand‐name medications), and, if so, what these amounts were, their annual household income, and their self‐identified race. Information on patient age, gender, and the primary reason for hospitalization was obtained from the electronic health record. This source was also used to verify the accuracy of the self‐reported preadmission medication list. When there were discrepancies between preadmission medications reported by patients and those recorded in their chart, the later was used because our hospital reconciles and records all medications at the time of hospital admission for all patients.
Postdischarge Survey
Within 3 days of discharge, patients were contacted by telephone and asked about new medications they were prescribed on discharge, if any. The discharge summary was used to verify the accuracy of the information provided by patients. The interviewers clarified any apparent discrepancies between the 2 sources of information with the patient. Patients who had been prescribed a new medication were asked whether or not they had filled their prescription. For patients who had, we asked whether: (1) they knew how much they would have to pay prior to going to the pharmacy, (2) they had discussed less expensive options with their pharmacist, and (3) they had discussed medication costs with their inpatient or outpatient physicians.
Data Analysis
We used descriptive statistics to summarize the characteristics of our respondents and our overall survey results. We generated univariate and multivariable logistic regression models to identify whether prehospitalization cost‐related medication underuse was influenced by patient age, gender, income, race, and the number of medications patients used on a regular basis. For the purpose of these analyses, we classified patients as reporting cost‐related underuse if they responded yes to any of the 4 strategies described above (ie, not filling medications, skipping doses, taking less medication, or splitting pills to make medicines last longer). Patients whose incomes were above the median level in our cohort were categorized as being of high‐income. Our multivariable model had a c‐statistic of 0.75, suggesting good discriminative ability.
RESULTS
During the study period, 483 potentially‐eligible patients were admitted to the general medicine, cardiology, and oncology services. We excluded 167 because they had been discharged prior to being identified, had been surveyed or already declined participation on a prior admission, or were not managed care enrollees (see Appendix A). Of the remaining 316 subjects, 130 participated in the inpatient survey (response rate = 41%); 93 (75%) of these patients were reached by telephone after hospital discharge and completed the postdischarge survey. The baseline characteristics of our respondents are presented in Table 1. Patients had a mean age of 52 years, were 50% male and two‐thirds of white race, represented a range of household incomes, and almost all had employer‐sponsored prescription coverage. Prior to admission, patients took an average of 5 prescription medications and paid an average copayment of $10.80 and $21.60 for each generic and brand‐name prescription, respectively.
| Characteristic | N = 130 |
|---|---|
| |
| Age, mean years (SD) | 52 (11.2) |
| Male, % | 65 (50.0) |
| Race/ethnicity,* n (%) | |
| Caucasian/white | 84 (67.2) |
| Black/African American | 20 (16.0) |
| Latino/Hispanic | 13 (10.4) |
| Asian | 3 (2.4) |
| American Indian or Alaska Native | 1 (0.8) |
| Other | 4 (3.2) |
| Annual household income,* n (%) | |
| <$30,000 | 15 (12.8) |
| $30,000‐$75,000 | 49 (41.9) |
| >$75,000 | 53 (45.3) |
| Insurance coverage for outpatient prescription drugs,* n (%) | |
| Employer or spouse's employer | 123 (96.0) |
| Independent | 5 (3.9) |
| Medication copayments,* mean $ (SD) | |
| Brand‐name medications | 21.6 (14.2) |
| Generic medications | 10.8 (6.0) |
| No. of medications prior to admission, mean (SD) | 5.5 (4.3) |
| Category of discharge diagnosis, n (%) | |
| Cardiovascular | 40 (30.8) |
| Gastrointestinal | 23 (17.7) |
| Pulmonary | 23 (17.7) |
| Infectious | 13 (10.0) |
| Oncology | 5 (3.8) |
| Renal | 6 (4.6) |
| Psychiatric | 3 (2.3) |
| Hematologic | 4 (3.1) |
| Neurologic | 5 (3.8) |
| Musculoskeletal | 5 (3.8) |
| Respiratory | 2 (1.5) |
| Endocrine | 1 (0.8) |
Cost‐Related Medication Underuse
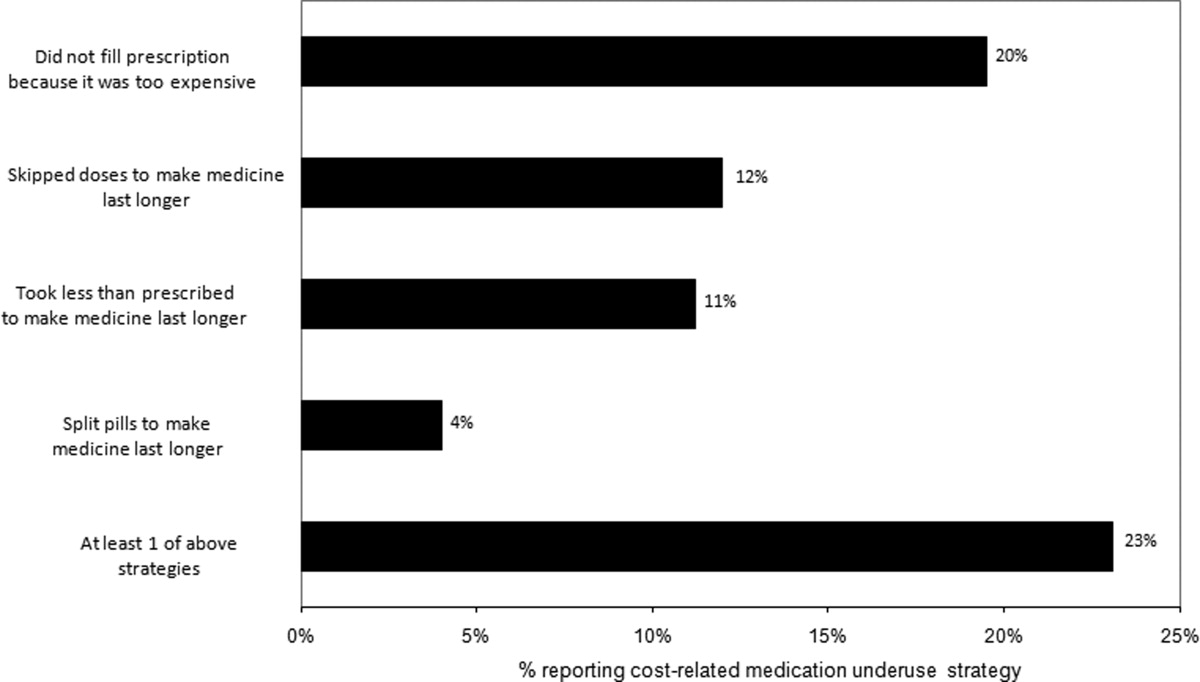
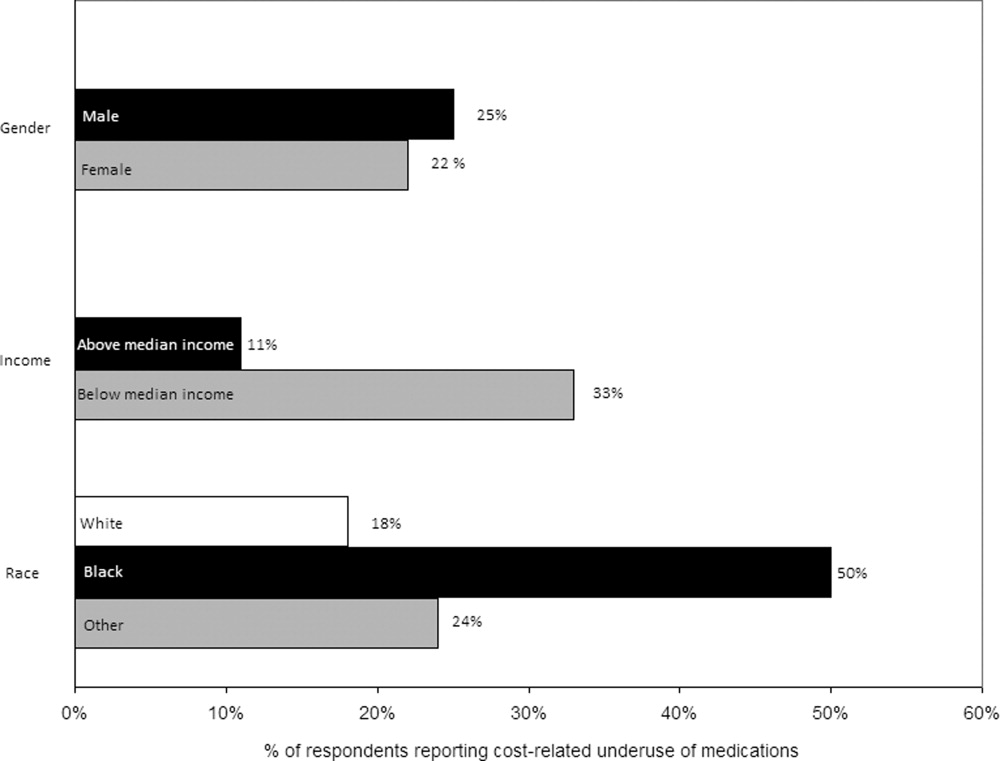
Thirty (23%) of the survey respondents reported at least 1 cost‐related medication underuse strategy in the year prior to their hospital admission (Figure 1), most commonly not filling a prescription at all because of cost (n = 26; 20%). Rates of cost‐related underuse were highest for patients of black race, low income, and women (Figure 2).
In unadjusted analyses, black respondents had 4.60 (95% confidence interval [CI], 1.63 to 13.0) times the odds of reporting cost‐related underuse than non‐Hispanic white respondents (Table 2). The association of black race and cost‐related underuse appears to be confounded, in part, by income (adjusted odds ratio for black race was 4.16; 95% CI, 1.34 to 12.86) and the number of medications patients used on a regular basis (adjusted odds ratio for black race was 4.14; 95% CI, 1.44 to 11.96). After controlling for these variables, as well as age and gender, the relationship between race and cost‐related underuse remained statistically significant (adjusted odds ratio 3.39; 95% CI, 1.05 to 11.02) (Table 2).
| Predictor | Unadjusted Odds Ratio (95% CI) | Adjusted Odds Ratio (95% CI) |
|---|---|---|
| ||
| Age (per additional year) | 0.98 (0.941.02) | 0.97 (0.931.01) |
| Male (vs female) | 0.84 (0.371.90) | 1.03 (0.432.48) |
| Race (vs white race) | ||
| Black | 4.60 (1.6313.0) | 3.39 (1.0511.02) |
| Other | 1.10 (0.363.37) | 0.77 (0.202.99) |
| No. of medications (per additional medication) | 1.10 (1.001.20) | 1.10 (1.001.22) |
| High income (vs low income) | 0.62 (0.271.42) | 0.71 (0.242.07) |
Strategies to Help Make Medications More Affordable
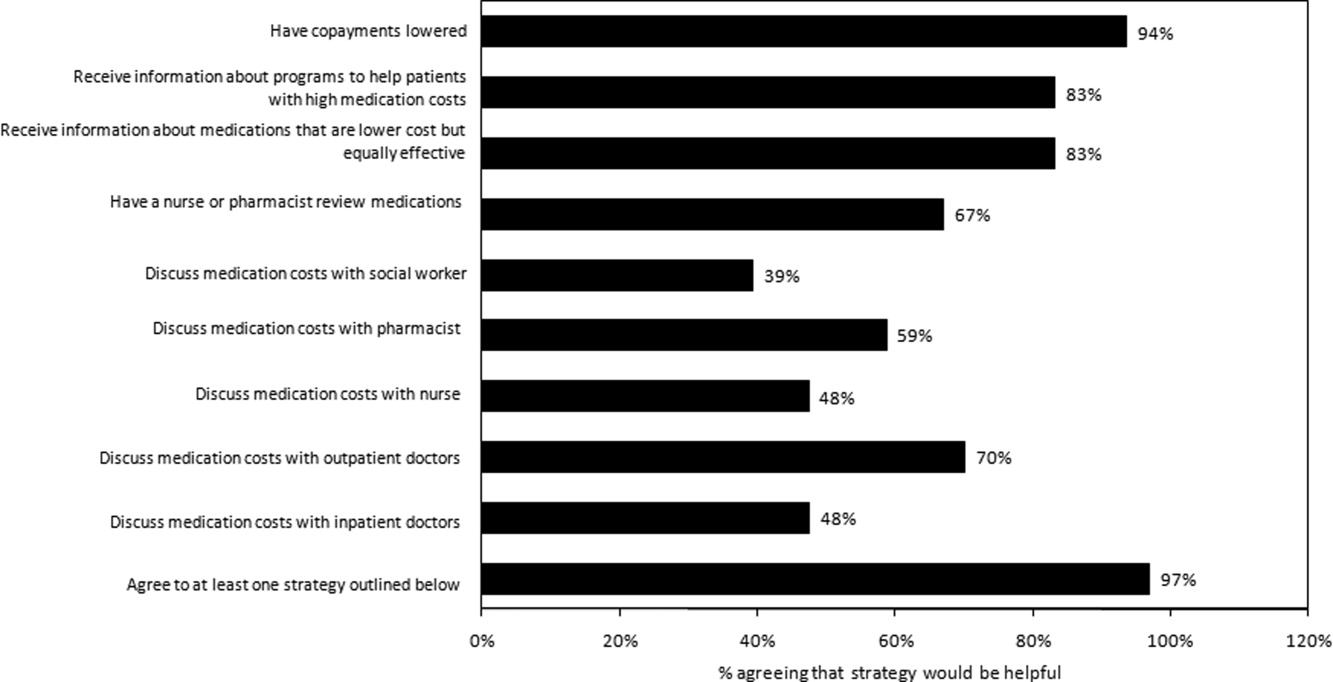
Virtually all respondents (n = 123; 95%) endorsed at least one of the proposed strategies to make medications more affordable (Figure 3). A majority felt that lowering cost sharing (94%), or receiving information about lower‐cost medication options (83%) or programs to subsidize medication costs (83%) would be helpful. Approximately 70% of patients stated that speaking to their outpatient physicians might be helpful, although only 14% reported actually speaking with their primary care provider about medication costs in the past year. Results were mixed for other strategies, including speaking with their inpatient physicians.
Postdischarge Medication Use
Seventy‐six (82%) respondents to the outpatient survey were prescribed a new medication at the time of hospital discharge, and virtually all (95%) had filled prescriptions for these medications by the time of the follow‐up survey. Patients paid an average of $27.63 (standard deviation $39.24) in out‐of‐pocket costs for these medications. Few (16%) patients knew how much they would have to pay before they had gone to the pharmacy to fill their prescription (see Appendix B). Even fewer patients asked, or were spoken to by their pharmacist, about less expensive medication options (7%), and almost none had spoken to their inpatient (4%) or outpatient providers (2%) about the cost of their newly prescribed drugs.
DISCUSSION
Almost a quarter of the medical inpatients we surveyed had not filled a medication because of cost, or had skipped doses, reduced dosages, or split pills to make their medicines last longer in the prior year. This amount is larger than that found in many prior studies, conducted in outpatient settings, in which 11% to 19% of patients report cost‐related underuse.68, 10, 11 Our results are particularly striking considering that our study cohort consisted exclusively of patients with commercial health insurance, the vast majority of whom also had employer‐sponsored drug coverage. Cost‐related medication underuse may be even more prevalent among hospitalized patients with less generous benefits, including the uninsured and perhaps even beneficiaries of Medicare Part D.
Reductions in medication use because of cost were particularly high among black patients, whose odds of reporting cost‐related underuse were more than 3 times higher than that of patients of non‐Hispanic white race. Race‐related differences in cost‐related underuse have been observed in outpatient studies,68, 12 and may be an important contributor to racial disparities in evidence‐based medication use.1315 These differences may, in part, reflect racial variations in socioeconomic status; lower income patients, who are more likely to be from a racial or ethnic minority, are more sensitive to cost sharing than higher income individuals.16 Consistent with this, the relationship between race and cost‐related underuse in our study was smaller but still highly significant in multivariable models that adjusted for income.
Not surprisingly, the underuse of effective prescription medications is associated with adverse clinical and economic consequences.17 Heisler et al. found that patients who had restricted medications because of cost were 76% more likely to report a decline in their health status than those who had not.18 The health effects of cost‐related underuse are likely to be particularly significant for hospitalized patients, given their high burden of disease and the frequency with which they are prescribed medications at discharge to treat the condition that led to their initial hospitalization. Thus, targeting efforts to address cost‐related underuse patients who are hospitalized may be an efficient method of improving patient health and reducing preventable readmissions. This is consistent with efforts that address, in the inpatient setting, other health issues that are commonly encountered in the ambulatory arena, such as immunizations and smoking cessation.19
Our survey respondents endorsed numerous strategies as being potentially helpful. Predictably, support for lowering copayments was extremely high. While this may not be practical or even desirable for some medications, lowering copayments for highly effective medications, such as statins and antihypertensives, in the context of value‐based insurance design, is an increasingly adopted strategy that has the potential to simultaneously improve clinical outcomes and reduce overall health spending.20, 21
While the majority of patients felt that talking to their outpatient physicians or pharmacists about medication costs might be helpful, the effectiveness of this strategy is unclear. Consistent with prior results,22, 23 the vast majority of the patients we surveyed had not discussed medication costs prior to their admission or after filling newly prescribed medications. Further, although physicians could help reduce drug expenditures in a variety of ways, including the increased ordering of generic drugs,24 many physicians are uncomfortable talking to their patients about costs,25 have limited knowledge about their patients' out‐of‐pocket expenditures, feel that addressing this issue is not their responsibility,26 or do not have resources, such as electronic formulary information, that could facilitate these discussions in an efficient manner.
An alternative strategy may be to provide patients with better education about medication costs. Virtually none of the patients we surveyed knew how much they would pay for their new prescriptions before visiting the pharmacy. These findings are similar to those observed in the outpatient setting,27 and suggest an opportunity to provide patients with information about the cost of their newly and previously prescribed drugs, and to facilitate discussions between patients and inpatient providers about predischarge prescribing decisions, in the same spirit as other predischarge patient education.28 Of course, issues related to transitions of care between the hospital and community setting, and coordination between inpatient and outpatient providers, must be adequately addressed for this strategy to be effective.
Our study has several notable limitations. It had a relatively small sample size and low response rate. Respondents may have differed systematically from non‐respondents, and we were unable to compare the characteristics of both populations. Further, we studied commercially insured inpatients on internal medicine services at an academic medical center, and thus our results may not be generalizable to patients hospitalized in other settings, or with different types of insurance coverage, including the uninsured. The primary outcome of our study was to determine self‐reported cost‐related underuse. While we used validated measures,8 it is possible that patients who reported reducing their medication use in response to cost may not have actually done so. We did not collect information on education or health literacy, nor did we have access to detailed information about our respondents' pharmacy benefit design structures; these important factors may have confounded our analyses, and/or may have been mediators of our observed results, and should be evaluated further in future studies. We did not have adequate statistical power to evaluate whether patients using specific classes of medications were particularly prone to cost‐related underuse.
Despite these limitations, our study is the first, to our knowledge, to evaluate the impact of medication costs on use in a cohort of hospitalized individuals. The high levels of cost‐related underuse that we observed is concerning. Our results support calls for the further development of interventions to address high medication costs and for the consideration of novel approaches to assist patients around the time of hospital discharge.
APPENDICES
APPENDIX A. Survey response flow diagram.
APPENDIX B. Behaviors to address the cost of medications prescribed at hospital discharge.
- USA Today/Kaiser Family Foundation/Harvard School of Public Health.The Public on Prescription Drugs and Pharmaceutical Companies.2008. Available at: http://www.kff.org/kaiserpolls/pomr030408pkg.cfm. Accessed September 5, 2008.
- ,,, et al.Pharmacy benefits and the use of drugs by the chronically ill.JAMA.2004;291(19):2344–2350.
- Kaiser Family Foundation and Health Research and Educational Trust.Employer Health Benefits Annual Survey,2009.year="2009"2009. Available at: http://ehbs.kff.org/pdf/2009/7936.pdf. Accessed May 5,year="2010"2010.
- Kaiser Family Foundation.Prescription Drug Trends.2007. Available at: http://www.kff.org/rxdrugs/upload/3057_06.pdf. Accessed December 5,year="2007"2007.
- The Patient Protection and Affordable Care Act, H.R. 3590, Section 2713 (c).Washington, DC:111 Congress;2010.
- ,,, et al.Cost‐related medication nonadherence and spending on basic needs following implementation of Medicare Part D.JAMA.2008;299(16):1922–1928.
- ,,, et al.Race/ethnicity and economic differences in cost‐related medication underuse among insured adults with diabetes: the Translating Research Into Action for Diabetes Study.Diabetes Care.2008;31(2):261–266.
- ,,, et al.Cost‐related medication nonadherence among elderly and disabled Medicare beneficiaries: a national survey 1 year before the Medicare drug benefit.Arch Intern Med.2006;166(17):1829–1835.
- ,,, et al.Prescription drug coverage and seniors: findings from a 2003 national survey.Health Aff (Millwood). Jan‐Jun 2005;Suppl Web Exclusives: W5‐152‐W155‐166.
- ,,.Cost‐related medication underuse among chronically ill adults: the treatments people forgo, how often, and who is at risk.Am J Public Health.2004;94(10):1782–1787.
- ,,.Problems paying out‐of‐pocket medication costs among older adults with diabetes.Diabetes Care.2004;27(2):384–391.
- ,,.Race/ethnicity and nonadherence to prescription medications among seniors: results of a national study.J Gen Intern Med.2007;22(11):1572–1578.
- ,,,,,.Long‐term persistence in use of statin therapy in elderly patients.JAMA.2002;288(4):455–461.
- ,,, et al.Predictors of adherence with antihypertensive and lipid‐lowering therapy.Arch Intern Med.2005;165(10):1147–1152.
- ,,,.Racial disparities in the quality of medication use in older adults: baseline findings from a longitudinal study.J Gen Intern Med.2010;25(3)228–234.
- ,,,,,.Effects of increased patient cost sharing on socioeconomic disparities in health care.J Gen Intern Med.2008;23(8):1131–1136.
- .Relationship between high cost sharing and adverse outcomes: a truism that's tough to prove.Am J Manag Care.2010;16(4):287–289.
- ,,,,,.The health effects of restricting prescription medication use because of cost.Med Care.2004;42(7):626–634.
- ,.Smoking cessation initiated during hospital stay for patients with coronary artery disease: a randomized controlled trial.Can Med Assoc J.2009;180(13):1297–1303.
- .Copayment levels and medication adherence: less is more.Circulation.2009;119(3):365–367.
- ,,,,.Cost‐effectiveness of providing full drug coverage to increase medication adherence in post‐myocardial infarction Medicare beneficiaries.Circulation.2008;117(10):1261–1268.
- ,,.Cost‐related medication underuse: do patients with chronic illnesses tell their doctors?Arch Intern Med.2004;164(16):1749–1755.
- ,,.Patient‐physician communication about out‐of‐pocket costs.JAMA.2003;290(7):953–958.
- ,,,,.Patients' perceptions of generic medications.Health Aff (Millwood).2009;28(2):546–556.
- ,,.Physician strategies to reduce patients' out‐of‐pocket prescription costs.Arch Intern Med.2005;165(6):633–636.
- ,,, et al.Physicians' perceived knowledge of and responsibility for managing patients' out‐of‐pocket costs for prescription drugs.Ann Pharmacother.2006;40(9):1534–1540.
- ,,, et al.The effect of pharmacy benefit design on patient‐physician communication about costs.J Gen Intern Med.2006;21(4):334–339.
- ,,,.Discharge education improves clinical outcomes in patients with chronic heart failure.Circulation.2005;111(2):179–185.
The affordability of prescription medications continues to be one of the most pressing public health issues in the United States. Many patients reduce their prescribed doses to make medications last longer or do not fill prescriptions because of cost.1 Cost‐related medication underuse affects patients with and without drug insurance coverage,2 and is likely to become even more problematic as employers scale back on drug benefits3 and drug prices continue to increase.4 The landmark Patient Protection and Affordability Act passed in March 2010 does little to address this issue.5
Existing estimates of cost‐related medication underuse come largely from surveys of ambulatory patients. For example, using data from the Medicare Current Beneficiary Survey, Maden et al. estimated that 11% to 15% of patients reduced medication use in the past year because of cost.6 Tseng and colleagues found very similar rates of cost‐related underuse in managed care beneficiaries with diabetes.7
Hospitalized patients, who have a high burden of disease and tend to use more medications than their ambulatory counterparts, may be particularly vulnerable to cost‐related underuse but, thus far, have been subject to little investigation. New medications, which are frequently prescribed at the time of discharge, may exacerbate these issues further and contribute to preventable readmissions. Accordingly, we surveyed a cohort of medical inpatients at a large academic medical center to estimate the prevalence and predictors of cost‐related medication underuse for hospitalized managed care patients, and to identify strategies that patients perceive as helpful to make medications more affordable.
METHODS
Study Sample
We identified consecutive patients newly admitted to the general medicine, cardiology, or oncology services at Brigham and Women's Hospital from November 2008 to December 2009. For our survey, we included only those patients who received medical benefits through 1 of 3 large insurers with whom our hospital has pay‐for‐performance contracts. Annually, there are approximately 4000 patients covered by these insurers admitted to the 3 clinical services we evaluated, We focused on patients who had a primary care physician at one of the hospital's outpatient practices because of the existence of an automated infrastructure to identify these managed care beneficiaries of these insurers who are newly hospitalized, and because patients covered by commercial insurance plans likely represent a conservative lower‐bound of cost‐related medication underuse among hospitalized patients.
Patients were surveyed on the first non‐holiday weekday after admission. We excluded patients who had been discharged prior to the daily admission list being generated, or who, on a previous admission, had completed our survey or declined to be surveyed. We also excluded several patients who were not beneficiaries of the target insurers and were erroneously included on the managed care admission roster.
Potentially eligible patients were approached on the hospital ward by 1 of 3 study care coordinators (2 nurses and 1 pharmacist) and were asked if they were willing to participate in a research project about medication use that involved a short verbally delivered in‐person (inpatient) survey, a brief postdischarge telephone call, and a review of their electronic health record. The Institutional Review Board of Brigham and Women's Hospital approved this study.
Inpatient Survey
Our survey instrument was developed iteratively and pilot‐tested to improve face validity. Questions about cost‐related underuse were based on validated measures.8, 9 Specifically, we asked whether in the past year patients had: (1) not filled a prescription because it was too expensive, (2) skipped doses to make medicines last longer, (3) took less medicine than prescribed to make the medicine last longer, or (4) split pills to make the medication last longer.
Questions about strategies to improve medication affordability assessed whether patients thought it would be helpful to: (1) discuss medication affordability with healthcare workers (inpatient doctors, outpatient doctors, nurses, pharmacists, or social workers); (2) have their medications reviewed by a nurse or pharmacist; (3) receive information about lower cost but equally effective medication options, or about programs that provide medications at reduced costs; and/or (4) have their copayments/coinsurance lowered. Possible responses to all of these questions were binary, ie, yes or no.
In addition, patients were asked about the nature of their drug insurance coverage, the prescription medications that they currently use, whether they know their copayment levels (for generic and brand‐name medications), and, if so, what these amounts were, their annual household income, and their self‐identified race. Information on patient age, gender, and the primary reason for hospitalization was obtained from the electronic health record. This source was also used to verify the accuracy of the self‐reported preadmission medication list. When there were discrepancies between preadmission medications reported by patients and those recorded in their chart, the later was used because our hospital reconciles and records all medications at the time of hospital admission for all patients.
Postdischarge Survey
Within 3 days of discharge, patients were contacted by telephone and asked about new medications they were prescribed on discharge, if any. The discharge summary was used to verify the accuracy of the information provided by patients. The interviewers clarified any apparent discrepancies between the 2 sources of information with the patient. Patients who had been prescribed a new medication were asked whether or not they had filled their prescription. For patients who had, we asked whether: (1) they knew how much they would have to pay prior to going to the pharmacy, (2) they had discussed less expensive options with their pharmacist, and (3) they had discussed medication costs with their inpatient or outpatient physicians.
Data Analysis
We used descriptive statistics to summarize the characteristics of our respondents and our overall survey results. We generated univariate and multivariable logistic regression models to identify whether prehospitalization cost‐related medication underuse was influenced by patient age, gender, income, race, and the number of medications patients used on a regular basis. For the purpose of these analyses, we classified patients as reporting cost‐related underuse if they responded yes to any of the 4 strategies described above (ie, not filling medications, skipping doses, taking less medication, or splitting pills to make medicines last longer). Patients whose incomes were above the median level in our cohort were categorized as being of high‐income. Our multivariable model had a c‐statistic of 0.75, suggesting good discriminative ability.
RESULTS
During the study period, 483 potentially‐eligible patients were admitted to the general medicine, cardiology, and oncology services. We excluded 167 because they had been discharged prior to being identified, had been surveyed or already declined participation on a prior admission, or were not managed care enrollees (see Appendix A). Of the remaining 316 subjects, 130 participated in the inpatient survey (response rate = 41%); 93 (75%) of these patients were reached by telephone after hospital discharge and completed the postdischarge survey. The baseline characteristics of our respondents are presented in Table 1. Patients had a mean age of 52 years, were 50% male and two‐thirds of white race, represented a range of household incomes, and almost all had employer‐sponsored prescription coverage. Prior to admission, patients took an average of 5 prescription medications and paid an average copayment of $10.80 and $21.60 for each generic and brand‐name prescription, respectively.
| Characteristic | N = 130 |
|---|---|
| |
| Age, mean years (SD) | 52 (11.2) |
| Male, % | 65 (50.0) |
| Race/ethnicity,* n (%) | |
| Caucasian/white | 84 (67.2) |
| Black/African American | 20 (16.0) |
| Latino/Hispanic | 13 (10.4) |
| Asian | 3 (2.4) |
| American Indian or Alaska Native | 1 (0.8) |
| Other | 4 (3.2) |
| Annual household income,* n (%) | |
| <$30,000 | 15 (12.8) |
| $30,000‐$75,000 | 49 (41.9) |
| >$75,000 | 53 (45.3) |
| Insurance coverage for outpatient prescription drugs,* n (%) | |
| Employer or spouse's employer | 123 (96.0) |
| Independent | 5 (3.9) |
| Medication copayments,* mean $ (SD) | |
| Brand‐name medications | 21.6 (14.2) |
| Generic medications | 10.8 (6.0) |
| No. of medications prior to admission, mean (SD) | 5.5 (4.3) |
| Category of discharge diagnosis, n (%) | |
| Cardiovascular | 40 (30.8) |
| Gastrointestinal | 23 (17.7) |
| Pulmonary | 23 (17.7) |
| Infectious | 13 (10.0) |
| Oncology | 5 (3.8) |
| Renal | 6 (4.6) |
| Psychiatric | 3 (2.3) |
| Hematologic | 4 (3.1) |
| Neurologic | 5 (3.8) |
| Musculoskeletal | 5 (3.8) |
| Respiratory | 2 (1.5) |
| Endocrine | 1 (0.8) |
Cost‐Related Medication Underuse
Thirty (23%) of the survey respondents reported at least 1 cost‐related medication underuse strategy in the year prior to their hospital admission (Figure 1), most commonly not filling a prescription at all because of cost (n = 26; 20%). Rates of cost‐related underuse were highest for patients of black race, low income, and women (Figure 2).
In unadjusted analyses, black respondents had 4.60 (95% confidence interval [CI], 1.63 to 13.0) times the odds of reporting cost‐related underuse than non‐Hispanic white respondents (Table 2). The association of black race and cost‐related underuse appears to be confounded, in part, by income (adjusted odds ratio for black race was 4.16; 95% CI, 1.34 to 12.86) and the number of medications patients used on a regular basis (adjusted odds ratio for black race was 4.14; 95% CI, 1.44 to 11.96). After controlling for these variables, as well as age and gender, the relationship between race and cost‐related underuse remained statistically significant (adjusted odds ratio 3.39; 95% CI, 1.05 to 11.02) (Table 2).
| Predictor | Unadjusted Odds Ratio (95% CI) | Adjusted Odds Ratio (95% CI) |
|---|---|---|
| ||
| Age (per additional year) | 0.98 (0.941.02) | 0.97 (0.931.01) |
| Male (vs female) | 0.84 (0.371.90) | 1.03 (0.432.48) |
| Race (vs white race) | ||
| Black | 4.60 (1.6313.0) | 3.39 (1.0511.02) |
| Other | 1.10 (0.363.37) | 0.77 (0.202.99) |
| No. of medications (per additional medication) | 1.10 (1.001.20) | 1.10 (1.001.22) |
| High income (vs low income) | 0.62 (0.271.42) | 0.71 (0.242.07) |
Strategies to Help Make Medications More Affordable
Virtually all respondents (n = 123; 95%) endorsed at least one of the proposed strategies to make medications more affordable (Figure 3). A majority felt that lowering cost sharing (94%), or receiving information about lower‐cost medication options (83%) or programs to subsidize medication costs (83%) would be helpful. Approximately 70% of patients stated that speaking to their outpatient physicians might be helpful, although only 14% reported actually speaking with their primary care provider about medication costs in the past year. Results were mixed for other strategies, including speaking with their inpatient physicians.
Postdischarge Medication Use
Seventy‐six (82%) respondents to the outpatient survey were prescribed a new medication at the time of hospital discharge, and virtually all (95%) had filled prescriptions for these medications by the time of the follow‐up survey. Patients paid an average of $27.63 (standard deviation $39.24) in out‐of‐pocket costs for these medications. Few (16%) patients knew how much they would have to pay before they had gone to the pharmacy to fill their prescription (see Appendix B). Even fewer patients asked, or were spoken to by their pharmacist, about less expensive medication options (7%), and almost none had spoken to their inpatient (4%) or outpatient providers (2%) about the cost of their newly prescribed drugs.
DISCUSSION
Almost a quarter of the medical inpatients we surveyed had not filled a medication because of cost, or had skipped doses, reduced dosages, or split pills to make their medicines last longer in the prior year. This amount is larger than that found in many prior studies, conducted in outpatient settings, in which 11% to 19% of patients report cost‐related underuse.68, 10, 11 Our results are particularly striking considering that our study cohort consisted exclusively of patients with commercial health insurance, the vast majority of whom also had employer‐sponsored drug coverage. Cost‐related medication underuse may be even more prevalent among hospitalized patients with less generous benefits, including the uninsured and perhaps even beneficiaries of Medicare Part D.
Reductions in medication use because of cost were particularly high among black patients, whose odds of reporting cost‐related underuse were more than 3 times higher than that of patients of non‐Hispanic white race. Race‐related differences in cost‐related underuse have been observed in outpatient studies,68, 12 and may be an important contributor to racial disparities in evidence‐based medication use.1315 These differences may, in part, reflect racial variations in socioeconomic status; lower income patients, who are more likely to be from a racial or ethnic minority, are more sensitive to cost sharing than higher income individuals.16 Consistent with this, the relationship between race and cost‐related underuse in our study was smaller but still highly significant in multivariable models that adjusted for income.
Not surprisingly, the underuse of effective prescription medications is associated with adverse clinical and economic consequences.17 Heisler et al. found that patients who had restricted medications because of cost were 76% more likely to report a decline in their health status than those who had not.18 The health effects of cost‐related underuse are likely to be particularly significant for hospitalized patients, given their high burden of disease and the frequency with which they are prescribed medications at discharge to treat the condition that led to their initial hospitalization. Thus, targeting efforts to address cost‐related underuse patients who are hospitalized may be an efficient method of improving patient health and reducing preventable readmissions. This is consistent with efforts that address, in the inpatient setting, other health issues that are commonly encountered in the ambulatory arena, such as immunizations and smoking cessation.19
Our survey respondents endorsed numerous strategies as being potentially helpful. Predictably, support for lowering copayments was extremely high. While this may not be practical or even desirable for some medications, lowering copayments for highly effective medications, such as statins and antihypertensives, in the context of value‐based insurance design, is an increasingly adopted strategy that has the potential to simultaneously improve clinical outcomes and reduce overall health spending.20, 21
While the majority of patients felt that talking to their outpatient physicians or pharmacists about medication costs might be helpful, the effectiveness of this strategy is unclear. Consistent with prior results,22, 23 the vast majority of the patients we surveyed had not discussed medication costs prior to their admission or after filling newly prescribed medications. Further, although physicians could help reduce drug expenditures in a variety of ways, including the increased ordering of generic drugs,24 many physicians are uncomfortable talking to their patients about costs,25 have limited knowledge about their patients' out‐of‐pocket expenditures, feel that addressing this issue is not their responsibility,26 or do not have resources, such as electronic formulary information, that could facilitate these discussions in an efficient manner.
An alternative strategy may be to provide patients with better education about medication costs. Virtually none of the patients we surveyed knew how much they would pay for their new prescriptions before visiting the pharmacy. These findings are similar to those observed in the outpatient setting,27 and suggest an opportunity to provide patients with information about the cost of their newly and previously prescribed drugs, and to facilitate discussions between patients and inpatient providers about predischarge prescribing decisions, in the same spirit as other predischarge patient education.28 Of course, issues related to transitions of care between the hospital and community setting, and coordination between inpatient and outpatient providers, must be adequately addressed for this strategy to be effective.
Our study has several notable limitations. It had a relatively small sample size and low response rate. Respondents may have differed systematically from non‐respondents, and we were unable to compare the characteristics of both populations. Further, we studied commercially insured inpatients on internal medicine services at an academic medical center, and thus our results may not be generalizable to patients hospitalized in other settings, or with different types of insurance coverage, including the uninsured. The primary outcome of our study was to determine self‐reported cost‐related underuse. While we used validated measures,8 it is possible that patients who reported reducing their medication use in response to cost may not have actually done so. We did not collect information on education or health literacy, nor did we have access to detailed information about our respondents' pharmacy benefit design structures; these important factors may have confounded our analyses, and/or may have been mediators of our observed results, and should be evaluated further in future studies. We did not have adequate statistical power to evaluate whether patients using specific classes of medications were particularly prone to cost‐related underuse.
Despite these limitations, our study is the first, to our knowledge, to evaluate the impact of medication costs on use in a cohort of hospitalized individuals. The high levels of cost‐related underuse that we observed is concerning. Our results support calls for the further development of interventions to address high medication costs and for the consideration of novel approaches to assist patients around the time of hospital discharge.
APPENDICES
APPENDIX A. Survey response flow diagram.
APPENDIX B. Behaviors to address the cost of medications prescribed at hospital discharge.
- USA Today/Kaiser Family Foundation/Harvard School of Public Health.The Public on Prescription Drugs and Pharmaceutical Companies.2008. Available at: http://www.kff.org/kaiserpolls/pomr030408pkg.cfm. Accessed September 5, 2008.
- ,,, et al.Pharmacy benefits and the use of drugs by the chronically ill.JAMA.2004;291(19):2344–2350.
- Kaiser Family Foundation and Health Research and Educational Trust.Employer Health Benefits Annual Survey,2009.year="2009"2009. Available at: http://ehbs.kff.org/pdf/2009/7936.pdf. Accessed May 5,year="2010"2010.
- Kaiser Family Foundation.Prescription Drug Trends.2007. Available at: http://www.kff.org/rxdrugs/upload/3057_06.pdf. Accessed December 5,year="2007"2007.
- The Patient Protection and Affordable Care Act, H.R. 3590, Section 2713 (c).Washington, DC:111 Congress;2010.
- ,,, et al.Cost‐related medication nonadherence and spending on basic needs following implementation of Medicare Part D.JAMA.2008;299(16):1922–1928.
- ,,, et al.Race/ethnicity and economic differences in cost‐related medication underuse among insured adults with diabetes: the Translating Research Into Action for Diabetes Study.Diabetes Care.2008;31(2):261–266.
- ,,, et al.Cost‐related medication nonadherence among elderly and disabled Medicare beneficiaries: a national survey 1 year before the Medicare drug benefit.Arch Intern Med.2006;166(17):1829–1835.
- ,,, et al.Prescription drug coverage and seniors: findings from a 2003 national survey.Health Aff (Millwood). Jan‐Jun 2005;Suppl Web Exclusives: W5‐152‐W155‐166.
- ,,.Cost‐related medication underuse among chronically ill adults: the treatments people forgo, how often, and who is at risk.Am J Public Health.2004;94(10):1782–1787.
- ,,.Problems paying out‐of‐pocket medication costs among older adults with diabetes.Diabetes Care.2004;27(2):384–391.
- ,,.Race/ethnicity and nonadherence to prescription medications among seniors: results of a national study.J Gen Intern Med.2007;22(11):1572–1578.
- ,,,,,.Long‐term persistence in use of statin therapy in elderly patients.JAMA.2002;288(4):455–461.
- ,,, et al.Predictors of adherence with antihypertensive and lipid‐lowering therapy.Arch Intern Med.2005;165(10):1147–1152.
- ,,,.Racial disparities in the quality of medication use in older adults: baseline findings from a longitudinal study.J Gen Intern Med.2010;25(3)228–234.
- ,,,,,.Effects of increased patient cost sharing on socioeconomic disparities in health care.J Gen Intern Med.2008;23(8):1131–1136.
- .Relationship between high cost sharing and adverse outcomes: a truism that's tough to prove.Am J Manag Care.2010;16(4):287–289.
- ,,,,,.The health effects of restricting prescription medication use because of cost.Med Care.2004;42(7):626–634.
- ,.Smoking cessation initiated during hospital stay for patients with coronary artery disease: a randomized controlled trial.Can Med Assoc J.2009;180(13):1297–1303.
- .Copayment levels and medication adherence: less is more.Circulation.2009;119(3):365–367.
- ,,,,.Cost‐effectiveness of providing full drug coverage to increase medication adherence in post‐myocardial infarction Medicare beneficiaries.Circulation.2008;117(10):1261–1268.
- ,,.Cost‐related medication underuse: do patients with chronic illnesses tell their doctors?Arch Intern Med.2004;164(16):1749–1755.
- ,,.Patient‐physician communication about out‐of‐pocket costs.JAMA.2003;290(7):953–958.
- ,,,,.Patients' perceptions of generic medications.Health Aff (Millwood).2009;28(2):546–556.
- ,,.Physician strategies to reduce patients' out‐of‐pocket prescription costs.Arch Intern Med.2005;165(6):633–636.
- ,,, et al.Physicians' perceived knowledge of and responsibility for managing patients' out‐of‐pocket costs for prescription drugs.Ann Pharmacother.2006;40(9):1534–1540.
- ,,, et al.The effect of pharmacy benefit design on patient‐physician communication about costs.J Gen Intern Med.2006;21(4):334–339.
- ,,,.Discharge education improves clinical outcomes in patients with chronic heart failure.Circulation.2005;111(2):179–185.
Copyright © 2011 Society of Hospital Medicine

Hospitalist Versus Traditional Systems
In the United States, general medical inpatient care is increasingly provided by hospital‐based physicians, also called hospitalists.1 The field of pediatrics is no exception, and by 2005 there were an estimated 1000 pediatric hospitalists in the workforce.2 Current numbers are likely to be greater than 2500, as the need for pediatric hospitalists has grown considerably.
At the same time, the quality of care delivered by the United States health system has come under increased scrutiny. In 2001, the Institute of Medicine, in its report on the quality of healthcare in America, concluded that between the care we have and what we could have lies not just a gap but a chasm.3 Meanwhile, the cost of healthcare delivery continues to increase. The pressure to deliver cost‐effective, high quality care is among the more important forces driving the proliferation of hospitalists.4
Over the last decade, data supporting the role of hospitalists in improving quality of care for adult patients has continued to accumulate.58 A 2007 retrospective cohort study by Lindenaur et al.7 included nearly 77,000 adult patients and found small reductions in length of stay without adverse effects on mortality or readmission rates, and a 2009 systematic review by Peterson6 included 33 studies and concluded that in general inpatient care of general medical patients by hospitalist physicians leads to decreased hospital cost and length of stay. A 2002 study by Meltzer et al.8 is also interesting, suggesting that improvements in costs and short‐term mortality are related to the disease‐specific experience of hospitalists.
Similar data for pediatric hospitalists has been slower to emerge. A systematic review of the literature by Landrigan et al., which included studies through 2004, concluded that [R]esearch suggests that pediatric hospitalists decrease costs and length of stay . The quality of care in pediatric hospitalist systems is unclear, because rigorous metrics to evaluate quality are lacking.9 Since the publication of that review, there have been multiple studies which have sought to evaluate the quality of pediatric hospitalist systems. This review was undertaken to synthesize this new information, and to determine the effect of pediatric hospitalist systems on quality of care.
METHODS
A review of the available English language literature on the Medline database was undertaken in November of 2010 to answer the question, What are the differences in quality of care and outcomes of inpatient medical care provided by hospitalists versus non‐hospitalists in the pediatric population? Care metrics of interest were categorized according to the Society of Hospital Medicine's recommendations for measuring hospital performance.10
Search terms used (with additional medical subject headings [MeSH] terms in parenthesis) were hospital medicine (hospitalist), pediatrics (child health, child welfare), cost (cost and cost analysis), quality (quality indicators, healthcare), outcomes (outcome assessment, healthcare; outcomes and process assessment, healthcare); volume, patient satisfaction, length of stay, productivity (efficiency), provider satisfaction (attitude of health personnel, job satisfaction), mortality, and readmission rate (patient readmission). The citing articles search tool was used to identify other articles that potentially could meet criteria. Finally, references cited in the selected articles, as well as in excluded literature reviews, were searched for additional articles.
Articles were deemed eligible if they were published in a peer‐reviewed journal, if they had a comparative experimental design for hospitalists versus non‐hospitalists, and if they dealt exclusively with pediatric hospitalists. Noncomparative studies were excluded, as were studies that pertained to settings besides that of an inpatient pediatrics ward, such as pediatric intensive care units or emergency rooms. The search algorithm is diagrammed in Figure 1.
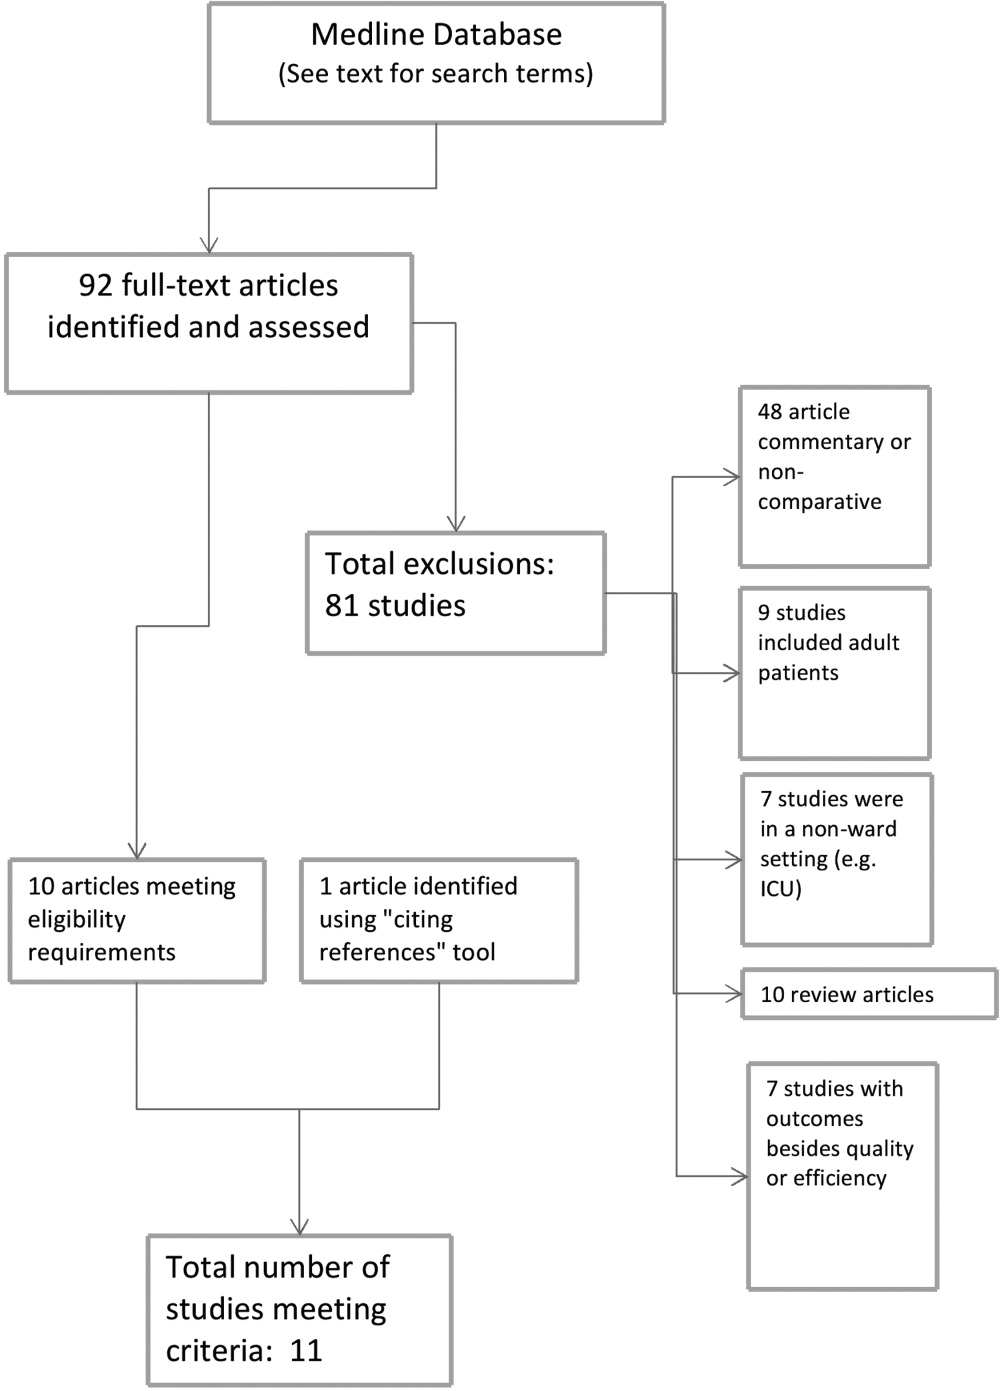
The selected articles were reviewed for the relevant outcome measures. The quality of each article was assessed using the Oxford Centre for Evidence‐Based Medicine levels of evidence,11 a widely accepted standard for critical analysis of studies. Levels of evidence are assigned to studies, from 1a (systematic reviews of randomized controlled trials) to 5 (expert opinion only). Well‐conducted prospective cohort studies receive a rating of 2c; those with wide confidence intervals due to small sample size receive a minus () modifier. This system does not specifically address survey studies, which were therefore not assigned a level of evidence.
RESULTS
The screening process yielded 92 possible relevant articles, which were then reviewed individually (by G.M.M.) by title and abstract. A total of 81 articles were excluded, including 48 studies that were either noncomparative or descriptive in nature. Ten of the identified articles were reviews and did not contain primary data. Nine studies were not restricted to the pediatric population. Also excluded were 7 studies that did not have outcomes related to quality (eg, billing performance), and 7 studies of hospitalists in settings besides general pediatric wards (eg, pediatric intensive care units). Ten studies were thus identified. The cited reference tool was used to identify an additional article which met criteria, yielding 11 total articles that were included in the review.
Five of the identified studies published prior to 2005 were previously reviewed by Landrigan et al.9 Since then, 6 additional studies of similar nature have been published and were included here. Articles that met criteria but appeared in an earlier review are included in Table 1; new articles appear in Table 2. The results of all 11 articles were included for this discussion.
| Source | Site | Study Design | Outcomes Measured (Oxford Level of Evidence) | Results for Hospitalists |
|---|---|---|---|---|
| ||||
| Bellet and Whitaker13 (2000) | Cincinnati Children's Hospital Medical Center, Cincinnati, OH | 1440 general pediatric patients | LOS, costs (2c) | LOS shorter (2.4 vs 2.7 days) |
| Retrospective cohort study | Readmission rate, subspecialty consultations, mortality (2c, low power) | Costs lower ($2720 vs $3002) | ||
| Readmissions higher for hospitalists (1% vs 3%) | ||||
| No differences in consultations | ||||
| No mortality in study | ||||
| Ogershok et al.16 (2001) | West Virginia University Children's Hospitals, Morgantown, WV | 2177 general pediatric patients | LOS, cost (2c) | No difference in LOS |
| Retrospective cohort study | Readmission rate, patient satisfaction, mortality (2c, low power) | Costs lower ($1238 vs $1421) | ||
| Lab and radiology tests ordered less often | ||||
| No difference in mortality or readmission rates | ||||
| No difference in satisfaction scores | ||||
| Wells et al.15 (2001) | Valley Children's Hospital, Madera, CA | 182 general pediatric patients | LOS, cost, patient satisfaction, follow‐up rate (2c, low power) | LOS shorter (45.2 vs 66.8 hr; P = 0.01) |
| Prospective cohort study | No LOS or cost benefit for patients with bronchiolitis, gastroenteritis, or pneumonia | |||
| Costs lower ($2701 vs $4854; P = 0.005) for patients with asthma | ||||
| No difference in outpatient follow‐up rate | ||||
| Landrigan et al.14 (2002) | Boston Children's Hospital, Boston, MA | 17,873 general pediatric patients | LOS, cost (2c) | LOS shorter (2.2 vs 2.5 days) |
| Retrospective cohort study | Readmission rate, follow‐up rate, mortality (2c, low power) | Costs lower ($1139 vs $1356) | ||
| No difference in follow‐up rate | ||||
| No mortality in study | ||||
| Dwight et al.12 (2004) | Hospital for Sick Children, Toronto, Ontario, Canada | 3807 general pediatric patients | LOS (2c) | LOS shorter (from 2.9 to 2.5 days; P = 0.04) |
| Retrospective cohort study | Subspecialty consultations, readmission rate, mortality (2c, low power) | No difference in readmission rates | ||
| No difference in mortality | ||||
| Source | Site | Study Design | Outcomes Measured (Oxford Level of Evidence) | Results for Hospitalists |
|---|---|---|---|---|
| ||||
| Boyd et al.21 (2006) | St Joseph's Hospital and Medical Center, Phoenix, AZ | 1009 patients with 11 most common DRGs (3 groups) | Cost, LOS, and readmission rate (2c, low power) | LOS longer (2.6 2.0 vs 3.1 2.6 vs 2.9 2.3, mean SD) |
| Retrospective cohort study | Costs higher ($1781 $1449 (faculty) vs $1954 $1212 (hospitalist group 1) vs $1964 $1495 (hospitalist group 2) | |||
| No difference in readmission rates | ||||
| Conway et al.22 (2006) | National provider survey | 213 hospitalists and 352 community pediatrician survey responses | Self‐reported evidence‐based medicine use (descriptive study, no assignable level) | Hospitalists more likely to follow EBG for following: VCUG and RUS after first UTI, albuterol and ipratropium in first 24 hr for asthma |
| Descriptive study | Hospitalists less likely to use the following unproven therapies: levalbuterol and inhaled or oral steroids for bronchiolitis, stool culture or rotavirus testing for gastroenteritis, or ipratropium after 24 hr for asthma | |||
| Srivastava et al.17 (2007) | University of Utah Health Sciences Center, Salt Lake City, UT | 1970 patients with asthma, dehydration, or viral illness | LOS, cost (2c, no confidence intervals reported) | LOS shorter for asthma (0.23 days, 13%) and for dehydration (0.19 days, 11%) |
| Retrospective cohort study | No LOS difference for patients with viral illness | |||
| Costs lower for asthma ($105.51, 9.3%) and for dehydration ($86.22, 7.8%) | ||||
| Simon et al.19 (2007) | Children's Hospital of Denver, Denver, CO | 759 patients undergoing spinal fusion before and after availability of hospitalist consultation | LOS (4, unaccounted confounding factors) | LOS shorter, 6.5 (6.26.7) days to 4.8 (4.55.1) |
| Retrospective cohort study | ||||
| Bekmezian et al.18 (2008) | UCLA Hospital and Medical Center, Los Angeles, CA | 925 subspecialty patients on GI and Heme/Onc services vs hospitalist service | LOS, cost, readmission rate, mortality (2c, low power) | LOS shorter (38%, P < 0.01) |
| Retrospective cohort study | Cost lower (29%, P < 0.05) | |||
| Readmissions lower (36 for faculty vs none for hospitalists, P = 0.02) | ||||
| No difference in mortality | ||||
| Conway and Keren20 (2009) | Multicenter, 25 children's hospitals | 20,892 patients identified with UTI admissions in PHIS database | LOS, cost, evidence‐based medicine use (2c) | No difference in LOS |
| Retrospective cohort study | No difference in cost | |||
| No difference in performance of EBM guideline (VCUG and RUS for first UTI) | ||||
Effect on Length of Stay, Cost, and Resource Utilization
Ten articles addressed length of stay as an outcome measure, and 8 included cost as well. Five have been previously reported9 (see Table 1). Of these, Dwight et al.,12, Bellet and Whitaker,13 and Landrigan et al.14 found decreased length of stay (LOS) and cost for all patients. Wells et al.15 found significantly decreased LOS and cost for asthma patients but not for all diagnoses taken together, and Ogershok et al.16 found lower hospital costs but not length of stay. Five of the 6 new studies, listed in Table 2, reported on length of stay and cost. Three showed some benefits for length of stay: Srivastava et al.17 reported improvement in length of stay and cost for asthma and dehydration, but not for all diagnoses together; Bekmezian et al.18 reported improved length of stay and cost for pediatric hospitalists for patients on a hematology and gastroenterology service; and Simon et al.19 attributes a generalized decrease in length of stay on a surgical service to implementation of hospitalist comanagement of their most complex patients, though hospitalists only comanaged 12% of the patients in the study. A multicentered study in 2009 by Conway and Keren20 reported no significant difference in length of stay for general pediatric patients with urinary tract infections.
Of the 4 total studies that showed significant advantage in length of stay for hospitalist groups, improvement ranged from 11% to 38%. All attempted to adjust for diagnosis and severity using diagnosis‐related groups (DRGs) or other methods. Dwight et al.,12 Bellet and Whitaker,13 and Bekmezian et al.18 used retrospective or historical comparison alone, while Landrigan et al.14 had both concurrent and historical comparison groups.
In contrast to the other studies, Boyd et al.21 in 2006 found significant advantages, in both length of stay and cost, for a faculty/resident service in comparison to a hospitalist service. This nonrandomized, retrospective cohort study included 1009 pediatric patients, with the 11 most common DRGs, admitted during the same time period to either a traditional faculty/resident team or 1 of 2 private practice hospitalist groups at an academic medical center. The 8 general pediatric faculty practice attendings were dedicated to inpatient care while on service, and rotated bimonthly. The authors found that the faculty group patients had significantly shorter lengths of stay and total direct patient costs.
Cost‐comparison results were reported by 7 of the studies. Bellet and Whitaker,13 Landrigan et al.,14 Ogershok et al.,16 and Bekmezian et al.18 reported reductions in cost for all patients varying from 9% to 29%, while Wells et al.15 and Srivastava et al.17 found reductions in cost only for patients with certain diagnoses. Srivastava et al.17 analyzed 1970 patients, admitted with primary diagnoses of asthma, dehydration, or viral illness, over a 5‐year period from 1993 to 1997. Cost‐per‐patient was reduced between 9.3% for asthma and 7.8% for dehydrations, but when combined with the viral illness group, the difference was not statistically significant. Wells et al.15 studied 182 admissions over a 1‐year period, and found significant reductions in cost of 44% (P < 0.005) for patients with asthma but not for bronchiolitis, gastroenteritis, or pneumonia. In 2009, Conway and Keren20 studied a multicentered cohort of 20,892 children hospitalized for urinary tract infection, and found no significant difference in hospitalization costs between hospitalist services and more traditional models.
Other Quality Measures
Though financial outcomes (length of stay, cost, and resource utilization) were the primary area of emphasis for most of the selected articles, other parameters with more of a focus on quality were examined as well. The studies by Dwight et al.,12 Bellet and Whitaker,13 Landrigan et al.,14 Ogershok et al.,16 Bekmezian et al.,18 and Boyd et al.21 examined mortality and readmission rate. None of these studies reported differences in mortality rate, though none were powered to do so. When studying readmission rate, Bellet and Whitaker13 reported a statistically significant lower rate of readmission for a traditionally staffed service versus the hospitalist service (1% vs 3%; P = 0.006). In contrast, Bekmezian et al.18 found a lower readmission rate for the hospitalist service (4.4% vs 0%; P = 0.02). The studies by Dwight et al.,12 Landrigan et al.,14 Ogershok et al.,16 and Boyd et al.21 did not detect differences in readmission rates.
Two studies measured patient satisfaction.15, 16 Ogershok et al.16 utilized hospital‐generated patient satisfaction surveys, completed at discharge, for comparison and found no differences between the hospitalist and non‐hospitalist ward services. Wells et al.15 utilized a standardized patient satisfaction assessment tool, given at discharge, followed by a telephone interview after 1 month. At discharge, parents rated hospitalist physicians higher in courtesy (P < 0.05) and friendliness (P < 0.005), though this difference was not detected in the telephone interviews 1 month later. However, at that time, parents did indicate that they received better explanations about their child's illness if their child was seen by their primary care physician rather than a hospitalist.
In 2006, a study by Conway et al.22 reported on the use of evidence‐based therapies and tests by hospitalists as compared to community pediatricians. The survey identified evidence‐based therapies and tests for asthma, bronchiolitis, gastroenteritis, and first‐time urinary tract infection (UTI) diagnosis. A total of 213 hospitalists and 228 community pediatricians met the inclusion criteria by returning the completed survey. After multivariate regression analysis, hospitalists were found to be more likely to use 4 of 5 evidence‐based therapies and recommended tests, and were less likely to use 6 of 7 therapies and tests of unproven benefit. In 2009, Conway and Clancy23 again studied the use of evidence‐based therapies, this time using more objective measures. In this report, the Pediatric Health Information System (PHIS) was examined for a cohort of 20,892 patients. After multivariable regression analysis, there was no statistical difference in the performance of evidence‐based imaging following a first UTI between hospitals staffed primarily by community pediatricians versus those with pediatric hospitalist systems. However, it should be noted that the evidence base for UTI‐related imaging has been debated in the literature over the past decade.
DISCUSSION
Of the 11 studies selected for this review, 10 measured length of stay as an outcome, with the majority favoring hospitalists but with mixed results. Three of these studies, those by Dwight et al.,12 Bellet and Whitaker,13 and Landrigan et al.,14 demonstrated 11% to 14% improvement for hospitalist services compared to community pediatricians. Boyd et al.,21 however, found exactly the opposite result, and 2 studies by Conway and Keren20 and Ogershok et al.16 found no difference in length of stay. Two more studies found benefits restricted to certain conditions: Wells et al.15 found 32% shorter lengths of stay for asthma, but not for other conditions; Srivastava et al.17 found a 13% reduction in length of stay for asthma and 11% for dehydration, but none for viral illnesses or when all conditions were combined. Bekmezian et al.18 found shorter lengths of stay on a hospitalist service for hematology and gastroenterology patients, and Simon et al.19 attribute a general trend of decreasing lengths of stay on a surgical service to the implementation of hospital comanagement for a small percentage of patients.
The most common quality measures studied were patient satisfaction, readmission rates, and mortality. Only 1 study by Ogershok et al.16 reported on patient satisfaction and found few differences between hospitalists and community pediatricians. Readmission rate were reported by 6 studies. Bellet and Whitaker13 found a higher readmission rate for pediatric hospitalists, Bekmezian et al.18 found a lower rate but on a subspecialty service. The study with the greatest power for this analysis, by Landrigan et al.14 with nearly 18,000 patients, found no difference, and neither did another 3 studies. Unsurprisingly, no study detected differences in mortality; it would be extremely difficult to adequately power a study to do so in the general pediatric setting, where mortality is rare.
The effect of relative experience of hospitalist physicians is uncertain. Boyd et al.21 speculated that 1 possible cause for the decreased lengths of stay and costs associated with their faculty group compared to hospitalists may have been due to the increased experience of the faculty group. Unfortunately, they were unable to generate statistical significance due to the small numbers of physicians in the study. In contrast, the hospitalists in the report by Dwight et al.12 had decreased lengths of stay but were less experienced. In the adult literature, the study by Meltzer et al.8 suggests that improved outcomes from hospitalist systems may not become apparent for 1 or more years after implementation, but none of the pediatric studies included in our review specifically address this issue. This leaves the possibility open that the hospitalist systems evaluated in some studies had insufficient time in which to develop increased efficiencies.
There were several limitations to our studies. First, due to the heterogeneity and methodological variations among the included studies, we were unable to perform a meta‐analysis. Second, the overall quality of evidence is limited due to the lack of randomized control trials. Third, a lack of agreement on appropriate quality markers has limited the study of quality of care. Published reports continue to focus on financial measures, such as length of stay, despite the recommendation in the previous review by Landrigan et al.9 that such studies would be of limited value. Finally, the current variability of hospitalist models and lack of study of factors that might influence outcomes makes comparisons difficult.
Despite these limitations, several interesting trends emerge from these studies. One such trend is that the more recent studies highlight that simple classification of hospitalist system versus traditional system fails to measure the complexity and nuance of care delivery. The 2006 study by Boyd et al.21 is especially notable because it showed the opposite effect of previous studies, namely, an increase in length of stay and costs for hospitalists at St Joseph's Medical Center in Phoenix, Arizona. In this study, the traditional faculty group was employed by the hospital, and the hospitalist group was a private practice model. The authors suggest that their faculty physicians were therefore operating like hospitalists in that almost all of their time was focused on inpatient care while they were on service. They also had a limited number of general pediatricians, who attended in the inpatient setting, who were more experienced than the private practice groups. Also, the authors theorize that their faculty may have had a closer working relationship with their residents due to additional service responsibilities and locations of the faculty group onsite. Further study of the care models utilized by faculty and hospitalist practices at St Joseph's and other hospitals may reveal important insights about improving the quality and efficiency of inpatient pediatric care in general.
Though there is a clear trend in the adult literature indicating that the use of hospitalists results in superior quality of care, there is less evidence for pediatric systems. The aforementioned previous review by Landrigan et al.9, in 2006 concluded that emerging research suggests that pediatric hospitalist systems decrease cost and length of stay, but also the quality of care in pediatric hospitalist systems is unclear, because rigorous metrics to evaluate quality are lacking. Data from the 6 additional studies presented here lend limited support to the first hypothesis, and the presence of only 1 negative study is not sufficient to undermine it.
While data on quality markers such as readmission rate or mortality remain elusive, the 2 studies by Conway et al.20, 22 attempt to evaluate quality by comparing the use of evidence‐based therapies by hospitalists and community pediatricians. Though the use of objective PHIS data for UTI in 2009 did not confirm the conclusion suggested by the 2006 provider survey study, the attempt to find measurable outcomes such as the use of evidence‐based therapies is a start but we need more metrics, including rigorous patient outcome metrics, to define the quality of our care systems. Before the effect of hospitalist systems on quality is fully understood, more work will need to be done defining metrics for comparison.
Unfortunately, over 5 years since the previous review by Landrigan et al.9 called for increased focus on inpatient quality and understanding how to improve, the sophistication of our measurement of pediatric inpatient quality and understanding of the mechanisms underlying improvement is still in its infancy. We propose a solution at multiple levels.
First, the investment in research comparing system‐level interventions (eg, discharge process A vs discharge process B) must be increased. This investment increased significantly due to the over $1 billion in Recovery Act funding for comparative effectiveness research.23 However, the future investment in comparative effectiveness research, often called patient‐centered outcomes research, and proportion of investment focused on delivery system interventions is unclear. We propose that the investment in comparing delivery system interventions is essential to improving not only hospital medicine systems, but, more importantly, the healthcare system broadly. In addition, research investment needs to focus on reliably implementing proven interventions in systems of care, and evaluating both the effects on patient outcomes and cost, and the contextual factors associated with successful implementation.24 A hospital medicine example would be the comparison of the implementation of a guideline for a common disease across a set of hospitals. One could perform a prospective observational design, in which one compares high intensity versus low intensity intervention and assesses the baseline characteristics of the hospital systems, to understand their association with successful implementation and, ultimately, patient outcomes. One could also perform a clustered randomized design.
Second, the development and implementation of pediatric quality of care measures, including in the inpatient setting, needs to increase rapidly. The Children's Health Insurance Program (CHIP) and its focus on an initial core set of quality measures that expands over time, through an investment in measure development and validation, is an opportunity for pediatric hospital medicine. Inpatient measures should be a focus of measure development and implementation. We must move beyond a limited set of inpatient measures to a broader set focused on issues such as patient safety, hospital‐acquired infections, outcomes for common illnesses, and transitions of care. We also need better measures for important pediatric populations, such as children with complex medical conditions.25
Third, our understanding of the mechanisms leading to improvement in hospital medicine systems needs to be developed. Studies of hospital medicine systems should move past simple binary comparisons of hospitalist systems versus traditional systems to understand the effect on patient outcomes and cost of factors such as years of experience, volume of patients seen overall and with a specific condition, staffing model, training, quality improvement knowledge and application, and health information systems. These factors may be additive or multiplicative to the performance of inpatient systems once put into place, but these hypotheses need to be tested.
Fourth, individual hospitalists and their groups must focus on quality measurement and improvement in quality and value delivered. At Cincinnati, we have a portfolio of quality and value projects derived from our strategic objectives, illustrated in Figure 2. The projects have leaders and teams to drive improvement and measure results. Increasingly, we are able to publish these results in peer‐reviewed journals. On a quarterly basis, we review the portfolio via a dashboard and/or run and control charts. We establish new projects and set new goals on at least an annual basis. It is important to note that at the beginning of the 2010‐2011 fiscal year, almost all initiatives identified as priorities were yellow or red. Our group is now planning new initiatives and goals for next year. This is one method applicable to our setting, but a focus on quality and value and measuring results needs to be part of every hospital medicine program. As payer focus on value increases, this will be essential to demonstrate how a hospitalist group improves outcomes and adds value.
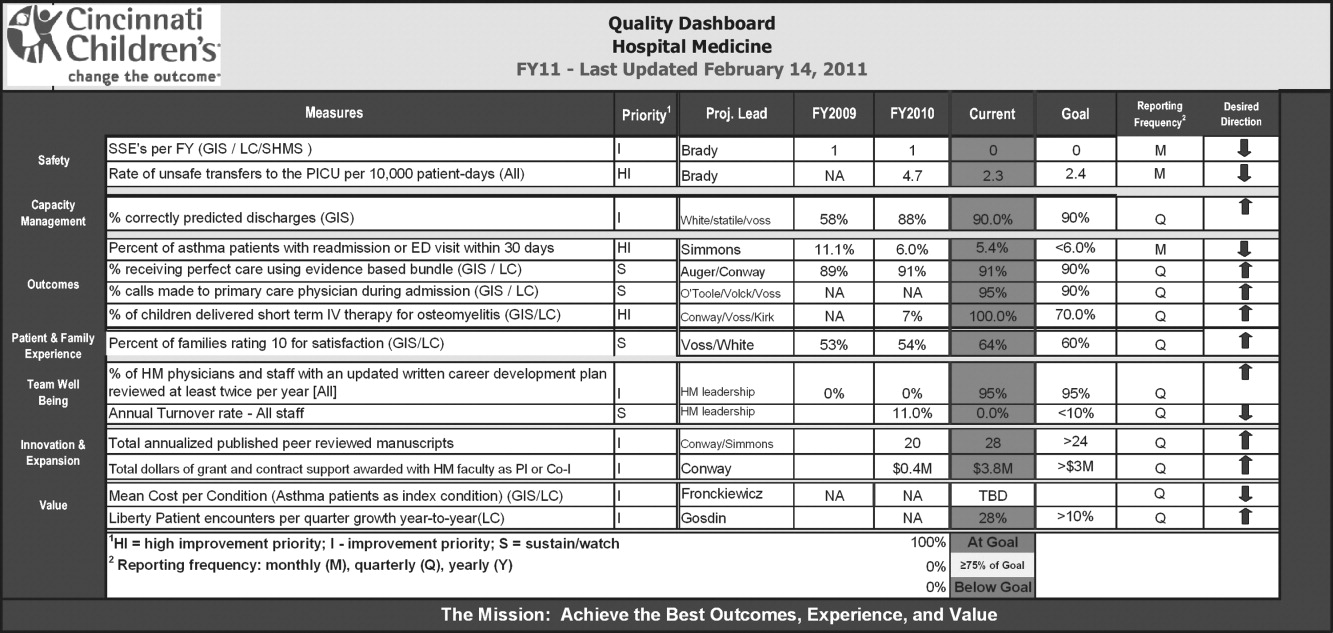
CONCLUSION
This review suggests that the use of hospitalists can improve the quality of inpatient care in the pediatric population, but this is not a universal finding and, most importantly, the mechanisms of improvement are poorly understood. We propose 4 components to address these issues so that a systematic review 5 years from now would be much more robust. These are: 1) increased investment in research comparing system‐level interventions and reliable implementation; 2) further development and implementation of pediatric quality of care measures in the inpatient setting; 3) understanding the mechanisms and factors leading to improvement in hospital medicine systems; and 4) an increased focus on quality measurement, and improvement in quality and value delivered by all individual hospitalists and their groups.
- ,.The emerging role of “hospitalists” in the American health care system.N Engl J Med.1996;335(7):514–517.
- ,,, et al.Pediatric hospitalists: report of a leadership conference.Pediatrics.2006;117(4):1122–1130.
- Institute of Medicine.Crossing the Quality Chasm: A New Health System for the 21st Century.Washington, DC:National Academy Press;2001.
- ,.The hospitalist movement 5 years later.JAMA.2002;287(4):487–494.
- ,.The impact of hospitalists on the cost and quality of inpatient care in the United States: a research synthesis.Med Care Res Rev.2005;62(4):379–406.
- .A systematic review of outcomes and quality measures in adult patients cared for by hospitalists vs nonhospitalists.Mayo Clin Proc.2009;84(3):248–254.
- ,,,,,.Outcomes of care by hospitalists, general internists, and family physicians.N Engl J Med.2007;375(25):2589–2600.
- ,,, et al.Effects of physician experience on costs and outcomes on an academic general medicine service: results of a trial of hospitalists.Ann Intern Med.2002;137(11):866–875.
- ,,,.Pediatric hospitalists: a systematic review of the literature.Pediatrics.2006;117(5):1736–1744.
- Society of Hospital Medicine. Measuring hospitalist performance: metrics, reports, and dashboards. Available at: http://www.hospitalmedicine.org/AM/Template.cfm?Section=Publications; April2007.
- Oxford Centre for Evidence‐Based Medicine levels of evidence. Updated March 2009. Available at: http://www.cebm.net/index.aspx?o=1025. Accessed March 14,2011.
- ,,,.Evaluation of a staff‐only hospitalist system in a tertiary care, academic children's hospital.Pediatrics.2004;114(6):1545–1549.
- ,.Evaluation of a pediatric hospitalist service: impact on length of stay and hospital charges.Pediatrics.2000;105(3 pt 1):478–484.
- ,,, et al.Impact of a health maintenance organization hospitalist system in academic pediatrics.Pediatrics.2002;110(4):720–728.
- ,,.Pediatric hospitalists: quality care for the underserved?Am J Med Qual.2001;16(5):174–180.
- ,,,,,.Restructuring an academic pediatric inpatient service using concepts developed by hospitalists.Clin Pediatr (Phila).2001;40(12):653–662.
- ,,, et al.Impact of a hospitalist system on length of stay and cost for children with common conditions.Pediatrics.2007;120(2):267–274.
- ,,.Staff‐only pediatric hospitalist care of patients with medically complex subspecialty conditions in a major teaching hospital.Arch Pediatr Adolesc Med.2008;162(10):975–980.
- ,,,,,.Pediatric hospitalist comanagement of spinal fusion surgery patients.J Hosp Med.2007;2(1):23–30.
- ,.Factors associated with variability in outcomes for children hospitalized with urinary tract infection.J Pediatr.2009;154(6):789–796.
- ,,,,.Comparison of outcome measures for a traditional pediatric faculty service and nonfaculty hospitalist services in a community teaching hospital.Pediatrics.2006;118(4):1327–1331.
- ,,,,,.Variations in management of common inpatient pediatric illnesses: hospitalists and community pediatricians.Pediatrics.2006;118(2):441–447.
- ,.Comparative‐effectiveness research—implications of the federal coordinating council's report.N Engl J Med.2009;361(4):328–330.
- ,.Charting a path from comparative effectiveness funding to improved patient‐centered health care.JAMA.2010;303(10):985–986.
- ,,, et al.Children with medical complexity: an emerging population for clinical and research initiatives.Pediatrics.2011;127(3):529–538.
In the United States, general medical inpatient care is increasingly provided by hospital‐based physicians, also called hospitalists.1 The field of pediatrics is no exception, and by 2005 there were an estimated 1000 pediatric hospitalists in the workforce.2 Current numbers are likely to be greater than 2500, as the need for pediatric hospitalists has grown considerably.
At the same time, the quality of care delivered by the United States health system has come under increased scrutiny. In 2001, the Institute of Medicine, in its report on the quality of healthcare in America, concluded that between the care we have and what we could have lies not just a gap but a chasm.3 Meanwhile, the cost of healthcare delivery continues to increase. The pressure to deliver cost‐effective, high quality care is among the more important forces driving the proliferation of hospitalists.4
Over the last decade, data supporting the role of hospitalists in improving quality of care for adult patients has continued to accumulate.58 A 2007 retrospective cohort study by Lindenaur et al.7 included nearly 77,000 adult patients and found small reductions in length of stay without adverse effects on mortality or readmission rates, and a 2009 systematic review by Peterson6 included 33 studies and concluded that in general inpatient care of general medical patients by hospitalist physicians leads to decreased hospital cost and length of stay. A 2002 study by Meltzer et al.8 is also interesting, suggesting that improvements in costs and short‐term mortality are related to the disease‐specific experience of hospitalists.
Similar data for pediatric hospitalists has been slower to emerge. A systematic review of the literature by Landrigan et al., which included studies through 2004, concluded that [R]esearch suggests that pediatric hospitalists decrease costs and length of stay . The quality of care in pediatric hospitalist systems is unclear, because rigorous metrics to evaluate quality are lacking.9 Since the publication of that review, there have been multiple studies which have sought to evaluate the quality of pediatric hospitalist systems. This review was undertaken to synthesize this new information, and to determine the effect of pediatric hospitalist systems on quality of care.
METHODS
A review of the available English language literature on the Medline database was undertaken in November of 2010 to answer the question, What are the differences in quality of care and outcomes of inpatient medical care provided by hospitalists versus non‐hospitalists in the pediatric population? Care metrics of interest were categorized according to the Society of Hospital Medicine's recommendations for measuring hospital performance.10
Search terms used (with additional medical subject headings [MeSH] terms in parenthesis) were hospital medicine (hospitalist), pediatrics (child health, child welfare), cost (cost and cost analysis), quality (quality indicators, healthcare), outcomes (outcome assessment, healthcare; outcomes and process assessment, healthcare); volume, patient satisfaction, length of stay, productivity (efficiency), provider satisfaction (attitude of health personnel, job satisfaction), mortality, and readmission rate (patient readmission). The citing articles search tool was used to identify other articles that potentially could meet criteria. Finally, references cited in the selected articles, as well as in excluded literature reviews, were searched for additional articles.
Articles were deemed eligible if they were published in a peer‐reviewed journal, if they had a comparative experimental design for hospitalists versus non‐hospitalists, and if they dealt exclusively with pediatric hospitalists. Noncomparative studies were excluded, as were studies that pertained to settings besides that of an inpatient pediatrics ward, such as pediatric intensive care units or emergency rooms. The search algorithm is diagrammed in Figure 1.
The selected articles were reviewed for the relevant outcome measures. The quality of each article was assessed using the Oxford Centre for Evidence‐Based Medicine levels of evidence,11 a widely accepted standard for critical analysis of studies. Levels of evidence are assigned to studies, from 1a (systematic reviews of randomized controlled trials) to 5 (expert opinion only). Well‐conducted prospective cohort studies receive a rating of 2c; those with wide confidence intervals due to small sample size receive a minus () modifier. This system does not specifically address survey studies, which were therefore not assigned a level of evidence.
RESULTS
The screening process yielded 92 possible relevant articles, which were then reviewed individually (by G.M.M.) by title and abstract. A total of 81 articles were excluded, including 48 studies that were either noncomparative or descriptive in nature. Ten of the identified articles were reviews and did not contain primary data. Nine studies were not restricted to the pediatric population. Also excluded were 7 studies that did not have outcomes related to quality (eg, billing performance), and 7 studies of hospitalists in settings besides general pediatric wards (eg, pediatric intensive care units). Ten studies were thus identified. The cited reference tool was used to identify an additional article which met criteria, yielding 11 total articles that were included in the review.
Five of the identified studies published prior to 2005 were previously reviewed by Landrigan et al.9 Since then, 6 additional studies of similar nature have been published and were included here. Articles that met criteria but appeared in an earlier review are included in Table 1; new articles appear in Table 2. The results of all 11 articles were included for this discussion.
| Source | Site | Study Design | Outcomes Measured (Oxford Level of Evidence) | Results for Hospitalists |
|---|---|---|---|---|
| ||||
| Bellet and Whitaker13 (2000) | Cincinnati Children's Hospital Medical Center, Cincinnati, OH | 1440 general pediatric patients | LOS, costs (2c) | LOS shorter (2.4 vs 2.7 days) |
| Retrospective cohort study | Readmission rate, subspecialty consultations, mortality (2c, low power) | Costs lower ($2720 vs $3002) | ||
| Readmissions higher for hospitalists (1% vs 3%) | ||||
| No differences in consultations | ||||
| No mortality in study | ||||
| Ogershok et al.16 (2001) | West Virginia University Children's Hospitals, Morgantown, WV | 2177 general pediatric patients | LOS, cost (2c) | No difference in LOS |
| Retrospective cohort study | Readmission rate, patient satisfaction, mortality (2c, low power) | Costs lower ($1238 vs $1421) | ||
| Lab and radiology tests ordered less often | ||||
| No difference in mortality or readmission rates | ||||
| No difference in satisfaction scores | ||||
| Wells et al.15 (2001) | Valley Children's Hospital, Madera, CA | 182 general pediatric patients | LOS, cost, patient satisfaction, follow‐up rate (2c, low power) | LOS shorter (45.2 vs 66.8 hr; P = 0.01) |
| Prospective cohort study | No LOS or cost benefit for patients with bronchiolitis, gastroenteritis, or pneumonia | |||
| Costs lower ($2701 vs $4854; P = 0.005) for patients with asthma | ||||
| No difference in outpatient follow‐up rate | ||||
| Landrigan et al.14 (2002) | Boston Children's Hospital, Boston, MA | 17,873 general pediatric patients | LOS, cost (2c) | LOS shorter (2.2 vs 2.5 days) |
| Retrospective cohort study | Readmission rate, follow‐up rate, mortality (2c, low power) | Costs lower ($1139 vs $1356) | ||
| No difference in follow‐up rate | ||||
| No mortality in study | ||||
| Dwight et al.12 (2004) | Hospital for Sick Children, Toronto, Ontario, Canada | 3807 general pediatric patients | LOS (2c) | LOS shorter (from 2.9 to 2.5 days; P = 0.04) |
| Retrospective cohort study | Subspecialty consultations, readmission rate, mortality (2c, low power) | No difference in readmission rates | ||
| No difference in mortality | ||||
| Source | Site | Study Design | Outcomes Measured (Oxford Level of Evidence) | Results for Hospitalists |
|---|---|---|---|---|
| ||||
| Boyd et al.21 (2006) | St Joseph's Hospital and Medical Center, Phoenix, AZ | 1009 patients with 11 most common DRGs (3 groups) | Cost, LOS, and readmission rate (2c, low power) | LOS longer (2.6 2.0 vs 3.1 2.6 vs 2.9 2.3, mean SD) |
| Retrospective cohort study | Costs higher ($1781 $1449 (faculty) vs $1954 $1212 (hospitalist group 1) vs $1964 $1495 (hospitalist group 2) | |||
| No difference in readmission rates | ||||
| Conway et al.22 (2006) | National provider survey | 213 hospitalists and 352 community pediatrician survey responses | Self‐reported evidence‐based medicine use (descriptive study, no assignable level) | Hospitalists more likely to follow EBG for following: VCUG and RUS after first UTI, albuterol and ipratropium in first 24 hr for asthma |
| Descriptive study | Hospitalists less likely to use the following unproven therapies: levalbuterol and inhaled or oral steroids for bronchiolitis, stool culture or rotavirus testing for gastroenteritis, or ipratropium after 24 hr for asthma | |||
| Srivastava et al.17 (2007) | University of Utah Health Sciences Center, Salt Lake City, UT | 1970 patients with asthma, dehydration, or viral illness | LOS, cost (2c, no confidence intervals reported) | LOS shorter for asthma (0.23 days, 13%) and for dehydration (0.19 days, 11%) |
| Retrospective cohort study | No LOS difference for patients with viral illness | |||
| Costs lower for asthma ($105.51, 9.3%) and for dehydration ($86.22, 7.8%) | ||||
| Simon et al.19 (2007) | Children's Hospital of Denver, Denver, CO | 759 patients undergoing spinal fusion before and after availability of hospitalist consultation | LOS (4, unaccounted confounding factors) | LOS shorter, 6.5 (6.26.7) days to 4.8 (4.55.1) |
| Retrospective cohort study | ||||
| Bekmezian et al.18 (2008) | UCLA Hospital and Medical Center, Los Angeles, CA | 925 subspecialty patients on GI and Heme/Onc services vs hospitalist service | LOS, cost, readmission rate, mortality (2c, low power) | LOS shorter (38%, P < 0.01) |
| Retrospective cohort study | Cost lower (29%, P < 0.05) | |||
| Readmissions lower (36 for faculty vs none for hospitalists, P = 0.02) | ||||
| No difference in mortality | ||||
| Conway and Keren20 (2009) | Multicenter, 25 children's hospitals | 20,892 patients identified with UTI admissions in PHIS database | LOS, cost, evidence‐based medicine use (2c) | No difference in LOS |
| Retrospective cohort study | No difference in cost | |||
| No difference in performance of EBM guideline (VCUG and RUS for first UTI) | ||||
Effect on Length of Stay, Cost, and Resource Utilization
Ten articles addressed length of stay as an outcome measure, and 8 included cost as well. Five have been previously reported9 (see Table 1). Of these, Dwight et al.,12, Bellet and Whitaker,13 and Landrigan et al.14 found decreased length of stay (LOS) and cost for all patients. Wells et al.15 found significantly decreased LOS and cost for asthma patients but not for all diagnoses taken together, and Ogershok et al.16 found lower hospital costs but not length of stay. Five of the 6 new studies, listed in Table 2, reported on length of stay and cost. Three showed some benefits for length of stay: Srivastava et al.17 reported improvement in length of stay and cost for asthma and dehydration, but not for all diagnoses together; Bekmezian et al.18 reported improved length of stay and cost for pediatric hospitalists for patients on a hematology and gastroenterology service; and Simon et al.19 attributes a generalized decrease in length of stay on a surgical service to implementation of hospitalist comanagement of their most complex patients, though hospitalists only comanaged 12% of the patients in the study. A multicentered study in 2009 by Conway and Keren20 reported no significant difference in length of stay for general pediatric patients with urinary tract infections.
Of the 4 total studies that showed significant advantage in length of stay for hospitalist groups, improvement ranged from 11% to 38%. All attempted to adjust for diagnosis and severity using diagnosis‐related groups (DRGs) or other methods. Dwight et al.,12 Bellet and Whitaker,13 and Bekmezian et al.18 used retrospective or historical comparison alone, while Landrigan et al.14 had both concurrent and historical comparison groups.
In contrast to the other studies, Boyd et al.21 in 2006 found significant advantages, in both length of stay and cost, for a faculty/resident service in comparison to a hospitalist service. This nonrandomized, retrospective cohort study included 1009 pediatric patients, with the 11 most common DRGs, admitted during the same time period to either a traditional faculty/resident team or 1 of 2 private practice hospitalist groups at an academic medical center. The 8 general pediatric faculty practice attendings were dedicated to inpatient care while on service, and rotated bimonthly. The authors found that the faculty group patients had significantly shorter lengths of stay and total direct patient costs.
Cost‐comparison results were reported by 7 of the studies. Bellet and Whitaker,13 Landrigan et al.,14 Ogershok et al.,16 and Bekmezian et al.18 reported reductions in cost for all patients varying from 9% to 29%, while Wells et al.15 and Srivastava et al.17 found reductions in cost only for patients with certain diagnoses. Srivastava et al.17 analyzed 1970 patients, admitted with primary diagnoses of asthma, dehydration, or viral illness, over a 5‐year period from 1993 to 1997. Cost‐per‐patient was reduced between 9.3% for asthma and 7.8% for dehydrations, but when combined with the viral illness group, the difference was not statistically significant. Wells et al.15 studied 182 admissions over a 1‐year period, and found significant reductions in cost of 44% (P < 0.005) for patients with asthma but not for bronchiolitis, gastroenteritis, or pneumonia. In 2009, Conway and Keren20 studied a multicentered cohort of 20,892 children hospitalized for urinary tract infection, and found no significant difference in hospitalization costs between hospitalist services and more traditional models.
Other Quality Measures
Though financial outcomes (length of stay, cost, and resource utilization) were the primary area of emphasis for most of the selected articles, other parameters with more of a focus on quality were examined as well. The studies by Dwight et al.,12 Bellet and Whitaker,13 Landrigan et al.,14 Ogershok et al.,16 Bekmezian et al.,18 and Boyd et al.21 examined mortality and readmission rate. None of these studies reported differences in mortality rate, though none were powered to do so. When studying readmission rate, Bellet and Whitaker13 reported a statistically significant lower rate of readmission for a traditionally staffed service versus the hospitalist service (1% vs 3%; P = 0.006). In contrast, Bekmezian et al.18 found a lower readmission rate for the hospitalist service (4.4% vs 0%; P = 0.02). The studies by Dwight et al.,12 Landrigan et al.,14 Ogershok et al.,16 and Boyd et al.21 did not detect differences in readmission rates.
Two studies measured patient satisfaction.15, 16 Ogershok et al.16 utilized hospital‐generated patient satisfaction surveys, completed at discharge, for comparison and found no differences between the hospitalist and non‐hospitalist ward services. Wells et al.15 utilized a standardized patient satisfaction assessment tool, given at discharge, followed by a telephone interview after 1 month. At discharge, parents rated hospitalist physicians higher in courtesy (P < 0.05) and friendliness (P < 0.005), though this difference was not detected in the telephone interviews 1 month later. However, at that time, parents did indicate that they received better explanations about their child's illness if their child was seen by their primary care physician rather than a hospitalist.
In 2006, a study by Conway et al.22 reported on the use of evidence‐based therapies and tests by hospitalists as compared to community pediatricians. The survey identified evidence‐based therapies and tests for asthma, bronchiolitis, gastroenteritis, and first‐time urinary tract infection (UTI) diagnosis. A total of 213 hospitalists and 228 community pediatricians met the inclusion criteria by returning the completed survey. After multivariate regression analysis, hospitalists were found to be more likely to use 4 of 5 evidence‐based therapies and recommended tests, and were less likely to use 6 of 7 therapies and tests of unproven benefit. In 2009, Conway and Clancy23 again studied the use of evidence‐based therapies, this time using more objective measures. In this report, the Pediatric Health Information System (PHIS) was examined for a cohort of 20,892 patients. After multivariable regression analysis, there was no statistical difference in the performance of evidence‐based imaging following a first UTI between hospitals staffed primarily by community pediatricians versus those with pediatric hospitalist systems. However, it should be noted that the evidence base for UTI‐related imaging has been debated in the literature over the past decade.
DISCUSSION
Of the 11 studies selected for this review, 10 measured length of stay as an outcome, with the majority favoring hospitalists but with mixed results. Three of these studies, those by Dwight et al.,12 Bellet and Whitaker,13 and Landrigan et al.,14 demonstrated 11% to 14% improvement for hospitalist services compared to community pediatricians. Boyd et al.,21 however, found exactly the opposite result, and 2 studies by Conway and Keren20 and Ogershok et al.16 found no difference in length of stay. Two more studies found benefits restricted to certain conditions: Wells et al.15 found 32% shorter lengths of stay for asthma, but not for other conditions; Srivastava et al.17 found a 13% reduction in length of stay for asthma and 11% for dehydration, but none for viral illnesses or when all conditions were combined. Bekmezian et al.18 found shorter lengths of stay on a hospitalist service for hematology and gastroenterology patients, and Simon et al.19 attribute a general trend of decreasing lengths of stay on a surgical service to the implementation of hospital comanagement for a small percentage of patients.
The most common quality measures studied were patient satisfaction, readmission rates, and mortality. Only 1 study by Ogershok et al.16 reported on patient satisfaction and found few differences between hospitalists and community pediatricians. Readmission rate were reported by 6 studies. Bellet and Whitaker13 found a higher readmission rate for pediatric hospitalists, Bekmezian et al.18 found a lower rate but on a subspecialty service. The study with the greatest power for this analysis, by Landrigan et al.14 with nearly 18,000 patients, found no difference, and neither did another 3 studies. Unsurprisingly, no study detected differences in mortality; it would be extremely difficult to adequately power a study to do so in the general pediatric setting, where mortality is rare.
The effect of relative experience of hospitalist physicians is uncertain. Boyd et al.21 speculated that 1 possible cause for the decreased lengths of stay and costs associated with their faculty group compared to hospitalists may have been due to the increased experience of the faculty group. Unfortunately, they were unable to generate statistical significance due to the small numbers of physicians in the study. In contrast, the hospitalists in the report by Dwight et al.12 had decreased lengths of stay but were less experienced. In the adult literature, the study by Meltzer et al.8 suggests that improved outcomes from hospitalist systems may not become apparent for 1 or more years after implementation, but none of the pediatric studies included in our review specifically address this issue. This leaves the possibility open that the hospitalist systems evaluated in some studies had insufficient time in which to develop increased efficiencies.
There were several limitations to our studies. First, due to the heterogeneity and methodological variations among the included studies, we were unable to perform a meta‐analysis. Second, the overall quality of evidence is limited due to the lack of randomized control trials. Third, a lack of agreement on appropriate quality markers has limited the study of quality of care. Published reports continue to focus on financial measures, such as length of stay, despite the recommendation in the previous review by Landrigan et al.9 that such studies would be of limited value. Finally, the current variability of hospitalist models and lack of study of factors that might influence outcomes makes comparisons difficult.
Despite these limitations, several interesting trends emerge from these studies. One such trend is that the more recent studies highlight that simple classification of hospitalist system versus traditional system fails to measure the complexity and nuance of care delivery. The 2006 study by Boyd et al.21 is especially notable because it showed the opposite effect of previous studies, namely, an increase in length of stay and costs for hospitalists at St Joseph's Medical Center in Phoenix, Arizona. In this study, the traditional faculty group was employed by the hospital, and the hospitalist group was a private practice model. The authors suggest that their faculty physicians were therefore operating like hospitalists in that almost all of their time was focused on inpatient care while they were on service. They also had a limited number of general pediatricians, who attended in the inpatient setting, who were more experienced than the private practice groups. Also, the authors theorize that their faculty may have had a closer working relationship with their residents due to additional service responsibilities and locations of the faculty group onsite. Further study of the care models utilized by faculty and hospitalist practices at St Joseph's and other hospitals may reveal important insights about improving the quality and efficiency of inpatient pediatric care in general.
Though there is a clear trend in the adult literature indicating that the use of hospitalists results in superior quality of care, there is less evidence for pediatric systems. The aforementioned previous review by Landrigan et al.9, in 2006 concluded that emerging research suggests that pediatric hospitalist systems decrease cost and length of stay, but also the quality of care in pediatric hospitalist systems is unclear, because rigorous metrics to evaluate quality are lacking. Data from the 6 additional studies presented here lend limited support to the first hypothesis, and the presence of only 1 negative study is not sufficient to undermine it.
While data on quality markers such as readmission rate or mortality remain elusive, the 2 studies by Conway et al.20, 22 attempt to evaluate quality by comparing the use of evidence‐based therapies by hospitalists and community pediatricians. Though the use of objective PHIS data for UTI in 2009 did not confirm the conclusion suggested by the 2006 provider survey study, the attempt to find measurable outcomes such as the use of evidence‐based therapies is a start but we need more metrics, including rigorous patient outcome metrics, to define the quality of our care systems. Before the effect of hospitalist systems on quality is fully understood, more work will need to be done defining metrics for comparison.
Unfortunately, over 5 years since the previous review by Landrigan et al.9 called for increased focus on inpatient quality and understanding how to improve, the sophistication of our measurement of pediatric inpatient quality and understanding of the mechanisms underlying improvement is still in its infancy. We propose a solution at multiple levels.
First, the investment in research comparing system‐level interventions (eg, discharge process A vs discharge process B) must be increased. This investment increased significantly due to the over $1 billion in Recovery Act funding for comparative effectiveness research.23 However, the future investment in comparative effectiveness research, often called patient‐centered outcomes research, and proportion of investment focused on delivery system interventions is unclear. We propose that the investment in comparing delivery system interventions is essential to improving not only hospital medicine systems, but, more importantly, the healthcare system broadly. In addition, research investment needs to focus on reliably implementing proven interventions in systems of care, and evaluating both the effects on patient outcomes and cost, and the contextual factors associated with successful implementation.24 A hospital medicine example would be the comparison of the implementation of a guideline for a common disease across a set of hospitals. One could perform a prospective observational design, in which one compares high intensity versus low intensity intervention and assesses the baseline characteristics of the hospital systems, to understand their association with successful implementation and, ultimately, patient outcomes. One could also perform a clustered randomized design.
Second, the development and implementation of pediatric quality of care measures, including in the inpatient setting, needs to increase rapidly. The Children's Health Insurance Program (CHIP) and its focus on an initial core set of quality measures that expands over time, through an investment in measure development and validation, is an opportunity for pediatric hospital medicine. Inpatient measures should be a focus of measure development and implementation. We must move beyond a limited set of inpatient measures to a broader set focused on issues such as patient safety, hospital‐acquired infections, outcomes for common illnesses, and transitions of care. We also need better measures for important pediatric populations, such as children with complex medical conditions.25
Third, our understanding of the mechanisms leading to improvement in hospital medicine systems needs to be developed. Studies of hospital medicine systems should move past simple binary comparisons of hospitalist systems versus traditional systems to understand the effect on patient outcomes and cost of factors such as years of experience, volume of patients seen overall and with a specific condition, staffing model, training, quality improvement knowledge and application, and health information systems. These factors may be additive or multiplicative to the performance of inpatient systems once put into place, but these hypotheses need to be tested.
Fourth, individual hospitalists and their groups must focus on quality measurement and improvement in quality and value delivered. At Cincinnati, we have a portfolio of quality and value projects derived from our strategic objectives, illustrated in Figure 2. The projects have leaders and teams to drive improvement and measure results. Increasingly, we are able to publish these results in peer‐reviewed journals. On a quarterly basis, we review the portfolio via a dashboard and/or run and control charts. We establish new projects and set new goals on at least an annual basis. It is important to note that at the beginning of the 2010‐2011 fiscal year, almost all initiatives identified as priorities were yellow or red. Our group is now planning new initiatives and goals for next year. This is one method applicable to our setting, but a focus on quality and value and measuring results needs to be part of every hospital medicine program. As payer focus on value increases, this will be essential to demonstrate how a hospitalist group improves outcomes and adds value.
CONCLUSION
This review suggests that the use of hospitalists can improve the quality of inpatient care in the pediatric population, but this is not a universal finding and, most importantly, the mechanisms of improvement are poorly understood. We propose 4 components to address these issues so that a systematic review 5 years from now would be much more robust. These are: 1) increased investment in research comparing system‐level interventions and reliable implementation; 2) further development and implementation of pediatric quality of care measures in the inpatient setting; 3) understanding the mechanisms and factors leading to improvement in hospital medicine systems; and 4) an increased focus on quality measurement, and improvement in quality and value delivered by all individual hospitalists and their groups.
- ,.The emerging role of “hospitalists” in the American health care system.N Engl J Med.1996;335(7):514–517.
- ,,, et al.Pediatric hospitalists: report of a leadership conference.Pediatrics.2006;117(4):1122–1130.
- Institute of Medicine.Crossing the Quality Chasm: A New Health System for the 21st Century.Washington, DC:National Academy Press;2001.
- ,.The hospitalist movement 5 years later.JAMA.2002;287(4):487–494.
- ,.The impact of hospitalists on the cost and quality of inpatient care in the United States: a research synthesis.Med Care Res Rev.2005;62(4):379–406.
- .A systematic review of outcomes and quality measures in adult patients cared for by hospitalists vs nonhospitalists.Mayo Clin Proc.2009;84(3):248–254.
- ,,,,,.Outcomes of care by hospitalists, general internists, and family physicians.N Engl J Med.2007;375(25):2589–2600.
- ,,, et al.Effects of physician experience on costs and outcomes on an academic general medicine service: results of a trial of hospitalists.Ann Intern Med.2002;137(11):866–875.
- ,,,.Pediatric hospitalists: a systematic review of the literature.Pediatrics.2006;117(5):1736–1744.
- Society of Hospital Medicine. Measuring hospitalist performance: metrics, reports, and dashboards. Available at: http://www.hospitalmedicine.org/AM/Template.cfm?Section=Publications; April2007.
- Oxford Centre for Evidence‐Based Medicine levels of evidence. Updated March 2009. Available at: http://www.cebm.net/index.aspx?o=1025. Accessed March 14,2011.
- ,,,.Evaluation of a staff‐only hospitalist system in a tertiary care, academic children's hospital.Pediatrics.2004;114(6):1545–1549.
- ,.Evaluation of a pediatric hospitalist service: impact on length of stay and hospital charges.Pediatrics.2000;105(3 pt 1):478–484.
- ,,, et al.Impact of a health maintenance organization hospitalist system in academic pediatrics.Pediatrics.2002;110(4):720–728.
- ,,.Pediatric hospitalists: quality care for the underserved?Am J Med Qual.2001;16(5):174–180.
- ,,,,,.Restructuring an academic pediatric inpatient service using concepts developed by hospitalists.Clin Pediatr (Phila).2001;40(12):653–662.
- ,,, et al.Impact of a hospitalist system on length of stay and cost for children with common conditions.Pediatrics.2007;120(2):267–274.
- ,,.Staff‐only pediatric hospitalist care of patients with medically complex subspecialty conditions in a major teaching hospital.Arch Pediatr Adolesc Med.2008;162(10):975–980.
- ,,,,,.Pediatric hospitalist comanagement of spinal fusion surgery patients.J Hosp Med.2007;2(1):23–30.
- ,.Factors associated with variability in outcomes for children hospitalized with urinary tract infection.J Pediatr.2009;154(6):789–796.
- ,,,,.Comparison of outcome measures for a traditional pediatric faculty service and nonfaculty hospitalist services in a community teaching hospital.Pediatrics.2006;118(4):1327–1331.
- ,,,,,.Variations in management of common inpatient pediatric illnesses: hospitalists and community pediatricians.Pediatrics.2006;118(2):441–447.
- ,.Comparative‐effectiveness research—implications of the federal coordinating council's report.N Engl J Med.2009;361(4):328–330.
- ,.Charting a path from comparative effectiveness funding to improved patient‐centered health care.JAMA.2010;303(10):985–986.
- ,,, et al.Children with medical complexity: an emerging population for clinical and research initiatives.Pediatrics.2011;127(3):529–538.

Insurance and LOS for Children With CAP
Disparities in patterns of care and outcomes for ambulatory‐care sensitive conditions remain a persistent problem for children.19 Many studies have focused on disparities in hospitalization rates and length of stay (LOS) related to asthma, however, few studies have focused on community‐acquired pneumonia (CAP) despite the fact that pneumonia is the most common, preventable, and potentially serious infection in childhood.10 Providers, payers, and families have a common interest in minimizing hospital LOS for different reasons (eg, minimizing costs, lost wages, exposure to antibiotic‐resistant bacteria), however, this interest is balanced against the potentially greater risk of readmission and adverse outcomes if LOS is inappropriately short. To date, the relationship between insurance status and LOS for CAP remains unexplored.
As in other conditions, substantial variation exists with respect to patterns of care and outcomes for children hospitalized with CAP.11 For example, children hospitalized in rural settings have a shorter LOS for pneumonia than those hospitalized in large urban settings.12 Children from racial/ethnic minorities tend to have higher rates of CAP‐associated complications, including death.11 Decades of prior studies have documented that uninsured children are less likely than insured children to make preventive care visits and obtain prescription medications, but differences in LOS or hospitalization rates between insured and uninsured children with CAP have not been studied.6, 8, 13, 14 Though imperfect, insurance status is 1 proxy for healthcare access, and current healthcare reform efforts aim to improve healthcare access and decrease socioeconomic gradients in health by increasing the number of insured American children. Nonetheless, quantifying the relationship between insurance status on LOS for children hospitalized with CAP is a first step towards understanding the influence of ambulatory care access on hospitalization for ambulatory‐care sensitive conditions.
The purpose of this study was to investigate the influence of insurance status and type on LOS for children hospitalized with CAP. In addition, we sought to determine if there were consistent trends over time in the association between insurance status and type with LOS for children hospitalized with CAP.
METHODS
Study Design and Data Source
This retrospective cross‐sectional study used data from the 1997, 2000, 2003, and 2006 Kids' Inpatient Database (KID). The KID is part of the Healthcare Cost and Utilization Project sponsored by the Agency for Healthcare Research and Quality (AHRQ). It is the only dataset on hospital use and outcomes specifically designed to study children's use of hospital services in the United States. The KID samples pediatric discharges from all community non‐rehabilitation hospitals in states participating in the Healthcare Cost and Utilization Project, using a complex stratification system, across pediatric discharge type and hospital characteristics. Community hospitals in the KID are defined as all non‐federal, short‐term, general and other specialty hospitals, including academic medical centers, obstetrics‐gynecology, otolaryngology, orthopedic, and children's hospitals. Federal hospitals, long‐term hospitals, psychiatric hospitals, alcohol/chemical dependency treatment facilities and hospitals units within institutions are excluded. Discharge‐level weights assigned to discharges within the stratum permit calculation of national estimates. Datasets, which each contain approximately 3 million discharges (unweighted), are released every 3 years beginning with 1997. The 2006 KID is the most recently available dataset and contains hospital administrative data from 38 states, representing 88.8% of the estimated US population.15 This study was considered exempt from review by the Committees for the Protection of Human Subjects at The Children's Hospital of Philadelphia.
Study Participants
Patients 18 years of age and younger were eligible for inclusion if they required hospitalization for CAP in 1997, 2000, 2003, or 2006. Using a previously validated algorithm, patients were considered as having CAP if they met 1 of 2 criteria: 1) International Classification of Diseases, 9th Revision, Clinical Modification (ICD‐9 CM) primary diagnosis code indicating pneumonia (480‐483, 485‐486), empyema (510), or pleurisy (511.0‐1, 511.9); or 2) primary diagnosis of pneumonia‐related symptom (eg, cough, fever, tachypnea) and secondary diagnosis of pneumonia, empyema or pleurisy. Pneumonia‐related symptoms included fever, respiratory abnormality unspecified, shortness of breath, tachypnea, wheezing, cough, hemoptysis, abnormal sputum, chest pain, and abnormal chest sounds.16 Because there is no specific ICD‐9 code for nosocomial pneumonia, this previously validated approach minimized such misclassification16 (eg, a child hospitalized following traumatic injury who then develops ventilator‐associated pneumonia is likely to have trauma, rather than pneumonia or a pneumonia‐related symptom, listed as the primary diagnosis). Patients with the following comorbid conditions (identified by KID data elements and ICD‐9 CM codes) were excluded as these comorbidities are characterized by risk factors not reflective of the general pediatric population: acquired and congenital immunologic disorders, malignancy, collagen vascular disease, sickle cell disease, cystic fibrosis, organ transplant, congenital heart defects, and heart failure. Patients identified as in‐hospital births were excluded to minimize the inclusion of perinatally acquired and nosocomial infections occurring in neonates. Patients with a secondary diagnosis code indicating trauma were also excluded, as a diagnosis of pneumonia in this population likely reflects nosocomial etiology. CAP‐related complications (eg, effusion, abscess; for complete list, see Supporting Appendix A in the online version of this article) were identified using ICD‐9 CM diagnosis and procedure codes. Asthma‐related hospitalizations were identified using ICD‐9 CM diagnosis code 493 in any secondary diagnosis field.
Primary Exposure
The primary exposure was insurance type, categorized as private, public, uninsured, or other (eg, Civilian Health and Medical Program Uniform Service (CHAMPUS), worker's compensation, union‐based insurance, but definition varies by state precluding categorization as purely public or private).
Primary Outcome
The primary outcome was the hospital LOS calculated in days.
Statistical Analysis
Consistent with prior work,12 subjects were characterized by age, race, sex, the presence or absence of a pneumonia‐associated complication, discharge status (discharge from hospital vs in‐hospital death), hospital type (rural, urban non‐teaching, urban teaching non‐children's, urban teaching children's), and hospital region (Northeast, Midwest, South, West). Age groups for analysis were defined as <1 year (infant), 1 to 5 years (preschool age), 6 to 11 years (school‐age), and 12 to 18 years old (adolescent). Race was recorded as a single variable (white, black, other, and missing). Patient information for race was missing from 32% of discharges in 1997, 18% in 2000, 29% in 2003, and 26% in 2006. Patients with missing race data were included to preserve the integrity of our estimates. Categorical variables were summarized by frequencies and percents. Continuous variables were summarized by mean and standard deviation values.
All analyses accounted for the complex sampling design with the survey commands included in STATA, version 10 (College Station, TX) to produce weighted estimates. To determine the adjusted impact of patient and hospital‐level characteristics in our cohort, we constructed multivariable negative binomial regression models using all available covariates for LOS because of its rightward‐skewed distribution. The negative binomial model produced an incident rate ratio (IRR) for LOS (IRR >1 indicates that the risk factor is associated with a longer length of stay). As recommended in the AHRQ technical documentation, variance estimates for each model accounted for the clustering of data at the hospital level. To address the impact of missing race data on outcome, we constructed additional multivariable negative binomial regression models while varying the underlying assumptions about race classification. In these secondary analyses, children with race coded as missing were sequentially excluded, assumed to be white, and assumed to be black. These analyses were repeated after excluding insurance from the multivariable model.
RESULTS
The more than 10.5 million children sampled (unweighted) in KID during these 4 time periods (1997, 2000, 2003, and 2006) are representative of the more than 28.9 million children hospitalized in the United States. In each of these sample years, there were approximately 150,000 children hospitalized with pneumonia across the United States (Table 1). Of those hospitalized, 23% to 28% had a concomitant diagnosis of asthma; 6% to 8% had a pneumonia‐associated complication; and mortality was <0.01% in each sample year for patients hospitalized with pneumonia. In all years, among those with racial/ethnic data, the sample population was predominantly white boys less than 6 years old. The greatest proportion of children were hospitalized in urban non‐teaching settings, and also those children living in the southern regions of the United States.
| 1997 | 2000 | 2003 | 2006 | |
|---|---|---|---|---|
| N = 148,702 | N = 157,847 | N = 157,743 | N = 156,810 | |
| ||||
| Race | ||||
| White | 56,348 (38) | 68,643 (44) | 54,903 (35) | 56,108 (36) |
| Black | 22,864 (15) | 22,580 (14) | 17,960 (11) | 18,800 (12) |
| Other | 22,203 (15) | 38,448 (24) | 39,138 (25) | 40,803 (26) |
| Missing | 47,287 (32) | 28,175 (18) | 45,588 (29) | 41,099 (26) |
| Age category | ||||
| <1 year | 43,851 (29) | 44,470 (28) | 37,798 (24) | 37,705 (24) |
| 1 through 5 years | 75,033 (50) | 76,385 (48) | 77,530 (49) | 79,519 (51) |
| 6 through 11 years | 19,372 (13) | 21,403 (14) | 23,126 (15) | 23,494 (15) |
| >12 years | 10,446 (7) | 15,589 (9) | 19,289 (12) | 16,092 (10) |
| Hospital type | ||||
| Urban non‐teaching | 52,756 (35) | 50,718 (32) | 52,552 (34) | 50,718 (32) |
| Rural | 47,910 (32) | 41,715 (27) | 39,605 (26) | 31,947 (21) |
| Urban teaching non‐children's | 20,378 (14) | 30,981 (20) | 28,432 (18) | 30,194 (20) |
| Urban teaching children's | 27,658 (19) | 34,021 (22) | 34,454 (22) | 41,035 (27) |
| Male sex | 83,291 (56) | 8,783 (56) | 86,034 (55) | 85,508 (55) |
| Region* | ||||
| Northeast | 19,750 (13) | 26,092 (17) | 23,867 (15) | 23,832 (15) |
| Midwest | 33,053 (22) | 30,706 (19) | 35,714 (23) | 35,900 (23) |
| South | 68,958 (46) | 68,663 (44) | 65,994 (42) | 65,460 (42) |
| West | 26,741 (18) | 32,385 (21) | 32,169 (20) | 31,618 (20) |
| Asthma | 26,971 (24) | 31,746 (28) | 27,729 (24) | 26,822 (23) |
| Pneumonia‐associated complication | 8,831 (6) | 11,084 (7) | 12,005 (8) | 11,724 (7) |
| Died | 334 (0.002) | 394 (0.002) | 270 (0.002) | 193 (0.001) |
| Insurance | ||||
| Private | 65,428 (44) | 73,528 (47) | 68,720 (44) | 63,997 (41) |
| Public | 68,024 (46) | 71,698 (45) | 76,779 (49) | 80,226 (51) |
| Uninsured | 9,922 (7) | 8,336 (5) | 6,381 (4) | 6,912 (4) |
| Other | 4,964 (3) | 4,285 (3) | 5,391 (3) | 5,283 (3) |
There was little variation in the insurance status of children hospitalized with CAP between 1997 and 2006. In each of the sampled years, at least 40% of sampled children were privately insured, at least 40% were publicly insured, and approximately 5% were uninsured (Table 1). In all years, there were significant racial/ethnic disparities in insurance coverage such that whites were 4 to 6 times more likely to have private insurance than blacks, however, the large amount of missing race/ethnicity data warrant caution in interpreting this finding (Table 2; also see Supporting Information Appendix B in the online version of this article). We also found that children less than 1 year old were the most likely to be publicly insured in all years (see Supporting Appendix C in the online version of this article). There were also regional differences related to insurance coverage such that a greater proportion of children hospitalized in facilities located in the southern part of the United States were publicly insured. Notably, there were no significant differences in CAP‐associated mortality or asthma related to insurance coverage (Table 2). In 2006, CAP‐associated complications occurred in 8.5% of children with private insurance, 6.5% of children with public insurance, and 7.7% of uninsured children; the relative distribution of complications by insurance type were similar in previous years of the KID survey.
| Private | Public | Uninsured | Other Insurance | P | |
|---|---|---|---|---|---|
| |||||
| No. of children (%) | 63,997 (41) | 80,226 (51) | 6,912 (4) | 5,283 (3) | |
| Male sex | 34,639 (41) | 44,140 (52) | 3,727 (4) | 2,808 (3) | 0.092 |
| Race | |||||
| White | 30,707 (55) | 21,282 (38) | 2,241 (4) | 1,774 (3) | <0.001 |
| Black* | 5,112 (27) | 12,239 (65) | 988 (5) | 426 (3) | |
| Other | 11,033 (27) | 26,489 (65) | 2,112 (5) | 1,076 (3) | |
| Missing | 17,145 (42) | 20,216 (49) | 1,572 (4) | 2,007 (4) | |
| Age category | |||||
| <1 year | 10,788 (29) | 24,762 (65) | 1,164 (3) | 880 (3) | <0.001 |
| 1 through 5 years | 33,664 (42) | 39,531 (50) | 3,442 (4) | 2,673 (3) | |
| 6 through 11 years | 11,660 (50) | 9,684 (41) | 1,085 (5) | 1,015 (4) | |
| >12 years | 7,885 (49) | 6,249 (39) | 1,221 (8) | 714 (4) | |
| Hospital type | |||||
| Urban non‐teaching | 22,429 (44) | 24,241 (49) | 2,440 (5) | 1,555 (2) | <0.001 |
| Rural | 10,880 (34) | 18,396 (58) | 1,290 (4) | 1,109 (3) | |
| Urban teaching non‐children's | 13,130 (44) | 14,542 (48) | 1,721 (6) | 750 (2) | |
| Urban teaching children's | 16,591 (40) | 21,544 (53) | 1,417 (3) | 1,465 (4) | |
| Region | |||||
| Northeast | 12,364 (52) | 9,620 (40) | 1,466 (6) | 377 (2) | <0.001 |
| Midwest∥ | 17,891 (50) | 15,573 (43) | 1,160 (3) | 1,215 (3) | |
| South∥ | 21,479 (33) | 38,112 (58) | 3,108 (5) | 2,495 (4) | |
| West∥ | 12,263 (39) | 16,921 (44) | 1,178 (5) | 1,195 (5) | |
| Asthma | 10,829 (41) | 13,923 (52) | 1,119 (4) | 866 (3) | 0.193 |
| Pneumonia‐associated complication | 5,416 (46) | 5,206 (45) | 532 (4) | 556 (5) | <0.001 |
| Died | 66 (34) | 115 (60) | 3 (1) | 8 (5) | 0.131 |
After examining the general and demographic characteristics, we then examined mean LOS for all children with CAP in each sample year (Table 3). The mean LOS for children with CAP was 3.44 days in 1997, with marginal decreases in subsequent years to a mean LOS of 3.18 days in 2006. The distribution of LOS for children with CAP revealed that nearly 70% of children were hospitalized for fewer than 3 days, another 22% to 28% were hospitalized for less than 1 week, and only 3% were hospitalized for more than 1 week. This distribution did not change substantially between 1997 and 2006. Next, we compared mean LOS by insurance type and race/ethnicity in unadjusted analyses. In each sample year, publicly insured children hospitalized with CAP had significantly longer LOS than privately insured children (P < 0.001). Similarly, in all years excepting 1997, uninsured children hospitalized with CAP had significantly shorter LOS than privately insured children. There were also significant racial differences in LOS for children with CAP, such that black children had longer LOS than white children with CAP. However, the large amount of missing data for race/ethnicity limited the robustness of this finding, and subsequent sensitivity analyses demonstrated that there were no consistent racial/ethnic disparities in LOS (see Supporting Appendix B in the online version of this article). These sensitivity analyses for missing race data did not alter our primary finding of shorter LOS for uninsured versus publicly or privately insured children.
| 1997 | P | 2000 | P | 2003 | P | 2006 | P | |
|---|---|---|---|---|---|---|---|---|
| ||||||||
| Overall | 3.44 (0.04) | 3.35 (0.05) | 3.27 (0.05) | 3.18 (0.04) | ||||
| Insurance type | ||||||||
| Private | 3.21 (0.04) | 3.19 (0.04) | 3.09 (0.04) | 3.00 (0.03) | ||||
| Public | 3.71 (0.06) | <0.001 | 3.57 (0.06) | <0.001 | 3.44 (0.06) | <0.001 | 3.34 (0.05) | <0.001 |
| Uninsured | 3.18 (0.14) | 0.792 | 2.92 (0.07) | <0.001 | 2.80 (0.05) | <0.001 | 2.82 (0.05) | <0.001 |
| Other | 3.32 (0.11) | 0.319 | 3.55 (0.14) | 0.0134 | 3.54 (0.21) | 0.037 | 3.42 (0.13) | 0.001 |
| Race | ||||||||
| White | 3.31 (0.05) | 3.18 (0.04) | 3.19 (0.05) | 3.10 (0.04) | ||||
| Black | 3.61 (0.08) | <0.001 | 3.32 (0.07) | <0.001 | 3.36 (0.08) | <0.001 | 3.31 (0.07) | <0.001 |
| Other | 3.96 (0.11) | <0.001 | 3.81 (0.09) | <0.001 | 3.67 (0.10) | <0.001 | 3.56 (0.08) | <0.001 |
| Missing | 3.27 (0.08) | 0.645 | 3.18 (0.08) | 0.926 | 2.99 (0.06) | 0.0134 | 2.86 (0.04) | <0.001 |
After controlling for child age, race/ethnicity, gender, hospital type, transfer status, and presence of asthma or pneumonia‐associated complications, our multivariable analyses examining the relationship between insurance coverage and hospital LOS yielded the following results (Table 4). First, publicly insured children had significantly longer hospital stays than privately insured children, and uninsured children had significantly shorter hospital stays than privately insured children in all years except 1997. Second, children admitted with CAP at urban teaching children's hospitals had significantly longer LOS than those admitted to urban non‐teaching hospitals, and, in 2003, children admitted with CAP to rural hospitals had significantly shorter LOS than those admitted to urban non‐teaching hospitals. Third, children older than 1 year consistently had shorter hospital stays than infants less than 1 year old. Finally, though concomitant diagnosis of asthma did not consistently influence LOS, children who developed any complications had significantly longer LOS than those who did not. The cumulative impact of seemingly small differences in LOS is great. For example, in 2006, our model suggests that, for every 1000 children hospitalized with CAP in a given year, after adjusting for differences in sex, age, race, hospital‐type, region, transfer status, and diagnosis of asthma or complications, publicly insured children spend 90 to 130 more days in the hospital than privately insured children, whereas uninsured children spend between 40 to 90 fewer days in the hospital than privately insured children.
| 1997 | 2000 | 2003 | 2006 | |
|---|---|---|---|---|
| Variable | IRR (95% CI) | IRR (95% CI) | IRR (95% CI) | IRR (95% CI) |
| ||||
| Age category | ||||
| <1 year | ||||
| 15 years | 0.82 (0.81, 0.84) | 0.83 (0.88, 0.95) | 0.86 (0.85, 0.88) | 0.87 (0.86, 0.89) |
| 611 years | 0.91 (0.87, 0.95) | 0.91 (0.88, 0.94) | 0.93 (0.91, 0.95) | 0.93 (0.90, 0.95) |
| >12 years | 1.03 (0.99, 1.07) | 1.17 (1.11, 1.22) | 1.09 (1.06, 1.13) | 1.13 (1.09, 1.16) |
| Race | ||||
| White | ||||
| Black | 1.04 (0.99, 1.08) | 1.00 (0.95, 1.03) | 1.00 (0.98, 1.03) | 1.02 (0.98, 1.06) |
| Other | 1.09 (1.05, 1.13) | 1.11 (1.08, 1.15) | 1.09 (1.06, 1.12) | 1.08 (1.05, 1.11) |
| Missing | 1.00 (0.94, 1.06) | 1.01 (0.96, 1.06) | 0.95 (0.92, 0.99)* | 0.96 (0.93, 0.99) |
| Sex | ||||
| Female | 1.02 (0.94, 1.06) | 1.01 (0.99, 1.02) | 1.01(0.93, 100) | 1.01 (1.00, 1.02) |
| Insurance type | ||||
| Private | ||||
| Public | 1.13 (1.11, 1.16) | 1.11 (1.09, 1.14) | 1.11 (1.09, 1.13) | 1.11 (1.09, 1.13) |
| Uninsured | 1.01 (0.91, 1.11) | 0.93 (0.89, 0.96) | 0.92 (0.90, 0.96) | 0.94 (0.91, 0.96) |
| Other | 1.01 (0.96, 1.06) | 1.10 (1.03, 1.18) | 1.10 (1.02, 1.19)* | 1.07 (1.02, 1.13) |
| Hospital type | ||||
| Urban non‐teaching | ||||
| Rural | 0.98 (0.92, 1.04) | 0.96 (0.92, 1.00) | 0.97 (0.94, 1.00) | 0.97 (0.93, 1.00) |
| Urban teaching (non‐children's) | 0.99 (0.95, 1.04) | 1.06 (1.02, 1.10) | 1.06 (1.02, 1.10) | 1.03 (0.99, 1.07) |
| Urban teaching children's | 1.2 (1.14, 1.26) | 1.23 (1.16, 1.30) | 1.28 (1.21, 1.37) | 1.25 (1.19, 1.31) |
| Region | ||||
| Northeast | ||||
| Midwest | 0.93 (0.88, 0.98)* | 0.96 (0.92, 1.00) | 0.95 (0.91, 0.99)* | 0.95 (0.91, 0.99)* |
| South | 0.98 (0.94, 1.02) | 1.06 (1.02, 1.10)* | 1.04 (1.00, 1.09) | 1.03 (0.98, 1.08) |
| West | 0.97 (0.92, 1.01) | 1.22 (1.16, 1.30)* | 1.02 (0.97, 1.08) | 1.06 (1.00, 1.12)* |
| Transfer status | ||||
| Transfer | 1.35 (1.25, 1.46) | 1.39 (1.27, 1.52) | 1.31 (1.23, 1.37 ) | 1.16 (1.10, 1.23) |
| Asthma | 0.99 (0.96, 1.03) | 0.97 (0.95, 0.99) | 0.98 (0.96, 1.00) | 0.98 (0.97, 1.00)* |
| Pneumonia Complications | 0.99 (0.96, 1.03) | 0.97 (0.95, 0.99)* | 0.98 (0.96, 1.0) | 0.98 (0.97, 1.00)* |
| Any complication | 2.20 (2.07, 2.34) | 2.23 (2.07, 2.40) | 2.22 (2.22, 2.44) | 2.37 (2.27, 2.47) |
DISCUSSION
In this nationally representative sample selected over the past 10 years, we found that publicly insured children hospitalized with CAP have significantly longer LOS than those who are privately insured, and that, since 2000, uninsured children hospitalized with CAP have significantly shorter LOS than those who are privately insured. Though these observed differences are small, they are consistent across all 4 sampled years and, because CAP is one of the most common pediatric inpatient diagnoses, the cumulative impact of the observed differences on hospital LOS is great. Insurance status is often considered a proxy for access to preventive and ambulatory healthcare services or socioeconomic status. However, the underlying mechanisms relating insurance status to healthcare access, utilization, and ultimately, health outcomes are highly complex and difficult to elucidate.17 The observed variation in this study raises questions about the potential influence of insurance status on hospital discharge practices. Additional research is necessary to understand whether there are differences in processes of care (eg, performance of blood cultures or chest radiographs), quality of care, or other outcomes, such as readmissions, related to CAP inpatient management for children with different insurance coverage.
Apart from differences in hospital discharge practices, another possible explanation for uninsured children with CAP having shorter LOS is that these children have less severe disease than privately insured. This may occur if uninsured children with CAP are evaluated in the emergency department rather than the office setting, because emergency department providers may be more likely to admit children with CAP who lack a consistent access to ambulatory primary care services. Countering this alternative, prior studies have shown that uninsured groups are more likely to have greater disease severity than privately insured groups at the time of hospital admission.18, 19 In this study, we attempted to identify children with greater severity of disease using ICD‐9 codes for CAP‐associated complications. Though this is a relatively crude method that might lead to an underestimate of the total number of children with complications, we found that there were no significant differences in the prevalence of CAP‐associated complications between uninsured and insured groups in all sampled years.
On the other hand, uninsured patients may be released earlier by providers in order to reduce the amount of uncompensated care provided, or possibly because parents may urge providers to discharge their children, given their inability to pay forthcoming hospital bills and/or avoid further lost wages due to work absence.20, 21 In California, Bindman et al. demonstrated that decreasing the frequency of Medicaid recertification, and consequently increasing the likelihood of continuous insurance coverage, was associated with a decreased risk of hospitalization for ambulatory‐care sensitive conditions.5
We also found that children admitted to urban teaching children's hospitals with CAP had significantly longer LOS than those admitted to urban non‐teaching hospitals, whereas children in rural hospitals had significantly shorter LOS than those in urban non‐teaching hospitals in 2003. These findings are consistent with prior data from 1996 to1998 demonstrating that children admitted to rural hospitals in New York and Pennsylvania had significantly shorter LOS than large urban hospitals for 19 medical and 9 surgical conditions, including pneumonia.12 These findings may reflect underlying differences in between rural and urban hospital transfer practices, whereby rural hospitals may be more likely than urban hospitals to transfer children with relatively more severe illness to urban referral centers and retain children with less severe illness, leading to shorter LOS.12 Though our empiric understanding of differences in LOS between teaching and non‐teaching hospitals is currently limited, clinical experience supports the notion that there may be decreases in efficiency that occur in teaching hospitals, and are a result of the supervision required for care provided by trainees. It is also possible that, despite our exclusion of comorbid conditions, some children with complex or chronic medical conditions were included in this study. These children are often cared for at teaching hospitals, regardless of the primary cause for admission, and are more likely to have public insurance than other children, thus confounding the relationship between hospital type, insurance type and status, and LOS for children with CAP. The limitations of this dataset preclude further examination of this issue.
There are some limitations to this study. First, the KID data are cross‐sectional and causal inferences are limited. However, our results demonstrating that uninsured children hospitalized with CAP had shorter LOS than privately insured children were quite consistent in each sample year, suggesting that our results are a true association. Additionally, insurance status in KID is typically collected at admission, however, it is not possible to determine whether specific changes to insurance status that occurred during the hospitalization were applied to the data. The impact of this limitation would depend on the type of insurance obtained by the patient. If uninsured patients obtained public insurance, our study would underestimate the increased LOS for publicly insured patients, compared with privately insured patients, but have no effect on the difference in LOS between uninsured and privately insured patients. In the unlikely event that uninsured patients obtained private insurance, then our study would underestimate the difference for uninsured patients, compared with privately insured patients, biasing our current study results towards the null. Second, a substantial proportion of sampled children had missing data for race/ethnicity. To assess the impact of the missing race/ethnicity data on our results, we conducted sensitivity analyses and found that, though difficult to make any definitive conclusions about the relationship between race/ethnicity and LOS for children with CAP, there were no changes to our primary findings regarding differences in LOS between children with different insurance status and type. Third, KID does not include data about other unmeasured confounders (eg, parent income, parent education, regular source of care) that might be related to LOS, as well as a broad spectrum of pediatric outcomes. Serious consideration of expanding KID to include these variables is warranted. Fourth, the other category of insurance is not uniformly coded across states in the KID database. While some states use this category to classify public insurance options other than Medicare and Medicaid, other states include private insurance options in this group. Thus, it is possible that some patients with public insurance are misclassified as having other insurance. We would expect such misclassification to bias our findings towards the null hypothesis. Finally, we focused on the relationship between child health insurance status and CAP, only 1 ambulatory care‐sensitive condition. Additional research examining the relationship between insurance type and other ambulatory care‐sensitive conditions is warranted.
In summary, we found that, after multivariable adjustment, uninsured children hospitalized with community‐acquired pneumonia had significantly shorter LOS than privately insured children, and publicly insured children had a significantly longer hospital stay than privately insured children in these 4 nationally representative samples from 1997 to 2006. Current federal and state efforts to increase enrollment of children into insurance programs are a first step in reducing healthcare disparities. However, insurance coverage alone does not guarantee access to healthcare, thus, these efforts in isolation will likely be insufficient to achieve optimal health for the children of our country. As healthcare reform legislation is implemented, these findings provide hospitals and policy makers additional impetus to develop ways to achieve the ideal length of stay for every child; this ideal state will be achieved when clinical status and course, rather than nonclinical factors such as insurance type or provider's unease with ambulatory follow‐up, determine the duration of hospitalization for every child.
- ,,,,,.Recurrent urinary tract infections in children: risk factors and association with prophylactic antimicrobials.JAMA.2007;298:179–186.
- ,.Factors associated with variability in outcomes for children hospitalized with urinary tract infection.J Pediatr.2009;154:789–796.
- ,,,,.Intravenous immunoglobulin in children with streptococcal toxic shock syndrome.Clin Infect Dis.2009;49:1369–1376.
- ,,.Pediatric hospital adherence to the standard of care for acute gastroenteritis.Pediatrics.2009;124:e1081–e1087.
- ,,.Medicaid re‐enrollment policies and children's risk of hospitalizations for ambulatory care sensitive conditions.Med Care.2008;46:1049–1054.
- ,.Differences associated with age, transfer status, and insurance coverage in end‐of‐life hospital care for children.J Hosp Med.2008;3:376–383.
- ,,,,,.Health care for children and youth in the United States: annual report on patterns of coverage, utilization, quality, and expenditures by a county level of urban influence.Ambul Pediatr.2006;6:241–264.
- ,,.Lengths of stay and costs associated with children's hospitals.Pediatrics.2005;115:839–844.
- ,.Variation in hospital discharges for ambulatory care‐sensitive conditions among children.Pediatrics.2000;106:942–948.
- ,,,,,.Ambulatory visit rates and antibiotic prescribing for children with pneumonia, 1994–2007.Pediatrics.2011;127:411–418.
- ,,,,.Patterns of hospital‐based pediatric care across diverse ethnicities: the case of pneumonia.J Health Care Poor Underserved.2004;15:462–473.
- ,,,,.Equivalent lengths of stay of pediatric patients hospitalized in rural and nonrural hospitals.Pediatrics.2004;114:e400–e408.
- ,.Effect of Child Health Insurance Plan enrollment on the utilization of health care services by children using a public safety net system.Pediatrics.2002;110:940–945.
- ,,,,,.Relationships between welfare status, health insurance status, and health and medical care among children with asthma.Am J Public Health.2002;92:1446–1452.
- HCUP Kids' Inpatient Database (KID). Healthcare Cost and Utilization Project (HCUP), 1997, 2000, 2003, 2006. Agency for Healthcare Research and Quality. Available at: http://www.hcup‐us.ahrq.gov/kidoverview.jsp. Accessed May 17,2010.
- ,,, et al.Community‐acquired pneumonia: can it be defined with claims data?Am J Med Qual.1997;12:187–193.
- .Sicker and poorer—the consequences of being uninsured: a review of the research on the relationship between health insurance, medical care use, health, work, and income.Med Care Res Rev.2003;60:3S–75S; discussion76S–112S.
- ,,,,,.Socioeconomic variation in asthma hospitalization: excess utilization or greater need?Pediatrics.1999;103:e75.
- ,,, et al.Analysis of 23 million US hospitalizations: uninsured children have higher all‐cause in‐hospital mortality.J Public Health (Oxf).2010;32(2)236–244.
- ,.The impact of welfare reform on parents' ability to care for their children's health.Am J Public Health.1999;89:502–505.
- ,,.Knowledge of welfare reform program provisions among families of children with chronic conditions.Am J Public Health.2002;92:228–230.
Disparities in patterns of care and outcomes for ambulatory‐care sensitive conditions remain a persistent problem for children.19 Many studies have focused on disparities in hospitalization rates and length of stay (LOS) related to asthma, however, few studies have focused on community‐acquired pneumonia (CAP) despite the fact that pneumonia is the most common, preventable, and potentially serious infection in childhood.10 Providers, payers, and families have a common interest in minimizing hospital LOS for different reasons (eg, minimizing costs, lost wages, exposure to antibiotic‐resistant bacteria), however, this interest is balanced against the potentially greater risk of readmission and adverse outcomes if LOS is inappropriately short. To date, the relationship between insurance status and LOS for CAP remains unexplored.
As in other conditions, substantial variation exists with respect to patterns of care and outcomes for children hospitalized with CAP.11 For example, children hospitalized in rural settings have a shorter LOS for pneumonia than those hospitalized in large urban settings.12 Children from racial/ethnic minorities tend to have higher rates of CAP‐associated complications, including death.11 Decades of prior studies have documented that uninsured children are less likely than insured children to make preventive care visits and obtain prescription medications, but differences in LOS or hospitalization rates between insured and uninsured children with CAP have not been studied.6, 8, 13, 14 Though imperfect, insurance status is 1 proxy for healthcare access, and current healthcare reform efforts aim to improve healthcare access and decrease socioeconomic gradients in health by increasing the number of insured American children. Nonetheless, quantifying the relationship between insurance status on LOS for children hospitalized with CAP is a first step towards understanding the influence of ambulatory care access on hospitalization for ambulatory‐care sensitive conditions.
The purpose of this study was to investigate the influence of insurance status and type on LOS for children hospitalized with CAP. In addition, we sought to determine if there were consistent trends over time in the association between insurance status and type with LOS for children hospitalized with CAP.
METHODS
Study Design and Data Source
This retrospective cross‐sectional study used data from the 1997, 2000, 2003, and 2006 Kids' Inpatient Database (KID). The KID is part of the Healthcare Cost and Utilization Project sponsored by the Agency for Healthcare Research and Quality (AHRQ). It is the only dataset on hospital use and outcomes specifically designed to study children's use of hospital services in the United States. The KID samples pediatric discharges from all community non‐rehabilitation hospitals in states participating in the Healthcare Cost and Utilization Project, using a complex stratification system, across pediatric discharge type and hospital characteristics. Community hospitals in the KID are defined as all non‐federal, short‐term, general and other specialty hospitals, including academic medical centers, obstetrics‐gynecology, otolaryngology, orthopedic, and children's hospitals. Federal hospitals, long‐term hospitals, psychiatric hospitals, alcohol/chemical dependency treatment facilities and hospitals units within institutions are excluded. Discharge‐level weights assigned to discharges within the stratum permit calculation of national estimates. Datasets, which each contain approximately 3 million discharges (unweighted), are released every 3 years beginning with 1997. The 2006 KID is the most recently available dataset and contains hospital administrative data from 38 states, representing 88.8% of the estimated US population.15 This study was considered exempt from review by the Committees for the Protection of Human Subjects at The Children's Hospital of Philadelphia.
Study Participants
Patients 18 years of age and younger were eligible for inclusion if they required hospitalization for CAP in 1997, 2000, 2003, or 2006. Using a previously validated algorithm, patients were considered as having CAP if they met 1 of 2 criteria: 1) International Classification of Diseases, 9th Revision, Clinical Modification (ICD‐9 CM) primary diagnosis code indicating pneumonia (480‐483, 485‐486), empyema (510), or pleurisy (511.0‐1, 511.9); or 2) primary diagnosis of pneumonia‐related symptom (eg, cough, fever, tachypnea) and secondary diagnosis of pneumonia, empyema or pleurisy. Pneumonia‐related symptoms included fever, respiratory abnormality unspecified, shortness of breath, tachypnea, wheezing, cough, hemoptysis, abnormal sputum, chest pain, and abnormal chest sounds.16 Because there is no specific ICD‐9 code for nosocomial pneumonia, this previously validated approach minimized such misclassification16 (eg, a child hospitalized following traumatic injury who then develops ventilator‐associated pneumonia is likely to have trauma, rather than pneumonia or a pneumonia‐related symptom, listed as the primary diagnosis). Patients with the following comorbid conditions (identified by KID data elements and ICD‐9 CM codes) were excluded as these comorbidities are characterized by risk factors not reflective of the general pediatric population: acquired and congenital immunologic disorders, malignancy, collagen vascular disease, sickle cell disease, cystic fibrosis, organ transplant, congenital heart defects, and heart failure. Patients identified as in‐hospital births were excluded to minimize the inclusion of perinatally acquired and nosocomial infections occurring in neonates. Patients with a secondary diagnosis code indicating trauma were also excluded, as a diagnosis of pneumonia in this population likely reflects nosocomial etiology. CAP‐related complications (eg, effusion, abscess; for complete list, see Supporting Appendix A in the online version of this article) were identified using ICD‐9 CM diagnosis and procedure codes. Asthma‐related hospitalizations were identified using ICD‐9 CM diagnosis code 493 in any secondary diagnosis field.
Primary Exposure
The primary exposure was insurance type, categorized as private, public, uninsured, or other (eg, Civilian Health and Medical Program Uniform Service (CHAMPUS), worker's compensation, union‐based insurance, but definition varies by state precluding categorization as purely public or private).
Primary Outcome
The primary outcome was the hospital LOS calculated in days.
Statistical Analysis
Consistent with prior work,12 subjects were characterized by age, race, sex, the presence or absence of a pneumonia‐associated complication, discharge status (discharge from hospital vs in‐hospital death), hospital type (rural, urban non‐teaching, urban teaching non‐children's, urban teaching children's), and hospital region (Northeast, Midwest, South, West). Age groups for analysis were defined as <1 year (infant), 1 to 5 years (preschool age), 6 to 11 years (school‐age), and 12 to 18 years old (adolescent). Race was recorded as a single variable (white, black, other, and missing). Patient information for race was missing from 32% of discharges in 1997, 18% in 2000, 29% in 2003, and 26% in 2006. Patients with missing race data were included to preserve the integrity of our estimates. Categorical variables were summarized by frequencies and percents. Continuous variables were summarized by mean and standard deviation values.
All analyses accounted for the complex sampling design with the survey commands included in STATA, version 10 (College Station, TX) to produce weighted estimates. To determine the adjusted impact of patient and hospital‐level characteristics in our cohort, we constructed multivariable negative binomial regression models using all available covariates for LOS because of its rightward‐skewed distribution. The negative binomial model produced an incident rate ratio (IRR) for LOS (IRR >1 indicates that the risk factor is associated with a longer length of stay). As recommended in the AHRQ technical documentation, variance estimates for each model accounted for the clustering of data at the hospital level. To address the impact of missing race data on outcome, we constructed additional multivariable negative binomial regression models while varying the underlying assumptions about race classification. In these secondary analyses, children with race coded as missing were sequentially excluded, assumed to be white, and assumed to be black. These analyses were repeated after excluding insurance from the multivariable model.
RESULTS
The more than 10.5 million children sampled (unweighted) in KID during these 4 time periods (1997, 2000, 2003, and 2006) are representative of the more than 28.9 million children hospitalized in the United States. In each of these sample years, there were approximately 150,000 children hospitalized with pneumonia across the United States (Table 1). Of those hospitalized, 23% to 28% had a concomitant diagnosis of asthma; 6% to 8% had a pneumonia‐associated complication; and mortality was <0.01% in each sample year for patients hospitalized with pneumonia. In all years, among those with racial/ethnic data, the sample population was predominantly white boys less than 6 years old. The greatest proportion of children were hospitalized in urban non‐teaching settings, and also those children living in the southern regions of the United States.
| 1997 | 2000 | 2003 | 2006 | |
|---|---|---|---|---|
| N = 148,702 | N = 157,847 | N = 157,743 | N = 156,810 | |
| ||||
| Race | ||||
| White | 56,348 (38) | 68,643 (44) | 54,903 (35) | 56,108 (36) |
| Black | 22,864 (15) | 22,580 (14) | 17,960 (11) | 18,800 (12) |
| Other | 22,203 (15) | 38,448 (24) | 39,138 (25) | 40,803 (26) |
| Missing | 47,287 (32) | 28,175 (18) | 45,588 (29) | 41,099 (26) |
| Age category | ||||
| <1 year | 43,851 (29) | 44,470 (28) | 37,798 (24) | 37,705 (24) |
| 1 through 5 years | 75,033 (50) | 76,385 (48) | 77,530 (49) | 79,519 (51) |
| 6 through 11 years | 19,372 (13) | 21,403 (14) | 23,126 (15) | 23,494 (15) |
| >12 years | 10,446 (7) | 15,589 (9) | 19,289 (12) | 16,092 (10) |
| Hospital type | ||||
| Urban non‐teaching | 52,756 (35) | 50,718 (32) | 52,552 (34) | 50,718 (32) |
| Rural | 47,910 (32) | 41,715 (27) | 39,605 (26) | 31,947 (21) |
| Urban teaching non‐children's | 20,378 (14) | 30,981 (20) | 28,432 (18) | 30,194 (20) |
| Urban teaching children's | 27,658 (19) | 34,021 (22) | 34,454 (22) | 41,035 (27) |
| Male sex | 83,291 (56) | 8,783 (56) | 86,034 (55) | 85,508 (55) |
| Region* | ||||
| Northeast | 19,750 (13) | 26,092 (17) | 23,867 (15) | 23,832 (15) |
| Midwest | 33,053 (22) | 30,706 (19) | 35,714 (23) | 35,900 (23) |
| South | 68,958 (46) | 68,663 (44) | 65,994 (42) | 65,460 (42) |
| West | 26,741 (18) | 32,385 (21) | 32,169 (20) | 31,618 (20) |
| Asthma | 26,971 (24) | 31,746 (28) | 27,729 (24) | 26,822 (23) |
| Pneumonia‐associated complication | 8,831 (6) | 11,084 (7) | 12,005 (8) | 11,724 (7) |
| Died | 334 (0.002) | 394 (0.002) | 270 (0.002) | 193 (0.001) |
| Insurance | ||||
| Private | 65,428 (44) | 73,528 (47) | 68,720 (44) | 63,997 (41) |
| Public | 68,024 (46) | 71,698 (45) | 76,779 (49) | 80,226 (51) |
| Uninsured | 9,922 (7) | 8,336 (5) | 6,381 (4) | 6,912 (4) |
| Other | 4,964 (3) | 4,285 (3) | 5,391 (3) | 5,283 (3) |
There was little variation in the insurance status of children hospitalized with CAP between 1997 and 2006. In each of the sampled years, at least 40% of sampled children were privately insured, at least 40% were publicly insured, and approximately 5% were uninsured (Table 1). In all years, there were significant racial/ethnic disparities in insurance coverage such that whites were 4 to 6 times more likely to have private insurance than blacks, however, the large amount of missing race/ethnicity data warrant caution in interpreting this finding (Table 2; also see Supporting Information Appendix B in the online version of this article). We also found that children less than 1 year old were the most likely to be publicly insured in all years (see Supporting Appendix C in the online version of this article). There were also regional differences related to insurance coverage such that a greater proportion of children hospitalized in facilities located in the southern part of the United States were publicly insured. Notably, there were no significant differences in CAP‐associated mortality or asthma related to insurance coverage (Table 2). In 2006, CAP‐associated complications occurred in 8.5% of children with private insurance, 6.5% of children with public insurance, and 7.7% of uninsured children; the relative distribution of complications by insurance type were similar in previous years of the KID survey.
| Private | Public | Uninsured | Other Insurance | P | |
|---|---|---|---|---|---|
| |||||
| No. of children (%) | 63,997 (41) | 80,226 (51) | 6,912 (4) | 5,283 (3) | |
| Male sex | 34,639 (41) | 44,140 (52) | 3,727 (4) | 2,808 (3) | 0.092 |
| Race | |||||
| White | 30,707 (55) | 21,282 (38) | 2,241 (4) | 1,774 (3) | <0.001 |
| Black* | 5,112 (27) | 12,239 (65) | 988 (5) | 426 (3) | |
| Other | 11,033 (27) | 26,489 (65) | 2,112 (5) | 1,076 (3) | |
| Missing | 17,145 (42) | 20,216 (49) | 1,572 (4) | 2,007 (4) | |
| Age category | |||||
| <1 year | 10,788 (29) | 24,762 (65) | 1,164 (3) | 880 (3) | <0.001 |
| 1 through 5 years | 33,664 (42) | 39,531 (50) | 3,442 (4) | 2,673 (3) | |
| 6 through 11 years | 11,660 (50) | 9,684 (41) | 1,085 (5) | 1,015 (4) | |
| >12 years | 7,885 (49) | 6,249 (39) | 1,221 (8) | 714 (4) | |
| Hospital type | |||||
| Urban non‐teaching | 22,429 (44) | 24,241 (49) | 2,440 (5) | 1,555 (2) | <0.001 |
| Rural | 10,880 (34) | 18,396 (58) | 1,290 (4) | 1,109 (3) | |
| Urban teaching non‐children's | 13,130 (44) | 14,542 (48) | 1,721 (6) | 750 (2) | |
| Urban teaching children's | 16,591 (40) | 21,544 (53) | 1,417 (3) | 1,465 (4) | |
| Region | |||||
| Northeast | 12,364 (52) | 9,620 (40) | 1,466 (6) | 377 (2) | <0.001 |
| Midwest∥ | 17,891 (50) | 15,573 (43) | 1,160 (3) | 1,215 (3) | |
| South∥ | 21,479 (33) | 38,112 (58) | 3,108 (5) | 2,495 (4) | |
| West∥ | 12,263 (39) | 16,921 (44) | 1,178 (5) | 1,195 (5) | |
| Asthma | 10,829 (41) | 13,923 (52) | 1,119 (4) | 866 (3) | 0.193 |
| Pneumonia‐associated complication | 5,416 (46) | 5,206 (45) | 532 (4) | 556 (5) | <0.001 |
| Died | 66 (34) | 115 (60) | 3 (1) | 8 (5) | 0.131 |
After examining the general and demographic characteristics, we then examined mean LOS for all children with CAP in each sample year (Table 3). The mean LOS for children with CAP was 3.44 days in 1997, with marginal decreases in subsequent years to a mean LOS of 3.18 days in 2006. The distribution of LOS for children with CAP revealed that nearly 70% of children were hospitalized for fewer than 3 days, another 22% to 28% were hospitalized for less than 1 week, and only 3% were hospitalized for more than 1 week. This distribution did not change substantially between 1997 and 2006. Next, we compared mean LOS by insurance type and race/ethnicity in unadjusted analyses. In each sample year, publicly insured children hospitalized with CAP had significantly longer LOS than privately insured children (P < 0.001). Similarly, in all years excepting 1997, uninsured children hospitalized with CAP had significantly shorter LOS than privately insured children. There were also significant racial differences in LOS for children with CAP, such that black children had longer LOS than white children with CAP. However, the large amount of missing data for race/ethnicity limited the robustness of this finding, and subsequent sensitivity analyses demonstrated that there were no consistent racial/ethnic disparities in LOS (see Supporting Appendix B in the online version of this article). These sensitivity analyses for missing race data did not alter our primary finding of shorter LOS for uninsured versus publicly or privately insured children.
| 1997 | P | 2000 | P | 2003 | P | 2006 | P | |
|---|---|---|---|---|---|---|---|---|
| ||||||||
| Overall | 3.44 (0.04) | 3.35 (0.05) | 3.27 (0.05) | 3.18 (0.04) | ||||
| Insurance type | ||||||||
| Private | 3.21 (0.04) | 3.19 (0.04) | 3.09 (0.04) | 3.00 (0.03) | ||||
| Public | 3.71 (0.06) | <0.001 | 3.57 (0.06) | <0.001 | 3.44 (0.06) | <0.001 | 3.34 (0.05) | <0.001 |
| Uninsured | 3.18 (0.14) | 0.792 | 2.92 (0.07) | <0.001 | 2.80 (0.05) | <0.001 | 2.82 (0.05) | <0.001 |
| Other | 3.32 (0.11) | 0.319 | 3.55 (0.14) | 0.0134 | 3.54 (0.21) | 0.037 | 3.42 (0.13) | 0.001 |
| Race | ||||||||
| White | 3.31 (0.05) | 3.18 (0.04) | 3.19 (0.05) | 3.10 (0.04) | ||||
| Black | 3.61 (0.08) | <0.001 | 3.32 (0.07) | <0.001 | 3.36 (0.08) | <0.001 | 3.31 (0.07) | <0.001 |
| Other | 3.96 (0.11) | <0.001 | 3.81 (0.09) | <0.001 | 3.67 (0.10) | <0.001 | 3.56 (0.08) | <0.001 |
| Missing | 3.27 (0.08) | 0.645 | 3.18 (0.08) | 0.926 | 2.99 (0.06) | 0.0134 | 2.86 (0.04) | <0.001 |
After controlling for child age, race/ethnicity, gender, hospital type, transfer status, and presence of asthma or pneumonia‐associated complications, our multivariable analyses examining the relationship between insurance coverage and hospital LOS yielded the following results (Table 4). First, publicly insured children had significantly longer hospital stays than privately insured children, and uninsured children had significantly shorter hospital stays than privately insured children in all years except 1997. Second, children admitted with CAP at urban teaching children's hospitals had significantly longer LOS than those admitted to urban non‐teaching hospitals, and, in 2003, children admitted with CAP to rural hospitals had significantly shorter LOS than those admitted to urban non‐teaching hospitals. Third, children older than 1 year consistently had shorter hospital stays than infants less than 1 year old. Finally, though concomitant diagnosis of asthma did not consistently influence LOS, children who developed any complications had significantly longer LOS than those who did not. The cumulative impact of seemingly small differences in LOS is great. For example, in 2006, our model suggests that, for every 1000 children hospitalized with CAP in a given year, after adjusting for differences in sex, age, race, hospital‐type, region, transfer status, and diagnosis of asthma or complications, publicly insured children spend 90 to 130 more days in the hospital than privately insured children, whereas uninsured children spend between 40 to 90 fewer days in the hospital than privately insured children.
| 1997 | 2000 | 2003 | 2006 | |
|---|---|---|---|---|
| Variable | IRR (95% CI) | IRR (95% CI) | IRR (95% CI) | IRR (95% CI) |
| ||||
| Age category | ||||
| <1 year | ||||
| 15 years | 0.82 (0.81, 0.84) | 0.83 (0.88, 0.95) | 0.86 (0.85, 0.88) | 0.87 (0.86, 0.89) |
| 611 years | 0.91 (0.87, 0.95) | 0.91 (0.88, 0.94) | 0.93 (0.91, 0.95) | 0.93 (0.90, 0.95) |
| >12 years | 1.03 (0.99, 1.07) | 1.17 (1.11, 1.22) | 1.09 (1.06, 1.13) | 1.13 (1.09, 1.16) |
| Race | ||||
| White | ||||
| Black | 1.04 (0.99, 1.08) | 1.00 (0.95, 1.03) | 1.00 (0.98, 1.03) | 1.02 (0.98, 1.06) |
| Other | 1.09 (1.05, 1.13) | 1.11 (1.08, 1.15) | 1.09 (1.06, 1.12) | 1.08 (1.05, 1.11) |
| Missing | 1.00 (0.94, 1.06) | 1.01 (0.96, 1.06) | 0.95 (0.92, 0.99)* | 0.96 (0.93, 0.99) |
| Sex | ||||
| Female | 1.02 (0.94, 1.06) | 1.01 (0.99, 1.02) | 1.01(0.93, 100) | 1.01 (1.00, 1.02) |
| Insurance type | ||||
| Private | ||||
| Public | 1.13 (1.11, 1.16) | 1.11 (1.09, 1.14) | 1.11 (1.09, 1.13) | 1.11 (1.09, 1.13) |
| Uninsured | 1.01 (0.91, 1.11) | 0.93 (0.89, 0.96) | 0.92 (0.90, 0.96) | 0.94 (0.91, 0.96) |
| Other | 1.01 (0.96, 1.06) | 1.10 (1.03, 1.18) | 1.10 (1.02, 1.19)* | 1.07 (1.02, 1.13) |
| Hospital type | ||||
| Urban non‐teaching | ||||
| Rural | 0.98 (0.92, 1.04) | 0.96 (0.92, 1.00) | 0.97 (0.94, 1.00) | 0.97 (0.93, 1.00) |
| Urban teaching (non‐children's) | 0.99 (0.95, 1.04) | 1.06 (1.02, 1.10) | 1.06 (1.02, 1.10) | 1.03 (0.99, 1.07) |
| Urban teaching children's | 1.2 (1.14, 1.26) | 1.23 (1.16, 1.30) | 1.28 (1.21, 1.37) | 1.25 (1.19, 1.31) |
| Region | ||||
| Northeast | ||||
| Midwest | 0.93 (0.88, 0.98)* | 0.96 (0.92, 1.00) | 0.95 (0.91, 0.99)* | 0.95 (0.91, 0.99)* |
| South | 0.98 (0.94, 1.02) | 1.06 (1.02, 1.10)* | 1.04 (1.00, 1.09) | 1.03 (0.98, 1.08) |
| West | 0.97 (0.92, 1.01) | 1.22 (1.16, 1.30)* | 1.02 (0.97, 1.08) | 1.06 (1.00, 1.12)* |
| Transfer status | ||||
| Transfer | 1.35 (1.25, 1.46) | 1.39 (1.27, 1.52) | 1.31 (1.23, 1.37 ) | 1.16 (1.10, 1.23) |
| Asthma | 0.99 (0.96, 1.03) | 0.97 (0.95, 0.99) | 0.98 (0.96, 1.00) | 0.98 (0.97, 1.00)* |
| Pneumonia Complications | 0.99 (0.96, 1.03) | 0.97 (0.95, 0.99)* | 0.98 (0.96, 1.0) | 0.98 (0.97, 1.00)* |
| Any complication | 2.20 (2.07, 2.34) | 2.23 (2.07, 2.40) | 2.22 (2.22, 2.44) | 2.37 (2.27, 2.47) |
DISCUSSION
In this nationally representative sample selected over the past 10 years, we found that publicly insured children hospitalized with CAP have significantly longer LOS than those who are privately insured, and that, since 2000, uninsured children hospitalized with CAP have significantly shorter LOS than those who are privately insured. Though these observed differences are small, they are consistent across all 4 sampled years and, because CAP is one of the most common pediatric inpatient diagnoses, the cumulative impact of the observed differences on hospital LOS is great. Insurance status is often considered a proxy for access to preventive and ambulatory healthcare services or socioeconomic status. However, the underlying mechanisms relating insurance status to healthcare access, utilization, and ultimately, health outcomes are highly complex and difficult to elucidate.17 The observed variation in this study raises questions about the potential influence of insurance status on hospital discharge practices. Additional research is necessary to understand whether there are differences in processes of care (eg, performance of blood cultures or chest radiographs), quality of care, or other outcomes, such as readmissions, related to CAP inpatient management for children with different insurance coverage.
Apart from differences in hospital discharge practices, another possible explanation for uninsured children with CAP having shorter LOS is that these children have less severe disease than privately insured. This may occur if uninsured children with CAP are evaluated in the emergency department rather than the office setting, because emergency department providers may be more likely to admit children with CAP who lack a consistent access to ambulatory primary care services. Countering this alternative, prior studies have shown that uninsured groups are more likely to have greater disease severity than privately insured groups at the time of hospital admission.18, 19 In this study, we attempted to identify children with greater severity of disease using ICD‐9 codes for CAP‐associated complications. Though this is a relatively crude method that might lead to an underestimate of the total number of children with complications, we found that there were no significant differences in the prevalence of CAP‐associated complications between uninsured and insured groups in all sampled years.
On the other hand, uninsured patients may be released earlier by providers in order to reduce the amount of uncompensated care provided, or possibly because parents may urge providers to discharge their children, given their inability to pay forthcoming hospital bills and/or avoid further lost wages due to work absence.20, 21 In California, Bindman et al. demonstrated that decreasing the frequency of Medicaid recertification, and consequently increasing the likelihood of continuous insurance coverage, was associated with a decreased risk of hospitalization for ambulatory‐care sensitive conditions.5
We also found that children admitted to urban teaching children's hospitals with CAP had significantly longer LOS than those admitted to urban non‐teaching hospitals, whereas children in rural hospitals had significantly shorter LOS than those in urban non‐teaching hospitals in 2003. These findings are consistent with prior data from 1996 to1998 demonstrating that children admitted to rural hospitals in New York and Pennsylvania had significantly shorter LOS than large urban hospitals for 19 medical and 9 surgical conditions, including pneumonia.12 These findings may reflect underlying differences in between rural and urban hospital transfer practices, whereby rural hospitals may be more likely than urban hospitals to transfer children with relatively more severe illness to urban referral centers and retain children with less severe illness, leading to shorter LOS.12 Though our empiric understanding of differences in LOS between teaching and non‐teaching hospitals is currently limited, clinical experience supports the notion that there may be decreases in efficiency that occur in teaching hospitals, and are a result of the supervision required for care provided by trainees. It is also possible that, despite our exclusion of comorbid conditions, some children with complex or chronic medical conditions were included in this study. These children are often cared for at teaching hospitals, regardless of the primary cause for admission, and are more likely to have public insurance than other children, thus confounding the relationship between hospital type, insurance type and status, and LOS for children with CAP. The limitations of this dataset preclude further examination of this issue.
There are some limitations to this study. First, the KID data are cross‐sectional and causal inferences are limited. However, our results demonstrating that uninsured children hospitalized with CAP had shorter LOS than privately insured children were quite consistent in each sample year, suggesting that our results are a true association. Additionally, insurance status in KID is typically collected at admission, however, it is not possible to determine whether specific changes to insurance status that occurred during the hospitalization were applied to the data. The impact of this limitation would depend on the type of insurance obtained by the patient. If uninsured patients obtained public insurance, our study would underestimate the increased LOS for publicly insured patients, compared with privately insured patients, but have no effect on the difference in LOS between uninsured and privately insured patients. In the unlikely event that uninsured patients obtained private insurance, then our study would underestimate the difference for uninsured patients, compared with privately insured patients, biasing our current study results towards the null. Second, a substantial proportion of sampled children had missing data for race/ethnicity. To assess the impact of the missing race/ethnicity data on our results, we conducted sensitivity analyses and found that, though difficult to make any definitive conclusions about the relationship between race/ethnicity and LOS for children with CAP, there were no changes to our primary findings regarding differences in LOS between children with different insurance status and type. Third, KID does not include data about other unmeasured confounders (eg, parent income, parent education, regular source of care) that might be related to LOS, as well as a broad spectrum of pediatric outcomes. Serious consideration of expanding KID to include these variables is warranted. Fourth, the other category of insurance is not uniformly coded across states in the KID database. While some states use this category to classify public insurance options other than Medicare and Medicaid, other states include private insurance options in this group. Thus, it is possible that some patients with public insurance are misclassified as having other insurance. We would expect such misclassification to bias our findings towards the null hypothesis. Finally, we focused on the relationship between child health insurance status and CAP, only 1 ambulatory care‐sensitive condition. Additional research examining the relationship between insurance type and other ambulatory care‐sensitive conditions is warranted.
In summary, we found that, after multivariable adjustment, uninsured children hospitalized with community‐acquired pneumonia had significantly shorter LOS than privately insured children, and publicly insured children had a significantly longer hospital stay than privately insured children in these 4 nationally representative samples from 1997 to 2006. Current federal and state efforts to increase enrollment of children into insurance programs are a first step in reducing healthcare disparities. However, insurance coverage alone does not guarantee access to healthcare, thus, these efforts in isolation will likely be insufficient to achieve optimal health for the children of our country. As healthcare reform legislation is implemented, these findings provide hospitals and policy makers additional impetus to develop ways to achieve the ideal length of stay for every child; this ideal state will be achieved when clinical status and course, rather than nonclinical factors such as insurance type or provider's unease with ambulatory follow‐up, determine the duration of hospitalization for every child.
- ,,,,,.Recurrent urinary tract infections in children: risk factors and association with prophylactic antimicrobials.JAMA.2007;298:179–186.
- ,.Factors associated with variability in outcomes for children hospitalized with urinary tract infection.J Pediatr.2009;154:789–796.
- ,,,,.Intravenous immunoglobulin in children with streptococcal toxic shock syndrome.Clin Infect Dis.2009;49:1369–1376.
- ,,.Pediatric hospital adherence to the standard of care for acute gastroenteritis.Pediatrics.2009;124:e1081–e1087.
- ,,.Medicaid re‐enrollment policies and children's risk of hospitalizations for ambulatory care sensitive conditions.Med Care.2008;46:1049–1054.
- ,.Differences associated with age, transfer status, and insurance coverage in end‐of‐life hospital care for children.J Hosp Med.2008;3:376–383.
- ,,,,,.Health care for children and youth in the United States: annual report on patterns of coverage, utilization, quality, and expenditures by a county level of urban influence.Ambul Pediatr.2006;6:241–264.
- ,,.Lengths of stay and costs associated with children's hospitals.Pediatrics.2005;115:839–844.
- ,.Variation in hospital discharges for ambulatory care‐sensitive conditions among children.Pediatrics.2000;106:942–948.
- ,,,,,.Ambulatory visit rates and antibiotic prescribing for children with pneumonia, 1994–2007.Pediatrics.2011;127:411–418.
- ,,,,.Patterns of hospital‐based pediatric care across diverse ethnicities: the case of pneumonia.J Health Care Poor Underserved.2004;15:462–473.
- ,,,,.Equivalent lengths of stay of pediatric patients hospitalized in rural and nonrural hospitals.Pediatrics.2004;114:e400–e408.
- ,.Effect of Child Health Insurance Plan enrollment on the utilization of health care services by children using a public safety net system.Pediatrics.2002;110:940–945.
- ,,,,,.Relationships between welfare status, health insurance status, and health and medical care among children with asthma.Am J Public Health.2002;92:1446–1452.
- HCUP Kids' Inpatient Database (KID). Healthcare Cost and Utilization Project (HCUP), 1997, 2000, 2003, 2006. Agency for Healthcare Research and Quality. Available at: http://www.hcup‐us.ahrq.gov/kidoverview.jsp. Accessed May 17,2010.
- ,,, et al.Community‐acquired pneumonia: can it be defined with claims data?Am J Med Qual.1997;12:187–193.
- .Sicker and poorer—the consequences of being uninsured: a review of the research on the relationship between health insurance, medical care use, health, work, and income.Med Care Res Rev.2003;60:3S–75S; discussion76S–112S.
- ,,,,,.Socioeconomic variation in asthma hospitalization: excess utilization or greater need?Pediatrics.1999;103:e75.
- ,,, et al.Analysis of 23 million US hospitalizations: uninsured children have higher all‐cause in‐hospital mortality.J Public Health (Oxf).2010;32(2)236–244.
- ,.The impact of welfare reform on parents' ability to care for their children's health.Am J Public Health.1999;89:502–505.
- ,,.Knowledge of welfare reform program provisions among families of children with chronic conditions.Am J Public Health.2002;92:228–230.
Copyright © 2011 Society of Hospital Medicine