User login
Incident Database
Recognition that healthcare carries considerable risks of patient injury has focused efforts on identifying problems before they occur, and understanding the root causes of those problems that do occur to prevent them from happening again.1 To further these efforts, a Joint Commission (JC) standard requires hospitals to review sentinel events (SE).2 Reviews must develop a timely, thorough, and credible root cause analysis (RCA), implement action plans to reduce risk, and monitor the effectiveness of implemented improvements.3
Ideally, hospitals would summarize their experiences with SE reviews, identify high‐risk activities and patients, institute system changes to prevent SE recurrences, and share their findings with other healthcare organizations to help them avoid similar patient injuries.1 In support of this last goal, the JC maintains a voluntary database system that allows hospitals to report their SE analyses for other facilities to review and institute preventative actions.
Unfortunately, the reality of SE reviews does not match their ideals for improving patient safety.4 Healthcare organizations often describe their review process as less than credible and note a need for ongoing oversight to maintain the reviews' effectiveness.5 The JC voluntary reporting system captures less than 1% of the SEs that occur nationally,2 because hospitals perceive barriers to external reporting.1 If healthcare organizations decide against reporting externally, they can create their own internal systems to aggregate and summarize SEs, but few such systems exist. A major impediment to designing internal systems is the absence of universally endorsed nomenclature for safety‐related events.6, 7 Poorly aligned terminology and subjective conceptualizations for safety incidents impede the aggregation of SEs, comparisons between facilities, and trend analyses for tracking SE patterns.
In 2005, the World Health Organization (WHO) World Alliance for Patient Safety, in collaboration with the JC, began developing an International Classification for Patient Safety (ICPS) to provide healthcare organizations a consistent conceptual model for safety incidents and promote their classification by a standardized taxonomy.810 Although this system has promise for allowing standardization, data aggregation, analysis, and learning between institutions,11 integration of the ICPS conceptual model into an SE decision support tool with summarizing and reporting features has not been reported.
This report describes our development of an intranet‐based SE reporting system, called Incident Tracker (I‐Tracker), based on the ICPS model. For our SE review groups from the 4 Providence Health Systems (PHS) Portland Service Area (PSA) hospitals, the I‐Tracker system offers a tool to guide efforts in developing RCAs and action plans in alignment with the ICPS framework. The system includes scripts that automatically generate and distribute standardized reports of individual and aggregated SEs. The objectives of this project were to report our experience with developing a flexible and accessible intranet‐based system that assists RCA participants in conforming to the ICPS framework and oversight safety staff in summarizing and reporting root cause analyses.
METHODS
The 4 PSA hospitals have 1083 licensed beds and perform SE reviews with a centralized process that reports results to a Community Governing Board. An ad hoc team for each SE performs the RCAs. The SE groups report RCAs and action plans in an unstructured format that varies for each event. A paper file is maintained for each SE report, but a system for aggregating reports to track trends, disseminating SE trends, or monitoring the completion or effectiveness of action plans is not available.
We designed a system to achieve the following objectives:
-
Apply the ICPS framework (Figure 1) and taxonomy of terms to SE analyses;
-
Provide a computer‐based tool to assist review groups and quality staff to perform their SE reviews and data collection in alignment with the ICPS framework;
-
Create an intranet‐based database that captures elements of the reviews, RCAs, and action plans with the use of drop‐down lists, help windows, windows with live access to Internet educational resources and tools, decision support tools, default entries, and audio prompts to streamline data entry;
-
Generate a suite of standardized reports customized for different audiences that can be accessed online and printed from the database with automated scripts;
-
Produce intranet‐based summaries of aggregated events to identify common causes and disseminate observed patterns and action plans to other PSA hospitals.
We selected FileMaker Pro 11 Advanced (FMP11) for authoring and maintaining the decision support tool and database, and FileMaker Pro Server 11 Advanced (FMPS11) (Filemaker, Inc, Santa Clara, CA) for hosting the system, because it provides intranet access and tools for updating the system by personnel with minimal programming experience. End users can view and enter data through layouts that display only the information allowed by the user's login password and access privileges, with external authentication by Active Directory and Open Directory technology. Staff who author and manage the database do so through client FMP11 software loaded on a computer that provides remote server access.
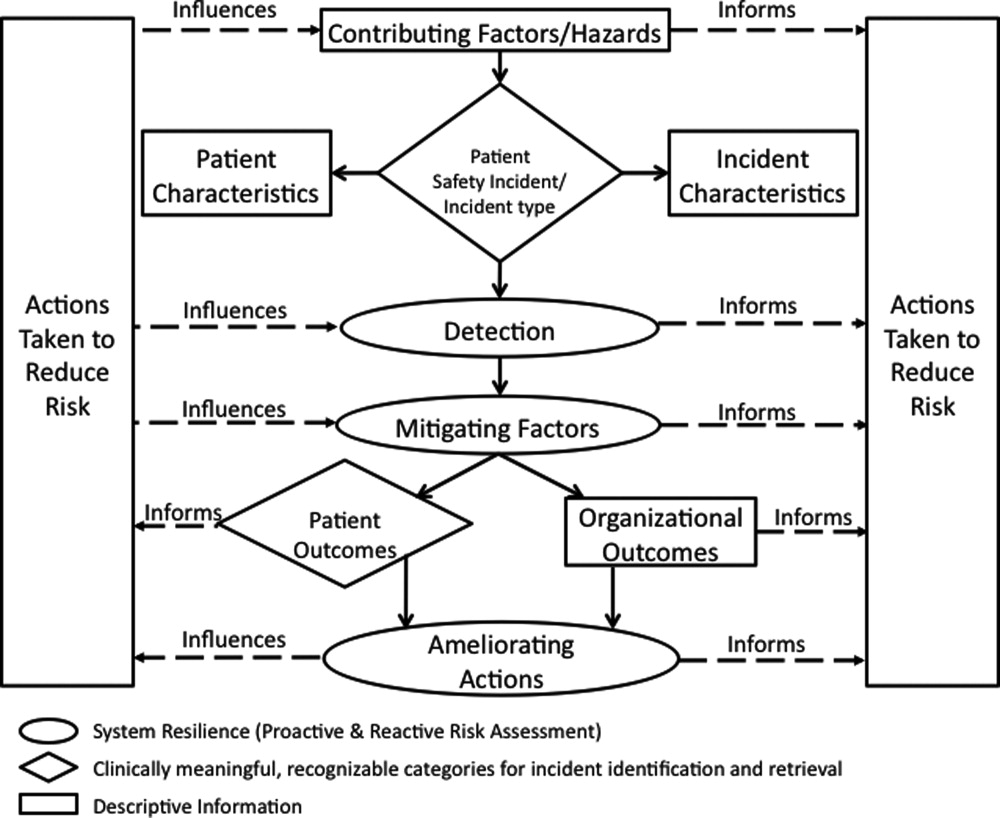
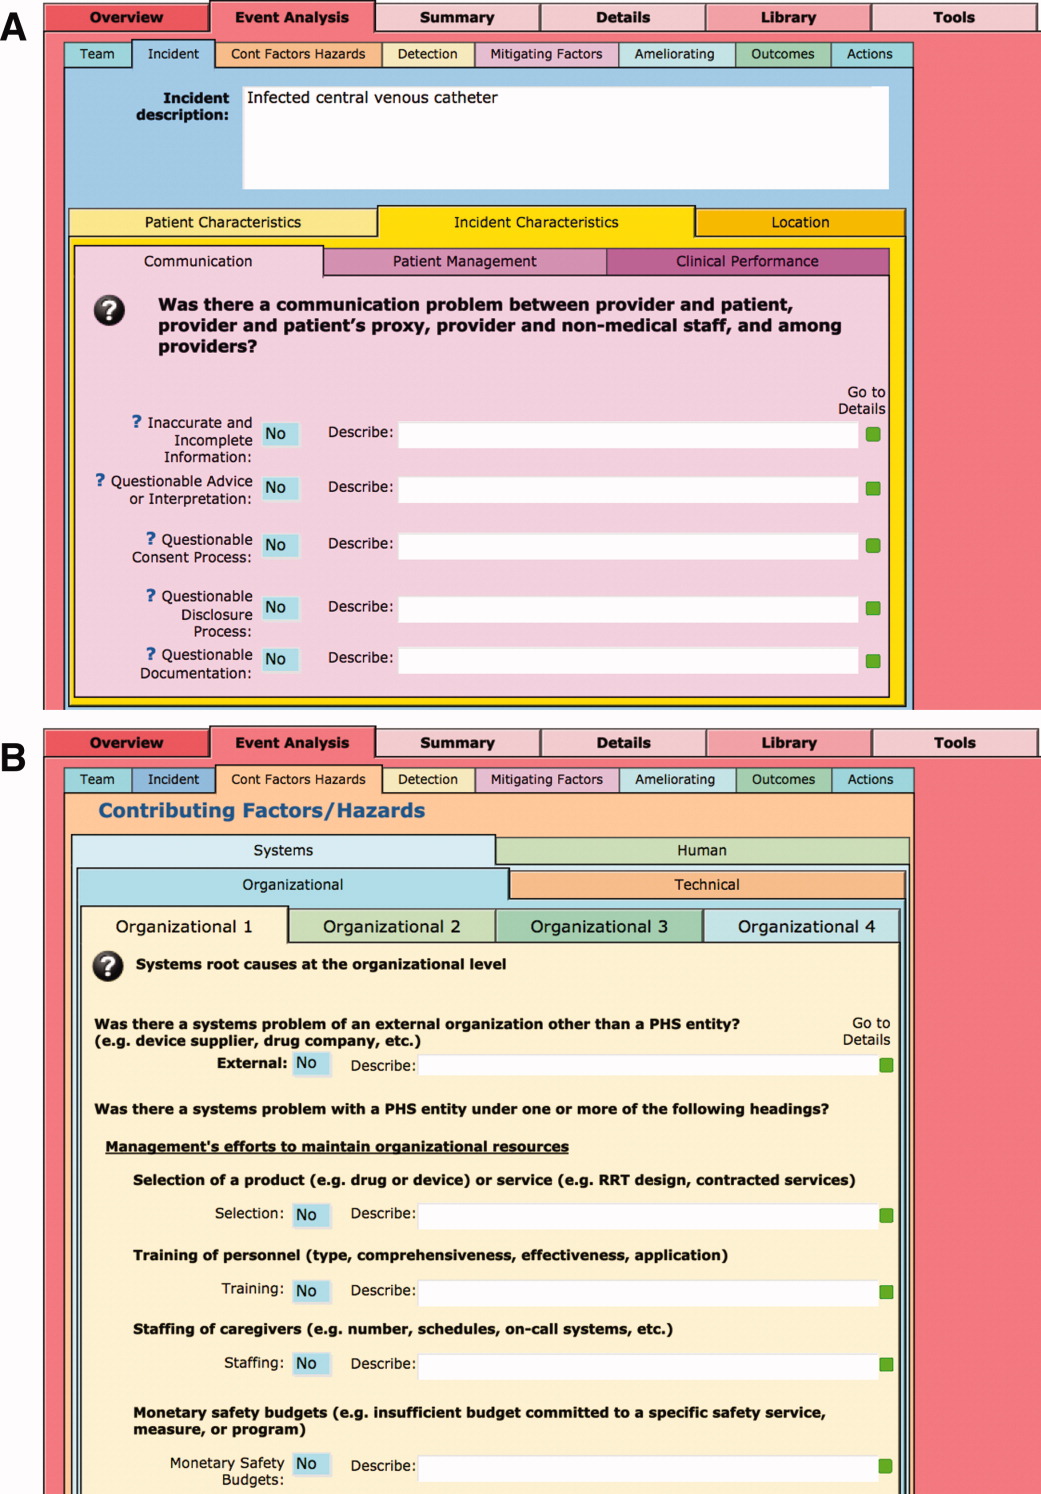
The I‐Tracker system was authored using the ICPS definitions for the 48 preferred terms for safety incidents and the ICPS conceptual framework.8 The conceptual framework consists of 10 major incident domains, that include incident type, patient outcomes, patient characteristics, incident characteristics, contributing factors and hazards, organizational outcomes, detection, mitigating factors, ameliorating actions, and actions taken to reduce risk (Figure 1).11 The framework is applicable to all hospital safety incidents, but we limited I‐Tracker to SEs because our hospitals had completed comprehensive reviews and action plans only for these more serious events. The literature on the ICPS framework812 was carefully reviewed to identify the specific data fields that were recommended by ICPS developers to be included under each of the 10 major classification domains. In most instances, data fields existed only in the body of these reports. Article texts, however, provided sufficient descriptions of these data fields to allow their translation into data entry fields in I‐Tracker with accompanying help windows and explanations to guide I‐Tracker users. Sixty ICPS data fields were programmed into I‐Tracker, with another 120 fields that allowed entry of descriptions and explanations of the ICPS data field entries. For instance, an entry of Yes into an ICPS data field that queried Was there a systems problem of an external organization other than a Providence entity opens a Describe field that allows a brief description of the problem, and an additional Details field that allows a longer explanation of the problem if necessary. The brief Describe field contents populate an automatically generated fishbone diagram.
The authors and quality staff translated the most recent 15 SE reviews into ICPS terms and classifications, and entered the results into I‐Tracker as it was being developed, to assist system design and programming of the system. The authors noted during data entry which of the 10 ICPS major domains had not been analyzed by the previous 15 reviews. Because existing reports were unstructured with considerable variation in style and usage of terms, the authors and quality staff made group decisions regarding how to cross‐walk existing information into the standardized ICPS data fields.
RESULTS
In developing I‐Tracker, the authors and quality staff observed that the ICPS framework and recommended data fields were logical and straightforward to learn. Although it was difficult to find the definitions of specific ICPS data fields within the 10 major domains in the text of retrieved articles, these fields could be readily cross‐walked into I‐Tracker data entry fields. Translating existing SE reports into I‐Tracker classifications, however, presented considerable challenges because of the unstructured, discursive, and variable nature of our SE review and reports. The authors and staff spent 1 to 2 hours conferring over each report to make judgments as to which elements of the review would be entered into which I‐Tracker data fields. Once the authors and staff translated existing reports into ICPS terms, actual data entry into I‐Tracker took typically less than 30 minutes for each review. We found that none of our 15 SE reviews included information on the following ICPS major domains: detection, mitigating factors, and ameliorating actions. We also observed that many ICPS data fields were not assessed, such as patient contributions to errors and external organization's contributions to a safety incident.
The latest version of I‐Tracker receives and displays information at the individual patient level. Records are shown onscreen with different screen layouts depending on the viewer's login security clearance. Hospital safety staff have full access to view and enter data on the initial layout, which displays patient demographic information and folder tabs that navigate when clicked to other database fields (Figure 2). Viewers with lower security clearance either view the same opening screen, but have limited access to other screens, or view a different opening screen designed to meet their specific needs. All screens provide definitions of terms and information to assist data entry, buttons that navigate to help pages, pop‐up windows that provide tips, and buttons that trigger brief audio explanations. Most fields use drop‐down lists to standardize data entry around the ICPS definitions, with default values entered into many fields to streamline data entry. A list view allows review of all patients and quick access to an individual patient's record. All fields and combinations of fields with Boolean rules are searchable within the database.
I‐Tracker has features that support SE review groups in beginning an SE review by providing them a paper form or electronic interface by way of a portable computer or tablet device, that guides their discussions and analyses toward providing conclusions that can be entered into the database fields, thereby aligning their deliberations with the ICPS conceptual framework. The same resource is available within the database online for those groups who would prefer to use computer prompts and enter data directly into the database as they proceed through their analyses. Some layouts contain windows that port live views from external Web sites (eg, JC RCA resources) that provide participants of RCA groups with tools to assist their work. FMP11 allows users to access the database by portable computers or handheld tablet devices using the hospitals' WiFi network.
A report screen allows automatic generation of different printouts of individual or aggregate summary reports. A Comprehensive Report includes all of the data fields included in the ICPS conceptual framework. Other reports present subsets of data depending on the user's needs and access privileges. The FMPS11 database allows printing the reports to paper or Portable Document Format (pdf), exporting data into an Excel spreadsheet, or e‐mailing reports to recipients from within I‐Tracker.
Additionally, I‐Tracker functionality facilitates follow‐up and monitoring of action items developed during the RCA process in a manner that conforms to the ICPS framework. We are now developing educational resources for RCA team members to investigate the implementation of I‐Tracker into future RCAs.
DISCUSSION
I‐Tracker provides an intranet‐based tool that met the objectives of the present project. The process of entering 15 existing SE reviews and action plans from our healthcare system into I‐Tracker allowed an incremental development of the database and identified gaps in our existing RCA process. For instance, none of the previous RCAs critically appraised detection, mitigating factors, or ameliorating actions; defined the specific nature or quantified severity of patient injuries using standardized terms; distinguished between human errors and negligence; or comprehensively reported the full spectrum of underlying causes of Tracker's use of standardized terms based on the ICPS conceptual framework provided a potential resource for focusing SE reviews and producing more comprehensive RCAs and action plans in the future. I‐Tracker has additional potential to facilitate dissemination of RCAs to other facilities, both as individual incident reports and aggregated summaries as recommended by experts in patient safety.13
The deficiencies in our existing RCA analyses, identified during data entry into I‐Tracker, represent common shortcomings experienced by other healthcare organizations and summarized in a report by the Agency for Healthcare Research and Quality.4 Considerable hindsight bias and prevailing concerns of the day taint the RCA process, which is time‐consuming and labor intensive, and thereby hinders comprehensive reviews. Also, our SE reviews, like others reviewed in the literature,14 focused on biologic injury to patients and omitted assessment of psychologic, organizational, social, and economic injury domains. Although SE review teams benefit from involvement of quality improvement staff who are trained in techniques and goals of RCA,15 many hospitals like ours have limited resources for fully staffing all SE reviews with trained facilitators. These SE reviews generate both quantitative and qualitative data, the latter of which hinders standardized data entry in the absence of a conceptual framework. A structured database with formative tools to guide RCAs in conformance with the ICPS framework in organizations without sufficient numbers of trained facilitators offers opportunities to produce more comprehensive, standardized, and actionable reports. To date, our quality staff and leadership have responded positively to presentations of the functional features of I‐Tracker (Table 1).
|
| Online availability of the system that allows access both from client database software loaded on Quality Office computers and through intranet browser software (Explorer, Safari, Firefox, etc) |
| Security features of encrypted software that allow full or limited views depending on the user's password security clearance and purpose for reviewing data |
| Software accessibility in authoring and managing the database, which do not require support from information technology data analysts |
| Decision support tools provided in the system to assist RCA analysis |
| System flexibility that allows scripted reporting of single SEs or multiple SE summaries within any selected timeframe |
Limitations of our report include its focus solely on the development and programming phase of I‐Tracker and the absence of information on its actual implementation. We believe, however, the development phase is important to report because it demonstrates that the ICPS framework and specific ICPS data fields are amenable to incorporation into a decision support and reporting tool, which to our knowledge has not been previously reported. We begin implementation of I‐Tracker within our organization this year and will have observations on its feasibility, acceptability, and staff training needs. As an additional limitation, we emphasize that we do not propose I‐Tracker as a solution for other organizations, because we have no plans for its commercial or public domain development. This report is intended to demonstrate, however, that commercially available software, such as FileMaker, can readily support the ICPS Framework and thereby has potential to assist RCAs and SE reporting. Other organizations may develop similar systems on other database platforms that incorporate the ICPS system into their reviews.
To implement I‐Tracker, we are now working with nursing and pharmacy leadership focus groups to develop formative tools, data collection forms, and other resources to assist their RCA efforts and data entry into the database. We also plan to apply the database tool to our residency training program to promote resident involvement in SE reviews by providing standardized, reproducible, and structured processes.16 Our 5‐state healthcare system has funded an evaluation of the implementation phase of I‐Tracker to other Providence facilities. Because the ICPS framework applies to all safety incidents beyond SEs (Table 2), a successful implementation of I‐Tracker for SEs will allow its eventual application to other types of critical incidents.
|
| Clinical administration |
| Clinical process/procedure |
| Documentation |
| Healthcare‐associated infection |
| Medication/IV fluids |
| Blood/blood products |
| Nutrition |
| Oxygen/gas/vapor |
| Medical device/equipment |
| Behavior |
| Patient accidents |
| Infrastructure/building/fixtures |
| Resources/organizational management |
The strength of this project derives from its innovative development of an intranet‐based tool that allows groups to conform their RCAs to the ICPS framework. Because the absence of a standardized classification for patient safety concepts has hindered advances in patient safety,11 we believe I‐Tracker, or decision support tools like it that use the ICPS framework, can standardize RCAs and promote dissemination and adoption of action plans.
Acknowledgements
We appreciate the support of Judy Stenstrom, Lynette Savage, and the Portland Service Area Quality Improvement Office.
- .Reporting of adverse events.N Engl J Med.2002;347:1633–1638.
- The Joint Commission's Sentinel Event Policy: ten years of improving the quality and safety of health care.Jt Comm Perspect.2005;25(1):3–5.
- ,.Root cause analysis and nursing management responsibilities in wrong‐site surgery.Dimens Crit Care Nurs.2006;25,221–225.
- ,.Root Cause Analysis.Making Health Care Safer. Available at: http://archive.ahrq.gov/clinic/ptsafety/chap5.htm. Accessed May 21,2010.
- Oversight group holds RCA teams accountable.Healthcare Benchmarks Qual Improv.2008;15:117–118.
- .Shared meanings: preferred terms and definitions for safety and quality concepts.Med J Aust.2006;184:S41–S43.
- ,,.What do family physicians consider an error? A comparison of definitions and physician perception.BMC Fam Pract.2006;7:73.
- ,,,,,.Towards an International Classification for Patient Safety: key concepts and terms.Int J Qual Health Care.2009;21:18–26.
- ,,,,.The JCAHO patient safety event taxonomy: a standardized terminology and classification schema for near misses and adverse events.Int J Qual Health Care.2005;17:95–105.
- World Health Organization. 2009 Conceptual Framework for the International Classification for Patient Safety. Final Technical Report Version 1.1. Available at: http://www.who.int/patientsafety/taxonomy/icps_full_report.pdf. Accessed April 25,2011.
- ,,, et al.Towards an International Classification for Patient Safety: the conceptual framework.Int J Qual Health Care.2009;21:2–8.
- ,,,,,.Towards an International Classification for Patient Safety: a Delphi survey.Int J Qual Health Care.2009;21:9–17.
- ,,.Effectiveness and efficiency of root cause analysis in medicine.JAMA.2008;299:685–687.
- ,,,,.How can clinicians measure safety and quality in acute care?Lancet.2004;363:1061–1067.
- ,,,,.Systematic root cause analysis of adverse drug events in a tertiary referral hospital.Jt Comm J Qual Improv.2000;26:563–575.
- ,,,,,.Educational quality improvement report: outcomes from a revised morbidity and mortality format that emphasised patient safety.Postgrad Med J.2008;84:211–216.
Recognition that healthcare carries considerable risks of patient injury has focused efforts on identifying problems before they occur, and understanding the root causes of those problems that do occur to prevent them from happening again.1 To further these efforts, a Joint Commission (JC) standard requires hospitals to review sentinel events (SE).2 Reviews must develop a timely, thorough, and credible root cause analysis (RCA), implement action plans to reduce risk, and monitor the effectiveness of implemented improvements.3
Ideally, hospitals would summarize their experiences with SE reviews, identify high‐risk activities and patients, institute system changes to prevent SE recurrences, and share their findings with other healthcare organizations to help them avoid similar patient injuries.1 In support of this last goal, the JC maintains a voluntary database system that allows hospitals to report their SE analyses for other facilities to review and institute preventative actions.
Unfortunately, the reality of SE reviews does not match their ideals for improving patient safety.4 Healthcare organizations often describe their review process as less than credible and note a need for ongoing oversight to maintain the reviews' effectiveness.5 The JC voluntary reporting system captures less than 1% of the SEs that occur nationally,2 because hospitals perceive barriers to external reporting.1 If healthcare organizations decide against reporting externally, they can create their own internal systems to aggregate and summarize SEs, but few such systems exist. A major impediment to designing internal systems is the absence of universally endorsed nomenclature for safety‐related events.6, 7 Poorly aligned terminology and subjective conceptualizations for safety incidents impede the aggregation of SEs, comparisons between facilities, and trend analyses for tracking SE patterns.
In 2005, the World Health Organization (WHO) World Alliance for Patient Safety, in collaboration with the JC, began developing an International Classification for Patient Safety (ICPS) to provide healthcare organizations a consistent conceptual model for safety incidents and promote their classification by a standardized taxonomy.810 Although this system has promise for allowing standardization, data aggregation, analysis, and learning between institutions,11 integration of the ICPS conceptual model into an SE decision support tool with summarizing and reporting features has not been reported.
This report describes our development of an intranet‐based SE reporting system, called Incident Tracker (I‐Tracker), based on the ICPS model. For our SE review groups from the 4 Providence Health Systems (PHS) Portland Service Area (PSA) hospitals, the I‐Tracker system offers a tool to guide efforts in developing RCAs and action plans in alignment with the ICPS framework. The system includes scripts that automatically generate and distribute standardized reports of individual and aggregated SEs. The objectives of this project were to report our experience with developing a flexible and accessible intranet‐based system that assists RCA participants in conforming to the ICPS framework and oversight safety staff in summarizing and reporting root cause analyses.
METHODS
The 4 PSA hospitals have 1083 licensed beds and perform SE reviews with a centralized process that reports results to a Community Governing Board. An ad hoc team for each SE performs the RCAs. The SE groups report RCAs and action plans in an unstructured format that varies for each event. A paper file is maintained for each SE report, but a system for aggregating reports to track trends, disseminating SE trends, or monitoring the completion or effectiveness of action plans is not available.
We designed a system to achieve the following objectives:
-
Apply the ICPS framework (Figure 1) and taxonomy of terms to SE analyses;
-
Provide a computer‐based tool to assist review groups and quality staff to perform their SE reviews and data collection in alignment with the ICPS framework;
-
Create an intranet‐based database that captures elements of the reviews, RCAs, and action plans with the use of drop‐down lists, help windows, windows with live access to Internet educational resources and tools, decision support tools, default entries, and audio prompts to streamline data entry;
-
Generate a suite of standardized reports customized for different audiences that can be accessed online and printed from the database with automated scripts;
-
Produce intranet‐based summaries of aggregated events to identify common causes and disseminate observed patterns and action plans to other PSA hospitals.
We selected FileMaker Pro 11 Advanced (FMP11) for authoring and maintaining the decision support tool and database, and FileMaker Pro Server 11 Advanced (FMPS11) (Filemaker, Inc, Santa Clara, CA) for hosting the system, because it provides intranet access and tools for updating the system by personnel with minimal programming experience. End users can view and enter data through layouts that display only the information allowed by the user's login password and access privileges, with external authentication by Active Directory and Open Directory technology. Staff who author and manage the database do so through client FMP11 software loaded on a computer that provides remote server access.
The I‐Tracker system was authored using the ICPS definitions for the 48 preferred terms for safety incidents and the ICPS conceptual framework.8 The conceptual framework consists of 10 major incident domains, that include incident type, patient outcomes, patient characteristics, incident characteristics, contributing factors and hazards, organizational outcomes, detection, mitigating factors, ameliorating actions, and actions taken to reduce risk (Figure 1).11 The framework is applicable to all hospital safety incidents, but we limited I‐Tracker to SEs because our hospitals had completed comprehensive reviews and action plans only for these more serious events. The literature on the ICPS framework812 was carefully reviewed to identify the specific data fields that were recommended by ICPS developers to be included under each of the 10 major classification domains. In most instances, data fields existed only in the body of these reports. Article texts, however, provided sufficient descriptions of these data fields to allow their translation into data entry fields in I‐Tracker with accompanying help windows and explanations to guide I‐Tracker users. Sixty ICPS data fields were programmed into I‐Tracker, with another 120 fields that allowed entry of descriptions and explanations of the ICPS data field entries. For instance, an entry of Yes into an ICPS data field that queried Was there a systems problem of an external organization other than a Providence entity opens a Describe field that allows a brief description of the problem, and an additional Details field that allows a longer explanation of the problem if necessary. The brief Describe field contents populate an automatically generated fishbone diagram.
The authors and quality staff translated the most recent 15 SE reviews into ICPS terms and classifications, and entered the results into I‐Tracker as it was being developed, to assist system design and programming of the system. The authors noted during data entry which of the 10 ICPS major domains had not been analyzed by the previous 15 reviews. Because existing reports were unstructured with considerable variation in style and usage of terms, the authors and quality staff made group decisions regarding how to cross‐walk existing information into the standardized ICPS data fields.
RESULTS
In developing I‐Tracker, the authors and quality staff observed that the ICPS framework and recommended data fields were logical and straightforward to learn. Although it was difficult to find the definitions of specific ICPS data fields within the 10 major domains in the text of retrieved articles, these fields could be readily cross‐walked into I‐Tracker data entry fields. Translating existing SE reports into I‐Tracker classifications, however, presented considerable challenges because of the unstructured, discursive, and variable nature of our SE review and reports. The authors and staff spent 1 to 2 hours conferring over each report to make judgments as to which elements of the review would be entered into which I‐Tracker data fields. Once the authors and staff translated existing reports into ICPS terms, actual data entry into I‐Tracker took typically less than 30 minutes for each review. We found that none of our 15 SE reviews included information on the following ICPS major domains: detection, mitigating factors, and ameliorating actions. We also observed that many ICPS data fields were not assessed, such as patient contributions to errors and external organization's contributions to a safety incident.
The latest version of I‐Tracker receives and displays information at the individual patient level. Records are shown onscreen with different screen layouts depending on the viewer's login security clearance. Hospital safety staff have full access to view and enter data on the initial layout, which displays patient demographic information and folder tabs that navigate when clicked to other database fields (Figure 2). Viewers with lower security clearance either view the same opening screen, but have limited access to other screens, or view a different opening screen designed to meet their specific needs. All screens provide definitions of terms and information to assist data entry, buttons that navigate to help pages, pop‐up windows that provide tips, and buttons that trigger brief audio explanations. Most fields use drop‐down lists to standardize data entry around the ICPS definitions, with default values entered into many fields to streamline data entry. A list view allows review of all patients and quick access to an individual patient's record. All fields and combinations of fields with Boolean rules are searchable within the database.
I‐Tracker has features that support SE review groups in beginning an SE review by providing them a paper form or electronic interface by way of a portable computer or tablet device, that guides their discussions and analyses toward providing conclusions that can be entered into the database fields, thereby aligning their deliberations with the ICPS conceptual framework. The same resource is available within the database online for those groups who would prefer to use computer prompts and enter data directly into the database as they proceed through their analyses. Some layouts contain windows that port live views from external Web sites (eg, JC RCA resources) that provide participants of RCA groups with tools to assist their work. FMP11 allows users to access the database by portable computers or handheld tablet devices using the hospitals' WiFi network.
A report screen allows automatic generation of different printouts of individual or aggregate summary reports. A Comprehensive Report includes all of the data fields included in the ICPS conceptual framework. Other reports present subsets of data depending on the user's needs and access privileges. The FMPS11 database allows printing the reports to paper or Portable Document Format (pdf), exporting data into an Excel spreadsheet, or e‐mailing reports to recipients from within I‐Tracker.
Additionally, I‐Tracker functionality facilitates follow‐up and monitoring of action items developed during the RCA process in a manner that conforms to the ICPS framework. We are now developing educational resources for RCA team members to investigate the implementation of I‐Tracker into future RCAs.
DISCUSSION
I‐Tracker provides an intranet‐based tool that met the objectives of the present project. The process of entering 15 existing SE reviews and action plans from our healthcare system into I‐Tracker allowed an incremental development of the database and identified gaps in our existing RCA process. For instance, none of the previous RCAs critically appraised detection, mitigating factors, or ameliorating actions; defined the specific nature or quantified severity of patient injuries using standardized terms; distinguished between human errors and negligence; or comprehensively reported the full spectrum of underlying causes of Tracker's use of standardized terms based on the ICPS conceptual framework provided a potential resource for focusing SE reviews and producing more comprehensive RCAs and action plans in the future. I‐Tracker has additional potential to facilitate dissemination of RCAs to other facilities, both as individual incident reports and aggregated summaries as recommended by experts in patient safety.13
The deficiencies in our existing RCA analyses, identified during data entry into I‐Tracker, represent common shortcomings experienced by other healthcare organizations and summarized in a report by the Agency for Healthcare Research and Quality.4 Considerable hindsight bias and prevailing concerns of the day taint the RCA process, which is time‐consuming and labor intensive, and thereby hinders comprehensive reviews. Also, our SE reviews, like others reviewed in the literature,14 focused on biologic injury to patients and omitted assessment of psychologic, organizational, social, and economic injury domains. Although SE review teams benefit from involvement of quality improvement staff who are trained in techniques and goals of RCA,15 many hospitals like ours have limited resources for fully staffing all SE reviews with trained facilitators. These SE reviews generate both quantitative and qualitative data, the latter of which hinders standardized data entry in the absence of a conceptual framework. A structured database with formative tools to guide RCAs in conformance with the ICPS framework in organizations without sufficient numbers of trained facilitators offers opportunities to produce more comprehensive, standardized, and actionable reports. To date, our quality staff and leadership have responded positively to presentations of the functional features of I‐Tracker (Table 1).
|
| Online availability of the system that allows access both from client database software loaded on Quality Office computers and through intranet browser software (Explorer, Safari, Firefox, etc) |
| Security features of encrypted software that allow full or limited views depending on the user's password security clearance and purpose for reviewing data |
| Software accessibility in authoring and managing the database, which do not require support from information technology data analysts |
| Decision support tools provided in the system to assist RCA analysis |
| System flexibility that allows scripted reporting of single SEs or multiple SE summaries within any selected timeframe |
Limitations of our report include its focus solely on the development and programming phase of I‐Tracker and the absence of information on its actual implementation. We believe, however, the development phase is important to report because it demonstrates that the ICPS framework and specific ICPS data fields are amenable to incorporation into a decision support and reporting tool, which to our knowledge has not been previously reported. We begin implementation of I‐Tracker within our organization this year and will have observations on its feasibility, acceptability, and staff training needs. As an additional limitation, we emphasize that we do not propose I‐Tracker as a solution for other organizations, because we have no plans for its commercial or public domain development. This report is intended to demonstrate, however, that commercially available software, such as FileMaker, can readily support the ICPS Framework and thereby has potential to assist RCAs and SE reporting. Other organizations may develop similar systems on other database platforms that incorporate the ICPS system into their reviews.
To implement I‐Tracker, we are now working with nursing and pharmacy leadership focus groups to develop formative tools, data collection forms, and other resources to assist their RCA efforts and data entry into the database. We also plan to apply the database tool to our residency training program to promote resident involvement in SE reviews by providing standardized, reproducible, and structured processes.16 Our 5‐state healthcare system has funded an evaluation of the implementation phase of I‐Tracker to other Providence facilities. Because the ICPS framework applies to all safety incidents beyond SEs (Table 2), a successful implementation of I‐Tracker for SEs will allow its eventual application to other types of critical incidents.
|
| Clinical administration |
| Clinical process/procedure |
| Documentation |
| Healthcare‐associated infection |
| Medication/IV fluids |
| Blood/blood products |
| Nutrition |
| Oxygen/gas/vapor |
| Medical device/equipment |
| Behavior |
| Patient accidents |
| Infrastructure/building/fixtures |
| Resources/organizational management |
The strength of this project derives from its innovative development of an intranet‐based tool that allows groups to conform their RCAs to the ICPS framework. Because the absence of a standardized classification for patient safety concepts has hindered advances in patient safety,11 we believe I‐Tracker, or decision support tools like it that use the ICPS framework, can standardize RCAs and promote dissemination and adoption of action plans.
Acknowledgements
We appreciate the support of Judy Stenstrom, Lynette Savage, and the Portland Service Area Quality Improvement Office.
- .Reporting of adverse events.N Engl J Med.2002;347:1633–1638.
- The Joint Commission's Sentinel Event Policy: ten years of improving the quality and safety of health care.Jt Comm Perspect.2005;25(1):3–5.
- ,.Root cause analysis and nursing management responsibilities in wrong‐site surgery.Dimens Crit Care Nurs.2006;25,221–225.
- ,.Root Cause Analysis.Making Health Care Safer. Available at: http://archive.ahrq.gov/clinic/ptsafety/chap5.htm. Accessed May 21,2010.
- Oversight group holds RCA teams accountable.Healthcare Benchmarks Qual Improv.2008;15:117–118.
- .Shared meanings: preferred terms and definitions for safety and quality concepts.Med J Aust.2006;184:S41–S43.
- ,,.What do family physicians consider an error? A comparison of definitions and physician perception.BMC Fam Pract.2006;7:73.
- ,,,,,.Towards an International Classification for Patient Safety: key concepts and terms.Int J Qual Health Care.2009;21:18–26.
- ,,,,.The JCAHO patient safety event taxonomy: a standardized terminology and classification schema for near misses and adverse events.Int J Qual Health Care.2005;17:95–105.
- World Health Organization. 2009 Conceptual Framework for the International Classification for Patient Safety. Final Technical Report Version 1.1. Available at: http://www.who.int/patientsafety/taxonomy/icps_full_report.pdf. Accessed April 25,2011.
- ,,, et al.Towards an International Classification for Patient Safety: the conceptual framework.Int J Qual Health Care.2009;21:2–8.
- ,,,,,.Towards an International Classification for Patient Safety: a Delphi survey.Int J Qual Health Care.2009;21:9–17.
- ,,.Effectiveness and efficiency of root cause analysis in medicine.JAMA.2008;299:685–687.
- ,,,,.How can clinicians measure safety and quality in acute care?Lancet.2004;363:1061–1067.
- ,,,,.Systematic root cause analysis of adverse drug events in a tertiary referral hospital.Jt Comm J Qual Improv.2000;26:563–575.
- ,,,,,.Educational quality improvement report: outcomes from a revised morbidity and mortality format that emphasised patient safety.Postgrad Med J.2008;84:211–216.

Implementing an RRT
In‐hospital cardiopulmonary arrests are often preceded by signs of clinical instability, such as changes in vital signs or mental status.1 Nearly 85% of patients who suffer from cardiopulmonary arrests have documented observations of deterioration in the 8 hours before arrest.2 A Medical Emergency Team (MET), sometimes known as Rapid Response Team (RRT), can rapidly assess and manage unstable patients, with the goal that early intervention will prevent adverse outcomes. In 2004, the Institute for Healthcare Improvement (IHI), as part of its 100,000 Lives Campaign, called for hospitals to implement rapid response systems as 1 of 6 strategies to reduce deaths in hospital.3 Since this recommendation, hundreds of hospitals in the United States have invested substantial financial and personnel resources to implement some form of a rapid response system, which is comprised of a varying array of healthcare providers who bring critical care expertise to the patient's bedside.4, 5
Despite the intuitive appeal of the approach, and early observational data which suggested that METs could reduce both codes and unexpected in‐hospital mortality,2, 6 the largest randomized controlled trial found that METs failed to reduce unplanned intensive care unit (ICU) admissions, cardiac arrests, or unexpected deaths.7 More recently, in a prospective observational cohort study at 1 US hospital, Chan et al. found that a nurse‐led RRT did not impact hospital‐wide code rates or mortality.4
The study of rapid response systems is further complicated by a lack of standard definition, and the many types of hospitals in which they may be implemented. In 2006, a consensus conference suggested that MET be used to refer to teams led by physicians (usually intensivists), and RRT be used for teams led by nurses.8 Many studies have been conducted at non‐US institutions, and follow‐up periods have generally been 1 year or less. We report on almost 4 years of experience with a hospitalist‐led MET implemented in a major US academic medical center, and examine the subsequent changes in code calls, cardiac arrests, deaths following cardiopulmonary resuscitation, and overall hospital mortality. Because the MET did not operate in the critical care units, and because cardiac arrest may occur without prior signs of deterioration, we hypothesized that implementation of the MET would correspond to a small drop in total code calls, no change in codes called inside of critical care units, no change in cardiac arrest outside of critical care, and a marked drop in other medical crises (mostly respiratory distress) outside critical care. We also hypothesized that there would be no change in the rate of fatal codes, because most deaths occur in patients who were found to be pulseless on arrival of the code team.
METHODS
Setting
Beginning in March 2006, Baystate Medical Center implemented an MET in accordance with the recommendations of the IHI. Baystate is a 670‐bed tertiary care referral center in Springfield, Massachusetts, and a major teaching hospital for Tufts University. Throughout the study period, the hospital had full‐time intensivists and >90% of medical patients were cared for by hospitalists with 24‐hour coverage. As a result, a medical patient's attending physician or corresponding coverage was usually on site. In order to promote acceptance of the team as well as to maximize continuity of care, we constructed our MET to include a critical care nurse, a respiratory therapist, intravenous therapist, and the patient's physician (either attending or resident). Baystate staff members carry alpha‐numeric pagers, so attendings could be alerted to the fact that the MET had been activated by means of a text page. In the event that the patient's physician could not respond, an ICU physician served as a backup team member. The MET was implemented initially in March of 2006 on 2 medical floors, and over a period of 3 months was gradually expanded to cover the entire hospital. For surgical patients, the MET was led by the attending surgeon or appropriate resident. Educational efforts, including meetings, e‐mails, and posters, targeted nurses in particular, but anyone could summon the MET by calling the activation number posted on all ward telephones. Nurses were encouraged to activate the system for any of the following: heart rate (<40 and >130 beats per minute), systolic blood pressure (<90 mmHg), respiratory rate (<8 or >24 per minute), oxygen saturation (<90% despite supplemental oxygen), altered mental status, or simply concern that something is wrong. The MET implementation oversight committee met biweekly and made adjustments to the team composition and protocols using rapid Plan Do Study Act (PDSA) cycles. A full description of the implementation process has been published elsewhere.9
In addition to the MET, Baystate has a separate code team which can be activated for cardiovascular arrests via a call to a designated phone extension, which activates a page to the code team members and an overhead announcement. Code team members include the ICU medical resident and intern, a critical care nurse, an anesthesiologist, a respiratory therapist, a staff nurse, and the house supervisor. In response to the overhead announcement, doctors, nurses and students in the vicinity often respond as well. Prior to implementation of the MET, a code blue was the only level of immediate response available.
Data and Outcomes
The nurse attending a code blue or code completes a report form which becomes part of the permanent medical record. A copy of the report is reviewed by the Division of Healthcare Quality and housed in the Critical Care administrative offices. For this study, we reviewed all code reports from January 2004 through December 2009. For each report, we extracted the following information: the date, location (inside or outside of a critical care unit), whether the patient had a pulse on arrival of the team, and whether the patient survived to discharge. All activations of the code system were included, regardless of the patient's code status (ie, even if the code was called in error) or the reason for the code call. Patients were then aggregated to calculate the rate of codes called per calendar quarter, as well as the rates of codes called in and out of critical care and the rates of two subsets of code calls, namely cardiac arrests and other medical crises (eg, respiratory arrest or seizures).
MET members were also required to collect data on the reason for the MET call, as well as the response time, time of day and unit, duration of the call, whether the physician was present, whether the patient was transferred to critical care, and whether the patient survived to discharge. In addition, we surveyed the nursing staff directly after the call, asking the following questions: 1) Did the team arrive promptly? 2) Were the critical care nurse and respiratory therapist efficient and respectful? 3) Did you feel the patient's needs were addressed appropriately? 4) Did you feel supported by the MET? and 5) Would you call the MET again?
Statistical Analysis
Quarterly event rates per 1000 admissions were calculated for each outcome. Event rates were compared using piecewise Poisson regression10 with robust standard errors.11 We excluded the 2 quarterly periods (2006 Q1 and Q2) during which the MET was implemented. A piecewise Poisson regression model was chosen to facilitate estimation of: 1) change in code calls from immediately before implementation to immediately after; and 2) temporal trends in code calls before and after implementation. Each model was built with 1 pre‐implementation intercept (December 2005), and 1 post‐implementation intercept (July 2006), as well as 2 slopes, with time coded negatively before the intervention (ie, 2, 1, 0), and positively after (ie, 0, 1, 2). Linear contrasts tested for differences in each parameter. A significant difference in intercepts suggests a post‐intervention decrease in code call rates; a significant, negative post‐intervention slope suggests continuing decline in code call rates. Statistical inferences were aided with visual plots of predicted incidence rates for each quarter in the observation period, with 95% confidence intervals (CI) for each quarterly rate estimated by the delta method.12 Alpha was specified at 0.05 and all significance tests were 2‐sided. Analyses were conducted in Stata 11.1 for Windows ( 2010, StataCorp LP, College Station, TX).
RESULTS
Implementation of the MET
The MET was introduced in the first and second quarters of 2006, with 2717 calls logged through the end of 2009 (out of 154,382 admissions). The rate of MET calls increased during the first 6 months of implementation from 5.95 per 1000 admissions in the first quarter of the intervention, to 15.8 calls per 1000 admissions in the second quarter. Call rates peaked in the first half of 2009, at 20.9 calls per 1000 admissions, leveling off to 17.9 calls per 1000 admissions in the last half of 2009 (Figure 1). Of calls with time recorded, 40% occurred on the day shift, 35% on the evening shift, and 25% on the night shift. The most common reason to call the MET was respiratory distress (33%), followed by cardiovascular instability (25%), and neurological abnormality (20%). In 15% of cases, concern about a patient's condition prompted the nurse to call. Calls came primarily from medical floors (75%) and surgical units (20%). The median response time was 4 minutes (interquartile range [IQR], 2.8 to 5.2 minutes) with no meaningful trend during the study period. The median call duration was 50 minutes (IQR, 38 to 72 minutes). Again, there was no trend over time. The most common interventions were arterial blood gas, fluid resuscitation, and electrocardiogram (see Supporting Web Appendix Table 1 in the online version of this article). A physician was present at 52% of the calls in the first year, which rose to 93% of calls in the final year. Approximately 25% of calls resulted in the patient being transferred to a critical care unit. Staff evaluations were overwhelmingly positive. Nurses rated the teams on the following points: whether the critical care nurse and respiratory therapist were efficient and respectful (mean rating 98%, SD 5.6%); promptness (98%, SD 5.6%); whether the patient's needs were addressed appropriately (mean 98%, SD 4.2%); whether the nurse felt supported by the MET (99.5%, SD 1.7%); and whether they would call the MET again (99.7%, SD 1.4%).

Effect of MET on Code Calls and Mortality
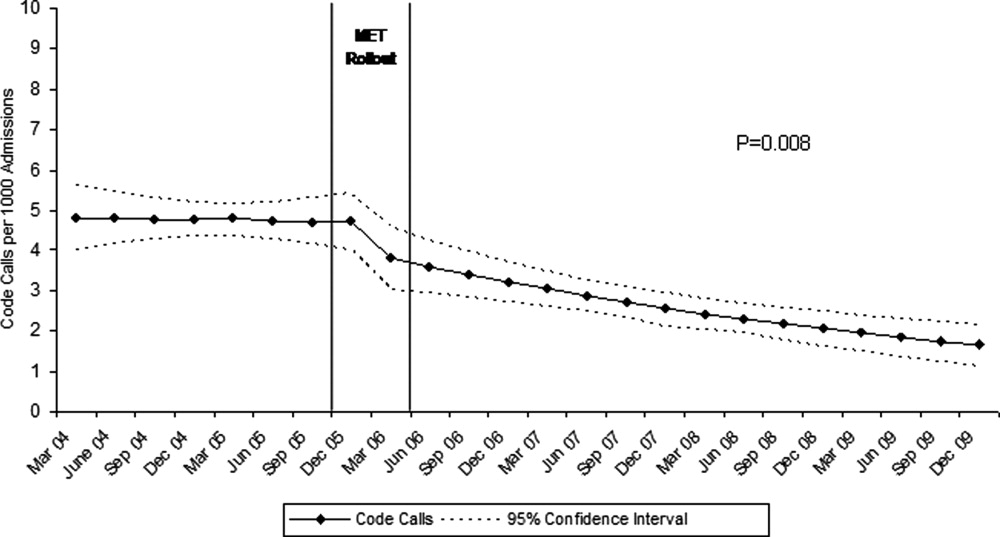
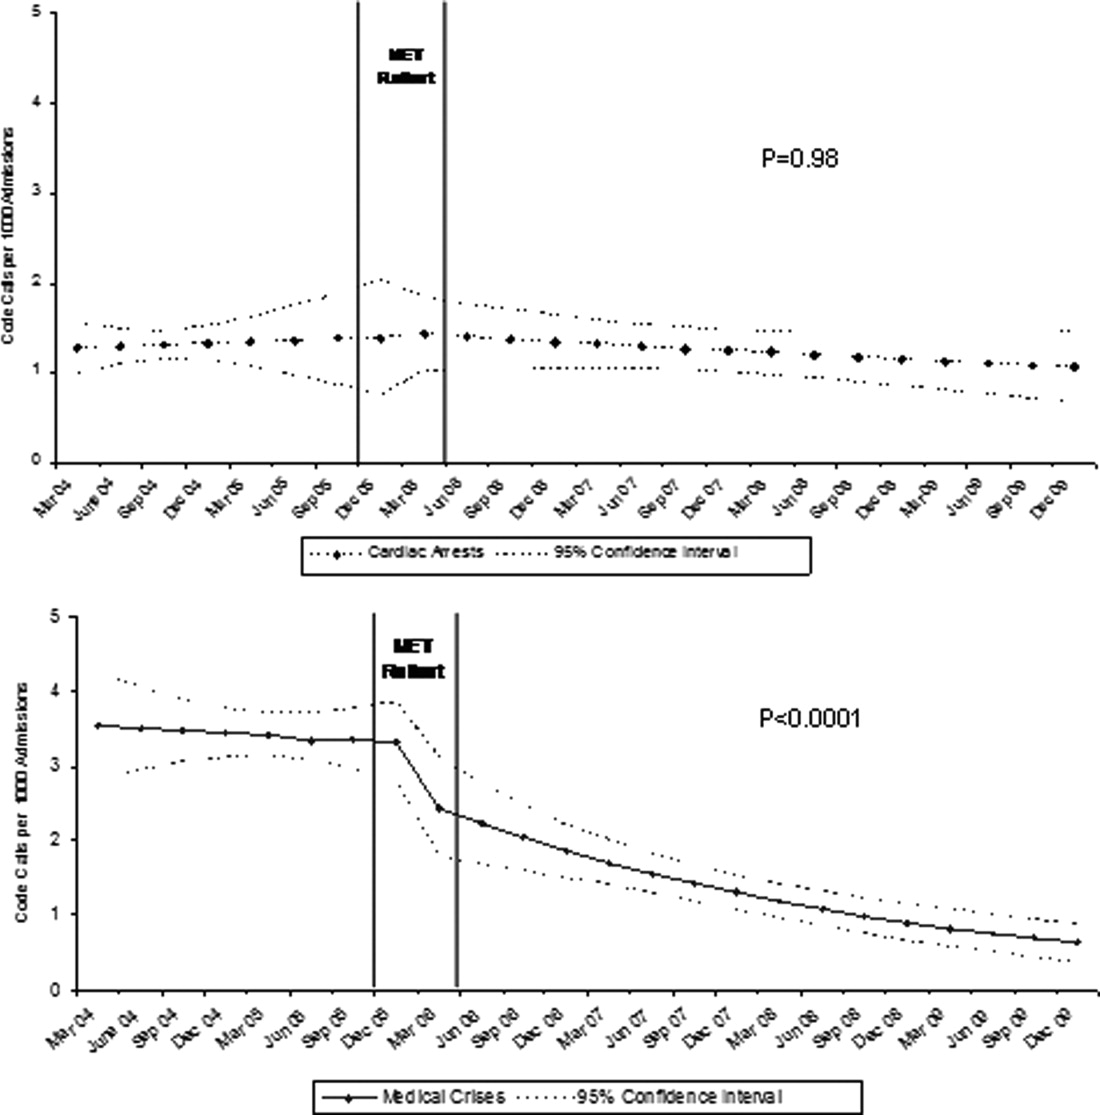
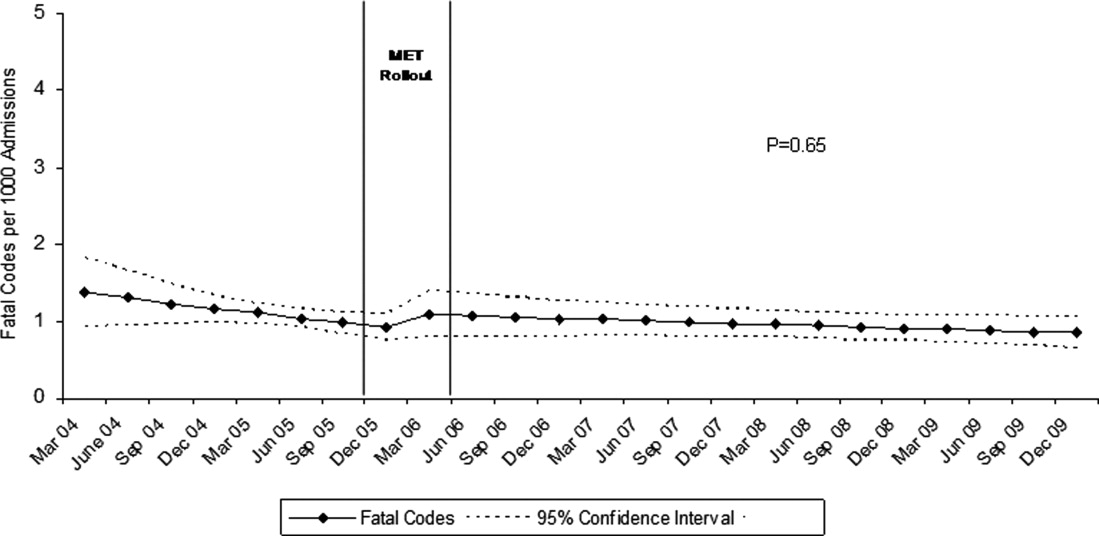
Between January 2004 and December of 2009, the hospital case mix index remained constant, and there were a total of 1202 codes called. The majority (62%) took place outside of critical care units. Linear contrasts of pre‐piecewise and post‐piecewise intercepts revealed that overall code calls declined significantly between pre‐implementation and post‐implementation of the MET from 7.30 (95% CI 5.81, 9.16) codes called per 1000 admissions to 4.21 (95% CI 3.42, 5.18) calls per 1000 admissions (Figure 1; also see Supporting Web Appendix Table 2 in the online version of this article). Outside of critical care, code calls declined from 4.70 (95% CI 3.92, 5.63) before the MET was implemented to 3.11 (95% CI 2.44, 3.97) afterwards (Figure 2); this was due primarily to a decrease in medical crises, which averaged 3.29 events per 1000 admissions (95% CI 2.70, 4.02) before implementation and decreased to 1.72 (95% CI 1.28, 2.31) afterwards, whereas cardiac arrests did not change significantly (Figure 3). Following implementation, code calls within critical care also declined significantly, from 2.59 events per 1000 admissions (95% CI 1.82, 3.69) before to 1.24 events per 1000 admissions (95% CI 0.94, 1.63) afterwards. The change in codes called within critical care was smaller, however, and included reductions in both cardiac arrests ( 0.84 events, P = 0.01) and medical crises ( 0.55, P = 0.08). There was no significant change in the rate of fatal codes per 1000 admissions ( +0.06, P = 0.65) (Figure 4). Overall hospital mortality remained steady at 22.0 deaths per 1000 admissions throughout the study period.
DISCUSSION
In this report, we detail the implementation of a novel hospitalist‐led medical emergency team at a large academic medical center over a period of 4 years. The team, which consisted of the patient's physician, a critical care nurse, a respiratory therapist, and an intravenous therapist, achieved full implementation within 6 months, was well received by the nursing staff, and was associated with a 42% decrease in code calls hospital‐wide. Most of the overall reduction was due to a reduction in codes called for medical crises outside of critical care, accompanied by a lesser reduction in codes called for cardiac arrests and medical crises within critical care units. There was no significant effect on the rate of cardiac arrest outside critical care. More importantly, there was no change in the rate of fatal codes or overall hospital mortality.
The idea of early intervention to prevent deterioration among hospitalized patients appeals to the concept that an ounce of prevention is worth a pound of cure. Like many other preventive interventions, rapid response systems have not always delivered on this promise. Since several early reports from Australia2 suggested that medical emergency teams could reduce not only cardiopulmonary arrests, but overall hospital mortality, there has been a rapid proliferation in their implementation, spurred on by the IHI's 100,000 Lives Campaign, which incorporated rapid response systems as one of 6 hospital‐wide interventions aimed at reducing harm and mortality.13 Subsequent randomized trials have both reproduced and refuted the early observational results. A ward‐randomized trial within 1 British hospital found a 50% reduction in hospital mortality for wards assigned to have an RRT,14 while a cluster randomized trial conducted at 23 Australian hospitals found no difference in rates of cardiac arrest or mortality between hospitals implementing METs and those continuing with usual care.7 Interestingly, in the Australian trial, the rates of cardiac arrest and mortality declined for both groups compared to historical controls, an important limitation to observational trials. Reports from single‐institution observational trials are also divided between those that found a reduction in mortality following implementation and those that did not. A recent meta‐analysis reported that there was too much heterogeneity among these trials to reach a conclusion about the benefits of rapid response systems.15
Our study adds to this literature in several ways. First, our MET design, which included the patient's physician (as opposed to an intensive care physician), was different from those previously studied. Including the patient's physician increases the team's knowledge of the patient and disease, and may improve physician acceptance of METs. In addition, our study provides 4 full years of follow‐up. Second, our rate of MET activation (18 calls/1000 admissions) was 2 to 3 times higher than that seen in most other studies,16 thus, the lack of mortality benefit was not likely the result of underuse. Third, our hospital employs a large number of hospitalists whose continuous presence might be expected to attenuate the benefits of an MET. Indeed, our initial rate of codes (7.5/1000 admissions) was similar to the post‐intervention rate in other studies.4 Nevertheless, the decrease in the overall rate of code calls following implementation of our MET was similar to that observed by others.17 Finally, our stratification of code calls inside critical care (where the MET was not deployed) and outside critical care, as well as the division of codes into cardiac arrest (where intervention is often unsuccessful) and other medical crises (primarily respiratory distress), gives further insight into how METs might work. As expected, we found that outside critical care only, codes called for medical crises declined, implying that the main effect of the MET was to provide early interventions for patients who were not likely to die anyway (eg, respiratory care for patients with respiratory distress or intravenous fluids for hypotensive patients). Instead of intervening to prevent death, MET may avoid emergent intubation by providing respiratory therapy and/or urgent intubation. In addition, it represents a less‐intense option for responding to nonlife‐threatening emergencies, such as seizures or syncope. As codes were no longer called for these types of crises, the rate of code calls necessarily fell. The reason that code calls declined inside critical care is less clear. It could be that patients transferred to critical care by the MET were less likely to code than those transferred before implementation, or the decline might be due to other factors that were not evaluated. Regardless, it is clear that the MET did not simply relocate codes to critical care units.
Our study has a number of limitations. First, it is an observational study and cannot account for other confounders relating to temporal trends in the hospital. However, our long time window allowed us to examine trends over several years. For 2 years prior to implementation of the MET, there was no decline at all in the rate of code calls, followed by an immediate and sustained drop after implementation. Other interventions, including ventilator‐associated pneumonia bundles, sepsis bundles, and advanced cardiac life support simulation training were also implemented at different times during the study period. However, the stark demarcation in code call rates coinciding with MET implementation makes it less likely that these other interventions were responsible for the observed decline. Second, our study was limited to a single institution and a single type of MET. Our findings may not apply to other types of institutions with different staffing arrangements or a different hospital culture, nor would they necessarily apply to different types of MET. Third, our nurse surveys were not collected anonymously, and this may have affected the nurses' responses. Finally, we did not collect physiological parameters on our patients, so we cannot state with certainty what the MET intervention accomplished.
Since initial studies suggested that METs could reduce hospital mortality rates, the Joint Commission has effectively mandated implementation of rapid response systems in all hospitals. Newer evidence, however, has been less convincing of mortality or other benefit. Our study adds to the literature in that we also did not find a mortality benefit. However, there were 2 clear benefits that we did identify. Our MET did appear to substantially reduce total numbers of code calls, particularly codes called for medical crises. Also, our nurses had a very positive response to the MET, which empowered them to get help for a patient when the patient's physician was unavailable or did not take their concerns seriously. Clearly, additional study is needed to better understand the effects of METs on mortality, codes, and other indicators of patient outcomes. However, in the current regulatory environment, such studies will be difficult to perform. Instead, additional studies can clarify which models deliver best outcomes and optimal use of our limited resources.
- ,,,,,.Recognising clinical instability in hospital patients before cardiac arrest or unplanned admission to intensive care. A pilot study in a tertiary‐care hospital.Med J Aust.1999;171:22–25.
- ,,, et al.Rates of in‐hospital arrests, deaths and intensive care admissions: the effect of a medical emergency team.Med J Aust.2000;173:236–240.
- ,,,.The 100,000 Lives Campaign: setting a goal and a deadline for improving health care quality.JAMA.2006;295:324–327.
- ,,,,,.Hospital‐wide code rates and mortality before and after implementation of a rapid response team.JAMA.2008;300:2506–2513.
- ,,,,.Rapid response teams: do they make a difference?Dimens Crit Care Nurs.2007;26:253–262.
- ,,,,,.Effects of a medical emergency team on reduction of incidence of and mortality from unexpected cardiac arrests in hospital: preliminary study.BMJ.2002;324:387–390.
- ,,, et al.Introduction of the medical emergency team (MET) system: a cluster‐randomised controlled trial.Lancet.2005;365:2091–2097.
- ,,, et al.Findings of the first consensus conference on medical emergency teams.Crit Care Med.2006;34:2463–2478.
- ,.Implementation of a rapid response team: a success story.Crit Care Nurse.2009;29:66–76.
- .Practical Biostatistical Methods.Belmont, CA:Wadsworth Publishing;1995.
- ,,,.Regression Methods in Biostatistics: Linear, Logistic, Survival, and Repeated Measures Models.New York:Springer Science + Business Media;2005.
- .A note on the delta method.Am Stat.1992;46:27–29.
- ,.The 100,000 Lives Campaign: crystallizing standards of care for hospitals.Health Aff.2005;24:1560–1570.
- ,,, et al.Introducing critical care outreach: a ward‐randomised trial of phased introduction in a general hospital.Intensive Care Med.2004;30:1398–404.
- ,,,,,.Rapid response systems: a systematic review.Crit Care Med.2007;35:1238–1243.
- ,,,,.Effects of rapid response systems on clinical outcomes: systematic review and meta‐analysis.J Hosp Med.2007;2:422–432.
- ,,,,.Rapid response teams: a systematic review and meta‐analysis.Arch Intern Med.2010;170:18–26.
In‐hospital cardiopulmonary arrests are often preceded by signs of clinical instability, such as changes in vital signs or mental status.1 Nearly 85% of patients who suffer from cardiopulmonary arrests have documented observations of deterioration in the 8 hours before arrest.2 A Medical Emergency Team (MET), sometimes known as Rapid Response Team (RRT), can rapidly assess and manage unstable patients, with the goal that early intervention will prevent adverse outcomes. In 2004, the Institute for Healthcare Improvement (IHI), as part of its 100,000 Lives Campaign, called for hospitals to implement rapid response systems as 1 of 6 strategies to reduce deaths in hospital.3 Since this recommendation, hundreds of hospitals in the United States have invested substantial financial and personnel resources to implement some form of a rapid response system, which is comprised of a varying array of healthcare providers who bring critical care expertise to the patient's bedside.4, 5
Despite the intuitive appeal of the approach, and early observational data which suggested that METs could reduce both codes and unexpected in‐hospital mortality,2, 6 the largest randomized controlled trial found that METs failed to reduce unplanned intensive care unit (ICU) admissions, cardiac arrests, or unexpected deaths.7 More recently, in a prospective observational cohort study at 1 US hospital, Chan et al. found that a nurse‐led RRT did not impact hospital‐wide code rates or mortality.4
The study of rapid response systems is further complicated by a lack of standard definition, and the many types of hospitals in which they may be implemented. In 2006, a consensus conference suggested that MET be used to refer to teams led by physicians (usually intensivists), and RRT be used for teams led by nurses.8 Many studies have been conducted at non‐US institutions, and follow‐up periods have generally been 1 year or less. We report on almost 4 years of experience with a hospitalist‐led MET implemented in a major US academic medical center, and examine the subsequent changes in code calls, cardiac arrests, deaths following cardiopulmonary resuscitation, and overall hospital mortality. Because the MET did not operate in the critical care units, and because cardiac arrest may occur without prior signs of deterioration, we hypothesized that implementation of the MET would correspond to a small drop in total code calls, no change in codes called inside of critical care units, no change in cardiac arrest outside of critical care, and a marked drop in other medical crises (mostly respiratory distress) outside critical care. We also hypothesized that there would be no change in the rate of fatal codes, because most deaths occur in patients who were found to be pulseless on arrival of the code team.
METHODS
Setting
Beginning in March 2006, Baystate Medical Center implemented an MET in accordance with the recommendations of the IHI. Baystate is a 670‐bed tertiary care referral center in Springfield, Massachusetts, and a major teaching hospital for Tufts University. Throughout the study period, the hospital had full‐time intensivists and >90% of medical patients were cared for by hospitalists with 24‐hour coverage. As a result, a medical patient's attending physician or corresponding coverage was usually on site. In order to promote acceptance of the team as well as to maximize continuity of care, we constructed our MET to include a critical care nurse, a respiratory therapist, intravenous therapist, and the patient's physician (either attending or resident). Baystate staff members carry alpha‐numeric pagers, so attendings could be alerted to the fact that the MET had been activated by means of a text page. In the event that the patient's physician could not respond, an ICU physician served as a backup team member. The MET was implemented initially in March of 2006 on 2 medical floors, and over a period of 3 months was gradually expanded to cover the entire hospital. For surgical patients, the MET was led by the attending surgeon or appropriate resident. Educational efforts, including meetings, e‐mails, and posters, targeted nurses in particular, but anyone could summon the MET by calling the activation number posted on all ward telephones. Nurses were encouraged to activate the system for any of the following: heart rate (<40 and >130 beats per minute), systolic blood pressure (<90 mmHg), respiratory rate (<8 or >24 per minute), oxygen saturation (<90% despite supplemental oxygen), altered mental status, or simply concern that something is wrong. The MET implementation oversight committee met biweekly and made adjustments to the team composition and protocols using rapid Plan Do Study Act (PDSA) cycles. A full description of the implementation process has been published elsewhere.9
In addition to the MET, Baystate has a separate code team which can be activated for cardiovascular arrests via a call to a designated phone extension, which activates a page to the code team members and an overhead announcement. Code team members include the ICU medical resident and intern, a critical care nurse, an anesthesiologist, a respiratory therapist, a staff nurse, and the house supervisor. In response to the overhead announcement, doctors, nurses and students in the vicinity often respond as well. Prior to implementation of the MET, a code blue was the only level of immediate response available.
Data and Outcomes
The nurse attending a code blue or code completes a report form which becomes part of the permanent medical record. A copy of the report is reviewed by the Division of Healthcare Quality and housed in the Critical Care administrative offices. For this study, we reviewed all code reports from January 2004 through December 2009. For each report, we extracted the following information: the date, location (inside or outside of a critical care unit), whether the patient had a pulse on arrival of the team, and whether the patient survived to discharge. All activations of the code system were included, regardless of the patient's code status (ie, even if the code was called in error) or the reason for the code call. Patients were then aggregated to calculate the rate of codes called per calendar quarter, as well as the rates of codes called in and out of critical care and the rates of two subsets of code calls, namely cardiac arrests and other medical crises (eg, respiratory arrest or seizures).
MET members were also required to collect data on the reason for the MET call, as well as the response time, time of day and unit, duration of the call, whether the physician was present, whether the patient was transferred to critical care, and whether the patient survived to discharge. In addition, we surveyed the nursing staff directly after the call, asking the following questions: 1) Did the team arrive promptly? 2) Were the critical care nurse and respiratory therapist efficient and respectful? 3) Did you feel the patient's needs were addressed appropriately? 4) Did you feel supported by the MET? and 5) Would you call the MET again?
Statistical Analysis
Quarterly event rates per 1000 admissions were calculated for each outcome. Event rates were compared using piecewise Poisson regression10 with robust standard errors.11 We excluded the 2 quarterly periods (2006 Q1 and Q2) during which the MET was implemented. A piecewise Poisson regression model was chosen to facilitate estimation of: 1) change in code calls from immediately before implementation to immediately after; and 2) temporal trends in code calls before and after implementation. Each model was built with 1 pre‐implementation intercept (December 2005), and 1 post‐implementation intercept (July 2006), as well as 2 slopes, with time coded negatively before the intervention (ie, 2, 1, 0), and positively after (ie, 0, 1, 2). Linear contrasts tested for differences in each parameter. A significant difference in intercepts suggests a post‐intervention decrease in code call rates; a significant, negative post‐intervention slope suggests continuing decline in code call rates. Statistical inferences were aided with visual plots of predicted incidence rates for each quarter in the observation period, with 95% confidence intervals (CI) for each quarterly rate estimated by the delta method.12 Alpha was specified at 0.05 and all significance tests were 2‐sided. Analyses were conducted in Stata 11.1 for Windows ( 2010, StataCorp LP, College Station, TX).
RESULTS
Implementation of the MET
The MET was introduced in the first and second quarters of 2006, with 2717 calls logged through the end of 2009 (out of 154,382 admissions). The rate of MET calls increased during the first 6 months of implementation from 5.95 per 1000 admissions in the first quarter of the intervention, to 15.8 calls per 1000 admissions in the second quarter. Call rates peaked in the first half of 2009, at 20.9 calls per 1000 admissions, leveling off to 17.9 calls per 1000 admissions in the last half of 2009 (Figure 1). Of calls with time recorded, 40% occurred on the day shift, 35% on the evening shift, and 25% on the night shift. The most common reason to call the MET was respiratory distress (33%), followed by cardiovascular instability (25%), and neurological abnormality (20%). In 15% of cases, concern about a patient's condition prompted the nurse to call. Calls came primarily from medical floors (75%) and surgical units (20%). The median response time was 4 minutes (interquartile range [IQR], 2.8 to 5.2 minutes) with no meaningful trend during the study period. The median call duration was 50 minutes (IQR, 38 to 72 minutes). Again, there was no trend over time. The most common interventions were arterial blood gas, fluid resuscitation, and electrocardiogram (see Supporting Web Appendix Table 1 in the online version of this article). A physician was present at 52% of the calls in the first year, which rose to 93% of calls in the final year. Approximately 25% of calls resulted in the patient being transferred to a critical care unit. Staff evaluations were overwhelmingly positive. Nurses rated the teams on the following points: whether the critical care nurse and respiratory therapist were efficient and respectful (mean rating 98%, SD 5.6%); promptness (98%, SD 5.6%); whether the patient's needs were addressed appropriately (mean 98%, SD 4.2%); whether the nurse felt supported by the MET (99.5%, SD 1.7%); and whether they would call the MET again (99.7%, SD 1.4%).
Effect of MET on Code Calls and Mortality
Between January 2004 and December of 2009, the hospital case mix index remained constant, and there were a total of 1202 codes called. The majority (62%) took place outside of critical care units. Linear contrasts of pre‐piecewise and post‐piecewise intercepts revealed that overall code calls declined significantly between pre‐implementation and post‐implementation of the MET from 7.30 (95% CI 5.81, 9.16) codes called per 1000 admissions to 4.21 (95% CI 3.42, 5.18) calls per 1000 admissions (Figure 1; also see Supporting Web Appendix Table 2 in the online version of this article). Outside of critical care, code calls declined from 4.70 (95% CI 3.92, 5.63) before the MET was implemented to 3.11 (95% CI 2.44, 3.97) afterwards (Figure 2); this was due primarily to a decrease in medical crises, which averaged 3.29 events per 1000 admissions (95% CI 2.70, 4.02) before implementation and decreased to 1.72 (95% CI 1.28, 2.31) afterwards, whereas cardiac arrests did not change significantly (Figure 3). Following implementation, code calls within critical care also declined significantly, from 2.59 events per 1000 admissions (95% CI 1.82, 3.69) before to 1.24 events per 1000 admissions (95% CI 0.94, 1.63) afterwards. The change in codes called within critical care was smaller, however, and included reductions in both cardiac arrests ( 0.84 events, P = 0.01) and medical crises ( 0.55, P = 0.08). There was no significant change in the rate of fatal codes per 1000 admissions ( +0.06, P = 0.65) (Figure 4). Overall hospital mortality remained steady at 22.0 deaths per 1000 admissions throughout the study period.
DISCUSSION
In this report, we detail the implementation of a novel hospitalist‐led medical emergency team at a large academic medical center over a period of 4 years. The team, which consisted of the patient's physician, a critical care nurse, a respiratory therapist, and an intravenous therapist, achieved full implementation within 6 months, was well received by the nursing staff, and was associated with a 42% decrease in code calls hospital‐wide. Most of the overall reduction was due to a reduction in codes called for medical crises outside of critical care, accompanied by a lesser reduction in codes called for cardiac arrests and medical crises within critical care units. There was no significant effect on the rate of cardiac arrest outside critical care. More importantly, there was no change in the rate of fatal codes or overall hospital mortality.
The idea of early intervention to prevent deterioration among hospitalized patients appeals to the concept that an ounce of prevention is worth a pound of cure. Like many other preventive interventions, rapid response systems have not always delivered on this promise. Since several early reports from Australia2 suggested that medical emergency teams could reduce not only cardiopulmonary arrests, but overall hospital mortality, there has been a rapid proliferation in their implementation, spurred on by the IHI's 100,000 Lives Campaign, which incorporated rapid response systems as one of 6 hospital‐wide interventions aimed at reducing harm and mortality.13 Subsequent randomized trials have both reproduced and refuted the early observational results. A ward‐randomized trial within 1 British hospital found a 50% reduction in hospital mortality for wards assigned to have an RRT,14 while a cluster randomized trial conducted at 23 Australian hospitals found no difference in rates of cardiac arrest or mortality between hospitals implementing METs and those continuing with usual care.7 Interestingly, in the Australian trial, the rates of cardiac arrest and mortality declined for both groups compared to historical controls, an important limitation to observational trials. Reports from single‐institution observational trials are also divided between those that found a reduction in mortality following implementation and those that did not. A recent meta‐analysis reported that there was too much heterogeneity among these trials to reach a conclusion about the benefits of rapid response systems.15
Our study adds to this literature in several ways. First, our MET design, which included the patient's physician (as opposed to an intensive care physician), was different from those previously studied. Including the patient's physician increases the team's knowledge of the patient and disease, and may improve physician acceptance of METs. In addition, our study provides 4 full years of follow‐up. Second, our rate of MET activation (18 calls/1000 admissions) was 2 to 3 times higher than that seen in most other studies,16 thus, the lack of mortality benefit was not likely the result of underuse. Third, our hospital employs a large number of hospitalists whose continuous presence might be expected to attenuate the benefits of an MET. Indeed, our initial rate of codes (7.5/1000 admissions) was similar to the post‐intervention rate in other studies.4 Nevertheless, the decrease in the overall rate of code calls following implementation of our MET was similar to that observed by others.17 Finally, our stratification of code calls inside critical care (where the MET was not deployed) and outside critical care, as well as the division of codes into cardiac arrest (where intervention is often unsuccessful) and other medical crises (primarily respiratory distress), gives further insight into how METs might work. As expected, we found that outside critical care only, codes called for medical crises declined, implying that the main effect of the MET was to provide early interventions for patients who were not likely to die anyway (eg, respiratory care for patients with respiratory distress or intravenous fluids for hypotensive patients). Instead of intervening to prevent death, MET may avoid emergent intubation by providing respiratory therapy and/or urgent intubation. In addition, it represents a less‐intense option for responding to nonlife‐threatening emergencies, such as seizures or syncope. As codes were no longer called for these types of crises, the rate of code calls necessarily fell. The reason that code calls declined inside critical care is less clear. It could be that patients transferred to critical care by the MET were less likely to code than those transferred before implementation, or the decline might be due to other factors that were not evaluated. Regardless, it is clear that the MET did not simply relocate codes to critical care units.
Our study has a number of limitations. First, it is an observational study and cannot account for other confounders relating to temporal trends in the hospital. However, our long time window allowed us to examine trends over several years. For 2 years prior to implementation of the MET, there was no decline at all in the rate of code calls, followed by an immediate and sustained drop after implementation. Other interventions, including ventilator‐associated pneumonia bundles, sepsis bundles, and advanced cardiac life support simulation training were also implemented at different times during the study period. However, the stark demarcation in code call rates coinciding with MET implementation makes it less likely that these other interventions were responsible for the observed decline. Second, our study was limited to a single institution and a single type of MET. Our findings may not apply to other types of institutions with different staffing arrangements or a different hospital culture, nor would they necessarily apply to different types of MET. Third, our nurse surveys were not collected anonymously, and this may have affected the nurses' responses. Finally, we did not collect physiological parameters on our patients, so we cannot state with certainty what the MET intervention accomplished.
Since initial studies suggested that METs could reduce hospital mortality rates, the Joint Commission has effectively mandated implementation of rapid response systems in all hospitals. Newer evidence, however, has been less convincing of mortality or other benefit. Our study adds to the literature in that we also did not find a mortality benefit. However, there were 2 clear benefits that we did identify. Our MET did appear to substantially reduce total numbers of code calls, particularly codes called for medical crises. Also, our nurses had a very positive response to the MET, which empowered them to get help for a patient when the patient's physician was unavailable or did not take their concerns seriously. Clearly, additional study is needed to better understand the effects of METs on mortality, codes, and other indicators of patient outcomes. However, in the current regulatory environment, such studies will be difficult to perform. Instead, additional studies can clarify which models deliver best outcomes and optimal use of our limited resources.
- ,,,,,.Recognising clinical instability in hospital patients before cardiac arrest or unplanned admission to intensive care. A pilot study in a tertiary‐care hospital.Med J Aust.1999;171:22–25.
- ,,, et al.Rates of in‐hospital arrests, deaths and intensive care admissions: the effect of a medical emergency team.Med J Aust.2000;173:236–240.
- ,,,.The 100,000 Lives Campaign: setting a goal and a deadline for improving health care quality.JAMA.2006;295:324–327.
- ,,,,,.Hospital‐wide code rates and mortality before and after implementation of a rapid response team.JAMA.2008;300:2506–2513.
- ,,,,.Rapid response teams: do they make a difference?Dimens Crit Care Nurs.2007;26:253–262.
- ,,,,,.Effects of a medical emergency team on reduction of incidence of and mortality from unexpected cardiac arrests in hospital: preliminary study.BMJ.2002;324:387–390.
- ,,, et al.Introduction of the medical emergency team (MET) system: a cluster‐randomised controlled trial.Lancet.2005;365:2091–2097.
- ,,, et al.Findings of the first consensus conference on medical emergency teams.Crit Care Med.2006;34:2463–2478.
- ,.Implementation of a rapid response team: a success story.Crit Care Nurse.2009;29:66–76.
- .Practical Biostatistical Methods.Belmont, CA:Wadsworth Publishing;1995.
- ,,,.Regression Methods in Biostatistics: Linear, Logistic, Survival, and Repeated Measures Models.New York:Springer Science + Business Media;2005.
- .A note on the delta method.Am Stat.1992;46:27–29.
- ,.The 100,000 Lives Campaign: crystallizing standards of care for hospitals.Health Aff.2005;24:1560–1570.
- ,,, et al.Introducing critical care outreach: a ward‐randomised trial of phased introduction in a general hospital.Intensive Care Med.2004;30:1398–404.
- ,,,,,.Rapid response systems: a systematic review.Crit Care Med.2007;35:1238–1243.
- ,,,,.Effects of rapid response systems on clinical outcomes: systematic review and meta‐analysis.J Hosp Med.2007;2:422–432.
- ,,,,.Rapid response teams: a systematic review and meta‐analysis.Arch Intern Med.2010;170:18–26.
Copyright © 2011 Society of Hospital Medicine
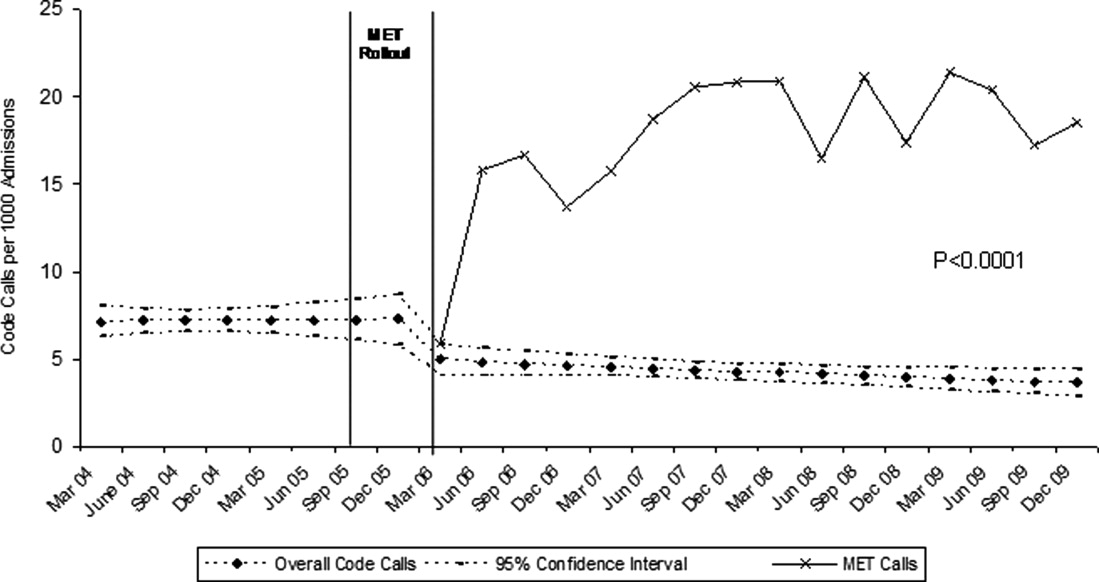
Pediatric Hospitalists' Influences
The number of pediatric hospitalists (PH) in the United States is increasing rapidly. The membership of the American Academy of Pediatrics (AAP) Section on Hospital Medicine has grown to 880 (7/10, AAP Section on Hospital Medicine), and there over 10,000 members of the Society of Hospital Medicine of which an estimated 5% care for children (7/10, Society of Hospital Medicine). Little is known about the educational contributions of pediatric hospitalists, residents' perceptions of hospitalists' roles, or how hospitalists may influence residents' eventual career plans even though 89% of pediatric hospitalists report they serve as teaching attendings.1 Teaching by hospitalists is well received and valued by residents, but, to date, all such data are from single institution studies of individual hospitalist programs.27 Less is known regarding what residents perceive about the differences in patient care provided by hospitalists as compared with traditional pediatric teaching attendings. There is a paucity of information about the level of interest of current pediatric residents in becoming hospitalists, including how many plan such a career, reasons why residents might prefer to become hospitalists, and their perceptions of Pediatric Hospital Medicine (PHM) careers as either long or short term. In addition, the effects of new residency graduates going into Hospital Medicine on the overall pediatric workforce, and how the availability of Hospital Medicine careers affects the choice of practice in Primary Care Pediatrics have not been examined.
We surveyed a national, randomly selected representative sample of pediatric residents to determine their level of exposure to hospitalist attending physicians during training. We asked the resident cohort about their educational experiences with hospitalists, patient care provided by hospitalists on their team, and career plans regarding becoming a hospitalist, including perceived needs for different or additional training. We obtained further information about reasons why hospitalist positions were appealing and about the current relationship between careers in Pediatric Hospital Medicine and Primary Care. To our knowledge, this is the first national study of how pediatric hospitalists might influence residents in the domains of education, patient care, and career planning.
METHODS
We conducted a survey of randomly selected pediatric residents from the AAP membership database. The selection was done by random generation by the AAP Department of Research from the membership database, in the same way members are selected for the annual Survey of Fellows and the annual pediatric level 3 (PL3) survey. Permission was obtained from the American Academy of Pediatrics Section on Residents (AAP SORe) to survey a selection of US pediatric residents in June 2007. The full sample of US pediatric residents included 9569 residents. The AAP SORe had 7694 e‐mail addresses from which the AAP Department of Research generated a random sample of 300 for our use, including Medicine‐Pediatric, Pediatric, and Pediatric Chief residents. One of the researchers (A.H.) sent an e‐mail with the title $200 AAP Career Raffle Survey containing a link to a SurveyMonkey survey (see Supporting Appendix AQuestionnaire in the online version of this article) and offering incentivized participation with a raffle. The need for informed consent was waived, as consent was implied by participation in the survey. The survey was taken anonymously by connecting through the link, and when it was completed, residents were asked to separately e‐mail a Section on Hospital Medicine address if they wished to participate in the raffle. Their raffle request was not linked to their survey results in any way. The $200 was supplied by the AAP Section on Hospital Medicine. The survey was sent 3 times. We analyzed responses with descriptive statistics. Institutional Review Board approval was obtained from Concord Hospital in Concord, New Hampshire.
RESULTS
The respondents are described in Figure 1 and Table 1. For their exposure to PHM, 54% (73 of 111) reported PH attendings in medical school; 90% (75 of 83) did have or will have PH attendings during residency, with no significant variation by program size (small, medium, large, or extra large). The degree of exposure was not asked. To learn about PHM, 47% (46 of 97 respondents) asked a PH in their program, while 28% (27 of 99) visited the AAP web site. Sixty‐eight percent (73 of 108) felt familiar or very familiar with PHM.
| % | Absolute Response Rate | |
|---|---|---|
| ||
| Training year | ||
| PL1 | 47.5 | 57 |
| PL2 | 35 | 42 |
| PL3 | 9 | 11 |
| PL4 | 1 | 1 |
| Skipped question | 7.5 | 9 |
| Gender | ||
| Male | 31.5 | 38 |
| Female | 61 | 73 |
| Skipped question | 7.5 | 9 |
| Specialty | ||
| Pediatrics | 79 | 95 |
| Med/Peds | 14 | 17 |
| Other (Pediatric combination residencies) | 4 | 5 |
| Skipped question | 3 | 3 |
| Program size | ||
| Less than 15 residents in program | 11 | 12 |
| 16‐30 | 38.5 | 42 |
| 31‐45 | 22.9 | 25 |
| Greater than 45 | 27.5 | 30 |
| Skipped question | 9.1 | 11 |
Table 2 summarizes the respondents' perception of PHM. They report a positive opinion of the field and overwhelmingly feel that PHM is a growing/developing field. Almost none feel PHM will not survive. A small percentage (10%, 28 of 99) felt there was no difference between PH and residents, with 25% (25 of 99) feeling some ambiguity about whether the PH role differs from that of a resident. Many (35 of 99) did not disagree that there is little difference between PH and resident positions, although most did. Sixty percent (59 of 99) agreed or strongly agreed that a PH position would be a good job for the short‐term. Forty‐seven percent (46 of 99) agreed in some form that PHM gives you something to do while you are waiting for another position. Given the choice of PHM as a long‐term opportunity, short‐term opportunity, either or not sure: 21% (21 of 98) saw PHM as a short‐term option only; 26% (25 of 98) saw PHM as a long‐term career only; 49% (48 of 98) saw it as either a short‐term option or long‐term career. Most (65%, 64 of 99) believed PH were better than primary care providers at caring for complex inpatients, but only 28% (28 of 99) thought PH provided better care for routine admissions. Most (82%, 81 of 99) agreed in some form that working with pediatric hospitalists enhances a resident's education.
| Strongly/Somewhat Disagree | Neither Disagree or Agree | Somewhat/Strongly Agree | |
|---|---|---|---|
| |||
| I think it is a great field | 2% (9/99) | 15% (15/99) | 83% (82/99) |
| It's a good job for the short‐term | 13% (13/99) | 27% (27/99) | 60% (59/99) |
| It gives you something to do while you are waiting for another position | 20% (20/99) | 33% (33/99) | 47% (46/99) |
| It's a growing/developing field | 1% (1/99) | 8% (8/99) | 91% (90/99) |
| It's a field that won't survive | 86% (85/99) | 13% (13/99) | 1% (1/99) |
| Hospitalists are better able to take care of complex inpatients than are primary care physicians | 20% (20/99) | 15% (15/99) | 65% (64/99) |
| Hospitalists are better able to take care of routine patient admissions than are primary care physicians | 39% (39/99) | 32% (32/99) | 28% (28/99) |
| There is little difference between hospitalist and resident positions | 65% (64/99) | 25% (25/99) | 10% (10/99) |
| Working with hospitalists enhances a residents education | 2% (2/99) | 16% (16/99) | 82% (81/99) |
On a 5‐point scale ranging from would definitely not include to might or might not include to would definitely include, the majority of respondents felt a PHM job would definitely include Pediatric Wards (86%, 84 of 98) and Inpatient Consultant for Specialists (54%, 52 of 97). Only 47% (46/97) felt the responsibilities would probably or definitely include Medical Student and Resident Education (47%, 46 of 97). The respondents were less certain (might or might not response) if PHM should include Normal Newborn Nursery (37%, 36 of 98), Delivery Room (42%, 41 of 98), Intensive Care Nursery (35%, 34 of 98), ED/Urgent Care (34%, 33 of 98), or Research (50%, 49 of 98). A majority of respondents felt PHM unlikely to include, or felt the job might not or might include: Outpatient Clinics (77%, 75 of 98), Outpatient Consults (81%, 79 of 98), and Pediatric Intensive Care Unit work (70%, 68 of 98).
Of categorical pediatric trainees answering the question, 35% (28 of 80) are considering a PHM career. Immediately post‐residency, 30% (24 of 80) of categorical trainees plan to enter Primary Care (PC), 4% (3 of 80) plan on PHM, and 3% (2 of 80) plan to pursue PH fellowship.
Of all respondents given the choice of whether a factor plays no role, limited role, or strong role in considering a career in PHM: flexible hours (96%, 94 of 98), opportunities to participate in education (97%, 95 of 98), and better salary than PC (94%, 91 of 97) would influence their decision to choose PHM. For 49% (48 of 98), ability to do the job without fellowship would play a strong role in choosing a career in PHM.
Forty‐five percent (44 of 97) support training in addition to residency; 16.5% (16 of 97) are against it; the remaining 38% (37 of 97) are unsure. Three percent (3 of 98) thought 3‐year fellowship best, while 28% (27 of 98) preferred 2‐year fellowship; 29% (28 of 98) would like a hospitalist‐track residency; 28% (27 of 98) believe standard residency sufficient; and 4% (4 of 98) felt a chief year adequate. If they were to pursue PHM, 31% (30 of 98) would enter PH fellowship, 34% (33 of 98) would not, and 36% (35 of 98) were unsure.
On a 5‐point scale, respondents were asked about barriers identified to choosing a career in PHM: 28% (27 of 96) agreed or strongly agreed that not feeling well‐enough trained was a barrier to entering the field; 42% (40 of 96) were agreed in some form that they were unsure of what training they needed; 39% (37 of 95) were unsure about where positions are available. Seven percent (7 of 98) of respondents were less likely to choose to practice Primary Care (PC) pediatrics because of hospitalists. Of respondents choosing PC, 59% (34 of 58) prefer or must have PH to work within their future practices, while 12% (7 of 58) prefer not to, or definitely do not want to, work with PH.
DISCUSSION
In 2006, the American Board of Pediatrics (ABP) General Pediatrics Career Survey found that 1% of first‐time applicants were taking a hospitalist position.8 In 2007, this number grew to 3% choosing a position in Pediatric Hospital Medicine.9, 10 The 2009‐2010 survey data found that 7.6% of first‐time applicants would be taking a job as hospitalist as of July 1.11 Our data suggest this number will continue to grow over the next few years. The growth of PHM has prompted an in‐depth look at the field by the ABP.1, 12, 13 PHM programs appear to have become part of the fabric of pediatric care, with the majority of hospitals with PHM programs planning to continue the programs despite the need to pay for value‐added by hospitalists beyond revenue received for their direct clinical service.13 Looking forward, when the Institute of Medicine recommendations to further restrict resident work hours to 16 hour shifts are implemented, many programs plan on increasing their PHM programs.14, 15 Therefore, residents' views of a career in PHM are important, as they give perspective on attitudes of those who might be, or interact with, hospitalists in the future, and should impact training programs for residents regardless of their interest in a career in PHM.
Our national data support local, large institution studies that hospitalists are positively impacting education.27 However, this study suggests that this is not only a local or large academic center phenomenon, but a national trend towards providing a different and positive education experience for pediatric residents. This mirrors the opinion of the majority of residency and clerkship directors who feel that hospitalists are more accessible to trainees than traditional attendings.12 Training programs should consider this impact when selecting attending hospitalists and supporting their roles as mentors and educators.
As residents finish their training and seek positions as pediatric hospitalists, programs need to be aware that a significant percentage of residents in our survey see PHM as a short‐term career option and/or fail to see a difference between a PH job and their own. Program Directors also need to be aware of the breadth of PHM practice which can include areas our respondents felt were less likely to be part of PHM, such as other inpatient areas and the expectation of research.
While 1 option to address some of these issues is fellowship training, this is not a simple decision. PHM needs to determine if fellowship is truly the best option for future hospitalists and, if so, what the fellowship should look like in terms of duration and scope. While the needs of optimal training should be paramount, resident preferences to not commit to an additional 3 years of training must be considered. Many residents fail to see a difference between the role of PH and their own role during training, and feel that the current format of residency training is all the preparation needed to step into a career as a PH. This demonstrates a clear gap between resident perceptions of PHM and the accepted definition of a hospitalist,16 which reaches far beyond direct inpatient care. While The Core Competencies for Pediatric Hospital Medicine17 address a number of these areas, neither trainees nor hospitalists themselves have fully integrated these into their practice. PH must recognize and prepare for their position as mentors and role models to residents. This responsibility should differentiate PH role from that of a resident, demonstrating roles PH play in policy making, patient safety and quality initiatives, in administration, and in providing advanced thinking in direct patient care. Finally, PH and their employers must work to build programs that present PHM as a long‐term career option for residents.
There is a significant impact on the field if those who enter it see it only as something to do while waiting for a position elsewhere. While some of these new‐careerists may stay with the field once they have tried it and become significant contributors, inherent in these answers are the issues of turnover and lack of senior experience many Hospital Medicine programs currently face. Additionally, and outside the scope of this survey, it is unclear what those next positions are and how a brief experience as a hospitalist might impact their future practice.
It is a significant change that residents entering a Primary Care career expect to work with pediatric hospitalists and, in general, see this as a benefit and necessity. The 2007 American Board of Pediatrics' survey found that 27% of respondents planned a career in General Pediatrics with little or no inpatient care.10 Hospitalists of the near future will likely face a dichotomy of needs between primary care providers who trained before, and those who trained after, the existence of hospitalists. Hospitalists will need to understand and address the ongoing needs of both of these groups in order to adequately serve them and their patient‐bases.
Limitations of our study include our small sample size, with a response rate of 43% at best (individual question response rate varied). Though the group was nationally representative, it was skewed towards first year respondents, likely due to the time of year in which it was distributed. There is likely some bias due to the low response rate, in that those more interested in careers as hospitalists might be more likely to respond. This might potentially inflate the percentages of those who state they are interested in being a hospitalist. In addition, given that the last round of the survey went out at the very end of the academic year, graduating residents had a lower response rate.
We were unable to compare opinions across unexposed and exposed residents because only 6.5% reported knowing nothing about the field, and only 2 respondents had not had any exposure to pediatric hospitalists to date. Given that most residencies have PHM services,12 this distinction is unlikely to be significant. In looking at training desires, we did not compare them to residents considering entering other fields of medicine. It may be true that residents considering other fellowships do not desire to do 3 years of fellowship training. That being said, it in no way diminishes the implication that 3‐year fellowships for PHM may not be the right answer for future training.
Strengths of the study include that it is, to our knowledge, the first national study of a group of residents regarding exposure to, and career plans as related to, PH. In addition, the group is gender‐balanced, and represents residents from a range of training sites (urban, suburban, rural) and program sizes. This study offers important information that must be considered in the further development of the field of Pediatric Hospital Medicine.
CONCLUSION
This was the first national study of residents regarding Pediatric Hospital Medicine. Almost all residents are exposed to PH during their training, though a gap of no exposure still exists. More work needs to be done to improve the perception of PHM as a viable long‐term career. Nevertheless, PHM has become a career consideration for trainees. Nearly half agreed that some type of specialized training would be helpful. This information should impact on the development of PHM training programs.
Acknowledgements
Thanks to the American Academy of Pediatrics Section on Hospital Medicine for raffle funding, and Texas Children's Hospital and Dr Yong Han for use of SurveyMonkey and assistance with survey set‐up. Also thanks to Dr Vincent Chang for his guidance and review.
- ,,,;for the Research Advisory Committee of the American Board of Pediatrics.Characteristics of the pediatric hospitalist workforce: its roles and work environment.Pediatrics.2007;120(1):33–39.
- ,,,,,.Effect of a pediatric hospitalist system on housestaff education and experience.Arch Pediatr Adolesc Med.2002;156(9):877–883.
- ,,.Establishing a pediatric hospitalist program at an academic medical center.Clin Pediatr (Phila).2000;39(4):221–227.
- ,,,,,.Restructuring an academic pediatric inpatient service using concepts developed by hospitalists.Clin Pediatr (Phila).2001;40(12):653–660.
- .Employing hospitalists to improve residents' inpatient learning.Acad Med.2001;76(5):556.
- ,,,,,.Community and hospital‐based physicians' attitudes regarding pediatric hospitalist systems.Pediatrics.2005;115(1):34–38.
- ,,,.Pediatric hospitalists: a systematic review of the literature.Pediatrics.2006;117(5):1736–1744.
- American Board of Pediatrics. 2006 General Pediatrics Career Survey. Available at: http://www.abp.org. Accessed on January 15, 2008.
- ,,,,;for the Research Advisory Committee of the American Board of Pediatrics.General pediatrics resident perspectives on training decisions and career choice.Pediatrics.2009;123(1 suppl):S26–S30.
- American Board of Pediatrics. 2007 General Pediatrics Career Survey. Available at: http://www.abp.org. Accessed July 10,2009.
- American Board of Pediatrics. 2009–2010 Workforce Data. Available at: http://www.abp.org. Accessed July 20,2010.
- ,,.Hospitalists' involvement in pediatrics training: perspectives from pediatric residency program and clerkship directors.Acad Med.2009;84(11):1617–1621.
- ,,.Assessing the value of pediatric hospitalist programs: the perspective of hospital leaders.Acad Pediatr.2009;9(3):192–196.
- ,,,.Inpatient staffing within pediatric residency programs: work hour restrictions and the evolving role of the pediatric hospitalist.J Hosp Med.2011;6(in press).
- Accreditation Council for Graduate Medical Education. Available at: http://acgme‐2010standards.org/. Accessed December 15, 2010.
- Society of Hospital Medicine. Available at: http://www.hospitalmedicine.org/AM/Template.cfm?Section=Hospitalist_Definition5:i–iv. doi://10.1002/jhm.776. Available at: http://www3.interscience.wiley.com. Accessed on May 11, 2011.
The number of pediatric hospitalists (PH) in the United States is increasing rapidly. The membership of the American Academy of Pediatrics (AAP) Section on Hospital Medicine has grown to 880 (7/10, AAP Section on Hospital Medicine), and there over 10,000 members of the Society of Hospital Medicine of which an estimated 5% care for children (7/10, Society of Hospital Medicine). Little is known about the educational contributions of pediatric hospitalists, residents' perceptions of hospitalists' roles, or how hospitalists may influence residents' eventual career plans even though 89% of pediatric hospitalists report they serve as teaching attendings.1 Teaching by hospitalists is well received and valued by residents, but, to date, all such data are from single institution studies of individual hospitalist programs.27 Less is known regarding what residents perceive about the differences in patient care provided by hospitalists as compared with traditional pediatric teaching attendings. There is a paucity of information about the level of interest of current pediatric residents in becoming hospitalists, including how many plan such a career, reasons why residents might prefer to become hospitalists, and their perceptions of Pediatric Hospital Medicine (PHM) careers as either long or short term. In addition, the effects of new residency graduates going into Hospital Medicine on the overall pediatric workforce, and how the availability of Hospital Medicine careers affects the choice of practice in Primary Care Pediatrics have not been examined.
We surveyed a national, randomly selected representative sample of pediatric residents to determine their level of exposure to hospitalist attending physicians during training. We asked the resident cohort about their educational experiences with hospitalists, patient care provided by hospitalists on their team, and career plans regarding becoming a hospitalist, including perceived needs for different or additional training. We obtained further information about reasons why hospitalist positions were appealing and about the current relationship between careers in Pediatric Hospital Medicine and Primary Care. To our knowledge, this is the first national study of how pediatric hospitalists might influence residents in the domains of education, patient care, and career planning.
METHODS
We conducted a survey of randomly selected pediatric residents from the AAP membership database. The selection was done by random generation by the AAP Department of Research from the membership database, in the same way members are selected for the annual Survey of Fellows and the annual pediatric level 3 (PL3) survey. Permission was obtained from the American Academy of Pediatrics Section on Residents (AAP SORe) to survey a selection of US pediatric residents in June 2007. The full sample of US pediatric residents included 9569 residents. The AAP SORe had 7694 e‐mail addresses from which the AAP Department of Research generated a random sample of 300 for our use, including Medicine‐Pediatric, Pediatric, and Pediatric Chief residents. One of the researchers (A.H.) sent an e‐mail with the title $200 AAP Career Raffle Survey containing a link to a SurveyMonkey survey (see Supporting Appendix AQuestionnaire in the online version of this article) and offering incentivized participation with a raffle. The need for informed consent was waived, as consent was implied by participation in the survey. The survey was taken anonymously by connecting through the link, and when it was completed, residents were asked to separately e‐mail a Section on Hospital Medicine address if they wished to participate in the raffle. Their raffle request was not linked to their survey results in any way. The $200 was supplied by the AAP Section on Hospital Medicine. The survey was sent 3 times. We analyzed responses with descriptive statistics. Institutional Review Board approval was obtained from Concord Hospital in Concord, New Hampshire.
RESULTS
The respondents are described in Figure 1 and Table 1. For their exposure to PHM, 54% (73 of 111) reported PH attendings in medical school; 90% (75 of 83) did have or will have PH attendings during residency, with no significant variation by program size (small, medium, large, or extra large). The degree of exposure was not asked. To learn about PHM, 47% (46 of 97 respondents) asked a PH in their program, while 28% (27 of 99) visited the AAP web site. Sixty‐eight percent (73 of 108) felt familiar or very familiar with PHM.
| % | Absolute Response Rate | |
|---|---|---|
| ||
| Training year | ||
| PL1 | 47.5 | 57 |
| PL2 | 35 | 42 |
| PL3 | 9 | 11 |
| PL4 | 1 | 1 |
| Skipped question | 7.5 | 9 |
| Gender | ||
| Male | 31.5 | 38 |
| Female | 61 | 73 |
| Skipped question | 7.5 | 9 |
| Specialty | ||
| Pediatrics | 79 | 95 |
| Med/Peds | 14 | 17 |
| Other (Pediatric combination residencies) | 4 | 5 |
| Skipped question | 3 | 3 |
| Program size | ||
| Less than 15 residents in program | 11 | 12 |
| 16‐30 | 38.5 | 42 |
| 31‐45 | 22.9 | 25 |
| Greater than 45 | 27.5 | 30 |
| Skipped question | 9.1 | 11 |
Table 2 summarizes the respondents' perception of PHM. They report a positive opinion of the field and overwhelmingly feel that PHM is a growing/developing field. Almost none feel PHM will not survive. A small percentage (10%, 28 of 99) felt there was no difference between PH and residents, with 25% (25 of 99) feeling some ambiguity about whether the PH role differs from that of a resident. Many (35 of 99) did not disagree that there is little difference between PH and resident positions, although most did. Sixty percent (59 of 99) agreed or strongly agreed that a PH position would be a good job for the short‐term. Forty‐seven percent (46 of 99) agreed in some form that PHM gives you something to do while you are waiting for another position. Given the choice of PHM as a long‐term opportunity, short‐term opportunity, either or not sure: 21% (21 of 98) saw PHM as a short‐term option only; 26% (25 of 98) saw PHM as a long‐term career only; 49% (48 of 98) saw it as either a short‐term option or long‐term career. Most (65%, 64 of 99) believed PH were better than primary care providers at caring for complex inpatients, but only 28% (28 of 99) thought PH provided better care for routine admissions. Most (82%, 81 of 99) agreed in some form that working with pediatric hospitalists enhances a resident's education.
| Strongly/Somewhat Disagree | Neither Disagree or Agree | Somewhat/Strongly Agree | |
|---|---|---|---|
| |||
| I think it is a great field | 2% (9/99) | 15% (15/99) | 83% (82/99) |
| It's a good job for the short‐term | 13% (13/99) | 27% (27/99) | 60% (59/99) |
| It gives you something to do while you are waiting for another position | 20% (20/99) | 33% (33/99) | 47% (46/99) |
| It's a growing/developing field | 1% (1/99) | 8% (8/99) | 91% (90/99) |
| It's a field that won't survive | 86% (85/99) | 13% (13/99) | 1% (1/99) |
| Hospitalists are better able to take care of complex inpatients than are primary care physicians | 20% (20/99) | 15% (15/99) | 65% (64/99) |
| Hospitalists are better able to take care of routine patient admissions than are primary care physicians | 39% (39/99) | 32% (32/99) | 28% (28/99) |
| There is little difference between hospitalist and resident positions | 65% (64/99) | 25% (25/99) | 10% (10/99) |
| Working with hospitalists enhances a residents education | 2% (2/99) | 16% (16/99) | 82% (81/99) |
On a 5‐point scale ranging from would definitely not include to might or might not include to would definitely include, the majority of respondents felt a PHM job would definitely include Pediatric Wards (86%, 84 of 98) and Inpatient Consultant for Specialists (54%, 52 of 97). Only 47% (46/97) felt the responsibilities would probably or definitely include Medical Student and Resident Education (47%, 46 of 97). The respondents were less certain (might or might not response) if PHM should include Normal Newborn Nursery (37%, 36 of 98), Delivery Room (42%, 41 of 98), Intensive Care Nursery (35%, 34 of 98), ED/Urgent Care (34%, 33 of 98), or Research (50%, 49 of 98). A majority of respondents felt PHM unlikely to include, or felt the job might not or might include: Outpatient Clinics (77%, 75 of 98), Outpatient Consults (81%, 79 of 98), and Pediatric Intensive Care Unit work (70%, 68 of 98).
Of categorical pediatric trainees answering the question, 35% (28 of 80) are considering a PHM career. Immediately post‐residency, 30% (24 of 80) of categorical trainees plan to enter Primary Care (PC), 4% (3 of 80) plan on PHM, and 3% (2 of 80) plan to pursue PH fellowship.
Of all respondents given the choice of whether a factor plays no role, limited role, or strong role in considering a career in PHM: flexible hours (96%, 94 of 98), opportunities to participate in education (97%, 95 of 98), and better salary than PC (94%, 91 of 97) would influence their decision to choose PHM. For 49% (48 of 98), ability to do the job without fellowship would play a strong role in choosing a career in PHM.
Forty‐five percent (44 of 97) support training in addition to residency; 16.5% (16 of 97) are against it; the remaining 38% (37 of 97) are unsure. Three percent (3 of 98) thought 3‐year fellowship best, while 28% (27 of 98) preferred 2‐year fellowship; 29% (28 of 98) would like a hospitalist‐track residency; 28% (27 of 98) believe standard residency sufficient; and 4% (4 of 98) felt a chief year adequate. If they were to pursue PHM, 31% (30 of 98) would enter PH fellowship, 34% (33 of 98) would not, and 36% (35 of 98) were unsure.
On a 5‐point scale, respondents were asked about barriers identified to choosing a career in PHM: 28% (27 of 96) agreed or strongly agreed that not feeling well‐enough trained was a barrier to entering the field; 42% (40 of 96) were agreed in some form that they were unsure of what training they needed; 39% (37 of 95) were unsure about where positions are available. Seven percent (7 of 98) of respondents were less likely to choose to practice Primary Care (PC) pediatrics because of hospitalists. Of respondents choosing PC, 59% (34 of 58) prefer or must have PH to work within their future practices, while 12% (7 of 58) prefer not to, or definitely do not want to, work with PH.
DISCUSSION
In 2006, the American Board of Pediatrics (ABP) General Pediatrics Career Survey found that 1% of first‐time applicants were taking a hospitalist position.8 In 2007, this number grew to 3% choosing a position in Pediatric Hospital Medicine.9, 10 The 2009‐2010 survey data found that 7.6% of first‐time applicants would be taking a job as hospitalist as of July 1.11 Our data suggest this number will continue to grow over the next few years. The growth of PHM has prompted an in‐depth look at the field by the ABP.1, 12, 13 PHM programs appear to have become part of the fabric of pediatric care, with the majority of hospitals with PHM programs planning to continue the programs despite the need to pay for value‐added by hospitalists beyond revenue received for their direct clinical service.13 Looking forward, when the Institute of Medicine recommendations to further restrict resident work hours to 16 hour shifts are implemented, many programs plan on increasing their PHM programs.14, 15 Therefore, residents' views of a career in PHM are important, as they give perspective on attitudes of those who might be, or interact with, hospitalists in the future, and should impact training programs for residents regardless of their interest in a career in PHM.
Our national data support local, large institution studies that hospitalists are positively impacting education.27 However, this study suggests that this is not only a local or large academic center phenomenon, but a national trend towards providing a different and positive education experience for pediatric residents. This mirrors the opinion of the majority of residency and clerkship directors who feel that hospitalists are more accessible to trainees than traditional attendings.12 Training programs should consider this impact when selecting attending hospitalists and supporting their roles as mentors and educators.
As residents finish their training and seek positions as pediatric hospitalists, programs need to be aware that a significant percentage of residents in our survey see PHM as a short‐term career option and/or fail to see a difference between a PH job and their own. Program Directors also need to be aware of the breadth of PHM practice which can include areas our respondents felt were less likely to be part of PHM, such as other inpatient areas and the expectation of research.
While 1 option to address some of these issues is fellowship training, this is not a simple decision. PHM needs to determine if fellowship is truly the best option for future hospitalists and, if so, what the fellowship should look like in terms of duration and scope. While the needs of optimal training should be paramount, resident preferences to not commit to an additional 3 years of training must be considered. Many residents fail to see a difference between the role of PH and their own role during training, and feel that the current format of residency training is all the preparation needed to step into a career as a PH. This demonstrates a clear gap between resident perceptions of PHM and the accepted definition of a hospitalist,16 which reaches far beyond direct inpatient care. While The Core Competencies for Pediatric Hospital Medicine17 address a number of these areas, neither trainees nor hospitalists themselves have fully integrated these into their practice. PH must recognize and prepare for their position as mentors and role models to residents. This responsibility should differentiate PH role from that of a resident, demonstrating roles PH play in policy making, patient safety and quality initiatives, in administration, and in providing advanced thinking in direct patient care. Finally, PH and their employers must work to build programs that present PHM as a long‐term career option for residents.
There is a significant impact on the field if those who enter it see it only as something to do while waiting for a position elsewhere. While some of these new‐careerists may stay with the field once they have tried it and become significant contributors, inherent in these answers are the issues of turnover and lack of senior experience many Hospital Medicine programs currently face. Additionally, and outside the scope of this survey, it is unclear what those next positions are and how a brief experience as a hospitalist might impact their future practice.
It is a significant change that residents entering a Primary Care career expect to work with pediatric hospitalists and, in general, see this as a benefit and necessity. The 2007 American Board of Pediatrics' survey found that 27% of respondents planned a career in General Pediatrics with little or no inpatient care.10 Hospitalists of the near future will likely face a dichotomy of needs between primary care providers who trained before, and those who trained after, the existence of hospitalists. Hospitalists will need to understand and address the ongoing needs of both of these groups in order to adequately serve them and their patient‐bases.
Limitations of our study include our small sample size, with a response rate of 43% at best (individual question response rate varied). Though the group was nationally representative, it was skewed towards first year respondents, likely due to the time of year in which it was distributed. There is likely some bias due to the low response rate, in that those more interested in careers as hospitalists might be more likely to respond. This might potentially inflate the percentages of those who state they are interested in being a hospitalist. In addition, given that the last round of the survey went out at the very end of the academic year, graduating residents had a lower response rate.
We were unable to compare opinions across unexposed and exposed residents because only 6.5% reported knowing nothing about the field, and only 2 respondents had not had any exposure to pediatric hospitalists to date. Given that most residencies have PHM services,12 this distinction is unlikely to be significant. In looking at training desires, we did not compare them to residents considering entering other fields of medicine. It may be true that residents considering other fellowships do not desire to do 3 years of fellowship training. That being said, it in no way diminishes the implication that 3‐year fellowships for PHM may not be the right answer for future training.
Strengths of the study include that it is, to our knowledge, the first national study of a group of residents regarding exposure to, and career plans as related to, PH. In addition, the group is gender‐balanced, and represents residents from a range of training sites (urban, suburban, rural) and program sizes. This study offers important information that must be considered in the further development of the field of Pediatric Hospital Medicine.
CONCLUSION
This was the first national study of residents regarding Pediatric Hospital Medicine. Almost all residents are exposed to PH during their training, though a gap of no exposure still exists. More work needs to be done to improve the perception of PHM as a viable long‐term career. Nevertheless, PHM has become a career consideration for trainees. Nearly half agreed that some type of specialized training would be helpful. This information should impact on the development of PHM training programs.
Acknowledgements
Thanks to the American Academy of Pediatrics Section on Hospital Medicine for raffle funding, and Texas Children's Hospital and Dr Yong Han for use of SurveyMonkey and assistance with survey set‐up. Also thanks to Dr Vincent Chang for his guidance and review.
- ,,,;for the Research Advisory Committee of the American Board of Pediatrics.Characteristics of the pediatric hospitalist workforce: its roles and work environment.Pediatrics.2007;120(1):33–39.
- ,,,,,.Effect of a pediatric hospitalist system on housestaff education and experience.Arch Pediatr Adolesc Med.2002;156(9):877–883.
- ,,.Establishing a pediatric hospitalist program at an academic medical center.Clin Pediatr (Phila).2000;39(4):221–227.
- ,,,,,.Restructuring an academic pediatric inpatient service using concepts developed by hospitalists.Clin Pediatr (Phila).2001;40(12):653–660.
- .Employing hospitalists to improve residents' inpatient learning.Acad Med.2001;76(5):556.
- ,,,,,.Community and hospital‐based physicians' attitudes regarding pediatric hospitalist systems.Pediatrics.2005;115(1):34–38.
- ,,,.Pediatric hospitalists: a systematic review of the literature.Pediatrics.2006;117(5):1736–1744.
- American Board of Pediatrics. 2006 General Pediatrics Career Survey. Available at: http://www.abp.org. Accessed on January 15, 2008.
- ,,,,;for the Research Advisory Committee of the American Board of Pediatrics.General pediatrics resident perspectives on training decisions and career choice.Pediatrics.2009;123(1 suppl):S26–S30.
- American Board of Pediatrics. 2007 General Pediatrics Career Survey. Available at: http://www.abp.org. Accessed July 10,2009.
- American Board of Pediatrics. 2009–2010 Workforce Data. Available at: http://www.abp.org. Accessed July 20,2010.
- ,,.Hospitalists' involvement in pediatrics training: perspectives from pediatric residency program and clerkship directors.Acad Med.2009;84(11):1617–1621.
- ,,.Assessing the value of pediatric hospitalist programs: the perspective of hospital leaders.Acad Pediatr.2009;9(3):192–196.
- ,,,.Inpatient staffing within pediatric residency programs: work hour restrictions and the evolving role of the pediatric hospitalist.J Hosp Med.2011;6(in press).
- Accreditation Council for Graduate Medical Education. Available at: http://acgme‐2010standards.org/. Accessed December 15, 2010.
- Society of Hospital Medicine. Available at: http://www.hospitalmedicine.org/AM/Template.cfm?Section=Hospitalist_Definition5:i–iv. doi://10.1002/jhm.776. Available at: http://www3.interscience.wiley.com. Accessed on May 11, 2011.
Copyright © 2011 Society of Hospital Medicine

Can Healthcare Go From Good to Great?
The American healthcare system produces a product whose quality, safety, reliability, and cost would be incompatible with corporate survival, were they created by a business operating in a competitive industry. Care fails to comport with best evidence nearly half of the time.1 Tens of thousands of Americans die yearly from preventable medical mistakes.2 The healthcare inflation rate is nearly twice that of the rest of the economy, rapidly outstripping the ability of employers, tax revenues, and consumers to pay the mounting bills.
Increasingly, the healthcare system is being held accountable for this lack of value. Whether through a more robust accreditation and regulatory environment, public reporting of quality and safety metrics, or pay for performance (or no pay for errors) initiatives, outside stakeholders are creating performance pressures that scarcely existed a decade ago.
Healthcare organizations and providers have begun to take notice and act, often by seeking answers from industries outside healthcare and thoughtfully importing these lessons into medicine. For example, the use of checklists has been adopted by healthcare (from aviation), with impressive results.3, 4 Many quality methods drawn from industry (Lean, Toyota, Six Sigma) have been used to try to improve performance and remove waste from complex processes.5, 6
While these efforts have been helpful, their focus has generally been at the point‐of‐careimproving the care of patients with acute myocardial infarction or decreasing readmissions. However, while the business community has long recognized that poor management and structure can thwart most efforts to improve individual processes, healthcare has paid relatively little attention to issues of organizational structure and leadership. The question arises: Could methods that have been used to learn from top‐performing businesses be helpful to healthcare's efforts to improve its own organizational performance?
In this article, we describe perhaps the best known effort to identify top‐performing corporations, compare them to carefully selected organizations that failed to achieve similar levels of performance, and glean lessons from these analyses. This effort, described in a book entitled Good to Great: Why Some Companies Make the Leapand Others Don't, has sold more than 3 million copies in its 35 languages, and is often cited by business leaders as a seminal work. We ask whether the methods of Good to Great might be applicable to healthcare organizations seeking to produce the kinds of value that patients and purchasers need and deserve.
GOOD TO GREAT METHODOLOGY
In 2001, business consultant Jim Collins published Good to Great. Its methods can be divided into 3 main components: (1) a gold standard metric to identify top organizations; (2) the creation of a control group of organizations that appeared similar to the top performers at the start of the study, but failed to match the successful organizations' performance over time; and (3) a detailed review of the methods, leadership, and structure of both the winning and laggard organizations, drawing lessons from their differences. Before discussing whether these methods could be used to analyze healthcare organizations, it is worth describing Collins' methods in more detail.
The first component of Good to Great's structure was the use of 4 metrics to identify top‐performing companies (Table 1). To select the good to great companies, Collins and his team began with a field of 1435 companies drawn from Fortune magazine's rankings of America's largest public companies. They then used the criteria in Table 1 to narrow the list to their final 11 companies, which formed the experimental group for the analysis.
|
| The company had to show a pattern of good performance punctuated by a transition point when it shifted to great performance. Great performance was defined as a cumulative total stock return of at least 3 times the general stock market for the period from the transition point through 15 years. |
| The transition from good to great had to be company‐specific, not an industry‐wide event. |
| The company had to be an established enterprise, not a startup, in business for at least 10 years prior to its transition. |
| At the time of the selection (in 1996), the company still had to show an upward trend. |
After identifying these 11 top‐performing companies, Collins created a control group, composed of companies with similar attributes that could have made the transition, but failed to do so.7 To create the control group, Collins matched and scored a pool of control group candidates based on the following criteria: similarities of business model, size, age, and cumulative stock returns prior to the good to great transition. When there were several potential controls, Collins chose companies that were larger, more profitable, and had a stronger market position and reputation prior to the transition, in order to increase the probability that the experimental companies' successes were not incidental.8 Table 2 lists the paired experimental and control companies.
| Experimental Company | Control Company |
|---|---|
| |
| Abbott | Upjohn |
| Circuit City | Silo |
| Fannie Mae | Great Western |
| Gillette | Warner‐Lambert |
| Kimberly‐Clark | Scott Paper |
| Kroger | A&P |
| Nucor | Bethlehem Steel |
| Philip Morris | R.J. Reynolds |
| Pitney Bowes | Addressograph |
| Walgreen's | Eckerd |
| Wells Fargo | Bank of America |
Finally, Collins performed a detailed historical analysis on the experimental and control groups, using materials (such as major articles published on the company, books, academic case studies, analyst reports, and financial and annual reports) that assessed the companies in real time. Good to Great relied on evidence from the period of interest (ie, accrued prior to the transition point) to avoid biases that would likely result from relying on retrospective sources of data.9
This analysis identified a series of factors that were generally present in good to great companies and absent in the control organizations. In brief, they were: building a culture of discipline, making change through gradual and consistent improvement, having a leader with a paradoxical blend of personal humility and professional will, and relentlessly focusing on hiring and nurturing the best employees. Over 6000 articles and 5 years of analysis support these conclusions.8
EFFORTS TO DATE TO ANALYZE HEALTHCARE ORGANIZATIONAL CHARACTERISTICS
We reviewed a convenience sample of the literature on organizational change in healthcare, and found only 1 study that utilized a similar methodology to that of Good to Great: an analysis of the academic medical centers that participate in the University HealthSystem Consortium (UHC). Drawing inspiration from Collins' methodologies, the UHC study developed a holistic measure of quality, based on safety, mortality, compliance with evidence‐based practices, and equity of care. Using these criteria, the investigators selected 3 UHC member organizations that were performing extremely well, and 3 others performing toward the middle and bottom of the pack. Experts on health system organization then conducted detailed site visits to these 6 academic medical centers. The researchers were blinded to these rankings at the time of the visits, but were able to perfectly predict which cohort the organizations were in.
The investigators analyzed the factors that seemed to be present in the top‐performing organizations, but were absent in the laggards, and found: hospital leadership emphasizing a patients‐first mission, an alignment of departmental objectives to reduce conflict, a concrete accountability structure for quality, a relentless focus on measurable improvement, and a culture promoting interprofessional collaboration on quality.10
While the UHC study is among the most robust exploration of healthcare organization dynamics in the literature, it has a few limitations. The first is that it studied a small, relatively specialized population: UHC members, which are large, mostly urban, well‐resourced teaching hospitals. While studying segments of populations can limit the generalizability of some of the UHC studies' findings, their approach can be a useful model to apply to studying other types of healthcare institutions. (And, to be fair, Good to Great also studies a specialized populationFortune 500 companiesand thus its lessons need to be extrapolated to other businesses, such as small companies, with a degree of caution.) The study also suffers from the relative paucity of publicly accessible organizational data in healthcare. The fact that the UHC investigators depended on both top‐performing and laggard hospitals, to voluntarily release their organizational data and permit a detailed site visit, potentially introduces a selection bias into the survey population, a bias not present in Good to Great due to Collins' protocol for matching cases and controls.
There have been several other efforts, using different methods, to determine organizational predictors of success in healthcare. The results of several important studies are shown in Table 3. Taken together, they indicate that higher performing organizations make practitioners accountable for performance measurements, and implement systems designed to both reduce errors and facilitate adherence to evidence‐based guidelines. In addition to these studies, several consulting organizations and foundations have performed focused reviews of high‐performing healthcare organizations in an effort to identify key success factors.11 These studies, while elucidating factors that influence organizational performance, suffer from variable quality measures and subjective methods for gathering organizational data, both of which are addressed within a good to great‐style analysis.12
| Study | Key Findings |
|---|---|
| |
| Keroack et al.10 | Superior‐performing organizations were distinguished from average ones by having: hospital leadership emphasizing a patients‐first mission, an alignment of departmental objectives to reduce conflict, concrete accountability structures for quality, a relentless focus on measurable improvement, and a culture promoting interprofessional collaboration toward quality improvement measures. |
| Jha et al.22 | Factors that led to the VA's improved performance included: |
| Implementation of a systematic approach to measurement, management, and accountability for quality. | |
| Initiating routine performance measurements for high‐priority conditions. | |
| Creating performance contracts to hold managers accountable for meeting improvement goals. | |
| Having an independent agency gather and monitor data. | |
| Implementing process improvements, such as an integrated, comprehensive medical‐record system. | |
| Making performance data public and distributing these data widely within the VA and among other key stakeholders (veterans' service organizations, Congress). | |
| Shortell et al.20 | Focusing on reducing the barriers and encouraging the adoption of evidence‐based organizational management is associated with better patient outcomes. Examples of reducing barriers to encourage adoption of evidence‐based guidelines include: |
| Installing an IT system to improve chronic care management. | |
| Creating a culture where practitioners can help each other learn from their mistakes. | |
| Knaus et al.21 | The interaction and coordination of each hospital's ICU staff had a greater correlation with reduced mortality rates than did the unit's administrative structure, amount of specialized treatment used, or the hospital's teaching status. |
| Pronovost et al.3 | Introducing a checklist of 5 evidence‐based procedures into a healthcare team's operation can significantly reduce the rate of catheter‐associated infections. |
| Simple process change interventions, such as checklists, must be accompanied by efforts to improve team culture and create leadership accountability and engagement. | |
| Pronovost et al.30 | Implementing evidence‐based therapies by embedding them within a healthcare team's culture is more effective than simply focusing on changing physician behavior. |
| The authors proposed a 4‐step model for implementing evidence‐based therapies: select interventions with the largest benefit and lowest barriers to use, identify local barriers to implementation, measure performance, and ensure all patients receive the interventions. | |
Perhaps the best‐known study on healthcare organizational performance is The Dartmouth Atlas, an analysis that (though based on data accumulated over more than 30 years) has received tremendous public attention, in recent years, in the context of the debate over healthcare reform.13 However, by early 2010, the Dartmouth analysis was stirring controversy, with some observers expressing concerns over its focus on care toward the end of life, its methods for adjusting for case‐mix and sociodemographic predictors of outcomes and costs, and its exclusive use of Medicare data.14, 15 These limitations are also addressed by a good to great‐style analysis.
WOULD A GOOD TO GREAT ANALYSIS BE POSSIBLE IN HEALTHCARE?
While this review of prior research on organizational success factors in healthcare illustrates considerable interest in this area, none of the studies, to date, matches Good to Great in the robustness of the analysis or, obviously, its impact on the profession. Could a good to great analysis be carried out in healthcare? It is worth considering this by assessing each of Collins' 3 key steps: identifying the enterprises that made a good to great leap, selecting appropriate control organizations, and determining the factors that contributed to the successes of the former group.
Good to Great used an impressive elevation in stock price as a summary measure of organizational success. In the for‐profit business world, it is often assumed that Adam Smith's invisible hand makes corporate information available to investors, causing an organization's stock price to capture the overall success of its business strategy, including its product quality and operational efficiency.16 In the healthcare world, mostly populated by non‐profit organizations that are simultaneously working toward a bottom line and carrying out a social mission, there is no obvious equivalent to the stock price for measuring overall organizational performance and value. All of the methods for judging top hospitals, for example, are flaweda recent study found that the widely cited U.S. News & World Report's America's Best Hospitals list is largely driven by hospital reputation,17 while another study found glaring inconsistencies among methods used to calculate risk‐adjusted mortality rates.18 A generally accepted set of metrics defining the value of care produced by a healthcare organization (including quality, safety, access, patient satisfaction, and efficiency) would be needed to mirror the first good to great step: defining top‐performing organizations using a gold standard.19 The summary measure used in the UHC study is the closest we have seen to a good to great‐style summary performance measure in healthcare.10
While it is important to identify a gold‐standard measure of organizational quality, careful selection of a control organization may be the most important step in conducting a good to great analysis. Although Collins' use of stock price as a summary measure of organizational performance is the best measure available in business, it is by no means perfect. Despite this shortcoming, however, Collins believes that the central requirement is not finding a perfect measure of organizational success, but rather determining what correlates with a divergence of performance in stock price (J. Collins, oral communication, July 2010). Similar to clinical trials, meticulous matching of a good to great organization with a control has the advantage of canceling out extraneous environmental factors, thereby enabling the elucidation of organizational factors that contribute to divergent performance. Good to Great's methods depended on substantial historical background to define top performers and controls. Unfortunately, healthcare lacks an analog to the business world's robust historical and publicly accessible record of performance and organizational data. Therefore, even if a certain organization was determined to be a top performer based on a gold‐standard measure, selecting a control organization by matching its organizational and performance data to the top performer's would be unfeasible.
Finally, the lack of a historical record in healthcare also places substantial roadblocks in the way of looking under the organization's hood. Even in pioneering organizational analyses by Shortell et al.,20 Knaus et al.,21 and Jha et al.,22 substantial parts of their analyses relied on retrospective accounts to determine organizational characteristics. To remove the bias that comes from knowing the organization's ultimate performance, Collins was careful to base his analysis of organizational structures and leadership on documents available before the good to great transition. Equivalent data in healthcare are extremely difficult to find.
While it is best to rely on an historical record, it may be possible to carry out a good to great‐type analysis through meticulous structuring of personal interviews. Collins has endorsed a non‐healthcare study that utilized the good to great matching strategy but used personal interviews to make up for lack of access to a substantial historical record.23 To reduce the bias inherent in relying on interviews, the research team ensured that the good to great transition was sustained for many years, and that the practices elicited from the interviews started before the good to great transition. Both of these techniques helped increase the probability that the identified practices contributed to the transition to superior results (in this case, in public education outcomes) and, thus, that the adoption of these practices could result in improvements elsewhere (J. Collins, oral communication, July 2010).
To make such a study possible in healthcare, more organizational data are required. Without prodding by outside stakeholders, most healthcare organizations have been reluctant to publicize performance data for fear of malpractice risk,24 or based on their belief that current data paint an incomplete or inaccurate picture of their quality.25 Trends toward required reporting of quality data (such as via Medicare's Hospital Compare Web site) offer hope that future comparisons could rely on robust organizational quality and safety data. Instituting healthcare analogs to Securities & Exchange Commission (SEC) reporting mandates would further ameliorate this information deficit.26
While we believe that Good to Great offers lessons relevant to healthcare, there are limitations that are worth considering. First, the extraordinary complexity of healthcare organizations makes it likely that a matched‐pair‐type study would need to be accompanied by other types of analyses, including more quantitative analyses of large datasets, to give a full picture of structural and leadership predictors of strong performance. Moreover, before embracing the good to great method, some will undoubtedly point to the demise of Circuit City and Fannie Mae (2 of the Good to Great companies; Table 2) as a cautionary note. Collins addresses this issue with the commonsensical argument that the success of a company needs to be judged in the context of the era. By way of analogy, he points to the value of studying a sports team, such as the John Wooden‐coached UCLA teams of the 1960s and 1970s, notwithstanding the less stellar performance of today's UCLA team. In fact, Collins' recent book mines some of these failures for their important lessons.27
GOOD TO GREAT IN HEALTHCARE
Breaking through healthcare's myopia to explore solutions drawn from other industries, such as checklists, simulation, and industrial approaches to quality improvement, has yielded substantial insights and catalyzed major improvements in care. Similarly, we believe that finding ways to measure the performance of healthcare organizations on both cost and quality, to learn from those organizations achieving superior performance, and to create a policy and educational environment that rewards superior performance and helps poor performers improve, is a defining issue for healthcare. This will be particularly crucial as the policy environment changestransitions to Accountable Care Organizations28 and bundled payments29 are likely to increase the pressure on healthcare organizations to learn the secrets of their better‐performing brethren. These shifts are likely to put an even greater premium on the kinds of leadership, organizational structure, and ability to adapt to a changing environment that Collins highlighted in his analysis. After all, it is under the most challenging conditions that top organizations often prove their mettle.
Although there are considerable challenges in performing a good to great analysis in healthcare (Table 4), the overall point remains: Healthcare is likely to benefit from rigorous, unbiased methods to distinguish successful from less successful organizations, to learn the lessons of both, and to apply these lessons to improvement efforts.
| Issue* | Good to Great* | What Exists in Healthcare | How Healthcare Can Fill in the Gaps |
|---|---|---|---|
| |||
| Gold standard measure of quality | Cumulative total stock return of at least 3 times the general market for the period from the transition point through 15 years. | Risk‐adjusted patient outcomes data (eg, mortality), process data (eg, appropriate medication use), structural data (eg, stroke center). | Create a more robust constellation of quality criteria to measure organizational performance (risk‐adjusted patient outcomes, avoidable deaths, adherence to evidence‐based guidelines, cost effectiveness, patient satisfaction); develop a generally accepted roll‐up measure. Of the studies we reviewed, the UHC study's summary measure was the closest representation to a good to great‐summary performance measure. |
| At the time of the selection, the good to great company still had to show an upward trend. | The study of the VA's transformation and the ongoing UHC study stand out as examples of studying the upward trends of healthcare organizations.22 | Make sure that the high‐performing healthcare organizations are still improvingas indicated by gold standard measures. Once the organizations are identified, study the methods these organizations utilized to improve their performance. | |
| The turnaround had to be company‐specific, not an industry‐wide event. | A few organizations have been lauded for transformations (such as the VA system).22 In most circumstances, organizations praised for high quality (eg, Geisinger, Mayo Clinic, Cleveland Clinic) have long‐established corporate tradition and culture that would be difficult to imitate. The VA operates within a system that is unique and not replicable by most healthcare organizations. | Healthcare needs to identify more examples like the VA turnaround, particularly examples of hospitals or healthcare organizations operating in more typical environmentssuch as a community or rural hospital. | |
| The company had to be an established enterprise, not a startup, in business for at least 10 years prior to its transition. | Most of the healthcare organizations of interest are large organizations with complex corporate cultures, not startups. | Not applicable. | |
| Comparison method | Collins selected a comparison company that was almost exactly the same as the good to great company, except for the transition. The selection criteria were business fit, size fit, age fit, stock chart fit, conservative test, and face validity.* | Healthcare organizational studies are mostly comparisons of organizations that all experience success; few studies compare high‐performing with nonhigh‐performing organizations. (Jha et al. compared Medicare data from non‐VA hospitals and the VA, but did not use similar criteria to select similar organizations22; Keroack and colleagues' comparison of 3 mediocre to 3 superior‐performing hospitals is the closest analog to the Good to Great methodology thus far.10) | Similar to the Good to Great study, a set of factors that can categorize healthcare organizations according to similarities must be devised (eg, outpatient care, inpatient care, academic affiliation, tertiary care center, patient demographics), but finding similar organizations whose performance diverged over time is challenging. |
| Analysis of factors that separated great companies from those that did not make the transition to greatness | Good to Great used annual reports, letters to shareholders, articles written about the company during the period of interest, books about the company, business school case studies, analyst reports written in real time. | Most of the research conducted thus far has been retrospective analyses of why organizations became top performers. | The historical source of data is almost nonexistent in comparison with the business world. A parallel effort would have to capture a mixture of structure and process changes, along with organizational variables. The most effective method would be a prospective organizational assessment of several organizations, following them over time to see which ones markedly improved their performance. |
- ,,, et al.The quality of health care delivered to adults in the United States.N Engl J Med.2003;348(26):2635–2645.
- ,,;for the Institute of Medicine (US), Committee on Quality of Health Care in America.To Err Is Human: Building a Safer Health System.Washington, DC:National Academy Press;1999. Available at: http://www.nap.edu/books/0309068371/html/. Accessed August 22, 2011.
- ,,, et al.An intervention to decrease catheter‐related bloodstream infections in the ICU.N Engl J Med.2006;355(26):2725–2732.
- ,,, et al.A surgical safety checklist to reduce morbidity and mortality in a global population.N Engl J Med.2009;360(5):491–499.
- ,,,,,.Using industrial processes to improve patient care.BMJ.2004;328(7432):162–164.
- ,,,,.Lean six sigma in healthcare.J Healthc Qual.2006;28(2):4–11.
- .Good to great.Fast Company. September 30,2001. Available at: http://www.fastcompany.com/magazine/51/goodtogreat.html. Accessed August 22, 2011.
- .Good to Great: Why Some Companies Make the Leap… and Others Don't.New York, NY:HarperBusiness;2001.
- .It's in the research.Jim Collins. Available at: http://www.jimcollins.com/books/research.html. Accessed May 23,2010.
- ,,,,,.Organizational factors associated with high performance in quality and safety in academic medical centers.Acad Med.2007;82(12):1178–1186.
- ,,,,.Hosptial Quality: Ingredients for Success—a Case Study of Beth Israel Deaconess Medical Center.New York, NY:Commonwealth Fund;2004. Available at: http://www.commonwealthfund.org/Content/Publications/Fund‐Reports/2004/Jul/Hospital‐Quality–Ingredients‐for‐Success‐A‐Case‐Study‐of‐Beth‐Israel‐Deaconess‐Medical‐Center. aspx. Accessed August 22, 2011.
- ,,;for the Commonwealth Fund.Hospital quality improvement strategies and lessons from U.S. hospitals.New York, NY:Commonwealth Fund;2007. Available at: http://www.commonwealthfund.org/usr_doc/Silow‐Carroll_hosp_quality_ improve_strategies_lessons_1009.pdf?section=4039. Accessed August 22, 2011.
- .The cost conundrum: what a Texas town can teach us about healthcare.The New Yorker. June 1,2009.
- .A map to bad policy—hospital efficiency measures in the Dartmouth Atlas.N Engl J Med.2010;362(7):569–574.
- ,.Critics question study cited in health debate.The New York Times. June 2,2010.
- Smith A. Campbell RH, Skinner AS, eds.An Inquiry Into the Nature and Causes of the Wealth of Nations.Oxford, England:Clarendon Press;1976.
- .The role of reputation in U.S. News 152(8):521–525.
- ,,,,.Variability in the measurement of hospital‐wide mortality rates.N Engl J Med.2010;363(26):2530–2539.
- .The elephant of patient safety: what you see depends on how you look.Jt Comm J Qual Patient Saf.2010;36(9):399–401.
- ,,.Improving patient care by linking evidence‐based medicine and evidence‐based management.JAMA.2007;298(6):673–676.
- ,,,.An evaluation of outcome from intensive care in major medical centers.Ann Intern Med.1986;104(3):410–418.
- ,,,.Effect of the transformation of the Veterans Affairs Health Care System on the quality of care.N Engl J Med.2003;348(22):2218–2227.
- ;for the Morrison Institute for Public Policy, Center for the Future of Arizona.Why Some Schools With Latino Children Beat the Odds, and Others Don't.Tempe, AZ:Morrison Institute for Public Policy;2006.
- ,,, et al.Error reporting and disclosure systems: views from hospital leaders.JAMA.2005;293(11):1359–1366.
- .Public release of performance data: a progress report from the front.JAMA.2000;283(14):1884–1886.
- ,,.The GAAP in quality measurement and reporting.JAMA.2007;298(15):1800–1802.
- .How the Mighty Fall: And Why Some Companies Never Give in.New York, NY:Jim Collins [distributed in the US and Canada exclusively by HarperCollins Publishers];2009.
- ,,,.Creating accountable care organizations: the extended hospital medical staff.Health Aff (Millwood).2007;26(1):w44–w57.
- ,,,.Using Medicare payment policy to transform the health system: a framework for improving performance.Health Aff (Millwood).2009;28(2):w238–w250.
- ,,.Translating evidence into practice: a model for large scale knowledge translation.BMJ.2008;337:a1714.
The American healthcare system produces a product whose quality, safety, reliability, and cost would be incompatible with corporate survival, were they created by a business operating in a competitive industry. Care fails to comport with best evidence nearly half of the time.1 Tens of thousands of Americans die yearly from preventable medical mistakes.2 The healthcare inflation rate is nearly twice that of the rest of the economy, rapidly outstripping the ability of employers, tax revenues, and consumers to pay the mounting bills.
Increasingly, the healthcare system is being held accountable for this lack of value. Whether through a more robust accreditation and regulatory environment, public reporting of quality and safety metrics, or pay for performance (or no pay for errors) initiatives, outside stakeholders are creating performance pressures that scarcely existed a decade ago.
Healthcare organizations and providers have begun to take notice and act, often by seeking answers from industries outside healthcare and thoughtfully importing these lessons into medicine. For example, the use of checklists has been adopted by healthcare (from aviation), with impressive results.3, 4 Many quality methods drawn from industry (Lean, Toyota, Six Sigma) have been used to try to improve performance and remove waste from complex processes.5, 6
While these efforts have been helpful, their focus has generally been at the point‐of‐careimproving the care of patients with acute myocardial infarction or decreasing readmissions. However, while the business community has long recognized that poor management and structure can thwart most efforts to improve individual processes, healthcare has paid relatively little attention to issues of organizational structure and leadership. The question arises: Could methods that have been used to learn from top‐performing businesses be helpful to healthcare's efforts to improve its own organizational performance?
In this article, we describe perhaps the best known effort to identify top‐performing corporations, compare them to carefully selected organizations that failed to achieve similar levels of performance, and glean lessons from these analyses. This effort, described in a book entitled Good to Great: Why Some Companies Make the Leapand Others Don't, has sold more than 3 million copies in its 35 languages, and is often cited by business leaders as a seminal work. We ask whether the methods of Good to Great might be applicable to healthcare organizations seeking to produce the kinds of value that patients and purchasers need and deserve.
GOOD TO GREAT METHODOLOGY
In 2001, business consultant Jim Collins published Good to Great. Its methods can be divided into 3 main components: (1) a gold standard metric to identify top organizations; (2) the creation of a control group of organizations that appeared similar to the top performers at the start of the study, but failed to match the successful organizations' performance over time; and (3) a detailed review of the methods, leadership, and structure of both the winning and laggard organizations, drawing lessons from their differences. Before discussing whether these methods could be used to analyze healthcare organizations, it is worth describing Collins' methods in more detail.
The first component of Good to Great's structure was the use of 4 metrics to identify top‐performing companies (Table 1). To select the good to great companies, Collins and his team began with a field of 1435 companies drawn from Fortune magazine's rankings of America's largest public companies. They then used the criteria in Table 1 to narrow the list to their final 11 companies, which formed the experimental group for the analysis.
|
| The company had to show a pattern of good performance punctuated by a transition point when it shifted to great performance. Great performance was defined as a cumulative total stock return of at least 3 times the general stock market for the period from the transition point through 15 years. |
| The transition from good to great had to be company‐specific, not an industry‐wide event. |
| The company had to be an established enterprise, not a startup, in business for at least 10 years prior to its transition. |
| At the time of the selection (in 1996), the company still had to show an upward trend. |
After identifying these 11 top‐performing companies, Collins created a control group, composed of companies with similar attributes that could have made the transition, but failed to do so.7 To create the control group, Collins matched and scored a pool of control group candidates based on the following criteria: similarities of business model, size, age, and cumulative stock returns prior to the good to great transition. When there were several potential controls, Collins chose companies that were larger, more profitable, and had a stronger market position and reputation prior to the transition, in order to increase the probability that the experimental companies' successes were not incidental.8 Table 2 lists the paired experimental and control companies.
| Experimental Company | Control Company |
|---|---|
| |
| Abbott | Upjohn |
| Circuit City | Silo |
| Fannie Mae | Great Western |
| Gillette | Warner‐Lambert |
| Kimberly‐Clark | Scott Paper |
| Kroger | A&P |
| Nucor | Bethlehem Steel |
| Philip Morris | R.J. Reynolds |
| Pitney Bowes | Addressograph |
| Walgreen's | Eckerd |
| Wells Fargo | Bank of America |
Finally, Collins performed a detailed historical analysis on the experimental and control groups, using materials (such as major articles published on the company, books, academic case studies, analyst reports, and financial and annual reports) that assessed the companies in real time. Good to Great relied on evidence from the period of interest (ie, accrued prior to the transition point) to avoid biases that would likely result from relying on retrospective sources of data.9
This analysis identified a series of factors that were generally present in good to great companies and absent in the control organizations. In brief, they were: building a culture of discipline, making change through gradual and consistent improvement, having a leader with a paradoxical blend of personal humility and professional will, and relentlessly focusing on hiring and nurturing the best employees. Over 6000 articles and 5 years of analysis support these conclusions.8
EFFORTS TO DATE TO ANALYZE HEALTHCARE ORGANIZATIONAL CHARACTERISTICS
We reviewed a convenience sample of the literature on organizational change in healthcare, and found only 1 study that utilized a similar methodology to that of Good to Great: an analysis of the academic medical centers that participate in the University HealthSystem Consortium (UHC). Drawing inspiration from Collins' methodologies, the UHC study developed a holistic measure of quality, based on safety, mortality, compliance with evidence‐based practices, and equity of care. Using these criteria, the investigators selected 3 UHC member organizations that were performing extremely well, and 3 others performing toward the middle and bottom of the pack. Experts on health system organization then conducted detailed site visits to these 6 academic medical centers. The researchers were blinded to these rankings at the time of the visits, but were able to perfectly predict which cohort the organizations were in.
The investigators analyzed the factors that seemed to be present in the top‐performing organizations, but were absent in the laggards, and found: hospital leadership emphasizing a patients‐first mission, an alignment of departmental objectives to reduce conflict, a concrete accountability structure for quality, a relentless focus on measurable improvement, and a culture promoting interprofessional collaboration on quality.10
While the UHC study is among the most robust exploration of healthcare organization dynamics in the literature, it has a few limitations. The first is that it studied a small, relatively specialized population: UHC members, which are large, mostly urban, well‐resourced teaching hospitals. While studying segments of populations can limit the generalizability of some of the UHC studies' findings, their approach can be a useful model to apply to studying other types of healthcare institutions. (And, to be fair, Good to Great also studies a specialized populationFortune 500 companiesand thus its lessons need to be extrapolated to other businesses, such as small companies, with a degree of caution.) The study also suffers from the relative paucity of publicly accessible organizational data in healthcare. The fact that the UHC investigators depended on both top‐performing and laggard hospitals, to voluntarily release their organizational data and permit a detailed site visit, potentially introduces a selection bias into the survey population, a bias not present in Good to Great due to Collins' protocol for matching cases and controls.
There have been several other efforts, using different methods, to determine organizational predictors of success in healthcare. The results of several important studies are shown in Table 3. Taken together, they indicate that higher performing organizations make practitioners accountable for performance measurements, and implement systems designed to both reduce errors and facilitate adherence to evidence‐based guidelines. In addition to these studies, several consulting organizations and foundations have performed focused reviews of high‐performing healthcare organizations in an effort to identify key success factors.11 These studies, while elucidating factors that influence organizational performance, suffer from variable quality measures and subjective methods for gathering organizational data, both of which are addressed within a good to great‐style analysis.12
| Study | Key Findings |
|---|---|
| |
| Keroack et al.10 | Superior‐performing organizations were distinguished from average ones by having: hospital leadership emphasizing a patients‐first mission, an alignment of departmental objectives to reduce conflict, concrete accountability structures for quality, a relentless focus on measurable improvement, and a culture promoting interprofessional collaboration toward quality improvement measures. |
| Jha et al.22 | Factors that led to the VA's improved performance included: |
| Implementation of a systematic approach to measurement, management, and accountability for quality. | |
| Initiating routine performance measurements for high‐priority conditions. | |
| Creating performance contracts to hold managers accountable for meeting improvement goals. | |
| Having an independent agency gather and monitor data. | |
| Implementing process improvements, such as an integrated, comprehensive medical‐record system. | |
| Making performance data public and distributing these data widely within the VA and among other key stakeholders (veterans' service organizations, Congress). | |
| Shortell et al.20 | Focusing on reducing the barriers and encouraging the adoption of evidence‐based organizational management is associated with better patient outcomes. Examples of reducing barriers to encourage adoption of evidence‐based guidelines include: |
| Installing an IT system to improve chronic care management. | |
| Creating a culture where practitioners can help each other learn from their mistakes. | |
| Knaus et al.21 | The interaction and coordination of each hospital's ICU staff had a greater correlation with reduced mortality rates than did the unit's administrative structure, amount of specialized treatment used, or the hospital's teaching status. |
| Pronovost et al.3 | Introducing a checklist of 5 evidence‐based procedures into a healthcare team's operation can significantly reduce the rate of catheter‐associated infections. |
| Simple process change interventions, such as checklists, must be accompanied by efforts to improve team culture and create leadership accountability and engagement. | |
| Pronovost et al.30 | Implementing evidence‐based therapies by embedding them within a healthcare team's culture is more effective than simply focusing on changing physician behavior. |
| The authors proposed a 4‐step model for implementing evidence‐based therapies: select interventions with the largest benefit and lowest barriers to use, identify local barriers to implementation, measure performance, and ensure all patients receive the interventions. | |
Perhaps the best‐known study on healthcare organizational performance is The Dartmouth Atlas, an analysis that (though based on data accumulated over more than 30 years) has received tremendous public attention, in recent years, in the context of the debate over healthcare reform.13 However, by early 2010, the Dartmouth analysis was stirring controversy, with some observers expressing concerns over its focus on care toward the end of life, its methods for adjusting for case‐mix and sociodemographic predictors of outcomes and costs, and its exclusive use of Medicare data.14, 15 These limitations are also addressed by a good to great‐style analysis.
WOULD A GOOD TO GREAT ANALYSIS BE POSSIBLE IN HEALTHCARE?
While this review of prior research on organizational success factors in healthcare illustrates considerable interest in this area, none of the studies, to date, matches Good to Great in the robustness of the analysis or, obviously, its impact on the profession. Could a good to great analysis be carried out in healthcare? It is worth considering this by assessing each of Collins' 3 key steps: identifying the enterprises that made a good to great leap, selecting appropriate control organizations, and determining the factors that contributed to the successes of the former group.
Good to Great used an impressive elevation in stock price as a summary measure of organizational success. In the for‐profit business world, it is often assumed that Adam Smith's invisible hand makes corporate information available to investors, causing an organization's stock price to capture the overall success of its business strategy, including its product quality and operational efficiency.16 In the healthcare world, mostly populated by non‐profit organizations that are simultaneously working toward a bottom line and carrying out a social mission, there is no obvious equivalent to the stock price for measuring overall organizational performance and value. All of the methods for judging top hospitals, for example, are flaweda recent study found that the widely cited U.S. News & World Report's America's Best Hospitals list is largely driven by hospital reputation,17 while another study found glaring inconsistencies among methods used to calculate risk‐adjusted mortality rates.18 A generally accepted set of metrics defining the value of care produced by a healthcare organization (including quality, safety, access, patient satisfaction, and efficiency) would be needed to mirror the first good to great step: defining top‐performing organizations using a gold standard.19 The summary measure used in the UHC study is the closest we have seen to a good to great‐style summary performance measure in healthcare.10
While it is important to identify a gold‐standard measure of organizational quality, careful selection of a control organization may be the most important step in conducting a good to great analysis. Although Collins' use of stock price as a summary measure of organizational performance is the best measure available in business, it is by no means perfect. Despite this shortcoming, however, Collins believes that the central requirement is not finding a perfect measure of organizational success, but rather determining what correlates with a divergence of performance in stock price (J. Collins, oral communication, July 2010). Similar to clinical trials, meticulous matching of a good to great organization with a control has the advantage of canceling out extraneous environmental factors, thereby enabling the elucidation of organizational factors that contribute to divergent performance. Good to Great's methods depended on substantial historical background to define top performers and controls. Unfortunately, healthcare lacks an analog to the business world's robust historical and publicly accessible record of performance and organizational data. Therefore, even if a certain organization was determined to be a top performer based on a gold‐standard measure, selecting a control organization by matching its organizational and performance data to the top performer's would be unfeasible.
Finally, the lack of a historical record in healthcare also places substantial roadblocks in the way of looking under the organization's hood. Even in pioneering organizational analyses by Shortell et al.,20 Knaus et al.,21 and Jha et al.,22 substantial parts of their analyses relied on retrospective accounts to determine organizational characteristics. To remove the bias that comes from knowing the organization's ultimate performance, Collins was careful to base his analysis of organizational structures and leadership on documents available before the good to great transition. Equivalent data in healthcare are extremely difficult to find.
While it is best to rely on an historical record, it may be possible to carry out a good to great‐type analysis through meticulous structuring of personal interviews. Collins has endorsed a non‐healthcare study that utilized the good to great matching strategy but used personal interviews to make up for lack of access to a substantial historical record.23 To reduce the bias inherent in relying on interviews, the research team ensured that the good to great transition was sustained for many years, and that the practices elicited from the interviews started before the good to great transition. Both of these techniques helped increase the probability that the identified practices contributed to the transition to superior results (in this case, in public education outcomes) and, thus, that the adoption of these practices could result in improvements elsewhere (J. Collins, oral communication, July 2010).
To make such a study possible in healthcare, more organizational data are required. Without prodding by outside stakeholders, most healthcare organizations have been reluctant to publicize performance data for fear of malpractice risk,24 or based on their belief that current data paint an incomplete or inaccurate picture of their quality.25 Trends toward required reporting of quality data (such as via Medicare's Hospital Compare Web site) offer hope that future comparisons could rely on robust organizational quality and safety data. Instituting healthcare analogs to Securities & Exchange Commission (SEC) reporting mandates would further ameliorate this information deficit.26
While we believe that Good to Great offers lessons relevant to healthcare, there are limitations that are worth considering. First, the extraordinary complexity of healthcare organizations makes it likely that a matched‐pair‐type study would need to be accompanied by other types of analyses, including more quantitative analyses of large datasets, to give a full picture of structural and leadership predictors of strong performance. Moreover, before embracing the good to great method, some will undoubtedly point to the demise of Circuit City and Fannie Mae (2 of the Good to Great companies; Table 2) as a cautionary note. Collins addresses this issue with the commonsensical argument that the success of a company needs to be judged in the context of the era. By way of analogy, he points to the value of studying a sports team, such as the John Wooden‐coached UCLA teams of the 1960s and 1970s, notwithstanding the less stellar performance of today's UCLA team. In fact, Collins' recent book mines some of these failures for their important lessons.27
GOOD TO GREAT IN HEALTHCARE
Breaking through healthcare's myopia to explore solutions drawn from other industries, such as checklists, simulation, and industrial approaches to quality improvement, has yielded substantial insights and catalyzed major improvements in care. Similarly, we believe that finding ways to measure the performance of healthcare organizations on both cost and quality, to learn from those organizations achieving superior performance, and to create a policy and educational environment that rewards superior performance and helps poor performers improve, is a defining issue for healthcare. This will be particularly crucial as the policy environment changestransitions to Accountable Care Organizations28 and bundled payments29 are likely to increase the pressure on healthcare organizations to learn the secrets of their better‐performing brethren. These shifts are likely to put an even greater premium on the kinds of leadership, organizational structure, and ability to adapt to a changing environment that Collins highlighted in his analysis. After all, it is under the most challenging conditions that top organizations often prove their mettle.
Although there are considerable challenges in performing a good to great analysis in healthcare (Table 4), the overall point remains: Healthcare is likely to benefit from rigorous, unbiased methods to distinguish successful from less successful organizations, to learn the lessons of both, and to apply these lessons to improvement efforts.
| Issue* | Good to Great* | What Exists in Healthcare | How Healthcare Can Fill in the Gaps |
|---|---|---|---|
| |||
| Gold standard measure of quality | Cumulative total stock return of at least 3 times the general market for the period from the transition point through 15 years. | Risk‐adjusted patient outcomes data (eg, mortality), process data (eg, appropriate medication use), structural data (eg, stroke center). | Create a more robust constellation of quality criteria to measure organizational performance (risk‐adjusted patient outcomes, avoidable deaths, adherence to evidence‐based guidelines, cost effectiveness, patient satisfaction); develop a generally accepted roll‐up measure. Of the studies we reviewed, the UHC study's summary measure was the closest representation to a good to great‐summary performance measure. |
| At the time of the selection, the good to great company still had to show an upward trend. | The study of the VA's transformation and the ongoing UHC study stand out as examples of studying the upward trends of healthcare organizations.22 | Make sure that the high‐performing healthcare organizations are still improvingas indicated by gold standard measures. Once the organizations are identified, study the methods these organizations utilized to improve their performance. | |
| The turnaround had to be company‐specific, not an industry‐wide event. | A few organizations have been lauded for transformations (such as the VA system).22 In most circumstances, organizations praised for high quality (eg, Geisinger, Mayo Clinic, Cleveland Clinic) have long‐established corporate tradition and culture that would be difficult to imitate. The VA operates within a system that is unique and not replicable by most healthcare organizations. | Healthcare needs to identify more examples like the VA turnaround, particularly examples of hospitals or healthcare organizations operating in more typical environmentssuch as a community or rural hospital. | |
| The company had to be an established enterprise, not a startup, in business for at least 10 years prior to its transition. | Most of the healthcare organizations of interest are large organizations with complex corporate cultures, not startups. | Not applicable. | |
| Comparison method | Collins selected a comparison company that was almost exactly the same as the good to great company, except for the transition. The selection criteria were business fit, size fit, age fit, stock chart fit, conservative test, and face validity.* | Healthcare organizational studies are mostly comparisons of organizations that all experience success; few studies compare high‐performing with nonhigh‐performing organizations. (Jha et al. compared Medicare data from non‐VA hospitals and the VA, but did not use similar criteria to select similar organizations22; Keroack and colleagues' comparison of 3 mediocre to 3 superior‐performing hospitals is the closest analog to the Good to Great methodology thus far.10) | Similar to the Good to Great study, a set of factors that can categorize healthcare organizations according to similarities must be devised (eg, outpatient care, inpatient care, academic affiliation, tertiary care center, patient demographics), but finding similar organizations whose performance diverged over time is challenging. |
| Analysis of factors that separated great companies from those that did not make the transition to greatness | Good to Great used annual reports, letters to shareholders, articles written about the company during the period of interest, books about the company, business school case studies, analyst reports written in real time. | Most of the research conducted thus far has been retrospective analyses of why organizations became top performers. | The historical source of data is almost nonexistent in comparison with the business world. A parallel effort would have to capture a mixture of structure and process changes, along with organizational variables. The most effective method would be a prospective organizational assessment of several organizations, following them over time to see which ones markedly improved their performance. |
- ,,, et al.The quality of health care delivered to adults in the United States.N Engl J Med.2003;348(26):2635–2645.
- ,,;for the Institute of Medicine (US), Committee on Quality of Health Care in America.To Err Is Human: Building a Safer Health System.Washington, DC:National Academy Press;1999. Available at: http://www.nap.edu/books/0309068371/html/. Accessed August 22, 2011.
- ,,, et al.An intervention to decrease catheter‐related bloodstream infections in the ICU.N Engl J Med.2006;355(26):2725–2732.
- ,,, et al.A surgical safety checklist to reduce morbidity and mortality in a global population.N Engl J Med.2009;360(5):491–499.
- ,,,,,.Using industrial processes to improve patient care.BMJ.2004;328(7432):162–164.
- ,,,,.Lean six sigma in healthcare.J Healthc Qual.2006;28(2):4–11.
- .Good to great.Fast Company. September 30,2001. Available at: http://www.fastcompany.com/magazine/51/goodtogreat.html. Accessed August 22, 2011.
- .Good to Great: Why Some Companies Make the Leap… and Others Don't.New York, NY:HarperBusiness;2001.
- .It's in the research.Jim Collins. Available at: http://www.jimcollins.com/books/research.html. Accessed May 23,2010.
- ,,,,,.Organizational factors associated with high performance in quality and safety in academic medical centers.Acad Med.2007;82(12):1178–1186.
- ,,,,.Hosptial Quality: Ingredients for Success—a Case Study of Beth Israel Deaconess Medical Center.New York, NY:Commonwealth Fund;2004. Available at: http://www.commonwealthfund.org/Content/Publications/Fund‐Reports/2004/Jul/Hospital‐Quality–Ingredients‐for‐Success‐A‐Case‐Study‐of‐Beth‐Israel‐Deaconess‐Medical‐Center. aspx. Accessed August 22, 2011.
- ,,;for the Commonwealth Fund.Hospital quality improvement strategies and lessons from U.S. hospitals.New York, NY:Commonwealth Fund;2007. Available at: http://www.commonwealthfund.org/usr_doc/Silow‐Carroll_hosp_quality_ improve_strategies_lessons_1009.pdf?section=4039. Accessed August 22, 2011.
- .The cost conundrum: what a Texas town can teach us about healthcare.The New Yorker. June 1,2009.
- .A map to bad policy—hospital efficiency measures in the Dartmouth Atlas.N Engl J Med.2010;362(7):569–574.
- ,.Critics question study cited in health debate.The New York Times. June 2,2010.
- Smith A. Campbell RH, Skinner AS, eds.An Inquiry Into the Nature and Causes of the Wealth of Nations.Oxford, England:Clarendon Press;1976.
- .The role of reputation in U.S. News 152(8):521–525.
- ,,,,.Variability in the measurement of hospital‐wide mortality rates.N Engl J Med.2010;363(26):2530–2539.
- .The elephant of patient safety: what you see depends on how you look.Jt Comm J Qual Patient Saf.2010;36(9):399–401.
- ,,.Improving patient care by linking evidence‐based medicine and evidence‐based management.JAMA.2007;298(6):673–676.
- ,,,.An evaluation of outcome from intensive care in major medical centers.Ann Intern Med.1986;104(3):410–418.
- ,,,.Effect of the transformation of the Veterans Affairs Health Care System on the quality of care.N Engl J Med.2003;348(22):2218–2227.
- ;for the Morrison Institute for Public Policy, Center for the Future of Arizona.Why Some Schools With Latino Children Beat the Odds, and Others Don't.Tempe, AZ:Morrison Institute for Public Policy;2006.
- ,,, et al.Error reporting and disclosure systems: views from hospital leaders.JAMA.2005;293(11):1359–1366.
- .Public release of performance data: a progress report from the front.JAMA.2000;283(14):1884–1886.
- ,,.The GAAP in quality measurement and reporting.JAMA.2007;298(15):1800–1802.
- .How the Mighty Fall: And Why Some Companies Never Give in.New York, NY:Jim Collins [distributed in the US and Canada exclusively by HarperCollins Publishers];2009.
- ,,,.Creating accountable care organizations: the extended hospital medical staff.Health Aff (Millwood).2007;26(1):w44–w57.
- ,,,.Using Medicare payment policy to transform the health system: a framework for improving performance.Health Aff (Millwood).2009;28(2):w238–w250.
- ,,.Translating evidence into practice: a model for large scale knowledge translation.BMJ.2008;337:a1714.
Cardiac Risk in Diabetes Often Overestimated
DENVER – Diabetes patients with stable symptoms of coronary artery disease appear to have a lower cardiac event risk than previously thought.
The yearly rate of cardiovascular death or nonfatal MI was just 2.4% in a series of 444 consecutive diabetes outpatients with symptoms suggestive of coronary artery disease (CAD) who underwent exercise treadmill or pharmacologic stress single-photon emission computed tomography (SPECT) myocardial perfusion imaging. The cardiovascular death rate of 0.4% per year and the nonfatal MI rate of 2.0% per year were surprisingly low, given that 39% of subjects had known CAD and the rest had symptoms suggestive of CAD, Dr. Jamieson M. Bourque noted at the annual meeting of the American Society of Nuclear Cardiology.
The explanation may be found at least in part in contemporary evidence-based intensive medical management for risk reduction in this traditionally high-risk population, added Dr. Bourque of the University of Virginia, Charlottesville.
Of the 444 symptomatic diabetes patients, 78.5% had no inducible ischemia on stress SPECT myocardial perfusion imaging, 16.5% had 1%-9% left ventricular ischemia, and 5% had left ventricular ischemia of at least 10%. Again, these are lower rates than would be expected based on historical data taken from the era before aggressive risk factor modification in patients with diabetes and CAD symptoms.
During a median 2.4 years of follow-up, the combined rate of cardiovascular death, nonfatal MI, or revascularization more than 4 weeks after myocardial perfusion imaging was 32% in patients with at least 10% left ventricular ischemia on their presenting SPECT study, 14% in those with 1%-9% ischemia, and 8% in those with no ischemia.
Patients who achieved at least 10 METs (metabolic equivalents) on the treadmill during testing had the best prognosis. The sole event that occurred in this subgroup was a late revascularization.
In all, 60% of hard cardiac events occurring in this study were in patients with no perfusion defects. This points to the need for improved patient selection and risk stratification techniques in diabetes patients, according to Dr. Bourque.
He declared having no financial conflicts.
FROM THE ANNUAL MEETING OF THE AMERICAN SOCIETY OF NUCLEAR CARDIOLOGY
Major Finding: The annual combined rate of cardiovascular death or nonfatal MI was 2.4% in a prospective series of diabetes patients with stable symptoms suggestive of CAD.
Data Source: A consecutive series of 444 patients followed for a median of 2.4 years.
Disclosures: No conflicts of interest.
NQF Launches Interactive Quality-Measurement Tool
Quality-minded hospitalists now have a new research tool at their disposal. In the past few weeks, the National Quality Forum (NQF) unveiled a beta-test version of its Quality Positioning System (QPS), a searchable and interactive database of NQF-endorsed quality measures on a host of medical topics.
The database, which won’t have an official launch until 2012, allows users to create lists of measurements or view lists that other institutions have put together, dubbed portfolios. The idea is that as more users post public portfolios, the more physicians across the country can see what measures work where.
“This is a brand-new tool, so we’re starting to see more and more portfolios created,” said Diane Stollenwerk, MPP, NQF’s vice president of community alliances. “The more people who use the portfolio function in QPS, the more valuable the portfolios and QPS will become for end users.”
HM groups can use the site to create private portfolios that can be shared just among group members. NQF will provide automatic updates on those measures a user is interested in, giving the site an interactive feature. Stollenwerk says future added value in the site will be pushed in part by user feedback. She is hopeful that users will not only create lists of which measures they use, but also comment on their experience in using those measures in specific situations.
“A foundational role QPS can play is simply creating a shared space for people to have the conversation,” Stollenwerk adds.
In the Literature: Research You Need to Know
Clinical question: What is the prognostic influence of atrial fibrillation in patients with acute myocardial infarction?
Background: There have been conflicting reports regarding the prognostic impact of atrial fibrillation (AF) in patients with acute myocardial infarction (MI). This study represents the first meta-analysis performed to quantify the mortality risk associated with AF in MI patients.
Study design: Meta-analysis of observational studies.
Setting: Forty-three studies involving 278,854 patients diagnosed with MI from 1972 to 2000.
Synopsis: The odds ratio (OR) of mortality associated with AF in MI patients was 1.46 (95% confidence interval, 1.35 to 1.58, I2=76%, 23 studies). Although there was significant heterogeneity in included studies, in subgroup analysis, the significant association between AF and mortality was present whether the AF was new (defined as occurring for the first time within one week of MI) with OR of 1.37 (95% confidence interval, 1.26 to 1.49; I2=28%, nine studies) or old (defined as pre-existing before the MI admission) with OR of 1.28 (95% confidence interval, 1.16 to 1.40, I2=24%, four studies). Sensitivity analyses performed by pooling studies according to follow-up duration and adjustment for confounding clinical factors had little effect on the estimates.
Bottom line: AF was associated with increased mortality in patients with MI regardless of the timing of AF development.
Citation: Jabre P, Roger VL, Murad MH, et al. Mortality associated with atrial fibrillation in patients with myocardial infarction. Circulation. 2011;123:1587-1593.
For more physician reviews of HM-related literature, visit our website.
Stroke Risk Surges After 10 Years in Diabetes Patients
SAN DIEGO – The risk of ischemic stroke more than triples in patients with a 10-year history of diabetes, according to results of the population-based Northern Manhattan Study.
Ischemic stroke has long been associated with diabetes, but a large, longitudinal study enabled investigators to explore how risk changes over time, Dr. Julio R. Vieira said at the annual meeting of the American Neurological Association.
Columbia University researchers followed 3,298 multiethnic patients who had no prior history of stroke, assessing for diabetes at baseline and annually, beginning in 1993.
At baseline, the mean age of subjects was 69 years (range, 59-79). More than half were Hispanic, with 24% black and 21% white.
Initially, 717 patients (22%) had diabetes and 338 (10%) developed new-onset diabetes over the course of the study.
During a median of 9 years of follow-up, 244 patients were diagnosed with ischemic stroke.
In Cox proportional hazards models, patients with diabetes at baseline faced a 2.5-fold increased risk of having an ischemic stroke during the study period. Among those patients and those who developed de novo diabetes, the risk of ischemic stroke rose over time. Risk was elevated 70% among patients with diabetes for 5 years or less, 80% for those with a 5- to 10-year history of diabetes, and 3.3-fold for those with at least a 10-year history of the disease.
The majority of patients in the study had type 2 diabetes, said Dr. Vieira during an interview following his presentation during a cardiovascular group session at the meeting.
Although risk of ischemic stroke was present from the start in diabetic patients, it did not triple for a decade, he stressed in the interview.
"Diabetes, like hypertension and all of the other risk factors for cardiovascular disease, takes a while to really cause big damage," he said. "That’s exactly what we’re seeing here."
To Dr. Vieira, a research fellow at the Neurological Institute of New York at Columbia University, the message for physicians and patients alike is, "You have a lot of time for intervention."
He said that in his own experience, warning diabetic patients of impending problems with their eyes, hearts, or extremities does not always seem to get their attention.
Perhaps it would be more sobering to tell them that they have 10 years to get the disease under control, or face a tripling of their risk of a potentially fatal or disabling stroke, he speculated.
"Maybe people will get the message," he said.
Dr. Vieira and all coinvestigators, except one, had no relevant disclosures. The principal investigator of the study, Dr. Mitchell Elkind, reported serving as a consultant to Bristol-Myers Squibb and Tethys Bioscience; serving on speakers’ bureaus for Boehringer-Ingelheim, Bristol-Myers Squibb/Sanofi Pharmaceuticals Partnership, and Genentech; and receiving research support from diaDexus, Bristol-Myers Squibb/Sanofi Pharmaceuticals Partnership, and the National Institute for Neurological Disorders and Stroke (NINDS). He also has given expert testimony on behalf of Novartis and GlaxoSmithKline for stroke litigation. The study is supported by a grant from NINDS.
FROM THE ANNUAL MEETING OF THE AMERICAN NEUROLOGICAL ASSOCIATION
Major Finding: Study participants with at least a 10-year history of diabetes had more than three times greater risk for stroke than did participants without diabetes.
Data Source: The Northern Manhattan Study, a population-based, longitudinal study of 3,298 people.
Disclosures: Dr. Vieira and all coinvestigators, except one, had no relevant disclosures. The principal investigator of the study, Dr. Mitchell Elkind, reported serving as a consultant to Bristol-Myers Squibb and Tethys Bioscience; serving on speakers’ bureaus for Boehringer-Ingelheim, Bristol-Myers Squibb/Sanofi Pharmaceuticals Partnership, and Genentech; and receiving research support from diaDexus, Bristol-Myers Squibb/Sanofi Pharmaceuticals Partnership, and the National Institute for Neurological Disorders and Stroke (NINDS). He also has given expert testimony on behalf of Novartis and GlaxoSmithKline for stroke litigation. The study is supported by a grant from NINDS.
PHM Strategic Planning Roundtable
Hospitalists are the fastest growing segment of physicians in the United States.1 Given the growing field of Pediatric Hospital Medicine (PHM) and the need to define strategic direction, the Society of Hospital Medicine (SHM), the American Academy of Pediatrics (AAP), and the Academic Pediatric Association (APA) sponsored a strategic planning meeting in February 2009 that brought together 22 PHM leaders to discuss the future of the field.
PHM is at a critical juncture in terms of clinical practice, research, workforce issues, and quality improvement. The field has developed sufficiently to produce leaders capable of setting an agenda and moving forward. A discussion with the American Board of Pediatrics (ABP) by PHM leaders from the AAP, APA, and SHM at the Pediatric Hospital Medicine 2007 Conference regarding subspecialty designation stimulated convening the PHM Strategic Planning Roundtable to address the task of coordinating further development of PHM (Table 1).
|
| Develop a strategic vision for the role of PHM in the future of children's health care |
| Describe the current gaps between the vision and today's reality |
| Develop a common understanding regarding current initiatives in PHM domains of clinical practice, quality, research, and workforce |
| Determine the method(s) by which participants can be organized to accomplish additional initiatives to implement the vision |
| Identify and prioritize key strategic initiatives |
| Assign accountability and determine next steps and timeline to implement the selected initiatives |
The objective of this article is to describe: (1) the Strategic Planning Roundtable's vision for the field of pediatric hospital medicine; (2) the generation and progress on specific initiatives in clinical practice, quality, research, and workforce identified by the Strategic Planning Roundtable; and (3) issues in the designation of PHM as a subspecialty.
METHODS
The PHM Strategic Planning Roundtable was conducted by a facilitator (S.M.) during a 2‐day retreat using established healthcare strategic planning methods.2
Participants were the existing PHM leaders from the AAP, APA, and SHM, as well as other national leaders in clinical practice, quality, research, and workforce. Development of the vision statement was a key step in which the participants developed a consensus‐based aspirational view of the future. The draft version of the vision statement was initially developed after extensive interviews with key stakeholders and experts in PHM, and was revised by the participants in the course of a facilitated group discussion during the retreat. Following creation of the vision statement, the group then defined the elements of transformation pertaining to PHM and detailed the components of the vision.
Analysis of internal and external environmental factors was critical in the strategic planning process. This type of analysis, detailing the current state of PHM practice, permitted the strategic planners to understand the gaps that existed between the aspirational vision statement and today's reality, and set the stage to identify and implement initiatives to achieve the vision. Several months before the meeting, 4 expert panels comprised of PHM specialists representing a variety of academic and clinical practice settings were brought together via e‐mail and conference calls to focus on 4 domains of PHM: clinical practice, quality of care, research, and workforce. These groups were asked to describe the current status, challenges, and opportunities in these areas. Combining literature review and key stakeholder interviews, their findings and recommendations were distilled into brief summaries that were presented at the Roundtable meeting. Following the presentations, the participants, working in small groups representing all areas of focus,provided additional feedback.
Following the creation of a consensus vision statement and review of internal and external factors, the participants worked to identify specific initiatives in the 4 domains that would advance the field towards the goals contained in the vision statement. These initiatives were grouped into categories. Initiatives by category were scored and prioritized according to predetermined criteria including potential impact, cost, operational complexity, and achievability.
For each initiative selected, the group developed targets and metrics that would be used to track progress. Assigning leadership, accountability, and a timeline to each of the selected projects completed the implementation plan. In addition, the group developed an organizational structure to provide oversight for the overall process, and designated individuals representing the sponsoring organizations into those roles. In conclusion, the group discussed potential structures to guide the future of PHM.
CLINICAL PRACTICE
The Roundtable defined clinical practice for PHM as the general medical care of the hospitalized child, including direct patient care and leadership of the inpatient service. Clinical practice is affected by a number of current national trends including: fewer primary care providers interested in, or with the time to provide, inpatient care; resident work hour restrictions; increasing complexity of clinical issues; and increasing availability of pediatric hospitalists. At the hospital level, clinical practice is affected by increasing need for quality and safety measures, electronic health records and computerized physician order entry, and mounting financial pressures on the hospital system. Hospitalists are assuming more roles in leading quality and safety initiatives, creating computerized systems that address children's needs, and creating financially viable systems of quality pediatric care.3 Hospitalists' clinical care and leadership roles are emerging, and therefore the field faces training and mentorship issues.
Progress to date in this area includes 2 textbooks that define a scope of knowledge and practice, and a newly developed journal in PHM. Core competencies in PHM have been published and provide further refinement of scope and a template for future training.4
Multiple opportunities exist for hospitalists to establish themselves as clinical leaders. Hospitalists can become the preferred providers for hospitalized chronically ill children, with specific initiatives to improve care coordination and multidisciplinary communication. In addition to care coordination and decreasing length of stay, hospitalists, with their intimate knowledge of hospital operations, can be leaders in hospital capacity management and patient flow to increase operational efficiency. Hospitalists can expand evidence‐based guidelines for, and data about, inpatient conditions, and explore the effect of workload and hours on patient care. In addition, there is an expanding role into administrative areas, as well as alternate care arenas, such as: intensive care support (pediatric and neonatal), transport, sedation, palliative care, and pain management. Activities in administrative and alternate care areas have profound direct affects on patient care, as well as providing value added services and additional revenue streams which can further support clinical needs. Finally, achieving quality targets will likely be increasingly linked to payment, so hospitalists may play a key role in the incentives paid to their hospitals. Meeting these challenges will further solidify the standing of hospitalists in the clinical realm.
QUALITY
National and governmental agencies have influenced quality and performance improvement measurements in adult healthcare, resulting in improvements in adult healthcare quality measurement.5 There is limited similar influence or measure development in pediatric medicine, so the quality chasm between adult and child healthcare has widened. Few resources are invested in improving quality and safety of pediatric inpatient care. Of the 18 private health insurance plans' quality and pay for performance programs identified by Leapfrog, only 17% developed pediatric‐specific inpatient measures.6 Only 5 of 40 controlled trials of quality improvement efforts for children published between 1980 and 1998 addressed inpatient problems.7
There have been recent efforts at the national level addressing these issues, highlighted by the introduction of The Children's Health Care Quality Act, in 2007. Early studies in PHM systems focused on overall operational efficiency, documenting 9% to 16% decreases in length of stay and cost compared to traditional models of care.8 Conway et al. identified higher reported adherence to evidence‐based care for hospitalists compared to community pediatricians.9 However, Landrigan et al. demonstrated that there is still large variation in care that exists in the management of common inpatient diagnoses, lacking strong evidence‐based guidelines even among pediatric hospitalists.10 Moreover, there have been no significant studies reviewing the impact of pediatric hospitalists on safety of inpatient care. Magnifying these challenges is the reality that our healthcare system is fragmented with various entities scrambling to define, measure, and compare the effectiveness and safety of pediatric healthcare.
These challenges create an opportunity for PHM to develop a model of how to deliver the highest quality and safest care to our patients. The solution is complex and will take cooperation at many levels of our healthcare system. Improving the safety and quality of care for children in all settings of inpatient care in the United States may best be accomplished via an effective collaborative. This collaborative should be comprehensive and inclusive, and focused on demonstrating and disseminating how standardized, evidence‐based care in both clinical and safety domains can lead to high‐value and high‐quality outcomes. The success of PHM will be measured by its ability to deliver a clear value proposition to all consumers and payers of healthcare. The creation of a robust national collaborative network is a first step towards meeting this goal and will take an extraordinary effort. A PHM Quality Improvement (QI) Collaborative workgroup was created in August 2009. Three collaboratives have been commissioned: (1) Reduction of patient identification errors; (2) Improving discharge communication to referring primary care providers for pediatric hospitalist programs, and (3) Reducing the misuse and overuse of bronchodilators for bronchiolitis. All the collaborative groups have effectively engaged key groups of stakeholders and utilized standard QI tools, demonstrating improvement by the fall of 2010 (unpublished data, S.N.).
RESEARCH
Despite being a relatively young field, there is a critical mass of pediatric hospitalist‐investigators who are establishing research career paths for themselves by securing external grant funding for their work, publishing, and receiving mentorship from largely non‐hospitalist mentors. Some hospitalists are now in a position to mentor junior investigators. These hospitalist‐investigators identified a collective goal of working together across multiple sites in a clinical research network. The goal is to conduct high‐quality studies and provide the necessary clinical information to allow practicing hospitalists to make better decisions regarding patient care. This new inpatient evidence‐base will have the added advantage of helping further define the field of PHM.
The Pediatric Research in Inpatient Settings Network (PRIS) was identified as the vehicle to accomplish these goals. A series of objectives were identified to redesign PRIS in order to accommodate and organize this new influx of hospitalist‐investigators. These objectives included having hospitalist‐investigators commit their time to the prioritization, design, and execution of multicenter studies, drafting new governance documents for PRIS, securing external funding, redefining the relationships of the 3 existing organizations that formed PRIS (AAP, APA, SHM), defining how new clinical sites could be added to PRIS, creating a pipeline for junior hospitalist‐investigators to transition to leadership roles, securing a data coordinating center with established expertise in conducting multicenter studies, and establishing an external research advisory committee of leaders in pediatric clinical research and QI.
Several critical issues were identified, but funding remained a priority for the sustainability of PRIS. Comparative effectiveness (CE) was recognized as a potential important source of future funding. Pediatric studies on CE (eg, surgery vs medical management) conducted by PRIS would provide important new data to allow hospitalists to practice evidence‐based medicine and to improve quality.
A Research Leadership Task Force was created with 4 members of the PHM Strategic Planning Roundtable to work on the identified issues. The APA leadership worked with PRIS to establish a new Executive Council (comprised of additional qualified hospitalist‐investigators). The Executive Council was charged with accomplishing the tasks outlined from the Strategic Planning Roundtable. They have created the governance documents and standard operating procedures necessary for PRIS to conduct multicenter studies, defined a strategic framework for PRIS including the mission, vision and values, and funding strategy. In February 2010, PRIS received a 3‐year award for over $1 million from the Child Health Corporation of America to both fund the infrastructure of PRIS and to conduct a Prioritization Project. The Prioritization Project seeks to identify the conditions that are costly, prevalent, and demonstrate high inter‐hospital variation in resource utilization, which signals either lack of high‐quality data upon which to base medical decisions, and/or an opportunity to standardize care across hospitals. Some of these conditions will warrant further investigation to define the evidence base, whereas other conditions may require implementation studies to reliably introduce evidence into practice. Members of the Executive Council received additional funding to investigate community settings, as most children are hospitalized outside of large children's hospitals. PRIS also reengaged all 3 societies (APA, AAP, and SHM) for support for the first face‐to‐face meeting of the Executive Council. PRIS applied for 2 Recovery Act stimulus grants, and received funding for both of approximately $12 million. The processes used to design, provide feedback, and shepherd these initial studies formed the basis for the standard operating procedures for the Network. PRIS is now reengaging its membership to establish how sites may be able to conduct research, and receive new ideas to be considered for study in PRIS.
Although much work remains to be done, the Executive Council is continuing the charge with quarterly face‐to‐face meetings, hiring of a full‐time PRIS Coordinator, and carrying out these initial projects, while maintaining the goal of meeting the needs of the membership and PHM. If PRIS is to accomplish its mission of improving the health of, and healthcare delivery to, hospitalized children and their families, then the types of studies undertaken will include not only original research questions, but also comparative implementation methods to better understand how hospitalists in a variety of settings can best translate research findings into clinical practice and ultimately improve patient outcomes.
WORKFORCE
The current number of pediatric hospitalists is difficult to gauge11; estimates range from 1500 to 3000 physicians. There are groups of pediatric hospitalists within several national organizations including the AAP, APA, and SHM, in addition to a very active listserve community. It is likely that only a portion of pediatric hospitalists are represented by membership in these organizations.
Most physicians entering the field of PHM come directly out of residency. A recent survey by Freed et al.12 reported that 3% of current pediatric residents are interested in PHM as a career. In another survey by Freed et al., about 6% of recent pediatric residency graduates reported currently practicing as pediatric hospitalists.13 This difference may indicate a number of pediatricians practicing transiently as pediatric hospitalists.
There are numerous issues that will affect the growth and sustainability of PHM. A large number of pediatric residents entering the field will be needed to maintain current numbers. With 45% of hospitalists in practice less than 3 years,11 the growth of PHM in both numbers and influence will require an increasing number of hospitalists with sustained careers in the field. Recognition as experts in inpatient care, as well as expansion of the role of hospitalists beyond the clinical realm to education, research, and hospital leadership, will foster long‐term career satisfaction. The increasingly common stature of hospital medicine as an independent division, equivalent to general pediatrics and subspecialty divisions within a department, may further bolster the perception of hospital medicine as a career.
The majority of pediatric hospitalists believe that current pediatric residency training does not provide all of the skills necessary to practice as a pediatric hospitalist,14 though there is disagreement regarding how additional training in pediatric hospital medicine should be achieved: a dedicated fellowship versus continuing medical education (CME). There are several initiatives with the potential to transform the way pediatric hospitalists are trained and certified. The Residency Review and Redesign Project indicates that pediatric residency is likely to be reformed to better meet the training demands of the individual resident's chosen career path. Changing residency to better prepare pediatric residents to take positions in pediatric hospital medicine will certainly affect the workforce emerging from residency programs and their subsequent training needs.15 The American Board of Internal Medicine and the American Board of Family Medicine have approved a Recognition of Focused Practice in Hospital Medicine. This recognition is gained through the Maintenance of Certification (MOC) Program of the respective boards after a minimum of 3 years of practice. SHM is offering fellow recognition in tiered designations of Fellow of Hospital Medicine (FHM), Senior Fellow of Hospital Medicine, and Master of Hospital Medicine. Five hundred hospitalists, including many pediatric hospitalists, received the inaugural FHM designation in 2009. Organizational recognition is a common process in many other medical fields, although previously limited in pediatrics to Fellow of the AAP. FHM is an important step, but cannot substitute for specific training and certification.
Academic fellowships in PHM will aid in the training of hospitalists with scholarly skills and will help produce more pediatric hospitalists with clinical, quality, administrative, and leadership skills. A model of subspecialty fellowship training and certification of all PHM physicians would require a several‐fold increase in available fellowships, currently approximately 15.
Ongoing CME offerings are also critical to sustaining and developing the workforce. The annual national meetings of the APA, AAP, and SHM all offer PHM‐dedicated content, and there is an annual PHM conference sponsored by these 3 organizations. There are now multiple additional national and regional meetings focused on PHM, reflecting the growing audience for PHM CME content. The AAP offers a PHM study guide and an Education in quality improvement for pediatric practice (eQIPP) module on inpatient asthma, specifically designed to facilitate the MOC process for pediatric hospitalists.
Some form of ABP recognition may be necessary to provide the status for PHM to be widely recognized as a viable academic career in the larger pediatric community. This would entail standardized fellowships that will ensure graduates have demonstrated proficiency in the core competencies. PHM leaders have engaged the ABP to better understand the subspecialty approval process and thoughtfully examine the ramifications of subspecialty status, specifically what subspecialty certification would mean for PHM providers and hospitals. Achieving ABP certification may create a new standard of care meaning that noncertified PHM providers will be at a disadvantage. It is unknown what the impact on pediatric inpatient care would be if a PHM standard was set without the supply of practitioners to provide that care.
STRUCTURE
The efforts of the Roundtable demonstrate the potential effectiveness of the current structure that guides the field: that of the cooperative interchange between the PHM leaders within the APA, AAP, and SHM. It may be that, similar to Pediatric Emergency Medicine (PEM), no formal, unifying structure is necessary. Alternatively, both Adolescent Medicine and Behavioral and Developmental Pediatrics (BDP) have their own organizations that guide their respective fields. A hybrid model is that of Pediatric Cardiology which has the Joint Council on Congenital Heart Disease. This structure assures that the leaders of the various organizations concerned with congenital heart disease meet at least annually to report on their activities and coordinate future efforts. Its makeup is similar to how the planning committee of the annual national PHM conference is constructed. Although PHM has largely succeeded with the current organizational structure, it is possible that a more formal structure is needed to continue forward.
CONCLUSION
The Roundtable members developed the following vision for PHM: Pediatric hospitalists will transform the delivery of hospital care for children. This will be done by achieving 7 goals (Table 2).
|
| We will ensure that care for hospitalized children is fully integrated and includes the medical home |
| We will design and support systems for children that eliminate harm associated with hospital care |
| We will develop a skilled and stable workforce that is the preferred provider of care for most hospitalized children |
| We will use collaborative research models to answer questions of clinical efficacy, comparative effectiveness, and quality improvement, and we will deliver care based on that knowledge |
| We will provide the expertise that supports continuing education in the care of the hospitalized child for pediatric hospitalists, trainees, midlevel providers, and hospital staff |
| We will create value for our patients and organizations in which we work based on our unique expertise in PHM clinical care, research, and education |
| We will be leaders and influential agents in national health care policies that impact hospital care |
Attaining this vision will take tremendous dedication, effort, and collaboration. As a starting point, the following initiatives were proposed and implemented as noted:
Clinical
-
Develop an educational plan supporting the PHM Core Competencies, addressing both hospitalist training needs and the role as formal educators.
-
Create a clinical practice monitoring dashboard template for use at PHM hospitals and practices (implemented July 2010).
Quality
-
Undertake environmental assessment of PHM participation on key quality and safety committees, societies, and agencies to ensure appropriate PHM representation in liaison and/or leadership positions.
-
Create a plan for a QI collaborative by assessing the needs and resources available; draft plans for 2 projects (1 safety and 1 quality) which will improve care for children hospitalized with common conditions (started July 2009).
Research
-
Create a collaborative research entity by restructuring the existing research network and formalizing relationships with affiliated networks.
-
Create a pipeline/mentorship system to increase the number of PHM researchers.
Workforce
-
Develop a descriptive statement that can be used by any PHM physician that defines the field of PHM and answers the question who are we?
-
Develop a communications tool describing value added of PHM.
-
Develop a tool to assess career satisfaction among PHM physicians, with links to current SHM work in this area.
Structure
-
Formalize an organizational infrastructure for oversight and guidance of PHM Strategic Planning Roundtable efforts, with clear delineation of the relationships with the AAP, APA, and SHM.
This review demonstrates the work that needs to be done to close the gaps between the current state of affairs and the full vision of the potential impact of PHM. Harm is still common in hospitalized children, and, as a group of physicians, we do not consistently provide evidence‐based care. Quality and safety activities are currently dispersed throughout multiple national entities often working in silos. Much of our PHM research is fragmented, with a lack of effective research networks and collaborative efforts. We also found that while our workforce has many strengths, it is not yet stable.
We believe the Roundtable was successful in describing the current state of PHM and laying a course for the future. We developed a series of deliverable products that have already seen success on many fronts, and that will serve as the foundation for further maturation of the field. We hope to engage the pediatric community, within and without PHM, to comment, advise, and foster PHM so that these efforts are not static but ongoing and evolving. Already, new challenges have arisen not addressed at the Roundtable, such as further resident work restrictions, and healthcare reform with its potential effects on hospital finances. This is truly an exciting and dynamic time, and we know that this is just the beginning.
Acknowledgements
The authors acknowledge the contribution of all members of the roundtable: Douglas Carlson, Vincent Chiang, Patrick Conway, Jennifer Daru, Matthew Garber, Christopher Landrigan, Patricia Lye, Sanjay Mahant, Jennifer Maniscalco, Sanford Melzer, Stephen Muething, Steve Narang, Mary Ottolini, Jack Percelay, Daniel Rauch, Mario Reyes, Beth Robbins, Jeff Sperring, Rajendu Srivastava, Erin Stucky, Lisa Zaoutis, and David Zipes. The authors thank David Zipes for his help in reviewing the manuscript.
- ,.The hospitalist movement 5 years later.JAMA.2002;287(4):487–494.
- ,,.The Physician Strategist: Setting Strategic Direction for Your Practice; Chicago, Irwin Professional Pub,1996.
- ,.Pediatric hospitalists: training, current practice, and career goals.J Hosp Med.2009;4(3):179–186.
- The Pediatric Core Competencies Supplement.J Hosp Med.2010;5(suppl 2):1–114.
- ,,,.Reauthorizing SCHIP: Opportunities for Promoting Effective Health Coverage and High Quality Care for Children and Adolescents. Publication 1051.New York, NY:The Commonwealth Fund; August2007:4.
- ,.National Association of Children's Hospitals. Quality Performance Measurement in Medicaid and SCHIP: Result of a 2006 National Survey of State Officials.Lansing, MI:Health Management Associates; August2006.
- ,,,.A report card on quality improvement for children's health care.Pediatrics.2001;107:143–155.
- ,,, et al.Impact of a hospitalist system on length of stay and cost for children with common conditions.Pediatrics.2007;120(2):267–274.
- ,,,,,.Variations in management of common inpatient pediatric illnesses: hospitalists and community pediatricians.Pediatrics.2006;118:441–447.
- ,,,,.Variation in pediatric hospitalists' use of unproven therapies: a study from the Pediatric Research in Inpatient Settings (PRIS) network.J Hosp Med.2008;3(4):292–298.
- ,,,.Characteristics of the pediatric hospitalist workforce: its roles and work environment.Pediatrics.2007;120(1):33–39.
- ,,,,.General pediatrics resident perspectives on training decisions and career choice.Pediatrics.2009;123(suppl 1):S26–S30.
- ,,,,.Recently trained general pediatricians: perspectives on residency training and scope of practice.Pediatrics.2009;123(suppl 1):S38–S43.
- ,,,.PRIS survey: pediatric hospitalist roles and training needs [abstract].Pediatr Res.2004(55):1.
- ,,.The Residency Review and Redesign in Pediatrics (R3P) Project: roots and branches.Pediatrics.2009;123(suppl 1):S8–S11.
Hospitalists are the fastest growing segment of physicians in the United States.1 Given the growing field of Pediatric Hospital Medicine (PHM) and the need to define strategic direction, the Society of Hospital Medicine (SHM), the American Academy of Pediatrics (AAP), and the Academic Pediatric Association (APA) sponsored a strategic planning meeting in February 2009 that brought together 22 PHM leaders to discuss the future of the field.
PHM is at a critical juncture in terms of clinical practice, research, workforce issues, and quality improvement. The field has developed sufficiently to produce leaders capable of setting an agenda and moving forward. A discussion with the American Board of Pediatrics (ABP) by PHM leaders from the AAP, APA, and SHM at the Pediatric Hospital Medicine 2007 Conference regarding subspecialty designation stimulated convening the PHM Strategic Planning Roundtable to address the task of coordinating further development of PHM (Table 1).
|
| Develop a strategic vision for the role of PHM in the future of children's health care |
| Describe the current gaps between the vision and today's reality |
| Develop a common understanding regarding current initiatives in PHM domains of clinical practice, quality, research, and workforce |
| Determine the method(s) by which participants can be organized to accomplish additional initiatives to implement the vision |
| Identify and prioritize key strategic initiatives |
| Assign accountability and determine next steps and timeline to implement the selected initiatives |
The objective of this article is to describe: (1) the Strategic Planning Roundtable's vision for the field of pediatric hospital medicine; (2) the generation and progress on specific initiatives in clinical practice, quality, research, and workforce identified by the Strategic Planning Roundtable; and (3) issues in the designation of PHM as a subspecialty.
METHODS
The PHM Strategic Planning Roundtable was conducted by a facilitator (S.M.) during a 2‐day retreat using established healthcare strategic planning methods.2
Participants were the existing PHM leaders from the AAP, APA, and SHM, as well as other national leaders in clinical practice, quality, research, and workforce. Development of the vision statement was a key step in which the participants developed a consensus‐based aspirational view of the future. The draft version of the vision statement was initially developed after extensive interviews with key stakeholders and experts in PHM, and was revised by the participants in the course of a facilitated group discussion during the retreat. Following creation of the vision statement, the group then defined the elements of transformation pertaining to PHM and detailed the components of the vision.
Analysis of internal and external environmental factors was critical in the strategic planning process. This type of analysis, detailing the current state of PHM practice, permitted the strategic planners to understand the gaps that existed between the aspirational vision statement and today's reality, and set the stage to identify and implement initiatives to achieve the vision. Several months before the meeting, 4 expert panels comprised of PHM specialists representing a variety of academic and clinical practice settings were brought together via e‐mail and conference calls to focus on 4 domains of PHM: clinical practice, quality of care, research, and workforce. These groups were asked to describe the current status, challenges, and opportunities in these areas. Combining literature review and key stakeholder interviews, their findings and recommendations were distilled into brief summaries that were presented at the Roundtable meeting. Following the presentations, the participants, working in small groups representing all areas of focus,provided additional feedback.
Following the creation of a consensus vision statement and review of internal and external factors, the participants worked to identify specific initiatives in the 4 domains that would advance the field towards the goals contained in the vision statement. These initiatives were grouped into categories. Initiatives by category were scored and prioritized according to predetermined criteria including potential impact, cost, operational complexity, and achievability.
For each initiative selected, the group developed targets and metrics that would be used to track progress. Assigning leadership, accountability, and a timeline to each of the selected projects completed the implementation plan. In addition, the group developed an organizational structure to provide oversight for the overall process, and designated individuals representing the sponsoring organizations into those roles. In conclusion, the group discussed potential structures to guide the future of PHM.
CLINICAL PRACTICE
The Roundtable defined clinical practice for PHM as the general medical care of the hospitalized child, including direct patient care and leadership of the inpatient service. Clinical practice is affected by a number of current national trends including: fewer primary care providers interested in, or with the time to provide, inpatient care; resident work hour restrictions; increasing complexity of clinical issues; and increasing availability of pediatric hospitalists. At the hospital level, clinical practice is affected by increasing need for quality and safety measures, electronic health records and computerized physician order entry, and mounting financial pressures on the hospital system. Hospitalists are assuming more roles in leading quality and safety initiatives, creating computerized systems that address children's needs, and creating financially viable systems of quality pediatric care.3 Hospitalists' clinical care and leadership roles are emerging, and therefore the field faces training and mentorship issues.
Progress to date in this area includes 2 textbooks that define a scope of knowledge and practice, and a newly developed journal in PHM. Core competencies in PHM have been published and provide further refinement of scope and a template for future training.4
Multiple opportunities exist for hospitalists to establish themselves as clinical leaders. Hospitalists can become the preferred providers for hospitalized chronically ill children, with specific initiatives to improve care coordination and multidisciplinary communication. In addition to care coordination and decreasing length of stay, hospitalists, with their intimate knowledge of hospital operations, can be leaders in hospital capacity management and patient flow to increase operational efficiency. Hospitalists can expand evidence‐based guidelines for, and data about, inpatient conditions, and explore the effect of workload and hours on patient care. In addition, there is an expanding role into administrative areas, as well as alternate care arenas, such as: intensive care support (pediatric and neonatal), transport, sedation, palliative care, and pain management. Activities in administrative and alternate care areas have profound direct affects on patient care, as well as providing value added services and additional revenue streams which can further support clinical needs. Finally, achieving quality targets will likely be increasingly linked to payment, so hospitalists may play a key role in the incentives paid to their hospitals. Meeting these challenges will further solidify the standing of hospitalists in the clinical realm.
QUALITY
National and governmental agencies have influenced quality and performance improvement measurements in adult healthcare, resulting in improvements in adult healthcare quality measurement.5 There is limited similar influence or measure development in pediatric medicine, so the quality chasm between adult and child healthcare has widened. Few resources are invested in improving quality and safety of pediatric inpatient care. Of the 18 private health insurance plans' quality and pay for performance programs identified by Leapfrog, only 17% developed pediatric‐specific inpatient measures.6 Only 5 of 40 controlled trials of quality improvement efforts for children published between 1980 and 1998 addressed inpatient problems.7
There have been recent efforts at the national level addressing these issues, highlighted by the introduction of The Children's Health Care Quality Act, in 2007. Early studies in PHM systems focused on overall operational efficiency, documenting 9% to 16% decreases in length of stay and cost compared to traditional models of care.8 Conway et al. identified higher reported adherence to evidence‐based care for hospitalists compared to community pediatricians.9 However, Landrigan et al. demonstrated that there is still large variation in care that exists in the management of common inpatient diagnoses, lacking strong evidence‐based guidelines even among pediatric hospitalists.10 Moreover, there have been no significant studies reviewing the impact of pediatric hospitalists on safety of inpatient care. Magnifying these challenges is the reality that our healthcare system is fragmented with various entities scrambling to define, measure, and compare the effectiveness and safety of pediatric healthcare.
These challenges create an opportunity for PHM to develop a model of how to deliver the highest quality and safest care to our patients. The solution is complex and will take cooperation at many levels of our healthcare system. Improving the safety and quality of care for children in all settings of inpatient care in the United States may best be accomplished via an effective collaborative. This collaborative should be comprehensive and inclusive, and focused on demonstrating and disseminating how standardized, evidence‐based care in both clinical and safety domains can lead to high‐value and high‐quality outcomes. The success of PHM will be measured by its ability to deliver a clear value proposition to all consumers and payers of healthcare. The creation of a robust national collaborative network is a first step towards meeting this goal and will take an extraordinary effort. A PHM Quality Improvement (QI) Collaborative workgroup was created in August 2009. Three collaboratives have been commissioned: (1) Reduction of patient identification errors; (2) Improving discharge communication to referring primary care providers for pediatric hospitalist programs, and (3) Reducing the misuse and overuse of bronchodilators for bronchiolitis. All the collaborative groups have effectively engaged key groups of stakeholders and utilized standard QI tools, demonstrating improvement by the fall of 2010 (unpublished data, S.N.).
RESEARCH
Despite being a relatively young field, there is a critical mass of pediatric hospitalist‐investigators who are establishing research career paths for themselves by securing external grant funding for their work, publishing, and receiving mentorship from largely non‐hospitalist mentors. Some hospitalists are now in a position to mentor junior investigators. These hospitalist‐investigators identified a collective goal of working together across multiple sites in a clinical research network. The goal is to conduct high‐quality studies and provide the necessary clinical information to allow practicing hospitalists to make better decisions regarding patient care. This new inpatient evidence‐base will have the added advantage of helping further define the field of PHM.
The Pediatric Research in Inpatient Settings Network (PRIS) was identified as the vehicle to accomplish these goals. A series of objectives were identified to redesign PRIS in order to accommodate and organize this new influx of hospitalist‐investigators. These objectives included having hospitalist‐investigators commit their time to the prioritization, design, and execution of multicenter studies, drafting new governance documents for PRIS, securing external funding, redefining the relationships of the 3 existing organizations that formed PRIS (AAP, APA, SHM), defining how new clinical sites could be added to PRIS, creating a pipeline for junior hospitalist‐investigators to transition to leadership roles, securing a data coordinating center with established expertise in conducting multicenter studies, and establishing an external research advisory committee of leaders in pediatric clinical research and QI.
Several critical issues were identified, but funding remained a priority for the sustainability of PRIS. Comparative effectiveness (CE) was recognized as a potential important source of future funding. Pediatric studies on CE (eg, surgery vs medical management) conducted by PRIS would provide important new data to allow hospitalists to practice evidence‐based medicine and to improve quality.
A Research Leadership Task Force was created with 4 members of the PHM Strategic Planning Roundtable to work on the identified issues. The APA leadership worked with PRIS to establish a new Executive Council (comprised of additional qualified hospitalist‐investigators). The Executive Council was charged with accomplishing the tasks outlined from the Strategic Planning Roundtable. They have created the governance documents and standard operating procedures necessary for PRIS to conduct multicenter studies, defined a strategic framework for PRIS including the mission, vision and values, and funding strategy. In February 2010, PRIS received a 3‐year award for over $1 million from the Child Health Corporation of America to both fund the infrastructure of PRIS and to conduct a Prioritization Project. The Prioritization Project seeks to identify the conditions that are costly, prevalent, and demonstrate high inter‐hospital variation in resource utilization, which signals either lack of high‐quality data upon which to base medical decisions, and/or an opportunity to standardize care across hospitals. Some of these conditions will warrant further investigation to define the evidence base, whereas other conditions may require implementation studies to reliably introduce evidence into practice. Members of the Executive Council received additional funding to investigate community settings, as most children are hospitalized outside of large children's hospitals. PRIS also reengaged all 3 societies (APA, AAP, and SHM) for support for the first face‐to‐face meeting of the Executive Council. PRIS applied for 2 Recovery Act stimulus grants, and received funding for both of approximately $12 million. The processes used to design, provide feedback, and shepherd these initial studies formed the basis for the standard operating procedures for the Network. PRIS is now reengaging its membership to establish how sites may be able to conduct research, and receive new ideas to be considered for study in PRIS.
Although much work remains to be done, the Executive Council is continuing the charge with quarterly face‐to‐face meetings, hiring of a full‐time PRIS Coordinator, and carrying out these initial projects, while maintaining the goal of meeting the needs of the membership and PHM. If PRIS is to accomplish its mission of improving the health of, and healthcare delivery to, hospitalized children and their families, then the types of studies undertaken will include not only original research questions, but also comparative implementation methods to better understand how hospitalists in a variety of settings can best translate research findings into clinical practice and ultimately improve patient outcomes.
WORKFORCE
The current number of pediatric hospitalists is difficult to gauge11; estimates range from 1500 to 3000 physicians. There are groups of pediatric hospitalists within several national organizations including the AAP, APA, and SHM, in addition to a very active listserve community. It is likely that only a portion of pediatric hospitalists are represented by membership in these organizations.
Most physicians entering the field of PHM come directly out of residency. A recent survey by Freed et al.12 reported that 3% of current pediatric residents are interested in PHM as a career. In another survey by Freed et al., about 6% of recent pediatric residency graduates reported currently practicing as pediatric hospitalists.13 This difference may indicate a number of pediatricians practicing transiently as pediatric hospitalists.
There are numerous issues that will affect the growth and sustainability of PHM. A large number of pediatric residents entering the field will be needed to maintain current numbers. With 45% of hospitalists in practice less than 3 years,11 the growth of PHM in both numbers and influence will require an increasing number of hospitalists with sustained careers in the field. Recognition as experts in inpatient care, as well as expansion of the role of hospitalists beyond the clinical realm to education, research, and hospital leadership, will foster long‐term career satisfaction. The increasingly common stature of hospital medicine as an independent division, equivalent to general pediatrics and subspecialty divisions within a department, may further bolster the perception of hospital medicine as a career.
The majority of pediatric hospitalists believe that current pediatric residency training does not provide all of the skills necessary to practice as a pediatric hospitalist,14 though there is disagreement regarding how additional training in pediatric hospital medicine should be achieved: a dedicated fellowship versus continuing medical education (CME). There are several initiatives with the potential to transform the way pediatric hospitalists are trained and certified. The Residency Review and Redesign Project indicates that pediatric residency is likely to be reformed to better meet the training demands of the individual resident's chosen career path. Changing residency to better prepare pediatric residents to take positions in pediatric hospital medicine will certainly affect the workforce emerging from residency programs and their subsequent training needs.15 The American Board of Internal Medicine and the American Board of Family Medicine have approved a Recognition of Focused Practice in Hospital Medicine. This recognition is gained through the Maintenance of Certification (MOC) Program of the respective boards after a minimum of 3 years of practice. SHM is offering fellow recognition in tiered designations of Fellow of Hospital Medicine (FHM), Senior Fellow of Hospital Medicine, and Master of Hospital Medicine. Five hundred hospitalists, including many pediatric hospitalists, received the inaugural FHM designation in 2009. Organizational recognition is a common process in many other medical fields, although previously limited in pediatrics to Fellow of the AAP. FHM is an important step, but cannot substitute for specific training and certification.
Academic fellowships in PHM will aid in the training of hospitalists with scholarly skills and will help produce more pediatric hospitalists with clinical, quality, administrative, and leadership skills. A model of subspecialty fellowship training and certification of all PHM physicians would require a several‐fold increase in available fellowships, currently approximately 15.
Ongoing CME offerings are also critical to sustaining and developing the workforce. The annual national meetings of the APA, AAP, and SHM all offer PHM‐dedicated content, and there is an annual PHM conference sponsored by these 3 organizations. There are now multiple additional national and regional meetings focused on PHM, reflecting the growing audience for PHM CME content. The AAP offers a PHM study guide and an Education in quality improvement for pediatric practice (eQIPP) module on inpatient asthma, specifically designed to facilitate the MOC process for pediatric hospitalists.
Some form of ABP recognition may be necessary to provide the status for PHM to be widely recognized as a viable academic career in the larger pediatric community. This would entail standardized fellowships that will ensure graduates have demonstrated proficiency in the core competencies. PHM leaders have engaged the ABP to better understand the subspecialty approval process and thoughtfully examine the ramifications of subspecialty status, specifically what subspecialty certification would mean for PHM providers and hospitals. Achieving ABP certification may create a new standard of care meaning that noncertified PHM providers will be at a disadvantage. It is unknown what the impact on pediatric inpatient care would be if a PHM standard was set without the supply of practitioners to provide that care.
STRUCTURE
The efforts of the Roundtable demonstrate the potential effectiveness of the current structure that guides the field: that of the cooperative interchange between the PHM leaders within the APA, AAP, and SHM. It may be that, similar to Pediatric Emergency Medicine (PEM), no formal, unifying structure is necessary. Alternatively, both Adolescent Medicine and Behavioral and Developmental Pediatrics (BDP) have their own organizations that guide their respective fields. A hybrid model is that of Pediatric Cardiology which has the Joint Council on Congenital Heart Disease. This structure assures that the leaders of the various organizations concerned with congenital heart disease meet at least annually to report on their activities and coordinate future efforts. Its makeup is similar to how the planning committee of the annual national PHM conference is constructed. Although PHM has largely succeeded with the current organizational structure, it is possible that a more formal structure is needed to continue forward.
CONCLUSION
The Roundtable members developed the following vision for PHM: Pediatric hospitalists will transform the delivery of hospital care for children. This will be done by achieving 7 goals (Table 2).
|
| We will ensure that care for hospitalized children is fully integrated and includes the medical home |
| We will design and support systems for children that eliminate harm associated with hospital care |
| We will develop a skilled and stable workforce that is the preferred provider of care for most hospitalized children |
| We will use collaborative research models to answer questions of clinical efficacy, comparative effectiveness, and quality improvement, and we will deliver care based on that knowledge |
| We will provide the expertise that supports continuing education in the care of the hospitalized child for pediatric hospitalists, trainees, midlevel providers, and hospital staff |
| We will create value for our patients and organizations in which we work based on our unique expertise in PHM clinical care, research, and education |
| We will be leaders and influential agents in national health care policies that impact hospital care |
Attaining this vision will take tremendous dedication, effort, and collaboration. As a starting point, the following initiatives were proposed and implemented as noted:
Clinical
-
Develop an educational plan supporting the PHM Core Competencies, addressing both hospitalist training needs and the role as formal educators.
-
Create a clinical practice monitoring dashboard template for use at PHM hospitals and practices (implemented July 2010).
Quality
-
Undertake environmental assessment of PHM participation on key quality and safety committees, societies, and agencies to ensure appropriate PHM representation in liaison and/or leadership positions.
-
Create a plan for a QI collaborative by assessing the needs and resources available; draft plans for 2 projects (1 safety and 1 quality) which will improve care for children hospitalized with common conditions (started July 2009).
Research
-
Create a collaborative research entity by restructuring the existing research network and formalizing relationships with affiliated networks.
-
Create a pipeline/mentorship system to increase the number of PHM researchers.
Workforce
-
Develop a descriptive statement that can be used by any PHM physician that defines the field of PHM and answers the question who are we?
-
Develop a communications tool describing value added of PHM.
-
Develop a tool to assess career satisfaction among PHM physicians, with links to current SHM work in this area.
Structure
-
Formalize an organizational infrastructure for oversight and guidance of PHM Strategic Planning Roundtable efforts, with clear delineation of the relationships with the AAP, APA, and SHM.
This review demonstrates the work that needs to be done to close the gaps between the current state of affairs and the full vision of the potential impact of PHM. Harm is still common in hospitalized children, and, as a group of physicians, we do not consistently provide evidence‐based care. Quality and safety activities are currently dispersed throughout multiple national entities often working in silos. Much of our PHM research is fragmented, with a lack of effective research networks and collaborative efforts. We also found that while our workforce has many strengths, it is not yet stable.
We believe the Roundtable was successful in describing the current state of PHM and laying a course for the future. We developed a series of deliverable products that have already seen success on many fronts, and that will serve as the foundation for further maturation of the field. We hope to engage the pediatric community, within and without PHM, to comment, advise, and foster PHM so that these efforts are not static but ongoing and evolving. Already, new challenges have arisen not addressed at the Roundtable, such as further resident work restrictions, and healthcare reform with its potential effects on hospital finances. This is truly an exciting and dynamic time, and we know that this is just the beginning.
Acknowledgements
The authors acknowledge the contribution of all members of the roundtable: Douglas Carlson, Vincent Chiang, Patrick Conway, Jennifer Daru, Matthew Garber, Christopher Landrigan, Patricia Lye, Sanjay Mahant, Jennifer Maniscalco, Sanford Melzer, Stephen Muething, Steve Narang, Mary Ottolini, Jack Percelay, Daniel Rauch, Mario Reyes, Beth Robbins, Jeff Sperring, Rajendu Srivastava, Erin Stucky, Lisa Zaoutis, and David Zipes. The authors thank David Zipes for his help in reviewing the manuscript.
- ,.The hospitalist movement 5 years later.JAMA.2002;287(4):487–494.
- ,,.The Physician Strategist: Setting Strategic Direction for Your Practice; Chicago, Irwin Professional Pub,1996.
- ,.Pediatric hospitalists: training, current practice, and career goals.J Hosp Med.2009;4(3):179–186.
- The Pediatric Core Competencies Supplement.J Hosp Med.2010;5(suppl 2):1–114.
- ,,,.Reauthorizing SCHIP: Opportunities for Promoting Effective Health Coverage and High Quality Care for Children and Adolescents. Publication 1051.New York, NY:The Commonwealth Fund; August2007:4.
- ,.National Association of Children's Hospitals. Quality Performance Measurement in Medicaid and SCHIP: Result of a 2006 National Survey of State Officials.Lansing, MI:Health Management Associates; August2006.
- ,,,.A report card on quality improvement for children's health care.Pediatrics.2001;107:143–155.
- ,,, et al.Impact of a hospitalist system on length of stay and cost for children with common conditions.Pediatrics.2007;120(2):267–274.
- ,,,,,.Variations in management of common inpatient pediatric illnesses: hospitalists and community pediatricians.Pediatrics.2006;118:441–447.
- ,,,,.Variation in pediatric hospitalists' use of unproven therapies: a study from the Pediatric Research in Inpatient Settings (PRIS) network.J Hosp Med.2008;3(4):292–298.
- ,,,.Characteristics of the pediatric hospitalist workforce: its roles and work environment.Pediatrics.2007;120(1):33–39.
- ,,,,.General pediatrics resident perspectives on training decisions and career choice.Pediatrics.2009;123(suppl 1):S26–S30.
- ,,,,.Recently trained general pediatricians: perspectives on residency training and scope of practice.Pediatrics.2009;123(suppl 1):S38–S43.
- ,,,.PRIS survey: pediatric hospitalist roles and training needs [abstract].Pediatr Res.2004(55):1.
- ,,.The Residency Review and Redesign in Pediatrics (R3P) Project: roots and branches.Pediatrics.2009;123(suppl 1):S8–S11.
Diagnosis of Complicated Pneumonia
Community‐acquired pneumonia (CAP), the most common serious bacterial infection in childhood, may be complicated by parapneumonic effusion (ie, complicated pneumonia).1, 2 The clinical outcome of children with complicated pneumonia is directly influenced by the causative organism, and precise identification of the infectious agent has the potential to improve clinical management.35 The incidence of complicated pneumonia has recently increased, highlighting the need to better understand the reasons for this changing epidemiology.68 However, using conventional bacterial culture, bacteria are isolated from clinical samples obtained from children with complicated pneumonia in only 17%42% of cases.1, 9, 10 The low rate of positive culture results may be related to stringent bacterial growth requirements or to administration of broad‐spectrum antibiotics before obtaining blood or pleural fluid samples for culture.
Unlike bacterial culture, polymerase chain reaction (PCR) relies on the detection of bacterial DNA rather than on the recovery of viable bacteria and is therefore less affected by the prior administration of antibiotics. Broad‐range or universal primer 16S rRNA PCR detects a conserved region of the 16S ribosomal RNA (rRNA) gene and can detect a wide range of bacterial species with a single assay.11 However, few studies have evaluated the role of 16S rRNA PCR in detecting bacteria in the pleural fluid of children with complicated pneumonia.12, 13 The purpose of this study was to determine the frequency of positive blood and pleural fluid cultures in children with complicated pneumonia, and to determine whether broad‐range 16S rRNA PCR can increase the proportion of children with an identifiable microbiologic cause of complicated pneumonia.
Methods
Study Design, Setting, and Participants
This prospective cohort study was conducted at The Children's Hospital of Philadelphia (CHOP), an urban tertiary care children's hospital. The proposal was approved by the CHOP Committees for the Protection of Human Subjects. Patients were eligible for participation if they were 18 years of age, admitted to the hospital between October 1, 2007 and March 31, 2010, and diagnosed with complicated pneumonia. Parental informed consent was obtained for all patients, and verbal assent was obtained for all children over seven years of age. Patients with chronic medical conditions predisposing them to severe or recurrent pneumonia, such as human immunodeficiency virus, malignancy, and sickle cell disease, were excluded. The study team had no role in the clinical management of study patients. As this test is still considered experimental, pleural fluid 16S rRNA PCR was not performed until the patient was discharged from the hospital; these test results were not shared with the treating physicians.
Study Definition
Complicated pneumonia was defined by a temperature >38.0C, and the presence of lung parenchymal infiltrates and pleural effusions of any size or character on chest radiography or computed tomography.
Microbiologic MethodsConventional Culture
Pleural fluid or blood (4 mL) was inoculated onto a single pediatric BacT/Alert FAN bottle (BioMrieux, Durham, NC) which was immediately transported to the laboratory at room temperature. Additional pleural fluid was also submitted to the laboratory for a cytospin Gram stain. Once received in the laboratory, the bottles were immediately loaded into the BacT/Alert instrument. Bottles were automatically checked by the instrument for production of CO2 every ten minutes, and remained in the instrument for a total of five days. Bottles flagged as positive by the BacT/Alert system were removed from the instrument, subcultured to agar plates, and Gram stained. Bacterial isolates were identified and the antibiotic susceptibility tested by conventional methods following Clinical and Laboratory Standards Institute guidelines.
Microbiological Methods16S rRNA PCR
The 16S rRNA primers and probe used in this study have been validated previously and have been used extensively for the identification of organisms from the Domain Bacteria.14 Escherichia coli (ATCC 25922) and Staphylococcus aureus (ATCC 29213) were used as Gram‐negative and Gram‐positive controls, respectively. DNA extraction was performed on a 300 l aliquot of pleural fluid using the MagMAX Total Nucleic Acid Isolation Kit (Applied Biosystems, Foster City, CA). Samples were disrupted using a Vortex adapter for 15 minutes at the highest setting. Tubes were then centrifuged at 16,000 relative centrifugal force (RCF) for three minutes, and DNA extraction was performed using the KingFisher Flex Automated Purification System (Thermo Scientific, Waltham, MA). All DNA extracts were frozen at 20C prior to use. Details of the 16S rRNA PCR assay optimization and validation appear in the Appendix.
DNA was amplified on an Applied Biosystems 7500 thermal cycler (ABI, Foster City, CA) using the primers, 16S F: 5‐GCT GTC ATC TCT TGT GGG CTG T‐3, 16S R: 5‐AAA CTC ATG GGA GCT GCT GGT T‐3, and the fluorescent labeled TaqMan probe, 16s Probe: 5‐Cy5/CCT GTC ATG CCC ACA CAA ATC TCT CC/BHQ‐2‐3. Human DNA (0.5 nanograms) was added to each assay as a standardized internal amplification control. The primers, AlbICF: 5‐GCT GTC ATC TCT TGT GGG CTG T‐3, AlbICR: 5‐AAA CTC ATG GGA GCT GCT GGT T‐3, and the TaqMan probe, AlbICP: 5‐Cy5/CCT GTC ATG CCC ACA CAA ATC TCT CC/BHQ‐2‐3 detect a region of the human albumin gene. Amplification was performed as follows: initial denaturation of 94C for 20 seconds, followed by 35 cycles of 94C for 10 seconds, 61C for 31 seconds, and 72C for 5 seconds. Each run included positive (E. coli ATCC 25922 DNA) and negative (nuclease free water) controls. A cycle threshold value of 30 or less indicated a positive sample. All positive samples were confirmed using the MicroSeq 500 16S rDNA Bacterial Identification kit (Applied Biosystems).
DNA Sequencing
DNA sequencing was performed directly on PCR products using an ABI 3730 with the BigDye Taq FS Terminator V3.1. Sequencing was completed at the University of Pennsylvania DNA Sequencing Facility, and sequence identification was performed by BLAST at the National Center for Biotechnology Information web site (
Statistical Analysis
Data were analyzed using STATA 10.0 (Stata Corp., College Station, TX). Categorical variables were described using frequencies and percentages, and were compared using the chi‐square test. Continuous variables were described using mean, median, intraquartile range (IQR), and range values. Binomial exact 95% confidence intervals (CIs) were calculated for the proportion of positive blood and pleural fluid cultures and pleural fluid 16S rRNA PCR tests.
Results
During the study period, 124 patients with complicated pneumonia were identified; the median age was 4.9 years (IQR, 2.78.8 years) and the ratio of female to male patients was 1:1. The racial distribution was as follows: non‐Hispanic white, 62 (50%); non‐Hispanic black, 43 (34%); and Hispanic, 7 (6%). The median length of stay was 11 days (range, 240 days; IQR, 811 days). Forty‐one (33.1%) patients were admitted to the intensive care unit, and nine (7.3%) patients required mechanical ventilation. Overall, 5 of the 71 blood cultures performed (7.0%; 95% CI: 2.3%15.7%) were positive.
Pleural fluid drainage was performed in 64 (51.6%) patients. The median duration of antibiotic treatment before pleural fluid drainage was two days (IQR, 04 days). Differences in duration of antibiotic pretreatment between those with and without pleural fluid drainage were not significant. Patients received beta‐lactam agents (76.6%), clindamycin (51.6%), and vancomycin (23.4%) before pleural drainage. Blood cultures were performed in 27 (45.0%) of 60 patients not undergoing pleural fluid drainage; 2 of these 27 (7.4%; 95% CI: 0.9%24.3%) blood cultures were positive, and Streptococcus pneumoniae was isolated in both cases.
Using a combination of pleural fluid culture, blood culture, and broad‐range PCR, a microbiologic cause of infection was identified in 11 of 64 (17.2%; 95% CI: 8.9%28.7%) patients undergoing pleural fluid drainage (Figure 1). Patients with an identified bacterial cause were younger than those without an identified bacterial cause (Table 1). However, there were no statistically significant differences between the groups with and without identified bacteria with respect to sex, race, clinical examination findings and laboratory results at admission, duration of antibiotic therapy before pleural fluid drainage, or length of stay (Table 1). The median pleural fluid white blood cell count was 6880 per mm3 (IQR, 154227,918 per mm3).
| Causative Bacteria Identified | |||
|---|---|---|---|
| Demographics | Yes (n = 11) | No (n = 53) | P Value |
| |||
| Female sex | 3 (27.3%) | 29 (54.7%) | 0.10 |
| Age (years) | 2 (1.34.50) | 4.3 (3.1 8.1) | 0.03 |
| Race | 0.09 | ||
| Non‐Hispanic white | 3 (27.3%) | 29 (54.7%) | |
| Non‐Hispanic black | 7 (63.6%) | 13 (24.5%) | |
| Hispanic | 0 (0.0%) | 3 (5.6%) | |
| Other | 1 (9.1%) | 8 (15.1%) | |
| History of asthma | 2 (18.2%%) | 12 (22.6%) | 0.75 |
| Duration of antibiotics before drainage (days) | 0.5 (03) | 2 (04) | 0.43 |
| Intensive care unit admission | 7 (63.6%) | 25 (47.2%) | 0.32 |
| Initial temperature (C) | 37.8 (37.239.5) | 38.1 (37.639.3) | 0.76 |
| Initial oxygen saturation (%) | 94 (9397) | 95 (9396) | 0.97 |
| Peripheral white blood cell count (per mm3) | 21.4 (14.028.4) | 16.3 (10.922.6) | 0.12 |
| Platelet count (per mm3) | 434 (298546) | 402 (312575) | 0.95 |
Blood was obtained for culture from 44 (68.8%) of 64 patients that underwent pleural fluid drainage. Blood cultures were positive in three (6.8%; 95% CI: 1.4%18.7%) of these patients; causative bacteria were S. pneumoniae (n = 1), Haemophilus influenzae (n = 1), and Staphylococcus aureus (n = 1). Pleural fluid cultures were positive from 6 of 64 patients (9.3%; 95% CI: 3.5%19.3%) that underwent pleural fluid drainage; causative bacteria were Staphylococcus aureus (n = 5) and Streptococcus pneumoniae (n = 1). Three of the 19 pleural fluid samples (15.8%, CI 3.4%39.6%) tested by 16S rRNA PCR yielded positive results; S. pneumoniae was identified by DNA sequencing in all three of these samples (Figure 1). Of these three specimens, two had both negative Gram stains and negative pleural fluid cultures, while one specimen had Gram‐positive cocci in pairs identified on Gram stain along with a pleural fluid culture‐positive for S. pneumoniae. Of the 16 patients with negative PCR results, one was found to have a pleural fluid culture‐positive for S. aureus; no bacteria were detected on the pleural fluid Gram stain (Figure 1). Differences in the demographic characteristics between patients in whom broad‐range PCR was performed and not performed were not statistically significant (Table 2). Differences in the median length of hospital stay between patients who had PCR performed (9 days; IQR, 712 days) and those who did not (11 days; IQR, 914 days) were not statistically significant (P = 0.19). Antibiotic therapy was simplified from treatment with multiple antibiotics to a single antibiotic in each instance of a positive culture, though the number of positive cultures was too small to lead to meaningful reductions in antibiotic use or spectrum.
| PCR Performed | |||
|---|---|---|---|
| Demographics | Yes (N = 19) | No (N = 45) | P Value |
| |||
| Female sex | 9 (47.4) | 23 (51.1) | 0.78 |
| Age (years) | 4.9 (2.78.8) | 4.0 (2.88.1) | 0.76 |
| Race | 0.42 | ||
| Non‐Hispanic white | 10 (52.6%) | 22 (48.9%) | |
| Non‐Hispanic black | 5 (26.3%) | 15 (33.3%) | |
| Hispanic | 0 (0.0%) | 3 (6.7%) | |
| Other | 4 (21.1%) | 5 (11.1%) | |
| History of asthma | 5 (26.32%) | 9 (20.0%) | 0.58 |
| Duration of antibiotics before drainage (days) | 2 (03) | 1.5 (04) | 0.65 |
| Intensive care unit admission | 8 (42.1%) | 24 (53.3%) | 0.41 |
| Initial temperature (C) | 38.1 (37.339.4) | 38.0 (37.639.4) | 0.86 |
| Initial pulse oximetry (%) | 96 (9497) | 94 (9296) | 0.34 |
| Initial white blood cell count (1000 per mm3) | 16.1 (9.527.4) | 17.8 (12.622.8) | 0.93 |
| Platelet count (1000 per mm3) | 397 (312575) | 431 (303597) | 0.73 |
Discussion
Identification of the causative organism can improve the treatment of children with complicated pneumonia by enabling clinicians to target the infection with effective, narrow‐spectrum antibiotics. However, broad‐spectrum antibiotics are typically given before blood or pleural fluid samples are obtained, lowering the yield of conventional bacterial cultures. In our study, pleural fluid and blood cultures were infrequently positive. However, the use of 16S rRNA broad‐range PCR and DNA sequencing as ancillary tests only modestly improved our diagnostic yield.
Two prior studies have shown that broad‐range PCR analysis of pleural fluid can detect pathogenic organisms from pleural fluid even after the administration of antibiotics. Saglani et al.12 used bacterial culture and broad‐range PCR to analyze pleural fluid from 32 children with complicated pneumonia. Although the cohort had received a median of eight days of antibiotic therapy prior to fluid aspiration, a combination of broad‐range PCR and DNA sequencing identified organisms, predominantly S. pneumoniae, in 17 of 26 (65.4%) pleural fluid samples with negative culture. Five of the six culture‐positive samples also had positive PCR results, suggesting that a low proportion of the PCR results were false‐negatives. Le Monnier et al.13 cultured the pleural fluid from 78 children with complicated pneumonia; 15 samples were excluded from PCR testing because they grew bacteria other than S. pneumoniae. Broad‐range 16S rRNA PCR detected bacteria in 22 of 40 (55.0%) samples that were culture‐negative; subsequent DNA sequencing identified S. pneumoniae (n = 17), S. pyogenes (n = 3), S. aureus (n = 1), and H. influenzae (n = 1). S. pneumoniae was identified by 16S rRNA PCR followed by DNA sequencing in 20 of the 23 (87.0%) pleural fluid samples that grew S. pneumoniae on culture.
PCR with organism‐specific primers has also been shown to detect pathogenic bacteria in 35%70% of pleural fluid samples from patients with complicated pneumonia.15, 16 These rates of detection are comparable to the results of prior studies that used broad‐range PCR, and suggest that 16S rRNA and organism‐specific PCR are similarly sensitive tests.
Our study found that the proportion of positive results with broad‐range PCR was greater than the proportion observed with conventional pleural fluid culture. We were also able to identify S. pneumoniae by broad‐range PCR in two culture‐negative pleural fluid samples. The detection of S. pneumoniae by PCR in the setting of negative pleural fluid culture is not surprising, as most patients received empiric antibiotic therapy against S. pneumoniae before undergoing pleural fluid drainage. This prior antibiotic therapy would be expected to decrease the yield of pleural fluid culture but have a less significant impact on PCR. The reason for the failure to detect S. aureus by PCR from our clinical samples is not known. We explored whether this issue could be attributable to test characteristics during validation of our assay (as described in the technical Appendix), and S. aureus was consistently identified in pleural fluid samples spiked with S. aureus. While our diagnostic yield was low compared with prior studies that used broad‐range PCR, the distribution of causative bacteria was similar to prior studies of complicated pneumonia.9, 10 There were too few positive cultures among the specimens available for broad‐range PCR testing for us to reliably assess 16S rRNA PCR sensitivity and specificity. Thus, it was not possible to reliably assess the value of 16S rRNA PCR as an ancillary test in culture‐negative complicated pneumonia.
Several factors may have contributed to the low yield of broad‐range PCR in our study. First, all patients in our study received broad‐spectrum antibiotics prior to pleural fluid drainage; most patients received treatment with a beta‐lactam agent in combination with either clindamycin or vancomycin. Although PCR is less affected than culture by the prior administration of antibiotics, it is still possible that exposure to antibiotics accelerated degradation of the bacterial genome, thus decreasing the sensitivity of broad‐range PCR. The median duration of antibiotic therapy prior to drainage was shorter for patients in whom a bacterial pathogen was identified, compared with those in whom a pathogen was not identified. Though this difference was not statistically significant, this difference emphasizes that early pleural fluid collection may improve bacterial detection. The median duration of prior antibiotic therapy was eight days, in the study by Saglani et al.,12 however details regarding anti‐staphylococcal therapy were not reported. Second, several studies using 16S rRNA PCR in blood or cerebrospinal fluid (CSF) specimens for children with sepsis or meningitis, respectively, have noted decreased sensitivity for detection of Gram‐positive bacteria.1720 The cell wall composition makes Gram‐positive bacteria particularly difficult to lyse for DNA extraction. Prior studies used a different approach to DNA extraction compared with our study. Saglani et al.12 used the QIAmp minikit for DNA extraction (Qiagen Ltd, West Sussex, UK) and Le Monnier et al.13 used the MagnaPure System (Roche Diagnostics, Indianapolis, IN) for DNA extraction; additionally Saglani et al.12 included an additional 15 minutes of incubation at 95C following Proteinase K digestion to ensure complete lysis of the bacterial cells. We used the MagMAX Total Nucleic Acid Isolation Kit with a bead beating step to degrade the samples prior to lysis. It is unlikely that any of these differences contributed to differences in our study results. Third, human DNA may cause a nonspecific background signal, which could decrease PCR sensitivity. This issue may be particularly important in complicated pneumonia where the pleural fluid white blood cell counts are substantially elevated. Human DNA from white blood cells might be present at much higher concentrations than bacterial DNA, which would create a competitive advantage for binding of human, rather than bacterial, DNA on to the bead matrix.21 Saglani et al.12 did not report pleural fluid white blood cell counts for comparison. However, Le Monnier et al.13 reported pleural fluid white blood cell counts slightly higher than those observed in our patients. Thus, differences in pleural fluid white blood cell counts do not necessarily explain the differences in yield across studies. Fourth, while the universal primers used in our study have been validated, including for detection of S. aureus, in previous studies,14 Saglani et al.12 and Le Monnier et al.13 each used a different set of primers. It is unclear whether or not the choice of different primers affected the microbiologic yield.
An important limitation of this study is the relatively small number of patients with pleural fluid available for PCR testing combined with the low PCR yield. This limitation may have caused us to underestimate the true benefit of 16S rRNA PCR as an ancillary diagnostic test, as suggested by the wide confidence intervals around the estimates of PCR yield. Additionally, not all patients underwent pleural drainage, and not all patients undergoing pleural drainage had pleural fluid available for PCR testing. The latter issue would likely have only minimal impact on our study results, as there were no differences in demographics or clinical or laboratory features among those with and without pleural fluid available for PCR testing. However, differences among physicians, and across institutions, may play an important role in the decision to perform pleural drainage. We do not know whether patients undergoing pleural drainage at our institution were more or less likely to have bacteria detected by PCR than patients not undergoing drainage. If they were more likely to have bacteria detected, then our study would underestimate the benefit of PCR as an adjunct diagnostic test. However, there was no difference in the duration of antibiotic pretreatment between these two groups, and the yield from blood culture was similar.
In conclusion, blood and pleural fluid cultures infrequently identify the causative bacteria in children with complicated pneumonia. The use of broad‐range PCR increased the microbiologic yield only modestly. Further refinements to improve the diagnostic accuracy of broad‐range PCR testing are needed before this technique can be recommended for widespread use in clinical practice.
Appendix
Optimization and Validation of The 16S Assay
The assay was optimized for use with pleural fluid samples as follows. E. coli (ATCC 25922) and S. aureus (ATCC 29213) were grown overnight in 100 ml Brain Heart Infusion (BHI) broth. A suspension equivalent to a 0.5 MacFarland standard was prepared and was taken to represent approximately 1 108 colony‐forming units/mL. To prepare standard PCR curves, 1 in 10 dilutions were prepared in PBS (pH, 7.4) and DNA was extracted, in triplicate, using two different DNA extraction methods: the MagMAX Total Nucleic Acid Isolation Kit and the PrepMan Ultra Sample Preparation reagent system (Applied Biosystems, Foster City, CA), as described by the manufacturer. For the MagMax extraction, a 300 microliter sample was added to 200 microliters of lysis/binding solution in a bead tube. Samples were disrupted using a vortex adapter for 15 minutes at the highest setting. Tubes were then centrifuged at 16,000 relative centrifugal force (RCF) for three minutes. DNA extraction was performed using the KingFisher Flex Automated Purification System (Thermo Scientific). For the PrepMan Ultra extraction, a 300‐l sample was centrifuged for three minutes at 16,000 RCF. The supernatant fluid was discarded and the pellet was resuspended in 100 microliters of PrepMan Ultra Lysis Buffer and incubated at 100C for ten minutes. The sample was centrifuged for three minutes at 16,000 RCF, and a 10‐microliter aliquot of supernatant fluid was added to 90 microliters of nuclease free water. All DNA extracts were frozen at 20C prior to use. Plate counts, performed from the bacterial suspensions in triplicate, revealed approximately 1.3 108 colony‐forming units/mL in the original suspensions.
Pleural fluid samples were spiked with known concentrations (1, 3, 10, 30, 100, 300, and 1000 colony‐forming units/mL) of E. coli and S. aureus, and each sample was extracted five times with both DNA extraction systems. Each DNA extract was amplified on an Applied Biosystems 7500 thermal cycler (ABI) and a SmartCycler (Cepheid, Sunnyvale, CA). Analysis of the results obtained from the preliminary experiments indicated that the following combination of DNA extraction and PCR was optimal, and these conditions were used for all patient samples.
DNA was extracted from a 300‐microliter aliquot of pleural fluid using the MagMAX Total Nucleic Acid Isolation Kit (Ambion, Applied Biosystems) as described by the manufacturer. PCR was performed on an Applied Biosystems 7500 thermal cycler (ABI) using the primers, 16S F: 5‐GCT GTC ATC TCT TGT GGG CTG T‐3, 16S R: 5‐AAA CTC ATG GGA GCT GCT GGT T‐3, and the fluorescent labeled TaqMan probe, 16s Probe: 5‐Cy5/CCT GTC ATG CCC ACA CAA ATC TCT CC/BHQ‐2‐3. Human DNA (0.5 nanograms) was added to each assay to ensure that an adequate amount of human DNA was available to act as an internal amplification control. The primers, AlbICF: 5‐GCT GTC ATC TCT TGT GGG CTG T‐3, AlbICR: 5‐AAA CTC ATG GGA GCT GCT GGT T‐3, and the TaqMan probe, AlbICP: 5‐Cy5/CCT GTC ATG CCC ACA CAA ATC TCT CC/BHQ‐2‐3 detect a region of the human albumin gene. Amplification was performed as follows: initial denaturation of 94C for 20 seconds, followed by 35 cycles of 94C for 10 seconds, 61C for 31 seconds, and 72C for 5 seconds. Each run included positive (E. coli ATCC 25922 DNA) and negative (nuclease free water) controls. A cycle threshold value of 30 or less indicated a positive sample. All positive samples were confirmed using the MicroSeq 500 16S rDNA Bacterial Identification kit (Applied Biosystems).
- ,,, et al.An epidemiological investigation of a sustained high rate of pediatric parapneumonic empyema: risk factors and microbiological associations.Clin Infect Dis.2002;34:434–440.
- ,,,,.Primary early thoracoscopy and reduction in length of hospital stay and additional procedures among children with complicated pneumonia: results of a multicenter retrospective cohort study.Arch Pediatr Adolesc Med.2008;162:675–681.
- ,,, et al.Pulmonary manifestations in children with invasive community‐acquired Staphylococcus aureus infection.Clin Infect Dis.2005;41:583–590.
- ,,, et al.Association between Staphylococcus aureus strains carrying gene for Panton‐Valentine leukocidin and highly lethal necrotising pneumonia in young immunocompetent patients.Lancet.2002;359:753–759.
- ,,, et al.Severe community‐onset pneumonia in healthy adults caused by methicillin‐resistant Staphylococcus aureus carrying the Panton‐Valentine leukocidin genes.Clin Infect Dis.2005;40:100–107.
- ,.Empyema hospitalizations increased in US children despite pneumococcal conjugate vaccine.Pediatrics.2010;125:26–33.
- ,,,.Increasing incidence of empyema complicating childhood community‐acquired pneumonia in the United States.Clin Infect Dis.2010;50:805–813.
- ,,,,.National hospitalization trends for pediatric pneumonia and associated complications.Pediatrics.2010;126:204–213.
- ,,, et al.Thoracoscopic decortication vs tube thoracostomy with fibrinolysis for empyema in children: a prospective, randomized trial.J Pediatr Surg.2009;44:106–111.
- ,,, et al.Comparison of urokinase and video‐assisted thoracoscopic surgery for treatment of childhood empyema.Am J Respir Crit Care Med.2006;174:221–227.
- ,.Development of broad‐range 16S rDNA PCR for use in the routine diagnostic clinical microbiology service.J Med Microbiol.2003;52:685–691.
- ,,,.Empyema: the use of broad range 16S rDNA PCR for pathogen detection.Arch Dis Child.2005;90:70–73.
- ,,, et al.Microbiological diagnosis of empyema in children: comparative evaluations by culture, polymerase chain reaction, and pneumococcal antigen detection in pleural fluids.Clin Infect Dis.2006;42:1135–1140.
- ,,,.Determination of bacterial load by real‐time PCR using a broad‐range (universal) probe and primers set.Microbiology.2002;148:257–266.
- ,,,,,.Pneumolysin polymerase chain reaction for diagnosis of pneumococcal pneumonia and empyema in children.Eur J Clin Microbiol Infect Dis.2006;25:783–789.
- ,,, et al.Pleural fluid PCR method for detection of Staphylococcus aureus, Streptococcus pneumoniae and Haemophilus influenzae in pediatric parapneumonic effusions.Respiration.2008;75:437–442.
- ,.16S rRNA gene sequencing for bacterial identification in the diagnostic laboratory: pluses, perils, and pitfalls.J Clin Microbiol.2007;45:2761–2764.
- ,,,,.Evaluating the near‐term infant for early onset sepsis: progress and challenges to consider with 16S rDNA polymerase chain reaction testing.J Mol Diagn.2006;8:357–363.
- ,,,,.Preanalytic removal of human DNA eliminates false signals in general 16S rDNA PCR monitoring of bacterial pathogens in blood.Comp Immunol Microbiol Infect Dis.2009;32:207–219.
- ,,,,.Use of broad range16S rDNA PCR in clinical microbiology.J Microbiol Methods.2009;76:217–225.
- ,.Real‐time polymerase chain reaction for detecting bacterial DNA directly from blood of neonates being evaluated for sepsis.J Mol Diagn.2005;7:575–581.
Community‐acquired pneumonia (CAP), the most common serious bacterial infection in childhood, may be complicated by parapneumonic effusion (ie, complicated pneumonia).1, 2 The clinical outcome of children with complicated pneumonia is directly influenced by the causative organism, and precise identification of the infectious agent has the potential to improve clinical management.35 The incidence of complicated pneumonia has recently increased, highlighting the need to better understand the reasons for this changing epidemiology.68 However, using conventional bacterial culture, bacteria are isolated from clinical samples obtained from children with complicated pneumonia in only 17%42% of cases.1, 9, 10 The low rate of positive culture results may be related to stringent bacterial growth requirements or to administration of broad‐spectrum antibiotics before obtaining blood or pleural fluid samples for culture.
Unlike bacterial culture, polymerase chain reaction (PCR) relies on the detection of bacterial DNA rather than on the recovery of viable bacteria and is therefore less affected by the prior administration of antibiotics. Broad‐range or universal primer 16S rRNA PCR detects a conserved region of the 16S ribosomal RNA (rRNA) gene and can detect a wide range of bacterial species with a single assay.11 However, few studies have evaluated the role of 16S rRNA PCR in detecting bacteria in the pleural fluid of children with complicated pneumonia.12, 13 The purpose of this study was to determine the frequency of positive blood and pleural fluid cultures in children with complicated pneumonia, and to determine whether broad‐range 16S rRNA PCR can increase the proportion of children with an identifiable microbiologic cause of complicated pneumonia.
Methods
Study Design, Setting, and Participants
This prospective cohort study was conducted at The Children's Hospital of Philadelphia (CHOP), an urban tertiary care children's hospital. The proposal was approved by the CHOP Committees for the Protection of Human Subjects. Patients were eligible for participation if they were 18 years of age, admitted to the hospital between October 1, 2007 and March 31, 2010, and diagnosed with complicated pneumonia. Parental informed consent was obtained for all patients, and verbal assent was obtained for all children over seven years of age. Patients with chronic medical conditions predisposing them to severe or recurrent pneumonia, such as human immunodeficiency virus, malignancy, and sickle cell disease, were excluded. The study team had no role in the clinical management of study patients. As this test is still considered experimental, pleural fluid 16S rRNA PCR was not performed until the patient was discharged from the hospital; these test results were not shared with the treating physicians.
Study Definition
Complicated pneumonia was defined by a temperature >38.0C, and the presence of lung parenchymal infiltrates and pleural effusions of any size or character on chest radiography or computed tomography.
Microbiologic MethodsConventional Culture
Pleural fluid or blood (4 mL) was inoculated onto a single pediatric BacT/Alert FAN bottle (BioMrieux, Durham, NC) which was immediately transported to the laboratory at room temperature. Additional pleural fluid was also submitted to the laboratory for a cytospin Gram stain. Once received in the laboratory, the bottles were immediately loaded into the BacT/Alert instrument. Bottles were automatically checked by the instrument for production of CO2 every ten minutes, and remained in the instrument for a total of five days. Bottles flagged as positive by the BacT/Alert system were removed from the instrument, subcultured to agar plates, and Gram stained. Bacterial isolates were identified and the antibiotic susceptibility tested by conventional methods following Clinical and Laboratory Standards Institute guidelines.
Microbiological Methods16S rRNA PCR
The 16S rRNA primers and probe used in this study have been validated previously and have been used extensively for the identification of organisms from the Domain Bacteria.14 Escherichia coli (ATCC 25922) and Staphylococcus aureus (ATCC 29213) were used as Gram‐negative and Gram‐positive controls, respectively. DNA extraction was performed on a 300 l aliquot of pleural fluid using the MagMAX Total Nucleic Acid Isolation Kit (Applied Biosystems, Foster City, CA). Samples were disrupted using a Vortex adapter for 15 minutes at the highest setting. Tubes were then centrifuged at 16,000 relative centrifugal force (RCF) for three minutes, and DNA extraction was performed using the KingFisher Flex Automated Purification System (Thermo Scientific, Waltham, MA). All DNA extracts were frozen at 20C prior to use. Details of the 16S rRNA PCR assay optimization and validation appear in the Appendix.
DNA was amplified on an Applied Biosystems 7500 thermal cycler (ABI, Foster City, CA) using the primers, 16S F: 5‐GCT GTC ATC TCT TGT GGG CTG T‐3, 16S R: 5‐AAA CTC ATG GGA GCT GCT GGT T‐3, and the fluorescent labeled TaqMan probe, 16s Probe: 5‐Cy5/CCT GTC ATG CCC ACA CAA ATC TCT CC/BHQ‐2‐3. Human DNA (0.5 nanograms) was added to each assay as a standardized internal amplification control. The primers, AlbICF: 5‐GCT GTC ATC TCT TGT GGG CTG T‐3, AlbICR: 5‐AAA CTC ATG GGA GCT GCT GGT T‐3, and the TaqMan probe, AlbICP: 5‐Cy5/CCT GTC ATG CCC ACA CAA ATC TCT CC/BHQ‐2‐3 detect a region of the human albumin gene. Amplification was performed as follows: initial denaturation of 94C for 20 seconds, followed by 35 cycles of 94C for 10 seconds, 61C for 31 seconds, and 72C for 5 seconds. Each run included positive (E. coli ATCC 25922 DNA) and negative (nuclease free water) controls. A cycle threshold value of 30 or less indicated a positive sample. All positive samples were confirmed using the MicroSeq 500 16S rDNA Bacterial Identification kit (Applied Biosystems).
DNA Sequencing
DNA sequencing was performed directly on PCR products using an ABI 3730 with the BigDye Taq FS Terminator V3.1. Sequencing was completed at the University of Pennsylvania DNA Sequencing Facility, and sequence identification was performed by BLAST at the National Center for Biotechnology Information web site (
Statistical Analysis
Data were analyzed using STATA 10.0 (Stata Corp., College Station, TX). Categorical variables were described using frequencies and percentages, and were compared using the chi‐square test. Continuous variables were described using mean, median, intraquartile range (IQR), and range values. Binomial exact 95% confidence intervals (CIs) were calculated for the proportion of positive blood and pleural fluid cultures and pleural fluid 16S rRNA PCR tests.
Results
During the study period, 124 patients with complicated pneumonia were identified; the median age was 4.9 years (IQR, 2.78.8 years) and the ratio of female to male patients was 1:1. The racial distribution was as follows: non‐Hispanic white, 62 (50%); non‐Hispanic black, 43 (34%); and Hispanic, 7 (6%). The median length of stay was 11 days (range, 240 days; IQR, 811 days). Forty‐one (33.1%) patients were admitted to the intensive care unit, and nine (7.3%) patients required mechanical ventilation. Overall, 5 of the 71 blood cultures performed (7.0%; 95% CI: 2.3%15.7%) were positive.
Pleural fluid drainage was performed in 64 (51.6%) patients. The median duration of antibiotic treatment before pleural fluid drainage was two days (IQR, 04 days). Differences in duration of antibiotic pretreatment between those with and without pleural fluid drainage were not significant. Patients received beta‐lactam agents (76.6%), clindamycin (51.6%), and vancomycin (23.4%) before pleural drainage. Blood cultures were performed in 27 (45.0%) of 60 patients not undergoing pleural fluid drainage; 2 of these 27 (7.4%; 95% CI: 0.9%24.3%) blood cultures were positive, and Streptococcus pneumoniae was isolated in both cases.
Using a combination of pleural fluid culture, blood culture, and broad‐range PCR, a microbiologic cause of infection was identified in 11 of 64 (17.2%; 95% CI: 8.9%28.7%) patients undergoing pleural fluid drainage (Figure 1). Patients with an identified bacterial cause were younger than those without an identified bacterial cause (Table 1). However, there were no statistically significant differences between the groups with and without identified bacteria with respect to sex, race, clinical examination findings and laboratory results at admission, duration of antibiotic therapy before pleural fluid drainage, or length of stay (Table 1). The median pleural fluid white blood cell count was 6880 per mm3 (IQR, 154227,918 per mm3).
| Causative Bacteria Identified | |||
|---|---|---|---|
| Demographics | Yes (n = 11) | No (n = 53) | P Value |
| |||
| Female sex | 3 (27.3%) | 29 (54.7%) | 0.10 |
| Age (years) | 2 (1.34.50) | 4.3 (3.1 8.1) | 0.03 |
| Race | 0.09 | ||
| Non‐Hispanic white | 3 (27.3%) | 29 (54.7%) | |
| Non‐Hispanic black | 7 (63.6%) | 13 (24.5%) | |
| Hispanic | 0 (0.0%) | 3 (5.6%) | |
| Other | 1 (9.1%) | 8 (15.1%) | |
| History of asthma | 2 (18.2%%) | 12 (22.6%) | 0.75 |
| Duration of antibiotics before drainage (days) | 0.5 (03) | 2 (04) | 0.43 |
| Intensive care unit admission | 7 (63.6%) | 25 (47.2%) | 0.32 |
| Initial temperature (C) | 37.8 (37.239.5) | 38.1 (37.639.3) | 0.76 |
| Initial oxygen saturation (%) | 94 (9397) | 95 (9396) | 0.97 |
| Peripheral white blood cell count (per mm3) | 21.4 (14.028.4) | 16.3 (10.922.6) | 0.12 |
| Platelet count (per mm3) | 434 (298546) | 402 (312575) | 0.95 |
Blood was obtained for culture from 44 (68.8%) of 64 patients that underwent pleural fluid drainage. Blood cultures were positive in three (6.8%; 95% CI: 1.4%18.7%) of these patients; causative bacteria were S. pneumoniae (n = 1), Haemophilus influenzae (n = 1), and Staphylococcus aureus (n = 1). Pleural fluid cultures were positive from 6 of 64 patients (9.3%; 95% CI: 3.5%19.3%) that underwent pleural fluid drainage; causative bacteria were Staphylococcus aureus (n = 5) and Streptococcus pneumoniae (n = 1). Three of the 19 pleural fluid samples (15.8%, CI 3.4%39.6%) tested by 16S rRNA PCR yielded positive results; S. pneumoniae was identified by DNA sequencing in all three of these samples (Figure 1). Of these three specimens, two had both negative Gram stains and negative pleural fluid cultures, while one specimen had Gram‐positive cocci in pairs identified on Gram stain along with a pleural fluid culture‐positive for S. pneumoniae. Of the 16 patients with negative PCR results, one was found to have a pleural fluid culture‐positive for S. aureus; no bacteria were detected on the pleural fluid Gram stain (Figure 1). Differences in the demographic characteristics between patients in whom broad‐range PCR was performed and not performed were not statistically significant (Table 2). Differences in the median length of hospital stay between patients who had PCR performed (9 days; IQR, 712 days) and those who did not (11 days; IQR, 914 days) were not statistically significant (P = 0.19). Antibiotic therapy was simplified from treatment with multiple antibiotics to a single antibiotic in each instance of a positive culture, though the number of positive cultures was too small to lead to meaningful reductions in antibiotic use or spectrum.
| PCR Performed | |||
|---|---|---|---|
| Demographics | Yes (N = 19) | No (N = 45) | P Value |
| |||
| Female sex | 9 (47.4) | 23 (51.1) | 0.78 |
| Age (years) | 4.9 (2.78.8) | 4.0 (2.88.1) | 0.76 |
| Race | 0.42 | ||
| Non‐Hispanic white | 10 (52.6%) | 22 (48.9%) | |
| Non‐Hispanic black | 5 (26.3%) | 15 (33.3%) | |
| Hispanic | 0 (0.0%) | 3 (6.7%) | |
| Other | 4 (21.1%) | 5 (11.1%) | |
| History of asthma | 5 (26.32%) | 9 (20.0%) | 0.58 |
| Duration of antibiotics before drainage (days) | 2 (03) | 1.5 (04) | 0.65 |
| Intensive care unit admission | 8 (42.1%) | 24 (53.3%) | 0.41 |
| Initial temperature (C) | 38.1 (37.339.4) | 38.0 (37.639.4) | 0.86 |
| Initial pulse oximetry (%) | 96 (9497) | 94 (9296) | 0.34 |
| Initial white blood cell count (1000 per mm3) | 16.1 (9.527.4) | 17.8 (12.622.8) | 0.93 |
| Platelet count (1000 per mm3) | 397 (312575) | 431 (303597) | 0.73 |
Discussion
Identification of the causative organism can improve the treatment of children with complicated pneumonia by enabling clinicians to target the infection with effective, narrow‐spectrum antibiotics. However, broad‐spectrum antibiotics are typically given before blood or pleural fluid samples are obtained, lowering the yield of conventional bacterial cultures. In our study, pleural fluid and blood cultures were infrequently positive. However, the use of 16S rRNA broad‐range PCR and DNA sequencing as ancillary tests only modestly improved our diagnostic yield.
Two prior studies have shown that broad‐range PCR analysis of pleural fluid can detect pathogenic organisms from pleural fluid even after the administration of antibiotics. Saglani et al.12 used bacterial culture and broad‐range PCR to analyze pleural fluid from 32 children with complicated pneumonia. Although the cohort had received a median of eight days of antibiotic therapy prior to fluid aspiration, a combination of broad‐range PCR and DNA sequencing identified organisms, predominantly S. pneumoniae, in 17 of 26 (65.4%) pleural fluid samples with negative culture. Five of the six culture‐positive samples also had positive PCR results, suggesting that a low proportion of the PCR results were false‐negatives. Le Monnier et al.13 cultured the pleural fluid from 78 children with complicated pneumonia; 15 samples were excluded from PCR testing because they grew bacteria other than S. pneumoniae. Broad‐range 16S rRNA PCR detected bacteria in 22 of 40 (55.0%) samples that were culture‐negative; subsequent DNA sequencing identified S. pneumoniae (n = 17), S. pyogenes (n = 3), S. aureus (n = 1), and H. influenzae (n = 1). S. pneumoniae was identified by 16S rRNA PCR followed by DNA sequencing in 20 of the 23 (87.0%) pleural fluid samples that grew S. pneumoniae on culture.
PCR with organism‐specific primers has also been shown to detect pathogenic bacteria in 35%70% of pleural fluid samples from patients with complicated pneumonia.15, 16 These rates of detection are comparable to the results of prior studies that used broad‐range PCR, and suggest that 16S rRNA and organism‐specific PCR are similarly sensitive tests.
Our study found that the proportion of positive results with broad‐range PCR was greater than the proportion observed with conventional pleural fluid culture. We were also able to identify S. pneumoniae by broad‐range PCR in two culture‐negative pleural fluid samples. The detection of S. pneumoniae by PCR in the setting of negative pleural fluid culture is not surprising, as most patients received empiric antibiotic therapy against S. pneumoniae before undergoing pleural fluid drainage. This prior antibiotic therapy would be expected to decrease the yield of pleural fluid culture but have a less significant impact on PCR. The reason for the failure to detect S. aureus by PCR from our clinical samples is not known. We explored whether this issue could be attributable to test characteristics during validation of our assay (as described in the technical Appendix), and S. aureus was consistently identified in pleural fluid samples spiked with S. aureus. While our diagnostic yield was low compared with prior studies that used broad‐range PCR, the distribution of causative bacteria was similar to prior studies of complicated pneumonia.9, 10 There were too few positive cultures among the specimens available for broad‐range PCR testing for us to reliably assess 16S rRNA PCR sensitivity and specificity. Thus, it was not possible to reliably assess the value of 16S rRNA PCR as an ancillary test in culture‐negative complicated pneumonia.
Several factors may have contributed to the low yield of broad‐range PCR in our study. First, all patients in our study received broad‐spectrum antibiotics prior to pleural fluid drainage; most patients received treatment with a beta‐lactam agent in combination with either clindamycin or vancomycin. Although PCR is less affected than culture by the prior administration of antibiotics, it is still possible that exposure to antibiotics accelerated degradation of the bacterial genome, thus decreasing the sensitivity of broad‐range PCR. The median duration of antibiotic therapy prior to drainage was shorter for patients in whom a bacterial pathogen was identified, compared with those in whom a pathogen was not identified. Though this difference was not statistically significant, this difference emphasizes that early pleural fluid collection may improve bacterial detection. The median duration of prior antibiotic therapy was eight days, in the study by Saglani et al.,12 however details regarding anti‐staphylococcal therapy were not reported. Second, several studies using 16S rRNA PCR in blood or cerebrospinal fluid (CSF) specimens for children with sepsis or meningitis, respectively, have noted decreased sensitivity for detection of Gram‐positive bacteria.1720 The cell wall composition makes Gram‐positive bacteria particularly difficult to lyse for DNA extraction. Prior studies used a different approach to DNA extraction compared with our study. Saglani et al.12 used the QIAmp minikit for DNA extraction (Qiagen Ltd, West Sussex, UK) and Le Monnier et al.13 used the MagnaPure System (Roche Diagnostics, Indianapolis, IN) for DNA extraction; additionally Saglani et al.12 included an additional 15 minutes of incubation at 95C following Proteinase K digestion to ensure complete lysis of the bacterial cells. We used the MagMAX Total Nucleic Acid Isolation Kit with a bead beating step to degrade the samples prior to lysis. It is unlikely that any of these differences contributed to differences in our study results. Third, human DNA may cause a nonspecific background signal, which could decrease PCR sensitivity. This issue may be particularly important in complicated pneumonia where the pleural fluid white blood cell counts are substantially elevated. Human DNA from white blood cells might be present at much higher concentrations than bacterial DNA, which would create a competitive advantage for binding of human, rather than bacterial, DNA on to the bead matrix.21 Saglani et al.12 did not report pleural fluid white blood cell counts for comparison. However, Le Monnier et al.13 reported pleural fluid white blood cell counts slightly higher than those observed in our patients. Thus, differences in pleural fluid white blood cell counts do not necessarily explain the differences in yield across studies. Fourth, while the universal primers used in our study have been validated, including for detection of S. aureus, in previous studies,14 Saglani et al.12 and Le Monnier et al.13 each used a different set of primers. It is unclear whether or not the choice of different primers affected the microbiologic yield.
An important limitation of this study is the relatively small number of patients with pleural fluid available for PCR testing combined with the low PCR yield. This limitation may have caused us to underestimate the true benefit of 16S rRNA PCR as an ancillary diagnostic test, as suggested by the wide confidence intervals around the estimates of PCR yield. Additionally, not all patients underwent pleural drainage, and not all patients undergoing pleural drainage had pleural fluid available for PCR testing. The latter issue would likely have only minimal impact on our study results, as there were no differences in demographics or clinical or laboratory features among those with and without pleural fluid available for PCR testing. However, differences among physicians, and across institutions, may play an important role in the decision to perform pleural drainage. We do not know whether patients undergoing pleural drainage at our institution were more or less likely to have bacteria detected by PCR than patients not undergoing drainage. If they were more likely to have bacteria detected, then our study would underestimate the benefit of PCR as an adjunct diagnostic test. However, there was no difference in the duration of antibiotic pretreatment between these two groups, and the yield from blood culture was similar.
In conclusion, blood and pleural fluid cultures infrequently identify the causative bacteria in children with complicated pneumonia. The use of broad‐range PCR increased the microbiologic yield only modestly. Further refinements to improve the diagnostic accuracy of broad‐range PCR testing are needed before this technique can be recommended for widespread use in clinical practice.
Appendix
Optimization and Validation of The 16S Assay
The assay was optimized for use with pleural fluid samples as follows. E. coli (ATCC 25922) and S. aureus (ATCC 29213) were grown overnight in 100 ml Brain Heart Infusion (BHI) broth. A suspension equivalent to a 0.5 MacFarland standard was prepared and was taken to represent approximately 1 108 colony‐forming units/mL. To prepare standard PCR curves, 1 in 10 dilutions were prepared in PBS (pH, 7.4) and DNA was extracted, in triplicate, using two different DNA extraction methods: the MagMAX Total Nucleic Acid Isolation Kit and the PrepMan Ultra Sample Preparation reagent system (Applied Biosystems, Foster City, CA), as described by the manufacturer. For the MagMax extraction, a 300 microliter sample was added to 200 microliters of lysis/binding solution in a bead tube. Samples were disrupted using a vortex adapter for 15 minutes at the highest setting. Tubes were then centrifuged at 16,000 relative centrifugal force (RCF) for three minutes. DNA extraction was performed using the KingFisher Flex Automated Purification System (Thermo Scientific). For the PrepMan Ultra extraction, a 300‐l sample was centrifuged for three minutes at 16,000 RCF. The supernatant fluid was discarded and the pellet was resuspended in 100 microliters of PrepMan Ultra Lysis Buffer and incubated at 100C for ten minutes. The sample was centrifuged for three minutes at 16,000 RCF, and a 10‐microliter aliquot of supernatant fluid was added to 90 microliters of nuclease free water. All DNA extracts were frozen at 20C prior to use. Plate counts, performed from the bacterial suspensions in triplicate, revealed approximately 1.3 108 colony‐forming units/mL in the original suspensions.
Pleural fluid samples were spiked with known concentrations (1, 3, 10, 30, 100, 300, and 1000 colony‐forming units/mL) of E. coli and S. aureus, and each sample was extracted five times with both DNA extraction systems. Each DNA extract was amplified on an Applied Biosystems 7500 thermal cycler (ABI) and a SmartCycler (Cepheid, Sunnyvale, CA). Analysis of the results obtained from the preliminary experiments indicated that the following combination of DNA extraction and PCR was optimal, and these conditions were used for all patient samples.
DNA was extracted from a 300‐microliter aliquot of pleural fluid using the MagMAX Total Nucleic Acid Isolation Kit (Ambion, Applied Biosystems) as described by the manufacturer. PCR was performed on an Applied Biosystems 7500 thermal cycler (ABI) using the primers, 16S F: 5‐GCT GTC ATC TCT TGT GGG CTG T‐3, 16S R: 5‐AAA CTC ATG GGA GCT GCT GGT T‐3, and the fluorescent labeled TaqMan probe, 16s Probe: 5‐Cy5/CCT GTC ATG CCC ACA CAA ATC TCT CC/BHQ‐2‐3. Human DNA (0.5 nanograms) was added to each assay to ensure that an adequate amount of human DNA was available to act as an internal amplification control. The primers, AlbICF: 5‐GCT GTC ATC TCT TGT GGG CTG T‐3, AlbICR: 5‐AAA CTC ATG GGA GCT GCT GGT T‐3, and the TaqMan probe, AlbICP: 5‐Cy5/CCT GTC ATG CCC ACA CAA ATC TCT CC/BHQ‐2‐3 detect a region of the human albumin gene. Amplification was performed as follows: initial denaturation of 94C for 20 seconds, followed by 35 cycles of 94C for 10 seconds, 61C for 31 seconds, and 72C for 5 seconds. Each run included positive (E. coli ATCC 25922 DNA) and negative (nuclease free water) controls. A cycle threshold value of 30 or less indicated a positive sample. All positive samples were confirmed using the MicroSeq 500 16S rDNA Bacterial Identification kit (Applied Biosystems).
- ,,, et al.An epidemiological investigation of a sustained high rate of pediatric parapneumonic empyema: risk factors and microbiological associations.Clin Infect Dis.2002;34:434–440.
- ,,,,.Primary early thoracoscopy and reduction in length of hospital stay and additional procedures among children with complicated pneumonia: results of a multicenter retrospective cohort study.Arch Pediatr Adolesc Med.2008;162:675–681.
- ,,, et al.Pulmonary manifestations in children with invasive community‐acquired Staphylococcus aureus infection.Clin Infect Dis.2005;41:583–590.
- ,,, et al.Association between Staphylococcus aureus strains carrying gene for Panton‐Valentine leukocidin and highly lethal necrotising pneumonia in young immunocompetent patients.Lancet.2002;359:753–759.
- ,,, et al.Severe community‐onset pneumonia in healthy adults caused by methicillin‐resistant Staphylococcus aureus carrying the Panton‐Valentine leukocidin genes.Clin Infect Dis.2005;40:100–107.
- ,.Empyema hospitalizations increased in US children despite pneumococcal conjugate vaccine.Pediatrics.2010;125:26–33.
- ,,,.Increasing incidence of empyema complicating childhood community‐acquired pneumonia in the United States.Clin Infect Dis.2010;50:805–813.
- ,,,,.National hospitalization trends for pediatric pneumonia and associated complications.Pediatrics.2010;126:204–213.
- ,,, et al.Thoracoscopic decortication vs tube thoracostomy with fibrinolysis for empyema in children: a prospective, randomized trial.J Pediatr Surg.2009;44:106–111.
- ,,, et al.Comparison of urokinase and video‐assisted thoracoscopic surgery for treatment of childhood empyema.Am J Respir Crit Care Med.2006;174:221–227.
- ,.Development of broad‐range 16S rDNA PCR for use in the routine diagnostic clinical microbiology service.J Med Microbiol.2003;52:685–691.
- ,,,.Empyema: the use of broad range 16S rDNA PCR for pathogen detection.Arch Dis Child.2005;90:70–73.
- ,,, et al.Microbiological diagnosis of empyema in children: comparative evaluations by culture, polymerase chain reaction, and pneumococcal antigen detection in pleural fluids.Clin Infect Dis.2006;42:1135–1140.
- ,,,.Determination of bacterial load by real‐time PCR using a broad‐range (universal) probe and primers set.Microbiology.2002;148:257–266.
- ,,,,,.Pneumolysin polymerase chain reaction for diagnosis of pneumococcal pneumonia and empyema in children.Eur J Clin Microbiol Infect Dis.2006;25:783–789.
- ,,, et al.Pleural fluid PCR method for detection of Staphylococcus aureus, Streptococcus pneumoniae and Haemophilus influenzae in pediatric parapneumonic effusions.Respiration.2008;75:437–442.
- ,.16S rRNA gene sequencing for bacterial identification in the diagnostic laboratory: pluses, perils, and pitfalls.J Clin Microbiol.2007;45:2761–2764.
- ,,,,.Evaluating the near‐term infant for early onset sepsis: progress and challenges to consider with 16S rDNA polymerase chain reaction testing.J Mol Diagn.2006;8:357–363.
- ,,,,.Preanalytic removal of human DNA eliminates false signals in general 16S rDNA PCR monitoring of bacterial pathogens in blood.Comp Immunol Microbiol Infect Dis.2009;32:207–219.
- ,,,,.Use of broad range16S rDNA PCR in clinical microbiology.J Microbiol Methods.2009;76:217–225.
- ,.Real‐time polymerase chain reaction for detecting bacterial DNA directly from blood of neonates being evaluated for sepsis.J Mol Diagn.2005;7:575–581.
Copyright © 2011 Society of Hospital Medicine
