User login
NQF Launches Interactive Quality-Measurement Tool
Quality-minded hospitalists now have a new research tool at their disposal. In the past few weeks, the National Quality Forum (NQF) unveiled a beta-test version of its Quality Positioning System (QPS), a searchable and interactive database of NQF-endorsed quality measures on a host of medical topics.
The database, which won’t have an official launch until 2012, allows users to create lists of measurements or view lists that other institutions have put together, dubbed portfolios. The idea is that as more users post public portfolios, the more physicians across the country can see what measures work where.
“This is a brand-new tool, so we’re starting to see more and more portfolios created,” said Diane Stollenwerk, MPP, NQF’s vice president of community alliances. “The more people who use the portfolio function in QPS, the more valuable the portfolios and QPS will become for end users.”
HM groups can use the site to create private portfolios that can be shared just among group members. NQF will provide automatic updates on those measures a user is interested in, giving the site an interactive feature. Stollenwerk says future added value in the site will be pushed in part by user feedback. She is hopeful that users will not only create lists of which measures they use, but also comment on their experience in using those measures in specific situations.
“A foundational role QPS can play is simply creating a shared space for people to have the conversation,” Stollenwerk adds.
In the Literature: Research You Need to Know
Clinical question: What is the prognostic influence of atrial fibrillation in patients with acute myocardial infarction?
Background: There have been conflicting reports regarding the prognostic impact of atrial fibrillation (AF) in patients with acute myocardial infarction (MI). This study represents the first meta-analysis performed to quantify the mortality risk associated with AF in MI patients.
Study design: Meta-analysis of observational studies.
Setting: Forty-three studies involving 278,854 patients diagnosed with MI from 1972 to 2000.
Synopsis: The odds ratio (OR) of mortality associated with AF in MI patients was 1.46 (95% confidence interval, 1.35 to 1.58, I2=76%, 23 studies). Although there was significant heterogeneity in included studies, in subgroup analysis, the significant association between AF and mortality was present whether the AF was new (defined as occurring for the first time within one week of MI) with OR of 1.37 (95% confidence interval, 1.26 to 1.49; I2=28%, nine studies) or old (defined as pre-existing before the MI admission) with OR of 1.28 (95% confidence interval, 1.16 to 1.40, I2=24%, four studies). Sensitivity analyses performed by pooling studies according to follow-up duration and adjustment for confounding clinical factors had little effect on the estimates.
Bottom line: AF was associated with increased mortality in patients with MI regardless of the timing of AF development.
Citation: Jabre P, Roger VL, Murad MH, et al. Mortality associated with atrial fibrillation in patients with myocardial infarction. Circulation. 2011;123:1587-1593.
For more physician reviews of HM-related literature, visit our website.
Stroke Risk Surges After 10 Years in Diabetes Patients
SAN DIEGO – The risk of ischemic stroke more than triples in patients with a 10-year history of diabetes, according to results of the population-based Northern Manhattan Study.
Ischemic stroke has long been associated with diabetes, but a large, longitudinal study enabled investigators to explore how risk changes over time, Dr. Julio R. Vieira said at the annual meeting of the American Neurological Association.
Columbia University researchers followed 3,298 multiethnic patients who had no prior history of stroke, assessing for diabetes at baseline and annually, beginning in 1993.
At baseline, the mean age of subjects was 69 years (range, 59-79). More than half were Hispanic, with 24% black and 21% white.
Initially, 717 patients (22%) had diabetes and 338 (10%) developed new-onset diabetes over the course of the study.
During a median of 9 years of follow-up, 244 patients were diagnosed with ischemic stroke.
In Cox proportional hazards models, patients with diabetes at baseline faced a 2.5-fold increased risk of having an ischemic stroke during the study period. Among those patients and those who developed de novo diabetes, the risk of ischemic stroke rose over time. Risk was elevated 70% among patients with diabetes for 5 years or less, 80% for those with a 5- to 10-year history of diabetes, and 3.3-fold for those with at least a 10-year history of the disease.
The majority of patients in the study had type 2 diabetes, said Dr. Vieira during an interview following his presentation during a cardiovascular group session at the meeting.
Although risk of ischemic stroke was present from the start in diabetic patients, it did not triple for a decade, he stressed in the interview.
"Diabetes, like hypertension and all of the other risk factors for cardiovascular disease, takes a while to really cause big damage," he said. "That’s exactly what we’re seeing here."
To Dr. Vieira, a research fellow at the Neurological Institute of New York at Columbia University, the message for physicians and patients alike is, "You have a lot of time for intervention."
He said that in his own experience, warning diabetic patients of impending problems with their eyes, hearts, or extremities does not always seem to get their attention.
Perhaps it would be more sobering to tell them that they have 10 years to get the disease under control, or face a tripling of their risk of a potentially fatal or disabling stroke, he speculated.
"Maybe people will get the message," he said.
Dr. Vieira and all coinvestigators, except one, had no relevant disclosures. The principal investigator of the study, Dr. Mitchell Elkind, reported serving as a consultant to Bristol-Myers Squibb and Tethys Bioscience; serving on speakers’ bureaus for Boehringer-Ingelheim, Bristol-Myers Squibb/Sanofi Pharmaceuticals Partnership, and Genentech; and receiving research support from diaDexus, Bristol-Myers Squibb/Sanofi Pharmaceuticals Partnership, and the National Institute for Neurological Disorders and Stroke (NINDS). He also has given expert testimony on behalf of Novartis and GlaxoSmithKline for stroke litigation. The study is supported by a grant from NINDS.
FROM THE ANNUAL MEETING OF THE AMERICAN NEUROLOGICAL ASSOCIATION
Major Finding: Study participants with at least a 10-year history of diabetes had more than three times greater risk for stroke than did participants without diabetes.
Data Source: The Northern Manhattan Study, a population-based, longitudinal study of 3,298 people.
Disclosures: Dr. Vieira and all coinvestigators, except one, had no relevant disclosures. The principal investigator of the study, Dr. Mitchell Elkind, reported serving as a consultant to Bristol-Myers Squibb and Tethys Bioscience; serving on speakers’ bureaus for Boehringer-Ingelheim, Bristol-Myers Squibb/Sanofi Pharmaceuticals Partnership, and Genentech; and receiving research support from diaDexus, Bristol-Myers Squibb/Sanofi Pharmaceuticals Partnership, and the National Institute for Neurological Disorders and Stroke (NINDS). He also has given expert testimony on behalf of Novartis and GlaxoSmithKline for stroke litigation. The study is supported by a grant from NINDS.
PHM Strategic Planning Roundtable
Hospitalists are the fastest growing segment of physicians in the United States.1 Given the growing field of Pediatric Hospital Medicine (PHM) and the need to define strategic direction, the Society of Hospital Medicine (SHM), the American Academy of Pediatrics (AAP), and the Academic Pediatric Association (APA) sponsored a strategic planning meeting in February 2009 that brought together 22 PHM leaders to discuss the future of the field.
PHM is at a critical juncture in terms of clinical practice, research, workforce issues, and quality improvement. The field has developed sufficiently to produce leaders capable of setting an agenda and moving forward. A discussion with the American Board of Pediatrics (ABP) by PHM leaders from the AAP, APA, and SHM at the Pediatric Hospital Medicine 2007 Conference regarding subspecialty designation stimulated convening the PHM Strategic Planning Roundtable to address the task of coordinating further development of PHM (Table 1).
|
| Develop a strategic vision for the role of PHM in the future of children's health care |
| Describe the current gaps between the vision and today's reality |
| Develop a common understanding regarding current initiatives in PHM domains of clinical practice, quality, research, and workforce |
| Determine the method(s) by which participants can be organized to accomplish additional initiatives to implement the vision |
| Identify and prioritize key strategic initiatives |
| Assign accountability and determine next steps and timeline to implement the selected initiatives |
The objective of this article is to describe: (1) the Strategic Planning Roundtable's vision for the field of pediatric hospital medicine; (2) the generation and progress on specific initiatives in clinical practice, quality, research, and workforce identified by the Strategic Planning Roundtable; and (3) issues in the designation of PHM as a subspecialty.
METHODS
The PHM Strategic Planning Roundtable was conducted by a facilitator (S.M.) during a 2‐day retreat using established healthcare strategic planning methods.2
Participants were the existing PHM leaders from the AAP, APA, and SHM, as well as other national leaders in clinical practice, quality, research, and workforce. Development of the vision statement was a key step in which the participants developed a consensus‐based aspirational view of the future. The draft version of the vision statement was initially developed after extensive interviews with key stakeholders and experts in PHM, and was revised by the participants in the course of a facilitated group discussion during the retreat. Following creation of the vision statement, the group then defined the elements of transformation pertaining to PHM and detailed the components of the vision.
Analysis of internal and external environmental factors was critical in the strategic planning process. This type of analysis, detailing the current state of PHM practice, permitted the strategic planners to understand the gaps that existed between the aspirational vision statement and today's reality, and set the stage to identify and implement initiatives to achieve the vision. Several months before the meeting, 4 expert panels comprised of PHM specialists representing a variety of academic and clinical practice settings were brought together via e‐mail and conference calls to focus on 4 domains of PHM: clinical practice, quality of care, research, and workforce. These groups were asked to describe the current status, challenges, and opportunities in these areas. Combining literature review and key stakeholder interviews, their findings and recommendations were distilled into brief summaries that were presented at the Roundtable meeting. Following the presentations, the participants, working in small groups representing all areas of focus,provided additional feedback.
Following the creation of a consensus vision statement and review of internal and external factors, the participants worked to identify specific initiatives in the 4 domains that would advance the field towards the goals contained in the vision statement. These initiatives were grouped into categories. Initiatives by category were scored and prioritized according to predetermined criteria including potential impact, cost, operational complexity, and achievability.
For each initiative selected, the group developed targets and metrics that would be used to track progress. Assigning leadership, accountability, and a timeline to each of the selected projects completed the implementation plan. In addition, the group developed an organizational structure to provide oversight for the overall process, and designated individuals representing the sponsoring organizations into those roles. In conclusion, the group discussed potential structures to guide the future of PHM.
CLINICAL PRACTICE
The Roundtable defined clinical practice for PHM as the general medical care of the hospitalized child, including direct patient care and leadership of the inpatient service. Clinical practice is affected by a number of current national trends including: fewer primary care providers interested in, or with the time to provide, inpatient care; resident work hour restrictions; increasing complexity of clinical issues; and increasing availability of pediatric hospitalists. At the hospital level, clinical practice is affected by increasing need for quality and safety measures, electronic health records and computerized physician order entry, and mounting financial pressures on the hospital system. Hospitalists are assuming more roles in leading quality and safety initiatives, creating computerized systems that address children's needs, and creating financially viable systems of quality pediatric care.3 Hospitalists' clinical care and leadership roles are emerging, and therefore the field faces training and mentorship issues.
Progress to date in this area includes 2 textbooks that define a scope of knowledge and practice, and a newly developed journal in PHM. Core competencies in PHM have been published and provide further refinement of scope and a template for future training.4
Multiple opportunities exist for hospitalists to establish themselves as clinical leaders. Hospitalists can become the preferred providers for hospitalized chronically ill children, with specific initiatives to improve care coordination and multidisciplinary communication. In addition to care coordination and decreasing length of stay, hospitalists, with their intimate knowledge of hospital operations, can be leaders in hospital capacity management and patient flow to increase operational efficiency. Hospitalists can expand evidence‐based guidelines for, and data about, inpatient conditions, and explore the effect of workload and hours on patient care. In addition, there is an expanding role into administrative areas, as well as alternate care arenas, such as: intensive care support (pediatric and neonatal), transport, sedation, palliative care, and pain management. Activities in administrative and alternate care areas have profound direct affects on patient care, as well as providing value added services and additional revenue streams which can further support clinical needs. Finally, achieving quality targets will likely be increasingly linked to payment, so hospitalists may play a key role in the incentives paid to their hospitals. Meeting these challenges will further solidify the standing of hospitalists in the clinical realm.
QUALITY
National and governmental agencies have influenced quality and performance improvement measurements in adult healthcare, resulting in improvements in adult healthcare quality measurement.5 There is limited similar influence or measure development in pediatric medicine, so the quality chasm between adult and child healthcare has widened. Few resources are invested in improving quality and safety of pediatric inpatient care. Of the 18 private health insurance plans' quality and pay for performance programs identified by Leapfrog, only 17% developed pediatric‐specific inpatient measures.6 Only 5 of 40 controlled trials of quality improvement efforts for children published between 1980 and 1998 addressed inpatient problems.7
There have been recent efforts at the national level addressing these issues, highlighted by the introduction of The Children's Health Care Quality Act, in 2007. Early studies in PHM systems focused on overall operational efficiency, documenting 9% to 16% decreases in length of stay and cost compared to traditional models of care.8 Conway et al. identified higher reported adherence to evidence‐based care for hospitalists compared to community pediatricians.9 However, Landrigan et al. demonstrated that there is still large variation in care that exists in the management of common inpatient diagnoses, lacking strong evidence‐based guidelines even among pediatric hospitalists.10 Moreover, there have been no significant studies reviewing the impact of pediatric hospitalists on safety of inpatient care. Magnifying these challenges is the reality that our healthcare system is fragmented with various entities scrambling to define, measure, and compare the effectiveness and safety of pediatric healthcare.
These challenges create an opportunity for PHM to develop a model of how to deliver the highest quality and safest care to our patients. The solution is complex and will take cooperation at many levels of our healthcare system. Improving the safety and quality of care for children in all settings of inpatient care in the United States may best be accomplished via an effective collaborative. This collaborative should be comprehensive and inclusive, and focused on demonstrating and disseminating how standardized, evidence‐based care in both clinical and safety domains can lead to high‐value and high‐quality outcomes. The success of PHM will be measured by its ability to deliver a clear value proposition to all consumers and payers of healthcare. The creation of a robust national collaborative network is a first step towards meeting this goal and will take an extraordinary effort. A PHM Quality Improvement (QI) Collaborative workgroup was created in August 2009. Three collaboratives have been commissioned: (1) Reduction of patient identification errors; (2) Improving discharge communication to referring primary care providers for pediatric hospitalist programs, and (3) Reducing the misuse and overuse of bronchodilators for bronchiolitis. All the collaborative groups have effectively engaged key groups of stakeholders and utilized standard QI tools, demonstrating improvement by the fall of 2010 (unpublished data, S.N.).
RESEARCH
Despite being a relatively young field, there is a critical mass of pediatric hospitalist‐investigators who are establishing research career paths for themselves by securing external grant funding for their work, publishing, and receiving mentorship from largely non‐hospitalist mentors. Some hospitalists are now in a position to mentor junior investigators. These hospitalist‐investigators identified a collective goal of working together across multiple sites in a clinical research network. The goal is to conduct high‐quality studies and provide the necessary clinical information to allow practicing hospitalists to make better decisions regarding patient care. This new inpatient evidence‐base will have the added advantage of helping further define the field of PHM.
The Pediatric Research in Inpatient Settings Network (PRIS) was identified as the vehicle to accomplish these goals. A series of objectives were identified to redesign PRIS in order to accommodate and organize this new influx of hospitalist‐investigators. These objectives included having hospitalist‐investigators commit their time to the prioritization, design, and execution of multicenter studies, drafting new governance documents for PRIS, securing external funding, redefining the relationships of the 3 existing organizations that formed PRIS (AAP, APA, SHM), defining how new clinical sites could be added to PRIS, creating a pipeline for junior hospitalist‐investigators to transition to leadership roles, securing a data coordinating center with established expertise in conducting multicenter studies, and establishing an external research advisory committee of leaders in pediatric clinical research and QI.
Several critical issues were identified, but funding remained a priority for the sustainability of PRIS. Comparative effectiveness (CE) was recognized as a potential important source of future funding. Pediatric studies on CE (eg, surgery vs medical management) conducted by PRIS would provide important new data to allow hospitalists to practice evidence‐based medicine and to improve quality.
A Research Leadership Task Force was created with 4 members of the PHM Strategic Planning Roundtable to work on the identified issues. The APA leadership worked with PRIS to establish a new Executive Council (comprised of additional qualified hospitalist‐investigators). The Executive Council was charged with accomplishing the tasks outlined from the Strategic Planning Roundtable. They have created the governance documents and standard operating procedures necessary for PRIS to conduct multicenter studies, defined a strategic framework for PRIS including the mission, vision and values, and funding strategy. In February 2010, PRIS received a 3‐year award for over $1 million from the Child Health Corporation of America to both fund the infrastructure of PRIS and to conduct a Prioritization Project. The Prioritization Project seeks to identify the conditions that are costly, prevalent, and demonstrate high inter‐hospital variation in resource utilization, which signals either lack of high‐quality data upon which to base medical decisions, and/or an opportunity to standardize care across hospitals. Some of these conditions will warrant further investigation to define the evidence base, whereas other conditions may require implementation studies to reliably introduce evidence into practice. Members of the Executive Council received additional funding to investigate community settings, as most children are hospitalized outside of large children's hospitals. PRIS also reengaged all 3 societies (APA, AAP, and SHM) for support for the first face‐to‐face meeting of the Executive Council. PRIS applied for 2 Recovery Act stimulus grants, and received funding for both of approximately $12 million. The processes used to design, provide feedback, and shepherd these initial studies formed the basis for the standard operating procedures for the Network. PRIS is now reengaging its membership to establish how sites may be able to conduct research, and receive new ideas to be considered for study in PRIS.
Although much work remains to be done, the Executive Council is continuing the charge with quarterly face‐to‐face meetings, hiring of a full‐time PRIS Coordinator, and carrying out these initial projects, while maintaining the goal of meeting the needs of the membership and PHM. If PRIS is to accomplish its mission of improving the health of, and healthcare delivery to, hospitalized children and their families, then the types of studies undertaken will include not only original research questions, but also comparative implementation methods to better understand how hospitalists in a variety of settings can best translate research findings into clinical practice and ultimately improve patient outcomes.
WORKFORCE
The current number of pediatric hospitalists is difficult to gauge11; estimates range from 1500 to 3000 physicians. There are groups of pediatric hospitalists within several national organizations including the AAP, APA, and SHM, in addition to a very active listserve community. It is likely that only a portion of pediatric hospitalists are represented by membership in these organizations.
Most physicians entering the field of PHM come directly out of residency. A recent survey by Freed et al.12 reported that 3% of current pediatric residents are interested in PHM as a career. In another survey by Freed et al., about 6% of recent pediatric residency graduates reported currently practicing as pediatric hospitalists.13 This difference may indicate a number of pediatricians practicing transiently as pediatric hospitalists.
There are numerous issues that will affect the growth and sustainability of PHM. A large number of pediatric residents entering the field will be needed to maintain current numbers. With 45% of hospitalists in practice less than 3 years,11 the growth of PHM in both numbers and influence will require an increasing number of hospitalists with sustained careers in the field. Recognition as experts in inpatient care, as well as expansion of the role of hospitalists beyond the clinical realm to education, research, and hospital leadership, will foster long‐term career satisfaction. The increasingly common stature of hospital medicine as an independent division, equivalent to general pediatrics and subspecialty divisions within a department, may further bolster the perception of hospital medicine as a career.
The majority of pediatric hospitalists believe that current pediatric residency training does not provide all of the skills necessary to practice as a pediatric hospitalist,14 though there is disagreement regarding how additional training in pediatric hospital medicine should be achieved: a dedicated fellowship versus continuing medical education (CME). There are several initiatives with the potential to transform the way pediatric hospitalists are trained and certified. The Residency Review and Redesign Project indicates that pediatric residency is likely to be reformed to better meet the training demands of the individual resident's chosen career path. Changing residency to better prepare pediatric residents to take positions in pediatric hospital medicine will certainly affect the workforce emerging from residency programs and their subsequent training needs.15 The American Board of Internal Medicine and the American Board of Family Medicine have approved a Recognition of Focused Practice in Hospital Medicine. This recognition is gained through the Maintenance of Certification (MOC) Program of the respective boards after a minimum of 3 years of practice. SHM is offering fellow recognition in tiered designations of Fellow of Hospital Medicine (FHM), Senior Fellow of Hospital Medicine, and Master of Hospital Medicine. Five hundred hospitalists, including many pediatric hospitalists, received the inaugural FHM designation in 2009. Organizational recognition is a common process in many other medical fields, although previously limited in pediatrics to Fellow of the AAP. FHM is an important step, but cannot substitute for specific training and certification.
Academic fellowships in PHM will aid in the training of hospitalists with scholarly skills and will help produce more pediatric hospitalists with clinical, quality, administrative, and leadership skills. A model of subspecialty fellowship training and certification of all PHM physicians would require a several‐fold increase in available fellowships, currently approximately 15.
Ongoing CME offerings are also critical to sustaining and developing the workforce. The annual national meetings of the APA, AAP, and SHM all offer PHM‐dedicated content, and there is an annual PHM conference sponsored by these 3 organizations. There are now multiple additional national and regional meetings focused on PHM, reflecting the growing audience for PHM CME content. The AAP offers a PHM study guide and an Education in quality improvement for pediatric practice (eQIPP) module on inpatient asthma, specifically designed to facilitate the MOC process for pediatric hospitalists.
Some form of ABP recognition may be necessary to provide the status for PHM to be widely recognized as a viable academic career in the larger pediatric community. This would entail standardized fellowships that will ensure graduates have demonstrated proficiency in the core competencies. PHM leaders have engaged the ABP to better understand the subspecialty approval process and thoughtfully examine the ramifications of subspecialty status, specifically what subspecialty certification would mean for PHM providers and hospitals. Achieving ABP certification may create a new standard of care meaning that noncertified PHM providers will be at a disadvantage. It is unknown what the impact on pediatric inpatient care would be if a PHM standard was set without the supply of practitioners to provide that care.
STRUCTURE
The efforts of the Roundtable demonstrate the potential effectiveness of the current structure that guides the field: that of the cooperative interchange between the PHM leaders within the APA, AAP, and SHM. It may be that, similar to Pediatric Emergency Medicine (PEM), no formal, unifying structure is necessary. Alternatively, both Adolescent Medicine and Behavioral and Developmental Pediatrics (BDP) have their own organizations that guide their respective fields. A hybrid model is that of Pediatric Cardiology which has the Joint Council on Congenital Heart Disease. This structure assures that the leaders of the various organizations concerned with congenital heart disease meet at least annually to report on their activities and coordinate future efforts. Its makeup is similar to how the planning committee of the annual national PHM conference is constructed. Although PHM has largely succeeded with the current organizational structure, it is possible that a more formal structure is needed to continue forward.
CONCLUSION
The Roundtable members developed the following vision for PHM: Pediatric hospitalists will transform the delivery of hospital care for children. This will be done by achieving 7 goals (Table 2).
|
| We will ensure that care for hospitalized children is fully integrated and includes the medical home |
| We will design and support systems for children that eliminate harm associated with hospital care |
| We will develop a skilled and stable workforce that is the preferred provider of care for most hospitalized children |
| We will use collaborative research models to answer questions of clinical efficacy, comparative effectiveness, and quality improvement, and we will deliver care based on that knowledge |
| We will provide the expertise that supports continuing education in the care of the hospitalized child for pediatric hospitalists, trainees, midlevel providers, and hospital staff |
| We will create value for our patients and organizations in which we work based on our unique expertise in PHM clinical care, research, and education |
| We will be leaders and influential agents in national health care policies that impact hospital care |
Attaining this vision will take tremendous dedication, effort, and collaboration. As a starting point, the following initiatives were proposed and implemented as noted:
Clinical
-
Develop an educational plan supporting the PHM Core Competencies, addressing both hospitalist training needs and the role as formal educators.
-
Create a clinical practice monitoring dashboard template for use at PHM hospitals and practices (implemented July 2010).
Quality
-
Undertake environmental assessment of PHM participation on key quality and safety committees, societies, and agencies to ensure appropriate PHM representation in liaison and/or leadership positions.
-
Create a plan for a QI collaborative by assessing the needs and resources available; draft plans for 2 projects (1 safety and 1 quality) which will improve care for children hospitalized with common conditions (started July 2009).
Research
-
Create a collaborative research entity by restructuring the existing research network and formalizing relationships with affiliated networks.
-
Create a pipeline/mentorship system to increase the number of PHM researchers.
Workforce
-
Develop a descriptive statement that can be used by any PHM physician that defines the field of PHM and answers the question who are we?
-
Develop a communications tool describing value added of PHM.
-
Develop a tool to assess career satisfaction among PHM physicians, with links to current SHM work in this area.
Structure
-
Formalize an organizational infrastructure for oversight and guidance of PHM Strategic Planning Roundtable efforts, with clear delineation of the relationships with the AAP, APA, and SHM.
This review demonstrates the work that needs to be done to close the gaps between the current state of affairs and the full vision of the potential impact of PHM. Harm is still common in hospitalized children, and, as a group of physicians, we do not consistently provide evidence‐based care. Quality and safety activities are currently dispersed throughout multiple national entities often working in silos. Much of our PHM research is fragmented, with a lack of effective research networks and collaborative efforts. We also found that while our workforce has many strengths, it is not yet stable.
We believe the Roundtable was successful in describing the current state of PHM and laying a course for the future. We developed a series of deliverable products that have already seen success on many fronts, and that will serve as the foundation for further maturation of the field. We hope to engage the pediatric community, within and without PHM, to comment, advise, and foster PHM so that these efforts are not static but ongoing and evolving. Already, new challenges have arisen not addressed at the Roundtable, such as further resident work restrictions, and healthcare reform with its potential effects on hospital finances. This is truly an exciting and dynamic time, and we know that this is just the beginning.
Acknowledgements
The authors acknowledge the contribution of all members of the roundtable: Douglas Carlson, Vincent Chiang, Patrick Conway, Jennifer Daru, Matthew Garber, Christopher Landrigan, Patricia Lye, Sanjay Mahant, Jennifer Maniscalco, Sanford Melzer, Stephen Muething, Steve Narang, Mary Ottolini, Jack Percelay, Daniel Rauch, Mario Reyes, Beth Robbins, Jeff Sperring, Rajendu Srivastava, Erin Stucky, Lisa Zaoutis, and David Zipes. The authors thank David Zipes for his help in reviewing the manuscript.
- ,.The hospitalist movement 5 years later.JAMA.2002;287(4):487–494.
- ,,.The Physician Strategist: Setting Strategic Direction for Your Practice; Chicago, Irwin Professional Pub,1996.
- ,.Pediatric hospitalists: training, current practice, and career goals.J Hosp Med.2009;4(3):179–186.
- The Pediatric Core Competencies Supplement.J Hosp Med.2010;5(suppl 2):1–114.
- ,,,.Reauthorizing SCHIP: Opportunities for Promoting Effective Health Coverage and High Quality Care for Children and Adolescents. Publication 1051.New York, NY:The Commonwealth Fund; August2007:4.
- ,.National Association of Children's Hospitals. Quality Performance Measurement in Medicaid and SCHIP: Result of a 2006 National Survey of State Officials.Lansing, MI:Health Management Associates; August2006.
- ,,,.A report card on quality improvement for children's health care.Pediatrics.2001;107:143–155.
- ,,, et al.Impact of a hospitalist system on length of stay and cost for children with common conditions.Pediatrics.2007;120(2):267–274.
- ,,,,,.Variations in management of common inpatient pediatric illnesses: hospitalists and community pediatricians.Pediatrics.2006;118:441–447.
- ,,,,.Variation in pediatric hospitalists' use of unproven therapies: a study from the Pediatric Research in Inpatient Settings (PRIS) network.J Hosp Med.2008;3(4):292–298.
- ,,,.Characteristics of the pediatric hospitalist workforce: its roles and work environment.Pediatrics.2007;120(1):33–39.
- ,,,,.General pediatrics resident perspectives on training decisions and career choice.Pediatrics.2009;123(suppl 1):S26–S30.
- ,,,,.Recently trained general pediatricians: perspectives on residency training and scope of practice.Pediatrics.2009;123(suppl 1):S38–S43.
- ,,,.PRIS survey: pediatric hospitalist roles and training needs [abstract].Pediatr Res.2004(55):1.
- ,,.The Residency Review and Redesign in Pediatrics (R3P) Project: roots and branches.Pediatrics.2009;123(suppl 1):S8–S11.
Hospitalists are the fastest growing segment of physicians in the United States.1 Given the growing field of Pediatric Hospital Medicine (PHM) and the need to define strategic direction, the Society of Hospital Medicine (SHM), the American Academy of Pediatrics (AAP), and the Academic Pediatric Association (APA) sponsored a strategic planning meeting in February 2009 that brought together 22 PHM leaders to discuss the future of the field.
PHM is at a critical juncture in terms of clinical practice, research, workforce issues, and quality improvement. The field has developed sufficiently to produce leaders capable of setting an agenda and moving forward. A discussion with the American Board of Pediatrics (ABP) by PHM leaders from the AAP, APA, and SHM at the Pediatric Hospital Medicine 2007 Conference regarding subspecialty designation stimulated convening the PHM Strategic Planning Roundtable to address the task of coordinating further development of PHM (Table 1).
|
| Develop a strategic vision for the role of PHM in the future of children's health care |
| Describe the current gaps between the vision and today's reality |
| Develop a common understanding regarding current initiatives in PHM domains of clinical practice, quality, research, and workforce |
| Determine the method(s) by which participants can be organized to accomplish additional initiatives to implement the vision |
| Identify and prioritize key strategic initiatives |
| Assign accountability and determine next steps and timeline to implement the selected initiatives |
The objective of this article is to describe: (1) the Strategic Planning Roundtable's vision for the field of pediatric hospital medicine; (2) the generation and progress on specific initiatives in clinical practice, quality, research, and workforce identified by the Strategic Planning Roundtable; and (3) issues in the designation of PHM as a subspecialty.
METHODS
The PHM Strategic Planning Roundtable was conducted by a facilitator (S.M.) during a 2‐day retreat using established healthcare strategic planning methods.2
Participants were the existing PHM leaders from the AAP, APA, and SHM, as well as other national leaders in clinical practice, quality, research, and workforce. Development of the vision statement was a key step in which the participants developed a consensus‐based aspirational view of the future. The draft version of the vision statement was initially developed after extensive interviews with key stakeholders and experts in PHM, and was revised by the participants in the course of a facilitated group discussion during the retreat. Following creation of the vision statement, the group then defined the elements of transformation pertaining to PHM and detailed the components of the vision.
Analysis of internal and external environmental factors was critical in the strategic planning process. This type of analysis, detailing the current state of PHM practice, permitted the strategic planners to understand the gaps that existed between the aspirational vision statement and today's reality, and set the stage to identify and implement initiatives to achieve the vision. Several months before the meeting, 4 expert panels comprised of PHM specialists representing a variety of academic and clinical practice settings were brought together via e‐mail and conference calls to focus on 4 domains of PHM: clinical practice, quality of care, research, and workforce. These groups were asked to describe the current status, challenges, and opportunities in these areas. Combining literature review and key stakeholder interviews, their findings and recommendations were distilled into brief summaries that were presented at the Roundtable meeting. Following the presentations, the participants, working in small groups representing all areas of focus,provided additional feedback.
Following the creation of a consensus vision statement and review of internal and external factors, the participants worked to identify specific initiatives in the 4 domains that would advance the field towards the goals contained in the vision statement. These initiatives were grouped into categories. Initiatives by category were scored and prioritized according to predetermined criteria including potential impact, cost, operational complexity, and achievability.
For each initiative selected, the group developed targets and metrics that would be used to track progress. Assigning leadership, accountability, and a timeline to each of the selected projects completed the implementation plan. In addition, the group developed an organizational structure to provide oversight for the overall process, and designated individuals representing the sponsoring organizations into those roles. In conclusion, the group discussed potential structures to guide the future of PHM.
CLINICAL PRACTICE
The Roundtable defined clinical practice for PHM as the general medical care of the hospitalized child, including direct patient care and leadership of the inpatient service. Clinical practice is affected by a number of current national trends including: fewer primary care providers interested in, or with the time to provide, inpatient care; resident work hour restrictions; increasing complexity of clinical issues; and increasing availability of pediatric hospitalists. At the hospital level, clinical practice is affected by increasing need for quality and safety measures, electronic health records and computerized physician order entry, and mounting financial pressures on the hospital system. Hospitalists are assuming more roles in leading quality and safety initiatives, creating computerized systems that address children's needs, and creating financially viable systems of quality pediatric care.3 Hospitalists' clinical care and leadership roles are emerging, and therefore the field faces training and mentorship issues.
Progress to date in this area includes 2 textbooks that define a scope of knowledge and practice, and a newly developed journal in PHM. Core competencies in PHM have been published and provide further refinement of scope and a template for future training.4
Multiple opportunities exist for hospitalists to establish themselves as clinical leaders. Hospitalists can become the preferred providers for hospitalized chronically ill children, with specific initiatives to improve care coordination and multidisciplinary communication. In addition to care coordination and decreasing length of stay, hospitalists, with their intimate knowledge of hospital operations, can be leaders in hospital capacity management and patient flow to increase operational efficiency. Hospitalists can expand evidence‐based guidelines for, and data about, inpatient conditions, and explore the effect of workload and hours on patient care. In addition, there is an expanding role into administrative areas, as well as alternate care arenas, such as: intensive care support (pediatric and neonatal), transport, sedation, palliative care, and pain management. Activities in administrative and alternate care areas have profound direct affects on patient care, as well as providing value added services and additional revenue streams which can further support clinical needs. Finally, achieving quality targets will likely be increasingly linked to payment, so hospitalists may play a key role in the incentives paid to their hospitals. Meeting these challenges will further solidify the standing of hospitalists in the clinical realm.
QUALITY
National and governmental agencies have influenced quality and performance improvement measurements in adult healthcare, resulting in improvements in adult healthcare quality measurement.5 There is limited similar influence or measure development in pediatric medicine, so the quality chasm between adult and child healthcare has widened. Few resources are invested in improving quality and safety of pediatric inpatient care. Of the 18 private health insurance plans' quality and pay for performance programs identified by Leapfrog, only 17% developed pediatric‐specific inpatient measures.6 Only 5 of 40 controlled trials of quality improvement efforts for children published between 1980 and 1998 addressed inpatient problems.7
There have been recent efforts at the national level addressing these issues, highlighted by the introduction of The Children's Health Care Quality Act, in 2007. Early studies in PHM systems focused on overall operational efficiency, documenting 9% to 16% decreases in length of stay and cost compared to traditional models of care.8 Conway et al. identified higher reported adherence to evidence‐based care for hospitalists compared to community pediatricians.9 However, Landrigan et al. demonstrated that there is still large variation in care that exists in the management of common inpatient diagnoses, lacking strong evidence‐based guidelines even among pediatric hospitalists.10 Moreover, there have been no significant studies reviewing the impact of pediatric hospitalists on safety of inpatient care. Magnifying these challenges is the reality that our healthcare system is fragmented with various entities scrambling to define, measure, and compare the effectiveness and safety of pediatric healthcare.
These challenges create an opportunity for PHM to develop a model of how to deliver the highest quality and safest care to our patients. The solution is complex and will take cooperation at many levels of our healthcare system. Improving the safety and quality of care for children in all settings of inpatient care in the United States may best be accomplished via an effective collaborative. This collaborative should be comprehensive and inclusive, and focused on demonstrating and disseminating how standardized, evidence‐based care in both clinical and safety domains can lead to high‐value and high‐quality outcomes. The success of PHM will be measured by its ability to deliver a clear value proposition to all consumers and payers of healthcare. The creation of a robust national collaborative network is a first step towards meeting this goal and will take an extraordinary effort. A PHM Quality Improvement (QI) Collaborative workgroup was created in August 2009. Three collaboratives have been commissioned: (1) Reduction of patient identification errors; (2) Improving discharge communication to referring primary care providers for pediatric hospitalist programs, and (3) Reducing the misuse and overuse of bronchodilators for bronchiolitis. All the collaborative groups have effectively engaged key groups of stakeholders and utilized standard QI tools, demonstrating improvement by the fall of 2010 (unpublished data, S.N.).
RESEARCH
Despite being a relatively young field, there is a critical mass of pediatric hospitalist‐investigators who are establishing research career paths for themselves by securing external grant funding for their work, publishing, and receiving mentorship from largely non‐hospitalist mentors. Some hospitalists are now in a position to mentor junior investigators. These hospitalist‐investigators identified a collective goal of working together across multiple sites in a clinical research network. The goal is to conduct high‐quality studies and provide the necessary clinical information to allow practicing hospitalists to make better decisions regarding patient care. This new inpatient evidence‐base will have the added advantage of helping further define the field of PHM.
The Pediatric Research in Inpatient Settings Network (PRIS) was identified as the vehicle to accomplish these goals. A series of objectives were identified to redesign PRIS in order to accommodate and organize this new influx of hospitalist‐investigators. These objectives included having hospitalist‐investigators commit their time to the prioritization, design, and execution of multicenter studies, drafting new governance documents for PRIS, securing external funding, redefining the relationships of the 3 existing organizations that formed PRIS (AAP, APA, SHM), defining how new clinical sites could be added to PRIS, creating a pipeline for junior hospitalist‐investigators to transition to leadership roles, securing a data coordinating center with established expertise in conducting multicenter studies, and establishing an external research advisory committee of leaders in pediatric clinical research and QI.
Several critical issues were identified, but funding remained a priority for the sustainability of PRIS. Comparative effectiveness (CE) was recognized as a potential important source of future funding. Pediatric studies on CE (eg, surgery vs medical management) conducted by PRIS would provide important new data to allow hospitalists to practice evidence‐based medicine and to improve quality.
A Research Leadership Task Force was created with 4 members of the PHM Strategic Planning Roundtable to work on the identified issues. The APA leadership worked with PRIS to establish a new Executive Council (comprised of additional qualified hospitalist‐investigators). The Executive Council was charged with accomplishing the tasks outlined from the Strategic Planning Roundtable. They have created the governance documents and standard operating procedures necessary for PRIS to conduct multicenter studies, defined a strategic framework for PRIS including the mission, vision and values, and funding strategy. In February 2010, PRIS received a 3‐year award for over $1 million from the Child Health Corporation of America to both fund the infrastructure of PRIS and to conduct a Prioritization Project. The Prioritization Project seeks to identify the conditions that are costly, prevalent, and demonstrate high inter‐hospital variation in resource utilization, which signals either lack of high‐quality data upon which to base medical decisions, and/or an opportunity to standardize care across hospitals. Some of these conditions will warrant further investigation to define the evidence base, whereas other conditions may require implementation studies to reliably introduce evidence into practice. Members of the Executive Council received additional funding to investigate community settings, as most children are hospitalized outside of large children's hospitals. PRIS also reengaged all 3 societies (APA, AAP, and SHM) for support for the first face‐to‐face meeting of the Executive Council. PRIS applied for 2 Recovery Act stimulus grants, and received funding for both of approximately $12 million. The processes used to design, provide feedback, and shepherd these initial studies formed the basis for the standard operating procedures for the Network. PRIS is now reengaging its membership to establish how sites may be able to conduct research, and receive new ideas to be considered for study in PRIS.
Although much work remains to be done, the Executive Council is continuing the charge with quarterly face‐to‐face meetings, hiring of a full‐time PRIS Coordinator, and carrying out these initial projects, while maintaining the goal of meeting the needs of the membership and PHM. If PRIS is to accomplish its mission of improving the health of, and healthcare delivery to, hospitalized children and their families, then the types of studies undertaken will include not only original research questions, but also comparative implementation methods to better understand how hospitalists in a variety of settings can best translate research findings into clinical practice and ultimately improve patient outcomes.
WORKFORCE
The current number of pediatric hospitalists is difficult to gauge11; estimates range from 1500 to 3000 physicians. There are groups of pediatric hospitalists within several national organizations including the AAP, APA, and SHM, in addition to a very active listserve community. It is likely that only a portion of pediatric hospitalists are represented by membership in these organizations.
Most physicians entering the field of PHM come directly out of residency. A recent survey by Freed et al.12 reported that 3% of current pediatric residents are interested in PHM as a career. In another survey by Freed et al., about 6% of recent pediatric residency graduates reported currently practicing as pediatric hospitalists.13 This difference may indicate a number of pediatricians practicing transiently as pediatric hospitalists.
There are numerous issues that will affect the growth and sustainability of PHM. A large number of pediatric residents entering the field will be needed to maintain current numbers. With 45% of hospitalists in practice less than 3 years,11 the growth of PHM in both numbers and influence will require an increasing number of hospitalists with sustained careers in the field. Recognition as experts in inpatient care, as well as expansion of the role of hospitalists beyond the clinical realm to education, research, and hospital leadership, will foster long‐term career satisfaction. The increasingly common stature of hospital medicine as an independent division, equivalent to general pediatrics and subspecialty divisions within a department, may further bolster the perception of hospital medicine as a career.
The majority of pediatric hospitalists believe that current pediatric residency training does not provide all of the skills necessary to practice as a pediatric hospitalist,14 though there is disagreement regarding how additional training in pediatric hospital medicine should be achieved: a dedicated fellowship versus continuing medical education (CME). There are several initiatives with the potential to transform the way pediatric hospitalists are trained and certified. The Residency Review and Redesign Project indicates that pediatric residency is likely to be reformed to better meet the training demands of the individual resident's chosen career path. Changing residency to better prepare pediatric residents to take positions in pediatric hospital medicine will certainly affect the workforce emerging from residency programs and their subsequent training needs.15 The American Board of Internal Medicine and the American Board of Family Medicine have approved a Recognition of Focused Practice in Hospital Medicine. This recognition is gained through the Maintenance of Certification (MOC) Program of the respective boards after a minimum of 3 years of practice. SHM is offering fellow recognition in tiered designations of Fellow of Hospital Medicine (FHM), Senior Fellow of Hospital Medicine, and Master of Hospital Medicine. Five hundred hospitalists, including many pediatric hospitalists, received the inaugural FHM designation in 2009. Organizational recognition is a common process in many other medical fields, although previously limited in pediatrics to Fellow of the AAP. FHM is an important step, but cannot substitute for specific training and certification.
Academic fellowships in PHM will aid in the training of hospitalists with scholarly skills and will help produce more pediatric hospitalists with clinical, quality, administrative, and leadership skills. A model of subspecialty fellowship training and certification of all PHM physicians would require a several‐fold increase in available fellowships, currently approximately 15.
Ongoing CME offerings are also critical to sustaining and developing the workforce. The annual national meetings of the APA, AAP, and SHM all offer PHM‐dedicated content, and there is an annual PHM conference sponsored by these 3 organizations. There are now multiple additional national and regional meetings focused on PHM, reflecting the growing audience for PHM CME content. The AAP offers a PHM study guide and an Education in quality improvement for pediatric practice (eQIPP) module on inpatient asthma, specifically designed to facilitate the MOC process for pediatric hospitalists.
Some form of ABP recognition may be necessary to provide the status for PHM to be widely recognized as a viable academic career in the larger pediatric community. This would entail standardized fellowships that will ensure graduates have demonstrated proficiency in the core competencies. PHM leaders have engaged the ABP to better understand the subspecialty approval process and thoughtfully examine the ramifications of subspecialty status, specifically what subspecialty certification would mean for PHM providers and hospitals. Achieving ABP certification may create a new standard of care meaning that noncertified PHM providers will be at a disadvantage. It is unknown what the impact on pediatric inpatient care would be if a PHM standard was set without the supply of practitioners to provide that care.
STRUCTURE
The efforts of the Roundtable demonstrate the potential effectiveness of the current structure that guides the field: that of the cooperative interchange between the PHM leaders within the APA, AAP, and SHM. It may be that, similar to Pediatric Emergency Medicine (PEM), no formal, unifying structure is necessary. Alternatively, both Adolescent Medicine and Behavioral and Developmental Pediatrics (BDP) have their own organizations that guide their respective fields. A hybrid model is that of Pediatric Cardiology which has the Joint Council on Congenital Heart Disease. This structure assures that the leaders of the various organizations concerned with congenital heart disease meet at least annually to report on their activities and coordinate future efforts. Its makeup is similar to how the planning committee of the annual national PHM conference is constructed. Although PHM has largely succeeded with the current organizational structure, it is possible that a more formal structure is needed to continue forward.
CONCLUSION
The Roundtable members developed the following vision for PHM: Pediatric hospitalists will transform the delivery of hospital care for children. This will be done by achieving 7 goals (Table 2).
|
| We will ensure that care for hospitalized children is fully integrated and includes the medical home |
| We will design and support systems for children that eliminate harm associated with hospital care |
| We will develop a skilled and stable workforce that is the preferred provider of care for most hospitalized children |
| We will use collaborative research models to answer questions of clinical efficacy, comparative effectiveness, and quality improvement, and we will deliver care based on that knowledge |
| We will provide the expertise that supports continuing education in the care of the hospitalized child for pediatric hospitalists, trainees, midlevel providers, and hospital staff |
| We will create value for our patients and organizations in which we work based on our unique expertise in PHM clinical care, research, and education |
| We will be leaders and influential agents in national health care policies that impact hospital care |
Attaining this vision will take tremendous dedication, effort, and collaboration. As a starting point, the following initiatives were proposed and implemented as noted:
Clinical
-
Develop an educational plan supporting the PHM Core Competencies, addressing both hospitalist training needs and the role as formal educators.
-
Create a clinical practice monitoring dashboard template for use at PHM hospitals and practices (implemented July 2010).
Quality
-
Undertake environmental assessment of PHM participation on key quality and safety committees, societies, and agencies to ensure appropriate PHM representation in liaison and/or leadership positions.
-
Create a plan for a QI collaborative by assessing the needs and resources available; draft plans for 2 projects (1 safety and 1 quality) which will improve care for children hospitalized with common conditions (started July 2009).
Research
-
Create a collaborative research entity by restructuring the existing research network and formalizing relationships with affiliated networks.
-
Create a pipeline/mentorship system to increase the number of PHM researchers.
Workforce
-
Develop a descriptive statement that can be used by any PHM physician that defines the field of PHM and answers the question who are we?
-
Develop a communications tool describing value added of PHM.
-
Develop a tool to assess career satisfaction among PHM physicians, with links to current SHM work in this area.
Structure
-
Formalize an organizational infrastructure for oversight and guidance of PHM Strategic Planning Roundtable efforts, with clear delineation of the relationships with the AAP, APA, and SHM.
This review demonstrates the work that needs to be done to close the gaps between the current state of affairs and the full vision of the potential impact of PHM. Harm is still common in hospitalized children, and, as a group of physicians, we do not consistently provide evidence‐based care. Quality and safety activities are currently dispersed throughout multiple national entities often working in silos. Much of our PHM research is fragmented, with a lack of effective research networks and collaborative efforts. We also found that while our workforce has many strengths, it is not yet stable.
We believe the Roundtable was successful in describing the current state of PHM and laying a course for the future. We developed a series of deliverable products that have already seen success on many fronts, and that will serve as the foundation for further maturation of the field. We hope to engage the pediatric community, within and without PHM, to comment, advise, and foster PHM so that these efforts are not static but ongoing and evolving. Already, new challenges have arisen not addressed at the Roundtable, such as further resident work restrictions, and healthcare reform with its potential effects on hospital finances. This is truly an exciting and dynamic time, and we know that this is just the beginning.
Acknowledgements
The authors acknowledge the contribution of all members of the roundtable: Douglas Carlson, Vincent Chiang, Patrick Conway, Jennifer Daru, Matthew Garber, Christopher Landrigan, Patricia Lye, Sanjay Mahant, Jennifer Maniscalco, Sanford Melzer, Stephen Muething, Steve Narang, Mary Ottolini, Jack Percelay, Daniel Rauch, Mario Reyes, Beth Robbins, Jeff Sperring, Rajendu Srivastava, Erin Stucky, Lisa Zaoutis, and David Zipes. The authors thank David Zipes for his help in reviewing the manuscript.
- ,.The hospitalist movement 5 years later.JAMA.2002;287(4):487–494.
- ,,.The Physician Strategist: Setting Strategic Direction for Your Practice; Chicago, Irwin Professional Pub,1996.
- ,.Pediatric hospitalists: training, current practice, and career goals.J Hosp Med.2009;4(3):179–186.
- The Pediatric Core Competencies Supplement.J Hosp Med.2010;5(suppl 2):1–114.
- ,,,.Reauthorizing SCHIP: Opportunities for Promoting Effective Health Coverage and High Quality Care for Children and Adolescents. Publication 1051.New York, NY:The Commonwealth Fund; August2007:4.
- ,.National Association of Children's Hospitals. Quality Performance Measurement in Medicaid and SCHIP: Result of a 2006 National Survey of State Officials.Lansing, MI:Health Management Associates; August2006.
- ,,,.A report card on quality improvement for children's health care.Pediatrics.2001;107:143–155.
- ,,, et al.Impact of a hospitalist system on length of stay and cost for children with common conditions.Pediatrics.2007;120(2):267–274.
- ,,,,,.Variations in management of common inpatient pediatric illnesses: hospitalists and community pediatricians.Pediatrics.2006;118:441–447.
- ,,,,.Variation in pediatric hospitalists' use of unproven therapies: a study from the Pediatric Research in Inpatient Settings (PRIS) network.J Hosp Med.2008;3(4):292–298.
- ,,,.Characteristics of the pediatric hospitalist workforce: its roles and work environment.Pediatrics.2007;120(1):33–39.
- ,,,,.General pediatrics resident perspectives on training decisions and career choice.Pediatrics.2009;123(suppl 1):S26–S30.
- ,,,,.Recently trained general pediatricians: perspectives on residency training and scope of practice.Pediatrics.2009;123(suppl 1):S38–S43.
- ,,,.PRIS survey: pediatric hospitalist roles and training needs [abstract].Pediatr Res.2004(55):1.
- ,,.The Residency Review and Redesign in Pediatrics (R3P) Project: roots and branches.Pediatrics.2009;123(suppl 1):S8–S11.
Diagnosis of Complicated Pneumonia
Community‐acquired pneumonia (CAP), the most common serious bacterial infection in childhood, may be complicated by parapneumonic effusion (ie, complicated pneumonia).1, 2 The clinical outcome of children with complicated pneumonia is directly influenced by the causative organism, and precise identification of the infectious agent has the potential to improve clinical management.35 The incidence of complicated pneumonia has recently increased, highlighting the need to better understand the reasons for this changing epidemiology.68 However, using conventional bacterial culture, bacteria are isolated from clinical samples obtained from children with complicated pneumonia in only 17%42% of cases.1, 9, 10 The low rate of positive culture results may be related to stringent bacterial growth requirements or to administration of broad‐spectrum antibiotics before obtaining blood or pleural fluid samples for culture.
Unlike bacterial culture, polymerase chain reaction (PCR) relies on the detection of bacterial DNA rather than on the recovery of viable bacteria and is therefore less affected by the prior administration of antibiotics. Broad‐range or universal primer 16S rRNA PCR detects a conserved region of the 16S ribosomal RNA (rRNA) gene and can detect a wide range of bacterial species with a single assay.11 However, few studies have evaluated the role of 16S rRNA PCR in detecting bacteria in the pleural fluid of children with complicated pneumonia.12, 13 The purpose of this study was to determine the frequency of positive blood and pleural fluid cultures in children with complicated pneumonia, and to determine whether broad‐range 16S rRNA PCR can increase the proportion of children with an identifiable microbiologic cause of complicated pneumonia.
Methods
Study Design, Setting, and Participants
This prospective cohort study was conducted at The Children's Hospital of Philadelphia (CHOP), an urban tertiary care children's hospital. The proposal was approved by the CHOP Committees for the Protection of Human Subjects. Patients were eligible for participation if they were 18 years of age, admitted to the hospital between October 1, 2007 and March 31, 2010, and diagnosed with complicated pneumonia. Parental informed consent was obtained for all patients, and verbal assent was obtained for all children over seven years of age. Patients with chronic medical conditions predisposing them to severe or recurrent pneumonia, such as human immunodeficiency virus, malignancy, and sickle cell disease, were excluded. The study team had no role in the clinical management of study patients. As this test is still considered experimental, pleural fluid 16S rRNA PCR was not performed until the patient was discharged from the hospital; these test results were not shared with the treating physicians.
Study Definition
Complicated pneumonia was defined by a temperature >38.0C, and the presence of lung parenchymal infiltrates and pleural effusions of any size or character on chest radiography or computed tomography.
Microbiologic MethodsConventional Culture
Pleural fluid or blood (4 mL) was inoculated onto a single pediatric BacT/Alert FAN bottle (BioMrieux, Durham, NC) which was immediately transported to the laboratory at room temperature. Additional pleural fluid was also submitted to the laboratory for a cytospin Gram stain. Once received in the laboratory, the bottles were immediately loaded into the BacT/Alert instrument. Bottles were automatically checked by the instrument for production of CO2 every ten minutes, and remained in the instrument for a total of five days. Bottles flagged as positive by the BacT/Alert system were removed from the instrument, subcultured to agar plates, and Gram stained. Bacterial isolates were identified and the antibiotic susceptibility tested by conventional methods following Clinical and Laboratory Standards Institute guidelines.
Microbiological Methods16S rRNA PCR
The 16S rRNA primers and probe used in this study have been validated previously and have been used extensively for the identification of organisms from the Domain Bacteria.14 Escherichia coli (ATCC 25922) and Staphylococcus aureus (ATCC 29213) were used as Gram‐negative and Gram‐positive controls, respectively. DNA extraction was performed on a 300 l aliquot of pleural fluid using the MagMAX Total Nucleic Acid Isolation Kit (Applied Biosystems, Foster City, CA). Samples were disrupted using a Vortex adapter for 15 minutes at the highest setting. Tubes were then centrifuged at 16,000 relative centrifugal force (RCF) for three minutes, and DNA extraction was performed using the KingFisher Flex Automated Purification System (Thermo Scientific, Waltham, MA). All DNA extracts were frozen at 20C prior to use. Details of the 16S rRNA PCR assay optimization and validation appear in the Appendix.
DNA was amplified on an Applied Biosystems 7500 thermal cycler (ABI, Foster City, CA) using the primers, 16S F: 5‐GCT GTC ATC TCT TGT GGG CTG T‐3, 16S R: 5‐AAA CTC ATG GGA GCT GCT GGT T‐3, and the fluorescent labeled TaqMan probe, 16s Probe: 5‐Cy5/CCT GTC ATG CCC ACA CAA ATC TCT CC/BHQ‐2‐3. Human DNA (0.5 nanograms) was added to each assay as a standardized internal amplification control. The primers, AlbICF: 5‐GCT GTC ATC TCT TGT GGG CTG T‐3, AlbICR: 5‐AAA CTC ATG GGA GCT GCT GGT T‐3, and the TaqMan probe, AlbICP: 5‐Cy5/CCT GTC ATG CCC ACA CAA ATC TCT CC/BHQ‐2‐3 detect a region of the human albumin gene. Amplification was performed as follows: initial denaturation of 94C for 20 seconds, followed by 35 cycles of 94C for 10 seconds, 61C for 31 seconds, and 72C for 5 seconds. Each run included positive (E. coli ATCC 25922 DNA) and negative (nuclease free water) controls. A cycle threshold value of 30 or less indicated a positive sample. All positive samples were confirmed using the MicroSeq 500 16S rDNA Bacterial Identification kit (Applied Biosystems).
DNA Sequencing
DNA sequencing was performed directly on PCR products using an ABI 3730 with the BigDye Taq FS Terminator V3.1. Sequencing was completed at the University of Pennsylvania DNA Sequencing Facility, and sequence identification was performed by BLAST at the National Center for Biotechnology Information web site (
Statistical Analysis
Data were analyzed using STATA 10.0 (Stata Corp., College Station, TX). Categorical variables were described using frequencies and percentages, and were compared using the chi‐square test. Continuous variables were described using mean, median, intraquartile range (IQR), and range values. Binomial exact 95% confidence intervals (CIs) were calculated for the proportion of positive blood and pleural fluid cultures and pleural fluid 16S rRNA PCR tests.
Results
During the study period, 124 patients with complicated pneumonia were identified; the median age was 4.9 years (IQR, 2.78.8 years) and the ratio of female to male patients was 1:1. The racial distribution was as follows: non‐Hispanic white, 62 (50%); non‐Hispanic black, 43 (34%); and Hispanic, 7 (6%). The median length of stay was 11 days (range, 240 days; IQR, 811 days). Forty‐one (33.1%) patients were admitted to the intensive care unit, and nine (7.3%) patients required mechanical ventilation. Overall, 5 of the 71 blood cultures performed (7.0%; 95% CI: 2.3%15.7%) were positive.
Pleural fluid drainage was performed in 64 (51.6%) patients. The median duration of antibiotic treatment before pleural fluid drainage was two days (IQR, 04 days). Differences in duration of antibiotic pretreatment between those with and without pleural fluid drainage were not significant. Patients received beta‐lactam agents (76.6%), clindamycin (51.6%), and vancomycin (23.4%) before pleural drainage. Blood cultures were performed in 27 (45.0%) of 60 patients not undergoing pleural fluid drainage; 2 of these 27 (7.4%; 95% CI: 0.9%24.3%) blood cultures were positive, and Streptococcus pneumoniae was isolated in both cases.
Using a combination of pleural fluid culture, blood culture, and broad‐range PCR, a microbiologic cause of infection was identified in 11 of 64 (17.2%; 95% CI: 8.9%28.7%) patients undergoing pleural fluid drainage (Figure 1). Patients with an identified bacterial cause were younger than those without an identified bacterial cause (Table 1). However, there were no statistically significant differences between the groups with and without identified bacteria with respect to sex, race, clinical examination findings and laboratory results at admission, duration of antibiotic therapy before pleural fluid drainage, or length of stay (Table 1). The median pleural fluid white blood cell count was 6880 per mm3 (IQR, 154227,918 per mm3).
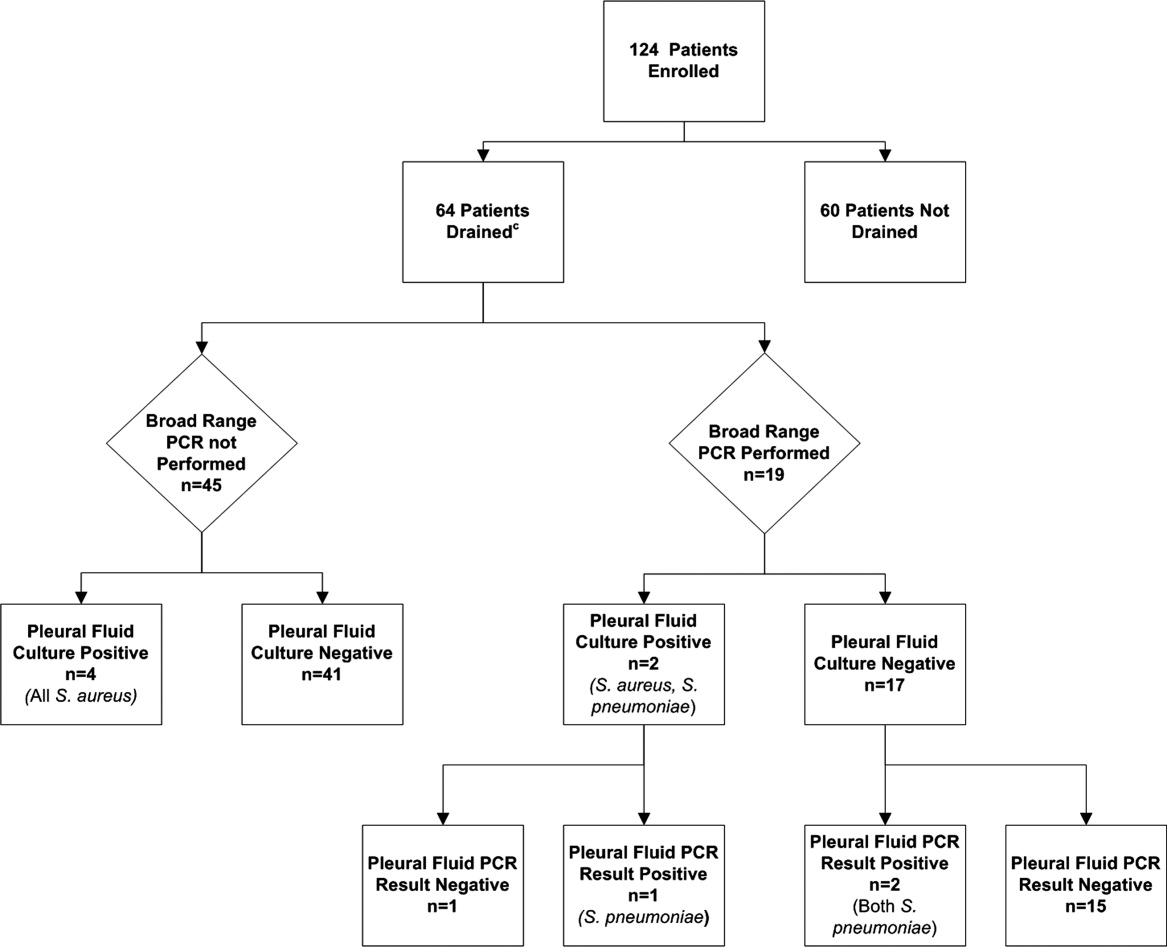
| Causative Bacteria Identified | |||
|---|---|---|---|
| Demographics | Yes (n = 11) | No (n = 53) | P Value |
| |||
| Female sex | 3 (27.3%) | 29 (54.7%) | 0.10 |
| Age (years) | 2 (1.34.50) | 4.3 (3.1 8.1) | 0.03 |
| Race | 0.09 | ||
| Non‐Hispanic white | 3 (27.3%) | 29 (54.7%) | |
| Non‐Hispanic black | 7 (63.6%) | 13 (24.5%) | |
| Hispanic | 0 (0.0%) | 3 (5.6%) | |
| Other | 1 (9.1%) | 8 (15.1%) | |
| History of asthma | 2 (18.2%%) | 12 (22.6%) | 0.75 |
| Duration of antibiotics before drainage (days) | 0.5 (03) | 2 (04) | 0.43 |
| Intensive care unit admission | 7 (63.6%) | 25 (47.2%) | 0.32 |
| Initial temperature (C) | 37.8 (37.239.5) | 38.1 (37.639.3) | 0.76 |
| Initial oxygen saturation (%) | 94 (9397) | 95 (9396) | 0.97 |
| Peripheral white blood cell count (per mm3) | 21.4 (14.028.4) | 16.3 (10.922.6) | 0.12 |
| Platelet count (per mm3) | 434 (298546) | 402 (312575) | 0.95 |
Blood was obtained for culture from 44 (68.8%) of 64 patients that underwent pleural fluid drainage. Blood cultures were positive in three (6.8%; 95% CI: 1.4%18.7%) of these patients; causative bacteria were S. pneumoniae (n = 1), Haemophilus influenzae (n = 1), and Staphylococcus aureus (n = 1). Pleural fluid cultures were positive from 6 of 64 patients (9.3%; 95% CI: 3.5%19.3%) that underwent pleural fluid drainage; causative bacteria were Staphylococcus aureus (n = 5) and Streptococcus pneumoniae (n = 1). Three of the 19 pleural fluid samples (15.8%, CI 3.4%39.6%) tested by 16S rRNA PCR yielded positive results; S. pneumoniae was identified by DNA sequencing in all three of these samples (Figure 1). Of these three specimens, two had both negative Gram stains and negative pleural fluid cultures, while one specimen had Gram‐positive cocci in pairs identified on Gram stain along with a pleural fluid culture‐positive for S. pneumoniae. Of the 16 patients with negative PCR results, one was found to have a pleural fluid culture‐positive for S. aureus; no bacteria were detected on the pleural fluid Gram stain (Figure 1). Differences in the demographic characteristics between patients in whom broad‐range PCR was performed and not performed were not statistically significant (Table 2). Differences in the median length of hospital stay between patients who had PCR performed (9 days; IQR, 712 days) and those who did not (11 days; IQR, 914 days) were not statistically significant (P = 0.19). Antibiotic therapy was simplified from treatment with multiple antibiotics to a single antibiotic in each instance of a positive culture, though the number of positive cultures was too small to lead to meaningful reductions in antibiotic use or spectrum.
| PCR Performed | |||
|---|---|---|---|
| Demographics | Yes (N = 19) | No (N = 45) | P Value |
| |||
| Female sex | 9 (47.4) | 23 (51.1) | 0.78 |
| Age (years) | 4.9 (2.78.8) | 4.0 (2.88.1) | 0.76 |
| Race | 0.42 | ||
| Non‐Hispanic white | 10 (52.6%) | 22 (48.9%) | |
| Non‐Hispanic black | 5 (26.3%) | 15 (33.3%) | |
| Hispanic | 0 (0.0%) | 3 (6.7%) | |
| Other | 4 (21.1%) | 5 (11.1%) | |
| History of asthma | 5 (26.32%) | 9 (20.0%) | 0.58 |
| Duration of antibiotics before drainage (days) | 2 (03) | 1.5 (04) | 0.65 |
| Intensive care unit admission | 8 (42.1%) | 24 (53.3%) | 0.41 |
| Initial temperature (C) | 38.1 (37.339.4) | 38.0 (37.639.4) | 0.86 |
| Initial pulse oximetry (%) | 96 (9497) | 94 (9296) | 0.34 |
| Initial white blood cell count (1000 per mm3) | 16.1 (9.527.4) | 17.8 (12.622.8) | 0.93 |
| Platelet count (1000 per mm3) | 397 (312575) | 431 (303597) | 0.73 |
Discussion
Identification of the causative organism can improve the treatment of children with complicated pneumonia by enabling clinicians to target the infection with effective, narrow‐spectrum antibiotics. However, broad‐spectrum antibiotics are typically given before blood or pleural fluid samples are obtained, lowering the yield of conventional bacterial cultures. In our study, pleural fluid and blood cultures were infrequently positive. However, the use of 16S rRNA broad‐range PCR and DNA sequencing as ancillary tests only modestly improved our diagnostic yield.
Two prior studies have shown that broad‐range PCR analysis of pleural fluid can detect pathogenic organisms from pleural fluid even after the administration of antibiotics. Saglani et al.12 used bacterial culture and broad‐range PCR to analyze pleural fluid from 32 children with complicated pneumonia. Although the cohort had received a median of eight days of antibiotic therapy prior to fluid aspiration, a combination of broad‐range PCR and DNA sequencing identified organisms, predominantly S. pneumoniae, in 17 of 26 (65.4%) pleural fluid samples with negative culture. Five of the six culture‐positive samples also had positive PCR results, suggesting that a low proportion of the PCR results were false‐negatives. Le Monnier et al.13 cultured the pleural fluid from 78 children with complicated pneumonia; 15 samples were excluded from PCR testing because they grew bacteria other than S. pneumoniae. Broad‐range 16S rRNA PCR detected bacteria in 22 of 40 (55.0%) samples that were culture‐negative; subsequent DNA sequencing identified S. pneumoniae (n = 17), S. pyogenes (n = 3), S. aureus (n = 1), and H. influenzae (n = 1). S. pneumoniae was identified by 16S rRNA PCR followed by DNA sequencing in 20 of the 23 (87.0%) pleural fluid samples that grew S. pneumoniae on culture.
PCR with organism‐specific primers has also been shown to detect pathogenic bacteria in 35%70% of pleural fluid samples from patients with complicated pneumonia.15, 16 These rates of detection are comparable to the results of prior studies that used broad‐range PCR, and suggest that 16S rRNA and organism‐specific PCR are similarly sensitive tests.
Our study found that the proportion of positive results with broad‐range PCR was greater than the proportion observed with conventional pleural fluid culture. We were also able to identify S. pneumoniae by broad‐range PCR in two culture‐negative pleural fluid samples. The detection of S. pneumoniae by PCR in the setting of negative pleural fluid culture is not surprising, as most patients received empiric antibiotic therapy against S. pneumoniae before undergoing pleural fluid drainage. This prior antibiotic therapy would be expected to decrease the yield of pleural fluid culture but have a less significant impact on PCR. The reason for the failure to detect S. aureus by PCR from our clinical samples is not known. We explored whether this issue could be attributable to test characteristics during validation of our assay (as described in the technical Appendix), and S. aureus was consistently identified in pleural fluid samples spiked with S. aureus. While our diagnostic yield was low compared with prior studies that used broad‐range PCR, the distribution of causative bacteria was similar to prior studies of complicated pneumonia.9, 10 There were too few positive cultures among the specimens available for broad‐range PCR testing for us to reliably assess 16S rRNA PCR sensitivity and specificity. Thus, it was not possible to reliably assess the value of 16S rRNA PCR as an ancillary test in culture‐negative complicated pneumonia.
Several factors may have contributed to the low yield of broad‐range PCR in our study. First, all patients in our study received broad‐spectrum antibiotics prior to pleural fluid drainage; most patients received treatment with a beta‐lactam agent in combination with either clindamycin or vancomycin. Although PCR is less affected than culture by the prior administration of antibiotics, it is still possible that exposure to antibiotics accelerated degradation of the bacterial genome, thus decreasing the sensitivity of broad‐range PCR. The median duration of antibiotic therapy prior to drainage was shorter for patients in whom a bacterial pathogen was identified, compared with those in whom a pathogen was not identified. Though this difference was not statistically significant, this difference emphasizes that early pleural fluid collection may improve bacterial detection. The median duration of prior antibiotic therapy was eight days, in the study by Saglani et al.,12 however details regarding anti‐staphylococcal therapy were not reported. Second, several studies using 16S rRNA PCR in blood or cerebrospinal fluid (CSF) specimens for children with sepsis or meningitis, respectively, have noted decreased sensitivity for detection of Gram‐positive bacteria.1720 The cell wall composition makes Gram‐positive bacteria particularly difficult to lyse for DNA extraction. Prior studies used a different approach to DNA extraction compared with our study. Saglani et al.12 used the QIAmp minikit for DNA extraction (Qiagen Ltd, West Sussex, UK) and Le Monnier et al.13 used the MagnaPure System (Roche Diagnostics, Indianapolis, IN) for DNA extraction; additionally Saglani et al.12 included an additional 15 minutes of incubation at 95C following Proteinase K digestion to ensure complete lysis of the bacterial cells. We used the MagMAX Total Nucleic Acid Isolation Kit with a bead beating step to degrade the samples prior to lysis. It is unlikely that any of these differences contributed to differences in our study results. Third, human DNA may cause a nonspecific background signal, which could decrease PCR sensitivity. This issue may be particularly important in complicated pneumonia where the pleural fluid white blood cell counts are substantially elevated. Human DNA from white blood cells might be present at much higher concentrations than bacterial DNA, which would create a competitive advantage for binding of human, rather than bacterial, DNA on to the bead matrix.21 Saglani et al.12 did not report pleural fluid white blood cell counts for comparison. However, Le Monnier et al.13 reported pleural fluid white blood cell counts slightly higher than those observed in our patients. Thus, differences in pleural fluid white blood cell counts do not necessarily explain the differences in yield across studies. Fourth, while the universal primers used in our study have been validated, including for detection of S. aureus, in previous studies,14 Saglani et al.12 and Le Monnier et al.13 each used a different set of primers. It is unclear whether or not the choice of different primers affected the microbiologic yield.
An important limitation of this study is the relatively small number of patients with pleural fluid available for PCR testing combined with the low PCR yield. This limitation may have caused us to underestimate the true benefit of 16S rRNA PCR as an ancillary diagnostic test, as suggested by the wide confidence intervals around the estimates of PCR yield. Additionally, not all patients underwent pleural drainage, and not all patients undergoing pleural drainage had pleural fluid available for PCR testing. The latter issue would likely have only minimal impact on our study results, as there were no differences in demographics or clinical or laboratory features among those with and without pleural fluid available for PCR testing. However, differences among physicians, and across institutions, may play an important role in the decision to perform pleural drainage. We do not know whether patients undergoing pleural drainage at our institution were more or less likely to have bacteria detected by PCR than patients not undergoing drainage. If they were more likely to have bacteria detected, then our study would underestimate the benefit of PCR as an adjunct diagnostic test. However, there was no difference in the duration of antibiotic pretreatment between these two groups, and the yield from blood culture was similar.
In conclusion, blood and pleural fluid cultures infrequently identify the causative bacteria in children with complicated pneumonia. The use of broad‐range PCR increased the microbiologic yield only modestly. Further refinements to improve the diagnostic accuracy of broad‐range PCR testing are needed before this technique can be recommended for widespread use in clinical practice.
Appendix
Optimization and Validation of The 16S Assay
The assay was optimized for use with pleural fluid samples as follows. E. coli (ATCC 25922) and S. aureus (ATCC 29213) were grown overnight in 100 ml Brain Heart Infusion (BHI) broth. A suspension equivalent to a 0.5 MacFarland standard was prepared and was taken to represent approximately 1 108 colony‐forming units/mL. To prepare standard PCR curves, 1 in 10 dilutions were prepared in PBS (pH, 7.4) and DNA was extracted, in triplicate, using two different DNA extraction methods: the MagMAX Total Nucleic Acid Isolation Kit and the PrepMan Ultra Sample Preparation reagent system (Applied Biosystems, Foster City, CA), as described by the manufacturer. For the MagMax extraction, a 300 microliter sample was added to 200 microliters of lysis/binding solution in a bead tube. Samples were disrupted using a vortex adapter for 15 minutes at the highest setting. Tubes were then centrifuged at 16,000 relative centrifugal force (RCF) for three minutes. DNA extraction was performed using the KingFisher Flex Automated Purification System (Thermo Scientific). For the PrepMan Ultra extraction, a 300‐l sample was centrifuged for three minutes at 16,000 RCF. The supernatant fluid was discarded and the pellet was resuspended in 100 microliters of PrepMan Ultra Lysis Buffer and incubated at 100C for ten minutes. The sample was centrifuged for three minutes at 16,000 RCF, and a 10‐microliter aliquot of supernatant fluid was added to 90 microliters of nuclease free water. All DNA extracts were frozen at 20C prior to use. Plate counts, performed from the bacterial suspensions in triplicate, revealed approximately 1.3 108 colony‐forming units/mL in the original suspensions.
Pleural fluid samples were spiked with known concentrations (1, 3, 10, 30, 100, 300, and 1000 colony‐forming units/mL) of E. coli and S. aureus, and each sample was extracted five times with both DNA extraction systems. Each DNA extract was amplified on an Applied Biosystems 7500 thermal cycler (ABI) and a SmartCycler (Cepheid, Sunnyvale, CA). Analysis of the results obtained from the preliminary experiments indicated that the following combination of DNA extraction and PCR was optimal, and these conditions were used for all patient samples.
DNA was extracted from a 300‐microliter aliquot of pleural fluid using the MagMAX Total Nucleic Acid Isolation Kit (Ambion, Applied Biosystems) as described by the manufacturer. PCR was performed on an Applied Biosystems 7500 thermal cycler (ABI) using the primers, 16S F: 5‐GCT GTC ATC TCT TGT GGG CTG T‐3, 16S R: 5‐AAA CTC ATG GGA GCT GCT GGT T‐3, and the fluorescent labeled TaqMan probe, 16s Probe: 5‐Cy5/CCT GTC ATG CCC ACA CAA ATC TCT CC/BHQ‐2‐3. Human DNA (0.5 nanograms) was added to each assay to ensure that an adequate amount of human DNA was available to act as an internal amplification control. The primers, AlbICF: 5‐GCT GTC ATC TCT TGT GGG CTG T‐3, AlbICR: 5‐AAA CTC ATG GGA GCT GCT GGT T‐3, and the TaqMan probe, AlbICP: 5‐Cy5/CCT GTC ATG CCC ACA CAA ATC TCT CC/BHQ‐2‐3 detect a region of the human albumin gene. Amplification was performed as follows: initial denaturation of 94C for 20 seconds, followed by 35 cycles of 94C for 10 seconds, 61C for 31 seconds, and 72C for 5 seconds. Each run included positive (E. coli ATCC 25922 DNA) and negative (nuclease free water) controls. A cycle threshold value of 30 or less indicated a positive sample. All positive samples were confirmed using the MicroSeq 500 16S rDNA Bacterial Identification kit (Applied Biosystems).
- ,,, et al.An epidemiological investigation of a sustained high rate of pediatric parapneumonic empyema: risk factors and microbiological associations.Clin Infect Dis.2002;34:434–440.
- ,,,,.Primary early thoracoscopy and reduction in length of hospital stay and additional procedures among children with complicated pneumonia: results of a multicenter retrospective cohort study.Arch Pediatr Adolesc Med.2008;162:675–681.
- ,,, et al.Pulmonary manifestations in children with invasive community‐acquired Staphylococcus aureus infection.Clin Infect Dis.2005;41:583–590.
- ,,, et al.Association between Staphylococcus aureus strains carrying gene for Panton‐Valentine leukocidin and highly lethal necrotising pneumonia in young immunocompetent patients.Lancet.2002;359:753–759.
- ,,, et al.Severe community‐onset pneumonia in healthy adults caused by methicillin‐resistant Staphylococcus aureus carrying the Panton‐Valentine leukocidin genes.Clin Infect Dis.2005;40:100–107.
- ,.Empyema hospitalizations increased in US children despite pneumococcal conjugate vaccine.Pediatrics.2010;125:26–33.
- ,,,.Increasing incidence of empyema complicating childhood community‐acquired pneumonia in the United States.Clin Infect Dis.2010;50:805–813.
- ,,,,.National hospitalization trends for pediatric pneumonia and associated complications.Pediatrics.2010;126:204–213.
- ,,, et al.Thoracoscopic decortication vs tube thoracostomy with fibrinolysis for empyema in children: a prospective, randomized trial.J Pediatr Surg.2009;44:106–111.
- ,,, et al.Comparison of urokinase and video‐assisted thoracoscopic surgery for treatment of childhood empyema.Am J Respir Crit Care Med.2006;174:221–227.
- ,.Development of broad‐range 16S rDNA PCR for use in the routine diagnostic clinical microbiology service.J Med Microbiol.2003;52:685–691.
- ,,,.Empyema: the use of broad range 16S rDNA PCR for pathogen detection.Arch Dis Child.2005;90:70–73.
- ,,, et al.Microbiological diagnosis of empyema in children: comparative evaluations by culture, polymerase chain reaction, and pneumococcal antigen detection in pleural fluids.Clin Infect Dis.2006;42:1135–1140.
- ,,,.Determination of bacterial load by real‐time PCR using a broad‐range (universal) probe and primers set.Microbiology.2002;148:257–266.
- ,,,,,.Pneumolysin polymerase chain reaction for diagnosis of pneumococcal pneumonia and empyema in children.Eur J Clin Microbiol Infect Dis.2006;25:783–789.
- ,,, et al.Pleural fluid PCR method for detection of Staphylococcus aureus, Streptococcus pneumoniae and Haemophilus influenzae in pediatric parapneumonic effusions.Respiration.2008;75:437–442.
- ,.16S rRNA gene sequencing for bacterial identification in the diagnostic laboratory: pluses, perils, and pitfalls.J Clin Microbiol.2007;45:2761–2764.
- ,,,,.Evaluating the near‐term infant for early onset sepsis: progress and challenges to consider with 16S rDNA polymerase chain reaction testing.J Mol Diagn.2006;8:357–363.
- ,,,,.Preanalytic removal of human DNA eliminates false signals in general 16S rDNA PCR monitoring of bacterial pathogens in blood.Comp Immunol Microbiol Infect Dis.2009;32:207–219.
- ,,,,.Use of broad range16S rDNA PCR in clinical microbiology.J Microbiol Methods.2009;76:217–225.
- ,.Real‐time polymerase chain reaction for detecting bacterial DNA directly from blood of neonates being evaluated for sepsis.J Mol Diagn.2005;7:575–581.
Community‐acquired pneumonia (CAP), the most common serious bacterial infection in childhood, may be complicated by parapneumonic effusion (ie, complicated pneumonia).1, 2 The clinical outcome of children with complicated pneumonia is directly influenced by the causative organism, and precise identification of the infectious agent has the potential to improve clinical management.35 The incidence of complicated pneumonia has recently increased, highlighting the need to better understand the reasons for this changing epidemiology.68 However, using conventional bacterial culture, bacteria are isolated from clinical samples obtained from children with complicated pneumonia in only 17%42% of cases.1, 9, 10 The low rate of positive culture results may be related to stringent bacterial growth requirements or to administration of broad‐spectrum antibiotics before obtaining blood or pleural fluid samples for culture.
Unlike bacterial culture, polymerase chain reaction (PCR) relies on the detection of bacterial DNA rather than on the recovery of viable bacteria and is therefore less affected by the prior administration of antibiotics. Broad‐range or universal primer 16S rRNA PCR detects a conserved region of the 16S ribosomal RNA (rRNA) gene and can detect a wide range of bacterial species with a single assay.11 However, few studies have evaluated the role of 16S rRNA PCR in detecting bacteria in the pleural fluid of children with complicated pneumonia.12, 13 The purpose of this study was to determine the frequency of positive blood and pleural fluid cultures in children with complicated pneumonia, and to determine whether broad‐range 16S rRNA PCR can increase the proportion of children with an identifiable microbiologic cause of complicated pneumonia.
Methods
Study Design, Setting, and Participants
This prospective cohort study was conducted at The Children's Hospital of Philadelphia (CHOP), an urban tertiary care children's hospital. The proposal was approved by the CHOP Committees for the Protection of Human Subjects. Patients were eligible for participation if they were 18 years of age, admitted to the hospital between October 1, 2007 and March 31, 2010, and diagnosed with complicated pneumonia. Parental informed consent was obtained for all patients, and verbal assent was obtained for all children over seven years of age. Patients with chronic medical conditions predisposing them to severe or recurrent pneumonia, such as human immunodeficiency virus, malignancy, and sickle cell disease, were excluded. The study team had no role in the clinical management of study patients. As this test is still considered experimental, pleural fluid 16S rRNA PCR was not performed until the patient was discharged from the hospital; these test results were not shared with the treating physicians.
Study Definition
Complicated pneumonia was defined by a temperature >38.0C, and the presence of lung parenchymal infiltrates and pleural effusions of any size or character on chest radiography or computed tomography.
Microbiologic MethodsConventional Culture
Pleural fluid or blood (4 mL) was inoculated onto a single pediatric BacT/Alert FAN bottle (BioMrieux, Durham, NC) which was immediately transported to the laboratory at room temperature. Additional pleural fluid was also submitted to the laboratory for a cytospin Gram stain. Once received in the laboratory, the bottles were immediately loaded into the BacT/Alert instrument. Bottles were automatically checked by the instrument for production of CO2 every ten minutes, and remained in the instrument for a total of five days. Bottles flagged as positive by the BacT/Alert system were removed from the instrument, subcultured to agar plates, and Gram stained. Bacterial isolates were identified and the antibiotic susceptibility tested by conventional methods following Clinical and Laboratory Standards Institute guidelines.
Microbiological Methods16S rRNA PCR
The 16S rRNA primers and probe used in this study have been validated previously and have been used extensively for the identification of organisms from the Domain Bacteria.14 Escherichia coli (ATCC 25922) and Staphylococcus aureus (ATCC 29213) were used as Gram‐negative and Gram‐positive controls, respectively. DNA extraction was performed on a 300 l aliquot of pleural fluid using the MagMAX Total Nucleic Acid Isolation Kit (Applied Biosystems, Foster City, CA). Samples were disrupted using a Vortex adapter for 15 minutes at the highest setting. Tubes were then centrifuged at 16,000 relative centrifugal force (RCF) for three minutes, and DNA extraction was performed using the KingFisher Flex Automated Purification System (Thermo Scientific, Waltham, MA). All DNA extracts were frozen at 20C prior to use. Details of the 16S rRNA PCR assay optimization and validation appear in the Appendix.
DNA was amplified on an Applied Biosystems 7500 thermal cycler (ABI, Foster City, CA) using the primers, 16S F: 5‐GCT GTC ATC TCT TGT GGG CTG T‐3, 16S R: 5‐AAA CTC ATG GGA GCT GCT GGT T‐3, and the fluorescent labeled TaqMan probe, 16s Probe: 5‐Cy5/CCT GTC ATG CCC ACA CAA ATC TCT CC/BHQ‐2‐3. Human DNA (0.5 nanograms) was added to each assay as a standardized internal amplification control. The primers, AlbICF: 5‐GCT GTC ATC TCT TGT GGG CTG T‐3, AlbICR: 5‐AAA CTC ATG GGA GCT GCT GGT T‐3, and the TaqMan probe, AlbICP: 5‐Cy5/CCT GTC ATG CCC ACA CAA ATC TCT CC/BHQ‐2‐3 detect a region of the human albumin gene. Amplification was performed as follows: initial denaturation of 94C for 20 seconds, followed by 35 cycles of 94C for 10 seconds, 61C for 31 seconds, and 72C for 5 seconds. Each run included positive (E. coli ATCC 25922 DNA) and negative (nuclease free water) controls. A cycle threshold value of 30 or less indicated a positive sample. All positive samples were confirmed using the MicroSeq 500 16S rDNA Bacterial Identification kit (Applied Biosystems).
DNA Sequencing
DNA sequencing was performed directly on PCR products using an ABI 3730 with the BigDye Taq FS Terminator V3.1. Sequencing was completed at the University of Pennsylvania DNA Sequencing Facility, and sequence identification was performed by BLAST at the National Center for Biotechnology Information web site (
Statistical Analysis
Data were analyzed using STATA 10.0 (Stata Corp., College Station, TX). Categorical variables were described using frequencies and percentages, and were compared using the chi‐square test. Continuous variables were described using mean, median, intraquartile range (IQR), and range values. Binomial exact 95% confidence intervals (CIs) were calculated for the proportion of positive blood and pleural fluid cultures and pleural fluid 16S rRNA PCR tests.
Results
During the study period, 124 patients with complicated pneumonia were identified; the median age was 4.9 years (IQR, 2.78.8 years) and the ratio of female to male patients was 1:1. The racial distribution was as follows: non‐Hispanic white, 62 (50%); non‐Hispanic black, 43 (34%); and Hispanic, 7 (6%). The median length of stay was 11 days (range, 240 days; IQR, 811 days). Forty‐one (33.1%) patients were admitted to the intensive care unit, and nine (7.3%) patients required mechanical ventilation. Overall, 5 of the 71 blood cultures performed (7.0%; 95% CI: 2.3%15.7%) were positive.
Pleural fluid drainage was performed in 64 (51.6%) patients. The median duration of antibiotic treatment before pleural fluid drainage was two days (IQR, 04 days). Differences in duration of antibiotic pretreatment between those with and without pleural fluid drainage were not significant. Patients received beta‐lactam agents (76.6%), clindamycin (51.6%), and vancomycin (23.4%) before pleural drainage. Blood cultures were performed in 27 (45.0%) of 60 patients not undergoing pleural fluid drainage; 2 of these 27 (7.4%; 95% CI: 0.9%24.3%) blood cultures were positive, and Streptococcus pneumoniae was isolated in both cases.
Using a combination of pleural fluid culture, blood culture, and broad‐range PCR, a microbiologic cause of infection was identified in 11 of 64 (17.2%; 95% CI: 8.9%28.7%) patients undergoing pleural fluid drainage (Figure 1). Patients with an identified bacterial cause were younger than those without an identified bacterial cause (Table 1). However, there were no statistically significant differences between the groups with and without identified bacteria with respect to sex, race, clinical examination findings and laboratory results at admission, duration of antibiotic therapy before pleural fluid drainage, or length of stay (Table 1). The median pleural fluid white blood cell count was 6880 per mm3 (IQR, 154227,918 per mm3).
| Causative Bacteria Identified | |||
|---|---|---|---|
| Demographics | Yes (n = 11) | No (n = 53) | P Value |
| |||
| Female sex | 3 (27.3%) | 29 (54.7%) | 0.10 |
| Age (years) | 2 (1.34.50) | 4.3 (3.1 8.1) | 0.03 |
| Race | 0.09 | ||
| Non‐Hispanic white | 3 (27.3%) | 29 (54.7%) | |
| Non‐Hispanic black | 7 (63.6%) | 13 (24.5%) | |
| Hispanic | 0 (0.0%) | 3 (5.6%) | |
| Other | 1 (9.1%) | 8 (15.1%) | |
| History of asthma | 2 (18.2%%) | 12 (22.6%) | 0.75 |
| Duration of antibiotics before drainage (days) | 0.5 (03) | 2 (04) | 0.43 |
| Intensive care unit admission | 7 (63.6%) | 25 (47.2%) | 0.32 |
| Initial temperature (C) | 37.8 (37.239.5) | 38.1 (37.639.3) | 0.76 |
| Initial oxygen saturation (%) | 94 (9397) | 95 (9396) | 0.97 |
| Peripheral white blood cell count (per mm3) | 21.4 (14.028.4) | 16.3 (10.922.6) | 0.12 |
| Platelet count (per mm3) | 434 (298546) | 402 (312575) | 0.95 |
Blood was obtained for culture from 44 (68.8%) of 64 patients that underwent pleural fluid drainage. Blood cultures were positive in three (6.8%; 95% CI: 1.4%18.7%) of these patients; causative bacteria were S. pneumoniae (n = 1), Haemophilus influenzae (n = 1), and Staphylococcus aureus (n = 1). Pleural fluid cultures were positive from 6 of 64 patients (9.3%; 95% CI: 3.5%19.3%) that underwent pleural fluid drainage; causative bacteria were Staphylococcus aureus (n = 5) and Streptococcus pneumoniae (n = 1). Three of the 19 pleural fluid samples (15.8%, CI 3.4%39.6%) tested by 16S rRNA PCR yielded positive results; S. pneumoniae was identified by DNA sequencing in all three of these samples (Figure 1). Of these three specimens, two had both negative Gram stains and negative pleural fluid cultures, while one specimen had Gram‐positive cocci in pairs identified on Gram stain along with a pleural fluid culture‐positive for S. pneumoniae. Of the 16 patients with negative PCR results, one was found to have a pleural fluid culture‐positive for S. aureus; no bacteria were detected on the pleural fluid Gram stain (Figure 1). Differences in the demographic characteristics between patients in whom broad‐range PCR was performed and not performed were not statistically significant (Table 2). Differences in the median length of hospital stay between patients who had PCR performed (9 days; IQR, 712 days) and those who did not (11 days; IQR, 914 days) were not statistically significant (P = 0.19). Antibiotic therapy was simplified from treatment with multiple antibiotics to a single antibiotic in each instance of a positive culture, though the number of positive cultures was too small to lead to meaningful reductions in antibiotic use or spectrum.
| PCR Performed | |||
|---|---|---|---|
| Demographics | Yes (N = 19) | No (N = 45) | P Value |
| |||
| Female sex | 9 (47.4) | 23 (51.1) | 0.78 |
| Age (years) | 4.9 (2.78.8) | 4.0 (2.88.1) | 0.76 |
| Race | 0.42 | ||
| Non‐Hispanic white | 10 (52.6%) | 22 (48.9%) | |
| Non‐Hispanic black | 5 (26.3%) | 15 (33.3%) | |
| Hispanic | 0 (0.0%) | 3 (6.7%) | |
| Other | 4 (21.1%) | 5 (11.1%) | |
| History of asthma | 5 (26.32%) | 9 (20.0%) | 0.58 |
| Duration of antibiotics before drainage (days) | 2 (03) | 1.5 (04) | 0.65 |
| Intensive care unit admission | 8 (42.1%) | 24 (53.3%) | 0.41 |
| Initial temperature (C) | 38.1 (37.339.4) | 38.0 (37.639.4) | 0.86 |
| Initial pulse oximetry (%) | 96 (9497) | 94 (9296) | 0.34 |
| Initial white blood cell count (1000 per mm3) | 16.1 (9.527.4) | 17.8 (12.622.8) | 0.93 |
| Platelet count (1000 per mm3) | 397 (312575) | 431 (303597) | 0.73 |
Discussion
Identification of the causative organism can improve the treatment of children with complicated pneumonia by enabling clinicians to target the infection with effective, narrow‐spectrum antibiotics. However, broad‐spectrum antibiotics are typically given before blood or pleural fluid samples are obtained, lowering the yield of conventional bacterial cultures. In our study, pleural fluid and blood cultures were infrequently positive. However, the use of 16S rRNA broad‐range PCR and DNA sequencing as ancillary tests only modestly improved our diagnostic yield.
Two prior studies have shown that broad‐range PCR analysis of pleural fluid can detect pathogenic organisms from pleural fluid even after the administration of antibiotics. Saglani et al.12 used bacterial culture and broad‐range PCR to analyze pleural fluid from 32 children with complicated pneumonia. Although the cohort had received a median of eight days of antibiotic therapy prior to fluid aspiration, a combination of broad‐range PCR and DNA sequencing identified organisms, predominantly S. pneumoniae, in 17 of 26 (65.4%) pleural fluid samples with negative culture. Five of the six culture‐positive samples also had positive PCR results, suggesting that a low proportion of the PCR results were false‐negatives. Le Monnier et al.13 cultured the pleural fluid from 78 children with complicated pneumonia; 15 samples were excluded from PCR testing because they grew bacteria other than S. pneumoniae. Broad‐range 16S rRNA PCR detected bacteria in 22 of 40 (55.0%) samples that were culture‐negative; subsequent DNA sequencing identified S. pneumoniae (n = 17), S. pyogenes (n = 3), S. aureus (n = 1), and H. influenzae (n = 1). S. pneumoniae was identified by 16S rRNA PCR followed by DNA sequencing in 20 of the 23 (87.0%) pleural fluid samples that grew S. pneumoniae on culture.
PCR with organism‐specific primers has also been shown to detect pathogenic bacteria in 35%70% of pleural fluid samples from patients with complicated pneumonia.15, 16 These rates of detection are comparable to the results of prior studies that used broad‐range PCR, and suggest that 16S rRNA and organism‐specific PCR are similarly sensitive tests.
Our study found that the proportion of positive results with broad‐range PCR was greater than the proportion observed with conventional pleural fluid culture. We were also able to identify S. pneumoniae by broad‐range PCR in two culture‐negative pleural fluid samples. The detection of S. pneumoniae by PCR in the setting of negative pleural fluid culture is not surprising, as most patients received empiric antibiotic therapy against S. pneumoniae before undergoing pleural fluid drainage. This prior antibiotic therapy would be expected to decrease the yield of pleural fluid culture but have a less significant impact on PCR. The reason for the failure to detect S. aureus by PCR from our clinical samples is not known. We explored whether this issue could be attributable to test characteristics during validation of our assay (as described in the technical Appendix), and S. aureus was consistently identified in pleural fluid samples spiked with S. aureus. While our diagnostic yield was low compared with prior studies that used broad‐range PCR, the distribution of causative bacteria was similar to prior studies of complicated pneumonia.9, 10 There were too few positive cultures among the specimens available for broad‐range PCR testing for us to reliably assess 16S rRNA PCR sensitivity and specificity. Thus, it was not possible to reliably assess the value of 16S rRNA PCR as an ancillary test in culture‐negative complicated pneumonia.
Several factors may have contributed to the low yield of broad‐range PCR in our study. First, all patients in our study received broad‐spectrum antibiotics prior to pleural fluid drainage; most patients received treatment with a beta‐lactam agent in combination with either clindamycin or vancomycin. Although PCR is less affected than culture by the prior administration of antibiotics, it is still possible that exposure to antibiotics accelerated degradation of the bacterial genome, thus decreasing the sensitivity of broad‐range PCR. The median duration of antibiotic therapy prior to drainage was shorter for patients in whom a bacterial pathogen was identified, compared with those in whom a pathogen was not identified. Though this difference was not statistically significant, this difference emphasizes that early pleural fluid collection may improve bacterial detection. The median duration of prior antibiotic therapy was eight days, in the study by Saglani et al.,12 however details regarding anti‐staphylococcal therapy were not reported. Second, several studies using 16S rRNA PCR in blood or cerebrospinal fluid (CSF) specimens for children with sepsis or meningitis, respectively, have noted decreased sensitivity for detection of Gram‐positive bacteria.1720 The cell wall composition makes Gram‐positive bacteria particularly difficult to lyse for DNA extraction. Prior studies used a different approach to DNA extraction compared with our study. Saglani et al.12 used the QIAmp minikit for DNA extraction (Qiagen Ltd, West Sussex, UK) and Le Monnier et al.13 used the MagnaPure System (Roche Diagnostics, Indianapolis, IN) for DNA extraction; additionally Saglani et al.12 included an additional 15 minutes of incubation at 95C following Proteinase K digestion to ensure complete lysis of the bacterial cells. We used the MagMAX Total Nucleic Acid Isolation Kit with a bead beating step to degrade the samples prior to lysis. It is unlikely that any of these differences contributed to differences in our study results. Third, human DNA may cause a nonspecific background signal, which could decrease PCR sensitivity. This issue may be particularly important in complicated pneumonia where the pleural fluid white blood cell counts are substantially elevated. Human DNA from white blood cells might be present at much higher concentrations than bacterial DNA, which would create a competitive advantage for binding of human, rather than bacterial, DNA on to the bead matrix.21 Saglani et al.12 did not report pleural fluid white blood cell counts for comparison. However, Le Monnier et al.13 reported pleural fluid white blood cell counts slightly higher than those observed in our patients. Thus, differences in pleural fluid white blood cell counts do not necessarily explain the differences in yield across studies. Fourth, while the universal primers used in our study have been validated, including for detection of S. aureus, in previous studies,14 Saglani et al.12 and Le Monnier et al.13 each used a different set of primers. It is unclear whether or not the choice of different primers affected the microbiologic yield.
An important limitation of this study is the relatively small number of patients with pleural fluid available for PCR testing combined with the low PCR yield. This limitation may have caused us to underestimate the true benefit of 16S rRNA PCR as an ancillary diagnostic test, as suggested by the wide confidence intervals around the estimates of PCR yield. Additionally, not all patients underwent pleural drainage, and not all patients undergoing pleural drainage had pleural fluid available for PCR testing. The latter issue would likely have only minimal impact on our study results, as there were no differences in demographics or clinical or laboratory features among those with and without pleural fluid available for PCR testing. However, differences among physicians, and across institutions, may play an important role in the decision to perform pleural drainage. We do not know whether patients undergoing pleural drainage at our institution were more or less likely to have bacteria detected by PCR than patients not undergoing drainage. If they were more likely to have bacteria detected, then our study would underestimate the benefit of PCR as an adjunct diagnostic test. However, there was no difference in the duration of antibiotic pretreatment between these two groups, and the yield from blood culture was similar.
In conclusion, blood and pleural fluid cultures infrequently identify the causative bacteria in children with complicated pneumonia. The use of broad‐range PCR increased the microbiologic yield only modestly. Further refinements to improve the diagnostic accuracy of broad‐range PCR testing are needed before this technique can be recommended for widespread use in clinical practice.
Appendix
Optimization and Validation of The 16S Assay
The assay was optimized for use with pleural fluid samples as follows. E. coli (ATCC 25922) and S. aureus (ATCC 29213) were grown overnight in 100 ml Brain Heart Infusion (BHI) broth. A suspension equivalent to a 0.5 MacFarland standard was prepared and was taken to represent approximately 1 108 colony‐forming units/mL. To prepare standard PCR curves, 1 in 10 dilutions were prepared in PBS (pH, 7.4) and DNA was extracted, in triplicate, using two different DNA extraction methods: the MagMAX Total Nucleic Acid Isolation Kit and the PrepMan Ultra Sample Preparation reagent system (Applied Biosystems, Foster City, CA), as described by the manufacturer. For the MagMax extraction, a 300 microliter sample was added to 200 microliters of lysis/binding solution in a bead tube. Samples were disrupted using a vortex adapter for 15 minutes at the highest setting. Tubes were then centrifuged at 16,000 relative centrifugal force (RCF) for three minutes. DNA extraction was performed using the KingFisher Flex Automated Purification System (Thermo Scientific). For the PrepMan Ultra extraction, a 300‐l sample was centrifuged for three minutes at 16,000 RCF. The supernatant fluid was discarded and the pellet was resuspended in 100 microliters of PrepMan Ultra Lysis Buffer and incubated at 100C for ten minutes. The sample was centrifuged for three minutes at 16,000 RCF, and a 10‐microliter aliquot of supernatant fluid was added to 90 microliters of nuclease free water. All DNA extracts were frozen at 20C prior to use. Plate counts, performed from the bacterial suspensions in triplicate, revealed approximately 1.3 108 colony‐forming units/mL in the original suspensions.
Pleural fluid samples were spiked with known concentrations (1, 3, 10, 30, 100, 300, and 1000 colony‐forming units/mL) of E. coli and S. aureus, and each sample was extracted five times with both DNA extraction systems. Each DNA extract was amplified on an Applied Biosystems 7500 thermal cycler (ABI) and a SmartCycler (Cepheid, Sunnyvale, CA). Analysis of the results obtained from the preliminary experiments indicated that the following combination of DNA extraction and PCR was optimal, and these conditions were used for all patient samples.
DNA was extracted from a 300‐microliter aliquot of pleural fluid using the MagMAX Total Nucleic Acid Isolation Kit (Ambion, Applied Biosystems) as described by the manufacturer. PCR was performed on an Applied Biosystems 7500 thermal cycler (ABI) using the primers, 16S F: 5‐GCT GTC ATC TCT TGT GGG CTG T‐3, 16S R: 5‐AAA CTC ATG GGA GCT GCT GGT T‐3, and the fluorescent labeled TaqMan probe, 16s Probe: 5‐Cy5/CCT GTC ATG CCC ACA CAA ATC TCT CC/BHQ‐2‐3. Human DNA (0.5 nanograms) was added to each assay to ensure that an adequate amount of human DNA was available to act as an internal amplification control. The primers, AlbICF: 5‐GCT GTC ATC TCT TGT GGG CTG T‐3, AlbICR: 5‐AAA CTC ATG GGA GCT GCT GGT T‐3, and the TaqMan probe, AlbICP: 5‐Cy5/CCT GTC ATG CCC ACA CAA ATC TCT CC/BHQ‐2‐3 detect a region of the human albumin gene. Amplification was performed as follows: initial denaturation of 94C for 20 seconds, followed by 35 cycles of 94C for 10 seconds, 61C for 31 seconds, and 72C for 5 seconds. Each run included positive (E. coli ATCC 25922 DNA) and negative (nuclease free water) controls. A cycle threshold value of 30 or less indicated a positive sample. All positive samples were confirmed using the MicroSeq 500 16S rDNA Bacterial Identification kit (Applied Biosystems).
- ,,, et al.An epidemiological investigation of a sustained high rate of pediatric parapneumonic empyema: risk factors and microbiological associations.Clin Infect Dis.2002;34:434–440.
- ,,,,.Primary early thoracoscopy and reduction in length of hospital stay and additional procedures among children with complicated pneumonia: results of a multicenter retrospective cohort study.Arch Pediatr Adolesc Med.2008;162:675–681.
- ,,, et al.Pulmonary manifestations in children with invasive community‐acquired Staphylococcus aureus infection.Clin Infect Dis.2005;41:583–590.
- ,,, et al.Association between Staphylococcus aureus strains carrying gene for Panton‐Valentine leukocidin and highly lethal necrotising pneumonia in young immunocompetent patients.Lancet.2002;359:753–759.
- ,,, et al.Severe community‐onset pneumonia in healthy adults caused by methicillin‐resistant Staphylococcus aureus carrying the Panton‐Valentine leukocidin genes.Clin Infect Dis.2005;40:100–107.
- ,.Empyema hospitalizations increased in US children despite pneumococcal conjugate vaccine.Pediatrics.2010;125:26–33.
- ,,,.Increasing incidence of empyema complicating childhood community‐acquired pneumonia in the United States.Clin Infect Dis.2010;50:805–813.
- ,,,,.National hospitalization trends for pediatric pneumonia and associated complications.Pediatrics.2010;126:204–213.
- ,,, et al.Thoracoscopic decortication vs tube thoracostomy with fibrinolysis for empyema in children: a prospective, randomized trial.J Pediatr Surg.2009;44:106–111.
- ,,, et al.Comparison of urokinase and video‐assisted thoracoscopic surgery for treatment of childhood empyema.Am J Respir Crit Care Med.2006;174:221–227.
- ,.Development of broad‐range 16S rDNA PCR for use in the routine diagnostic clinical microbiology service.J Med Microbiol.2003;52:685–691.
- ,,,.Empyema: the use of broad range 16S rDNA PCR for pathogen detection.Arch Dis Child.2005;90:70–73.
- ,,, et al.Microbiological diagnosis of empyema in children: comparative evaluations by culture, polymerase chain reaction, and pneumococcal antigen detection in pleural fluids.Clin Infect Dis.2006;42:1135–1140.
- ,,,.Determination of bacterial load by real‐time PCR using a broad‐range (universal) probe and primers set.Microbiology.2002;148:257–266.
- ,,,,,.Pneumolysin polymerase chain reaction for diagnosis of pneumococcal pneumonia and empyema in children.Eur J Clin Microbiol Infect Dis.2006;25:783–789.
- ,,, et al.Pleural fluid PCR method for detection of Staphylococcus aureus, Streptococcus pneumoniae and Haemophilus influenzae in pediatric parapneumonic effusions.Respiration.2008;75:437–442.
- ,.16S rRNA gene sequencing for bacterial identification in the diagnostic laboratory: pluses, perils, and pitfalls.J Clin Microbiol.2007;45:2761–2764.
- ,,,,.Evaluating the near‐term infant for early onset sepsis: progress and challenges to consider with 16S rDNA polymerase chain reaction testing.J Mol Diagn.2006;8:357–363.
- ,,,,.Preanalytic removal of human DNA eliminates false signals in general 16S rDNA PCR monitoring of bacterial pathogens in blood.Comp Immunol Microbiol Infect Dis.2009;32:207–219.
- ,,,,.Use of broad range16S rDNA PCR in clinical microbiology.J Microbiol Methods.2009;76:217–225.
- ,.Real‐time polymerase chain reaction for detecting bacterial DNA directly from blood of neonates being evaluated for sepsis.J Mol Diagn.2005;7:575–581.
Copyright © 2011 Society of Hospital Medicine

FDA: Increased PAH Risk Seen With Dasatinib
Treatment with the leukemia drug dasatinib has been associated with an increased risk for pulmonary arterial hypertension, which can occur at any time after starting treatment, the Food and Drug Administration announced on Oct. 11.
None of the cases was fatal, and PAH "may be reversible" if treatment is discontinued, according to the statement, posted on the agency’s MedWatch site.
Dasatinib, a kinase inhibitor marketed as Sprycel by Bristol-Myers Squibb, is approved for treating certain adults with Philadelphia chromosome-positive chronic myeloid leukemia (CML) or acute lymphoblastic leukemia (ALL). It is an oral therapy, administered once daily.
Since dasatinib was approved in 2006, the BMS global pharmacovigilance database has identified cases of PAH in treated patients, the statement said. In 12 of these cases, right heart catheterization confirmed the diagnosis, and dasatinib was considered "the most likely cause," the FDA said. These patients had developed symptoms at various time intervals after starting treatment, including more than 12 months afterward, and they often were taking other medications or had comorbidities, so "there may be a combination of factors contributing to the development of PAH" in patients taking dasatinib, the FDA said.
Because dyspnea, fatigue, hypoxia, fluid retention, and other PAH symptoms overlap with those of other conditions, "a diagnosis of Sprycel-associated PAH should be considered" if other causes have been ruled out in symptomatic patients, the FDA advises. Health care professionals should also evaluate patients for signs and symptoms of underlying cardiopulmonary disease before starting treatment and during treatment. The drug should be permanently discontinued if a diagnosis of PAH is confirmed.
Improvements in hemodynamic and clinical parameters were observed following discontinuation in some patients, the FDA statement said.
This information has been added to the drug’s prescribing information. Serious adverse events associated with dasatinib should be reported to the FDA’s MedWatch program at 800-332-1088.
Age, Location of Bruises Flag Child Abuse
SAN FRANCISCO – The location of bruising and the age of a child can help hone clinical suspicion of child abuse, thanks to a study identifying these predictors.
Because of this study, clinicians now have a better way of raising the topic with parents, which is always a difficult scenario, Dr. Robert Sidbury said.

Instead of physicians having to say that they need to discuss the possibility the bruises might be from nonaccidental trauma, they can now can say, "I’ve got this paper that says bruises in this certain location in a child of this age make me have to check this out," he said at the Women’s and Pediatric Dermatology Seminar, sponsored by Skin Disease Education Foundation (SDEF). "To me, that sounds different."
The study compared the characteristics of bruises on 95 infants aged 0-48 months seen in a pediatric ICU, 53 of whom had accidental trauma and 42 of whom were victims of abuse. Bruising on the torso, ear, or neck ("Think TEN," he suggested) in a child younger than 4 years of age increased the possibility of abuse (Pediatrics 2010;125:67-74).
"Does that mean a child can’t fall and bruise an ear? Of course not," said Dr. Sidbury, chief of dermatology at Seattle Children’s Hospital. "It is one thing to add to the list when we’re doing an assessment of the interaction with the parent, interaction with the child, [and] any other signs of trauma – all the things we go through" when considering the possibility of abuse.
"Remember, if they can’t cruise, they can’t bruise." Also, bruising anywhere on an infant younger than 4 months of age was suggestive of abuse. "Remember, if they can’t cruise, they can’t bruise," he said. "Is that evidence of abuse? It is not. Is it something we should pay attention to? I think it is."
Bruising on multiple sites was not in the study’s model, but also is suggestive of child abuse, Dr. Sidbury added.
He described seeing a 2-month-old patient with multiple linear, angulated bruises, some of them in the TEN locations. "The index of suspicion was high, and sadly, this was absolutely a case of abuse," he said.
The more data like this that can be gathered, the easier it will make the physician’s job when assessing a child that might be a victim of abuse.
"It is a wrenching issue," he said. "It is wrenching if it is abuse, and it is equally wrenching if you falsely raise the specter of abuse."
Dr. Sidbury said he had no relevant conflicts of interest.
SDEF and this news organization are owned by Elsevier.
SAN FRANCISCO – The location of bruising and the age of a child can help hone clinical suspicion of child abuse, thanks to a study identifying these predictors.
Because of this study, clinicians now have a better way of raising the topic with parents, which is always a difficult scenario, Dr. Robert Sidbury said.
Instead of physicians having to say that they need to discuss the possibility the bruises might be from nonaccidental trauma, they can now can say, "I’ve got this paper that says bruises in this certain location in a child of this age make me have to check this out," he said at the Women’s and Pediatric Dermatology Seminar, sponsored by Skin Disease Education Foundation (SDEF). "To me, that sounds different."
The study compared the characteristics of bruises on 95 infants aged 0-48 months seen in a pediatric ICU, 53 of whom had accidental trauma and 42 of whom were victims of abuse. Bruising on the torso, ear, or neck ("Think TEN," he suggested) in a child younger than 4 years of age increased the possibility of abuse (Pediatrics 2010;125:67-74).
"Does that mean a child can’t fall and bruise an ear? Of course not," said Dr. Sidbury, chief of dermatology at Seattle Children’s Hospital. "It is one thing to add to the list when we’re doing an assessment of the interaction with the parent, interaction with the child, [and] any other signs of trauma – all the things we go through" when considering the possibility of abuse.
"Remember, if they can’t cruise, they can’t bruise." Also, bruising anywhere on an infant younger than 4 months of age was suggestive of abuse. "Remember, if they can’t cruise, they can’t bruise," he said. "Is that evidence of abuse? It is not. Is it something we should pay attention to? I think it is."
Bruising on multiple sites was not in the study’s model, but also is suggestive of child abuse, Dr. Sidbury added.
He described seeing a 2-month-old patient with multiple linear, angulated bruises, some of them in the TEN locations. "The index of suspicion was high, and sadly, this was absolutely a case of abuse," he said.
The more data like this that can be gathered, the easier it will make the physician’s job when assessing a child that might be a victim of abuse.
"It is a wrenching issue," he said. "It is wrenching if it is abuse, and it is equally wrenching if you falsely raise the specter of abuse."
Dr. Sidbury said he had no relevant conflicts of interest.
SDEF and this news organization are owned by Elsevier.
EXPERT ANALYSIS FROM THE SDEF WOMEN’S & PEDIATRIC DERMATOLOGY SEMINAR
Cracking the Case
A 43‐year‐old woman presented to an outside hospital with painful plaques and patches on her bilateral lower extremities. Two weeks prior to presentation, she had noticed a single red lesion on her left ankle. Over the next two weeks, the lesion enlarged to involve the lower half of her posterior calf and subsequently turned purple and became exquisitely tender. Similar but smaller purple, tender lesions simultaneously appeared, first over her right shin and then on her bilateral thighs and hips. She also reported fatigue as well as diffuse joint pains in her hands and wrists bilaterally for the past month. She denied any swelling of these joints or functional impairment. She denied fevers, weight loss, headache, sinus symptoms, difficulty breathing, or abdominal pain.
Although we do not yet have a physical exam, the tempo, pattern of spread, and accompanying features allow some early hypotheses to be considered. Distal lower extremity lesions which darkened and spread could be erythema nodosum or erythema induratum. Malignancies rarely have such prominent skin manifestations, although leukemia cutis or an aggressive cutaneous T cell lymphoma might present with disseminated and darkened plaques, and Kaposi's sarcoma is characteristically purple and multifocal. Autoimmune disorders such as sarcoidosis, cutaneous lupus, and psoriasis may similarly present with widespread plaques. Most disseminated infections that start with patches evolve to pustules, ulcers, bullae, or other forms that reflect the invasive nature of the infection; syphilis warrants consideration for any widespread eruption of unknown etiology. Antecedent arthralgias with fatigue suggest an autoimmune condition, although infections such as hepatitis or parvovirus can do the same. Systemic lupus erythematosus (SLE) or rheumatoid arthritis (RA) would be favored initially on account of her demographics and the hand and wrist involvement, and each can be associated with vasculitis.
The significant pain as described is not compatible with most of the aforementioned diagnoses. Its presence, coupled with potential autoimmune symptoms, suggests a vasculitis such as polyarteritis nodosa (which can have prominent diffuse skin involvement), Henoch Schonlein purpura (with its predilection for the lower extremities, including extension to the hips and buttocks), cryoglobulinemia, or SLE‐ or RA‐associated vasculitis. Calciphylaxis is another ischemic vascular disorder that can cause diffuse dark painful lesions, but this only warrants consideration if advanced renal disease is present.
A skin biopsy ofher right hip was taken at the outside hospital. She was discharged on a two‐week course of prednisone for suspected vasculitis while biopsy results were pending. Over the next two weeks, none of the skin lesions improved, despite compliance with this treatment, and the skin over her left posterior calf and right shin lesions began to erode and bleed. In addition, small purple, tender lesions appeared over the pinnae of both ears. Three weeks after her initial evaluation, she presented to another emergency department for ulcerating skin lesions and worsening pain. At that point, the initial skin biopsy result was available and revealed vasculopathy of the small vessels with thrombi but no vasculitis.
The patient had no children,and denied a history of miscarriages. Her past medical history was unremarkable. She did not report any history of thrombotic events. She started a new job as a software engineer one month ago and was feeling stressed about her new responsibilities. She denied any high‐risk sexual behavior and any history of intravenous drug use. She had not traveled recently and did not own any pets. There was no family history of rheumatologic disorders, hypercoagulable states, or thrombotic events.
This picture of occluded but noninflamed vessels shifts the diagnosis away from vasculitis and focuses attention on hypercoagulable states with prominent dermal manifestations, including antiphospholipid antibody syndrome (APLS) and livedoid vasculopathy. In this young woman with arthralgias, consideration of SLE and APLS is warranted. Her recent increase in stress and widespread purpuric and ulcerative lesions could bring to mind a factitious disorder, but the histology results eliminate this possibility.
The patient's temperaturewas 36.5C, her blood pressure was 110/70 mmHg, respiratory rate was 16 breaths per minute, and her heart rate was 65 beats per minute. She was well‐appearing but in moderate pain. She did not have any oral lesions. Her cardiac, respiratory, and abdominal exams were normal. Skin exam revealed a 10‐cm by 4‐cm area of bloody granulation tissue draining serosanguinous fluid, surrounded by stellate palpable netlike purpura on her left posterior calf. There was a similar 4‐cm by 2‐cm ulcerated lesion on her right shin. Both lesions were exquisitely tender to palpation. On her bilateral thighs and hips, there were multiple stellate purpuric patches, all 4 cm in diameter or less, and only minimally tender to palpation. She also had 1‐cm purpuric bullae on the helices of both ears (Figure 1) which were slightly tender to palpation. Splinter hemorrhages were also noted on multiple nail beds bilaterally. Musculoskeletal exam did not reveal any synovitis.

The original purpura on her calf and ear demonstrate a clear demarcation corresponding to cutaneous vascular insufficiency. The development of bullae (ear) and ulceration (calf) are compatible with ischemia. Despite the presence of multiple splinter hemorrhages, the distribution of lesions is very unusual for an embolic phenomenon (eg, endocarditis, cholesterol emboli, or atrial myxoma). The multifocal nature of the skin lesions with progression to well‐demarcated cutaneous necrosis is reminiscent of calciphylaxis or warfarin‐induced skin necrosis, although she lacks the relevant risk factors. A toxin such as cocaine or methamphetamine mediating multifocal vasoconstriction or hypercoagulability should be excluded.
The bilateral ear involvement remains decidedly unusual and makes me wonder if there is something about the ear, such as the nature of its circulation or its potentially lower temperature (as an acral organ) that might render it particularly susceptible, for instance, to cryoglobulinemia or cryofibrinogenemia‐mediated ischemia.
Laboratory studiesdemonstrated: white blood cell count of 1500/mm3 (37.3% neutrophils, 5.1% lymphocytes, 6.7% monocytes, and 1.3% eosinophils); hemoglobin 9.3 g/dl (mean corpuscular volume 91 fL); platelet count 212/mm3; erythrocyte sedimentation rate 62 mm/hr; C‐reactive protein 14.6 mg/L. Serum electrolytes, liver tests, coagulation studies, and urinalysis were normal. Fecal occult blood test was negative.
Her neutropenia and anemia suggest decreased production in the marrow by infection, malignancy, or toxin, or increased destruction, perhaps from an autoimmune process. The associated infections are usually viral, such as human immunodeficiency virus (HIV) and Epstein‐Barr virus (EBV), although their linkage with her cutaneous disease is tenuous. It is possible that malignancy could be present in the marrow with resultant dermal hypercoagulability and ischemia, but this seems unlikely. We do not know about any toxins that she has been exposed to, but these hematologic findings would mandate directed inquiry along those lines. In this young woman with cutaneous ulcers secondary to thrombotic vasculopathy, bicytopenia, antecedent arthralgias without synovitis, and elevated inflammatory markers, I favor an autoimmune process such as SLE, which I would evaluate with an antinuclear antibody (ANA) and antiphospholipid antibody studies.
She was admittedto the hospital and received hydromorphone for pain control. Corticosteroids were not administered. Peripheral blood morphology was normal. Antibodies against HIV1 and 2 were negative, as were antibodies against cytomegalovirus, EBV, parvovirus B19, mycoplasma pneumoniae, and hepatitis C virus. Bilateral lower extremity ultrasound was negative for deep vein thrombosis. Transthoracic echocardiogram was normal. Repeat skin biopsy confirmed small vessel vasculopathy without vasculitis (Figure 2). The results of the following investigations were also negative: ANA, rheumatoid factor, double‐stranded DNA (dsDNA), cyclic citrullinated peptide, ribonucleoprotein (RNP), and anti‐Smith antibodies. C3 and C4 complement levels were normal.
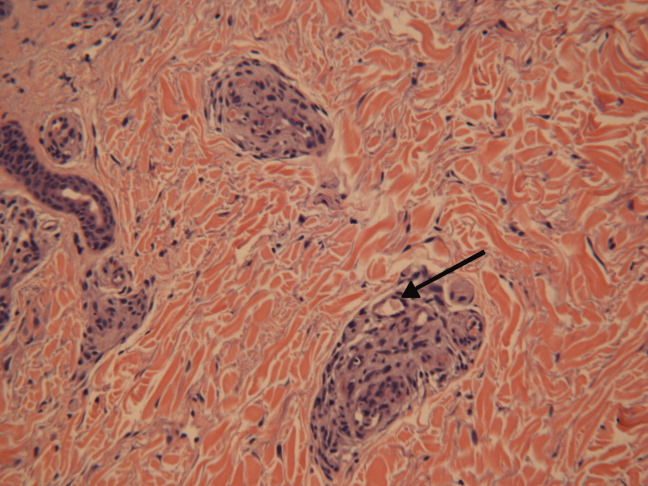
Given how much the histology is driving the clinical reasoning and focusing the differential diagnosis in this case, I agree with the decision to repeat the biopsy. In complex or undiagnosed cases, repeat histology samples allow for confirmation of the original interpretation (often with the perspective of new clinicians and pathologists) and sometimes reveal pathognomonic or additional findings that only appear after the disease has evolved over time. HIV seronegativity helps constrain the differential diagnosis, and parvovirus is another excellent consideration for arthralgias and cytopenias (with the predilection to involve cells lines other than RBCs particularly seen in HIV), although ulcers are not seen with this condition. Herpes simplex virus (HSV) is another viral infection that can cause painful skin ulcerations and cytopenias, although the duration and distribution are highly atypical. The negative ANA and dsDNA and normal complement levels make SLE unlikely. The negative lower extremity ultrasound helps frame the thromboses as a local cutaneous process rather than a systemic hypercoagulable state. Although the peripheral blood smear is normal, a bone marrow biopsy will be necessary to exclude a marrow invasive process, such as leukemia or lymphoma. A bone marrow biopsy would also provide another opportunity to examine tissue for mycobacteria or fungi which can cause ulcerations and cytopenias, although there is little reason to suspect she is susceptible to those pathogens. As this clinical picture fails to fit clearly with an infectious, autoimmune, or neoplastic disorder, I would revisit the possibility of toxinsprescription, complementary, over‐the‐counter, or illegal (eg, cocaine) at this time.
In further discussionwith the patient, she reported using cocaine intranasally for the past three months. Her urine toxicology was positive for cocaine. She was found to have positive perinuclear antineutrophil cytoplasmic antibodies (p‐ANCA), antimyeloperoxidase (MPO) antibodies, anticardiolipin (ACL) antibodies, and lupus anticoagulant (LAC). By hospital day 3, her lesions had significantly improved without any intervention, and her absolute neutrophil count increased to 1080/mm3.
The presence of widespread cutaneous ischemia (with bland thrombosis) and detectable ACL and LAC antibodies is compatible with APLS; the APLS could be deemed primary, because there is no clear associated rheumatologic or other systemic disease. However, neutropenia is not a characteristic of APLS, which has thrombocytopenia as its more frequently associated hematologic abnormality. Livedoid vasculopathy, a related disorder, is also supported by the ACL and LAC results, but also does not feature neutropenia. While the presence of diffuse thrombosis could be attributed to a widespread secondary effect of cocaine vasoconstriction, the appearance of ANCA (which can be drug‐induced, eg, propylthiouracil [PTU]) and the slowly resolving neutropenia during hospitalization without specific treatment is very suggestive of a toxin. The demographic, diffuse skin ulcers, and hematologic and serologic profile is compatible with the recently described toxidrome related to levamisole adulteration of cocaine.
A send‐out studyof a urine sample returned positive for levamisole. Based on purpuric skin lesions with a predilection for the ears, agranulocytosis, and skin biopsy revealing thrombotic vasculopathy, she was diagnosed with levamisole‐adulterated cocaine exposure. One week after discharge, her lower extremity pain and ulcerations were significantly improved. Her absolute neutrophil count increased to 2820/mm.3 Her urine toxicology screen was negative for cocaine.
DISCUSSION
Levamisole was initially developed in 1964 as an antihelminthic agent. Its incidentally discovered immunomodulatory effects led to trials for the treatment of chronic infections, inflammatory bowel disease, rheumatic diseases,1 and nephrotic syndrome in children.2 By 1990, 3 major studies supported levamisole as an adjunctive therapy in melanoma3 and colon cancer.4
Although levamisole appeared to be nontoxic at single or low doses, long‐term use in clinical trials demonstrated that 2.5%‐13% of patients developed life‐threatening agranulocytosis, and up to 10% of those instances resulted in death.5 A distinctive cutaneous pseudovasculitis was noted in children on therapeutic levamisole. They presented with purpura that had a predilection for the ears, cheeks, and thighs,6 and positive serologic markers for ANCA and antiphospholipid antibodies. Skin biopsies of the purpuric lesions revealed leukocytoclastic vasculitis, thrombotic vasculitis, and/or vascular occlusions.
Levamisole was withdrawn from the market in 2000 in the United States due to its side effects,7 but quickly found its way onto the black market. It was first detected in cocaine in 2002, and the percentage of cocaine containing levamisole has steadily been increasing since then. In July 2009, over 70% of cocaine seized by the Drug Enforcement Administration was found to contain levamisole.8 It is unclear exactly why this drug is used as an adulterant in cocaine. Theories include potentiation of the euphoric effects of cocaine, serving as a bulking agent, or functioning as a chemical signature to track distribution.9
The resurgence of levamisole has brought a new face to a problem seen over a decade ago. Current reports of levamisole toxicity describe adults presenting with purpura preferentially involving the ears, neutropenia, positive ANCA, and positive antiphospholipid antibodies.1012 Since 2002, there have been at least 20 confirmed cases of agranulocytosis and two deaths associated with levamisole‐adulterated cocaine.8, 13, 14 In September 2009, the Department of Health and Human Services issued a public health alert warning of an impending increase in levamisole‐related illness.
Levamisole is not detected on routine toxicology screens, but can be tested for using gas chromatography and mass spectrometry. Most laboratories do not offer testing for levamisole and send‐out testing is required. Given its half‐life of 5.6 hours, levamisole can only be detected in the blood within 24 hours, and in the urine within 48‐72 hours of exposure.15, 16 Urine samples are preferred over blood samples, since blood levels decline more rapidly and have lower sensitivity. Cocaine can also be sent out to local or state forensics laboratories to be tested for levamisole. The only definitive treatment for levamisole‐induced cutaneous pseudovasculitis and neutropenia is cessation of toxin exposure.
Although the discussant had familiarity with this toxidrome from local and published cases, he was only able to settle on levamisole toxicity after a series of competing hypotheses were ruled out on the basis of irreconcilable features (vasculitis and histology results; APLS and neutropenia; SLE and negative ANA with no visceral involvement) and by using analogical reasoning (eg, to infer the presence of a toxin on the basis of neutropenia [as seen with chemotherapy and other drugs] and ANCA induction [as seen with PTU]). It was a laborious process of hypothesis testing, but one that ultimately allowed him to crack the case.
Key Teaching Points
-
In patients presenting with neutropenia and purpuric skin lesionsparticularly with a predilection for the earsconsider levamisole‐adulterated cocaine exposure.
-
Tests supporting this diagnosis include positive serologies for ANCA and antiphospholipid antibodies, and skin biopsies that show leukocytoclastic vasculitis, thrombotic vasculitis, or vascular occlusion. Urine studies for levamisole are definitive if sent within 48 to 72 hours of exposure.
The approach to clinical conundrums by an expert clinician is revealed through presentation of an actual patient's case in an approach typical of morning report. Similar to patient care, sequential pieces of information are provided to the clinician who is unfamiliar with the case. The focus is on the thought processes of both the clinical team caring for the patient and the discussant.
- ,.Levamisole, the story and the lessons.Int J Immunopharmocol.1992;14(3):481–486.
- British Association for Paediatric Nephrology.Levamisole for corticosteroid‐dependent nephrotic syndrome in childhood.Lancet.1991;337:1555–1557.
- ,,,,.Improved survival in patients with poor‐prognosis malignant melanoma treated with adjuvant levamisole: a phase III study by the National Cancer Institute of Canada Clinical Trials Group.J Clin Oncol.1991;9:729–735.
- ,,.Levamisole and fluorouracil for adjuvant therapy of resected colon carcinoma.N Engl J Med.1990;322:352–358.
- ,,.Studies on levamisole‐induced agranulocytosis.Blood.1980;56(3):388–396.
- ,,.Purpura of the ears: a distinctive vasculopathy with circulating autoantibodies complicating long‐term treatment with levamisole in children.Br J Dermatol.1999;140:948–951.
- . Janssen Discontinues Ergamisol. Available at: http://findarticles.com/p/articles/mi_m3374/is_18_22/ai_68536218/. Accessed July 25,2010.
- SAMHSA. Nationwide Public Health Alert Issued Concerning Life‐Threatening Risk Posed by Cocaine Laced with Veterinary Anti‐Parasite Drug. Available at: http://www.samhsa.gov/newsroom/advisories/090921vet5101.aspx. Accessed July 20,2010.
- .Unusual adulterants in cocaine seized on Italian clandestine market.Forensic Sci Int.2007;172(2–3):e1.
- ,,.Levamisole‐induced occlusive necrotizing vasculitis of the ears after use of cocaine contaminated with levamisole.J Med Toxicol.2010;Jun 12.
- ,,,.Bilateral necrosis of earlobes and cheeks: another complication of cocaine contaminated with levamisole.Ann Intern Med.2010;1;152(11):758–759.
- ,,,,.Cocaine‐associated retiform purpura and neutropenia: is levamisole the culprit?J Am Acad Dermatol.2010;Mar 19.
- ,,,.A confirmed case of agranulocytosis after use of cocaine contaminated with levamisole.J Med Toxicol.2010;Apr 1.
- Centers for Disease Control and Prevention.Agranulocytosis associated with cocaine use—four States, March 2008–November 2009.MMWR.2009;58(49):1381–1385.
- ,,.Levamisole as a contaminant of illicit cocaine.Journal of the Clandestine Laboratory Investigating Chemists Association.2006;16:6–11. Available at: http://www.tiaft2006.org/proceedings/pdf/PT‐p‐06.pdf. Accessed July 20, 2010.
- . Cocaine Cutting Agents—A Discussion. Laboratory Medicine and Pathology, University of Alberta. Available at: http://www.vandu.org/documents/Levamisole_Cocaine.pdf. Accessed July 20,2010.
A 43‐year‐old woman presented to an outside hospital with painful plaques and patches on her bilateral lower extremities. Two weeks prior to presentation, she had noticed a single red lesion on her left ankle. Over the next two weeks, the lesion enlarged to involve the lower half of her posterior calf and subsequently turned purple and became exquisitely tender. Similar but smaller purple, tender lesions simultaneously appeared, first over her right shin and then on her bilateral thighs and hips. She also reported fatigue as well as diffuse joint pains in her hands and wrists bilaterally for the past month. She denied any swelling of these joints or functional impairment. She denied fevers, weight loss, headache, sinus symptoms, difficulty breathing, or abdominal pain.
Although we do not yet have a physical exam, the tempo, pattern of spread, and accompanying features allow some early hypotheses to be considered. Distal lower extremity lesions which darkened and spread could be erythema nodosum or erythema induratum. Malignancies rarely have such prominent skin manifestations, although leukemia cutis or an aggressive cutaneous T cell lymphoma might present with disseminated and darkened plaques, and Kaposi's sarcoma is characteristically purple and multifocal. Autoimmune disorders such as sarcoidosis, cutaneous lupus, and psoriasis may similarly present with widespread plaques. Most disseminated infections that start with patches evolve to pustules, ulcers, bullae, or other forms that reflect the invasive nature of the infection; syphilis warrants consideration for any widespread eruption of unknown etiology. Antecedent arthralgias with fatigue suggest an autoimmune condition, although infections such as hepatitis or parvovirus can do the same. Systemic lupus erythematosus (SLE) or rheumatoid arthritis (RA) would be favored initially on account of her demographics and the hand and wrist involvement, and each can be associated with vasculitis.
The significant pain as described is not compatible with most of the aforementioned diagnoses. Its presence, coupled with potential autoimmune symptoms, suggests a vasculitis such as polyarteritis nodosa (which can have prominent diffuse skin involvement), Henoch Schonlein purpura (with its predilection for the lower extremities, including extension to the hips and buttocks), cryoglobulinemia, or SLE‐ or RA‐associated vasculitis. Calciphylaxis is another ischemic vascular disorder that can cause diffuse dark painful lesions, but this only warrants consideration if advanced renal disease is present.
A skin biopsy ofher right hip was taken at the outside hospital. She was discharged on a two‐week course of prednisone for suspected vasculitis while biopsy results were pending. Over the next two weeks, none of the skin lesions improved, despite compliance with this treatment, and the skin over her left posterior calf and right shin lesions began to erode and bleed. In addition, small purple, tender lesions appeared over the pinnae of both ears. Three weeks after her initial evaluation, she presented to another emergency department for ulcerating skin lesions and worsening pain. At that point, the initial skin biopsy result was available and revealed vasculopathy of the small vessels with thrombi but no vasculitis.
The patient had no children,and denied a history of miscarriages. Her past medical history was unremarkable. She did not report any history of thrombotic events. She started a new job as a software engineer one month ago and was feeling stressed about her new responsibilities. She denied any high‐risk sexual behavior and any history of intravenous drug use. She had not traveled recently and did not own any pets. There was no family history of rheumatologic disorders, hypercoagulable states, or thrombotic events.
This picture of occluded but noninflamed vessels shifts the diagnosis away from vasculitis and focuses attention on hypercoagulable states with prominent dermal manifestations, including antiphospholipid antibody syndrome (APLS) and livedoid vasculopathy. In this young woman with arthralgias, consideration of SLE and APLS is warranted. Her recent increase in stress and widespread purpuric and ulcerative lesions could bring to mind a factitious disorder, but the histology results eliminate this possibility.
The patient's temperaturewas 36.5C, her blood pressure was 110/70 mmHg, respiratory rate was 16 breaths per minute, and her heart rate was 65 beats per minute. She was well‐appearing but in moderate pain. She did not have any oral lesions. Her cardiac, respiratory, and abdominal exams were normal. Skin exam revealed a 10‐cm by 4‐cm area of bloody granulation tissue draining serosanguinous fluid, surrounded by stellate palpable netlike purpura on her left posterior calf. There was a similar 4‐cm by 2‐cm ulcerated lesion on her right shin. Both lesions were exquisitely tender to palpation. On her bilateral thighs and hips, there were multiple stellate purpuric patches, all 4 cm in diameter or less, and only minimally tender to palpation. She also had 1‐cm purpuric bullae on the helices of both ears (Figure 1) which were slightly tender to palpation. Splinter hemorrhages were also noted on multiple nail beds bilaterally. Musculoskeletal exam did not reveal any synovitis.
The original purpura on her calf and ear demonstrate a clear demarcation corresponding to cutaneous vascular insufficiency. The development of bullae (ear) and ulceration (calf) are compatible with ischemia. Despite the presence of multiple splinter hemorrhages, the distribution of lesions is very unusual for an embolic phenomenon (eg, endocarditis, cholesterol emboli, or atrial myxoma). The multifocal nature of the skin lesions with progression to well‐demarcated cutaneous necrosis is reminiscent of calciphylaxis or warfarin‐induced skin necrosis, although she lacks the relevant risk factors. A toxin such as cocaine or methamphetamine mediating multifocal vasoconstriction or hypercoagulability should be excluded.
The bilateral ear involvement remains decidedly unusual and makes me wonder if there is something about the ear, such as the nature of its circulation or its potentially lower temperature (as an acral organ) that might render it particularly susceptible, for instance, to cryoglobulinemia or cryofibrinogenemia‐mediated ischemia.
Laboratory studiesdemonstrated: white blood cell count of 1500/mm3 (37.3% neutrophils, 5.1% lymphocytes, 6.7% monocytes, and 1.3% eosinophils); hemoglobin 9.3 g/dl (mean corpuscular volume 91 fL); platelet count 212/mm3; erythrocyte sedimentation rate 62 mm/hr; C‐reactive protein 14.6 mg/L. Serum electrolytes, liver tests, coagulation studies, and urinalysis were normal. Fecal occult blood test was negative.
Her neutropenia and anemia suggest decreased production in the marrow by infection, malignancy, or toxin, or increased destruction, perhaps from an autoimmune process. The associated infections are usually viral, such as human immunodeficiency virus (HIV) and Epstein‐Barr virus (EBV), although their linkage with her cutaneous disease is tenuous. It is possible that malignancy could be present in the marrow with resultant dermal hypercoagulability and ischemia, but this seems unlikely. We do not know about any toxins that she has been exposed to, but these hematologic findings would mandate directed inquiry along those lines. In this young woman with cutaneous ulcers secondary to thrombotic vasculopathy, bicytopenia, antecedent arthralgias without synovitis, and elevated inflammatory markers, I favor an autoimmune process such as SLE, which I would evaluate with an antinuclear antibody (ANA) and antiphospholipid antibody studies.
She was admittedto the hospital and received hydromorphone for pain control. Corticosteroids were not administered. Peripheral blood morphology was normal. Antibodies against HIV1 and 2 were negative, as were antibodies against cytomegalovirus, EBV, parvovirus B19, mycoplasma pneumoniae, and hepatitis C virus. Bilateral lower extremity ultrasound was negative for deep vein thrombosis. Transthoracic echocardiogram was normal. Repeat skin biopsy confirmed small vessel vasculopathy without vasculitis (Figure 2). The results of the following investigations were also negative: ANA, rheumatoid factor, double‐stranded DNA (dsDNA), cyclic citrullinated peptide, ribonucleoprotein (RNP), and anti‐Smith antibodies. C3 and C4 complement levels were normal.
Given how much the histology is driving the clinical reasoning and focusing the differential diagnosis in this case, I agree with the decision to repeat the biopsy. In complex or undiagnosed cases, repeat histology samples allow for confirmation of the original interpretation (often with the perspective of new clinicians and pathologists) and sometimes reveal pathognomonic or additional findings that only appear after the disease has evolved over time. HIV seronegativity helps constrain the differential diagnosis, and parvovirus is another excellent consideration for arthralgias and cytopenias (with the predilection to involve cells lines other than RBCs particularly seen in HIV), although ulcers are not seen with this condition. Herpes simplex virus (HSV) is another viral infection that can cause painful skin ulcerations and cytopenias, although the duration and distribution are highly atypical. The negative ANA and dsDNA and normal complement levels make SLE unlikely. The negative lower extremity ultrasound helps frame the thromboses as a local cutaneous process rather than a systemic hypercoagulable state. Although the peripheral blood smear is normal, a bone marrow biopsy will be necessary to exclude a marrow invasive process, such as leukemia or lymphoma. A bone marrow biopsy would also provide another opportunity to examine tissue for mycobacteria or fungi which can cause ulcerations and cytopenias, although there is little reason to suspect she is susceptible to those pathogens. As this clinical picture fails to fit clearly with an infectious, autoimmune, or neoplastic disorder, I would revisit the possibility of toxinsprescription, complementary, over‐the‐counter, or illegal (eg, cocaine) at this time.
In further discussionwith the patient, she reported using cocaine intranasally for the past three months. Her urine toxicology was positive for cocaine. She was found to have positive perinuclear antineutrophil cytoplasmic antibodies (p‐ANCA), antimyeloperoxidase (MPO) antibodies, anticardiolipin (ACL) antibodies, and lupus anticoagulant (LAC). By hospital day 3, her lesions had significantly improved without any intervention, and her absolute neutrophil count increased to 1080/mm3.
The presence of widespread cutaneous ischemia (with bland thrombosis) and detectable ACL and LAC antibodies is compatible with APLS; the APLS could be deemed primary, because there is no clear associated rheumatologic or other systemic disease. However, neutropenia is not a characteristic of APLS, which has thrombocytopenia as its more frequently associated hematologic abnormality. Livedoid vasculopathy, a related disorder, is also supported by the ACL and LAC results, but also does not feature neutropenia. While the presence of diffuse thrombosis could be attributed to a widespread secondary effect of cocaine vasoconstriction, the appearance of ANCA (which can be drug‐induced, eg, propylthiouracil [PTU]) and the slowly resolving neutropenia during hospitalization without specific treatment is very suggestive of a toxin. The demographic, diffuse skin ulcers, and hematologic and serologic profile is compatible with the recently described toxidrome related to levamisole adulteration of cocaine.
A send‐out studyof a urine sample returned positive for levamisole. Based on purpuric skin lesions with a predilection for the ears, agranulocytosis, and skin biopsy revealing thrombotic vasculopathy, she was diagnosed with levamisole‐adulterated cocaine exposure. One week after discharge, her lower extremity pain and ulcerations were significantly improved. Her absolute neutrophil count increased to 2820/mm.3 Her urine toxicology screen was negative for cocaine.
DISCUSSION
Levamisole was initially developed in 1964 as an antihelminthic agent. Its incidentally discovered immunomodulatory effects led to trials for the treatment of chronic infections, inflammatory bowel disease, rheumatic diseases,1 and nephrotic syndrome in children.2 By 1990, 3 major studies supported levamisole as an adjunctive therapy in melanoma3 and colon cancer.4
Although levamisole appeared to be nontoxic at single or low doses, long‐term use in clinical trials demonstrated that 2.5%‐13% of patients developed life‐threatening agranulocytosis, and up to 10% of those instances resulted in death.5 A distinctive cutaneous pseudovasculitis was noted in children on therapeutic levamisole. They presented with purpura that had a predilection for the ears, cheeks, and thighs,6 and positive serologic markers for ANCA and antiphospholipid antibodies. Skin biopsies of the purpuric lesions revealed leukocytoclastic vasculitis, thrombotic vasculitis, and/or vascular occlusions.
Levamisole was withdrawn from the market in 2000 in the United States due to its side effects,7 but quickly found its way onto the black market. It was first detected in cocaine in 2002, and the percentage of cocaine containing levamisole has steadily been increasing since then. In July 2009, over 70% of cocaine seized by the Drug Enforcement Administration was found to contain levamisole.8 It is unclear exactly why this drug is used as an adulterant in cocaine. Theories include potentiation of the euphoric effects of cocaine, serving as a bulking agent, or functioning as a chemical signature to track distribution.9
The resurgence of levamisole has brought a new face to a problem seen over a decade ago. Current reports of levamisole toxicity describe adults presenting with purpura preferentially involving the ears, neutropenia, positive ANCA, and positive antiphospholipid antibodies.1012 Since 2002, there have been at least 20 confirmed cases of agranulocytosis and two deaths associated with levamisole‐adulterated cocaine.8, 13, 14 In September 2009, the Department of Health and Human Services issued a public health alert warning of an impending increase in levamisole‐related illness.
Levamisole is not detected on routine toxicology screens, but can be tested for using gas chromatography and mass spectrometry. Most laboratories do not offer testing for levamisole and send‐out testing is required. Given its half‐life of 5.6 hours, levamisole can only be detected in the blood within 24 hours, and in the urine within 48‐72 hours of exposure.15, 16 Urine samples are preferred over blood samples, since blood levels decline more rapidly and have lower sensitivity. Cocaine can also be sent out to local or state forensics laboratories to be tested for levamisole. The only definitive treatment for levamisole‐induced cutaneous pseudovasculitis and neutropenia is cessation of toxin exposure.
Although the discussant had familiarity with this toxidrome from local and published cases, he was only able to settle on levamisole toxicity after a series of competing hypotheses were ruled out on the basis of irreconcilable features (vasculitis and histology results; APLS and neutropenia; SLE and negative ANA with no visceral involvement) and by using analogical reasoning (eg, to infer the presence of a toxin on the basis of neutropenia [as seen with chemotherapy and other drugs] and ANCA induction [as seen with PTU]). It was a laborious process of hypothesis testing, but one that ultimately allowed him to crack the case.
Key Teaching Points
-
In patients presenting with neutropenia and purpuric skin lesionsparticularly with a predilection for the earsconsider levamisole‐adulterated cocaine exposure.
-
Tests supporting this diagnosis include positive serologies for ANCA and antiphospholipid antibodies, and skin biopsies that show leukocytoclastic vasculitis, thrombotic vasculitis, or vascular occlusion. Urine studies for levamisole are definitive if sent within 48 to 72 hours of exposure.
The approach to clinical conundrums by an expert clinician is revealed through presentation of an actual patient's case in an approach typical of morning report. Similar to patient care, sequential pieces of information are provided to the clinician who is unfamiliar with the case. The focus is on the thought processes of both the clinical team caring for the patient and the discussant.
- ,.Levamisole, the story and the lessons.Int J Immunopharmocol.1992;14(3):481–486.
- British Association for Paediatric Nephrology.Levamisole for corticosteroid‐dependent nephrotic syndrome in childhood.Lancet.1991;337:1555–1557.
- ,,,,.Improved survival in patients with poor‐prognosis malignant melanoma treated with adjuvant levamisole: a phase III study by the National Cancer Institute of Canada Clinical Trials Group.J Clin Oncol.1991;9:729–735.
- ,,.Levamisole and fluorouracil for adjuvant therapy of resected colon carcinoma.N Engl J Med.1990;322:352–358.
- ,,.Studies on levamisole‐induced agranulocytosis.Blood.1980;56(3):388–396.
- ,,.Purpura of the ears: a distinctive vasculopathy with circulating autoantibodies complicating long‐term treatment with levamisole in children.Br J Dermatol.1999;140:948–951.
- . Janssen Discontinues Ergamisol. Available at: http://findarticles.com/p/articles/mi_m3374/is_18_22/ai_68536218/. Accessed July 25,2010.
- SAMHSA. Nationwide Public Health Alert Issued Concerning Life‐Threatening Risk Posed by Cocaine Laced with Veterinary Anti‐Parasite Drug. Available at: http://www.samhsa.gov/newsroom/advisories/090921vet5101.aspx. Accessed July 20,2010.
- .Unusual adulterants in cocaine seized on Italian clandestine market.Forensic Sci Int.2007;172(2–3):e1.
- ,,.Levamisole‐induced occlusive necrotizing vasculitis of the ears after use of cocaine contaminated with levamisole.J Med Toxicol.2010;Jun 12.
- ,,,.Bilateral necrosis of earlobes and cheeks: another complication of cocaine contaminated with levamisole.Ann Intern Med.2010;1;152(11):758–759.
- ,,,,.Cocaine‐associated retiform purpura and neutropenia: is levamisole the culprit?J Am Acad Dermatol.2010;Mar 19.
- ,,,.A confirmed case of agranulocytosis after use of cocaine contaminated with levamisole.J Med Toxicol.2010;Apr 1.
- Centers for Disease Control and Prevention.Agranulocytosis associated with cocaine use—four States, March 2008–November 2009.MMWR.2009;58(49):1381–1385.
- ,,.Levamisole as a contaminant of illicit cocaine.Journal of the Clandestine Laboratory Investigating Chemists Association.2006;16:6–11. Available at: http://www.tiaft2006.org/proceedings/pdf/PT‐p‐06.pdf. Accessed July 20, 2010.
- . Cocaine Cutting Agents—A Discussion. Laboratory Medicine and Pathology, University of Alberta. Available at: http://www.vandu.org/documents/Levamisole_Cocaine.pdf. Accessed July 20,2010.
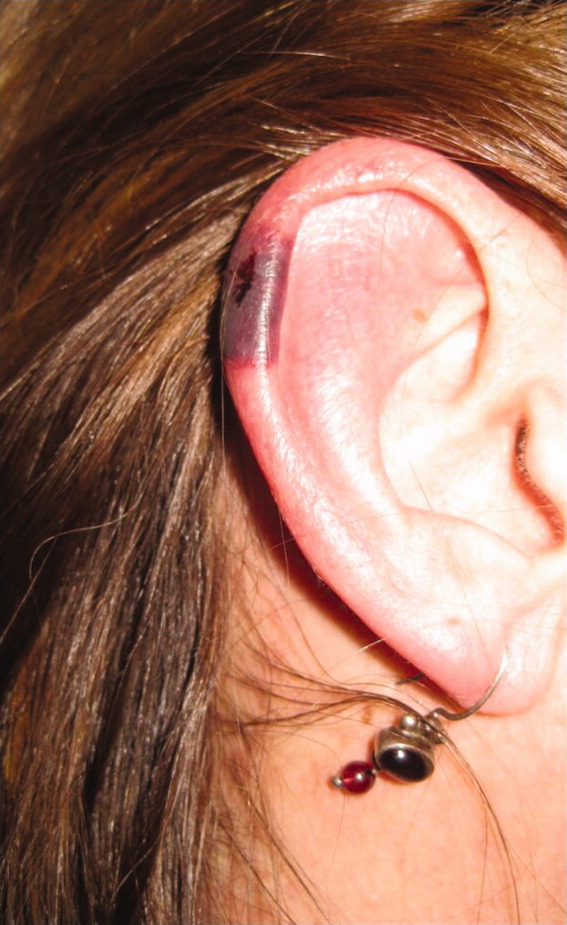
Treating AWS with Oral Baclofen
In the United States, unhealthy alcohol use affects medical care on several levels. The prevalence of alcohol problems is 7%20% or higher among outpatients,1 30%40% among emergency room patients, and 50% among patients with trauma.13 In 2006, approximately 430,000 hospital discharges in the United States were for persons with a principal (first‐listed) alcohol‐related diagnosis, and 1.7 million discharges listed at least one alcohol‐related diagnosis, representing 1.3% and 5.3% of all hospital discharges, respectively.4 Alcoholic psychosis (34.5%) and alcohol dependence syndrome (29.5%) together accounted for the majority of principal alcohol‐related diagnoses.4 Additionally, many patients hospitalized for other indications are susceptible to withdrawal symptoms due to physiological habituation to alcohol. Abrupt cessation of alcohol intake causes habituated drinkers to experience symptoms of alcohol withdrawal syndrome (AWS), which significantly increases intensity and cost of care. Trauma patients who develop AWS were found to have increased morbidity, more intensive care and ventilator days, and higher hospital costs than trauma patients without AWS.5 Unfortunately, attempts to develop predictive models to accurately forecast the likelihood of developing severe AWS in an individual case have been modestly successful at best.68
Regimens used to treat AWS have evolved over time, taking advantage of advances in the understanding of addiction neurophysiology. There is no specific ethanol receptor.9 Much of alcohol's acute effects on the central nervous system are mediated by its stimulation of the gamma‐aminobutyric acid (GABA) system, which is neuroinhibitory.10 Chronic alcohol use leads to habituation partly by inducing configuration changes of GABA‐A receptor subunits. This renders the GABA‐A receptor less sensitive to alcohol, barbiturates, and benzodiazepines.11 Although both GABA‐A and GABA‐B receptor activation cause increased GABA neuronal output, the GABA‐A receptor is rendered relatively less sensitive by chronic exposure to alcohol. Baclofen is a pure GABA‐B receptor agonist,12 and its GABA‐B stimulatory effect is maintained even in habituated alcoholics.13, 14 The absence of cross‐tolerance between baclofen and ethanol suggests that low doses of baclofen may be helpful in the management of AWS.
Currently, AWS is usually managed with benzodiazepines, using variable dosing depending on the severity of withdrawal symptoms. Such symptom‐triggered treatment is generally preferred over fixed‐dose regimens,15 in part because when using this method, many cases of AWS can be managed with less medication. Benzodiazepine regimens using high doses have been found to be associated with substantial morbidity and prolonged hospitalizations.16, 17
In a series of small studies, Addolorato's research team has reported decreases in AWS symptoms in association with the use of low doses of baclofen in an outpatient population,18 and has found baclofen to be associated with reduced alcohol craving in the long‐term management of alcohol dependence.11, 19, 20 Addolorato and colleagues' studies of baclofen in relieving AWS symptoms prompted our group to apply the use of baclofen in a larger group of inpatients with AWS.11, 18, 21 We conducted this study to improve understanding of the role of baclofen in the management of acute AWS in an inpatient population of subjects at risk for AWS, drawn from general hospital admissions.
Our primary null hypothesis was that Clinical Institute Withdrawal Assessment of Alcohol Scale, Revised (CIWA‐Ar) scores in acutely withdrawing alcoholic patients are equal in baclofen‐treated and placebo‐treated subject groups. Our secondary null hypothesis was that benzodiazepine doses used to treat acutely withdrawing alcoholic patients are equal in the baclofen‐treated and placebo‐treated groups.
METHODS
The protocol for this study was approved by the Essentia Health Institutional Review Board, Duluth, Minnesota.
This was a randomized, placebo‐controlled, double‐blind trial. Subjects were recruited from among patients who were admitted to 1 of 2 regional general hospitals in Duluth, Minnesota (St. Mary's Medical Center or Miller‐Dwan Medical Center) and who were identified by clinical staff as being at risk for AWS. Potential subjects were not required to have an alcohol‐related condition as their primary reason for admission, but were required to have a history of AWS or of alcohol use suggestive of significant risk for AWS, and to be able to provide informed consent, as described below.
Patients were not eligible for enrollment in the study if they had other active drug dependence in addition to alcohol; were using baclofen at the time of study enrollment; were using benzodiazepines chronically at the time of study enrollment; had a known baclofen or benzodiazepine sensitivity; were unable to take oral medications; were pregnant or breast‐feeding; had a serum creatinine level 2.0; had a history of non‐alcohol withdrawal seizures; required intravenous benzodiazepines to control their AWS; or were unable to complete the consenting procedures.
Consenting and Enrollment Procedures
Patients who were identified by clinical staff as being at high risk for AWS were approached for possible enrollment in the study. Potential subjects who met other inclusion criteria were screened to assess their mental status with the Mini‐Mental Status Exam (MMSE), using methods developed for subjects with cognitive impairment.22 Potential subjects who scored 24 of a possible score of 30 or higher on the exam were considered capable of providing informed consent. Potential subjects who scored between 20 and 23 were considered to be capable of providing consent if they were able to answer 4 questions about the study (why the study is being done, what will be required of them if they participate, how long they will be in the study, and how it will be determined if they will receive the investigational drug or the placebo).
Patients who met inclusion criteria were enrolled in the study. Subjects were randomized only if they developed signs of AWS sufficient to meet Diagnostic and Statistical Manual of Mental Disorders IV (DSMIV) criteria for AWS diagnosis, and reached at least a score of 11 (of a possible 67) on the CIWA‐Ar. All subjects received symptom‐triggered benzodiazepine treatment, and also were randomized to receive either baclofen (10 mg) or placebo every 8 hours (q8h) orally as inpatients for 72 hours or until discharge, whichever was shorter. Lorazepam was selected for the symptom‐triggered benzodiazepine treatment, as it has been used for managing AWS in the participating hospitals for several years. The initial research protocol called for 5 days of participation (15 doses of study drug), but we found that many subjects were discharged before the 5 days had elapsed after enrollment, and that compliance with follow‐up outpatient visits was poor. Accordingly, the protocol was amended to shorten the treatment period to 72 hours of participation (9 doses) or until discharge if prior to 72 hours, with the minimum observation period set to 72 hours.
Data Collection
Baseline data were collected at the time of enrollment, both from the patient and the medical record. Demographic data (age, gender, race) were obtained, as well as data on alcohol history, including approximate duration and intensity of alcohol use, and prior experience with AWS; data on comorbid conditions and medical history; and history of beta‐blocker use. During the period of observation following randomization, data were obtained on CIWA‐Ar scores; benzodiazepine doses administered; and adverse events, including use of sedatives in addition to benzodiazepines, use of restraints, use of intensive care, and clinical complications during the AWS course.
Study Procedures
The research pharmacy provided study medications (baclofen or placebo in identical form) for enrolled subjects. Subjects and study personnel were blinded to treatment group (baclofen vs placebo).
Nurses on inpatient units were provided with training in CIWA‐Ar assessment. All subjects were monitored for CIWA‐Ar scores at the time of study enrollment and for at least the next 72 hours. In monitoring the subjects, the nurses used the CIWA‐Ar protocol, in which subjects were assessed and potentially dosed with lorazepam hourly if their scores were 11 or higher. If the CIWA‐Ar score was less than 11, the subjects were assessed every 4 hours and at study discharge. CIWA‐AR results were reported as averaged over 8‐hour periods starting at study enrollment.
Data Analysis
Demographic and baseline variables with ordinal and continuous measurements, such as age, MMSE total score, and drinks per day were evaluated using group t test analysis, with two‐tailed significance estimates. Variables with prevalence reported were evaluated using the chi‐square test of significance. In accordance with the protocol, data from patients who had CIWA‐Ar assessments for at least 72 hours following randomization were included in the final study analyses. Repeated measures analysis of variance were conducted for the 2 treatment groups (baclofen and placebo), to evaluate mean CIWA‐Ar scores and mean lorazepam doses within each 8‐hour interval, as well as cumulative lorazepam dose. No covariates were included in the models. The last‐observation‐carried‐forward approach was used for those subjects who were missing CIWA‐Ar scores between baseline and their last CIWA‐Ar score. Doses for postdischarge patients without lorazepam prescriptions were set to 0 mg/8 hr. Cumulative lorazepam dose at 72 hours was also analyzed by defining the upper 25th percentile of existing doses (the upper 8 of 31) as high dose. This high‐dose lorazepam treatment level was determined to include all study participants receiving 20 mg or more of lorazepam during the first 72 hours. Fisher's exact test (two‐tailed) was then used to assess the difference in treatment group (baclofen vs placebo) for high‐dose lorazepam treatment.
RESULTS
Seventy‐nine subjects met study inclusion criteria, and provided informed consent for participation in the study. Of these, 44 subjects developed signs of AWS sufficient to meet DSMIV criteria for AWS diagnosis, and were randomized to receive either baclofen or placebo, in addition to benzodiazepine therapy. As summarized in Table 1, subjects who developed signs of AWS were similar to subjects who did not enter withdrawal, differing principally in that those who developed AWS reported more drinks per day, and more significant history of previous AWS.
| Withdrawal/Randomized | ||||
|---|---|---|---|---|
| No Withdrawal | All | Placebo | Baclofen | |
| Characteristic | (N = 35) | (N = 44) | (N = 19) | (N = 25) |
| ||||
| % Male | 82.9 | 84.1 | 94.7 | 76.0 |
| Age at admission (mean/SD) | 52.0/12.0 | 46.9/10.9 | 46.1/11.9 | 47.5/10.3 |
| MMSE total score (mean/SD) | 26.5/1.7 | 25.8/3.3 | 25.4/4.1 | 26.0/2.4 |
| Drinking history | ||||
| Age began drinking (mean/SD) | 16.7/4.2 | 16.2/4.3 | 15.5/4.5 | 16.7/4.2 |
| Years drinking (mean/SD) | 34.1/10.8 | 30.2/10.0 | 30.0/12.8 | 30.3/7.8 |
| Drinks per day (mean/SD)* | 11.2/8.8 | 16.3/9.7 | 14.4/7.8 | 18.0/11.0 |
| % Daily drinker | 65.7 | 64.1 | 57.9 | 70.0 |
| Days since last drink (mean/SD) | 1.5/0.9 | 1.3/1.3 | 1.0/0.8 | 1.6/1.5 |
| Medical history, % with history of | ||||
| Alcohol withdrawal syndrome | 60.6 | 87.5 | 87.5 | 87.5 |
| Seizures*, | 30.0 | 53.8 | 33.3 | 66.7 |
| DTs* | 48.3 | 74.3 | 80.0 | 70.0 |
| Medications, % at time of admission | ||||
| Alcohol treatment | 0.0 | 4.5 | 5.3 | 4.0 |
| Beta‐blocker | 31.4 | 25.0 | 26.3 | 24.0 |
| Sleep agent | 2.9 | 6.8 | 5.3 | 8.0 |
| Narcotic pain medication | 37.1 | 40.9 | 31.6 | 48.0 |
| Depakote | 0.0 | 4.5 | 0.0 | 8.0 |
| Benzodiazepine | 2.9 | 11.4 | 10.5 | 12.0 |
| Anti‐anxiety medication | 2.9 | 2.3 | 0.0 | 4.0 |
| Anti‐psychotic medication | 5.7 | 6.8 | 10.5 | 4.0 |
| Other psychiatric medication | 2.9 | 9.1 | 5.3 | 12.0 |
The 79 subjects who were enrolled were drawn from a population of 237 potential subjects who were screened for the study. The most common reasons that the 158 potential subjects were not enrolled were refusal (29.7%), low risk of withdrawal (19.0%), inability to provide consent (9.5%), and concurrent use of benzodiazepines (8.9%). The 15 patients who were unable to provide consent were those who scored 24 or lower on the MMSE, and did not have a surrogate decision‐maker available.
Of the 44 subjects who were randomized, 31 (18 in the baclofen group, 13 in the placebo group) completed 72 hours of CIWA‐Ar assessments, as summarized in Table 2. These assessments were completed either entirely as inpatients (24 subjects) or with inpatient assessments followed by outpatient assessments after discharge (7 subjects). Discharges prior to 72 hours occurred in 3 of the 18 subjects receiving baclofen, and in 4 of the 13 receiving placebo (odds ratio = 0.45, 95% CI = 0.082.49). Mean CIWA‐Ar scores for the 31 subjects who completed 72 hours of CIWA‐Ar assessments are presented in Figure 1.
| All | Placebo | Baclofen | |
|---|---|---|---|
| Characteristic | (N = 31) | (N = 13) | (N = 18) |
| |||
| % Male | 87.1 | 92.3 | 83.3 |
| Age at admission (mean/SD) | 47.5/10.2 | 45.7/9.3 | 48.7/10.9 |
| MMSE total score (mean/SD) | 26.3/2.2 | 26.3/1.8 | 26.3/2.6 |
| Charlson Comorbidity Score | 1.0/1.1 | 1.1/0.9 | 1.0/1.3 |
| Drinking history | |||
| Age began drinking (mean/SD) | 16.7/4.6 | 16.1/4.3 | 17.1/5.0 |
| Years drinking (mean/SD) | 29.8/8.6 | 29.5/10.0 | 30.0/7.9 |
| Drinks per day (mean/SD) | 16.0/9.9 | 12.9/8.4 | 18.6/10.5 |
| % Daily drinker | 58.1 | 53.8 | 78.6 |
| Days since last drink (mean/SD) | 1.2/0.9 | 1.1/0.8 | 1.3/1.1 |
| Current hospitalization, primary diagnosis | |||
| Alcohol withdrawal syndrome/alcoholism | 48.4 | 46.2 | 50.0 |
| Probably related to alcoholism* | 35.5 | 38.5 | 33.3 |
| Other | 16.1 | 15.4 | 16.7 |
| Medical history, % with history of | |||
| Alcohol withdrawal syndrome | 89.7 | 83.3 | 94.1 |
| Seizures | 60.7 | 45.5 | 70.6 |
| DTs | 79.2 | 80.0 | 78.6 |
| Medications, % at time of admission | |||
| Alcohol treatment | 6.5 | 7.7 | 5.6 |
| Beta‐blocker | 29.1 | 23.1 | 33.3 |
| Sleep agent | 6.5 | 7.7 | 5.6 |
| Narcotic pain medication | 45.2 | 30.8 | 55.6 |
| Depakote | 6.5 | 0.0 | 11.1 |
| Benzodiazepine | 9.7 | 15.4 | 5.6 |
| Anti‐anxiety medication | 3.2 | 0.0 | 5.6 |
| Anti‐psychotic medication | 9.7 | 15.4 | 5.6 |
| Other psychiatric medication | 6.5 | 7.7 | 5.6 |
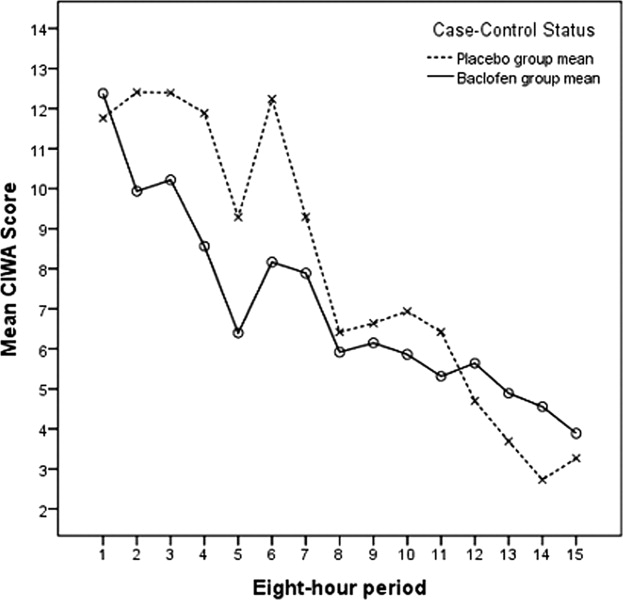
Figures 2 and 3 summarize the mean lorazepam doses in each 8‐hour period, and the cumulative lorazepam doses for the subjects in the 2 arms of the study, respectively. The cumulative dose of lorazepam administered to the 31 subjects ranged from 0 to 1035 mg in the 72 hours following randomization, with a range of 1 to 1035 mg in the placebo group and 0 to 39 mg in the baclofen group. The 8 subjects who received the highest doses of lorazepam (20 mg or more) included 1 of the 18 subjects who received baclofen and 7 of the 13 subjects who received placebo (P = 0.004). Only 4 subjects required >50 mg of lorazepam over the 72 hours; all 4 of these were patients in the placebo group (P = 0.023).
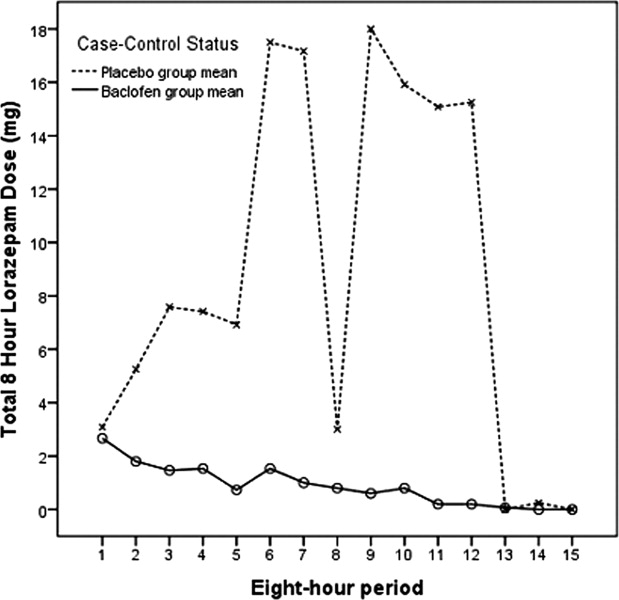
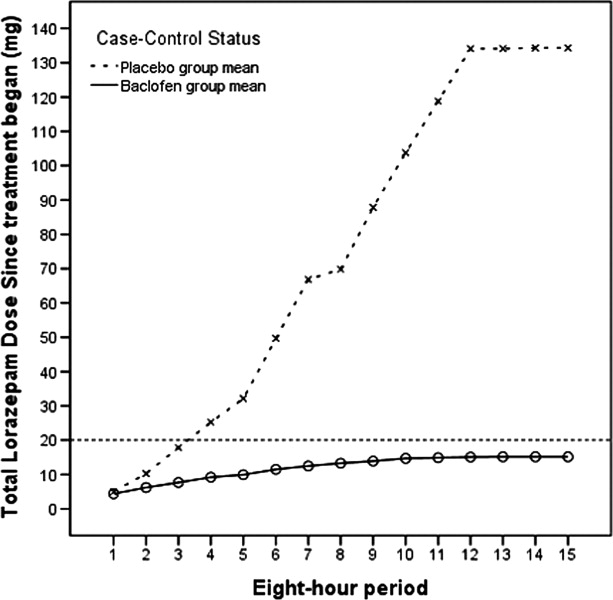
Subjects who received baclofen and subjects who received placebo did not differ significantly in regard to the use of sedatives other than benzodiazepines, the use of restraints, the use of intensive care, or other clinical complications. On the basis this analysis, the study's primary null hypothesis was not rejected (the CIWA‐Ar scores in the baclofen and placebo groups were not different), but the secondary null hypothesis was rejected (baclofen was associated with lower likelihood of the use of high doses of benzodiazepines).
DISCUSSION
Benzodiazepines are effective drugs in the treatment of alcohol withdrawal syndrome. They remain the gold standard of treatment. The most effective method of administering benzodiazepines to acutely withdrawing patients has been shown to be variable dosing, based on withdrawal symptoms.
Our small study of acutely withdrawing inpatients confirmed that benzodiazepines, administered at frequencies and doses dependent on AWS symptoms, work well to control CIWA‐Ar scores over a relatively short time span. Our study also demonstrated that the addition of the GABA‐B agonist baclofen orally, at a fixed dose of 30 mg daily, will allow the same level of AWS symptom control, while reducing the risk that high doses of benzodiazepines will be needed to achieve that control. Reducing the use of high‐dose benzodiazepines has the potential to improve patient safety. In addition, since the frequency of nursing assessments parallel CIWA‐AR scores and benzodiazepine dosing frequency, using oral baclofen in this setting has the potential to decrease the nursing time required to control withdrawal symptoms.
A larger study of AWS will be needed to assess the role of baclofen in managing the frequency and severity of the complications of AWS, such as prolonged sedation, intensive care admission, and ventilator days. The current study was not powered to assess differences in the frequency of relatively rare events, and we excluded patients who required intravenous benzodiazepines for AWS symptom management. However, in light of the well‐documented risk of sedation and respiratory depression from high‐dose benzodiazepines, our findings suggest that a larger study of the role of baclofen in AWS management is warranted.
Either baclofen or benzodiazepines may have severe adverse effects in high doses. In this study, we used a low, fixed dose of baclofen (10 mg every 8 hours), a level at which severe side effects such as respiratory depression are uncommon. Our principal finding was that the use of low‐dose baclofen is associated with reduced use of high‐dose benzodiazepines in some AWS patients.
Further Research
The use of baclofen and other adjunctive treatments in the management of AWS and other alcohol dependency syndromes warrants future study. If the benzodiazepine‐sparing effects of baclofen in AWS management are confirmed in additional studies, baclofen may become an important adjunct to benzodiazepines in AWS management, particularly in settings where the use of symptom‐triggered therapy is difficult.
It is difficult to predict which suddenly abstinent alcoholics will experience severe AWS. In the current study, 44 of the 79 patients judged by experienced clinicians to be at high risk for acute AWS reached the CIWA‐Ar threshold (a score of 11 or more) to be randomized. We found that those who experienced significant withdrawal were younger, drank more heavily, and had more prior experience with severe AWS, which is consistent with earlier studies.23, 24 Nevertheless, patient history is not a reliable predictor of risk for AWS; clinicians are often obliged to watch and wait until clinical signs of AWS develop. In light of the growing evidence that baclofen alleviates many symptoms of alcohol dependence, both in patients with AWS and in those in recovery,19, 20, 2529 future research should also examine the role of baclofen in preventing AWS in at‐risk patients.
Since ethanol has effects on several neurotransmitters and receptor systems, combinations of medications that modify GABA, glutamate, and adrenergic activity in low doses may be more effective and safer in managing AWS than using high doses of a single agent. Future research should seek to identify the most effective combination of low‐dose medications in managing AWS.
Study Limitations
This study was subject to several significant limitations. With a small study population (31 subjects), the experiences of individual subjects had a strong effect on the findings (such as the dip in mean lorazepam doses for placebo subjects in Figure 2, which was due to a high‐dose subject sleeping through the observation period). However, the overall finding of the lorazepam‐sparing effect of baclofen was consistent. We excluded patients who required intravenous benzodiazepines for AWS management, and so our study did not include the most severe AWS subjects. However, all of our subjects showed signs of mild‐to‐moderate alcohol withdrawal upon enrollment (CIWA‐Ar scores of 11 or more upon randomization), and all were at risk for more severe AWS; many went on to much higher CIWA‐AR scores during the course of their AWS. Of the 44 subjects who were randomized, 13 did not complete the study; the impact that these subjects might have had on the findings is unknown. However, the subjects who did not complete the study (baclofen 54%, placebo 46%) did not differ from the remaining subjects in regard to any of the variables used in the study. More baclofen‐treated than placebo‐treated subjects were taking narcotics and/or beta‐blockers at the time of enrollment, although these differences were not statistically significant, and their impact upon our findings are unknown. This study was conducted in northeast Minnesota; the study population reflected the limited diversity of the region. Caution should be used in generalizing the findings to other populations.
CONCLUSION
These findings suggest that baclofen may have potential as an adjunct in the management of acute alcohol withdrawal.
- .Clinical practice. Unhealthy alcohol use.N Engl J Med.2005;352(6):596–607.
- ,,, et al.Patients with alcohol problems in the emergency department, part 1: improving detection. SAEM Substance Abuse Task Force. Society for Academic Emergency Medicine.Acad Emerg Med.1998;5(12):1200–1209.
- ,,.Screening for alcohol problems in primary care: a systematic review.Arch Intern Med.2000;160(13):1977–1989.
- ,.Trends in Alcohol‐Related Morbidity Among Short‐Stay Community Hospital Discharges, United States, 1979–2006. Surveillance Report #84.Arlington, VA:National Institute on Alcohol Abuse and Alcoholism; August2008.
- ,,, et al.Alcohol withdrawal syndrome: turning minor injuries into a major problem.J Trauma.2006;61(6):1441–1446.
- ,,,,,.An assessment of the potential value of elevated homocysteine in predicting alcohol‐withdrawal seizures.Epilepsia.2006;47(5):934–938.
- ,.Combining the audit questionnaire and biochemical markers to assess alcohol use and risk of alcohol withdrawal in medical inpatients.Alcohol Alcohol.2005;40(6):515–519.
- .A model for predicting alcohol withdrawal delirium.Psychiatr Serv.2001;52(6):820–823.
- .[GABA‐system and alcohol: does an “ethanol receptor” exist?] [review].Zh Nevrol Psikhiatr Im S S Korsakova.2007;Suppl 1:56–62.
- ,,, et al.Identification of molecular targets associated with ethanol toxicity and implications in drug development.Curr Pharm Des.2010;16(11):1313–1355.
- ,,,,.Baclofen: a new drug for the treatment of alcohol dependence.Int J Clin Pract.2006;60(8):1003–1008.
- ,.3H‐baclofen and 3H‐GABA bind to bicuculline‐insensitive GABA B sites in rat brain.Nature.1981;290(5802):149–152.
- ,.Differential effects of GABA(A) and GABA(B) agonists on sensitization to the locomotor stimulant effects of ethanol in DBA/2 J mice.Psychopharmacology (Berl).1999;141(2):197–205.
- .Cerebral GABA receptors.Alcohol Alcohol Suppl.1994;2:181–186.
- ,,, et al.Symptom‐triggered vs fixed‐schedule doses of benzodiazepine for alcohol withdrawal.Arch Intern Med.2002;162(10):1117–1121.
- .Short‐term lorazepam infusion and concern for propylene glycol toxicity: case report and review.Pharmacother.2001;21(9):1140–1144.
- ,,,,,.The use of continuous IV sedation is associated with prolongation of mechanical ventilation.Chest.1998;114:541–548.
- ,,, et al.Rapid suppression of alcohol withdrawal syndrome by baclofen.Am J Med.2002;112(3):226–229.
- ,,,,,.Ability of baclofen in reducing alcohol craving and intake: II—preliminary clinical evidence.Alcohol Clin Exp Res.2000;24(1):67–71.
- ,,, et al.Baclofen efficacy in reducing alcohol craving and intake: a preliminary double‐blind randomized controlled study.Alcohol Alcohol.2002;37(5):504–508.
- ,,, et al.Baclofen in the treatment of alcohol withdrawal syndrome: a comparative study vs diazepam.Am J Med.2006;119:276.e213–276.e218.
- ,,,,.Relationship between Alzheimer's disease severity and patient participation in decisions about their care.J Geriatr Psychiatry Neurol.2002;15(2):68–72.
- ,,.Impact of age on the severity, course, and complications of alcohol withdrawal.Arch Intern Med.1997;157(19):2234–2241.
- ,,.Independent clinical correlates of severe alcohol withdrawal.Substance Abuse.2003;24(4):197–209.
- ,,, et al.Effectiveness and safety of baclofen for maintenance of alcohol abstinence in alcohol‐dependent patients with liver cirrhosis: randomised, double‐blind study.Lancet.2007;370:1915–1922.
- ,,, et al.Baclofen for alcohol dependence: a preliminary open‐label study.Alcohol Clin Exp Res.2004;28(10):1517–1523.
- ,,,.[Pharmacological treatment options for prevention of alcohol relapse].Fortschr Neurol Psychiatr.2008;76(7):421–428.
- ,.Pharmacological treatment of alcohol dependence: target symptoms and target mechanisms.Pharmacol Ther.2006;111:855–876.
- ,.Baclofen as prophylaxis and treatment for alcohol withdrawal: a retrospective chart review.J Okla State Med Assoc.2007;100(9):354–360.
In the United States, unhealthy alcohol use affects medical care on several levels. The prevalence of alcohol problems is 7%20% or higher among outpatients,1 30%40% among emergency room patients, and 50% among patients with trauma.13 In 2006, approximately 430,000 hospital discharges in the United States were for persons with a principal (first‐listed) alcohol‐related diagnosis, and 1.7 million discharges listed at least one alcohol‐related diagnosis, representing 1.3% and 5.3% of all hospital discharges, respectively.4 Alcoholic psychosis (34.5%) and alcohol dependence syndrome (29.5%) together accounted for the majority of principal alcohol‐related diagnoses.4 Additionally, many patients hospitalized for other indications are susceptible to withdrawal symptoms due to physiological habituation to alcohol. Abrupt cessation of alcohol intake causes habituated drinkers to experience symptoms of alcohol withdrawal syndrome (AWS), which significantly increases intensity and cost of care. Trauma patients who develop AWS were found to have increased morbidity, more intensive care and ventilator days, and higher hospital costs than trauma patients without AWS.5 Unfortunately, attempts to develop predictive models to accurately forecast the likelihood of developing severe AWS in an individual case have been modestly successful at best.68
Regimens used to treat AWS have evolved over time, taking advantage of advances in the understanding of addiction neurophysiology. There is no specific ethanol receptor.9 Much of alcohol's acute effects on the central nervous system are mediated by its stimulation of the gamma‐aminobutyric acid (GABA) system, which is neuroinhibitory.10 Chronic alcohol use leads to habituation partly by inducing configuration changes of GABA‐A receptor subunits. This renders the GABA‐A receptor less sensitive to alcohol, barbiturates, and benzodiazepines.11 Although both GABA‐A and GABA‐B receptor activation cause increased GABA neuronal output, the GABA‐A receptor is rendered relatively less sensitive by chronic exposure to alcohol. Baclofen is a pure GABA‐B receptor agonist,12 and its GABA‐B stimulatory effect is maintained even in habituated alcoholics.13, 14 The absence of cross‐tolerance between baclofen and ethanol suggests that low doses of baclofen may be helpful in the management of AWS.
Currently, AWS is usually managed with benzodiazepines, using variable dosing depending on the severity of withdrawal symptoms. Such symptom‐triggered treatment is generally preferred over fixed‐dose regimens,15 in part because when using this method, many cases of AWS can be managed with less medication. Benzodiazepine regimens using high doses have been found to be associated with substantial morbidity and prolonged hospitalizations.16, 17
In a series of small studies, Addolorato's research team has reported decreases in AWS symptoms in association with the use of low doses of baclofen in an outpatient population,18 and has found baclofen to be associated with reduced alcohol craving in the long‐term management of alcohol dependence.11, 19, 20 Addolorato and colleagues' studies of baclofen in relieving AWS symptoms prompted our group to apply the use of baclofen in a larger group of inpatients with AWS.11, 18, 21 We conducted this study to improve understanding of the role of baclofen in the management of acute AWS in an inpatient population of subjects at risk for AWS, drawn from general hospital admissions.
Our primary null hypothesis was that Clinical Institute Withdrawal Assessment of Alcohol Scale, Revised (CIWA‐Ar) scores in acutely withdrawing alcoholic patients are equal in baclofen‐treated and placebo‐treated subject groups. Our secondary null hypothesis was that benzodiazepine doses used to treat acutely withdrawing alcoholic patients are equal in the baclofen‐treated and placebo‐treated groups.
METHODS
The protocol for this study was approved by the Essentia Health Institutional Review Board, Duluth, Minnesota.
This was a randomized, placebo‐controlled, double‐blind trial. Subjects were recruited from among patients who were admitted to 1 of 2 regional general hospitals in Duluth, Minnesota (St. Mary's Medical Center or Miller‐Dwan Medical Center) and who were identified by clinical staff as being at risk for AWS. Potential subjects were not required to have an alcohol‐related condition as their primary reason for admission, but were required to have a history of AWS or of alcohol use suggestive of significant risk for AWS, and to be able to provide informed consent, as described below.
Patients were not eligible for enrollment in the study if they had other active drug dependence in addition to alcohol; were using baclofen at the time of study enrollment; were using benzodiazepines chronically at the time of study enrollment; had a known baclofen or benzodiazepine sensitivity; were unable to take oral medications; were pregnant or breast‐feeding; had a serum creatinine level 2.0; had a history of non‐alcohol withdrawal seizures; required intravenous benzodiazepines to control their AWS; or were unable to complete the consenting procedures.
Consenting and Enrollment Procedures
Patients who were identified by clinical staff as being at high risk for AWS were approached for possible enrollment in the study. Potential subjects who met other inclusion criteria were screened to assess their mental status with the Mini‐Mental Status Exam (MMSE), using methods developed for subjects with cognitive impairment.22 Potential subjects who scored 24 of a possible score of 30 or higher on the exam were considered capable of providing informed consent. Potential subjects who scored between 20 and 23 were considered to be capable of providing consent if they were able to answer 4 questions about the study (why the study is being done, what will be required of them if they participate, how long they will be in the study, and how it will be determined if they will receive the investigational drug or the placebo).
Patients who met inclusion criteria were enrolled in the study. Subjects were randomized only if they developed signs of AWS sufficient to meet Diagnostic and Statistical Manual of Mental Disorders IV (DSMIV) criteria for AWS diagnosis, and reached at least a score of 11 (of a possible 67) on the CIWA‐Ar. All subjects received symptom‐triggered benzodiazepine treatment, and also were randomized to receive either baclofen (10 mg) or placebo every 8 hours (q8h) orally as inpatients for 72 hours or until discharge, whichever was shorter. Lorazepam was selected for the symptom‐triggered benzodiazepine treatment, as it has been used for managing AWS in the participating hospitals for several years. The initial research protocol called for 5 days of participation (15 doses of study drug), but we found that many subjects were discharged before the 5 days had elapsed after enrollment, and that compliance with follow‐up outpatient visits was poor. Accordingly, the protocol was amended to shorten the treatment period to 72 hours of participation (9 doses) or until discharge if prior to 72 hours, with the minimum observation period set to 72 hours.
Data Collection
Baseline data were collected at the time of enrollment, both from the patient and the medical record. Demographic data (age, gender, race) were obtained, as well as data on alcohol history, including approximate duration and intensity of alcohol use, and prior experience with AWS; data on comorbid conditions and medical history; and history of beta‐blocker use. During the period of observation following randomization, data were obtained on CIWA‐Ar scores; benzodiazepine doses administered; and adverse events, including use of sedatives in addition to benzodiazepines, use of restraints, use of intensive care, and clinical complications during the AWS course.
Study Procedures
The research pharmacy provided study medications (baclofen or placebo in identical form) for enrolled subjects. Subjects and study personnel were blinded to treatment group (baclofen vs placebo).
Nurses on inpatient units were provided with training in CIWA‐Ar assessment. All subjects were monitored for CIWA‐Ar scores at the time of study enrollment and for at least the next 72 hours. In monitoring the subjects, the nurses used the CIWA‐Ar protocol, in which subjects were assessed and potentially dosed with lorazepam hourly if their scores were 11 or higher. If the CIWA‐Ar score was less than 11, the subjects were assessed every 4 hours and at study discharge. CIWA‐AR results were reported as averaged over 8‐hour periods starting at study enrollment.
Data Analysis
Demographic and baseline variables with ordinal and continuous measurements, such as age, MMSE total score, and drinks per day were evaluated using group t test analysis, with two‐tailed significance estimates. Variables with prevalence reported were evaluated using the chi‐square test of significance. In accordance with the protocol, data from patients who had CIWA‐Ar assessments for at least 72 hours following randomization were included in the final study analyses. Repeated measures analysis of variance were conducted for the 2 treatment groups (baclofen and placebo), to evaluate mean CIWA‐Ar scores and mean lorazepam doses within each 8‐hour interval, as well as cumulative lorazepam dose. No covariates were included in the models. The last‐observation‐carried‐forward approach was used for those subjects who were missing CIWA‐Ar scores between baseline and their last CIWA‐Ar score. Doses for postdischarge patients without lorazepam prescriptions were set to 0 mg/8 hr. Cumulative lorazepam dose at 72 hours was also analyzed by defining the upper 25th percentile of existing doses (the upper 8 of 31) as high dose. This high‐dose lorazepam treatment level was determined to include all study participants receiving 20 mg or more of lorazepam during the first 72 hours. Fisher's exact test (two‐tailed) was then used to assess the difference in treatment group (baclofen vs placebo) for high‐dose lorazepam treatment.
RESULTS
Seventy‐nine subjects met study inclusion criteria, and provided informed consent for participation in the study. Of these, 44 subjects developed signs of AWS sufficient to meet DSMIV criteria for AWS diagnosis, and were randomized to receive either baclofen or placebo, in addition to benzodiazepine therapy. As summarized in Table 1, subjects who developed signs of AWS were similar to subjects who did not enter withdrawal, differing principally in that those who developed AWS reported more drinks per day, and more significant history of previous AWS.
| Withdrawal/Randomized | ||||
|---|---|---|---|---|
| No Withdrawal | All | Placebo | Baclofen | |
| Characteristic | (N = 35) | (N = 44) | (N = 19) | (N = 25) |
| ||||
| % Male | 82.9 | 84.1 | 94.7 | 76.0 |
| Age at admission (mean/SD) | 52.0/12.0 | 46.9/10.9 | 46.1/11.9 | 47.5/10.3 |
| MMSE total score (mean/SD) | 26.5/1.7 | 25.8/3.3 | 25.4/4.1 | 26.0/2.4 |
| Drinking history | ||||
| Age began drinking (mean/SD) | 16.7/4.2 | 16.2/4.3 | 15.5/4.5 | 16.7/4.2 |
| Years drinking (mean/SD) | 34.1/10.8 | 30.2/10.0 | 30.0/12.8 | 30.3/7.8 |
| Drinks per day (mean/SD)* | 11.2/8.8 | 16.3/9.7 | 14.4/7.8 | 18.0/11.0 |
| % Daily drinker | 65.7 | 64.1 | 57.9 | 70.0 |
| Days since last drink (mean/SD) | 1.5/0.9 | 1.3/1.3 | 1.0/0.8 | 1.6/1.5 |
| Medical history, % with history of | ||||
| Alcohol withdrawal syndrome | 60.6 | 87.5 | 87.5 | 87.5 |
| Seizures*, | 30.0 | 53.8 | 33.3 | 66.7 |
| DTs* | 48.3 | 74.3 | 80.0 | 70.0 |
| Medications, % at time of admission | ||||
| Alcohol treatment | 0.0 | 4.5 | 5.3 | 4.0 |
| Beta‐blocker | 31.4 | 25.0 | 26.3 | 24.0 |
| Sleep agent | 2.9 | 6.8 | 5.3 | 8.0 |
| Narcotic pain medication | 37.1 | 40.9 | 31.6 | 48.0 |
| Depakote | 0.0 | 4.5 | 0.0 | 8.0 |
| Benzodiazepine | 2.9 | 11.4 | 10.5 | 12.0 |
| Anti‐anxiety medication | 2.9 | 2.3 | 0.0 | 4.0 |
| Anti‐psychotic medication | 5.7 | 6.8 | 10.5 | 4.0 |
| Other psychiatric medication | 2.9 | 9.1 | 5.3 | 12.0 |
The 79 subjects who were enrolled were drawn from a population of 237 potential subjects who were screened for the study. The most common reasons that the 158 potential subjects were not enrolled were refusal (29.7%), low risk of withdrawal (19.0%), inability to provide consent (9.5%), and concurrent use of benzodiazepines (8.9%). The 15 patients who were unable to provide consent were those who scored 24 or lower on the MMSE, and did not have a surrogate decision‐maker available.
Of the 44 subjects who were randomized, 31 (18 in the baclofen group, 13 in the placebo group) completed 72 hours of CIWA‐Ar assessments, as summarized in Table 2. These assessments were completed either entirely as inpatients (24 subjects) or with inpatient assessments followed by outpatient assessments after discharge (7 subjects). Discharges prior to 72 hours occurred in 3 of the 18 subjects receiving baclofen, and in 4 of the 13 receiving placebo (odds ratio = 0.45, 95% CI = 0.082.49). Mean CIWA‐Ar scores for the 31 subjects who completed 72 hours of CIWA‐Ar assessments are presented in Figure 1.
| All | Placebo | Baclofen | |
|---|---|---|---|
| Characteristic | (N = 31) | (N = 13) | (N = 18) |
| |||
| % Male | 87.1 | 92.3 | 83.3 |
| Age at admission (mean/SD) | 47.5/10.2 | 45.7/9.3 | 48.7/10.9 |
| MMSE total score (mean/SD) | 26.3/2.2 | 26.3/1.8 | 26.3/2.6 |
| Charlson Comorbidity Score | 1.0/1.1 | 1.1/0.9 | 1.0/1.3 |
| Drinking history | |||
| Age began drinking (mean/SD) | 16.7/4.6 | 16.1/4.3 | 17.1/5.0 |
| Years drinking (mean/SD) | 29.8/8.6 | 29.5/10.0 | 30.0/7.9 |
| Drinks per day (mean/SD) | 16.0/9.9 | 12.9/8.4 | 18.6/10.5 |
| % Daily drinker | 58.1 | 53.8 | 78.6 |
| Days since last drink (mean/SD) | 1.2/0.9 | 1.1/0.8 | 1.3/1.1 |
| Current hospitalization, primary diagnosis | |||
| Alcohol withdrawal syndrome/alcoholism | 48.4 | 46.2 | 50.0 |
| Probably related to alcoholism* | 35.5 | 38.5 | 33.3 |
| Other | 16.1 | 15.4 | 16.7 |
| Medical history, % with history of | |||
| Alcohol withdrawal syndrome | 89.7 | 83.3 | 94.1 |
| Seizures | 60.7 | 45.5 | 70.6 |
| DTs | 79.2 | 80.0 | 78.6 |
| Medications, % at time of admission | |||
| Alcohol treatment | 6.5 | 7.7 | 5.6 |
| Beta‐blocker | 29.1 | 23.1 | 33.3 |
| Sleep agent | 6.5 | 7.7 | 5.6 |
| Narcotic pain medication | 45.2 | 30.8 | 55.6 |
| Depakote | 6.5 | 0.0 | 11.1 |
| Benzodiazepine | 9.7 | 15.4 | 5.6 |
| Anti‐anxiety medication | 3.2 | 0.0 | 5.6 |
| Anti‐psychotic medication | 9.7 | 15.4 | 5.6 |
| Other psychiatric medication | 6.5 | 7.7 | 5.6 |
Figures 2 and 3 summarize the mean lorazepam doses in each 8‐hour period, and the cumulative lorazepam doses for the subjects in the 2 arms of the study, respectively. The cumulative dose of lorazepam administered to the 31 subjects ranged from 0 to 1035 mg in the 72 hours following randomization, with a range of 1 to 1035 mg in the placebo group and 0 to 39 mg in the baclofen group. The 8 subjects who received the highest doses of lorazepam (20 mg or more) included 1 of the 18 subjects who received baclofen and 7 of the 13 subjects who received placebo (P = 0.004). Only 4 subjects required >50 mg of lorazepam over the 72 hours; all 4 of these were patients in the placebo group (P = 0.023).
Subjects who received baclofen and subjects who received placebo did not differ significantly in regard to the use of sedatives other than benzodiazepines, the use of restraints, the use of intensive care, or other clinical complications. On the basis this analysis, the study's primary null hypothesis was not rejected (the CIWA‐Ar scores in the baclofen and placebo groups were not different), but the secondary null hypothesis was rejected (baclofen was associated with lower likelihood of the use of high doses of benzodiazepines).
DISCUSSION
Benzodiazepines are effective drugs in the treatment of alcohol withdrawal syndrome. They remain the gold standard of treatment. The most effective method of administering benzodiazepines to acutely withdrawing patients has been shown to be variable dosing, based on withdrawal symptoms.
Our small study of acutely withdrawing inpatients confirmed that benzodiazepines, administered at frequencies and doses dependent on AWS symptoms, work well to control CIWA‐Ar scores over a relatively short time span. Our study also demonstrated that the addition of the GABA‐B agonist baclofen orally, at a fixed dose of 30 mg daily, will allow the same level of AWS symptom control, while reducing the risk that high doses of benzodiazepines will be needed to achieve that control. Reducing the use of high‐dose benzodiazepines has the potential to improve patient safety. In addition, since the frequency of nursing assessments parallel CIWA‐AR scores and benzodiazepine dosing frequency, using oral baclofen in this setting has the potential to decrease the nursing time required to control withdrawal symptoms.
A larger study of AWS will be needed to assess the role of baclofen in managing the frequency and severity of the complications of AWS, such as prolonged sedation, intensive care admission, and ventilator days. The current study was not powered to assess differences in the frequency of relatively rare events, and we excluded patients who required intravenous benzodiazepines for AWS symptom management. However, in light of the well‐documented risk of sedation and respiratory depression from high‐dose benzodiazepines, our findings suggest that a larger study of the role of baclofen in AWS management is warranted.
Either baclofen or benzodiazepines may have severe adverse effects in high doses. In this study, we used a low, fixed dose of baclofen (10 mg every 8 hours), a level at which severe side effects such as respiratory depression are uncommon. Our principal finding was that the use of low‐dose baclofen is associated with reduced use of high‐dose benzodiazepines in some AWS patients.
Further Research
The use of baclofen and other adjunctive treatments in the management of AWS and other alcohol dependency syndromes warrants future study. If the benzodiazepine‐sparing effects of baclofen in AWS management are confirmed in additional studies, baclofen may become an important adjunct to benzodiazepines in AWS management, particularly in settings where the use of symptom‐triggered therapy is difficult.
It is difficult to predict which suddenly abstinent alcoholics will experience severe AWS. In the current study, 44 of the 79 patients judged by experienced clinicians to be at high risk for acute AWS reached the CIWA‐Ar threshold (a score of 11 or more) to be randomized. We found that those who experienced significant withdrawal were younger, drank more heavily, and had more prior experience with severe AWS, which is consistent with earlier studies.23, 24 Nevertheless, patient history is not a reliable predictor of risk for AWS; clinicians are often obliged to watch and wait until clinical signs of AWS develop. In light of the growing evidence that baclofen alleviates many symptoms of alcohol dependence, both in patients with AWS and in those in recovery,19, 20, 2529 future research should also examine the role of baclofen in preventing AWS in at‐risk patients.
Since ethanol has effects on several neurotransmitters and receptor systems, combinations of medications that modify GABA, glutamate, and adrenergic activity in low doses may be more effective and safer in managing AWS than using high doses of a single agent. Future research should seek to identify the most effective combination of low‐dose medications in managing AWS.
Study Limitations
This study was subject to several significant limitations. With a small study population (31 subjects), the experiences of individual subjects had a strong effect on the findings (such as the dip in mean lorazepam doses for placebo subjects in Figure 2, which was due to a high‐dose subject sleeping through the observation period). However, the overall finding of the lorazepam‐sparing effect of baclofen was consistent. We excluded patients who required intravenous benzodiazepines for AWS management, and so our study did not include the most severe AWS subjects. However, all of our subjects showed signs of mild‐to‐moderate alcohol withdrawal upon enrollment (CIWA‐Ar scores of 11 or more upon randomization), and all were at risk for more severe AWS; many went on to much higher CIWA‐AR scores during the course of their AWS. Of the 44 subjects who were randomized, 13 did not complete the study; the impact that these subjects might have had on the findings is unknown. However, the subjects who did not complete the study (baclofen 54%, placebo 46%) did not differ from the remaining subjects in regard to any of the variables used in the study. More baclofen‐treated than placebo‐treated subjects were taking narcotics and/or beta‐blockers at the time of enrollment, although these differences were not statistically significant, and their impact upon our findings are unknown. This study was conducted in northeast Minnesota; the study population reflected the limited diversity of the region. Caution should be used in generalizing the findings to other populations.
CONCLUSION
These findings suggest that baclofen may have potential as an adjunct in the management of acute alcohol withdrawal.
- .Clinical practice. Unhealthy alcohol use.N Engl J Med.2005;352(6):596–607.
- ,,, et al.Patients with alcohol problems in the emergency department, part 1: improving detection. SAEM Substance Abuse Task Force. Society for Academic Emergency Medicine.Acad Emerg Med.1998;5(12):1200–1209.
- ,,.Screening for alcohol problems in primary care: a systematic review.Arch Intern Med.2000;160(13):1977–1989.
- ,.Trends in Alcohol‐Related Morbidity Among Short‐Stay Community Hospital Discharges, United States, 1979–2006. Surveillance Report #84.Arlington, VA:National Institute on Alcohol Abuse and Alcoholism; August2008.
- ,,, et al.Alcohol withdrawal syndrome: turning minor injuries into a major problem.J Trauma.2006;61(6):1441–1446.
- ,,,,,.An assessment of the potential value of elevated homocysteine in predicting alcohol‐withdrawal seizures.Epilepsia.2006;47(5):934–938.
- ,.Combining the audit questionnaire and biochemical markers to assess alcohol use and risk of alcohol withdrawal in medical inpatients.Alcohol Alcohol.2005;40(6):515–519.
- .A model for predicting alcohol withdrawal delirium.Psychiatr Serv.2001;52(6):820–823.
- .[GABA‐system and alcohol: does an “ethanol receptor” exist?] [review].Zh Nevrol Psikhiatr Im S S Korsakova.2007;Suppl 1:56–62.
- ,,, et al.Identification of molecular targets associated with ethanol toxicity and implications in drug development.Curr Pharm Des.2010;16(11):1313–1355.
- ,,,,.Baclofen: a new drug for the treatment of alcohol dependence.Int J Clin Pract.2006;60(8):1003–1008.
- ,.3H‐baclofen and 3H‐GABA bind to bicuculline‐insensitive GABA B sites in rat brain.Nature.1981;290(5802):149–152.
- ,.Differential effects of GABA(A) and GABA(B) agonists on sensitization to the locomotor stimulant effects of ethanol in DBA/2 J mice.Psychopharmacology (Berl).1999;141(2):197–205.
- .Cerebral GABA receptors.Alcohol Alcohol Suppl.1994;2:181–186.
- ,,, et al.Symptom‐triggered vs fixed‐schedule doses of benzodiazepine for alcohol withdrawal.Arch Intern Med.2002;162(10):1117–1121.
- .Short‐term lorazepam infusion and concern for propylene glycol toxicity: case report and review.Pharmacother.2001;21(9):1140–1144.
- ,,,,,.The use of continuous IV sedation is associated with prolongation of mechanical ventilation.Chest.1998;114:541–548.
- ,,, et al.Rapid suppression of alcohol withdrawal syndrome by baclofen.Am J Med.2002;112(3):226–229.
- ,,,,,.Ability of baclofen in reducing alcohol craving and intake: II—preliminary clinical evidence.Alcohol Clin Exp Res.2000;24(1):67–71.
- ,,, et al.Baclofen efficacy in reducing alcohol craving and intake: a preliminary double‐blind randomized controlled study.Alcohol Alcohol.2002;37(5):504–508.
- ,,, et al.Baclofen in the treatment of alcohol withdrawal syndrome: a comparative study vs diazepam.Am J Med.2006;119:276.e213–276.e218.
- ,,,,.Relationship between Alzheimer's disease severity and patient participation in decisions about their care.J Geriatr Psychiatry Neurol.2002;15(2):68–72.
- ,,.Impact of age on the severity, course, and complications of alcohol withdrawal.Arch Intern Med.1997;157(19):2234–2241.
- ,,.Independent clinical correlates of severe alcohol withdrawal.Substance Abuse.2003;24(4):197–209.
- ,,, et al.Effectiveness and safety of baclofen for maintenance of alcohol abstinence in alcohol‐dependent patients with liver cirrhosis: randomised, double‐blind study.Lancet.2007;370:1915–1922.
- ,,, et al.Baclofen for alcohol dependence: a preliminary open‐label study.Alcohol Clin Exp Res.2004;28(10):1517–1523.
- ,,,.[Pharmacological treatment options for prevention of alcohol relapse].Fortschr Neurol Psychiatr.2008;76(7):421–428.
- ,.Pharmacological treatment of alcohol dependence: target symptoms and target mechanisms.Pharmacol Ther.2006;111:855–876.
- ,.Baclofen as prophylaxis and treatment for alcohol withdrawal: a retrospective chart review.J Okla State Med Assoc.2007;100(9):354–360.
Copyright © 2011 Society of Hospital Medicine

Too Many Cooks in the Kitchen?
The tension between continuity of care and specialization is not new, but may have reached a tipping point when the hospitalist movement erupted onto the American medical scene in the late 1990s. By definition, when a hospitalist cares for an inpatient, there is some fragmentation of care, which is, at least in theory, avoidableif the primary care provider (PCP) can serve as attending physician in the hospital. Literature has since emerged suggesting that clinical and economic outcomes of care by hospitalists are at least as good as that provided by PCPs, and that patients are not, in general, opposed to hospitalist care.13
However, the degree of discontinuity is not just a feature of whether a hospitalist assumes care of the hospitalized patient. Discontinuity can be exacerbated by changing attendings throughout the hospital stay. And inpatient continuity is a potential issue for both the hospitalist model and traditional model of care (in which the PCP serves as inpatient attending physician). While one might assume that the hospitalist model fosters more inpatient discontinuity because most hospitalistswhether working a 7‐on7‐off schedule or another scheduledo not commit to caring for a patient throughout an entire hospitalization the way a PCP might, this question has not previously been examined. Even if the hospitalist model is a fait accompli in many hospitals, it is worth knowing how inpatient continuity differs between the 2 models.
In this issue of the Journal, Fletcher and colleagues4 used billing data to examine trends in inpatient continuity of care over a 10‐year period ending in 2006, and sought to determine: (1) whether inpatient care has become more fragmented over time (as defined by the number of generalists caring for a patient over the course of an average hospitalization), and (2) whether inpatient care provided by hospitalists tends to be more fragmented than care provided by PCPs. They found that continuity of inpatient care has indeed decreased over time. In 1996, just over 70% of patients received care from 1 generalist; this number declined to just under 60% a decade later, despite a decrease in length‐of‐stay during that period. However, and perhaps surprisingly, patients cared for exclusively by hospitalists saw fewer generalists in the hospital (ie, fewer different hospitalists) than those cared for exclusively by outpatient providers. The authors conclude that the doctorpatient continuity over the course of a hospital stay is not worse in the hospitalist model than in the traditional model. While reassuring, it is important to remember that the patient experience does not begin at admission or end at discharge, and a more patient‐centered analysis might take into account the outpatient providers too (ie, those seeing the patient before admission and after discharge), and would probably show that the hospitalist model indeed leads to more care fragmentation. After all, there are at least 2 providers involved in every patient's care when a hospitalist model is used, whereas a large subset of patients cared for by PCPs would have only 1 provider involved.
While not the primary focus of the analysis, Fletcher and colleagues4 identified additional predictors of inpatient continuity of care. Higher socioeconomic class and white race were associated with lower continuity. This suggests that care fragmentation is not a feature of inferior, or at least cheap, care. In keeping with this observation, there was also enormous geographic variation in inpatient care continuity, marked by greater fragmentation of care in the New England and the mid‐Atlantic regions than in other areas of the country, and more fragmentation in larger hospitals serving heavily populated metropolitan areas. This pattern is strikingly similar to the cost‐of‐care patterns observed by the Dartmouth Atlas researchers.5, 6 Densely populated areas tend to have more specialists per capita and also tend to deliver more expensive carewithout demonstrably higher quality. In parallel, it is easy to see how care fragmentation might increase length‐of‐stay7 and lead to excessive diagnostic testing and consultation. More cooks in the kitchen might make costlier stew.
How hospitalists tackle the issue of inpatient continuity is not only a matter of quality of care, but also a matter of job sustainability. The simple way to maximize continuityworking many consecutive dayscan lead to burnout if taken too far. But there are creative ways to assign admissions that maximize continuity for the average inpatient while allowing providers needed time off. The CICLE initiative (Creating Incentives and Continuity Leading to Efficiency in hospital medicine) at the Johns Hopkins Bayview Medical Center, for instance, assigns physicians to 4‐day cycles of clinical work; the first day of the cycle (a long‐call day) involves admitting a large number of patients during a busy shift, with no new patients admitted on the remaining days of the cycle. Thus, all patients whose length of stay is less than 5 days will have a single attending‐of‐record. Not only does this model increase continuity, it also incentivizes providers to augment throughput: more discharged patients on Tuesday means fewer patients to see on Wednesday, without any expectation to backfill. Other less aggressive but similar approaches are used elsewhere, such as exempting hospitalists from accepting new patients on the last 1 or 2 of the consecutive days they work. We eagerly await data on the impact of these programs on quality of care, patient satisfaction, and provider satisfaction.
The impact of other providers and staff cannot be ignored. While the most important handoff in many cases may indeed be between the PCP and attending hospitalist tasked with coordinating the overall care of the patient, for some patients, there may be a specialist who has known the patient for years who is driving the plan of care. For patients with severe chronic illnesses, such as end‐stage renal disease or asthma, a well‐structured specialty clinic may even serve as a patient‐centered medical home.8 And the current inpatient team includes night coverage physicians (whether moonlighters, house staff, or covering hospitalists), and an ever‐increasing number of non‐physicians who play a critical role in hospital care (non‐physician providers, nurses, social workers, pharmacists, case managers, physical therapists, and others). While it is tempting to focus on the attending physician as the main driver of healthcare quality, continuity, and the inpatient experience, this is an oversimplification.
If there is a take‐home message, it is probably that most hospitalized patients will be cared for by multiple providers and a team of non‐physicians. The Marcus Welby practice model may not be completely dead, but if Dr. Welby were still in practice, it would be a safe bet that he would be slower at computerized order entry than the average intern, that financial pressures would make it hard for him to attend to his hospitalized patients, and that he probably would have turned over much of his inpatient practice to the physicians and non‐physician caregivers who make the hospital their primary workplace.9 Going forward, research should examine ways to optimize care coordination under the hospitalist model,1013 rather than comparing it to the traditional model of inpatient care. The ingredients for success include coordinated care by a committee of caregivers, effective handoffs (throughout hospitalization and at discharge),12, 14 focused and deliberate multidisciplinary communication, and effective patient education,15 regardless of the attending‐du‐jour.
- ,.The impact of hospitalists on the cost and quality of inpatient care in the United States: a research synthesis.Med Care Res Rev.2005;62:379–406.
- ,,,.How physicians perceive hospitalist services after implementation: anticipation vs reality.Arch Intern Med.2003;163:2330–2336.
- ,,,,,.Outcomes of care by hospitalists, general internists, and family physicians.N Engl J Med.2007;357:2589–2600.
- ,,,,.Trends in inpatient continuity of care for a cohort of Medicare patients, 1996–2006.J Hosp Med.2011;6:438–444.
- ,,,,,.The implications of regional variations in Medicare spending. Part 2: health outcomes and satisfaction with care.Ann Intern Med.2003;138:288–298.
- ,,,,,.The implications of regional variations in Medicare spending. Part 1: the content, quality, and accessibility of care.Ann Intern Med.2003;138:273–287.
- ,,,,.The impact of fragmentation of hospitalist care on length of stay.J Hosp Med.2010;5:335–338.
- ,.Specialists/subspecialists and the patient‐centered medical home.Chest.2010;137:200–204.
- ,.U.S. trends in hospitalization and generalist physician workforce and the emergence of hospitalists.J Gen Intern Med.2010;25:453–459.
- ,,,.Understanding communication during hospitalist service changes: a mixed methods study.J Hosp Med.2009;4:535–540.
- ,,, et al.Transition of care for hospitalized elderly patients—development of a discharge checklist for hospitalists.J Hosp Med.2006;1:354–360.
- ,,,,,.Hospitalist handoffs: a systematic review and task force recommendations.J Hosp Med.2009;4:433–440.
- .The hospitalist field turns 15: new opportunities and challenges.J Hosp Med.2011;6:E1–E4.
- ,,, et al.Transitions of Care Consensus Policy Statement American College of Physicians‐Society of General Internal Medicine‐Society of Hospital Medicine‐American Geriatrics Society‐American College of Emergency Physicians‐Society of Academic Emergency Medicine.J Gen Intern Med.2009;24:971–976.
- ,,, et al.A reengineered hospital discharge program to decrease rehospitalization: a randomized trial.Ann Intern Med.2009;150:178–187.
The tension between continuity of care and specialization is not new, but may have reached a tipping point when the hospitalist movement erupted onto the American medical scene in the late 1990s. By definition, when a hospitalist cares for an inpatient, there is some fragmentation of care, which is, at least in theory, avoidableif the primary care provider (PCP) can serve as attending physician in the hospital. Literature has since emerged suggesting that clinical and economic outcomes of care by hospitalists are at least as good as that provided by PCPs, and that patients are not, in general, opposed to hospitalist care.13
However, the degree of discontinuity is not just a feature of whether a hospitalist assumes care of the hospitalized patient. Discontinuity can be exacerbated by changing attendings throughout the hospital stay. And inpatient continuity is a potential issue for both the hospitalist model and traditional model of care (in which the PCP serves as inpatient attending physician). While one might assume that the hospitalist model fosters more inpatient discontinuity because most hospitalistswhether working a 7‐on7‐off schedule or another scheduledo not commit to caring for a patient throughout an entire hospitalization the way a PCP might, this question has not previously been examined. Even if the hospitalist model is a fait accompli in many hospitals, it is worth knowing how inpatient continuity differs between the 2 models.
In this issue of the Journal, Fletcher and colleagues4 used billing data to examine trends in inpatient continuity of care over a 10‐year period ending in 2006, and sought to determine: (1) whether inpatient care has become more fragmented over time (as defined by the number of generalists caring for a patient over the course of an average hospitalization), and (2) whether inpatient care provided by hospitalists tends to be more fragmented than care provided by PCPs. They found that continuity of inpatient care has indeed decreased over time. In 1996, just over 70% of patients received care from 1 generalist; this number declined to just under 60% a decade later, despite a decrease in length‐of‐stay during that period. However, and perhaps surprisingly, patients cared for exclusively by hospitalists saw fewer generalists in the hospital (ie, fewer different hospitalists) than those cared for exclusively by outpatient providers. The authors conclude that the doctorpatient continuity over the course of a hospital stay is not worse in the hospitalist model than in the traditional model. While reassuring, it is important to remember that the patient experience does not begin at admission or end at discharge, and a more patient‐centered analysis might take into account the outpatient providers too (ie, those seeing the patient before admission and after discharge), and would probably show that the hospitalist model indeed leads to more care fragmentation. After all, there are at least 2 providers involved in every patient's care when a hospitalist model is used, whereas a large subset of patients cared for by PCPs would have only 1 provider involved.
While not the primary focus of the analysis, Fletcher and colleagues4 identified additional predictors of inpatient continuity of care. Higher socioeconomic class and white race were associated with lower continuity. This suggests that care fragmentation is not a feature of inferior, or at least cheap, care. In keeping with this observation, there was also enormous geographic variation in inpatient care continuity, marked by greater fragmentation of care in the New England and the mid‐Atlantic regions than in other areas of the country, and more fragmentation in larger hospitals serving heavily populated metropolitan areas. This pattern is strikingly similar to the cost‐of‐care patterns observed by the Dartmouth Atlas researchers.5, 6 Densely populated areas tend to have more specialists per capita and also tend to deliver more expensive carewithout demonstrably higher quality. In parallel, it is easy to see how care fragmentation might increase length‐of‐stay7 and lead to excessive diagnostic testing and consultation. More cooks in the kitchen might make costlier stew.
How hospitalists tackle the issue of inpatient continuity is not only a matter of quality of care, but also a matter of job sustainability. The simple way to maximize continuityworking many consecutive dayscan lead to burnout if taken too far. But there are creative ways to assign admissions that maximize continuity for the average inpatient while allowing providers needed time off. The CICLE initiative (Creating Incentives and Continuity Leading to Efficiency in hospital medicine) at the Johns Hopkins Bayview Medical Center, for instance, assigns physicians to 4‐day cycles of clinical work; the first day of the cycle (a long‐call day) involves admitting a large number of patients during a busy shift, with no new patients admitted on the remaining days of the cycle. Thus, all patients whose length of stay is less than 5 days will have a single attending‐of‐record. Not only does this model increase continuity, it also incentivizes providers to augment throughput: more discharged patients on Tuesday means fewer patients to see on Wednesday, without any expectation to backfill. Other less aggressive but similar approaches are used elsewhere, such as exempting hospitalists from accepting new patients on the last 1 or 2 of the consecutive days they work. We eagerly await data on the impact of these programs on quality of care, patient satisfaction, and provider satisfaction.
The impact of other providers and staff cannot be ignored. While the most important handoff in many cases may indeed be between the PCP and attending hospitalist tasked with coordinating the overall care of the patient, for some patients, there may be a specialist who has known the patient for years who is driving the plan of care. For patients with severe chronic illnesses, such as end‐stage renal disease or asthma, a well‐structured specialty clinic may even serve as a patient‐centered medical home.8 And the current inpatient team includes night coverage physicians (whether moonlighters, house staff, or covering hospitalists), and an ever‐increasing number of non‐physicians who play a critical role in hospital care (non‐physician providers, nurses, social workers, pharmacists, case managers, physical therapists, and others). While it is tempting to focus on the attending physician as the main driver of healthcare quality, continuity, and the inpatient experience, this is an oversimplification.
If there is a take‐home message, it is probably that most hospitalized patients will be cared for by multiple providers and a team of non‐physicians. The Marcus Welby practice model may not be completely dead, but if Dr. Welby were still in practice, it would be a safe bet that he would be slower at computerized order entry than the average intern, that financial pressures would make it hard for him to attend to his hospitalized patients, and that he probably would have turned over much of his inpatient practice to the physicians and non‐physician caregivers who make the hospital their primary workplace.9 Going forward, research should examine ways to optimize care coordination under the hospitalist model,1013 rather than comparing it to the traditional model of inpatient care. The ingredients for success include coordinated care by a committee of caregivers, effective handoffs (throughout hospitalization and at discharge),12, 14 focused and deliberate multidisciplinary communication, and effective patient education,15 regardless of the attending‐du‐jour.
- ,.The impact of hospitalists on the cost and quality of inpatient care in the United States: a research synthesis.Med Care Res Rev.2005;62:379–406.
- ,,,.How physicians perceive hospitalist services after implementation: anticipation vs reality.Arch Intern Med.2003;163:2330–2336.
- ,,,,,.Outcomes of care by hospitalists, general internists, and family physicians.N Engl J Med.2007;357:2589–2600.
- ,,,,.Trends in inpatient continuity of care for a cohort of Medicare patients, 1996–2006.J Hosp Med.2011;6:438–444.
- ,,,,,.The implications of regional variations in Medicare spending. Part 2: health outcomes and satisfaction with care.Ann Intern Med.2003;138:288–298.
- ,,,,,.The implications of regional variations in Medicare spending. Part 1: the content, quality, and accessibility of care.Ann Intern Med.2003;138:273–287.
- ,,,,.The impact of fragmentation of hospitalist care on length of stay.J Hosp Med.2010;5:335–338.
- ,.Specialists/subspecialists and the patient‐centered medical home.Chest.2010;137:200–204.
- ,.U.S. trends in hospitalization and generalist physician workforce and the emergence of hospitalists.J Gen Intern Med.2010;25:453–459.
- ,,,.Understanding communication during hospitalist service changes: a mixed methods study.J Hosp Med.2009;4:535–540.
- ,,, et al.Transition of care for hospitalized elderly patients—development of a discharge checklist for hospitalists.J Hosp Med.2006;1:354–360.
- ,,,,,.Hospitalist handoffs: a systematic review and task force recommendations.J Hosp Med.2009;4:433–440.
- .The hospitalist field turns 15: new opportunities and challenges.J Hosp Med.2011;6:E1–E4.
- ,,, et al.Transitions of Care Consensus Policy Statement American College of Physicians‐Society of General Internal Medicine‐Society of Hospital Medicine‐American Geriatrics Society‐American College of Emergency Physicians‐Society of Academic Emergency Medicine.J Gen Intern Med.2009;24:971–976.
- ,,, et al.A reengineered hospital discharge program to decrease rehospitalization: a randomized trial.Ann Intern Med.2009;150:178–187.