User login
Multiple sclerosis, natalizumab, and PML: Helping patients decide
Multiple sclerosis (MS) is an autoimmune disease whose inflammatory process causes demyelination, axonal loss, and neurodegeneration, all of which can lead to progressive neurologic disability. Without treatment, the risk of progressive disability 15 to 20 years after the onset of MS has been estimated to be as high as 50%.1
Seven drugs have been approved by the US Food and Drug Administration (FDA) for the treatment of MS. Of these, interferon beta drugs and glatiramer acetate are generally considered as first-line agents based on extensive experience and relative safety. Indeed, reports with followup approaching 20 years have not identified significant safety concerns. However, these agents have only modest efficacy, reducing by approximately 30% the frequency of relapse in patients with relapsing-remitting MS.2–6
Natalizumab, and more recently, fingolimod, are generally used as second-line agents. Fingolimod, the first oral agent to receive FDA approval for the treatment of relapsing-remitting MS, is a functional antagonist of sphingosine-1-phosphate receptors. The reductions in annualized relapse rates in two phase 3 controlled trials of fingolimod were approximately 55% compared with placebo7 or intramuscular interferon beta-1a.8 Because of its more convenient oral route of administration and its documented efficacy, widespread use of fingolimod is anticipated. However, adverse reactions affecting more than 10% of patients include headache, influenza, diarrhea, back pain, liver transaminase elevations, and cough.9 Because sphingosine-1-phosphate receptors are widespread in many body tissues, off-target effects of fingolimod may be problematic and long-term toxicity is unknown.
In addition to natalizumab and fingolimod, which are currently available for use as second-line agents, several other MS therapies are showing promise. Oral cladribine, teriflunomide, and laquinimod have reported positive phase 3 results in publication or at national meetings, and several other drugs are in late stages of development (alemtuzumab, BG-12, ocrelizumab) based on encouraging phase 2 results.10–12 Thus, the options for MS patients are expanding, but drugs with higher efficacy also may pose greater risk.
NATALIZUMAB: ROBUST BENEFITS BUT ASSOCIATED RISK
Natalizumab is a humanized monoclonal antibody that binds to alpha-4 integrin on leukocytes. By inhibiting alpha-4 integrin, natalizumab, the first of a new class of selective adhesion-molecule inhibitors, impedes migration of activated mononuclear leukocytes into the brain and gut.13
Significant efficacy
Two phase 3 studies demonstrated more robust efficacy of natalizumab in patients with relapsing-remitting MS than had been observed in prior studies with other agents.14,15 In the Natalizumab Safety and Efficacy in Relapsing-Remitting Multiple Sclerosis (AFFIRM) study, which followed patients over 2 years of treatment, natalizumab was associated with a 68% reduction in the annualized relapse rate14; a 92% reduction in gadolinium-enhanced lesions on magnetic resonance imaging (MRI), which indicate new, active lesions16; and an 83% reduction in the mean number of new or enlarging T2 lesions16 compared with placebo. The likelihood of confirmed worsening on the Kurtzke Expanded Disability Status Score, which is the standard measure for MS-related disability, was also 42% lower in patients assigned to natalizumab compared with placebo.14
Other reported benefits from natalizumab therapy include a significantly increased probability of maintaining disease-free status17 and clinically significant improvements on patient-reported quality-of-life measures.18 Although there have been no head-to-head studies of natalizumab with interferon beta, glatiramer acetate, or fingolimod, there is a widespread view that treatment benefits of natalizumab exceed those of other disease-modifying drugs. In clinical practice, patients with MS who experience breakthrough disease on standard disease-modifying drugs are routinely observed to achieve disease control after switching to natalizumab. Thus, based purely on efficacy, patient-reported outcomes, and the convenience of once-monthly intravenous infusion, natalizumab represents an extremely attractive treatment option for patients with relapsing-remitting MS.
Use discontinued in 2005
Natalizumab was approved for treatment of relapsing-remitting MS in November 2004, using the FDA accelerated review pathway. The approval was based on the first-year results of the AFFIRM14 and the Natalizumab plus Interferon Beta-1a for Relapsing Remitting Multiple Sclerosis (SENTINEL)19 studies, both of which were completed in February 2005. In the 3 to 4 months between the drug’s approval and completion of the AFFIRM and SENTINEL studies, approximately 7,000 patients with relapsing-remitting MS received treatment with natalizumab. In February 2005, shortly after the release of the 2-year data, three cases of progressive multifocal leukoencephalopathy (PML) were identified in natalizumab-treated patients (one with Crohn disease, the other two with MS). Clinical and research use of natalizumab was abruptly suspended that month, pending a comprehensive safety review.
A safety study evaluated 3,116 patients who had received natalizumab over a mean exposure of 17.9 monthly doses.20 The study failed to identify any additional cases of PML and concluded that the risk of PML was approximately 1 in 1,000 patients. Abrupt discontinuation of natalizumab also allowed systematic assessment of disease behavior following treatment interruption. In 1,866 patients who had received natalizumab during clinical trials but who discontinued natalizumab after PML was recognized, MS relapses and gadolinium-enhancing lesions returned approximately to baseline levels within 4 to 7 months of natalizumab suspension. Reactivation of MS disease activity was observed even in patients who instituted one of the first-line disease-modifying drugs as substitute therapy.21
Based on the strong efficacy data and the extensive safety review, an FDA advisory committee recommended reintroduction, and natalizumab was returned to the market in June 2006. Natalizumab may be administered only in accredited infusion centers that agree to a monthly reporting regimen designed to identify all cases of PML. In the United States, natalizumab is available to patients only through the Tysabri Outreach Unified Commitment to Health (TOUCH) Prescribing Program, a restricted distribution program. Aggressive monitoring and reporting is also required in other regions of the world, so that ascertainment of PML associated with natalizumab is thought to be relatively complete.
Risk related to duration of therapy
Of the first 35 cases of natalizumab-associated PML, 10 cases (29%) were fatal. Among surviving patients, the level of disability was found to be severe in 48%; moderate in 36%; and mild in 16%.23 Improved survival was associated with younger age, less MS-related disability prior to PML, more localized disease on brain MRI at diagnosis, and shorter time from symptom onset to PML diagnosis.23 As of August 4, 2011, there were 150 confirmed cases of natalizumab-associated PML (58 in the United States, 85 in Europe, and 7 from the rest of the world); of these, 29 (19%) have died.22
VARIATION IN PATIENT RISK TOLERANCE
The postmarketing surveillance of natalizumab clearly demonstrates that risk is associated with administration of the drug, but risk tolerance varies considerably among individuals with MS. Some patients elect to use natalizumab despite the risk of PML, even when they have relatively mild MS. Other patients decline use of natalizumab even when their MS is severe and has responded poorly to other disease-modifying drugs.
In most cases, based on my experience, patients accept the risk of natalizumab-associated PML if MS disease is their primary consideration. Another major factor is the patient’s prior experiences with disease-modifying drugs; patients who have experienced breakthrough disease activity despite treatment with first-line drugs commonly opt for natalizumab regardless of the risk of PML.
Interestingly, the treating neurologist’s perception of MS severity and risk of PML may differ from the patient’s perception. In a study of 69 natalizumab-treated MS patients and 66 neurologists, Heesen et al found that patients had a significantly worse perception of their disease and were more willing to assume treatment risks and continue natalizumab therapy than their neurologists were.24 About one-half of the neurologists said that they would discontinue natalizumab at a risk level of 1 in 5,000 or lower, whereas only 17% of the patients would stop at this risk level. This finding has significant implications for clinical practice and implies that the neurologist should discuss concerns about MS and risk of treatment with the patient in order to tailor the decision to the patient’s concerns.
Interest in identifying biomarkers to aid in quantifying risk is ongoing. Chen et al found that subclinical reactivation of the JC virus (JCV) occurred frequently in 19 natalizumab-treated MS patients.25 Another study of 24 natalizumab-treated MS patients found no JCV DNA in the blood, although JCV DNA was found in the urine in 25% of patients.26 A large survey of blood and urine from natalizumab-treated MS patients found low sensitivity and specificity for JCV DNA as a predictor for subsequent PML.27 In this study of more than 1,000 natalizumab-treated patients, JCV DNA was detected in 0.3% of patients’ plasma and in 26% of patients’ urine, but PML did not develop in any patient who was JCV-positive. Among five natalizumab-treated patients who developed PML, JCV DNA was detected in none before the advent of symptoms. The presence of JCV DNA in bodily fluids is important for the diagnosis of PML, but it currently holds no predictive clinical value. At present, measuring JCV DNA in blood, cells, or urine as a predictive biomarker for natalizumab-associated PML does not appear to be clinically useful.
Stratifying risk by measuring JCV serology, however, does appear to be a useful strategy. Investigators using a two-step assay to detect and quantify JCV antibodies found 53.6% of MS patients to be seropositive, with a false-negative rate of 2.5%. Of most interest, all 17 natalizumab-associated PML patients who had available blood samples taken an average of 2 years before onset of PML tested positive for JCV antibodies.28 Although studies are ongoing, classification according to JCV-antibody status may be helpful in advising patients. Patients who are JCV-antibody seronegative (about one-half of patients) appear to be at extraordinarily low risk for PML. In these patients, use of natalizumab could be liberalized and continued as long as the JCV-antibody status remains negative. In patients who are seropositive for JCV antibodies, caution is recommended, particularly for patients who had prior immunosuppressive drug therapy and for patients who have received treatment for more than 24 months. Even in JCV-antibody–seropositive patients, use of natalizumab may be advisable depending on disease severity, available options, and the patient’s risk tolerance. JCV-antibody testing is a rare example of a clinically useful biomarker that can guide specific treatment decisions in the field of neurology.
CURRENT PRACTICE: A PERSONAL MANAGEMENT ALGORITHM
Based on current evidence, the following opinion on the use of natalizumab for the treatment of MS is offered as a supplement to approved prescribing information. The neurologist must individualize the treatment decision for each patient and recognize that these general comments represent a personal opinion. Several factors affect decisions about the use of disease-modifying drugs in MS, and specifically use of natalizumab: How severe is the disease, and what is the prognosis for future disease progression from the neurologist’s perspective? How concerned is the patient about current or future MS symptoms and disability? What is the patient’s tolerance for medication side effects? For risk taking? Has there been prior immunosuppressive therapy? What is the JCV antibody status? What other options are available for disease management?
These issues require discussion among the neurologist, the patient, and the patient’s family. The neurologist should provide input on disease status, an opinion about prognosis, and a description of appropriate options for disease management. Many patients also want a global recommendation (ie, “Tell me what you think I should do”). The neurologist must tailor that global recommendation to the patient’s perceptions of his or her MS, its treatment, and preferences regarding treatment options.
For patients who are already receiving treatment with a first-line drug and whose disease is well controlled, I make no changes in treatment until a breakthrough occurs, at which time I recommend switching to natalizumab with JCV antibody status assessed yearly (Figure 2B). If a patient has been taking natalizumab for more than 2 years and is seronegative, I advise continuing natalizumab (Figure 2C). If seropositive after 2 or more years of natalizumab therapy, I recommend switching to fingolimod and monitoring for disease reactivation.
DISCUSSION
Dr. Calabrese: Have you perceived growing concern over PML among the MS patient population over the past 2 to 3 years?
Dr. Rudick: I would say that it’s pretty stable. Patients who are risk intolerant select out of natalizumab. Some patients would just as soon take their chances with MS rather than deal with additional risk. Since we talk about the risk of PML with patients prior to treatment, the patients who choose natalizumab are able to deal with the risk. The difficult cases are those patients who will be severely disabled before long but choose not to go on natalizumab because they’re very risk averse. It gets even more complicated when the closest family member (parents or spouse) want their relative to use natalizumab but the patient is risk averse. This can become quite complicated—for example, I’ve seen situations where the patient is a minor, and one parent wants their child to use natalizumab but the other is risk-averse. Spouses often see risk differently, and this has led to interesting and difficult discussions. In the case of a child with MS, I listen to preferences from family members, but otherwise I empower the patient to drive the decision.
Dr. Major: Our data seem to suggest a higher percentage of individuals who are seropositive—about 56%. The issue, however, is a lack of a standard to define seropositive and seronegative. I suggested that the natalizumab manufacturer collect a bank of samples and allocate them to laboratories with no vested interest for polymerase chain reaction (PCR) assays, from which consensus definitions of seropositive and seronegative could be developed.
Dr. Calabrese: Why is there no confirmatory immunoassay for this virus? We don’t have false positives for hepatitis B or human immunodeficiency virus. We still seem to be relying on older technologies.
Dr. Major: To determine the level of antibody, an enzyme-linked immunosorbent assay is just fine.
Dr. Calabrese: That’s for sensitivity, but what about specificity?
Dr. Major: Specificity is quite good. Everybody now uses the same antigen, the polyoma capsid antigen, VP1, to detect productive viral infection, but there are no set standards for the cutpoints to classify as seropositive and seronegative. Certainly, there’s high sensitivity with PCR to detect JCV DNA in cerebrospinal fluid (CSF), because we’re able to detect very low copy levels of JCV DNA in the CSF.
Dr. Simpson: I would like to see a quantitative measure of risk versus benefit for all of the drugs used in MS, not just natalizumab. When you look at any clinical trial, you see a table of adverse events and you see efficacy measures, but you don’t see the two combined. This really is necessary to compare drug A with drug B. Instead, we end up making decisions based on risk tolerance and rather soft criteria. One could argue that we don’t want to be so algorithmic that we take the art out of medicine, but the criteria we use to make decisions are quite soft. I wonder whether you have any suggestions on a more quantitative approach.
Dr. Rudick: This is an important point, but a difficult problem. We have much more information about PML associated with natalizumab than we do about many serious adverse events. For example, there are rare adverse events with interferon beta—severe depression, liver injury, and so forth. But we don’t have precise quantitative data on most adverse drug effects, and in general adverse events are underreported in clinical practice.
The natalizumab-PML situation is somewhat unique. PML is a dramatic, often fatal, disease that is virtually never observed spontaneously in MS, and the strict reporting requirements have resulted in near-complete ascertainment and more precise risk estimates. This situation doesn’t apply to most adverse events associated with other therapies—even for some severe adverse events. But you are correct—focusing exclusively on the risk of PML seems somewhat simplistic because there are clear risks with other drugs, and these need to be factored into treatment decisions.
Dr. Molloy: Do you have good tools that predict how a patient with MS will do over time?
Dr. Fox: We have fair tools, not great tools.
Dr. Rudick: We’re diagnosing MS earlier, sometimes at the first symptom. We’re even beginning to recognize it in patients without symptoms who have MS observed as an incidental MRI finding. It is difficult at the earliest stage of MS to predict severity with any confidence. The best predictor we have is the severity of the disease by MRI criteria. This can provide a general guide to treatment decisions, but it is an imprecise predictor.
- Weinshenker BG, Bass B, Rice GPA, et al. The natural history of multiple sclerosis: a geographically based study. I. Clinical course and disability. Brain 1999; 112:133–146.
- Jacobs LD, Cookfair DL, Rudick RA, et al. Intramuscular interferon beta-1a for disease progression in relapsing multiple sclerosis. Ann Neurol 1996; 39:285–294.
- The IFNB Multiple Sclerosis Study Group. Interferon beta-1b is effective in relapsing-remitting multiple sclerosis I: clinical results of a multicenter, randomized, double-blind, placebo-controlled trial. Neurology 1993; 43:655–661.
- IFNB Multiple Sclerosis Study Group, The University of British Columbia MS/MRI Analysis Group. Interferon beta-1b in the treatment of multiple sclerosis: final outcome of the randomized controlled trial. The IFNB Multiple Sclerosis Study Group and the University of British Columbia MS/MRI Analysis Group. Neurology 1995; 45:1277–1285.
- Johnson KP, Brooks BR, Cohen JA, et al. Copolymer 1 reduces relapse rate and improves disability in relapsing-remitting multiple sclerosis: results of a phase III multicenter, double-blind, placebo-controlled trial. Neurology 1995; 45:1268–1276.
- PRISMS (Prevention of Relapses and Disability by Interferon beta-1a Subcutaneously in Multiple Sclerosis) Study Group. Randomised double-blind placebo-controlled study of interferon beta-1a in relapsing/remitting multiple sclerosis. Lancet 1998; 352:1498–1504.
- Kappos L, Radue EW, O’Connor P, et al. A placebo-controlled trial of oral fingolimod in relapsing multiple sclerosis. N Engl J Med 2010; 362:387–401.
- Cohen JA, Barkhof F, Comi G, et al. Oral fingolimod or intramuscular interferon for relapsing multiple sclerosis. N Engl J Med 2010; 362:402–415.
- Gilenya [package insert]. East Hanover, NJ: Novartis Pharmaceuticals Corporation; 2011.
- Coles AJ, Fox E, Vladic A, et al. Alemtuzumab versus interferon beta-1a in early relapsing-remitting multiple sclerosis: post-hoc and subset analyses of clinical efficacy outcomes. Lancet Neurol 2011; 10:338–348.
- Nicholas R, Giannetti P, Alsanousi A, Friede T, Muraro PA. Development of oral immunomodulatory agents in the management of multiple sclerosis. Drug Des Devel Ther 2011; 5:255–274.
- Consortium of Multiple Sclerosis Centers (CMSC). Phase II study with ocrelizumab shows significant reduction in disease activity. CMSC Web site. http://mscare.org/cmsc/index.php?option=com_content&task=view&id=1081&Itemid=1465. Published October 15, 2010. Accessed August 26, 2011.
- Tysabri [package insert]. South San Francisco, CA: Elan Pharmaceuticals, Inc.; 2011.
- Polman CH, O’Connor PW, Havrdova E, et al. A randomized, placebo-controlled trial of natalizumab for relapsing multiple sclerosis. N Engl J Med 2006; 354:899–910.
- Miller DH, Khan OA, Sheremata WA, et al. A controlled trial of natalizumab for relapsing multiple sclerosis. N Engl J Med 2003; 348:15–23.
- Miller DH, Soon D, Fernando KT, et al. MRI outcomes in a placebo-controlled trial of natalizumab in relapsing MS. Neurology 2007; 68:1390–1401.
- Havrdova E, Galetta S, Hutchinson M, et al. Effect of natalizumab on clinical and radiological disease activity in multiple sclerosis: a retrospective analysis of the Natalizumab Safety and Efficacy in Relapsing-Remitting Multiple Sclerosis (AFFIRM) study. Lancet Neurol 2009; 8:254–260.
- Rudick RA, Miller D, Hass S, et al. Health-related quality of life in multiple sclerosis: effects of natalizumab. Ann Neurol 2007; 62:335–346.
- Rudick RA, Stuart WH, Calabresi PA, et al. Natalizumab plus interferon beta-1a for relapsing multipls sclerosis. N Engl J Med 2006; 354:911–923.
- Yousry TA, Major EO, Ryschkewitsch C, et al. Evaluation of patients treated with natalizumab for progressive multifocal leukoencephalopathy. N Engl J Med 2006; 354:924–933.
- O’Connor PW, Goodman A, Kappos L, et al. Disease activity return during natalizumab treatment interruption in patients with multiple sclerosis [published online ahead of print May 4, 2011]. Neurology 2011; 76:1858–1865.
- Update on Tysabri and PML. National Multiple Sclerosis Society Web site. http://www.nationalmssociety.org/news/news-detail/index.aspx?nid=2308. Published April 11, 2011. Updated May 23, 2011. Accessed June 22, 2011.
- Vermersch P, Kappos L, Gold R, et al. Clinical outcomes of natalizumab-associated progressive multifocal leukoencephalopathy. Neurology 2011; 76:1697–1704.
- Heesen C, Kleiter I, Nguyen F, et al. Risk perception in natalizumab-treated multiple sclerosis patients and their neurologists. Mult Scler 2010; 16:1507–1512.
- Chen Y, Bord E, Tompkins T, et al. Asymptomatic reactivation of JC virus in patients treated with natalizumab. N Engl J Med 2009; 361:1067–1074.
- Jilek S, Jaquiery E, Hirsch HH, et al. Immune responses to JC virus in patients with multiple sclerosis treated with natalizumab: a cross-sectional and longitudinal study. Lancet Neurol 2010; 9:264–272.
- Rudick RA, O’Connor PW, Polman CH, et al. Assessment of JC virus DNA in blood and urine from natalizumab-treated patients. Ann Neurol 2010; 68:304–310.
- Gorelik L, Lerner M, Bixler S, et al. Anti-JC virus antibodies: implications for PML risk stratification. Ann Neurol 2010; 68:295–303.
Multiple sclerosis (MS) is an autoimmune disease whose inflammatory process causes demyelination, axonal loss, and neurodegeneration, all of which can lead to progressive neurologic disability. Without treatment, the risk of progressive disability 15 to 20 years after the onset of MS has been estimated to be as high as 50%.1
Seven drugs have been approved by the US Food and Drug Administration (FDA) for the treatment of MS. Of these, interferon beta drugs and glatiramer acetate are generally considered as first-line agents based on extensive experience and relative safety. Indeed, reports with followup approaching 20 years have not identified significant safety concerns. However, these agents have only modest efficacy, reducing by approximately 30% the frequency of relapse in patients with relapsing-remitting MS.2–6
Natalizumab, and more recently, fingolimod, are generally used as second-line agents. Fingolimod, the first oral agent to receive FDA approval for the treatment of relapsing-remitting MS, is a functional antagonist of sphingosine-1-phosphate receptors. The reductions in annualized relapse rates in two phase 3 controlled trials of fingolimod were approximately 55% compared with placebo7 or intramuscular interferon beta-1a.8 Because of its more convenient oral route of administration and its documented efficacy, widespread use of fingolimod is anticipated. However, adverse reactions affecting more than 10% of patients include headache, influenza, diarrhea, back pain, liver transaminase elevations, and cough.9 Because sphingosine-1-phosphate receptors are widespread in many body tissues, off-target effects of fingolimod may be problematic and long-term toxicity is unknown.
In addition to natalizumab and fingolimod, which are currently available for use as second-line agents, several other MS therapies are showing promise. Oral cladribine, teriflunomide, and laquinimod have reported positive phase 3 results in publication or at national meetings, and several other drugs are in late stages of development (alemtuzumab, BG-12, ocrelizumab) based on encouraging phase 2 results.10–12 Thus, the options for MS patients are expanding, but drugs with higher efficacy also may pose greater risk.
NATALIZUMAB: ROBUST BENEFITS BUT ASSOCIATED RISK
Natalizumab is a humanized monoclonal antibody that binds to alpha-4 integrin on leukocytes. By inhibiting alpha-4 integrin, natalizumab, the first of a new class of selective adhesion-molecule inhibitors, impedes migration of activated mononuclear leukocytes into the brain and gut.13
Significant efficacy
Two phase 3 studies demonstrated more robust efficacy of natalizumab in patients with relapsing-remitting MS than had been observed in prior studies with other agents.14,15 In the Natalizumab Safety and Efficacy in Relapsing-Remitting Multiple Sclerosis (AFFIRM) study, which followed patients over 2 years of treatment, natalizumab was associated with a 68% reduction in the annualized relapse rate14; a 92% reduction in gadolinium-enhanced lesions on magnetic resonance imaging (MRI), which indicate new, active lesions16; and an 83% reduction in the mean number of new or enlarging T2 lesions16 compared with placebo. The likelihood of confirmed worsening on the Kurtzke Expanded Disability Status Score, which is the standard measure for MS-related disability, was also 42% lower in patients assigned to natalizumab compared with placebo.14
Other reported benefits from natalizumab therapy include a significantly increased probability of maintaining disease-free status17 and clinically significant improvements on patient-reported quality-of-life measures.18 Although there have been no head-to-head studies of natalizumab with interferon beta, glatiramer acetate, or fingolimod, there is a widespread view that treatment benefits of natalizumab exceed those of other disease-modifying drugs. In clinical practice, patients with MS who experience breakthrough disease on standard disease-modifying drugs are routinely observed to achieve disease control after switching to natalizumab. Thus, based purely on efficacy, patient-reported outcomes, and the convenience of once-monthly intravenous infusion, natalizumab represents an extremely attractive treatment option for patients with relapsing-remitting MS.
Use discontinued in 2005
Natalizumab was approved for treatment of relapsing-remitting MS in November 2004, using the FDA accelerated review pathway. The approval was based on the first-year results of the AFFIRM14 and the Natalizumab plus Interferon Beta-1a for Relapsing Remitting Multiple Sclerosis (SENTINEL)19 studies, both of which were completed in February 2005. In the 3 to 4 months between the drug’s approval and completion of the AFFIRM and SENTINEL studies, approximately 7,000 patients with relapsing-remitting MS received treatment with natalizumab. In February 2005, shortly after the release of the 2-year data, three cases of progressive multifocal leukoencephalopathy (PML) were identified in natalizumab-treated patients (one with Crohn disease, the other two with MS). Clinical and research use of natalizumab was abruptly suspended that month, pending a comprehensive safety review.
A safety study evaluated 3,116 patients who had received natalizumab over a mean exposure of 17.9 monthly doses.20 The study failed to identify any additional cases of PML and concluded that the risk of PML was approximately 1 in 1,000 patients. Abrupt discontinuation of natalizumab also allowed systematic assessment of disease behavior following treatment interruption. In 1,866 patients who had received natalizumab during clinical trials but who discontinued natalizumab after PML was recognized, MS relapses and gadolinium-enhancing lesions returned approximately to baseline levels within 4 to 7 months of natalizumab suspension. Reactivation of MS disease activity was observed even in patients who instituted one of the first-line disease-modifying drugs as substitute therapy.21
Based on the strong efficacy data and the extensive safety review, an FDA advisory committee recommended reintroduction, and natalizumab was returned to the market in June 2006. Natalizumab may be administered only in accredited infusion centers that agree to a monthly reporting regimen designed to identify all cases of PML. In the United States, natalizumab is available to patients only through the Tysabri Outreach Unified Commitment to Health (TOUCH) Prescribing Program, a restricted distribution program. Aggressive monitoring and reporting is also required in other regions of the world, so that ascertainment of PML associated with natalizumab is thought to be relatively complete.
Risk related to duration of therapy
Of the first 35 cases of natalizumab-associated PML, 10 cases (29%) were fatal. Among surviving patients, the level of disability was found to be severe in 48%; moderate in 36%; and mild in 16%.23 Improved survival was associated with younger age, less MS-related disability prior to PML, more localized disease on brain MRI at diagnosis, and shorter time from symptom onset to PML diagnosis.23 As of August 4, 2011, there were 150 confirmed cases of natalizumab-associated PML (58 in the United States, 85 in Europe, and 7 from the rest of the world); of these, 29 (19%) have died.22
VARIATION IN PATIENT RISK TOLERANCE
The postmarketing surveillance of natalizumab clearly demonstrates that risk is associated with administration of the drug, but risk tolerance varies considerably among individuals with MS. Some patients elect to use natalizumab despite the risk of PML, even when they have relatively mild MS. Other patients decline use of natalizumab even when their MS is severe and has responded poorly to other disease-modifying drugs.
In most cases, based on my experience, patients accept the risk of natalizumab-associated PML if MS disease is their primary consideration. Another major factor is the patient’s prior experiences with disease-modifying drugs; patients who have experienced breakthrough disease activity despite treatment with first-line drugs commonly opt for natalizumab regardless of the risk of PML.
Interestingly, the treating neurologist’s perception of MS severity and risk of PML may differ from the patient’s perception. In a study of 69 natalizumab-treated MS patients and 66 neurologists, Heesen et al found that patients had a significantly worse perception of their disease and were more willing to assume treatment risks and continue natalizumab therapy than their neurologists were.24 About one-half of the neurologists said that they would discontinue natalizumab at a risk level of 1 in 5,000 or lower, whereas only 17% of the patients would stop at this risk level. This finding has significant implications for clinical practice and implies that the neurologist should discuss concerns about MS and risk of treatment with the patient in order to tailor the decision to the patient’s concerns.
Interest in identifying biomarkers to aid in quantifying risk is ongoing. Chen et al found that subclinical reactivation of the JC virus (JCV) occurred frequently in 19 natalizumab-treated MS patients.25 Another study of 24 natalizumab-treated MS patients found no JCV DNA in the blood, although JCV DNA was found in the urine in 25% of patients.26 A large survey of blood and urine from natalizumab-treated MS patients found low sensitivity and specificity for JCV DNA as a predictor for subsequent PML.27 In this study of more than 1,000 natalizumab-treated patients, JCV DNA was detected in 0.3% of patients’ plasma and in 26% of patients’ urine, but PML did not develop in any patient who was JCV-positive. Among five natalizumab-treated patients who developed PML, JCV DNA was detected in none before the advent of symptoms. The presence of JCV DNA in bodily fluids is important for the diagnosis of PML, but it currently holds no predictive clinical value. At present, measuring JCV DNA in blood, cells, or urine as a predictive biomarker for natalizumab-associated PML does not appear to be clinically useful.
Stratifying risk by measuring JCV serology, however, does appear to be a useful strategy. Investigators using a two-step assay to detect and quantify JCV antibodies found 53.6% of MS patients to be seropositive, with a false-negative rate of 2.5%. Of most interest, all 17 natalizumab-associated PML patients who had available blood samples taken an average of 2 years before onset of PML tested positive for JCV antibodies.28 Although studies are ongoing, classification according to JCV-antibody status may be helpful in advising patients. Patients who are JCV-antibody seronegative (about one-half of patients) appear to be at extraordinarily low risk for PML. In these patients, use of natalizumab could be liberalized and continued as long as the JCV-antibody status remains negative. In patients who are seropositive for JCV antibodies, caution is recommended, particularly for patients who had prior immunosuppressive drug therapy and for patients who have received treatment for more than 24 months. Even in JCV-antibody–seropositive patients, use of natalizumab may be advisable depending on disease severity, available options, and the patient’s risk tolerance. JCV-antibody testing is a rare example of a clinically useful biomarker that can guide specific treatment decisions in the field of neurology.
CURRENT PRACTICE: A PERSONAL MANAGEMENT ALGORITHM
Based on current evidence, the following opinion on the use of natalizumab for the treatment of MS is offered as a supplement to approved prescribing information. The neurologist must individualize the treatment decision for each patient and recognize that these general comments represent a personal opinion. Several factors affect decisions about the use of disease-modifying drugs in MS, and specifically use of natalizumab: How severe is the disease, and what is the prognosis for future disease progression from the neurologist’s perspective? How concerned is the patient about current or future MS symptoms and disability? What is the patient’s tolerance for medication side effects? For risk taking? Has there been prior immunosuppressive therapy? What is the JCV antibody status? What other options are available for disease management?
These issues require discussion among the neurologist, the patient, and the patient’s family. The neurologist should provide input on disease status, an opinion about prognosis, and a description of appropriate options for disease management. Many patients also want a global recommendation (ie, “Tell me what you think I should do”). The neurologist must tailor that global recommendation to the patient’s perceptions of his or her MS, its treatment, and preferences regarding treatment options.
For patients who are already receiving treatment with a first-line drug and whose disease is well controlled, I make no changes in treatment until a breakthrough occurs, at which time I recommend switching to natalizumab with JCV antibody status assessed yearly (Figure 2B). If a patient has been taking natalizumab for more than 2 years and is seronegative, I advise continuing natalizumab (Figure 2C). If seropositive after 2 or more years of natalizumab therapy, I recommend switching to fingolimod and monitoring for disease reactivation.
DISCUSSION
Dr. Calabrese: Have you perceived growing concern over PML among the MS patient population over the past 2 to 3 years?
Dr. Rudick: I would say that it’s pretty stable. Patients who are risk intolerant select out of natalizumab. Some patients would just as soon take their chances with MS rather than deal with additional risk. Since we talk about the risk of PML with patients prior to treatment, the patients who choose natalizumab are able to deal with the risk. The difficult cases are those patients who will be severely disabled before long but choose not to go on natalizumab because they’re very risk averse. It gets even more complicated when the closest family member (parents or spouse) want their relative to use natalizumab but the patient is risk averse. This can become quite complicated—for example, I’ve seen situations where the patient is a minor, and one parent wants their child to use natalizumab but the other is risk-averse. Spouses often see risk differently, and this has led to interesting and difficult discussions. In the case of a child with MS, I listen to preferences from family members, but otherwise I empower the patient to drive the decision.
Dr. Major: Our data seem to suggest a higher percentage of individuals who are seropositive—about 56%. The issue, however, is a lack of a standard to define seropositive and seronegative. I suggested that the natalizumab manufacturer collect a bank of samples and allocate them to laboratories with no vested interest for polymerase chain reaction (PCR) assays, from which consensus definitions of seropositive and seronegative could be developed.
Dr. Calabrese: Why is there no confirmatory immunoassay for this virus? We don’t have false positives for hepatitis B or human immunodeficiency virus. We still seem to be relying on older technologies.
Dr. Major: To determine the level of antibody, an enzyme-linked immunosorbent assay is just fine.
Dr. Calabrese: That’s for sensitivity, but what about specificity?
Dr. Major: Specificity is quite good. Everybody now uses the same antigen, the polyoma capsid antigen, VP1, to detect productive viral infection, but there are no set standards for the cutpoints to classify as seropositive and seronegative. Certainly, there’s high sensitivity with PCR to detect JCV DNA in cerebrospinal fluid (CSF), because we’re able to detect very low copy levels of JCV DNA in the CSF.
Dr. Simpson: I would like to see a quantitative measure of risk versus benefit for all of the drugs used in MS, not just natalizumab. When you look at any clinical trial, you see a table of adverse events and you see efficacy measures, but you don’t see the two combined. This really is necessary to compare drug A with drug B. Instead, we end up making decisions based on risk tolerance and rather soft criteria. One could argue that we don’t want to be so algorithmic that we take the art out of medicine, but the criteria we use to make decisions are quite soft. I wonder whether you have any suggestions on a more quantitative approach.
Dr. Rudick: This is an important point, but a difficult problem. We have much more information about PML associated with natalizumab than we do about many serious adverse events. For example, there are rare adverse events with interferon beta—severe depression, liver injury, and so forth. But we don’t have precise quantitative data on most adverse drug effects, and in general adverse events are underreported in clinical practice.
The natalizumab-PML situation is somewhat unique. PML is a dramatic, often fatal, disease that is virtually never observed spontaneously in MS, and the strict reporting requirements have resulted in near-complete ascertainment and more precise risk estimates. This situation doesn’t apply to most adverse events associated with other therapies—even for some severe adverse events. But you are correct—focusing exclusively on the risk of PML seems somewhat simplistic because there are clear risks with other drugs, and these need to be factored into treatment decisions.
Dr. Molloy: Do you have good tools that predict how a patient with MS will do over time?
Dr. Fox: We have fair tools, not great tools.
Dr. Rudick: We’re diagnosing MS earlier, sometimes at the first symptom. We’re even beginning to recognize it in patients without symptoms who have MS observed as an incidental MRI finding. It is difficult at the earliest stage of MS to predict severity with any confidence. The best predictor we have is the severity of the disease by MRI criteria. This can provide a general guide to treatment decisions, but it is an imprecise predictor.
- Weinshenker BG, Bass B, Rice GPA, et al. The natural history of multiple sclerosis: a geographically based study. I. Clinical course and disability. Brain 1999; 112:133–146.
- Jacobs LD, Cookfair DL, Rudick RA, et al. Intramuscular interferon beta-1a for disease progression in relapsing multiple sclerosis. Ann Neurol 1996; 39:285–294.
- The IFNB Multiple Sclerosis Study Group. Interferon beta-1b is effective in relapsing-remitting multiple sclerosis I: clinical results of a multicenter, randomized, double-blind, placebo-controlled trial. Neurology 1993; 43:655–661.
- IFNB Multiple Sclerosis Study Group, The University of British Columbia MS/MRI Analysis Group. Interferon beta-1b in the treatment of multiple sclerosis: final outcome of the randomized controlled trial. The IFNB Multiple Sclerosis Study Group and the University of British Columbia MS/MRI Analysis Group. Neurology 1995; 45:1277–1285.
- Johnson KP, Brooks BR, Cohen JA, et al. Copolymer 1 reduces relapse rate and improves disability in relapsing-remitting multiple sclerosis: results of a phase III multicenter, double-blind, placebo-controlled trial. Neurology 1995; 45:1268–1276.
- PRISMS (Prevention of Relapses and Disability by Interferon beta-1a Subcutaneously in Multiple Sclerosis) Study Group. Randomised double-blind placebo-controlled study of interferon beta-1a in relapsing/remitting multiple sclerosis. Lancet 1998; 352:1498–1504.
- Kappos L, Radue EW, O’Connor P, et al. A placebo-controlled trial of oral fingolimod in relapsing multiple sclerosis. N Engl J Med 2010; 362:387–401.
- Cohen JA, Barkhof F, Comi G, et al. Oral fingolimod or intramuscular interferon for relapsing multiple sclerosis. N Engl J Med 2010; 362:402–415.
- Gilenya [package insert]. East Hanover, NJ: Novartis Pharmaceuticals Corporation; 2011.
- Coles AJ, Fox E, Vladic A, et al. Alemtuzumab versus interferon beta-1a in early relapsing-remitting multiple sclerosis: post-hoc and subset analyses of clinical efficacy outcomes. Lancet Neurol 2011; 10:338–348.
- Nicholas R, Giannetti P, Alsanousi A, Friede T, Muraro PA. Development of oral immunomodulatory agents in the management of multiple sclerosis. Drug Des Devel Ther 2011; 5:255–274.
- Consortium of Multiple Sclerosis Centers (CMSC). Phase II study with ocrelizumab shows significant reduction in disease activity. CMSC Web site. http://mscare.org/cmsc/index.php?option=com_content&task=view&id=1081&Itemid=1465. Published October 15, 2010. Accessed August 26, 2011.
- Tysabri [package insert]. South San Francisco, CA: Elan Pharmaceuticals, Inc.; 2011.
- Polman CH, O’Connor PW, Havrdova E, et al. A randomized, placebo-controlled trial of natalizumab for relapsing multiple sclerosis. N Engl J Med 2006; 354:899–910.
- Miller DH, Khan OA, Sheremata WA, et al. A controlled trial of natalizumab for relapsing multiple sclerosis. N Engl J Med 2003; 348:15–23.
- Miller DH, Soon D, Fernando KT, et al. MRI outcomes in a placebo-controlled trial of natalizumab in relapsing MS. Neurology 2007; 68:1390–1401.
- Havrdova E, Galetta S, Hutchinson M, et al. Effect of natalizumab on clinical and radiological disease activity in multiple sclerosis: a retrospective analysis of the Natalizumab Safety and Efficacy in Relapsing-Remitting Multiple Sclerosis (AFFIRM) study. Lancet Neurol 2009; 8:254–260.
- Rudick RA, Miller D, Hass S, et al. Health-related quality of life in multiple sclerosis: effects of natalizumab. Ann Neurol 2007; 62:335–346.
- Rudick RA, Stuart WH, Calabresi PA, et al. Natalizumab plus interferon beta-1a for relapsing multipls sclerosis. N Engl J Med 2006; 354:911–923.
- Yousry TA, Major EO, Ryschkewitsch C, et al. Evaluation of patients treated with natalizumab for progressive multifocal leukoencephalopathy. N Engl J Med 2006; 354:924–933.
- O’Connor PW, Goodman A, Kappos L, et al. Disease activity return during natalizumab treatment interruption in patients with multiple sclerosis [published online ahead of print May 4, 2011]. Neurology 2011; 76:1858–1865.
- Update on Tysabri and PML. National Multiple Sclerosis Society Web site. http://www.nationalmssociety.org/news/news-detail/index.aspx?nid=2308. Published April 11, 2011. Updated May 23, 2011. Accessed June 22, 2011.
- Vermersch P, Kappos L, Gold R, et al. Clinical outcomes of natalizumab-associated progressive multifocal leukoencephalopathy. Neurology 2011; 76:1697–1704.
- Heesen C, Kleiter I, Nguyen F, et al. Risk perception in natalizumab-treated multiple sclerosis patients and their neurologists. Mult Scler 2010; 16:1507–1512.
- Chen Y, Bord E, Tompkins T, et al. Asymptomatic reactivation of JC virus in patients treated with natalizumab. N Engl J Med 2009; 361:1067–1074.
- Jilek S, Jaquiery E, Hirsch HH, et al. Immune responses to JC virus in patients with multiple sclerosis treated with natalizumab: a cross-sectional and longitudinal study. Lancet Neurol 2010; 9:264–272.
- Rudick RA, O’Connor PW, Polman CH, et al. Assessment of JC virus DNA in blood and urine from natalizumab-treated patients. Ann Neurol 2010; 68:304–310.
- Gorelik L, Lerner M, Bixler S, et al. Anti-JC virus antibodies: implications for PML risk stratification. Ann Neurol 2010; 68:295–303.
HIV-associated PML: Changing epidemiology and clinical approach
The appearance of progressive multifocal leukoencephalopathy (PML) as a complication of human immunodeficiency virus (HIV) infection dates to shortly after the first description of acquired immunodeficiency syndrome (AIDS). The advent of highly active antiretroviral therapy (HAART) dramatically altered the nature of HIV infection, resulting in a substantial decline in mortality and, in essence, turning AIDS into a chronic disease. As patients lived longer with HIV infection, one consequence was an increased incidence of neurologic complications. By the early 1980s, AIDS was well recognized as an underlying disorder that predisposed to PML.
As many as 70% of HIV patients will eventually have involvement of either the peripheral or central nervous system (CNS). Most patients with HIV are managed by primary care clinicians, including those in the fields of family practice, internal medicine, or infectious disease, and the complexity of the neurologic disorders associated with HIV often results in either delayed diagnosis or misdiagnosis. For example, the evolution of HIV in the plasma, where most clinicians measure it, may differ from its evolution in the spinal fluid and brain. An emerging issue is that of hepatitis C coinfection, which may itself be associated with central and peripheral neurologic complications.
Treatment of HIV with antiretroviral agents has numerous neurologic implications. These include the potential ability of these agents to penetrate the blood-brain barrier, their efficacy in both treating and preventing cognitive impairment and other CNS disorders, and their toxic effects in the CNS and peripheral nervous system.
NEUROLOGIC COMPLICATIONS OF AIDS
Neurologic disease in AIDS patients can be classified in several ways. One of the most logical, particularly for primary care clinicians, is the separation of primary from secondary neurologic disorders:
- Primary neurologic disorders are enigmatic and difficult to characterize; they include HIV-associated neurocognitive disorders in adults, encephalopathy in children, myelopathy or spinal cord disease, and peripheral neuropathy.
- Secondary complications are related to progressive immunosuppression. These include opportunistic infections such as cytomegalovirus, toxoplasmosis, or cryptococcal meningitis; and neoplasms such as primary CNS lymphoma. Opportunistic infections and neoplasms have declined in incidence in the HAART era.
AT-RISK POOLS FOR PML
The AIDS epidemic significantly changed the epidemiology of PML, turning a formerly rare disease into a much more common one. In South Florida, the incidence of PML in patients with AIDS increased by 12 times from the 5-year period 1981 to 1984 compared with 1991 to 1994. Only two non-AIDS cases of PML were reported in South Florida during this 15-year period.1
At present, nonimmunosuppressed, healthy individuals account for fewer than 1% of all cases of PML. Non-HIV–related PML represents 10% to 20% of all PML cases. Cancer survivors and patients with rheumatoid arthritis who are treated with immunotherapy constitute the largest at-risk pools among this group. PML related to HIV represents 80% to 90% of PML cases, drawing from a pool of 1.2 million HIV-infected individuals in the United States.
UNIQUE PRESENTATION OF HIV-ASSOCIATED PML
The brain lesion in PML is classically a nonenhancing focal lesion, preferentially in white matter, but lesion characteristics often depart from this characteristic picture. For example, relatively faint contrast enhancement of lesions on magnetic resonance imaging has been observed, as well as involvement of white matter and gray matter. The distribution and character of brain lesions in PML may also differ from the classic picture. For example, the lesion may not be focal, particularly when PML is combined with the symmetric white matter abnormalities that are seen in HIV encephalopathy; this nonclassic presentation can cause difficulty in radiologic differentiation of PML and HIV encephalopathy.
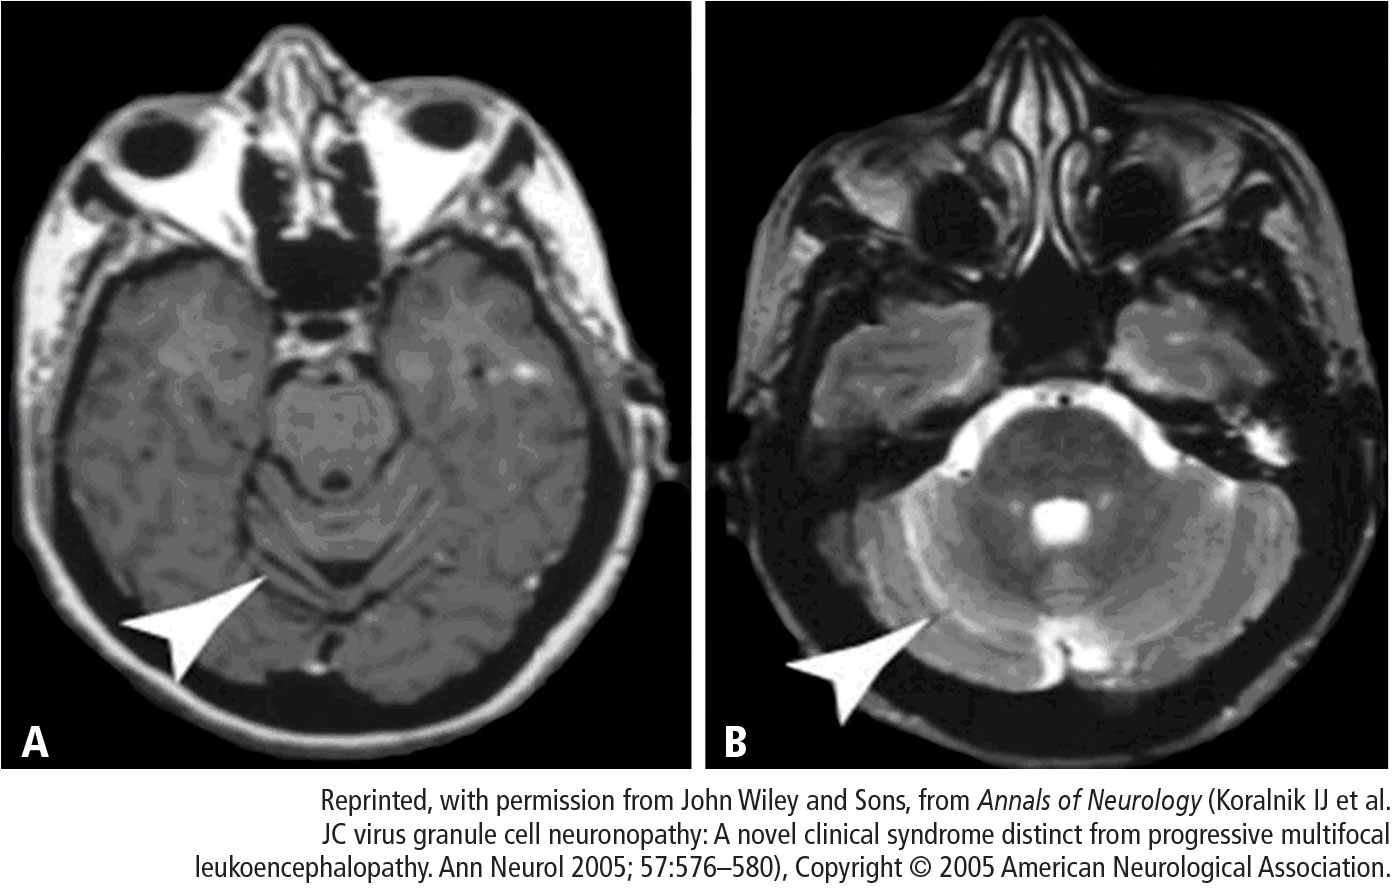
Cerebellar degeneration
A unique presentation of PML is possible in HIV-infected patients. In 1998, Tagliati et al2 described a syndrome of degeneration of the cerebellum in 10 HIV-infected patients. One patient had JC virus (JCV) detected by polymerase chain reaction (PCR) in cerebellar biopsy tissue. The authors proposed the possibility of latent JCV infection of cerebellar granular cells in HIV-infected patients with cerebellar atrophy, lacking further evidence of other features of PML.
MANAGEMENT OF HIV-ASSOCIATED PML
Optimize HAART
A suppressed plasma HIV viral load is the strongest prognostic factor for an improved course in PML.4 In the pre-HAART era, the mean survival of HIV-associated PML was 3 to 6 months, with long-term survival estimated at 10%.5 The use of HAART has achieved a dramatic improvement in long-term survival, to upwards of 50%.6 Neurologic deficits are often irreversible even with HAART, but most HAART recipients show stability in neurologic status for years.
Other key characteristics associated with improved survival in HIV-associated PML appear to be younger age, PML as the heralding manifestation of AIDS, initiation of HAART upon diagnosis of PML, higher CD4 count, and absence of severe neurologic impairment.5–7
Investigational therapies
Specific antiviral drug regimens targeting JCV have been tested empirically in case studies and in clinical trials in patients with AIDS- and non–AIDS-related PML.
Cytosine arabinoside (Ara-C). Ara-C is a nucleoside analog used as an antineoplastic agent; it terminates chain elongation and inhibits DNA polymerase to confer antiviral activity. Ara-C decreased JCV replication in vitro.8 Based on anecdotal reports of efficacy in cancer-related cases of PML,9 Ara-C was tested in a multicenter trial of 57 patients with HIV and biopsy-confirmed PML.10 Neither intravenous nor intrathecal Ara-C combined with established antiviral therapy for AIDS improved the prognosis of these patients, and Ara-C has since been abandoned as a strategy to treat HIV-related PML.
Cidofovir. The noncyclic nucleoside phosphonate cidofovir garnered attention as a potential treatment for PML based on case reports of efficacy in HIV as well as non-HIV patients. Subsequently, a large multicenter study failed to detect any significant added benefit with cidofovir beyond that of HAART.11 Retrospective European studies confirmed the lack of clinical benefit with cidofovir.6,7,12
Interferon alfa. Case reports with interferon alfa-2a and -2b for the treatment of PML show conflicting results with respect to clinical response, symptomatic improvement, and survival, but toxicity has been substantial. In a series of 97 patients with AIDS-related PML, Geschwind et al determined that interferon alfa had no effect on survival beyond that of HAART.13
Mirtazapine. Serotonin receptor antagonists such as mirtazapine can block JCV entry into glial cells via serotonin 5-hydroxytryptamine receptors, providing a rationale for their use as a potential treatment for PML. Verma et al describe a case of clinical improvement (stable neurologic deficit) and PML lesion regression in a 63-year-old bedbound woman with polycythemia vera with biopsy-proven non–HIV-related PML that had progressed to quadriparesis.14
Mefloquine. The antimalarial drug mefloquine inhibits viral replication in cultured human glial cells and astrocytes, inhibits JC viral DNA replication, and showed efficacy against two JCV strains in cell culture.15 A randomized study to assess the effectiveness of mefloquine for treatment of PML has been completed and its results await publication.
SUMMARY
The incidence of PML has remained unchanged from the pre-HAART to the HAART era, but the prognosis is greatly improved. The clinical presentation of PML in AIDS patients may deviate from the classic triad of progressive, multifocal, white matter disease. It may be static and unifocal, and it may involve gray matter and neurons as well as white matter. The number of neurologic manifestations is vast and can include the cerebellar syndrome. Lumbar puncture with a PCR negative for JCV does not confirm the absence of PML.
The standard of care for HIV-associated PML is HAART, with the goal of achieving immunologic recovery and optimal virologic control. Whether therapeutic results obtained in patients with HIV-associated PML can be translated to the setting of non–HIV-associated PML is unclear.
DISCUSSION
Dr. Simpson: As a followup to the Ara-C trial that was published,10 PML confirmed by brain biopsy was one of the enrolling criteria, and the planned study population was 65 patients. Longitudinal examination of viral load in cerebrospinal fluid (CSF) was a part of the study, and we found that the lower the viral load, the better the prognosis. Fifty-two patients were enrolled before the trial was stopped because it was clear that Ara-C was not producing a benefit. The patients had multifocal disease but, because Ara-C does not effectively cross the blood-brain barrier, penetration in the brain was minimal even with the use of an intrathecal shunt in this study.
Dr. Major: Do you think viral load in CSF is a predictor of disease severity and outcome in PML?
Dr. Rudick: Generally speaking, that’s probably true. We have found, as have many of our colleagues who run a lot of CSF samples, that high viral loads are not a good thing.
Dr. Bennett: How is it that the incidence of PML has not changed from the pre-HAART to the post-HAART era? How do you account for this in terms of the change in patients’ T-cell function from pre- to post-HAART?
Dr. Simpson: I don’t know. Intuitively, why do patients treated with HAART, who are relatively immune reconstituted, develop PML? The problem is that not everyone is immune reconstituted. HAART fails in some patients. Further, PML remains a disease that is more common in late-stage HIV among patients with low CD4 counts and high viral loads, meaning that a large population of patients is available to develop this disease. With that said, it is perplexing that the incidence has not gone down more than it has.
Dr. Major: There’s a phenomenon called “unmasking PML with HAART,” in which individuals have no signs of PML upon initiation of HAART, but then very shortly after, PML is diagnosed.
Dr. Berger: You’re talking about PML immune reconstitution inflammatory syndrome (IRIS).
Dr. Major: IRIS can occur before PML, or PML and IRIS can be concurrent. In some patients, once the infection starts, it persists; this suggests that the virus is carried to the brain through the infected lymphocyte populations and may explain why the incidence of PML has not changed from the pre-HAART to the HAART era.
Dr. Calabrese: In patients with HIV who develop PML within the first 6 months of HAART, are we seeing the IRIS phenomenon or is it a presenting sign of advanced HIV?
Dr. Simpson: It’s well known that a number of opportunistic infections can develop in the setting of HAART. In fact, whether one should delay HAART when initiating therapy for opportunistic infections has been debated for just this reason. Most people presume IRIS to be a massive immunologic hit to all organ systems, as CD4 counts rise dramatically to produce hyperimmune-mediated phenomena such as Guillain-Barré syndrome. To what extent immunologic recovery is or is not linked to PML and why it happens are fascinating questions.
Dr. Berger: Opportunistic infections, PML among them, that occur following the initiation of HAART and recovery of the immune system are almost always an IRIS-mediated phenomenon in which the disease has been smoldering and then surfaces because of the release of an inflammatory response.
Dr. Calabrese: In patients with cerebellar degeneration, do you typically detect JCV in PCR in the spinal fluid?
Dr. Simpson: Not in the early stages, but in some patients with later-stage disease,3 the answer is yes. Certainly, PCR of CSF samples to look for JCV is the diagnostic test of choice. But in the early days, when we had no idea what caused this cerebellar syndrome, we were doing cerebellar biopsies.
- Berger JR, Pall L, Lanska D, Whiteman M. Progressive multifocal leukoencephalopathy in patients with HIV infection. J Neurovirol 1998; 4:59–68.
- Tagliati M, Simpson D, Margello S, Clifford D, Schwartz RL, Berger JR. Cerebellar degeneration associated with human immunodeficiency virus infection. Neurology 1998; 50:244–251.
- Koralnik I, Wüthrich C, Dang X, et al. JC virus granule cell neuronopathy: a novel clinical syndrome distinct from progressive multifocal leukoencephalopathy. Ann Neurol 2005; 57:576–580.
- Clifford DB, Yiannoutsos C, Glicksman M, et al. HAART improves prognosis in HIV-associated progressive multifocal leukoencephalopathy. Neurology 1999; 52:623–625.
- Berger JR, Levy RM, Flomenhoff D, Dobbs M. Predictive factors for prolonged survival in acquired immunodeficiency syndrome-associated progressive multifocal leukoencephalopathy. Ann Neurol 1998; 44:341–349.
- Antinori A, Cingolani A, Lorenzini P, et al. Clinical epidemiology and survival of progressive multifocal leukoencephalopathy in the era of highly active antiretroviral therapy: data from the Italian Registry Investigative Neuro AIDS (IRINA). J Neurovirol 2003; 9( suppl 1):47–53.
- Berenguer J, Miralles P, Arrizabalaga J, et al. Clinical course and prognostic factors of progressive multifocal leukoencephalopathy in patients treated with highly active antiretroviral therapy. Clin Infect Dis 2003; 36:1047–1052.
- Hou J, Major EO. The efficacy of nucleoside analogs against JC virus multiplication in a persistently infected human fetal brain cell line. J Neurovirol 1998; 4:451–456.
- Aksamit A. Treatment of non-AIDS progressive multifocal leukoencephalopathy with cytosine arabinoside. J Neurovirol 2001; 7:386–390.
- Hall C, Dafni U, Simpson D, et al. Failure of cytarabine in progressive multifocal leukoencephalopathy associated with human immunodeficiency virus infection. AIDS Clinical Trials Group 243 Team. N Engl J Med 1998; 338:1345–1351.
- Marra CM, Rajicic N, Barker DE, et al. A pilot study of cidofovir for progressive multifocal leukoencephalopathy in AIDS. AIDS 2002; 16:1791–1797.
- Gasnault J, Kousignian P, Kahraman M, et al. Cidofovir in AIDS-associated progressive multifocal leukoencephalopathy: a monocenter observational study with clinical and JC virus load monitoring. J Neurovirol 2001; 7:375–381.
- Geschwind MD, Skolasky RI, Royal WS, McArthur JC. The relative contributions of HAART and alpha-interferon for therapy of progressive multifocal leukoencephalopathy in AIDS. J Neurovirol 2001; 7:353–357.
- Verma S, Cikurel K, Koralnik IJ, et al. Mirtazapine in progressive multifocal leukoencephalopathy. J Infect Dis 2007; 196:709–711.
- Brickelmaier M, Lugovskoy A, Kartikeyan R, et al. Identification and characterization of mefloquine efficacy against JC virus in vitro. Antimicrob Agents Chemother 2009; 53:1840–1849.
The appearance of progressive multifocal leukoencephalopathy (PML) as a complication of human immunodeficiency virus (HIV) infection dates to shortly after the first description of acquired immunodeficiency syndrome (AIDS). The advent of highly active antiretroviral therapy (HAART) dramatically altered the nature of HIV infection, resulting in a substantial decline in mortality and, in essence, turning AIDS into a chronic disease. As patients lived longer with HIV infection, one consequence was an increased incidence of neurologic complications. By the early 1980s, AIDS was well recognized as an underlying disorder that predisposed to PML.
As many as 70% of HIV patients will eventually have involvement of either the peripheral or central nervous system (CNS). Most patients with HIV are managed by primary care clinicians, including those in the fields of family practice, internal medicine, or infectious disease, and the complexity of the neurologic disorders associated with HIV often results in either delayed diagnosis or misdiagnosis. For example, the evolution of HIV in the plasma, where most clinicians measure it, may differ from its evolution in the spinal fluid and brain. An emerging issue is that of hepatitis C coinfection, which may itself be associated with central and peripheral neurologic complications.
Treatment of HIV with antiretroviral agents has numerous neurologic implications. These include the potential ability of these agents to penetrate the blood-brain barrier, their efficacy in both treating and preventing cognitive impairment and other CNS disorders, and their toxic effects in the CNS and peripheral nervous system.
NEUROLOGIC COMPLICATIONS OF AIDS
Neurologic disease in AIDS patients can be classified in several ways. One of the most logical, particularly for primary care clinicians, is the separation of primary from secondary neurologic disorders:
- Primary neurologic disorders are enigmatic and difficult to characterize; they include HIV-associated neurocognitive disorders in adults, encephalopathy in children, myelopathy or spinal cord disease, and peripheral neuropathy.
- Secondary complications are related to progressive immunosuppression. These include opportunistic infections such as cytomegalovirus, toxoplasmosis, or cryptococcal meningitis; and neoplasms such as primary CNS lymphoma. Opportunistic infections and neoplasms have declined in incidence in the HAART era.
AT-RISK POOLS FOR PML
The AIDS epidemic significantly changed the epidemiology of PML, turning a formerly rare disease into a much more common one. In South Florida, the incidence of PML in patients with AIDS increased by 12 times from the 5-year period 1981 to 1984 compared with 1991 to 1994. Only two non-AIDS cases of PML were reported in South Florida during this 15-year period.1
At present, nonimmunosuppressed, healthy individuals account for fewer than 1% of all cases of PML. Non-HIV–related PML represents 10% to 20% of all PML cases. Cancer survivors and patients with rheumatoid arthritis who are treated with immunotherapy constitute the largest at-risk pools among this group. PML related to HIV represents 80% to 90% of PML cases, drawing from a pool of 1.2 million HIV-infected individuals in the United States.
UNIQUE PRESENTATION OF HIV-ASSOCIATED PML
The brain lesion in PML is classically a nonenhancing focal lesion, preferentially in white matter, but lesion characteristics often depart from this characteristic picture. For example, relatively faint contrast enhancement of lesions on magnetic resonance imaging has been observed, as well as involvement of white matter and gray matter. The distribution and character of brain lesions in PML may also differ from the classic picture. For example, the lesion may not be focal, particularly when PML is combined with the symmetric white matter abnormalities that are seen in HIV encephalopathy; this nonclassic presentation can cause difficulty in radiologic differentiation of PML and HIV encephalopathy.
Cerebellar degeneration
A unique presentation of PML is possible in HIV-infected patients. In 1998, Tagliati et al2 described a syndrome of degeneration of the cerebellum in 10 HIV-infected patients. One patient had JC virus (JCV) detected by polymerase chain reaction (PCR) in cerebellar biopsy tissue. The authors proposed the possibility of latent JCV infection of cerebellar granular cells in HIV-infected patients with cerebellar atrophy, lacking further evidence of other features of PML.
MANAGEMENT OF HIV-ASSOCIATED PML
Optimize HAART
A suppressed plasma HIV viral load is the strongest prognostic factor for an improved course in PML.4 In the pre-HAART era, the mean survival of HIV-associated PML was 3 to 6 months, with long-term survival estimated at 10%.5 The use of HAART has achieved a dramatic improvement in long-term survival, to upwards of 50%.6 Neurologic deficits are often irreversible even with HAART, but most HAART recipients show stability in neurologic status for years.
Other key characteristics associated with improved survival in HIV-associated PML appear to be younger age, PML as the heralding manifestation of AIDS, initiation of HAART upon diagnosis of PML, higher CD4 count, and absence of severe neurologic impairment.5–7
Investigational therapies
Specific antiviral drug regimens targeting JCV have been tested empirically in case studies and in clinical trials in patients with AIDS- and non–AIDS-related PML.
Cytosine arabinoside (Ara-C). Ara-C is a nucleoside analog used as an antineoplastic agent; it terminates chain elongation and inhibits DNA polymerase to confer antiviral activity. Ara-C decreased JCV replication in vitro.8 Based on anecdotal reports of efficacy in cancer-related cases of PML,9 Ara-C was tested in a multicenter trial of 57 patients with HIV and biopsy-confirmed PML.10 Neither intravenous nor intrathecal Ara-C combined with established antiviral therapy for AIDS improved the prognosis of these patients, and Ara-C has since been abandoned as a strategy to treat HIV-related PML.
Cidofovir. The noncyclic nucleoside phosphonate cidofovir garnered attention as a potential treatment for PML based on case reports of efficacy in HIV as well as non-HIV patients. Subsequently, a large multicenter study failed to detect any significant added benefit with cidofovir beyond that of HAART.11 Retrospective European studies confirmed the lack of clinical benefit with cidofovir.6,7,12
Interferon alfa. Case reports with interferon alfa-2a and -2b for the treatment of PML show conflicting results with respect to clinical response, symptomatic improvement, and survival, but toxicity has been substantial. In a series of 97 patients with AIDS-related PML, Geschwind et al determined that interferon alfa had no effect on survival beyond that of HAART.13
Mirtazapine. Serotonin receptor antagonists such as mirtazapine can block JCV entry into glial cells via serotonin 5-hydroxytryptamine receptors, providing a rationale for their use as a potential treatment for PML. Verma et al describe a case of clinical improvement (stable neurologic deficit) and PML lesion regression in a 63-year-old bedbound woman with polycythemia vera with biopsy-proven non–HIV-related PML that had progressed to quadriparesis.14
Mefloquine. The antimalarial drug mefloquine inhibits viral replication in cultured human glial cells and astrocytes, inhibits JC viral DNA replication, and showed efficacy against two JCV strains in cell culture.15 A randomized study to assess the effectiveness of mefloquine for treatment of PML has been completed and its results await publication.
SUMMARY
The incidence of PML has remained unchanged from the pre-HAART to the HAART era, but the prognosis is greatly improved. The clinical presentation of PML in AIDS patients may deviate from the classic triad of progressive, multifocal, white matter disease. It may be static and unifocal, and it may involve gray matter and neurons as well as white matter. The number of neurologic manifestations is vast and can include the cerebellar syndrome. Lumbar puncture with a PCR negative for JCV does not confirm the absence of PML.
The standard of care for HIV-associated PML is HAART, with the goal of achieving immunologic recovery and optimal virologic control. Whether therapeutic results obtained in patients with HIV-associated PML can be translated to the setting of non–HIV-associated PML is unclear.
DISCUSSION
Dr. Simpson: As a followup to the Ara-C trial that was published,10 PML confirmed by brain biopsy was one of the enrolling criteria, and the planned study population was 65 patients. Longitudinal examination of viral load in cerebrospinal fluid (CSF) was a part of the study, and we found that the lower the viral load, the better the prognosis. Fifty-two patients were enrolled before the trial was stopped because it was clear that Ara-C was not producing a benefit. The patients had multifocal disease but, because Ara-C does not effectively cross the blood-brain barrier, penetration in the brain was minimal even with the use of an intrathecal shunt in this study.
Dr. Major: Do you think viral load in CSF is a predictor of disease severity and outcome in PML?
Dr. Rudick: Generally speaking, that’s probably true. We have found, as have many of our colleagues who run a lot of CSF samples, that high viral loads are not a good thing.
Dr. Bennett: How is it that the incidence of PML has not changed from the pre-HAART to the post-HAART era? How do you account for this in terms of the change in patients’ T-cell function from pre- to post-HAART?
Dr. Simpson: I don’t know. Intuitively, why do patients treated with HAART, who are relatively immune reconstituted, develop PML? The problem is that not everyone is immune reconstituted. HAART fails in some patients. Further, PML remains a disease that is more common in late-stage HIV among patients with low CD4 counts and high viral loads, meaning that a large population of patients is available to develop this disease. With that said, it is perplexing that the incidence has not gone down more than it has.
Dr. Major: There’s a phenomenon called “unmasking PML with HAART,” in which individuals have no signs of PML upon initiation of HAART, but then very shortly after, PML is diagnosed.
Dr. Berger: You’re talking about PML immune reconstitution inflammatory syndrome (IRIS).
Dr. Major: IRIS can occur before PML, or PML and IRIS can be concurrent. In some patients, once the infection starts, it persists; this suggests that the virus is carried to the brain through the infected lymphocyte populations and may explain why the incidence of PML has not changed from the pre-HAART to the HAART era.
Dr. Calabrese: In patients with HIV who develop PML within the first 6 months of HAART, are we seeing the IRIS phenomenon or is it a presenting sign of advanced HIV?
Dr. Simpson: It’s well known that a number of opportunistic infections can develop in the setting of HAART. In fact, whether one should delay HAART when initiating therapy for opportunistic infections has been debated for just this reason. Most people presume IRIS to be a massive immunologic hit to all organ systems, as CD4 counts rise dramatically to produce hyperimmune-mediated phenomena such as Guillain-Barré syndrome. To what extent immunologic recovery is or is not linked to PML and why it happens are fascinating questions.
Dr. Berger: Opportunistic infections, PML among them, that occur following the initiation of HAART and recovery of the immune system are almost always an IRIS-mediated phenomenon in which the disease has been smoldering and then surfaces because of the release of an inflammatory response.
Dr. Calabrese: In patients with cerebellar degeneration, do you typically detect JCV in PCR in the spinal fluid?
Dr. Simpson: Not in the early stages, but in some patients with later-stage disease,3 the answer is yes. Certainly, PCR of CSF samples to look for JCV is the diagnostic test of choice. But in the early days, when we had no idea what caused this cerebellar syndrome, we were doing cerebellar biopsies.
- Berger JR, Pall L, Lanska D, Whiteman M. Progressive multifocal leukoencephalopathy in patients with HIV infection. J Neurovirol 1998; 4:59–68.
- Tagliati M, Simpson D, Margello S, Clifford D, Schwartz RL, Berger JR. Cerebellar degeneration associated with human immunodeficiency virus infection. Neurology 1998; 50:244–251.
- Koralnik I, Wüthrich C, Dang X, et al. JC virus granule cell neuronopathy: a novel clinical syndrome distinct from progressive multifocal leukoencephalopathy. Ann Neurol 2005; 57:576–580.
- Clifford DB, Yiannoutsos C, Glicksman M, et al. HAART improves prognosis in HIV-associated progressive multifocal leukoencephalopathy. Neurology 1999; 52:623–625.
- Berger JR, Levy RM, Flomenhoff D, Dobbs M. Predictive factors for prolonged survival in acquired immunodeficiency syndrome-associated progressive multifocal leukoencephalopathy. Ann Neurol 1998; 44:341–349.
- Antinori A, Cingolani A, Lorenzini P, et al. Clinical epidemiology and survival of progressive multifocal leukoencephalopathy in the era of highly active antiretroviral therapy: data from the Italian Registry Investigative Neuro AIDS (IRINA). J Neurovirol 2003; 9( suppl 1):47–53.
- Berenguer J, Miralles P, Arrizabalaga J, et al. Clinical course and prognostic factors of progressive multifocal leukoencephalopathy in patients treated with highly active antiretroviral therapy. Clin Infect Dis 2003; 36:1047–1052.
- Hou J, Major EO. The efficacy of nucleoside analogs against JC virus multiplication in a persistently infected human fetal brain cell line. J Neurovirol 1998; 4:451–456.
- Aksamit A. Treatment of non-AIDS progressive multifocal leukoencephalopathy with cytosine arabinoside. J Neurovirol 2001; 7:386–390.
- Hall C, Dafni U, Simpson D, et al. Failure of cytarabine in progressive multifocal leukoencephalopathy associated with human immunodeficiency virus infection. AIDS Clinical Trials Group 243 Team. N Engl J Med 1998; 338:1345–1351.
- Marra CM, Rajicic N, Barker DE, et al. A pilot study of cidofovir for progressive multifocal leukoencephalopathy in AIDS. AIDS 2002; 16:1791–1797.
- Gasnault J, Kousignian P, Kahraman M, et al. Cidofovir in AIDS-associated progressive multifocal leukoencephalopathy: a monocenter observational study with clinical and JC virus load monitoring. J Neurovirol 2001; 7:375–381.
- Geschwind MD, Skolasky RI, Royal WS, McArthur JC. The relative contributions of HAART and alpha-interferon for therapy of progressive multifocal leukoencephalopathy in AIDS. J Neurovirol 2001; 7:353–357.
- Verma S, Cikurel K, Koralnik IJ, et al. Mirtazapine in progressive multifocal leukoencephalopathy. J Infect Dis 2007; 196:709–711.
- Brickelmaier M, Lugovskoy A, Kartikeyan R, et al. Identification and characterization of mefloquine efficacy against JC virus in vitro. Antimicrob Agents Chemother 2009; 53:1840–1849.
PML and rheumatology: The contribution of disease and drugs
Progressive multifocal leukoencephalopathy (PML) is a rare, typically fatal, opportunistic infection caused by the JC virus (JCV). Formerly an example of neurologic arcana, PML became an important clinical concern when it developed in patients with human immunodeficiency virus (HIV) infection. More recently, PML has attracted the attention of rheumatologists following reports of its being associated with the use of targeted therapies such as natalizumab and rituximab.1
A recent survey of rheumatologists’ knowledge of and attitudes towards PML revealed that concerns over PML affect decisions on the use of biologic agents. Further, rheumatologists have important real and perceived learning gaps regarding PML; for example, 41% of those surveyed could not identify the diagnostic test of choice for PML.2
PML IN RHEUMATIC DISEASES
Examination of the immunosuppressive therapies prescribed to these patients within 6 months of the onset of neurologic symptoms attributed to PML revealed that low-dose (≤ 15 mg/d) prednisone, with or without an antimalarial agent, was the only immunosuppressive therapy in 31% of patients with SLE and in 11% of patients with rheumatic diseases other than SLE. Three patients had no documented immunosuppressive therapy in the 6 months prior to the onset of PML. Two patients with SLE were prescribed rituximab; no cases were reported in association with biologic therapies other than rituximab.4
In order to circumvent reporting bias, a nationwide hospital discharge database representing nearly 300 million patient discharges was used to determine the relative frequency of PML in patients with rheumatic diseases.5 Because of the reliance on diagnostic coding, rheumatic diseases were likely underreported in this sample; information on therapies was unavailable. After excluding patients who had HIV or cancer or were organ transplant recipients, four cases of PML were identified per 100,000 SLE discharges. This rate was 10-fold higher than the rate associated with rheumatoid arthritis and 20-fold higher than that of the background population.
These data show that PML is a rare occurrence in patients with rheumatic diseases, and SLE appears to be associated with a predisposition to PML. This predisposition in patients with SLE does not appear to be proportional to the degree of iatrogenic immunosuppression, emphasizing the role of host factors.
DISEASE-MODIFYING DRUGS AND PML RISK
In addition to certain disease states, disease-modifying biologic drugs have recently been associated with rare instances of PML.
Rituximab
The first case of rituximab-associated PML in the setting of rheumatoid arthritis was recorded in September 2008.6 The patient had longstanding rheumatoid arthritis and Sjögren syndrome. She received four courses of rituximab and was diagnosed with PML 18 months after the last dose; she died 1 month later. Her therapy for rheumatoid arthritis included a tumor necrosis factor (TNF) antagonist prior to rituximab initiation and treatment with methotrexate and steroids before, during, and after rituximab therapy. Oropharyngeal cancer developed in this patient 9 months prior to the onset of PML and was treated with chemotherapy and radiation therapy.
Another case of PML in a patient with rheumatic disease who had been treated with rituximab was notable because it was the first in which the patient had not previously been treated with an anti-TNF agent.7
Ascertaining cause of PML in patients treated with rituximab is difficult because the potential pathogenic mechanism remains unknown. Humoral immunity is not protective against PML, leading to speculation that the loss of other B-cell functions, such as those of antigen-presenting cells or cytokine production, may lead to a defect in cell-mediated immunity. Another theory posits that reconstitution of naïve B cells with latent JCV infection following B-cell depletion from rituximab therapy may somehow facilitate the development of PML.
Efalizumab
Efalizumab is a monoclonal antibody that targets CD11a, the alpha subunit of lymphocyte function–associated antigen 1. Efalizumab blocks binding to intercellular adhesion molecule 1, and thereby blocks T-cell adhesion and migration. CD11a is also expressed on a variety of other leukocytes and lymphocytes such as B cells, monocytes, and natural killer cells.
Efalizumab was approved in 2003 by the FDA for the treatment of moderate to severe plaque psoriasis. It is estimated that 46,000 patients have been treated with efalizumab worldwide since its approval. In 2008, a black box warning was added to the efalizumab prescribing information following the occurrence of serious infections, including pulmonary tuberculosis, necrotizing fasciitis, and invasive fungal infections.8 Subsequently, four cases of PML, three of which were fatal, were reported in psoriasis patients treated with efalizumab. Of note, these were the first cases of PML reported in patients with psoriasis. Of more concern, the affected patients were among a group of approximately 1,100 patients who had been treated with efalizumab for more than 3 years. In February 2009, a public health advisory was issued by the FDA,9 and efalizumab was voluntarily withdrawn by its manufacturer 2 months later.
Belatacept
Belatacept is a recombinant soluble fusion protein of the extracellular domain of human cytotoxic T-lymphocyte antigen-4 with a fragment of a modified Fc domain of immunoglobulin G1. Recently approved by the FDA for prophylaxis of renal transplant rejection, it is a second-generation, higher-avidity version of abatacept. Abatacept is licensed for the treatment of rheumatoid arthritis and is under investigation for the treatment of vasculitis and SLE. Belatacept differs from abatacept by only two amino acids.
Two cases of PML have been reported in association with belatacept, one in a patient following renal transplantation and the other in a patient following liver transplantation. Both patients had been treated with other standard immunosuppressive therapies for prophylaxis of organ transplant rejection, including mycophenolate mofetil.
Mycophenolate mofetil
Mycophenolate mofetil is the prodrug of mycophenolic acid. Both have been the subjects of FDA alerts regarding PML, based on a January 2008 report of 10 definite and 7 possible cases of PML occurring with mycophenolate mofetil. The patients affected included four with SLE, none of whom underwent a renal transplant.10
In a retrospective cohort study of 32,757 renal transplant patients, Neff et al11 found 14 cases of PML per 100,000 person-years among patients treated with mycophenolate mofetil following kidney transplant compared with none in patients who did not receive mycophenolate mofetil. It is difficult to ascertain risk with mycophenolate mofetil because it is standard therapy among renal transplant patients, leaving few patients in these groups unexposed.
Given the FDA alert with respect to mycophenolate mofetil and PML,10 the frequent use of mycophenolate mofetil in the setting of SLE, and the concerns about possible predisposition to PML among patients with SLE, it will be important to clarify the level of risk in patients with SLE who are treated with mycophenolate mofetil.
AGGREGATE EXPERIENCE: REVIEW OF FEDERAL DATABASE
Ten cases of PML were confirmed with cyclophosphamide treatment, and cyclophosphamide was the most recent DMARD prescribed in two of these cases. Five cases were confirmed with mycophenolate mofetil (in four of which it was the most recently prescribed DMARD) and six with azathioprine (in three of which it was the most recently prescribed DMARD).
Risk of PML with DMARD therapy
Rituximab. The confirmation of six cases of PML among rituximab-treated rheumatoid arthritis patients is a source of concern. Nevertheless, PML is a rare adverse event. It occurs in fewer than 1 in 10,000 rituximab-treated patients who have rheumatoid arthritis, among a total of approximately 130,000 such patients. A better understanding of the potential mechanism responsible for the increased risk of developing PML may help in risk prediction and to guide patient selection for this agent.
Anti-TNF therapy. A paucity of confirmed cases in patients treated with anti-TNF therapy argues against a significant risk of PML associated with this therapy, especially considering the estimated 2 to 3 million rheumatoid arthritis patients who are receiving treatment with anti-TNF agents. A note of caution is sounded by a recent case report of PML in a rheumatoid arthritis patient. The patient had been treated with infliximab, with the only background therapy being methotrexate.13 Ongoing vigilance is therefore necessary.
Mycophenolate mofetil. All five confirmed cases of PML in mycophenolate mofetil-treated patients had earlier received treatment with cyclophosphamide. These data indicate no clear signal of excess risk with mycophenolate mofetil above that seen with other nonbiologic immunosuppressive agents, such as cyclophosphamide or azathioprine.
CONCLUSION AND RECOMMENDATIONS
PML has been reported in association with a variety of disease states, although a predisposition in patients with SLE has become apparent. Synthetic and biologic immunosuppressive therapies have also been implicated, but PML may also occur in the setting of minimal iatrogenic immunosuppression.
Until greater clarity can be achieved, all patients with systemic rheumatic diseases should be considered at risk for PML, regardless of the nature or intensity of their immunosuppressive therapy. In this context, differentiating PML from neurologic syndromes related to the underlying rheumatic disease (eg, neuropsychiatric SLE, cerebral vasculitis) is critical, particularly given the markedly different approaches to management.
PML should be considered in patients with unexplained subacute progressive focal and diffuse neurologic deficits, especially if their clinical or radiologic status worsens in the face of increased intensity of immunosuppressive therapy. Spinal cord or optic nerve involvement argues against PML. A normal magnetic resonance image (MRI) has a high negative predictive value, and frank infarction is not a feature of PML. In classic PML, contrast enhancement is typically absent and routine cerebrospinal fluid (CSF) analysis is typically normal. However, contrast enhancement and edema on MRI, lymphocytic CSF pleocytosis, and elevated CSF protein may be seen in the more recently described “inflammatory PML,” in which case the distinction from cerebral vasculitis or neuropsychiatric SLE may be more difficult. Angiography appears normal in patients with PML.
The diagnostic test of choice is a polymerase chain reaction (PCR) assay for JCV in CSF. If the PCR is repeatedly negative, then a brain biopsy should be considered, especially in the setting of progressive neurologic decline in patients receiving immunosuppressive therapy.
DISCUSSION
Dr. Simpson: To what extent are these lesions in the brain being attributed to the underlying vasculitis, particularly in SLE, as opposed to pursuing a PML diagnosis, and how might this result in dramatic underreporting of the complication?
Dr. Molloy: We found that PML is almost certainly underdiagnosed, particularly in SLE patients. If a patient succumbs to assumed neuropsychiatric SLE, how often is an autopsy undertaken? One telling paper from Sweden documented four cases of PML in SLE patients.14 In one of these, the diagnosis was made retrospectively from autopsy tissue that had been banked 20 years previously. It undoubtedly is underdiagnosed.
Dr. Calabrese: Even in the most recent rituximab-associated cases of PML, several patients were empirically given additional immunosuppressive therapy because it was presumed that they had a comorbid neuropsychiatric rheumatic complication. The presence of neuropsychiatric complications ascribed to an autoinflammatory disease generally warrants escalation of immunosuppressive therapy. It has always been standard practice for us to rule out opportunistic infection, but JCV infection has not been on the radar screen until very recently.
Dr. Molloy: I’d like to emphasize that, in our literature review, 50% of the rheumatic disease patients diagnosed with PML had been treated with more intensive immunosuppressive therapy. It was only after they continued to deteriorate that JCV infection was suspected and PML ultimately diagnosed.
Dr. Berger: Is it fair to say that the incidence of PML in SLE is about 10 times that in rheumatoid arthritis?
Dr. Molloy: In the hospital discharge database, it was 10-fold higher in SLE than in rheumatoid arthritis, but we can’t draw a conclusion from the AERS database because we don’t have a denominator. The database consists of voluntary submission of cases.
Dr. Calabrese: The information that we can expect to glean from the database is profoundly limited, for all the reasons that you enumerated. Despite the flaws, we’re obligated to continuously examine it because sometimes a case or two may provide some special insight.
Dr. Simpson: As neurologists, we often lag behind rheumatologists in the use of new treatments, including intravenous immune globulin (IVIG) and now rituximab. Rituximab is becoming the go-to drug for a number of neurologic diseases. I’m using it quite a bit and have observed some dramatic responses in patients with chronic inflammatory demyelinating polyneuropathy, for example, in whom IVIG or plasmapheresis was failing. Anecdotally, some of the turnarounds in polymyositis and even myasthenia gravis are remarkable as well. I’m not sure to what extent neurologists—particularly peripheral neurologists—who use rituximab are recognizing PML.
Dr. Fox: The index of suspicion is probably vastly different among multiple sclerosis (MS) specialists and general neurologists. Neurologists who treat MS will be acutely aware of PML because of its association with natalizumab.
Dr. Berger: Yes, but you’re talking about possibly two orders of magnitude difference between natalizumab and rituximab. In fact, PML is rarely reported in the setting of neurologic disease. It’s mostly reported in the setting of rheumatologic disease.
Dr. Rudick: I don’t necessarily agree with you. Ascertaining the true incidence of PML with agents other than natalizumab is difficult. One is unlikely to miss a case of PML in an MS patient treated with natalizumab, but most cases stemming from the use of these other disease-modifying drugs are probably being missed.
Dr. Calabrese: I get two messages out of this body of work. Number one is that while PML is rare, it is seen across the spectrum of immunosuppressive agents, including biologic and nonbiologic drugs. Number two is that PML is seriously underreported and underrecognized, which is probably leading to suboptimal patient care. Rituximab was recently approved for treatment of Wegener granulomatosis, and this disease is heavily pretreated with cyclophosphamide. You would expect that PML is on the radar among clinicians caring for patients whose diseases warrant the use of increasingly complex, potent, and novel immunosuppressives.
Dr. Berger: There is one other biologic agent you left out—alemtuzumab. It wipes out all of the B cells and T cells; the B cells repopulate but the T cells remain suppressed for a long period. If ever there was a drug whose action mirrors what happens in HIV, alemtuzumab is that drug. Yet, PML is rarely seen with alemtuzumab. Alemtuzumab-associated PML has not been reported in the MS population, and it has only been seen in two transplantations that I’m aware of. I’m not saying that it doesn’t occur, but we’re not seeing it with the same frequency that one would predict given its profile.
- Calabrese LH, Molloy ES, Huang D, Ransohoff RM. Progressive multifocal leukoencephalopathy in rheumatic diseases: evolving clinical and pathologic patterns of disease. Arthritis Rheum 2007; 6:2116–2128.
- Calabrese LH, Molloy ES, Taege AJ. Rheumatologists’ knowledge, attitudes and concerns regarding progressive multifocal encephalopathy (PML) [abstract]. Arthritis Rheum 2009; 60 (suppl 10):130.
- Rituxan (rituximab). U.S. Food and Drug Administration Web site. http://www.fda.gov/Safety/MedWatch/SafetyInformation/SafetyAlertsforHumanMedicalProducts/ucm150747.htm. Updated June 19, 2009. Accessed September 15, 2011.
- Molloy ES, Calabrese LH. Progressive multifocal leukoencephalopathy in patients with rheumatic diseases: are patients with systemic lupus erythematosus at particular risk? Autoimmun Rev 2008; 8:144–146.
- Molloy ES, Calabrese LH. Progressive multifocal leukoencephalopathy: a national estimate of frequency in systemic lupus erythematosus and other rheumatic diseases. Arthritis Rheum 2009; 60:3761–3765.
- Fleischmann RM. Progressive multifocal leukoencephalopathy following rituximab treatment in a patient with rheumatoid arthritis. Arthritis Rheum 2009; 60:3225–3228.
- Rituxan (rituximab) – PML. U.S. Food and Drug Administration Web site. http://www.fda.gov/Safety/MedWatch/SafetyInformation/SafetyAlertsforHumanMedicalProducts/ucm187791.htm. Updated October 23, 2009. Accessed September 15, 2011.
- Raptiva (efalizumab) October 2008. U.S. Food and Drug Administration Web site. http://www.fda.gov/Safety/MedWatch/SafetyInformation/SafetyAlertsforHumanMedicalProducts/ucm092089.htm. Updated June 19, 2009. Accessed September 15, 2011.
- Raptiva (efalizumab) Feb 2009. U.S. Food and Drug Administration Web site. http://www.fda.gov/Safety/MedWatch/SafetyInformation/SafetyAlertsforHumanMedicalProducts/ucm149675.htm. Updated June 16, 2009. Accessed September 15, 2011.
- Communication about an ongoing safety review of CellCept (mycophenolate mofetil) and Myfortic (mycophenolic acid). U.S. Food and Drug Administration Web site. http://www.fda.gov/Drugs/DrugSafety/PostmarketDrugSafetyInformationforPatientsandProviders/DrugSafetyInformationforHeathcareProfessionals/ucm072438.htm. Updated October 30, 2009. Accessed September 15, 2011.
- Neff RT, Hurst FP, Falta EM, et al. Progressive multifocal leukoencephalopathy and use of mycophenolate mofetil after kidney transplantation. Transplantation 2008; 86:1474–1478.
- Molloy ES, Calabrese LH. Progressive multifocal leukoencephalopathy and biologic therapy in rheumatic diseases: an analysis of the FDA AERS database [ACR abstract 700]. Arthritis Rheum 2010; 62 (suppl):S292.
- Kumar D, Bouldin TW, Berger RG. A case of progressive multifocal leukoencephalopathy in a patient treated with infliximab. Arthritis Rheum 2010; 62:3191–3195.
- Nived O, Bengtsson AA, Jonsen A, Sturfelt G. Progressive multifocal leukoencephalopathy—the importance of early diagnosis illustrated in four cases. Lupus 2008; 17:1036–1041.
Progressive multifocal leukoencephalopathy (PML) is a rare, typically fatal, opportunistic infection caused by the JC virus (JCV). Formerly an example of neurologic arcana, PML became an important clinical concern when it developed in patients with human immunodeficiency virus (HIV) infection. More recently, PML has attracted the attention of rheumatologists following reports of its being associated with the use of targeted therapies such as natalizumab and rituximab.1
A recent survey of rheumatologists’ knowledge of and attitudes towards PML revealed that concerns over PML affect decisions on the use of biologic agents. Further, rheumatologists have important real and perceived learning gaps regarding PML; for example, 41% of those surveyed could not identify the diagnostic test of choice for PML.2
PML IN RHEUMATIC DISEASES
Examination of the immunosuppressive therapies prescribed to these patients within 6 months of the onset of neurologic symptoms attributed to PML revealed that low-dose (≤ 15 mg/d) prednisone, with or without an antimalarial agent, was the only immunosuppressive therapy in 31% of patients with SLE and in 11% of patients with rheumatic diseases other than SLE. Three patients had no documented immunosuppressive therapy in the 6 months prior to the onset of PML. Two patients with SLE were prescribed rituximab; no cases were reported in association with biologic therapies other than rituximab.4
In order to circumvent reporting bias, a nationwide hospital discharge database representing nearly 300 million patient discharges was used to determine the relative frequency of PML in patients with rheumatic diseases.5 Because of the reliance on diagnostic coding, rheumatic diseases were likely underreported in this sample; information on therapies was unavailable. After excluding patients who had HIV or cancer or were organ transplant recipients, four cases of PML were identified per 100,000 SLE discharges. This rate was 10-fold higher than the rate associated with rheumatoid arthritis and 20-fold higher than that of the background population.
These data show that PML is a rare occurrence in patients with rheumatic diseases, and SLE appears to be associated with a predisposition to PML. This predisposition in patients with SLE does not appear to be proportional to the degree of iatrogenic immunosuppression, emphasizing the role of host factors.
DISEASE-MODIFYING DRUGS AND PML RISK
In addition to certain disease states, disease-modifying biologic drugs have recently been associated with rare instances of PML.
Rituximab
The first case of rituximab-associated PML in the setting of rheumatoid arthritis was recorded in September 2008.6 The patient had longstanding rheumatoid arthritis and Sjögren syndrome. She received four courses of rituximab and was diagnosed with PML 18 months after the last dose; she died 1 month later. Her therapy for rheumatoid arthritis included a tumor necrosis factor (TNF) antagonist prior to rituximab initiation and treatment with methotrexate and steroids before, during, and after rituximab therapy. Oropharyngeal cancer developed in this patient 9 months prior to the onset of PML and was treated with chemotherapy and radiation therapy.
Another case of PML in a patient with rheumatic disease who had been treated with rituximab was notable because it was the first in which the patient had not previously been treated with an anti-TNF agent.7
Ascertaining cause of PML in patients treated with rituximab is difficult because the potential pathogenic mechanism remains unknown. Humoral immunity is not protective against PML, leading to speculation that the loss of other B-cell functions, such as those of antigen-presenting cells or cytokine production, may lead to a defect in cell-mediated immunity. Another theory posits that reconstitution of naïve B cells with latent JCV infection following B-cell depletion from rituximab therapy may somehow facilitate the development of PML.
Efalizumab
Efalizumab is a monoclonal antibody that targets CD11a, the alpha subunit of lymphocyte function–associated antigen 1. Efalizumab blocks binding to intercellular adhesion molecule 1, and thereby blocks T-cell adhesion and migration. CD11a is also expressed on a variety of other leukocytes and lymphocytes such as B cells, monocytes, and natural killer cells.
Efalizumab was approved in 2003 by the FDA for the treatment of moderate to severe plaque psoriasis. It is estimated that 46,000 patients have been treated with efalizumab worldwide since its approval. In 2008, a black box warning was added to the efalizumab prescribing information following the occurrence of serious infections, including pulmonary tuberculosis, necrotizing fasciitis, and invasive fungal infections.8 Subsequently, four cases of PML, three of which were fatal, were reported in psoriasis patients treated with efalizumab. Of note, these were the first cases of PML reported in patients with psoriasis. Of more concern, the affected patients were among a group of approximately 1,100 patients who had been treated with efalizumab for more than 3 years. In February 2009, a public health advisory was issued by the FDA,9 and efalizumab was voluntarily withdrawn by its manufacturer 2 months later.
Belatacept
Belatacept is a recombinant soluble fusion protein of the extracellular domain of human cytotoxic T-lymphocyte antigen-4 with a fragment of a modified Fc domain of immunoglobulin G1. Recently approved by the FDA for prophylaxis of renal transplant rejection, it is a second-generation, higher-avidity version of abatacept. Abatacept is licensed for the treatment of rheumatoid arthritis and is under investigation for the treatment of vasculitis and SLE. Belatacept differs from abatacept by only two amino acids.
Two cases of PML have been reported in association with belatacept, one in a patient following renal transplantation and the other in a patient following liver transplantation. Both patients had been treated with other standard immunosuppressive therapies for prophylaxis of organ transplant rejection, including mycophenolate mofetil.
Mycophenolate mofetil
Mycophenolate mofetil is the prodrug of mycophenolic acid. Both have been the subjects of FDA alerts regarding PML, based on a January 2008 report of 10 definite and 7 possible cases of PML occurring with mycophenolate mofetil. The patients affected included four with SLE, none of whom underwent a renal transplant.10
In a retrospective cohort study of 32,757 renal transplant patients, Neff et al11 found 14 cases of PML per 100,000 person-years among patients treated with mycophenolate mofetil following kidney transplant compared with none in patients who did not receive mycophenolate mofetil. It is difficult to ascertain risk with mycophenolate mofetil because it is standard therapy among renal transplant patients, leaving few patients in these groups unexposed.
Given the FDA alert with respect to mycophenolate mofetil and PML,10 the frequent use of mycophenolate mofetil in the setting of SLE, and the concerns about possible predisposition to PML among patients with SLE, it will be important to clarify the level of risk in patients with SLE who are treated with mycophenolate mofetil.
AGGREGATE EXPERIENCE: REVIEW OF FEDERAL DATABASE
Ten cases of PML were confirmed with cyclophosphamide treatment, and cyclophosphamide was the most recent DMARD prescribed in two of these cases. Five cases were confirmed with mycophenolate mofetil (in four of which it was the most recently prescribed DMARD) and six with azathioprine (in three of which it was the most recently prescribed DMARD).
Risk of PML with DMARD therapy
Rituximab. The confirmation of six cases of PML among rituximab-treated rheumatoid arthritis patients is a source of concern. Nevertheless, PML is a rare adverse event. It occurs in fewer than 1 in 10,000 rituximab-treated patients who have rheumatoid arthritis, among a total of approximately 130,000 such patients. A better understanding of the potential mechanism responsible for the increased risk of developing PML may help in risk prediction and to guide patient selection for this agent.
Anti-TNF therapy. A paucity of confirmed cases in patients treated with anti-TNF therapy argues against a significant risk of PML associated with this therapy, especially considering the estimated 2 to 3 million rheumatoid arthritis patients who are receiving treatment with anti-TNF agents. A note of caution is sounded by a recent case report of PML in a rheumatoid arthritis patient. The patient had been treated with infliximab, with the only background therapy being methotrexate.13 Ongoing vigilance is therefore necessary.
Mycophenolate mofetil. All five confirmed cases of PML in mycophenolate mofetil-treated patients had earlier received treatment with cyclophosphamide. These data indicate no clear signal of excess risk with mycophenolate mofetil above that seen with other nonbiologic immunosuppressive agents, such as cyclophosphamide or azathioprine.
CONCLUSION AND RECOMMENDATIONS
PML has been reported in association with a variety of disease states, although a predisposition in patients with SLE has become apparent. Synthetic and biologic immunosuppressive therapies have also been implicated, but PML may also occur in the setting of minimal iatrogenic immunosuppression.
Until greater clarity can be achieved, all patients with systemic rheumatic diseases should be considered at risk for PML, regardless of the nature or intensity of their immunosuppressive therapy. In this context, differentiating PML from neurologic syndromes related to the underlying rheumatic disease (eg, neuropsychiatric SLE, cerebral vasculitis) is critical, particularly given the markedly different approaches to management.
PML should be considered in patients with unexplained subacute progressive focal and diffuse neurologic deficits, especially if their clinical or radiologic status worsens in the face of increased intensity of immunosuppressive therapy. Spinal cord or optic nerve involvement argues against PML. A normal magnetic resonance image (MRI) has a high negative predictive value, and frank infarction is not a feature of PML. In classic PML, contrast enhancement is typically absent and routine cerebrospinal fluid (CSF) analysis is typically normal. However, contrast enhancement and edema on MRI, lymphocytic CSF pleocytosis, and elevated CSF protein may be seen in the more recently described “inflammatory PML,” in which case the distinction from cerebral vasculitis or neuropsychiatric SLE may be more difficult. Angiography appears normal in patients with PML.
The diagnostic test of choice is a polymerase chain reaction (PCR) assay for JCV in CSF. If the PCR is repeatedly negative, then a brain biopsy should be considered, especially in the setting of progressive neurologic decline in patients receiving immunosuppressive therapy.
DISCUSSION
Dr. Simpson: To what extent are these lesions in the brain being attributed to the underlying vasculitis, particularly in SLE, as opposed to pursuing a PML diagnosis, and how might this result in dramatic underreporting of the complication?
Dr. Molloy: We found that PML is almost certainly underdiagnosed, particularly in SLE patients. If a patient succumbs to assumed neuropsychiatric SLE, how often is an autopsy undertaken? One telling paper from Sweden documented four cases of PML in SLE patients.14 In one of these, the diagnosis was made retrospectively from autopsy tissue that had been banked 20 years previously. It undoubtedly is underdiagnosed.
Dr. Calabrese: Even in the most recent rituximab-associated cases of PML, several patients were empirically given additional immunosuppressive therapy because it was presumed that they had a comorbid neuropsychiatric rheumatic complication. The presence of neuropsychiatric complications ascribed to an autoinflammatory disease generally warrants escalation of immunosuppressive therapy. It has always been standard practice for us to rule out opportunistic infection, but JCV infection has not been on the radar screen until very recently.
Dr. Molloy: I’d like to emphasize that, in our literature review, 50% of the rheumatic disease patients diagnosed with PML had been treated with more intensive immunosuppressive therapy. It was only after they continued to deteriorate that JCV infection was suspected and PML ultimately diagnosed.
Dr. Berger: Is it fair to say that the incidence of PML in SLE is about 10 times that in rheumatoid arthritis?
Dr. Molloy: In the hospital discharge database, it was 10-fold higher in SLE than in rheumatoid arthritis, but we can’t draw a conclusion from the AERS database because we don’t have a denominator. The database consists of voluntary submission of cases.
Dr. Calabrese: The information that we can expect to glean from the database is profoundly limited, for all the reasons that you enumerated. Despite the flaws, we’re obligated to continuously examine it because sometimes a case or two may provide some special insight.
Dr. Simpson: As neurologists, we often lag behind rheumatologists in the use of new treatments, including intravenous immune globulin (IVIG) and now rituximab. Rituximab is becoming the go-to drug for a number of neurologic diseases. I’m using it quite a bit and have observed some dramatic responses in patients with chronic inflammatory demyelinating polyneuropathy, for example, in whom IVIG or plasmapheresis was failing. Anecdotally, some of the turnarounds in polymyositis and even myasthenia gravis are remarkable as well. I’m not sure to what extent neurologists—particularly peripheral neurologists—who use rituximab are recognizing PML.
Dr. Fox: The index of suspicion is probably vastly different among multiple sclerosis (MS) specialists and general neurologists. Neurologists who treat MS will be acutely aware of PML because of its association with natalizumab.
Dr. Berger: Yes, but you’re talking about possibly two orders of magnitude difference between natalizumab and rituximab. In fact, PML is rarely reported in the setting of neurologic disease. It’s mostly reported in the setting of rheumatologic disease.
Dr. Rudick: I don’t necessarily agree with you. Ascertaining the true incidence of PML with agents other than natalizumab is difficult. One is unlikely to miss a case of PML in an MS patient treated with natalizumab, but most cases stemming from the use of these other disease-modifying drugs are probably being missed.
Dr. Calabrese: I get two messages out of this body of work. Number one is that while PML is rare, it is seen across the spectrum of immunosuppressive agents, including biologic and nonbiologic drugs. Number two is that PML is seriously underreported and underrecognized, which is probably leading to suboptimal patient care. Rituximab was recently approved for treatment of Wegener granulomatosis, and this disease is heavily pretreated with cyclophosphamide. You would expect that PML is on the radar among clinicians caring for patients whose diseases warrant the use of increasingly complex, potent, and novel immunosuppressives.
Dr. Berger: There is one other biologic agent you left out—alemtuzumab. It wipes out all of the B cells and T cells; the B cells repopulate but the T cells remain suppressed for a long period. If ever there was a drug whose action mirrors what happens in HIV, alemtuzumab is that drug. Yet, PML is rarely seen with alemtuzumab. Alemtuzumab-associated PML has not been reported in the MS population, and it has only been seen in two transplantations that I’m aware of. I’m not saying that it doesn’t occur, but we’re not seeing it with the same frequency that one would predict given its profile.
- Calabrese LH, Molloy ES, Huang D, Ransohoff RM. Progressive multifocal leukoencephalopathy in rheumatic diseases: evolving clinical and pathologic patterns of disease. Arthritis Rheum 2007; 6:2116–2128.
- Calabrese LH, Molloy ES, Taege AJ. Rheumatologists’ knowledge, attitudes and concerns regarding progressive multifocal encephalopathy (PML) [abstract]. Arthritis Rheum 2009; 60 (suppl 10):130.
- Rituxan (rituximab). U.S. Food and Drug Administration Web site. http://www.fda.gov/Safety/MedWatch/SafetyInformation/SafetyAlertsforHumanMedicalProducts/ucm150747.htm. Updated June 19, 2009. Accessed September 15, 2011.
- Molloy ES, Calabrese LH. Progressive multifocal leukoencephalopathy in patients with rheumatic diseases: are patients with systemic lupus erythematosus at particular risk? Autoimmun Rev 2008; 8:144–146.
- Molloy ES, Calabrese LH. Progressive multifocal leukoencephalopathy: a national estimate of frequency in systemic lupus erythematosus and other rheumatic diseases. Arthritis Rheum 2009; 60:3761–3765.
- Fleischmann RM. Progressive multifocal leukoencephalopathy following rituximab treatment in a patient with rheumatoid arthritis. Arthritis Rheum 2009; 60:3225–3228.
- Rituxan (rituximab) – PML. U.S. Food and Drug Administration Web site. http://www.fda.gov/Safety/MedWatch/SafetyInformation/SafetyAlertsforHumanMedicalProducts/ucm187791.htm. Updated October 23, 2009. Accessed September 15, 2011.
- Raptiva (efalizumab) October 2008. U.S. Food and Drug Administration Web site. http://www.fda.gov/Safety/MedWatch/SafetyInformation/SafetyAlertsforHumanMedicalProducts/ucm092089.htm. Updated June 19, 2009. Accessed September 15, 2011.
- Raptiva (efalizumab) Feb 2009. U.S. Food and Drug Administration Web site. http://www.fda.gov/Safety/MedWatch/SafetyInformation/SafetyAlertsforHumanMedicalProducts/ucm149675.htm. Updated June 16, 2009. Accessed September 15, 2011.
- Communication about an ongoing safety review of CellCept (mycophenolate mofetil) and Myfortic (mycophenolic acid). U.S. Food and Drug Administration Web site. http://www.fda.gov/Drugs/DrugSafety/PostmarketDrugSafetyInformationforPatientsandProviders/DrugSafetyInformationforHeathcareProfessionals/ucm072438.htm. Updated October 30, 2009. Accessed September 15, 2011.
- Neff RT, Hurst FP, Falta EM, et al. Progressive multifocal leukoencephalopathy and use of mycophenolate mofetil after kidney transplantation. Transplantation 2008; 86:1474–1478.
- Molloy ES, Calabrese LH. Progressive multifocal leukoencephalopathy and biologic therapy in rheumatic diseases: an analysis of the FDA AERS database [ACR abstract 700]. Arthritis Rheum 2010; 62 (suppl):S292.
- Kumar D, Bouldin TW, Berger RG. A case of progressive multifocal leukoencephalopathy in a patient treated with infliximab. Arthritis Rheum 2010; 62:3191–3195.
- Nived O, Bengtsson AA, Jonsen A, Sturfelt G. Progressive multifocal leukoencephalopathy—the importance of early diagnosis illustrated in four cases. Lupus 2008; 17:1036–1041.
A rational approach to PML for the clinician
Our remarkable progress in understanding progressive multifocal leukoencephalopathy (PML) since its discovery more than 50 years ago has evolved in three stages, concurrent with the changing epidemiology of PML: the pre–human immunodeficiency virus (HIV) era; the HIV era, with highly active antiretroviral therapy (HAART) bringing further change; and the biologic therapy era.
Before the appearance of HIV, PML developed mostly in patients who had lymphoma, other malignancies, and rare forms of immunosuppression. The development of HIV changed the nature of PML, with more than 75% of cases now reported in HIV-infected patients. Within the HIV population, the epidemiology and prognosis of PML have undergone additional changes since the late 1990s. The introduction of HAART transformed PML from an almost uniformly fatal and inexorably progressive disease to one in which long-term survival is expected, particularly in the setting of robust immune reconstitution.1
The third and most recent stage in the evolution of PML and our understanding of it has coincided with the introduction and use of increasingly potent immunosuppressive regimens and novel biologic immunologic therapies that target various aspects of the integrated immune response. These agents are being applied not only in the field of autoimmune and autoinflammatory disease but also in transplantation and oncology.
Collectively, vulnerable populations (ie, patients with lymphoreticular malignancies and autoinflammatory diseases) are now being subjected to therapies that singly or in combination have unknown effects on the immune system. As a byproduct, practitioners who were only vaguely aware of PML in the past now must consider PML in their differential diagnosis, develop a rational plan for evaluating such patients, and recognize when referral to a specialist is indicated. Recent descriptions of atypical forms of PML2,3 add to the challenge for clinicians, as do reports of cases of PML in patients with minimal immunosuppression, in the absence of immunosuppressive therapy, and in patients who appear to have “normal” immune systems but in fact have diseases such as sarcoidosis.4 Rare cases are also being reported in patients with advanced liver disease.4
This article offers recommendations for enhanced awareness of PML, suggestions for improved evaluation of predisposed patients, and a summary of currently accepted treatment strategies.
WHEN TO SUSPECT PML
Patients being treated with immunosuppressive biologic agents represent a significant group that is predisposed to PML. At one time, focal neurologic deficits were required to consider the possibility of PML, but cognitive/behavioral abnormalities rather than focal neurologic findings are often the presenting sign in individuals treated with immune-modulating biologic agents. This phenomenon is most strikingly observed in recipients of natalizumab. Any central nervous system (CNS) dysfunction in a patient taking an immunosuppressive biologic agent should arouse suspicion for PML.
Peripheral neuropathy is not caused by PML but can coexist with it. Accordingly, in patients with rheumatologic disease who are receiving immune modifiers, neuromuscular symptoms in the absence of brain abnormalities on magnetic resonance imaging (MRI) argue against consideration of PML but do not rule it out—especially in patients with connective tissue diseases.
Systemic lupus erythematosus (SLE) represents a special challenge for several reasons. First, SLE appears to be a predisposing factor among other connective tissue diseases.5 In addition, SLE is associated with a variety of CNS complications, including a spectrum of focal and diffuse signs and symptoms that can mimic PML and lead to underdiagnosis.
Underrecognition is a risk in the HIV population as well, where cognitive impairment is common. Irrespective of immune or virologic status, 57% of HIV patients demonstrate impairment on neuropsychiatric testing. Often, mild to moderate cognitive impairment in HIV is attributed to HIV encephalopathy with no further workup, resulting in a missed or late diagnosis of PML.
IMAGING CONSIDERATIONS
In the rheumatologic disease population, especially those with SLE, and the HIV population, neuroimaging is indicated in any patient who presents with cognitive impairment. Typical radiographic characteristics of PML on MRI are subcortical white matter hyperintense areas on T2-weighted images and fluid-attenuated inversion recovery. T1-weighted images will reveal hypointense lesions that usually do not enhance, but may do so in fewer than 10% of patients with PML. Typically, no mass effect is seen.
In addition to rare faint gadolinium enhancement of lesions, other lesion characteristics may depart from the classic picture—for example, white matter and gray matter involvement, and monofocal instead of multifocal lesions. In HIV-positive patients, MRI can demonstrate diffuse cerebellar atrophy and subtle white matter abnormalities within the cerebellum.
Unfortunately, nonspecific white matter lesions occur in HIV infection as well as connective tissue diseases, compromising diagnostic specificity of a single imaging study. Nevertheless, progression of clinical signs and symptoms and progressive MRI changes should prompt a more vigorous diagnostic evaluation for PML. Alternatively, a normal MRI in a patient in whom PML is suspected has strong negative predictive value. In either situation, baseline neuroimaging is not recommended.
DIAGNOSIS AND REFERRAL
A neurology consult is advised when a patient has a predisposing condition for PML or suspicious neurologic signs or symptoms, whether focal or diffuse, and in whom an MRI demonstrates white matter changes.
Evaluation for JC virus DNA
When the neurology consult has been scheduled, and before the actual visit to the neurologist, a cerebrospinal fluid (CSF) sample should be obtained and evaluated for JC virus (JCV) DNA using a highly sensitive polymerase chain reaction (PCR) assay. Lumbar puncture in the setting of possible PML is critical to exclude the presence of other opportunistic infections.
The importance of using ultrasensitive PCR assays for diagnosing PML cannot be overstated, as falsely negative CSF PCR has been observed for JCV DNA despite high levels of JCV DNA in spinal fluid when utilizing less sensitive assays. The most sensitive commercial assays can detect as few as 50 copies of JCV DNA per mL of CSF fluid.
The risk of PML imparted by biologic agents other than natalizumab and nonbiologic immunosuppressive agents has been difficult to quantify, but no immune-modifying drug or combination of drugs appears entirely free of risk. Any patient who has had significant or prolonged immunosuppression should be considered vulnerable, and any patient with suspicion of PML based on unexplained neurologic symptoms warrants CSF examination for JCV DNA.
Brain biopsy
In patients with progressive clinical and MRI findings that suggest PML, but whose CSF PCR for JCV DNA is repeatedly negative, a brain biopsy is appropriate regardless of background immunosuppression. In the patient with rheumatologic disease, for example, suspicion of PML should be heightened if there is neurologic deterioration in the face of escalating antiinflammatory or immunosuppressive therapy for immune-driven inflammatory disease. Diagnostic urgency is particularly warranted in those disorders where the possibility for immune reconstitution is highest (ie, those receiving immunosuppressive regimens).
PML MANAGEMENT DEPENDS ON CLINICAL SETTING
Management of PML starts with risk stratification to identify those patients most prone to developing PML based on their immune status; the presence of autoimmune disease; the subtype of disease (in the case of SLE); and the nature, intensity, and duration of their immunosuppression. If a high-risk patient develops signs and symptoms of PML, the diagnosis should be anticipated and serious consideration given to withholding immunosuppressive therapies while the patient is being worked up.
Accelerating immune reconstitution
Once a diagnosis of PML is confirmed, immune reconstitution should be accelerated whenever possible. This can include temporary or permanent withdrawal of immunosuppressive therapy and initiation of plasmapheresis. Evidence supports continuing plasma exchange until natalizumab serum drug levels decline to less than 1 μg/mL to achieve desaturation of the alpha-4 integrin receptor.6 Typically, desaturation of the targeted integrin receptor occurs after five plasmapheresis sessions.
Immune reconstitution may also precipitate a syndrome known as the immune reconstitution inflammatory syndrome (IRIS), characterized by enlargement and contrast enhancement of PML lesions, appearance of new brain lesions, and worsening of neurologic deficits. The infiltration of the brain with inflammatory multinucleated cells and lymphocytes following abrupt immune reconstitution requires treatment. Opinion suggests that judicious use of corticosteroids may control the immune response in the brain in patients with PML-IRIS,7,8 although further studies are needed.
Involving the patient in treatment decisions
Because risk tolerance varies considerably among individuals, patients should be informed of the risks of PML on the basis of their disease and the agents used to treat it. They should also be given information about the effects of individual treatments on the course of their disease, and they should be encouraged to participate in the selection of therapy.
SUMMARY
The approach to PML in the biologic era starts with an increased awareness of the disease followed by recognition of vulnerable populations and factors that contribute to the development of PML, such as biologic and nonbiologic immunosuppressive therapy. Optimal management includes a low threshold for investigating neurologic signs and symptoms and new-onset signs and symptoms in vulnerable populations, the use of MRI to detect typical PML brain lesions and other atypical brain features (ie, cerebellar atrophy), lumbar puncture and spinal CSF analysis to detect JCV DNA, and timely neurologic consultation for further evaluation. Much still needs to be learned about PML and the risks imparted by background diseases and individual drugs used in rheumatologic, neurologic, and oncologic disease.
- Brew BJ, Davies NW, Cinque P, Clifford DB, Nath A. Progressive multifocal leukoencephalopathy and other forms of JC virus disease. Nat Rev Neurol 2010; 6:667–679.
- Kedar S, Berger JR. The changing landscape of progressive multifocal leukoencephalopathy. Curr Infect Dis Rep 2011; 13:380–386.
- Tan CS, Koralnik IJ. Progressive multifocal leukoencephalopathy and other disorders caused by JC virus: clinical features and pathogenesis. Lancet Neurol 2010; 9:425–437.
- Gheuens S, Pierone G, Peeters P, Koralnik IJ. Progressive multifocal leukoencephalopathy in individuals with minimal or occult immunosuppression. J Neurol Neurosurg Psychiatry 2010; 81:247–254.
- Molloy ES, Calabrese LH. Progressive multifocal leukoencephalopathy: a national estimate of frequency in systemic lupus erythematosus and other rheumatic diseases. Arthritis Rheum 2009; 60:3761–3765.
- Khatri BO, Man S, Giovannoni G, et al. Effect of plasma exchange in accelerating natalizumab clearance and restoring leukocyte function. Neurology 2009; 72:402–409.
- Clifford DB, De Luca A, Simpson DM, Arendt G, Giovannoni G, Nath A. Natalizumab-associated progressive multifocal leukoencephalopathy in patients with multiple sclerosis: lessons from 28 cases. Lancet Neurol 2010; 9:438–446.
- Johnson T, Nath A. Immune reconstitution inflammatory syndrome and the central nervous system. Curr Opin Neurol 2011; 24:284–290.
Our remarkable progress in understanding progressive multifocal leukoencephalopathy (PML) since its discovery more than 50 years ago has evolved in three stages, concurrent with the changing epidemiology of PML: the pre–human immunodeficiency virus (HIV) era; the HIV era, with highly active antiretroviral therapy (HAART) bringing further change; and the biologic therapy era.
Before the appearance of HIV, PML developed mostly in patients who had lymphoma, other malignancies, and rare forms of immunosuppression. The development of HIV changed the nature of PML, with more than 75% of cases now reported in HIV-infected patients. Within the HIV population, the epidemiology and prognosis of PML have undergone additional changes since the late 1990s. The introduction of HAART transformed PML from an almost uniformly fatal and inexorably progressive disease to one in which long-term survival is expected, particularly in the setting of robust immune reconstitution.1
The third and most recent stage in the evolution of PML and our understanding of it has coincided with the introduction and use of increasingly potent immunosuppressive regimens and novel biologic immunologic therapies that target various aspects of the integrated immune response. These agents are being applied not only in the field of autoimmune and autoinflammatory disease but also in transplantation and oncology.
Collectively, vulnerable populations (ie, patients with lymphoreticular malignancies and autoinflammatory diseases) are now being subjected to therapies that singly or in combination have unknown effects on the immune system. As a byproduct, practitioners who were only vaguely aware of PML in the past now must consider PML in their differential diagnosis, develop a rational plan for evaluating such patients, and recognize when referral to a specialist is indicated. Recent descriptions of atypical forms of PML2,3 add to the challenge for clinicians, as do reports of cases of PML in patients with minimal immunosuppression, in the absence of immunosuppressive therapy, and in patients who appear to have “normal” immune systems but in fact have diseases such as sarcoidosis.4 Rare cases are also being reported in patients with advanced liver disease.4
This article offers recommendations for enhanced awareness of PML, suggestions for improved evaluation of predisposed patients, and a summary of currently accepted treatment strategies.
WHEN TO SUSPECT PML
Patients being treated with immunosuppressive biologic agents represent a significant group that is predisposed to PML. At one time, focal neurologic deficits were required to consider the possibility of PML, but cognitive/behavioral abnormalities rather than focal neurologic findings are often the presenting sign in individuals treated with immune-modulating biologic agents. This phenomenon is most strikingly observed in recipients of natalizumab. Any central nervous system (CNS) dysfunction in a patient taking an immunosuppressive biologic agent should arouse suspicion for PML.
Peripheral neuropathy is not caused by PML but can coexist with it. Accordingly, in patients with rheumatologic disease who are receiving immune modifiers, neuromuscular symptoms in the absence of brain abnormalities on magnetic resonance imaging (MRI) argue against consideration of PML but do not rule it out—especially in patients with connective tissue diseases.
Systemic lupus erythematosus (SLE) represents a special challenge for several reasons. First, SLE appears to be a predisposing factor among other connective tissue diseases.5 In addition, SLE is associated with a variety of CNS complications, including a spectrum of focal and diffuse signs and symptoms that can mimic PML and lead to underdiagnosis.
Underrecognition is a risk in the HIV population as well, where cognitive impairment is common. Irrespective of immune or virologic status, 57% of HIV patients demonstrate impairment on neuropsychiatric testing. Often, mild to moderate cognitive impairment in HIV is attributed to HIV encephalopathy with no further workup, resulting in a missed or late diagnosis of PML.
IMAGING CONSIDERATIONS
In the rheumatologic disease population, especially those with SLE, and the HIV population, neuroimaging is indicated in any patient who presents with cognitive impairment. Typical radiographic characteristics of PML on MRI are subcortical white matter hyperintense areas on T2-weighted images and fluid-attenuated inversion recovery. T1-weighted images will reveal hypointense lesions that usually do not enhance, but may do so in fewer than 10% of patients with PML. Typically, no mass effect is seen.
In addition to rare faint gadolinium enhancement of lesions, other lesion characteristics may depart from the classic picture—for example, white matter and gray matter involvement, and monofocal instead of multifocal lesions. In HIV-positive patients, MRI can demonstrate diffuse cerebellar atrophy and subtle white matter abnormalities within the cerebellum.
Unfortunately, nonspecific white matter lesions occur in HIV infection as well as connective tissue diseases, compromising diagnostic specificity of a single imaging study. Nevertheless, progression of clinical signs and symptoms and progressive MRI changes should prompt a more vigorous diagnostic evaluation for PML. Alternatively, a normal MRI in a patient in whom PML is suspected has strong negative predictive value. In either situation, baseline neuroimaging is not recommended.
DIAGNOSIS AND REFERRAL
A neurology consult is advised when a patient has a predisposing condition for PML or suspicious neurologic signs or symptoms, whether focal or diffuse, and in whom an MRI demonstrates white matter changes.
Evaluation for JC virus DNA
When the neurology consult has been scheduled, and before the actual visit to the neurologist, a cerebrospinal fluid (CSF) sample should be obtained and evaluated for JC virus (JCV) DNA using a highly sensitive polymerase chain reaction (PCR) assay. Lumbar puncture in the setting of possible PML is critical to exclude the presence of other opportunistic infections.
The importance of using ultrasensitive PCR assays for diagnosing PML cannot be overstated, as falsely negative CSF PCR has been observed for JCV DNA despite high levels of JCV DNA in spinal fluid when utilizing less sensitive assays. The most sensitive commercial assays can detect as few as 50 copies of JCV DNA per mL of CSF fluid.
The risk of PML imparted by biologic agents other than natalizumab and nonbiologic immunosuppressive agents has been difficult to quantify, but no immune-modifying drug or combination of drugs appears entirely free of risk. Any patient who has had significant or prolonged immunosuppression should be considered vulnerable, and any patient with suspicion of PML based on unexplained neurologic symptoms warrants CSF examination for JCV DNA.
Brain biopsy
In patients with progressive clinical and MRI findings that suggest PML, but whose CSF PCR for JCV DNA is repeatedly negative, a brain biopsy is appropriate regardless of background immunosuppression. In the patient with rheumatologic disease, for example, suspicion of PML should be heightened if there is neurologic deterioration in the face of escalating antiinflammatory or immunosuppressive therapy for immune-driven inflammatory disease. Diagnostic urgency is particularly warranted in those disorders where the possibility for immune reconstitution is highest (ie, those receiving immunosuppressive regimens).
PML MANAGEMENT DEPENDS ON CLINICAL SETTING
Management of PML starts with risk stratification to identify those patients most prone to developing PML based on their immune status; the presence of autoimmune disease; the subtype of disease (in the case of SLE); and the nature, intensity, and duration of their immunosuppression. If a high-risk patient develops signs and symptoms of PML, the diagnosis should be anticipated and serious consideration given to withholding immunosuppressive therapies while the patient is being worked up.
Accelerating immune reconstitution
Once a diagnosis of PML is confirmed, immune reconstitution should be accelerated whenever possible. This can include temporary or permanent withdrawal of immunosuppressive therapy and initiation of plasmapheresis. Evidence supports continuing plasma exchange until natalizumab serum drug levels decline to less than 1 μg/mL to achieve desaturation of the alpha-4 integrin receptor.6 Typically, desaturation of the targeted integrin receptor occurs after five plasmapheresis sessions.
Immune reconstitution may also precipitate a syndrome known as the immune reconstitution inflammatory syndrome (IRIS), characterized by enlargement and contrast enhancement of PML lesions, appearance of new brain lesions, and worsening of neurologic deficits. The infiltration of the brain with inflammatory multinucleated cells and lymphocytes following abrupt immune reconstitution requires treatment. Opinion suggests that judicious use of corticosteroids may control the immune response in the brain in patients with PML-IRIS,7,8 although further studies are needed.
Involving the patient in treatment decisions
Because risk tolerance varies considerably among individuals, patients should be informed of the risks of PML on the basis of their disease and the agents used to treat it. They should also be given information about the effects of individual treatments on the course of their disease, and they should be encouraged to participate in the selection of therapy.
SUMMARY
The approach to PML in the biologic era starts with an increased awareness of the disease followed by recognition of vulnerable populations and factors that contribute to the development of PML, such as biologic and nonbiologic immunosuppressive therapy. Optimal management includes a low threshold for investigating neurologic signs and symptoms and new-onset signs and symptoms in vulnerable populations, the use of MRI to detect typical PML brain lesions and other atypical brain features (ie, cerebellar atrophy), lumbar puncture and spinal CSF analysis to detect JCV DNA, and timely neurologic consultation for further evaluation. Much still needs to be learned about PML and the risks imparted by background diseases and individual drugs used in rheumatologic, neurologic, and oncologic disease.
- Brew BJ, Davies NW, Cinque P, Clifford DB, Nath A. Progressive multifocal leukoencephalopathy and other forms of JC virus disease. Nat Rev Neurol 2010; 6:667–679.
- Kedar S, Berger JR. The changing landscape of progressive multifocal leukoencephalopathy. Curr Infect Dis Rep 2011; 13:380–386.
- Tan CS, Koralnik IJ. Progressive multifocal leukoencephalopathy and other disorders caused by JC virus: clinical features and pathogenesis. Lancet Neurol 2010; 9:425–437.
- Gheuens S, Pierone G, Peeters P, Koralnik IJ. Progressive multifocal leukoencephalopathy in individuals with minimal or occult immunosuppression. J Neurol Neurosurg Psychiatry 2010; 81:247–254.
- Molloy ES, Calabrese LH. Progressive multifocal leukoencephalopathy: a national estimate of frequency in systemic lupus erythematosus and other rheumatic diseases. Arthritis Rheum 2009; 60:3761–3765.
- Khatri BO, Man S, Giovannoni G, et al. Effect of plasma exchange in accelerating natalizumab clearance and restoring leukocyte function. Neurology 2009; 72:402–409.
- Clifford DB, De Luca A, Simpson DM, Arendt G, Giovannoni G, Nath A. Natalizumab-associated progressive multifocal leukoencephalopathy in patients with multiple sclerosis: lessons from 28 cases. Lancet Neurol 2010; 9:438–446.
- Johnson T, Nath A. Immune reconstitution inflammatory syndrome and the central nervous system. Curr Opin Neurol 2011; 24:284–290.
Advances in the management of PML: Focus on natalizumab
Progressive multifocal leukoencephalopathy (PML) is a rare opportunistic infection of the central nervous system (CNS). Although originally associated with broad-based immunosuppression (human immunodeficiency virus infection, lymphoproliferative disorders, and immunosuppressive medications), recognition of PML in patients with selective immunosuppression is growing. This restricted immunodeviation can arise from autoimmune disorders such as systemic lupus erythematosus, selective immunosuppressive therapies (eg, rituximab, leflunomide, and efalizumab), or immunosuppression limited to the CNS (eg, treatment with natalizumab).
This article reviews approaches to the management of PML, with specific recommendations regarding PML associated with natalizumab therapy.
APPROACH TO PML TREATMENT
The ideal approach to PML treatment is generally two-pronged: antiviral therapies to directly reduce viral replication and immune reconstitution that empowers the immune system to attack the JC virus (JCV). Challenges to treatment are the difficulty in culturing JCV for in vitro studies, lack of an animal model of PML, and infrequency of PML cases.
Antiviral therapies
At present, no antiviral agent has confirmed efficacy in PML. Nucleoside analogues, serotonin 5-hydroxytryptamine receptor antagonists (to block the JCV receptor), and several cytokines provided exciting prospects in preclinical studies for treatment of PML in humans. Unfortunately, subsequent clinical studies of cytarabine, cidofovir, and interferon alfa all yielded disappointing results. A derivative of cidofovir, CMX001, is also being evaluated for efficacy in PML. Mefloquine was identified through a broad pharmaceutical screening study to have strong antiviral effects in vitro, but a clinical trial to assess its effects was stopped. It remains unclear whether the failure of clinical studies after successful in vitro studies is secondary to low drug penetration into the CNS, treatment initiation too late in the course of PML, or other differences not yet fully understood.
Immune reconstitution
Given the widespread failure of antiviral regimens, the mainstay of PML treatment is immune reconstitution. When immunosuppression is secondary to a medical disorder, efforts are pursued to reverse the primary disorder. For example, highly active antiretroviral therapy significantly prolongs survival in antiretroviral-naïve acquired immunodeficiency syndrome patients.1,2 Decreasing the intensity of immunosuppressive therapy in solid organ transplant may improve survival with PML. When PML is associated with biologic therapies for autoimmune diseases, early diagnosis and immediate suspension of therapy is thought to improve outcomes.
EXPERIENCE WITH NATALIZUMAB
PML in the setting of natalizumab therapy is related to cumulative exposure to natalizumab. As of August 4, 2011, there had been 150 cases of natalizumab-related PML documented in more than 88,000 patients exposed to natalizumab worldwide3 (see page S18, “Multiple sclerosis, natalizumab, and PML: Helping patients decide”). The incidence of PML in natalizumab-treated patients varies according to the number of infusions received, but the incidence of PML by each epoch of treatment exposure (1 to 24 infusions, 25 to 36 infusions, 37 to 48 infusions) appears to have remained stable over time.3
The mortality associated with natalizumab-related PML was 19% (29 deaths among the 150 confirmed cases) as of August 4, 2011.3 In cases with at least 6 months of follow-up, mortality has remained at about 20%. Many who survived were left with serious morbidity and permanent disability, although interpretation of disability is difficult because functional impairment is a hallmark of multiple sclerosis (MS) irrespective of PML. Survival in patients with natalizumab-associated PML appears to be better than with PML associated with other conditions, possibly because of early diagnosis achieved through clinical vigilance and swift immune reconstitution through natalizumab discontinuation and either plasmapheresis or immunoabsorption. Predictors of survival include younger age at diagnosis, less disability prior to onset of PML, more localized disease on magnetic resonance imaging (MRI) of the brain, and shorter time from symptom onset to PML diagnosis.
Clinical characteristics of natalizumab-associated PML
Several clinical observations should increase suspicion of natalizumab-associated PML.3–5 For example, the most common presenting symptoms are cognitive, motor, language, and visual impairment. Gadolinium-enhancing lesions are observed at presentation in about one-half of patients. Seizures and paroxysmal events can occur at presentation, which helps to differentiate PML from an MS relapse.
Approximately one-half of patients with natalizumab-associated PML have an initial viral load of less than 500 copies/mL, underscoring the need for ultrasensitive polymerase chain reaction (PCR) testing. An ultrasensitive JCV assay (Focus Diagnostics, Cypress, California) is available that can detect less than 50 copies/mL of JCV DNA. Because the viral copy numbers in the cerebrospinal fluid (CSF) may be low in patients treated with natalizumab, the CSF PCR may be falsely negative. In several cases of PML, JCV was undetectable in the CSF by PCR, identified only later by repeat PCR or brain biopsy.4 Serum JCV PCR is not useful in the screening or diagnosis of PML.
Natalizumab-associated PML has not been observed with therapy of 6 months’ or less duration. After 6 months of natalizumab therapy, new MRI lesions are rare in patients who are negative for neutralizing antibodies. A new MRI lesion in such a patient should be considered suspicious for PML. Our standard protocol is to check for neutralizing antibodies at 6 months in all patients treated with natalizumab. Symptoms of PML develop in affected patients whose duration of therapy ranges from 6 to 81 infusions. Symptoms often develop well before PML is diagnosed.4,5
Forty-six percent of patients treated with natalizumab who develop PML have received previous autologous bone marrow transplantation or chemo therapy, including mitoxantrone, azathioprine, methotrexate, and mycophenolate mofetil. In comparison, up to 25% of MS patients who were treated with natalizumab (13% in the United States, 24% in Europe) have had prior chemotherapy treatment. Prior immunosuppressive therapy increases the risk of PML by two- to fourfold, which may explain the higher rate of PML in Europe compared with that of the United States.4,5
Testing for immune response to JCV
A JCV enzyme-linked immunosorbent assay (ELISA) test has been developed that identifies patients with an immune response to JCV. Among MS patients, 55% test positive for JCV through this assay.6 The false-negative rate of the test is 5%, and the overall annual seroconversion rate is estimated to be about 2%, necessitating repeat testing.
Based on results of this assay, the estimated risk of PML in seropositive patients is about 1 in 500.6 The test was positive in 28 of 28 patients who developed PML. The probability of this relationship occurring by chance is 0.5528, which suggests that this assay is useful to stratify risk for development of PML. Although the rate of false negatives makes the test an imperfect predictor, it is still useful in clinical practice. The test became available clinically in late summer 2011. Further longitudinal observation studies (STRATIFY-1 and STRATIFY-2) on the use of the JCV ELISA to detect anti-JCV antibodies in the blood of natalizumab-treated patients with MS are under way.
Stratifying risk for natalizumab-related PML
Natalizumab holidays and PML risk
The possibility of reducing the risk of PML in natalizumab-treated patients through natalizumab holidays is attractive. When exploring this option, one must consider whether the risk of recurrent disease activity with treatment interruption outweighs the potentially decreased risk of PML.8 A randomized controlled multicenter clinical trial of natalizumab interruption is ongoing, with the recruitment phase complete after enrollment of 175 patients. Patients taking natalizumab at study entry have been randomized to one of three arms: continuation of monthly natalizumab for 6 months, placebo for 6 months, or an alternate treatment (interferon beta-1a, glatiramer acetate, or monthly intravenous steroids) for 6 months administered open-label by clinician and patient choice.
The primary outcome measures are markers of immune function and overall disease activity during treatment interruption and after resumption. Patients are monitored monthly using MRI to measure disease activity. Those who experience relapse will have the option of returning to natalizumab therapy or switching to an alternate treatment. The results of this prospective, randomized, controlled trial will provide a greater understanding of the safety issues surrounding natalizumab holidays.
Management of natalizumab-related PML
Management of patients taking natalizumab starts with risk stratification in an attempt to prevent the development of PML. If suspicion for PML is raised based on symptoms, early diagnosis can be accomplished through the use of a sensitive JCV PCR assay, with a repeat PCR if negative. Natalizumab treatment should be withheld during the workup for PML.
When immunosuppression is rapidly reversed in cases of natalizumab-associated PML, an overly exuberant immune response targeting JCV in the CNS is observed 2 to 6 weeks later. The response, termed immune reconstitution inflammatory syndrome (IRIS), is not always easy to differentiate from progression of PML. Nonetheless, most clinicians recommend high-dose corticosteroids if a clinical and imaging syndrome resembling IRIS develops several weeks after immune restoration.10 The objective is to achieve the immune reconstitution needed to control JCV infection while limiting the collateral damage of inflammation on the remaining brain tissue.
SUMMARY
Risk factors for natalizumab-associated PML include duration of treatment with natalizumab, previous chemotherapy, and JCV antibody serology. Early diagnosis requires the use of an ultrasensitive JCV PCR assay. Treatment is focused on early diagnosis, immediate cessation of pharmacologic causes of immunosuppression, and active efforts to accelerate immune restoration.
DISCUSSION
Dr. Calabrese: What are your thoughts about plasmapheresis for rituximab-related cases of PML?
Dr. Fox: It’s probably not going to be as helpful as with natalizumab. Rituximab has pharmacokinetics that are similar to those of other monoclonal antibodies, with a half-life in the range of 14 to 20 days. So it’s pretty much absent from the body within 1 to 2 months of infusion. The enduring benefit from rituximab comes not from the persistent presence of the monoclonal antibody, but the persistent absence of CD19 B cells. Plasmapheresis is unlikely to be effective because it won’t accelerate return of CD19 B cells to the peripheral circulation. In rituximab-related PML, stimulating the bone marrow to produce more B cells in order to restore the immune system is more likely to be effective. In contrast, I did recommend plasma pheresis in a case of efalizumab-related PML. Because efalizumab is a binding antibody to the CD11a receptor, we wanted to accelerate its removal.
Dr. Molloy: In an MS patient who responds well to natalizumab, do you ever explore a strategy of dose reduction or extending the dosing interval of natalizumab?
Dr. Fox: Let me put that into a clinical context. A 35-year old man has had relapsing-remitting MS for 3 years. Two years ago, after disease activity occurred while he was using an injectable therapy, he started natalizumab and has been clinically and radiologically stable on natalizumab. Then, he gets the JCV assay, it’s positive, and he asks if it’s time to get off natalizumab “because of the risk of that brain virus.”
What do I tell him? Should I change the dosing interval? At this point, we are not doing either. One reason is the unpredictable pharmacokinetics of the drug. The dose and dosing regimen were chosen to have 85% or greater receptor saturation in 95% or more of patients over the course of the recommended 4-week dosing interval. If you increase the interval to 6 weeks or 8 weeks, you can’t predict in individual patients whether or not meaningful desaturation occurs and thus allows some immune cells to enter the brain to protect against PML (but not too many, or MS disease activity will return).
Dr. Simpson: Do you have an algorithm for working up patients?
Dr. Fox: It depends on the level of suspicion given the patient’s symptoms. It’s difficult to find a single MS patient who does not have some fluctuation of symptoms over time and some worsening of symptoms such as stiffness, fatigue, and cognitive difficulties. They all have changes in mood, so if one took any symptom change—any change in their report of mood and cognition— as the cutoff for a workup, we wouldn’t be giving natalizumab at all. But if a patient or family says, “I am worried,” then we need to work it up. Also, if there are clearcut new or worsening neurologic symptoms, we pursue a workup. Often, the change in symptoms is revealed when the patient comes in for his or her monthly infusion and the nurse asks the four questions from the preinfusion checklist (as part of the mandatory Tysabri Outreach: Unified Commitment to Health [TOUCH] prescribing program for natalizumab).11
If there are new symptoms, we hold infusions and do a two-stage evaluation. The first stage is a brain MRI to evaluate for change from baseline (the US Food and Drug Administration requires a brain MRI at baseline before starting natalizumab therapy). Most patients undergo a brain MRI every 6 to 12 months while on natalizumab therapy, with instructions to the neuroradiologist to evaluate carefully for new lesions. In our institution, the PML MRI evaluation is a fine-toothcomb assessment of lesions from the most recent MRI compared with the current MRI. Depending on the results of the current MRI and on our level of suspicion, we may proceed to a spinal tap, even if the MRI findings are stable. We have done 8 to 10 spinal taps in patients taking natalizumab when we were suspicious enough to evaluate for PML. Occasional patients continue to have active disease, relapses, and new lesions even without developing antibodies while taking natalizumab.
Dr. Rudick: We need a quick, quantitative analysis method to compare one MRI with another. It is easy to say, “Consider PML if there are new lesions.” It’s not so easy to know if the lesions are new. We are participating in a National Institutes of Health study regarding identification of biomarkers of interferon’s effects, and the study requires obtaining MRI scans at baseline and 6 months. We have state-of-the-art subtraction MRI to quantify new lesions on the followup MRI. However, there is significant disagreement on the number of new lesions determined by clinical raters, and disagreement between the clinical raters and the numbers generated by the computer program.
Dr. Major: Is the incidence of natalizumab-related PML based on the number of months or on the number of infusions?
Dr. Fox: It is based on the number of infusions. You bring up a good point because these patients may interrupt treatment when they go on vacation, for example, or have a lapse in insurance coverage. Most patients follow the every-4-weeks protocol and receive 13 infusions in a year. Perhaps 10% to 15% do not follow it precisely.
Dr. Molloy: Is everyone who takes natalizumab being followed for PML even if they discontinue natalizumab? Have any differences emerged in the factors that predispose to PML among those who continue therapy compared with those who discontinue? I ask because I’m wondering why the incidence appears to stabilize, or even go down, after 36 infusions.
Dr. Fox: PML has not been reported beyond several months after stopping natalizumab; concern about PML can decrease fairly quickly after stopping the drug. Many of us expected the risk of PML to continue rising with cumulative treatment, so were pleasantly surprised to see a plateau in the risk of PML after about 36 months. We don’t understand what leads to this plateau.
- Berenguer J, Miralles P, Arrizabalaga J, et al. Clinical course and prognostic factors of progressive multifocal leukoencephalopathy in patients treated with highly active antiretroviral therapy. Clin Infect Dis 2003; 36:1047–1052.
- Wyen C, Hoffmann C, Schmeisser N, et al. Progressive multifocal leukencephalopathy in patients on highly active antiretroviral therapy: survival and risk factors of death. J Acquir Immune Defic Syndr 2004; 37:1263–1268.
- Update on Tysabri and PML. National Multiple Sclerosis Society Web site. http://www.nationalmssociety.org/news/news-detail/index.aspx?nid=2308. Published April 11, 2011. Updated July 6, 2011. Accessed July 7, 2011.
- Clifford DB, De Luca A, Simpson DM, Arendt G, Giovannoni G, Nath A. Natalizumab-associated progressive multifocal leukoencephalopathy in patients with multiple sclerosis: lessons from 28 cases. Lancet Neurol 2010; 9:438–446.
- Stangel M, Sørensen PS, Petersen T, Vermersch P, De Seze J, Confavreux C. Natalizumab utilisation and safety in the TYGRIS programme in the European Union. Paper presented at: 25th Congress of the European Committee for Treatment and Research in Multiple Sclerosis (ECTRIMS); September 9–12, 2009; Dusseldorf, Germany.
- Gorelik L, Lerner M, Bixler S, et al. Anti-JC virus antibodies: implications for PML risk stratification. Ann Neurol 2010; 68:295–303.
- Britt RR. The odds of dying. Live Science Web site. http://www.livescience.com/3780-odds-dying.html. Published January 6, 2005. Accessed July 17, 2011.
- West TW, Cree BA. Natalizumab dosage suspension: are we helping or hurting? Ann Neurol 2010; 68:395–399.
- Khatri BO, Man S, Giovannoni G, et al. Effect of plasma exchange in accelerating natalizumab clearance and restoring leukocyte function. Neurology 2009; 72:402–409.
- Berger JR. Steroids for PML-IRIS: a double-edged sword? Neurology 2009; 72:1454–1455.
- The TYSABRI TOUCH® Prescribing Program. Tysabri (natalizumab) Web site. http://www.tysabri.com/tysbProject/tysb.portal/_baseurl/threeColLayout/SCSRepository/en_US/tysb/home/treatment-withtysabri/touch-prescribing-program.xml. Accessed July 15, 2011.
Progressive multifocal leukoencephalopathy (PML) is a rare opportunistic infection of the central nervous system (CNS). Although originally associated with broad-based immunosuppression (human immunodeficiency virus infection, lymphoproliferative disorders, and immunosuppressive medications), recognition of PML in patients with selective immunosuppression is growing. This restricted immunodeviation can arise from autoimmune disorders such as systemic lupus erythematosus, selective immunosuppressive therapies (eg, rituximab, leflunomide, and efalizumab), or immunosuppression limited to the CNS (eg, treatment with natalizumab).
This article reviews approaches to the management of PML, with specific recommendations regarding PML associated with natalizumab therapy.
APPROACH TO PML TREATMENT
The ideal approach to PML treatment is generally two-pronged: antiviral therapies to directly reduce viral replication and immune reconstitution that empowers the immune system to attack the JC virus (JCV). Challenges to treatment are the difficulty in culturing JCV for in vitro studies, lack of an animal model of PML, and infrequency of PML cases.
Antiviral therapies
At present, no antiviral agent has confirmed efficacy in PML. Nucleoside analogues, serotonin 5-hydroxytryptamine receptor antagonists (to block the JCV receptor), and several cytokines provided exciting prospects in preclinical studies for treatment of PML in humans. Unfortunately, subsequent clinical studies of cytarabine, cidofovir, and interferon alfa all yielded disappointing results. A derivative of cidofovir, CMX001, is also being evaluated for efficacy in PML. Mefloquine was identified through a broad pharmaceutical screening study to have strong antiviral effects in vitro, but a clinical trial to assess its effects was stopped. It remains unclear whether the failure of clinical studies after successful in vitro studies is secondary to low drug penetration into the CNS, treatment initiation too late in the course of PML, or other differences not yet fully understood.
Immune reconstitution
Given the widespread failure of antiviral regimens, the mainstay of PML treatment is immune reconstitution. When immunosuppression is secondary to a medical disorder, efforts are pursued to reverse the primary disorder. For example, highly active antiretroviral therapy significantly prolongs survival in antiretroviral-naïve acquired immunodeficiency syndrome patients.1,2 Decreasing the intensity of immunosuppressive therapy in solid organ transplant may improve survival with PML. When PML is associated with biologic therapies for autoimmune diseases, early diagnosis and immediate suspension of therapy is thought to improve outcomes.
EXPERIENCE WITH NATALIZUMAB
PML in the setting of natalizumab therapy is related to cumulative exposure to natalizumab. As of August 4, 2011, there had been 150 cases of natalizumab-related PML documented in more than 88,000 patients exposed to natalizumab worldwide3 (see page S18, “Multiple sclerosis, natalizumab, and PML: Helping patients decide”). The incidence of PML in natalizumab-treated patients varies according to the number of infusions received, but the incidence of PML by each epoch of treatment exposure (1 to 24 infusions, 25 to 36 infusions, 37 to 48 infusions) appears to have remained stable over time.3
The mortality associated with natalizumab-related PML was 19% (29 deaths among the 150 confirmed cases) as of August 4, 2011.3 In cases with at least 6 months of follow-up, mortality has remained at about 20%. Many who survived were left with serious morbidity and permanent disability, although interpretation of disability is difficult because functional impairment is a hallmark of multiple sclerosis (MS) irrespective of PML. Survival in patients with natalizumab-associated PML appears to be better than with PML associated with other conditions, possibly because of early diagnosis achieved through clinical vigilance and swift immune reconstitution through natalizumab discontinuation and either plasmapheresis or immunoabsorption. Predictors of survival include younger age at diagnosis, less disability prior to onset of PML, more localized disease on magnetic resonance imaging (MRI) of the brain, and shorter time from symptom onset to PML diagnosis.
Clinical characteristics of natalizumab-associated PML
Several clinical observations should increase suspicion of natalizumab-associated PML.3–5 For example, the most common presenting symptoms are cognitive, motor, language, and visual impairment. Gadolinium-enhancing lesions are observed at presentation in about one-half of patients. Seizures and paroxysmal events can occur at presentation, which helps to differentiate PML from an MS relapse.
Approximately one-half of patients with natalizumab-associated PML have an initial viral load of less than 500 copies/mL, underscoring the need for ultrasensitive polymerase chain reaction (PCR) testing. An ultrasensitive JCV assay (Focus Diagnostics, Cypress, California) is available that can detect less than 50 copies/mL of JCV DNA. Because the viral copy numbers in the cerebrospinal fluid (CSF) may be low in patients treated with natalizumab, the CSF PCR may be falsely negative. In several cases of PML, JCV was undetectable in the CSF by PCR, identified only later by repeat PCR or brain biopsy.4 Serum JCV PCR is not useful in the screening or diagnosis of PML.
Natalizumab-associated PML has not been observed with therapy of 6 months’ or less duration. After 6 months of natalizumab therapy, new MRI lesions are rare in patients who are negative for neutralizing antibodies. A new MRI lesion in such a patient should be considered suspicious for PML. Our standard protocol is to check for neutralizing antibodies at 6 months in all patients treated with natalizumab. Symptoms of PML develop in affected patients whose duration of therapy ranges from 6 to 81 infusions. Symptoms often develop well before PML is diagnosed.4,5
Forty-six percent of patients treated with natalizumab who develop PML have received previous autologous bone marrow transplantation or chemo therapy, including mitoxantrone, azathioprine, methotrexate, and mycophenolate mofetil. In comparison, up to 25% of MS patients who were treated with natalizumab (13% in the United States, 24% in Europe) have had prior chemotherapy treatment. Prior immunosuppressive therapy increases the risk of PML by two- to fourfold, which may explain the higher rate of PML in Europe compared with that of the United States.4,5
Testing for immune response to JCV
A JCV enzyme-linked immunosorbent assay (ELISA) test has been developed that identifies patients with an immune response to JCV. Among MS patients, 55% test positive for JCV through this assay.6 The false-negative rate of the test is 5%, and the overall annual seroconversion rate is estimated to be about 2%, necessitating repeat testing.
Based on results of this assay, the estimated risk of PML in seropositive patients is about 1 in 500.6 The test was positive in 28 of 28 patients who developed PML. The probability of this relationship occurring by chance is 0.5528, which suggests that this assay is useful to stratify risk for development of PML. Although the rate of false negatives makes the test an imperfect predictor, it is still useful in clinical practice. The test became available clinically in late summer 2011. Further longitudinal observation studies (STRATIFY-1 and STRATIFY-2) on the use of the JCV ELISA to detect anti-JCV antibodies in the blood of natalizumab-treated patients with MS are under way.
Stratifying risk for natalizumab-related PML
Natalizumab holidays and PML risk
The possibility of reducing the risk of PML in natalizumab-treated patients through natalizumab holidays is attractive. When exploring this option, one must consider whether the risk of recurrent disease activity with treatment interruption outweighs the potentially decreased risk of PML.8 A randomized controlled multicenter clinical trial of natalizumab interruption is ongoing, with the recruitment phase complete after enrollment of 175 patients. Patients taking natalizumab at study entry have been randomized to one of three arms: continuation of monthly natalizumab for 6 months, placebo for 6 months, or an alternate treatment (interferon beta-1a, glatiramer acetate, or monthly intravenous steroids) for 6 months administered open-label by clinician and patient choice.
The primary outcome measures are markers of immune function and overall disease activity during treatment interruption and after resumption. Patients are monitored monthly using MRI to measure disease activity. Those who experience relapse will have the option of returning to natalizumab therapy or switching to an alternate treatment. The results of this prospective, randomized, controlled trial will provide a greater understanding of the safety issues surrounding natalizumab holidays.
Management of natalizumab-related PML
Management of patients taking natalizumab starts with risk stratification in an attempt to prevent the development of PML. If suspicion for PML is raised based on symptoms, early diagnosis can be accomplished through the use of a sensitive JCV PCR assay, with a repeat PCR if negative. Natalizumab treatment should be withheld during the workup for PML.
When immunosuppression is rapidly reversed in cases of natalizumab-associated PML, an overly exuberant immune response targeting JCV in the CNS is observed 2 to 6 weeks later. The response, termed immune reconstitution inflammatory syndrome (IRIS), is not always easy to differentiate from progression of PML. Nonetheless, most clinicians recommend high-dose corticosteroids if a clinical and imaging syndrome resembling IRIS develops several weeks after immune restoration.10 The objective is to achieve the immune reconstitution needed to control JCV infection while limiting the collateral damage of inflammation on the remaining brain tissue.
SUMMARY
Risk factors for natalizumab-associated PML include duration of treatment with natalizumab, previous chemotherapy, and JCV antibody serology. Early diagnosis requires the use of an ultrasensitive JCV PCR assay. Treatment is focused on early diagnosis, immediate cessation of pharmacologic causes of immunosuppression, and active efforts to accelerate immune restoration.
DISCUSSION
Dr. Calabrese: What are your thoughts about plasmapheresis for rituximab-related cases of PML?
Dr. Fox: It’s probably not going to be as helpful as with natalizumab. Rituximab has pharmacokinetics that are similar to those of other monoclonal antibodies, with a half-life in the range of 14 to 20 days. So it’s pretty much absent from the body within 1 to 2 months of infusion. The enduring benefit from rituximab comes not from the persistent presence of the monoclonal antibody, but the persistent absence of CD19 B cells. Plasmapheresis is unlikely to be effective because it won’t accelerate return of CD19 B cells to the peripheral circulation. In rituximab-related PML, stimulating the bone marrow to produce more B cells in order to restore the immune system is more likely to be effective. In contrast, I did recommend plasma pheresis in a case of efalizumab-related PML. Because efalizumab is a binding antibody to the CD11a receptor, we wanted to accelerate its removal.
Dr. Molloy: In an MS patient who responds well to natalizumab, do you ever explore a strategy of dose reduction or extending the dosing interval of natalizumab?
Dr. Fox: Let me put that into a clinical context. A 35-year old man has had relapsing-remitting MS for 3 years. Two years ago, after disease activity occurred while he was using an injectable therapy, he started natalizumab and has been clinically and radiologically stable on natalizumab. Then, he gets the JCV assay, it’s positive, and he asks if it’s time to get off natalizumab “because of the risk of that brain virus.”
What do I tell him? Should I change the dosing interval? At this point, we are not doing either. One reason is the unpredictable pharmacokinetics of the drug. The dose and dosing regimen were chosen to have 85% or greater receptor saturation in 95% or more of patients over the course of the recommended 4-week dosing interval. If you increase the interval to 6 weeks or 8 weeks, you can’t predict in individual patients whether or not meaningful desaturation occurs and thus allows some immune cells to enter the brain to protect against PML (but not too many, or MS disease activity will return).
Dr. Simpson: Do you have an algorithm for working up patients?
Dr. Fox: It depends on the level of suspicion given the patient’s symptoms. It’s difficult to find a single MS patient who does not have some fluctuation of symptoms over time and some worsening of symptoms such as stiffness, fatigue, and cognitive difficulties. They all have changes in mood, so if one took any symptom change—any change in their report of mood and cognition— as the cutoff for a workup, we wouldn’t be giving natalizumab at all. But if a patient or family says, “I am worried,” then we need to work it up. Also, if there are clearcut new or worsening neurologic symptoms, we pursue a workup. Often, the change in symptoms is revealed when the patient comes in for his or her monthly infusion and the nurse asks the four questions from the preinfusion checklist (as part of the mandatory Tysabri Outreach: Unified Commitment to Health [TOUCH] prescribing program for natalizumab).11
If there are new symptoms, we hold infusions and do a two-stage evaluation. The first stage is a brain MRI to evaluate for change from baseline (the US Food and Drug Administration requires a brain MRI at baseline before starting natalizumab therapy). Most patients undergo a brain MRI every 6 to 12 months while on natalizumab therapy, with instructions to the neuroradiologist to evaluate carefully for new lesions. In our institution, the PML MRI evaluation is a fine-toothcomb assessment of lesions from the most recent MRI compared with the current MRI. Depending on the results of the current MRI and on our level of suspicion, we may proceed to a spinal tap, even if the MRI findings are stable. We have done 8 to 10 spinal taps in patients taking natalizumab when we were suspicious enough to evaluate for PML. Occasional patients continue to have active disease, relapses, and new lesions even without developing antibodies while taking natalizumab.
Dr. Rudick: We need a quick, quantitative analysis method to compare one MRI with another. It is easy to say, “Consider PML if there are new lesions.” It’s not so easy to know if the lesions are new. We are participating in a National Institutes of Health study regarding identification of biomarkers of interferon’s effects, and the study requires obtaining MRI scans at baseline and 6 months. We have state-of-the-art subtraction MRI to quantify new lesions on the followup MRI. However, there is significant disagreement on the number of new lesions determined by clinical raters, and disagreement between the clinical raters and the numbers generated by the computer program.
Dr. Major: Is the incidence of natalizumab-related PML based on the number of months or on the number of infusions?
Dr. Fox: It is based on the number of infusions. You bring up a good point because these patients may interrupt treatment when they go on vacation, for example, or have a lapse in insurance coverage. Most patients follow the every-4-weeks protocol and receive 13 infusions in a year. Perhaps 10% to 15% do not follow it precisely.
Dr. Molloy: Is everyone who takes natalizumab being followed for PML even if they discontinue natalizumab? Have any differences emerged in the factors that predispose to PML among those who continue therapy compared with those who discontinue? I ask because I’m wondering why the incidence appears to stabilize, or even go down, after 36 infusions.
Dr. Fox: PML has not been reported beyond several months after stopping natalizumab; concern about PML can decrease fairly quickly after stopping the drug. Many of us expected the risk of PML to continue rising with cumulative treatment, so were pleasantly surprised to see a plateau in the risk of PML after about 36 months. We don’t understand what leads to this plateau.
- Berenguer J, Miralles P, Arrizabalaga J, et al. Clinical course and prognostic factors of progressive multifocal leukoencephalopathy in patients treated with highly active antiretroviral therapy. Clin Infect Dis 2003; 36:1047–1052.
- Wyen C, Hoffmann C, Schmeisser N, et al. Progressive multifocal leukencephalopathy in patients on highly active antiretroviral therapy: survival and risk factors of death. J Acquir Immune Defic Syndr 2004; 37:1263–1268.
- Update on Tysabri and PML. National Multiple Sclerosis Society Web site. http://www.nationalmssociety.org/news/news-detail/index.aspx?nid=2308. Published April 11, 2011. Updated July 6, 2011. Accessed July 7, 2011.
- Clifford DB, De Luca A, Simpson DM, Arendt G, Giovannoni G, Nath A. Natalizumab-associated progressive multifocal leukoencephalopathy in patients with multiple sclerosis: lessons from 28 cases. Lancet Neurol 2010; 9:438–446.
- Stangel M, Sørensen PS, Petersen T, Vermersch P, De Seze J, Confavreux C. Natalizumab utilisation and safety in the TYGRIS programme in the European Union. Paper presented at: 25th Congress of the European Committee for Treatment and Research in Multiple Sclerosis (ECTRIMS); September 9–12, 2009; Dusseldorf, Germany.
- Gorelik L, Lerner M, Bixler S, et al. Anti-JC virus antibodies: implications for PML risk stratification. Ann Neurol 2010; 68:295–303.
- Britt RR. The odds of dying. Live Science Web site. http://www.livescience.com/3780-odds-dying.html. Published January 6, 2005. Accessed July 17, 2011.
- West TW, Cree BA. Natalizumab dosage suspension: are we helping or hurting? Ann Neurol 2010; 68:395–399.
- Khatri BO, Man S, Giovannoni G, et al. Effect of plasma exchange in accelerating natalizumab clearance and restoring leukocyte function. Neurology 2009; 72:402–409.
- Berger JR. Steroids for PML-IRIS: a double-edged sword? Neurology 2009; 72:1454–1455.
- The TYSABRI TOUCH® Prescribing Program. Tysabri (natalizumab) Web site. http://www.tysabri.com/tysbProject/tysb.portal/_baseurl/threeColLayout/SCSRepository/en_US/tysb/home/treatment-withtysabri/touch-prescribing-program.xml. Accessed July 15, 2011.
Osteoarthritis as a Chronic Disease: Maximizing Management in Primary Care
Osteoarthritis (OA) is the most common form of arthritis and a leading cause of disability worldwide. In the United States alone, it is believed that approximately 27 million people are affected by this degenerative condition. Many factors are known to increase the risk of developing OA, including heredity, obesity, joint or nerve injury, repeated overuse of certain joints, lack of physical activity, and aging. Treatment for OA needs to be individualized according to the stage of the disease, patient tolerability, comorbidities involved, and response to therapies to meet the goals of reducing pain, improving joint mobility and quality of life, and limiting functional impairment while avoiding drug toxicity. This supplement will review the latest advances in the pathogenesis, underlying phenotypes, and current therapeutic options of OA.
Click here to read Supplement.

A new approach to heparin production
Researchers have developed a new process for manufacturing ultra-low molecular weight heparin, and they believe it’s superior to current methods.
In addition to reducing the potential for contamination, this process produced 2 structurally homogeneous ultra-low molecular weight heparins that were identical in performance and safety to fondaparinux. But these heparins were purer, faster, and less expensive to produce.
Robert Linhardt, PhD, of Rensselaer Polytechnic Institute in New York, and his colleagues reported their discovery in the October 28 edition of Science.
“With this discovery, we have successfully demonstrated that replacing the current model of drug production with a chemoenzymatic approach can greatly reduce the cost of drug development and manufacturing, while also increasing drug performance and safety . . . ,” Dr Linhardt said.
These heparins—like fondaparinux—were chemically synthesized from non-animal materials. So the risk of contamination is reduced, when compared to the risk with traditional heparin production.
In addition, the new production process is superior to that used with fondaparinux, the researchers said. The new process requires 10 to 12 steps, whereas fondaparinux production requires roughly 50.
The investigators were also able to increase the heparin yield 500-fold with the new process. They said it could decrease the cost of manufacture by a similar amount.
And the ultra-low molecular weight heparins proved to be as effective as fondaparinux in rabbit models.
“[W]e were able to quickly build multiple doses in a simple laboratory setting and feel that this is something than can be quickly and easy commercialized to reduce the cost of this drug and help to shift how pharmaceutical companies approach the synthesis of carbohydrate-containing drugs,” Dr Linhardt said.
These findings are part of a larger body of work in the Linhardt lab to completely replace all types of heparin-based or other glycoprotein-based drugs with safer, low-cost, synthetic versions that do not rely on foreign, potentially contaminated animal sources. ![]()
Atrial fibrillation management: Issues of concern
To the Editor: I read with interest the article by Drs. Callahan and Baranowski1 in your April 2011 issue about managing newly diagnosed atrial fibrillation. I believe several issues merit further discussion.
First of all, as mentioned in the article, pulmonary vein isolation, or radiofrequency catheter ablation of the left atrium, can cure paroxysmal atrial fibrillation. Callahan and Baranowski described the optimal indication for this procedure, but they failed to mention the potential adverse effects, that is, esophageal ulcer and atrio-esophageal fistula.2 Owing to the proximity of the esophagus and the accompanying vagus nerve to the posterior wall of the left atrium, it is estimated that 47% of patients develop thermal mucosal injury and 18% develop esophageal ulcer after ablation, while 0.5% develop atrio-esophageal fistula.3 Gastric hypomotility and pyloric spasm are reported as well. It would therefore be prudent to inform patients of such risks if a persistently symptomatic young patient demands this procedure, since the damage might be long-lasting.
In addition, in deciding on long-term anticoagulation for patients with atrial fibrillation, the CHADS2 score is often utilized (1 point each for congestive heart failure, hypertension, age 75 or older, and diabetes mellitus; 2 points for prior stroke or transient ischemic attack). Although it is validated and widely applicable, the CHADS2 score carries the disadvantages of oversimplification and of overclassifying atrial fibrillation patients into the intermediate-risk category.4 Lip et al,5 in a seminal article surveying a large group of patients who had nonvalvular atrial fibrillation, proposed using a new and also simple risk stratification scheme, the 2009 Birmingham scheme. This scheme uses the acronym CHA2DS2-VASc and differs from the CHADS2 score in that patients age 75 or older get 2 points, those age 65 to 74 get 1 point, those with vascular disease get 1 point, and women get 1 point. They show that this new scheme fares marginally better than the original CHADS2 score, with fewer patients wrongly assigned to the intermediate-risk category. That means a lower percentage of patients will receive unnecessary anticoagulation and suffer from unneeded anguish. Subsequent studies also prove that this newer scoring index possesses higher sensitivity and predicts thromboembolic events more accurately than the CHADS2 score. Thus, I believe this should also be factored into the decision process when initiating warfarin in atrial fibrillation patients, especially in light of the fact that scanty evidence exists for the use of newer anticoagulants based on the CHADS2 score.
- Callahan T, Baranowski B. Managing newly diagnosed atrial fibrillation: rate, rhythm, and risk. Cleve Clin J Med 2011; 78:258–264.
- Ginzburg L. Esophageal ulceration: a complication of radiofrequency ablation treatment of atrial fibrillation. Gastrointest Endosc 2009; 70:551–552.
- Bahnson TD. Strategies to minimize the risk of esophageal injury during catheter ablation for atrial fibrillation. Pacing Clin Electrophysiol 2009; 32:248–260.
- Karthikeyan G, Eikelboom JW. The CHADS2 score for stroke risk stratification in atrial fibrillation—friend or foe? Thromb Haemost 2010; 104:45–48.
- Lip GYH, Nieuwlaat R, Pisters R, Lane DA, Crijns HJ. Refining clinical risk stratification for predicting stroke and thromboembolism in atrial fibrillation using a novel risk factor-based approach: the Euro Heart Survey on Atrial Fibrillation. Chest 2010; 137:263–172.
To the Editor: I read with interest the article by Drs. Callahan and Baranowski1 in your April 2011 issue about managing newly diagnosed atrial fibrillation. I believe several issues merit further discussion.
First of all, as mentioned in the article, pulmonary vein isolation, or radiofrequency catheter ablation of the left atrium, can cure paroxysmal atrial fibrillation. Callahan and Baranowski described the optimal indication for this procedure, but they failed to mention the potential adverse effects, that is, esophageal ulcer and atrio-esophageal fistula.2 Owing to the proximity of the esophagus and the accompanying vagus nerve to the posterior wall of the left atrium, it is estimated that 47% of patients develop thermal mucosal injury and 18% develop esophageal ulcer after ablation, while 0.5% develop atrio-esophageal fistula.3 Gastric hypomotility and pyloric spasm are reported as well. It would therefore be prudent to inform patients of such risks if a persistently symptomatic young patient demands this procedure, since the damage might be long-lasting.
In addition, in deciding on long-term anticoagulation for patients with atrial fibrillation, the CHADS2 score is often utilized (1 point each for congestive heart failure, hypertension, age 75 or older, and diabetes mellitus; 2 points for prior stroke or transient ischemic attack). Although it is validated and widely applicable, the CHADS2 score carries the disadvantages of oversimplification and of overclassifying atrial fibrillation patients into the intermediate-risk category.4 Lip et al,5 in a seminal article surveying a large group of patients who had nonvalvular atrial fibrillation, proposed using a new and also simple risk stratification scheme, the 2009 Birmingham scheme. This scheme uses the acronym CHA2DS2-VASc and differs from the CHADS2 score in that patients age 75 or older get 2 points, those age 65 to 74 get 1 point, those with vascular disease get 1 point, and women get 1 point. They show that this new scheme fares marginally better than the original CHADS2 score, with fewer patients wrongly assigned to the intermediate-risk category. That means a lower percentage of patients will receive unnecessary anticoagulation and suffer from unneeded anguish. Subsequent studies also prove that this newer scoring index possesses higher sensitivity and predicts thromboembolic events more accurately than the CHADS2 score. Thus, I believe this should also be factored into the decision process when initiating warfarin in atrial fibrillation patients, especially in light of the fact that scanty evidence exists for the use of newer anticoagulants based on the CHADS2 score.
- Callahan T, Baranowski B. Managing newly diagnosed atrial fibrillation: rate, rhythm, and risk. Cleve Clin J Med 2011; 78:258–264.
- Ginzburg L. Esophageal ulceration: a complication of radiofrequency ablation treatment of atrial fibrillation. Gastrointest Endosc 2009; 70:551–552.
- Bahnson TD. Strategies to minimize the risk of esophageal injury during catheter ablation for atrial fibrillation. Pacing Clin Electrophysiol 2009; 32:248–260.
- Karthikeyan G, Eikelboom JW. The CHADS2 score for stroke risk stratification in atrial fibrillation—friend or foe? Thromb Haemost 2010; 104:45–48.
- Lip GYH, Nieuwlaat R, Pisters R, Lane DA, Crijns HJ. Refining clinical risk stratification for predicting stroke and thromboembolism in atrial fibrillation using a novel risk factor-based approach: the Euro Heart Survey on Atrial Fibrillation. Chest 2010; 137:263–172.
In reply: Atrial fibrillation management: Issues of concern
In Reply: Dr. Chao raises several important points regarding our manuscript on the management of newly diagnosed atrial fibrillation.1
Dr. Chao mentions some of the complications of pulmonary vein antrum isolation. A review of catheter ablation for atrial fibrillation was outside the scope of our manuscript, so the details of the procedure and potential complications were not covered. Dr. Chao does mention some of the important potential complications. However, the complication rates he cites are not generally supported by the available medical literature. Thermal mucosal injury of the esophagus was reported at rates as low as 4% in the same studies cited by Dr. Chao in patients undergoing pulmonary vein antrum isolation with conscious sedation. The rate of 47% was seen in patients undergoing the procedure with general anesthesia. The rate of atrio-esophageal fistula is not well known. As of 2010, about 49 cases were reported in the literature.2 Rates have been described ranging from 0.01% to 0.2%,3–9 far lower than the rate mentioned by Dr. Chao. A careful review with the patient of the risks, benefits, and alternatives is standard practice before any elective, invasive procedure.
Multiple anticoagulation schemes have been proposed, including the Birmingham 2009 scheme.10 We included the CHADS2 score in our paper because it is widely accepted and well validated. The Birmingham 2009 scheme acknowledges other potential risk factors such as female sex, history of vascular disease, and age between 65 and 75 years. It will be interesting to see if it will ever supplant the CHADS2 score. However, no risk stratification scheme should replace sound clinical judgment. Individual patient factors must be considered when deciding whether anticoagulation is appropriate for an individual patient.
- Callahan T, Baranowski B. Managing newly diagnosed atrial fibrillation: rate, rhythm, and risk. Cleve Clin J Med 2011; 78:258–264.
- Seigel MO, Parenti DM, Simon GL. Atrial-esophageal fistula after atrial radiofrequency catheter ablation. Clin Infect Dis 2010; 51:73–76.
- Dagres N, Hindricks G, Kottkamp H, et al. Complications of atrial fibrillation ablation in a high-volume center in 1,000 procedures: still cause for concern? J Cardiovasc Electrophysiol 2009; 20:1014–1019.
- Pappone C, Oral H, Santinelli V, et al. Atrio-esophageal fistula as a complication of percutaneous transcatheter ablation of atrial fibrillation. Circulation 2004; 109:2724–2726.
- Cappato R, Calkins H, Chen SA, et al. Prevalence and causes of fatal outcome in catheter ablation of atrial fibrillation. J Am Coll Cardiol 2009; 53:1798-1803.
- Dagres N, Kottkamp H, Piorkowski C, et al. Rapid detection and successful treatment of esophageal perforation after radiofrequency ablation of atrial fibrillation: lessons from five cases. J Cardiovasc Electrophysiol 2006; 17:1213–1215.
- Ghia KK, Chugh A, Good E, et al. A nationwide survey on the prevalence of atrioesophageal fistula after left atrial radiofrequency catheter ablation. J Interv Card Electrophysiol 2009; 24:33–36.
- Mohr FW, Nikolaus D, Falk V, et al. Curative treatment of atrial fibrillation: acute and midterm results of intraoperative radiofrequency ablation of atrial fibrillation
in 150 patients. J Thorac Cardiovasc Surg 2002; 123:919–927. - Ren JF, Lin D, Marchlinski FE, Callans DJ, Patel V. Esophageal imaging and strategies for avoiding injury during left atrial ablation for atrial fibrillation. Heart Rhythm 2006; 3:1156–1161.
- Lip GYH, Nieuwlaat R, Pisters R, Lane DA, Crijns HJGM. Refining clinical risk stratification for predicting stroke and thromboembolism in atrial fibrillation using a novel risk factor-based approach: the Euro Heart Survey on Atrial Fibrillation. Chest 2010; 137:263–272.
In Reply: Dr. Chao raises several important points regarding our manuscript on the management of newly diagnosed atrial fibrillation.1
Dr. Chao mentions some of the complications of pulmonary vein antrum isolation. A review of catheter ablation for atrial fibrillation was outside the scope of our manuscript, so the details of the procedure and potential complications were not covered. Dr. Chao does mention some of the important potential complications. However, the complication rates he cites are not generally supported by the available medical literature. Thermal mucosal injury of the esophagus was reported at rates as low as 4% in the same studies cited by Dr. Chao in patients undergoing pulmonary vein antrum isolation with conscious sedation. The rate of 47% was seen in patients undergoing the procedure with general anesthesia. The rate of atrio-esophageal fistula is not well known. As of 2010, about 49 cases were reported in the literature.2 Rates have been described ranging from 0.01% to 0.2%,3–9 far lower than the rate mentioned by Dr. Chao. A careful review with the patient of the risks, benefits, and alternatives is standard practice before any elective, invasive procedure.
Multiple anticoagulation schemes have been proposed, including the Birmingham 2009 scheme.10 We included the CHADS2 score in our paper because it is widely accepted and well validated. The Birmingham 2009 scheme acknowledges other potential risk factors such as female sex, history of vascular disease, and age between 65 and 75 years. It will be interesting to see if it will ever supplant the CHADS2 score. However, no risk stratification scheme should replace sound clinical judgment. Individual patient factors must be considered when deciding whether anticoagulation is appropriate for an individual patient.
- Callahan T, Baranowski B. Managing newly diagnosed atrial fibrillation: rate, rhythm, and risk. Cleve Clin J Med 2011; 78:258–264.
- Seigel MO, Parenti DM, Simon GL. Atrial-esophageal fistula after atrial radiofrequency catheter ablation. Clin Infect Dis 2010; 51:73–76.
- Dagres N, Hindricks G, Kottkamp H, et al. Complications of atrial fibrillation ablation in a high-volume center in 1,000 procedures: still cause for concern? J Cardiovasc Electrophysiol 2009; 20:1014–1019.
- Pappone C, Oral H, Santinelli V, et al. Atrio-esophageal fistula as a complication of percutaneous transcatheter ablation of atrial fibrillation. Circulation 2004; 109:2724–2726.
- Cappato R, Calkins H, Chen SA, et al. Prevalence and causes of fatal outcome in catheter ablation of atrial fibrillation. J Am Coll Cardiol 2009; 53:1798-1803.
- Dagres N, Kottkamp H, Piorkowski C, et al. Rapid detection and successful treatment of esophageal perforation after radiofrequency ablation of atrial fibrillation: lessons from five cases. J Cardiovasc Electrophysiol 2006; 17:1213–1215.
- Ghia KK, Chugh A, Good E, et al. A nationwide survey on the prevalence of atrioesophageal fistula after left atrial radiofrequency catheter ablation. J Interv Card Electrophysiol 2009; 24:33–36.
- Mohr FW, Nikolaus D, Falk V, et al. Curative treatment of atrial fibrillation: acute and midterm results of intraoperative radiofrequency ablation of atrial fibrillation
in 150 patients. J Thorac Cardiovasc Surg 2002; 123:919–927. - Ren JF, Lin D, Marchlinski FE, Callans DJ, Patel V. Esophageal imaging and strategies for avoiding injury during left atrial ablation for atrial fibrillation. Heart Rhythm 2006; 3:1156–1161.
- Lip GYH, Nieuwlaat R, Pisters R, Lane DA, Crijns HJGM. Refining clinical risk stratification for predicting stroke and thromboembolism in atrial fibrillation using a novel risk factor-based approach: the Euro Heart Survey on Atrial Fibrillation. Chest 2010; 137:263–272.
Angioedema due to the renin inhibitor aliskiren
To the Editor: The interesting report by Korniyenko and colleagues of the delayed diagnosis of visceral angioedema due to angiotensin-converting enzyme (ACE) inhibitor therapy1 should alert readers that a long duration of use of ACE inhibitors should not rule out the diagnosis of ACE inhibitor-induced angioedema, as symptoms can be delayed for up to a decade.
Risk factors for angioedema for patients on ACE inhibitor therapy that have been identified so far include black race, the XPNPEP2 C-2399A polymorphism in men (which leads to decreased aminopeptidase P activity),2 and concomitant use of the mTOR inhibitors sirolimus (Rapamune) or everolimus (Afinitor) in renal transplant recipients.3 All of these factors further decrease metabolism of the vasoactive peptide bradykinin. However, the effect of cofactors such as use of nonsteroidal anti-inflammatory drugs, aspirin, simvastatin, estrogen, or a tendency for angioedema (such as in patients with recurrent or episodic idiopathic angioedema) on lowering the threshold for angioedema or increasing the severity of the angioedema episode or episodes after starting ACE inhibitor therapy remains unknown.
Physicians should also be aware of angioedema as a significant side effect of the new renin inhibitor aliskiren (marketed by Novartis Pharmaceuticals as Rasilez in the United Kingdom and as Tekturna in the United States) for treatment of essential hypertension.4 A pooled analysis of 31 studies in 12,188 patients showed the incidence of angioedema associated with aliskiren monotherapy to be 0.4%, similar to that with ACE inhibitors: relative risk 0.31, 95% confidence interval 0.07–1.47 for 150 mg; relative risk 0.57, 95% confidence interval 0.17–1.89 for 300 mg).5 However, no patients were hospitalized with a serious angioedema event.
Although the mechanism of action of aliskiren via renin inhibition would suggest that bradykinin may not be the causative agent of angioedema, physicians should ensure that patients who report significant angioedema episodes or those who present with angioedema have their medication history thoroughly reviewed to prevent a serious untoward event.
- Korniyenko A, Alviar CL, Cordova JP, Messerli FH. Visceral angioedema due to angiotensin-converting enzyme inhibitor therapy. Cleve Clin J Med 2011; 78:297–304.
- Woodard-Grice AV, Lucisano AC, Byrd JB, Stone ER, Simmons WH, Brown NJ. Sex-dependent and race-dependent association of XPNPEP2 C-2399A polymorphism with angiotensin-converting enzyme inhibitor-associated angioedema. Pharmacogenet Genomics 2010; 20:532–536.
- Duerr M, Glander P, Diekmann F, Dragun D, Neumayer HH, Budde K. Increased incidence of angioedema with ACE inhibitors in combination with mTOR inhibitors in kidney transplant recipients. Clin J Am Soc Nephrol 2010; 5:703–708.
- Aliskiren: risk of angioedema and renal dysfunction. Drug Safety Update. Medicines and Healthcare products Regulatory Agency. 2009; 10:2. http://www.mhra.gov.uk/home/groups/pl-p/documents/publication/con046452.pdf. Accessed September 6, 2011.
- White WB, Bresalier R, Kaplan AP, et al. Safety and tolerability of the direct renin inhibitor aliskiren: a pooled analysis of clinical experience in more than 12,000 patients with hypertension. J Clin Hypertens (Greenwich) 2010; 12:765–775.
To the Editor: The interesting report by Korniyenko and colleagues of the delayed diagnosis of visceral angioedema due to angiotensin-converting enzyme (ACE) inhibitor therapy1 should alert readers that a long duration of use of ACE inhibitors should not rule out the diagnosis of ACE inhibitor-induced angioedema, as symptoms can be delayed for up to a decade.
Risk factors for angioedema for patients on ACE inhibitor therapy that have been identified so far include black race, the XPNPEP2 C-2399A polymorphism in men (which leads to decreased aminopeptidase P activity),2 and concomitant use of the mTOR inhibitors sirolimus (Rapamune) or everolimus (Afinitor) in renal transplant recipients.3 All of these factors further decrease metabolism of the vasoactive peptide bradykinin. However, the effect of cofactors such as use of nonsteroidal anti-inflammatory drugs, aspirin, simvastatin, estrogen, or a tendency for angioedema (such as in patients with recurrent or episodic idiopathic angioedema) on lowering the threshold for angioedema or increasing the severity of the angioedema episode or episodes after starting ACE inhibitor therapy remains unknown.
Physicians should also be aware of angioedema as a significant side effect of the new renin inhibitor aliskiren (marketed by Novartis Pharmaceuticals as Rasilez in the United Kingdom and as Tekturna in the United States) for treatment of essential hypertension.4 A pooled analysis of 31 studies in 12,188 patients showed the incidence of angioedema associated with aliskiren monotherapy to be 0.4%, similar to that with ACE inhibitors: relative risk 0.31, 95% confidence interval 0.07–1.47 for 150 mg; relative risk 0.57, 95% confidence interval 0.17–1.89 for 300 mg).5 However, no patients were hospitalized with a serious angioedema event.
Although the mechanism of action of aliskiren via renin inhibition would suggest that bradykinin may not be the causative agent of angioedema, physicians should ensure that patients who report significant angioedema episodes or those who present with angioedema have their medication history thoroughly reviewed to prevent a serious untoward event.
- Korniyenko A, Alviar CL, Cordova JP, Messerli FH. Visceral angioedema due to angiotensin-converting enzyme inhibitor therapy. Cleve Clin J Med 2011; 78:297–304.
- Woodard-Grice AV, Lucisano AC, Byrd JB, Stone ER, Simmons WH, Brown NJ. Sex-dependent and race-dependent association of XPNPEP2 C-2399A polymorphism with angiotensin-converting enzyme inhibitor-associated angioedema. Pharmacogenet Genomics 2010; 20:532–536.
- Duerr M, Glander P, Diekmann F, Dragun D, Neumayer HH, Budde K. Increased incidence of angioedema with ACE inhibitors in combination with mTOR inhibitors in kidney transplant recipients. Clin J Am Soc Nephrol 2010; 5:703–708.
- Aliskiren: risk of angioedema and renal dysfunction. Drug Safety Update. Medicines and Healthcare products Regulatory Agency. 2009; 10:2. http://www.mhra.gov.uk/home/groups/pl-p/documents/publication/con046452.pdf. Accessed September 6, 2011.
- White WB, Bresalier R, Kaplan AP, et al. Safety and tolerability of the direct renin inhibitor aliskiren: a pooled analysis of clinical experience in more than 12,000 patients with hypertension. J Clin Hypertens (Greenwich) 2010; 12:765–775.