User login
International Hospital Medicine Scene
In the 15 years since Wachter and Goldman coined the term hospitalists, the specialty of Hospital Medicine grew faster than any other in the history of American medicine.1 The early drivers for growth were largely economic: There were significant reductions in resource use, with a 13% decrease in hospital costs and a 16% decrease in hospital lengths of stay (LOS).2 Hospitalist clinician‐educators increased the satisfaction of residents and medical students in academic settings.2 Patient satisfaction and hospital mortality did not suffer.2
Recent growth of Hospital Medicine revolves around 3 drivers: 1) improving quality and safety of hospitalized patientsowing in large part to the Institute of Medicine's 2 compelling reports, To Err Is Human3 and Crossing the Quality Chasm4; 2) hospitalist and specialist (surgeon) comanagement; and 3) the effects of duty hours restrictions imposed by the Accreditation Council for Graduate Medical Education affecting United States (US) teaching hospitals.5
In this issue of the Journal of Hospital Medicine, Shu and colleagues6 report on the performance of a hospitalist program in Taiwan. To the best of our knowledge, this report from Asia is the first published report of a successful hospitalist model with measurable patient outcomes outside of North America. Specifically, over a year, the authors found that patients admitted by hospitalists had a shorter LOS and lower cost per case, with no difference in in‐hospital mortality and 30‐day readmission. These results were obtained despite the fact that the cohort of patients admitted to the hospitalist team was older, sicker, and had worse functional capacity. Additionally, the patients admitted to the hospitalist team, and who died during hospitalization, were more likely to have a do‐not‐resuscitate (DNR) order signed, when compared with those patients admitted to the general internal medicine teaching service. Comparing LOS with North America may be problematic. As Shu and colleagues6 point out, there are cultural and economic issues that affect the behavior of patients and physicians in Taiwan.
The healthcare system in Taiwan has similarities to the healthcare systems in the United Kingdom (UK) and the US. In 1995, Taiwan implemented a national health insurance system. The UK has had a National Health Service for many years that provides most services for free. The Taiwanese system requires modest copayments for services. The implementation of the national health insurance system in Taiwan increased healthcare access from 57% of the population to 98%.7 The increase in insurance across the population with modest copayments has made it possible for a larger percentage of the population to access the healthcare system.7 According to the authors, this has resulted in increased hospital admissions (35% in the decade since the introduction of national health insurance), resulting in a shortage of Hospital Medicine physicians and hospital beds.7 Compounding the stressors on this system is that the diagnosis related group (DRG) reimbursement model, similar to the American DRG reimbursement model, will soon take effect in Taiwan. As a result, our colleagues in Taiwan are experiencing issues commonly faced by mature hospitalist programs in the US: increased needs in efficiency to improve patient flow and decrease emergency room overcrowding and LOS; and concerns with safe discharges of high‐risk patients while ensuring outpatient follow‐up. This is a scenario with which US hospitalists are all too familiar.
The next step for Taiwan might be to implement a culturally specific patient education program regarding the discharge process. The first step would be a needs assessment survey of patients in Taiwan, inquiring about concerns regarding readiness for discharge. They might inquire about patient beliefs regarding understanding indications for inpatient hospitalization versus discharge to home, home with home services, or skilled nursing facilities. They might be able to drill down to the root cause of refusal to be discharged home. These data could help our colleagues in Taiwan create their own discharge program to drive down LOS closer to that of the US and other Western countries, in order to reap financial benefits and improve resource utilization.
What do we know about the growth of Hospital Medicine around the world? The Society of Hospital Medicine (SHM) reports international members from 26 countries around the world. In North America, SHM members are found in the US, Canada, and Bermuda. In Europe, SHM members are found in England, Ireland, Scotland, Spain, Belgium, Portugal, Italy, and Germany. In South America, SHM members are found in Brazil, Chile, Colombia, and Argentina. In Asia and the Middle East, SHM has members in Saudi Arabia, Israel, United Arab Emirates, Pakistan, Japan, China, the Philippines, and Singapore. In Oceania, SHM has members in Australia, and New Zealand. In Africa, 1 SHM member is from Nigeria (Society of Hospital Medicine Data, 2011). In fact, the International Hospitalists Section of SHM is 1 of only 2 sections that the Society recognizes.
Hospitalists are organizing themselves abroad as well. In Canada, the Canadian Society of Hospital Medicine was founded in 2001 and has had 8 national conferences to date.8 There are roughly 1,000 Canadian hospitalists (Wilton D, personal communication, 2011). Whereas most US hospitalists are internists or pediatricians, in Canada, most hospitalists are family physicians. In the US, hospitalists are more likely to perform the following services: consultation, intensive care unit patient care, rapid response team service, surgical comanagement, and evening on‐site coverage. Canadian hospitalists are more likely to provide pediatric care and psychiatry inpatient comanagement.9
In the UK, the professional organization of physicians most similar to US hospitalists, acute physicians, is called SAM (The Society for Acute Medicine). It was founded in 2000.10 In the UK, general practitioners (GPs) never care for inpatients; at the time, GPs referred all admissions to organ‐specific specialists (eg, cardiologists). Acute medicine was created due to the realization that medical inpatients were too complex to have specialists managing them. Training programs were set up circa 2003 to create this specialty and address this need. Acute physicians staff geographically localized acute medicine units near emergency departments. These patients stay 1 to 3 days in an effort to concentrate services and resources to these patients, to prevent longer stays once fully admitted (Smith R, personal communication, April 23, 2011). Acute medicine units in the UK, Ireland, and Australia have led to positive benefits on patient outcomes. A review article by Scott and colleagues revealed reductions in LOS, inpatient mortality, and emergency department LOS, without increased 30‐day readmission rates. They found increased staff and patient satisfaction, and more medical patients discharged directly to home from acute medical units.11 The development of acute medicine in Australia and New Zealand began around 2005 and derives from the geographic localization of the UK model. Whereas the UK model has a focus on the first 72 hours of hospitalization, the model in Australia and New Zealand is more similar to the US model of following patients through their entire admission.12 Unlike the UK, Australia does not have dedicated acute medicine training programs.
PASHA, the Pan‐American Society of Hospitalists, is a loose affiliation of hospitalists largely in South America, linking with their North American colleagues. PASHA grew out of SOBRAMH, Sociedade Brasileira de Medicina Hospitalarthe first Hospital Medicine Society in South America, tracing its roots to 2004. To date, PASHA has had 1 international conference, but there have been 2 national conferences each in Brazil and Chile, and 1 in Colombia. The concept and advantages of Hospital Medicine have been presented at a conference in Panama. Argentina has its first Hospital Medicine Congress scheduled for September 2011, in concert with PASHA.
Two Hospital Medicine programs abroad deserve special mention. Both started in 2005 and have instituted the full hospitalist package, including multiple evidence‐based order sets at both sites (eg, deep vein thrombosis [DVT] prophylaxis and hyperglycemia management). At the Pontificia Universidad Catlica in Santiago, Chile, they have been awarded national grants to study hyperglycemia in hospitalized patients, and they have sent their faculty to the US for additional training in patient safety, quality improvement, leadership, and medical informatics. They have succeeded in decreasing LOS and improved the exam grades of their learners. Their faculty has published in national journals and is now beginning to submit their work for publication in US‐based journals (Rojas L, personal communication, April 22, 2011). The Clnica Universidad de Navarra (CUN) in Pamplona, Spain is a Joint Commission certified facility with a full electronic medical record. Hospitalists there are looking at ways in which hospitalist‐staffed intermediate care units can benefit patient outcomes. Additionally, they have comanagement arrangements with nearly all surgical subspecialties. The Management of the Hospitalized Patient symposium was organized by CUN hospitalists in 2007the first Hospital Medicine Congress, to our knowledge, in continental Europe. At any one time, 30% of all residents in all specialties rotate with CUN hospitalists (Lucena F, personal communication, April 22, 2011).
The specialty of Hospital Medicine is truly global. Our colleagues around the world employing the hospitalist model of care are now producing outcomes similar to the published models in North America and to the acute medicine models in Europe and Australia. According to the Society of Hospital Medicine, there are over 30,000 hospitalists in the US. There could be well over 50,000 hospitalists around the world. In 5 years, the world may have 100,000 hospitalists. The same drivers are fueling the growth of Hospital Medicine around the world. The evidence is building that the hospitalist model of care has financial and quality benefits that transcend borders. We forecast that the hospitalist model of care will become an increasingly larger part of the solution around the world to fix these international healthcare systems.
- ,.The emerging role of “hospitalists” in the American health care system.N Engl J Med.1996;335(7):514–517.
- ,.The hospitalist movement 5 years later.JAMA.2002;287(4):487–494.
- ,,.To Err Is Human: Building a Safer Health System; Institute of Medicine Committee on Quality of Health Care in America.Washington, DC:National Academy Press;2000.
- ,,.Crossing the Quality Chasm: A New Health System for the 21st Century; Institute of Medicine Committee of Health Care in America.Washington, DC:National Academy Press;2001.
- .The state of hospital medicine in 2008.Med Clin North Am.2008;92:265–273.
- et al.J Hosp Med.2011;6:378–382.
- ,,.A 10‐year experience with universal health insurance in Taiwan: measuring changes in health and health disparity.Ann Intern Med.2008;148(4):258–267.
- Canadian Hospitalist: Canadian Society of Hospital Medicine Web site. Available at: http://canadianhospitalist.ca/. Accessed April 15,2011.
- ,,,,,.Characteristics of hospitalists and hospitalist programs in the United States and Canada.J Clin Outcomes Manage.2009;16(2):69–74.
- The Society for Acute Medicine Web site. Available at: www.acutemedicine.org.uk. Accessed April 14,2011.
- ,,.Effectiveness of acute medical units in hospitals: a systematic review.Int J Qual Health Care.2009;21(6):397–407.
- .Acute and general medicine on opposite sides of the world.Acute Med.2011;10(2):67–68.
In the 15 years since Wachter and Goldman coined the term hospitalists, the specialty of Hospital Medicine grew faster than any other in the history of American medicine.1 The early drivers for growth were largely economic: There were significant reductions in resource use, with a 13% decrease in hospital costs and a 16% decrease in hospital lengths of stay (LOS).2 Hospitalist clinician‐educators increased the satisfaction of residents and medical students in academic settings.2 Patient satisfaction and hospital mortality did not suffer.2
Recent growth of Hospital Medicine revolves around 3 drivers: 1) improving quality and safety of hospitalized patientsowing in large part to the Institute of Medicine's 2 compelling reports, To Err Is Human3 and Crossing the Quality Chasm4; 2) hospitalist and specialist (surgeon) comanagement; and 3) the effects of duty hours restrictions imposed by the Accreditation Council for Graduate Medical Education affecting United States (US) teaching hospitals.5
In this issue of the Journal of Hospital Medicine, Shu and colleagues6 report on the performance of a hospitalist program in Taiwan. To the best of our knowledge, this report from Asia is the first published report of a successful hospitalist model with measurable patient outcomes outside of North America. Specifically, over a year, the authors found that patients admitted by hospitalists had a shorter LOS and lower cost per case, with no difference in in‐hospital mortality and 30‐day readmission. These results were obtained despite the fact that the cohort of patients admitted to the hospitalist team was older, sicker, and had worse functional capacity. Additionally, the patients admitted to the hospitalist team, and who died during hospitalization, were more likely to have a do‐not‐resuscitate (DNR) order signed, when compared with those patients admitted to the general internal medicine teaching service. Comparing LOS with North America may be problematic. As Shu and colleagues6 point out, there are cultural and economic issues that affect the behavior of patients and physicians in Taiwan.
The healthcare system in Taiwan has similarities to the healthcare systems in the United Kingdom (UK) and the US. In 1995, Taiwan implemented a national health insurance system. The UK has had a National Health Service for many years that provides most services for free. The Taiwanese system requires modest copayments for services. The implementation of the national health insurance system in Taiwan increased healthcare access from 57% of the population to 98%.7 The increase in insurance across the population with modest copayments has made it possible for a larger percentage of the population to access the healthcare system.7 According to the authors, this has resulted in increased hospital admissions (35% in the decade since the introduction of national health insurance), resulting in a shortage of Hospital Medicine physicians and hospital beds.7 Compounding the stressors on this system is that the diagnosis related group (DRG) reimbursement model, similar to the American DRG reimbursement model, will soon take effect in Taiwan. As a result, our colleagues in Taiwan are experiencing issues commonly faced by mature hospitalist programs in the US: increased needs in efficiency to improve patient flow and decrease emergency room overcrowding and LOS; and concerns with safe discharges of high‐risk patients while ensuring outpatient follow‐up. This is a scenario with which US hospitalists are all too familiar.
The next step for Taiwan might be to implement a culturally specific patient education program regarding the discharge process. The first step would be a needs assessment survey of patients in Taiwan, inquiring about concerns regarding readiness for discharge. They might inquire about patient beliefs regarding understanding indications for inpatient hospitalization versus discharge to home, home with home services, or skilled nursing facilities. They might be able to drill down to the root cause of refusal to be discharged home. These data could help our colleagues in Taiwan create their own discharge program to drive down LOS closer to that of the US and other Western countries, in order to reap financial benefits and improve resource utilization.
What do we know about the growth of Hospital Medicine around the world? The Society of Hospital Medicine (SHM) reports international members from 26 countries around the world. In North America, SHM members are found in the US, Canada, and Bermuda. In Europe, SHM members are found in England, Ireland, Scotland, Spain, Belgium, Portugal, Italy, and Germany. In South America, SHM members are found in Brazil, Chile, Colombia, and Argentina. In Asia and the Middle East, SHM has members in Saudi Arabia, Israel, United Arab Emirates, Pakistan, Japan, China, the Philippines, and Singapore. In Oceania, SHM has members in Australia, and New Zealand. In Africa, 1 SHM member is from Nigeria (Society of Hospital Medicine Data, 2011). In fact, the International Hospitalists Section of SHM is 1 of only 2 sections that the Society recognizes.
Hospitalists are organizing themselves abroad as well. In Canada, the Canadian Society of Hospital Medicine was founded in 2001 and has had 8 national conferences to date.8 There are roughly 1,000 Canadian hospitalists (Wilton D, personal communication, 2011). Whereas most US hospitalists are internists or pediatricians, in Canada, most hospitalists are family physicians. In the US, hospitalists are more likely to perform the following services: consultation, intensive care unit patient care, rapid response team service, surgical comanagement, and evening on‐site coverage. Canadian hospitalists are more likely to provide pediatric care and psychiatry inpatient comanagement.9
In the UK, the professional organization of physicians most similar to US hospitalists, acute physicians, is called SAM (The Society for Acute Medicine). It was founded in 2000.10 In the UK, general practitioners (GPs) never care for inpatients; at the time, GPs referred all admissions to organ‐specific specialists (eg, cardiologists). Acute medicine was created due to the realization that medical inpatients were too complex to have specialists managing them. Training programs were set up circa 2003 to create this specialty and address this need. Acute physicians staff geographically localized acute medicine units near emergency departments. These patients stay 1 to 3 days in an effort to concentrate services and resources to these patients, to prevent longer stays once fully admitted (Smith R, personal communication, April 23, 2011). Acute medicine units in the UK, Ireland, and Australia have led to positive benefits on patient outcomes. A review article by Scott and colleagues revealed reductions in LOS, inpatient mortality, and emergency department LOS, without increased 30‐day readmission rates. They found increased staff and patient satisfaction, and more medical patients discharged directly to home from acute medical units.11 The development of acute medicine in Australia and New Zealand began around 2005 and derives from the geographic localization of the UK model. Whereas the UK model has a focus on the first 72 hours of hospitalization, the model in Australia and New Zealand is more similar to the US model of following patients through their entire admission.12 Unlike the UK, Australia does not have dedicated acute medicine training programs.
PASHA, the Pan‐American Society of Hospitalists, is a loose affiliation of hospitalists largely in South America, linking with their North American colleagues. PASHA grew out of SOBRAMH, Sociedade Brasileira de Medicina Hospitalarthe first Hospital Medicine Society in South America, tracing its roots to 2004. To date, PASHA has had 1 international conference, but there have been 2 national conferences each in Brazil and Chile, and 1 in Colombia. The concept and advantages of Hospital Medicine have been presented at a conference in Panama. Argentina has its first Hospital Medicine Congress scheduled for September 2011, in concert with PASHA.
Two Hospital Medicine programs abroad deserve special mention. Both started in 2005 and have instituted the full hospitalist package, including multiple evidence‐based order sets at both sites (eg, deep vein thrombosis [DVT] prophylaxis and hyperglycemia management). At the Pontificia Universidad Catlica in Santiago, Chile, they have been awarded national grants to study hyperglycemia in hospitalized patients, and they have sent their faculty to the US for additional training in patient safety, quality improvement, leadership, and medical informatics. They have succeeded in decreasing LOS and improved the exam grades of their learners. Their faculty has published in national journals and is now beginning to submit their work for publication in US‐based journals (Rojas L, personal communication, April 22, 2011). The Clnica Universidad de Navarra (CUN) in Pamplona, Spain is a Joint Commission certified facility with a full electronic medical record. Hospitalists there are looking at ways in which hospitalist‐staffed intermediate care units can benefit patient outcomes. Additionally, they have comanagement arrangements with nearly all surgical subspecialties. The Management of the Hospitalized Patient symposium was organized by CUN hospitalists in 2007the first Hospital Medicine Congress, to our knowledge, in continental Europe. At any one time, 30% of all residents in all specialties rotate with CUN hospitalists (Lucena F, personal communication, April 22, 2011).
The specialty of Hospital Medicine is truly global. Our colleagues around the world employing the hospitalist model of care are now producing outcomes similar to the published models in North America and to the acute medicine models in Europe and Australia. According to the Society of Hospital Medicine, there are over 30,000 hospitalists in the US. There could be well over 50,000 hospitalists around the world. In 5 years, the world may have 100,000 hospitalists. The same drivers are fueling the growth of Hospital Medicine around the world. The evidence is building that the hospitalist model of care has financial and quality benefits that transcend borders. We forecast that the hospitalist model of care will become an increasingly larger part of the solution around the world to fix these international healthcare systems.
- ,.The emerging role of “hospitalists” in the American health care system.N Engl J Med.1996;335(7):514–517.
- ,.The hospitalist movement 5 years later.JAMA.2002;287(4):487–494.
- ,,.To Err Is Human: Building a Safer Health System; Institute of Medicine Committee on Quality of Health Care in America.Washington, DC:National Academy Press;2000.
- ,,.Crossing the Quality Chasm: A New Health System for the 21st Century; Institute of Medicine Committee of Health Care in America.Washington, DC:National Academy Press;2001.
- .The state of hospital medicine in 2008.Med Clin North Am.2008;92:265–273.
- et al.J Hosp Med.2011;6:378–382.
- ,,.A 10‐year experience with universal health insurance in Taiwan: measuring changes in health and health disparity.Ann Intern Med.2008;148(4):258–267.
- Canadian Hospitalist: Canadian Society of Hospital Medicine Web site. Available at: http://canadianhospitalist.ca/. Accessed April 15,2011.
- ,,,,,.Characteristics of hospitalists and hospitalist programs in the United States and Canada.J Clin Outcomes Manage.2009;16(2):69–74.
- The Society for Acute Medicine Web site. Available at: www.acutemedicine.org.uk. Accessed April 14,2011.
- ,,.Effectiveness of acute medical units in hospitals: a systematic review.Int J Qual Health Care.2009;21(6):397–407.
- .Acute and general medicine on opposite sides of the world.Acute Med.2011;10(2):67–68.
Quantifying Resident Clinical Experience
Internal medicine residency training continues to evolve as competency‐based and with education organized around patient care.13 Making the patient the center of resident education provides an opportunity for experiential learning in which learning can be organized around the clinical conditions that residents encounter. Despite the renewed emphasis on using patient experience as the basis for residency education, little is known regarding what specific diagnostic conditions are seen by internal medicine residents throughout their training. Attempts have been made to quantify resident clinical experience in various fields, using approaches such as review of medical records, case logs, and prescription profiles, but to date, we lack systematic methods to obtain clinical experience data for internal medicine residents.47
While residency curricula in internal medicine typically outlines specific rotations in various clinical areas such as general medical wards, cardiology services, and intensive care units, time spent on such rotations does not necessarily provide quantitative data on the actual clinical conditions that residents encounter, nor does it ensure consistent clinical experience between residents. It is plausible that there may be substantial variability in clinical experience between residents within the same program, and that the overall spectrum of clinical disorders seen by residents in a program may or may not be consistent with a desired optimum, though this is yet to be defined.
If residency education in internal medicine is to progressively incorporate more experiential learning, detailed knowledge of the clinical conditions seen by residents should be useful, not only for overall curriculum design, but this might also allow for various educational interventions to be made when there are variations in clinical experience between residents. Our program has been interested in the application of electronic resources for the improvement of patient care, such as through the handoff process and the use of personal digital assistants.8 We previously did a small analysis of clinical conditions seen by residents through non‐International Classification of Diseases, Ninth Revision (ICD‐9)‐based data they entered onto personal digital assistants. This suggested to us that electronic resources used by residents might serve as a venue by which they could enter diagnostic information which we could use to generate a more detailed analysis of the clinical conditions that they see. Here we describe a method by which we have attempted to quantify resident clinical experience in internal medicine using a modification of an electronic handoff system.
METHODS
The study was conducted within the Internal Medicine Residency Program at the Long Island Jewish Medical Center in New Hyde Park, New York, part of the North ShoreLong Island Jewish Health System, and was approved by the Institutional Review Board. This work was carried out as part of our participation in the Educational Innovation Project of the Residency Review Committee for Internal Medicine. A central objective of our proposal was to develop a method to assess residents' clinical experience on an individual and an aggregate basis. A group of faculty and residents in our residency program developed an electronic handoff tool which residents use for rapid access to key clinical data for their patients and for the handoff of clinical information for on call coverage. This handoff tool was developed with the technical assistance of MedTech Notes LLC which owns Patient Data Transfer System (PDTS) HandOff Note. We modified the handoff tool to include a section in which residents were required to enter a primary diagnosis for each of their patients (a hard stop design). We chose to use the ICD‐9 system for standardization and created two methods to select the code: 1) an organ system‐based dropdown list containing frequently used codes and 2) a search box allowing for searching of the complete ICD‐9 database. For the organ‐based dropdown list, selection of that organ system would reveal a brief list of frequently used codes to make it easier for residents to find them. Prior to using the handoff tool with the ICD‐9based primary diagnosis coding system, training sessions with the residents were conducted by 3 of the investigators along with 3 chief medical residents. These sessions included training not only in technical aspects of how to find diagnosis codes, but also how to make decisions regarding what the primary diagnosis should be. We also instructed our postgraduate year (PGY)‐1s to update their diagnostic selections during the course of the hospital stay.
Each data point represents a resident caring for a patient with a specific diagnostic entity, and is counted once for that resident's period of taking care of that patient. Thirty‐three PGY‐1s were studied and, on the internal medicine service, they were supervised by either hospitalist faculty or voluntary faculty in comparable proportions. If the patient's care is taken over by another resident, that second resident was also recorded as having had a diagnostic encounter with that patient, hence 1 patient could provide experience with the same diagnostic entity for 1 or more residents. Using this method, the denominator is not patients seen, but residentpatient diagnostic encounters that have taken place. The ICD‐9 diagnostic conditions entered by the residents were grouped using the ICD‐9 system. Individual diagnostic profiles for each resident, as well as an aggregate profile for all residents to reflect the residency program as a whole, were generated. We also carried out an analysis of the ICD‐9 codes entered by 6 consecutive PGY‐1s to assess how the diagnostic spectrum might vary among a small sampling of PGY‐1s. In order to evaluate the accuracy of the residents' diagnostic selections, we carried out a validation assessment using a tool used by the residents' supervising hospitalists (who were the attendings of record for those patients). This was carried out on a subset of patients and could be done at any time during the hospital stay. The hospitalists were asked to review their residents' ICD‐9 codes and indicate whether they agreed or disagreed.
RESULTS
A total of 7562 residentpatient diagnostic encounters were studied from July 1, 2007 through June 1, 2008. Mean patient age was 66 19.4 years. The age distribution is given in Table 1 and reveals that 65% of diagnostic encounters were with patients age 60 years or greater. Twelve housestaff teams were studied, each consisting of 2 PGY‐1s and a supervising PGY‐2 or PGY‐3 resident. All ICD‐9 codes were selected by categorical and preliminary internal medicine PGY‐1s on medical ward and intensive care unit rotations. Residents from other departments doing rotations on the medical service were excluded. A validation assessment of 341 patients indicated 83.3% agreement by the supervising hospitalist with the primary ICD‐9 code selected. ICD‐9 codes were then grouped and categorized using ICD‐9 nomenclature with the distribution provided in Table 2. A wide spectrum of clinical conditions is apparent including symptoms and ill‐defined conditions, circulatory disorders, respiratory disorders, neoplasms, genitourinary disorders, digestive disorders, diseases of the blood/blood forming organs, endocrinologic/nutritional/metabolic/emmmune disorders, and disorders of the skin and subcutaneous tissue, overall accounting for about 86% of resident clinical experience.
| Age Category | No. | Percent of Total |
|---|---|---|
| 1829 | 441 | 5.83 |
| 3039 | 455 | 6.02 |
| 4049 | 705 | 9.32 |
| 5059 | 1,010 | 13.36 |
| 6069 | 1,218 | 16.11 |
| 7079 | 1,465 | 19.37 |
| 8089 | 1,673 | 22.12 |
| 90110 | 595 | 7.87 |
| ICD‐9 Category Description | Frequency | Percent |
|---|---|---|
| ||
| Symptoms/Ill‐Defined Conditions | 1,475 | 19.51 |
| Circulatory System | 1,381 | 18.26 |
| Respiratory System | 939 | 12.42 |
| Neoplasms | 572 | 7.56 |
| Genitourinary System | 502 | 6.64 |
| Digestive System | 464 | 6.14 |
| Blood/Blood‐Forming Organs | 444 | 5.87 |
| Endo/Nutritional/Metabolic/Immunity | 393 | 5.20 |
| Skin and Subcutaneous Tissue | 380 | 5.03 |
| Injury and Poisoning | 222 | 2.94 |
| Musculoskeletal/Connective Tissue | 199 | 2.63 |
| Infectious/Parasitic | 194 | 2.57 |
| Mental Disorders | 166 | 2.20 |
| Nervous System/Sense Organs | 125 | 1.65 |
| Health Status/Contact with Health Services | 81 | 1.07 |
| Pregnancy/Childbirth/Puerperium | 14 | 0.19 |
We also examined the most common diagnostic conditions within each of these categories. The 3 most common ICD‐9 codes entered by residents within each category are provided in Table 3. Symptoms and ill‐defined conditions represent a sizable portion of resident clinical experience (19.51%). Within this category, the most common conditions were fever; abdominal pain (unspecified site); and chest pain, unspecified. Disorders of the circulatory and respiratory systems were the next most common categories of conditions seen by residents, comprising 18.26% and 12.42%, respectively, of resident clinical experience. Within the category of circulatory disorders, congestive heart failure and acute myocardial infarction were the most common conditions seen; for respiratory disorders, pneumonia, chronic airway obstruction, and asthma were most commonly encountered. In aggregate, symptoms and ill‐defined conditions, and disorders of the circulatory and respiratory systems accounted for 50% of resident clinical experience.
| ICD‐9 Category Description | ICD‐9 Code | Code Description | Frequency | Percent |
|---|---|---|---|---|
| ||||
| Symptoms/Ill‐Defined Conditions | 780.6 | Fever | 190 | 2.51 |
| 789 | Abdominal pain; unspecified site | 149 | 1.97 | |
| 786.5 | Chest pain, unspecified | 140 | 1.85 | |
| Circulatory System | 428 | Congestive heart failure, unspecified | 346 | 4.58 |
| 410.9 | Acute myocardial infarction; unspecified site; unspecified episode of care | 135 | 1.79 | |
| 410.1 | Acute myocardial infarction; other anterior wall; unspecified episode of care | 106 | 1.40 | |
| Respiratory System | 486 | Pneumonia, organism unspecified | 363 | 4.80 |
| 496 | Chronic airway obstruction, not elsewhere classified | 162 | 2.14 | |
| 493.9 | Asthma, unspecified; unspecified | 96 | 1.27 | |
| Neoplasms | 199.1 | Malignant neoplasm without specification of site; other | 86 | 1.14 |
| 162.9 | Malignant neoplasm; bronchus lung; unspecified | 73 | 0.97 | |
| 202.8 | Other lymphomas; unspecified site, extranodal and solid organ sites | 71 | 0.94 | |
| Genitourinary System | 599 | Urinary tract infection, site not specified | 247 | 3.27 |
| 584.9 | Acute renal failure, unspecified | 91 | 1.20 | |
| 585.6 | End stage renal disease | 40 | 0.53 | |
| Digestive System | 578.9 | Hemorrhage of gastrointestinal tract, unspecified | 119 | 1.57 |
| 558.9 | Other and unspecified noninfectious gastroenteritis and colitis | 69 | 0.91 | |
| 577 | Acute pancreatitis | 36 | 0.48 | |
| Blood/Blood‐Forming Organs | 285.9 | Anemia, unspecified | 127 | 1.68 |
| 282.64 | Sickle‐cell/Hb‐C disease with crisis | 80 | 1.06 | |
| 282.6 | Sickle‐cell disease, unspecified | 73 | 0.97 | |
| Endo/Nutritional/Metabolic/Immunity | 276.1 | Hypoosmolality and/or hyponatremia | 57 | 0.75 |
| 251.2 | Hypoglycemia, unspecified | 56 | 0.74 | |
| 250.1 | Diabetes with ketoacidosis; type II, not stated as uncontrolled | 50 | 0.66 | |
| Skin and Subcutaneous Tissue | 682.9 | Other cellulitis and abscess; unspecified site | 256 | 3.39 |
| 682.5 | Other cellulitis and abscess; buttock | 37 | 0.49 | |
| 686.9 | Unspecified local infection of skin and subcutaneous tissue | 23 | 0.30 | |
| Injury and Poisoning | 848.9 | Unspecified site of sprain and strain | 32 | 0.42 |
| 977.9 | Poisoning by unspecified drug or medicinal substance | 32 | 0.42 | |
| 829 | Fracture; unspecified bone, closed | 22 | 0.29 | |
| Musculoskeletal/Connective Tissue | 730.2 | Unspecified osteomyelitis; site unspecified | 33 | 0.44 |
| 710 | Systemic lupus erythematosus | 25 | 0.33 | |
| 728.87 | Muscle weakness (generalized) | 19 | 0.25 | |
| Infectious/Parasitic | 38.9 | Unspecified septicemia | 58 | 0.77 |
| 8.45 | Intestinal infection/clostridium difficile | 54 | 0.71 | |
| 9.1 | Colitis, enteritis, and gastroenteritis of presumed infectious organ | 15 | 0.20 | |
| Mental Disorders | 291.81 | Alcohol withdrawal | 43 | 0.57 |
| 307.9 | Other and unspecified special symptoms or syndromes, not elsewhere classified | 35 | 0.46 | |
| 294.8 | Other persistent mental disorders due to conditions classified elsewhere | 20 | 0.26 | |
| Nervous System/Sense Organs | 322.9 | Meningitis, unspecified | 30 | 0.40 |
| 331 | Alzheimer's disease | 14 | 0.19 | |
| 340 | Multiple sclerosis | 6 | 0.08 | |
| Health Status/Contact with Health Services | 885.9 | Accidental fall from other slipping tripping or stumbling | 18 | 0.24 |
| 884.4 | Accidental fall from bed | 7 | 0.09 | |
| V13.02 | Personal history of urinary (tract) infection | 4 | 0.05 | |
| Pregnancy/Childbirth/Puerperium | 673.8 | Other pulmonary embolism; unspecified episode of care | 9 | 0.12 |
| 665 | Rupture of uterus before onset of labor; unspecified episode of care | 1 | 0.01 | |
| 665.7 | Pelvic hematoma, unspecified episode of care | 1 | 0.01 | |
Individual resident clinical experience varied as well. As shown in Table 4, for a group of 6 PGY‐1s, there was substantial variability in the ICD‐9 diagnostic categories. For example, the percentages of codes falling into the cardiovascular disease category ranged from 15.27% to 27.91%, and for respiratory disease ranged from 8.22% to 18.55%. These data suggest that there may be sizable differences in the proportions of various clinical conditions seen by residents over a year of training.
| ICD‐9 Category Description | Mean | SD | Min | Max |
|---|---|---|---|---|
| ||||
| Symptoms/Ill‐Defined Conditions | 21.43 | 5.07 | 15.50 | 29.90 |
| Circulatory System | 21.84 | 4.38 | 15.27 | 27.91 |
| Respiratory System | 12.43 | 3.83 | 8.22 | 18.55 |
| Neoplasms | 8.47 | 2.64 | 4.12 | 11.80 |
| Genitourinary System | 5.26 | 1.09 | 4.03 | 6.98 |
| Digestive System | 4.53 | 0.96 | 3.09 | 5.65 |
| Blood/Blood‐Forming Organs | 4.64 | 2.73 | 3.05 | 10.05 |
| Endo/Nutritional/Metabolic/Immunity | 5.64 | 1.68 | 3.11 | 7.22 |
| Skin and Subcutaneous Tissue | 4.28 | 1.63 | 2.42 | 6.19 |
| Injury and Poisoning | 3.90 | 1.01 | 3.09 | 5.43 |
| Musculoskeletal/Connective Tissue | 2.86 | 1.36 | 1.55 | 4.58 |
| Infectious/Parasitic | 3.86 | 2.62 | 2.42 | 8.53 |
| Mental Disorders | 1.47 | 0.62 | 0.81 | 2.28 |
| Nervous System/Sense Organs | 1.49 | 0.87 | 0.62 | 3.09 |
DISCUSSION
Years ago, residency training transitioned from a predominantly bedside experience to a curriculum with a large didactic, non‐bedside component, following parameters defined by organizations such as the Accreditation Council for Graduate Medical Education. Residency training is undergoing substantial change to become competency‐based and to organize learning around patient care experiences.2, 3, 9 The Educational Innovation Project of the Residency Review Committee for Internal Medicine is one such endeavor to help develop new methods by which to accomplish this.1 Effective incorporation of innovative experiential learning methods, based on the core competencies, will require a detailed knowledge of resident clinical experience during the course of their training, yet such data have been sparse in internal medicine. Sequist et al. analyzed data from an electronic medical record to assess resident clinical experience in the outpatient setting.4 Bachur and Nagler have used an electronic patient tracking system to assess the clinical experience of pediatric emergency medicine fellows.5, 6 Most attempts to describe resident clinical experience have relied upon extracting diagnostic information from medical records, case logs, etc, though in another approach, Rohrbaugh et al. reviewed psychiatric resident prescription profiles,7 which might provide some indirect data on clinical experience if applied to internal medicine.
In this study, we attempted to quantify resident clinical experience using resident‐selected ICD‐9 codes, in contrast to other methods that have relied upon medical record review and other resident‐independent approaches. There are various strengths and limitations to this approach. Using the ICD‐9 system provides a number of strengths, a major one being standardization, allowing comparisons between different programs and perhaps even facilitating the development of guidelines for resident clinical experience. In addition, this approach using the ICD‐9 system could be readily implemented at any institution and does not require any specific technology. While we chose to do this through our handoff system, an institution could use any of a variety of other systems to accomplish this. For example, resident‐entered ICD‐9 coding systems could be incorporated into electronic discharge summaries, history and physicals, or progress notes. There may also be some practical benefits to having residents learn how to use the ICD‐9 system at this stage of their careers.
There are limitations to this approach as well. The ICD‐9 system was not intended to be used for medical education purposes. There are features of it that can make finding the best diagnosis difficult, and routes to it may at times seem counterintuitive. While we did not carry out resident surveys, a number of residents anecdotally mentioned that it took time to become comfortable using the system, and it could be challenging at times to find a diagnosis description that best fit what they were looking for. To make diagnosis selection easier, we created an organ system‐based dropdown list in the handoff tool so that when residents select an organ system, another list opens up containing commonly used ICD‐9 codes. This grouping is based on organ system alone and does not necessarily follow the ICD‐9 grouping (in contrast, our reported data in this article are all based on ICD‐9 grouping). A search tool to allow searching the entire ICD‐9 database was also made available on the handoff tool. Other factors that could limit diagnosis code accuracy could be lack of clinical knowledge, and error as a result of pressure to come up with a diagnosis because of the hard stop design of our system, in which residents were required to enter a primary diagnosis, potentially causing alert fatigue. A validation assessment that we carried out revealed fairly good agreement with the specific ICD‐9 codes chosen by the resident, but greater accuracy would be desirable. Further education on diagnosis selection and refinements to the handoff tool should help facilitate this. We are currently addressing this by ongoing education on diagnosis selection and by having the hospitalists share the handoff tool with the residents, allowing them to provide direct feedback on diagnostic selections.
More than 19% of the diagnoses selected by residents fell into the category of symptoms and ill‐defined conditions. This raises a number of potential educational issues. One of those is that if residents do, in fact, encounter such entities at such a high frequency, then the internal medicine curriculum must be structured in such a way as to complement this clinical experience with a comprehensive learning program. However, we must also consider the possibility that, in many such instances, a more definitive diagnosis became evident by the time of discharge and this may not have been reflected in the ICD‐9 code that the resident chose. Hence, the category of symptoms and ill‐defined conditions may actually be somewhat smaller than our findings would suggest.
Many issues will need to be addressed as programs obtain more data on their residents' clinical experience. While there may be many reasons to use the ICD‐9 system for selecting diagnoses including those listed above, the system by which ICD‐9 groups diagnoses might not provide ideal educational information, again as the ICD‐9 system was not designed for this purpose. While in this article we have reported the residents' diagnostic encounters grouped according to the ICD‐9 grouping system to provide an initial standardized description, grouping according to another diagnostic system that is felt to be more educationally meaningful may be preferred.
While one might assume that a higher frequency of exposure to certain clinical conditions should enhance competency, that relationship may not be straightforward in internal medicine. For surgical procedures, there are, in fact, data to show improved outcomes for surgeons with higher operative volumes for those procedures,10 but in internal medicine, we do not have data to demonstrate that competence of a resident caring for a particular condition is enhanced by experience alone. Therefore, as programs obtain more data on clinical experience, it will be important that the focus be kept on quality as opposed to quantity.
Obtaining data on resident clinical experience might greatly facilitate experiential learning approaches. For example, as residents go through training and encounter specific diagnostic conditions, those experiences could be supplemented by various learning innovations to make those experiences more meaningful and, hopefully, more likely to result in the development of competence, though that will require measurement. In our program, for example, we have incorporated an approach using illness scenarios, in that when residents have had a certain level of clinical experience with a given clinical condition, they are assembled in small groups and competency‐based case discussions are carried out with a preceptor. In addition, for those instances in which an individual resident may lack direct clinical experience in a certain area, this might be addressed by interventions to increase their contact with those conditions and/or targeted learning interventions to help develop competence. A resident found to be lacking in clinical experience in a certain area could be assigned to the care of more patients with that condition, or to spending more time in a venue in which that condition is more likely to be encountered. Various learning activities including didactics, case discussions, simulation, self‐directed learning, and others could also be used to compensate for such variability. Furthermore, if a residency program's aggregate clinical experience is divergent from some desirable standard yet to be determined, a detailed knowledge of this could help guide that program's curriculum revision. For example, for residents in a program in which there is relatively low exposure to patients with oncological issues, this could be compensated for by external rotations to achieve more clinical experience in oncology, as well as supplementation of the curriculum with additional learning activities in oncology, which could include small group discussions, self‐directed learning activities, case discussions, and others. While at present there are no defined standards for clinical experience and it remains to be seen if there would be a correlation with development of competence, no such standard would serve a purpose if programs did not have reliable and practical means of clinical experience assessment.
In summary, resident‐selected ICD‐9 codes may be a useful means to obtain data regarding resident clinical experience in internal medicine. Such data may be useful to residency training programs in developing new curricula based on experiential learning.
- ,,.Internal medicine's Educational Innovations Project: improving health care and learning.Am J Med.2009;122:398–404.
- ,,,,.Redesigning residency education in internal medicine: a position paper from the Association of Program Directors in Internal Medicine.Ann Intern Med.2006;144:920–926.
- ,,for the Education Committee of the American College of Physicians.Redesigning training for internal medicine.Ann Intern Med.2006;144:927–932.
- ,,,,.Use of an electronic medical record to profile the continuity clinic experiences of primary care residents.Acad Med.2005;80:390–394.
- ,,.An automated electronic case log: using electronic information systems to assess training in emergency medicine.Acad Emerg Med.2006;13:733–739.
- ,.Use of an automated electronic case log to assess fellowship training: tracking the pediatric emergency medicine experience.Pediatr Emerg Care.2008;24:75–82.
- ,,,.Utilizing VA information technology to develop psychiatric resident prescription profiles.Acad Psychiatry.2009;33:27–30.
- ,,, et al.Personal digital assistants (PDAs): a review of their application in graduate medical education.Am J Med Qual.2005;20:262–267.
- ,,, et al.Redesigning residency training in internal medicine: the consensus report of the Alliance for Academic Internal Medicine Education Redesign Task Force.Acad Med.2007;82:1211–1219.
- ,,,,,.Surgeon volume and operative mortality in the United States.N Engl J Med.2003;349:2117–2127.
Internal medicine residency training continues to evolve as competency‐based and with education organized around patient care.13 Making the patient the center of resident education provides an opportunity for experiential learning in which learning can be organized around the clinical conditions that residents encounter. Despite the renewed emphasis on using patient experience as the basis for residency education, little is known regarding what specific diagnostic conditions are seen by internal medicine residents throughout their training. Attempts have been made to quantify resident clinical experience in various fields, using approaches such as review of medical records, case logs, and prescription profiles, but to date, we lack systematic methods to obtain clinical experience data for internal medicine residents.47
While residency curricula in internal medicine typically outlines specific rotations in various clinical areas such as general medical wards, cardiology services, and intensive care units, time spent on such rotations does not necessarily provide quantitative data on the actual clinical conditions that residents encounter, nor does it ensure consistent clinical experience between residents. It is plausible that there may be substantial variability in clinical experience between residents within the same program, and that the overall spectrum of clinical disorders seen by residents in a program may or may not be consistent with a desired optimum, though this is yet to be defined.
If residency education in internal medicine is to progressively incorporate more experiential learning, detailed knowledge of the clinical conditions seen by residents should be useful, not only for overall curriculum design, but this might also allow for various educational interventions to be made when there are variations in clinical experience between residents. Our program has been interested in the application of electronic resources for the improvement of patient care, such as through the handoff process and the use of personal digital assistants.8 We previously did a small analysis of clinical conditions seen by residents through non‐International Classification of Diseases, Ninth Revision (ICD‐9)‐based data they entered onto personal digital assistants. This suggested to us that electronic resources used by residents might serve as a venue by which they could enter diagnostic information which we could use to generate a more detailed analysis of the clinical conditions that they see. Here we describe a method by which we have attempted to quantify resident clinical experience in internal medicine using a modification of an electronic handoff system.
METHODS
The study was conducted within the Internal Medicine Residency Program at the Long Island Jewish Medical Center in New Hyde Park, New York, part of the North ShoreLong Island Jewish Health System, and was approved by the Institutional Review Board. This work was carried out as part of our participation in the Educational Innovation Project of the Residency Review Committee for Internal Medicine. A central objective of our proposal was to develop a method to assess residents' clinical experience on an individual and an aggregate basis. A group of faculty and residents in our residency program developed an electronic handoff tool which residents use for rapid access to key clinical data for their patients and for the handoff of clinical information for on call coverage. This handoff tool was developed with the technical assistance of MedTech Notes LLC which owns Patient Data Transfer System (PDTS) HandOff Note. We modified the handoff tool to include a section in which residents were required to enter a primary diagnosis for each of their patients (a hard stop design). We chose to use the ICD‐9 system for standardization and created two methods to select the code: 1) an organ system‐based dropdown list containing frequently used codes and 2) a search box allowing for searching of the complete ICD‐9 database. For the organ‐based dropdown list, selection of that organ system would reveal a brief list of frequently used codes to make it easier for residents to find them. Prior to using the handoff tool with the ICD‐9based primary diagnosis coding system, training sessions with the residents were conducted by 3 of the investigators along with 3 chief medical residents. These sessions included training not only in technical aspects of how to find diagnosis codes, but also how to make decisions regarding what the primary diagnosis should be. We also instructed our postgraduate year (PGY)‐1s to update their diagnostic selections during the course of the hospital stay.
Each data point represents a resident caring for a patient with a specific diagnostic entity, and is counted once for that resident's period of taking care of that patient. Thirty‐three PGY‐1s were studied and, on the internal medicine service, they were supervised by either hospitalist faculty or voluntary faculty in comparable proportions. If the patient's care is taken over by another resident, that second resident was also recorded as having had a diagnostic encounter with that patient, hence 1 patient could provide experience with the same diagnostic entity for 1 or more residents. Using this method, the denominator is not patients seen, but residentpatient diagnostic encounters that have taken place. The ICD‐9 diagnostic conditions entered by the residents were grouped using the ICD‐9 system. Individual diagnostic profiles for each resident, as well as an aggregate profile for all residents to reflect the residency program as a whole, were generated. We also carried out an analysis of the ICD‐9 codes entered by 6 consecutive PGY‐1s to assess how the diagnostic spectrum might vary among a small sampling of PGY‐1s. In order to evaluate the accuracy of the residents' diagnostic selections, we carried out a validation assessment using a tool used by the residents' supervising hospitalists (who were the attendings of record for those patients). This was carried out on a subset of patients and could be done at any time during the hospital stay. The hospitalists were asked to review their residents' ICD‐9 codes and indicate whether they agreed or disagreed.
RESULTS
A total of 7562 residentpatient diagnostic encounters were studied from July 1, 2007 through June 1, 2008. Mean patient age was 66 19.4 years. The age distribution is given in Table 1 and reveals that 65% of diagnostic encounters were with patients age 60 years or greater. Twelve housestaff teams were studied, each consisting of 2 PGY‐1s and a supervising PGY‐2 or PGY‐3 resident. All ICD‐9 codes were selected by categorical and preliminary internal medicine PGY‐1s on medical ward and intensive care unit rotations. Residents from other departments doing rotations on the medical service were excluded. A validation assessment of 341 patients indicated 83.3% agreement by the supervising hospitalist with the primary ICD‐9 code selected. ICD‐9 codes were then grouped and categorized using ICD‐9 nomenclature with the distribution provided in Table 2. A wide spectrum of clinical conditions is apparent including symptoms and ill‐defined conditions, circulatory disorders, respiratory disorders, neoplasms, genitourinary disorders, digestive disorders, diseases of the blood/blood forming organs, endocrinologic/nutritional/metabolic/emmmune disorders, and disorders of the skin and subcutaneous tissue, overall accounting for about 86% of resident clinical experience.
| Age Category | No. | Percent of Total |
|---|---|---|
| 1829 | 441 | 5.83 |
| 3039 | 455 | 6.02 |
| 4049 | 705 | 9.32 |
| 5059 | 1,010 | 13.36 |
| 6069 | 1,218 | 16.11 |
| 7079 | 1,465 | 19.37 |
| 8089 | 1,673 | 22.12 |
| 90110 | 595 | 7.87 |
| ICD‐9 Category Description | Frequency | Percent |
|---|---|---|
| ||
| Symptoms/Ill‐Defined Conditions | 1,475 | 19.51 |
| Circulatory System | 1,381 | 18.26 |
| Respiratory System | 939 | 12.42 |
| Neoplasms | 572 | 7.56 |
| Genitourinary System | 502 | 6.64 |
| Digestive System | 464 | 6.14 |
| Blood/Blood‐Forming Organs | 444 | 5.87 |
| Endo/Nutritional/Metabolic/Immunity | 393 | 5.20 |
| Skin and Subcutaneous Tissue | 380 | 5.03 |
| Injury and Poisoning | 222 | 2.94 |
| Musculoskeletal/Connective Tissue | 199 | 2.63 |
| Infectious/Parasitic | 194 | 2.57 |
| Mental Disorders | 166 | 2.20 |
| Nervous System/Sense Organs | 125 | 1.65 |
| Health Status/Contact with Health Services | 81 | 1.07 |
| Pregnancy/Childbirth/Puerperium | 14 | 0.19 |
We also examined the most common diagnostic conditions within each of these categories. The 3 most common ICD‐9 codes entered by residents within each category are provided in Table 3. Symptoms and ill‐defined conditions represent a sizable portion of resident clinical experience (19.51%). Within this category, the most common conditions were fever; abdominal pain (unspecified site); and chest pain, unspecified. Disorders of the circulatory and respiratory systems were the next most common categories of conditions seen by residents, comprising 18.26% and 12.42%, respectively, of resident clinical experience. Within the category of circulatory disorders, congestive heart failure and acute myocardial infarction were the most common conditions seen; for respiratory disorders, pneumonia, chronic airway obstruction, and asthma were most commonly encountered. In aggregate, symptoms and ill‐defined conditions, and disorders of the circulatory and respiratory systems accounted for 50% of resident clinical experience.
| ICD‐9 Category Description | ICD‐9 Code | Code Description | Frequency | Percent |
|---|---|---|---|---|
| ||||
| Symptoms/Ill‐Defined Conditions | 780.6 | Fever | 190 | 2.51 |
| 789 | Abdominal pain; unspecified site | 149 | 1.97 | |
| 786.5 | Chest pain, unspecified | 140 | 1.85 | |
| Circulatory System | 428 | Congestive heart failure, unspecified | 346 | 4.58 |
| 410.9 | Acute myocardial infarction; unspecified site; unspecified episode of care | 135 | 1.79 | |
| 410.1 | Acute myocardial infarction; other anterior wall; unspecified episode of care | 106 | 1.40 | |
| Respiratory System | 486 | Pneumonia, organism unspecified | 363 | 4.80 |
| 496 | Chronic airway obstruction, not elsewhere classified | 162 | 2.14 | |
| 493.9 | Asthma, unspecified; unspecified | 96 | 1.27 | |
| Neoplasms | 199.1 | Malignant neoplasm without specification of site; other | 86 | 1.14 |
| 162.9 | Malignant neoplasm; bronchus lung; unspecified | 73 | 0.97 | |
| 202.8 | Other lymphomas; unspecified site, extranodal and solid organ sites | 71 | 0.94 | |
| Genitourinary System | 599 | Urinary tract infection, site not specified | 247 | 3.27 |
| 584.9 | Acute renal failure, unspecified | 91 | 1.20 | |
| 585.6 | End stage renal disease | 40 | 0.53 | |
| Digestive System | 578.9 | Hemorrhage of gastrointestinal tract, unspecified | 119 | 1.57 |
| 558.9 | Other and unspecified noninfectious gastroenteritis and colitis | 69 | 0.91 | |
| 577 | Acute pancreatitis | 36 | 0.48 | |
| Blood/Blood‐Forming Organs | 285.9 | Anemia, unspecified | 127 | 1.68 |
| 282.64 | Sickle‐cell/Hb‐C disease with crisis | 80 | 1.06 | |
| 282.6 | Sickle‐cell disease, unspecified | 73 | 0.97 | |
| Endo/Nutritional/Metabolic/Immunity | 276.1 | Hypoosmolality and/or hyponatremia | 57 | 0.75 |
| 251.2 | Hypoglycemia, unspecified | 56 | 0.74 | |
| 250.1 | Diabetes with ketoacidosis; type II, not stated as uncontrolled | 50 | 0.66 | |
| Skin and Subcutaneous Tissue | 682.9 | Other cellulitis and abscess; unspecified site | 256 | 3.39 |
| 682.5 | Other cellulitis and abscess; buttock | 37 | 0.49 | |
| 686.9 | Unspecified local infection of skin and subcutaneous tissue | 23 | 0.30 | |
| Injury and Poisoning | 848.9 | Unspecified site of sprain and strain | 32 | 0.42 |
| 977.9 | Poisoning by unspecified drug or medicinal substance | 32 | 0.42 | |
| 829 | Fracture; unspecified bone, closed | 22 | 0.29 | |
| Musculoskeletal/Connective Tissue | 730.2 | Unspecified osteomyelitis; site unspecified | 33 | 0.44 |
| 710 | Systemic lupus erythematosus | 25 | 0.33 | |
| 728.87 | Muscle weakness (generalized) | 19 | 0.25 | |
| Infectious/Parasitic | 38.9 | Unspecified septicemia | 58 | 0.77 |
| 8.45 | Intestinal infection/clostridium difficile | 54 | 0.71 | |
| 9.1 | Colitis, enteritis, and gastroenteritis of presumed infectious organ | 15 | 0.20 | |
| Mental Disorders | 291.81 | Alcohol withdrawal | 43 | 0.57 |
| 307.9 | Other and unspecified special symptoms or syndromes, not elsewhere classified | 35 | 0.46 | |
| 294.8 | Other persistent mental disorders due to conditions classified elsewhere | 20 | 0.26 | |
| Nervous System/Sense Organs | 322.9 | Meningitis, unspecified | 30 | 0.40 |
| 331 | Alzheimer's disease | 14 | 0.19 | |
| 340 | Multiple sclerosis | 6 | 0.08 | |
| Health Status/Contact with Health Services | 885.9 | Accidental fall from other slipping tripping or stumbling | 18 | 0.24 |
| 884.4 | Accidental fall from bed | 7 | 0.09 | |
| V13.02 | Personal history of urinary (tract) infection | 4 | 0.05 | |
| Pregnancy/Childbirth/Puerperium | 673.8 | Other pulmonary embolism; unspecified episode of care | 9 | 0.12 |
| 665 | Rupture of uterus before onset of labor; unspecified episode of care | 1 | 0.01 | |
| 665.7 | Pelvic hematoma, unspecified episode of care | 1 | 0.01 | |
Individual resident clinical experience varied as well. As shown in Table 4, for a group of 6 PGY‐1s, there was substantial variability in the ICD‐9 diagnostic categories. For example, the percentages of codes falling into the cardiovascular disease category ranged from 15.27% to 27.91%, and for respiratory disease ranged from 8.22% to 18.55%. These data suggest that there may be sizable differences in the proportions of various clinical conditions seen by residents over a year of training.
| ICD‐9 Category Description | Mean | SD | Min | Max |
|---|---|---|---|---|
| ||||
| Symptoms/Ill‐Defined Conditions | 21.43 | 5.07 | 15.50 | 29.90 |
| Circulatory System | 21.84 | 4.38 | 15.27 | 27.91 |
| Respiratory System | 12.43 | 3.83 | 8.22 | 18.55 |
| Neoplasms | 8.47 | 2.64 | 4.12 | 11.80 |
| Genitourinary System | 5.26 | 1.09 | 4.03 | 6.98 |
| Digestive System | 4.53 | 0.96 | 3.09 | 5.65 |
| Blood/Blood‐Forming Organs | 4.64 | 2.73 | 3.05 | 10.05 |
| Endo/Nutritional/Metabolic/Immunity | 5.64 | 1.68 | 3.11 | 7.22 |
| Skin and Subcutaneous Tissue | 4.28 | 1.63 | 2.42 | 6.19 |
| Injury and Poisoning | 3.90 | 1.01 | 3.09 | 5.43 |
| Musculoskeletal/Connective Tissue | 2.86 | 1.36 | 1.55 | 4.58 |
| Infectious/Parasitic | 3.86 | 2.62 | 2.42 | 8.53 |
| Mental Disorders | 1.47 | 0.62 | 0.81 | 2.28 |
| Nervous System/Sense Organs | 1.49 | 0.87 | 0.62 | 3.09 |
DISCUSSION
Years ago, residency training transitioned from a predominantly bedside experience to a curriculum with a large didactic, non‐bedside component, following parameters defined by organizations such as the Accreditation Council for Graduate Medical Education. Residency training is undergoing substantial change to become competency‐based and to organize learning around patient care experiences.2, 3, 9 The Educational Innovation Project of the Residency Review Committee for Internal Medicine is one such endeavor to help develop new methods by which to accomplish this.1 Effective incorporation of innovative experiential learning methods, based on the core competencies, will require a detailed knowledge of resident clinical experience during the course of their training, yet such data have been sparse in internal medicine. Sequist et al. analyzed data from an electronic medical record to assess resident clinical experience in the outpatient setting.4 Bachur and Nagler have used an electronic patient tracking system to assess the clinical experience of pediatric emergency medicine fellows.5, 6 Most attempts to describe resident clinical experience have relied upon extracting diagnostic information from medical records, case logs, etc, though in another approach, Rohrbaugh et al. reviewed psychiatric resident prescription profiles,7 which might provide some indirect data on clinical experience if applied to internal medicine.
In this study, we attempted to quantify resident clinical experience using resident‐selected ICD‐9 codes, in contrast to other methods that have relied upon medical record review and other resident‐independent approaches. There are various strengths and limitations to this approach. Using the ICD‐9 system provides a number of strengths, a major one being standardization, allowing comparisons between different programs and perhaps even facilitating the development of guidelines for resident clinical experience. In addition, this approach using the ICD‐9 system could be readily implemented at any institution and does not require any specific technology. While we chose to do this through our handoff system, an institution could use any of a variety of other systems to accomplish this. For example, resident‐entered ICD‐9 coding systems could be incorporated into electronic discharge summaries, history and physicals, or progress notes. There may also be some practical benefits to having residents learn how to use the ICD‐9 system at this stage of their careers.
There are limitations to this approach as well. The ICD‐9 system was not intended to be used for medical education purposes. There are features of it that can make finding the best diagnosis difficult, and routes to it may at times seem counterintuitive. While we did not carry out resident surveys, a number of residents anecdotally mentioned that it took time to become comfortable using the system, and it could be challenging at times to find a diagnosis description that best fit what they were looking for. To make diagnosis selection easier, we created an organ system‐based dropdown list in the handoff tool so that when residents select an organ system, another list opens up containing commonly used ICD‐9 codes. This grouping is based on organ system alone and does not necessarily follow the ICD‐9 grouping (in contrast, our reported data in this article are all based on ICD‐9 grouping). A search tool to allow searching the entire ICD‐9 database was also made available on the handoff tool. Other factors that could limit diagnosis code accuracy could be lack of clinical knowledge, and error as a result of pressure to come up with a diagnosis because of the hard stop design of our system, in which residents were required to enter a primary diagnosis, potentially causing alert fatigue. A validation assessment that we carried out revealed fairly good agreement with the specific ICD‐9 codes chosen by the resident, but greater accuracy would be desirable. Further education on diagnosis selection and refinements to the handoff tool should help facilitate this. We are currently addressing this by ongoing education on diagnosis selection and by having the hospitalists share the handoff tool with the residents, allowing them to provide direct feedback on diagnostic selections.
More than 19% of the diagnoses selected by residents fell into the category of symptoms and ill‐defined conditions. This raises a number of potential educational issues. One of those is that if residents do, in fact, encounter such entities at such a high frequency, then the internal medicine curriculum must be structured in such a way as to complement this clinical experience with a comprehensive learning program. However, we must also consider the possibility that, in many such instances, a more definitive diagnosis became evident by the time of discharge and this may not have been reflected in the ICD‐9 code that the resident chose. Hence, the category of symptoms and ill‐defined conditions may actually be somewhat smaller than our findings would suggest.
Many issues will need to be addressed as programs obtain more data on their residents' clinical experience. While there may be many reasons to use the ICD‐9 system for selecting diagnoses including those listed above, the system by which ICD‐9 groups diagnoses might not provide ideal educational information, again as the ICD‐9 system was not designed for this purpose. While in this article we have reported the residents' diagnostic encounters grouped according to the ICD‐9 grouping system to provide an initial standardized description, grouping according to another diagnostic system that is felt to be more educationally meaningful may be preferred.
While one might assume that a higher frequency of exposure to certain clinical conditions should enhance competency, that relationship may not be straightforward in internal medicine. For surgical procedures, there are, in fact, data to show improved outcomes for surgeons with higher operative volumes for those procedures,10 but in internal medicine, we do not have data to demonstrate that competence of a resident caring for a particular condition is enhanced by experience alone. Therefore, as programs obtain more data on clinical experience, it will be important that the focus be kept on quality as opposed to quantity.
Obtaining data on resident clinical experience might greatly facilitate experiential learning approaches. For example, as residents go through training and encounter specific diagnostic conditions, those experiences could be supplemented by various learning innovations to make those experiences more meaningful and, hopefully, more likely to result in the development of competence, though that will require measurement. In our program, for example, we have incorporated an approach using illness scenarios, in that when residents have had a certain level of clinical experience with a given clinical condition, they are assembled in small groups and competency‐based case discussions are carried out with a preceptor. In addition, for those instances in which an individual resident may lack direct clinical experience in a certain area, this might be addressed by interventions to increase their contact with those conditions and/or targeted learning interventions to help develop competence. A resident found to be lacking in clinical experience in a certain area could be assigned to the care of more patients with that condition, or to spending more time in a venue in which that condition is more likely to be encountered. Various learning activities including didactics, case discussions, simulation, self‐directed learning, and others could also be used to compensate for such variability. Furthermore, if a residency program's aggregate clinical experience is divergent from some desirable standard yet to be determined, a detailed knowledge of this could help guide that program's curriculum revision. For example, for residents in a program in which there is relatively low exposure to patients with oncological issues, this could be compensated for by external rotations to achieve more clinical experience in oncology, as well as supplementation of the curriculum with additional learning activities in oncology, which could include small group discussions, self‐directed learning activities, case discussions, and others. While at present there are no defined standards for clinical experience and it remains to be seen if there would be a correlation with development of competence, no such standard would serve a purpose if programs did not have reliable and practical means of clinical experience assessment.
In summary, resident‐selected ICD‐9 codes may be a useful means to obtain data regarding resident clinical experience in internal medicine. Such data may be useful to residency training programs in developing new curricula based on experiential learning.
- ,,.Internal medicine's Educational Innovations Project: improving health care and learning.Am J Med.2009;122:398–404.
- ,,,,.Redesigning residency education in internal medicine: a position paper from the Association of Program Directors in Internal Medicine.Ann Intern Med.2006;144:920–926.
- ,,for the Education Committee of the American College of Physicians.Redesigning training for internal medicine.Ann Intern Med.2006;144:927–932.
- ,,,,.Use of an electronic medical record to profile the continuity clinic experiences of primary care residents.Acad Med.2005;80:390–394.
- ,,.An automated electronic case log: using electronic information systems to assess training in emergency medicine.Acad Emerg Med.2006;13:733–739.
- ,.Use of an automated electronic case log to assess fellowship training: tracking the pediatric emergency medicine experience.Pediatr Emerg Care.2008;24:75–82.
- ,,,.Utilizing VA information technology to develop psychiatric resident prescription profiles.Acad Psychiatry.2009;33:27–30.
- ,,, et al.Personal digital assistants (PDAs): a review of their application in graduate medical education.Am J Med Qual.2005;20:262–267.
- ,,, et al.Redesigning residency training in internal medicine: the consensus report of the Alliance for Academic Internal Medicine Education Redesign Task Force.Acad Med.2007;82:1211–1219.
- ,,,,,.Surgeon volume and operative mortality in the United States.N Engl J Med.2003;349:2117–2127.
Copyright © 2011 Society of Hospital Medicine
Severe Sepsis
Severe sepsis and septic shock are associated with excess mortality when inappropriate initial antimicrobial therapy, defined as an antimicrobial regimen that lacks in vitro activity against the isolated organism(s) responsible for the infection, is administered.14 Unfortunately, bacterial resistance to antibiotics is increasing and creates a therapeutic challenge for clinicians when treating patients with serious infections, such as severe sepsis. Increasing rates of bacterial resistance leads many clinicians to empirically treat critically ill patients with broad‐spectrum antibiotics, which can perpetuate the cycle of increasing resistance.5, 6 Conversely, inappropriate initial antimicrobial therapy can lead to treatment failures and adverse patient outcomes.7 Individuals with severe sepsis appear to be at particularly high risk of excess mortality when inappropriate initial antimicrobial therapy is administered.8, 9
The most recent Surviving Sepsis Guidelines recommend empiric combination therapy targeting Gram‐negative bacteria, particularly for patients with known or suspected Pseudomonas infections, as a means to decrease the likelihood of administering inappropriate initial antimicrobial therapy.10 However, the selection of an antimicrobial regimen that is active against the causative pathogen(s) is problematic, as the treating physician usually does not know the susceptibilities of the pathogen(s) for the selected empiric antibiotics. Therefore, we performed a study with the main goal of determining whether resistance to the initially prescribed antimicrobial regimen was associated with clinical outcome in patients with severe sepsis attributed to Gram‐negative bacteremia.
Materials and Methods
Study Location and Patients
This study was conducted at a university‐affiliated, urban teaching hospital: Barnes‐Jewish Hospital (1200 beds). During a 6‐year period (January 2002 to December 2007), all hospitalized patients with a positive blood culture for Gram‐negative bacteria, with antimicrobial susceptibility testing performed for the blood isolate(s), were eligible for this investigation. This study was approved by the Washington University School of Medicine Human Studies Committee.
Study Design and Data Collection
A retrospective cohort study design was employed. Two investigators (J.A.D., R.M.R.) identified potential study patients by the presence of a positive blood culture for Pseudomonas aeruginosa, Acinetobacter species, or Enterobacteriaceae (Escherichia coli, Klebsiella species, Enterobacter species) combined with primary or secondary International Classification of Diseases (ICD‐9‐CM) codes indicative of acute organ dysfunction, at least two criteria from the systemic inflammatory response syndrome (SIRS),10 and initial antibiotic treatment with either cefepime, piperacillin‐tazobactam, or a carbapenem (imipenem or meropenem). These antimicrobials represent the primary agents employed for the treatment of Gram‐negative infections at Barnes‐Jewish Hospital during the study period, and had to be administered within 12 hours of having the subsequently positive blood cultures drawn. Based on the initial study database construction, 3 investigators (E.C.W., J.K., M.P.) merged patient‐specific data from the automated hospital medical records, microbiology database, and pharmacy database of Barnes‐Jewish Hospital to complete the clinical database under the auspices of the definitions described below.
The baseline characteristics collected by the study investigators included: age, gender, race, the presence of congestive heart failure, chronic obstructive pulmonary disease, diabetes mellitus, chronic liver disease, underlying malignancy, and end‐stage renal disease requiring renal replacement therapy. All cause hospital mortality was evaluated as the primary outcome variable. Secondary outcomes included acquired organ dysfunction and hospital length of stay. The Acute Physiology and Chronic Health Evaluation (APACHE) II11 and Charlson co‐morbidity scores were also calculated during the 24 hours after the positive blood cultures were drawn. This was done because we included patients with community‐acquired infections who only had clinical data available after blood cultures were drawn.
Definitions
All definitions were selected prospectively as part of the original study design. Cases of Gram‐negative bacteremia were classified into mutually exclusive groups comprised of either community‐acquired or healthcare‐associated infection. Patients with healthcare‐associated bacteremia were categorized as community‐onset or hospital‐onset, as previously described.12 In brief, patients with healthcare‐associated community‐onset bacteremia had the positive culture obtained within the first 48 hours of hospital admission in combination with one or more of the following risk factors: (1) residence in a nursing home, rehabilitation hospital, or other long‐term nursing facility; (2) previous hospitalization within the immediately preceding 12 months; (3) receiving outpatient hemodialysis, peritoneal dialysis, wound care, or infusion therapy necessitating regular visits to a hospital‐based clinic; and (4) having an immune‐compromised state. Patients were classified as having healthcare‐associated hospital‐onset bacteremia when the culture was obtained 48 hours or more after admission. Community‐acquired bacteremia occurred in patients without healthcare risk factors and a positive blood culture within the first 48 hours of admission. Prior antibiotic exposure was defined as having occurred within the previous 30 days from the onset of severe sepsis.
To be included in the analysis, patients had to meet criteria for severe sepsis based on discharge ICD‐9‐CM codes for acute organ dysfunction, as previously described.13 The organs of interest included the heart, lungs, kidneys, bone marrow (hematologic), brain, and liver. Patients were classified as having septic shock if vasopressors (norepinephrine, dopamine, epinephrine, phenylephrine, or vasopressin) were initiated within 24 hours of the blood culture collection date and time. Empiric antimicrobial treatment was classified as being appropriate if the initially prescribed antibiotic regimen was active against the identified pathogen(s) based on in vitro susceptibility testing and administered within 12 hours following blood culture collection. Appropriate antimicrobial treatment also had to be prescribed for at least 24 hours. However, the total duration of antimicrobial therapy was at the discretion of the treating physicians. The Charlson co‐morbidity score was calculated using ICD‐9‐CM codes abstracted from the index hospitalization employing MS‐DRG Grouper version 26.
Antimicrobial Monitoring
From January 2002 through the present, Barnes‐Jewish Hospital utilized an antibiotic control program to help guide antimicrobial therapy. During this time, the use of cefepime and gentamicin was unrestricted. However, initiation of intravenous ciprofloxacin, imipenem/cilastatin, meropenem, or piperacillin/tazobactam was restricted and required preauthorization from either a clinical pharmacist or infectious diseases physician. Each intensive care unit (ICU) had a clinical pharmacist who reviewed all antibiotic orders to insure that dosing and interval of antibiotic administration was adequate for individual patients based on body size, renal function, and the resuscitation status of the patient. After daytime hours, the on‐call clinical pharmacist reviewed and approved the antibiotic orders. The initial antibiotic dosages for the antibiotics employed for the treatment of Gram‐negative infections at Barnes‐Jewish Hospital were as follows: cefepime, 1 to 2 grams every eight hours; pipercillin‐tazobactam, 4.5 grams every six hours; imipenem, 0.5 grams every six hours; meropenem, 1 gram every eight hours; ciprofloxacin, 400 mg every eight hours; gentamicin, 5 mg/kg once daily.
Starting in June 2005, a sepsis order set was implemented in the emergency department, general medical wards, and the intensive care units with the intent of standardizing empiric antibiotic selection for patients with sepsis based on the infection type (ie, community‐acquired pneumonia, healthcare‐associated pneumonia, intra‐abdominal infection, etc) and the hospital's antibiogram.14, 15 However, antimicrobial selection, dosing, and de‐escalation of therapy were still optimized by clinical pharmacists in these clinical areas.
Antimicrobial Susceptibility Testing
The microbiology laboratory performed antimicrobial susceptibility testing of the Gram‐negative blood isolates using the disk diffusion method according to guidelines and breakpoints established by the Clinical Laboratory and Standards Institute (CLSI) and published during the inclusive years of the study.16, 17 Zone diameters obtained by disk diffusion testing were converted to minimum inhibitory concentrations (MICs in mg/L) by linear regression analysis for each antimicrobial agent using the BIOMIC V3 antimicrobial susceptibility system (Giles Scientific, Inc., Santa Barbara, CA). Linear regression algorithms contained in the software of this system were determined by comparative studies correlating microbroth dilution‐determined MIC values with zone sizes obtained by disk diffusion testing.18
Data Analysis
Continuous variables were reported as mean the standard deviation, or median and quartiles. The Student's t test was used when comparing normally distributed data, and the MannWhitney U test was employed to analyze nonnormally distributed data. Categorical data were expressed as frequency distributions and the Chi‐squared test was used to determine if differences existed between groups. We performed multiple logistic regression analysis to identify clinical risk factors that were associated with hospital mortality (SPSS, Inc., Chicago, IL). All risk factors from Table 1, as well as the individual pathogens examined, were included in the corresponding multivariable analysis with the exception of acquired organ dysfunction (considered a secondary outcome). All tests were two‐tailed, and a P value <0.05 was determined to represent statistical significance.
| Variable | Hospital Survivors (n = 302) | Hospital Nonsurvivors (n = 233) | P value |
|---|---|---|---|
| |||
| Age, years | 57.9 16.2 | 60.3 15.8 | 0.091 |
| Male | 156 (51.7) | 132 (56.7) | 0.250 |
| Infection onset source | |||
| Community‐acquired | 31 (10.3) | 15 (6.4) | 0.005 |
| Healthcare‐associated community‐onset | 119 (39.4) | 68 (29.2) | |
| Healthcare‐associated hospital‐onset | 152 (50.3) | 150 (64.4) | |
| Underlying co‐morbidities | |||
| CHF | 43 (14.2) | 53 (22.7) | 0.011 |
| COPD | 42 (13.9) | 56 (24.0) | 0.003 |
| Chronic kidney disease | 31 (10.3) | 41 (17.6) | 0.014 |
| Liver disease | 34 (11.3) | 31 (13.3) | 0.473 |
| Active malignancy | 100 (33.1) | 83 (35.6) | 0.544 |
| Diabetes | 68 (22.5) | 50 (21.5) | 0.770 |
| Charlson co‐morbidity score | 4.5 3.5 | 5.2 3.9 | 0.041 |
| APACHE II score | 21.8 6.1 | 27.1 6.2 | <0.001 |
| ICU admission | 221 (73.2) | 216 (92.7) | <0.001 |
| Vasopressors | 137 (45.4) | 197 (84.5) | <0.001 |
| Mechanical ventilation | 124 (41.1) | 183 (78.5) | <0.001 |
| Drotrecogin alfa (activated) | 6 (2.0) | 21 (9.0) | <0.001 |
| Dysfunctional acquired organ systems | |||
| Cardiovascular | 149 (49.3) | 204 (87.6) | <0.001 |
| Respiratory | 141 (46.7) | 202 (86.7) | <0.001 |
| Renal | 145 (48.0) | 136 (58.4) | 0.017 |
| Hepatic | 13 (4.3) | 27 (11.6) | 0.001 |
| Hematologic | 103 (34.1) | 63 (27.0) | 0.080 |
| Neurologic | 11 (3.6) | 19 (8.2) | 0.024 |
| 2 Dysfunctional acquired organ systems | 164 (54.3) | 213 (91.4) | <0.001 |
| Source of bloodstream infection | |||
| Lungs | 95 (31.5) | 127 (54.5) | <0.001 |
| Urinary tract | 92 (30.5) | 45 (19.3) | |
| Central venous catheter | 30 (9.9) | 16 (6.9) | |
| Intra‐abdominal | 63 (20.9) | 33 (14.2) | |
| Unknown | 22 (7.3) | 12 (5.2) | |
| Prior antibiotics* | 103 (34.1) | 110 (47.2) | 0.002 |
Results
Patient Characteristics
Included in the study were 535 consecutive patients with severe sepsis attributed to Pseudomonas aeruginosa, Acinetobacter species, or Enterobacteriaceae bacteremia, of whom 233 (43.6%) died during their hospitalization. The mean age was 58.9 16.0 years (range, 18 to 96 years) with 288 (53.8%) males and 247 (46.2%) females. The infection sources included community‐acquired (n = 46, 8.6%), healthcare‐associated community‐onset (n = 187, 35.0%), and healthcare‐associated hospital‐onset (n = 302, 56.4%). Hospital nonsurvivors were statistically more likely to have a healthcare‐associated hospital‐onset infection, congestive heart failure, chronic obstructive pulmonary disease, chronic kidney disease, ICU admission, need for mechanical ventilation and/or vasopressors, administration of drotrecogin alfa (activated), prior antibiotic administration, the lungs as the source of infection, acquired dysfunction of the cardiovascular, respiratory, renal, hepatic, and neurologic organ systems, and greater APACHE II and Charlson co‐morbidity scores compared to hospital survivors (Table 1). Hospital nonsurvivors were also statistically less likely to have a healthcare‐associated community‐onset infection and a urinary source of infection compared to hospital survivors (Table 1).
Microbiology
Among the 547 Gram‐negative bacteria isolated from blood, the most common were Enterobacteriaceae (Escherichia coli, Klebsiella species, Enterobacter species) (70.2%) followed by Pseudomonas aeruginosa (20.8%) and Acinetobacter species (9.0%) (Table 2). Nine patients had two different Enterobacteriaceae species isolated from their blood cultures, and three patients had an Enterobacteriaceae species and Pseudomonas aeruginosa isolated from their blood cultures. Hospital nonsurvivors were statistically more likely to be infected with Pseudomonas aeruginosa and less likely to be infected with Enterobacteriaceae. The pathogen‐specific hospital mortality rate was significantly greater for Pseudomonas aeruginosa and Acinetobacter species compared to Enterobacteriaceae (P < 0.001 and P = 0.008, respectively).
| Bacteria | Hospital Survivors (n = 302) | Hospital Nonsurvivors (n = 233) | P value* | Percent Resistant | Pathogen‐ Specific Mortality Rate |
|---|---|---|---|---|---|
| |||||
| Enterobacteriaceae | 241 (79.8) | 143 (61.4) | <0.001 | 9.1 | 37.2 |
| Pseudomonas aeruginosa | 47 (15.6) | 67 (28.8) | <0.001 | 16.7 | 58.8 |
| Acinetobacter species | 22 (7.3) | 27 (11.6) | 0.087 | 71.4 | 55.1 |
Antimicrobial Treatment and Resistance
Among the study patients, 358 (66.9%) received cefepime, 102 (19.1%) received piperacillin‐tazobactam, and 75 (14.0%) received a carbapenem (meropenem or imipenem) as their initial antibiotic treatment. There were 169 (31.6%) patients who received initial combination therapy with either an aminoglycoside (n = 99, 58.6%) or ciprofloxacin (n = 70, 41.4%). Eighty‐two (15.3%) patients were infected with a pathogen that was resistant to the initial antibiotic treatment regimen [cefepime (n = 41; 50.0%), piperacillin‐tazobactam (n = 25; 30.5%), or imipenem/meropenem (n = 16; 19.5%), plus either an aminoglycoside or ciprofloxacin (n = 28; 34.1%)], and were classified as receiving inappropriate initial antibiotic therapy. Among the 453 (84.7%) patients infected with a pathogen that was susceptible to the initial antibiotic regimen, there was no relationship identified between minimum inhibitory concentration values and hospital mortality.
Patients infected with a pathogen resistant to the initial antibiotic regimen had significantly greater risk of hospital mortality (63.4% vs 40.0%; P < 0.001) (Figure 1). For the 82 individuals infected with a pathogen that was resistant to the initial antibiotic regimen, no difference in hospital mortality was observed among those prescribed initial combination treatment with an aminoglycoside (n = 17) (64.7% vs 61.1%; P = 0.790) or ciprofloxacin (n = 11) (72.7% vs 61.1%; P = 0.733) compared to monotherapy (n = 54). Similarly, among the patients infected with a pathogen that was susceptible to the initial antibiotic regimen, there was no difference in hospital mortality among those whose bloodstream isolate was only susceptible to the prescribed aminoglycoside (n = 12) compared to patients with isolates that were susceptible to the prescribed beta‐lactam antibiotic (n = 441) (41.7% vs 39.9%; P = 0.902).
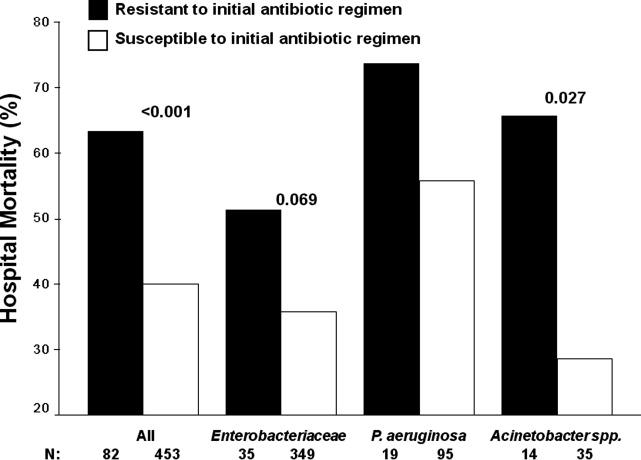
Logistic regression analysis identified infection with a pathogen resistant to the initial antibiotic regimen [adjusted odds ratio (AOR), 2.28; 95% confidence interval (CI), 1.69‐3.08; P = 0.006], increasing APACHE II scores (1‐point increments) (AOR, 1.13; 95% CI, 1.10‐1.15; P < 0.001), the need for vasopressors (AOR, 2.57; 95% CI, 2.15‐3.53; P < 0.001), the need for mechanical ventilation (AOR, 2.54; 95% CI, 2.19‐3.47; P < 0.001), healthcare‐associated hospital‐onset infection (AOR, 1.67; 95% CI, 1.32‐2.10; P =0.027), and infection with Pseudomonas aeruginosa (AOR, 2.21; 95% CI, 1.74‐2.86; P =0.002) as independent risk factors for hospital mortality (Hosmer‐Lemeshow goodness‐of‐fit test = 0.305). The model explained between 29.7% (Cox and Snell R square) and 39.8% (Nagelkerke R squared) of the variance in hospital mortality, and correctly classified 75.3% of cases.
Secondary Outcomes
Two or more acquired organ system derangements occurred significantly more often among patients with a pathogen resistant to the initial antibiotic regimen compared to those infected with susceptible isolates (84.1% vs 68.0%; P = 0.003). Hospital length of stay was significantly longer for patients infected with a pathogen resistant to the initial antibiotic regimen compared to those infected with susceptible isolates [39.9 50.6 days (median 27 days; quartiles 12 days and 45.5 days) vs 21.6 22.0 days (median 15 days; quartiles 7 days and 30 days); P < 0.001].
Discussion
Our study demonstrated that hospital nonsurvivors with severe sepsis attributed to Gram‐negative bacteremia had significantly greater rates of resistance to their initially prescribed antibiotic regimen compared to hospital survivors. This observation was confirmed in a multivariate analysis controlling for severity of illness and other potential confounding variables. Additionally, acquired organ system derangements and hospital length of stay were greater for patients infected with Gram‐negative pathogens resistant to the empiric antibiotic regimen. We also observed no survival advantage with the use of combination antimicrobial therapy for the subgroup of patients whose pathogens were resistant to the initially prescribed antibiotic regimen. Lastly, no difference in mortality was observed for patients with bacterial isolates that were susceptible only to the prescribed aminoglycoside compared to those with isolates susceptible to the prescribed beta‐lactam antibiotic.
Several previous investigators have linked antibiotic resistance and outcome in patients with serious infections attributed to Gram‐negative bacteria. Tam et al. examined 34 patients with Pseudomonas aeruginosa bacteremia having elevated MICs to piperacillin‐tazobactam (32 g/mL) that were reported as susceptible.19 In seven of these cases, piperacillin‐tazobactam was prescribed empirically, whereas other agents directed against Gram‐negative bacteria were employed in the other patients (carbapenems, aminoglycosides). Thirty‐day mortality was significantly greater for the patients treated with piperacillin‐tazobactam (85.7% vs 22.2%; P = 0.004), and a multivariate analysis found treatment with piperacillin‐tazobactam to be independently associated with 30‐day mortality. Similarly, Bhat et al. examined 204 episodes of bacteremia caused by Gram‐negative bacteria for which patients received cefepime.20 Patients infected with a Gram‐negative bacteria having an MIC to cefepime greater than, or equal to, 8 g/mL had a significantly greater 28‐day mortality compared to patients infected with isolates having an MIC to cefepime that was less than 8 g/mL (54.8% vs 24.1%; P = 0.001).
Our findings are consistent with earlier studies of patients with serious Gram‐negative infections including bacteremia and nosocomial pneumonia. Micek et al. showed that patients with Pseudomonas aeruginosa bacteremia who received inappropriate initial antimicrobial therapy had a greater risk of hospital mortality compared to patients initially treated with an antimicrobial regimen having activity for the Pseudomonas isolate based on in vitro susceptibility testing.21 Similarly, Trouillet et al.,22 Beardsley et al.,23 and Heyland et al.24 found that combination antimicrobial regimens directed against Gram‐negative bacteria in patients with nosocomial pneumonia were more likely to be appropriate based on the antimicrobial susceptibility patterns of the organisms compared to monotherapy. In a more recent study, Micek et al. demonstrated that combination antimicrobial therapy directed against severe sepsis attributed to Gram‐negative bacteria was associated with improved outcomes compared to monotherapy, especially when the combination agent was an aminoglycoside.25 However, empiric combination therapy that included an aminoglycoside was also associated with increased nephrotoxicity which makes the empiric use of aminoglycosides in all patients with suspected Gram‐negative severe sepsis problematic.25, 26 Nevertheless, the use of combination therapy represents a potential strategy to maximize the administration of appropriate treatment for serious Gram‐negative bacterial infections.
Rapid assessment of antimicrobial susceptibility is another strategy that offers the possibility of identifying the resistance pattern of Gram‐negative pathogens quickly in order to provide more appropriate treatment. Bouza et al. found that use of a rapid E‐test on the respiratory specimens of patients with ventilator‐associated pneumonia was associated with fewer days of fever, fewer days of antibiotic administration until resolution of the episode of ventilator‐associated pneumonia, decreased antibiotic consumption, less Clostridium difficile‐associated diarrhea, lower costs of antimicrobial agents, and fewer days receiving mechanical ventilation.27 Other methods for the rapid identification of resistant bacteria include real‐time polymerase chain reaction assays based on hybridization probes to identify specific resistance mechanisms in bacteria.28 Application of such methods for identification of broad categories of resistance mechanisms in Gram‐negative bacteria offer the possibility of tailoring initial antimicrobial regimens in order to provide appropriate therapy in a more timely manner.
Our study has several important limitations that should be noted. First, the study was performed at a single center and the results may not be generalizable to other institutions. However, the findings from other investigators corroborate the importance of antimicrobial resistance as a predictor of outcome for patients with serious Gram‐negative infections.19, 20 Additionally, a similar association has been observed in patients with methicillin‐resistant Staphylococcus aureus bacteremia, supporting the more general importance of antimicrobial resistance as an outcome predictor.29 Second, the method employed for determining MICs was a literature‐based linear regression method correlating disk diffusion diameters with broth dilution MIC determinations. Therefore, the lack of correlation we observed between MIC values and outcome for susceptible Gram‐negative isolates associated with severe sepsis requires further confirmation. Third, we only examined 3 antibiotics, or antibiotic classes, so our results may not be applicable to other agents. This also applies to doripenem, as we did not have that specific carbapenem available at the time this investigation took place.
Another important limitation of our study is the relatively small number of individuals infected with a pathogen that was resistant to the initial treatment regimen, or only susceptible to the aminoglycoside when combination therapy was prescribed. This limited our ability to detect meaningful associations in these subgroups of patients, to include whether or not combination therapy influenced their clinical outcome. Finally, we did not examine the exact timing of antibiotic therapy relative to the onset of severe sepsis. Instead we used a 12‐hour window from when subsequently positive blood cultures were drawn to the administration of initial antibiotic therapy. Other investigators have shown that delays in initial appropriate therapy of more than one hour for patients with septic shock increases the risk of death.9, 30 Failure to include the exact timing of therapy could have resulted in a final multivariate model that includes prediction variables that would not otherwise have been incorporated.
In summary, we demonstrated that resistance to the initial antibiotic treatment regimen was associated with a greater risk of hospital mortality in patients with severe sepsis attributed to Gram‐negative bacteremia. These findings imply that more rapid assessment of antimicrobial susceptibility could result in improved prescription of antibiotics in order to maximize initial administration of appropriate therapy. Future studies are required to address whether rapid determination of antimicrobial susceptibility can result in more effective administration of appropriate therapy, and if this can result in improved patient outcomes.
- ,,,.Inadequate antimicrobial treatment of infections: a risk factor for hospital mortality among critically ill patients.Chest.1999;115:462–474.
- ,,, et al.The clinical evaluation committee in a large multicenter phase 3 trial of drotrecogin alfa (activated) in patients with severe sepsis (PROWESS): role, methodology, and results.Crit Care Med.2003;31:2291–2301.
- ,,,,,.Impact of adequate empical antibiotic therapy on the outcome of patients admitted to the intensive care unit with sepsis.Crit Care Med.2003;31:2742–2751.
- ,,,,,.Inappropriate initial antimicrobial therapy and its effect on survival in a clinical trial of immunomodulating therapy for severe sepsis.Am J Med.2003;115:529–535.
- ,.Antibiotic‐resistant bugs in the 21st century—a clinical super‐challenge.N Engl J Med.2009;360:439–443.
- ,,, et al.Bad bugs, no drugs: no ESKAPE! An update from the Infectious Diseases Society of America.Clin Infect Dis.2009;48:1–12.
- .Broad‐spectrum antimicrobials and the treatment of serious bacterial infections: getting it right up front.Clin Infect Dis.2008;47:S3–S13.
- ,,, et al.Bundled care for septic shock: an analysis of clinical trials.Crit Care Med.2010;38:668–678.
- ,,, et al.Effectiveness of treatments for severe sepsis: a prospective, multicenter, observational study.Am J Respir Crit Care Med.2009;180:861–866.
- ,,, et al.Surviving Sepsis Campaign: international guidelines for management of severe sepsis and septic shock: 2008.Crit Care Med.2008;36:296–327.
- ,,,.APACHE II: a severity of disease classification system.Crit Care Med.1985;13:818–829.
- ,,, et al.Invasive methicillin‐resistant Staphylococcus aureus infections in the United States.JAMA.2007;298:1763–1771.
- ,,,,,.Epidemiology of severe sepsis in the United States: analysis of incidence, outcome, and associated costs of care.Crit Care Med.2001;29:1303–1310.
- ,,,,,.Hospital‐wide impact of a standardized order set for the management of bacteremic severe sepsis.Crit Care Med.2009;37:819–824.
- ,,, et al.Before‐after study of a standardized hospital order set for the management of septic shock.Crit Care Med.2007;34:2707–2713.
- National Committee for Clinical Laboratory Standards.Performance Standards for Antimicrobial Susceptibility Testing: Twelfth Informational Supplement. M100‐S12.Wayne, PA:National Committee for Clinical Laboratory Standards;2002.
- Clinical Laboratory Standards Institute.Performance Standards for Antimicrobial Susceptibility Testing: Seventeenth Informational Supplement. M100‐S17.Wayne, PA:Clinical Laboratory Standards Institute;2007.
- ,,, et al.Evaluation of the BIOGRAM antimicrobial susceptibility test system.J Clin Microbiol.1985;22:793–798.
- ,,, et al.Outcomes of bacteremia due to Pseudomonas aeruginosa with reduced susceptibility to piperacillin‐tazobactam: implications on the appropriateness of the resistance breakpoint.Clin Infect Dis.2008;46:862–867.
- ,,, et al.Failure of current cefepime breakpoints to predict clinical outcomes of bacteremia caused by Gram‐negative organisms.Antimicrob Agents Chemother.2007;51:4390–4395.
- ,,,,,.Pseudomonas aeruginosa bloodstream infection: importance of appropriate initial antimicrobial treatment.Antimicrob Agents Chemother.2005;49:1306–1311.
- ,,.Ventilator‐associated pneumonia caused by potentially drug‐resistant bacteria.Am J Respir Crit Care Med.1998;157:531–539.
- ,,,,,.Using local microbiologic data to develop institution‐specific guidelines for the treatment of hospital‐acquired pneumonia.Chest.2006;130:787–793.
- ,,, et al.Randomized trial of combination versus monotherapy for the empiric treatment of suspected ventilator‐associated pneumonia.Crit Care Med.2008;36:737–744.
- ,,, et al.Empiric combination antibiotic therapy is associated with improved outcome in Gram‐negative sepsis: a retrospective analysis.Antimicrob Agents Chemother.2010;54:1742–1748.
- ,,, et al.Monotherapy versus beta‐lactam‐aminoglycoside combination treatment for Gram‐negative bacteremia: a prospective, observational study.Antimicrob Agents Chemother.1997;41:1127–1133.
- ,,, et al.Direct E‐test (AB Biodisk) of respiratory samples improves antimicrobial use in ventilator‐associated pneumonia.Clin Infect Dis.2007;44:382–387.
- ,,, et al.Rapid detection of CTX‐M‐producing Enterobacteriaceae in urine samples.J Antimicrob Chemother.2009;64:986–989.
- ,,, et al.Influence of vancomycin minimum inhibitory concentration on the treatment of methicillin‐resistant Staphylococcus aureus bacteremia.Clin Infect Dis.2008;46:193–200.
- ,,, et al.Duration of hypotension before initiation of effective antimicrobial therapy is the critical determinant of survival in human septic shock.Crit Care Med.2006;34:1589–1596.
Severe sepsis and septic shock are associated with excess mortality when inappropriate initial antimicrobial therapy, defined as an antimicrobial regimen that lacks in vitro activity against the isolated organism(s) responsible for the infection, is administered.14 Unfortunately, bacterial resistance to antibiotics is increasing and creates a therapeutic challenge for clinicians when treating patients with serious infections, such as severe sepsis. Increasing rates of bacterial resistance leads many clinicians to empirically treat critically ill patients with broad‐spectrum antibiotics, which can perpetuate the cycle of increasing resistance.5, 6 Conversely, inappropriate initial antimicrobial therapy can lead to treatment failures and adverse patient outcomes.7 Individuals with severe sepsis appear to be at particularly high risk of excess mortality when inappropriate initial antimicrobial therapy is administered.8, 9
The most recent Surviving Sepsis Guidelines recommend empiric combination therapy targeting Gram‐negative bacteria, particularly for patients with known or suspected Pseudomonas infections, as a means to decrease the likelihood of administering inappropriate initial antimicrobial therapy.10 However, the selection of an antimicrobial regimen that is active against the causative pathogen(s) is problematic, as the treating physician usually does not know the susceptibilities of the pathogen(s) for the selected empiric antibiotics. Therefore, we performed a study with the main goal of determining whether resistance to the initially prescribed antimicrobial regimen was associated with clinical outcome in patients with severe sepsis attributed to Gram‐negative bacteremia.
Materials and Methods
Study Location and Patients
This study was conducted at a university‐affiliated, urban teaching hospital: Barnes‐Jewish Hospital (1200 beds). During a 6‐year period (January 2002 to December 2007), all hospitalized patients with a positive blood culture for Gram‐negative bacteria, with antimicrobial susceptibility testing performed for the blood isolate(s), were eligible for this investigation. This study was approved by the Washington University School of Medicine Human Studies Committee.
Study Design and Data Collection
A retrospective cohort study design was employed. Two investigators (J.A.D., R.M.R.) identified potential study patients by the presence of a positive blood culture for Pseudomonas aeruginosa, Acinetobacter species, or Enterobacteriaceae (Escherichia coli, Klebsiella species, Enterobacter species) combined with primary or secondary International Classification of Diseases (ICD‐9‐CM) codes indicative of acute organ dysfunction, at least two criteria from the systemic inflammatory response syndrome (SIRS),10 and initial antibiotic treatment with either cefepime, piperacillin‐tazobactam, or a carbapenem (imipenem or meropenem). These antimicrobials represent the primary agents employed for the treatment of Gram‐negative infections at Barnes‐Jewish Hospital during the study period, and had to be administered within 12 hours of having the subsequently positive blood cultures drawn. Based on the initial study database construction, 3 investigators (E.C.W., J.K., M.P.) merged patient‐specific data from the automated hospital medical records, microbiology database, and pharmacy database of Barnes‐Jewish Hospital to complete the clinical database under the auspices of the definitions described below.
The baseline characteristics collected by the study investigators included: age, gender, race, the presence of congestive heart failure, chronic obstructive pulmonary disease, diabetes mellitus, chronic liver disease, underlying malignancy, and end‐stage renal disease requiring renal replacement therapy. All cause hospital mortality was evaluated as the primary outcome variable. Secondary outcomes included acquired organ dysfunction and hospital length of stay. The Acute Physiology and Chronic Health Evaluation (APACHE) II11 and Charlson co‐morbidity scores were also calculated during the 24 hours after the positive blood cultures were drawn. This was done because we included patients with community‐acquired infections who only had clinical data available after blood cultures were drawn.
Definitions
All definitions were selected prospectively as part of the original study design. Cases of Gram‐negative bacteremia were classified into mutually exclusive groups comprised of either community‐acquired or healthcare‐associated infection. Patients with healthcare‐associated bacteremia were categorized as community‐onset or hospital‐onset, as previously described.12 In brief, patients with healthcare‐associated community‐onset bacteremia had the positive culture obtained within the first 48 hours of hospital admission in combination with one or more of the following risk factors: (1) residence in a nursing home, rehabilitation hospital, or other long‐term nursing facility; (2) previous hospitalization within the immediately preceding 12 months; (3) receiving outpatient hemodialysis, peritoneal dialysis, wound care, or infusion therapy necessitating regular visits to a hospital‐based clinic; and (4) having an immune‐compromised state. Patients were classified as having healthcare‐associated hospital‐onset bacteremia when the culture was obtained 48 hours or more after admission. Community‐acquired bacteremia occurred in patients without healthcare risk factors and a positive blood culture within the first 48 hours of admission. Prior antibiotic exposure was defined as having occurred within the previous 30 days from the onset of severe sepsis.
To be included in the analysis, patients had to meet criteria for severe sepsis based on discharge ICD‐9‐CM codes for acute organ dysfunction, as previously described.13 The organs of interest included the heart, lungs, kidneys, bone marrow (hematologic), brain, and liver. Patients were classified as having septic shock if vasopressors (norepinephrine, dopamine, epinephrine, phenylephrine, or vasopressin) were initiated within 24 hours of the blood culture collection date and time. Empiric antimicrobial treatment was classified as being appropriate if the initially prescribed antibiotic regimen was active against the identified pathogen(s) based on in vitro susceptibility testing and administered within 12 hours following blood culture collection. Appropriate antimicrobial treatment also had to be prescribed for at least 24 hours. However, the total duration of antimicrobial therapy was at the discretion of the treating physicians. The Charlson co‐morbidity score was calculated using ICD‐9‐CM codes abstracted from the index hospitalization employing MS‐DRG Grouper version 26.
Antimicrobial Monitoring
From January 2002 through the present, Barnes‐Jewish Hospital utilized an antibiotic control program to help guide antimicrobial therapy. During this time, the use of cefepime and gentamicin was unrestricted. However, initiation of intravenous ciprofloxacin, imipenem/cilastatin, meropenem, or piperacillin/tazobactam was restricted and required preauthorization from either a clinical pharmacist or infectious diseases physician. Each intensive care unit (ICU) had a clinical pharmacist who reviewed all antibiotic orders to insure that dosing and interval of antibiotic administration was adequate for individual patients based on body size, renal function, and the resuscitation status of the patient. After daytime hours, the on‐call clinical pharmacist reviewed and approved the antibiotic orders. The initial antibiotic dosages for the antibiotics employed for the treatment of Gram‐negative infections at Barnes‐Jewish Hospital were as follows: cefepime, 1 to 2 grams every eight hours; pipercillin‐tazobactam, 4.5 grams every six hours; imipenem, 0.5 grams every six hours; meropenem, 1 gram every eight hours; ciprofloxacin, 400 mg every eight hours; gentamicin, 5 mg/kg once daily.
Starting in June 2005, a sepsis order set was implemented in the emergency department, general medical wards, and the intensive care units with the intent of standardizing empiric antibiotic selection for patients with sepsis based on the infection type (ie, community‐acquired pneumonia, healthcare‐associated pneumonia, intra‐abdominal infection, etc) and the hospital's antibiogram.14, 15 However, antimicrobial selection, dosing, and de‐escalation of therapy were still optimized by clinical pharmacists in these clinical areas.
Antimicrobial Susceptibility Testing
The microbiology laboratory performed antimicrobial susceptibility testing of the Gram‐negative blood isolates using the disk diffusion method according to guidelines and breakpoints established by the Clinical Laboratory and Standards Institute (CLSI) and published during the inclusive years of the study.16, 17 Zone diameters obtained by disk diffusion testing were converted to minimum inhibitory concentrations (MICs in mg/L) by linear regression analysis for each antimicrobial agent using the BIOMIC V3 antimicrobial susceptibility system (Giles Scientific, Inc., Santa Barbara, CA). Linear regression algorithms contained in the software of this system were determined by comparative studies correlating microbroth dilution‐determined MIC values with zone sizes obtained by disk diffusion testing.18
Data Analysis
Continuous variables were reported as mean the standard deviation, or median and quartiles. The Student's t test was used when comparing normally distributed data, and the MannWhitney U test was employed to analyze nonnormally distributed data. Categorical data were expressed as frequency distributions and the Chi‐squared test was used to determine if differences existed between groups. We performed multiple logistic regression analysis to identify clinical risk factors that were associated with hospital mortality (SPSS, Inc., Chicago, IL). All risk factors from Table 1, as well as the individual pathogens examined, were included in the corresponding multivariable analysis with the exception of acquired organ dysfunction (considered a secondary outcome). All tests were two‐tailed, and a P value <0.05 was determined to represent statistical significance.
| Variable | Hospital Survivors (n = 302) | Hospital Nonsurvivors (n = 233) | P value |
|---|---|---|---|
| |||
| Age, years | 57.9 16.2 | 60.3 15.8 | 0.091 |
| Male | 156 (51.7) | 132 (56.7) | 0.250 |
| Infection onset source | |||
| Community‐acquired | 31 (10.3) | 15 (6.4) | 0.005 |
| Healthcare‐associated community‐onset | 119 (39.4) | 68 (29.2) | |
| Healthcare‐associated hospital‐onset | 152 (50.3) | 150 (64.4) | |
| Underlying co‐morbidities | |||
| CHF | 43 (14.2) | 53 (22.7) | 0.011 |
| COPD | 42 (13.9) | 56 (24.0) | 0.003 |
| Chronic kidney disease | 31 (10.3) | 41 (17.6) | 0.014 |
| Liver disease | 34 (11.3) | 31 (13.3) | 0.473 |
| Active malignancy | 100 (33.1) | 83 (35.6) | 0.544 |
| Diabetes | 68 (22.5) | 50 (21.5) | 0.770 |
| Charlson co‐morbidity score | 4.5 3.5 | 5.2 3.9 | 0.041 |
| APACHE II score | 21.8 6.1 | 27.1 6.2 | <0.001 |
| ICU admission | 221 (73.2) | 216 (92.7) | <0.001 |
| Vasopressors | 137 (45.4) | 197 (84.5) | <0.001 |
| Mechanical ventilation | 124 (41.1) | 183 (78.5) | <0.001 |
| Drotrecogin alfa (activated) | 6 (2.0) | 21 (9.0) | <0.001 |
| Dysfunctional acquired organ systems | |||
| Cardiovascular | 149 (49.3) | 204 (87.6) | <0.001 |
| Respiratory | 141 (46.7) | 202 (86.7) | <0.001 |
| Renal | 145 (48.0) | 136 (58.4) | 0.017 |
| Hepatic | 13 (4.3) | 27 (11.6) | 0.001 |
| Hematologic | 103 (34.1) | 63 (27.0) | 0.080 |
| Neurologic | 11 (3.6) | 19 (8.2) | 0.024 |
| 2 Dysfunctional acquired organ systems | 164 (54.3) | 213 (91.4) | <0.001 |
| Source of bloodstream infection | |||
| Lungs | 95 (31.5) | 127 (54.5) | <0.001 |
| Urinary tract | 92 (30.5) | 45 (19.3) | |
| Central venous catheter | 30 (9.9) | 16 (6.9) | |
| Intra‐abdominal | 63 (20.9) | 33 (14.2) | |
| Unknown | 22 (7.3) | 12 (5.2) | |
| Prior antibiotics* | 103 (34.1) | 110 (47.2) | 0.002 |
Results
Patient Characteristics
Included in the study were 535 consecutive patients with severe sepsis attributed to Pseudomonas aeruginosa, Acinetobacter species, or Enterobacteriaceae bacteremia, of whom 233 (43.6%) died during their hospitalization. The mean age was 58.9 16.0 years (range, 18 to 96 years) with 288 (53.8%) males and 247 (46.2%) females. The infection sources included community‐acquired (n = 46, 8.6%), healthcare‐associated community‐onset (n = 187, 35.0%), and healthcare‐associated hospital‐onset (n = 302, 56.4%). Hospital nonsurvivors were statistically more likely to have a healthcare‐associated hospital‐onset infection, congestive heart failure, chronic obstructive pulmonary disease, chronic kidney disease, ICU admission, need for mechanical ventilation and/or vasopressors, administration of drotrecogin alfa (activated), prior antibiotic administration, the lungs as the source of infection, acquired dysfunction of the cardiovascular, respiratory, renal, hepatic, and neurologic organ systems, and greater APACHE II and Charlson co‐morbidity scores compared to hospital survivors (Table 1). Hospital nonsurvivors were also statistically less likely to have a healthcare‐associated community‐onset infection and a urinary source of infection compared to hospital survivors (Table 1).
Microbiology
Among the 547 Gram‐negative bacteria isolated from blood, the most common were Enterobacteriaceae (Escherichia coli, Klebsiella species, Enterobacter species) (70.2%) followed by Pseudomonas aeruginosa (20.8%) and Acinetobacter species (9.0%) (Table 2). Nine patients had two different Enterobacteriaceae species isolated from their blood cultures, and three patients had an Enterobacteriaceae species and Pseudomonas aeruginosa isolated from their blood cultures. Hospital nonsurvivors were statistically more likely to be infected with Pseudomonas aeruginosa and less likely to be infected with Enterobacteriaceae. The pathogen‐specific hospital mortality rate was significantly greater for Pseudomonas aeruginosa and Acinetobacter species compared to Enterobacteriaceae (P < 0.001 and P = 0.008, respectively).
| Bacteria | Hospital Survivors (n = 302) | Hospital Nonsurvivors (n = 233) | P value* | Percent Resistant | Pathogen‐ Specific Mortality Rate |
|---|---|---|---|---|---|
| |||||
| Enterobacteriaceae | 241 (79.8) | 143 (61.4) | <0.001 | 9.1 | 37.2 |
| Pseudomonas aeruginosa | 47 (15.6) | 67 (28.8) | <0.001 | 16.7 | 58.8 |
| Acinetobacter species | 22 (7.3) | 27 (11.6) | 0.087 | 71.4 | 55.1 |
Antimicrobial Treatment and Resistance
Among the study patients, 358 (66.9%) received cefepime, 102 (19.1%) received piperacillin‐tazobactam, and 75 (14.0%) received a carbapenem (meropenem or imipenem) as their initial antibiotic treatment. There were 169 (31.6%) patients who received initial combination therapy with either an aminoglycoside (n = 99, 58.6%) or ciprofloxacin (n = 70, 41.4%). Eighty‐two (15.3%) patients were infected with a pathogen that was resistant to the initial antibiotic treatment regimen [cefepime (n = 41; 50.0%), piperacillin‐tazobactam (n = 25; 30.5%), or imipenem/meropenem (n = 16; 19.5%), plus either an aminoglycoside or ciprofloxacin (n = 28; 34.1%)], and were classified as receiving inappropriate initial antibiotic therapy. Among the 453 (84.7%) patients infected with a pathogen that was susceptible to the initial antibiotic regimen, there was no relationship identified between minimum inhibitory concentration values and hospital mortality.
Patients infected with a pathogen resistant to the initial antibiotic regimen had significantly greater risk of hospital mortality (63.4% vs 40.0%; P < 0.001) (Figure 1). For the 82 individuals infected with a pathogen that was resistant to the initial antibiotic regimen, no difference in hospital mortality was observed among those prescribed initial combination treatment with an aminoglycoside (n = 17) (64.7% vs 61.1%; P = 0.790) or ciprofloxacin (n = 11) (72.7% vs 61.1%; P = 0.733) compared to monotherapy (n = 54). Similarly, among the patients infected with a pathogen that was susceptible to the initial antibiotic regimen, there was no difference in hospital mortality among those whose bloodstream isolate was only susceptible to the prescribed aminoglycoside (n = 12) compared to patients with isolates that were susceptible to the prescribed beta‐lactam antibiotic (n = 441) (41.7% vs 39.9%; P = 0.902).
Logistic regression analysis identified infection with a pathogen resistant to the initial antibiotic regimen [adjusted odds ratio (AOR), 2.28; 95% confidence interval (CI), 1.69‐3.08; P = 0.006], increasing APACHE II scores (1‐point increments) (AOR, 1.13; 95% CI, 1.10‐1.15; P < 0.001), the need for vasopressors (AOR, 2.57; 95% CI, 2.15‐3.53; P < 0.001), the need for mechanical ventilation (AOR, 2.54; 95% CI, 2.19‐3.47; P < 0.001), healthcare‐associated hospital‐onset infection (AOR, 1.67; 95% CI, 1.32‐2.10; P =0.027), and infection with Pseudomonas aeruginosa (AOR, 2.21; 95% CI, 1.74‐2.86; P =0.002) as independent risk factors for hospital mortality (Hosmer‐Lemeshow goodness‐of‐fit test = 0.305). The model explained between 29.7% (Cox and Snell R square) and 39.8% (Nagelkerke R squared) of the variance in hospital mortality, and correctly classified 75.3% of cases.
Secondary Outcomes
Two or more acquired organ system derangements occurred significantly more often among patients with a pathogen resistant to the initial antibiotic regimen compared to those infected with susceptible isolates (84.1% vs 68.0%; P = 0.003). Hospital length of stay was significantly longer for patients infected with a pathogen resistant to the initial antibiotic regimen compared to those infected with susceptible isolates [39.9 50.6 days (median 27 days; quartiles 12 days and 45.5 days) vs 21.6 22.0 days (median 15 days; quartiles 7 days and 30 days); P < 0.001].
Discussion
Our study demonstrated that hospital nonsurvivors with severe sepsis attributed to Gram‐negative bacteremia had significantly greater rates of resistance to their initially prescribed antibiotic regimen compared to hospital survivors. This observation was confirmed in a multivariate analysis controlling for severity of illness and other potential confounding variables. Additionally, acquired organ system derangements and hospital length of stay were greater for patients infected with Gram‐negative pathogens resistant to the empiric antibiotic regimen. We also observed no survival advantage with the use of combination antimicrobial therapy for the subgroup of patients whose pathogens were resistant to the initially prescribed antibiotic regimen. Lastly, no difference in mortality was observed for patients with bacterial isolates that were susceptible only to the prescribed aminoglycoside compared to those with isolates susceptible to the prescribed beta‐lactam antibiotic.
Several previous investigators have linked antibiotic resistance and outcome in patients with serious infections attributed to Gram‐negative bacteria. Tam et al. examined 34 patients with Pseudomonas aeruginosa bacteremia having elevated MICs to piperacillin‐tazobactam (32 g/mL) that were reported as susceptible.19 In seven of these cases, piperacillin‐tazobactam was prescribed empirically, whereas other agents directed against Gram‐negative bacteria were employed in the other patients (carbapenems, aminoglycosides). Thirty‐day mortality was significantly greater for the patients treated with piperacillin‐tazobactam (85.7% vs 22.2%; P = 0.004), and a multivariate analysis found treatment with piperacillin‐tazobactam to be independently associated with 30‐day mortality. Similarly, Bhat et al. examined 204 episodes of bacteremia caused by Gram‐negative bacteria for which patients received cefepime.20 Patients infected with a Gram‐negative bacteria having an MIC to cefepime greater than, or equal to, 8 g/mL had a significantly greater 28‐day mortality compared to patients infected with isolates having an MIC to cefepime that was less than 8 g/mL (54.8% vs 24.1%; P = 0.001).
Our findings are consistent with earlier studies of patients with serious Gram‐negative infections including bacteremia and nosocomial pneumonia. Micek et al. showed that patients with Pseudomonas aeruginosa bacteremia who received inappropriate initial antimicrobial therapy had a greater risk of hospital mortality compared to patients initially treated with an antimicrobial regimen having activity for the Pseudomonas isolate based on in vitro susceptibility testing.21 Similarly, Trouillet et al.,22 Beardsley et al.,23 and Heyland et al.24 found that combination antimicrobial regimens directed against Gram‐negative bacteria in patients with nosocomial pneumonia were more likely to be appropriate based on the antimicrobial susceptibility patterns of the organisms compared to monotherapy. In a more recent study, Micek et al. demonstrated that combination antimicrobial therapy directed against severe sepsis attributed to Gram‐negative bacteria was associated with improved outcomes compared to monotherapy, especially when the combination agent was an aminoglycoside.25 However, empiric combination therapy that included an aminoglycoside was also associated with increased nephrotoxicity which makes the empiric use of aminoglycosides in all patients with suspected Gram‐negative severe sepsis problematic.25, 26 Nevertheless, the use of combination therapy represents a potential strategy to maximize the administration of appropriate treatment for serious Gram‐negative bacterial infections.
Rapid assessment of antimicrobial susceptibility is another strategy that offers the possibility of identifying the resistance pattern of Gram‐negative pathogens quickly in order to provide more appropriate treatment. Bouza et al. found that use of a rapid E‐test on the respiratory specimens of patients with ventilator‐associated pneumonia was associated with fewer days of fever, fewer days of antibiotic administration until resolution of the episode of ventilator‐associated pneumonia, decreased antibiotic consumption, less Clostridium difficile‐associated diarrhea, lower costs of antimicrobial agents, and fewer days receiving mechanical ventilation.27 Other methods for the rapid identification of resistant bacteria include real‐time polymerase chain reaction assays based on hybridization probes to identify specific resistance mechanisms in bacteria.28 Application of such methods for identification of broad categories of resistance mechanisms in Gram‐negative bacteria offer the possibility of tailoring initial antimicrobial regimens in order to provide appropriate therapy in a more timely manner.
Our study has several important limitations that should be noted. First, the study was performed at a single center and the results may not be generalizable to other institutions. However, the findings from other investigators corroborate the importance of antimicrobial resistance as a predictor of outcome for patients with serious Gram‐negative infections.19, 20 Additionally, a similar association has been observed in patients with methicillin‐resistant Staphylococcus aureus bacteremia, supporting the more general importance of antimicrobial resistance as an outcome predictor.29 Second, the method employed for determining MICs was a literature‐based linear regression method correlating disk diffusion diameters with broth dilution MIC determinations. Therefore, the lack of correlation we observed between MIC values and outcome for susceptible Gram‐negative isolates associated with severe sepsis requires further confirmation. Third, we only examined 3 antibiotics, or antibiotic classes, so our results may not be applicable to other agents. This also applies to doripenem, as we did not have that specific carbapenem available at the time this investigation took place.
Another important limitation of our study is the relatively small number of individuals infected with a pathogen that was resistant to the initial treatment regimen, or only susceptible to the aminoglycoside when combination therapy was prescribed. This limited our ability to detect meaningful associations in these subgroups of patients, to include whether or not combination therapy influenced their clinical outcome. Finally, we did not examine the exact timing of antibiotic therapy relative to the onset of severe sepsis. Instead we used a 12‐hour window from when subsequently positive blood cultures were drawn to the administration of initial antibiotic therapy. Other investigators have shown that delays in initial appropriate therapy of more than one hour for patients with septic shock increases the risk of death.9, 30 Failure to include the exact timing of therapy could have resulted in a final multivariate model that includes prediction variables that would not otherwise have been incorporated.
In summary, we demonstrated that resistance to the initial antibiotic treatment regimen was associated with a greater risk of hospital mortality in patients with severe sepsis attributed to Gram‐negative bacteremia. These findings imply that more rapid assessment of antimicrobial susceptibility could result in improved prescription of antibiotics in order to maximize initial administration of appropriate therapy. Future studies are required to address whether rapid determination of antimicrobial susceptibility can result in more effective administration of appropriate therapy, and if this can result in improved patient outcomes.
- ,,,.Inadequate antimicrobial treatment of infections: a risk factor for hospital mortality among critically ill patients.Chest.1999;115:462–474.
- ,,, et al.The clinical evaluation committee in a large multicenter phase 3 trial of drotrecogin alfa (activated) in patients with severe sepsis (PROWESS): role, methodology, and results.Crit Care Med.2003;31:2291–2301.
- ,,,,,.Impact of adequate empical antibiotic therapy on the outcome of patients admitted to the intensive care unit with sepsis.Crit Care Med.2003;31:2742–2751.
- ,,,,,.Inappropriate initial antimicrobial therapy and its effect on survival in a clinical trial of immunomodulating therapy for severe sepsis.Am J Med.2003;115:529–535.
- ,.Antibiotic‐resistant bugs in the 21st century—a clinical super‐challenge.N Engl J Med.2009;360:439–443.
- ,,, et al.Bad bugs, no drugs: no ESKAPE! An update from the Infectious Diseases Society of America.Clin Infect Dis.2009;48:1–12.
- .Broad‐spectrum antimicrobials and the treatment of serious bacterial infections: getting it right up front.Clin Infect Dis.2008;47:S3–S13.
- ,,, et al.Bundled care for septic shock: an analysis of clinical trials.Crit Care Med.2010;38:668–678.
- ,,, et al.Effectiveness of treatments for severe sepsis: a prospective, multicenter, observational study.Am J Respir Crit Care Med.2009;180:861–866.
- ,,, et al.Surviving Sepsis Campaign: international guidelines for management of severe sepsis and septic shock: 2008.Crit Care Med.2008;36:296–327.
- ,,,.APACHE II: a severity of disease classification system.Crit Care Med.1985;13:818–829.
- ,,, et al.Invasive methicillin‐resistant Staphylococcus aureus infections in the United States.JAMA.2007;298:1763–1771.
- ,,,,,.Epidemiology of severe sepsis in the United States: analysis of incidence, outcome, and associated costs of care.Crit Care Med.2001;29:1303–1310.
- ,,,,,.Hospital‐wide impact of a standardized order set for the management of bacteremic severe sepsis.Crit Care Med.2009;37:819–824.
- ,,, et al.Before‐after study of a standardized hospital order set for the management of septic shock.Crit Care Med.2007;34:2707–2713.
- National Committee for Clinical Laboratory Standards.Performance Standards for Antimicrobial Susceptibility Testing: Twelfth Informational Supplement. M100‐S12.Wayne, PA:National Committee for Clinical Laboratory Standards;2002.
- Clinical Laboratory Standards Institute.Performance Standards for Antimicrobial Susceptibility Testing: Seventeenth Informational Supplement. M100‐S17.Wayne, PA:Clinical Laboratory Standards Institute;2007.
- ,,, et al.Evaluation of the BIOGRAM antimicrobial susceptibility test system.J Clin Microbiol.1985;22:793–798.
- ,,, et al.Outcomes of bacteremia due to Pseudomonas aeruginosa with reduced susceptibility to piperacillin‐tazobactam: implications on the appropriateness of the resistance breakpoint.Clin Infect Dis.2008;46:862–867.
- ,,, et al.Failure of current cefepime breakpoints to predict clinical outcomes of bacteremia caused by Gram‐negative organisms.Antimicrob Agents Chemother.2007;51:4390–4395.
- ,,,,,.Pseudomonas aeruginosa bloodstream infection: importance of appropriate initial antimicrobial treatment.Antimicrob Agents Chemother.2005;49:1306–1311.
- ,,.Ventilator‐associated pneumonia caused by potentially drug‐resistant bacteria.Am J Respir Crit Care Med.1998;157:531–539.
- ,,,,,.Using local microbiologic data to develop institution‐specific guidelines for the treatment of hospital‐acquired pneumonia.Chest.2006;130:787–793.
- ,,, et al.Randomized trial of combination versus monotherapy for the empiric treatment of suspected ventilator‐associated pneumonia.Crit Care Med.2008;36:737–744.
- ,,, et al.Empiric combination antibiotic therapy is associated with improved outcome in Gram‐negative sepsis: a retrospective analysis.Antimicrob Agents Chemother.2010;54:1742–1748.
- ,,, et al.Monotherapy versus beta‐lactam‐aminoglycoside combination treatment for Gram‐negative bacteremia: a prospective, observational study.Antimicrob Agents Chemother.1997;41:1127–1133.
- ,,, et al.Direct E‐test (AB Biodisk) of respiratory samples improves antimicrobial use in ventilator‐associated pneumonia.Clin Infect Dis.2007;44:382–387.
- ,,, et al.Rapid detection of CTX‐M‐producing Enterobacteriaceae in urine samples.J Antimicrob Chemother.2009;64:986–989.
- ,,, et al.Influence of vancomycin minimum inhibitory concentration on the treatment of methicillin‐resistant Staphylococcus aureus bacteremia.Clin Infect Dis.2008;46:193–200.
- ,,, et al.Duration of hypotension before initiation of effective antimicrobial therapy is the critical determinant of survival in human septic shock.Crit Care Med.2006;34:1589–1596.
Copyright © 2011 Society of Hospital Medicine

Hospitalists Recall 9/11
Flashbulb Memories are memories for the circumstances in which one first learned of a very surprising and consequential (or emotionally arousing) event. Hearing the news that President John Kennedy had been shot is the prototype case. Almost everyone can remember, with an almost perceptual clarity, where he was when he heard, what he was doing at the time, who told him, what was the immediate aftermath, how he felt about it, and also one or more totally idiosyncratic and often trivial concomitants.1
In personal terms, all Americans are connected by recollections of the experience. 97% can remember exactly where they were or what they were doing the moment they heard about the attacks. (Pew Research survey, September 5, 2002)
The classic flashbulb memories of our parents' generation, who were young adults in the 1960s, were the assassinations of Martin Luther King and President John Kennedy. In the same way, the 9/11 attacks seem destined to endure as our generation's flashbulb memory, with the Space Shuttle Challenger explosion a distant second for those of us on the far side of age 40. Few of us are likely to ever forget the grief, anger, and confusion of September 11, 2001 and the days that followed, and it seems appropriate 10 years later to remember those who died that day, and to reflect on the lessons we learnedor should have. As hospitalists, we are at least somewhat familiar with the tragic and senseless loss of life that day, as the terrorist attacks were in a sense a reflection, writ large, of the unexpected and inexplicable deaths we have all been a part of: the healthy young woman exsanguinating from DIC in the immediate postpartum period, the preschool teacher rapidly succumbing to pneumococcal meningitis, the young adult dying of acute leukemia or necrotizing fasciitis.
On September 11, 2001, one of us (B.J.H.) was 2 years out of residency and in private practice near San Francisco.
For most of us on the West coast, 9/11 began while we slept. By the time I had awoken, showered, and coffeed, both planes had already hit the towers, and I only found out in the course of routinely turning on the television for a minute before leaving for work. Sometimes we forget that in those first minutes and hours, the news was contradictory and confused. Television and Internet couldn't keep up with the facts. And then within minutes, the towers fell. My first thought was that I was seeing tens of thousands of people die. Nine years earlier I had worked in the building adjacent to the World Trade Center and I knew the swarms of commuters moving through every morning. That the casualties were so much fewer is still miraculous to me.
I did go to work that morning, to a hospital full of colleagues with identical shocked looks. That dayand for the fog of days afterwardevery television in every room was on, showing planes hitting the towers over and over, different cameras, different angles; long crowds of people walking home to New Jersey out of the smoke; the faces of doomed firefighters in the stairwell, taken by survivors as they came down and the rescuers went up. Several thousand miles away, it was impossible to believe that it was all real and happening. Who could have ever imagined such a thing? I cannot believe that 9/11 didn't transform every American, regardless of background. What landmark would be next? Who in their right mind would work in the Sears Tower or Empire State Building after 9/11? I obsessed about bombings of the Golden Gate Bridge: the deck collapsing, my car plunging into the bay. For 6 months, I changed my commute times to avoid backed‐up, rush‐hour traffic. The events of 9/11 changed my beliefs and how I looked at things around me that I had always trusted.
For the other of us (J.C.P.), the news came in a patient's room during rounds.
My patient and I watched in disbelief while, as a reporter talked about the tragedy of a passenger jet crashing into one of the twin towers moments before, the second attack occurred. We both immediately knew beyond any doubt that this was a terrorist attack, although that fact seemed to take longer to register with the reporter. The rest of that morning is a blur, though I do recall attempting to see patients and teach through a haze of disbelief and disquiet. I eventually made it to my office and sat down, only to have my officemate burst in breathlessly and say, They just bombed the Pentagon! The receipt of that factually altered piece of information caused me to wonder just how horrific the day would prove to be when it was all over, and convinced me that life in the U.S. would never again be the same. The unfolding story over the next several days held my attention as no other public event during my lifetime has, and my wife and I spent evenings glued to the television that week. A benefit concert with an all‐star lineup of pop musicians was organized and held within days of the attacks, and I remember watching Paul Simon perform Bridge Over Troubled Water and thinking that it would have been more honest, though probably too dark, if he had chosen American Tune instead:
And I don't know a soul who's not been battered
I don't know a friend who feels at ease
I don't know a dream that's not been shattered
Or driven to its knees
But it's all right, it's all right
We've lived so well so long .
In a real sense it is surprising, even shocking, that there has not been a major domestic terrorism attack during the intervening decade, particularly given our multicultural, open society, but for me as for many of us, the next occurrence is a matter of when and hownot if. I've flown countless times since, but still never go to or through an airport, particularly in major cities, without thinking about the possibility of a terror strike, and I never walk through my former home of Washington, D.C. without thoughts of what if?
What lessons should we take away from the 9/11 tragedy a decade later, and indeed from our work with our patients? Certainly that mass casualties and disaster preparedness are an unfortunate fact of life in the 21st century, and that hospitalists have a responsibility to engage with our institutions in preparing for these eventualities. Possibly that life is uncertain and, at best, goes by much more quickly than any of us could have imagined when we embarked on our medical training. In the end, that our lives are measured primarily not by the number of years we live, but by how we live them, and the lives that we touch along the way.
Once a year, we pause to remember the nearly 3000 individuals who lost their lives on 9/11. As hospitalists, we practice a profession that demands a great deal from us and encourages workaholism; perhaps the 10th anniversary of those heinous acts should make each of us, as we remember the lives touched most directly by the attacks on the World Trade Center, the Pentagon, and United Flight 93, also pause to consider our work‐life balance, and to ensure that we are reserving sufficient quality time for our families and friends, as well as for activities that renew and enrich us.
- ,.Flashbulb memories.Cognition.1977;5(1):73–99.
Flashbulb Memories are memories for the circumstances in which one first learned of a very surprising and consequential (or emotionally arousing) event. Hearing the news that President John Kennedy had been shot is the prototype case. Almost everyone can remember, with an almost perceptual clarity, where he was when he heard, what he was doing at the time, who told him, what was the immediate aftermath, how he felt about it, and also one or more totally idiosyncratic and often trivial concomitants.1
In personal terms, all Americans are connected by recollections of the experience. 97% can remember exactly where they were or what they were doing the moment they heard about the attacks. (Pew Research survey, September 5, 2002)
The classic flashbulb memories of our parents' generation, who were young adults in the 1960s, were the assassinations of Martin Luther King and President John Kennedy. In the same way, the 9/11 attacks seem destined to endure as our generation's flashbulb memory, with the Space Shuttle Challenger explosion a distant second for those of us on the far side of age 40. Few of us are likely to ever forget the grief, anger, and confusion of September 11, 2001 and the days that followed, and it seems appropriate 10 years later to remember those who died that day, and to reflect on the lessons we learnedor should have. As hospitalists, we are at least somewhat familiar with the tragic and senseless loss of life that day, as the terrorist attacks were in a sense a reflection, writ large, of the unexpected and inexplicable deaths we have all been a part of: the healthy young woman exsanguinating from DIC in the immediate postpartum period, the preschool teacher rapidly succumbing to pneumococcal meningitis, the young adult dying of acute leukemia or necrotizing fasciitis.
On September 11, 2001, one of us (B.J.H.) was 2 years out of residency and in private practice near San Francisco.
For most of us on the West coast, 9/11 began while we slept. By the time I had awoken, showered, and coffeed, both planes had already hit the towers, and I only found out in the course of routinely turning on the television for a minute before leaving for work. Sometimes we forget that in those first minutes and hours, the news was contradictory and confused. Television and Internet couldn't keep up with the facts. And then within minutes, the towers fell. My first thought was that I was seeing tens of thousands of people die. Nine years earlier I had worked in the building adjacent to the World Trade Center and I knew the swarms of commuters moving through every morning. That the casualties were so much fewer is still miraculous to me.
I did go to work that morning, to a hospital full of colleagues with identical shocked looks. That dayand for the fog of days afterwardevery television in every room was on, showing planes hitting the towers over and over, different cameras, different angles; long crowds of people walking home to New Jersey out of the smoke; the faces of doomed firefighters in the stairwell, taken by survivors as they came down and the rescuers went up. Several thousand miles away, it was impossible to believe that it was all real and happening. Who could have ever imagined such a thing? I cannot believe that 9/11 didn't transform every American, regardless of background. What landmark would be next? Who in their right mind would work in the Sears Tower or Empire State Building after 9/11? I obsessed about bombings of the Golden Gate Bridge: the deck collapsing, my car plunging into the bay. For 6 months, I changed my commute times to avoid backed‐up, rush‐hour traffic. The events of 9/11 changed my beliefs and how I looked at things around me that I had always trusted.
For the other of us (J.C.P.), the news came in a patient's room during rounds.
My patient and I watched in disbelief while, as a reporter talked about the tragedy of a passenger jet crashing into one of the twin towers moments before, the second attack occurred. We both immediately knew beyond any doubt that this was a terrorist attack, although that fact seemed to take longer to register with the reporter. The rest of that morning is a blur, though I do recall attempting to see patients and teach through a haze of disbelief and disquiet. I eventually made it to my office and sat down, only to have my officemate burst in breathlessly and say, They just bombed the Pentagon! The receipt of that factually altered piece of information caused me to wonder just how horrific the day would prove to be when it was all over, and convinced me that life in the U.S. would never again be the same. The unfolding story over the next several days held my attention as no other public event during my lifetime has, and my wife and I spent evenings glued to the television that week. A benefit concert with an all‐star lineup of pop musicians was organized and held within days of the attacks, and I remember watching Paul Simon perform Bridge Over Troubled Water and thinking that it would have been more honest, though probably too dark, if he had chosen American Tune instead:
And I don't know a soul who's not been battered
I don't know a friend who feels at ease
I don't know a dream that's not been shattered
Or driven to its knees
But it's all right, it's all right
We've lived so well so long .
In a real sense it is surprising, even shocking, that there has not been a major domestic terrorism attack during the intervening decade, particularly given our multicultural, open society, but for me as for many of us, the next occurrence is a matter of when and hownot if. I've flown countless times since, but still never go to or through an airport, particularly in major cities, without thinking about the possibility of a terror strike, and I never walk through my former home of Washington, D.C. without thoughts of what if?
What lessons should we take away from the 9/11 tragedy a decade later, and indeed from our work with our patients? Certainly that mass casualties and disaster preparedness are an unfortunate fact of life in the 21st century, and that hospitalists have a responsibility to engage with our institutions in preparing for these eventualities. Possibly that life is uncertain and, at best, goes by much more quickly than any of us could have imagined when we embarked on our medical training. In the end, that our lives are measured primarily not by the number of years we live, but by how we live them, and the lives that we touch along the way.
Once a year, we pause to remember the nearly 3000 individuals who lost their lives on 9/11. As hospitalists, we practice a profession that demands a great deal from us and encourages workaholism; perhaps the 10th anniversary of those heinous acts should make each of us, as we remember the lives touched most directly by the attacks on the World Trade Center, the Pentagon, and United Flight 93, also pause to consider our work‐life balance, and to ensure that we are reserving sufficient quality time for our families and friends, as well as for activities that renew and enrich us.
- ,.Flashbulb memories.Cognition.1977;5(1):73–99.
- ,.Flashbulb memories.Cognition.1977;5(1):73–99.
Causes of Early Readmissions
Hospital readmissions have become a focus of national attention as a potential indicator of poor quality and health care waste.13 Geographic variations in readmission rates, a high rate of unplanned readmissions, and the emergence of promising interventions all suggest that some portion of readmissions are preventable.4, 5 This work adds to the work of the Agency for Healthcare Research and Quality (AHRQ) on reports of preventable hospital admissions, using hospitalization rates for ambulatory‐sensitive conditions as prevention quality indicators.6
The actual proportion of preventable readmissions is unknown. In previous research using physician reviewers, estimates have ranged from 5% to 38%.713 More recently, studies using a methodology based on relationships between diagnoses at the initial and subsequent hospitalizations have flagged as many as 76% of 30‐day readmissions as preventable.14
Understanding the preventability of readmissions is important if we are to gauge the true size of this quality and cost opportunity. Moreover, it is important to assess the beliefs of the front‐line clinicians who will be playing key roles in prevention.
The objective of the current study was to examine readmission preventability from the perspective of hospital medicine experts practicing at a community hospital. Through detailed chart review, we identify patient factors and care processes that affect preventability and describe clinicians' ideas for preventing future readmissions.
METHODS
Setting
The study took place within four community hospitals in Portland, OR, all staffed by a single hospitalist group. The hospitals included two large (483 and 525 bed) tertiary facilities with internal medicine residency programs and two smaller (77 and 40 bed) suburban hospitals, one of which has a family practice residency. The hospitalists are part of an employed medical group owned by the health care system. Each of the hospitalists is assigned as a liaison to a single primary care clinic as a means of fostering collaboration between primary care physicians and their hospital medicine colleagues.
Patients
Eligible patients were those discharged from one of these four hospitals, between January 2009 and May 2010, who had a hospitalist consult during their stay and were cared for in a system primary care clinic. The vast majority of patients were discharged by one of the internal medicine hospitalists (and all had an internal medicine consultation), thus most had medical rather than surgical diagnoses. Acute care and ambulatory care charts were reviewed for all patients readmitted within 21 days after their discharge date. The 21‐day window (rather than the customary 30‐day time period) was chosen to emphasize near‐term returns to the hospital. Hospital transfers and patients discharged to inpatient rehabilitation or inpatient mental health were excluded from the study as not representing a true readmission.
A total of 300 consecutive patient charts meeting these criteria were reviewed. These included patients readmitted multiple times. Each readmission was counted as a separate case.
Reviewers
Hospitalist reviewers came from each of the four participating hospitals. All are board certified internal medicine physicians, who perform both admitting and rounding of patients. None are nocturnists and none have specialist training or experience (in skilled nursing care, geriatrics or palliative care, or fellowship training). There were 11 male reviewers and 6 female; 12 were working full time and 5 part‐time. Two had previous primary care experience. The mean age was 38.1 (range, 3148 years) with an average 7.9 years of experience (119 years).
Six hospitalists accounted for 83% of the reviews. Among these top volume reviewers, the lowest was 17 cases and the highest was 61. There was variability in the number of reviews per hospitalist for two reasons: Some hospitalists joined in the review project earlier than others, and some hospitalists served as liaison for more primary care clinics (or larger ones) and thus had more readmissions to cover. For the purposes of analysis, the six top volume reviewers were compared to each other and to the group of remaining reviewers.
Data Collection
Data were collected via review of both inpatient and ambulatory charts by a hospitalist assigned as liaison to the primary care clinic where the patient had received care prior to hospital admission. In almost all cases (96%), the reviewer was not the discharging hospitalist, in order to provide a fresh perspective on the reasons for readmission.
A structured data collection form was developed in successive iterations by the hospitalists, starting with narrative text to describe the readmission scenario and gradually adding coded fields as themes emerged. A trial form was developed and then modified to final form by consensus discussion, in order to facilitate collection of essential information on patient diagnoses and care process issues (Appendix A). The form includes room for the reviewer to explain in narrative form the circumstances of the initial (index) admission, the readmission, and what happened in the interim. Reviewers were also asked to give their best judgment regarding the relationship between the initial and subsequent admission, whether the readmission was preventable, and potential interventions that could have prevented the readmission. The form went through slight modifications within the study, to eliminate the need for reviewer calculations and to add the more frequent diagnoses and prevention ideas appearing in the Other category.
The 17 physician reviewers were trained by one of the authors (D.K.). For key judgment ratings, definitions were agreed upon by the reviewer group. For ascertaining related admissions, definitions were linked to admitting diagnoses for the readmission and diagnoses listed in the discharge summary of the index admission. For ascertaining preventability, the reviewer decided whether a change in the discharge plan or immediate posthospitalization plan of care would have reduced the likelihood of readmission. Definitions and examples are provided in Appendix B. The two dimensions were intended to be differentthe degree of relatedness of a readmission did not dictate the degree of preventability.
Inter‐rater reliability analyses were not conducted, but data were analyzed by reviewer to determine the importance of reviewer on survey items requiring substantial reviewer judgment. In particular, reviewers were statistically compared on their rating of the relatedness of the initial and subsequent diagnoses using chi‐square. Over the course of the study, additional questions were added to the data collection form, resulting in different numbers of responses for some items.
PASW version 1815 was used for quantitative analyses, to profile readmitted patients and to identify factors important in preventability using the chi‐square and t test statistics. Stata version 1116 was used for hierarchical logistic regression modeling, to gauge the independent effect of various predictors of preventability while controlling for the possible unintended influence of the particular chart reviewer. The study was approved by the local health system institutional review board (IRB).
RESULTS
Two hundred thirteen patients (85%) had a single readmission. Another 33 patients had 2 readmissions, and 5 patients accounted for 21 readmissions for a total sample of 300 cases. Table 1 provides characteristics of readmitted patients. They were likely to be elderly; the mean (SD) age was 75.3 (15.3), and more than 48% were 80 or older. Sixty‐six percent of patients were taking more than ten medications, and a quarter (25%) had more than three new medications prescribed at discharge. Frequent diagnoses at the index admission included renal insufficiency, heart failure, dementia, atrial fibrillation, and chronic obstructive pulmonary disease (COPD). The majority of cases had more than one diagnosis identified at their first admission. These diagnoses are what hospitalists believe are significant patient issues rather than the hospital‐coded principal and secondary diagnoses.
| Characteristics | No. | % |
|---|---|---|
| ||
| Clinical parameter (n = 300 except where noted) | ||
| Age 80 or older | 144 | 48 |
| More than 10 medications at discharge | 197 | 66 |
| More than 3 new medications at discharge | 75 | 25 |
| Diagnoses at index admission* | ||
| Dementia/delirium/altered MS | 86 | 29 |
| Renal insufficiency | 85 | 28 |
| Heart failure | 77 | 26 |
| COPD | 56 | 19 |
| Atrial fibrillation | 51 | 17 |
| Pneumonia | 47 | 16 |
| History of noncompliance | 40 | 13 |
| Respiratory failure | 38 | 13 |
| Urinary tract infection | 30 | 10 |
| Depression/anxiety | 30 | 10 |
| Chemotherapy patient | 17/165 | 10 |
| Anticoagulation medication issues | 22 | 7 |
| Sepsis | 21 | 7 |
| Falls | 12/165 | 7 |
| MI | 18 | 6 |
| CVA | 18 | 6 |
| Readmission culminated in hospice referral | 16 | 5 |
| Sleep apnea | 9/165 | 5 |
| Patient with ongoing substance abuse | 10 | 3 |
Sixty‐four percent readmitted cases had been discharged to home (including those with home services), and 36% were discharged to a care facility (skilled nursing facility [SNF], foster care, assisted living) (Table 2). Fifty‐eight percent of cases were readmitted within seven days of the index admission, and another 29% within the first two weeks. Exactly 75% of the time, the readmission was for the same or related diagnosis as the index admission. Primary care follow‐up did not occur as recommended 69% of the time, and 57% of the time the patient was readmitted prior seeing their primary care physician (PCP).
| Characteristics | No. | % |
|---|---|---|
| ||
| Initial admissions LOS (n = 290) | ||
| 1 day | 33 | 11 |
| 23 days | 112 | 39 |
| 47 days | 108 | 37 |
| 8+ days | 37 | 13 |
| Discharge location (n = 286) | ||
| Home | 130 | 45 |
| SNF or ICF | 76 | 27 |
| Home with HH | 55 | 19 |
| Assisted living facility | 17 | 6 |
| Adult foster care | 8 | 3 |
| Readmit interval in days (n = 296) | ||
| 17 days | 171 | 58 |
| 814 days | 85 | 29 |
| 1521 days | 40 | 14 |
| Related diagnosis? (n = 299) | ||
| Unrelated | 75 | 25 |
| Related | 107 | 36 |
| Same | 117 | 39 |
| Follow‐up appointment did not occur as recommended (n = 166) | 114 | 69 |
| No PCP follow‐up prior to readmission (n = 300) | 172 | 57 |
| No evidence of PCP contact with patient in between hospitalizations (n = 300) | 183 | 61 |
| No evidence of primary care case management prior to readmission (n = 300) | 236 | 79 |
Overall, only 15% of readmissions were termed preventable by the hospital reviewers, although another 46% were deemed possibly preventable. Preventability ratings varied by reviewer, ranging from a high of 27% to a low of 0% among hospitalists rating ten or more cases (Table 3). There was similar variation in the number of recommended interventions. For readmissions deemed preventable or possibly preventable, the number of potential interventions ranged from more than three per patient to less than one per patient.
| Top Volume Reviewers | No. Cases Reviewed | No. (%) Termed Preventable or Possibly Preventable | Total No. Interventions Suggested | Interventions per Preventable Case |
|---|---|---|---|---|
| A | 17 | 3 (18) | 3 | 1.00 |
| B | 41 | 31 (76) | 95 | 3.06 |
| C | 61 | 48 (79) | 111 | 2.31 |
| D | 31 | 12 (39) | 4 | 0.33 |
| E | 34 | 11 (32) | 6 | 0.55 |
| F | 64 | 52 (81) | 120 | 2.31 |
| All others | 50 | 27 (54) | 35 | 1.30 |
| Total | 298 | 184 (62) | 374 | 2.03 |
The most frequently mentioned intervention that could have prevented a readmission was to extend the hospital stay by one to two days (Table 4). An earlier PCP appointment was suggested for another 21% of readmissions. Other interventions received a scattering of mentions. The types of recommended interventions varied with the rater's perception of preventability (Figure 1, available online). Hospitalists were more likely to recommend a longer initial stay, medication changes, or additional education at discharge, and earlier contact from a care facility, for readmissions they thought were preventable. For possibly preventable readmissions, these same recommendations were important, but hospitalists were also likely to recommend case management, disposition to a higher level of care, or a home health visit.
| Interventions | n | % | Total N |
|---|---|---|---|
| |||
| Extend hospital stay by 12 days | 68 | 23 | 300 |
| Earlier PCP follow‐up appointment | 56 | 21 | 269 |
| Primary care case management | 55 | 18 | 300 |
| More end‐of‐life discussion or palliative care consult | 50 | 17 | 300 |
| Different discharge medications/dosage | 48 | 16 | 300 |
| Disposition to a higher level of care | 17 | 13 | 134 |
| Better education re: home management | 17 | 13 | 134 |
| Hospice | 38 | 13 | 300 |
| Home health/home physical therapy visit | 30 | 11 | 269 |
| Nursing home visit by MD or SNF specialist | 24 | 9 | 269 |
| Earlier contact from care facility (SNF, ICF, ALF) | 14 | 5 | 268 |
| Improve medication reconciliation or education | 10 | 4 | 269 |
Table 5 shows the most important characteristics associated with preventability, using a cutoff of 0.2 in statistical significance. Readmissions for the same diagnosis were more likely than others to be rated preventable, as were cases with a short readmission interval, more than three new medications at discharge, and patients with COPD or depression/anxiety. Initial hospital length of stay did not influence preventability, nor did it influence the likelihood of a reviewer recommending a longer initial stay.
| Characteristic | Value | Preventable Portion (%) | P value |
|---|---|---|---|
| |||
| Index vs. readmission diagnosis | Same | 28.2 | <0.001 |
| Related | 8.4 | ||
| Unrelated | 4.1 | ||
| New discharge medications | More than 3 | 25.7 | 0.004 |
| 3 or fewer | 11.8 | ||
| Timing of PCP follow‐up | Readmitted prior to PCP follow‐up | 19.8 | 0.009 |
| Readmitted after PCP follow‐up | 8.7 | ||
| Readmission interval | 1 week or less | 19.3 | 0.012 |
| More than 1 week | 8.8 | ||
| COPD diagnosis | With COPD | 25.5 | 0.018 |
| Without COPD | 12.8 | ||
| Index admission site | Hospital 1 | 14.3 | 0.078 |
| Hospital 2 | 15.1 | ||
| Hospital 3 | 7.1 | ||
| Hospital 4 | 22.7 | ||
| Depression/anxiety diagnosis | With depression | 20.0 | 0.083 |
| Without depression | 9.0 | ||
| Patient on anticoagulation | Anticoagulation | 27.3 | 0.098 |
| No anticoagulation | 14.1 | ||
| Age | Greater than 80 | 12.0 | 0.144 |
| 80 or less | 18.1 | ||
Potential predictors associated with preventability were included in a hierarchical logistic regression model, with hospital site and reviewer included as random effects. In this modeling, preventable readmissions were more likely than nonpreventable readmissions to be influenced by three process factors: having the same index and readmission diagnosis; readmission in the first post‐hospital week; being readmitted prior to a primary care follow‐up; and three patient factors: having more than three new discharge medications, having anticoagulation treatment, and having a COPD diagnosis (data available online). Other chronic diseases, age, discharge location, or previous readmissions were not important in the rating of preventability. When entered as random effects in a hierarchical logistic regression model, the categorical variable representing hospital site did not significantly improve prediction (P = 0.42), but the reviewer variable (categorized by the top six reviewers and others) had marginal significance at P = 0.088.
DISCUSSION
Reported high Medicare 30‐day readmission rates and associate excess costs have created a national climate for eliminating unnecessary hospital readmissions.1 Recently passed healthcare legislation in the USA will put in place diagnosis‐related group (DRG) payment reductions for excess readmission rates by 2013. As the definitions and methodologies for determining the relatedness and preventable nature of readmissions continues to be clarified, this study contributes to the understanding of preventability and specific preventative strategies from a physician perspective. Although potential savings in readmission reduction work is attractive, our study indicates that most front‐line clinicians are not convinced that a large portion of readmissions are preventable.
The proportion of preventable readmissions found in our study is very much in line with previous research.713 Certain predictors of preventable readmissions were also similar. Several researchers have found that preventable readmissions are more likely to be early,8, 10, 12 and have the same or related diagnosis as the initial stay.8 On the other hand, our data did not show an independent effect of age on preventability, as others have suggested.9, 17 Patients with a large number of diagnoses and medications have been shown to be at risk for preventable readmissions,9 but the importance of new discharge medications has not been widely researched and is a factor that deserves further exploration.
One key message from our study was found in the variation in the ratings of preventability by individual physicians. At first blush, it may appear to reflect a lack of inter‐rater reliability or understanding of the underlying concept of preventability. We believe this is unlikely, given the discussions among raters and the clear descriptions offered in writing. Moreover, there was much less variation in other judgments such as the ratings of relatedness of the readmission diagnosis (chi‐square = 21.7, P = .041)
There are a number of possible reasons for variation in reviewer ratings of preventability. Reviewers did vary with regard to age, experience, tenure in the organization, gender, and full/part‐time status. They practiced at different hospitals. None of these factors were related to ratings of preventability. On the other hand, three explanations are worth noting.
First, the hierarchical regression models found that reviewer only slightly improved prediction (P = 0.088), above and beyond the other diagnosis and process factors. This would lead us to reject the factor of reviewer as the most important predictor of preventability; the other case characteristics mentioned above were more important.
Second, the three hospitalists who were more optimistic (rated more cases as preventable) reviewed more charts than others. It is possible that these three were more engaged, not only in the chart review process, but more eager to uncover potential remedies to prevent readmissions. While generating more ideas about how to do that, they rated more readmissions as preventable. We do not believe that actually doing more reviews caused them to rate a greater portion as preventable; none of the reviewers showed progression to more preventable ratings over time (analysis not shown).
Finally, it is worth noting that two of the more optimistic physicians had previous primary care experience. This is an intriguing explanation that would benefit from further research. First‐hand experience with primary care case management, rapid appointment follow‐up, home service referrals, and the like may give the practicing hospitalist reason to believe that actions in the ambulatory setting can prevent readmissions.
Regardless of the source, the variation demonstrates cultural or philosophical biases among clinicians regarding how much influence additional planning, education, and care coordination can have on readmissions. We believe that this variation must be addressed in the implementation of readmission reduction programs. Physician engagement will be more likely if there is optimism about the potential to prevent readmissions. In addition, it will be important to develop more consensus about effective interventions from the perspectives of hospital physicians, primary care physicians, nurses, and patients, as others have alluded.18, 19
The significant rate of related readmissions (75%) has implications for the potential Centers for Medicare and Medicaid Services (CMS) methodology that will be used to reduce DRG payments, given the legislation's current intent to exclude only unrelated and planned readmissions from the calculations. Providing clear definitions on relatedness and a methodology to code this criterion in administrative datasets may need to be developed. The views of hospitalists in the current study suggest that the relatedness methodology may be overly sensitive and not yet specific enough to isolate truly preventable readmissions. Less than a quarter of related readmissions were deemed preventable by these raters.
Hospitalists found both patient and process factors important in assessing the preventability of a readmission. This kind of analysis can point to subgroups with potential for targeted intervention. For example, over a third of patients readmitted within a week for the same diagnosis were rated as preventable, indicating a critical follow‐up period for some patients. Higher ratings of preventability among the readmissions for patients on anticoagulation or who were given more than three new medications at discharge indicates that better medication management may indeed be a fruitful strategy for readmission reduction.
The finding that increasing the length of the initial hospital stay was rated as the most prevalent strategy to mitigate against readmission in our retrospective review was surprising. It emphasizes the tension between efficient hospital throughput which reduces unnecessary hospital days and the necessity for appropriate monitoring to ensure clinical stability prior to discharge. Excess hospital days can prolong the exposure to a multitude of hospital acquired conditions (HAC), and this risk must be weighed against a longer length of stay and the time required delivering the appropriate hospital services.
Exploring alternative strategies to reduce readmissions without increasing the hospital length of stay is a reasonable response to this tension. Better discharge education and attention to discharge medications and dosages were also recommended strategies for preventable readmissions. These are interventions hospitalists are familiar with and can control. Relatively smaller percentages of patients were thought to benefit from case management, hospice, home health, or an MD visit to their nursing home, and hospitalists were more likely to recommend these for the possibly preventable patients. These interventions are not fully implemented within the study health system so there is understandably less confidence in them.
Limitations of this study include its relatively small sample size and the fact that all patients were served by a single medical practice. No extensive inter‐rater reliability checks were performed, although all reviewers were trained in the definitions of the most important judgment items. Other limitations include possible confounding biases which were not controlled, such as the number of charts reviewed, timing of review, and hospital reviewed (ie, each reviewer did not review the same proportion of charts from each hospital).
SUMMARY
We have presented a retrospective chart review study of hospital readmissions in a community hospital setting. This study adds to the increasing literature describing the factors that contribute to hospital readmissions, how preventable they are, and what strategies may reduce the likelihood of readmission. This study is unique in its contribution to the understanding of hospital readmissions by studying front‐line clinician (hospitalist) perceptions of those factors.
Acknowledgements
The authors express their appreciation to the following clinicians for their review of patient charts, revisions to the chart review tool, and contributions to the interpretation of study data: Adam Blomberg, MD; Adam Mizgajski, MD; Alison Ma, MD; Amy Carolan, MD; Amy Johnson, MD; Brian Kearns, MD; Christopher Zaugra, MD; Frank Joerke, MD; Janhavi Meghashyam, MD; Jennifer M. Wilson, MD; Larie Hoover, MD; Patrick J. Gaston, MD; Scott Kemeny, MD; Sean Tushla, MD; Timothy Dygert, MD; and Vinay Siddappa, MD. The authors are also grateful to Eileen O'Reilly‐Hoisington who created the online chart‐review forms and extracted data for the analysis.
- The Library of Congress. Thomas H.R. 3590 Bill Summary 360:1418–1428.
- ,.Preventing the preventable: reducing rehospitalizations through coordinated, patient‐centered discharge processes.Prof Case Manag.2009;14:135–140.
- Agency for Healthcare Research and Quality, Rockville, MD. Preventable Hospitalizations: a Window into Primary and Preventive Care, 2000. Available at: http://www.ahrq.gov/data/hcup/factbk5/. Accessed June 18,2010.
- ,,, et al.Classifying general medicine readmissions. Are they preventable? Veterans Affairs Cooperative Studies in Health Services Group on Primary Care and Hospital Readmissions.J Gen Intern Med.1996;11:597–607.
- ,,.Early readmissions to the department of medicine as a screening tool for monitoring quality of care problems.Medicine (Baltimore).2008;87:294–300.
- ,,, et al.Assessing the preventability of emergency hospital admissions. A method for evaluating the quality of medical care in a primary care facility.Am J Med.1987;83:1031–1036.
- .Are readmissions avoidable?BMJ.1990;301:1136–1138.
- ,,,,.How does managed care manage the frail elderly? The case of hospital readmissions in fee‐for‐service versus HMO systems.Am J Prev Med.1999;16:163–172.
- ,,.Preventability of emergent hospital readmission.Am J Med.1991;90:667–674.
- ,,,.Readmissions to a geriatric medical unit: is prevention possible?Aging Clin Exp Res.1992;4:61–67.
- Medicare Payment Advisory Commission. Payment policy for inpatient readmissions. In: Report to the Congress: Promoting Greater Efficiency in Medicare. Available at: http://www.medpac.gov/chapters/Jun07_Ch05.pdf. Accessed February 9,2010.
- PASW Statistics. Version 18.Chicago, IL:SPSS Inc, an IBM Company;2010.
- Stata Statistical Software: Release 11. Version 18.College Station, TX:StataCorp LP;2009.
- ,,,,,.Measuring potentially avoidable hospital readmissions.J Clin Epidemiol.2002;55(6):573–587.
- ,,,.Unplanned readmission to hospital: a comparison of the views of general practitioners and hospital staff.Age Ageing.2002;31:141–143.
- ,,.Reasons for readmission in heart failure: perspectives of patients, caregivers, cardiologists, and heart failure nurses.Heart Lung.2009;38:427–434.
Hospital readmissions have become a focus of national attention as a potential indicator of poor quality and health care waste.13 Geographic variations in readmission rates, a high rate of unplanned readmissions, and the emergence of promising interventions all suggest that some portion of readmissions are preventable.4, 5 This work adds to the work of the Agency for Healthcare Research and Quality (AHRQ) on reports of preventable hospital admissions, using hospitalization rates for ambulatory‐sensitive conditions as prevention quality indicators.6
The actual proportion of preventable readmissions is unknown. In previous research using physician reviewers, estimates have ranged from 5% to 38%.713 More recently, studies using a methodology based on relationships between diagnoses at the initial and subsequent hospitalizations have flagged as many as 76% of 30‐day readmissions as preventable.14
Understanding the preventability of readmissions is important if we are to gauge the true size of this quality and cost opportunity. Moreover, it is important to assess the beliefs of the front‐line clinicians who will be playing key roles in prevention.
The objective of the current study was to examine readmission preventability from the perspective of hospital medicine experts practicing at a community hospital. Through detailed chart review, we identify patient factors and care processes that affect preventability and describe clinicians' ideas for preventing future readmissions.
METHODS
Setting
The study took place within four community hospitals in Portland, OR, all staffed by a single hospitalist group. The hospitals included two large (483 and 525 bed) tertiary facilities with internal medicine residency programs and two smaller (77 and 40 bed) suburban hospitals, one of which has a family practice residency. The hospitalists are part of an employed medical group owned by the health care system. Each of the hospitalists is assigned as a liaison to a single primary care clinic as a means of fostering collaboration between primary care physicians and their hospital medicine colleagues.
Patients
Eligible patients were those discharged from one of these four hospitals, between January 2009 and May 2010, who had a hospitalist consult during their stay and were cared for in a system primary care clinic. The vast majority of patients were discharged by one of the internal medicine hospitalists (and all had an internal medicine consultation), thus most had medical rather than surgical diagnoses. Acute care and ambulatory care charts were reviewed for all patients readmitted within 21 days after their discharge date. The 21‐day window (rather than the customary 30‐day time period) was chosen to emphasize near‐term returns to the hospital. Hospital transfers and patients discharged to inpatient rehabilitation or inpatient mental health were excluded from the study as not representing a true readmission.
A total of 300 consecutive patient charts meeting these criteria were reviewed. These included patients readmitted multiple times. Each readmission was counted as a separate case.
Reviewers
Hospitalist reviewers came from each of the four participating hospitals. All are board certified internal medicine physicians, who perform both admitting and rounding of patients. None are nocturnists and none have specialist training or experience (in skilled nursing care, geriatrics or palliative care, or fellowship training). There were 11 male reviewers and 6 female; 12 were working full time and 5 part‐time. Two had previous primary care experience. The mean age was 38.1 (range, 3148 years) with an average 7.9 years of experience (119 years).
Six hospitalists accounted for 83% of the reviews. Among these top volume reviewers, the lowest was 17 cases and the highest was 61. There was variability in the number of reviews per hospitalist for two reasons: Some hospitalists joined in the review project earlier than others, and some hospitalists served as liaison for more primary care clinics (or larger ones) and thus had more readmissions to cover. For the purposes of analysis, the six top volume reviewers were compared to each other and to the group of remaining reviewers.
Data Collection
Data were collected via review of both inpatient and ambulatory charts by a hospitalist assigned as liaison to the primary care clinic where the patient had received care prior to hospital admission. In almost all cases (96%), the reviewer was not the discharging hospitalist, in order to provide a fresh perspective on the reasons for readmission.
A structured data collection form was developed in successive iterations by the hospitalists, starting with narrative text to describe the readmission scenario and gradually adding coded fields as themes emerged. A trial form was developed and then modified to final form by consensus discussion, in order to facilitate collection of essential information on patient diagnoses and care process issues (Appendix A). The form includes room for the reviewer to explain in narrative form the circumstances of the initial (index) admission, the readmission, and what happened in the interim. Reviewers were also asked to give their best judgment regarding the relationship between the initial and subsequent admission, whether the readmission was preventable, and potential interventions that could have prevented the readmission. The form went through slight modifications within the study, to eliminate the need for reviewer calculations and to add the more frequent diagnoses and prevention ideas appearing in the Other category.
The 17 physician reviewers were trained by one of the authors (D.K.). For key judgment ratings, definitions were agreed upon by the reviewer group. For ascertaining related admissions, definitions were linked to admitting diagnoses for the readmission and diagnoses listed in the discharge summary of the index admission. For ascertaining preventability, the reviewer decided whether a change in the discharge plan or immediate posthospitalization plan of care would have reduced the likelihood of readmission. Definitions and examples are provided in Appendix B. The two dimensions were intended to be differentthe degree of relatedness of a readmission did not dictate the degree of preventability.
Inter‐rater reliability analyses were not conducted, but data were analyzed by reviewer to determine the importance of reviewer on survey items requiring substantial reviewer judgment. In particular, reviewers were statistically compared on their rating of the relatedness of the initial and subsequent diagnoses using chi‐square. Over the course of the study, additional questions were added to the data collection form, resulting in different numbers of responses for some items.
PASW version 1815 was used for quantitative analyses, to profile readmitted patients and to identify factors important in preventability using the chi‐square and t test statistics. Stata version 1116 was used for hierarchical logistic regression modeling, to gauge the independent effect of various predictors of preventability while controlling for the possible unintended influence of the particular chart reviewer. The study was approved by the local health system institutional review board (IRB).
RESULTS
Two hundred thirteen patients (85%) had a single readmission. Another 33 patients had 2 readmissions, and 5 patients accounted for 21 readmissions for a total sample of 300 cases. Table 1 provides characteristics of readmitted patients. They were likely to be elderly; the mean (SD) age was 75.3 (15.3), and more than 48% were 80 or older. Sixty‐six percent of patients were taking more than ten medications, and a quarter (25%) had more than three new medications prescribed at discharge. Frequent diagnoses at the index admission included renal insufficiency, heart failure, dementia, atrial fibrillation, and chronic obstructive pulmonary disease (COPD). The majority of cases had more than one diagnosis identified at their first admission. These diagnoses are what hospitalists believe are significant patient issues rather than the hospital‐coded principal and secondary diagnoses.
| Characteristics | No. | % |
|---|---|---|
| ||
| Clinical parameter (n = 300 except where noted) | ||
| Age 80 or older | 144 | 48 |
| More than 10 medications at discharge | 197 | 66 |
| More than 3 new medications at discharge | 75 | 25 |
| Diagnoses at index admission* | ||
| Dementia/delirium/altered MS | 86 | 29 |
| Renal insufficiency | 85 | 28 |
| Heart failure | 77 | 26 |
| COPD | 56 | 19 |
| Atrial fibrillation | 51 | 17 |
| Pneumonia | 47 | 16 |
| History of noncompliance | 40 | 13 |
| Respiratory failure | 38 | 13 |
| Urinary tract infection | 30 | 10 |
| Depression/anxiety | 30 | 10 |
| Chemotherapy patient | 17/165 | 10 |
| Anticoagulation medication issues | 22 | 7 |
| Sepsis | 21 | 7 |
| Falls | 12/165 | 7 |
| MI | 18 | 6 |
| CVA | 18 | 6 |
| Readmission culminated in hospice referral | 16 | 5 |
| Sleep apnea | 9/165 | 5 |
| Patient with ongoing substance abuse | 10 | 3 |
Sixty‐four percent readmitted cases had been discharged to home (including those with home services), and 36% were discharged to a care facility (skilled nursing facility [SNF], foster care, assisted living) (Table 2). Fifty‐eight percent of cases were readmitted within seven days of the index admission, and another 29% within the first two weeks. Exactly 75% of the time, the readmission was for the same or related diagnosis as the index admission. Primary care follow‐up did not occur as recommended 69% of the time, and 57% of the time the patient was readmitted prior seeing their primary care physician (PCP).
| Characteristics | No. | % |
|---|---|---|
| ||
| Initial admissions LOS (n = 290) | ||
| 1 day | 33 | 11 |
| 23 days | 112 | 39 |
| 47 days | 108 | 37 |
| 8+ days | 37 | 13 |
| Discharge location (n = 286) | ||
| Home | 130 | 45 |
| SNF or ICF | 76 | 27 |
| Home with HH | 55 | 19 |
| Assisted living facility | 17 | 6 |
| Adult foster care | 8 | 3 |
| Readmit interval in days (n = 296) | ||
| 17 days | 171 | 58 |
| 814 days | 85 | 29 |
| 1521 days | 40 | 14 |
| Related diagnosis? (n = 299) | ||
| Unrelated | 75 | 25 |
| Related | 107 | 36 |
| Same | 117 | 39 |
| Follow‐up appointment did not occur as recommended (n = 166) | 114 | 69 |
| No PCP follow‐up prior to readmission (n = 300) | 172 | 57 |
| No evidence of PCP contact with patient in between hospitalizations (n = 300) | 183 | 61 |
| No evidence of primary care case management prior to readmission (n = 300) | 236 | 79 |
Overall, only 15% of readmissions were termed preventable by the hospital reviewers, although another 46% were deemed possibly preventable. Preventability ratings varied by reviewer, ranging from a high of 27% to a low of 0% among hospitalists rating ten or more cases (Table 3). There was similar variation in the number of recommended interventions. For readmissions deemed preventable or possibly preventable, the number of potential interventions ranged from more than three per patient to less than one per patient.
| Top Volume Reviewers | No. Cases Reviewed | No. (%) Termed Preventable or Possibly Preventable | Total No. Interventions Suggested | Interventions per Preventable Case |
|---|---|---|---|---|
| A | 17 | 3 (18) | 3 | 1.00 |
| B | 41 | 31 (76) | 95 | 3.06 |
| C | 61 | 48 (79) | 111 | 2.31 |
| D | 31 | 12 (39) | 4 | 0.33 |
| E | 34 | 11 (32) | 6 | 0.55 |
| F | 64 | 52 (81) | 120 | 2.31 |
| All others | 50 | 27 (54) | 35 | 1.30 |
| Total | 298 | 184 (62) | 374 | 2.03 |
The most frequently mentioned intervention that could have prevented a readmission was to extend the hospital stay by one to two days (Table 4). An earlier PCP appointment was suggested for another 21% of readmissions. Other interventions received a scattering of mentions. The types of recommended interventions varied with the rater's perception of preventability (Figure 1, available online). Hospitalists were more likely to recommend a longer initial stay, medication changes, or additional education at discharge, and earlier contact from a care facility, for readmissions they thought were preventable. For possibly preventable readmissions, these same recommendations were important, but hospitalists were also likely to recommend case management, disposition to a higher level of care, or a home health visit.
| Interventions | n | % | Total N |
|---|---|---|---|
| |||
| Extend hospital stay by 12 days | 68 | 23 | 300 |
| Earlier PCP follow‐up appointment | 56 | 21 | 269 |
| Primary care case management | 55 | 18 | 300 |
| More end‐of‐life discussion or palliative care consult | 50 | 17 | 300 |
| Different discharge medications/dosage | 48 | 16 | 300 |
| Disposition to a higher level of care | 17 | 13 | 134 |
| Better education re: home management | 17 | 13 | 134 |
| Hospice | 38 | 13 | 300 |
| Home health/home physical therapy visit | 30 | 11 | 269 |
| Nursing home visit by MD or SNF specialist | 24 | 9 | 269 |
| Earlier contact from care facility (SNF, ICF, ALF) | 14 | 5 | 268 |
| Improve medication reconciliation or education | 10 | 4 | 269 |
Table 5 shows the most important characteristics associated with preventability, using a cutoff of 0.2 in statistical significance. Readmissions for the same diagnosis were more likely than others to be rated preventable, as were cases with a short readmission interval, more than three new medications at discharge, and patients with COPD or depression/anxiety. Initial hospital length of stay did not influence preventability, nor did it influence the likelihood of a reviewer recommending a longer initial stay.
| Characteristic | Value | Preventable Portion (%) | P value |
|---|---|---|---|
| |||
| Index vs. readmission diagnosis | Same | 28.2 | <0.001 |
| Related | 8.4 | ||
| Unrelated | 4.1 | ||
| New discharge medications | More than 3 | 25.7 | 0.004 |
| 3 or fewer | 11.8 | ||
| Timing of PCP follow‐up | Readmitted prior to PCP follow‐up | 19.8 | 0.009 |
| Readmitted after PCP follow‐up | 8.7 | ||
| Readmission interval | 1 week or less | 19.3 | 0.012 |
| More than 1 week | 8.8 | ||
| COPD diagnosis | With COPD | 25.5 | 0.018 |
| Without COPD | 12.8 | ||
| Index admission site | Hospital 1 | 14.3 | 0.078 |
| Hospital 2 | 15.1 | ||
| Hospital 3 | 7.1 | ||
| Hospital 4 | 22.7 | ||
| Depression/anxiety diagnosis | With depression | 20.0 | 0.083 |
| Without depression | 9.0 | ||
| Patient on anticoagulation | Anticoagulation | 27.3 | 0.098 |
| No anticoagulation | 14.1 | ||
| Age | Greater than 80 | 12.0 | 0.144 |
| 80 or less | 18.1 | ||
Potential predictors associated with preventability were included in a hierarchical logistic regression model, with hospital site and reviewer included as random effects. In this modeling, preventable readmissions were more likely than nonpreventable readmissions to be influenced by three process factors: having the same index and readmission diagnosis; readmission in the first post‐hospital week; being readmitted prior to a primary care follow‐up; and three patient factors: having more than three new discharge medications, having anticoagulation treatment, and having a COPD diagnosis (data available online). Other chronic diseases, age, discharge location, or previous readmissions were not important in the rating of preventability. When entered as random effects in a hierarchical logistic regression model, the categorical variable representing hospital site did not significantly improve prediction (P = 0.42), but the reviewer variable (categorized by the top six reviewers and others) had marginal significance at P = 0.088.
DISCUSSION
Reported high Medicare 30‐day readmission rates and associate excess costs have created a national climate for eliminating unnecessary hospital readmissions.1 Recently passed healthcare legislation in the USA will put in place diagnosis‐related group (DRG) payment reductions for excess readmission rates by 2013. As the definitions and methodologies for determining the relatedness and preventable nature of readmissions continues to be clarified, this study contributes to the understanding of preventability and specific preventative strategies from a physician perspective. Although potential savings in readmission reduction work is attractive, our study indicates that most front‐line clinicians are not convinced that a large portion of readmissions are preventable.
The proportion of preventable readmissions found in our study is very much in line with previous research.713 Certain predictors of preventable readmissions were also similar. Several researchers have found that preventable readmissions are more likely to be early,8, 10, 12 and have the same or related diagnosis as the initial stay.8 On the other hand, our data did not show an independent effect of age on preventability, as others have suggested.9, 17 Patients with a large number of diagnoses and medications have been shown to be at risk for preventable readmissions,9 but the importance of new discharge medications has not been widely researched and is a factor that deserves further exploration.
One key message from our study was found in the variation in the ratings of preventability by individual physicians. At first blush, it may appear to reflect a lack of inter‐rater reliability or understanding of the underlying concept of preventability. We believe this is unlikely, given the discussions among raters and the clear descriptions offered in writing. Moreover, there was much less variation in other judgments such as the ratings of relatedness of the readmission diagnosis (chi‐square = 21.7, P = .041)
There are a number of possible reasons for variation in reviewer ratings of preventability. Reviewers did vary with regard to age, experience, tenure in the organization, gender, and full/part‐time status. They practiced at different hospitals. None of these factors were related to ratings of preventability. On the other hand, three explanations are worth noting.
First, the hierarchical regression models found that reviewer only slightly improved prediction (P = 0.088), above and beyond the other diagnosis and process factors. This would lead us to reject the factor of reviewer as the most important predictor of preventability; the other case characteristics mentioned above were more important.
Second, the three hospitalists who were more optimistic (rated more cases as preventable) reviewed more charts than others. It is possible that these three were more engaged, not only in the chart review process, but more eager to uncover potential remedies to prevent readmissions. While generating more ideas about how to do that, they rated more readmissions as preventable. We do not believe that actually doing more reviews caused them to rate a greater portion as preventable; none of the reviewers showed progression to more preventable ratings over time (analysis not shown).
Finally, it is worth noting that two of the more optimistic physicians had previous primary care experience. This is an intriguing explanation that would benefit from further research. First‐hand experience with primary care case management, rapid appointment follow‐up, home service referrals, and the like may give the practicing hospitalist reason to believe that actions in the ambulatory setting can prevent readmissions.
Regardless of the source, the variation demonstrates cultural or philosophical biases among clinicians regarding how much influence additional planning, education, and care coordination can have on readmissions. We believe that this variation must be addressed in the implementation of readmission reduction programs. Physician engagement will be more likely if there is optimism about the potential to prevent readmissions. In addition, it will be important to develop more consensus about effective interventions from the perspectives of hospital physicians, primary care physicians, nurses, and patients, as others have alluded.18, 19
The significant rate of related readmissions (75%) has implications for the potential Centers for Medicare and Medicaid Services (CMS) methodology that will be used to reduce DRG payments, given the legislation's current intent to exclude only unrelated and planned readmissions from the calculations. Providing clear definitions on relatedness and a methodology to code this criterion in administrative datasets may need to be developed. The views of hospitalists in the current study suggest that the relatedness methodology may be overly sensitive and not yet specific enough to isolate truly preventable readmissions. Less than a quarter of related readmissions were deemed preventable by these raters.
Hospitalists found both patient and process factors important in assessing the preventability of a readmission. This kind of analysis can point to subgroups with potential for targeted intervention. For example, over a third of patients readmitted within a week for the same diagnosis were rated as preventable, indicating a critical follow‐up period for some patients. Higher ratings of preventability among the readmissions for patients on anticoagulation or who were given more than three new medications at discharge indicates that better medication management may indeed be a fruitful strategy for readmission reduction.
The finding that increasing the length of the initial hospital stay was rated as the most prevalent strategy to mitigate against readmission in our retrospective review was surprising. It emphasizes the tension between efficient hospital throughput which reduces unnecessary hospital days and the necessity for appropriate monitoring to ensure clinical stability prior to discharge. Excess hospital days can prolong the exposure to a multitude of hospital acquired conditions (HAC), and this risk must be weighed against a longer length of stay and the time required delivering the appropriate hospital services.
Exploring alternative strategies to reduce readmissions without increasing the hospital length of stay is a reasonable response to this tension. Better discharge education and attention to discharge medications and dosages were also recommended strategies for preventable readmissions. These are interventions hospitalists are familiar with and can control. Relatively smaller percentages of patients were thought to benefit from case management, hospice, home health, or an MD visit to their nursing home, and hospitalists were more likely to recommend these for the possibly preventable patients. These interventions are not fully implemented within the study health system so there is understandably less confidence in them.
Limitations of this study include its relatively small sample size and the fact that all patients were served by a single medical practice. No extensive inter‐rater reliability checks were performed, although all reviewers were trained in the definitions of the most important judgment items. Other limitations include possible confounding biases which were not controlled, such as the number of charts reviewed, timing of review, and hospital reviewed (ie, each reviewer did not review the same proportion of charts from each hospital).
SUMMARY
We have presented a retrospective chart review study of hospital readmissions in a community hospital setting. This study adds to the increasing literature describing the factors that contribute to hospital readmissions, how preventable they are, and what strategies may reduce the likelihood of readmission. This study is unique in its contribution to the understanding of hospital readmissions by studying front‐line clinician (hospitalist) perceptions of those factors.
Acknowledgements
The authors express their appreciation to the following clinicians for their review of patient charts, revisions to the chart review tool, and contributions to the interpretation of study data: Adam Blomberg, MD; Adam Mizgajski, MD; Alison Ma, MD; Amy Carolan, MD; Amy Johnson, MD; Brian Kearns, MD; Christopher Zaugra, MD; Frank Joerke, MD; Janhavi Meghashyam, MD; Jennifer M. Wilson, MD; Larie Hoover, MD; Patrick J. Gaston, MD; Scott Kemeny, MD; Sean Tushla, MD; Timothy Dygert, MD; and Vinay Siddappa, MD. The authors are also grateful to Eileen O'Reilly‐Hoisington who created the online chart‐review forms and extracted data for the analysis.
- The Library of Congress. Thomas H.R. 3590 Bill Summary 360:1418–1428.
- ,.Preventing the preventable: reducing rehospitalizations through coordinated, patient‐centered discharge processes.Prof Case Manag.2009;14:135–140.
- Agency for Healthcare Research and Quality, Rockville, MD. Preventable Hospitalizations: a Window into Primary and Preventive Care, 2000. Available at: http://www.ahrq.gov/data/hcup/factbk5/. Accessed June 18,2010.
- ,,, et al.Classifying general medicine readmissions. Are they preventable? Veterans Affairs Cooperative Studies in Health Services Group on Primary Care and Hospital Readmissions.J Gen Intern Med.1996;11:597–607.
- ,,.Early readmissions to the department of medicine as a screening tool for monitoring quality of care problems.Medicine (Baltimore).2008;87:294–300.
- ,,, et al.Assessing the preventability of emergency hospital admissions. A method for evaluating the quality of medical care in a primary care facility.Am J Med.1987;83:1031–1036.
- .Are readmissions avoidable?BMJ.1990;301:1136–1138.
- ,,,,.How does managed care manage the frail elderly? The case of hospital readmissions in fee‐for‐service versus HMO systems.Am J Prev Med.1999;16:163–172.
- ,,.Preventability of emergent hospital readmission.Am J Med.1991;90:667–674.
- ,,,.Readmissions to a geriatric medical unit: is prevention possible?Aging Clin Exp Res.1992;4:61–67.
- Medicare Payment Advisory Commission. Payment policy for inpatient readmissions. In: Report to the Congress: Promoting Greater Efficiency in Medicare. Available at: http://www.medpac.gov/chapters/Jun07_Ch05.pdf. Accessed February 9,2010.
- PASW Statistics. Version 18.Chicago, IL:SPSS Inc, an IBM Company;2010.
- Stata Statistical Software: Release 11. Version 18.College Station, TX:StataCorp LP;2009.
- ,,,,,.Measuring potentially avoidable hospital readmissions.J Clin Epidemiol.2002;55(6):573–587.
- ,,,.Unplanned readmission to hospital: a comparison of the views of general practitioners and hospital staff.Age Ageing.2002;31:141–143.
- ,,.Reasons for readmission in heart failure: perspectives of patients, caregivers, cardiologists, and heart failure nurses.Heart Lung.2009;38:427–434.
Copyright © 2011 Society of Hospital Medicine
Prevalence and management of hypertension in the inpatient setting: A systematic review
If you wish to receive credit for this activity, please refer to the website:
Accreditation and Designation Statement
Blackwell Futura Media Services designates this journal‐based CME activity for a maximum of 1 AMA PRA Category 1 Credit.. Physicians should only claim credit commensurate with the extent of their participation in the activity.
Blackwell Futura Media Services is accredited by the Accreditation Council for Continuing Medical Education to provide continuing medical education for physicians.
Educational Objectives
The objectives need to be changed. Please remove the existing ones, and include these two:
-
To describe the correlation between inpatient and outpatient blood pressure measurements.
-
To assess the potential benefits of prescribing antihypertensive medication in hospitalized patients with hypertension.
This manuscript underwent peer review in line with the standards of editorial integrity and publication ethics maintained by Journal of Hospital Medicine. The peer reviewers have no relevant financial relationships. The peer review process for Journal of Hospital Medicine is single‐blinded. As such, the identities of the reviewers are not disclosed in line with the standard accepted practices of medical journal peer review.
Conflicts of interest have been identified and resolved in accordance with Blackwell Futura Media Services's Policy on Activity Disclosure and Conflict of Interest. The primary resolution method used was peer review and review by a non‐conflicted expert.
Instructions on Receiving Credit
For information on applicability and acceptance of CME credit for this activity, please consult your professional licensing board.
This activity is designed to be completed within an hour; physicians should claim only those credits that reflect the time actually spent in the activity. To successfully earn credit, participants must complete the activity during the valid credit period, which is up to two years from initial publication.
Follow these steps to earn credit:
-
Log on to www.wileyblackwellcme.com
-
Read the target audience, learning objectives, and author disclosures.
-
Read the article in print or online format.
-
Reflect on the article.
-
Access the CME Exam, and choose the best answer to each question.
-
Complete the required evaluation component of the activity.
This activity will be available for CME credit for twelve months following its publication date. At that time, it will be reviewed and potentially updated and extended for an additional twelve months.
OSTE for Hospitalist Teaching During FCR
Providing family centered care has been identified as a goal in the Institute of Medicine's report Crossing the Quality Chiasm1 and endorsed by the American Academy of Pediatrics.2 Traditionally, rounds are the central organizing structure for clinical work, decision making, and teaching in the inpatient setting. Patient care and educational goals emanate from rounds. Over the past several decades rounds have migrated from the patient's bedside to the privacy of the conference room. In our experience, although conference room rounds offer some advantages, patients and families are not privy to the data or decision‐making process used to determine their diagnosis and plan of care. The ritual that frequently occurs after conference‐room rounds is that the team members (medical students, residents, nurses, attending) visit the patient and family independently throughout the course of the day, communicating their understanding of medical and affective issues in a manner that families often view as providing confusing, if not contradictory information.
Conducting rounds entirely at the bedside can bypass this systemic flaw, allowing parents and patients to correct inaccurate data, and enable them to make their values and concerns known to the team. This model can help to connect the caregivers and receivers of care, and represents a collaborative communication process, the foundation for effective family‐centered rounds (FCR). When team members discuss how they interpret clinical data in the presence of the family it helps them to understand how and why a management plan is conceived. The care team develops an alliance of trust with the family through this transparent communication and joint decision‐making.
Despite the potential for enhancing patient/family satisfaction and endorsements by public and professional organizations, in a recent study less than half of pediatric hospitalists reported conducting FCR.3 Trainees and attending physicians raised concerns about the potential for FCR to waste time and diminish teaching.4 Trainees' perceptions of the educational value of FCR has not been well studied, but a recent qualitative study of pediatric residents reported that if conducted well, FCRs enhance education and clinical skills by increasing the number of patients seen by each team member, and by offering opportunities to improve physical examination skills. Trainees appreciated role‐modeling and realtime feedback by attending physicians. Senior residents reported enhanced leadership and teaching opportunities.5
The aim of this study was to design and implement a faculty development program to address the need of our junior hospitalist faculty members to enhance teaching during FCR.
Methods
We determined, based upon direct observation, a focus group and survey feedback from our pediatric residents, that for inpatient teaching during FCR to be successful, our faculty needed training in the following areas: orienting learners, providing feedback, teaching assessment of key physical exam findings, correcting errors in clinical reasoning, and promoting the role of the senior resident as team leader. We developed the Observed Structured Teaching Exercises (OSTE)6 and related workshops to promote key behaviors identified from the literature for each of the areas.
All of the Children's National Medical Center (CNMC) Pediatric hospitalists (N = 14) who were not investigators in the study were asked to participate. They were informed of the study design and the overall goal of making inpatient rounds more effective and efficient through better teaching skills. The study was approved by the CNMC institutional review board and was conducted from August to September 2007 in the CLASS (Clinical Learning and Simulation Skills) at The George Washington University School of Medicine and Health Sciences.
To assess faculty and fellow baseline knowledge and skills, the authors conducted a preintervention OSTE consisting of 4 stations: 1) physical exam interpretation and promoting PL‐3 autonomy (Established Patient), 2) stimulating clinical reasoning (New Patient), 3) feedback, and 4) facilitating an orientation. This exercise was followed within 2 weeks by four 90‐minute interactive workshops that focused on the topic areas as evaluated in the OSTEs. Each workshop consisted of a brief evidence‐based didactic component, interactive discussion, and skill building exercises to practice desired teaching behaviors. Two weeks following the workshops, the group participated in postintervention OSTEs similar to the preintervention scenarios, with minor changes, such as presenting diagnoses, to avoid pattern recognition.
Development of the Evaluation Process
The authors reviewed the literature on providing effective feedback7 and orientation8; in teaching a skill9; promoting senior resident autonomy10 and clinical reasoning.11 We also reviewed the faculty development literature12, 13 to determine which behaviors were found to be effective specifically for promoting teaching during FCR, but no studies specifically addressed evaluation of teaching skills during FCR. Checklists were created based on the evidence in the literature and supplemented by the consensus of the investigators when there was no evidence available (see Supp. Appendix S1, which is available online).
Two stations simulating FCR (physical exam interpretation and promoting PL‐3 autonomy [Established Patient]; and stimulating clinical reasoning [New Patient]), each used 2 Standardized Learners (SL) and 1 Standardized Parent (SP). The patient was portrayed using a poster or simulator. The stations simulating feedback and orientation used 1 SL. To conduct 14 pre‐ and post‐OSTEs, we used a total of 5 SPs and 20 SLs. The SPs were recruited from a cohort of individuals that regularly participate in OSCE teaching and evaluation scenarios in the CLASS Center. The SLs were 4th year medical students enrolled in the TALKS (Teaching and Learning Communication Skills) elective and trained how to portray SLs.14
Training consisted of advanced distribution of specific scripts to SPs/SLs and practice through role playing the scenarios with study investigators acting as the attending hospitalist. The SP/SLs and investigators tried to anticipate several possible ways participants might react to the scenarios so that SPs and SLs could standardize their responses and interrater reliability for rating checklists of desired teaching behaviors. SLs rated faculty according to the teaching behavior template during a 5‐minute interval immediately after each OSTE. Different SLs were used for pre‐ versus postintervention OSTEs and were unaware of the intervention itself or whether faculty participants were pre‐ or postintervention.
Each of the 4 OSTE stations began with the hospitalist reading a brief paragraph describing the scenario and the overall goals for the OSTE. SLs/SPs acted out scripts designed by investigators to provide opportunities for hospitalists to demonstrate desired teaching behaviors. Each OSTE was designed to be completed within 10 minutes.
Development of the Intervention Workshops
Five Hospitalist faculty members with extensive training in faculty development facilitated four 90‐minute workshops, each focused on the goals of a particular pretest OSTE session. The learning objectives for each workshop are listed in Table 1. Each interactive workshop included a brief, evidence‐based didactic portion followed by a presentation of the evaluation checklists and an aggregate summary of hospitalist pretest ratings on the corresponding OSTE.
|
| Established Patient Workshop: Promoting the Senior Resident Leadership Role and Physical Exam Assessment |
| 1.Identify barriers to teaching PE skills/emnterpretation at bedside |
| 2.Identify barriers to promoting the role of the senior resident as leader |
| 3.Discuss strategies for overcoming 1 & 2 |
| 4.State what is meant by Deliberate Practice |
| 5.State the key aspects of Activated Demonstration |
| 6.Practice Activated Demonstration through deliberate practice using the OSTE scoring template in role plays |
| Feedback Workshop |
| 1.State the value of feedback to learners |
| 2.Identify barriers to giving feedback, especially corrective feedback |
| 3.Discuss strategies for promoting reflective self‐assessment |
| 4.Describe examples that represent effective strategies for reinforcing behaviors |
| 5.Describe examples that represent effective strategies for correcting behaviors |
| 6.Practice through role play (using the OSTE scoring template): |
| a.Developing a learner‐centered action plan |
| b.Eliciting learner's feelings about feedback and action plan |
| c.Exploring the learner's readiness to implement plan |
| Workshop Promoting Clinical Reasoning‐Correcting Wrong New Patient Diagnosis |
| 1.Identify barriers to trainees giving focused oral presentations |
| 2.Identify barriers to teaching clinical reasoning |
| 3.Identify barriers inherent in discussing diagnostic uncertainty and misdiagnosis in front of families |
| 4.Discuss strategies for overcoming 1‐3 |
| 5.Describe the theoretical framework behind Problem Representation |
| 6.Describe the key behaviors that comprise the OMP model |
| 7.Practice using abstractions of the key features to represent the problem |
| 8.Practice identifying knowledge/synthesis gaps and correcting learner mistakes using the OSTE scoring template in role‐plays |
| Orientation Workshop |
| 1.State the value of orientation to learners |
| 2.State the key elements for an effective orientation |
| 3.Identify barriers to providing an orientation |
| 4.Discuss strategies for effectively orienting learners |
| 5.Practice orienting a learner through role play using the OSTE scoring template |
After facilitators explained the theory behind determining the checklist behaviors, participants discussed the checklists and agreed on the validity of the rating instruments. The participants determined strategies to consistently remember to incorporate the desired behaviors, such as using mnemonics on pocket‐sized laminated cards and then practiced desired behaviors using roleplay.
Analysis
The percentage of total points possible on each of the pretest and posttest OSTE scoring templates was compared using a paired Student t test for each of the 14 participants.
Results
All 14 eligible hospitalists voluntarily participated. Their mean year postcompletion of residency training for the faculty was 17 months 14 months; 71% were female. None of the participants experienced previous training in the areas proposed in the study.
Participants assigned high scores to the quality of the workshops, the OSTE experience and their learning from the participating in the faculty development exercise. The differences between pre‐ and post‐OSTE scenario as well as overall scores for the 4 stations were statistically significant (P < .0001). Particular improvements were noted in the correction of incorrect new admission diagnoses (56% pre, 86% post) and orientation (65% pre, 95% post; see Table 2).
| OSTE station | Pre | Post | DF | t value |
|---|---|---|---|---|
| ||||
| PE skill/ leadership | 70% | 91% | 12 | 9.07* |
| Feedback | 71% | 94% | 12 | 7.40* |
| Clinical reasoning | 56% | 86% | 13 | 12.40* |
| Orientation | 65% | 95% | 13 | 7.56* |
| Overall | 64% | 90% | 13 | 17.58* |
Discussion
If FCR are to be universally adopted in the academic pediatric inpatient setting, faculty must successfully balance the educational needs of trainees as well as efficiently negotiating a plan of management with patients and families. The ability of faculty to consistently orchestrate rounds so that they meet educational needs of varied levels of learners, while ensuring that patient management is correct and well communicated to families is a very complex task.
We found using OSTEs to frame desired behavior, supplemented with background information to validate the desired behaviors followed by deliberate practice opportunities during the workshops to be an effective faculty development strategy. We not only provided participants with feedback on the group's performance according to the rating scale, but also gave them the opportunity to practice rating each other using the scale so that they could reflect on the elements of their performance that merited a specific rating.
This strategy for training faculty to perform well in the complex environment within the patient's room during FCR is similar in some respects with training military personnel for complex battle situations.15 Desired behaviors are broken down and packaged within a framework to be implemented in a specific context. For example, we combined aspects of the One Minute Preceptor model (OMP)12 with Bordage's Problem Representation model to create a framework of behaviors to promote and correct errors in clinical reasoning.16, 17 Another framework was created and practiced to promote assessment of the physical exam at the bedside. Orientation and feedback, although not frequently used components of actual FCR, are necessary to set expectations and calibrate learner's performance during FCR.
The OSTE is an observed examination that has been validated for evaluating the teaching skills of faculty and residents.18 We planned to use learner‐centered, interactive workshops as the key component of the training intervention with the pre‐ and posttest OSTE as a measure of their effectiveness. However, we found in faculty feedback that the OSTEs were actually a key adjuvant, to the workshop training in that they provided a major source of feedback and learning opportunities in addition to their inherent evaluative qualities.
Each of 4 workshops was designed to teach participants the behaviors assessed in the 4 OSTE stations. The pretest OSTE provided a baseline for participant performance and served to activate the participants to focus on key teaching behaviors during the workshop. During the workshop following the pretest OSTE, participants were given copies of the rating scales and feedback on the performance of the group as a whole on each rated behavior. The evidence used to create the rating instruments was presented and participants had the opportunity to debate and agree on the instrument's construct validity. They then had the opportunity to engage in deliberate practice during role plays depicting challenges to orienting a learner, providing feedback, and to family centered rounds. The posttest OSTE served as summative evaluation of the participants' ability to perform the practiced behaviors effectively in a simulated teaching environment.
We chose to focus the FCR scenarios on correcting mistakes in clinical reasoning for a new patient and on teaching key parts of the physical exam during rounds for an established patient. Errors in clinical reasoning lead to misdirected patient management and are the number 1 cause of medical errors.19, 20 Bedside rounds are a perfect venue for reinforcing and fine‐tuning diagnostic reasoning because all the crucial sources of data are present: the patient, the parent, the nurse, and the computer with lab and imaging results. Faculty members and trainees have both expressed discomfort at correcting errors in clinical reasoning in front of families, leading to missed learning opportunities.21
During the workshop on clinical reasoning, we taught faculty how to use the Problem Representation method to analyze and correct errors in clinical reasoning. The method, studied by Bordage and associates22 forces learners to identify the key features of a presentation and relate their interpretation of the findings by using semantic qualifiers. We trained faculty to deliberately listen for the learner's interpretation of the key features to determine how a misdiagnosis occurred. They were also trained to walk trainees back through their thought process in an objective way, correcting the misinterpretation of data, so that the trainee's competence is not compromised in the eyes of the team or the parents. Teaching the trainee to think correctly about a clinical problem benefits the other members of the team, as well as providing the parents with a better understanding of the rationale for the management plan.
Correct interpretation of the physical exam findings is crucial to making the correct diagnosis. However, there have been several articles chronicling the lost art of eliciting and interpreting physical exam findings, ranging from the cardiac exam to neurological exam.23 A minority of physical exam teaching occurs at the patient's bedside, partly attributed to faculty members discomfort with this type of teaching.24, 25 To enhance the comfort of our faculty members, we included behaviors referenced in articles on teaching a skill,26 activated demonstration,10 and effective bedside teaching27 to guide faculty to incorporate eliciting and interpreting focused aspects of the physical exam during rounds.
Our FCR evaluation templates awarded the highest scores if the hospitalist encouraged senior residents to model clinical reasoning or physical exam skills for junior learners. Hospitalists' presence, especially on work rounds, can diminish the senior resident's opportunity to gain experience and confidence in leading the team.28 We therefore explicitly directed hospitalists to promote the role of the senior resident as the team leader during workshops, while priming faculty to assume the role of educational coach.29
We hypothesize that several factors contributed to the success of the OSTE workshopOSTE intervention. First, faculty members willingly volunteered to participate because they recognized gaps in their own knowledge and skill at leading FCR. They found the ability to deliberately practice the desired behaviors in the OSTE exercises to be the most useful part of the exercise, because the scenarios were authentic and SLs were real trainees.
Although we included all the junior faculty members of our large Pediatric Hospitalist Division in our study, our sample size is still small; limiting our ability to generalize our findings. We found the scheduling of 14 hospitalists to attend 4 different events in close succession to be problematic. Conducting the OSTE sessions at the GW CLASS center 5 miles away from our hospital was also logistically challenging.
We plan to simplify the logistics so that we can incorporate this model in the training of new hospitalists in the division. We still plan to use preintervention FCR OSTEs, but instead of workshops, will provide background information by means of self‐directed Web‐based modules. We will also videotape the OSTEs and provide faculty with a template to rate their own performance and then compare it with ratings from SLs. This individualized feedback and self‐reflection could result in better performance30 than the summary group feedback we gave during the workshops.
Another limitation of this study is the lack of data regarding the consistency of our faculty participants' performance in real FCR. Finally, we did not study the impact of the desired behaviors on patient, trainee, or nursing satisfaction, learning, or efficiency.
Conclusion
In conclusion, we found incorporating OSTEs into a faculty development program to improve FCR to be an effective strategy for changing faculty behavior in leading FCR. Additional study is needed to determine if replacing the workshops with Web‐based tutorials is equally effective and to determine if this faculty development strategy results in long‐term consistent practice in conducting rounds in real inpatient settings.
- Institute of Medicine of the National Academies.Crossing the Quality Chasm: A New Health System for the 21st Century. March 1,2001.Washington, DC:National Academy of Science.
- Committee on Hospital Care.American Academy of Pediatrics. Family‐centered care and the pediatrician's role.Pediatrics.2003;112:691–696.
- ,,, et al.Current trends in practice of family centered rounds: a study from the pediatric research in inpatient settings (PRIS) network.Pediatrics.2010. In press.
- ,,,,.Family‐centered bedside rounds: A new approach to patient care and teaching.Pediatrics.2007;119:829–832.
- ,,, et al.Do Family‐Centered Rounds (FCRs) Enhance Resident's Clinical and Educational Experiences and Improve Patient Outcomes? A Qualitative Study. In: Proceedings of the 2010 Pediatric Academic Societies Annual Meeting, May 1–4,2010, Vancouver, BC, Canada.
- ,,, et al.Development and implementation of an objective structured teaching exercise (OSTE) to evaluate improvement in feedback skills following a faculty development workshop.Teach Learn Med.2003;15:7–13.
- .Feedback in clinical medical education.JAMA.1983;250:777–781.
- ,,,,.Strategies for efficient and effective teaching in the ambulatory care setting.Acad Med.1997;72:277–280.
- ,.Arrows in the quiver: evaluation of a workshop on ambulatory teaching.Acad Med.1998;73(Suppl):S67–hyphen.
- .Teaching practice management skills to pediatric residents.Clin Pediatr.2006;45:846–849.
- .Educational strategies to promote clinical diagnostic reasoning.N Engl J Med.2006;355:2217–2225.
- ,,,.The search for effective and efficient ambulatory teaching methods through the literature.Pediatrics.2000;105:231–237.
- ,,.Teaching points identified by preceptors observing one‐minute preceptor and traditional preceptor encounters.Acad Med.2004;79:50–55.
- ,,,,.The Talks Manual: A Guide to Teaching Senior Students in the Health Professions to be Educators.Washington, DC:George Washington University;2000.
- .20th‐century revolution in military training. In: Ericsson KA, editor.Development of Professional Expertise Toward Measurement of Expert Performance and Design of Optimal Learning Environments.New York:Cambridge University Press;2009:27–59.
- .“Why did I miss the diagnosis? Some cognitive explanations and educational implications.”Acad Med.1999;74:S138–S143.
- ,.Promoting diagnostic problem.Med Educ.2002;36:760–766.
- ,,,,,.Reliability and validity of an objective structured teaching examination for generalist resident teachers.Acad Med.2002;77(suppl):S29.
- ,,, et al.Diagnosing diagnostic errors: lessons from a multi‐institutional collaborative project.Adv Patient Safety.2005;2:255–278.
- ,.“Diagnostic errors – the next frontier for patient safety.”JAMA.2009;301:1060–1062.
- ,.Teaching at the bedside: a new model.Med Teach.2003;25:127–130.
- .Elaborated knowledge: a key to successful diagnostic thinking.Acad Med.1994;69:883–889.
- .On bedside teaching.Ann Intern Med.1997;126:217–220.
- ,,,.Attending rounds and bedside case presentations: medical student and medicine resident experiences and attitudes.Teach Learn Med.2009;21:105–110.
- ,,,.Whither bedside teaching? A focus‐group study of clinical teachers.Acad Med.2003;78:384–390.
- .ABC of learning and teaching in medicine: skill based assessment.BMJ.2003;326:703–706.
- .Twelve tips to improve bedside teaching.Med Teach.2003;25:112–115.
- ,,, et al.Effect of a pediatric hospitalist system on house staff education and experience.Arch Pediatr Adolesc Med.2002;156:877–883.
- ,.Development of a tool to assess the team leadership skills of medical residents.Med Educ Online.2006:11;11–27.
- ,.Using standardised students in faculty development workshops to improve clinical teaching skills.Med Educ.2003;37:621–629.
Providing family centered care has been identified as a goal in the Institute of Medicine's report Crossing the Quality Chiasm1 and endorsed by the American Academy of Pediatrics.2 Traditionally, rounds are the central organizing structure for clinical work, decision making, and teaching in the inpatient setting. Patient care and educational goals emanate from rounds. Over the past several decades rounds have migrated from the patient's bedside to the privacy of the conference room. In our experience, although conference room rounds offer some advantages, patients and families are not privy to the data or decision‐making process used to determine their diagnosis and plan of care. The ritual that frequently occurs after conference‐room rounds is that the team members (medical students, residents, nurses, attending) visit the patient and family independently throughout the course of the day, communicating their understanding of medical and affective issues in a manner that families often view as providing confusing, if not contradictory information.
Conducting rounds entirely at the bedside can bypass this systemic flaw, allowing parents and patients to correct inaccurate data, and enable them to make their values and concerns known to the team. This model can help to connect the caregivers and receivers of care, and represents a collaborative communication process, the foundation for effective family‐centered rounds (FCR). When team members discuss how they interpret clinical data in the presence of the family it helps them to understand how and why a management plan is conceived. The care team develops an alliance of trust with the family through this transparent communication and joint decision‐making.
Despite the potential for enhancing patient/family satisfaction and endorsements by public and professional organizations, in a recent study less than half of pediatric hospitalists reported conducting FCR.3 Trainees and attending physicians raised concerns about the potential for FCR to waste time and diminish teaching.4 Trainees' perceptions of the educational value of FCR has not been well studied, but a recent qualitative study of pediatric residents reported that if conducted well, FCRs enhance education and clinical skills by increasing the number of patients seen by each team member, and by offering opportunities to improve physical examination skills. Trainees appreciated role‐modeling and realtime feedback by attending physicians. Senior residents reported enhanced leadership and teaching opportunities.5
The aim of this study was to design and implement a faculty development program to address the need of our junior hospitalist faculty members to enhance teaching during FCR.
Methods
We determined, based upon direct observation, a focus group and survey feedback from our pediatric residents, that for inpatient teaching during FCR to be successful, our faculty needed training in the following areas: orienting learners, providing feedback, teaching assessment of key physical exam findings, correcting errors in clinical reasoning, and promoting the role of the senior resident as team leader. We developed the Observed Structured Teaching Exercises (OSTE)6 and related workshops to promote key behaviors identified from the literature for each of the areas.
All of the Children's National Medical Center (CNMC) Pediatric hospitalists (N = 14) who were not investigators in the study were asked to participate. They were informed of the study design and the overall goal of making inpatient rounds more effective and efficient through better teaching skills. The study was approved by the CNMC institutional review board and was conducted from August to September 2007 in the CLASS (Clinical Learning and Simulation Skills) at The George Washington University School of Medicine and Health Sciences.
To assess faculty and fellow baseline knowledge and skills, the authors conducted a preintervention OSTE consisting of 4 stations: 1) physical exam interpretation and promoting PL‐3 autonomy (Established Patient), 2) stimulating clinical reasoning (New Patient), 3) feedback, and 4) facilitating an orientation. This exercise was followed within 2 weeks by four 90‐minute interactive workshops that focused on the topic areas as evaluated in the OSTEs. Each workshop consisted of a brief evidence‐based didactic component, interactive discussion, and skill building exercises to practice desired teaching behaviors. Two weeks following the workshops, the group participated in postintervention OSTEs similar to the preintervention scenarios, with minor changes, such as presenting diagnoses, to avoid pattern recognition.
Development of the Evaluation Process
The authors reviewed the literature on providing effective feedback7 and orientation8; in teaching a skill9; promoting senior resident autonomy10 and clinical reasoning.11 We also reviewed the faculty development literature12, 13 to determine which behaviors were found to be effective specifically for promoting teaching during FCR, but no studies specifically addressed evaluation of teaching skills during FCR. Checklists were created based on the evidence in the literature and supplemented by the consensus of the investigators when there was no evidence available (see Supp. Appendix S1, which is available online).
Two stations simulating FCR (physical exam interpretation and promoting PL‐3 autonomy [Established Patient]; and stimulating clinical reasoning [New Patient]), each used 2 Standardized Learners (SL) and 1 Standardized Parent (SP). The patient was portrayed using a poster or simulator. The stations simulating feedback and orientation used 1 SL. To conduct 14 pre‐ and post‐OSTEs, we used a total of 5 SPs and 20 SLs. The SPs were recruited from a cohort of individuals that regularly participate in OSCE teaching and evaluation scenarios in the CLASS Center. The SLs were 4th year medical students enrolled in the TALKS (Teaching and Learning Communication Skills) elective and trained how to portray SLs.14
Training consisted of advanced distribution of specific scripts to SPs/SLs and practice through role playing the scenarios with study investigators acting as the attending hospitalist. The SP/SLs and investigators tried to anticipate several possible ways participants might react to the scenarios so that SPs and SLs could standardize their responses and interrater reliability for rating checklists of desired teaching behaviors. SLs rated faculty according to the teaching behavior template during a 5‐minute interval immediately after each OSTE. Different SLs were used for pre‐ versus postintervention OSTEs and were unaware of the intervention itself or whether faculty participants were pre‐ or postintervention.
Each of the 4 OSTE stations began with the hospitalist reading a brief paragraph describing the scenario and the overall goals for the OSTE. SLs/SPs acted out scripts designed by investigators to provide opportunities for hospitalists to demonstrate desired teaching behaviors. Each OSTE was designed to be completed within 10 minutes.
Development of the Intervention Workshops
Five Hospitalist faculty members with extensive training in faculty development facilitated four 90‐minute workshops, each focused on the goals of a particular pretest OSTE session. The learning objectives for each workshop are listed in Table 1. Each interactive workshop included a brief, evidence‐based didactic portion followed by a presentation of the evaluation checklists and an aggregate summary of hospitalist pretest ratings on the corresponding OSTE.
|
| Established Patient Workshop: Promoting the Senior Resident Leadership Role and Physical Exam Assessment |
| 1.Identify barriers to teaching PE skills/emnterpretation at bedside |
| 2.Identify barriers to promoting the role of the senior resident as leader |
| 3.Discuss strategies for overcoming 1 & 2 |
| 4.State what is meant by Deliberate Practice |
| 5.State the key aspects of Activated Demonstration |
| 6.Practice Activated Demonstration through deliberate practice using the OSTE scoring template in role plays |
| Feedback Workshop |
| 1.State the value of feedback to learners |
| 2.Identify barriers to giving feedback, especially corrective feedback |
| 3.Discuss strategies for promoting reflective self‐assessment |
| 4.Describe examples that represent effective strategies for reinforcing behaviors |
| 5.Describe examples that represent effective strategies for correcting behaviors |
| 6.Practice through role play (using the OSTE scoring template): |
| a.Developing a learner‐centered action plan |
| b.Eliciting learner's feelings about feedback and action plan |
| c.Exploring the learner's readiness to implement plan |
| Workshop Promoting Clinical Reasoning‐Correcting Wrong New Patient Diagnosis |
| 1.Identify barriers to trainees giving focused oral presentations |
| 2.Identify barriers to teaching clinical reasoning |
| 3.Identify barriers inherent in discussing diagnostic uncertainty and misdiagnosis in front of families |
| 4.Discuss strategies for overcoming 1‐3 |
| 5.Describe the theoretical framework behind Problem Representation |
| 6.Describe the key behaviors that comprise the OMP model |
| 7.Practice using abstractions of the key features to represent the problem |
| 8.Practice identifying knowledge/synthesis gaps and correcting learner mistakes using the OSTE scoring template in role‐plays |
| Orientation Workshop |
| 1.State the value of orientation to learners |
| 2.State the key elements for an effective orientation |
| 3.Identify barriers to providing an orientation |
| 4.Discuss strategies for effectively orienting learners |
| 5.Practice orienting a learner through role play using the OSTE scoring template |
After facilitators explained the theory behind determining the checklist behaviors, participants discussed the checklists and agreed on the validity of the rating instruments. The participants determined strategies to consistently remember to incorporate the desired behaviors, such as using mnemonics on pocket‐sized laminated cards and then practiced desired behaviors using roleplay.
Analysis
The percentage of total points possible on each of the pretest and posttest OSTE scoring templates was compared using a paired Student t test for each of the 14 participants.
Results
All 14 eligible hospitalists voluntarily participated. Their mean year postcompletion of residency training for the faculty was 17 months 14 months; 71% were female. None of the participants experienced previous training in the areas proposed in the study.
Participants assigned high scores to the quality of the workshops, the OSTE experience and their learning from the participating in the faculty development exercise. The differences between pre‐ and post‐OSTE scenario as well as overall scores for the 4 stations were statistically significant (P < .0001). Particular improvements were noted in the correction of incorrect new admission diagnoses (56% pre, 86% post) and orientation (65% pre, 95% post; see Table 2).
| OSTE station | Pre | Post | DF | t value |
|---|---|---|---|---|
| ||||
| PE skill/ leadership | 70% | 91% | 12 | 9.07* |
| Feedback | 71% | 94% | 12 | 7.40* |
| Clinical reasoning | 56% | 86% | 13 | 12.40* |
| Orientation | 65% | 95% | 13 | 7.56* |
| Overall | 64% | 90% | 13 | 17.58* |
Discussion
If FCR are to be universally adopted in the academic pediatric inpatient setting, faculty must successfully balance the educational needs of trainees as well as efficiently negotiating a plan of management with patients and families. The ability of faculty to consistently orchestrate rounds so that they meet educational needs of varied levels of learners, while ensuring that patient management is correct and well communicated to families is a very complex task.
We found using OSTEs to frame desired behavior, supplemented with background information to validate the desired behaviors followed by deliberate practice opportunities during the workshops to be an effective faculty development strategy. We not only provided participants with feedback on the group's performance according to the rating scale, but also gave them the opportunity to practice rating each other using the scale so that they could reflect on the elements of their performance that merited a specific rating.
This strategy for training faculty to perform well in the complex environment within the patient's room during FCR is similar in some respects with training military personnel for complex battle situations.15 Desired behaviors are broken down and packaged within a framework to be implemented in a specific context. For example, we combined aspects of the One Minute Preceptor model (OMP)12 with Bordage's Problem Representation model to create a framework of behaviors to promote and correct errors in clinical reasoning.16, 17 Another framework was created and practiced to promote assessment of the physical exam at the bedside. Orientation and feedback, although not frequently used components of actual FCR, are necessary to set expectations and calibrate learner's performance during FCR.
The OSTE is an observed examination that has been validated for evaluating the teaching skills of faculty and residents.18 We planned to use learner‐centered, interactive workshops as the key component of the training intervention with the pre‐ and posttest OSTE as a measure of their effectiveness. However, we found in faculty feedback that the OSTEs were actually a key adjuvant, to the workshop training in that they provided a major source of feedback and learning opportunities in addition to their inherent evaluative qualities.
Each of 4 workshops was designed to teach participants the behaviors assessed in the 4 OSTE stations. The pretest OSTE provided a baseline for participant performance and served to activate the participants to focus on key teaching behaviors during the workshop. During the workshop following the pretest OSTE, participants were given copies of the rating scales and feedback on the performance of the group as a whole on each rated behavior. The evidence used to create the rating instruments was presented and participants had the opportunity to debate and agree on the instrument's construct validity. They then had the opportunity to engage in deliberate practice during role plays depicting challenges to orienting a learner, providing feedback, and to family centered rounds. The posttest OSTE served as summative evaluation of the participants' ability to perform the practiced behaviors effectively in a simulated teaching environment.
We chose to focus the FCR scenarios on correcting mistakes in clinical reasoning for a new patient and on teaching key parts of the physical exam during rounds for an established patient. Errors in clinical reasoning lead to misdirected patient management and are the number 1 cause of medical errors.19, 20 Bedside rounds are a perfect venue for reinforcing and fine‐tuning diagnostic reasoning because all the crucial sources of data are present: the patient, the parent, the nurse, and the computer with lab and imaging results. Faculty members and trainees have both expressed discomfort at correcting errors in clinical reasoning in front of families, leading to missed learning opportunities.21
During the workshop on clinical reasoning, we taught faculty how to use the Problem Representation method to analyze and correct errors in clinical reasoning. The method, studied by Bordage and associates22 forces learners to identify the key features of a presentation and relate their interpretation of the findings by using semantic qualifiers. We trained faculty to deliberately listen for the learner's interpretation of the key features to determine how a misdiagnosis occurred. They were also trained to walk trainees back through their thought process in an objective way, correcting the misinterpretation of data, so that the trainee's competence is not compromised in the eyes of the team or the parents. Teaching the trainee to think correctly about a clinical problem benefits the other members of the team, as well as providing the parents with a better understanding of the rationale for the management plan.
Correct interpretation of the physical exam findings is crucial to making the correct diagnosis. However, there have been several articles chronicling the lost art of eliciting and interpreting physical exam findings, ranging from the cardiac exam to neurological exam.23 A minority of physical exam teaching occurs at the patient's bedside, partly attributed to faculty members discomfort with this type of teaching.24, 25 To enhance the comfort of our faculty members, we included behaviors referenced in articles on teaching a skill,26 activated demonstration,10 and effective bedside teaching27 to guide faculty to incorporate eliciting and interpreting focused aspects of the physical exam during rounds.
Our FCR evaluation templates awarded the highest scores if the hospitalist encouraged senior residents to model clinical reasoning or physical exam skills for junior learners. Hospitalists' presence, especially on work rounds, can diminish the senior resident's opportunity to gain experience and confidence in leading the team.28 We therefore explicitly directed hospitalists to promote the role of the senior resident as the team leader during workshops, while priming faculty to assume the role of educational coach.29
We hypothesize that several factors contributed to the success of the OSTE workshopOSTE intervention. First, faculty members willingly volunteered to participate because they recognized gaps in their own knowledge and skill at leading FCR. They found the ability to deliberately practice the desired behaviors in the OSTE exercises to be the most useful part of the exercise, because the scenarios were authentic and SLs were real trainees.
Although we included all the junior faculty members of our large Pediatric Hospitalist Division in our study, our sample size is still small; limiting our ability to generalize our findings. We found the scheduling of 14 hospitalists to attend 4 different events in close succession to be problematic. Conducting the OSTE sessions at the GW CLASS center 5 miles away from our hospital was also logistically challenging.
We plan to simplify the logistics so that we can incorporate this model in the training of new hospitalists in the division. We still plan to use preintervention FCR OSTEs, but instead of workshops, will provide background information by means of self‐directed Web‐based modules. We will also videotape the OSTEs and provide faculty with a template to rate their own performance and then compare it with ratings from SLs. This individualized feedback and self‐reflection could result in better performance30 than the summary group feedback we gave during the workshops.
Another limitation of this study is the lack of data regarding the consistency of our faculty participants' performance in real FCR. Finally, we did not study the impact of the desired behaviors on patient, trainee, or nursing satisfaction, learning, or efficiency.
Conclusion
In conclusion, we found incorporating OSTEs into a faculty development program to improve FCR to be an effective strategy for changing faculty behavior in leading FCR. Additional study is needed to determine if replacing the workshops with Web‐based tutorials is equally effective and to determine if this faculty development strategy results in long‐term consistent practice in conducting rounds in real inpatient settings.
- Institute of Medicine of the National Academies.Crossing the Quality Chasm: A New Health System for the 21st Century. March 1,2001.Washington, DC:National Academy of Science.
- Committee on Hospital Care.American Academy of Pediatrics. Family‐centered care and the pediatrician's role.Pediatrics.2003;112:691–696.
- ,,, et al.Current trends in practice of family centered rounds: a study from the pediatric research in inpatient settings (PRIS) network.Pediatrics.2010. In press.
- ,,,,.Family‐centered bedside rounds: A new approach to patient care and teaching.Pediatrics.2007;119:829–832.
- ,,, et al.Do Family‐Centered Rounds (FCRs) Enhance Resident's Clinical and Educational Experiences and Improve Patient Outcomes? A Qualitative Study. In: Proceedings of the 2010 Pediatric Academic Societies Annual Meeting, May 1–4,2010, Vancouver, BC, Canada.
- ,,, et al.Development and implementation of an objective structured teaching exercise (OSTE) to evaluate improvement in feedback skills following a faculty development workshop.Teach Learn Med.2003;15:7–13.
- .Feedback in clinical medical education.JAMA.1983;250:777–781.
- ,,,,.Strategies for efficient and effective teaching in the ambulatory care setting.Acad Med.1997;72:277–280.
- ,.Arrows in the quiver: evaluation of a workshop on ambulatory teaching.Acad Med.1998;73(Suppl):S67–hyphen.
- .Teaching practice management skills to pediatric residents.Clin Pediatr.2006;45:846–849.
- .Educational strategies to promote clinical diagnostic reasoning.N Engl J Med.2006;355:2217–2225.
- ,,,.The search for effective and efficient ambulatory teaching methods through the literature.Pediatrics.2000;105:231–237.
- ,,.Teaching points identified by preceptors observing one‐minute preceptor and traditional preceptor encounters.Acad Med.2004;79:50–55.
- ,,,,.The Talks Manual: A Guide to Teaching Senior Students in the Health Professions to be Educators.Washington, DC:George Washington University;2000.
- .20th‐century revolution in military training. In: Ericsson KA, editor.Development of Professional Expertise Toward Measurement of Expert Performance and Design of Optimal Learning Environments.New York:Cambridge University Press;2009:27–59.
- .“Why did I miss the diagnosis? Some cognitive explanations and educational implications.”Acad Med.1999;74:S138–S143.
- ,.Promoting diagnostic problem.Med Educ.2002;36:760–766.
- ,,,,,.Reliability and validity of an objective structured teaching examination for generalist resident teachers.Acad Med.2002;77(suppl):S29.
- ,,, et al.Diagnosing diagnostic errors: lessons from a multi‐institutional collaborative project.Adv Patient Safety.2005;2:255–278.
- ,.“Diagnostic errors – the next frontier for patient safety.”JAMA.2009;301:1060–1062.
- ,.Teaching at the bedside: a new model.Med Teach.2003;25:127–130.
- .Elaborated knowledge: a key to successful diagnostic thinking.Acad Med.1994;69:883–889.
- .On bedside teaching.Ann Intern Med.1997;126:217–220.
- ,,,.Attending rounds and bedside case presentations: medical student and medicine resident experiences and attitudes.Teach Learn Med.2009;21:105–110.
- ,,,.Whither bedside teaching? A focus‐group study of clinical teachers.Acad Med.2003;78:384–390.
- .ABC of learning and teaching in medicine: skill based assessment.BMJ.2003;326:703–706.
- .Twelve tips to improve bedside teaching.Med Teach.2003;25:112–115.
- ,,, et al.Effect of a pediatric hospitalist system on house staff education and experience.Arch Pediatr Adolesc Med.2002;156:877–883.
- ,.Development of a tool to assess the team leadership skills of medical residents.Med Educ Online.2006:11;11–27.
- ,.Using standardised students in faculty development workshops to improve clinical teaching skills.Med Educ.2003;37:621–629.
Copyright © 2011 Society of Hospital Medicine
Hospitalist System Performance in Taiwan
In Taiwan, the national health insurance (NHI) implemented since 19951 has extended its coverage to almost the entire population. It may serve as a model for other countries looking to implement a universal health insurance system.2, 3 However, due to the low copayment for services, there are increasing admission rates and hospitalizations.2, 4 Admission rates, in particular, have nearly tripled for those who have been previously uninsured prior to the NHI program.2 In terms of hospital care, internal medicine and surgery are not favorite areas of specialty in the NHI system because inpatient care has a high workload but relatively low salaries.2, 5, 6 Consequently, there is now a shortage of primary inpatient care staff in Taiwan. The hospitalist system may be a solution to this problem.
The role of a hospitalist system has been discussed since 1996.7 Although its pros and cons are still debatable,8 the hospitalist system has grown in recent decades and there is a wide acceptance that hospitalists can efficiently care for inpatients.4, 9, 10 However, most related studies are in Western countries.4, 6, 11 It has rarely been studied in Asian countries and in those with NHI programs.
This study therefore aimed to investigate whether the hospitalist system, working within the NHI system in Taiwan, can be efficient in saving costs, maintaining quality care, and managing a high volume of in patients.
Materials and Methods
This prospective observational study was conducted in the National Taiwan University Hospital (NTUH), a tertiary‐care referral center in northern Taiwan, and approved by the hospital's Institutional Review Board. The program was also registered on Clinicaltrial.gov (identifier NCT00997646). A 36‐bed hospitalist‐run ward (HW) was set up in October 2009 in NTUH. For performance comparison, two 36‐bed internist‐run wards (IWs) were selected. The three wards were geographically separated.
Study Subjects
All patients age >18 years from the emergency department (ED) were admitted into one of the three wards based on the diagnosis category determined by the ED physicians. A patient was admitted by bed managers who were blinded to the study. Cases were categorized as diseases of general medicine, such as congestive heart failure, pneumonia, exacerbation of chronic obstructive pulmonary disease, cellulitis, ischemic stroke, urinary tract infection, and gastrointestinal bleeding.
Patients with severe illnesses requiring admission to intensive care units were excluded. Research assistants who were blinded to the patient stratification performed the patients' identification and data collection. Patient care was determined by the respective medical teams without any interference from this study.
Care‐Team Structure
The HW was set up with 3 attending physicians certified by a board of internal medicine and 6 nurse practitioners. All staff members worked full‐time to provide primary inpatient care. For comparison (Table 1), each IW had a set‐up of 3 attending physicians licensed by a board of internal medicine, one chief resident, 3 junior residents, and 3 interns. The attending physicians of the IWs visited their inpatients every workday and delegated primary care to residents on night shifts and weekends.
| Hospitalist‐Run Ward | Internist‐Run Wards | |
|---|---|---|
| ||
| Team member, per ward | 3 AP, 6 NP | 3 AP, 1 CR, 3 JR, 3 intern |
| Beds, per ward | 36 | 36 |
| Inpatient care of AP | Full time | Once daily |
| Who prescribes care order? | AP | AP, CR, JR |
| Who executes order? | NP | JR, intern |
| AP duty | Inpatient care; research | Inpatient/outpatient care; work of subspecialty; research |
| Bed manager | NP/AP | CR |
Clinical Characteristics
The patients' clinical characteristics, laboratory data, hospital course, and outcomes were recorded. The clinical characteristics included age, gender, underlying comorbidities, activities of daily living, and admission diagnosis. Charlson scores and Barthel's scores represented underlying comorbidities and activities of daily living, respectively. These were calculated as described in previous studies.11, 12 Admission costs paid for by the Taiwan NHI was defined as an inpatient's expenditure paid to the hospital by the institute of NHI. Total admission cost included expenses paid for by NHI and the patient's out‐of‐pocket expenditure not covered by NHI. A primary care physician was defined if the patient had visited the same doctor's clinic three times or more within one year prior to admission.8 Patients were followed‐up for 30 days after discharge by telephone, or until readmission.
Propensity Score Methods
Propensity score‐matching was used to balance observed covariates between the 2 care groups. It was defined as the conditional probability for being admitted to the HW, as a binary dependent variable, under a set of measurements. Factors that were significantly different (P < 0.05) between the 2 groups in univariate analysis were included in a multivariable logistic regression model to predict HW admission. The predicted probability derived from the logistic equation was used as the propensity score for each individual.
Patients in the HW and IWs were pooled and sorted according to their propensity score in ascending order. The selection process began from the first two cases with the lowest propensity score. If one was admitted to the HW and the other to an IW, both were selected as a matched pair. If this was not the case, then four cases were included. If there were two HW patients and two IW cases, the four were selected as two matched pairs. In the same way, HW and IW cases were matched by their propensity score in 1:1, 2:2, or 3:3 blocks. A patient who did not have a suitable match within the acceptable rank range was excluded from further analysis. The matching process moved down the sort list until all possible matched pairs were included and the selected patients formed a matched 1:1 pair in both groups.
Statistical Analysis
Intergroup differences were compared using independent t test for numerical variables and chi‐square test for categorical variables. Curves of probability of staying in the hospital within 30 days were generated using the Kaplan‐Meier method and compared using the log‐rank test. A logistic regression model was used for the propensity score match using the SPSS software version 13.0 (SPSS, Chicago, IL). The probability that indicated patient admission to the HW in both groups was used to draw box‐plots. After the 1:1 matched groups were assembled, the clinical characteristics were compared accordingly.
Results
From November 2009 to January 2010, 810 patients admitted from the ED to the study wards were enrolled. Among them, 377 were admitted to the HW and 433 to the IWs. Analysis of admission days showed that 84 (22%) and 53 (12%) patients were admitted to the HW and IWs, respectively, on weekends (P < 0.001).
Compared to the IW patients, the HW patients were older (age >65 years) and had poorer functional status by Barthel's scores (Table 2). Admission diagnosis was similar in both groups, except for pneumonia and urinary tract infection, which were higher in the HW patients. There was a primary care physician in 242 (64%) HW and 282 (65%) IW patients (P = 0.781).
The Charlson score, representing underlying comorbidity, was higher in the HW group (P = 0.002). Moreover, patients with severe liver cirrhosis (Child‐Pugh class C) were more frequently admitted to the HW (P = 0.018). Underlying malignancy, severe chronic kidney disease (estimated creatinine clearance <30 mL/min), and chronic respiratory failure requiring mechanical ventilator support were more associated with HW admission, although not statistically significantly (P = 0.064, 0.072, and 0.104, respectively).
The average admission cost was lower in HW patients than in IW patients, whether paid for by NHI ($1640.2 vs $2933.8 per patient, P = 0.001) or by the total admission cost ($2223.4 vs $3700.8 per patient, P = 0.001) (Table 3). Similarly, there was a shorter average length of stay (LOS) in the HW patients (9.3 vs 13.1 days, P < 0.001), who were discharged earlier than IW patients (Figure 1A). Regarding cost per patient‐day, the total daily cost was similar between the two groups (P = 0.560).
| Hospitalist‐Run Ward (n = 377) | Internist‐Run Wards (n = 433) | P‐Value | |
|---|---|---|---|
| |||
| Age >65 years old | 237 (63) | 240 (55) | 0.032 |
| Gender, male | 210 (56) | 243 (56) | 0.905 |
| Barthel's score | 61 35 | 70 33 | <0.001 |
| Charlson score | 3.7 3.4 | 3.0 3.2 | 0.002 |
| Admission diagnosis | |||
| Pneumonia | 106 (28) | 88 (20) | 0.010 |
| Exacerbation of COPD | 18 (5) | 15 (3) | 0.347 |
| Congestive heart failure | 12 (3) | 19 (4) | 0.373 |
| Upper gastrointestinal bleeding | 55 (15) | 58 (13) | 0.625 |
| Intra‐abdominal infection | 36 (10) | 47 (11) | 0.541 |
| Urinary tract infection | 85 (23) | 69 (16) | 0.017 |
| Cellulitis | 20 (5) | 18 (4) | 0.441 |
| Ischemic stroke | 12 (3) | 21 (5) | 0.231 |
| Others* | 117 (31) | 164 (38) | 0.041 |
| Laboratory data in the initial admission | |||
| Leukocyte count, /L | 11372 7962 | 10377 6422 | 0.050 |
| Hemoglobin, g/dL | 12.7 12.8 | 12.3 8.6 | 0.714 |
| Platelet count, K/L | 219 124 | 205 108 | 0.102 |
| Blood urea nitrogen, mg/dL | 33.2 27.7 | 24.1 17.4 | <0.001 |
| Creatinine, mg/dL | 1.9 2.9 | 1.6 2.8 | 0.080 |
| Total bilirubin, mg/dL | 2.2 3.7 | 2.3 3.6 | 0.826 |
| C‐reactive protein, mg/dL | 8.0 7.7 | 6.0 6.4 | 0.008 |
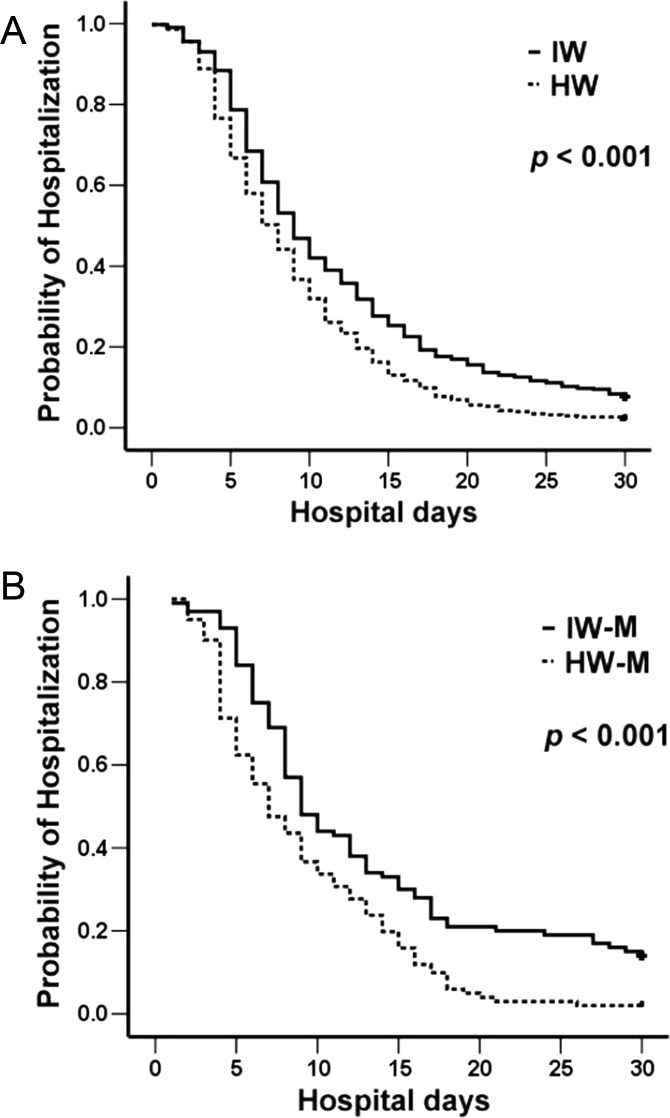
More patients in the HW group signed the do‐not‐resuscitate (DNR) consent (P < 0.001) and died during the hospital course, although the difference was not statistically significant (P = 0.068). Among those who expired during hospitalization, DNR consent was signed by 42 (90%) HW and 27 (68%) IW patients (P = 0.014). Among those discharged, 57 (17.2%) HW and 70 (17.6%) IW patients were lost to follow‐up. There was no difference in the 30‐day readmission for any cause between the two groups (P = 0.992).
Due to baseline differences, propensity score‐matching was performed and 101 pairs of patients were selected according to the probability generated from factors significantly different in univariate analysis (ie, age >65 years, pneumonia or urinary tract infections, Charlson score, Barthel's score, and blood urea nitrogen and C‐reactive protein levels on initial admission). The clinical characteristics of the 202 patients were shown in Table 4.
| Hospitalist‐Run Ward (n = 377) | Internist‐Run Wards (n = 433) | P‐Value | |
|---|---|---|---|
| |||
| Length of hospital stay, days | 9.3 6.7 | 13.1 12.4 | <0.001 |
| Total admission cost: $ per patient | 2223.4 3428.2 | 3700.8 8010.7 | 0.001 |
| Admission cost paid by NHI: $ per patient | 1640.2 2403.3 | 2933.8 7460.7 | 0.001 |
| In‐hospital mortality | 47 (12) | 37 (9) | 0.068 |
| Do‐not‐resuscitate consent | 74 (20) | 34 (8) | <0.001 |
| 30‐Day readmission* | 71 (22) | 83 (21) | 0.922 |
| Hospitalist‐Run Ward (n = 101) | Internist‐Run Wards (n = 101) | P‐Value | |
|---|---|---|---|
| |||
| Age >65 years old | 59 (58) | 59 (58) | 1.000 |
| Gender, Male | 55 (54) | 50 (50) | 0.481 |
| Barthel's score | 66 34 | 65 35 | 0.897 |
| Charlson score | 3.2 3.2 | 3.6 3.5 | 0.437 |
| Admission diagnosis | |||
| Pneumonia | 31 (31) | 27 (27) | 0.534 |
| Exacerbation of COPD | 4 (4) | 5 (5) | 0.733 |
| Congestive heart failure | 2 (2) | 2 (2) | 1.000 |
| Gastrointestinal bleeding | 10 (10) | 8 (8) | 0.621 |
| Intra‐abdominal infection | 18 (18) | 10 (10) | 0.103 |
| Urinary tract infection | 22 (22) | 21 (21) | 0.864 |
| Cellulitis | 6 (6) | 5 (5) | 0.757 |
| Ischemic stroke | 2 (2) | 0 | 0.155 |
| Others* | 39 (39) | 30 (30) | 0.182 |
| Laboratory data in the initial admission | |||
| Leukocyte count, /L | 12487 6288 | 11430 7718 | 0.287 |
| Hemoglobin, g/dL | 12.8 13.7 | 12.5 7.5 | 0.803 |
| Platelet count, K/L | 212 102 | 207 103 | 0.710 |
| Blood urea nitrogen, mg/dL | 25.5 19.7 | 24.7 17.5 | 0.773 |
| Creatinine, mg/dL | 1.5 1.2 | 1.6 1.5 | 0.979 |
| Total bilirubin, mg/dL | 2.0 7.0 | 2.0 6.9 | 0.963 |
| C‐reactive protein, mg/dL | 6.9 7.7 | 7.0 6.4 | 0.859 |
| Length of hospital stay, days | 9.2 6.4 | 15.2 13.8 | <0.001 |
| Do‐not‐resuscitate consent | 18 (18) | 6 (6) | 0.009 |
| Total admission cost: $ per patient | 2019.4 1709.3 | 5608.9 14244.8 | 0.013 |
| Cost paid by NHI: $ per patient | 1463.4 1404.6 | 4665.8 13553.3 | 0.019 |
| In‐hospital mortality | 9 (9) | 7 (7) | 0.602 |
| 30‐Day postdischarge readmission | 17 (18) | 21 (22) | 0.492 |
Both groups had almost the same propensity scores (P = 0.970; see online Supporting Information). Patients in the HW group had significantly lower admission cost, shorter LOS (Figure 1B), and more DNR consent, but similar in‐hospital mortality and readmission rates (Table 4).
DISCUSSION
The hospitalist system, which has been practiced for years in the United States, has not really been reported in Asia.13 Under the universal NHI system, this system has been studied in terms of treating patients in a Taiwan referral center. This study is the first to report on a hospitalist system in an Asian country with an NHI program. The hospitalist system in this study demonstrates efficient performance even though the patients have multiple comorbidities, compared to those in the general medical wards. By propensity score‐matching, admission costs of the hospitalist‐run ward are significantly lower than those of the internist‐run wards despite similar mortality and readmission rates.
The average LOS is reduced by 29% in HW patients and this plays a major role in cost reduction.14, 15 The reason may be the hospitalist's full‐time care, which allows for prompt decision‐making and close interaction with the patients' families.16 These families thus understand the treatment planning and prognosis. Furthermore, the hospitalist system continues working on weekends. As a result, patients are discharged without delay, even on holidays.
The aim of reducing LOS and costs is important because hospital income will decrease under the payment by disease‐related group (DRG) being implemented by the NHI system.17 A shortage of inpatient physicians may also develop due to the high workload but relatively low remuneration.2, 18 In contrast, a hospitalist care system that integrates nurse practitioners demands less human resources and saves on costs. In the future, it may be one of the solutions for hospitals aiming to maintain financial balance.
Another important issue in the NHI coverage is the increasing number of patients in the ED, which seems to be overflowing.19 In a previous Taiwan report, there are 7.1 patients per day who are staying in the ED for more than 72 hours, despite indications for admission.20 The delay is possibly due to the lack of available beds in the inpatient department.21 Amidst increasing demands for admission under the NHI and an aging society,2, 20 experience suggests that a hospitalist care system is a promising alternative to address the high ED patient volumes, especially on holidays. Howell et al. have also demonstrated that hospitalist‐driven bed management enhances the bed utility rate.21, 22 Since the current study also shows reduced LOS in the HW, patients will have a faster turn‐over rate and thereby assist in alleviating ED overcrowding.
Although the LOS of the patients here is comparable to that reported by the Taiwan NHI,2 it is far longer than that reported in the United States (around 4.75.2 days).4, 23 One possible explanation is the social and cultural determinants, including hospital‐ or physician‐dependence.24 In literature from Japan and Taiwan, hospitalization is as long as 13 weeks.25, 26 In addition, the average admission cost is reportedly around $1540 per patient‐day in the US, around 6 times that in this study ($266.6 per patient‐day).4 In the aging society of Taiwan,27 the NHI‐required copayment for admission may be relatively low, such that patients (or their families) may be misled that hospital care is better and hesitate to be discharged.2830
Regarding quality of care and patient safety, the in‐hospital mortality and the 30‐day readmission rates are similar in both groups, although disease severity and underlying comorbidities are worse in the HW at the start. This is consistent with previous reports that hospitalists can manage inpatient as well as internist care systems.4, 23 However, because this study has been performed in a tertiary referral center, patients may be more severely ill, such that the inpatient mortality and 30‐day readmission rates are as high as 10.3% and 21.11%, respectively.31, 32 Nonetheless, generalizing the hospitalist system to regional or district hospitals remains a concern, and this warrants further study.
This study has two other limitations. First, it is an observational study and patients have different demographics even though propensity score‐matching has been performed. Second, the patients were hospitalized without a standardized treatment protocol.
In conclusion, under the NHI system in Taiwan, a hospitalist system can have higher efficiency in shortening LOS and reducing cost than an internist care system, and still have similar hospital mortality and readmission rates. A hospitalist system may address the issue of high patient volume by increasing ward utilization. It can be recommended in a country with NHI that has a shortage of inpatient care staff.
- ,,,.Health system reform in the Republic of China. Formulating policy in a market‐based health system.JAMA.1995;273:777–781.
- ,,.A 10‐year experience with universal health insurance in Taiwan: measuring changes in health and health disparity.Ann Intern Med.2008;148:258–267.
- ,.Learning from Taiwan: experience with universal health insurance.Ann Intern Med.2008;148:313–314.
- ,,,,,.Outcomes of care by hospitalists, general internists, and family physicians.N Engl J Med.2007;357:2589–2600.
- ,.The effect of universal health insurance on health care utilization in Taiwan. Results from a natural experiment.JAMA.1997;278:89–93.
- ,,,,,.The interrelationships between working conditions, job satisfaction, burnout and mental health among hospital physicians in Japan: a path analysis.Ind Health.2009;47:166–172.
- ,.The emerging role of “hospitalists” in the American health care system.N Engl J Med.1996;335:514–517.
- ,,,,,.Continuity of outpatient and inpatient care by primary care physicians for hospitalized older adults.JAMA.2009;301:1671–1680.
- ,,,,.Hospitalists and the quality of care in hospitals.Arch Intern Med.2009;169:1389–1394.
- ,,,.Growth in the care of older patients by hospitalists in the United States.N Engl J Med.2009;360:1102–1112.
- ,,,,.The use of Charlson comorbidity index for patients revisiting the emergency department within 72 hours.Chang Gung Med J.2007;30:437–444.
- ,,,.Reliability of the Barthel Index when used with older people.Age Ageing.2005;34:228–232.
- .The hospitalist movement—a complex adaptive response to fragmentation of care in hospitals.Ann Acad Med Singapore.2008;37:145–150.
- ,,,,,.Determinants of hospitalist efficiency: a qualitative and quantitative study.Med Care Res Rev.2009;66:682–702.
- .The critical role of hospitalists in controlling healthcare costs.J Hosp Med.2010;5:127–132.
- .The relationship between hospitalists and primary care physicians.Ann Intern Med.2010;152:474.
- ,,,,,.Using diagnosis‐related groups. The situation in the United Kingdom National Health Service and in Germany.Eur J Health Econ.2004;5:287–289.
- ,,,,.Factors influencing medical students' choice of specialty.J Formos Med Assoc.2006;105:489–496.
- ,,,,.Factors associated with frequent use of emergency services in a medical center.J Formos Med Assoc.2003;102:222–228.
- ,,, et al.ED overcrowding in Taiwan: facts and strategies.Am J Emerg Med.1999;17:198–202.
- ,,,,,.Active bed management by hospitalists and emergency department throughput.Ann Intern Med.2008;149:804–811.
- ,,,.Hospitalist bed management effecting throughput from the emergency department to the intensive care unit.J Crit Care.2010;25:184–189.
- ,,,.A comparison of two hospitalist models with traditional care in a community teaching hospital.Am J Med.2005;118:536–543.
- ,,,.Factors associated with tocolytic hospitalizations in Taiwan: evidence from a population‐based and longitudinal study from 1997 to 2004.BMC Pregnancy Childbirth.2009;9:59.
- ,,.Complicated parapneumonic effusion and empyema in children.J Microbiol Immunol Infect.2006;39:483–488.
- ,,, et al.Efficacy of corticosteroids in the treatment of community‐acquired pneumonia requiring hospitalization.Lung.2007;185:249–255.
- ,,.Analysis of population projections for Taiwan area: 2008 to 2056.Taiwan Economic Forum.2009;7:36–69.
- ,,,,.Why Taiwanese hospice patients want to stay in hospital: health‐care professionals' beliefs and solutions.Support Care Cancer.2004;12:285–292.
- ,,.Patient characteristics predict occurrence and outcome of complaints against physicians: a study from a medical center in central Taiwan.J Formos Med Assoc.2009;108:126–134.
- ,.The demand for healthcare under Taiwan's national health insurance: a count data model approach.Expert Rev Pharmacoecon Outcomes Res.2009;9:13–22.
- ,.Feasibility and validity of International Classification of Diseases based case mix indices.BMC Health Serv Res.2006;6:125.
- ,,,,,.Non‐tuberculous mycobacterial pleurisy: an 8‐year single‐centre experience in Taiwan.Int J Tuberc Lung Dis.2010;14:635–641, p 634 follows 641.
In Taiwan, the national health insurance (NHI) implemented since 19951 has extended its coverage to almost the entire population. It may serve as a model for other countries looking to implement a universal health insurance system.2, 3 However, due to the low copayment for services, there are increasing admission rates and hospitalizations.2, 4 Admission rates, in particular, have nearly tripled for those who have been previously uninsured prior to the NHI program.2 In terms of hospital care, internal medicine and surgery are not favorite areas of specialty in the NHI system because inpatient care has a high workload but relatively low salaries.2, 5, 6 Consequently, there is now a shortage of primary inpatient care staff in Taiwan. The hospitalist system may be a solution to this problem.
The role of a hospitalist system has been discussed since 1996.7 Although its pros and cons are still debatable,8 the hospitalist system has grown in recent decades and there is a wide acceptance that hospitalists can efficiently care for inpatients.4, 9, 10 However, most related studies are in Western countries.4, 6, 11 It has rarely been studied in Asian countries and in those with NHI programs.
This study therefore aimed to investigate whether the hospitalist system, working within the NHI system in Taiwan, can be efficient in saving costs, maintaining quality care, and managing a high volume of in patients.
Materials and Methods
This prospective observational study was conducted in the National Taiwan University Hospital (NTUH), a tertiary‐care referral center in northern Taiwan, and approved by the hospital's Institutional Review Board. The program was also registered on Clinicaltrial.gov (identifier NCT00997646). A 36‐bed hospitalist‐run ward (HW) was set up in October 2009 in NTUH. For performance comparison, two 36‐bed internist‐run wards (IWs) were selected. The three wards were geographically separated.
Study Subjects
All patients age >18 years from the emergency department (ED) were admitted into one of the three wards based on the diagnosis category determined by the ED physicians. A patient was admitted by bed managers who were blinded to the study. Cases were categorized as diseases of general medicine, such as congestive heart failure, pneumonia, exacerbation of chronic obstructive pulmonary disease, cellulitis, ischemic stroke, urinary tract infection, and gastrointestinal bleeding.
Patients with severe illnesses requiring admission to intensive care units were excluded. Research assistants who were blinded to the patient stratification performed the patients' identification and data collection. Patient care was determined by the respective medical teams without any interference from this study.
Care‐Team Structure
The HW was set up with 3 attending physicians certified by a board of internal medicine and 6 nurse practitioners. All staff members worked full‐time to provide primary inpatient care. For comparison (Table 1), each IW had a set‐up of 3 attending physicians licensed by a board of internal medicine, one chief resident, 3 junior residents, and 3 interns. The attending physicians of the IWs visited their inpatients every workday and delegated primary care to residents on night shifts and weekends.
| Hospitalist‐Run Ward | Internist‐Run Wards | |
|---|---|---|
| ||
| Team member, per ward | 3 AP, 6 NP | 3 AP, 1 CR, 3 JR, 3 intern |
| Beds, per ward | 36 | 36 |
| Inpatient care of AP | Full time | Once daily |
| Who prescribes care order? | AP | AP, CR, JR |
| Who executes order? | NP | JR, intern |
| AP duty | Inpatient care; research | Inpatient/outpatient care; work of subspecialty; research |
| Bed manager | NP/AP | CR |
Clinical Characteristics
The patients' clinical characteristics, laboratory data, hospital course, and outcomes were recorded. The clinical characteristics included age, gender, underlying comorbidities, activities of daily living, and admission diagnosis. Charlson scores and Barthel's scores represented underlying comorbidities and activities of daily living, respectively. These were calculated as described in previous studies.11, 12 Admission costs paid for by the Taiwan NHI was defined as an inpatient's expenditure paid to the hospital by the institute of NHI. Total admission cost included expenses paid for by NHI and the patient's out‐of‐pocket expenditure not covered by NHI. A primary care physician was defined if the patient had visited the same doctor's clinic three times or more within one year prior to admission.8 Patients were followed‐up for 30 days after discharge by telephone, or until readmission.
Propensity Score Methods
Propensity score‐matching was used to balance observed covariates between the 2 care groups. It was defined as the conditional probability for being admitted to the HW, as a binary dependent variable, under a set of measurements. Factors that were significantly different (P < 0.05) between the 2 groups in univariate analysis were included in a multivariable logistic regression model to predict HW admission. The predicted probability derived from the logistic equation was used as the propensity score for each individual.
Patients in the HW and IWs were pooled and sorted according to their propensity score in ascending order. The selection process began from the first two cases with the lowest propensity score. If one was admitted to the HW and the other to an IW, both were selected as a matched pair. If this was not the case, then four cases were included. If there were two HW patients and two IW cases, the four were selected as two matched pairs. In the same way, HW and IW cases were matched by their propensity score in 1:1, 2:2, or 3:3 blocks. A patient who did not have a suitable match within the acceptable rank range was excluded from further analysis. The matching process moved down the sort list until all possible matched pairs were included and the selected patients formed a matched 1:1 pair in both groups.
Statistical Analysis
Intergroup differences were compared using independent t test for numerical variables and chi‐square test for categorical variables. Curves of probability of staying in the hospital within 30 days were generated using the Kaplan‐Meier method and compared using the log‐rank test. A logistic regression model was used for the propensity score match using the SPSS software version 13.0 (SPSS, Chicago, IL). The probability that indicated patient admission to the HW in both groups was used to draw box‐plots. After the 1:1 matched groups were assembled, the clinical characteristics were compared accordingly.
Results
From November 2009 to January 2010, 810 patients admitted from the ED to the study wards were enrolled. Among them, 377 were admitted to the HW and 433 to the IWs. Analysis of admission days showed that 84 (22%) and 53 (12%) patients were admitted to the HW and IWs, respectively, on weekends (P < 0.001).
Compared to the IW patients, the HW patients were older (age >65 years) and had poorer functional status by Barthel's scores (Table 2). Admission diagnosis was similar in both groups, except for pneumonia and urinary tract infection, which were higher in the HW patients. There was a primary care physician in 242 (64%) HW and 282 (65%) IW patients (P = 0.781).
The Charlson score, representing underlying comorbidity, was higher in the HW group (P = 0.002). Moreover, patients with severe liver cirrhosis (Child‐Pugh class C) were more frequently admitted to the HW (P = 0.018). Underlying malignancy, severe chronic kidney disease (estimated creatinine clearance <30 mL/min), and chronic respiratory failure requiring mechanical ventilator support were more associated with HW admission, although not statistically significantly (P = 0.064, 0.072, and 0.104, respectively).
The average admission cost was lower in HW patients than in IW patients, whether paid for by NHI ($1640.2 vs $2933.8 per patient, P = 0.001) or by the total admission cost ($2223.4 vs $3700.8 per patient, P = 0.001) (Table 3). Similarly, there was a shorter average length of stay (LOS) in the HW patients (9.3 vs 13.1 days, P < 0.001), who were discharged earlier than IW patients (Figure 1A). Regarding cost per patient‐day, the total daily cost was similar between the two groups (P = 0.560).
| Hospitalist‐Run Ward (n = 377) | Internist‐Run Wards (n = 433) | P‐Value | |
|---|---|---|---|
| |||
| Age >65 years old | 237 (63) | 240 (55) | 0.032 |
| Gender, male | 210 (56) | 243 (56) | 0.905 |
| Barthel's score | 61 35 | 70 33 | <0.001 |
| Charlson score | 3.7 3.4 | 3.0 3.2 | 0.002 |
| Admission diagnosis | |||
| Pneumonia | 106 (28) | 88 (20) | 0.010 |
| Exacerbation of COPD | 18 (5) | 15 (3) | 0.347 |
| Congestive heart failure | 12 (3) | 19 (4) | 0.373 |
| Upper gastrointestinal bleeding | 55 (15) | 58 (13) | 0.625 |
| Intra‐abdominal infection | 36 (10) | 47 (11) | 0.541 |
| Urinary tract infection | 85 (23) | 69 (16) | 0.017 |
| Cellulitis | 20 (5) | 18 (4) | 0.441 |
| Ischemic stroke | 12 (3) | 21 (5) | 0.231 |
| Others* | 117 (31) | 164 (38) | 0.041 |
| Laboratory data in the initial admission | |||
| Leukocyte count, /L | 11372 7962 | 10377 6422 | 0.050 |
| Hemoglobin, g/dL | 12.7 12.8 | 12.3 8.6 | 0.714 |
| Platelet count, K/L | 219 124 | 205 108 | 0.102 |
| Blood urea nitrogen, mg/dL | 33.2 27.7 | 24.1 17.4 | <0.001 |
| Creatinine, mg/dL | 1.9 2.9 | 1.6 2.8 | 0.080 |
| Total bilirubin, mg/dL | 2.2 3.7 | 2.3 3.6 | 0.826 |
| C‐reactive protein, mg/dL | 8.0 7.7 | 6.0 6.4 | 0.008 |
More patients in the HW group signed the do‐not‐resuscitate (DNR) consent (P < 0.001) and died during the hospital course, although the difference was not statistically significant (P = 0.068). Among those who expired during hospitalization, DNR consent was signed by 42 (90%) HW and 27 (68%) IW patients (P = 0.014). Among those discharged, 57 (17.2%) HW and 70 (17.6%) IW patients were lost to follow‐up. There was no difference in the 30‐day readmission for any cause between the two groups (P = 0.992).
Due to baseline differences, propensity score‐matching was performed and 101 pairs of patients were selected according to the probability generated from factors significantly different in univariate analysis (ie, age >65 years, pneumonia or urinary tract infections, Charlson score, Barthel's score, and blood urea nitrogen and C‐reactive protein levels on initial admission). The clinical characteristics of the 202 patients were shown in Table 4.
| Hospitalist‐Run Ward (n = 377) | Internist‐Run Wards (n = 433) | P‐Value | |
|---|---|---|---|
| |||
| Length of hospital stay, days | 9.3 6.7 | 13.1 12.4 | <0.001 |
| Total admission cost: $ per patient | 2223.4 3428.2 | 3700.8 8010.7 | 0.001 |
| Admission cost paid by NHI: $ per patient | 1640.2 2403.3 | 2933.8 7460.7 | 0.001 |
| In‐hospital mortality | 47 (12) | 37 (9) | 0.068 |
| Do‐not‐resuscitate consent | 74 (20) | 34 (8) | <0.001 |
| 30‐Day readmission* | 71 (22) | 83 (21) | 0.922 |
| Hospitalist‐Run Ward (n = 101) | Internist‐Run Wards (n = 101) | P‐Value | |
|---|---|---|---|
| |||
| Age >65 years old | 59 (58) | 59 (58) | 1.000 |
| Gender, Male | 55 (54) | 50 (50) | 0.481 |
| Barthel's score | 66 34 | 65 35 | 0.897 |
| Charlson score | 3.2 3.2 | 3.6 3.5 | 0.437 |
| Admission diagnosis | |||
| Pneumonia | 31 (31) | 27 (27) | 0.534 |
| Exacerbation of COPD | 4 (4) | 5 (5) | 0.733 |
| Congestive heart failure | 2 (2) | 2 (2) | 1.000 |
| Gastrointestinal bleeding | 10 (10) | 8 (8) | 0.621 |
| Intra‐abdominal infection | 18 (18) | 10 (10) | 0.103 |
| Urinary tract infection | 22 (22) | 21 (21) | 0.864 |
| Cellulitis | 6 (6) | 5 (5) | 0.757 |
| Ischemic stroke | 2 (2) | 0 | 0.155 |
| Others* | 39 (39) | 30 (30) | 0.182 |
| Laboratory data in the initial admission | |||
| Leukocyte count, /L | 12487 6288 | 11430 7718 | 0.287 |
| Hemoglobin, g/dL | 12.8 13.7 | 12.5 7.5 | 0.803 |
| Platelet count, K/L | 212 102 | 207 103 | 0.710 |
| Blood urea nitrogen, mg/dL | 25.5 19.7 | 24.7 17.5 | 0.773 |
| Creatinine, mg/dL | 1.5 1.2 | 1.6 1.5 | 0.979 |
| Total bilirubin, mg/dL | 2.0 7.0 | 2.0 6.9 | 0.963 |
| C‐reactive protein, mg/dL | 6.9 7.7 | 7.0 6.4 | 0.859 |
| Length of hospital stay, days | 9.2 6.4 | 15.2 13.8 | <0.001 |
| Do‐not‐resuscitate consent | 18 (18) | 6 (6) | 0.009 |
| Total admission cost: $ per patient | 2019.4 1709.3 | 5608.9 14244.8 | 0.013 |
| Cost paid by NHI: $ per patient | 1463.4 1404.6 | 4665.8 13553.3 | 0.019 |
| In‐hospital mortality | 9 (9) | 7 (7) | 0.602 |
| 30‐Day postdischarge readmission | 17 (18) | 21 (22) | 0.492 |
Both groups had almost the same propensity scores (P = 0.970; see online Supporting Information). Patients in the HW group had significantly lower admission cost, shorter LOS (Figure 1B), and more DNR consent, but similar in‐hospital mortality and readmission rates (Table 4).
DISCUSSION
The hospitalist system, which has been practiced for years in the United States, has not really been reported in Asia.13 Under the universal NHI system, this system has been studied in terms of treating patients in a Taiwan referral center. This study is the first to report on a hospitalist system in an Asian country with an NHI program. The hospitalist system in this study demonstrates efficient performance even though the patients have multiple comorbidities, compared to those in the general medical wards. By propensity score‐matching, admission costs of the hospitalist‐run ward are significantly lower than those of the internist‐run wards despite similar mortality and readmission rates.
The average LOS is reduced by 29% in HW patients and this plays a major role in cost reduction.14, 15 The reason may be the hospitalist's full‐time care, which allows for prompt decision‐making and close interaction with the patients' families.16 These families thus understand the treatment planning and prognosis. Furthermore, the hospitalist system continues working on weekends. As a result, patients are discharged without delay, even on holidays.
The aim of reducing LOS and costs is important because hospital income will decrease under the payment by disease‐related group (DRG) being implemented by the NHI system.17 A shortage of inpatient physicians may also develop due to the high workload but relatively low remuneration.2, 18 In contrast, a hospitalist care system that integrates nurse practitioners demands less human resources and saves on costs. In the future, it may be one of the solutions for hospitals aiming to maintain financial balance.
Another important issue in the NHI coverage is the increasing number of patients in the ED, which seems to be overflowing.19 In a previous Taiwan report, there are 7.1 patients per day who are staying in the ED for more than 72 hours, despite indications for admission.20 The delay is possibly due to the lack of available beds in the inpatient department.21 Amidst increasing demands for admission under the NHI and an aging society,2, 20 experience suggests that a hospitalist care system is a promising alternative to address the high ED patient volumes, especially on holidays. Howell et al. have also demonstrated that hospitalist‐driven bed management enhances the bed utility rate.21, 22 Since the current study also shows reduced LOS in the HW, patients will have a faster turn‐over rate and thereby assist in alleviating ED overcrowding.
Although the LOS of the patients here is comparable to that reported by the Taiwan NHI,2 it is far longer than that reported in the United States (around 4.75.2 days).4, 23 One possible explanation is the social and cultural determinants, including hospital‐ or physician‐dependence.24 In literature from Japan and Taiwan, hospitalization is as long as 13 weeks.25, 26 In addition, the average admission cost is reportedly around $1540 per patient‐day in the US, around 6 times that in this study ($266.6 per patient‐day).4 In the aging society of Taiwan,27 the NHI‐required copayment for admission may be relatively low, such that patients (or their families) may be misled that hospital care is better and hesitate to be discharged.2830
Regarding quality of care and patient safety, the in‐hospital mortality and the 30‐day readmission rates are similar in both groups, although disease severity and underlying comorbidities are worse in the HW at the start. This is consistent with previous reports that hospitalists can manage inpatient as well as internist care systems.4, 23 However, because this study has been performed in a tertiary referral center, patients may be more severely ill, such that the inpatient mortality and 30‐day readmission rates are as high as 10.3% and 21.11%, respectively.31, 32 Nonetheless, generalizing the hospitalist system to regional or district hospitals remains a concern, and this warrants further study.
This study has two other limitations. First, it is an observational study and patients have different demographics even though propensity score‐matching has been performed. Second, the patients were hospitalized without a standardized treatment protocol.
In conclusion, under the NHI system in Taiwan, a hospitalist system can have higher efficiency in shortening LOS and reducing cost than an internist care system, and still have similar hospital mortality and readmission rates. A hospitalist system may address the issue of high patient volume by increasing ward utilization. It can be recommended in a country with NHI that has a shortage of inpatient care staff.
- ,,,.Health system reform in the Republic of China. Formulating policy in a market‐based health system.JAMA.1995;273:777–781.
- ,,.A 10‐year experience with universal health insurance in Taiwan: measuring changes in health and health disparity.Ann Intern Med.2008;148:258–267.
- ,.Learning from Taiwan: experience with universal health insurance.Ann Intern Med.2008;148:313–314.
- ,,,,,.Outcomes of care by hospitalists, general internists, and family physicians.N Engl J Med.2007;357:2589–2600.
- ,.The effect of universal health insurance on health care utilization in Taiwan. Results from a natural experiment.JAMA.1997;278:89–93.
- ,,,,,.The interrelationships between working conditions, job satisfaction, burnout and mental health among hospital physicians in Japan: a path analysis.Ind Health.2009;47:166–172.
- ,.The emerging role of “hospitalists” in the American health care system.N Engl J Med.1996;335:514–517.
- ,,,,,.Continuity of outpatient and inpatient care by primary care physicians for hospitalized older adults.JAMA.2009;301:1671–1680.
- ,,,,.Hospitalists and the quality of care in hospitals.Arch Intern Med.2009;169:1389–1394.
- ,,,.Growth in the care of older patients by hospitalists in the United States.N Engl J Med.2009;360:1102–1112.
- ,,,,.The use of Charlson comorbidity index for patients revisiting the emergency department within 72 hours.Chang Gung Med J.2007;30:437–444.
- ,,,.Reliability of the Barthel Index when used with older people.Age Ageing.2005;34:228–232.
- .The hospitalist movement—a complex adaptive response to fragmentation of care in hospitals.Ann Acad Med Singapore.2008;37:145–150.
- ,,,,,.Determinants of hospitalist efficiency: a qualitative and quantitative study.Med Care Res Rev.2009;66:682–702.
- .The critical role of hospitalists in controlling healthcare costs.J Hosp Med.2010;5:127–132.
- .The relationship between hospitalists and primary care physicians.Ann Intern Med.2010;152:474.
- ,,,,,.Using diagnosis‐related groups. The situation in the United Kingdom National Health Service and in Germany.Eur J Health Econ.2004;5:287–289.
- ,,,,.Factors influencing medical students' choice of specialty.J Formos Med Assoc.2006;105:489–496.
- ,,,,.Factors associated with frequent use of emergency services in a medical center.J Formos Med Assoc.2003;102:222–228.
- ,,, et al.ED overcrowding in Taiwan: facts and strategies.Am J Emerg Med.1999;17:198–202.
- ,,,,,.Active bed management by hospitalists and emergency department throughput.Ann Intern Med.2008;149:804–811.
- ,,,.Hospitalist bed management effecting throughput from the emergency department to the intensive care unit.J Crit Care.2010;25:184–189.
- ,,,.A comparison of two hospitalist models with traditional care in a community teaching hospital.Am J Med.2005;118:536–543.
- ,,,.Factors associated with tocolytic hospitalizations in Taiwan: evidence from a population‐based and longitudinal study from 1997 to 2004.BMC Pregnancy Childbirth.2009;9:59.
- ,,.Complicated parapneumonic effusion and empyema in children.J Microbiol Immunol Infect.2006;39:483–488.
- ,,, et al.Efficacy of corticosteroids in the treatment of community‐acquired pneumonia requiring hospitalization.Lung.2007;185:249–255.
- ,,.Analysis of population projections for Taiwan area: 2008 to 2056.Taiwan Economic Forum.2009;7:36–69.
- ,,,,.Why Taiwanese hospice patients want to stay in hospital: health‐care professionals' beliefs and solutions.Support Care Cancer.2004;12:285–292.
- ,,.Patient characteristics predict occurrence and outcome of complaints against physicians: a study from a medical center in central Taiwan.J Formos Med Assoc.2009;108:126–134.
- ,.The demand for healthcare under Taiwan's national health insurance: a count data model approach.Expert Rev Pharmacoecon Outcomes Res.2009;9:13–22.
- ,.Feasibility and validity of International Classification of Diseases based case mix indices.BMC Health Serv Res.2006;6:125.
- ,,,,,.Non‐tuberculous mycobacterial pleurisy: an 8‐year single‐centre experience in Taiwan.Int J Tuberc Lung Dis.2010;14:635–641, p 634 follows 641.
Copyright © 2011 Society of Hospital Medicine

Provider Expectations and Experiences
Comanagement is common in hospital medicine practice. And yet, there is no consensus about how comanagement is different from traditional consultative practice. At its core, hospitalist comanagement is a practice arrangement wherein hospitalists and other specialists manage complex patients collaboratively. Beyond this, Huddleston et al. distinguish comanagement from traditional consultations in the comanaging hospitalists' prerogative to provide direct medical care in addition to consultative advice.1 Siegal focuses on the shared responsibility and authority among partnering providers in the comanagement model.2 Whinney and Michota see comanagement as patient care referral at the onset of a care episode, in contrast to consultations that are activated to address emergent problems.3 In a recent study that found the growing adoption of medical comanagement in Medicare beneficiaries (as much as 40% of surgical hospitalizations in 2006), comanagement was defined as an intensive form of consultation involving a claim for evaluation and management services on greater than 70% of inpatient days.4
In addition to the intensity, frequency, timing, responsibility, and authority of care, comanagement may be described by participating physicians' roles. With recent attention on multidisciplinary teams and an increasing focus on collaborative care, many of the hierarchical relations among healthcare providers are breaking down.5 Several studies of multidisciplinary teams suggest that more egalitarian, rather than hierarchical, problem‐solving and decision‐making among team members are beneficial to patients.67 However, neither the intended nor natural team structure under comanagement is known. We sought to shed some light on provider interactions by characterizing the expectations and experiences of providers of a comanaged service. The findings yielded an opportunity to generate an evolving, but conceptually supported definition of comanagement.
SETTING
We conducted a survey study of providers participating in a comanaged inpatient hepatology service at the University of Chicago Medical Center, a 572‐bed urban teaching hospital. The service was created in 2006, partly to address staffing problems related to housestaff work hour restrictions and partly to improve the care of candidates and recipients of liver transplantation. Nonsurgical floor patients with liver diseases were managed on the service by two collaborating teams of providers. The hepatology team consisted of an attending physician and a fellow, while the hospitalist team consisted of a hospitalist and one or two nonphysician providers (physician assistant or nurse practitioner). The practice model is characterized as comanagement because of the highly interdependent nature of the team's daily tasks and the norms of intensive communication, through formal joint daily rounds and informal direct exchanges of instructions and updates. Hepatologists were mainly responsible for coordinating admissions, managing issues related to liver dysfunction, communicating with transplant surgeons if necessary, and arranging postdischarge care. Hospitalists were responsible for admitting patients, managing routine (eg, ordering daily labs) and urgent issues (eg, responding to critical lab values) during hospitalizations, coordinating with ancillary and consultative staff, and discharging patients. Occasional meetings between the hepatology and hospital medicine groups were used to clarify assignment of responsibilities. Floor nurses received in‐servicing at the commencement of the service. Additional details about the service are described elsewhere.8
DATA COLLECTION AND ANALYSIS
For the purpose of our analysis, we defined interactions between any member of the hospitalist and hepatologist teams as pertinent to comanagement. The hospitalist nonphysician provider (NPP) and hepatologistfellow relationships are governed by the more traditional hierarchical dynamics based on supervision and authority according to laws and regulations. At the beginning of the study period, each participant completed nine items of a Baseline Survey that addressed respondents' expectations and preferences for the management of an ideally comanaged service. Responses were solicited using a 4‐point Likert‐type scale and were dichotomized such that agree and somewhat agree were grouped, while disagree and somewhat disagree were grouped for data analysis. Items were generated to address the salient issues of comanagement after reviewing the pertinent literature.
Subsequently, participants were asked to complete Repeated Surveys immediately before each change in membership of the comanaged team between April and October 2008. The surveys were hand delivered by one of the authors (K.H.) on the last day of each team's rotation and were often completed immediately. The seven items of the Repeated Survey reprised items from the Baseline Survey that were rephrased to allow respondents to report their direct experiences on specific teams. Because all providers rotated on the service more than once during the study period, the average value for each Likert‐type response across multiple surveys completed by a single provider was calculated before being dichotomized at the midpoint (<2.5, agree; 2.5, disagree). We reported proportions of respondents in agreement with survey item statements.
Comparison statistics across providers were generated using the chi‐square test. Differences in proportions between related items of the Baseline and Repeated Surveys were compared using the two‐sample test of proportions. All analyses were conducted using a statistics application (STATA 10.0, College Station, TX) with alpha equal to, or less than, 0.05 considered significant. The Institutional Review Board of the University of Chicago approved this project.
RESULTS
All 43 providers completed the Baseline Survey. During the study period, 32 of these participants rotated on the service and completed 177 of the 233 Repeated Surveys (79%) administered. The responses describe team interactions on the 47 unique combinations of providers comprising the comanaged teams. Details of the response rates are shown in Table 1.
| Baseline Survey, Completed/ Administered (%) | Repeated Surveys, Completed/ Administered (%) | Respondents Completing Repeated Surveys, n | Repeated Surveys Completed per Respondent, Median (IQR) | |
|---|---|---|---|---|
| ||||
| Hospitalists | 18/18 (100) | 36/43 (84) | 15 | 2 (2, 3) |
| NPPs | 5/5 (100) | 92/97 (95) | 5 | 20 (18, 20) |
| Hepatologists | 6/6 (100) | 26/42 (62) | 6 | 7 (3.75, 8) |
| Fellows | 12/12 (100) | 23/42 (55) | 6 | 7 (5.5, 8.5) |
| Total | 43/43 (100) | 177/223 (79) | 32 | 4.5 (2, 8.25) |
As shown in Table 2A, items 13, more members of the hospitalist team preferred to be informed about every management decision compared to members of the hepatologist team. Conversely, more of members of the hepatologist team than the hospitalist team preferred their comanaging partners to participate in every decision. A statistically similar proportion of respondents in each of the professional roles indicated desire for greater influence in directing management decisions (Table 2B, item 1).
| A. Baseline Survey | Hospitalists, % (n = 18) | NPPs, % (n = 5) | Hepatologists, % (n = 6) | GI Fellows, % (n = 12) | P‐value |
|---|---|---|---|---|---|
| |||||
| 1. I prefer to be informed about every decision. | 83 | 100 | 17 | 42 | <0.01 |
| 2. I prefer to participate in every decision. | 67 | 100 | 33 | 50 | 0.11 |
| 3. I prefer that my comanager participate in every decision. | 22 | 20 | 50 | 75 | 0.02 |
| 4. I prefer to have the final say in every decision. | 50 | 80 | 50 | 33 | 0.38 |
| 5. There should be one physician leader to direct the overall management of the patients' hospital course. | 89* | 100 | 67 | 83 | 0.43 |
| 6. Physician consensus should always be sought in every clinical decision. | 22 | 40 | 50 | 67 | 0.11 |
| 7. I have a clear understanding of my role on the comanagement service. | 61 | 80 | 83 | 75 | 0.66 |
| 8. I have as much a sense of ownership of patients on the comanaged service as on a non‐comanaged service. | 61 | 60 | 83 | 50 | 0.60 |
| 9. Comanagement tends to improve patient care. | 94 | 100* | 83 | 100* | 0.47 |
| B. Repeated Surveys | Hospitalists, % (n = 15) | NPPs, % (n = 5) | Hepatologists, % (n = 6) | GI Fellows, % (n = 6) | P‐value |
| 1. I would have liked greater influence in directing the overall management. | 40 | 60 | 0 | 17 | 0.12 |
| 2. I was responsible for work in clinical areas I was not comfortable managing. | 0 | 0 | 0 | 0 | NA |
| 3. There was one physician leader to direct the overall management of the patients' hospital course. | 60* | 80 | 67 | 83 | 0.70 |
| 4. Physician consensus was always sought in every clinical decision. | 40 | 40 | 50 | 67 | 0.72 |
| 5. I (have/had) a clear understanding of my role on the comanagement service. | 73 | 80 | 100 | 83 | 0.57 |
| 6. I had as much a sense of ownership of patients on the comanaged service as on a non‐comanaged service. | 53 | 80 | 100 | 67 | 0.20 |
| 7. Patients on my service received better care than they would have without comanagement. | 93 | 40* | 67 | 50* | 0.06 |
For the majority of surveyed areas, there was concordance between expectations and experiences of providers on comanagement. Most providers, regardless of professional role, agreed that there should be a single physician leader to direct the overall management (Table 2A, item 5). The majority perceived that a single physician directed the overall management of the patients' hospital course, although fewer hospitalists did so compared with baseline expectations (Table 2B, item 3). Many respondents felt at baseline that physician consensus should govern every management decision, and a similar proportion actually experienced consensus‐seeking on service.
We found that the proportion of providers reporting an understanding of their role increased slightly, though not significantly, from before (Table 2A, item 7) to after rotating on the comanaged service (Table 2B, item 5). Although not statistically significant, there was a trend towards hospitalists and gastrointestinal (GI) fellows reporting a lack of patient ownership, both before and after serving on the comanaged service. Finally, nearly all respondents reported that comanagement should improve care quality, although only the attending hospitalist and hepatologist felt that their experience on the comanaged service actually improved patient care (Table 2B, item 7).
DISCUSSION
In this survey of providers participating on a comanaged medical service, most reported understanding their role in the collaborative arrangement and had an initial perception that comanagement should improve patient care quality. We found that hospitalists preferred and were expected to participate in care globally, while hepatologists themselves preferred and were expected not to focus on every management decision. The prevalence of desire for ultimate authority across the professional roles suggests tensions that exist in this care model around how decisions are made. The majority of providers preferred and experienced a single physician leader under comanagement, but many also experienced consensus‐seeking for every management decision.
From these findings, we conclude that decision‐making processes are not uniform under comanagement and that some role ambiguity is present, but there appears to be a pattern of natural roles. This pattern can be defined by focus (general for hospitalists vs specialty‐specific for hepatologists), rather than by responsibilities for managing particular medical problems. The preference among both generalists and specialists for the broader involvement of hospitalist comanagers suggests an implicit recognition of the need for integrated management to overcome the silo‐effect within the comanagement structure.9 Although details about how such integration was achieved are not available in our data, we found that comanagement may be distinct from traditional consultative practice in that the consultants (hospitalists in this case) manage not only general medical problems, such as diabetes or hypertension, but hospitalizations more generally. From a mission‐based standpoint, comanagement may be seen as a collaborative management of complex patients by two or more clinical experts with distinct knowledge, skills, or focus enacted for the purpose of improving care quality.
The focus of comanagement on improving quality is in line with the founding charge of the hospital medicine specialty to raise hospital care quality.10 In fact, the distinction between comanagement and consultation may be meaningful only if comanagers can work with specialists to implement evidence‐based practice, process improvement, and address quality and cost concerns. But as seen in NPPs and fellows' skepticism of improved quality under comanagement, there is still clearly work to be done to validate this model through measurable improvement in patients' experiences and outcomes. Proving the advantages of comanagement as a platform for practice improvement remains future work.11
Collaborative arrangements create natural tensions related to team function.5 This is seen in the similar proportion of hospitalists and hepatologists indicating desire for final decision‐making authority. Although comanagement evokes assumptions about egalitarian provider interactions involving shared decision‐making and responsibility, it seems to function empirically under hierarchical as well as consensus‐seeking forms of decision‐making. Providers at the top of hierarchical teams typically experience their work as interdependent and collaborative, and report more positive interactions with other care providers.12 Based on the fact that no hepatologists wanted more influence over decision‐making, we assume that hepatologists were the physician leaders for most of the studied comanaged teams. Under situations characterized by high levels of complexity and interdependence, a team governed by a single leader may often be more effective than one governed by shared authority.8 However, even under hierarchical models, a more participatory than supervisory leadership can help avoid alienating partners through a pattern of we decide, you carry it out that is often associated with ineffective leadership styles.1314 In fact, this alienating effect on providers in subordinate roles (ie, NPPs and fellows) may have contributed to the negative perception of the team's function on improving patient care.
This study is limited in the following ways. We did not have 100% participation in the Repeated Surveys. Attitudes and experiences of participants in a single comanagement practice are not representative of all comanaging providers. However, the goal of this studyto collect unique survey data from providers themselves to inform an evolving definition of comanagementis modest enough in scope to not require a generalizable sample. Because this study unearthed differences in expectations and experiences within a single site, they may serve as a lower bound for the extent of differences across and within multiple sites. In addition, comanagement enacted for complex medical patients is not as common as the comanagement of surgical patients. Moreover, comanagement models in academic hospitals may have structural features and priorities not found in community settings. Whether or not these disparate models share enough in common to be categorized under a single rubric is a valid question.
Although the teamwork structure and provider roles within comanagement vary, the practice arrangement's preoccupation with quality can be seen as its defining feature. Limited evidence, to date,1, 1519 and the rapid proliferation of the model, suggest that quality and efficiency advantages can be obtained from an effective implementation of comanagement. As in any team‐based care model, a common understanding of roles and expectations are essential to enhancing teamwork. Our interpretation of the mission of comanagement may further enhance teamwork through an explicit articulation of shared goals.
- ,,, et al.Medical and surgical comanagement after elective hip and knee arthroplasty: A randomized, controlled trial.Ann Intern Med.2004;141(1):28–38.
- .Just because you can, doesn't mean that you should: A call for the rational application of hospitalist comanagement.J Hosp Med.2008;3(5):398–402.
- ,.Surgical comanagement: A natural evolution of hospitalist practice.J Hosp Med.2008;3(5):394–397.
- ,,,,.Comanagement of hospitalized surgical patients by medicine physicians in the United States.Arch Intern Med.2010;170(4):363–368.
- .Structure and meaning in multidisciplinary teamwork.Sociol Health Illn.1998;20(6):848–873.
- ,,,,.Human factors and cardiac surgery: A multicenter study.J Thorac Cardiov Surg.2000;119(4):661–670.
- ,,.The effects of a collaborative model of primary care on the mortality and hospital use of community‐dwelling older adults.J Gerontol A‐Biol.2001;56(2):M106–M112.
- ,,,,,.Effects of provider characteristics on care coordination under comanagement.J Hosp Med.2010;5:508–513.
- ,,.Crossing the Quality Chasm: A New Health System for the Twenty‐First Century.Washington, DC:Institute of Medicine;2001.
- ,.The emerging role of “hospitalists” in the American health care system.N Engl J Med.1996;335(7):514–517.
- .Internal medicine comanagement of surgical patients: Can we afford to do this?Arch Intern Med.2010;170(22):1965–1966.
- ,,, et al.Operating room teamwork among physicians and nurses: Teamwork in the eye of the beholder.J Am Coll Surg.2006;202(5):746–752.
- .“We decide, you carry it out”: A social network analysis of multidisciplinary longterm care teams.Soc Sci Med.1997;45(9):1411–1421.
- ,,.Patterns of aggressive behavior in experimentally created social climates.J Soc Psychol.1939;10:271–301.
- ,,, et al.Comanagement of surgical patients between neurosurgeons and hospitalists.Arch Intern Med.2010;170(22):2004–2010.
- ,,,,,.Outcomes for older patients with hip fractures: The impact of orthopedic and geriatric medicine cocare.J Orthop Trauma.2006;20(3):172–180.
- ,,, et al.Effects of a hospitalist model on elderly patients with hip fracture.Arch Intern Med.2005;165(7):796–801.
- ,,,.Hip fractures in geriatric patients. Results of an interdisciplinary hospital care program.Clin Orthop Relat Res.1992(274):213–225.
- ,,,.Impact of a comanaged Geriatric Fracture Center on short‐term hip fracture outcomes.Arch Intern Med.2009;169(18):1712–1717.
Comanagement is common in hospital medicine practice. And yet, there is no consensus about how comanagement is different from traditional consultative practice. At its core, hospitalist comanagement is a practice arrangement wherein hospitalists and other specialists manage complex patients collaboratively. Beyond this, Huddleston et al. distinguish comanagement from traditional consultations in the comanaging hospitalists' prerogative to provide direct medical care in addition to consultative advice.1 Siegal focuses on the shared responsibility and authority among partnering providers in the comanagement model.2 Whinney and Michota see comanagement as patient care referral at the onset of a care episode, in contrast to consultations that are activated to address emergent problems.3 In a recent study that found the growing adoption of medical comanagement in Medicare beneficiaries (as much as 40% of surgical hospitalizations in 2006), comanagement was defined as an intensive form of consultation involving a claim for evaluation and management services on greater than 70% of inpatient days.4
In addition to the intensity, frequency, timing, responsibility, and authority of care, comanagement may be described by participating physicians' roles. With recent attention on multidisciplinary teams and an increasing focus on collaborative care, many of the hierarchical relations among healthcare providers are breaking down.5 Several studies of multidisciplinary teams suggest that more egalitarian, rather than hierarchical, problem‐solving and decision‐making among team members are beneficial to patients.67 However, neither the intended nor natural team structure under comanagement is known. We sought to shed some light on provider interactions by characterizing the expectations and experiences of providers of a comanaged service. The findings yielded an opportunity to generate an evolving, but conceptually supported definition of comanagement.
SETTING
We conducted a survey study of providers participating in a comanaged inpatient hepatology service at the University of Chicago Medical Center, a 572‐bed urban teaching hospital. The service was created in 2006, partly to address staffing problems related to housestaff work hour restrictions and partly to improve the care of candidates and recipients of liver transplantation. Nonsurgical floor patients with liver diseases were managed on the service by two collaborating teams of providers. The hepatology team consisted of an attending physician and a fellow, while the hospitalist team consisted of a hospitalist and one or two nonphysician providers (physician assistant or nurse practitioner). The practice model is characterized as comanagement because of the highly interdependent nature of the team's daily tasks and the norms of intensive communication, through formal joint daily rounds and informal direct exchanges of instructions and updates. Hepatologists were mainly responsible for coordinating admissions, managing issues related to liver dysfunction, communicating with transplant surgeons if necessary, and arranging postdischarge care. Hospitalists were responsible for admitting patients, managing routine (eg, ordering daily labs) and urgent issues (eg, responding to critical lab values) during hospitalizations, coordinating with ancillary and consultative staff, and discharging patients. Occasional meetings between the hepatology and hospital medicine groups were used to clarify assignment of responsibilities. Floor nurses received in‐servicing at the commencement of the service. Additional details about the service are described elsewhere.8
DATA COLLECTION AND ANALYSIS
For the purpose of our analysis, we defined interactions between any member of the hospitalist and hepatologist teams as pertinent to comanagement. The hospitalist nonphysician provider (NPP) and hepatologistfellow relationships are governed by the more traditional hierarchical dynamics based on supervision and authority according to laws and regulations. At the beginning of the study period, each participant completed nine items of a Baseline Survey that addressed respondents' expectations and preferences for the management of an ideally comanaged service. Responses were solicited using a 4‐point Likert‐type scale and were dichotomized such that agree and somewhat agree were grouped, while disagree and somewhat disagree were grouped for data analysis. Items were generated to address the salient issues of comanagement after reviewing the pertinent literature.
Subsequently, participants were asked to complete Repeated Surveys immediately before each change in membership of the comanaged team between April and October 2008. The surveys were hand delivered by one of the authors (K.H.) on the last day of each team's rotation and were often completed immediately. The seven items of the Repeated Survey reprised items from the Baseline Survey that were rephrased to allow respondents to report their direct experiences on specific teams. Because all providers rotated on the service more than once during the study period, the average value for each Likert‐type response across multiple surveys completed by a single provider was calculated before being dichotomized at the midpoint (<2.5, agree; 2.5, disagree). We reported proportions of respondents in agreement with survey item statements.
Comparison statistics across providers were generated using the chi‐square test. Differences in proportions between related items of the Baseline and Repeated Surveys were compared using the two‐sample test of proportions. All analyses were conducted using a statistics application (STATA 10.0, College Station, TX) with alpha equal to, or less than, 0.05 considered significant. The Institutional Review Board of the University of Chicago approved this project.
RESULTS
All 43 providers completed the Baseline Survey. During the study period, 32 of these participants rotated on the service and completed 177 of the 233 Repeated Surveys (79%) administered. The responses describe team interactions on the 47 unique combinations of providers comprising the comanaged teams. Details of the response rates are shown in Table 1.
| Baseline Survey, Completed/ Administered (%) | Repeated Surveys, Completed/ Administered (%) | Respondents Completing Repeated Surveys, n | Repeated Surveys Completed per Respondent, Median (IQR) | |
|---|---|---|---|---|
| ||||
| Hospitalists | 18/18 (100) | 36/43 (84) | 15 | 2 (2, 3) |
| NPPs | 5/5 (100) | 92/97 (95) | 5 | 20 (18, 20) |
| Hepatologists | 6/6 (100) | 26/42 (62) | 6 | 7 (3.75, 8) |
| Fellows | 12/12 (100) | 23/42 (55) | 6 | 7 (5.5, 8.5) |
| Total | 43/43 (100) | 177/223 (79) | 32 | 4.5 (2, 8.25) |
As shown in Table 2A, items 13, more members of the hospitalist team preferred to be informed about every management decision compared to members of the hepatologist team. Conversely, more of members of the hepatologist team than the hospitalist team preferred their comanaging partners to participate in every decision. A statistically similar proportion of respondents in each of the professional roles indicated desire for greater influence in directing management decisions (Table 2B, item 1).
| A. Baseline Survey | Hospitalists, % (n = 18) | NPPs, % (n = 5) | Hepatologists, % (n = 6) | GI Fellows, % (n = 12) | P‐value |
|---|---|---|---|---|---|
| |||||
| 1. I prefer to be informed about every decision. | 83 | 100 | 17 | 42 | <0.01 |
| 2. I prefer to participate in every decision. | 67 | 100 | 33 | 50 | 0.11 |
| 3. I prefer that my comanager participate in every decision. | 22 | 20 | 50 | 75 | 0.02 |
| 4. I prefer to have the final say in every decision. | 50 | 80 | 50 | 33 | 0.38 |
| 5. There should be one physician leader to direct the overall management of the patients' hospital course. | 89* | 100 | 67 | 83 | 0.43 |
| 6. Physician consensus should always be sought in every clinical decision. | 22 | 40 | 50 | 67 | 0.11 |
| 7. I have a clear understanding of my role on the comanagement service. | 61 | 80 | 83 | 75 | 0.66 |
| 8. I have as much a sense of ownership of patients on the comanaged service as on a non‐comanaged service. | 61 | 60 | 83 | 50 | 0.60 |
| 9. Comanagement tends to improve patient care. | 94 | 100* | 83 | 100* | 0.47 |
| B. Repeated Surveys | Hospitalists, % (n = 15) | NPPs, % (n = 5) | Hepatologists, % (n = 6) | GI Fellows, % (n = 6) | P‐value |
| 1. I would have liked greater influence in directing the overall management. | 40 | 60 | 0 | 17 | 0.12 |
| 2. I was responsible for work in clinical areas I was not comfortable managing. | 0 | 0 | 0 | 0 | NA |
| 3. There was one physician leader to direct the overall management of the patients' hospital course. | 60* | 80 | 67 | 83 | 0.70 |
| 4. Physician consensus was always sought in every clinical decision. | 40 | 40 | 50 | 67 | 0.72 |
| 5. I (have/had) a clear understanding of my role on the comanagement service. | 73 | 80 | 100 | 83 | 0.57 |
| 6. I had as much a sense of ownership of patients on the comanaged service as on a non‐comanaged service. | 53 | 80 | 100 | 67 | 0.20 |
| 7. Patients on my service received better care than they would have without comanagement. | 93 | 40* | 67 | 50* | 0.06 |
For the majority of surveyed areas, there was concordance between expectations and experiences of providers on comanagement. Most providers, regardless of professional role, agreed that there should be a single physician leader to direct the overall management (Table 2A, item 5). The majority perceived that a single physician directed the overall management of the patients' hospital course, although fewer hospitalists did so compared with baseline expectations (Table 2B, item 3). Many respondents felt at baseline that physician consensus should govern every management decision, and a similar proportion actually experienced consensus‐seeking on service.
We found that the proportion of providers reporting an understanding of their role increased slightly, though not significantly, from before (Table 2A, item 7) to after rotating on the comanaged service (Table 2B, item 5). Although not statistically significant, there was a trend towards hospitalists and gastrointestinal (GI) fellows reporting a lack of patient ownership, both before and after serving on the comanaged service. Finally, nearly all respondents reported that comanagement should improve care quality, although only the attending hospitalist and hepatologist felt that their experience on the comanaged service actually improved patient care (Table 2B, item 7).
DISCUSSION
In this survey of providers participating on a comanaged medical service, most reported understanding their role in the collaborative arrangement and had an initial perception that comanagement should improve patient care quality. We found that hospitalists preferred and were expected to participate in care globally, while hepatologists themselves preferred and were expected not to focus on every management decision. The prevalence of desire for ultimate authority across the professional roles suggests tensions that exist in this care model around how decisions are made. The majority of providers preferred and experienced a single physician leader under comanagement, but many also experienced consensus‐seeking for every management decision.
From these findings, we conclude that decision‐making processes are not uniform under comanagement and that some role ambiguity is present, but there appears to be a pattern of natural roles. This pattern can be defined by focus (general for hospitalists vs specialty‐specific for hepatologists), rather than by responsibilities for managing particular medical problems. The preference among both generalists and specialists for the broader involvement of hospitalist comanagers suggests an implicit recognition of the need for integrated management to overcome the silo‐effect within the comanagement structure.9 Although details about how such integration was achieved are not available in our data, we found that comanagement may be distinct from traditional consultative practice in that the consultants (hospitalists in this case) manage not only general medical problems, such as diabetes or hypertension, but hospitalizations more generally. From a mission‐based standpoint, comanagement may be seen as a collaborative management of complex patients by two or more clinical experts with distinct knowledge, skills, or focus enacted for the purpose of improving care quality.
The focus of comanagement on improving quality is in line with the founding charge of the hospital medicine specialty to raise hospital care quality.10 In fact, the distinction between comanagement and consultation may be meaningful only if comanagers can work with specialists to implement evidence‐based practice, process improvement, and address quality and cost concerns. But as seen in NPPs and fellows' skepticism of improved quality under comanagement, there is still clearly work to be done to validate this model through measurable improvement in patients' experiences and outcomes. Proving the advantages of comanagement as a platform for practice improvement remains future work.11
Collaborative arrangements create natural tensions related to team function.5 This is seen in the similar proportion of hospitalists and hepatologists indicating desire for final decision‐making authority. Although comanagement evokes assumptions about egalitarian provider interactions involving shared decision‐making and responsibility, it seems to function empirically under hierarchical as well as consensus‐seeking forms of decision‐making. Providers at the top of hierarchical teams typically experience their work as interdependent and collaborative, and report more positive interactions with other care providers.12 Based on the fact that no hepatologists wanted more influence over decision‐making, we assume that hepatologists were the physician leaders for most of the studied comanaged teams. Under situations characterized by high levels of complexity and interdependence, a team governed by a single leader may often be more effective than one governed by shared authority.8 However, even under hierarchical models, a more participatory than supervisory leadership can help avoid alienating partners through a pattern of we decide, you carry it out that is often associated with ineffective leadership styles.1314 In fact, this alienating effect on providers in subordinate roles (ie, NPPs and fellows) may have contributed to the negative perception of the team's function on improving patient care.
This study is limited in the following ways. We did not have 100% participation in the Repeated Surveys. Attitudes and experiences of participants in a single comanagement practice are not representative of all comanaging providers. However, the goal of this studyto collect unique survey data from providers themselves to inform an evolving definition of comanagementis modest enough in scope to not require a generalizable sample. Because this study unearthed differences in expectations and experiences within a single site, they may serve as a lower bound for the extent of differences across and within multiple sites. In addition, comanagement enacted for complex medical patients is not as common as the comanagement of surgical patients. Moreover, comanagement models in academic hospitals may have structural features and priorities not found in community settings. Whether or not these disparate models share enough in common to be categorized under a single rubric is a valid question.
Although the teamwork structure and provider roles within comanagement vary, the practice arrangement's preoccupation with quality can be seen as its defining feature. Limited evidence, to date,1, 1519 and the rapid proliferation of the model, suggest that quality and efficiency advantages can be obtained from an effective implementation of comanagement. As in any team‐based care model, a common understanding of roles and expectations are essential to enhancing teamwork. Our interpretation of the mission of comanagement may further enhance teamwork through an explicit articulation of shared goals.
- ,,, et al.Medical and surgical comanagement after elective hip and knee arthroplasty: A randomized, controlled trial.Ann Intern Med.2004;141(1):28–38.
- .Just because you can, doesn't mean that you should: A call for the rational application of hospitalist comanagement.J Hosp Med.2008;3(5):398–402.
- ,.Surgical comanagement: A natural evolution of hospitalist practice.J Hosp Med.2008;3(5):394–397.
- ,,,,.Comanagement of hospitalized surgical patients by medicine physicians in the United States.Arch Intern Med.2010;170(4):363–368.
- .Structure and meaning in multidisciplinary teamwork.Sociol Health Illn.1998;20(6):848–873.
- ,,,,.Human factors and cardiac surgery: A multicenter study.J Thorac Cardiov Surg.2000;119(4):661–670.
- ,,.The effects of a collaborative model of primary care on the mortality and hospital use of community‐dwelling older adults.J Gerontol A‐Biol.2001;56(2):M106–M112.
- ,,,,,.Effects of provider characteristics on care coordination under comanagement.J Hosp Med.2010;5:508–513.
- ,,.Crossing the Quality Chasm: A New Health System for the Twenty‐First Century.Washington, DC:Institute of Medicine;2001.
- ,.The emerging role of “hospitalists” in the American health care system.N Engl J Med.1996;335(7):514–517.
- .Internal medicine comanagement of surgical patients: Can we afford to do this?Arch Intern Med.2010;170(22):1965–1966.
- ,,, et al.Operating room teamwork among physicians and nurses: Teamwork in the eye of the beholder.J Am Coll Surg.2006;202(5):746–752.
- .“We decide, you carry it out”: A social network analysis of multidisciplinary longterm care teams.Soc Sci Med.1997;45(9):1411–1421.
- ,,.Patterns of aggressive behavior in experimentally created social climates.J Soc Psychol.1939;10:271–301.
- ,,, et al.Comanagement of surgical patients between neurosurgeons and hospitalists.Arch Intern Med.2010;170(22):2004–2010.
- ,,,,,.Outcomes for older patients with hip fractures: The impact of orthopedic and geriatric medicine cocare.J Orthop Trauma.2006;20(3):172–180.
- ,,, et al.Effects of a hospitalist model on elderly patients with hip fracture.Arch Intern Med.2005;165(7):796–801.
- ,,,.Hip fractures in geriatric patients. Results of an interdisciplinary hospital care program.Clin Orthop Relat Res.1992(274):213–225.
- ,,,.Impact of a comanaged Geriatric Fracture Center on short‐term hip fracture outcomes.Arch Intern Med.2009;169(18):1712–1717.
Copyright © 2011 Society of Hospital Medicine
Successfully Promoted Academic Hospitalists
The growth of academic hospital medicine has been driven by multiple factors including expanding clinical needs, housestaff duty hours' limitations, and an increasing focus on quality and patient safety.1 Hospitalists at academic medical centers frequently assume roles that differ substantially from traditional faculty positions. Academic hospitalists may have predominantly clinical positions, and may be involved in quality improvement and patient safety projects.24 Because of these commitments, many academic hospitalists spend less time on research or educational efforts.1, 5 Many have raised concerns that these unique job descriptions might lead to less time to devote to scholarship and academic pursuits, and consequently greater challenges in the promotions process.2, 5
There are little published data on promotion and tenure in academics, and even less specifically focused on the promotion of hospitalists. Theoretically, promotion should recognize an individual's contribution to his or her institution and field. However, each institution has unique criteria though which faculty achieve promotion. Previous articles addressing specific groups, such as part‐time,6 clinical faculty,79 or clinician‐educators10 may be relevant to hospitalists, as hospitalists may be more likely to fall into these categories. These reports suggest general agreement that promotion committees should consider and weigh clinical and educational work (in addition to scholarly publications) in the promotions process, but assessment methods vary across institutions and the contribution of activities, such as quality improvement, remain unclear. The educator's portfolio has gained momentum as a way to document valued teaching in many institutions,11, 12 but academic hospitalist participation in education may be limited.13
Literature related to the development of Divisions of General Internal Medicine is relevant insofar as similar concerns for promotion were expressed with the growth of their faculty.14, 15 However, its applicability may be limited by differences between roles of hospitalists and more traditional general medicine faculty.
To better understand the factors influencing promotion for academic hospitalists, the Society of General Internal Medicine (SGIM) Academic Hospitalist Task Force (AHTF) undertook a survey of promoted hospitalists who had successfully reached the rank of Associate Professor or higher.
Methods
Development of the Survey
The AHTF is a group of 18 academic hospitalists representing 15 institutions. Draft survey questions were developed by the group and sent to its members for refinement based on group consensus. Three cycles of refinement were performed, and the final survey (Appendix) was converted into an electronic format distributed through SurveyMonkey (SurveyMonkey.com, Portland, OR).
Identification of Survey Recipients
We identified a convenience sample of hospitalists who had been promoted to Associate or Full Professor of Medicine by querying members of the AHTF, the Society of Hospital Medicine (SHM) Academic Committee, and colleagues of academic medical centers with established hospitalist programs. We identified 33 promoted hospitalists.
Each recipient received an email from the AHTF cochairs in January 2009 asking them to complete the survey. If a response was not received in three weeks, a second email was sent. If a response was again not received, an AHTF task‐force member who knew the recipient asked him or her to complete the survey. All responses were received by March 2009.
Data Analysis
We examined responses using descriptive measures. Responses were analyzed across all respondents, as well as between these two subgroups. Statistical analysis with Fisher's exact test was performed using Stata 9.0 (StataCorp, College Station, TX).
Results
Of the 33 hospitalists who received the survey, 26 responded (response rate of 79%). Of these, 25 completed the survey in its entirely and were included in our analysis; 1 did not submit details regarding specific promotion‐related activities. General information regarding the respondents and their programs at the time of their promotion is contained in Table 1.
| |
| No. of institutions represented | 20 |
| Program age | 5.7 years (range 110) |
| Size of hospitalist program at the time of promotion | 10 (range 128) |
| Size of hospitalist program currently | 25 (range 745) |
| Programs that were separate divisions at the time of respondent promotion | 4 (20%) |
| Programs that are now separate divisions | 8 (40%) |
| Programs with 1‐track* promotion system | 2 (10%) |
| Programs with 2‐track promotion system | 8 (40%) |
| Programs with 3‐track promotion system | 9 (45%) |
| Other type of promotion system | 1 (5%) |
| Tenure track* | 8 (32%) |
| Institutions with tenure and promotion criteria that explicitly recognized hospitalist work | 8 (40%) |
The seven nonrespondents were from seven different institutions; however two of these institutions were represented by respondents. One nonrespondent had achieved a rank of Professor (through general medicine); the rest had been promoted to Associate Professor. One nonrespondent is known by the authors to hold a research position.
Ten respondents identified themselves as clinician‐educators (40%), ten as clinician‐administrators (40%), and five as clinician‐researchers (20%). Seventeen (68%) of the promoted hospitalists were not on a tenure track (as defined by them); they were more likely to have administrative or educational roles than a research appointment. Though the majority of self‐identified researchers were among the earliest to have been promoted, there were no statistically significant differences in self‐defined job description between more and less recently promoted hospitalists.
Promoted hospitalists were involved in a diverse range of activities which supported their promotion, including service (eg, institutional committees), education, research, and quality improvement. Nearly all hospitalists surveyed listed teaching and educational activities, and almost all had disseminated scholarly output and some degree of grant funding. Table 2 lists the specific activities in which respondents reported being engaged in each of these domains.
| Activity | Percent of Respondents Engaged in Activity |
|---|---|
| Service | |
| School of Medicine | 56 |
| Department of Medicine | 84 |
| Hospital | 80 |
| Professional societies | 92 |
| Administration | 67 |
| Education | |
| Medical student | 72 |
| Housestaff lectures | 84 |
| Ward/consult attending | 96 |
| Clinic precepting | 40 |
| Course director/curriculum development | 80 |
| Program director (or associate) | 36 |
| Research | |
| Peer‐reviewed publications | 92 |
| Abstract/poster presentations | 80 |
| Invited speaker | 96 |
| Reviewer/editor | 80 |
| Study section | 24 |
| Federal grants | 32 |
| Nonfederal grants (internal and external) | 72 |
| Quality improvement/patient safety | |
| Project member | 36 |
| Project leader | 52 |
| Institutional leadership | 32 |
| Curriculum development | 32 |
A range of individuals assisted the respondents in the promotion process. Twenty‐three (92%) respondents identified the individuals who supported their promotion, and all listed more than one person. Respondents most commonly credited their Section or Division Chief (43%) with facilitating their promotion, followed by Departmental Chairs or Vice/Associate Chairs (22%). Mentors (13%) or peers (8%) were also named. Four respondents (17%) named themselves as the person providing most guidance through the promotions process.
No consistent themes regarding obstacles emerged from free‐text responses to questions about the promotions process. One respondent felt that high clinical expectations made participation in other academic activities a challenge. The only other barriers noted were not being on the radar screen of the Division Chief of GIM, and difficulty identifying external, senior hospitalists to write letters in support of promotion.
When asked about the most important activities supporting their promotion, 24 respondents listed one to two key activities, detailed in Table 3. The most common response was peer‐reviewed publications (33%). Activities related to education and/or teaching were the next most common response (29%), specifically teaching, educational activities, curriculum design, or program director. Research or research funding represented 26% of responses. Valued activities outside of the respondent's institution included national reputation (21%) and service in professional societies (16%). Service or administrative responsibilities were mentioned by 25% of respondents.
| Category of Activity | Frequency of Response* (%) |
|---|---|
| |
| Research | 14 (58) |
| Peer‐reviewed publications | 8 (33) |
| Research | 4 (16) |
| Research funding | 2 (8) |
| Activities outside institution | 8 (33) |
| National reputation | 5 (21) |
| Professional society membership | 3 (13) |
| Education | 7 (29) |
| Teaching | 3 (13) |
| Educational activities | 2 (8) |
| Residency Director | 1 (4) |
| Curriculum development | 1 (4) |
| Service | 6 (25) |
| Service | 3 (13) |
| Administration/leadership of group | 3 (13) |
Discussion
We conducted a unique and comprehensive survey of academic hospitalists who have been promoted since 1995. We identified the most common and important activities contributing to promotion. Contrary to our expectations, survey respondents generally did not report being a hospitalist was a barrier in the promotions process.
Respondents were engaged in a diverse range of activities, including service, education, and research. Interestingly, no one identified him or herself primarily as a clinician. Teaching appeared to be a core component for all surveyed, regardless of academic appointment. Only one felt that her clinical workload as a hospitalist was an obstacle that prevented her from being engaged in other activities important for promotion. With more programs potentially evolving to separate divisions, the issue of being on the radar screen of a General Internal Medicine Division Chief may become less common over time. We hope that as programs mature and the numbers of associate and full professors increase, there will not be difficulty obtaining outside letters.
Although only 23% self‐identified as clinician‐researchers, nearly all had peer‐reviewed publications and other evidence of disseminated scholarly work. Grant funding, both federal and nonfederal, was also common among this group. This finding is consistent with self‐reported activities of a cohort of junior internal medicine faculty followed over three years who were eventually promoted, though the majority of those participants were classified as having either traditional clinician‐educator or clinician‐researcher positions.16
Despite outlining a seemingly clear pathway to promotion for hospitalists, concerns remain. Most importantly, those surveyed seem to have achieved promotion through relatively traditional academic job descriptions. Obtaining or maintaining these types of positions may be difficult as clinical needs at academic centers increase. According to a recent survey of hospitalist faculty,13 over one‐third spend more than 60% of their time on nonteaching clinical services. In that survey, over half of respondents had little or no protected time for scholarly activities. The contrast between this survey's findings and ours raises the question of whether our promoted sample had positions similar to those of most academic hospitalists. Given that the majority of our respondents noted peer‐reviewed publications and grant funding to be among the most important activities for promotion, there may be a dangerous disconnect for junior academic hospitalists who spend the majority of their time in direct patient care. Moreover, the promoted hospitalists in our survey reported relatively less participation in quality improvement/patient safety activities, in contrast to both anecdotal and survey reports that these activities are a major component of many academic hospitalist positions.5, 17 Most academic medical centers do not yet consider achievements in this area in their promotions criteria, potentially creating a barrier for the ranks of clinician quality improvers.1 Thus, significant obstacles to promotion of academic hospitalists may exist.
Leaders in academic hospital medicine are recognizing these potential barriers. A diverse group from major professional societies recently published a summary of the challenges and opportunities for the field of academic hospital medicine.1 Several needs and areas for intervention were identified, including enhanced faculty development and improved documentation of quality improvement activities. The SGIM, the SHM, and the Association of Chiefs and Leaders of General Internal Medicine (ACLGIM) recently cosponsored an intensive four‐day faculty development course for junior faculty to promote skills necessary for academic hospitalist success. Early reports indicate that this was a success.1820
In addition, the AHTF has developed a Quality Portfolio, paralleling the Educator's Portfolio, that can be used as a tool for documenting quality improvement and patient safety activities in a way that can be useful for career development and promotion.4 Lastly, the Society of Hospital Medicine has hosted the inaugural Academic Hospital Medicine Leadership Summit as part of the national meeting to provide mentorship and professional development opportunities for junior faculty. Our hope is that these opportunities, coupled with the growth of mid‐level and senior leaders in hospital medicine, will provide greater infrastructure for the development and promotion of junior faculty.
Our results may have relevance beyond hospitalist groups. With anticipated further limits on housestaff duty hours, more academic physicians may be asked to fill predominantly clinical roles. In addition, a growing emphasis on quality and patient safety may lead to a more general expansion of academicians who focus on these areas.15
Our survey and methodology have limitations. By including only promoted individuals, we did not survey hospitalists with the most difficulties in the promotions processthose who were not promoted. Thus, we are unable to directly compare successful versus unsuccessful strategies. Identifying nonpromoted academic hospitalists to understand the reasons they were not (or have not yet been) promoted could be a next step in this line of inquiry. Additionally, understanding the attitudes of promotions committees regarding hospitalists, and the clinical and quality improvement roles in which they are engaged, could enhance our current results. Finally, we surveyed a convenience sample of a limited numbers of hospitalists and institutions, and were unable to systematically account for variations in promotions criteria across institutions. However, to our knowledge, this is the most comprehensive study of promotions among academic hospitalists to date. Given the common themes that emerged in terms of activities that supported promotion, mentors, and advice, we believe that our sample was sufficient to identify important themes and advance our understanding of this nascent specialty.
In conclusion, our survey of promoted hospital medicine faculty provides valuable information for junior faculty and hospitalist leaders. Success was found through engaging in a diverse set of activities in the traditional areas of education, service, and scholarship, frequently in conjunction with developing recognition outside of their institutions. While all respondents were clinically active, none described themselves as having purely clinical roles. As academic hospitalist roles evolve, academic leaders will need to provide adequate mentorship, create time for scholarly pursuits, and promote documentation and recognition of nontraditional activities that may nonetheless be worthy of promotion.
- ,,,,,.Challenges and opportunities in academic hospital medicine: report from the academic hospital medicine summit.J Gen Intern Med.2009;24(5):636–641.
- ,,.Hospitalist educators: future of inpatient internal medicine training.Mt Sinai J Med.2008;75(5):436–451.
- ,,,.Hospitalists as emerging leaders in patient safety: lessons learned and future directions.J Patient Saf.2009;5(1):3–8.
- Quality Portfolio—Template and Instructions. Available at: http://www.sgim.org/userfiles/file/AHTF%20QP%20WEB%20TEMPLATE%20INS TRUCTIONS.pdf. Accessed on April 24,2010.
- .An innovative approach to support hospitalist physicians toward academic success.J Hosp Med.2008;3:314–318.
- ,,,.Institutional policies of U.S. medical schools regarding tenure, promotion, and benefits for part‐time faculty.Acad Med.2000;75(8):846–849.
- ,,,,,.Revising appointment, promotion, and tenure procedures to incorporate an expanded definition of scholarship: the University of Kentucky College of Medicine experience.Acad Med.2000;75(9)913–924.
- ,,,.Attitudes of clinical faculty about career progress, career success and recognition, and commitment to academic medicine. Results of a survey.Arch Intern Med.2000;160(17):2625–2629.
- ,,, et al.Promotion criteria for clinician‐educators.J Gen Intern Med.2003;18(9):711–716.
- ,,,.Documentation systems for educators seeking academic promotion in U.S. medical schools.Acad Med.2004;79(8):783–790.
- ,,,.Faculty development: academic opportunities for emergency medicine faculty on education career tracks.Acad Emerg Med.2003;10(10):1113–1117.
- ,,,.Burnout and internal medicine resident work hours restrictions.Arch Intern Med.2005;165(22):2595–2600.
- ,.Development of a Division of General Medicine in a Department of Internal Medicine.J Med Ed.1981;56:390–396.
- .The evolution of departments of medicine.N Engl J Med.1980;303(9):489–496.
- ,.Clinicians in quality improvement: a new career pathway in academic medicine.JAMA.2009;301(7):766–768.
- ,,.A time to be promoted. The prospective study of promotion in academia.J Gen Intern Med.2006;21(2):123–129.
- Academic Hospitalist Academy. Available at: http://www.sgim.org/index. cfm?pageId=815. Accessed on April 24,2010.
- .Reflections on the Academic Hospitalist Academy.SGIM Forum.2010;33(1):5.
- .The Academic Hospitalist Academy: Get anchored, equipped, and energized.SGIM Forum.2010;33(1):5–6.
- .Four formative days in the life of an academic hospitalist: the Academic Hospitalist Academy.SGIM Forum.2010;33(1):6.
The growth of academic hospital medicine has been driven by multiple factors including expanding clinical needs, housestaff duty hours' limitations, and an increasing focus on quality and patient safety.1 Hospitalists at academic medical centers frequently assume roles that differ substantially from traditional faculty positions. Academic hospitalists may have predominantly clinical positions, and may be involved in quality improvement and patient safety projects.24 Because of these commitments, many academic hospitalists spend less time on research or educational efforts.1, 5 Many have raised concerns that these unique job descriptions might lead to less time to devote to scholarship and academic pursuits, and consequently greater challenges in the promotions process.2, 5
There are little published data on promotion and tenure in academics, and even less specifically focused on the promotion of hospitalists. Theoretically, promotion should recognize an individual's contribution to his or her institution and field. However, each institution has unique criteria though which faculty achieve promotion. Previous articles addressing specific groups, such as part‐time,6 clinical faculty,79 or clinician‐educators10 may be relevant to hospitalists, as hospitalists may be more likely to fall into these categories. These reports suggest general agreement that promotion committees should consider and weigh clinical and educational work (in addition to scholarly publications) in the promotions process, but assessment methods vary across institutions and the contribution of activities, such as quality improvement, remain unclear. The educator's portfolio has gained momentum as a way to document valued teaching in many institutions,11, 12 but academic hospitalist participation in education may be limited.13
Literature related to the development of Divisions of General Internal Medicine is relevant insofar as similar concerns for promotion were expressed with the growth of their faculty.14, 15 However, its applicability may be limited by differences between roles of hospitalists and more traditional general medicine faculty.
To better understand the factors influencing promotion for academic hospitalists, the Society of General Internal Medicine (SGIM) Academic Hospitalist Task Force (AHTF) undertook a survey of promoted hospitalists who had successfully reached the rank of Associate Professor or higher.
Methods
Development of the Survey
The AHTF is a group of 18 academic hospitalists representing 15 institutions. Draft survey questions were developed by the group and sent to its members for refinement based on group consensus. Three cycles of refinement were performed, and the final survey (Appendix) was converted into an electronic format distributed through SurveyMonkey (SurveyMonkey.com, Portland, OR).
Identification of Survey Recipients
We identified a convenience sample of hospitalists who had been promoted to Associate or Full Professor of Medicine by querying members of the AHTF, the Society of Hospital Medicine (SHM) Academic Committee, and colleagues of academic medical centers with established hospitalist programs. We identified 33 promoted hospitalists.
Each recipient received an email from the AHTF cochairs in January 2009 asking them to complete the survey. If a response was not received in three weeks, a second email was sent. If a response was again not received, an AHTF task‐force member who knew the recipient asked him or her to complete the survey. All responses were received by March 2009.
Data Analysis
We examined responses using descriptive measures. Responses were analyzed across all respondents, as well as between these two subgroups. Statistical analysis with Fisher's exact test was performed using Stata 9.0 (StataCorp, College Station, TX).
Results
Of the 33 hospitalists who received the survey, 26 responded (response rate of 79%). Of these, 25 completed the survey in its entirely and were included in our analysis; 1 did not submit details regarding specific promotion‐related activities. General information regarding the respondents and their programs at the time of their promotion is contained in Table 1.
| |
| No. of institutions represented | 20 |
| Program age | 5.7 years (range 110) |
| Size of hospitalist program at the time of promotion | 10 (range 128) |
| Size of hospitalist program currently | 25 (range 745) |
| Programs that were separate divisions at the time of respondent promotion | 4 (20%) |
| Programs that are now separate divisions | 8 (40%) |
| Programs with 1‐track* promotion system | 2 (10%) |
| Programs with 2‐track promotion system | 8 (40%) |
| Programs with 3‐track promotion system | 9 (45%) |
| Other type of promotion system | 1 (5%) |
| Tenure track* | 8 (32%) |
| Institutions with tenure and promotion criteria that explicitly recognized hospitalist work | 8 (40%) |
The seven nonrespondents were from seven different institutions; however two of these institutions were represented by respondents. One nonrespondent had achieved a rank of Professor (through general medicine); the rest had been promoted to Associate Professor. One nonrespondent is known by the authors to hold a research position.
Ten respondents identified themselves as clinician‐educators (40%), ten as clinician‐administrators (40%), and five as clinician‐researchers (20%). Seventeen (68%) of the promoted hospitalists were not on a tenure track (as defined by them); they were more likely to have administrative or educational roles than a research appointment. Though the majority of self‐identified researchers were among the earliest to have been promoted, there were no statistically significant differences in self‐defined job description between more and less recently promoted hospitalists.
Promoted hospitalists were involved in a diverse range of activities which supported their promotion, including service (eg, institutional committees), education, research, and quality improvement. Nearly all hospitalists surveyed listed teaching and educational activities, and almost all had disseminated scholarly output and some degree of grant funding. Table 2 lists the specific activities in which respondents reported being engaged in each of these domains.
| Activity | Percent of Respondents Engaged in Activity |
|---|---|
| Service | |
| School of Medicine | 56 |
| Department of Medicine | 84 |
| Hospital | 80 |
| Professional societies | 92 |
| Administration | 67 |
| Education | |
| Medical student | 72 |
| Housestaff lectures | 84 |
| Ward/consult attending | 96 |
| Clinic precepting | 40 |
| Course director/curriculum development | 80 |
| Program director (or associate) | 36 |
| Research | |
| Peer‐reviewed publications | 92 |
| Abstract/poster presentations | 80 |
| Invited speaker | 96 |
| Reviewer/editor | 80 |
| Study section | 24 |
| Federal grants | 32 |
| Nonfederal grants (internal and external) | 72 |
| Quality improvement/patient safety | |
| Project member | 36 |
| Project leader | 52 |
| Institutional leadership | 32 |
| Curriculum development | 32 |
A range of individuals assisted the respondents in the promotion process. Twenty‐three (92%) respondents identified the individuals who supported their promotion, and all listed more than one person. Respondents most commonly credited their Section or Division Chief (43%) with facilitating their promotion, followed by Departmental Chairs or Vice/Associate Chairs (22%). Mentors (13%) or peers (8%) were also named. Four respondents (17%) named themselves as the person providing most guidance through the promotions process.
No consistent themes regarding obstacles emerged from free‐text responses to questions about the promotions process. One respondent felt that high clinical expectations made participation in other academic activities a challenge. The only other barriers noted were not being on the radar screen of the Division Chief of GIM, and difficulty identifying external, senior hospitalists to write letters in support of promotion.
When asked about the most important activities supporting their promotion, 24 respondents listed one to two key activities, detailed in Table 3. The most common response was peer‐reviewed publications (33%). Activities related to education and/or teaching were the next most common response (29%), specifically teaching, educational activities, curriculum design, or program director. Research or research funding represented 26% of responses. Valued activities outside of the respondent's institution included national reputation (21%) and service in professional societies (16%). Service or administrative responsibilities were mentioned by 25% of respondents.
| Category of Activity | Frequency of Response* (%) |
|---|---|
| |
| Research | 14 (58) |
| Peer‐reviewed publications | 8 (33) |
| Research | 4 (16) |
| Research funding | 2 (8) |
| Activities outside institution | 8 (33) |
| National reputation | 5 (21) |
| Professional society membership | 3 (13) |
| Education | 7 (29) |
| Teaching | 3 (13) |
| Educational activities | 2 (8) |
| Residency Director | 1 (4) |
| Curriculum development | 1 (4) |
| Service | 6 (25) |
| Service | 3 (13) |
| Administration/leadership of group | 3 (13) |
Discussion
We conducted a unique and comprehensive survey of academic hospitalists who have been promoted since 1995. We identified the most common and important activities contributing to promotion. Contrary to our expectations, survey respondents generally did not report being a hospitalist was a barrier in the promotions process.
Respondents were engaged in a diverse range of activities, including service, education, and research. Interestingly, no one identified him or herself primarily as a clinician. Teaching appeared to be a core component for all surveyed, regardless of academic appointment. Only one felt that her clinical workload as a hospitalist was an obstacle that prevented her from being engaged in other activities important for promotion. With more programs potentially evolving to separate divisions, the issue of being on the radar screen of a General Internal Medicine Division Chief may become less common over time. We hope that as programs mature and the numbers of associate and full professors increase, there will not be difficulty obtaining outside letters.
Although only 23% self‐identified as clinician‐researchers, nearly all had peer‐reviewed publications and other evidence of disseminated scholarly work. Grant funding, both federal and nonfederal, was also common among this group. This finding is consistent with self‐reported activities of a cohort of junior internal medicine faculty followed over three years who were eventually promoted, though the majority of those participants were classified as having either traditional clinician‐educator or clinician‐researcher positions.16
Despite outlining a seemingly clear pathway to promotion for hospitalists, concerns remain. Most importantly, those surveyed seem to have achieved promotion through relatively traditional academic job descriptions. Obtaining or maintaining these types of positions may be difficult as clinical needs at academic centers increase. According to a recent survey of hospitalist faculty,13 over one‐third spend more than 60% of their time on nonteaching clinical services. In that survey, over half of respondents had little or no protected time for scholarly activities. The contrast between this survey's findings and ours raises the question of whether our promoted sample had positions similar to those of most academic hospitalists. Given that the majority of our respondents noted peer‐reviewed publications and grant funding to be among the most important activities for promotion, there may be a dangerous disconnect for junior academic hospitalists who spend the majority of their time in direct patient care. Moreover, the promoted hospitalists in our survey reported relatively less participation in quality improvement/patient safety activities, in contrast to both anecdotal and survey reports that these activities are a major component of many academic hospitalist positions.5, 17 Most academic medical centers do not yet consider achievements in this area in their promotions criteria, potentially creating a barrier for the ranks of clinician quality improvers.1 Thus, significant obstacles to promotion of academic hospitalists may exist.
Leaders in academic hospital medicine are recognizing these potential barriers. A diverse group from major professional societies recently published a summary of the challenges and opportunities for the field of academic hospital medicine.1 Several needs and areas for intervention were identified, including enhanced faculty development and improved documentation of quality improvement activities. The SGIM, the SHM, and the Association of Chiefs and Leaders of General Internal Medicine (ACLGIM) recently cosponsored an intensive four‐day faculty development course for junior faculty to promote skills necessary for academic hospitalist success. Early reports indicate that this was a success.1820
In addition, the AHTF has developed a Quality Portfolio, paralleling the Educator's Portfolio, that can be used as a tool for documenting quality improvement and patient safety activities in a way that can be useful for career development and promotion.4 Lastly, the Society of Hospital Medicine has hosted the inaugural Academic Hospital Medicine Leadership Summit as part of the national meeting to provide mentorship and professional development opportunities for junior faculty. Our hope is that these opportunities, coupled with the growth of mid‐level and senior leaders in hospital medicine, will provide greater infrastructure for the development and promotion of junior faculty.
Our results may have relevance beyond hospitalist groups. With anticipated further limits on housestaff duty hours, more academic physicians may be asked to fill predominantly clinical roles. In addition, a growing emphasis on quality and patient safety may lead to a more general expansion of academicians who focus on these areas.15
Our survey and methodology have limitations. By including only promoted individuals, we did not survey hospitalists with the most difficulties in the promotions processthose who were not promoted. Thus, we are unable to directly compare successful versus unsuccessful strategies. Identifying nonpromoted academic hospitalists to understand the reasons they were not (or have not yet been) promoted could be a next step in this line of inquiry. Additionally, understanding the attitudes of promotions committees regarding hospitalists, and the clinical and quality improvement roles in which they are engaged, could enhance our current results. Finally, we surveyed a convenience sample of a limited numbers of hospitalists and institutions, and were unable to systematically account for variations in promotions criteria across institutions. However, to our knowledge, this is the most comprehensive study of promotions among academic hospitalists to date. Given the common themes that emerged in terms of activities that supported promotion, mentors, and advice, we believe that our sample was sufficient to identify important themes and advance our understanding of this nascent specialty.
In conclusion, our survey of promoted hospital medicine faculty provides valuable information for junior faculty and hospitalist leaders. Success was found through engaging in a diverse set of activities in the traditional areas of education, service, and scholarship, frequently in conjunction with developing recognition outside of their institutions. While all respondents were clinically active, none described themselves as having purely clinical roles. As academic hospitalist roles evolve, academic leaders will need to provide adequate mentorship, create time for scholarly pursuits, and promote documentation and recognition of nontraditional activities that may nonetheless be worthy of promotion.
- ,,,,,.Challenges and opportunities in academic hospital medicine: report from the academic hospital medicine summit.J Gen Intern Med.2009;24(5):636–641.
- ,,.Hospitalist educators: future of inpatient internal medicine training.Mt Sinai J Med.2008;75(5):436–451.
- ,,,.Hospitalists as emerging leaders in patient safety: lessons learned and future directions.J Patient Saf.2009;5(1):3–8.
- Quality Portfolio—Template and Instructions. Available at: http://www.sgim.org/userfiles/file/AHTF%20QP%20WEB%20TEMPLATE%20INS TRUCTIONS.pdf. Accessed on April 24,2010.
- .An innovative approach to support hospitalist physicians toward academic success.J Hosp Med.2008;3:314–318.
- ,,,.Institutional policies of U.S. medical schools regarding tenure, promotion, and benefits for part‐time faculty.Acad Med.2000;75(8):846–849.
- ,,,,,.Revising appointment, promotion, and tenure procedures to incorporate an expanded definition of scholarship: the University of Kentucky College of Medicine experience.Acad Med.2000;75(9)913–924.
- ,,,.Attitudes of clinical faculty about career progress, career success and recognition, and commitment to academic medicine. Results of a survey.Arch Intern Med.2000;160(17):2625–2629.
- ,,, et al.Promotion criteria for clinician‐educators.J Gen Intern Med.2003;18(9):711–716.
- ,,,.Documentation systems for educators seeking academic promotion in U.S. medical schools.Acad Med.2004;79(8):783–790.
- ,,,.Faculty development: academic opportunities for emergency medicine faculty on education career tracks.Acad Emerg Med.2003;10(10):1113–1117.
- ,,,.Burnout and internal medicine resident work hours restrictions.Arch Intern Med.2005;165(22):2595–2600.
- ,.Development of a Division of General Medicine in a Department of Internal Medicine.J Med Ed.1981;56:390–396.
- .The evolution of departments of medicine.N Engl J Med.1980;303(9):489–496.
- ,.Clinicians in quality improvement: a new career pathway in academic medicine.JAMA.2009;301(7):766–768.
- ,,.A time to be promoted. The prospective study of promotion in academia.J Gen Intern Med.2006;21(2):123–129.
- Academic Hospitalist Academy. Available at: http://www.sgim.org/index. cfm?pageId=815. Accessed on April 24,2010.
- .Reflections on the Academic Hospitalist Academy.SGIM Forum.2010;33(1):5.
- .The Academic Hospitalist Academy: Get anchored, equipped, and energized.SGIM Forum.2010;33(1):5–6.
- .Four formative days in the life of an academic hospitalist: the Academic Hospitalist Academy.SGIM Forum.2010;33(1):6.
Copyright © 2011 Society of Hospital Medicine