User login
What is the best questionnaire to screen for alcohol use disorder in an office practice?
Popular questionnaires to screen for alcohol misuse include the CAGE, the TWEAK, and the short form of the Alcohol Use Disorder Identification Test (AUDIT-C). Any of these is recommended. The important thing is to be proactive about screening for this very common and underrecognized problem.
A COMMON PROBLEM, NOT OFTEN ADMITTED
Alcohol use disorder, which ranges from hazardous drinking to binge drinking and alcohol dependence, is more common than admitted and often goes undiagnosed. Its personal, societal, and economic consequences cannot be overemphasized. Alcohol use is responsible for 85,000 deaths each year in the United States, and it is linked to substantial medical and psychiatric consequences and injuries, especially motor vehicle accidents. The estimated annual cost of problems attributed to alcohol use is over $185 billion.1
About three in 10 US adults drink at levels that increase their risk for alcohol-related consequences, and about one in four adults currently abuses alcohol or is dependent on it.2 In 2009, 6.8% of the US population age 12 and above reported heavy drinking, with highest rates in those ages 21 to 29.3 The rate of alcohol use was higher in men than in women, but about 10% of pregnant women ages 15 to 44 reported current alcohol use.3
The prevalence of alcohol use disorder ranges from 2% to 29% in a typical ambulatory primary care medical practice.4 And only one-third of people with alcohol use disorder are diagnosed.
Studies and experience have shown that problem drinkers tend to not seek help until they have advanced dependence, often with associated medical and sociolegal complications. It is also well established that the earlier the diagnosis is made and appropriate intervention is offered, the better the prognosis.
WHAT IS THE GOAL OF SCREENING?
The goals of screening for alcohol use disorder are to estimate the patient’s risk level, to identify those at risk because they exceed defined limits, and to identify those with evidence of an active problem, ie, with adverse consequences related to their drinking. This screening paves the way for further assessment, definitive diagnosis, and a treatment plan.
The US Preventive Services Task Force recommends screening and behavioral counseling interventions (such as a brief intervention) in the primary care setting to reduce alcohol misuse by adults, including pregnant women.5 In addition, most primary care patients who screen positive for heavy drinking or alcohol use disorder show motivation and readiness to change, and those with the most severe symptoms tend to be the most ready.6
THE IDEAL QUESTIONNAIRE: SENSITIVE, SPECIFIC, AND SHORT
The ideal alcohol screening questionnaire for a busy practice should be brief and highly sensitive and specific for identifying the spectrum of alcohol misuse. Also, it should be easy to recall so it can be part of routine face-to-face discussion with the patient during an office visit.
Further, it should include questions that focus on the consequences of drinking as well as on quantity and frequency. It should also take into account factors such as the patient’s age, sex, race or ethnicity, and pregnancy status, as these can influence the effectiveness of the screening method.
Problems with focusing on quantity alone
“Risky use” is defined (in a non-alcohol-dependent person or one with no alcohol-related consequences) as more than seven standard drinks per week or more than three per occasion for women, and more than 14 standard drinks per week or more than four per occasion for men.2
A standard drink in the United States contains about 12 to 14 g of ethanol: a 12-oz can or bottle of beer, a 5-oz glass of wine, or about 1.5 oz of 80-proof liquor.2
The common single-item screening test asks, “How many times in the past year have you had more than four drinks (for women) or five drinks (for men) in a day?” This is recommended by the National Institute on Alcohol Abuse and Alcoholism for brief screening in primary care. However, a positive answer (ie, one or more times in the past year) has a sensitivity of only 82% and a specificity of only 79% for detecting unhealthy alcohol use, and an even lower specificity (67%) for detecting current alcohol use disorder.7
The CAGE questionnaire
The four-item CAGE questionnaire8 focuses on the consequences of drinking:
- C: Have you felt the need to cut down on your drinking?
- A: Have you ever felt annoyed by someone criticizing your drinking?
- G: Have you ever felt bad or guilty about your drinking?
- E: Have you ever had an eye-opener—a drink the first thing in the morning to steady your nerves?
A yes to one or more of the questions denotes a need for further assessment.
The CAGE questionnaire is simple, non-threatening, brief, and easy to remember. A yes answer to two or more items has a sensitivity of 75% to 95% and a specificity of 84% to 97% for alcohol dependence.9 However, CAGE is less sensitive for identifying nonalcohol-dependent at-risk drinkers. The patient’s sex and ethnicity have also been found to affect its performance somewhat, with some studies showing a sensitivity as low as 50% in adult white women and as low as 40% in at-risk groups ages 60 and over.
The TWEAK questionnaire
The TWEAK is a modification of the CAGE and includes a question about tolerance; it has a sensitivity of 87% for harmful drinking and 84% for dependence, especially in trauma-related cases.9 It has also been found to be better than the CAGE for screening pregnant patients.
- Tolerance: How many drinks can you hold without falling asleep or passing out? (2 points if six drinks or more)
- Worried: Have friends or relatives worried about your drinking? (2 points if yes)
- Eye-opener: Do you sometimes take a drink in the morning when you first get up? (1 point if yes)
- Amnesia: Have friends or relatives told you about things you said or did while drinking that you could not remember? (1 point if yes)
- Cut down: Do you sometimes feel the need to cut down on your drinking? (1 point if yes)
An answer of ≥ 6 to the first question or a total score of 3 or more denotes a problem with alcohol use and a need for further assessment.10
The AUDIT-C
The AUDIT-C, a shorter form of the 10-item AUDIT developed by the World Health Organization, uses only the first three questions of the full-length AUDIT. The three-item AUDIT-C has a sensitivity ranging from 85% in Hispanic women to 95% in white men.9,11 The questions center on the quantity and frequency of alcohol use:
- How often do you have a drink containing alcohol? Answer choices: never; monthly or less often; 2 to 4 times a month; 2 to 3 times a week; 4 or more times a week.
- How many standard drinks containing alcohol do you have on a typical day when you are drinking? Answer choices: one or two; three or four; five or six; seven to nine; 10 or more.
- How often do you have six or more drinks on one occasion? Answer choices: never, less than monthly; monthly; weekly; daily or almost.
Scoring is 0 for never, and 1, 2, 3, or 4 for the subsequent answer choices in each question.
The cut-off score for the AUDIT-C is usually a total of 3 points for women and 4 for men: ie, a score of 3 or higher for women and a score of 4 or higher for men indicate alcohol use disorder and the need for further assessment.
The AUDIT questionnaire has been found not only to have a high sensitivity (83%) and specificity (90%) for identifying alcohol dependence, but also to be more sensitive than the CAGE questionnaire (85% vs 75%) for identifying harmful drinking, hazardous drinking, and at-risk drinking. (Note: The full version of AUDIT performed similarly to the three-item AUDIT-C for detecting heavy drinking and active abuse or dependence.12) Furthermore, it has performed well as a screening test in many multinational trials of alcohol brief intervention. The questions about quantity of alcohol consumed may be even more suitable for adolescents and young adults, who tend to fall into the harmful-hazardous drinking category rather than the dependent category. In some studies, patients tended to reveal less with the CAGE questionnaire when it was preceded by direct and close-ended questions about the quantity and frequency of alcohol use, thus reducing its sensitivity.13
The AUDIT and TWEAK questionnaires showed greater sensitivity in both men and women than the CAGE questionnaire and were equally sensitive in African Americans.14
HOW TO FIT ALCOHOL SCREENING INTO AN OFFICE VISIT
A practical way to fit alcohol screening into an office visit is to include a questionnaire in the assessment papers completed by the patient while in the waiting room. In other settings, these questions may be asked by trained nursing staff as part of the initial assessment, ie, while obtaining the patient’s weight and vital statistics. This can be briefly reviewed by the physician during the face-to-face history and physical examination.
A concerted effort is needed to proactively screen for alcohol use. A combination of questions about the effect, the quantity, and the frequency of alcohol use is the best way to screen for the many different aspects of alcohol use disorder—many of which can be managed in the primary care setting through brief interventions without referral to a specialist.
When screening for alcohol misuse, it is also important to consider factors such as age, sex, race or ethnicity, pregnancy, and history of recent trauma or surgery.
- Saitz R. Clinical practice. Unhealthy alcohol use. N Engl J Med 2005; 352:596–607.
- National institute on Alcohol Abuse and Alcoholism (NIAAA). Helping patients who drink too much: A clinician’s guide and related professional support resources. http://pubs.niaaa.nih.gov/publications/practitioner/cliniciansguide2005/clinicians_guide.htm. Accessed July 29, 2011.
- Substance Abuse and Mental Health Services Administration (SAMHSA). Results from the 2009 National Survey on Drug Use and Health: Volume I. Summary of National Findings. http://www.oas.samhsa.gov/NSDUH/2k9NSDUH/2k9ResultsP.pdf. Accessed July 29, 2011.
- Fiellin DA, Reid MC, O’Connor PG. Screening for alcohol problems in primary care: a systematic review. Arch Intern Med 2000; 160:1977–1989.
- US Preventive Services Task Force (USPSTF). Screening and behavioral counseling interventions in primary care to reduce alcohol misuse. Release date: April 2004. http://www.uspreventiveservicestaskforce.org/uspstf/uspsdrin.htm. Accessed July 29, 2011.
- Williams EC, Kivlahan DR, Saitz R, et al. Readiness to change in primary care patients who screened positive for alcohol misuse. Ann Fam Med 2006; 4:213–220.
- Smith PC, Schmidt SM, Allensworth-Davies D, Saitz R. Primary care validation of a single-question alcohol screening test. J Gen Intern Med 2009; 24:783–788.
- Ewing JA. Detecting alcoholism. The CAGE questionnaire. JAMA 1984; 252:1905–1907.
- Cherpitel CJ. Screening for alcohol problems in the emergency department. Ann Emerg Med 1995; 26:158–166.
- Russell M, Martier SS, Sokol RJ, et al. Screening for pregnancy risk-drinking. Alcohol Clin Exp Res 1994; 18:1156–1161.
- Frank D, DeBenedetti AF, Volk RJ, Williams EC, Kivlahan DR, Bradley KA. Effectiveness of the AUDIT-C as a screening test for alcohol misuse in three race/ethnic groups. J Gen Intern Med 2008; 23:781–787.
- Bush K, Kivlahan DR, McDonell MB, Fihn SD, Bradley KA. The AUDIT alcohol consumption questions (AUDIT-C): an effective brief screening test for problem drinking. Ambulatory Care Quality Improvement Project (ACQUIP). Alcohol Use Disorders Identification Test. Arch Intern Med 1998; 158:1789–1795.
- Steinweg DL, Worth H. Alcoholism: the keys to the CAGE. Am J Med 1993; 94:520–523.
- Cherpitel CJ. Brief screening instruments for alcoholism. Alcohol Health Res World 1997; 21:348–351.
Popular questionnaires to screen for alcohol misuse include the CAGE, the TWEAK, and the short form of the Alcohol Use Disorder Identification Test (AUDIT-C). Any of these is recommended. The important thing is to be proactive about screening for this very common and underrecognized problem.
A COMMON PROBLEM, NOT OFTEN ADMITTED
Alcohol use disorder, which ranges from hazardous drinking to binge drinking and alcohol dependence, is more common than admitted and often goes undiagnosed. Its personal, societal, and economic consequences cannot be overemphasized. Alcohol use is responsible for 85,000 deaths each year in the United States, and it is linked to substantial medical and psychiatric consequences and injuries, especially motor vehicle accidents. The estimated annual cost of problems attributed to alcohol use is over $185 billion.1
About three in 10 US adults drink at levels that increase their risk for alcohol-related consequences, and about one in four adults currently abuses alcohol or is dependent on it.2 In 2009, 6.8% of the US population age 12 and above reported heavy drinking, with highest rates in those ages 21 to 29.3 The rate of alcohol use was higher in men than in women, but about 10% of pregnant women ages 15 to 44 reported current alcohol use.3
The prevalence of alcohol use disorder ranges from 2% to 29% in a typical ambulatory primary care medical practice.4 And only one-third of people with alcohol use disorder are diagnosed.
Studies and experience have shown that problem drinkers tend to not seek help until they have advanced dependence, often with associated medical and sociolegal complications. It is also well established that the earlier the diagnosis is made and appropriate intervention is offered, the better the prognosis.
WHAT IS THE GOAL OF SCREENING?
The goals of screening for alcohol use disorder are to estimate the patient’s risk level, to identify those at risk because they exceed defined limits, and to identify those with evidence of an active problem, ie, with adverse consequences related to their drinking. This screening paves the way for further assessment, definitive diagnosis, and a treatment plan.
The US Preventive Services Task Force recommends screening and behavioral counseling interventions (such as a brief intervention) in the primary care setting to reduce alcohol misuse by adults, including pregnant women.5 In addition, most primary care patients who screen positive for heavy drinking or alcohol use disorder show motivation and readiness to change, and those with the most severe symptoms tend to be the most ready.6
THE IDEAL QUESTIONNAIRE: SENSITIVE, SPECIFIC, AND SHORT
The ideal alcohol screening questionnaire for a busy practice should be brief and highly sensitive and specific for identifying the spectrum of alcohol misuse. Also, it should be easy to recall so it can be part of routine face-to-face discussion with the patient during an office visit.
Further, it should include questions that focus on the consequences of drinking as well as on quantity and frequency. It should also take into account factors such as the patient’s age, sex, race or ethnicity, and pregnancy status, as these can influence the effectiveness of the screening method.
Problems with focusing on quantity alone
“Risky use” is defined (in a non-alcohol-dependent person or one with no alcohol-related consequences) as more than seven standard drinks per week or more than three per occasion for women, and more than 14 standard drinks per week or more than four per occasion for men.2
A standard drink in the United States contains about 12 to 14 g of ethanol: a 12-oz can or bottle of beer, a 5-oz glass of wine, or about 1.5 oz of 80-proof liquor.2
The common single-item screening test asks, “How many times in the past year have you had more than four drinks (for women) or five drinks (for men) in a day?” This is recommended by the National Institute on Alcohol Abuse and Alcoholism for brief screening in primary care. However, a positive answer (ie, one or more times in the past year) has a sensitivity of only 82% and a specificity of only 79% for detecting unhealthy alcohol use, and an even lower specificity (67%) for detecting current alcohol use disorder.7
The CAGE questionnaire
The four-item CAGE questionnaire8 focuses on the consequences of drinking:
- C: Have you felt the need to cut down on your drinking?
- A: Have you ever felt annoyed by someone criticizing your drinking?
- G: Have you ever felt bad or guilty about your drinking?
- E: Have you ever had an eye-opener—a drink the first thing in the morning to steady your nerves?
A yes to one or more of the questions denotes a need for further assessment.
The CAGE questionnaire is simple, non-threatening, brief, and easy to remember. A yes answer to two or more items has a sensitivity of 75% to 95% and a specificity of 84% to 97% for alcohol dependence.9 However, CAGE is less sensitive for identifying nonalcohol-dependent at-risk drinkers. The patient’s sex and ethnicity have also been found to affect its performance somewhat, with some studies showing a sensitivity as low as 50% in adult white women and as low as 40% in at-risk groups ages 60 and over.
The TWEAK questionnaire
The TWEAK is a modification of the CAGE and includes a question about tolerance; it has a sensitivity of 87% for harmful drinking and 84% for dependence, especially in trauma-related cases.9 It has also been found to be better than the CAGE for screening pregnant patients.
- Tolerance: How many drinks can you hold without falling asleep or passing out? (2 points if six drinks or more)
- Worried: Have friends or relatives worried about your drinking? (2 points if yes)
- Eye-opener: Do you sometimes take a drink in the morning when you first get up? (1 point if yes)
- Amnesia: Have friends or relatives told you about things you said or did while drinking that you could not remember? (1 point if yes)
- Cut down: Do you sometimes feel the need to cut down on your drinking? (1 point if yes)
An answer of ≥ 6 to the first question or a total score of 3 or more denotes a problem with alcohol use and a need for further assessment.10
The AUDIT-C
The AUDIT-C, a shorter form of the 10-item AUDIT developed by the World Health Organization, uses only the first three questions of the full-length AUDIT. The three-item AUDIT-C has a sensitivity ranging from 85% in Hispanic women to 95% in white men.9,11 The questions center on the quantity and frequency of alcohol use:
- How often do you have a drink containing alcohol? Answer choices: never; monthly or less often; 2 to 4 times a month; 2 to 3 times a week; 4 or more times a week.
- How many standard drinks containing alcohol do you have on a typical day when you are drinking? Answer choices: one or two; three or four; five or six; seven to nine; 10 or more.
- How often do you have six or more drinks on one occasion? Answer choices: never, less than monthly; monthly; weekly; daily or almost.
Scoring is 0 for never, and 1, 2, 3, or 4 for the subsequent answer choices in each question.
The cut-off score for the AUDIT-C is usually a total of 3 points for women and 4 for men: ie, a score of 3 or higher for women and a score of 4 or higher for men indicate alcohol use disorder and the need for further assessment.
The AUDIT questionnaire has been found not only to have a high sensitivity (83%) and specificity (90%) for identifying alcohol dependence, but also to be more sensitive than the CAGE questionnaire (85% vs 75%) for identifying harmful drinking, hazardous drinking, and at-risk drinking. (Note: The full version of AUDIT performed similarly to the three-item AUDIT-C for detecting heavy drinking and active abuse or dependence.12) Furthermore, it has performed well as a screening test in many multinational trials of alcohol brief intervention. The questions about quantity of alcohol consumed may be even more suitable for adolescents and young adults, who tend to fall into the harmful-hazardous drinking category rather than the dependent category. In some studies, patients tended to reveal less with the CAGE questionnaire when it was preceded by direct and close-ended questions about the quantity and frequency of alcohol use, thus reducing its sensitivity.13
The AUDIT and TWEAK questionnaires showed greater sensitivity in both men and women than the CAGE questionnaire and were equally sensitive in African Americans.14
HOW TO FIT ALCOHOL SCREENING INTO AN OFFICE VISIT
A practical way to fit alcohol screening into an office visit is to include a questionnaire in the assessment papers completed by the patient while in the waiting room. In other settings, these questions may be asked by trained nursing staff as part of the initial assessment, ie, while obtaining the patient’s weight and vital statistics. This can be briefly reviewed by the physician during the face-to-face history and physical examination.
A concerted effort is needed to proactively screen for alcohol use. A combination of questions about the effect, the quantity, and the frequency of alcohol use is the best way to screen for the many different aspects of alcohol use disorder—many of which can be managed in the primary care setting through brief interventions without referral to a specialist.
When screening for alcohol misuse, it is also important to consider factors such as age, sex, race or ethnicity, pregnancy, and history of recent trauma or surgery.
- Saitz R. Clinical practice. Unhealthy alcohol use. N Engl J Med 2005; 352:596–607.
- National institute on Alcohol Abuse and Alcoholism (NIAAA). Helping patients who drink too much: A clinician’s guide and related professional support resources. http://pubs.niaaa.nih.gov/publications/practitioner/cliniciansguide2005/clinicians_guide.htm. Accessed July 29, 2011.
- Substance Abuse and Mental Health Services Administration (SAMHSA). Results from the 2009 National Survey on Drug Use and Health: Volume I. Summary of National Findings. http://www.oas.samhsa.gov/NSDUH/2k9NSDUH/2k9ResultsP.pdf. Accessed July 29, 2011.
- Fiellin DA, Reid MC, O’Connor PG. Screening for alcohol problems in primary care: a systematic review. Arch Intern Med 2000; 160:1977–1989.
- US Preventive Services Task Force (USPSTF). Screening and behavioral counseling interventions in primary care to reduce alcohol misuse. Release date: April 2004. http://www.uspreventiveservicestaskforce.org/uspstf/uspsdrin.htm. Accessed July 29, 2011.
- Williams EC, Kivlahan DR, Saitz R, et al. Readiness to change in primary care patients who screened positive for alcohol misuse. Ann Fam Med 2006; 4:213–220.
- Smith PC, Schmidt SM, Allensworth-Davies D, Saitz R. Primary care validation of a single-question alcohol screening test. J Gen Intern Med 2009; 24:783–788.
- Ewing JA. Detecting alcoholism. The CAGE questionnaire. JAMA 1984; 252:1905–1907.
- Cherpitel CJ. Screening for alcohol problems in the emergency department. Ann Emerg Med 1995; 26:158–166.
- Russell M, Martier SS, Sokol RJ, et al. Screening for pregnancy risk-drinking. Alcohol Clin Exp Res 1994; 18:1156–1161.
- Frank D, DeBenedetti AF, Volk RJ, Williams EC, Kivlahan DR, Bradley KA. Effectiveness of the AUDIT-C as a screening test for alcohol misuse in three race/ethnic groups. J Gen Intern Med 2008; 23:781–787.
- Bush K, Kivlahan DR, McDonell MB, Fihn SD, Bradley KA. The AUDIT alcohol consumption questions (AUDIT-C): an effective brief screening test for problem drinking. Ambulatory Care Quality Improvement Project (ACQUIP). Alcohol Use Disorders Identification Test. Arch Intern Med 1998; 158:1789–1795.
- Steinweg DL, Worth H. Alcoholism: the keys to the CAGE. Am J Med 1993; 94:520–523.
- Cherpitel CJ. Brief screening instruments for alcoholism. Alcohol Health Res World 1997; 21:348–351.
Necrotic skin lesions after hemodialysis
Current laboratory values:
- Serum calcium concentration 7.8 mg/dL (reference range 8.5–10.5)
- Phosphorus 6.4 mg/dL (2.5–4.5)
- Corrected calcium-phosphorus product 55
- Parathyroid hormone 275 pg/mL (10–60)
- 25-hydroxyvitamin D 7.4 ng/mL (31–80).
Q: Given the patient’s history, which of the following does her skin lesion likely represent?
- Necrotizing fasciitis
- Calciphylaxis
- Disseminated intravascular coagulation
- Anticoagulant-induced skin necrosis
A: Calciphylaxis, or calcific uremic arteriolopathy, is the most likely. It is rare in people with normal renal function, and still rare but somewhat less so in end-stage renal disease patients undergoing chronic hemodialysis.
WHAT CAUSED IT IN OUR PATIENT?
The cause of calciphylaxis is unknown. Theories have focused on protein C and parathyroid hormone. Putative precipitating factors include acute tubular necrosis, albumin infusion with paracentesis, deficiency of protein C or S, hyperparathyroidism, hyperphosphatemia, hypercalcemia, vitamin D supplementation, steroids, trauma, and warfarin use.
Our patient had a history of hypothyroidism, ulcerative colitis, and end-stage liver disease due to primary sclerosing cholangitis, but no previous history of renal disease.
At the time of her acute renal failure, her calcium-phosphorus level was 55, parathyroid hormone level 274 pg/mL (normal 10–60), and protein C level 26% (normal 76%–147%). At the time the skin lesions were discovered, her protein C level had dropped to 14%; her parathyroid level had returned to normal.
Her home medications included furosemide (Lasix), levothyroxine (Synthroid), mesalamine (Pentasa), azathioprine (Imuran), ursodiol (Actigall), spironolactone (Aldactone), and omeprazole (Prilosec).
NONHEALING LESIONS
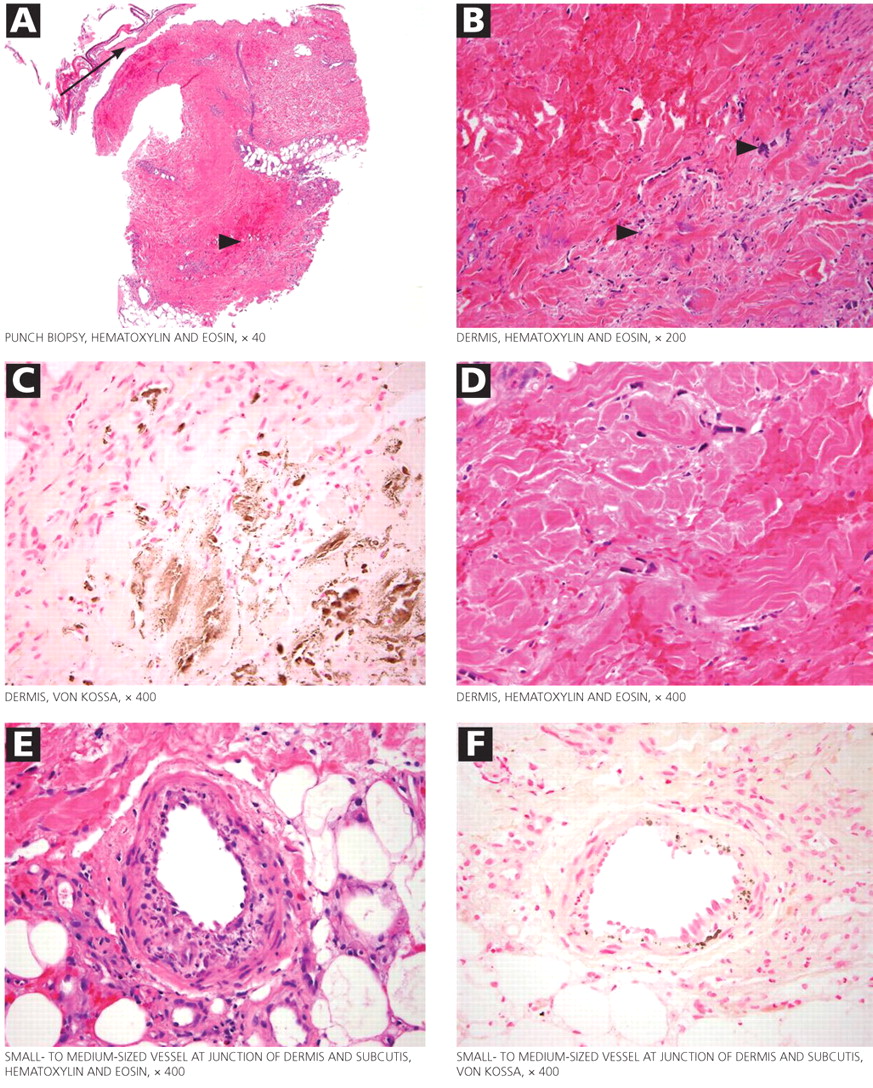
The skin lesions of calciphylaxis usually occur in areas of increased adipose tissue. The lesions may not manifest until several weeks after the initial insult (ie, the elevated calcium-phosphate level). Skin biopsy is recommended if a necrotic skin lesion is identified in a patient with an elevated calcium-phosphate level or in a patient with risk factors for renal, liver, or parathyroid disease.
PROGNOSIS IS POOR
Treatment is supportive. Intensive wound care (with surgical evaluation for skin grafting), hyperbaric oxygen, and possibly tissue plasminogen activator (if there is evidence of a hypercoagulable state and occlusive vasculopathy) may be the most beneficial. Identifying the underlying cause and regulating the calcium-phosphorus product level with diet, phosphate binders, bisphosphonates, and sodium thiosulfate are also important in wound healing. Cinacalcet (Sensipar) and parathyroidectomy should be considered in cases of secondary hyperparathyroidism.
Calciphylaxis is important to recognize early in its course and may require a multidisciplinary approach to treatment. Its prognosis is poor, with death rates ranging from 40% to 60%.
Our patient developed recurrent hepatorenal syndrome and sepsis and eventually died of septic shock.
- Daudén E, Oñate MJ. Calciphylaxis. Dermatol Clin 2008; 26:557–568.
- Pliquett RU, Schwock J, Paschke R, Achenbach H. Calciphylaxis in chronic, non-dialysis-dependent renal disease. BMC Nephrol 2003; 4:8.
- Nigwekar SU, Wolf M, Sterns RH, Hix JK. Calciphylaxis from nonuremic causes: a systematic review. Clin J Am Soc Nephrol 2008; 3:1139–1143.
Suggested Reading
- Rogers NM, Coates PT. Calcific uraemic arteriolopathy:an update. Curr Opin Nephrol Hypertens 2008; 17:629–634.
- Weenig RH, Sewell LD, Davis MD, McCarthy JT, Pittelkow MR. Calciphylaxis: natural history, risk factor analysis, and outcome. J Am Acad Dermatol 2007; 56:569–579.
Current laboratory values:
- Serum calcium concentration 7.8 mg/dL (reference range 8.5–10.5)
- Phosphorus 6.4 mg/dL (2.5–4.5)
- Corrected calcium-phosphorus product 55
- Parathyroid hormone 275 pg/mL (10–60)
- 25-hydroxyvitamin D 7.4 ng/mL (31–80).
Q: Given the patient’s history, which of the following does her skin lesion likely represent?
- Necrotizing fasciitis
- Calciphylaxis
- Disseminated intravascular coagulation
- Anticoagulant-induced skin necrosis
A: Calciphylaxis, or calcific uremic arteriolopathy, is the most likely. It is rare in people with normal renal function, and still rare but somewhat less so in end-stage renal disease patients undergoing chronic hemodialysis.
WHAT CAUSED IT IN OUR PATIENT?
The cause of calciphylaxis is unknown. Theories have focused on protein C and parathyroid hormone. Putative precipitating factors include acute tubular necrosis, albumin infusion with paracentesis, deficiency of protein C or S, hyperparathyroidism, hyperphosphatemia, hypercalcemia, vitamin D supplementation, steroids, trauma, and warfarin use.
Our patient had a history of hypothyroidism, ulcerative colitis, and end-stage liver disease due to primary sclerosing cholangitis, but no previous history of renal disease.
At the time of her acute renal failure, her calcium-phosphorus level was 55, parathyroid hormone level 274 pg/mL (normal 10–60), and protein C level 26% (normal 76%–147%). At the time the skin lesions were discovered, her protein C level had dropped to 14%; her parathyroid level had returned to normal.
Her home medications included furosemide (Lasix), levothyroxine (Synthroid), mesalamine (Pentasa), azathioprine (Imuran), ursodiol (Actigall), spironolactone (Aldactone), and omeprazole (Prilosec).
NONHEALING LESIONS
The skin lesions of calciphylaxis usually occur in areas of increased adipose tissue. The lesions may not manifest until several weeks after the initial insult (ie, the elevated calcium-phosphate level). Skin biopsy is recommended if a necrotic skin lesion is identified in a patient with an elevated calcium-phosphate level or in a patient with risk factors for renal, liver, or parathyroid disease.
PROGNOSIS IS POOR
Treatment is supportive. Intensive wound care (with surgical evaluation for skin grafting), hyperbaric oxygen, and possibly tissue plasminogen activator (if there is evidence of a hypercoagulable state and occlusive vasculopathy) may be the most beneficial. Identifying the underlying cause and regulating the calcium-phosphorus product level with diet, phosphate binders, bisphosphonates, and sodium thiosulfate are also important in wound healing. Cinacalcet (Sensipar) and parathyroidectomy should be considered in cases of secondary hyperparathyroidism.
Calciphylaxis is important to recognize early in its course and may require a multidisciplinary approach to treatment. Its prognosis is poor, with death rates ranging from 40% to 60%.
Our patient developed recurrent hepatorenal syndrome and sepsis and eventually died of septic shock.
- Daudén E, Oñate MJ. Calciphylaxis. Dermatol Clin 2008; 26:557–568.
- Pliquett RU, Schwock J, Paschke R, Achenbach H. Calciphylaxis in chronic, non-dialysis-dependent renal disease. BMC Nephrol 2003; 4:8.
- Nigwekar SU, Wolf M, Sterns RH, Hix JK. Calciphylaxis from nonuremic causes: a systematic review. Clin J Am Soc Nephrol 2008; 3:1139–1143.
Suggested Reading
- Rogers NM, Coates PT. Calcific uraemic arteriolopathy:an update. Curr Opin Nephrol Hypertens 2008; 17:629–634.
- Weenig RH, Sewell LD, Davis MD, McCarthy JT, Pittelkow MR. Calciphylaxis: natural history, risk factor analysis, and outcome. J Am Acad Dermatol 2007; 56:569–579.
A discussion of dissection

Dr. Alan C. Braverman, in this issue of the Journal, discusses thoracic aortic dissection. To most of us who do not routinely treat aortic disease, it may not seem that much has changed since that Thanksgiving in Philadelphia. Atherosclerosis is still a common risk, surgery is the treatment for ascending dissection, beta-blockers are useful for chronic descending dissections, and the mortality rate is enormously high when dissections bleed.
As internists, we consider the possibility of genetic disorders in patients with a family history of dissection or aneurysm, but we don’t really expect to find many, and most of us don’t often track advances in the understanding of these disorders at the molecular level. At the time I was working in that emergency room, Marfan syndrome was viewed as a connective tissue disorder, with a structurally weak aortic wall and variable other morphologic features. When the molecular defect was defined as fibrillin-1 deficiency, I didn’t think much more than that the weak link of the aorta’s fibrous belt was identified.
But it turns out that fibrillin is not just an aortic girdle; fibrillin lowers the concentration of the cytokine transforming growth factor (TGF)-beta in the aorta (and other organs) by promoting its sequestration in the extracellular matrix. Absence of fibrillin enhances TGF-beta activity, and excess TGF-beta can produce Marfan syndrome in young mice. In maybe the most striking consequence of this line of research, Dietz and colleagues1 have demonstrated that the specific antagonism of the angiotensin II type 1 receptor by the drug losartan (Cozaar) also blocks the effects of TGF-beta and consequently blocks the development of murine Marfan syndrome. And in a preliminary study, it slowed aneurysm progression in a small group of children with Marfan syndrome.
This does not imply that the same pathophysiology is at play in all aortic aneurysms. But at a time of new guidelines for screening for abdominal aneurysm, these observations offer a novel paradigm for developing drug therapies as an alternative to the mad rush for the vascular operating suite.
- Brooke BS, Habashi JP, Judge DP, Patel N, Loeys B, Dietz HC. Angiotensin II blockade and aortic-root dilation in Marfan’s syndrome. N Engl J Med 2008; 358:2787–2795.
Dr. Alan C. Braverman, in this issue of the Journal, discusses thoracic aortic dissection. To most of us who do not routinely treat aortic disease, it may not seem that much has changed since that Thanksgiving in Philadelphia. Atherosclerosis is still a common risk, surgery is the treatment for ascending dissection, beta-blockers are useful for chronic descending dissections, and the mortality rate is enormously high when dissections bleed.
As internists, we consider the possibility of genetic disorders in patients with a family history of dissection or aneurysm, but we don’t really expect to find many, and most of us don’t often track advances in the understanding of these disorders at the molecular level. At the time I was working in that emergency room, Marfan syndrome was viewed as a connective tissue disorder, with a structurally weak aortic wall and variable other morphologic features. When the molecular defect was defined as fibrillin-1 deficiency, I didn’t think much more than that the weak link of the aorta’s fibrous belt was identified.
But it turns out that fibrillin is not just an aortic girdle; fibrillin lowers the concentration of the cytokine transforming growth factor (TGF)-beta in the aorta (and other organs) by promoting its sequestration in the extracellular matrix. Absence of fibrillin enhances TGF-beta activity, and excess TGF-beta can produce Marfan syndrome in young mice. In maybe the most striking consequence of this line of research, Dietz and colleagues1 have demonstrated that the specific antagonism of the angiotensin II type 1 receptor by the drug losartan (Cozaar) also blocks the effects of TGF-beta and consequently blocks the development of murine Marfan syndrome. And in a preliminary study, it slowed aneurysm progression in a small group of children with Marfan syndrome.
This does not imply that the same pathophysiology is at play in all aortic aneurysms. But at a time of new guidelines for screening for abdominal aneurysm, these observations offer a novel paradigm for developing drug therapies as an alternative to the mad rush for the vascular operating suite.
- Brooke BS, Habashi JP, Judge DP, Patel N, Loeys B, Dietz HC. Angiotensin II blockade and aortic-root dilation in Marfan’s syndrome. N Engl J Med 2008; 358:2787–2795.
- Brooke BS, Habashi JP, Judge DP, Patel N, Loeys B, Dietz HC. Angiotensin II blockade and aortic-root dilation in Marfan’s syndrome. N Engl J Med 2008; 358:2787–2795.
Aortic dissection: Prompt diagnosis and emergency treatment are critical
A 50-year-old man developed severe chest pain and collapsed to the floor. The pain was sudden in onset, was burning in quality, and was located in the center of his chest. Emergency medical services arrived a few minutes later and found the patient diaphoretic and cyanotic, with an initial blood pressure of 74/54 mm Hg and a heart rate of 125 beats per minute. He was rushed to the hospital.
His medical history was unremarkable. He smoked one pack of cigarettes per day for 20 years. His father died of a “heart attack” at age 52.
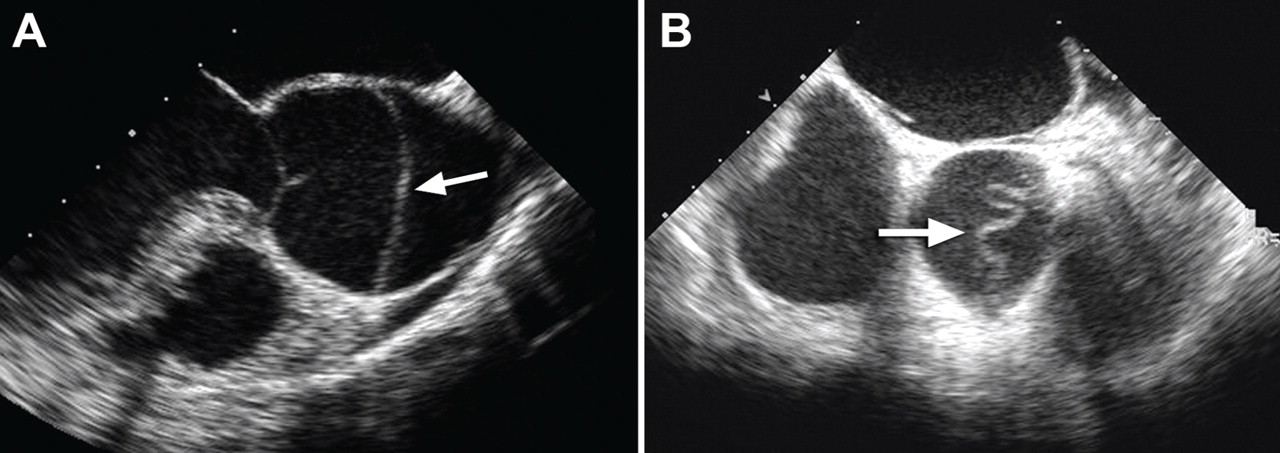
In the emergency department he underwent echocardiography with a portable handheld unit, which showed a pericardial effusion and cardiac tamponade. He was sent for emergency computed tomography of the chest, which revealed an aneurysm of the aortic root and acute type A (Stanford classification) aortic dissection with hemopericardium.
He underwent emergency cardiac surgery. At the time of surgery, he was in cardiogenic shock from aortic dissection complicated by severe aortic regurgitation and cardiac tamponade with hemopericardium. The aortic valve was trileaflet. A 27-mm St. Jude composite valve graft root replacement was performed.
The patient did well and was discharged home 7 days after surgery. Pathologic study of the aorta revealed cystic medial degeneration. He did not have any features of Marfan syndrome or Loeys-Dietz syndrome. His three children underwent evaluation, and each had a normal physical examination and echocardiographic test results.
A HIGH INDEX OF SUSPICION IS CRITICAL
Acute aortic dissection is the most common aortic catastrophe, with an incidence estimated at 5 to 30 per 1 million people per year, amounting to nearly 10,000 cases per year in the United States.1–4
The diagnosis of acute aortic dissection has many potential pitfalls.2,3 Aortic dissection may mimic other more common conditions, such as coronary ischemia, pleurisy, heart failure, stroke, and acute abdominal illness. Because acute aortic dissection may be rapidly fatal, one must maintain a high index of suspicion.2,3 Prompt diagnosis and emergency treatment are critical.
WHAT CAUSES AORTIC DISSECTION?
One hypothesis is that acute aortic dissection is caused by a primary tear in the aortic intima, with blood from the aortic lumen penetrating into the diseased media leading to dissection and creating a true and false lumen.2 Another is that rupture of the vasa vasorum leads to hemorrhage in the aortic wall with subsequent intimal disruption, creating the intimal tear and aortic dissection.
Once a dissection starts, pulsatile flow of blood within the aortic wall causes it to extend. The dissection flap may be localized, but it often spirals the entire length of the aorta. Distention of the false lumen with blood may cause the intimal flap to compress the true lumen and potentially lead to malperfusion syndromes.
CLASSIFIED ACCORDING TO LOCATION
It is important to recognize the location of the dissection, as the prognosis and treatment depend on whether the ascending aorta is involved.2,3 For classification purposes, the ascending aorta is the portion proximal to the brachiocephalic artery, while the descending aorta is the portion distal to the left subclavian artery.3
The DeBakey classification defines a type I aortic dissection as one that begins in the ascending aorta and extends at least to the aortic arch or beyond. Type II dissections involve the ascending aorta only, while type III dissections begin in the descending aorta, most often just distal to the left subclavian artery.
The Stanford classification scheme divides dissections into type A and type B. Type A dissections involve the ascending aorta, while type B dissections do not involve the ascending aorta.
Which classification scheme is used is not important. However, identifying patients with dissection of the ascending aorta (DeBakey type I or type II or Stanford type A) is critical, as emergency cardiac surgery is recommended for this type of dissection.2,3 For the purposes of this paper, the Stanford classification scheme will be used.
Dissection that involves the ascending aorta most commonly occurs in people ages 50 to 60, whereas acute dissection of the descending aorta typically occurs in people 10 years older.1,2
An acute aortic dissection is one that has occurred within 2 weeks of symptom onset. A chronic dissection is one that occurred more than 2 weeks after symptoms began.
DISEASES AND CONDITIONS ASSOCIATED WITH AORTIC DISSECTION
Hypertension and disorders leading to disruption of the normal structure and function of the aortic wall. About 75% of patients with acute aortic dissection have underlying hypertension.1–3
Cystic medial degeneration is a common pathologic feature in many cases of aortic dissection.
Cocaine use and intense weight-lifting increase the shear stresses on the aorta.2,3
Inflammatory aortic diseases such as giant cell arteritis.
Pregnancy can be complicated by aortic dissection, usually in the setting of an underlying aortopathy.5
Iatrogenic aortic dissection accounts for about 4% of cases, as a result of cardiac surgery, catheterization, stenting, or use of an intra-aortic balloon pump.1
Aortic aneurysm. Patients with thoracic aortic aneurysm are at higher risk of aortic dissection, and the larger the aortic diameter, the higher the risk.2,3,6 In the International Registry of Acute Aortic Dissection (IRAD), the average size of the aorta was about 5.3 cm at the time of acute dissection. Importantly, about 40% of acute dissections of the ascending aorta occur in patients with ascending aortic diameters less than 5.0 cm.7,8
Thus, many factors are associated with acute dissection, and specific reasons leading to an individual’s susceptibility to sudden dissection are poorly understood.
CLINICAL FEATURES OF ACUTE AORTIC DISSECTION
Because the symptoms of acute dissection may mimic other, more common conditions, one of the most important factors in the diagnosis of aortic dissection is a high clinical suspicion.1–3
What is the pretest risk of disease?
Recently, the American College of Cardiology (ACC) and the American Heart Association (AHA) released joint guidelines on thoracic aortic disease.3 These guidelines provide an approach to patients who have complaints that may represent acute thoracic aortic dissection, the intent being to establish a pretest risk of disease to be used to guide decision-making.3
The focused evaluation includes specific questions about underlying conditions, symptoms, and findings on examination that may greatly increase the likelihood of acute dissection. These include:
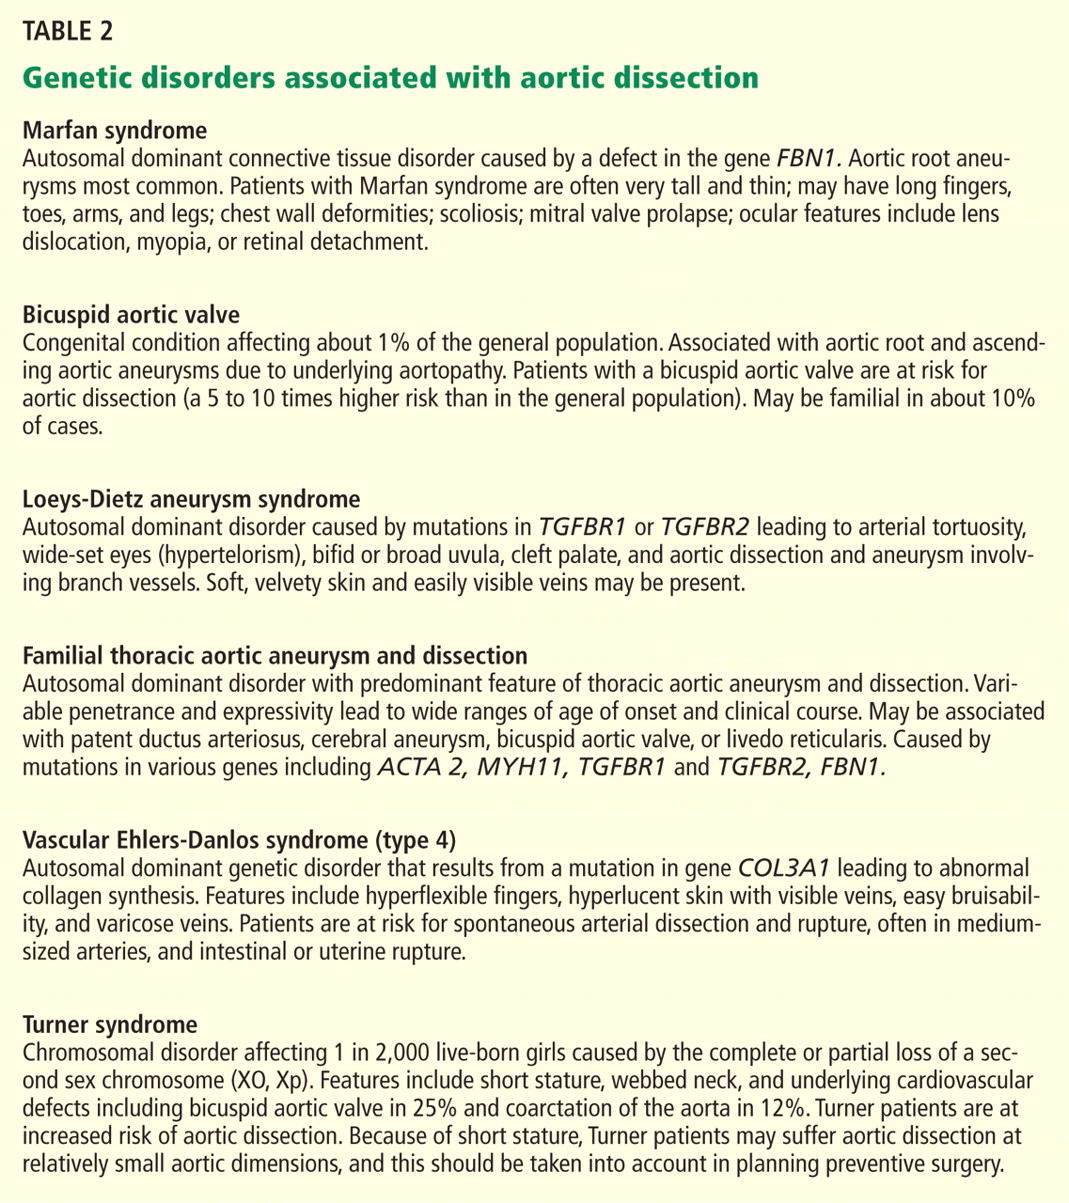
- High-risk conditions and historical features associated with aortic dissection, such as Marfan syndrome and other genetic disorders (Table 2), bicuspid aortic valve, family history of thoracic aortic aneurysm or dissection, known thoracic aortic aneurysm, and recent aortic manipulation
- Pain in the chest, back, or abdomen with high-risk features (eg, abrupt onset, severe intensity, or a ripping or tearing quality)
- High-risk findings on examination (eg, pulse deficits, new aortic regurgitation, hypotension, shock, or systolic blood pressure differences).
Using this information, expedited aortic imaging and treatment algorithms have been devised to improve the diagnosis.3
Using the IRAD database of more than 2,500 acute dissections, the diagnostic algorithm proposed in the ACC/AHA guidelines was shown to be highly sensitive (about 95%) for detecting acute aortic dissection.4 In addition, using this score may expedite evaluation by classifying certain patients as being at high risk of acute dissection.3,4
Important to recognize is that almost two-thirds of patients who suffered dissection in this large database did not have one of the “high-risk conditions” associated with dissection.4 Additionally, the specificity of the ACC/AHA algorithm is unknown, and further testing is necessary.4
Acute onset of severe pain
More than 90% of acute dissections present with acute pain in the chest or the back, or both.1–3 The pain is usually severe, of sudden onset, and often described as sharp or, occasionally, tearing, ripping, or stabbing. The pain usually differs from that of coronary ischemia, being most severe at its onset as opposed to the less intense, crescendo-like pain of angina or myocardial infarction. The pain may migrate as the dissection progresses along the length of the aorta or to branch vessels. It may abate, leading to a false sense of security in the patient and the physician.3 “Painless” dissection occurs in a minority, usually in those with syncope, neurologic symptoms, or heart failure.1–3
The patient with acute dissection may be anxious and may feel a sense of doom.
Acute heart failure, related to severe aortic regurgitation, may be a predominant symptom in dissection of the ascending aorta.
Syncope may occur as a result of aortic rupture, hemopericardium with cardiac tamponade, or acute neurologic complications.
Vascular insufficiency may occur in any branch vessel, leading to clinical syndromes that include acute myocardial infarction, stroke, paraplegia, paraparesis, mesenteric ischemia, and limb ischemia.
PHYSICAL FINDINGS CAN VARY WIDELY
Findings on physical examination in acute aortic dissection vary widely depending on underlying conditions and on the specific complications of the dissection.
Although the classic presentation is acute, severe pain in the chest or back in a severely hypertensive patient with aortic regurgitation and pulse deficits, most patients do not have all these characteristics.4 Most patients with type B dissection are hypertensive on presentation, but many with type A dissection present with normal blood pressure or hypotension.1 Pulse deficits (unequal or absent pulses) are reported in 10% to 30% of acute dissections and may be intermittent as the dynamic movement of the dissection flap interferes with branch vessel perfusion.1–3
- Aortic leaflet prolapse or distortion of the leaflet alignment
- Malcoaptation of the aortic leaflets from dilation of the aortic root and annulus
- Prolapse of the intimal flap across the aortic valve, interfering with valve function
- Preexisting aortic regurgitation from underlying aortic root aneurysm or primary aortic valve disease (such as a bicuspid aortic valve).
Neurologic manifestations are most common in dissection of the ascending aorta and are particularly important to recognize, as they may dominate the clinical presentation and lead to delay in the diagnosis of dissection.2,3 Neurologic syndromes include:
- Persistent or transient ischemic stroke
- Spinal cord ischemia
- Ischemic neuropathy
- Hypoxic encephalopathy.
These manifestations are related to malperfusion to branches supplying the brain, spinal cord, or peripheral nerves.9
Syncope is relatively common in aortic dissection and may be related to acute hypotension caused by cardiac tamponade or aortic rupture, cerebral vessel obstruction, or activation of cerebral baroreceptors.2,9 It is important to consider aortic dissection in the differential diagnosis in cases of unexplained syncope.3
Aortic dissections may extend into the abdominal aorta, leading to vascular complications involving one or more branch vessels.10 The renal artery is involved in at least 5% to 10% of cases and may lead to renal ischemia, infarction, renal insufficiency, or refractory hypertension.2Mesenteric ischemia or infarction occurs in about 5% of dissections, may be difficult to diagnose, and is particularly dangerous.2,8 Aortic dissection may extend into the iliac arteries and may cause acute lower extremity ischemia.
Acute myocardial infarction due to involvement of the dissection flap causing malperfusion of a coronary artery occurs in 1% to 7% of acute type A aortic dissections.1–3 The right coronary artery (Figure 2) is most commonly involved, leading to acute inferior myocardial infarction. Acute myocardial ischemia and infarction in the setting of dissection may lead to a delay in the diagnosis of dissection and to bleeding complications from antiplatelet and anticoagulant drugs given to treat the acute coronary syndrome.
Cardiac tamponade, occurring in about 10% of acute type A dissections, portends a higher risk of death.2,3
Additional clinical features of aortic dissection include a left-sided pleural effusion, usually related to an inflammatory response. An acute hemothorax may occur from rupture or leaking of a descending aortic dissection.
FINDINGS ON RADIOGRAPHY AND ELECTROCARDIOGRAPHY
Electrocardiography usually has normal or nonspecific findings, unless acute myocardial infarction complicates the dissection.
D-DIMER LEVELS
Biomarkers for the diagnosis of acute aortic dissection are of great interest.
D-dimer levels rise in acute aortic dissection as they do in pulmonary embolism.11 A D-dimer level greater than 1,600 ng/mL within the first 6 hours has a very high positive likelihood ratio for dissection, so this test may be useful in identifying patients with a high probability for dissection. In the first 24 hours after symptom onset, a D-dimer level of less than 500 ng/mL has a negative predictive value of 95%. Thus, elevations in D-dimer may help decide which imaging to perform in a patient presenting with chest pain or suspicion of dissection.11
However, D-dimer levels may not be elevated in dissection variants, such as aortic intramural hematoma or penetrating aortic ulcer. Additionally, once 24 hours have elapsed since the dissection started, D-dimer levels may no longer be elevated. The current ACC/AHA guidelines on thoracic aortic disease concluded that the D-dimer level cannot be used to rule out aortic dissection in high-risk individuals.3
Additional studies may clarify the appropriate role of the D-dimer assay in diagnosing aortic dissection.
DEFINITIVE IMAGING STUDIES: CT, MRI, TEE
Contrast-enhanced computed tomography (CT), magnetic resonance imaging (MRI), and transesophageal echocardiography (TEE) all have very high sensitivity and specificity for the diagnosis of aortic dissection.2,3 The choice of imaging study often depends on the availability of these studies, with CT and TEE being the most commonly performed initial studies.
MRI is outstanding for detecting and following aortic dissection, but it is usually not the initial study performed because of the time required for image acquisition and because it is generally not available on an emergency basis.
While transthoracic echocardiography (TTE) can detect aortic dissection, its sensitivity is much lower than that of other imaging tests.2,3 Therefore, negative findings on TTE do not exclude aortic dissection.
MANAGEMENT OF AORTIC DISSECTION
When acute aortic dissection is diagnosed, multidisciplinary evaluation and treatment are necessary. Time is of the essence, as the death rate in acute dissection may be as high as 1% per hour during the first 24 hours.1–3 All patients with acute aortic dissection, whether type A or type B, should be transferred to a tertiary care center with a staff experienced in managing aortic dissection and its complications.3 Emergency surgery is recommended for type A aortic dissection, whereas type B dissection is generally treated medically unless complications occur.2,3
The cornerstone of drug therapy is the prompt reduction in blood pressure with a beta-blocker to reduce shear stresses on the aorta. Intravenous agents such as esmolol (Brevibloc) or labetalol (Normodyne) are usually chosen. Sodium nitroprusside may be added to beta-blocker therapy for rapid blood pressure control in appropriate patients. The patient may require multiple antihypertensive medications. If hypertension is refractory, one must consider renal artery hypertension due to the dissection causing renal malperfusion.2 Acute pain may also worsen hypertension, and appropriate analgesia should be used.
Definitive therapy in acute dissection
Patients with acute type A dissection require emergency surgery,2,3 as they are at risk for life-threatening complications including cardiac tamponade from hemopericardium, aortic rupture, stroke, visceral ischemia, and heart failure due to severe aortic regurgitation. When aortic regurgitation complicates acute type A dissection, some patients are adequately treated by resuspension of the aortic valve leaflets, while others require valve-sparing root replacement or prosthetic aortic valve replacement.
Surgical therapy is associated with a survival benefit compared with medical therapy in acute type A dissection.1 The 14-day mortality rate for acute type A dissection treated surgically is about 25%.1 Patients with high-risk features such as heart failure, shock, tamponade, and mesenteric ischemia have a worse prognosis compared with those without these features.2,12,13
Acute type B aortic dissection carries a lower rate of death than type A dissection.1–3 In the IRAD cohort, the early mortality rate in those with type B dissection treated medically was about 10%.1 However, when complications such as malperfusion, shock, or requirement for surgery occur in type B dissection, the mortality rate is much higher,2,14 with rates of 25% to 50% reported.2
Thus, initial medical therapy is the preferred approach to acute type B dissection, and surgery or endovascular therapy is reserved for patients with acute complications.2,3 Typical indications for surgery or endovascular therapy in type B dissection include visceral or limb ischemia, aortic rupture, refractory pain, and aneurysmal dilation (Table 3).2
Endovascular therapy in aortic dissection
The high mortality rate with open surgery in acute type B dissection has spurred tremendous interest in endovascular treatments for complications involving the descending aorta and branch vessels.2
Fenestration of the aorta and stenting of branch vessels were the earliest techniques used in complicated type B dissection. By fenestrating (ie, opening) the intimal flap, blood can flow from the false lumen into the true lumen, decompressing the distended false lumen.
Endovascular stenting is used for acute aortic rupture, for malperfusion syndromes, and for rapidly enlarging false lumens. Endovascular grafts may cover the area of a primary intimal tear and thus eliminate the flow into the false channel and promote false-lumen thrombosis. Many patients with complicated type B dissection are treated with a hybrid approach, in which one segment of the aorta, such as the aortic arch, is treated surgically, while the descending aorta receives an endovascular graft.2
Patients with a type B dissection treated medically are at risk for late complications, including aneurysmal enlargement and subsequent aortic rupture. The Investigation of Stent Grafts in Aortic Dissection (INSTEAD) trial included 140 patients with uncomplicated type B dissection and compared drug therapy with endovascular stent grafting.15 After 2 years of follow-up, there was no difference in the rate of death between the two treatment groups. Patients receiving endovascular grafts had a higher rate of false-lumen thrombosis.
More studies are under way to examine the role of endovascular therapy in uncomplicated type B dissection.
AORTIC DISSECTION VARIANTS
Aortic intramural hematoma
Aortic intramural hematoma is a form of acute aortic syndrome in which a hematoma develops in the aortic media and no intimal flap is visualized either by imaging or at surgery.2,3,16 It is important to recognize this clinical entity in a patient presenting with acute chest or back pain, as sometimes it is mistaken for a “thrombus in a nonaneurysmal aorta.” Intramural hematoma accounts for 5% to 25% of acute aortic syndromes, depending on the study population (it is more common in Asian studies).2,3,17 It may present with symptoms similar to classic aortic dissection and is classified as type A or type B, depending on whether the ascending aorta is involved.
Patients with an intramural hematoma may progress to having complications such as hemopericardium, classic aortic dissection, aortic rupture, or aneurysmal dilation.2,3 However, many cases of type B aortic intramural hematoma result in complete resorption of the hematoma over time. In general, like classic aortic dissection, type A intramural hematoma is treated with emergency surgery and type B with initial medical therapy.2,3
There are reports from Southeast Asia of successful initial medical therapy for type A intramural hematoma, with surgery used for acute complications.18 In the Western literature, improved outcomes are reported with initial surgical therapy.17 Given the unpredictable nature of type A intramural hematoma, most experts recommend surgical therapy for appropriate candidates with acute type A intramural hematoma.2,3,19
Penetrating atherosclerotic ulcer of the aorta
Penetrating atherosclerotic ulcer of the aorta, another acute aortic syndrome, results from acute penetration of an atherosclerotic aortic lesion through the internal elastic lamina into the media.2,3,20 It is often associated with bleeding into the media, or intramural hematoma. While the ulcer may be found incidentally on imaging studies, especially in patients with severe aortic atherosclerosis, the typical presentation is acute, severe chest or back pain. It occurs most often in the descending aorta and the abdominal aorta.
Penetrating atherosclerotic ulcer may lead to pseudoaneurysm formation, focal aortic dissection, aortic rupture, or late aortic aneurysm.2
LONG-TERM MANAGEMENT AFTER AORTIC DISSECTION
After hospital discharge, patients with aortic dissection require lifelong management. This includes blood pressure control, lifestyle modification, serial imaging of the aorta with CT or MRI, patient education about the condition, and, when appropriate, screening of family members for aortic disease.5,21
Reported survival rates after hospitalization for type A dissection are 52% to 94% at 1 year and 45% to 88% at 5 years.2,22 The 10-year actuarial survival rate for those with acute dissection who survive the acute hospitalization is reported as 30% to 60%. Long-term survival rates after acute type B dissection have been reported at 56% to 92% at 1 year and 48% to 82% at 5 years.23 Survival rates depend on many factors, including the underlying condition, the age of the patient, and comorbidities.
It is important to treat hypertension after aortic dissection, with a goal blood pressure of 120/80 mm Hg or less for most patients. Older studies found higher mortality rates with poorly controlled hypertension. Beta-blockers are the drugs of first choice. Even in the absence of hypertension, long-term beta-blocker therapy should be used to lessen the aortic stress and force of ventricular contraction.
Genetic evaluation
Genetically triggered causes of aortic dissection should be considered. In many circumstances, referral to a medical geneticist or other practitioner knowledgeable in these conditions is important when these disorders are being evaluated (Table 2).
Many of these disorders have an autosomal dominant inheritance, and the patient should be asked about a family history of aortic disease, aortic dissection, or unexplained sudden death. Features of Marfan syndrome, Loeys-Dietz syndrome, and familial thoracic aortic aneurysm syndromes should be sought. Through comprehensive family studies, it is now recognized that up to 20% of patients with thoracic aortic disease (such as aneurysm or dissection) have another first-degree relative with thoracic aortic disease.2,3,24 Thus, first-degree relatives of patients with aortic aneurysm or dissection should be screened for thoracic aortic aneurysm disease.
Research into molecular genetics is providing a better understanding of the genetics of aortic dissection.3 New mutations associated with aortic dissection are being discovered in signaling pathways as well as elements critical for the integrity of the vascular wall.2,3 However, at present, most patients with aortic dissection will not have a specific identifiable genetic defect.
Not only does genetic testing enable the accurate diagnosis of the affected individual, but also treatments are often based on this diagnosis.3 Importantly, the identification of a specific gene mutation (ie, in TGFBR1 or 2, FBN1, ACTA2, MYH11, and COL3A1) in an affected individual has the potential to identify other family members at risk.3
Follow-up imaging
It is important to continue to image the aorta after aortic dissection. Patients may develop progressive dilation or aneurysm formation of the dissected aorta, pseudoaneurysm formation after repair, or recurrent dissection. Many patients require additional surgery on the aorta because of late aneurysm formation.
CT or MRI is usually performed at least every 6 months in the first 2 years after dissection and at least annually thereafter. More centers are choosing MRI for long-term follow-up to avoid the repeated radiation exposure with serial CT.
Patient education
Besides receiving medical therapy and undergoing imaging, patients with aortic dissection should be educated about this condition.5,21 The patient should be aware of symptoms suggesting dissection and should be instructed to seek attention for any concerning symptoms.
Lifestyle modifications are also important. The patient should be educated about safe activity levels and to avoid heavy isometric exercise, such as weight-lifting. Some patients will have to cease their current occupation because of activity restrictions.
- Hagan PG, Nienaber CA, Isselbacher EM, et al. International Registry of Acute Aortic Dissection (IRAD): new insights from an old disease. JAMA 2000; 283:897–903.
- Braverman AC, Thompson R, Sanchez L. Diseases of the aorta. In:Bonow RO, Mann DL, Zipes DP, Libby P. Braunwald’s Heart Disease, 9th Edition. Elsevier, Philadelphia, 2011.
- Hiratzka LF, Bakris GL, Beckman JA, et al. American College of Cardiology Foundation/American Heart Association Task Force on Practice Guidelines; American Association for Thoracic Surgery; American College of Radiology; American Stroke Association; Society of Cardiovascular Anesthesiologists; Society for Cardiovascular Angiography and Interventions; Society of Interventional Radiology; Society of Thoracic Surgeons; Society for Vascular Medicine. Guidelines for the management of patients with thoracic aortic disease. Circulation 2010; 121:e266–e369.
- Rogers AM, Herman LK, Booher AM, et al. Sensitivity of the aortic dissection detection risk score, a novel guideline-based tool for identification of acute aortic dissection at initial presentation. Results from the International Registry of Acute Aortic Dissection. Circulation 2011; 123:2213–2228.
- Braverman AC. Acute aortic dissection: clinician update. Circulation 2010; 122:184–188.
- Davies RR, Gallo A, Coady MA, et al. Novel measurement of relative aortic size predicts rupture of thoracic aortic aneurysms. Ann Thorac Surg 2006; 81:169–177.
- Pape LA, Tsai TT, Isselbacher EM, et al. Aortic diameter >5.5 cm is not a good predictor of type A aortic dissection. Observations from the International Registry of Acute Aortic Dissection. Circulation 2007; 116:1120–1127.
- Parish LM, Gorman JH, Kahn S, et al. Aortic size in acute type A dissection: implications for preventative ascending aortic replacement. Eur J Cardiothorac Surg 2009; 35:941–945.
- Gaul C, Dietrich W, Erbguth FJ. Neurological symptoms in acute aortic dissection: a challenge for neurologists. Cerebrovasc Dis 2008; 26:1–8.
- Upchurch GR, Nienaber C, Fattori R, et al Acute aortic dissection presenting with primarily abdominal pain: a rare manifestation of a deadly disease. Ann Vasc Surg 2005; 19:367–373.
- Suzuki T, Distante A, Zizza A, et al. Diagnosis of acute aortic dissection by D-dimer: the International Registry of Acute Aortic Dissection substudy on biomarkers (IRAD-bio) experience. Circulation 2009; 119:2702–2707.
- Tsai TT, Trimarchi S, Neinaber CA. Acute aortic dissection: perspectives from the International Registry of Acute Aortic Dissection (IRAD). Eur J Vasc Endovasc Surg 2009; 37:149–159.
- Trimarchi S, Nienaber CA, Rampoldi V, et al. Contemporary results of surgery in acute type A aortic dissection: the International Registry of Acute Aortic Dissection experience. J Thorac Cardiovasc Surg 2005; 129:112–122.
- Trimarchi S, Nienaber CA, Rampoldi V, et al. Role and results of surgery in acute type B aortic dissection. Insights from the International Registry of Acute Aortic Dissection (IRAD). Circulation 2006; 114(suppl 1):I-357–I-364.
- Nienaber CA, Rousseau H, Eggbrecht H, et al. Randomized comparison of strategies for type B aortic dissection. The Investigation of STEnt grafts in Aortic Dissection (INSTEAD) Trial. Circulation 2009; 120:2519–2528.
- Evangelista A, Mukherjee D, Mehta RH, et al. Acute intramural hematoma of the aorta. Circulation 2005; 111:1063–1070.
- Pelzel JM, Braverman AC, Hirsch AT, Harris KM. International heterogeneity in diagnostic frequency and clinical outcomes of ascending aortic intramural hematoma. J Am Soc Echo 2007; 20:1260–1268.
- Song JK, Yim JH, Ahn JM, et al. Outcomes of patients with acute type A aortic intramural hematoma. Circulation 2009; 120:2046–2052.
- Harris KM, Pelzel JM, Braverman AC. Letter regarding article, “Outcomes of patients with acute type A intramural hematoma.” Circulation 2010; 121:e456.
- Sundt TM. Intramural hematoma and penetrating atherosclerotic ulcer of the aorta. Ann Thorac Surg 2007; 83:S835–S841.
- Juang D, Braverman A, Eagle K. Aortic dissection. Circulation 2008; 118:e507–e510.
- Tsai TT, Evangelista A, Nienaber CA, et al. Long-term survival in patients presenting with type A acute aortic dissection. Insights from the international registry of acute aortic dissection. Circulation 2006; 114(suppl I):I-350–I-356.
- Tsai TT, Fattori R, Trimarchi S, et al. Long-term survival in patients presenting with type B acute aortic dissection. Insights from the international registry of acute aortic dissection. Circulation 2006; 114:2226–2231.
- Albornoz G, Coady MA, Roberts M, et al. Familial thoracic aortic aneurysms and dissections: incidence, modes of inheritance, and phenotypic patterns. Ann Thorac Surg 2006; 82:1400–1405.
A 50-year-old man developed severe chest pain and collapsed to the floor. The pain was sudden in onset, was burning in quality, and was located in the center of his chest. Emergency medical services arrived a few minutes later and found the patient diaphoretic and cyanotic, with an initial blood pressure of 74/54 mm Hg and a heart rate of 125 beats per minute. He was rushed to the hospital.
His medical history was unremarkable. He smoked one pack of cigarettes per day for 20 years. His father died of a “heart attack” at age 52.
In the emergency department he underwent echocardiography with a portable handheld unit, which showed a pericardial effusion and cardiac tamponade. He was sent for emergency computed tomography of the chest, which revealed an aneurysm of the aortic root and acute type A (Stanford classification) aortic dissection with hemopericardium.
He underwent emergency cardiac surgery. At the time of surgery, he was in cardiogenic shock from aortic dissection complicated by severe aortic regurgitation and cardiac tamponade with hemopericardium. The aortic valve was trileaflet. A 27-mm St. Jude composite valve graft root replacement was performed.
The patient did well and was discharged home 7 days after surgery. Pathologic study of the aorta revealed cystic medial degeneration. He did not have any features of Marfan syndrome or Loeys-Dietz syndrome. His three children underwent evaluation, and each had a normal physical examination and echocardiographic test results.
A HIGH INDEX OF SUSPICION IS CRITICAL
Acute aortic dissection is the most common aortic catastrophe, with an incidence estimated at 5 to 30 per 1 million people per year, amounting to nearly 10,000 cases per year in the United States.1–4
The diagnosis of acute aortic dissection has many potential pitfalls.2,3 Aortic dissection may mimic other more common conditions, such as coronary ischemia, pleurisy, heart failure, stroke, and acute abdominal illness. Because acute aortic dissection may be rapidly fatal, one must maintain a high index of suspicion.2,3 Prompt diagnosis and emergency treatment are critical.
WHAT CAUSES AORTIC DISSECTION?
One hypothesis is that acute aortic dissection is caused by a primary tear in the aortic intima, with blood from the aortic lumen penetrating into the diseased media leading to dissection and creating a true and false lumen.2 Another is that rupture of the vasa vasorum leads to hemorrhage in the aortic wall with subsequent intimal disruption, creating the intimal tear and aortic dissection.
Once a dissection starts, pulsatile flow of blood within the aortic wall causes it to extend. The dissection flap may be localized, but it often spirals the entire length of the aorta. Distention of the false lumen with blood may cause the intimal flap to compress the true lumen and potentially lead to malperfusion syndromes.
CLASSIFIED ACCORDING TO LOCATION
It is important to recognize the location of the dissection, as the prognosis and treatment depend on whether the ascending aorta is involved.2,3 For classification purposes, the ascending aorta is the portion proximal to the brachiocephalic artery, while the descending aorta is the portion distal to the left subclavian artery.3
The DeBakey classification defines a type I aortic dissection as one that begins in the ascending aorta and extends at least to the aortic arch or beyond. Type II dissections involve the ascending aorta only, while type III dissections begin in the descending aorta, most often just distal to the left subclavian artery.
The Stanford classification scheme divides dissections into type A and type B. Type A dissections involve the ascending aorta, while type B dissections do not involve the ascending aorta.
Which classification scheme is used is not important. However, identifying patients with dissection of the ascending aorta (DeBakey type I or type II or Stanford type A) is critical, as emergency cardiac surgery is recommended for this type of dissection.2,3 For the purposes of this paper, the Stanford classification scheme will be used.
Dissection that involves the ascending aorta most commonly occurs in people ages 50 to 60, whereas acute dissection of the descending aorta typically occurs in people 10 years older.1,2
An acute aortic dissection is one that has occurred within 2 weeks of symptom onset. A chronic dissection is one that occurred more than 2 weeks after symptoms began.
DISEASES AND CONDITIONS ASSOCIATED WITH AORTIC DISSECTION
Hypertension and disorders leading to disruption of the normal structure and function of the aortic wall. About 75% of patients with acute aortic dissection have underlying hypertension.1–3
Cystic medial degeneration is a common pathologic feature in many cases of aortic dissection.
Cocaine use and intense weight-lifting increase the shear stresses on the aorta.2,3
Inflammatory aortic diseases such as giant cell arteritis.
Pregnancy can be complicated by aortic dissection, usually in the setting of an underlying aortopathy.5
Iatrogenic aortic dissection accounts for about 4% of cases, as a result of cardiac surgery, catheterization, stenting, or use of an intra-aortic balloon pump.1
Aortic aneurysm. Patients with thoracic aortic aneurysm are at higher risk of aortic dissection, and the larger the aortic diameter, the higher the risk.2,3,6 In the International Registry of Acute Aortic Dissection (IRAD), the average size of the aorta was about 5.3 cm at the time of acute dissection. Importantly, about 40% of acute dissections of the ascending aorta occur in patients with ascending aortic diameters less than 5.0 cm.7,8
Thus, many factors are associated with acute dissection, and specific reasons leading to an individual’s susceptibility to sudden dissection are poorly understood.
CLINICAL FEATURES OF ACUTE AORTIC DISSECTION
Because the symptoms of acute dissection may mimic other, more common conditions, one of the most important factors in the diagnosis of aortic dissection is a high clinical suspicion.1–3
What is the pretest risk of disease?
Recently, the American College of Cardiology (ACC) and the American Heart Association (AHA) released joint guidelines on thoracic aortic disease.3 These guidelines provide an approach to patients who have complaints that may represent acute thoracic aortic dissection, the intent being to establish a pretest risk of disease to be used to guide decision-making.3
The focused evaluation includes specific questions about underlying conditions, symptoms, and findings on examination that may greatly increase the likelihood of acute dissection. These include:
- High-risk conditions and historical features associated with aortic dissection, such as Marfan syndrome and other genetic disorders (Table 2), bicuspid aortic valve, family history of thoracic aortic aneurysm or dissection, known thoracic aortic aneurysm, and recent aortic manipulation
- Pain in the chest, back, or abdomen with high-risk features (eg, abrupt onset, severe intensity, or a ripping or tearing quality)
- High-risk findings on examination (eg, pulse deficits, new aortic regurgitation, hypotension, shock, or systolic blood pressure differences).
Using this information, expedited aortic imaging and treatment algorithms have been devised to improve the diagnosis.3
Using the IRAD database of more than 2,500 acute dissections, the diagnostic algorithm proposed in the ACC/AHA guidelines was shown to be highly sensitive (about 95%) for detecting acute aortic dissection.4 In addition, using this score may expedite evaluation by classifying certain patients as being at high risk of acute dissection.3,4
Important to recognize is that almost two-thirds of patients who suffered dissection in this large database did not have one of the “high-risk conditions” associated with dissection.4 Additionally, the specificity of the ACC/AHA algorithm is unknown, and further testing is necessary.4
Acute onset of severe pain
More than 90% of acute dissections present with acute pain in the chest or the back, or both.1–3 The pain is usually severe, of sudden onset, and often described as sharp or, occasionally, tearing, ripping, or stabbing. The pain usually differs from that of coronary ischemia, being most severe at its onset as opposed to the less intense, crescendo-like pain of angina or myocardial infarction. The pain may migrate as the dissection progresses along the length of the aorta or to branch vessels. It may abate, leading to a false sense of security in the patient and the physician.3 “Painless” dissection occurs in a minority, usually in those with syncope, neurologic symptoms, or heart failure.1–3
The patient with acute dissection may be anxious and may feel a sense of doom.
Acute heart failure, related to severe aortic regurgitation, may be a predominant symptom in dissection of the ascending aorta.
Syncope may occur as a result of aortic rupture, hemopericardium with cardiac tamponade, or acute neurologic complications.
Vascular insufficiency may occur in any branch vessel, leading to clinical syndromes that include acute myocardial infarction, stroke, paraplegia, paraparesis, mesenteric ischemia, and limb ischemia.
PHYSICAL FINDINGS CAN VARY WIDELY
Findings on physical examination in acute aortic dissection vary widely depending on underlying conditions and on the specific complications of the dissection.
Although the classic presentation is acute, severe pain in the chest or back in a severely hypertensive patient with aortic regurgitation and pulse deficits, most patients do not have all these characteristics.4 Most patients with type B dissection are hypertensive on presentation, but many with type A dissection present with normal blood pressure or hypotension.1 Pulse deficits (unequal or absent pulses) are reported in 10% to 30% of acute dissections and may be intermittent as the dynamic movement of the dissection flap interferes with branch vessel perfusion.1–3
- Aortic leaflet prolapse or distortion of the leaflet alignment
- Malcoaptation of the aortic leaflets from dilation of the aortic root and annulus
- Prolapse of the intimal flap across the aortic valve, interfering with valve function
- Preexisting aortic regurgitation from underlying aortic root aneurysm or primary aortic valve disease (such as a bicuspid aortic valve).
Neurologic manifestations are most common in dissection of the ascending aorta and are particularly important to recognize, as they may dominate the clinical presentation and lead to delay in the diagnosis of dissection.2,3 Neurologic syndromes include:
- Persistent or transient ischemic stroke
- Spinal cord ischemia
- Ischemic neuropathy
- Hypoxic encephalopathy.
These manifestations are related to malperfusion to branches supplying the brain, spinal cord, or peripheral nerves.9
Syncope is relatively common in aortic dissection and may be related to acute hypotension caused by cardiac tamponade or aortic rupture, cerebral vessel obstruction, or activation of cerebral baroreceptors.2,9 It is important to consider aortic dissection in the differential diagnosis in cases of unexplained syncope.3
Aortic dissections may extend into the abdominal aorta, leading to vascular complications involving one or more branch vessels.10 The renal artery is involved in at least 5% to 10% of cases and may lead to renal ischemia, infarction, renal insufficiency, or refractory hypertension.2Mesenteric ischemia or infarction occurs in about 5% of dissections, may be difficult to diagnose, and is particularly dangerous.2,8 Aortic dissection may extend into the iliac arteries and may cause acute lower extremity ischemia.
Acute myocardial infarction due to involvement of the dissection flap causing malperfusion of a coronary artery occurs in 1% to 7% of acute type A aortic dissections.1–3 The right coronary artery (Figure 2) is most commonly involved, leading to acute inferior myocardial infarction. Acute myocardial ischemia and infarction in the setting of dissection may lead to a delay in the diagnosis of dissection and to bleeding complications from antiplatelet and anticoagulant drugs given to treat the acute coronary syndrome.
Cardiac tamponade, occurring in about 10% of acute type A dissections, portends a higher risk of death.2,3
Additional clinical features of aortic dissection include a left-sided pleural effusion, usually related to an inflammatory response. An acute hemothorax may occur from rupture or leaking of a descending aortic dissection.
FINDINGS ON RADIOGRAPHY AND ELECTROCARDIOGRAPHY
Electrocardiography usually has normal or nonspecific findings, unless acute myocardial infarction complicates the dissection.
D-DIMER LEVELS
Biomarkers for the diagnosis of acute aortic dissection are of great interest.
D-dimer levels rise in acute aortic dissection as they do in pulmonary embolism.11 A D-dimer level greater than 1,600 ng/mL within the first 6 hours has a very high positive likelihood ratio for dissection, so this test may be useful in identifying patients with a high probability for dissection. In the first 24 hours after symptom onset, a D-dimer level of less than 500 ng/mL has a negative predictive value of 95%. Thus, elevations in D-dimer may help decide which imaging to perform in a patient presenting with chest pain or suspicion of dissection.11
However, D-dimer levels may not be elevated in dissection variants, such as aortic intramural hematoma or penetrating aortic ulcer. Additionally, once 24 hours have elapsed since the dissection started, D-dimer levels may no longer be elevated. The current ACC/AHA guidelines on thoracic aortic disease concluded that the D-dimer level cannot be used to rule out aortic dissection in high-risk individuals.3
Additional studies may clarify the appropriate role of the D-dimer assay in diagnosing aortic dissection.
DEFINITIVE IMAGING STUDIES: CT, MRI, TEE
Contrast-enhanced computed tomography (CT), magnetic resonance imaging (MRI), and transesophageal echocardiography (TEE) all have very high sensitivity and specificity for the diagnosis of aortic dissection.2,3 The choice of imaging study often depends on the availability of these studies, with CT and TEE being the most commonly performed initial studies.
MRI is outstanding for detecting and following aortic dissection, but it is usually not the initial study performed because of the time required for image acquisition and because it is generally not available on an emergency basis.
While transthoracic echocardiography (TTE) can detect aortic dissection, its sensitivity is much lower than that of other imaging tests.2,3 Therefore, negative findings on TTE do not exclude aortic dissection.
MANAGEMENT OF AORTIC DISSECTION
When acute aortic dissection is diagnosed, multidisciplinary evaluation and treatment are necessary. Time is of the essence, as the death rate in acute dissection may be as high as 1% per hour during the first 24 hours.1–3 All patients with acute aortic dissection, whether type A or type B, should be transferred to a tertiary care center with a staff experienced in managing aortic dissection and its complications.3 Emergency surgery is recommended for type A aortic dissection, whereas type B dissection is generally treated medically unless complications occur.2,3
The cornerstone of drug therapy is the prompt reduction in blood pressure with a beta-blocker to reduce shear stresses on the aorta. Intravenous agents such as esmolol (Brevibloc) or labetalol (Normodyne) are usually chosen. Sodium nitroprusside may be added to beta-blocker therapy for rapid blood pressure control in appropriate patients. The patient may require multiple antihypertensive medications. If hypertension is refractory, one must consider renal artery hypertension due to the dissection causing renal malperfusion.2 Acute pain may also worsen hypertension, and appropriate analgesia should be used.
Definitive therapy in acute dissection
Patients with acute type A dissection require emergency surgery,2,3 as they are at risk for life-threatening complications including cardiac tamponade from hemopericardium, aortic rupture, stroke, visceral ischemia, and heart failure due to severe aortic regurgitation. When aortic regurgitation complicates acute type A dissection, some patients are adequately treated by resuspension of the aortic valve leaflets, while others require valve-sparing root replacement or prosthetic aortic valve replacement.
Surgical therapy is associated with a survival benefit compared with medical therapy in acute type A dissection.1 The 14-day mortality rate for acute type A dissection treated surgically is about 25%.1 Patients with high-risk features such as heart failure, shock, tamponade, and mesenteric ischemia have a worse prognosis compared with those without these features.2,12,13
Acute type B aortic dissection carries a lower rate of death than type A dissection.1–3 In the IRAD cohort, the early mortality rate in those with type B dissection treated medically was about 10%.1 However, when complications such as malperfusion, shock, or requirement for surgery occur in type B dissection, the mortality rate is much higher,2,14 with rates of 25% to 50% reported.2
Thus, initial medical therapy is the preferred approach to acute type B dissection, and surgery or endovascular therapy is reserved for patients with acute complications.2,3 Typical indications for surgery or endovascular therapy in type B dissection include visceral or limb ischemia, aortic rupture, refractory pain, and aneurysmal dilation (Table 3).2
Endovascular therapy in aortic dissection
The high mortality rate with open surgery in acute type B dissection has spurred tremendous interest in endovascular treatments for complications involving the descending aorta and branch vessels.2
Fenestration of the aorta and stenting of branch vessels were the earliest techniques used in complicated type B dissection. By fenestrating (ie, opening) the intimal flap, blood can flow from the false lumen into the true lumen, decompressing the distended false lumen.
Endovascular stenting is used for acute aortic rupture, for malperfusion syndromes, and for rapidly enlarging false lumens. Endovascular grafts may cover the area of a primary intimal tear and thus eliminate the flow into the false channel and promote false-lumen thrombosis. Many patients with complicated type B dissection are treated with a hybrid approach, in which one segment of the aorta, such as the aortic arch, is treated surgically, while the descending aorta receives an endovascular graft.2
Patients with a type B dissection treated medically are at risk for late complications, including aneurysmal enlargement and subsequent aortic rupture. The Investigation of Stent Grafts in Aortic Dissection (INSTEAD) trial included 140 patients with uncomplicated type B dissection and compared drug therapy with endovascular stent grafting.15 After 2 years of follow-up, there was no difference in the rate of death between the two treatment groups. Patients receiving endovascular grafts had a higher rate of false-lumen thrombosis.
More studies are under way to examine the role of endovascular therapy in uncomplicated type B dissection.
AORTIC DISSECTION VARIANTS
Aortic intramural hematoma
Aortic intramural hematoma is a form of acute aortic syndrome in which a hematoma develops in the aortic media and no intimal flap is visualized either by imaging or at surgery.2,3,16 It is important to recognize this clinical entity in a patient presenting with acute chest or back pain, as sometimes it is mistaken for a “thrombus in a nonaneurysmal aorta.” Intramural hematoma accounts for 5% to 25% of acute aortic syndromes, depending on the study population (it is more common in Asian studies).2,3,17 It may present with symptoms similar to classic aortic dissection and is classified as type A or type B, depending on whether the ascending aorta is involved.
Patients with an intramural hematoma may progress to having complications such as hemopericardium, classic aortic dissection, aortic rupture, or aneurysmal dilation.2,3 However, many cases of type B aortic intramural hematoma result in complete resorption of the hematoma over time. In general, like classic aortic dissection, type A intramural hematoma is treated with emergency surgery and type B with initial medical therapy.2,3
There are reports from Southeast Asia of successful initial medical therapy for type A intramural hematoma, with surgery used for acute complications.18 In the Western literature, improved outcomes are reported with initial surgical therapy.17 Given the unpredictable nature of type A intramural hematoma, most experts recommend surgical therapy for appropriate candidates with acute type A intramural hematoma.2,3,19
Penetrating atherosclerotic ulcer of the aorta
Penetrating atherosclerotic ulcer of the aorta, another acute aortic syndrome, results from acute penetration of an atherosclerotic aortic lesion through the internal elastic lamina into the media.2,3,20 It is often associated with bleeding into the media, or intramural hematoma. While the ulcer may be found incidentally on imaging studies, especially in patients with severe aortic atherosclerosis, the typical presentation is acute, severe chest or back pain. It occurs most often in the descending aorta and the abdominal aorta.
Penetrating atherosclerotic ulcer may lead to pseudoaneurysm formation, focal aortic dissection, aortic rupture, or late aortic aneurysm.2
LONG-TERM MANAGEMENT AFTER AORTIC DISSECTION
After hospital discharge, patients with aortic dissection require lifelong management. This includes blood pressure control, lifestyle modification, serial imaging of the aorta with CT or MRI, patient education about the condition, and, when appropriate, screening of family members for aortic disease.5,21
Reported survival rates after hospitalization for type A dissection are 52% to 94% at 1 year and 45% to 88% at 5 years.2,22 The 10-year actuarial survival rate for those with acute dissection who survive the acute hospitalization is reported as 30% to 60%. Long-term survival rates after acute type B dissection have been reported at 56% to 92% at 1 year and 48% to 82% at 5 years.23 Survival rates depend on many factors, including the underlying condition, the age of the patient, and comorbidities.
It is important to treat hypertension after aortic dissection, with a goal blood pressure of 120/80 mm Hg or less for most patients. Older studies found higher mortality rates with poorly controlled hypertension. Beta-blockers are the drugs of first choice. Even in the absence of hypertension, long-term beta-blocker therapy should be used to lessen the aortic stress and force of ventricular contraction.
Genetic evaluation
Genetically triggered causes of aortic dissection should be considered. In many circumstances, referral to a medical geneticist or other practitioner knowledgeable in these conditions is important when these disorders are being evaluated (Table 2).
Many of these disorders have an autosomal dominant inheritance, and the patient should be asked about a family history of aortic disease, aortic dissection, or unexplained sudden death. Features of Marfan syndrome, Loeys-Dietz syndrome, and familial thoracic aortic aneurysm syndromes should be sought. Through comprehensive family studies, it is now recognized that up to 20% of patients with thoracic aortic disease (such as aneurysm or dissection) have another first-degree relative with thoracic aortic disease.2,3,24 Thus, first-degree relatives of patients with aortic aneurysm or dissection should be screened for thoracic aortic aneurysm disease.
Research into molecular genetics is providing a better understanding of the genetics of aortic dissection.3 New mutations associated with aortic dissection are being discovered in signaling pathways as well as elements critical for the integrity of the vascular wall.2,3 However, at present, most patients with aortic dissection will not have a specific identifiable genetic defect.
Not only does genetic testing enable the accurate diagnosis of the affected individual, but also treatments are often based on this diagnosis.3 Importantly, the identification of a specific gene mutation (ie, in TGFBR1 or 2, FBN1, ACTA2, MYH11, and COL3A1) in an affected individual has the potential to identify other family members at risk.3
Follow-up imaging
It is important to continue to image the aorta after aortic dissection. Patients may develop progressive dilation or aneurysm formation of the dissected aorta, pseudoaneurysm formation after repair, or recurrent dissection. Many patients require additional surgery on the aorta because of late aneurysm formation.
CT or MRI is usually performed at least every 6 months in the first 2 years after dissection and at least annually thereafter. More centers are choosing MRI for long-term follow-up to avoid the repeated radiation exposure with serial CT.
Patient education
Besides receiving medical therapy and undergoing imaging, patients with aortic dissection should be educated about this condition.5,21 The patient should be aware of symptoms suggesting dissection and should be instructed to seek attention for any concerning symptoms.
Lifestyle modifications are also important. The patient should be educated about safe activity levels and to avoid heavy isometric exercise, such as weight-lifting. Some patients will have to cease their current occupation because of activity restrictions.
- Hagan PG, Nienaber CA, Isselbacher EM, et al. International Registry of Acute Aortic Dissection (IRAD): new insights from an old disease. JAMA 2000; 283:897–903.
- Braverman AC, Thompson R, Sanchez L. Diseases of the aorta. In:Bonow RO, Mann DL, Zipes DP, Libby P. Braunwald’s Heart Disease, 9th Edition. Elsevier, Philadelphia, 2011.
- Hiratzka LF, Bakris GL, Beckman JA, et al. American College of Cardiology Foundation/American Heart Association Task Force on Practice Guidelines; American Association for Thoracic Surgery; American College of Radiology; American Stroke Association; Society of Cardiovascular Anesthesiologists; Society for Cardiovascular Angiography and Interventions; Society of Interventional Radiology; Society of Thoracic Surgeons; Society for Vascular Medicine. Guidelines for the management of patients with thoracic aortic disease. Circulation 2010; 121:e266–e369.
- Rogers AM, Herman LK, Booher AM, et al. Sensitivity of the aortic dissection detection risk score, a novel guideline-based tool for identification of acute aortic dissection at initial presentation. Results from the International Registry of Acute Aortic Dissection. Circulation 2011; 123:2213–2228.
- Braverman AC. Acute aortic dissection: clinician update. Circulation 2010; 122:184–188.
- Davies RR, Gallo A, Coady MA, et al. Novel measurement of relative aortic size predicts rupture of thoracic aortic aneurysms. Ann Thorac Surg 2006; 81:169–177.
- Pape LA, Tsai TT, Isselbacher EM, et al. Aortic diameter >5.5 cm is not a good predictor of type A aortic dissection. Observations from the International Registry of Acute Aortic Dissection. Circulation 2007; 116:1120–1127.
- Parish LM, Gorman JH, Kahn S, et al. Aortic size in acute type A dissection: implications for preventative ascending aortic replacement. Eur J Cardiothorac Surg 2009; 35:941–945.
- Gaul C, Dietrich W, Erbguth FJ. Neurological symptoms in acute aortic dissection: a challenge for neurologists. Cerebrovasc Dis 2008; 26:1–8.
- Upchurch GR, Nienaber C, Fattori R, et al Acute aortic dissection presenting with primarily abdominal pain: a rare manifestation of a deadly disease. Ann Vasc Surg 2005; 19:367–373.
- Suzuki T, Distante A, Zizza A, et al. Diagnosis of acute aortic dissection by D-dimer: the International Registry of Acute Aortic Dissection substudy on biomarkers (IRAD-bio) experience. Circulation 2009; 119:2702–2707.
- Tsai TT, Trimarchi S, Neinaber CA. Acute aortic dissection: perspectives from the International Registry of Acute Aortic Dissection (IRAD). Eur J Vasc Endovasc Surg 2009; 37:149–159.
- Trimarchi S, Nienaber CA, Rampoldi V, et al. Contemporary results of surgery in acute type A aortic dissection: the International Registry of Acute Aortic Dissection experience. J Thorac Cardiovasc Surg 2005; 129:112–122.
- Trimarchi S, Nienaber CA, Rampoldi V, et al. Role and results of surgery in acute type B aortic dissection. Insights from the International Registry of Acute Aortic Dissection (IRAD). Circulation 2006; 114(suppl 1):I-357–I-364.
- Nienaber CA, Rousseau H, Eggbrecht H, et al. Randomized comparison of strategies for type B aortic dissection. The Investigation of STEnt grafts in Aortic Dissection (INSTEAD) Trial. Circulation 2009; 120:2519–2528.
- Evangelista A, Mukherjee D, Mehta RH, et al. Acute intramural hematoma of the aorta. Circulation 2005; 111:1063–1070.
- Pelzel JM, Braverman AC, Hirsch AT, Harris KM. International heterogeneity in diagnostic frequency and clinical outcomes of ascending aortic intramural hematoma. J Am Soc Echo 2007; 20:1260–1268.
- Song JK, Yim JH, Ahn JM, et al. Outcomes of patients with acute type A aortic intramural hematoma. Circulation 2009; 120:2046–2052.
- Harris KM, Pelzel JM, Braverman AC. Letter regarding article, “Outcomes of patients with acute type A intramural hematoma.” Circulation 2010; 121:e456.
- Sundt TM. Intramural hematoma and penetrating atherosclerotic ulcer of the aorta. Ann Thorac Surg 2007; 83:S835–S841.
- Juang D, Braverman A, Eagle K. Aortic dissection. Circulation 2008; 118:e507–e510.
- Tsai TT, Evangelista A, Nienaber CA, et al. Long-term survival in patients presenting with type A acute aortic dissection. Insights from the international registry of acute aortic dissection. Circulation 2006; 114(suppl I):I-350–I-356.
- Tsai TT, Fattori R, Trimarchi S, et al. Long-term survival in patients presenting with type B acute aortic dissection. Insights from the international registry of acute aortic dissection. Circulation 2006; 114:2226–2231.
- Albornoz G, Coady MA, Roberts M, et al. Familial thoracic aortic aneurysms and dissections: incidence, modes of inheritance, and phenotypic patterns. Ann Thorac Surg 2006; 82:1400–1405.
KEY POINTS
- Aortic surgery is the treatment of choice for dissection of the ascending aorta, whereas dissection of the descending aorta is initially managed medically.
- Look for an underlying genetic predisposition to aortic disease and, in many instances, screen first-degree relatives for aortic disease.
- Long-term management requires serial imaging of the aorta, blood pressure control, and, for many, future aortic procedures.
- Measuring the D-dimer levels may help in decision-making for appropriate imaging in patients presenting with chest pain, as an elevated level raises the suspicion of dissection. However, more study of this and other biomarkers is needed.
- Advances in molecular genetics and the biology of the aortic wall promise to improve the diagnosis and prognosis of aortic disease.
Study Seeks Predictors of Risk for PTSD
Guidelines for Thyroid Nodule Evaluation
Adolescent Androgenic Alopecia
Erratum (2007;80:113-120)
Is there a link between aripiprazole and treatment-emergent psychosis?
Discuss this article at www.facebook.com/CurrentPsychiatry
• Aripiprazole may interact preferentially with distinct conformations of the D2 receptor, leading to a spectrum of pharmacologic effects, including acting as a full agonist, partial agonist, or antagonist.
• Clinical predictors of aripiprazole-associated worsening of psychosis include low baseline level of psychopathology and previous treatment with high-dose antipsychotics.
• Rapid transition from a medication with significant anticholinergic properties to 1 without these properties may result in symptoms of activation, including restlessness, insomnia, and anxiety, which can be mistaken for worsening psychosis.
• Akathisia, a common adverse effect of aripiprazole, may masquerade as treatment-emergent worsening of psychotic symptoms.
Mr. N, age 29, presents to the emergency department at the urging of his family because of poor self-care, bizarre behavior, and disturbed sleep. He first experienced psychiatric symptoms 10 years ago after his mother died. He became dysphoric and paranoid, displaying bizarre responses and behaviors with poor self-care and a gradual functional decline. He has been taking sertraline, 100 mg/d, for 10 years.
Upon arrival at the hospital’s inpatient unit, Mr. N is unkempt, oddly related, and paranoid. His affect is constricted. Mr. N displays thought blocking and possibly is responding to internal stimuli. Sertraline is continued and haloperidol, 1 mg/d, is initiated. For the next 2 weeks, Mr. N continues to be oddly related, irritable, and paranoid, and experiences disturbed sleep and thought blocking. After an episode of impulsive aggression, the treatment team initiates aripiprazole, which is titrated to 30 mg/d for 1 week. Mr. N’s clinical status worsens; he is menacing toward other patients and his thinking is more disorganized, with loose associations and ideas of reference. He requires 4 injections of IM haloperidol, 5 mg, and several visits to the seclusion room over the next week. Haloperidol is increased to 30 mg/d over the next 10 days, then aripiprazole is discontinued because of a putative drug interaction with haloperidol. Following the medication changes Mr. N demonstrates better behavioral control, but still is grossly psychotic. While awaiting transfer to a state hospital, Mr. N receives a trial of olanzapine, 20 to 40 mg/d, for 2 weeks without significant benefit.
Several clinical trials demonstrate a significant reduction in intensity of psychotic symptoms with aripiprazole, which has a unique mechanism of action.1 However, since its FDA approval in 2002, several case reports have described treatment-emergent psychotic symptoms associated with aripiprazole initiation. Over the past 40 years, reports of worsening psychosis associated with antipsychotics have been limited to patients with schizophrenia who were taking high dosages or who had high plasma concentrations, when anticholinergic delirium may have explained increased psychotic symptoms.2-4
How can a drug effectively treat psychotic symptoms and occasionally worsen them? In this article, we discuss the relevant pharmacology and clinical literature on aripiprazole and try to make sense of this apparent paradox.
Unique pharmacologic profile
Antipsychotics have been reported to be either neutral antagonists or inverse agonists at the D2 receptor, based on in vitro data.5 Aripiprazole and its main metabolite, dehydroaripiprazole, originally were described as partial agonists at D2 dopamine receptors.6,7 However, it appears aripiprazole’s pharmacologic action is better explained by the concept of functional selectivity. Aripiprazole may interact preferentially with distinct conformations of the D2 receptor, leading to a spectrum of pharmacologic effects, including acting as a full agonist, partial agonist, or antagonistic.5
Researchers have hypothesized that the pathophysiology of schizophrenia may, in part, be caused by dysfunction of mesocorticolimbic dopaminergic neurons characterized by an enhanced sensitivity of postsynaptic D2 receptors and increased sensitivity to dopaminergic drugs.8,9 In addition, chronic treatment with a D2 receptor antagonist is associated with increases in postsynaptic dopamine receptor density (ie, an increase in receptor reserve).10,11 Upregulation of D2 receptors may explain several features seen in patients chronically treated with antipsychotics, including tardive dyskinesia12 and rapid psychotic relapse after discontinuing an antipsychotic (supersensitivity psychosis).13 Because chronic antipsychotic treatment leads to high postsynaptic receptor reserve, aripiprazole initiation may produce overactivation of D2 receptors, which might worsen a patient’s condition.14 In vitro data15-18 and clinical observations indicate that aripiprazole has intrinsic efficacy at D2 receptors, as do clinical observations, such as:
- its propensity to reduce serum prolactin19
- a decreased likelihood of producing extrapyramidal side effects despite >80% occupancy of D2 receptors6
- case reports documenting aripiprazole-associated mania,20 improvement of risperidone-associated cognitive impairment,21 and pathologic gambling.22
Emergence or worsening of psychotic symptoms or a marginal antipsychotic effect may occur if aripiprazole is indeed a postsynaptic D2 receptor agonist. An individual patient’s outcome likely would depend on his or her sensitivity to psychosis and concurrent or previous exposure to a D2 receptor antagonist. For example, stimulation of postsynaptic D2 receptors may be further augmented if the dosage of the previous antipsychotic was reduced or withdrawn before initiating aripiprazole because additional receptors would be available for interaction with aripiprazole.
Case reports
A literature review revealed 23 reports of treatment-emergent psychosis associated with aripiprazole initiation (Table). The mean age of the patients was 47 (range: 17 to 69) and 57% were men. Most patients (87%) were diagnosed with a schizophrenia-spectrum illness before aripiprazole initiation. Most (57%) had mild, stable, or no psychotic symptoms before aripiprazole initiation. Most were receiving relatively high doses of antipsychotics (average chlorpromazine equivalents [CPZE]: 648 mg/d) before aripiprazole initiation. This medication was either decreased or discontinued in 70% of patients.
Emergence or worsening of psychotic symptoms included agitation, aggressive behavior, and increased psychomotor activity. However, akathisia evaluation was described in only 2 reports: 1 author identified akathisia symptoms, but attributed them to a concomitant antipsychotic (fluphenazine)23 and the other report specifically excluded the possibility of akathisia.24 Two systematic studies have attempted to establish risk factors for aripiprazole-associated worsening psychosis (Box).14,25
In our literature review, the mean final dose of aripiprazole was 21.5 mg/d (range: 2 to 60 mg/d). In the cases describing subsequent treatment, all but 1 patient were switched to another antipsychotic, including 2 whose psychotic symptoms stabilized with continuation of aripiprazole and addition of a second antipsychotic. Interestingly, in the case reported by Adan-Manes et al,26 initial treatment with aripiprazole monotherapy was efficacious, but a subsequent trial of adjunctive aripiprazole resulted in worsening psychosis.
Table
Case reports: Treatment-emergent psychosis associated with aripiprazole
| Study | Age, sex | Diagnosis | Before aripiprazole initiation | Pre-aripiprazole treatment | Aripiprazole dose | Concomitant psychotropic treatment | Subsequent treatment |
|---|---|---|---|---|---|---|---|
| Chiu et al, 2011a | 39, M | Schizophrenia | Psychiatrically stable, tardive dystonia | Clozapine, 300 mg/d | 10 mg/d | Valproic acid, 1,000 mg/d, clonazepam, 2 mg/d, mephenoxalone, 800 mg/d | Clozapine |
| Ekinci et al, 2010b | 17, M | ADHD | Inattention and impulsive aggression | Tapered and discontinued risperidone, 2.5 mg/d | 5 mg/d | Methylphenidate, 54 mg/d | Risperidone, 2 mg/d, methylphenidate, 36 mg/d |
| Selvaraj et al, 2010c | 49, F | Chronic depression | Depressive symptoms, suicidal ideation | None stated | 2 mg/d | Duloxetine, 80 mg/d, clonazepam, 2 mg/d | Duloxetine, 120 mg/d |
| Adan-Manes et al, 2009d | 23, M | Schizophrenia | No psychotic symptoms | Abrupt decrease of amisulpride dose from 800 mg/d to 400 mg/d | 20 mg/d | Biperiden, 4 mg/d | Amisulpride, 800 mg/d |
| Cho et al, 2009e | 45, F | Schizophrenia | Persistent psychotic symptoms, new onset diabetes with acute ketoacidosis | Haloperidol, 20 mg/d, abrupt clozapine discontinuation | 15 mg/d | Valproic acid, nortriptyline | Molindone, 150 mg/d |
| Ahuja et al, 2007f | 35, F | Schizoaffective disorder | Stable before medication change | Tapered amisulpride, 400 mg/d, over 6 weeks | 15 mg/d | None | Amisulpride, 600 mg/d |
| Lea et al, 2007g | 57, M | Schizophrenia | Persistent psychotic symptoms, treatment resistance, recent recovery from NMS | Discontinued ziprasidone, 200 mg/d | 30 mg/d | Lorazepam, 2 mg/d, amantadine, 100 mg, sertraline, 50 mg/d | Clozapine |
| Lea et al, 2007g | 49, M | Schizoaffective disorder | Delusions, verbal aggression, substance abuse, HCV | Decreased quetiapine dose from 800 mg/d to 400 mg/d | 15 mg/d | Divalproex, 1,000 mg/d, fluvoxamine, 200 mg/d, clonazepam, 2 mg/d | Lithium, quetiapine, 500 mg/d, haloperidol, 2 mg/d |
| Lea et al, 2007g | 60, M | Schizophrenia | Delusions, labile mood, aggression | Risperidone, 3 mg/d, interruption of fluphenazine, 75 mg/d | 20 mg/d | Divalproex, 4,500 mg/d, benztropine, 3 mg/d | Not discussed |
| Raja, 2007h | 30, M | Schizoaffective disorder | Negative symptoms, otherwise stable, recent citalopram discontinuation | Discontinued amisulpride, 800 mg/d over 2 weeks | 30 mg/d | Lithium | Amisulpride, 500 mg/d |
| Raja, 2007h | 69, F | Bipolar disorder | History of multiple relapses; presented with tremor, akathisia, weight gain | Discontinued risperidone, 2 mg/d, over 2 weeks | 15 mg/d | Lithium | Risperidone, 4 mg |
| Raja, 2007h | 59, F | Schizophrenia | Negative symptoms, otherwise stable | Reduced risperidone dosage from 5 mg/d to 4 mg/d | 7.5 mg/d | None | Risperidone, 5 mg/d |
| Thone, 2007i | 31, M | Schizophrenia | Confusion, agitation, delusions worsened with aripiprazole dose increase | None | 60 mg/d | None | Aripiprazole dose reduction to 15 mg/d, olanzapine, 10 mg/d |
| Glick et al, 2006j | 55, F | Schizophrenia | Stable before medication change | Tapered and discontinued thioridazine, 600 mg/d, over 3 months | 30 mg/d | None | Chlorpromazine, 200 mg/d, aripiprazole, 30 mg/d |
| Glick et al, 2006j | 52, M | Schizophrenia | Negative symptoms | Decreased olanzapine dose from 30 mg/d to 20 mg/d | 30 mg/d | None | Olanzapine, 30 mg/d |
| Barnas et al, 2005k | 57, F | Schizoaffective disorder | Stable before medication change | Discontinued perphenazine, 8 mg/d | 30 mg/d | None | Quetiapine, 350 mg/d |
| DeQuardo, 2004l | 54, M | Schizophrenia | History of aggression, residual paranoia, severe EPS | Haloperidol, 200 mg/d | 15 mg/d | Benztropine | Haloperidol |
| DeQuardo, 2004l | 51, M | Schizophrenia | History of aggression, persistent psychotic symptoms, treatment resistance | Olanzapine, 60 mg/d | 10 mg/d | None | Olanzapine |
| Ramaswamy et al, 2004m | 43, F | Schizoaffective disorder | Psychiatrically stable, multiple medication changes, including substituting carbamazepine for valproic acid | Discontinued ziprasidone, 160 mg/d, discontinued quetiapine, 400 mg/d, over 2 weeks | 30 mg/d | Propranolol, 30 mg/d, l-thyroxine, .05 mg/d, carbamazepine, 600 mg/d | Not available |
| Ramaswawamy et al, 2004m | 57, F | Schizoaffective disorder | History of multiple hospitalizations, but stable before medication change | Decreased olanzapine dose from 20 mg/d to 15 mg/d | 30 mg/d | Valproic acid, 2,000 mg/d | Ziprasidone |
| Ramaswawamy et al, 2004m | 67, F | Schizophrenia | Remote hospitalizations, recent worsened psychosis | Decreased ziprasidone dose from 200 mg/d to 160 mg/d 2 months previously | 30 mg/d | Carbamazepine, 200 mg/d | Not discussed |
| Ramaswamy et al, 2004m | 46, M | Schizophrenia | Persistent delusions while receiving risperidone, TD | Risperidone, 3 mg/d | 15 mg/d | Valproic acid, 1,500 mg/d | Risperidone, 3 mg/d |
| Reeves et al, 2004n | 50, M | Schizoaffective disorder | Relatively stable with nonthreatening delusions, hallucinations | Quetiapine, 800 mg/d | 30 mg/d | Divalproex, 2,000 mg/d | Olanzapine, 20 mg/d |
| ADHD: attention-deficit/hyperactivity disorder; EPS: extrapyramidal symptoms; HCV: hepatitis C virus; NMS: neuroleptic malignant syndrome; TD: tardive dyskinesia Source: References a. Chiu YH, Chen CH, Lu ML. Worsening psychosis after adding aripiprazole to clozapine. Prog Neuropsychopharmacol Biol Psychiatry. 2011;35(1):291-292. b. Ekinci O, Sabuncuoglu O. Psychosis associated with switching from risperidone to aripiprazole in an adolescent on methylphenidate treatment. Prog Neuropsychopharmacol Biol Psychiatry. 2011;35(2):648-649. c. Selvaraj V, Ramaswamy S, Sharma A, et al. New-onset psychosis and emergence of suicidal ideation with aripiprazole. Am J Psychiatry. 2010;167(12):1535-1536. d. Adan-Manes J, Garcia-Parajua P. Aripiprazole in combination with other antipsychotic drugs may worsen psychosis. J Clin Pharm Ther. 2009;34(2):245-246. e. Cho DY, Lindenmayer JP. Aripiprazole-induced agitation after clozapine discontinuation: a case report. J Clin Psychiatry. 2009;70(1):141-143. f. Ahuja N, Lloyd AJ. Aripiprazole and worsening of psychosis: a case report. J Clin Psychiatry. 2007;68(5):805-806. g. Lea JW, Stoner SC, Lafollette J. Agitation associated with aripiprazole initiation. Pharmacotherapy. 2007;27(9):1339-1342. h. Raja M. Improvement or worsening of psychotic symptoms after treatment with low doses of aripiprazole. Int J Neuropsychopharmacol. 2007;10(1):107-110. i. Thone J. Worsened agitation and confusion in schizophrenia subsequent to high-dose aripiprazole. J Neuropsychiatry Clin Neurosci. 2007;19(4):481-482. j. Glick ID, Duggal V, Hodulik C. Aripiprazole as a dopamine partial agonist: positive and negative effects. J Clin Psychopharmacol. 2006;26(1):101-103. k. Barnas ME, Hussain N, Petrides G. Treatment-emergent psychosis with aripiprazole. J Clin Psychiatry. 2005;66(10):1339. l. DeQuardo JR. Worsened agitation with aripiprazole: adverse effect of dopamine partial agonism? J Clin Psychiatry. 2004;65(1):132-133. m. Ramaswamy S, Vijay D, William M, et al. Aripiprazole possibly worsens psychosis. Int Clin Psychopharmacol. 2004;19(1):45-48. n. Reeves RR, Mack JE. Worsening schizoaffective disorder with aripiprazole. Am J Psychiatry. 2004;161(7):1308. | |||||||
Takeuchi et al14 aimed to establish predictors of worsening psychosis in a naturalistic setting where patients slowly transitioned to aripiprazole from previous antipsychotic treatment. Patients were required to be on a stable dose of an antipsychotic before participating in the study. Aripiprazole was started at 12 mg/d for 2 weeks with flexible dosing from weeks 2 to 52. Previous antipsychotic therapy was reduced biweekly by 25%. The incidence of worsening psychopathology after aripiprazole initiation was higher in the group of patients who had previously received high-dose antipsychotic therapy (average chlorpromazine equivalents [CPZE]: 727 mg/d) compared with the group on low dosages (average CPZE: 382 mg/d). It is possible that previous high-dose antipsychotic therapy was indicative of more significant baseline psychopathology; however, the worsened group and stabilized group had similar baseline Clinical Global Impressions-Severity scores.
Pae et al25 aimed to find predictors of worsening psychosis with aripiprazole in patients whose previous antipsychotic therapy was immediately discontinued. They found lower baseline disease severity was associated with significant worsening during the first month of aripiprazole treatment.
Other potential explanations
Aripiprazole’s manufacturer reported the incidence of psychosis-related adverse events in an analysis of 9 randomized schizophrenia trials.27 The rates of psychosis-related adverse events ranged from 0.6% to 18%, but there was no apparent relationship to study design or method of transitioning to aripiprazole. Rates of psychosis-related adverse events were similar between aripiprazole and the control group (placebo in 3 studies, another antipsychotic in 2 studies).
Emergence or worsening of psychotic symptoms temporally associated with aripiprazole initiation does not necessarily imply causation. As in Mr. N’s case, it is not always possible to determine whether worsening psychosis is the natural disease course or a treatment effect. In addition, it is not possible to differentiate lack of efficacy from a true propensity for aripiprazole to worsen psychosis.
It also is conceivable discontinuation or dosage reduction of a previous antipsychotic would worsen psychotic symptoms or cause side effects. When significant changes in psychopathology or side effects develop during the transition from 1 antipsychotic to another, it is difficult to determine etiology. Specifically, rapid transition from a medication with significant anticholinergic and antihistaminic properties—such as quetiapine or olanzapine—to 1 without these properties—such as aripiprazole—may result in symptoms of activation, including restlessness, insomnia, and anxiety. Consequently, these symptoms could be mistaken for worsening psychosis.28 Only 1 patient in this series was reported to abruptly discontinue an antipsychotic with significant anticholinergic properties (clozapine) before initiating aripiprazole.24 Studies by Takeuchi et al14 and Pae et al25 did not report the relative baseline use of antipsychotic medication with anticholinergic properties.
In a pooled analysis of treatment-emergent adverse events in 5 randomized clinical trials of patients receiving aripiprazole for acute relapse of schizophrenia, the incidence of akathisia was 10%, although it is not clear if this is a dose-related adverse effect.29 Because akathisia may be confused for worsening psychosis,30 it is possible akathisia was mistakenly identified as worsening psychotic symptoms in Mr. N’s case, as well as several reports from our literature review.
Covert akathisia is unlikely to explain worsening psychopathology observed in all patients in our literature review because confusion of akathisia and worsening psychosis is not a widespread phenomenon. In a post hoc analysis of pooled safety data from aripiprazole trials, Kane et al31 did not find a correlation between presence of akathisia and aripiprazole efficacy as measured by the Positive and Negative Syndrome Scale (PANSS) total, PANSS positive, PANSS negative, Clinical Global Impressions-Severity, Clinical Global Impressions-Improvement, and percentage of responders. Pae et al25 also noted there was no correlation between scores on the Barnes Akathisia Rating Scale and worsening psychopathology in patients switched to aripiprazole.
An antagonist always is an antagonist and clinicians have appreciated this concept since the days of chlorpromazine. The activity of aripiprazole, however, is on a pharmacologic continuum between a neutral antagonist and full agonist and currently there is no way to precisely determine the level of D2 receptor agonist action in a patient.
Although it is interesting to speculate that aripiprazole’s D2 receptor agonist action may contribute to worsening psychosis,32-34 there are other plausible explanations to consider. Rapid transition from a drug with significant anticholinergic properties and aripiprazole-associated akathisia may contribute to worsening psychopathology in patients starting aripiprazole. Because covert side effects may be incorrectly identified as psychotic agitation, we cannot exclude this as a possible etiologic factor in Mr. N’s case as well as the cases in our literature review.
Related Resource
- Abilify [package insert]. Princeton, NJ: Bristol-Myers Squibb; 2011.
Drug Brand Names
- Amantadine • Symmetrel
- Aripiprazole • Abilify
- Benztropine • Cogentin
- Biperiden • Akineton
- Carbamazepine • Tegretol
- Chlorpromazine • Thorazine
- Clonazepam • Klonopin
- Clozapine • Clozaril
- Divalproex • Depakote
- Duloxetine • Cymbalta
- Fluphenazine • Permitil, Prolixin
- Fluvoxamine • Luvox
- Haloperidol • Haldol
- Lithium • Eskalith, Lithobid
- Lorazepam • Ativan
- Nortriptyline • Aventyl, Pamelor
- Methylphenidate • Concerta
- Molindone • Moban
- Olanzapine • Zyprexa
- Perphenazine • Trilafon
- Propranolol • Inderal
- Quetiapine • Seroquel
- Risperidone • Risperdal
- Sertraline • Zoloft
- Thioridazine • Mellaril
- Thyroxine • Synthroid
- Valproic acid • Depakene
- Ziprasidone • Geodon
Disclosure
The authors report no financial relationship with any company whose products are mentioned in this article or with manufacturers of competing products.
1. Citrome L. A review of aripiprazole in the treatment of patients with schizophrenia or bipolar I disorder. Neuropsychiatr Dis Treat. 2006;2(4):427-443.
2. Chong SA, Tan CH, Lee HS. Worsening of psychosis with clozapine and selective serotonin reuptake inhibitor combination: two case reports. J Clin Psychopharmacol. 1997;17(1):68-69.
3. Bowers MB Jr, Swigar ME. Psychotic patients who become worse on neuroleptics. J Clin Psychopharmacol. 1988;8(6):417-421.
4. Tornatore FL, Lee D, Sramek JJ. Psychotic exacerbation with haloperidol. Drug Intell Clin Pharm. 1981;15(3):209-213.
5. Beaulieu JM, Gainetdinov RR. The physiology signaling, and pharmacology of dopamine receptors. Pharmacol Rev. 2011;63(1):182-217.
6. Grunder G, Carlsson A, Wong DF. Mechanism of new antipsychotic medications: occupancy is not just antagonism. Arch Gen Psychiatry. 2003;60(10):974-977.
7. Wood MD, Scott C, Clarke K, et al. Aripiprazole and its human metabolite are partial agonists at the human dopamine D2 receptor, but the rodent metabolite displays antagonist properties. Eur J Pharmacol. 2006;546(1-3):88-94.
8. Seeman P, Weinshenker D, Quirion R, et al. Dopamine supersensitivity correlates with D2High states, implying many paths to psychosis. Proc Natl Acad Sci U S A. 2005;102(9):3513-3518.
9. Seeman P, Ko F, Jack E, et al. Consistent with dopamine supersensitivity, RGS9 expression is diminished in the amphetamine-treated animal model of schizophrenia and in postmortem schizophrenia brain. Synapse. 2007;61(5):303-309.
10. Burt DR, Creese I, Snyder SH. Antischizophrenic drugs: chronic treatment elevates dopamine receptor binding in brain. Science. 1977;196(4287):326-328.
11. Silvestri S, Seeman MV, Negrete JC, et al. Increased dopamine D2 receptor binding after long-term treatment with antipsychotics in humans: a clinical PET study. Psychopharmacology (Berl). 2000;152(2):174-180.
12. Sayers AC, Bürki HR, Ruch W, et al. Neuroleptic-induced hypersensitivity of striatal dopamine receptors in the rat as a model of tardive dyskinesias. Effects of clozapine, haloperidol, loxapine and chlorpromazine. Psychopharmacologia. 1975;41(2):97-104.
13. Moncrieff J. Does antipsychotic withdrawal provoke psychosis? Review of the literature on rapid onset psychosis (supersensitivity psychosis) and withdrawal-related relapse. Acta Psychiatr Scand. 2006;114(1):3-13.
14. Takeuchi H, Uchida H, Suzuki T, et al. Predictors of clinical worsening after a switch to aripiprazole in patients with schizophrenia: a 1-year naturalistic follow-up study. J Clin Psychopharmacol. 2009;29(4):394-395.
15. Shapiro DA, Renock S, Arrington E, et al. Aripiprazole, a novel atypical antipsychotic drug with a unique and robust pharmacology. Neuropsychopharmacology. 2003;28(8):1400-1411.
16. Urban JD, Vargas GA, von Zastrow M, et al. Aripiprazole has functionally selective actions at dopamine D2 receptor-mediated signaling pathways. Neuropsychopharmacology. 2007;32(1):67-77.
17. Klewe IV, Nielsen SM, Tarpo L, et al. Recruitment of beta-arrestin2 to the dopamine D2 receptor: Insights into anti-psychotic and anti-parkinsonian drug receptor signaling. Neuropharmacology. 2008;54(8):1215-1222.
18. Masri B, Salahpour A, Didriksen M, et al. Antagonism of dopamine D2 receptor/beta-arrestin 2 interaction is a common property of clinically effective antipsychotics. Proc Natl Acad Sci U S A. 2008;105(36):13656-13661.
19. Shim JC, Shin JG, Kelly DL, et al. Adjunctive treatment with a dopamine partial agonist, aripiprazole, for antipsychotic-induced hyperprolactinemia: a placebo-controlled trial. Am J Psychiatry. 2007;164(9):1404-1410.
20. Padala PR, Wengel SP, Petty F. Manic episode during treatment with aripiprazole. Am J Psychiatry. 2007;164(1):172-173.
21. Hu CH, Pai N, Huang XF, et al. Potential control of risperidone-related cognitive deficits by adjunctive aripiprazole treatment. J Clin Psychopharmacol. 2011;31(1):135-136;author reply 136–137.
22. Cohen J, Magalon D, Boyer L, et al. Aripiprazole-induced pathological gambling: a report of 3 cases. Curr Drug Saf. 2011;6(1):51-53.
23. Lea JW, Stoner SC, Lafollette J. Agitation associated with aripiprazole initiation. Pharmacotherapy. 2007;27(9):1339-1342.
24. Cho DY, Lindenmayer JP. Aripiprazole-induced agitation after clozapine discontinuation: a case report. J Clin Psychiatry. 2009;70(1):141-143.
25. Pae CU, Chiesa A, Mandelli L, et al. Predictors of early worsening after switch to aripiprazole: a randomized, controlled, open-label study. Clin Drug Investig. 2010;30(3):187-193.
26. Adan-Manes J, Garcia-Parajua P. Aripiprazole in combination with other antipsychotic drugs may worsen psychosis. J Clin Pharm Ther. 2009;34(2):245-246.
27. Cognata-Smith C, Baker RA, Pikalov A, et al. Analysis of nine aripiprazole trials to evaluate strategies for switching patients with schizophrenia to aripiprazole. Paper presented at: 162nd Annual Meeting American Psychiatric Association; May 16-21, 2009; San Francisco, CA.
28. Lieberman J. Cholinergic rebound in neuroleptic withdrawal syndromes. Psychosomatics. 1981;22(3):253-254.
29. Marder SR, McQuade RD, Stock E, et al. Aripiprazole in the treatment of schizophrenia: Safety and tolerability in short-term, placebo-controlled trials. Schizophr Res. 2003;61(2-3):123-136.
30. Kane JM, Fleischhacker WW, Hansen L, et al. Akathisia: an updated review focusing on second-generation antipsychotics. J Clin Psychiatry. 2009;70(5):627-643.
31. Kane JM, Barnes TR, Correll CU, et al. Evaluation of akathisia in patients with schizophrenia, schizoaffective disorder, or bipolar I disorder: A post hoc analysis of pooled data from short- and long-term aripiprazole trials. J Psychopharmacol. 2010;24(7):1019-1029.
32. Fleischhacker WW, McQuade RD, Marcus RN, et al. A double-blind, randomized comparative study of aripiprazole and olanzapine in patients with schizophrenia. Biol Psychiatry. 2009;65(6):510-517.
33. Kane JM, Osuntokun O, Kryzhanovskaya LA, et al. A 28-week, randomized, double-blind study of olanzapine versus aripiprazole in the treatment of schizophrenia. J Clin Psychiatry. 2009;70(4):572-581.
34. Kane JM, Correll CU, Goff DC, et al. A multicenter, randomized, double-blind, placebo-controlled, 16-week study of adjunctive aripiprazole for schizophrenia or schizoaffective disorder inadequately treated with quetiapine or risperidone monotherapy. J Clin Psychiatry. 2009;70(10):1348-1357.
James J. Gugger, PharmD, BCPP
Dr. Gugger is Assistant Clinical Professor, St. John’s University, College of Pharmacy and Allied Health Professions, Queens, NY
Courtney L. Tam, PharmD
Dr. Tam is Pharmacy Practice Resident, St. John’s University, College of Pharmacy and Allied Health Professions, Queens, NY
Charles R. Ashby, Jr, PhD
Dr. Ashby is Professor, St. John’s University, College of Pharmacy and Allied Health Professions, Queens, NY
Vicki L. Ellingrod, PharmD, BCPP, FCCP
Series Editor
Discuss this article at www.facebook.com/CurrentPsychiatry
• Aripiprazole may interact preferentially with distinct conformations of the D2 receptor, leading to a spectrum of pharmacologic effects, including acting as a full agonist, partial agonist, or antagonist.
• Clinical predictors of aripiprazole-associated worsening of psychosis include low baseline level of psychopathology and previous treatment with high-dose antipsychotics.
• Rapid transition from a medication with significant anticholinergic properties to 1 without these properties may result in symptoms of activation, including restlessness, insomnia, and anxiety, which can be mistaken for worsening psychosis.
• Akathisia, a common adverse effect of aripiprazole, may masquerade as treatment-emergent worsening of psychotic symptoms.
Mr. N, age 29, presents to the emergency department at the urging of his family because of poor self-care, bizarre behavior, and disturbed sleep. He first experienced psychiatric symptoms 10 years ago after his mother died. He became dysphoric and paranoid, displaying bizarre responses and behaviors with poor self-care and a gradual functional decline. He has been taking sertraline, 100 mg/d, for 10 years.
Upon arrival at the hospital’s inpatient unit, Mr. N is unkempt, oddly related, and paranoid. His affect is constricted. Mr. N displays thought blocking and possibly is responding to internal stimuli. Sertraline is continued and haloperidol, 1 mg/d, is initiated. For the next 2 weeks, Mr. N continues to be oddly related, irritable, and paranoid, and experiences disturbed sleep and thought blocking. After an episode of impulsive aggression, the treatment team initiates aripiprazole, which is titrated to 30 mg/d for 1 week. Mr. N’s clinical status worsens; he is menacing toward other patients and his thinking is more disorganized, with loose associations and ideas of reference. He requires 4 injections of IM haloperidol, 5 mg, and several visits to the seclusion room over the next week. Haloperidol is increased to 30 mg/d over the next 10 days, then aripiprazole is discontinued because of a putative drug interaction with haloperidol. Following the medication changes Mr. N demonstrates better behavioral control, but still is grossly psychotic. While awaiting transfer to a state hospital, Mr. N receives a trial of olanzapine, 20 to 40 mg/d, for 2 weeks without significant benefit.
Several clinical trials demonstrate a significant reduction in intensity of psychotic symptoms with aripiprazole, which has a unique mechanism of action.1 However, since its FDA approval in 2002, several case reports have described treatment-emergent psychotic symptoms associated with aripiprazole initiation. Over the past 40 years, reports of worsening psychosis associated with antipsychotics have been limited to patients with schizophrenia who were taking high dosages or who had high plasma concentrations, when anticholinergic delirium may have explained increased psychotic symptoms.2-4
How can a drug effectively treat psychotic symptoms and occasionally worsen them? In this article, we discuss the relevant pharmacology and clinical literature on aripiprazole and try to make sense of this apparent paradox.
Unique pharmacologic profile
Antipsychotics have been reported to be either neutral antagonists or inverse agonists at the D2 receptor, based on in vitro data.5 Aripiprazole and its main metabolite, dehydroaripiprazole, originally were described as partial agonists at D2 dopamine receptors.6,7 However, it appears aripiprazole’s pharmacologic action is better explained by the concept of functional selectivity. Aripiprazole may interact preferentially with distinct conformations of the D2 receptor, leading to a spectrum of pharmacologic effects, including acting as a full agonist, partial agonist, or antagonistic.5
Researchers have hypothesized that the pathophysiology of schizophrenia may, in part, be caused by dysfunction of mesocorticolimbic dopaminergic neurons characterized by an enhanced sensitivity of postsynaptic D2 receptors and increased sensitivity to dopaminergic drugs.8,9 In addition, chronic treatment with a D2 receptor antagonist is associated with increases in postsynaptic dopamine receptor density (ie, an increase in receptor reserve).10,11 Upregulation of D2 receptors may explain several features seen in patients chronically treated with antipsychotics, including tardive dyskinesia12 and rapid psychotic relapse after discontinuing an antipsychotic (supersensitivity psychosis).13 Because chronic antipsychotic treatment leads to high postsynaptic receptor reserve, aripiprazole initiation may produce overactivation of D2 receptors, which might worsen a patient’s condition.14 In vitro data15-18 and clinical observations indicate that aripiprazole has intrinsic efficacy at D2 receptors, as do clinical observations, such as:
- its propensity to reduce serum prolactin19
- a decreased likelihood of producing extrapyramidal side effects despite >80% occupancy of D2 receptors6
- case reports documenting aripiprazole-associated mania,20 improvement of risperidone-associated cognitive impairment,21 and pathologic gambling.22
Emergence or worsening of psychotic symptoms or a marginal antipsychotic effect may occur if aripiprazole is indeed a postsynaptic D2 receptor agonist. An individual patient’s outcome likely would depend on his or her sensitivity to psychosis and concurrent or previous exposure to a D2 receptor antagonist. For example, stimulation of postsynaptic D2 receptors may be further augmented if the dosage of the previous antipsychotic was reduced or withdrawn before initiating aripiprazole because additional receptors would be available for interaction with aripiprazole.
Case reports
A literature review revealed 23 reports of treatment-emergent psychosis associated with aripiprazole initiation (Table). The mean age of the patients was 47 (range: 17 to 69) and 57% were men. Most patients (87%) were diagnosed with a schizophrenia-spectrum illness before aripiprazole initiation. Most (57%) had mild, stable, or no psychotic symptoms before aripiprazole initiation. Most were receiving relatively high doses of antipsychotics (average chlorpromazine equivalents [CPZE]: 648 mg/d) before aripiprazole initiation. This medication was either decreased or discontinued in 70% of patients.
Emergence or worsening of psychotic symptoms included agitation, aggressive behavior, and increased psychomotor activity. However, akathisia evaluation was described in only 2 reports: 1 author identified akathisia symptoms, but attributed them to a concomitant antipsychotic (fluphenazine)23 and the other report specifically excluded the possibility of akathisia.24 Two systematic studies have attempted to establish risk factors for aripiprazole-associated worsening psychosis (Box).14,25
In our literature review, the mean final dose of aripiprazole was 21.5 mg/d (range: 2 to 60 mg/d). In the cases describing subsequent treatment, all but 1 patient were switched to another antipsychotic, including 2 whose psychotic symptoms stabilized with continuation of aripiprazole and addition of a second antipsychotic. Interestingly, in the case reported by Adan-Manes et al,26 initial treatment with aripiprazole monotherapy was efficacious, but a subsequent trial of adjunctive aripiprazole resulted in worsening psychosis.
Table
Case reports: Treatment-emergent psychosis associated with aripiprazole
| Study | Age, sex | Diagnosis | Before aripiprazole initiation | Pre-aripiprazole treatment | Aripiprazole dose | Concomitant psychotropic treatment | Subsequent treatment |
|---|---|---|---|---|---|---|---|
| Chiu et al, 2011a | 39, M | Schizophrenia | Psychiatrically stable, tardive dystonia | Clozapine, 300 mg/d | 10 mg/d | Valproic acid, 1,000 mg/d, clonazepam, 2 mg/d, mephenoxalone, 800 mg/d | Clozapine |
| Ekinci et al, 2010b | 17, M | ADHD | Inattention and impulsive aggression | Tapered and discontinued risperidone, 2.5 mg/d | 5 mg/d | Methylphenidate, 54 mg/d | Risperidone, 2 mg/d, methylphenidate, 36 mg/d |
| Selvaraj et al, 2010c | 49, F | Chronic depression | Depressive symptoms, suicidal ideation | None stated | 2 mg/d | Duloxetine, 80 mg/d, clonazepam, 2 mg/d | Duloxetine, 120 mg/d |
| Adan-Manes et al, 2009d | 23, M | Schizophrenia | No psychotic symptoms | Abrupt decrease of amisulpride dose from 800 mg/d to 400 mg/d | 20 mg/d | Biperiden, 4 mg/d | Amisulpride, 800 mg/d |
| Cho et al, 2009e | 45, F | Schizophrenia | Persistent psychotic symptoms, new onset diabetes with acute ketoacidosis | Haloperidol, 20 mg/d, abrupt clozapine discontinuation | 15 mg/d | Valproic acid, nortriptyline | Molindone, 150 mg/d |
| Ahuja et al, 2007f | 35, F | Schizoaffective disorder | Stable before medication change | Tapered amisulpride, 400 mg/d, over 6 weeks | 15 mg/d | None | Amisulpride, 600 mg/d |
| Lea et al, 2007g | 57, M | Schizophrenia | Persistent psychotic symptoms, treatment resistance, recent recovery from NMS | Discontinued ziprasidone, 200 mg/d | 30 mg/d | Lorazepam, 2 mg/d, amantadine, 100 mg, sertraline, 50 mg/d | Clozapine |
| Lea et al, 2007g | 49, M | Schizoaffective disorder | Delusions, verbal aggression, substance abuse, HCV | Decreased quetiapine dose from 800 mg/d to 400 mg/d | 15 mg/d | Divalproex, 1,000 mg/d, fluvoxamine, 200 mg/d, clonazepam, 2 mg/d | Lithium, quetiapine, 500 mg/d, haloperidol, 2 mg/d |
| Lea et al, 2007g | 60, M | Schizophrenia | Delusions, labile mood, aggression | Risperidone, 3 mg/d, interruption of fluphenazine, 75 mg/d | 20 mg/d | Divalproex, 4,500 mg/d, benztropine, 3 mg/d | Not discussed |
| Raja, 2007h | 30, M | Schizoaffective disorder | Negative symptoms, otherwise stable, recent citalopram discontinuation | Discontinued amisulpride, 800 mg/d over 2 weeks | 30 mg/d | Lithium | Amisulpride, 500 mg/d |
| Raja, 2007h | 69, F | Bipolar disorder | History of multiple relapses; presented with tremor, akathisia, weight gain | Discontinued risperidone, 2 mg/d, over 2 weeks | 15 mg/d | Lithium | Risperidone, 4 mg |
| Raja, 2007h | 59, F | Schizophrenia | Negative symptoms, otherwise stable | Reduced risperidone dosage from 5 mg/d to 4 mg/d | 7.5 mg/d | None | Risperidone, 5 mg/d |
| Thone, 2007i | 31, M | Schizophrenia | Confusion, agitation, delusions worsened with aripiprazole dose increase | None | 60 mg/d | None | Aripiprazole dose reduction to 15 mg/d, olanzapine, 10 mg/d |
| Glick et al, 2006j | 55, F | Schizophrenia | Stable before medication change | Tapered and discontinued thioridazine, 600 mg/d, over 3 months | 30 mg/d | None | Chlorpromazine, 200 mg/d, aripiprazole, 30 mg/d |
| Glick et al, 2006j | 52, M | Schizophrenia | Negative symptoms | Decreased olanzapine dose from 30 mg/d to 20 mg/d | 30 mg/d | None | Olanzapine, 30 mg/d |
| Barnas et al, 2005k | 57, F | Schizoaffective disorder | Stable before medication change | Discontinued perphenazine, 8 mg/d | 30 mg/d | None | Quetiapine, 350 mg/d |
| DeQuardo, 2004l | 54, M | Schizophrenia | History of aggression, residual paranoia, severe EPS | Haloperidol, 200 mg/d | 15 mg/d | Benztropine | Haloperidol |
| DeQuardo, 2004l | 51, M | Schizophrenia | History of aggression, persistent psychotic symptoms, treatment resistance | Olanzapine, 60 mg/d | 10 mg/d | None | Olanzapine |
| Ramaswamy et al, 2004m | 43, F | Schizoaffective disorder | Psychiatrically stable, multiple medication changes, including substituting carbamazepine for valproic acid | Discontinued ziprasidone, 160 mg/d, discontinued quetiapine, 400 mg/d, over 2 weeks | 30 mg/d | Propranolol, 30 mg/d, l-thyroxine, .05 mg/d, carbamazepine, 600 mg/d | Not available |
| Ramaswawamy et al, 2004m | 57, F | Schizoaffective disorder | History of multiple hospitalizations, but stable before medication change | Decreased olanzapine dose from 20 mg/d to 15 mg/d | 30 mg/d | Valproic acid, 2,000 mg/d | Ziprasidone |
| Ramaswawamy et al, 2004m | 67, F | Schizophrenia | Remote hospitalizations, recent worsened psychosis | Decreased ziprasidone dose from 200 mg/d to 160 mg/d 2 months previously | 30 mg/d | Carbamazepine, 200 mg/d | Not discussed |
| Ramaswamy et al, 2004m | 46, M | Schizophrenia | Persistent delusions while receiving risperidone, TD | Risperidone, 3 mg/d | 15 mg/d | Valproic acid, 1,500 mg/d | Risperidone, 3 mg/d |
| Reeves et al, 2004n | 50, M | Schizoaffective disorder | Relatively stable with nonthreatening delusions, hallucinations | Quetiapine, 800 mg/d | 30 mg/d | Divalproex, 2,000 mg/d | Olanzapine, 20 mg/d |
| ADHD: attention-deficit/hyperactivity disorder; EPS: extrapyramidal symptoms; HCV: hepatitis C virus; NMS: neuroleptic malignant syndrome; TD: tardive dyskinesia Source: References a. Chiu YH, Chen CH, Lu ML. Worsening psychosis after adding aripiprazole to clozapine. Prog Neuropsychopharmacol Biol Psychiatry. 2011;35(1):291-292. b. Ekinci O, Sabuncuoglu O. Psychosis associated with switching from risperidone to aripiprazole in an adolescent on methylphenidate treatment. Prog Neuropsychopharmacol Biol Psychiatry. 2011;35(2):648-649. c. Selvaraj V, Ramaswamy S, Sharma A, et al. New-onset psychosis and emergence of suicidal ideation with aripiprazole. Am J Psychiatry. 2010;167(12):1535-1536. d. Adan-Manes J, Garcia-Parajua P. Aripiprazole in combination with other antipsychotic drugs may worsen psychosis. J Clin Pharm Ther. 2009;34(2):245-246. e. Cho DY, Lindenmayer JP. Aripiprazole-induced agitation after clozapine discontinuation: a case report. J Clin Psychiatry. 2009;70(1):141-143. f. Ahuja N, Lloyd AJ. Aripiprazole and worsening of psychosis: a case report. J Clin Psychiatry. 2007;68(5):805-806. g. Lea JW, Stoner SC, Lafollette J. Agitation associated with aripiprazole initiation. Pharmacotherapy. 2007;27(9):1339-1342. h. Raja M. Improvement or worsening of psychotic symptoms after treatment with low doses of aripiprazole. Int J Neuropsychopharmacol. 2007;10(1):107-110. i. Thone J. Worsened agitation and confusion in schizophrenia subsequent to high-dose aripiprazole. J Neuropsychiatry Clin Neurosci. 2007;19(4):481-482. j. Glick ID, Duggal V, Hodulik C. Aripiprazole as a dopamine partial agonist: positive and negative effects. J Clin Psychopharmacol. 2006;26(1):101-103. k. Barnas ME, Hussain N, Petrides G. Treatment-emergent psychosis with aripiprazole. J Clin Psychiatry. 2005;66(10):1339. l. DeQuardo JR. Worsened agitation with aripiprazole: adverse effect of dopamine partial agonism? J Clin Psychiatry. 2004;65(1):132-133. m. Ramaswamy S, Vijay D, William M, et al. Aripiprazole possibly worsens psychosis. Int Clin Psychopharmacol. 2004;19(1):45-48. n. Reeves RR, Mack JE. Worsening schizoaffective disorder with aripiprazole. Am J Psychiatry. 2004;161(7):1308. | |||||||
Takeuchi et al14 aimed to establish predictors of worsening psychosis in a naturalistic setting where patients slowly transitioned to aripiprazole from previous antipsychotic treatment. Patients were required to be on a stable dose of an antipsychotic before participating in the study. Aripiprazole was started at 12 mg/d for 2 weeks with flexible dosing from weeks 2 to 52. Previous antipsychotic therapy was reduced biweekly by 25%. The incidence of worsening psychopathology after aripiprazole initiation was higher in the group of patients who had previously received high-dose antipsychotic therapy (average chlorpromazine equivalents [CPZE]: 727 mg/d) compared with the group on low dosages (average CPZE: 382 mg/d). It is possible that previous high-dose antipsychotic therapy was indicative of more significant baseline psychopathology; however, the worsened group and stabilized group had similar baseline Clinical Global Impressions-Severity scores.
Pae et al25 aimed to find predictors of worsening psychosis with aripiprazole in patients whose previous antipsychotic therapy was immediately discontinued. They found lower baseline disease severity was associated with significant worsening during the first month of aripiprazole treatment.
Other potential explanations
Aripiprazole’s manufacturer reported the incidence of psychosis-related adverse events in an analysis of 9 randomized schizophrenia trials.27 The rates of psychosis-related adverse events ranged from 0.6% to 18%, but there was no apparent relationship to study design or method of transitioning to aripiprazole. Rates of psychosis-related adverse events were similar between aripiprazole and the control group (placebo in 3 studies, another antipsychotic in 2 studies).
Emergence or worsening of psychotic symptoms temporally associated with aripiprazole initiation does not necessarily imply causation. As in Mr. N’s case, it is not always possible to determine whether worsening psychosis is the natural disease course or a treatment effect. In addition, it is not possible to differentiate lack of efficacy from a true propensity for aripiprazole to worsen psychosis.
It also is conceivable discontinuation or dosage reduction of a previous antipsychotic would worsen psychotic symptoms or cause side effects. When significant changes in psychopathology or side effects develop during the transition from 1 antipsychotic to another, it is difficult to determine etiology. Specifically, rapid transition from a medication with significant anticholinergic and antihistaminic properties—such as quetiapine or olanzapine—to 1 without these properties—such as aripiprazole—may result in symptoms of activation, including restlessness, insomnia, and anxiety. Consequently, these symptoms could be mistaken for worsening psychosis.28 Only 1 patient in this series was reported to abruptly discontinue an antipsychotic with significant anticholinergic properties (clozapine) before initiating aripiprazole.24 Studies by Takeuchi et al14 and Pae et al25 did not report the relative baseline use of antipsychotic medication with anticholinergic properties.
In a pooled analysis of treatment-emergent adverse events in 5 randomized clinical trials of patients receiving aripiprazole for acute relapse of schizophrenia, the incidence of akathisia was 10%, although it is not clear if this is a dose-related adverse effect.29 Because akathisia may be confused for worsening psychosis,30 it is possible akathisia was mistakenly identified as worsening psychotic symptoms in Mr. N’s case, as well as several reports from our literature review.
Covert akathisia is unlikely to explain worsening psychopathology observed in all patients in our literature review because confusion of akathisia and worsening psychosis is not a widespread phenomenon. In a post hoc analysis of pooled safety data from aripiprazole trials, Kane et al31 did not find a correlation between presence of akathisia and aripiprazole efficacy as measured by the Positive and Negative Syndrome Scale (PANSS) total, PANSS positive, PANSS negative, Clinical Global Impressions-Severity, Clinical Global Impressions-Improvement, and percentage of responders. Pae et al25 also noted there was no correlation between scores on the Barnes Akathisia Rating Scale and worsening psychopathology in patients switched to aripiprazole.
An antagonist always is an antagonist and clinicians have appreciated this concept since the days of chlorpromazine. The activity of aripiprazole, however, is on a pharmacologic continuum between a neutral antagonist and full agonist and currently there is no way to precisely determine the level of D2 receptor agonist action in a patient.
Although it is interesting to speculate that aripiprazole’s D2 receptor agonist action may contribute to worsening psychosis,32-34 there are other plausible explanations to consider. Rapid transition from a drug with significant anticholinergic properties and aripiprazole-associated akathisia may contribute to worsening psychopathology in patients starting aripiprazole. Because covert side effects may be incorrectly identified as psychotic agitation, we cannot exclude this as a possible etiologic factor in Mr. N’s case as well as the cases in our literature review.
Related Resource
- Abilify [package insert]. Princeton, NJ: Bristol-Myers Squibb; 2011.
Drug Brand Names
- Amantadine • Symmetrel
- Aripiprazole • Abilify
- Benztropine • Cogentin
- Biperiden • Akineton
- Carbamazepine • Tegretol
- Chlorpromazine • Thorazine
- Clonazepam • Klonopin
- Clozapine • Clozaril
- Divalproex • Depakote
- Duloxetine • Cymbalta
- Fluphenazine • Permitil, Prolixin
- Fluvoxamine • Luvox
- Haloperidol • Haldol
- Lithium • Eskalith, Lithobid
- Lorazepam • Ativan
- Nortriptyline • Aventyl, Pamelor
- Methylphenidate • Concerta
- Molindone • Moban
- Olanzapine • Zyprexa
- Perphenazine • Trilafon
- Propranolol • Inderal
- Quetiapine • Seroquel
- Risperidone • Risperdal
- Sertraline • Zoloft
- Thioridazine • Mellaril
- Thyroxine • Synthroid
- Valproic acid • Depakene
- Ziprasidone • Geodon
Disclosure
The authors report no financial relationship with any company whose products are mentioned in this article or with manufacturers of competing products.
1. Citrome L. A review of aripiprazole in the treatment of patients with schizophrenia or bipolar I disorder. Neuropsychiatr Dis Treat. 2006;2(4):427-443.
2. Chong SA, Tan CH, Lee HS. Worsening of psychosis with clozapine and selective serotonin reuptake inhibitor combination: two case reports. J Clin Psychopharmacol. 1997;17(1):68-69.
3. Bowers MB Jr, Swigar ME. Psychotic patients who become worse on neuroleptics. J Clin Psychopharmacol. 1988;8(6):417-421.
4. Tornatore FL, Lee D, Sramek JJ. Psychotic exacerbation with haloperidol. Drug Intell Clin Pharm. 1981;15(3):209-213.
5. Beaulieu JM, Gainetdinov RR. The physiology signaling, and pharmacology of dopamine receptors. Pharmacol Rev. 2011;63(1):182-217.
6. Grunder G, Carlsson A, Wong DF. Mechanism of new antipsychotic medications: occupancy is not just antagonism. Arch Gen Psychiatry. 2003;60(10):974-977.
7. Wood MD, Scott C, Clarke K, et al. Aripiprazole and its human metabolite are partial agonists at the human dopamine D2 receptor, but the rodent metabolite displays antagonist properties. Eur J Pharmacol. 2006;546(1-3):88-94.
8. Seeman P, Weinshenker D, Quirion R, et al. Dopamine supersensitivity correlates with D2High states, implying many paths to psychosis. Proc Natl Acad Sci U S A. 2005;102(9):3513-3518.
9. Seeman P, Ko F, Jack E, et al. Consistent with dopamine supersensitivity, RGS9 expression is diminished in the amphetamine-treated animal model of schizophrenia and in postmortem schizophrenia brain. Synapse. 2007;61(5):303-309.
10. Burt DR, Creese I, Snyder SH. Antischizophrenic drugs: chronic treatment elevates dopamine receptor binding in brain. Science. 1977;196(4287):326-328.
11. Silvestri S, Seeman MV, Negrete JC, et al. Increased dopamine D2 receptor binding after long-term treatment with antipsychotics in humans: a clinical PET study. Psychopharmacology (Berl). 2000;152(2):174-180.
12. Sayers AC, Bürki HR, Ruch W, et al. Neuroleptic-induced hypersensitivity of striatal dopamine receptors in the rat as a model of tardive dyskinesias. Effects of clozapine, haloperidol, loxapine and chlorpromazine. Psychopharmacologia. 1975;41(2):97-104.
13. Moncrieff J. Does antipsychotic withdrawal provoke psychosis? Review of the literature on rapid onset psychosis (supersensitivity psychosis) and withdrawal-related relapse. Acta Psychiatr Scand. 2006;114(1):3-13.
14. Takeuchi H, Uchida H, Suzuki T, et al. Predictors of clinical worsening after a switch to aripiprazole in patients with schizophrenia: a 1-year naturalistic follow-up study. J Clin Psychopharmacol. 2009;29(4):394-395.
15. Shapiro DA, Renock S, Arrington E, et al. Aripiprazole, a novel atypical antipsychotic drug with a unique and robust pharmacology. Neuropsychopharmacology. 2003;28(8):1400-1411.
16. Urban JD, Vargas GA, von Zastrow M, et al. Aripiprazole has functionally selective actions at dopamine D2 receptor-mediated signaling pathways. Neuropsychopharmacology. 2007;32(1):67-77.
17. Klewe IV, Nielsen SM, Tarpo L, et al. Recruitment of beta-arrestin2 to the dopamine D2 receptor: Insights into anti-psychotic and anti-parkinsonian drug receptor signaling. Neuropharmacology. 2008;54(8):1215-1222.
18. Masri B, Salahpour A, Didriksen M, et al. Antagonism of dopamine D2 receptor/beta-arrestin 2 interaction is a common property of clinically effective antipsychotics. Proc Natl Acad Sci U S A. 2008;105(36):13656-13661.
19. Shim JC, Shin JG, Kelly DL, et al. Adjunctive treatment with a dopamine partial agonist, aripiprazole, for antipsychotic-induced hyperprolactinemia: a placebo-controlled trial. Am J Psychiatry. 2007;164(9):1404-1410.
20. Padala PR, Wengel SP, Petty F. Manic episode during treatment with aripiprazole. Am J Psychiatry. 2007;164(1):172-173.
21. Hu CH, Pai N, Huang XF, et al. Potential control of risperidone-related cognitive deficits by adjunctive aripiprazole treatment. J Clin Psychopharmacol. 2011;31(1):135-136;author reply 136–137.
22. Cohen J, Magalon D, Boyer L, et al. Aripiprazole-induced pathological gambling: a report of 3 cases. Curr Drug Saf. 2011;6(1):51-53.
23. Lea JW, Stoner SC, Lafollette J. Agitation associated with aripiprazole initiation. Pharmacotherapy. 2007;27(9):1339-1342.
24. Cho DY, Lindenmayer JP. Aripiprazole-induced agitation after clozapine discontinuation: a case report. J Clin Psychiatry. 2009;70(1):141-143.
25. Pae CU, Chiesa A, Mandelli L, et al. Predictors of early worsening after switch to aripiprazole: a randomized, controlled, open-label study. Clin Drug Investig. 2010;30(3):187-193.
26. Adan-Manes J, Garcia-Parajua P. Aripiprazole in combination with other antipsychotic drugs may worsen psychosis. J Clin Pharm Ther. 2009;34(2):245-246.
27. Cognata-Smith C, Baker RA, Pikalov A, et al. Analysis of nine aripiprazole trials to evaluate strategies for switching patients with schizophrenia to aripiprazole. Paper presented at: 162nd Annual Meeting American Psychiatric Association; May 16-21, 2009; San Francisco, CA.
28. Lieberman J. Cholinergic rebound in neuroleptic withdrawal syndromes. Psychosomatics. 1981;22(3):253-254.
29. Marder SR, McQuade RD, Stock E, et al. Aripiprazole in the treatment of schizophrenia: Safety and tolerability in short-term, placebo-controlled trials. Schizophr Res. 2003;61(2-3):123-136.
30. Kane JM, Fleischhacker WW, Hansen L, et al. Akathisia: an updated review focusing on second-generation antipsychotics. J Clin Psychiatry. 2009;70(5):627-643.
31. Kane JM, Barnes TR, Correll CU, et al. Evaluation of akathisia in patients with schizophrenia, schizoaffective disorder, or bipolar I disorder: A post hoc analysis of pooled data from short- and long-term aripiprazole trials. J Psychopharmacol. 2010;24(7):1019-1029.
32. Fleischhacker WW, McQuade RD, Marcus RN, et al. A double-blind, randomized comparative study of aripiprazole and olanzapine in patients with schizophrenia. Biol Psychiatry. 2009;65(6):510-517.
33. Kane JM, Osuntokun O, Kryzhanovskaya LA, et al. A 28-week, randomized, double-blind study of olanzapine versus aripiprazole in the treatment of schizophrenia. J Clin Psychiatry. 2009;70(4):572-581.
34. Kane JM, Correll CU, Goff DC, et al. A multicenter, randomized, double-blind, placebo-controlled, 16-week study of adjunctive aripiprazole for schizophrenia or schizoaffective disorder inadequately treated with quetiapine or risperidone monotherapy. J Clin Psychiatry. 2009;70(10):1348-1357.
UPDATE ON PELVIC FLOOR DYSFUNCTION
Vulvar Pain Syndromes 3-Part Series
- Making the correct diagnosis
(September 2011) - A bounty of treatments-but not all of them are proven
(October 2011) - Provoked vestibulodynia
(Coming in November 2011)
Chronic pelvic pain: 11 critical questions about causes and care
Fred M. Howard, MD (August 2009)
Vague symptoms. Unexpected flares. Inconsistent manifestations. These characteristics can make diagnosis and treatment of chronic pelvic pain frustrating for both patient and physician. Most patients undergo myriad tests and studies to uncover the source of their pain—but a targeted pelvic exam may be all that is necessary to identify a prevalent but commonly overlooked cause of pelvic pain. Levator myalgia, myofascial pelvic pain syndrome, and pelvic floor spasm are all terms that describe a condition that may affect as many as 78% of women who are given a diagnosis of chronic pelvic pain.1 This syndrome may be represented by an array of symptoms, including pelvic pressure, dyspareunia, rectal discomfort, and irritative urinary symptoms such as spasms, frequency, and urgency. It is characterized by the presence of tight, band-like pelvic muscles that reproduce the patient’s pain when palpated.2
Diagnosis of this syndrome often surprises the patient. Although the concept of a muscle spasm is not foreign, the location is unexpected. Patients and physicians alike may forget that there is a large complex of muscles that completely lines the pelvic girdle. To complicate matters, the patient often associates the onset of her symptoms with an acute event such as a “bad” urinary tract infection or pelvic or vaginal surgery, which may divert attention from the musculature. Although a muscle spasm may be the cause of the patient’s pain, it’s important to realize that an underlying process may have triggered the original spasm. To provide effective treatment of pain, therefore, you must identify the fundamental cause, assuming that it is reversible, rather than focus exclusively on symptoms.
Although there are many therapeutic options for levator myalgia, an appraisal of the extensive literature on these medications is beyond the scope of this article. Rather, we will review alternative treatment modalities and summarize the results of five trials that explored physical therapy, trigger-point or chemodenervation injection, and neuromodulation (TABLE).
Weighing the nonpharmaceutical options for treatment
of myofascial pelvic pain
| Treatment | Pros | Cons |
|---|---|---|
| Physical therapy | Minimally invasive Moderate long-term success | Requires highly specialized therapist |
| Trigger-point injection | Minimally invasive Performed in clinic Immediate short-term success | Optimal injectable agent is unknown Botulinum toxin A lacks FDA approval for this indication Limited information on adverse events and long-term efficacy |
| Percutaneous tibial nerve stimulation | Minimally invasive Performed in clinic | Requires numerous office visits for treatment Lacks FDA approval for this indication Limited information on long-term efficacy |
| Sacral neuromodulation | Moderately invasive Permanent implant | Requires implantation in operating room Lacks FDA approval for this indication Limited information on long-term efficacy |
Pelvic myofascial therapy offers relief—but qualified therapists may be scarce
FitzGerald MP, Anderson RU, Potts J, et al; Urological Pelvic Pain Collaborative Research Network. Randomized multicenter feasibility trial of myofascial physical therapy for the treatment of urological chronic pelvic pain syndromes. J Urology. 2009;182(2):570–580.
Physical therapy of the pelvic floor—otherwise known as pelvic myofascial therapy—requires a therapist who is highly trained and specialized in this technique. It is more invasive than other forms of rehabilitative therapy because of the need to perform transvaginal maneuvers (FIGURE 1).
This pilot study by the Urological Pelvic Pain Collaborative Research Network evaluated the ability of patients to adhere to pelvic myofascial therapy, the response of their pain to therapy, and adverse events associated with manual therapy. It found that patients were willing to undergo the therapy, despite the invasive nature of the maneuvers, because it was significantly effective.
Details of the study
Patients (both men and women) were randomized to myofascial physical therapy or global therapeutic massage. Myofascial therapy consisted of internal or vaginal manipulation of the trigger-point muscle bundles and tissues of the pelvic floor. It also focused on muscles of the hip girdle and abdomen. The comparison group underwent traditional Western full-body massage. In both groups, treatment lasted 1 hour every week, and participants agreed to 10 full treatments.
Patients were eligible for the study if they experienced pelvic pain, urinary frequency, or bladder discomfort in the previous 6 months. In addition, an examiner must have been able to elicit tenderness upon palpation of the pelvic floor during examination. Patients were excluded if they showed signs of urinary tract infection or dysmenorrhea.
A total of 47 patients were randomized—24 to global massage and 23 to myofascial physical therapy. Overall, the myofascial group experienced a significantly higher rate of improvement in the global response at 12 weeks than did patients in the global-massage group (57% vs 21%; P=.03). Patients were willing to engage in myofascial pelvic therapy, and adverse events were minor.
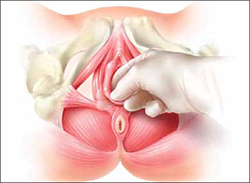
FIGURE 1 Transvaginal myofascial therapy
Physical therapy of the pelvic floor is more invasive than other forms of rehabilitative therapy because of the need to perform transvaginal maneuvers.
Need for specialized training may limit number of therapists
The randomized controlled study design renders these findings fairly reliable. Therapists were unmasked and aware of the treatment arms but were trained to make the different therapy sessions appear as similar as possible.
Although investigators were enthusiastic about their initial findings, additional studies are needed to validate the results. Moreover, these findings may be difficult to generalize because women who volunteer to participate in such a study may differ from the general population.
Nevertheless, patients who suffer from chronic pelvic pain may take heart that there is a nonpharmaceutical alternative to manage their symptoms, although availability is likely limited in many areas. Given the nature of the physical therapy required for this particular location of myofascial pain, specialized training is necessary for therapists. Despite motivated patients and well-informed providers, it may be difficult to find specialized therapists within local vicinities. Referrals to centers where this type of therapy is offered may be necessary.
Pelvic myofascial therapy is an effective and acceptable intervention for the treatment of levator myalgia.
The ideal agent for trigger-point injections remains a mystery
Langford CF, Udvari Nagy S, Ghoniem G M. Levator ani trigger point injections: An underutilized treatment for chronic pelvic pain. Neurourol Urodyn. 2007;26(1):59–62.
Abbott JA, Jarvis SK, Lyons SD, Thomson A, Vancaille TG. Botulinum toxin type A for chronic pain and pelvic floor spasm in women: a randomized controlled trial. Obstet Gynecol. 2006;108(4):915–923.
Trigger points are discrete, tender areas within a ridge of contracted muscle. These points may cause focal pain or referred pain upon irritation of the muscle.2 Trigger-point injection therapy aims to anesthetize or relax these points by infiltrating the muscle with medications.
These two studies evaluated the value of trigger-point injections in the treatment of pelvic myofascial pain; they found that the injections provide relief, although the mechanism of action and the ideal agent remain to be determined.
Langford et al: Details of the study
In this prospective study, 18 women who had pelvic pain of at least 6 months’ duration and confirmed trigger points on examination underwent transvaginal injection of a solution of bupivacaine, lidocaine, and triamcinolone. They were assessed by questionnaire at baseline and 3 months after injection. Assessment included a visual analog scale for pain severity. Investigators defined success as a decrease in pain of 50% or more and global-satisfaction and global-cure visual scores of 60% or higher.
Thirteen of the 18 women (72.2%) improved after their first injection, with six women reporting a complete absence of pain. Overall, women reported significant decreases in pain and increases in the rates of satisfaction and cure, meeting the definition of success at 3 months after the injection.
Among the theories proposed to explain the mechanism of action of trigger-point injections are:
- disruption of reflex arcs within skeletal muscle
- release of endorphins
- mechanical changes in abnormally contracted muscle fibers.
This last theory highlights one of the limitations of this study—lack of a placebo arm. Could it be possible that the injection of any fluid produces the same effect?
This study was not designed to investigate the causal relationship between the injection of a particular solution and pain relief, but it does highlight the need for studies to clarify the mechanism of action, including use of a placebo. It also prompts questions about the duration of effect after a single injection.
Goal of chemodenervation is blocking of muscle activity
Botulinum toxin type A (Botox) blocks the release of acetylcholine from presynaptic neurons. The release of acetylcholine stimulates muscle contractions; therefore, blockage of its release reduces muscle activity. This type of chemodenervation has found widespread use, and botulinum toxin A now has approval from the Food and Drug Administration (FDA) for treatment of chronic migraine, limb spasticity, cervical dystonia, strabismus, hyperhidrosis, and facial cosmesis.3 Although it is not approved for pelvic floor levator spasm, its success in treating other myotonic disorders suggests that its application may be relevant.
Abbott et al: Details of the study
Abbott and colleagues performed a double-blind, randomized, controlled trial to compare injection of botulinum toxin A with injection of saline. They measured changes in the pain scale, quality of life, and vaginal pressure.
Women were eligible for the study if they had subjectively reported pelvic pain of more than 2 years’ duration and objective evidence of trigger points (on examination) and elevated vaginal resting pressure (by vaginal manometry). Neither the clinical research staff nor the patient knew the contents of the injections, but all women received a total of four—two at sites in the puborectalis muscle and two in the pubococcygeus muscle.
After periodic assessment by questionnaire and examination through 6 months after injection, no differences were found in the pain score or resting vaginal pressure between the group of women who received botulinum toxin A and the group who received placebo. However, each group experienced a significant reduction in pain and vaginal pressure, compared with baseline. And both groups reported improved quality of life, compared with baseline. Neither group reported voiding dysfunction.
These two studies support the use of trigger-point injection into pelvic floor muscles to reduce pelvic myofascial pain. The findings of Abbott and colleagues, in particular, suggest that the substance that is injected may not be as important as the actual needling of the muscle. Larger studies and comparisons between placebo, botulinum toxin A, and anesthetic solutions are needed to elucidate the therapeutic benefit of these particular medications.
Neuromodulation shows promise as treatment for pelvic myofascial pain
van Balken MR, Vandoninck V, Messelink, BJ, et al. Percutaneous tibial nerve stimulation as neuromodulative treatment of chronic pelvic pain. Eur Urol. 2003;43(2):158–163.
Zabihi N, Mourtzinos A, Maher MG, Raz S, Rodriguez LV. Short-term results of bilateral S2-S4 sacral neuromodulation for the treatment of refractory interstitial cystitis, painful bladder syndrome, and chronic pelvic pain. Int Urogynecol J Pelvic Floor Dysfunct. 2008;19(4):553–557.
Neuromodulation is the science of using electrical impulses to alter neuronal activities. The exact mechanisms of action are unclear, but the technology has been utilized to control symptoms of overactive bladder and urinary retention caused by poor relaxation of the urethral and pelvic floor muscles. While studying the effects of sacral nerve root neuromodulation on the bladder, investigators noted improvements in other symptoms, such as pelvic pain.
Neuromodulation of the sacral nerve roots may be achieved by direct conduction of electrical impulses from a lead implanted in the sacrum (sacral neuromodulation) or by the retrograde conduction of these impulses through the posterior tibial nerve (percutaneous tibial nerve stimulation, or PTNS) (FIGURE 2). The tibial nerve arises from sacral nerves L5 to S3 and is one of the larger branches of the sciatic nerve.
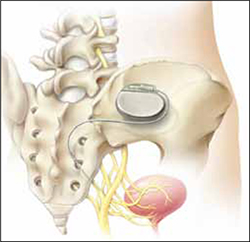
FIGURE 2 InterStim therapy
Stimulation of the sacral nerve has been used successfully to manage overactive bladder and urinary retention and may prove useful in the treatment of pelvic myofascial pain.
Van Balken et al: Details of the study
In this prospective observational study, 33 patients (both male and female) who had chronic pelvic pain by history and examination were treated with weekly, 30-minute outpatient sessions of PTNS for 12 weeks. Participants were asked to provide baseline pain scores and keep a diary of their pain. Quality-of-life questionnaires were also administered at baseline and at 12 weeks.
Investigators considered both subjective and objective success in their outcomes. If a patient elected to continue therapy, he or she was classified as a subjective success. Objective success required a decrease of at least 50% in the pain score. At the end of 12 weeks, although 33 patients (42%) wanted to continue therapy, only seven (21%) met the definition for objective success. Of those seven, six elected to continue therapy.
This study sheds light on a treatment modality that has not been studied adequately for the indication of pelvic pain but that may be promising in patients who have levator myalgia. Limitations of this study include the lack of a placebo arm, short-term outcome, and lack of localization of pain. Furthermore, although PTNS has FDA approval for treatment of urinary urgency, frequency, and urge incontinence, it is not approved for the treatment of pelvic pain. These preliminary findings demonstrate potential but, as with any new indication, long-term comparative studies are needed.
Zabihi et al: Details of the study
Patients in this retrospective study had a diagnosis of interstitial cystitis or chronic pelvic pain. Pelvic myofascial pain and trigger points were not required for eligibility. Thirty patients (21 women and nine men) had temporary placement of a lead containing four small electrodes along the S2 to S4 sacral nerve roots on both sides of the sacrum. They were then followed for a trial period of 2 to 4 weeks. To qualify for the final stage of the study, in which the leads were connected internally to a generator implanted in the buttocks, patients had to report improvement of at least 50% in their symptoms. If their improvement did not meet that threshold, the leads were removed.
Twenty-three patients (77%) met the criteria for permanent implantation. Of these patients, 42% reported improvement of more than 50% at 6 postoperative months. Quality-of-life scores also improved significantly.
Sacral neuromodulation is not FDA-approved for the treatment of chronic pelvic pain; further studies are needed before it can be recommended for this indication.
Neither of these studies required objective evidence of myofascial pain for inclusion. Therefore, although the benefits they demonstrated may be theorized to extend to the relief of myofascial pain, this fact cannot be corroborated.
We want to hear from you! Tell us what you think.
1. Bassaly R, Tidwell N, Bertolino S, Hoyte L, Downes K, Hart S. Myofascial pain and pelvic floor dysfunction in patients with interstitial cystitis. Int Urogynecol J. 2011;22(4):413-418.
2. Alvarez DJ, Rockwell PG. Trigger points: diagnosis and management. Am Fam Physician. 2002;65(4):653-660.
3. Allergan, Inc. Medication Guide: BOTOX. US Food and Drug Administration Web site. http://www.fda.gov/downloads/Drugs/DrugSafety/UCM176360.pdf. Published October 2010. Accessed August 30, 2011.

Amie Kawasaki, MD
Dr. Kawasaki is Fellow in the Division of Female Pelvic Medicine and Reconstructive Surgery, and Clinical Instructor of Obstetrics and Gynecology, at Duke University Medical Center in Durham, NC.

Cindy L. Amundsen, MD
Dr. Amundsen is Associate Professor and Fellowship Director of Female Pelvic Medicine and Reconstructive Surgery, Department of Obstetrics and Gynecology, at Duke University Medical Center in Durham, NC.
The authors report that they have no financial relationships relevant to this article.
Amie Kawasaki, MD
Dr. Kawasaki is Fellow in the Division of Female Pelvic Medicine and Reconstructive Surgery, and Clinical Instructor of Obstetrics and Gynecology, at Duke University Medical Center in Durham, NC.
Cindy L. Amundsen, MD
Dr. Amundsen is Associate Professor and Fellowship Director of Female Pelvic Medicine and Reconstructive Surgery, Department of Obstetrics and Gynecology, at Duke University Medical Center in Durham, NC.
The authors report that they have no financial relationships relevant to this article.
Vulvar Pain Syndromes 3-Part Series
- Making the correct diagnosis
(September 2011) - A bounty of treatments-but not all of them are proven
(October 2011) - Provoked vestibulodynia
(Coming in November 2011)
Chronic pelvic pain: 11 critical questions about causes and care
Fred M. Howard, MD (August 2009)
Vague symptoms. Unexpected flares. Inconsistent manifestations. These characteristics can make diagnosis and treatment of chronic pelvic pain frustrating for both patient and physician. Most patients undergo myriad tests and studies to uncover the source of their pain—but a targeted pelvic exam may be all that is necessary to identify a prevalent but commonly overlooked cause of pelvic pain. Levator myalgia, myofascial pelvic pain syndrome, and pelvic floor spasm are all terms that describe a condition that may affect as many as 78% of women who are given a diagnosis of chronic pelvic pain.1 This syndrome may be represented by an array of symptoms, including pelvic pressure, dyspareunia, rectal discomfort, and irritative urinary symptoms such as spasms, frequency, and urgency. It is characterized by the presence of tight, band-like pelvic muscles that reproduce the patient’s pain when palpated.2
Diagnosis of this syndrome often surprises the patient. Although the concept of a muscle spasm is not foreign, the location is unexpected. Patients and physicians alike may forget that there is a large complex of muscles that completely lines the pelvic girdle. To complicate matters, the patient often associates the onset of her symptoms with an acute event such as a “bad” urinary tract infection or pelvic or vaginal surgery, which may divert attention from the musculature. Although a muscle spasm may be the cause of the patient’s pain, it’s important to realize that an underlying process may have triggered the original spasm. To provide effective treatment of pain, therefore, you must identify the fundamental cause, assuming that it is reversible, rather than focus exclusively on symptoms.
Although there are many therapeutic options for levator myalgia, an appraisal of the extensive literature on these medications is beyond the scope of this article. Rather, we will review alternative treatment modalities and summarize the results of five trials that explored physical therapy, trigger-point or chemodenervation injection, and neuromodulation (TABLE).
Weighing the nonpharmaceutical options for treatment
of myofascial pelvic pain
| Treatment | Pros | Cons |
|---|---|---|
| Physical therapy | Minimally invasive Moderate long-term success | Requires highly specialized therapist |
| Trigger-point injection | Minimally invasive Performed in clinic Immediate short-term success | Optimal injectable agent is unknown Botulinum toxin A lacks FDA approval for this indication Limited information on adverse events and long-term efficacy |
| Percutaneous tibial nerve stimulation | Minimally invasive Performed in clinic | Requires numerous office visits for treatment Lacks FDA approval for this indication Limited information on long-term efficacy |
| Sacral neuromodulation | Moderately invasive Permanent implant | Requires implantation in operating room Lacks FDA approval for this indication Limited information on long-term efficacy |
Pelvic myofascial therapy offers relief—but qualified therapists may be scarce
FitzGerald MP, Anderson RU, Potts J, et al; Urological Pelvic Pain Collaborative Research Network. Randomized multicenter feasibility trial of myofascial physical therapy for the treatment of urological chronic pelvic pain syndromes. J Urology. 2009;182(2):570–580.
Physical therapy of the pelvic floor—otherwise known as pelvic myofascial therapy—requires a therapist who is highly trained and specialized in this technique. It is more invasive than other forms of rehabilitative therapy because of the need to perform transvaginal maneuvers (FIGURE 1).
This pilot study by the Urological Pelvic Pain Collaborative Research Network evaluated the ability of patients to adhere to pelvic myofascial therapy, the response of their pain to therapy, and adverse events associated with manual therapy. It found that patients were willing to undergo the therapy, despite the invasive nature of the maneuvers, because it was significantly effective.
Details of the study
Patients (both men and women) were randomized to myofascial physical therapy or global therapeutic massage. Myofascial therapy consisted of internal or vaginal manipulation of the trigger-point muscle bundles and tissues of the pelvic floor. It also focused on muscles of the hip girdle and abdomen. The comparison group underwent traditional Western full-body massage. In both groups, treatment lasted 1 hour every week, and participants agreed to 10 full treatments.
Patients were eligible for the study if they experienced pelvic pain, urinary frequency, or bladder discomfort in the previous 6 months. In addition, an examiner must have been able to elicit tenderness upon palpation of the pelvic floor during examination. Patients were excluded if they showed signs of urinary tract infection or dysmenorrhea.
A total of 47 patients were randomized—24 to global massage and 23 to myofascial physical therapy. Overall, the myofascial group experienced a significantly higher rate of improvement in the global response at 12 weeks than did patients in the global-massage group (57% vs 21%; P=.03). Patients were willing to engage in myofascial pelvic therapy, and adverse events were minor.
FIGURE 1 Transvaginal myofascial therapy
Physical therapy of the pelvic floor is more invasive than other forms of rehabilitative therapy because of the need to perform transvaginal maneuvers.
Need for specialized training may limit number of therapists
The randomized controlled study design renders these findings fairly reliable. Therapists were unmasked and aware of the treatment arms but were trained to make the different therapy sessions appear as similar as possible.
Although investigators were enthusiastic about their initial findings, additional studies are needed to validate the results. Moreover, these findings may be difficult to generalize because women who volunteer to participate in such a study may differ from the general population.
Nevertheless, patients who suffer from chronic pelvic pain may take heart that there is a nonpharmaceutical alternative to manage their symptoms, although availability is likely limited in many areas. Given the nature of the physical therapy required for this particular location of myofascial pain, specialized training is necessary for therapists. Despite motivated patients and well-informed providers, it may be difficult to find specialized therapists within local vicinities. Referrals to centers where this type of therapy is offered may be necessary.
Pelvic myofascial therapy is an effective and acceptable intervention for the treatment of levator myalgia.
The ideal agent for trigger-point injections remains a mystery
Langford CF, Udvari Nagy S, Ghoniem G M. Levator ani trigger point injections: An underutilized treatment for chronic pelvic pain. Neurourol Urodyn. 2007;26(1):59–62.
Abbott JA, Jarvis SK, Lyons SD, Thomson A, Vancaille TG. Botulinum toxin type A for chronic pain and pelvic floor spasm in women: a randomized controlled trial. Obstet Gynecol. 2006;108(4):915–923.
Trigger points are discrete, tender areas within a ridge of contracted muscle. These points may cause focal pain or referred pain upon irritation of the muscle.2 Trigger-point injection therapy aims to anesthetize or relax these points by infiltrating the muscle with medications.
These two studies evaluated the value of trigger-point injections in the treatment of pelvic myofascial pain; they found that the injections provide relief, although the mechanism of action and the ideal agent remain to be determined.
Langford et al: Details of the study
In this prospective study, 18 women who had pelvic pain of at least 6 months’ duration and confirmed trigger points on examination underwent transvaginal injection of a solution of bupivacaine, lidocaine, and triamcinolone. They were assessed by questionnaire at baseline and 3 months after injection. Assessment included a visual analog scale for pain severity. Investigators defined success as a decrease in pain of 50% or more and global-satisfaction and global-cure visual scores of 60% or higher.
Thirteen of the 18 women (72.2%) improved after their first injection, with six women reporting a complete absence of pain. Overall, women reported significant decreases in pain and increases in the rates of satisfaction and cure, meeting the definition of success at 3 months after the injection.
Among the theories proposed to explain the mechanism of action of trigger-point injections are:
- disruption of reflex arcs within skeletal muscle
- release of endorphins
- mechanical changes in abnormally contracted muscle fibers.
This last theory highlights one of the limitations of this study—lack of a placebo arm. Could it be possible that the injection of any fluid produces the same effect?
This study was not designed to investigate the causal relationship between the injection of a particular solution and pain relief, but it does highlight the need for studies to clarify the mechanism of action, including use of a placebo. It also prompts questions about the duration of effect after a single injection.
Goal of chemodenervation is blocking of muscle activity
Botulinum toxin type A (Botox) blocks the release of acetylcholine from presynaptic neurons. The release of acetylcholine stimulates muscle contractions; therefore, blockage of its release reduces muscle activity. This type of chemodenervation has found widespread use, and botulinum toxin A now has approval from the Food and Drug Administration (FDA) for treatment of chronic migraine, limb spasticity, cervical dystonia, strabismus, hyperhidrosis, and facial cosmesis.3 Although it is not approved for pelvic floor levator spasm, its success in treating other myotonic disorders suggests that its application may be relevant.
Abbott et al: Details of the study
Abbott and colleagues performed a double-blind, randomized, controlled trial to compare injection of botulinum toxin A with injection of saline. They measured changes in the pain scale, quality of life, and vaginal pressure.
Women were eligible for the study if they had subjectively reported pelvic pain of more than 2 years’ duration and objective evidence of trigger points (on examination) and elevated vaginal resting pressure (by vaginal manometry). Neither the clinical research staff nor the patient knew the contents of the injections, but all women received a total of four—two at sites in the puborectalis muscle and two in the pubococcygeus muscle.
After periodic assessment by questionnaire and examination through 6 months after injection, no differences were found in the pain score or resting vaginal pressure between the group of women who received botulinum toxin A and the group who received placebo. However, each group experienced a significant reduction in pain and vaginal pressure, compared with baseline. And both groups reported improved quality of life, compared with baseline. Neither group reported voiding dysfunction.
These two studies support the use of trigger-point injection into pelvic floor muscles to reduce pelvic myofascial pain. The findings of Abbott and colleagues, in particular, suggest that the substance that is injected may not be as important as the actual needling of the muscle. Larger studies and comparisons between placebo, botulinum toxin A, and anesthetic solutions are needed to elucidate the therapeutic benefit of these particular medications.
Neuromodulation shows promise as treatment for pelvic myofascial pain
van Balken MR, Vandoninck V, Messelink, BJ, et al. Percutaneous tibial nerve stimulation as neuromodulative treatment of chronic pelvic pain. Eur Urol. 2003;43(2):158–163.
Zabihi N, Mourtzinos A, Maher MG, Raz S, Rodriguez LV. Short-term results of bilateral S2-S4 sacral neuromodulation for the treatment of refractory interstitial cystitis, painful bladder syndrome, and chronic pelvic pain. Int Urogynecol J Pelvic Floor Dysfunct. 2008;19(4):553–557.
Neuromodulation is the science of using electrical impulses to alter neuronal activities. The exact mechanisms of action are unclear, but the technology has been utilized to control symptoms of overactive bladder and urinary retention caused by poor relaxation of the urethral and pelvic floor muscles. While studying the effects of sacral nerve root neuromodulation on the bladder, investigators noted improvements in other symptoms, such as pelvic pain.
Neuromodulation of the sacral nerve roots may be achieved by direct conduction of electrical impulses from a lead implanted in the sacrum (sacral neuromodulation) or by the retrograde conduction of these impulses through the posterior tibial nerve (percutaneous tibial nerve stimulation, or PTNS) (FIGURE 2). The tibial nerve arises from sacral nerves L5 to S3 and is one of the larger branches of the sciatic nerve.
FIGURE 2 InterStim therapy
Stimulation of the sacral nerve has been used successfully to manage overactive bladder and urinary retention and may prove useful in the treatment of pelvic myofascial pain.
Van Balken et al: Details of the study
In this prospective observational study, 33 patients (both male and female) who had chronic pelvic pain by history and examination were treated with weekly, 30-minute outpatient sessions of PTNS for 12 weeks. Participants were asked to provide baseline pain scores and keep a diary of their pain. Quality-of-life questionnaires were also administered at baseline and at 12 weeks.
Investigators considered both subjective and objective success in their outcomes. If a patient elected to continue therapy, he or she was classified as a subjective success. Objective success required a decrease of at least 50% in the pain score. At the end of 12 weeks, although 33 patients (42%) wanted to continue therapy, only seven (21%) met the definition for objective success. Of those seven, six elected to continue therapy.
This study sheds light on a treatment modality that has not been studied adequately for the indication of pelvic pain but that may be promising in patients who have levator myalgia. Limitations of this study include the lack of a placebo arm, short-term outcome, and lack of localization of pain. Furthermore, although PTNS has FDA approval for treatment of urinary urgency, frequency, and urge incontinence, it is not approved for the treatment of pelvic pain. These preliminary findings demonstrate potential but, as with any new indication, long-term comparative studies are needed.
Zabihi et al: Details of the study
Patients in this retrospective study had a diagnosis of interstitial cystitis or chronic pelvic pain. Pelvic myofascial pain and trigger points were not required for eligibility. Thirty patients (21 women and nine men) had temporary placement of a lead containing four small electrodes along the S2 to S4 sacral nerve roots on both sides of the sacrum. They were then followed for a trial period of 2 to 4 weeks. To qualify for the final stage of the study, in which the leads were connected internally to a generator implanted in the buttocks, patients had to report improvement of at least 50% in their symptoms. If their improvement did not meet that threshold, the leads were removed.
Twenty-three patients (77%) met the criteria for permanent implantation. Of these patients, 42% reported improvement of more than 50% at 6 postoperative months. Quality-of-life scores also improved significantly.
Sacral neuromodulation is not FDA-approved for the treatment of chronic pelvic pain; further studies are needed before it can be recommended for this indication.
Neither of these studies required objective evidence of myofascial pain for inclusion. Therefore, although the benefits they demonstrated may be theorized to extend to the relief of myofascial pain, this fact cannot be corroborated.
We want to hear from you! Tell us what you think.
1. Bassaly R, Tidwell N, Bertolino S, Hoyte L, Downes K, Hart S. Myofascial pain and pelvic floor dysfunction in patients with interstitial cystitis. Int Urogynecol J. 2011;22(4):413-418.
2. Alvarez DJ, Rockwell PG. Trigger points: diagnosis and management. Am Fam Physician. 2002;65(4):653-660.
3. Allergan, Inc. Medication Guide: BOTOX. US Food and Drug Administration Web site. http://www.fda.gov/downloads/Drugs/DrugSafety/UCM176360.pdf. Published October 2010. Accessed August 30, 2011.