User login
Computer-Aided Surgery in Orthopedics: From Strength to Strength
Treating Patients With Delusions of Parasitosis: A Blueprint for Clinicians
Update on concussion: Here’s what the experts say
• Don’t allow an athlete who has symptoms at rest or with exertion to return to play. C
• Consider neuropsychological testing in conjunction with continued clinical assessment for objective measurements to assist in managing concussion. B
• Recommend up-to-date protective equipment for athletes. Recent improvements, especially in football, have been shown to help decrease the incidence of concussion. A
Strength of recommendation (SOR)
A Good-quality patient-oriented evidence
B Inconsistent or limited-quality patient-oriented evidence
C Consensus, usual practice, opinion, disease-oriented evidence, case series
CASE: Jeff, a 15-year-old high school ice hockey player, asks you to write a note for his coach, stating that he has recovered from his concussion and can return to play. He says that 2 days ago he collided with another player and was knocked unconscious for roughly 10 seconds. He had a headache for the rest of that evening, and complained that the light was hurting his eyes. Now he has no symptoms at rest, but activity gives him a slight headache.
How would you evaluate this patient to determine whether he can return to play?
Concussions like Jeff’s are common in sports-related activities, and family physicians are frequently asked to manage the condition and decide when the injured athlete can safely return to play.
Concussions occur in both helmeted and nonhelmeted sports, and are most common in collision sports.1 A 2007 estimate from the Centers for Disease Control and Prevention (CDC) suggests that 1.1 million people are seen in emergency departments in the United States each year for concussion-related injuries, while nearly another 235,000 people are hospitalized.2 As astounding as these numbers are, many experts believe they underestimate the true incidence of concussion, given the propensity for athletes not to report symptoms for fear of being held out of sporting events.3,4
Further complicating matters: There has historically been a lack of agreement over what, exactly, constitutes a concussion and how to manage these injuries.
Refining concussion terminology
Concussion has often been referred to as mild traumatic brain injury (MTBI), although more recent expert opinion suggests the terms refer to different injury constructs and should not be used interchangeably.5 Over the years there has been little agreement on the definition, grading, and treatment of these injuries.6-8 On 3 occasions in the last decade, the sports medicine community has held symposia designed to refine an expert consensus on these issues: in 2001 in Vienna, in 2004 in Prague, and in 2008 in Zurich.5,9,10 These recommendations provide a useful framework for caring for patients like Jeff.
A definition. According to the consensus statement that emerged from the most recent Zurich conference, sports concussion can be defined as a “complex pathophysiological process affecting the brain, induced by traumatic biomechanical forces.” Common features may include:5
- A direct blow to the head or elsewhere in the body with an impulsive force transmitted to the head.
- Rapid onset of neurological impairments that resolve spontaneously over time.
- Possible neuropathological changes, although the clinical symptoms reflect a functional disturbance rather than structural injury.
- A graded set of clinical symptoms that may or may not involve loss of consciousness.
- No abnormality on standard structural neuroimaging studies.
Athletes with concussion show a range of signs and symptoms
Athletes who suffer from a concussion may show signs of being dazed or disoriented, or experience retrograde amnesia (where they can’t remember things that happened before the traumatic event) or anterograde amnesia (where they can’t remember things that happened after the event). They may also suffer from poor coordination, decreased attention span, emotional lability, or loss of consciousness. After the traumatic event, they may complain of headache, dizziness, nausea or vomiting, photophobia, phonophobia, inability to concentrate, sleep disturbances, fatigue, and memory disturbances. Academic performance can also be severely impaired during the postconcussive period.
Symptoms of concussion may be short-lived or persist for many weeks. Postconcussive syndrome is a term used to describe the condition of prolonged and persistent concussive symptoms. Recent studies in military personal have also shown a strong association between post-traumatic stress disorder (PTSD) and clinical depression in soldiers who have suffered from a traumatic brain injury.11
Start with the ABCs, then check the spine
If you are a team physician on the spot when the injury occurs, you can do the initial assessment on the field of play. A certified athletic trainer can also do this first assessment. Start by checking the basics: airway, breathing, and circulation. Once the ABCs have been completed, palpate the head and neck to rule out a head or cervical spine injury. If the player complains of neck pain or you can palpate bony tenderness or step-off over the spinous processes, suspect a possible cervical spine injury. Make sure the player is put onto a spine board with cervical spine precautions and transported to the nearest medical facility.
Look for neurologic deficits
If the cervical spine is cleared, you can do the rest of the assessment in a quiet location either on the sideline or in your office. Your history should include a narrative of how the injury occurred, an estimate of the force involved, the duration of any symptoms, and any previous concussions. The physical examination comes next, and should include a neurologic assessment and a full cognitive evaluation. Reassess frequently after the traumatic event to monitor for any signs of neurologic decline. If any neurologic deficits are found, the patient should be transported to the nearest medical facility for neuroimaging studies to rule out a structural brain injury.
The SCAT2: A convenient assessment tool
Standardized tools now exist to help you evaluate patients with concussion. The Pocket Sport Concussion Assessment Tool (SCAT2) on page 430 has been endorsed by the Zurich conference.5 It is a condensed version of the conference recommendations, suitable for use on the field of play. The SCAT2 includes a symptom scale, mental status tests, instructions on neurologic screening, and guidelines for return to play.
Pocket Sports Concussion Assessment Tool (SCAT2)
Adapted from: Pocket SCAT2. Available at: http://bjsm.bmj.com/content/43/Suppl_1/i89.full.pdf. Accessed July 7, 2010.
No system for grading severity is recommended
Many different classification systems for grading the severity of concussion have been proposed, but none of them is endorsed by the Zurich conference.5,7,12-15 The classification schemes that have been proposed are complex, not evidence-based, and unable to encompass the full range of concussion symptoms. Thus, the 3rd International Conference on Concussion in Sport abandoned all attempts to use or create classification systems, but recommended that each case be treated clinically on the basis of the symptoms displayed and the duration of the impairment.5 Athletes with severe impairment or prolonged symptoms may require referral to a sport medicine specialist with expertise in the management of concussion.
The third conference did agree on a range of “modifying factors” that may influence management and possibly predict the potential for prolonged or persistent symptoms (TABLE). The conference participants endorsed that any athlete displaying these features should be managed in a multidisciplinary manner coordinated by a physician with specific expertise in the management of concussive injuries.
TABLE
"Modifying factors” that may influence concussion management
| Symptoms | How many? |
| How long did symptoms last? (>10 days?) | |
| How severe? | |
| Signs | Loss of consciousness lasting >1 minute, amnesia |
| Sequelae | Concussive convulsions |
| Timing | Repeated concussions, concussions occurring close together in time, or recent concussion |
| Threshold | Repeated concussions with progressively less impact force or slower recovery after each |
| Age | Child or adolescent <18 years |
| Comorbidities | Migraine, depression, other mental health disorders, attention deficit hyperactivity disorder, learning disabilities, sleep disorders |
| Medications | Psychoactive drugs, anticoagulants |
| Behavior | Dangerous style of play |
| Sport in which injury occurred | High-risk, contact, and collision sports, “high sporting level” |
| Source: McCrory P, et al. Br J Sports Med. 2009.5 | |
Return to play is the crucial decision
Just as multiple systems for classifying severity have been proposed, so have guidelines for return to play.13-15 Again, each of the proposed guidelines has been based on expert opinion and no single set of guidelines has ever been proven to be accurate.10 There is, therefore, no universally accepted guide for making the decision of when an athlete can safely return to play. It is universally accepted, however, that no athlete should return to play if he or she is still symptomatic at rest or with any exertional maneuvers.3,7,16 Additionally, the athlete should not be taking any medication that could minimize any of the signs or symptoms of concussion when the physician is determining whether he or she can return to activity.
Once you are assured that the player has no symptoms at rest, you can start him or her on a graded, step-by-step regimen for returning to play. Athletes should spend 24 to 48 hours at each level before progressing to the next. If symptoms return at any point, instruct the athlete to drop back down a step for 24 hours and then proceed with the progression as tolerated.9,10 The stages of activity are: 3,10
- Light aerobic exercise
- Moderate to intense aerobic exercise
- Sport-specific activities/noncontact training drills
- Full contact activities
- Game play.
Neuropsychological testing can help you decide
In 1989, Barth and colleagues evaluated 2300 college football players, 200 of whom had suspected concussion.17 Neuropsychological testing at 24 hours, 5 days, and 10 days showed a decline from baseline following a concussion, with the majority of the athletes returning to baseline by 10 days postconcussion. This finding led researchers to believe that testing could help identify concussions, and several computer-based testing products were developed.11,18
Neuropsychological testing should include measures of concentration, motor dexterity, information processing, visual and verbal memory, executive function, and brain stem function.19 Testing can be performed in the athletic setting with a Web-based computer program, by a sports medicine specialist with an interest in concussion, or by a neuro-psychologist with expertise in concussion.
Improvement in cognitive function as a concussion resolves may come prior to, or follow, the resolution of clinical symptoms. Therefore, it is important to properly assess cognition and symptoms before you make a recommendation about returning to play.3,10 Baseline performance parameters must be established before the season starts.
Neuropsychological testing can provide both an objective measure of the neuro-cognitive effects of concussion and the ability to track recovery. It may also assist in making return-to-play recommendations in complicated cases, but bear in mind that no data are available to suggest that return to play is safe once neuropsychological testing has returned to normal.3,9 Test results can aid clinical decision making, but cannot substitute for it. Testing may be most helpful in athletes with repeated concussions or those with persistent symptoms.10
Educating athletes, parents, and coaches in prevention
No foolproof method exists for preventing concussion in sports. Sports medicine research has focused on designing and testing safer equipment and on devising new rules to make play safer.20-22 At present, there is no evidence that protective equipment will prevent concussions, but recent studies by Collins and Viano suggest that newer football helmets may assist in decreasing the incidence of concussions.20,22,23
The Zurich consensus statement warns that protective equipment can have a paradoxical effect, influencing athletes to take risks that they might otherwise avoid, thus increasing injury rates.5 Trials of rule changes in different sports have been and continue to be conducted, such as barring spearing in football and restricting helmet-to-helmet hits. Given the frequency of concussion, further research is clearly needed. In the meantime, family physicians can play a major role in educating players, parents, and coaches about the seriousness of concussive injury and the need for identifying concussion promptly and allowing adequate time for recovery.
What do you tell Jeff?
Your answer for Jeff is, “You’re not ready to go back to practice or play. You feel OK when you’re resting, but when you get up, your headache returns. Come back to the office in a day or 2, and I’ll re-evaluate you. If you don’t have any symptoms then, you can start a program of graduated activity, beginning with some light aerobic exercise. If you feel all right with that, you can go on to a moderate and then an intense aerobic workout. If you still feel good, you can go on to sports-specific activities with no contact training, and then full contact training.
“At each stage, you will need to be re-evaluated by me or by your team trainer. Once you’ve finished the program without any reactivation of symptoms, I’ll clear you for play.”
CORRESPONDENCE Shawn M. Ferullo, MD, One Boston Medical Center Place, Boston, MA 02118; [email protected]
1. Cantu R. Cerebral concussion in sport: management and prevention. Sports Med. 1992;14:64-74.
2. Centers for Disease Control and Prevention. Nonfatal traumatic brain injuries from sports and recreational activities. MMWR Morb Mortal Wkly Rep. 2007;56:733-737.
3. American College of Sports Medicine. Special communications: concussion (mild traumatic brain injury) and the team physician: a consensus statement. Med Sci Sports Exerc. 2006;38:395-399.
4. Van Kampen D, Lovell M, Pardini J, et al. The “value added” of neurocognitive testing after sports-related concussion. Am J Sports Med. 2006;34:1630-1636.
5. McCrory P, Meeuwisse W, Johnston K, et al. Consensus statement on concussion in sport: the 3rd International Conference on Concussion in Sport held in Zurich, November 2008. Br J Sports Med. 2009;43(suppl I):i76-i84.
6. Powell J. Cerebral concussion: causes, effects and risks in sports. J Athl Training. 2001;36:307-311.
7. Cantu R. Posttraumatic retrograde and anterograde amnesia: pathophysiology and implications in grading and safe return to play. J Athl Training. 2001;36:244-248.
8. Oliaro S, Anderson S, Hooker D. Management of cerebral concussion in sports: the athletic trainer’s perspective. J Athl Training. 2001;36:257-262.
9. Concussion in sport group: Aubry M, Cantu R, Dvorak J, et al. Summary and Agreement Statement of the 1st International Symposium on Concussion in Sport. Vienna 2001. Clin J Sports Med. 2002;12:6-11.
10. McCrory P, Johnston K, Meeuwisse W, et al. Summary and agreement statement of the 2nd International Conference on Concussion in Sport. Prague 2004. Br J Sports Med. 2005;39:196-204.
11. Hoge C, McGurk D, Thomas J, et al. Mild traumatic brain injury in US soldiers returning from Iraq. N Engl J Med. 2008;358:453-463.
12. Harmon KG. Assessment and management of concussion in sports. Am Fam Physician. 1999;60:887-892.
13. American Academy of Neurology. Practice parameter: the management of concussion in sport (summary statement). Report of the Quality Standards Subcommittee. Neurology. 1997;48:581-585.
14. Cantu R. Guidelines for return to contact sports after cerebral concussion. Phys Sports Med. 1986;14:75-83.
15. Colorado Medical Society School and Sports Medicine Committee. Guidelines for the management of concussion in sports. Colo Med. 1990;87:4.-
16. Guskiewicz KM, Bruce SL, Cantu R, et al. Research based recommendations on management of sport related concussion: summary of the National Athletic Trainers’ Association Position Statement. Br J Sports Med. 2006;40:6-10.
17. Barth JT, Alves WA, Ryan TV, et al. Mild head injury in sports; neuropsychological sequelae and recovery of function. In: Levin HS, Eisenberg HM, Benton AL, eds. Mild Head Injury. New York: Oxford University Press; 1989:257–275.
18. Randolph C. Implementation of neuropsychological testing models for the high school, collegiate and professional sport settings. J Athl Training. 2001;36:288-296.
19. Maroon J, Lovell M, Norwig J, et al. Cerebral concussion in athletes: evaluation and neuropsychological testing. Neurosurgery. 2000;47:659-672.
20. Collins M, Lovell M, Iverson G, et al. Examining concussion rates and return to play in high school football players wearing newer helmet technology: a three year prospective cohort study. Neurosurgery. 2006;58:275-286.
21. Delaney J, Al-Kashmiri A, Drummond R, et al. The effect of protective headgear on head injuries and concussions in adolescent football (soccer) players. Br J Sports Med. 2008;42:110-115.
22. Viano D, Pellman E, Whitnall C, et al. Concussion in professional football: performance of newer helmets in reconstructed game impacts – Part 13. Neurosurgery. 2006;59:591-606.
23. Pellman E, Lovell M, Viano D, et al. Concussion in professional football: recovery of NFL and high school athletes assessed by neuropsychological testing – Part 12. Neurosurgery. 2006;58:236-274.
• Don’t allow an athlete who has symptoms at rest or with exertion to return to play. C
• Consider neuropsychological testing in conjunction with continued clinical assessment for objective measurements to assist in managing concussion. B
• Recommend up-to-date protective equipment for athletes. Recent improvements, especially in football, have been shown to help decrease the incidence of concussion. A
Strength of recommendation (SOR)
A Good-quality patient-oriented evidence
B Inconsistent or limited-quality patient-oriented evidence
C Consensus, usual practice, opinion, disease-oriented evidence, case series
CASE: Jeff, a 15-year-old high school ice hockey player, asks you to write a note for his coach, stating that he has recovered from his concussion and can return to play. He says that 2 days ago he collided with another player and was knocked unconscious for roughly 10 seconds. He had a headache for the rest of that evening, and complained that the light was hurting his eyes. Now he has no symptoms at rest, but activity gives him a slight headache.
How would you evaluate this patient to determine whether he can return to play?
Concussions like Jeff’s are common in sports-related activities, and family physicians are frequently asked to manage the condition and decide when the injured athlete can safely return to play.
Concussions occur in both helmeted and nonhelmeted sports, and are most common in collision sports.1 A 2007 estimate from the Centers for Disease Control and Prevention (CDC) suggests that 1.1 million people are seen in emergency departments in the United States each year for concussion-related injuries, while nearly another 235,000 people are hospitalized.2 As astounding as these numbers are, many experts believe they underestimate the true incidence of concussion, given the propensity for athletes not to report symptoms for fear of being held out of sporting events.3,4
Further complicating matters: There has historically been a lack of agreement over what, exactly, constitutes a concussion and how to manage these injuries.
Refining concussion terminology
Concussion has often been referred to as mild traumatic brain injury (MTBI), although more recent expert opinion suggests the terms refer to different injury constructs and should not be used interchangeably.5 Over the years there has been little agreement on the definition, grading, and treatment of these injuries.6-8 On 3 occasions in the last decade, the sports medicine community has held symposia designed to refine an expert consensus on these issues: in 2001 in Vienna, in 2004 in Prague, and in 2008 in Zurich.5,9,10 These recommendations provide a useful framework for caring for patients like Jeff.
A definition. According to the consensus statement that emerged from the most recent Zurich conference, sports concussion can be defined as a “complex pathophysiological process affecting the brain, induced by traumatic biomechanical forces.” Common features may include:5
- A direct blow to the head or elsewhere in the body with an impulsive force transmitted to the head.
- Rapid onset of neurological impairments that resolve spontaneously over time.
- Possible neuropathological changes, although the clinical symptoms reflect a functional disturbance rather than structural injury.
- A graded set of clinical symptoms that may or may not involve loss of consciousness.
- No abnormality on standard structural neuroimaging studies.
Athletes with concussion show a range of signs and symptoms
Athletes who suffer from a concussion may show signs of being dazed or disoriented, or experience retrograde amnesia (where they can’t remember things that happened before the traumatic event) or anterograde amnesia (where they can’t remember things that happened after the event). They may also suffer from poor coordination, decreased attention span, emotional lability, or loss of consciousness. After the traumatic event, they may complain of headache, dizziness, nausea or vomiting, photophobia, phonophobia, inability to concentrate, sleep disturbances, fatigue, and memory disturbances. Academic performance can also be severely impaired during the postconcussive period.
Symptoms of concussion may be short-lived or persist for many weeks. Postconcussive syndrome is a term used to describe the condition of prolonged and persistent concussive symptoms. Recent studies in military personal have also shown a strong association between post-traumatic stress disorder (PTSD) and clinical depression in soldiers who have suffered from a traumatic brain injury.11
Start with the ABCs, then check the spine
If you are a team physician on the spot when the injury occurs, you can do the initial assessment on the field of play. A certified athletic trainer can also do this first assessment. Start by checking the basics: airway, breathing, and circulation. Once the ABCs have been completed, palpate the head and neck to rule out a head or cervical spine injury. If the player complains of neck pain or you can palpate bony tenderness or step-off over the spinous processes, suspect a possible cervical spine injury. Make sure the player is put onto a spine board with cervical spine precautions and transported to the nearest medical facility.
Look for neurologic deficits
If the cervical spine is cleared, you can do the rest of the assessment in a quiet location either on the sideline or in your office. Your history should include a narrative of how the injury occurred, an estimate of the force involved, the duration of any symptoms, and any previous concussions. The physical examination comes next, and should include a neurologic assessment and a full cognitive evaluation. Reassess frequently after the traumatic event to monitor for any signs of neurologic decline. If any neurologic deficits are found, the patient should be transported to the nearest medical facility for neuroimaging studies to rule out a structural brain injury.
The SCAT2: A convenient assessment tool
Standardized tools now exist to help you evaluate patients with concussion. The Pocket Sport Concussion Assessment Tool (SCAT2) on page 430 has been endorsed by the Zurich conference.5 It is a condensed version of the conference recommendations, suitable for use on the field of play. The SCAT2 includes a symptom scale, mental status tests, instructions on neurologic screening, and guidelines for return to play.
Pocket Sports Concussion Assessment Tool (SCAT2)
Adapted from: Pocket SCAT2. Available at: http://bjsm.bmj.com/content/43/Suppl_1/i89.full.pdf. Accessed July 7, 2010.
No system for grading severity is recommended
Many different classification systems for grading the severity of concussion have been proposed, but none of them is endorsed by the Zurich conference.5,7,12-15 The classification schemes that have been proposed are complex, not evidence-based, and unable to encompass the full range of concussion symptoms. Thus, the 3rd International Conference on Concussion in Sport abandoned all attempts to use or create classification systems, but recommended that each case be treated clinically on the basis of the symptoms displayed and the duration of the impairment.5 Athletes with severe impairment or prolonged symptoms may require referral to a sport medicine specialist with expertise in the management of concussion.
The third conference did agree on a range of “modifying factors” that may influence management and possibly predict the potential for prolonged or persistent symptoms (TABLE). The conference participants endorsed that any athlete displaying these features should be managed in a multidisciplinary manner coordinated by a physician with specific expertise in the management of concussive injuries.
TABLE
"Modifying factors” that may influence concussion management
| Symptoms | How many? |
| How long did symptoms last? (>10 days?) | |
| How severe? | |
| Signs | Loss of consciousness lasting >1 minute, amnesia |
| Sequelae | Concussive convulsions |
| Timing | Repeated concussions, concussions occurring close together in time, or recent concussion |
| Threshold | Repeated concussions with progressively less impact force or slower recovery after each |
| Age | Child or adolescent <18 years |
| Comorbidities | Migraine, depression, other mental health disorders, attention deficit hyperactivity disorder, learning disabilities, sleep disorders |
| Medications | Psychoactive drugs, anticoagulants |
| Behavior | Dangerous style of play |
| Sport in which injury occurred | High-risk, contact, and collision sports, “high sporting level” |
| Source: McCrory P, et al. Br J Sports Med. 2009.5 | |
Return to play is the crucial decision
Just as multiple systems for classifying severity have been proposed, so have guidelines for return to play.13-15 Again, each of the proposed guidelines has been based on expert opinion and no single set of guidelines has ever been proven to be accurate.10 There is, therefore, no universally accepted guide for making the decision of when an athlete can safely return to play. It is universally accepted, however, that no athlete should return to play if he or she is still symptomatic at rest or with any exertional maneuvers.3,7,16 Additionally, the athlete should not be taking any medication that could minimize any of the signs or symptoms of concussion when the physician is determining whether he or she can return to activity.
Once you are assured that the player has no symptoms at rest, you can start him or her on a graded, step-by-step regimen for returning to play. Athletes should spend 24 to 48 hours at each level before progressing to the next. If symptoms return at any point, instruct the athlete to drop back down a step for 24 hours and then proceed with the progression as tolerated.9,10 The stages of activity are: 3,10
- Light aerobic exercise
- Moderate to intense aerobic exercise
- Sport-specific activities/noncontact training drills
- Full contact activities
- Game play.
Neuropsychological testing can help you decide
In 1989, Barth and colleagues evaluated 2300 college football players, 200 of whom had suspected concussion.17 Neuropsychological testing at 24 hours, 5 days, and 10 days showed a decline from baseline following a concussion, with the majority of the athletes returning to baseline by 10 days postconcussion. This finding led researchers to believe that testing could help identify concussions, and several computer-based testing products were developed.11,18
Neuropsychological testing should include measures of concentration, motor dexterity, information processing, visual and verbal memory, executive function, and brain stem function.19 Testing can be performed in the athletic setting with a Web-based computer program, by a sports medicine specialist with an interest in concussion, or by a neuro-psychologist with expertise in concussion.
Improvement in cognitive function as a concussion resolves may come prior to, or follow, the resolution of clinical symptoms. Therefore, it is important to properly assess cognition and symptoms before you make a recommendation about returning to play.3,10 Baseline performance parameters must be established before the season starts.
Neuropsychological testing can provide both an objective measure of the neuro-cognitive effects of concussion and the ability to track recovery. It may also assist in making return-to-play recommendations in complicated cases, but bear in mind that no data are available to suggest that return to play is safe once neuropsychological testing has returned to normal.3,9 Test results can aid clinical decision making, but cannot substitute for it. Testing may be most helpful in athletes with repeated concussions or those with persistent symptoms.10
Educating athletes, parents, and coaches in prevention
No foolproof method exists for preventing concussion in sports. Sports medicine research has focused on designing and testing safer equipment and on devising new rules to make play safer.20-22 At present, there is no evidence that protective equipment will prevent concussions, but recent studies by Collins and Viano suggest that newer football helmets may assist in decreasing the incidence of concussions.20,22,23
The Zurich consensus statement warns that protective equipment can have a paradoxical effect, influencing athletes to take risks that they might otherwise avoid, thus increasing injury rates.5 Trials of rule changes in different sports have been and continue to be conducted, such as barring spearing in football and restricting helmet-to-helmet hits. Given the frequency of concussion, further research is clearly needed. In the meantime, family physicians can play a major role in educating players, parents, and coaches about the seriousness of concussive injury and the need for identifying concussion promptly and allowing adequate time for recovery.
What do you tell Jeff?
Your answer for Jeff is, “You’re not ready to go back to practice or play. You feel OK when you’re resting, but when you get up, your headache returns. Come back to the office in a day or 2, and I’ll re-evaluate you. If you don’t have any symptoms then, you can start a program of graduated activity, beginning with some light aerobic exercise. If you feel all right with that, you can go on to a moderate and then an intense aerobic workout. If you still feel good, you can go on to sports-specific activities with no contact training, and then full contact training.
“At each stage, you will need to be re-evaluated by me or by your team trainer. Once you’ve finished the program without any reactivation of symptoms, I’ll clear you for play.”
CORRESPONDENCE Shawn M. Ferullo, MD, One Boston Medical Center Place, Boston, MA 02118; [email protected]
1. Cantu R. Cerebral concussion in sport: management and prevention. Sports Med. 1992;14:64-74.
2. Centers for Disease Control and Prevention. Nonfatal traumatic brain injuries from sports and recreational activities. MMWR Morb Mortal Wkly Rep. 2007;56:733-737.
3. American College of Sports Medicine. Special communications: concussion (mild traumatic brain injury) and the team physician: a consensus statement. Med Sci Sports Exerc. 2006;38:395-399.
4. Van Kampen D, Lovell M, Pardini J, et al. The “value added” of neurocognitive testing after sports-related concussion. Am J Sports Med. 2006;34:1630-1636.
5. McCrory P, Meeuwisse W, Johnston K, et al. Consensus statement on concussion in sport: the 3rd International Conference on Concussion in Sport held in Zurich, November 2008. Br J Sports Med. 2009;43(suppl I):i76-i84.
6. Powell J. Cerebral concussion: causes, effects and risks in sports. J Athl Training. 2001;36:307-311.
7. Cantu R. Posttraumatic retrograde and anterograde amnesia: pathophysiology and implications in grading and safe return to play. J Athl Training. 2001;36:244-248.
8. Oliaro S, Anderson S, Hooker D. Management of cerebral concussion in sports: the athletic trainer’s perspective. J Athl Training. 2001;36:257-262.
9. Concussion in sport group: Aubry M, Cantu R, Dvorak J, et al. Summary and Agreement Statement of the 1st International Symposium on Concussion in Sport. Vienna 2001. Clin J Sports Med. 2002;12:6-11.
10. McCrory P, Johnston K, Meeuwisse W, et al. Summary and agreement statement of the 2nd International Conference on Concussion in Sport. Prague 2004. Br J Sports Med. 2005;39:196-204.
11. Hoge C, McGurk D, Thomas J, et al. Mild traumatic brain injury in US soldiers returning from Iraq. N Engl J Med. 2008;358:453-463.
12. Harmon KG. Assessment and management of concussion in sports. Am Fam Physician. 1999;60:887-892.
13. American Academy of Neurology. Practice parameter: the management of concussion in sport (summary statement). Report of the Quality Standards Subcommittee. Neurology. 1997;48:581-585.
14. Cantu R. Guidelines for return to contact sports after cerebral concussion. Phys Sports Med. 1986;14:75-83.
15. Colorado Medical Society School and Sports Medicine Committee. Guidelines for the management of concussion in sports. Colo Med. 1990;87:4.-
16. Guskiewicz KM, Bruce SL, Cantu R, et al. Research based recommendations on management of sport related concussion: summary of the National Athletic Trainers’ Association Position Statement. Br J Sports Med. 2006;40:6-10.
17. Barth JT, Alves WA, Ryan TV, et al. Mild head injury in sports; neuropsychological sequelae and recovery of function. In: Levin HS, Eisenberg HM, Benton AL, eds. Mild Head Injury. New York: Oxford University Press; 1989:257–275.
18. Randolph C. Implementation of neuropsychological testing models for the high school, collegiate and professional sport settings. J Athl Training. 2001;36:288-296.
19. Maroon J, Lovell M, Norwig J, et al. Cerebral concussion in athletes: evaluation and neuropsychological testing. Neurosurgery. 2000;47:659-672.
20. Collins M, Lovell M, Iverson G, et al. Examining concussion rates and return to play in high school football players wearing newer helmet technology: a three year prospective cohort study. Neurosurgery. 2006;58:275-286.
21. Delaney J, Al-Kashmiri A, Drummond R, et al. The effect of protective headgear on head injuries and concussions in adolescent football (soccer) players. Br J Sports Med. 2008;42:110-115.
22. Viano D, Pellman E, Whitnall C, et al. Concussion in professional football: performance of newer helmets in reconstructed game impacts – Part 13. Neurosurgery. 2006;59:591-606.
23. Pellman E, Lovell M, Viano D, et al. Concussion in professional football: recovery of NFL and high school athletes assessed by neuropsychological testing – Part 12. Neurosurgery. 2006;58:236-274.
Dysmenorrhea and Irregular Uterine Bleeding
Dysmenorrhea and menorrhagia beyond the norm often overlap in adolescents and can occur in up to 15% of these young women.
The normal time period from breast development (thelarche) and development of pubic hair to menses in young girls is about 2 years. A longer time course is cause for investigation.
The maturation of the hypothalamic-pituitary-ovarian axis occurs over approximately 5 years. After initiation of menses (menarche), some adolescents have anovulatory cycles, i.e., no luteinizing hormone surge with subsequent lack of ovulation and dysfunctional estrogen effect on the uterine endometrial lining. This can present with irregular bleeding that can be very heavy when the endometrial lining sheds in an unsynchronized manner. If no other cause for this bleeding is established (for example, endocrine, anatomic, or underlying chronic disease), then it is considered dysfunctional uterine bleeding (DUB).
In the same time period of 5 years from menarche, an estimated 15%-30% of young women will have primary dysmenorrhea strong enough to require pain medication, including nonsteroidal anti-inflammatory drugs (NSAIDs).
The vast majority of young adolescent girls experience some pain with their periods, ranging from discomfort to pain requiring medication to being unable to go to school.
When the pain is severe, these patients either miss school or just make it through the school day, but their attention and performance suffer. These girls with significant pain need more assistance because their dysmenorrhea may not subside for several years, and a referral to a subspecialist is warranted.
In terms of differential diagnosis, menstrual pain (dysmenorrhea) is a crampy, focal phenomenon in the mid-lower quadrant, sometimes with radiation to the back and the lower extremities. It starts with the onset of menses. If the pain precedes menses, it may be endometriosis and not primary dysmenorrhea, although there is an overlap in the pain symptoms between these two entities. A nonleading question to ask is whether the patient experiences pain before, during, or after her cycle.
A gastrointestinal etiology is more likely if the pain is nonfocal and present in all four quadrants. Ruling out other GI etiologies, particularly constipation, is important. A trial of Miralax over 2-3 weeks with a cessation in the pain easily confirms constipation as the underlying cause. Constipation is very common in children and adolescents, and the pain is not related to the menstrual cycle.
Dysmenorrhea is a clinical diagnosis. Laboratory tests for this condition are not needed. Instead, a good history, detailed description of the pain, and ultrasound examination (transabdominal, not transvaginal) aid the differential diagnosis. Ultrasound is reassuring, as it can show normal uterine development and no ovarian masses, including no benign childhood ovarian tumors. Rarely is a pelvic examination necessary.
Pediatricians are instrumental in terms of educating patients, encouraging these patients to keep a detailed menstrual and pain diary, and advocating appropriate use of NSAIDs. However, if the diagnosis and management of teenagers with dysmenorrhea are outside your comfort zone, or your focus is primarily on younger children, you can refer the patient to a pediatric and adolescent gynecologist or other adolescent medicine specialist.
One problem for these patients is the use of Tylenol, which does not work on the elevated prostaglandins in primary dysmenorrhea. Instead, recommend an NSAID such as ibuprofen (Motrin, Advil), naproxen (Naprosyn), or mefenamic acid (Ponstel).
If pain relief is inadequate, switch classes of NSAIDs instead of switching between drugs in the same class.
Birth control pills are another option for controlling painful periods. For most girls with menses painful enough to impair their activities of daily living, birth control pills are a huge benefit. Oral contraceptives for 1-2 years for irregular bleeding and dysmenorrhea can make a big difference, and then you can try a trial period without them. Prescription of birth control pills requires a lot of education, particularly because these young patients need to be compliant. Create a routine for them—such as suggesting their pills be stored in a secure location with their toothbrush.
Parents also need to be vested in this approach, and some will be resistant. I recommend that you discuss birth control pills as a strategy to control pain and bleeding when the parents and the patient are both present. Educate parents that birth control pills will not give their daughters breast cancer or cause them to become sexually active. Any generic monophasic oral contraceptive with 30 mcg of estradiol can be used.
If you add birth control pills to NSAIDs, 95% of patients experience no pain or bearable pain. It can take up to 6 months for maximum relief, however, and these teenagers need to keep a menstrual and pain diary to track and appreciate the improvements over time.
Heating pads can be a comforting, nonpharmacologic strategy for managing dysmenorrhea. Some girls who use them report taking fewer NSAIDs. There also is some literature on the benefits of acupuncture, but it is not always practical in the United States.
DUB is a diagnosis of exclusion. In your differential diagnosis, rule out thyroid dysfunction, prolactinoma (a rare brain tumor), or any underlying chronic diseases (such as lupus) that affect the menstrual cycle. If you suspect anatomic abnormalities, a transabdominal ultrasound examination is indicated. You also have to consider polycystic ovarian syndrome (PCOS), because teenagers with this syndrome can present with irregular bleeding.
Laboratory tests for DUB are thyroid function, prolactin, and markers for PCOS. These assays include free and total testosterone, sex hormone–binding globulin, and androstenedione.
Most pediatricians know this, but if the first menses (menarche) is very heavy, you have to think of a bleeding disorder. This is an important diagnostic sign that additional work-up is warranted, and early intervention may be possible. If there is a bleeding disorder, early diagnosis could mean a lesser chance of hemorrhage during childbirth. Awareness among pediatricians is important because young girls rarely see gynecologists.
Classic DUB is related to menstrual cycle irregularities. There is a cohort of eggs recruited in the first half of the cycle (follicular phase). One follicle emerges that will rupture and release the egg at midcycle after luteinizing hormone levels spike in the body. If this sequence does not occur, the menstrual cycle is affected. The endometrial lining has proliferated under the effect of estrogen, and unsynchronized shedding with irregular bleeding occurs.
Again, you can take control of the menstrual cycle with birth control pills.
Be Alert to Red Flags Heralding Families at Risk
Stress is nothing new to American families, who—over the generations—have endured wars, epidemics, natural disasters, and numerous economic downturns.
Today's dismal economic climate with continuing unemployment poses real challenges for families.
You should be especially attuned to warning signs that more children in your practice may be at risk for hunger, displacement from their homes and schools, and poverty-associated trauma, both physical and psychological.
The statistics are sobering.
In June 2010, unemployment stood at 14.6 million people, or 9.5% of the working-age population nationwide. Even more people are jobless in some unfortunate states and cities—more than 14% in Nevada, for instance; 14.5% in Las Vegas, Nev.; and 27.6% in tiny El Centro, Calif.
Homelessness among American families is growing, with 170,000 families seeking shelter in 2009, up from 159,000 the year before, according to the U.S. Department of Housing and Urban Development.
Every 3 months, another 250,000 families' homes enter foreclosure, putting one child in every classroom at risk of losing his or her home, according to the Mortgage Bankers Association. That statistic is so stunning—home foreclosures impacting one child in every classroom—that it bears repeating as it indicates every pediatric practice has more red flags in terms of psychosocial stressors then at any time in most pediatrician's career.
Families, as always, face crises unrelated to the economy as well: illness, marital discord, substance abuse, and intergenerational pressures, but economic downturns increase the prevalence of almost all of the crises on this list.
Poverty is the elephant in the room, exposing children to a host of contributors to an unstable environment that sets the stage for poor academic performance, increased mental health disorders, conduct problems, substance abuse, and difficulties in relationships.
The first red flag raised by a family in economic trouble probably isn't even seen in the examining room, but in your billing department, where reimbursements are likely down and delinquent accounts are likely up.
A family may be unable to produce a copay for a visit, or may have lost health insurance along with mom or dad's job. They may report multiple changes in their address. Mail from your office may be returned as undeliverable.
This is, of course, an economic problem for you and your practice, but it likely heralds medical and psychosocial problems as well. A child whose family cannot pay for your services may be twice as likely as a financially secure child to have depression, anxiety, and learning problems at school.
Your office staff may want to alert you to financial red flags not only as they appear on the office balance sheet, but as they relate to your care of the child as well.
Moving, for example, has many implications for a child's development and well-being.
A new address may mean changes in a child's school and after-school activities, the loss of friends and close access to extended family members, and a shattering of the security of familiar places and routines. If the move was involuntary, say, a forced exit from a foreclosed home, parents may be so distracted and emotionally spent, they may not have devoted time to calmly explaining to the child what will change and what will stay the same.
I always think it's a good idea, but especially so in hard times, for you to ask one screening question of every family during routine office visits.
That bushel basket question is, “Are there any ongoing tensions affecting the family?”
Answers can potentially cover a lot of ground, and may open the door to a family sharing financial concerns, as well as any other issues that may be troubling them: a recent move, concern about a family member, or signs of domestic strife.
Red flags may appear during your examination as well. Immunizations may not be up to date, problems are suddenly arising at school, or a there may be a change in trajectory of the child's weight curve due to a lack of nutritious food.
Fatigue and stress associated with family troubles may be cloaked in somatic diagnoses: headaches, stomachaches, chest pain, weakness, or dizziness in a child who never had such complaints before or where these symptoms previously have signaled stress.
Take a good look at the parent accompanying your patient as well. Does the mother or father seem more withdrawn, sadder, or more anxious than expected?
Often, you have an internal red flag, a vaguely unsettled feeling that something is not right. Do not underestimate the value of this clinical sixth sense. Listen to it. It may not be anything specific that you can put your finger on or diagnose, but if you're getting that signal from within, sit down and take the pulse of the family in these troubling times.
A Deadly Month
The results of a new Journal of General Internal Medicine study that associates a 10% increase in medication-error-related deaths in teaching hospitals in July should not be ignored by hospitalists, says an associate residency program director.
Majid E. Cina, MD, FACP, a hospitalist and associate director at the University of Maryland School of Medicine in Baltimore, says the implication is that errors made by new medical interns are responsible for the spike, but HM leaders in academic settings shouldn’t draw too solid a conclusion. The spike could be tied to interns across a variety of departments, or the result of a series of other factors outside the scope of researchers.
“Correlations made by such studies are inherently flawed, with no certain cause-effect relationship established despite all attempts to control variables,” Dr. Cina says. “Still, these data cannot be ignored. ... Program directors should take heed.”
Researchers reported that inside medical institutions, in counties containing teaching hospitals, fatal medication errors spiked 10% in July and in no other month (JR=1.10; [1.06-1.14]) (J Gen Intern Med. 2010 Aug;25(8):774-779). Counties without teaching hospitals in the region had no spikes, and the greater the concentration of teaching hospitals in a region, the greater the July spike (R=0.80; P=0.005).
“After assessing competing explanations, we concluded that the July mortality spike results at least partly from changes associated with the arrival of new medical residents,” the study authors wrote.
Dr. Cina says his institution prioritizes the care of patients in July. Additional staff is put in place at the beginning of internships, which start a week early to allow for a smooth transition period. Senior staff also work longer hours in July, in close contact with residents on “a steep learning curve,” he says. “I recognized my work days will be much longer in July,” Dr. Cina adds.
As an academic hospitalist, Dr. Cina noted that new rules proposed by the Accreditation Council for Graduate Medical Education (ACGME) to reduce resident work hours might help mitigate medication-error-related deaths. Those regulations could go into effect in July 2011.
In the Literature: Research You Need to Know
Clinical question: Does the presence of deep vein thrombosis (DVT) in patients with pulmonary embolism (PE) have any prognostic value?
Background: There are variable mortality rates among patients with PE because of heterogeneous presentations. Concomitant DVT in patients with PE has an uncertain prognostic significance.
Study design: Prospective cohort study.
Setting: Hospital ED in Madrid, Spain.
Synopsis: Adult outpatients from the ED who underwent evaluation for possible acute PE from January 2003 through October 2007 were screened for DVT. Patients with a history of previous venous thromboembolism (VTE) were excluded.
The primary outcome of the study was all-cause mortality. Secondary outcomes included PE-specific mortality and recurrent symptomatic VTE.
Patients with concomitant DVT had an increased risk for recurrent VTE, along with increased risk of all-cause mortality and PE-specific mortality compared with those without concomitant DVT.
Bottom line: Assessment of the presence of absence of DVT can assist in risk stratification of patients with acute PE.
Citation: Jimenez D, Aujesky D, Diaz G, et al. Prognostic significance of deep vein thrombosis in patients presenting with acute symptomatic pulmonary embolism. Am J Respir Crit Care Med. 2010;181(9):983-991.
Reviewed for TH eWireby Alexander R. Carbo, MD, SFHM; Lauren Doctoroff, MD; John Fani Srour, MD; Matthew Hill, MD; Nancy Torres-Finnerty, MD, FHM; Anita Vanka, MD; Hospital Medicine Program, Beth Israel Deaconess Medical Center, Boston.
For more physician reviews of HM-related research, visit our website.
IHE Presenting as Chest Pain
Intramural hematoma of the esophagus (IHE) is a rare clinical entity. The majority of cases occur following esophageal instrumentation; however, other causes have been described.14 Rarely, IHE may develop spontaneously. We report a case of apparent spontaneous IHE (SIHE) in a patient presenting with acute‐onset chest pain and dysphagia who was taking low‐dose aspirin, bisphosphonate, and iron supplementation therapy. We highlight the evaluation of chest pain in these patients and the importance of considering the association between esophageal pathology and less commonly implicated medications which may increase the risk of esophageal injury.
Case Report
An 80‐year‐old Hispanic female with a history of osteoporosis, hypertension, and anemia presumed secondary to long‐standing noninsulin‐dependent diabetes mellitus presented with severe, abrupt‐onset, epigastric and retrosternal chest pain following ingestion of a banana. Home medications included aspirin (81 mg daily), alendronate (70 mg weekly), and ferrous sulfate (300 mg 3 times daily). She experienced nausea and minimal vomiting without hematemesis following the onset of pain. She admitted to several weeks of progressive dysphagia leading up to this event, but denied persistent vomiting, straining, foreign body ingestion, or trauma. At admission, the patient was afebrile with heart rate (HR) = 88, blood pressure (BP) = 172/88, pulse oximetry = 99% on room air, hemoglobin = 9.0 g/dL, hematocrit = 26.5%, platelets = 191,000, and international normalized ratio (INR) = 1.04. Electrocardiogram and cardiac enzymes were negative for myocardial infarction. Chest radiograph did not show a widened mediastinum. A computed tomography (CT) scan of the chest demonstrated diffuse thickening of the esophageal wall. Upper endoscopy demonstrated a large, purple, nonpulsatile submucosal mass protruding into and nearly occluding the esophageal lumen (Figure 1A). This mass extended 22 cm along the esophagus and terminated at the esophagogastric junction. There was suggestion of a potential distal mucosal tear and visible clot (Figure 1B, C). An endoscopy performed 6 years prior was unremarkable for esophagitis, stricture, mass, or hemorrhage.
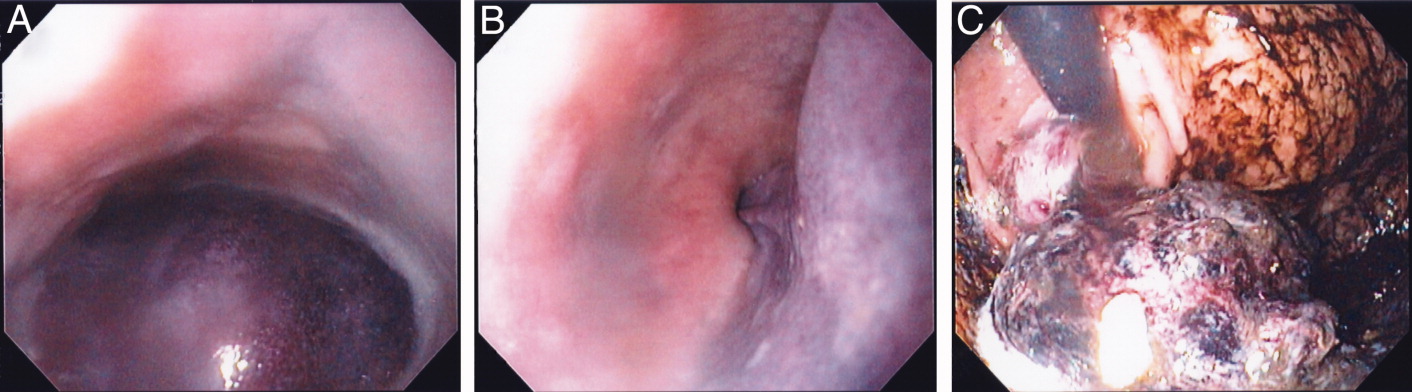
The patient remained nil‐per‐os and was managed conservatively with intravenous fluids, antiemetics, and acid‐suppression therapy. Due to persistent odynophagia, the patient did not tolerate per‐os nutrition, and a percutaneous gastrostomy tube was placed nonendoscopically for temporary nutritional support. The patient's hospital stay was complicated by deep vein thrombosis of the right peroneal vein, for which she underwent inferior vena cava filter placement. She was discharged 18 days following admission. Alendronate and aspirin were discontinued and not reinitiated, and a follow‐up CT scan 6 weeks posthospitalization demonstrated complete resolution of the hematoma.
Discussion
Esophageal injuries include lacerations (Mallory‐Weiss syndrome), perforations (Boerhaave's syndrome), and hematomas (ie, IHE). IHE is by far the least common of these 3 pathologies and, despite increasing reports, it remains a rare clinical entity. Criblez et al.,4 in a review of 91 cases, found that only 35% of patients present with the classic triad of retrosternal chest pain, dysphagia/odynophagia, and hematemesis, while 99% present with at least 1 of these.5 Presentations mimic other cardiothoracic emergencies including myocardial infarction,6 pulmonary embolism,2 aortic dissection,6 and aortoesophageal fistula. Misdiagnosis of IHE and treatment with anticoagulant or thrombolytic therapy can have disastrous consequences, including death.5 Electrocardiograms, chest radiographs, and cardiac enzymes are often normal, as in this case. Endoscopy, performed cautiously, typically reveals a nonpulsatile, purple, submucosal mass. CT, which is rapid, noninvasive, and capable of differentiating between esophageal and life‐threatening thoracomediastinal pathology, frequently demonstrates thickening of the posterior wall of the esophagus with a long, smooth filling‐defect and luminal narrowing.7 Conservative management is the mainstay of treatment with most patients receiving acid suppression and antiemetic therapy. Surgical treatment and antibiotics (in cases of suspected infection) are required infrequently and should be used conservatively when necessary. The vast majority of patients recover spontaneously. Long‐term complications are rare.
IHE most frequently results from esophageal instrumentation, but other antecedent causes have been described. In contrast, SIHE occurs without warning, frequently developing in the absence of vomiting or hematemesis. Since SIHE was first reported in 1970,8 many authors have postulated potential mechanisms of hematoma formation. Controversy remains as to the precise etiology, but recent reports emphasize the association between SIHE and antiplatelet therapy, including low‐dose aspirin,9, 10 aspirin plus dipyridamole,11 and clopidogrel.12 Few studies have identified mechanisms for why the hemorrhage remains in the esophagus and why other parts of the gastrointestinal tract or other organ systems are not involved.
We report a case of apparent SIHE in a patient taking low‐dose aspirin, alendronate, and ferrous sulfate. While a subclinical traumatic event cannot be completely excluded, this patient lacked any apparent antecedent symptoms or other etiologic explanation. Alendronate and ferrous sulfate have been implicated in upper gastrointestinal irritation, but have not previously been associated with SIHE. Park et al.13 estimated a 3.0% incidence of esophageal or gastric events in alendronate users. Recently, esophagitis dissecans superficialis,3 esophageal dissection,14 and even fatal esophageal perforation16 have been reported in patients taking alendronate. Iron supplementation is also a recognized cause of esophageal injury. High local iron saturation may lead to concentration‐dependent absorption and thereby the formation of reactive oxygen metabolites and mucosal injury.16
We hypothesize that alendronate in combination with ferrous sulfate therapy resulted in subclinical esophageal injury predisposing our patient to SIHE. The patient reported 2 weeks of dysphagia prior to admission, suggesting a period of esophageal irritation. On endoscopy, a potential distal esophageal mucosal tear and clot were observed, which may represent a focus of injury. The interaction between this alendronate‐induced injury and chronic antiplatelet therapy may have resulted in hematoma expansion 22 cm along the esophagus. We are aware of one other report of IHE in a patient taking aspirin and alendronate published as an abstract in the Iranian Govaresh Journal.17
A spectrum of less‐commonly‐implicated medications may exert local toxicity on the esophagus and lead to de novo esophageal damage, predisposing patients to a broad spectrum of esophageal pathology, ranging from focal esophageal damage to large hematoma or perforation. Numerous medications are known to be associated with esophageal pathology through a variety of mechanisms (Table 1). Anatomic and motility disorders, as well as pill‐specific factors including contact time, coating materials, and sustained release formulations, may influence toxicity and predispose to injury.18 Elderly patients may be especially susceptible to the combined interactions between antiplatelet therapy and these commonly prescribed or over‐the‐counter medications.
| |
| Nonsteroidal antiinflammatory drugs | Aspirin, naproxen, ibuprofen |
| Bisphosphonates | Alendronate, etidronate, pamidronate |
| Antibiotics | Tetracycline, doxycycline, clindamycin, penicillin |
| Antiviral agents | Zalcitibine, zidovudine, nelfanavir |
| Chemotherapeutic agents | Dactinomycin, bleomycin, cytarabine, daunorubicin, 5‐fluorouracil, methotrexate, vincristine |
| Others | Ferrous sulfate, potassium chloride, ascorbic acid, multivitamins, quinidine, theophylline |
Conclusions
We report a case of apparent SIHE in an elderly woman taking low‐dose aspirin, iron, and alendronate therapy who presented with acute‐onset retrosternal chest pain and dysphagia. We emphasize the importance of including esophageal pathology in the evaluation of chest pain in these patients, particularly elderly women. We encourage a thorough examination of symptoms, including dysphagia/odynophagia, and an exhaustive medication history to identify medications less‐commonly implicated with esophageal pathology. In patients with chest pain taking these medications, clinicians must remain vigilant in their diagnostic approach to prevent misdiagnosis and inappropriate treatment.
Acknowledgements
The authors acknowledge and thank Dr. Sonal Singh for his assistance in helping to analyze the potential drug interactions involved in this case presentation.
- ,,.Post‐sclerotherapy intramural esophageal hematoma: endoscopic and radiologic findings.Gastrointest Endosc.1992;38:102–103.
- ,,.Esophageal hematoma. Four new cases, a review, and proposed etiology.Dig Dis Sci.1981;26:1019–1024.
- ,,.Spontaneous dissecting intramural hematoma of the oesophagus: a rare cause of haematemesis and dysphagia.Endoscopy.1981;13:128–130.
- ,,,,.Intramural rupture and intramural hematoma of the esophagus: 3 case reports and literature review.Schweiz Med Wochenschr.1992;122:416–423.
- ,.Dissecting intramural hematoma of the esophagus.Eur J Gastroenterol Hepatol.2000;12:1151–1161.
- ,,.Spontaneous intramural hematoma of the oesophagus: a report of three cases and review of the literature.Aust N Z J Surg.1994;64:190–193.
- ,,,,.Intramural hematoma of the esophagus: a pictorial essay.Emerg Radiol.2008;15(1):13–22.
- ,.Spontaneous cervico‐mediastinal haematoma.J Ir Med Assoc.1970;63:298.
- ,,,,,.Giant esophageal hematoma: possible association with low‐dose aspirin.Gastroenterol Hepatol.2004;27(8):460–463.
- ,,,.Intramural esophageal hematoma. Clinical and endoscopic evolution.Med Clin.2004;123(1):39.
- ,.Spontaneous intramural esophageal hematoma. Diagnosis by CT scanning.J Clin Gastroenterol.1987;9(5):546–548.
- ,,,.Intramural hematoma of the esophagus: a rare cause of chest pain.Am J Emerg Med.2008;26(7):843.e1–e2.
- ,,,.Incidence of adverse oesophageal and gastric events in alendronate users.Pharmacoepidemiol Drug Saf.2000;9(5):371–376.
- ,,.An elderly man with excruciating retrosternal pain and dysphagia.CMAJ.2005;172:1556.
- ,.Fatal esophageal perforation with alendronate.Am J Gastroenterol.2001;96:3212–3213.
- ,,.Erosive injury to the upper gastrointestinal tract in patients receiving iron medication: an underrecognized entitiy.Am J Surg Pathol.1999;23:1241–1247.
- ,.[A case report of esophageal intramural hematoma.] [English abstract on p.4 of the pdf].Govaresh J.2006;11(1):39–41. [Farsi] Available at: http://www.iagh.org/Portals/44fa7561‐56f7‐47e4‐a228‐477ca071e439/Volume%2011,%20Number%201,%20Spring%202006/(1)Dr_bagheri‐11‐1‐7.pdf. Accessed October 2009.
- .Esophageal disorders caused by medications, trauma, and infection. In:Feldman M, Friedman L, Brandt L, eds.Sleisenger and Fordtran's Gastrointestinal and Liver Disease.8th ed.Philadelphia:Saunders;2006:937–948.
Intramural hematoma of the esophagus (IHE) is a rare clinical entity. The majority of cases occur following esophageal instrumentation; however, other causes have been described.14 Rarely, IHE may develop spontaneously. We report a case of apparent spontaneous IHE (SIHE) in a patient presenting with acute‐onset chest pain and dysphagia who was taking low‐dose aspirin, bisphosphonate, and iron supplementation therapy. We highlight the evaluation of chest pain in these patients and the importance of considering the association between esophageal pathology and less commonly implicated medications which may increase the risk of esophageal injury.
Case Report
An 80‐year‐old Hispanic female with a history of osteoporosis, hypertension, and anemia presumed secondary to long‐standing noninsulin‐dependent diabetes mellitus presented with severe, abrupt‐onset, epigastric and retrosternal chest pain following ingestion of a banana. Home medications included aspirin (81 mg daily), alendronate (70 mg weekly), and ferrous sulfate (300 mg 3 times daily). She experienced nausea and minimal vomiting without hematemesis following the onset of pain. She admitted to several weeks of progressive dysphagia leading up to this event, but denied persistent vomiting, straining, foreign body ingestion, or trauma. At admission, the patient was afebrile with heart rate (HR) = 88, blood pressure (BP) = 172/88, pulse oximetry = 99% on room air, hemoglobin = 9.0 g/dL, hematocrit = 26.5%, platelets = 191,000, and international normalized ratio (INR) = 1.04. Electrocardiogram and cardiac enzymes were negative for myocardial infarction. Chest radiograph did not show a widened mediastinum. A computed tomography (CT) scan of the chest demonstrated diffuse thickening of the esophageal wall. Upper endoscopy demonstrated a large, purple, nonpulsatile submucosal mass protruding into and nearly occluding the esophageal lumen (Figure 1A). This mass extended 22 cm along the esophagus and terminated at the esophagogastric junction. There was suggestion of a potential distal mucosal tear and visible clot (Figure 1B, C). An endoscopy performed 6 years prior was unremarkable for esophagitis, stricture, mass, or hemorrhage.
The patient remained nil‐per‐os and was managed conservatively with intravenous fluids, antiemetics, and acid‐suppression therapy. Due to persistent odynophagia, the patient did not tolerate per‐os nutrition, and a percutaneous gastrostomy tube was placed nonendoscopically for temporary nutritional support. The patient's hospital stay was complicated by deep vein thrombosis of the right peroneal vein, for which she underwent inferior vena cava filter placement. She was discharged 18 days following admission. Alendronate and aspirin were discontinued and not reinitiated, and a follow‐up CT scan 6 weeks posthospitalization demonstrated complete resolution of the hematoma.
Discussion
Esophageal injuries include lacerations (Mallory‐Weiss syndrome), perforations (Boerhaave's syndrome), and hematomas (ie, IHE). IHE is by far the least common of these 3 pathologies and, despite increasing reports, it remains a rare clinical entity. Criblez et al.,4 in a review of 91 cases, found that only 35% of patients present with the classic triad of retrosternal chest pain, dysphagia/odynophagia, and hematemesis, while 99% present with at least 1 of these.5 Presentations mimic other cardiothoracic emergencies including myocardial infarction,6 pulmonary embolism,2 aortic dissection,6 and aortoesophageal fistula. Misdiagnosis of IHE and treatment with anticoagulant or thrombolytic therapy can have disastrous consequences, including death.5 Electrocardiograms, chest radiographs, and cardiac enzymes are often normal, as in this case. Endoscopy, performed cautiously, typically reveals a nonpulsatile, purple, submucosal mass. CT, which is rapid, noninvasive, and capable of differentiating between esophageal and life‐threatening thoracomediastinal pathology, frequently demonstrates thickening of the posterior wall of the esophagus with a long, smooth filling‐defect and luminal narrowing.7 Conservative management is the mainstay of treatment with most patients receiving acid suppression and antiemetic therapy. Surgical treatment and antibiotics (in cases of suspected infection) are required infrequently and should be used conservatively when necessary. The vast majority of patients recover spontaneously. Long‐term complications are rare.
IHE most frequently results from esophageal instrumentation, but other antecedent causes have been described. In contrast, SIHE occurs without warning, frequently developing in the absence of vomiting or hematemesis. Since SIHE was first reported in 1970,8 many authors have postulated potential mechanisms of hematoma formation. Controversy remains as to the precise etiology, but recent reports emphasize the association between SIHE and antiplatelet therapy, including low‐dose aspirin,9, 10 aspirin plus dipyridamole,11 and clopidogrel.12 Few studies have identified mechanisms for why the hemorrhage remains in the esophagus and why other parts of the gastrointestinal tract or other organ systems are not involved.
We report a case of apparent SIHE in a patient taking low‐dose aspirin, alendronate, and ferrous sulfate. While a subclinical traumatic event cannot be completely excluded, this patient lacked any apparent antecedent symptoms or other etiologic explanation. Alendronate and ferrous sulfate have been implicated in upper gastrointestinal irritation, but have not previously been associated with SIHE. Park et al.13 estimated a 3.0% incidence of esophageal or gastric events in alendronate users. Recently, esophagitis dissecans superficialis,3 esophageal dissection,14 and even fatal esophageal perforation16 have been reported in patients taking alendronate. Iron supplementation is also a recognized cause of esophageal injury. High local iron saturation may lead to concentration‐dependent absorption and thereby the formation of reactive oxygen metabolites and mucosal injury.16
We hypothesize that alendronate in combination with ferrous sulfate therapy resulted in subclinical esophageal injury predisposing our patient to SIHE. The patient reported 2 weeks of dysphagia prior to admission, suggesting a period of esophageal irritation. On endoscopy, a potential distal esophageal mucosal tear and clot were observed, which may represent a focus of injury. The interaction between this alendronate‐induced injury and chronic antiplatelet therapy may have resulted in hematoma expansion 22 cm along the esophagus. We are aware of one other report of IHE in a patient taking aspirin and alendronate published as an abstract in the Iranian Govaresh Journal.17
A spectrum of less‐commonly‐implicated medications may exert local toxicity on the esophagus and lead to de novo esophageal damage, predisposing patients to a broad spectrum of esophageal pathology, ranging from focal esophageal damage to large hematoma or perforation. Numerous medications are known to be associated with esophageal pathology through a variety of mechanisms (Table 1). Anatomic and motility disorders, as well as pill‐specific factors including contact time, coating materials, and sustained release formulations, may influence toxicity and predispose to injury.18 Elderly patients may be especially susceptible to the combined interactions between antiplatelet therapy and these commonly prescribed or over‐the‐counter medications.
| |
| Nonsteroidal antiinflammatory drugs | Aspirin, naproxen, ibuprofen |
| Bisphosphonates | Alendronate, etidronate, pamidronate |
| Antibiotics | Tetracycline, doxycycline, clindamycin, penicillin |
| Antiviral agents | Zalcitibine, zidovudine, nelfanavir |
| Chemotherapeutic agents | Dactinomycin, bleomycin, cytarabine, daunorubicin, 5‐fluorouracil, methotrexate, vincristine |
| Others | Ferrous sulfate, potassium chloride, ascorbic acid, multivitamins, quinidine, theophylline |
Conclusions
We report a case of apparent SIHE in an elderly woman taking low‐dose aspirin, iron, and alendronate therapy who presented with acute‐onset retrosternal chest pain and dysphagia. We emphasize the importance of including esophageal pathology in the evaluation of chest pain in these patients, particularly elderly women. We encourage a thorough examination of symptoms, including dysphagia/odynophagia, and an exhaustive medication history to identify medications less‐commonly implicated with esophageal pathology. In patients with chest pain taking these medications, clinicians must remain vigilant in their diagnostic approach to prevent misdiagnosis and inappropriate treatment.
Acknowledgements
The authors acknowledge and thank Dr. Sonal Singh for his assistance in helping to analyze the potential drug interactions involved in this case presentation.
- ,,.Post‐sclerotherapy intramural esophageal hematoma: endoscopic and radiologic findings.Gastrointest Endosc.1992;38:102–103.
- ,,.Esophageal hematoma. Four new cases, a review, and proposed etiology.Dig Dis Sci.1981;26:1019–1024.
- ,,.Spontaneous dissecting intramural hematoma of the oesophagus: a rare cause of haematemesis and dysphagia.Endoscopy.1981;13:128–130.
- ,,,,.Intramural rupture and intramural hematoma of the esophagus: 3 case reports and literature review.Schweiz Med Wochenschr.1992;122:416–423.
- ,.Dissecting intramural hematoma of the esophagus.Eur J Gastroenterol Hepatol.2000;12:1151–1161.
- ,,.Spontaneous intramural hematoma of the oesophagus: a report of three cases and review of the literature.Aust N Z J Surg.1994;64:190–193.
- ,,,,.Intramural hematoma of the esophagus: a pictorial essay.Emerg Radiol.2008;15(1):13–22.
- ,.Spontaneous cervico‐mediastinal haematoma.J Ir Med Assoc.1970;63:298.
- ,,,,,.Giant esophageal hematoma: possible association with low‐dose aspirin.Gastroenterol Hepatol.2004;27(8):460–463.
- ,,,.Intramural esophageal hematoma. Clinical and endoscopic evolution.Med Clin.2004;123(1):39.
- ,.Spontaneous intramural esophageal hematoma. Diagnosis by CT scanning.J Clin Gastroenterol.1987;9(5):546–548.
- ,,,.Intramural hematoma of the esophagus: a rare cause of chest pain.Am J Emerg Med.2008;26(7):843.e1–e2.
- ,,,.Incidence of adverse oesophageal and gastric events in alendronate users.Pharmacoepidemiol Drug Saf.2000;9(5):371–376.
- ,,.An elderly man with excruciating retrosternal pain and dysphagia.CMAJ.2005;172:1556.
- ,.Fatal esophageal perforation with alendronate.Am J Gastroenterol.2001;96:3212–3213.
- ,,.Erosive injury to the upper gastrointestinal tract in patients receiving iron medication: an underrecognized entitiy.Am J Surg Pathol.1999;23:1241–1247.
- ,.[A case report of esophageal intramural hematoma.] [English abstract on p.4 of the pdf].Govaresh J.2006;11(1):39–41. [Farsi] Available at: http://www.iagh.org/Portals/44fa7561‐56f7‐47e4‐a228‐477ca071e439/Volume%2011,%20Number%201,%20Spring%202006/(1)Dr_bagheri‐11‐1‐7.pdf. Accessed October 2009.
- .Esophageal disorders caused by medications, trauma, and infection. In:Feldman M, Friedman L, Brandt L, eds.Sleisenger and Fordtran's Gastrointestinal and Liver Disease.8th ed.Philadelphia:Saunders;2006:937–948.

Inpatient Hypertension Review
Hypertension (HTN) is highly prevalent in the general adult population with recent estimates from the National Health and Nutrition Examination Survey (NHANES) of 29% in the United States.1, 2 The relationship between increasing levels of blood pressure (BP) and increasing risk for cardiovascular disease events and stroke is well established.3 However, while 64% of treated HTN patients have a BP 140/90 mmHg, overall control rates for HTN in the adult population remain at approximately 44%.2 The 20% discrepancy in control rates between treated patients and the overall adult population reflects the fact that approximately 30% of patients are unaware of their HTN and that a substantial proportion of aware patients remain untreated. Historically, efforts to improve the recognition, treatment, and control of HTN have appropriately focused on the outpatient setting. However, programs to extend screening for HTN outside the clinic into the community, schools, and even dentists' offices have been around for some time.49
The potential also exists to improve the recognition, treatment, and control of HTN by focusing on hospitalized patients. Hospitalization is common in the U.S. with almost 35 million acute hospitalizations and more than 45,000 inpatient surgical procedures in 2006.10 Inpatient populations have increased in age and comorbidity over the past 3 decades whereas lengths of stay and continuity of care between the inpatient and outpatient arenas have diminished.10, 11 Multiple prior studies examining BP in different settings have noted that average BP among hospitalized patients is not systematically higher than that of outpatients.1214 Thus, patients with persistently elevated BP in the inpatient setting without mitigating factors may have HTN that will persist after hospital discharge. However, little information is available regarding the actual prevalence of HTN in the inpatient population and care patterns for inpatient HTN. Therefore, we performed a systematic review of the English‐language medical literature in order to describe the epidemiology of HTN observed in the inpatient setting.
Methods
Our search strategy was designed to identify randomized‐controlled trials, meta‐analyses, and observational studies that: (1) reported estimates of the prevalence of HTN in the inpatient setting, and (2) used HTN diagnosis or treatment as a primary focus. We performed an extensive review of the peer‐reviewed, English language medical literature in MEDLINE using a predetermined search algorithm. Search terms included HTN[Mesh] or BP[Mesh]. These results were cross‐referenced with the following search terms: Inpatients[Mesh] or Hospitalization[title/abstract] or Hospitalized[title/abstract]. Articles were further narrowed using the following terms: Prevalence[Mesh] or Epidemiology[Mesh] or Treatment[title/abstract] or Management [title/abstract]. Limits employed included limiting to humans and to adults 19 years‐of‐age and older. Studies published prior to 1976 were excluded because 1976 was the first year that the Joint National Committee on Prevention, Detection, Evaluation, and Treatment of High BP published consensus guidelines for the diagnosis and management of HTN. We also excluded randomized, controlled trials that recorded measures of inpatient BP but whose focus was not HTN, because such trials would not answer the primary epidemiologic question of this review. We did include trials focused on subspecialty populations for which the diagnosis and inpatient management of HTN were key outcomes.
Next, the bibliographies of reviewed studies were investigated for additional relevant reports. Abstracts from the American Heart Association (AHA) were reviewed for the past 15 years for reports that were presented but not subsequently published and available in MEDLINE. We also searched for articles using the online Google search engine. One author (RNA) performed the preliminary MEDLINE search and abstract review with the assistance of a reference librarian (LC), and a second author (BME) also reviewed full‐text articles for potential inclusion. Ultimate decision for study inclusion was reached through discussion among authors. Finally, a list of potential articles was submitted to 2 experts in this field of study to determine whether other reports met our inclusion criteria for this systematic review but were overlooked.
Results
Search Results
The initial MEDLINE search algorithm yielded a total of 826 articles. After title and abstract review, 41 full‐text articles were obtained for detailed review, and 5 met criteria for inclusion. Three additional articles were discovered through searching the bibliographies of the included studies. No AHA abstracts addressed this subject area. Experts were not aware of any additional studies. One article was located using a Google search. In all, 9 articles were deemed suitable for inclusion in this review. Search results at each stage are depicted in Figure 1.
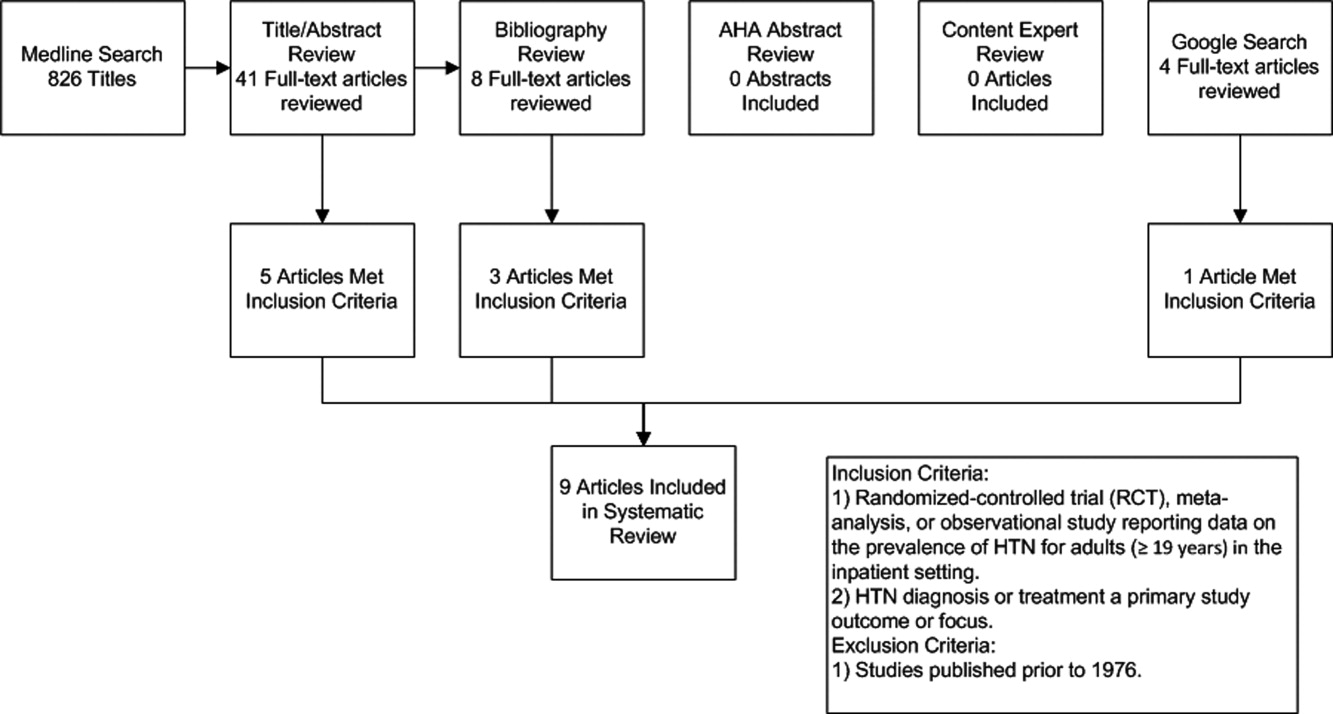
Description of Included Studies
Characteristics of included studies are depicted in Table 1. Two older retrospective cohort studies reported HTN prevalence using earlier, less stringent diagnostic criteria. Shankar et al.15 abstracted data from more than 19,000 adults discharged alive from Maryland hospitals during 1978. Greenland et al.16 performed chart review for 536 medical and surgical inpatients in 1987 reporting information on the proportion of patients appropriately diagnosed as having HTN and the proportion with controlled BP on admission and at discharge based on then‐current JNC‐III criteria (HTN if BP > 160/90).
| Study | Design | Setting | Hypertension Prevalence | Diagnostic Criteria for HTN |
|---|---|---|---|---|
| ||||
| Shankar et al.15 (1982) | Retrospective cohort | All hospital discharges in Maryland in 1978 | 23.8% (4571/19,259) | HTN diagnosis in record or diastolic BP 100 mm Hg |
| Greenland et al.16 (1987) | Retrospective cohort | Single University Center, U.S., medical/surgical patients | 28% (143/536 ) | HTN diagnosis in record or mean of first 4 hospital BP measures 160/90 mm Hg |
| Euroaspire I17 | Retrospective cohort with prospective follow up | 9 European countries, coronary heart disease admissions | 57.8% (2553/4415) | Admission BP 140/90 mm Hg or on antihypertensive medications |
| Euroaspire II18 | Retrospective cohort with prospective follow up | 15 European countries, coronary heart disease admissions | 50.5% (2806/5556) | Mean clinic BP at 618 months follow up of 140/90 mm Hg |
| Amar et al.20 (2002) | Retrospective cohort | 77 Cardiology centers, France, ischemic heart disease admissions | 58.5% (729/1247) | HTN diagnosis in record or admission BP 140/90 mm Hg |
| Onder et al.23 (2003) | Cross‐sectional | 81 Hospitals, Italy, elderly patients with known HTN | *86.9% (3304/3807) | HTN diagnosis in record AND admission BP 140/90 mm Hg |
| Jankowski et al.19 (2005) | Retrospective cohort with prospective follow up | 3 University cardiology centers, Poland | 70.2% (593/845) | Mean clinic BP at 618 months follow up of 140/90 mm Hg |
| Conen et al.21 (2006) | Cross‐sectional | Single University Center, U.S., medical/surgical patients | 72.6% (228/314) | HTN diagnosis in record OR mean 24‐hour BP 125/80 mm Hg |
| Giantin et al.22 (2009) | Cross‐sectional | Single University Center, Italy, medical/surgical patients | 56.4% (141/250) | Mean 24‐hour BP 125/80 mm Hg |
| Clinical Question | Findings |
|---|---|
| |
| Accuracy of routine inpatient BP measurements | 56.4% to 72.6% of inpatients receiving 24 hour BP monitoring had HTN.21, 22 |
| 28% to 38% of HTN patients had masked HTN (identified by 24‐hour monitoring but not revealed by routine inpatient BP measures). | |
| Proportion of HTN patients uncontrolled on admission | 86.9% of patients with previously documented HTN were uncontrolled on admission.23 |
| Proportion of HTN patients uncontrolled at discharge | 37% to 77% of inpatients with HTN still had BP > 140/90 mm Hg at time of discharge.16, 20, 23 |
| Proportion of HTN patients without a recorded diagnosis at discharge | 8% to 44% of patients with elevated BP > 140/90 mmHg were discharged without a documented diagnosis of HTN.15, 16, 18, 19 |
| Proportion of uncontrolled HTN patients receiving intensification of therapy during index admission | 53.1% of patients with uncontrolled BP received additional antihypertensive medication upon discharge.23 |
| Proportion of HTN controlled at follow up | 50% of patients with HTN were controlled to 140/90 mm Hg at follow up.17 |
Four studies focused primarily on cardiac patients. The European Society of Cardiology survey of secondary prevention of coronary heart disease (EUROASPIRE I) and subsequent EUROASPIRE II studies used retrospective chart review and prospective follow up clinic visits with a focus on baseline patient characteristics and risk factor modification at post‐discharge follow up.17, 18 Jankowski et al.19 studied 845 similar cardiac patients discharged from 6 Polish centers. Amar et al.20 performed a retrospective cohort study using records from 77 French cardiology centers to assess the impact of BP control prior to discharge in patients with acute coronary syndromes on the prevention of subsequent nonfatal myocardial infarction (MI) and cardiac death.
Two studies utilized 24‐hour BP monitoring to diagnose HTN among inpatients, and compared this to routine inpatient measurement techniques. Conen et al.21 performed 24‐hour BP monitoring on 314 consecutive stable medical and surgical inpatients admitted to a Swiss University hospital. Giantin et al.22 also performed 24‐hour monitoring on a cohort of elderly Italian outpatients and inpatients to determine the prevalence of masked and white coat HTN in different care settings. Finally, Onder et al.23 reported on rates of uncontrolled BP and HTN management among known hypertensives as part of a series of cross‐sectional surveys performed on elderly Italian inpatients.23
Inpatient HTN Prevalence
Overall, study authors reported an HTN prevalence among inpatients that ranged from 50.5% to 72%. Estimates varied somewhat based on HTN definitions, diagnostic standards utilized, measurement techniques, and patient populations. In earlier studies HTN prevalence was reported at 23.8% to 28%, but these likely represented significant underestimates by current diagnostic standards.15, 16 High estimates by Onder et al.23 (86.9%) stem from selection criteria that included a prior billing diagnosis of HTN coupled with elevated admission blood pressures. Estimates in the 50% to 70% prevalence range were seen in studies that focused on cardiac and general medical inpatients.1722 Additional findings of included studies are listed in Table 2.
Accuracy of Inpatient BP Measures
In two studies, 24‐hour BP monitors produced prevalence estimates ranging from 56.4% to 72.6%.21, 22 In both studies, a significant proportion of patients had masked HTN, or HTN detected by 24‐hour BP monitoring alone. Also, 28% to 38% of patients without a prior HTN diagnosis, who were not detected by routine measures, were found to be hypertensive by 24‐hour monitoring. Finally, Conen et al.21 retested a subset of hypertensives with 24‐hour monitoring one month after hospitalization, and 87.5% remained categorized as hypertensive on follow‐up. Of note, it is unclear how this subset of patients was selected.
Proportion of Controlled HTN on Admission and Discharge
Because most included studies established prevalence of HTN based in part upon uncontrolled BP at hospital admission, estimates for the proportion of hypertensive patients controlled on admission were not given. However, Onder et al.23 did examine patients with a prior International Classification of Diseases, 9th edition (ICD‐9) diagnosis of HTN and uncontrolled HTN (BP 140/90) on admission. At discharge, only 23.2% of this cohort was controlled with a BP 140/90 mmHg. However, other estimates suggested that 37% to 44% of patients remained uncontrolled at discharge.16, 20
Proportion of Undiagnosed HTN
In 4 studies, the proportion of patients with elevated BP and/or a history of HTN who did not receive a diagnosis of HTN upon discharge ranged from 8.8% to 44% between cohorts.15, 16, 18, 19 Interpretation of these estimates, however, is difficult due to significant differences between the studies. For example, both earlier studies were performed during an era of higher thresholds for HTN diagnosis and lower overall HTN awareness.15, 16 Both studies of cardiac patients suggested lower rates of nondiagnosis than might have been found in general medical or surgical inpatients.18, 19 One of the 4 studies also suggested that surgical patients who were hypertensive during hospitalization were more likely than medical patients to be discharged without a HTN diagnosis (17% vs. 4%, P 0.05); although, the overall number of patients was small (18/146 remained undiagnosed).16
Proportion Receiving Intensification of Therapy
In 3 studies, prescribing practices for hypertensive inpatients were discussed. Shankar et al.15 found that only 62% of patients with a recorded HTN diagnosis received antihypertensive medications during hospitalization. Unfortunately, no information was given on the proportion of patients prescribed antihypertensive medications at the time of discharge. However, Greenland et al.16 found no net increase in BP medication use at discharge compared to admission despite 44% of patients remaining uncontrolled to 160/90 mmHg at the time of discharge. Onder et al.23 determined that BP medication was intensified in only 53.1% of hypertensive patients during hospitalization. Younger age, fewer drugs on admission, lower comorbidity index, diagnosis of congestive heart failure, lengthy hospital stay, and increasing levels of BP (systolic and diastolic) were all associated with more aggressive prescribing practices. Interestingly, Jankowski et al.19 found that treatment with a BP lowering agent at discharge was associated with the lowest odds of nontreatment at follow up (odds ratio [OR] 0.08, 95% confidence interval [CI] 0.030.19).
Proportion of HTN Controlled at Follow Up
In the EuroASPIRE 1 study, 50% of HTN patients had a systolic BP of 140 mm Hg at follow up 6 months after hospitalization for MI.17 Jankowski et al.19 found that patients with documented inpatient HTN but without a recorded HTN diagnosis during index admission were 4 times more likely (19.2% vs. 4.5%, P 0.0001) to be untreated for their HTN at 6 to 18 months postdischarge, and they were less likely to be controlled at 140/90 mmHg. In a separate cohort of cardiac patients, multivariable modeling identified uncontrolled isolated systolic HTN at hospital discharge as an independent predictor of subsequent cardiac death or nonfatal MI at 6 months follow up (OR, 1.96; 95% CI, 1.153.36).20
Discussion
The present systematic review highlights the high prevalence of HTN with contemporary estimates ranging between 50% and 72% in general medical/surgical and cardiology populations. Furthermore, routine inpatient BP measurements may underestimate the prevalence of HTN among inpatients when compared to 24 hour BP monitoring; although there is no current diagnostic standard for HTN among inpatients. Among patients with uncontrolled BP on admission, BP typically remains above recommended levels at the time of discharge. Further, studies commenting on the prescribing practices at the time of discharge did not detect a strong tendency to intensify antihypertensive regimens in patients with uncontrolled inpatient HTN.16, 23 Most importantly, our data suggest that the medical literature is lacking: only 9 reports met our inclusion criteria for this review.
The validity of inpatient BP measures for making an HTN diagnosis remains a concern when asserting that the inpatient setting is appropriate for HTN screening and efforts to improve BP control. For example, BP measures might be inaccurate because of the inherent heterogeneity of patients with acute illness often with associated pain and nausea that might raise or lower BP. Inpatients often need to have their BP medications held for appropriate reasons, or they may have additional medications while hospitalized that also affect BP. Finally, BP measures in the inpatient setting are less commonly performed using standardized techniques or with accurate BP devices. However, both studies included in this review featuring follow up outpatient BP measures found high degrees of correlation between inpatient and outpatient measures.19, 21 Also, Giantin and colleagues reported that 28.6% of elderly patients who were normotensive based on routine BP measures, were actually hypertensive based on 24‐hour ambulatory BP monitoring.22
Some clinicians may have concerns about starting or titrating BP medications in dynamic hospitalized patients. Certainly, this should be done with caution and in appropriately selected patients. We would argue that achieving complete BP control during an index hospitalization as emphasized by Greenland and Amar is not always the most appropriate goal. However, appropriate recognition of persistently elevated BP does offer the opportunity to make an HTN diagnosis and to refer for future outpatient treatment or to communicate with existing primary care providers. The latter is especially important in this era of discontinuity between inpatient and outpatient care. Beginning or titrating BP medications in the hospital also has advantages for 2 reasons. First, medications started in the hospital tend to be the medications on which patients are sent home. Second, in the study by Jankowski et al.,19 the failure to prescribe an antihypertensive medication at the time of discharge was the single strongest predictor of nontreatment at 6 to 18 months follow‐up despite other follow up outpatient visits where BP medications might have been titrated.
Multiple lines of evidence suggest that failure to appropriately manage HTN observed in the inpatient setting can impact subsequent medication use and disease outcomes for high‐risk patients. Amar et al.20 found that better controlled systolic BP on hospital discharge is associated with better outcomes in patients with ischemic heart disease. Only 35% of patients in one cohort admitted to the hospital with hypertensive urgency or emergency completed an outpatient follow up visit for HTN within 90 days. However, 37% were readmitted and 11% died during 3 month follow up.24 Predischarge initiation of a beta blocker in congestive heart failure patients has been associated with a nearly 18% absolute increase in rates of beta blocker use at 2 months follow‐up.25 Finally, prescription of antihypertensive medications is suboptimal for secondary stroke prevention despite a number needed to treat of 51 patients to prevent one stroke annually.26, 27
The primary limitation of this review is the paucity of published reports documenting the prevalence of inpatient HTN. It is possible that important articles were missed, but we did follow a prespecified systematic search strategy with the assistance of a trained reference librarian. Also, the definition of HTN varied significantly between studies. However, current consensus guidelines do not specifically address the diagnosis or management of HTN in the inpatient setting.28
In summary, available medical evidence suggests that HTN is a common problem observed in the hospital. Opportunities for the appropriate diagnosis of HTN and for the initiation or modification of HTN treatment are often missed. Future studies in this area are warranted to better understand the prevalence of HTN in the inpatient setting and the need to improve HTN detection, treatment, and control. Clearer diagnostic and therapeutic guidelines for the detection and treatment of inpatient HTN could contribute to further improvements in control rates of all hypertensive patients, especially if coupled with improved care transitions between the inpatient and outpatient setting.
- ,,,,.Prevalence, awareness, treatment, and control of hypertension among United States adults 1999–2004.Hypertension.2007;49:69–75.
- ,,,.Hypertension awareness, treatment, and control‐continued disparities in adults: United States, 2005–2006.NCHS Data Brief.2008;3:1–8.
- ,,,,,Prospective Studies C.Age‐specific relevance of usual blood pressure to vascular mortality: a meta‐analysis of individual data for one million adults in 61 prospective studies.Lancet.2002;360:1903–1913.
- ,,,,,.Blood pressure screening of school children in a multiracial school district: the Healthy Kids Project.Am J Hypertens.2009;22:351–356.
- ,,,,.Kidney Early Evaluation Program (KEEP). Findings from a community screening program.Diabetes Educ.2004;30(2):196–198,200–202,220.
- .Screening for traditional risk factors for cardiovascular disease: a review for oral health care providers.J Am Dent Assoc.2002;133:291–300.
- .Health screening in schools. Part II.J Pediatr.1985;107:653–661.
- ,,,.Experience with a community screening program for hypertension: results on 24,462 individuals.Eur J Cardiol.1978;7:487–497.
- .Screening for hypertension in the dental office.J Am Dent Assoc.1974;88:563–567.
- ,,,.2006 National Hospital Discharge Survey:National Center for Health Statistics;2008.
- ,,,,,.Continuity of outpatient and inpatient care by primary care physicians for hospitalized older adults.J Am Med Assoc.2009;301:1671–1680.
- ,,.Influence of hospitalization and placebo therapy on blood pressure and sympathetic function in essential hypertension.Hypertension.1981;3:113–118.
- ,,.Effect of hospitalization on conventional and 24‐hour blood pressure.Age Ageing.1995;24:25–29.
- ,,, et al.Spontaneous fall in blood pressure and reactivity of sympathetic nervous system in hospitalized patients with essential hypertension.Jpn J Med.1990;29:13–21.
- ,,,.Patterns of care for hypertension among hospitalized patients.Public Health Rep.1982;97:521–527.
- ,,.Hospitalization as an opportunity to improve hypertension recognition and control.Med Care.1987;25:717–723.
- EUROASPIRE.A European Society of Cardiology survey of secondary prevention of coronary heart disease: principal results. EUROASPIRE Study Group. European Action on Secondary Prevention through Intervention to Reduce Events.Eur Heart J.1997;18:1569–1582.
- Lifestyle and risk factor management and use of drug therapies in coronary patients from 15 countries; principal results from EUROASPIRE II Euro Heart Survey Programme.Eur Heart J.2001;22:554–572.
- ,,,.Determinants of poor hypertension management in patients with ischaemic heart disease.Blood Press.2005;14:284–292.
- ,,, et al.Hypertension control at hospital discharge after acute coronary event: influence on cardiovascular prognosis‐‐the PREVENIR study.Heart.2002;88:587–591.
- ,,,.High prevalence of newly detected hypertension in hospitalized patients: the value of in‐hospital 24‐h blood pressure measurement.J Hypertens2006;24:301–306.
- ,,, et al.Masked and white‐coat hypertension in two cohorts of elderly subjects, ambulatory and hospitalized patients.Arch Gerontol Geriatr.2009;49Suppl 1:125–128.
- ,,, et al.Impact of hospitalization on blood pressure control in Italy: results from the Italian Group of Pharmacoepidemiology in the Elderly (GIFA).Pharmacotherapy.2003;23:240–247.
- ,,, et al.Practice patterns, outcomes, and end‐organ dysfunction for patients with acute severe hypertension: The Studying the Treatment of Acute hyperTension (STAT) Registry.Am Heart J.2009;158:599–606.
- ,,,,.Predischarge initiation of carvedilol in patients hospitalized for decompensated heart failure: results of the Initiation Management Predischarge: Process for Assessment of Carvedilol Therapy in Heart Failure (IMPACT‐HF) trial.J Am Coll Cardiol.2004;43:1534–1541.
- ,,,.Antihypertensive medications prescribed at discharge after an acute ischemic cerebrovascular event.Stroke.2005;36:1944–1947.
- ,,.New Evidence for Stroke Prevention: Scientific Review.JAMA.2002;288:1388–1395.
- ,,,,.Seventh Report of the Joint National Committee on Prevention, Detection, Evaluation and Treatment of High Blood Pressure. National High Blood Pressure Education Program Coordinating Committee.Hypertension.2003;42:1206–1252.
Hypertension (HTN) is highly prevalent in the general adult population with recent estimates from the National Health and Nutrition Examination Survey (NHANES) of 29% in the United States.1, 2 The relationship between increasing levels of blood pressure (BP) and increasing risk for cardiovascular disease events and stroke is well established.3 However, while 64% of treated HTN patients have a BP 140/90 mmHg, overall control rates for HTN in the adult population remain at approximately 44%.2 The 20% discrepancy in control rates between treated patients and the overall adult population reflects the fact that approximately 30% of patients are unaware of their HTN and that a substantial proportion of aware patients remain untreated. Historically, efforts to improve the recognition, treatment, and control of HTN have appropriately focused on the outpatient setting. However, programs to extend screening for HTN outside the clinic into the community, schools, and even dentists' offices have been around for some time.49
The potential also exists to improve the recognition, treatment, and control of HTN by focusing on hospitalized patients. Hospitalization is common in the U.S. with almost 35 million acute hospitalizations and more than 45,000 inpatient surgical procedures in 2006.10 Inpatient populations have increased in age and comorbidity over the past 3 decades whereas lengths of stay and continuity of care between the inpatient and outpatient arenas have diminished.10, 11 Multiple prior studies examining BP in different settings have noted that average BP among hospitalized patients is not systematically higher than that of outpatients.1214 Thus, patients with persistently elevated BP in the inpatient setting without mitigating factors may have HTN that will persist after hospital discharge. However, little information is available regarding the actual prevalence of HTN in the inpatient population and care patterns for inpatient HTN. Therefore, we performed a systematic review of the English‐language medical literature in order to describe the epidemiology of HTN observed in the inpatient setting.
Methods
Our search strategy was designed to identify randomized‐controlled trials, meta‐analyses, and observational studies that: (1) reported estimates of the prevalence of HTN in the inpatient setting, and (2) used HTN diagnosis or treatment as a primary focus. We performed an extensive review of the peer‐reviewed, English language medical literature in MEDLINE using a predetermined search algorithm. Search terms included HTN[Mesh] or BP[Mesh]. These results were cross‐referenced with the following search terms: Inpatients[Mesh] or Hospitalization[title/abstract] or Hospitalized[title/abstract]. Articles were further narrowed using the following terms: Prevalence[Mesh] or Epidemiology[Mesh] or Treatment[title/abstract] or Management [title/abstract]. Limits employed included limiting to humans and to adults 19 years‐of‐age and older. Studies published prior to 1976 were excluded because 1976 was the first year that the Joint National Committee on Prevention, Detection, Evaluation, and Treatment of High BP published consensus guidelines for the diagnosis and management of HTN. We also excluded randomized, controlled trials that recorded measures of inpatient BP but whose focus was not HTN, because such trials would not answer the primary epidemiologic question of this review. We did include trials focused on subspecialty populations for which the diagnosis and inpatient management of HTN were key outcomes.
Next, the bibliographies of reviewed studies were investigated for additional relevant reports. Abstracts from the American Heart Association (AHA) were reviewed for the past 15 years for reports that were presented but not subsequently published and available in MEDLINE. We also searched for articles using the online Google search engine. One author (RNA) performed the preliminary MEDLINE search and abstract review with the assistance of a reference librarian (LC), and a second author (BME) also reviewed full‐text articles for potential inclusion. Ultimate decision for study inclusion was reached through discussion among authors. Finally, a list of potential articles was submitted to 2 experts in this field of study to determine whether other reports met our inclusion criteria for this systematic review but were overlooked.
Results
Search Results
The initial MEDLINE search algorithm yielded a total of 826 articles. After title and abstract review, 41 full‐text articles were obtained for detailed review, and 5 met criteria for inclusion. Three additional articles were discovered through searching the bibliographies of the included studies. No AHA abstracts addressed this subject area. Experts were not aware of any additional studies. One article was located using a Google search. In all, 9 articles were deemed suitable for inclusion in this review. Search results at each stage are depicted in Figure 1.
Description of Included Studies
Characteristics of included studies are depicted in Table 1. Two older retrospective cohort studies reported HTN prevalence using earlier, less stringent diagnostic criteria. Shankar et al.15 abstracted data from more than 19,000 adults discharged alive from Maryland hospitals during 1978. Greenland et al.16 performed chart review for 536 medical and surgical inpatients in 1987 reporting information on the proportion of patients appropriately diagnosed as having HTN and the proportion with controlled BP on admission and at discharge based on then‐current JNC‐III criteria (HTN if BP > 160/90).
| Study | Design | Setting | Hypertension Prevalence | Diagnostic Criteria for HTN |
|---|---|---|---|---|
| ||||
| Shankar et al.15 (1982) | Retrospective cohort | All hospital discharges in Maryland in 1978 | 23.8% (4571/19,259) | HTN diagnosis in record or diastolic BP 100 mm Hg |
| Greenland et al.16 (1987) | Retrospective cohort | Single University Center, U.S., medical/surgical patients | 28% (143/536 ) | HTN diagnosis in record or mean of first 4 hospital BP measures 160/90 mm Hg |
| Euroaspire I17 | Retrospective cohort with prospective follow up | 9 European countries, coronary heart disease admissions | 57.8% (2553/4415) | Admission BP 140/90 mm Hg or on antihypertensive medications |
| Euroaspire II18 | Retrospective cohort with prospective follow up | 15 European countries, coronary heart disease admissions | 50.5% (2806/5556) | Mean clinic BP at 618 months follow up of 140/90 mm Hg |
| Amar et al.20 (2002) | Retrospective cohort | 77 Cardiology centers, France, ischemic heart disease admissions | 58.5% (729/1247) | HTN diagnosis in record or admission BP 140/90 mm Hg |
| Onder et al.23 (2003) | Cross‐sectional | 81 Hospitals, Italy, elderly patients with known HTN | *86.9% (3304/3807) | HTN diagnosis in record AND admission BP 140/90 mm Hg |
| Jankowski et al.19 (2005) | Retrospective cohort with prospective follow up | 3 University cardiology centers, Poland | 70.2% (593/845) | Mean clinic BP at 618 months follow up of 140/90 mm Hg |
| Conen et al.21 (2006) | Cross‐sectional | Single University Center, U.S., medical/surgical patients | 72.6% (228/314) | HTN diagnosis in record OR mean 24‐hour BP 125/80 mm Hg |
| Giantin et al.22 (2009) | Cross‐sectional | Single University Center, Italy, medical/surgical patients | 56.4% (141/250) | Mean 24‐hour BP 125/80 mm Hg |
| Clinical Question | Findings |
|---|---|
| |
| Accuracy of routine inpatient BP measurements | 56.4% to 72.6% of inpatients receiving 24 hour BP monitoring had HTN.21, 22 |
| 28% to 38% of HTN patients had masked HTN (identified by 24‐hour monitoring but not revealed by routine inpatient BP measures). | |
| Proportion of HTN patients uncontrolled on admission | 86.9% of patients with previously documented HTN were uncontrolled on admission.23 |
| Proportion of HTN patients uncontrolled at discharge | 37% to 77% of inpatients with HTN still had BP > 140/90 mm Hg at time of discharge.16, 20, 23 |
| Proportion of HTN patients without a recorded diagnosis at discharge | 8% to 44% of patients with elevated BP > 140/90 mmHg were discharged without a documented diagnosis of HTN.15, 16, 18, 19 |
| Proportion of uncontrolled HTN patients receiving intensification of therapy during index admission | 53.1% of patients with uncontrolled BP received additional antihypertensive medication upon discharge.23 |
| Proportion of HTN controlled at follow up | 50% of patients with HTN were controlled to 140/90 mm Hg at follow up.17 |
Four studies focused primarily on cardiac patients. The European Society of Cardiology survey of secondary prevention of coronary heart disease (EUROASPIRE I) and subsequent EUROASPIRE II studies used retrospective chart review and prospective follow up clinic visits with a focus on baseline patient characteristics and risk factor modification at post‐discharge follow up.17, 18 Jankowski et al.19 studied 845 similar cardiac patients discharged from 6 Polish centers. Amar et al.20 performed a retrospective cohort study using records from 77 French cardiology centers to assess the impact of BP control prior to discharge in patients with acute coronary syndromes on the prevention of subsequent nonfatal myocardial infarction (MI) and cardiac death.
Two studies utilized 24‐hour BP monitoring to diagnose HTN among inpatients, and compared this to routine inpatient measurement techniques. Conen et al.21 performed 24‐hour BP monitoring on 314 consecutive stable medical and surgical inpatients admitted to a Swiss University hospital. Giantin et al.22 also performed 24‐hour monitoring on a cohort of elderly Italian outpatients and inpatients to determine the prevalence of masked and white coat HTN in different care settings. Finally, Onder et al.23 reported on rates of uncontrolled BP and HTN management among known hypertensives as part of a series of cross‐sectional surveys performed on elderly Italian inpatients.23
Inpatient HTN Prevalence
Overall, study authors reported an HTN prevalence among inpatients that ranged from 50.5% to 72%. Estimates varied somewhat based on HTN definitions, diagnostic standards utilized, measurement techniques, and patient populations. In earlier studies HTN prevalence was reported at 23.8% to 28%, but these likely represented significant underestimates by current diagnostic standards.15, 16 High estimates by Onder et al.23 (86.9%) stem from selection criteria that included a prior billing diagnosis of HTN coupled with elevated admission blood pressures. Estimates in the 50% to 70% prevalence range were seen in studies that focused on cardiac and general medical inpatients.1722 Additional findings of included studies are listed in Table 2.
Accuracy of Inpatient BP Measures
In two studies, 24‐hour BP monitors produced prevalence estimates ranging from 56.4% to 72.6%.21, 22 In both studies, a significant proportion of patients had masked HTN, or HTN detected by 24‐hour BP monitoring alone. Also, 28% to 38% of patients without a prior HTN diagnosis, who were not detected by routine measures, were found to be hypertensive by 24‐hour monitoring. Finally, Conen et al.21 retested a subset of hypertensives with 24‐hour monitoring one month after hospitalization, and 87.5% remained categorized as hypertensive on follow‐up. Of note, it is unclear how this subset of patients was selected.
Proportion of Controlled HTN on Admission and Discharge
Because most included studies established prevalence of HTN based in part upon uncontrolled BP at hospital admission, estimates for the proportion of hypertensive patients controlled on admission were not given. However, Onder et al.23 did examine patients with a prior International Classification of Diseases, 9th edition (ICD‐9) diagnosis of HTN and uncontrolled HTN (BP 140/90) on admission. At discharge, only 23.2% of this cohort was controlled with a BP 140/90 mmHg. However, other estimates suggested that 37% to 44% of patients remained uncontrolled at discharge.16, 20
Proportion of Undiagnosed HTN
In 4 studies, the proportion of patients with elevated BP and/or a history of HTN who did not receive a diagnosis of HTN upon discharge ranged from 8.8% to 44% between cohorts.15, 16, 18, 19 Interpretation of these estimates, however, is difficult due to significant differences between the studies. For example, both earlier studies were performed during an era of higher thresholds for HTN diagnosis and lower overall HTN awareness.15, 16 Both studies of cardiac patients suggested lower rates of nondiagnosis than might have been found in general medical or surgical inpatients.18, 19 One of the 4 studies also suggested that surgical patients who were hypertensive during hospitalization were more likely than medical patients to be discharged without a HTN diagnosis (17% vs. 4%, P 0.05); although, the overall number of patients was small (18/146 remained undiagnosed).16
Proportion Receiving Intensification of Therapy
In 3 studies, prescribing practices for hypertensive inpatients were discussed. Shankar et al.15 found that only 62% of patients with a recorded HTN diagnosis received antihypertensive medications during hospitalization. Unfortunately, no information was given on the proportion of patients prescribed antihypertensive medications at the time of discharge. However, Greenland et al.16 found no net increase in BP medication use at discharge compared to admission despite 44% of patients remaining uncontrolled to 160/90 mmHg at the time of discharge. Onder et al.23 determined that BP medication was intensified in only 53.1% of hypertensive patients during hospitalization. Younger age, fewer drugs on admission, lower comorbidity index, diagnosis of congestive heart failure, lengthy hospital stay, and increasing levels of BP (systolic and diastolic) were all associated with more aggressive prescribing practices. Interestingly, Jankowski et al.19 found that treatment with a BP lowering agent at discharge was associated with the lowest odds of nontreatment at follow up (odds ratio [OR] 0.08, 95% confidence interval [CI] 0.030.19).
Proportion of HTN Controlled at Follow Up
In the EuroASPIRE 1 study, 50% of HTN patients had a systolic BP of 140 mm Hg at follow up 6 months after hospitalization for MI.17 Jankowski et al.19 found that patients with documented inpatient HTN but without a recorded HTN diagnosis during index admission were 4 times more likely (19.2% vs. 4.5%, P 0.0001) to be untreated for their HTN at 6 to 18 months postdischarge, and they were less likely to be controlled at 140/90 mmHg. In a separate cohort of cardiac patients, multivariable modeling identified uncontrolled isolated systolic HTN at hospital discharge as an independent predictor of subsequent cardiac death or nonfatal MI at 6 months follow up (OR, 1.96; 95% CI, 1.153.36).20
Discussion
The present systematic review highlights the high prevalence of HTN with contemporary estimates ranging between 50% and 72% in general medical/surgical and cardiology populations. Furthermore, routine inpatient BP measurements may underestimate the prevalence of HTN among inpatients when compared to 24 hour BP monitoring; although there is no current diagnostic standard for HTN among inpatients. Among patients with uncontrolled BP on admission, BP typically remains above recommended levels at the time of discharge. Further, studies commenting on the prescribing practices at the time of discharge did not detect a strong tendency to intensify antihypertensive regimens in patients with uncontrolled inpatient HTN.16, 23 Most importantly, our data suggest that the medical literature is lacking: only 9 reports met our inclusion criteria for this review.
The validity of inpatient BP measures for making an HTN diagnosis remains a concern when asserting that the inpatient setting is appropriate for HTN screening and efforts to improve BP control. For example, BP measures might be inaccurate because of the inherent heterogeneity of patients with acute illness often with associated pain and nausea that might raise or lower BP. Inpatients often need to have their BP medications held for appropriate reasons, or they may have additional medications while hospitalized that also affect BP. Finally, BP measures in the inpatient setting are less commonly performed using standardized techniques or with accurate BP devices. However, both studies included in this review featuring follow up outpatient BP measures found high degrees of correlation between inpatient and outpatient measures.19, 21 Also, Giantin and colleagues reported that 28.6% of elderly patients who were normotensive based on routine BP measures, were actually hypertensive based on 24‐hour ambulatory BP monitoring.22
Some clinicians may have concerns about starting or titrating BP medications in dynamic hospitalized patients. Certainly, this should be done with caution and in appropriately selected patients. We would argue that achieving complete BP control during an index hospitalization as emphasized by Greenland and Amar is not always the most appropriate goal. However, appropriate recognition of persistently elevated BP does offer the opportunity to make an HTN diagnosis and to refer for future outpatient treatment or to communicate with existing primary care providers. The latter is especially important in this era of discontinuity between inpatient and outpatient care. Beginning or titrating BP medications in the hospital also has advantages for 2 reasons. First, medications started in the hospital tend to be the medications on which patients are sent home. Second, in the study by Jankowski et al.,19 the failure to prescribe an antihypertensive medication at the time of discharge was the single strongest predictor of nontreatment at 6 to 18 months follow‐up despite other follow up outpatient visits where BP medications might have been titrated.
Multiple lines of evidence suggest that failure to appropriately manage HTN observed in the inpatient setting can impact subsequent medication use and disease outcomes for high‐risk patients. Amar et al.20 found that better controlled systolic BP on hospital discharge is associated with better outcomes in patients with ischemic heart disease. Only 35% of patients in one cohort admitted to the hospital with hypertensive urgency or emergency completed an outpatient follow up visit for HTN within 90 days. However, 37% were readmitted and 11% died during 3 month follow up.24 Predischarge initiation of a beta blocker in congestive heart failure patients has been associated with a nearly 18% absolute increase in rates of beta blocker use at 2 months follow‐up.25 Finally, prescription of antihypertensive medications is suboptimal for secondary stroke prevention despite a number needed to treat of 51 patients to prevent one stroke annually.26, 27
The primary limitation of this review is the paucity of published reports documenting the prevalence of inpatient HTN. It is possible that important articles were missed, but we did follow a prespecified systematic search strategy with the assistance of a trained reference librarian. Also, the definition of HTN varied significantly between studies. However, current consensus guidelines do not specifically address the diagnosis or management of HTN in the inpatient setting.28
In summary, available medical evidence suggests that HTN is a common problem observed in the hospital. Opportunities for the appropriate diagnosis of HTN and for the initiation or modification of HTN treatment are often missed. Future studies in this area are warranted to better understand the prevalence of HTN in the inpatient setting and the need to improve HTN detection, treatment, and control. Clearer diagnostic and therapeutic guidelines for the detection and treatment of inpatient HTN could contribute to further improvements in control rates of all hypertensive patients, especially if coupled with improved care transitions between the inpatient and outpatient setting.
- ,,,,.Prevalence, awareness, treatment, and control of hypertension among United States adults 1999–2004.Hypertension.2007;49:69–75.
- ,,,.Hypertension awareness, treatment, and control‐continued disparities in adults: United States, 2005–2006.NCHS Data Brief.2008;3:1–8.
- ,,,,,Prospective Studies C.Age‐specific relevance of usual blood pressure to vascular mortality: a meta‐analysis of individual data for one million adults in 61 prospective studies.Lancet.2002;360:1903–1913.
- ,,,,,.Blood pressure screening of school children in a multiracial school district: the Healthy Kids Project.Am J Hypertens.2009;22:351–356.
- ,,,,.Kidney Early Evaluation Program (KEEP). Findings from a community screening program.Diabetes Educ.2004;30(2):196–198,200–202,220.
- .Screening for traditional risk factors for cardiovascular disease: a review for oral health care providers.J Am Dent Assoc.2002;133:291–300.
- .Health screening in schools. Part II.J Pediatr.1985;107:653–661.
- ,,,.Experience with a community screening program for hypertension: results on 24,462 individuals.Eur J Cardiol.1978;7:487–497.
- .Screening for hypertension in the dental office.J Am Dent Assoc.1974;88:563–567.
- ,,,.2006 National Hospital Discharge Survey:National Center for Health Statistics;2008.
- ,,,,,.Continuity of outpatient and inpatient care by primary care physicians for hospitalized older adults.J Am Med Assoc.2009;301:1671–1680.
- ,,.Influence of hospitalization and placebo therapy on blood pressure and sympathetic function in essential hypertension.Hypertension.1981;3:113–118.
- ,,.Effect of hospitalization on conventional and 24‐hour blood pressure.Age Ageing.1995;24:25–29.
- ,,, et al.Spontaneous fall in blood pressure and reactivity of sympathetic nervous system in hospitalized patients with essential hypertension.Jpn J Med.1990;29:13–21.
- ,,,.Patterns of care for hypertension among hospitalized patients.Public Health Rep.1982;97:521–527.
- ,,.Hospitalization as an opportunity to improve hypertension recognition and control.Med Care.1987;25:717–723.
- EUROASPIRE.A European Society of Cardiology survey of secondary prevention of coronary heart disease: principal results. EUROASPIRE Study Group. European Action on Secondary Prevention through Intervention to Reduce Events.Eur Heart J.1997;18:1569–1582.
- Lifestyle and risk factor management and use of drug therapies in coronary patients from 15 countries; principal results from EUROASPIRE II Euro Heart Survey Programme.Eur Heart J.2001;22:554–572.
- ,,,.Determinants of poor hypertension management in patients with ischaemic heart disease.Blood Press.2005;14:284–292.
- ,,, et al.Hypertension control at hospital discharge after acute coronary event: influence on cardiovascular prognosis‐‐the PREVENIR study.Heart.2002;88:587–591.
- ,,,.High prevalence of newly detected hypertension in hospitalized patients: the value of in‐hospital 24‐h blood pressure measurement.J Hypertens2006;24:301–306.
- ,,, et al.Masked and white‐coat hypertension in two cohorts of elderly subjects, ambulatory and hospitalized patients.Arch Gerontol Geriatr.2009;49Suppl 1:125–128.
- ,,, et al.Impact of hospitalization on blood pressure control in Italy: results from the Italian Group of Pharmacoepidemiology in the Elderly (GIFA).Pharmacotherapy.2003;23:240–247.
- ,,, et al.Practice patterns, outcomes, and end‐organ dysfunction for patients with acute severe hypertension: The Studying the Treatment of Acute hyperTension (STAT) Registry.Am Heart J.2009;158:599–606.
- ,,,,.Predischarge initiation of carvedilol in patients hospitalized for decompensated heart failure: results of the Initiation Management Predischarge: Process for Assessment of Carvedilol Therapy in Heart Failure (IMPACT‐HF) trial.J Am Coll Cardiol.2004;43:1534–1541.
- ,,,.Antihypertensive medications prescribed at discharge after an acute ischemic cerebrovascular event.Stroke.2005;36:1944–1947.
- ,,.New Evidence for Stroke Prevention: Scientific Review.JAMA.2002;288:1388–1395.
- ,,,,.Seventh Report of the Joint National Committee on Prevention, Detection, Evaluation and Treatment of High Blood Pressure. National High Blood Pressure Education Program Coordinating Committee.Hypertension.2003;42:1206–1252.

IRIS Presenting as Acute Pericarditis
Although antiretroviral therapy for human immunodeficiency virus (HIV)‐infected patients reduces viral load dramatically and improves immune function, some patients experience a clinical deterioration within the first few months of therapy because of an exuberant and dysregulated immune responsethe immune reconstitution inflammatory syndrome (IRIS). The exaggerated immune response associated with this syndrome can be stimulated by either antigens from infectious agents (typically a mycobacterium or cryptococcus) or from autoantigens, giving rise to a heterogeneous range of clinical manifestations.1 IRIS may present as an inflammatory reaction that unmasks a previously untreated infection or as a paradoxical worsening of an infection that is being treated appropriately. Although most cases of IRIS are mild and self‐limited, some patients require aggressive treatment.1
Case Report
A 53‐year‐old man was evaluated for a 5‐day history of intermittent chest pain. He had been diagnosed with HIV/acquired immune deficiency syndrome (AIDS) 11 years ago but he had not been compliant with therapy. Seven years earlier he had been treated for 9 months with isoniazid for a positive tuberculin skin test. Three months before admission, he developed methicillin‐resistant Staphylococcus aureus skin abscesses and was found to have a CD4 count of 1/L and a HIV viral load of over 400,000 copies/mL. He finished a course of vancomycin, and was started on lopinavir, ritonavir, abacavir, lamivudine, and zidovudine. Five days before admission, he was evaluated in the emergency department for intermittent chest pain and described using cocaine. There was only J‐point elevation on the electrocardiogram (Figure 1A), serial cardiac enzymes were negative, and he was discharged home. However, despite discontinuation of cocaine use, his chest pain worsened, became pleuritic, and was associated with dyspnea, which prompted this admission. Physical examination was remarkable only for tachycardia, although the electrocardiogram now revealed diffuse ST segment (ST) elevation and PR segment (PR) depression, consistent with acute pericarditis (Figure 1B). Serial cardiac enzymes, viral studies, and bacterial, fungal, and mycobacterial blood cultures were negative. His CD4 count was 16/L, and the HIV viral load was 870 copies/mL.
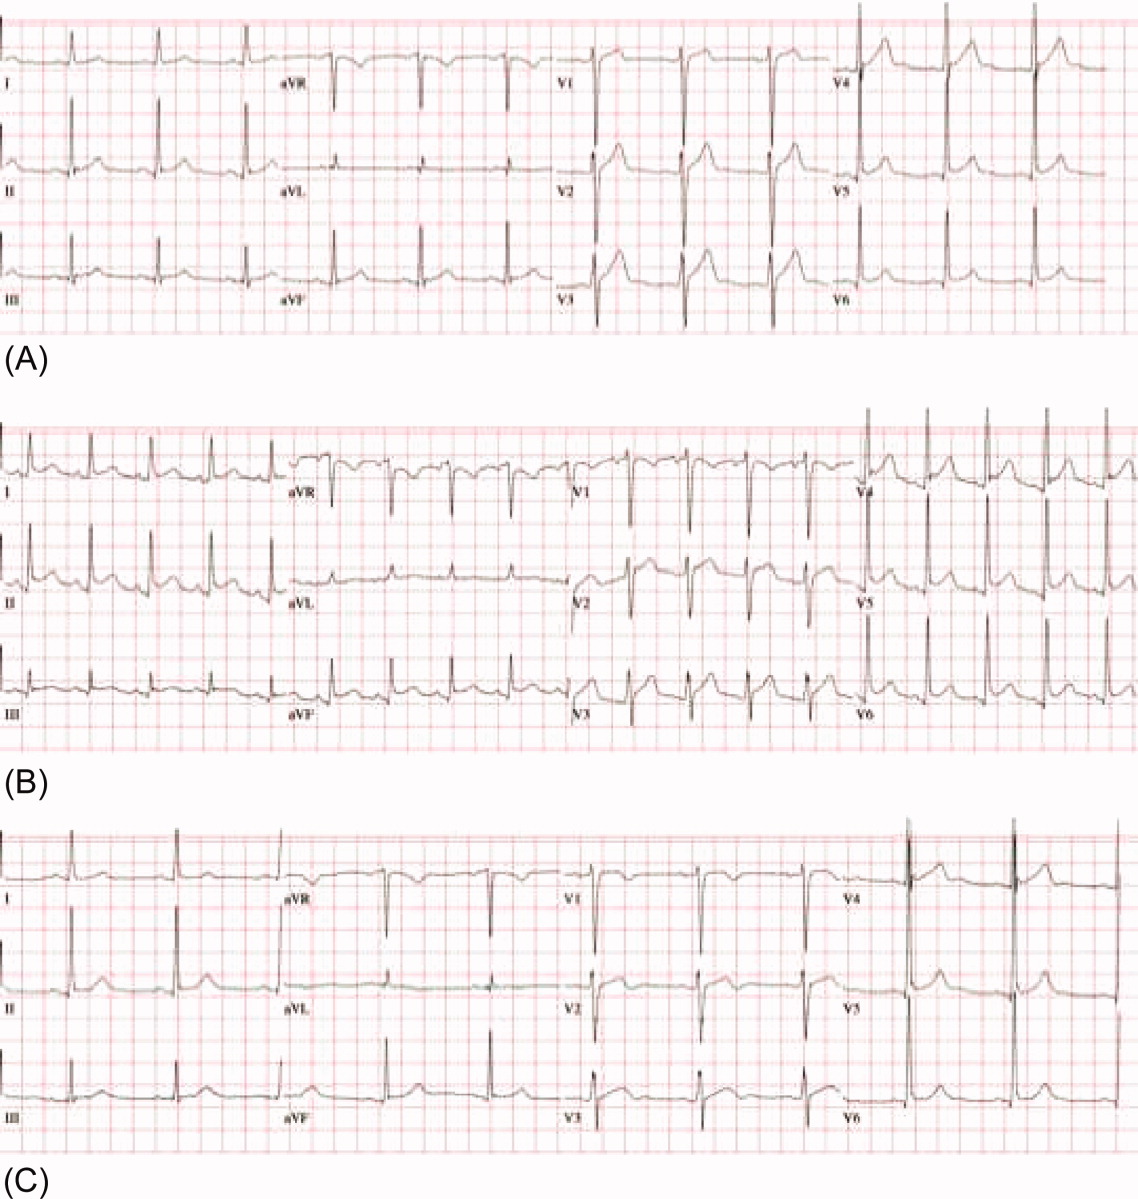
The patient was treated with high‐dose ibuprofen and colchicine, but mild chest pain and electrocardiogram changes persisted, and he developed a friction rub. A chest computed tomography (CT) scan was negative for pulmonary embolism and revealed no significant intra‐thoracic pathology, except for a moderate pericardial effusion that was confirmed by transthoracic echocardiogram (Figure 2A). There was no echocardiographic evidence of tamponade. He underwent thoracoscopic pericardial and mediastinal lymph node biopsy, along with drainage of the pericardial effusion. Pericardial biopsy showed acute on chronic inflammation consistent with pericarditis (Figure 2B) and culture was positive for Mycobacterium Avium Complex (MAC). He was treated with clarithromycin, ethambutol, and prednisone, and his antiretroviral medications were continued. At 2, 6, and 12 months follow‐up, he was asymptomatic, the electrocardiogram had normalized (Figure 1C), and the echocardiogram showed no effusion or evidence of pericardial constriction.
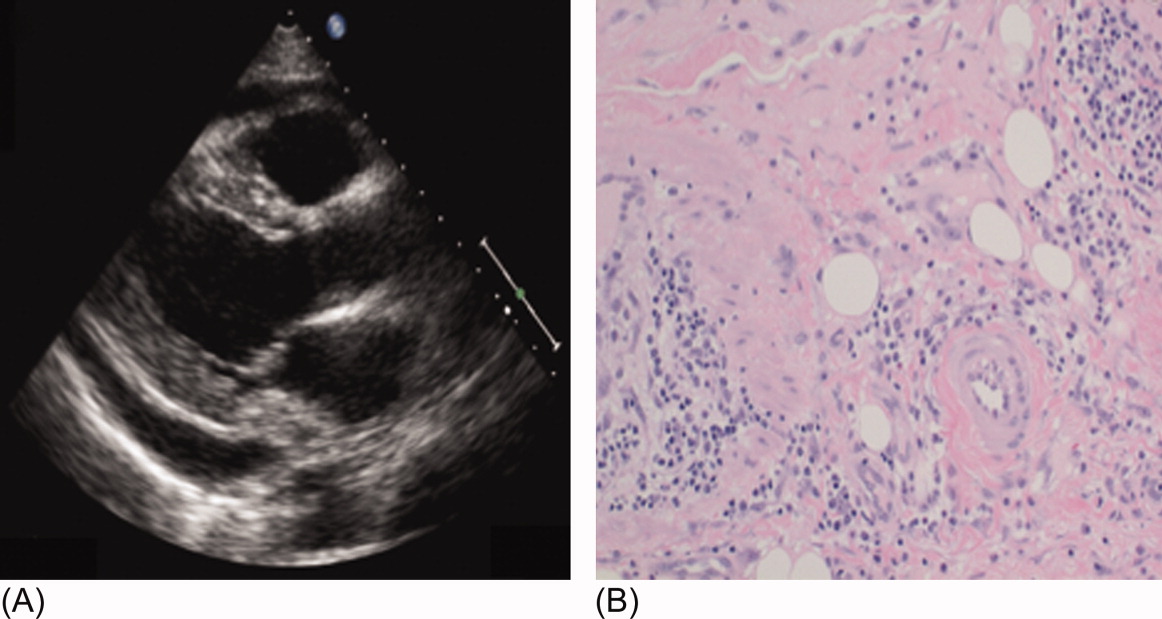
Discussion
This case demonstrates a unique manifestation of the IRIS associated with MAC infection, which more typically presents as peripheral, pulmonary, or intra‐abdominal lymphadenopathy.2, 3 It usually responds to MAC therapy, although intra‐abdominal disease portends a poor prognosis.3, 4 This patient has two significant risk factors for the development of IRIS: low CD4 count at the time of antiretroviral therapy and rapid viral clearance.5, 6 While his CD4 count response is lower than expected for IRIS, previous studies have shown that functional immune recovery usually precedes quantitative CD4 count recovery, and that IRIS could happen at low CD4 count.1, 7 Finally, we believe that the use of corticosteroids accounted for his rapid clinical improvement and favorable long‐term outcome, consistent with previous experience of corticosteroid use in MAC‐associated IRIS.3, 4 To our knowledge, this is the first reported case of MAC‐associated IRIS presenting as isolated acute pericarditis and pericardial effusion. In conclusion, our case illustrates that IRIS can present as an abnormal immune response to an opportunistic infection in an unusual location. Clinicians must be aware that after starting antiretroviral therapy, new symptoms, including chest pain, might represent 1 of the IRISs, and that corticosteroids might be beneficial when inflammation is severe.
Acknowledgements
The authors thank Dr. Arthur Evans for his comments.
- ,,,,.Immune reconstitution inflammatory syndrome in HIV‐infected patients receiving antiretroviral therapy.Drugs.2008;68:191–208.
- ,,,,.The imaging features of nontuberculous mycobacterial immune reconstitution syndrome.J Comput Assist Tomogr.2009;33:242–246.
- ,,, et al.Nontuberculous mycobacterial immune reconstitution syndrome in HIV‐infected patients: spectrum of disease and long‐term follow‐up.Clin Infect Dis.2005;41:1483–1497.
- ,,,,,.Mycobacterium avium complex immune reconstitution inflammatory syndrome: long term outcomes.J Transl Med.2007;5:50–56.
- ,,, et al.Incidence and risk factors for immune reconstitution inflammatory syndrome during highly active antiretroviral therapy.AIDS.2005;19:399–406.
- ,,,.Incidence and risk factors for immune reconstitution inflammatory syndrome in an ethnically diverse HIV type 1‐infected cohort.Clin Infect Dis.2006;42:418–427.
- ,,.Immune reconstitution disease associated with mycobacterial infections in HIV‐infected individuals receiving antiretrovirals.Lancet Infect Dis.2005;5:361–373.
Although antiretroviral therapy for human immunodeficiency virus (HIV)‐infected patients reduces viral load dramatically and improves immune function, some patients experience a clinical deterioration within the first few months of therapy because of an exuberant and dysregulated immune responsethe immune reconstitution inflammatory syndrome (IRIS). The exaggerated immune response associated with this syndrome can be stimulated by either antigens from infectious agents (typically a mycobacterium or cryptococcus) or from autoantigens, giving rise to a heterogeneous range of clinical manifestations.1 IRIS may present as an inflammatory reaction that unmasks a previously untreated infection or as a paradoxical worsening of an infection that is being treated appropriately. Although most cases of IRIS are mild and self‐limited, some patients require aggressive treatment.1
Case Report
A 53‐year‐old man was evaluated for a 5‐day history of intermittent chest pain. He had been diagnosed with HIV/acquired immune deficiency syndrome (AIDS) 11 years ago but he had not been compliant with therapy. Seven years earlier he had been treated for 9 months with isoniazid for a positive tuberculin skin test. Three months before admission, he developed methicillin‐resistant Staphylococcus aureus skin abscesses and was found to have a CD4 count of 1/L and a HIV viral load of over 400,000 copies/mL. He finished a course of vancomycin, and was started on lopinavir, ritonavir, abacavir, lamivudine, and zidovudine. Five days before admission, he was evaluated in the emergency department for intermittent chest pain and described using cocaine. There was only J‐point elevation on the electrocardiogram (Figure 1A), serial cardiac enzymes were negative, and he was discharged home. However, despite discontinuation of cocaine use, his chest pain worsened, became pleuritic, and was associated with dyspnea, which prompted this admission. Physical examination was remarkable only for tachycardia, although the electrocardiogram now revealed diffuse ST segment (ST) elevation and PR segment (PR) depression, consistent with acute pericarditis (Figure 1B). Serial cardiac enzymes, viral studies, and bacterial, fungal, and mycobacterial blood cultures were negative. His CD4 count was 16/L, and the HIV viral load was 870 copies/mL.
The patient was treated with high‐dose ibuprofen and colchicine, but mild chest pain and electrocardiogram changes persisted, and he developed a friction rub. A chest computed tomography (CT) scan was negative for pulmonary embolism and revealed no significant intra‐thoracic pathology, except for a moderate pericardial effusion that was confirmed by transthoracic echocardiogram (Figure 2A). There was no echocardiographic evidence of tamponade. He underwent thoracoscopic pericardial and mediastinal lymph node biopsy, along with drainage of the pericardial effusion. Pericardial biopsy showed acute on chronic inflammation consistent with pericarditis (Figure 2B) and culture was positive for Mycobacterium Avium Complex (MAC). He was treated with clarithromycin, ethambutol, and prednisone, and his antiretroviral medications were continued. At 2, 6, and 12 months follow‐up, he was asymptomatic, the electrocardiogram had normalized (Figure 1C), and the echocardiogram showed no effusion or evidence of pericardial constriction.
Discussion
This case demonstrates a unique manifestation of the IRIS associated with MAC infection, which more typically presents as peripheral, pulmonary, or intra‐abdominal lymphadenopathy.2, 3 It usually responds to MAC therapy, although intra‐abdominal disease portends a poor prognosis.3, 4 This patient has two significant risk factors for the development of IRIS: low CD4 count at the time of antiretroviral therapy and rapid viral clearance.5, 6 While his CD4 count response is lower than expected for IRIS, previous studies have shown that functional immune recovery usually precedes quantitative CD4 count recovery, and that IRIS could happen at low CD4 count.1, 7 Finally, we believe that the use of corticosteroids accounted for his rapid clinical improvement and favorable long‐term outcome, consistent with previous experience of corticosteroid use in MAC‐associated IRIS.3, 4 To our knowledge, this is the first reported case of MAC‐associated IRIS presenting as isolated acute pericarditis and pericardial effusion. In conclusion, our case illustrates that IRIS can present as an abnormal immune response to an opportunistic infection in an unusual location. Clinicians must be aware that after starting antiretroviral therapy, new symptoms, including chest pain, might represent 1 of the IRISs, and that corticosteroids might be beneficial when inflammation is severe.
Acknowledgements
The authors thank Dr. Arthur Evans for his comments.
- ,,,,.Immune reconstitution inflammatory syndrome in HIV‐infected patients receiving antiretroviral therapy.Drugs.2008;68:191–208.
- ,,,,.The imaging features of nontuberculous mycobacterial immune reconstitution syndrome.J Comput Assist Tomogr.2009;33:242–246.
- ,,, et al.Nontuberculous mycobacterial immune reconstitution syndrome in HIV‐infected patients: spectrum of disease and long‐term follow‐up.Clin Infect Dis.2005;41:1483–1497.
- ,,,,,.Mycobacterium avium complex immune reconstitution inflammatory syndrome: long term outcomes.J Transl Med.2007;5:50–56.
- ,,, et al.Incidence and risk factors for immune reconstitution inflammatory syndrome during highly active antiretroviral therapy.AIDS.2005;19:399–406.
- ,,,.Incidence and risk factors for immune reconstitution inflammatory syndrome in an ethnically diverse HIV type 1‐infected cohort.Clin Infect Dis.2006;42:418–427.
- ,,.Immune reconstitution disease associated with mycobacterial infections in HIV‐infected individuals receiving antiretrovirals.Lancet Infect Dis.2005;5:361–373.
