User login
Market Watch
New Generics
- Nateglinide (generic Starlix) tablets1
New Drugs, Indications, and Dosage Forms
- Abatacept (Orencia), a selective costimulation modulator used in treating moderate to severe juvenile idiopathic arthritis and rheumatoid arthritis (RA), has undergone a label change regarding earlier use in methotrexate-naïve patients with moderate to severe RA of less than two years’ disease duration.2,3
- Aliskiren/valsartan (Valturna) has been approved by the FDA for treating hypertension in patients with inadequate hypertension control using aliskiren or valsartan alone. It’s also approved for first-line treatment of patients who are likely to need multiple agents to manage their hypertension.4
- Cethromycin (Restanza) has been granted orphan drug approval as a once-daily agent for the prophylaxis of anthrax, tularemia, and the plague. Studies are being conducted on the drug as a potential bioterrorism countermeasure agent through a Department of Defense contract.5
- Ganciclovir ophthalmic gel 0.15% (Zirgan) has been approved by the FDA for treating acute herpetic keratitis. It held orphan drug status for this indication since April 2007. Comparable clinical resolution of herpetic keratitis was obtained compared with acyclovir at day seven in an open-label, multicenter study of 213 patients (77% ganciclovir; 72% acyclovir). The most common adverse effects in clinical trials were blurred vision, eye irritation, punctate keratitis, and conjunctival hyperemia. Dosing recommendations are to instill one drop of ganciclovir in the affected eye five times daily until the ulcer heals, then instill one drop three times daily for seven days. It is anticipated that this product will be available in a 5-g tube in early 2010.6
- Glycerol phenylbutyrate (HPN-100), an experimental intermittent or chronic treatment for patients with cirrhosis and hepatic encephalopathy, has received orphan drug status. A phase-2 trial is planned for late 2009 or early 2010.7 Glycerol phenylbutyrate is a pre-pro-drug of phenylacetic acid, the active component of buphenyl (approved by the FDA to treat urea cycle disorders). Glycerol phenylbutyrate is administered in liquid form and also has orphan drug status for treating urea cycle disorders.
- Guanfacine extended-release tablets (Intuiv), a once-daily, nonstimulant treatment for attention deficit hyperactivity disorder (ADHD), has been approved by the FDA for treating patients 6 to 17 years old. Because guanfacine is not a controlled substance, a 90-day supply can be prescribed.8
- Pancrelipase (Zenpep), a delayed-release pancrelipase enzyme product, has been approved by the FDA for treating adults and children (ages 1 to 12) with cystic fibrosis. The most common adverse effects reported in clinical trials were flatulence, abdominal pain, headache, and cough. The product is available in four prescription strengths: “Eurand 5” is 5,000 USP units of lipase, 17,000 USP units of protease, and 27,000 USP units of amylase; “Eurand 10” is 10,000 units lipase, 34,000 units protease, and 55,000 units amylase; “Eurand 15” is 15,000 units lipase, 51,000 units protease, and 82,000 units amylase; and “Eurand 20” is 20,000 units lipase, 68,000 units protease, and 109,000 units amylase.9,10
- Vigabatrin (Sabril) has been approved by the FDA in an oral solution as monotherapy for treating infantile spasms in children ages one month to 2 years. The tablets also are approved for adjunctive therapy for refractory complex partial seizures in adults who have not adequately responded to other treatments. It is available in 500-mg powder packets for oral solution preparation and 500-mg tablets.11 One severe adverse effect is progressive peripheral vision loss with the potential to decrease visual acuity. Due to this risk of permanent vision loss, vigabatrin is available only through a restricted distribution program.
Pipeline
- Human papillomavirus quadrivalent (Types 6, 11, 16 and 18; Gardasil) has been recommended for approval to prevent genital warts in boys and young men 9 to 26 years old. The FDA is expected to make a decision by the end of 2009.12,13 This vaccine already is approved for use in men in 112 countries.
- Oral insulin (Ora-Lyn) is a proprietary formulation that delivers insulin spray through the buccal mucosa.14 In September, Ora-Lyn was approved under the FDA’s Treatment Investigational New Drug (IND) program for both Type 1 and Type 2 diabetes mellitus. This program allows manufacturers to provide early medication access to investigational drugs for patients with life-threatening or other serious conditions for which there are no satisfactory treatment alternatives. Doctors must register with the IND program to obtain the medication for their patients.15Ora-Lyn already is approved abroad.
Drug Information
- On Sept. 22, the FDA banned candy- and fruit-flavored cigarettes under the Family Smoking Prevention and Tobacco Control Act. The goal is to reduce smoking in America.16 Menthol cigarettes and flavored tobacco products are not part of this ban, but they are being evaluated as many of these products are seen as a gateway for children and young adults to begin smoking. More information is available at www.fda.gov/flavoredtobacco. TH
Michele B. Kaufman, PharmD, BSc, RPh, is a freelance medical writer based in New York City and a clinical pharmacist at New York Downtown Hospital.
References
- Par Pharma to begin marketing Starlix generic. Pharmaceutical-Technology.com Web site. Available at: www.pharmaceutical-technology.com/news/news64185.html. Accessed Sept. 23, 2009.
- Highlights of prescribing information. FDA Web site. Available at: www.accessdata.fda.gov/drugsatfda_docs/label/2009/125118s0086lbl.pdf Accessed Sept. 23, 2009.
- Bratulic A. Bristol Myers Squibb: Orencia label updated to support earlier use in adults with RA. FirstWord Web site. Available at: www.firstwordplus.com/Fws.do?articleid=DA78CDE71605485C9BC1B3B40392B1C0&logRowId=323904. Accessed Sept. 23, 2009.
- Bratulic A. FDA approves Novartis’ Valturna for hypertension. FirstWord Web site. Available at: www.firstwordplus.com/Fws.do?articleid=4D45881D26B8447D950A4D63E80B806C&logRowId=327307. Accessed Sept. 23, 2009.
- Advanced Life Sciences’ Restanza could treat plague and anthrax. Pharmaceutical-Technology.com Web site. Available at: www.pharmaceutical-technology.com/News/News64553.html. Accessed Sept. 23, 2009.
- FDA approves Zirgan. Drugs.com Web site. Available at: www.drugs.com/newdrugs/sirion-therapeutics-announces-fda-approval-zirgan-ganciclovir-ophthalmic-gel-0-15-herpetic-keratitis-1657.html. Accessed Sept. 23, 2009.
- 7. Hyperion Therapeutics receives orphan drug designation for HPN-100 for the treatment of hepatic encephalopathy. Hyperion Therapeutics Web site. Available at: www.hyperiontx.com/press/release/pr_1253144476. Accessed Sept. 23, 2009.
- George J. FDA approves nonstimulant Shire ADHD drug. Philadelphia Business Journal Web site. Available at: philadelphia.bizjournals.com/philadelphia/stories/2009/08/31/daily40.html?surround=etf&ana=e_article. Accessed Sept. 23, 2009.
- Petrochko C. FDA approves first EPI drug for kids. Medpage Today Web site. Available at: www.medpagetoday.com/Gastroenterology/GeneralGastroenterology/15734. Accessed Sept. 23, 2009.
- Highlights of prescribing information. FDA Web site. Available at: www.accessdata.fda.gov/drugsatfda_docs/label/2009/022210s000lbl.pdf. Accessed Sept. 23, 2009.
- Sabril approved for infantile spasms and adult epileptic seizures. Monthly Prescribing Reference Web site. Available at: www.empr.com/Sabril-approved-for-infantile-spasms-and-adult-epileptic-seizures/article/147148/. Accessed Sept. 23, 2009.
- FDA advisory committee recommends approval for use of Gardasil in boys and men. Merck Web site. Available at: www.merck.com/newsroom/press_releases/product/2009_0909.html. Accessed Sept. 23, 2009.
- Bratulic A. Merck & Co.’s Gardasil recommended by FDA panel for use in boys and men. FirstWord Web site. Available at: www.firstwordplus.com/Fws.do?articleid=352E8E6109E14925B0168FF465E27C1F&logRowId=325991. Accessed Sept. 23, 2009.
- Generex technology. Generex Biotechnology Web site. Available at: www.generex.com/technology.php. Accessed Sept. 23, 2009.
- Reidy C. Generex Drug is OK’d under special FDA program. The Boston Globe Web site. www.generex.com/fckuploads/file/Boston_Globe_09_10_09.pdf. Accessed Sept. 23, 2009.
- Quinn K. Candy and fruit flavored cigarettes now illegal in United States; step is first under new tobacco law. Food and Drug Administration Web site. Available at: www.fda.gov/NewsEvents/Newsroom/PressAnnouncements/ucm183211.htm. Accessed Sept. 23, 2009.
2009: Year in Review
From continued membership growth to increased visibility in the national media, SHM and its members have been influencing healthcare for more than a decade. But even by the highest of standards, 2009 has been a landmark year—one that demonstrated hospitalists’ collective ability to transform healthcare and improve care to the hospitalized patient.
“The momentum of the hospital medicine movement has been growing for years, and 2009 has been no exception,” says Scott Flanders, MD, FHM, president of SHM. “This year built on the successes of the past and plainly illustrated the impact that hospital medicine will have on the future of healthcare.”
Groundbreaking QI Programs Go Nationwide
This year, SHM and its members began to tackle some of the most pressing QI issues in healthcare: reducing readmissions to the hospital and glycemic control. New research in the New England Journal of Medicine couldn’t have made the need for reducing readmissions any clearer: Unplanned hospital readmissions cost Medicare $17.4 billion annually.1
SHM’s Project BOOST (Better Outcomes for Older Adults through Safe Transitions) helps hospitals implement customized programs to reduce readmissions through improved discharge processes. Hospitalists who enroll in the yearlong program take advantage of a one-on-one mentorship arrangement with experts in the field. Participants can also access the Project BOOST resource toolkit.
Project BOOST began in six pilot hospital sites in 2008 and added 24 new sites in March 2009. The program’s leaders are looking forward to further expansion in 2010. “The response to Project BOOST has been overwhelmingly positive. Given today’s healthcare climate, we know its impact will be even greater in years to come,” says Jane Kelly-Cummings, RN, CPHQ, SHM’s senior director of quality initiatives. “There is a very serious need to improve discharge processes in hospitals across the country. With Project BOOST, hospitalists are taking the initiative to ensure a smooth transition from hospital to home.”
SHM also launched the Glycemic Control Mentored Implementation (GCMI) program. Like Project BOOST, GCMI uses a combination of one-on-one mentorships and customized resources to assist hospitalists with QI program implementation.
GCMI takes on another common chronic issue hospitalists face daily: managing glycemic levels in hospitalized patients. The GCMI program is currently in 30 sites across the country.

—Jane Kelly-Cummings, RN, CPHQ, SHM’s senior director of quality initiatives
HM09 Draws Capacity Crowd in Chicago
In an economic climate that forced many industries’ annual meetings to be canceled, delayed, or scaled back, Hospital Medicine 2009 (HM09) in Chicago exceeded expectations. SHM had expected about 1,500 participants in the annual conference; organizers were pleasantly surprised to receive more than 2,000 registrations for the May event. The demand for exhibition space also surpassed projections.
“We’ve long known that hospitalists see real value in a meeting specifically designed for them, with relevant educational sessions and plenty of time for networking,” says Geri Barnes, SHM’s senior director of education and meetings. “Each year, we’ve received more and more interest in the annual conference, but the response to our 2009 conference was unprecedented.”
HM10 is April 8-11 at the Gaylord National Hotel and Convention Center in Washington, D.C.
SHM, MGMA Form Research Partnership
Beginning in 2010, SHM and the Medical Group Management Association (MGMA) will team up to give hospitalists and healthcare executives an even clearer picture on hospitalist compensation and productivity.
Prior to the partnership, SHM had conducted its own research. Now, hospitals and HM managers will have new data at their fingertips, and additional analysis and name-brand recognition of one of the leaders in medical practice research. The first round of research will be available in summer 2010. SHM and MGMA already have collaborated on educational webinars for hospitalists, and SHM is offering books published by MGMA on its Web site.
“This new alliance will pay dividends for years to come,” says Leslie Flores, the director of SHM’s Practice Management Institute. “The information from our compensation and productivity surveys has always been valuable to hospitals. Having the MGMA name attached to next year’s product will only increase its significance and usefulness.”
Hospitalists will receive the joint survey questionnaire from SHM and MGMA in January.
Fellow in Hospital medicine Spotlight
Penny McDonald, MD, FACP, FHM

Undergraduate education: High Point University, High Point, N.C.
Medical school: East Carolina University School of Medicine, Greenville, N.C.
Notable: Dr. McDonald has been a practicing hospitalist since 1997 and an SHM member since 1999. She has served on the physician leadership board and ethics committee at Forsyth. She has been published in the Archives of Internal Medicine.
FYI: Outside the hospital, Dr. McDonald is an avid hiker and loves to travel. Last year, she reached her own personal goal of visiting all 50 states. Her new goal is to visit every national park in the U.S.
Quotable: “I have a secret desire that our specialty be renamed. Describing us as ‘hospitalists,’ based on where we practice, doesn’t seem to cover it. I think ‘medical complexity specialist’ would be more fitting and would encompass all of what we do.”
For more information about the FHM program, visit www.hospitalmedicine.org/fellows.
HM Fellows
Three letters can mean a lot, especially for hospitalists looking for ways to demonstrate their commitment to the specialty. This year was the first in which qualified hospitalists could earn the Fellow in Hospital Medicine (FHM) designation. The first class of more than 500 FHM designees was introduced in an on-stage ceremony at HM09.
“This is a special way for SHM—and the healthcare industry as a whole—to recognize the unique achievements and dedication that hospital medicine requires,” says Todd Von Deak, MBA, CAE, SHM’s vice president for marketing and membership. “As the specialty grows in number and influence, so will the fellows program.”
In 2010, SHM will induct the first class of Senior Fellows in Hospital Medicine (SFHM). While the process for applying for the senior designation will be similar to the FHM designation, the SFHM will require additional years of practice and leadership in the specialty.
The fellows program also features the Master in Hospital Medicine (MHM) designation, the highest level of recognition available. The MHM will be available in 2011, and the nomination process will be invitation-only.
Outside Recognition
SHM isn’t the only group recognizing the impact hospitalists are making on healthcare. In September, the American Board of Internal Medicine (ABIM) announced that hospitalists will be able to apply for Recognition of Focused Practice (RFP) in Hospital Medicine as part of ABIM’s maintenance of certification (MOC) program. The application process will be available as early as next month.
SHM will be assisting hospitalists in the application process through online resources and the MOC pre-course, which will be offered before HM10. Hospitalists with three years of experience in the field can apply for the RFP program. Although most physicians are required to recertify every 10 years, hospitalists won’t have to wait until their certification is up to apply for focused recognition. For more information about the RFP in HM program, visit www.abim.org.
Hospital-Provider Partners
Treating hospitalized patients has always been a team sport. From caseworkers and pharmacists to physicians and critical-care nurses, the diverse and specialized needs of hospital care demand collaboration and coordination.
That’s the idea behind the Hospital Care Collaborative (HCC), which convened for the first time in 2009. The group is made up of six national organizations that represent hundreds of thousands of care providers. The HCC has developed and published “Common Principles for Team-Based Healthcare.” The principles emphasize the need for teamwork within the hospital setting and a focus on the patient.
As part of its goals for the future, the HCC will identify best practices in teamwork and promote educational programs that encourage interdisciplinary teams.
Look Back, Look Forward
For SHM CEO Larry Wellikson, MD, FHM, the end of 2009 is an opportunity to look forward to 2010 and beyond. “Ten years ago, hospital medicine was little more than an idea,” he says. “Today, it is a growing medical specialty, recognized by leaders in healthcare and public policy, with thousands of experienced and enthusiastic hospitalists throughout the country.
“I am confident that when we look back ten years from now, we will see a hospital landscape transformed for the better, and that hospitalists and the rest of the new healthcare team will have played an important role.” TH
Brendon Shank is a freelance writer based in Philadelphia.
Reference
- Jencks SF, Williams MV, Coleman A. Rehospitaliza- tions among patients in the Medicare fee-for-service program. N Engl J Med. 2009;360(14):1418-1428.
Chapter Updates
Los Angeles
The Los Angeles chapter met Sept. 24 at Craft restaurant. The event was hosted by Manoj K. Mathew, MD, FHM. The presentation, “An Update in Hospital Medicine,” was offered by Joseph Li, MD, FHM, director of hospitalist services at Beth Israel Deaconess Medical Center in Boston and an SHM board member. Nearly 30 attendees from 10 hospitalist organizations attended the meeting. The next Los Angeles chapter meeting is scheduled for January 2010.
Southwest Wisconsin
Transitions of care was the featured topic at the Aug. 6 Southwest Wisconsin chapter meeting. Monica Anderson, director of business development at Select Specialty Hospital in Madison, presented valuable information about the role long-term acute-care hospitals play in a patient’s continuum of care. Following the presentation, attendees discussed ways in which hospitalists can collaborate across HM groups to address patient care and quality issues that are common to hospitalist practices.
Philadelphia Tri-State Area
The Philadelphia Tri-State Area chapter met Sept. 30 at Ristorante Panorama. About 20 hospitalists attended the event, which was sponsored by the France Foundation.
Todd Hecht, MD, of the University of Pennsylvania lectured on DVT prophylaxis. Chapter founder Jennifer Myers, MD, FHM, preceded the lecture by announcing she was stepping down as co-president after a six-year tenure. She thanked the audience for their support and introduced Susan Krekun, MD, chair of the division of hospital medicine at Jefferson University Hospital in Philadelphia, as the new chapter co-president.
The chapter sponsored a job fair Nov. 19 at the downtown Marriott. Medical directors from more than 10 programs attended the event to meet aspiring hospitalists and discuss the state of hospital medicine in the Philadelphia area.
Indiana

The Indiana chapter held a meeting Sept. 2 at Maggiano’s Italian Restaurant in Indianapolis. The meeting was sponsored by AstraZeneca and featured a meet-and-greet before the regular program. Attendees were treated to a report about SHM’s recent Leadership Academy in Miami, and election results were revealed.
Angela Corea, MD, announced the 2010 chapter election nomination results: vice president, John Gilbert, MD, unopposed; secretary, Robert Blessing, MD, unopposed; president, Angela Corea, MD, Raphael Villavicencio, MD, and Gordon Reed, MD, FHM. All three chapter president nominees addressed the attendees.
David Mares, MD, held a question-and-answer session to discuss “New Maintenance Options for the Treatment of COPD.” Drs. Reed and Corea discussed the results of the SHM survey. The meeting concluded with a secret ballot.
Nashville and Middle Tennessee
The Nashville and Middle Tennessee chapter met Oct. 27, with 16 attendees representing eight local hospitals. The speaker, Anton Maki, MD, of Kingsport, presented a thorough review of the microbiology and antimicrobial treatment recommendations for community-acquired pneumonia (CAP). Attendees also were provided information about upcoming SHM conferences and training academies, the application process for the fellowship program, and plans for the ABIM Recognition of Focused Practice in Hospital Medicine certification.
Boston
Anita Barry, the infectious-disease bureau chief and director of communicable-disease control for the Boston Public Health Commission, spoke to nearly 60 hospitalists and guests during the Sept. 10 Boston chapter meeting at Legal Sea Foods. Dr. Barry’s topic was the H1N1 virus. The next chapter event is a clinical investigator training course Dec. 10-11 at Beth Israel Deaconess Medical Center in Boston. Anyone interested in learning more about conducting clinical trials can attend. This course is not limited to physicians; nurses and others are encouraged to attend. There is no fee to attend Boston chapter events. For more information or to RSVP, contact Dr. Li at [email protected] or 617-632-0205.
From continued membership growth to increased visibility in the national media, SHM and its members have been influencing healthcare for more than a decade. But even by the highest of standards, 2009 has been a landmark year—one that demonstrated hospitalists’ collective ability to transform healthcare and improve care to the hospitalized patient.
“The momentum of the hospital medicine movement has been growing for years, and 2009 has been no exception,” says Scott Flanders, MD, FHM, president of SHM. “This year built on the successes of the past and plainly illustrated the impact that hospital medicine will have on the future of healthcare.”
Groundbreaking QI Programs Go Nationwide
This year, SHM and its members began to tackle some of the most pressing QI issues in healthcare: reducing readmissions to the hospital and glycemic control. New research in the New England Journal of Medicine couldn’t have made the need for reducing readmissions any clearer: Unplanned hospital readmissions cost Medicare $17.4 billion annually.1
SHM’s Project BOOST (Better Outcomes for Older Adults through Safe Transitions) helps hospitals implement customized programs to reduce readmissions through improved discharge processes. Hospitalists who enroll in the yearlong program take advantage of a one-on-one mentorship arrangement with experts in the field. Participants can also access the Project BOOST resource toolkit.
Project BOOST began in six pilot hospital sites in 2008 and added 24 new sites in March 2009. The program’s leaders are looking forward to further expansion in 2010. “The response to Project BOOST has been overwhelmingly positive. Given today’s healthcare climate, we know its impact will be even greater in years to come,” says Jane Kelly-Cummings, RN, CPHQ, SHM’s senior director of quality initiatives. “There is a very serious need to improve discharge processes in hospitals across the country. With Project BOOST, hospitalists are taking the initiative to ensure a smooth transition from hospital to home.”
SHM also launched the Glycemic Control Mentored Implementation (GCMI) program. Like Project BOOST, GCMI uses a combination of one-on-one mentorships and customized resources to assist hospitalists with QI program implementation.
GCMI takes on another common chronic issue hospitalists face daily: managing glycemic levels in hospitalized patients. The GCMI program is currently in 30 sites across the country.
—Jane Kelly-Cummings, RN, CPHQ, SHM’s senior director of quality initiatives
HM09 Draws Capacity Crowd in Chicago
In an economic climate that forced many industries’ annual meetings to be canceled, delayed, or scaled back, Hospital Medicine 2009 (HM09) in Chicago exceeded expectations. SHM had expected about 1,500 participants in the annual conference; organizers were pleasantly surprised to receive more than 2,000 registrations for the May event. The demand for exhibition space also surpassed projections.
“We’ve long known that hospitalists see real value in a meeting specifically designed for them, with relevant educational sessions and plenty of time for networking,” says Geri Barnes, SHM’s senior director of education and meetings. “Each year, we’ve received more and more interest in the annual conference, but the response to our 2009 conference was unprecedented.”
HM10 is April 8-11 at the Gaylord National Hotel and Convention Center in Washington, D.C.
SHM, MGMA Form Research Partnership
Beginning in 2010, SHM and the Medical Group Management Association (MGMA) will team up to give hospitalists and healthcare executives an even clearer picture on hospitalist compensation and productivity.
Prior to the partnership, SHM had conducted its own research. Now, hospitals and HM managers will have new data at their fingertips, and additional analysis and name-brand recognition of one of the leaders in medical practice research. The first round of research will be available in summer 2010. SHM and MGMA already have collaborated on educational webinars for hospitalists, and SHM is offering books published by MGMA on its Web site.
“This new alliance will pay dividends for years to come,” says Leslie Flores, the director of SHM’s Practice Management Institute. “The information from our compensation and productivity surveys has always been valuable to hospitals. Having the MGMA name attached to next year’s product will only increase its significance and usefulness.”
Hospitalists will receive the joint survey questionnaire from SHM and MGMA in January.
Fellow in Hospital medicine Spotlight
Penny McDonald, MD, FACP, FHM
Undergraduate education: High Point University, High Point, N.C.
Medical school: East Carolina University School of Medicine, Greenville, N.C.
Notable: Dr. McDonald has been a practicing hospitalist since 1997 and an SHM member since 1999. She has served on the physician leadership board and ethics committee at Forsyth. She has been published in the Archives of Internal Medicine.
FYI: Outside the hospital, Dr. McDonald is an avid hiker and loves to travel. Last year, she reached her own personal goal of visiting all 50 states. Her new goal is to visit every national park in the U.S.
Quotable: “I have a secret desire that our specialty be renamed. Describing us as ‘hospitalists,’ based on where we practice, doesn’t seem to cover it. I think ‘medical complexity specialist’ would be more fitting and would encompass all of what we do.”
For more information about the FHM program, visit www.hospitalmedicine.org/fellows.
HM Fellows
Three letters can mean a lot, especially for hospitalists looking for ways to demonstrate their commitment to the specialty. This year was the first in which qualified hospitalists could earn the Fellow in Hospital Medicine (FHM) designation. The first class of more than 500 FHM designees was introduced in an on-stage ceremony at HM09.
“This is a special way for SHM—and the healthcare industry as a whole—to recognize the unique achievements and dedication that hospital medicine requires,” says Todd Von Deak, MBA, CAE, SHM’s vice president for marketing and membership. “As the specialty grows in number and influence, so will the fellows program.”
In 2010, SHM will induct the first class of Senior Fellows in Hospital Medicine (SFHM). While the process for applying for the senior designation will be similar to the FHM designation, the SFHM will require additional years of practice and leadership in the specialty.
The fellows program also features the Master in Hospital Medicine (MHM) designation, the highest level of recognition available. The MHM will be available in 2011, and the nomination process will be invitation-only.
Outside Recognition
SHM isn’t the only group recognizing the impact hospitalists are making on healthcare. In September, the American Board of Internal Medicine (ABIM) announced that hospitalists will be able to apply for Recognition of Focused Practice (RFP) in Hospital Medicine as part of ABIM’s maintenance of certification (MOC) program. The application process will be available as early as next month.
SHM will be assisting hospitalists in the application process through online resources and the MOC pre-course, which will be offered before HM10. Hospitalists with three years of experience in the field can apply for the RFP program. Although most physicians are required to recertify every 10 years, hospitalists won’t have to wait until their certification is up to apply for focused recognition. For more information about the RFP in HM program, visit www.abim.org.
Hospital-Provider Partners
Treating hospitalized patients has always been a team sport. From caseworkers and pharmacists to physicians and critical-care nurses, the diverse and specialized needs of hospital care demand collaboration and coordination.
That’s the idea behind the Hospital Care Collaborative (HCC), which convened for the first time in 2009. The group is made up of six national organizations that represent hundreds of thousands of care providers. The HCC has developed and published “Common Principles for Team-Based Healthcare.” The principles emphasize the need for teamwork within the hospital setting and a focus on the patient.
As part of its goals for the future, the HCC will identify best practices in teamwork and promote educational programs that encourage interdisciplinary teams.
Look Back, Look Forward
For SHM CEO Larry Wellikson, MD, FHM, the end of 2009 is an opportunity to look forward to 2010 and beyond. “Ten years ago, hospital medicine was little more than an idea,” he says. “Today, it is a growing medical specialty, recognized by leaders in healthcare and public policy, with thousands of experienced and enthusiastic hospitalists throughout the country.
“I am confident that when we look back ten years from now, we will see a hospital landscape transformed for the better, and that hospitalists and the rest of the new healthcare team will have played an important role.” TH
Brendon Shank is a freelance writer based in Philadelphia.
Reference
- Jencks SF, Williams MV, Coleman A. Rehospitaliza- tions among patients in the Medicare fee-for-service program. N Engl J Med. 2009;360(14):1418-1428.
Chapter Updates
Los Angeles
The Los Angeles chapter met Sept. 24 at Craft restaurant. The event was hosted by Manoj K. Mathew, MD, FHM. The presentation, “An Update in Hospital Medicine,” was offered by Joseph Li, MD, FHM, director of hospitalist services at Beth Israel Deaconess Medical Center in Boston and an SHM board member. Nearly 30 attendees from 10 hospitalist organizations attended the meeting. The next Los Angeles chapter meeting is scheduled for January 2010.
Southwest Wisconsin
Transitions of care was the featured topic at the Aug. 6 Southwest Wisconsin chapter meeting. Monica Anderson, director of business development at Select Specialty Hospital in Madison, presented valuable information about the role long-term acute-care hospitals play in a patient’s continuum of care. Following the presentation, attendees discussed ways in which hospitalists can collaborate across HM groups to address patient care and quality issues that are common to hospitalist practices.
Philadelphia Tri-State Area
The Philadelphia Tri-State Area chapter met Sept. 30 at Ristorante Panorama. About 20 hospitalists attended the event, which was sponsored by the France Foundation.
Todd Hecht, MD, of the University of Pennsylvania lectured on DVT prophylaxis. Chapter founder Jennifer Myers, MD, FHM, preceded the lecture by announcing she was stepping down as co-president after a six-year tenure. She thanked the audience for their support and introduced Susan Krekun, MD, chair of the division of hospital medicine at Jefferson University Hospital in Philadelphia, as the new chapter co-president.
The chapter sponsored a job fair Nov. 19 at the downtown Marriott. Medical directors from more than 10 programs attended the event to meet aspiring hospitalists and discuss the state of hospital medicine in the Philadelphia area.
Indiana
The Indiana chapter held a meeting Sept. 2 at Maggiano’s Italian Restaurant in Indianapolis. The meeting was sponsored by AstraZeneca and featured a meet-and-greet before the regular program. Attendees were treated to a report about SHM’s recent Leadership Academy in Miami, and election results were revealed.
Angela Corea, MD, announced the 2010 chapter election nomination results: vice president, John Gilbert, MD, unopposed; secretary, Robert Blessing, MD, unopposed; president, Angela Corea, MD, Raphael Villavicencio, MD, and Gordon Reed, MD, FHM. All three chapter president nominees addressed the attendees.
David Mares, MD, held a question-and-answer session to discuss “New Maintenance Options for the Treatment of COPD.” Drs. Reed and Corea discussed the results of the SHM survey. The meeting concluded with a secret ballot.
Nashville and Middle Tennessee
The Nashville and Middle Tennessee chapter met Oct. 27, with 16 attendees representing eight local hospitals. The speaker, Anton Maki, MD, of Kingsport, presented a thorough review of the microbiology and antimicrobial treatment recommendations for community-acquired pneumonia (CAP). Attendees also were provided information about upcoming SHM conferences and training academies, the application process for the fellowship program, and plans for the ABIM Recognition of Focused Practice in Hospital Medicine certification.
Boston
Anita Barry, the infectious-disease bureau chief and director of communicable-disease control for the Boston Public Health Commission, spoke to nearly 60 hospitalists and guests during the Sept. 10 Boston chapter meeting at Legal Sea Foods. Dr. Barry’s topic was the H1N1 virus. The next chapter event is a clinical investigator training course Dec. 10-11 at Beth Israel Deaconess Medical Center in Boston. Anyone interested in learning more about conducting clinical trials can attend. This course is not limited to physicians; nurses and others are encouraged to attend. There is no fee to attend Boston chapter events. For more information or to RSVP, contact Dr. Li at [email protected] or 617-632-0205.
Spotlight on Stroke
Ethan Cumbler, MD, is board-certified in internal medicine and pediatrics, and has practiced hospital medicine for six years, first at a community hospital and now at the University of Colorado Denver (UCD), where he directs the Acute Care for the Elderly service. The prevalence of stroke in his practice and the daily challenges of managing stroke patients led Dr. Cumbler to seek additional training in stroke care. He is the hospitalist representative to the UCD stroke council, a researcher in the arena of acute stroke care, and is helping UCD become a Joint Commission-certified stroke center.
“There are a variety of roles for the hospitalist in stroke care,” Dr. Cumbler says, explaining that HM physicians can be admitting attendings for stroke patients or part of acute stroke teams, and participate in decisions to start such treatments as intravenous recombinant tissue plasminogen activator (t-PA), the Food and Drug Administration-approved clot-busting therapy. “[Hospitalists] can be medical consultants on stroke patients admitted to other hospital services, managing common comorbid conditions such as blood pressure and glucose levels, which have particular character for patients immediately post-stroke.”
Stroke is the third-leading cause of death in the U.S., as well as a leading cause of serious, long-term disability. How many stroke patients are seen by hospitalists is not known, but it is reasonable to assume that a majority of hospitalized stroke patients will encounter a hospitalist, if not for acute treatment, then for ongoing medical management.
Some hospitalists think stroke and transient ischemic attacks (TIAs)—temporary neurological deficits sometimes called “mini-strokes,” and a major risk factor for full-blown strokes—are among the most common diseases seen by hospitalists.1 Acute stroke care is a growing part of HM practice because neurologist availability in emergent situations varies widely between hospitals. The rapid evolution of stroke treatment and the time-sensitive needs of stroke patients represents a huge opportunity for hospitalists to fill that void for their hospitals—whether they want to or not.
“I think hospitalists are fully capable of learning and mastering stroke care, but it requires both interest and training,” Dr. Cumbler says.
HM Can Help Fill a Void
According to the American Heart Association (AHA), there are four neurologists per 100,000 Americans, and not all of those neurologists specialize in stroke care.2 The scarcity of neurological specialists means that in many hospitals, a neurologist won’t be available for the critical assessment and treatment decisions required in the first few hours after a stroke is diagnosed. Yet many hospitalists complain that their preparation during internal-medicine residency did not equip them to care for acute stroke patients.3
S. Andrew Josephson, MD, a neurovascular physician and director of the neurohospitalist program at the University of California at San Francisco Medical Center, says the number of hospitalists on the front lines of acute stroke care is growing every day. “A new stroke is a very treatable neurological emergency that requires ultra-fast intervention,”7 Dr. Josephson says, “and hospitalists, increasingly, are the people who matter most in that intervention.” The reason, in most cases, is hospitalists are available at all times, and neurologists aren’t.
Given variable access to neurologists at the time of urgent need in many hospitals, the actions hospitalists can take in acute stroke management include:
- Become better trained in stroke care. Sessions on stroke management are included in numerous HM educational programs, including SHM conferences and in continuing medical education (CME) offerings from such groups as the American Academy of Neurology (see “Stroke Training, Resources, and Opportunities,” p. 30).
- Partner with neurologists in your hospital. One trend is to develop a neurohospitalist practice.
- Push for increased organization and response times for stroke patients. Given HM’s focus on quality and patient safety, hospitalists are natural champions for improving systems of care for stroke. Hospitalists can work with neurologists, radiologists, pharmacists, and other providers to develop stroke treatment protocols and rapid response capabilities.
- Help develop a stroke team, and seek certification as a primary stroke center. The Joint Commission certifies stroke centers (www.jointcommission.org/CertificationPrograms/PrimaryStroke Centers) based on demonstrated compliance with disease-based standards, effective use of clinical practice guidelines, and performance-improvement activities.
- Establish a collaborative relationship with a regional stroke center or tertiary hospital. This could manifest as a telemedicine link to aid in stroke assessment and treatment decisions (see “Rural Response: The ‘Drip and Ship’ Method,” p. 28).
- Refine approaches to more rapidly identify and work up patients who experience a stroke while they are in the hospital.

—S. Andrew Josephson, MD, director, neurohospitalist program, University of California at San Francisco Medical Center
Streamline In-Hospital Stroke Response
From 6.5% to 15% of stroke patients experience their stroke while they are in the hospital.4 “Hospitals are not always geared up to deal with neurological emergencies, and yet these patients are firmly within our domain,” Dr. Cumbler says. “We found that it took three times longer in our hospital to complete the evaluation when the stroke happened in the hospital than for strokes presenting in the emergency department.”
Through a hospitalwide quality-improvement (QI) project, UCD’s in-hospital stroke response time was reduced to 37 minutes from 70 minutes.
A comprehensive approach to stroke QI should include training first witnesses in the hospital (e.g., nurses, physical therapists, and housekeepers) to recognize potential stroke symptoms; creating a rapid response capability from personnel who understand how to evaluate and treat suspected stroke and are able to respond quickly; and making suspected stroke a top priority in the radiology lab.
Stroke patient management processes need to be improved and provider roles better defined. Hospitalists can help on the frontlines, and should advocate for quality and patient safety measures.
“Stroke has so many facets: the need to reduce risk, to educate the public about the need for prompt response, the appropriate evaluation of risks and benefits of treatment,” Dr. Cumbler says. “How do you achieve a system in the hospital where patients are fully able to realize benefits of all these advances? I think there’s something in stroke treatment for every hospitalist and, for those with a particular interest, opportunities to play leadership roles.”
New Era in Stroke Care
Many compare the evolution of stroke care to that of more common conditions, and hospitalists have a buffet of new and improved treatments and technologies at their disposal. “This is an interesting time in the treatment of stroke,” Dr. Cumbler says. “We are at the cusp of a new era. Previously, stroke was one of the classic neurologic issues in hospital medicine, but we did not have much to offer. Now, as with heart attack, we have a growing array of urgent and effective treatment options, and new imaging techniques to determine whether to treat and with what type of treatment.”
New and emerging treatment approaches include:
- Induced hypothermia, to protect the brain;
- Enhanced thrombolytics by ultrasound;
- Perfusion-based treatment time windows;
- Recanalization;
- Extended cardiac telemetry targeting atrial fibrillation;
- Neuroprotective agents; and
- Pressor usage to raise blood pressure in the post-stroke patient.
Interventional strategies seek to combine intravenous t-PA with localized techniques to open occluded vessels. While these are cutting-edge and not yet integrated into medical routine, “they illustrate why stroke management is so exciting right now,” Dr. Cumbler says.
As stroke treatment becomes more standardized, hospitals will expect HM physicians to be thoroughly versed in optimal stroke care, says David Yu, MD, MBA, FACP, medical director of hospitalist services at Decatur Memorial Hospital in Illinois and a member of Team Hospitalist. “There will be a shift in hospital medicine, with the practice of neurology becoming more open to non-neurologists,” he says. “As opportunities for stroke treatment increase, more responsibility will fall on hospitalists. It is part of the evolution of our field.”
That evolution is reflected in Medicare’s decision in 2005 to begin paying hospitals a higher diagnostic-related grouping (DRG) rate for administering intravenous t-PA.5 DRG 559 pays a hospital about $6,000 more, regionally adjusted, for stroke treatment that includes intravenous t-PA, compared with stroke care without it. That differential creates incentives for the hospital to invest in infrastructure, staffing, and training.
The Neurohospitalist
Recent journal articles have explored the emergence of neurohospitalists—hybrid physicians who are loosely defined as neurologists whose primary focus is the care of hospitalized patients. The neurohospitalist trend is spurred by the same time and fiscal constraints that drove the HM movement, says William Freeman, MD, neurologist at the Mayo Clinic in Jacksonville, Fla., and coauthor of one of those articles.6
Office-based neurologists increasingly are unavailable to respond to neurological emergencies in the hospital. Depending on the size of the hospital and its need for specialist access, an organized neurohospitalist group covering a schedule in the hospital could make significant contributions to quality of care, length of stay, and other stroke outcomes, Dr. Freeman says. “This field is starting to gel and crystallize, as more neurologists find themselves focusing their practice on site of care,” he notes.
Although not all experts agree, Dr. Freeman says that general hospitalists could become neurohospitalists, and vice versa. Neurologists could learn more internal medicine, and the two groups could work together more closely, he says.
Dr. Josephson of the University of California at San Francisco Medical Center reserves the term “neurohospitalist” for neurologists, but adds that medical hospitalists can manage neurologic disorders. He also sees potential for joint research on the management of hospitalized neurologic patients.
Drs. Freeman and Josephson have led discussions of the neurohospitalist model, both within AAN and in a recent conference call with SHM representatives. Data are limited on the numbers of physicians practicing this specialty, but job postings are growing and a neurohospitalist listserv sponsored by AAN grew to 250 members from 50 within six months. The University of California at San Francisco Medical Center established the first neurohospitalist fellowship in 2008, and a neurohospitalist journal is in development. “Most stroke patients are not seen by neurologists. I keep saying that at stroke conventions,” Dr. Josephson explains. “Hospitalists are going to continue to be out front on stroke management. Some will have a neurologist available. More likely, the hospitalist and neurologist will be participating in acute stroke management as part of some system of care with the emergency department or critical care.” TH
Larry Beresford is a freelance writer based in Oakland, Calif.
References
- Glasheen J, Cumbler E, Tailoring internal medicine training to improve hospitalist outcomes. Arch Intern Med. 2009;169:204-205.
- Telemedicine helps experts treat stroke from afar. National Stroke Association Web site. Available at: http://www.stroke.org/site/News2?page=NewsArticle&id=8208&news_iv_ctrl=1221. Accessed Nov. 4, 2009.
- Plauth WH, Pantilat SZ, Wachter RM, Fenton CL. Hospitalists’ perceptions of their residency training needs: results of a national survey. Am J Med. 2001;111(3)247-254.
- Blacker DJ. In-hospital stroke. Lancet Neurol. 2003;2(12):741-746.
- Demaerschalk BM, Durocher DL. How diagnosis-related group 559 will change the US Medicare cost reimbursement ratio for stroke centers. Stroke. 2007;38:1309-1312.
- Freeman WD, Gronseth G, Eidelman BH. Is it time for neurohospitalists? Neurology. 2009;72:476-477.
- Hacke W, Kaste M, Bluhmki E, et al. Thrombolysis with alteplase 3 to 4.5 hours after acute ischemic stroke. N Engl J Med. 2008;359(13):1317-1329.
- Del Zoppo GJ, Saver JL, Jauch EC, Adams HP Jr. American Heart Association Stroke Council. Expansion of the time window for treatment of acute ischemic stroke with intravenous tissue plasminogen activator: a science advisory from the American Heart Association/American Stroke Association. Stroke. 2009;40(8):2945-2948.
- Lyden P. Thrombolytic therapy for acute stroke—not a moment to lose. N Engl J Med. 2008;359:1393-1397.
- Doheny K. Few stroke patients get clot-busting drug. Business Week Web site. Available at: http://www.businessweek.com/lifestyle/content/healthday/624280.html. Accessed Sept. 23, 2009.
- Sacco RL, Diener HC, Yusuf S, et al. Aspirin and extended-release dipyridamole versus clopidogrel for recurrent strokes. N Engl J Med. 2008;359:1238-1251.
- Cumbler E, Glasheen J. Risk stratification tools for TIA: Which patients require hospital admission? J Hosp Med. 2009;4:247-251.
- Johnston SC, Rothwell PM, Nguyen-Huynh MN, et al. Validation and refinement of scores to predict very early stroke risk after transient ischaemic attack. Lancet. 2007; 369:283-292.
- Cumbler E, Glasheen J. Management of blood pressure after acute ischemic stroke: An evidence-based guide for the hospitalist. J Hosp Med. 2007;2:261-267.
Image Source: FORESTPATH/ISTOCKPHOTO.COM
Ethan Cumbler, MD, is board-certified in internal medicine and pediatrics, and has practiced hospital medicine for six years, first at a community hospital and now at the University of Colorado Denver (UCD), where he directs the Acute Care for the Elderly service. The prevalence of stroke in his practice and the daily challenges of managing stroke patients led Dr. Cumbler to seek additional training in stroke care. He is the hospitalist representative to the UCD stroke council, a researcher in the arena of acute stroke care, and is helping UCD become a Joint Commission-certified stroke center.
“There are a variety of roles for the hospitalist in stroke care,” Dr. Cumbler says, explaining that HM physicians can be admitting attendings for stroke patients or part of acute stroke teams, and participate in decisions to start such treatments as intravenous recombinant tissue plasminogen activator (t-PA), the Food and Drug Administration-approved clot-busting therapy. “[Hospitalists] can be medical consultants on stroke patients admitted to other hospital services, managing common comorbid conditions such as blood pressure and glucose levels, which have particular character for patients immediately post-stroke.”
Stroke is the third-leading cause of death in the U.S., as well as a leading cause of serious, long-term disability. How many stroke patients are seen by hospitalists is not known, but it is reasonable to assume that a majority of hospitalized stroke patients will encounter a hospitalist, if not for acute treatment, then for ongoing medical management.
Some hospitalists think stroke and transient ischemic attacks (TIAs)—temporary neurological deficits sometimes called “mini-strokes,” and a major risk factor for full-blown strokes—are among the most common diseases seen by hospitalists.1 Acute stroke care is a growing part of HM practice because neurologist availability in emergent situations varies widely between hospitals. The rapid evolution of stroke treatment and the time-sensitive needs of stroke patients represents a huge opportunity for hospitalists to fill that void for their hospitals—whether they want to or not.
“I think hospitalists are fully capable of learning and mastering stroke care, but it requires both interest and training,” Dr. Cumbler says.
HM Can Help Fill a Void
According to the American Heart Association (AHA), there are four neurologists per 100,000 Americans, and not all of those neurologists specialize in stroke care.2 The scarcity of neurological specialists means that in many hospitals, a neurologist won’t be available for the critical assessment and treatment decisions required in the first few hours after a stroke is diagnosed. Yet many hospitalists complain that their preparation during internal-medicine residency did not equip them to care for acute stroke patients.3
S. Andrew Josephson, MD, a neurovascular physician and director of the neurohospitalist program at the University of California at San Francisco Medical Center, says the number of hospitalists on the front lines of acute stroke care is growing every day. “A new stroke is a very treatable neurological emergency that requires ultra-fast intervention,”7 Dr. Josephson says, “and hospitalists, increasingly, are the people who matter most in that intervention.” The reason, in most cases, is hospitalists are available at all times, and neurologists aren’t.
Given variable access to neurologists at the time of urgent need in many hospitals, the actions hospitalists can take in acute stroke management include:
- Become better trained in stroke care. Sessions on stroke management are included in numerous HM educational programs, including SHM conferences and in continuing medical education (CME) offerings from such groups as the American Academy of Neurology (see “Stroke Training, Resources, and Opportunities,” p. 30).
- Partner with neurologists in your hospital. One trend is to develop a neurohospitalist practice.
- Push for increased organization and response times for stroke patients. Given HM’s focus on quality and patient safety, hospitalists are natural champions for improving systems of care for stroke. Hospitalists can work with neurologists, radiologists, pharmacists, and other providers to develop stroke treatment protocols and rapid response capabilities.
- Help develop a stroke team, and seek certification as a primary stroke center. The Joint Commission certifies stroke centers (www.jointcommission.org/CertificationPrograms/PrimaryStroke Centers) based on demonstrated compliance with disease-based standards, effective use of clinical practice guidelines, and performance-improvement activities.
- Establish a collaborative relationship with a regional stroke center or tertiary hospital. This could manifest as a telemedicine link to aid in stroke assessment and treatment decisions (see “Rural Response: The ‘Drip and Ship’ Method,” p. 28).
- Refine approaches to more rapidly identify and work up patients who experience a stroke while they are in the hospital.
—S. Andrew Josephson, MD, director, neurohospitalist program, University of California at San Francisco Medical Center
Streamline In-Hospital Stroke Response
From 6.5% to 15% of stroke patients experience their stroke while they are in the hospital.4 “Hospitals are not always geared up to deal with neurological emergencies, and yet these patients are firmly within our domain,” Dr. Cumbler says. “We found that it took three times longer in our hospital to complete the evaluation when the stroke happened in the hospital than for strokes presenting in the emergency department.”
Through a hospitalwide quality-improvement (QI) project, UCD’s in-hospital stroke response time was reduced to 37 minutes from 70 minutes.
A comprehensive approach to stroke QI should include training first witnesses in the hospital (e.g., nurses, physical therapists, and housekeepers) to recognize potential stroke symptoms; creating a rapid response capability from personnel who understand how to evaluate and treat suspected stroke and are able to respond quickly; and making suspected stroke a top priority in the radiology lab.
Stroke patient management processes need to be improved and provider roles better defined. Hospitalists can help on the frontlines, and should advocate for quality and patient safety measures.
“Stroke has so many facets: the need to reduce risk, to educate the public about the need for prompt response, the appropriate evaluation of risks and benefits of treatment,” Dr. Cumbler says. “How do you achieve a system in the hospital where patients are fully able to realize benefits of all these advances? I think there’s something in stroke treatment for every hospitalist and, for those with a particular interest, opportunities to play leadership roles.”
New Era in Stroke Care
Many compare the evolution of stroke care to that of more common conditions, and hospitalists have a buffet of new and improved treatments and technologies at their disposal. “This is an interesting time in the treatment of stroke,” Dr. Cumbler says. “We are at the cusp of a new era. Previously, stroke was one of the classic neurologic issues in hospital medicine, but we did not have much to offer. Now, as with heart attack, we have a growing array of urgent and effective treatment options, and new imaging techniques to determine whether to treat and with what type of treatment.”
New and emerging treatment approaches include:
- Induced hypothermia, to protect the brain;
- Enhanced thrombolytics by ultrasound;
- Perfusion-based treatment time windows;
- Recanalization;
- Extended cardiac telemetry targeting atrial fibrillation;
- Neuroprotective agents; and
- Pressor usage to raise blood pressure in the post-stroke patient.
Interventional strategies seek to combine intravenous t-PA with localized techniques to open occluded vessels. While these are cutting-edge and not yet integrated into medical routine, “they illustrate why stroke management is so exciting right now,” Dr. Cumbler says.
As stroke treatment becomes more standardized, hospitals will expect HM physicians to be thoroughly versed in optimal stroke care, says David Yu, MD, MBA, FACP, medical director of hospitalist services at Decatur Memorial Hospital in Illinois and a member of Team Hospitalist. “There will be a shift in hospital medicine, with the practice of neurology becoming more open to non-neurologists,” he says. “As opportunities for stroke treatment increase, more responsibility will fall on hospitalists. It is part of the evolution of our field.”
That evolution is reflected in Medicare’s decision in 2005 to begin paying hospitals a higher diagnostic-related grouping (DRG) rate for administering intravenous t-PA.5 DRG 559 pays a hospital about $6,000 more, regionally adjusted, for stroke treatment that includes intravenous t-PA, compared with stroke care without it. That differential creates incentives for the hospital to invest in infrastructure, staffing, and training.
The Neurohospitalist
Recent journal articles have explored the emergence of neurohospitalists—hybrid physicians who are loosely defined as neurologists whose primary focus is the care of hospitalized patients. The neurohospitalist trend is spurred by the same time and fiscal constraints that drove the HM movement, says William Freeman, MD, neurologist at the Mayo Clinic in Jacksonville, Fla., and coauthor of one of those articles.6
Office-based neurologists increasingly are unavailable to respond to neurological emergencies in the hospital. Depending on the size of the hospital and its need for specialist access, an organized neurohospitalist group covering a schedule in the hospital could make significant contributions to quality of care, length of stay, and other stroke outcomes, Dr. Freeman says. “This field is starting to gel and crystallize, as more neurologists find themselves focusing their practice on site of care,” he notes.
Although not all experts agree, Dr. Freeman says that general hospitalists could become neurohospitalists, and vice versa. Neurologists could learn more internal medicine, and the two groups could work together more closely, he says.
Dr. Josephson of the University of California at San Francisco Medical Center reserves the term “neurohospitalist” for neurologists, but adds that medical hospitalists can manage neurologic disorders. He also sees potential for joint research on the management of hospitalized neurologic patients.
Drs. Freeman and Josephson have led discussions of the neurohospitalist model, both within AAN and in a recent conference call with SHM representatives. Data are limited on the numbers of physicians practicing this specialty, but job postings are growing and a neurohospitalist listserv sponsored by AAN grew to 250 members from 50 within six months. The University of California at San Francisco Medical Center established the first neurohospitalist fellowship in 2008, and a neurohospitalist journal is in development. “Most stroke patients are not seen by neurologists. I keep saying that at stroke conventions,” Dr. Josephson explains. “Hospitalists are going to continue to be out front on stroke management. Some will have a neurologist available. More likely, the hospitalist and neurologist will be participating in acute stroke management as part of some system of care with the emergency department or critical care.” TH
Larry Beresford is a freelance writer based in Oakland, Calif.
References
- Glasheen J, Cumbler E, Tailoring internal medicine training to improve hospitalist outcomes. Arch Intern Med. 2009;169:204-205.
- Telemedicine helps experts treat stroke from afar. National Stroke Association Web site. Available at: http://www.stroke.org/site/News2?page=NewsArticle&id=8208&news_iv_ctrl=1221. Accessed Nov. 4, 2009.
- Plauth WH, Pantilat SZ, Wachter RM, Fenton CL. Hospitalists’ perceptions of their residency training needs: results of a national survey. Am J Med. 2001;111(3)247-254.
- Blacker DJ. In-hospital stroke. Lancet Neurol. 2003;2(12):741-746.
- Demaerschalk BM, Durocher DL. How diagnosis-related group 559 will change the US Medicare cost reimbursement ratio for stroke centers. Stroke. 2007;38:1309-1312.
- Freeman WD, Gronseth G, Eidelman BH. Is it time for neurohospitalists? Neurology. 2009;72:476-477.
- Hacke W, Kaste M, Bluhmki E, et al. Thrombolysis with alteplase 3 to 4.5 hours after acute ischemic stroke. N Engl J Med. 2008;359(13):1317-1329.
- Del Zoppo GJ, Saver JL, Jauch EC, Adams HP Jr. American Heart Association Stroke Council. Expansion of the time window for treatment of acute ischemic stroke with intravenous tissue plasminogen activator: a science advisory from the American Heart Association/American Stroke Association. Stroke. 2009;40(8):2945-2948.
- Lyden P. Thrombolytic therapy for acute stroke—not a moment to lose. N Engl J Med. 2008;359:1393-1397.
- Doheny K. Few stroke patients get clot-busting drug. Business Week Web site. Available at: http://www.businessweek.com/lifestyle/content/healthday/624280.html. Accessed Sept. 23, 2009.
- Sacco RL, Diener HC, Yusuf S, et al. Aspirin and extended-release dipyridamole versus clopidogrel for recurrent strokes. N Engl J Med. 2008;359:1238-1251.
- Cumbler E, Glasheen J. Risk stratification tools for TIA: Which patients require hospital admission? J Hosp Med. 2009;4:247-251.
- Johnston SC, Rothwell PM, Nguyen-Huynh MN, et al. Validation and refinement of scores to predict very early stroke risk after transient ischaemic attack. Lancet. 2007; 369:283-292.
- Cumbler E, Glasheen J. Management of blood pressure after acute ischemic stroke: An evidence-based guide for the hospitalist. J Hosp Med. 2007;2:261-267.
Image Source: FORESTPATH/ISTOCKPHOTO.COM
ONLINE EXCLUSIVE: Audio interview with Robert Wachter, MD, FHM
Listen to HM pioneer Bob Wachter recap his HM09 keynote address about the quality and patient safety revolution
Listen to HM pioneer Bob Wachter recap his HM09 keynote address about the quality and patient safety revolution
Listen to HM pioneer Bob Wachter recap his HM09 keynote address about the quality and patient safety revolution
All Grown Up
There are times when Dan Hale, MD, FAAP, wishes he had more standardized tools to use when he leads a team of four full-time and four part-time pediatric hospitalists at Central Maine Medical Center (CMMC) in Lewiston. Even after five years at the community hospital, the pediatric HM program still is searching for the best way to hand off patients who are leaving the hospital to their primary-care physicians (PCPs).
It also would be beneficial to have markers against which CMMC could compare itself with similarly sized pediatric HM programs around the country, says Dr. Hale, chief of pediatrics at the medical center. CMMC, which averages about 4,000 patient encounters per year, is one of three hospitals in the state with a pediatric HM program. “It would be nice to see progress being made in these areas,” he says.
Dr. Hale might not have to wait long to see his wishes granted. More than 20 pediatric hospitalists from across the nation met in Chicago earlier this year, intent on developing a strategic framework for pediatric HM (PHM). About 10% of the 30,000-plus hospitalists practicing in the U.S. focus exclusively on pediatrics, according to SHM’s 2007-2008 “Bi-Annual Survey on the State of the Hospital Medicine Movement.” Like the hospitalist movement in general, PHM is growing in number and influence as pediatric hospitalists take on leadership roles and develop working relationships with hospital administrators. The time has come to clearly define the discipline for other physicians, as well as patients and their families, and leverage PHM’s growth and usefulness to improve medical care for children, says Erin Stucky, MD, FHM, a pediatric hospitalist at Rady Children’s Hospital and Health Center in San Diego.

—Jennifer Daru, MD, FAAP, FHM, chief, division of pediatric hospital medicine, California Pacific Medical Center, San Francisco
“It’s a little bit of pie in the sky, a little bit of rose-colored glasses, but it’s good to aim high,” she says.
Some PHM leaders think the subspecialty has advanced enough in recent years to apply its collective knowledge and influence on a broader stage. “We have gone through our adolescence, and now we are a big community,” says Jack Percelay, MD, MPH, FHM, a pediatric hospitalist at Saint Barnabas Medical Center in New York City and SHM board member. “We’re active at almost all the major medical centers and we need to step up to the plate. We need to start the hard work of bringing our vision to fruition.”
Definition and Strategy
Drs. Stucky and Percelay attended the Pediatric Hospital Medicine (PHM) Strategic Planning Roundtable and serve on the roundtable’s planning committee. SHM, the Academic Pediatric Association (APA), and the American Academy of Pediatrics (AAP) sponsored the gathering, which included young and veteran pediatric hospitalists, clinicians, researchers, and hospitalists from academic, children’s, and community hospitals. The net was cast far and wide to gather information from a broad cross-section of stakeholders.

—Jack Percelay, MD, MPH, FHM, pediatric hospitalist, Saint Barnabas Medical Center, New York City, SHM board member
As pediatric hospitalists strive to better demonstrate how they can help hospitals improve the quality of patient care and safety while decreasing its cost, the roundtable is charged with defining and educating healthcare professionals on the key issues. Also in the crosshairs: simultaneously advancing evidence-based medicine and family-based care.
“We need to distinguish that we are not just house physicians, but really establish ourselves as content-area knowledge experts,” Dr. Percelay says. In other words, pediatric hospitalists are physicians who specialize in effective and efficient medicine in resource-intensive facilities.
Pediatric hospitalists also grapple with how to enhance career satisfaction and sustainability at a time when many PHM programs require a burdensome clinical load that fosters burnout. Many PHM leaders also think pediatric hospitalists need extra training but fear they will lose those physicians to fellowships. And as the PHM ranks fill with physicians who have little or no outpatient training, there is the challenge of explaining the capabilities and limitations pediatric hospitalists and primary-care physicians (PCPs) have in order to avoid unrealistic expectations and friction.
Participants in the strategic roundtable aim to address several broad goals outlined in an executive summary, which can be viewed in the “Section on Hospital Medicine” on the AAP Web site (www.aap.org/sections/hospcare/default.cfm). The following are some of the goals:
- Ensure care for hospitalized children is fully integrated and includes the medical home;
- Design and support systems for children that eliminate harm associated with hospital care;
- Develop a skilled and stable workforce that provides expert care for hospitalized children;
- Use collaborative research models to answer questions of clinical efficacy, comparative effectiveness, and quality improvement inclusive of patient safety, and deliver care based on that knowledge;
- Provide the expertise that supports innovative continuing education in the care of the hospitalized child for pediatric hospitalists, trainees, midlevel providers, and hospital staff;
- Create value and provide academic and systems leadership for patients and organizations based on pediatric hospitalists’ unique expertise in PHM clinical care, research, and education; and
- Be leaders and influential agents in local, state, and national healthcare policies that affect hospital care.
Although it was discussed, the roundtable decided against the establishment of a professional organization for pediatric hospitalists. Instead, the group agreed to continue to utilize the resources and organizational support provided by SHM, APA, and AAP. All three groups contributed money to the roundtable, sent representatives to the meeting, and are interested in the results.

“The Academic Pediatric Association has been involved with pediatric hospital medicine from the beginning, and we plan on continuing our involvement,” says Daniel Rauch, MD, FHM, associate director of pediatrics at Elmhurst Hospital Center in New York City and co-chair of the APA’s Hospital Medicine Special Interest Group, which is paying close attention to PHM education and research issues.
Strategic Initiatives
The roundtable established four workgroups: clinical practice/workforce, quality and safety, research, and education. The workgroups are directed to create strategic initiative projects focused on advancing the goals laid out at the roundtable meeting and complete most of the projects no later than the July 2010 PHM Conference in Minneapolis (see “A Closer Look at the Pediatric Hospital Medicine Initiatives,” p. 7). At the 2009 PHM conference in Tampa, Fla., roundtable participants reported on some of the initiatives’ preliminary results.
“I walked away … energized and ready to help change the world, which is a pretty great feeling,” says Jennifer Daru, MD, FAAP, FHM, chief of the division of pediatric hospital medicine at California Pacific Medical Center in San Francisco and co-leader of the roundtable’s clinical practice/workforce workgroup.
One of Dr. Daru’s workgroup’s strategic initiative projects should make Dr. Hale and his pediatric hospitalists at Central Maine Medical Center happy. Dr. Daru’s group is creating a clinical practice dashboard template that PHM programs can use to internally track patient care and compare themselves with other programs and national standards.
“I think very few programs have a dashboard, because it’s a relatively newer thing for pediatric hospital medicine,” Dr. Daru says. “With this dashboard, we want to be able to say, ‘Here are the things you should look at to ensure quality care for your kids, and as you look at them, you should probably track them over time.’ ”
Steve Narang, MD, medical director of quality/safety and pediatric emergency services at Our Lady of the Lake Regional Medical Center and Children’s Hospital in Baton Rouge, La., is leading the quality and safety workgroup, which is focused on patient identification, patient handoffs between pediatric hospitalists and PCPs, and clinical outcomes for common pediatric diagnoses.
“Most doctors don’t like standardized forms or cookbook medicine, but they do understand good care. Hopefully, we will show success in these initiatives and they will serve as a launching pad to other initiatives,” Dr. Narang says.
Dr. Hale, for one, is excited by the initiatives and workgroups, and optimistic the strategic projects will help his program. In recent years, the PHM community has talked about these kinds of advances, and he’s encouraged to see them moving forward. “These initiatives contribute to the strength of our field,” says Dr. Hale, who also serves on the executive board of AAP’s Maine chapter.
About 80 pediatric hospitalists have volunteered to help with the strategic initiatives. Earlier this year, a request for help was broadcast over the Section on Hospital Medicine listserv run by the AAP. It was announced at HM09 in Chicago and the PHM conference in Tampa. Everyone who submitted a resume or CV, references, and a statement of interest is included, Dr. Percelay says. “This is not supposed to be some exclusive club that no one can get into,” he says. “We are committed to a transparent process.”
While the application deadline has passed, organizers expect additional calls for volunteers in the future as strategic projects move forward, projects are added, and current volunteers depart (see “How to Get Involved,” above).
“They will be the next volunteer go-tos. We will essentially build them into new projects that come up or if gaps emerge,” Dr. Daru says. “We want to have as many people as possible who are really motivated.”
Group Effort
You don’t necessarily have to volunteer for workgroups to be a part of the broader effort. You can read and comment on draft reports released by some of the project teams, or review the roundtable’s executive summary and find ways to apply the vision and goals to your own PHM program, says Mark Shen, MD, medical director of hospital medicine at Dell Children’s Medical Center in Austin, Texas, and pediatric editor of The Hospitalist.
“If each pediatric hospitalist set strategic initiatives for their own group or hospital, chances are they would find remarkable similarity between what they came up with and what the strategic planning roundtable came up with,” says Dr. Shen, who is directing one of the quality and safety workgroup’s initiatives. “There are plenty of ways to think globally and act locally.” TH
Lisa Ryan is a freelance writer based in New Jersey.
Top Image Source: HOMER SYKES/ALAMY
A Closer Look at the Pediatric Hospital Medicine Initiatives
Four workgroups emerged from the Pediatric Hospital Medicine Strategic Planning Roundtable in February. Each group was charged with directing strategic initiative projects over the next 16 to 18 months. The mission is to transform the delivery of hospital care for children. Here is a synopsis of the workgroup initiatives, some of which have estimated completion dates:

Clinical Practice/Workforce
- Create a PHM position paper that defines what it means to be a pediatric hospitalist and where the field is headed. A progress report is to be published within the next few months.
- Create a clinical practice dashboard template that PHM programs can use to monitor patient care and eventually compare their program with other programs and national standards. The template will include such markers as patient readmissions and pediatric rapid response events that PHM programs should measure and track. The first version of the dashboard template should be ready by the end of 2009; test sites are to be selected by 2010.
- Develop a “return on investment” document to help pediatric hospitalists effectively discuss with hospital administrators and other stakeholders the benefits of adding or expanding PHM programs. Target deadline: February 2010.
- Assess career satisfaction among pediatric hospitalists. A large part of this initiative will involve SHM’s career satisfaction survey.
Quality and Safety
- Launch a safety project involving six to eight hospitals that is aimed at improving pediatric patient identification. Preliminary results are expected by July 2010.
- Develop a standardized communications tool that pediatric hospitalists can use when handing off patients to primary-care physicians after patients leave the hospital.
- Create a benchmarking process for the most common pediatric inpatient diagnoses (e.g., bronchiolitis, skin infections, and pneumonia) by expanding the Value in Inpatient Pediatrics (VIP) Network, a pediatric-hospitalist-led effort to find cost-effective ways to treat patients.
Research
- Restructure the existing Pediatric Research in Inpatient Settings (PRIS) network, an independent entity founded through a joint SHM-AAP-APA effort, to better advance research on issues important to pediatric care.
- Secure funding to conduct studies relevant to inpatient pediatrics. Tap into American Recovery and Reinvestment Act of 2009 (ARRA) funding for comparative effectiveness research. Target deadline: ARRA proposals by fall 2009.
- Create a mentorship system to connect pediatric hospitalists who are interested in research with PHM researchers through the AAP listserv.
Education
- Develop an educational plan supporting PHM core competencies to assist medical schools, post-graduate training programs, and continuing medical education programs in PHM teaching. The core competencies should be released by the end of the year.
- Meet the needs of PHM educators by focusing efforts on topics of interest to them, such as family-centered rounds, night float curriculum, and handoffs. Establish a repository of curriculum information that educators can access for guidance.
There are times when Dan Hale, MD, FAAP, wishes he had more standardized tools to use when he leads a team of four full-time and four part-time pediatric hospitalists at Central Maine Medical Center (CMMC) in Lewiston. Even after five years at the community hospital, the pediatric HM program still is searching for the best way to hand off patients who are leaving the hospital to their primary-care physicians (PCPs).
It also would be beneficial to have markers against which CMMC could compare itself with similarly sized pediatric HM programs around the country, says Dr. Hale, chief of pediatrics at the medical center. CMMC, which averages about 4,000 patient encounters per year, is one of three hospitals in the state with a pediatric HM program. “It would be nice to see progress being made in these areas,” he says.
Dr. Hale might not have to wait long to see his wishes granted. More than 20 pediatric hospitalists from across the nation met in Chicago earlier this year, intent on developing a strategic framework for pediatric HM (PHM). About 10% of the 30,000-plus hospitalists practicing in the U.S. focus exclusively on pediatrics, according to SHM’s 2007-2008 “Bi-Annual Survey on the State of the Hospital Medicine Movement.” Like the hospitalist movement in general, PHM is growing in number and influence as pediatric hospitalists take on leadership roles and develop working relationships with hospital administrators. The time has come to clearly define the discipline for other physicians, as well as patients and their families, and leverage PHM’s growth and usefulness to improve medical care for children, says Erin Stucky, MD, FHM, a pediatric hospitalist at Rady Children’s Hospital and Health Center in San Diego.
—Jennifer Daru, MD, FAAP, FHM, chief, division of pediatric hospital medicine, California Pacific Medical Center, San Francisco
“It’s a little bit of pie in the sky, a little bit of rose-colored glasses, but it’s good to aim high,” she says.
Some PHM leaders think the subspecialty has advanced enough in recent years to apply its collective knowledge and influence on a broader stage. “We have gone through our adolescence, and now we are a big community,” says Jack Percelay, MD, MPH, FHM, a pediatric hospitalist at Saint Barnabas Medical Center in New York City and SHM board member. “We’re active at almost all the major medical centers and we need to step up to the plate. We need to start the hard work of bringing our vision to fruition.”
Definition and Strategy
Drs. Stucky and Percelay attended the Pediatric Hospital Medicine (PHM) Strategic Planning Roundtable and serve on the roundtable’s planning committee. SHM, the Academic Pediatric Association (APA), and the American Academy of Pediatrics (AAP) sponsored the gathering, which included young and veteran pediatric hospitalists, clinicians, researchers, and hospitalists from academic, children’s, and community hospitals. The net was cast far and wide to gather information from a broad cross-section of stakeholders.
—Jack Percelay, MD, MPH, FHM, pediatric hospitalist, Saint Barnabas Medical Center, New York City, SHM board member
As pediatric hospitalists strive to better demonstrate how they can help hospitals improve the quality of patient care and safety while decreasing its cost, the roundtable is charged with defining and educating healthcare professionals on the key issues. Also in the crosshairs: simultaneously advancing evidence-based medicine and family-based care.
“We need to distinguish that we are not just house physicians, but really establish ourselves as content-area knowledge experts,” Dr. Percelay says. In other words, pediatric hospitalists are physicians who specialize in effective and efficient medicine in resource-intensive facilities.
Pediatric hospitalists also grapple with how to enhance career satisfaction and sustainability at a time when many PHM programs require a burdensome clinical load that fosters burnout. Many PHM leaders also think pediatric hospitalists need extra training but fear they will lose those physicians to fellowships. And as the PHM ranks fill with physicians who have little or no outpatient training, there is the challenge of explaining the capabilities and limitations pediatric hospitalists and primary-care physicians (PCPs) have in order to avoid unrealistic expectations and friction.
Participants in the strategic roundtable aim to address several broad goals outlined in an executive summary, which can be viewed in the “Section on Hospital Medicine” on the AAP Web site (www.aap.org/sections/hospcare/default.cfm). The following are some of the goals:
- Ensure care for hospitalized children is fully integrated and includes the medical home;
- Design and support systems for children that eliminate harm associated with hospital care;
- Develop a skilled and stable workforce that provides expert care for hospitalized children;
- Use collaborative research models to answer questions of clinical efficacy, comparative effectiveness, and quality improvement inclusive of patient safety, and deliver care based on that knowledge;
- Provide the expertise that supports innovative continuing education in the care of the hospitalized child for pediatric hospitalists, trainees, midlevel providers, and hospital staff;
- Create value and provide academic and systems leadership for patients and organizations based on pediatric hospitalists’ unique expertise in PHM clinical care, research, and education; and
- Be leaders and influential agents in local, state, and national healthcare policies that affect hospital care.
Although it was discussed, the roundtable decided against the establishment of a professional organization for pediatric hospitalists. Instead, the group agreed to continue to utilize the resources and organizational support provided by SHM, APA, and AAP. All three groups contributed money to the roundtable, sent representatives to the meeting, and are interested in the results.
“The Academic Pediatric Association has been involved with pediatric hospital medicine from the beginning, and we plan on continuing our involvement,” says Daniel Rauch, MD, FHM, associate director of pediatrics at Elmhurst Hospital Center in New York City and co-chair of the APA’s Hospital Medicine Special Interest Group, which is paying close attention to PHM education and research issues.
Strategic Initiatives
The roundtable established four workgroups: clinical practice/workforce, quality and safety, research, and education. The workgroups are directed to create strategic initiative projects focused on advancing the goals laid out at the roundtable meeting and complete most of the projects no later than the July 2010 PHM Conference in Minneapolis (see “A Closer Look at the Pediatric Hospital Medicine Initiatives,” p. 7). At the 2009 PHM conference in Tampa, Fla., roundtable participants reported on some of the initiatives’ preliminary results.
“I walked away … energized and ready to help change the world, which is a pretty great feeling,” says Jennifer Daru, MD, FAAP, FHM, chief of the division of pediatric hospital medicine at California Pacific Medical Center in San Francisco and co-leader of the roundtable’s clinical practice/workforce workgroup.
One of Dr. Daru’s workgroup’s strategic initiative projects should make Dr. Hale and his pediatric hospitalists at Central Maine Medical Center happy. Dr. Daru’s group is creating a clinical practice dashboard template that PHM programs can use to internally track patient care and compare themselves with other programs and national standards.
“I think very few programs have a dashboard, because it’s a relatively newer thing for pediatric hospital medicine,” Dr. Daru says. “With this dashboard, we want to be able to say, ‘Here are the things you should look at to ensure quality care for your kids, and as you look at them, you should probably track them over time.’ ”
Steve Narang, MD, medical director of quality/safety and pediatric emergency services at Our Lady of the Lake Regional Medical Center and Children’s Hospital in Baton Rouge, La., is leading the quality and safety workgroup, which is focused on patient identification, patient handoffs between pediatric hospitalists and PCPs, and clinical outcomes for common pediatric diagnoses.
“Most doctors don’t like standardized forms or cookbook medicine, but they do understand good care. Hopefully, we will show success in these initiatives and they will serve as a launching pad to other initiatives,” Dr. Narang says.
Dr. Hale, for one, is excited by the initiatives and workgroups, and optimistic the strategic projects will help his program. In recent years, the PHM community has talked about these kinds of advances, and he’s encouraged to see them moving forward. “These initiatives contribute to the strength of our field,” says Dr. Hale, who also serves on the executive board of AAP’s Maine chapter.
About 80 pediatric hospitalists have volunteered to help with the strategic initiatives. Earlier this year, a request for help was broadcast over the Section on Hospital Medicine listserv run by the AAP. It was announced at HM09 in Chicago and the PHM conference in Tampa. Everyone who submitted a resume or CV, references, and a statement of interest is included, Dr. Percelay says. “This is not supposed to be some exclusive club that no one can get into,” he says. “We are committed to a transparent process.”
While the application deadline has passed, organizers expect additional calls for volunteers in the future as strategic projects move forward, projects are added, and current volunteers depart (see “How to Get Involved,” above).
“They will be the next volunteer go-tos. We will essentially build them into new projects that come up or if gaps emerge,” Dr. Daru says. “We want to have as many people as possible who are really motivated.”
Group Effort
You don’t necessarily have to volunteer for workgroups to be a part of the broader effort. You can read and comment on draft reports released by some of the project teams, or review the roundtable’s executive summary and find ways to apply the vision and goals to your own PHM program, says Mark Shen, MD, medical director of hospital medicine at Dell Children’s Medical Center in Austin, Texas, and pediatric editor of The Hospitalist.
“If each pediatric hospitalist set strategic initiatives for their own group or hospital, chances are they would find remarkable similarity between what they came up with and what the strategic planning roundtable came up with,” says Dr. Shen, who is directing one of the quality and safety workgroup’s initiatives. “There are plenty of ways to think globally and act locally.” TH
Lisa Ryan is a freelance writer based in New Jersey.
Top Image Source: HOMER SYKES/ALAMY
A Closer Look at the Pediatric Hospital Medicine Initiatives
Four workgroups emerged from the Pediatric Hospital Medicine Strategic Planning Roundtable in February. Each group was charged with directing strategic initiative projects over the next 16 to 18 months. The mission is to transform the delivery of hospital care for children. Here is a synopsis of the workgroup initiatives, some of which have estimated completion dates:
Clinical Practice/Workforce
- Create a PHM position paper that defines what it means to be a pediatric hospitalist and where the field is headed. A progress report is to be published within the next few months.
- Create a clinical practice dashboard template that PHM programs can use to monitor patient care and eventually compare their program with other programs and national standards. The template will include such markers as patient readmissions and pediatric rapid response events that PHM programs should measure and track. The first version of the dashboard template should be ready by the end of 2009; test sites are to be selected by 2010.
- Develop a “return on investment” document to help pediatric hospitalists effectively discuss with hospital administrators and other stakeholders the benefits of adding or expanding PHM programs. Target deadline: February 2010.
- Assess career satisfaction among pediatric hospitalists. A large part of this initiative will involve SHM’s career satisfaction survey.
Quality and Safety
- Launch a safety project involving six to eight hospitals that is aimed at improving pediatric patient identification. Preliminary results are expected by July 2010.
- Develop a standardized communications tool that pediatric hospitalists can use when handing off patients to primary-care physicians after patients leave the hospital.
- Create a benchmarking process for the most common pediatric inpatient diagnoses (e.g., bronchiolitis, skin infections, and pneumonia) by expanding the Value in Inpatient Pediatrics (VIP) Network, a pediatric-hospitalist-led effort to find cost-effective ways to treat patients.
Research
- Restructure the existing Pediatric Research in Inpatient Settings (PRIS) network, an independent entity founded through a joint SHM-AAP-APA effort, to better advance research on issues important to pediatric care.
- Secure funding to conduct studies relevant to inpatient pediatrics. Tap into American Recovery and Reinvestment Act of 2009 (ARRA) funding for comparative effectiveness research. Target deadline: ARRA proposals by fall 2009.
- Create a mentorship system to connect pediatric hospitalists who are interested in research with PHM researchers through the AAP listserv.
Education
- Develop an educational plan supporting PHM core competencies to assist medical schools, post-graduate training programs, and continuing medical education programs in PHM teaching. The core competencies should be released by the end of the year.
- Meet the needs of PHM educators by focusing efforts on topics of interest to them, such as family-centered rounds, night float curriculum, and handoffs. Establish a repository of curriculum information that educators can access for guidance.
ONLINE EXCLUSIVE: Audio interview with Jack Percelay, MD, FHM
Dr. Percelay, an SHM board member, says pediatric hospitalists need to: "establish ourselves as content-area knowledge experts” who specialize in effective and efficient medicine in resource-intensive facilities.
Dr. Percelay, an SHM board member, says pediatric hospitalists need to: "establish ourselves as content-area knowledge experts” who specialize in effective and efficient medicine in resource-intensive facilities.
Dr. Percelay, an SHM board member, says pediatric hospitalists need to: "establish ourselves as content-area knowledge experts” who specialize in effective and efficient medicine in resource-intensive facilities.
ONLINE EXCLUSIVE: Audio interview with Lee H. Schwamm, MD
Massachusetts General Hospital and Brigham and Women’s Hospital are the Boston-based hubs for the Partners TeleStroke Network. The system connects 27 participating hospitals across three states with an escalating chain of access to stroke resources. Spoke hospitals transmit, through a secure link, such clinical data as noncontrast head CT scans to the hub, where a stroke expert “examines” the patient via live video feed and shares in the responsibility for deciding whether to initiate t-PA.
Massachusetts General Hospital and Brigham and Women’s Hospital are the Boston-based hubs for the Partners TeleStroke Network. The system connects 27 participating hospitals across three states with an escalating chain of access to stroke resources. Spoke hospitals transmit, through a secure link, such clinical data as noncontrast head CT scans to the hub, where a stroke expert “examines” the patient via live video feed and shares in the responsibility for deciding whether to initiate t-PA.
Massachusetts General Hospital and Brigham and Women’s Hospital are the Boston-based hubs for the Partners TeleStroke Network. The system connects 27 participating hospitals across three states with an escalating chain of access to stroke resources. Spoke hospitals transmit, through a secure link, such clinical data as noncontrast head CT scans to the hub, where a stroke expert “examines” the patient via live video feed and shares in the responsibility for deciding whether to initiate t-PA.
The Role of Incretin-Based Therapies in Treating Patients with Type 2 Diabetes Mellitus

Supplement Editor:
Laurence Kennedy, MD
Contents
Incretin-based therapies for type 2 diabetes mellitus: New therapeutic mechanisms
Laurence Kennedy, MD
Current antihyperglycemic treatment strategies for patients with type 2 diabetes mellitus
Lawrence Blonde, MD
Role of the incretin pathway in the pathogenesis of type 2 diabetes mellitus
Jeffrey S. Freeman, DO
Patient and treatment perspectives: Revisiting the link between type 2 diabetes, weight gain, and cardiovascular risk
Anne L. Peters, MD, CDE
Advances in therapy for type 2 diabetes: GLP-1 receptor agonists and DPP-4 inhibitors
Jaime A. Davidson, MD
Redefining treatment success in type 2 diabetes mellitus: Comprehensive targeting of core defects
William T. Cefalu, MD; Robert J. Richards, MD; and Lydia Y. Melendez-Ramirez, MD
Incretin-based therapies for type 2 diabetes mellitus: New therapeutic mechanisms
Almost a decade into the 21st century, the global epidemic of diabetes—which accelerated in the 1970s—shows no sign of slowing. At the same time, our insights into both type 1 and type 2 diabetes mellitus (T2DM) have increased at a similarly rapid rate.
At the beginning of the 1970s, it was far from clear whether improved glycemic control made much difference in the long-term well-being of people with diabetes other than to relieve their symptoms of hyperglycemia and decrease the likelihood of diabetic ketoacidosis or hyperglycemic hyperosmolar nonketotic coma. Concerns were expressed about the risk/benefit ratio of antihyperglycemic drugs—so there is nothing new under the sun! The drugs available in the United States were limited to insulin and sulfonylureas. The rest of the world also had access to metformin, but, in truth, its potential was underestimated until much later.
RECOGNIZING THE VALUE OF GLYCEMIC CONTROL
Out of this milieu of scientific uncertainty grew the two clinical trials that effectively ended the debate about the value of glycemic control: the Diabetes Control and Complications Trial (DCCT)1 for type 1 diabetes, and the United Kingdom Prospective Diabetes Study (UKPDS)2,3 for T2DM. The conduct of these trials was facilitated by the timely demonstration of the utility of glycosylated hemoglobin (HbA1c) as an objective measure of glycemic control, and of microalbuminuria as a marker of early nephropathy.
Both the DCCT and the UKPDS, in their initial “end of study” analyses in the 1990s, established the role of glycemic control in reducing the risk of retinopathy, neuropathy, and nephropathy—the microvascular complications of diabetes. Additionally, the UKPDS demonstrated that in T2DM, hypertension management was at least as important as glycemic control in reducing the risk of microvascular complications.
Neither the DCCT nor the UKPDS was powered to determine initially whether glycemic control was a risk factor for cardiovascular disease; however, careful longer-term surveillance of the patient cohorts in the studies has recently borne fruit in this regard. Reports from both studies have shown that efforts to control glycemia early in the course of diabetes are rewarded many years later by a decreased risk of cardiovascular events and death.4,5 This is true even when excellent glycemic control achieved early on is not sustained indefinitely. It has also become widely recognized that the management of diabetes, with prevention of microvascular and cardiovascular disease as major aims, involves much more than a simple preoccupation with glycemic control—important as that is.
NEW TREATMENT OPTIONS
Concurrent with the DCCT and the UKPDS being conducted with, in effect, the therapeutic tools of the 1970s, considerable strides were being made in the development of new classes of antihyperglycemic agents for use in T2DM. These include the thiazolidinediones (TZDs), alpha-glucosidase inhibitors, nonsulfonylurea insulin secretagogues (also known as glinides), and, more recently, the incretin-based drugs that are the focus of this supplement to the Cleveland Clinic Journal of Medicine.
Understandable enthusiasm for tapping into the hitherto unexploited pathways and mechanisms targeted by a new drug class is inevitably tempered by known, or sometimes unforeseen, adverse effects. Some of the adverse effects typically associated with antihyperglycemic drugs used before the incretin-based therapies became available include hypoglycemia, weight gain, and fluid retention; all of these are perceived as possibly increasing the risk of the very thing we are striving to avoid in diabetes—cardiovascular morbidity and mortality. Such is the concern about this risk—epitomized, rightly or wrongly, in the controversial meta-analysis of clinical trials involving rosiglitazone6—that the US Food and Drug Administration now requires new antihyperglycemic drugs not only to meet efficacy standards for improving glycemia but also to show no sign of increased cardiovascular risk. The requirement must be met in preapproval trials, to be followed by postmarketing studies to prove the lack of cardiovascular risk.
As the contributions in this supplement point out, incretin-based therapies generally are either weight neutral or promote weight loss; by their modes of action, they are unlikely to cause hypoglycemia; and, as shown thus far, they are unassociated with fluid retention or increased likelihood of heart failure. Continued vigilance regarding cardiovascular risk will be important for the new incretin-based therapies, however.
BETA-CELL FUNCTION STILL A CHALLENGE
Another aspect of T2DM highlighted by the UKPDS is the degree of pancreatic beta-cell function loss—typically about 50% or more—at the time of clinical diagnosis, and the steady decline in function thereafter.7 This, as much as the understandable fatigue with lifestyle modification that normal humans experience, accounts for the frequent failure of oral antihyperglycemic monotherapy or dual therapy to maintain satisfactory glycemic control over the years. Relieving hyperglycemia at the time of diagnosis by any means usually leads to a temporary improvement in beta-cell function, but the possibility of slowing or even reversing the long-term decline has been an elusive therapeutic goal.
Although direct quantitative assessment of beta-cell function in humans is difficult in routine practice or outside of strict research protocols, a randomized study comparing different monotherapies for T2DM showed that over several years, the rise in HbA1c was more gradual with rosiglitazone than with glyburide or metformin; this suggests that, at least compared with metformin and sulfonylureas, the TZDs may have some longer-term benefit with respect to beta-cell function.8
That incretin-based treatments may help preserve or improve beta-cell function has been suggested by animal data.9 Proving that that is the case in humans will be much more challenging. A recent randomized study in patients with T2DM already taking metformin showed that addition of exenatide for 1 year resulted in improved beta-cell function, assessed by C-peptide responses to glucose and to arginine during a combined euglycemic-hyperinsulinemic and hyperglycemic clamp procedure. The improvement was evident compared with baseline function and with patients randomized to receive insulin glargine in addition to metformin for a year.10 However, 4 weeks after exenatide and glargine were discontinued, the beta-cell function had reverted to the pretreatment level and was not significantly different in the two groups of patients. Moreover, 3 months after treatment discontinuation, the HbA1c levels, which had decreased during the year to a similar extent in both groups, had returned to pretreatment levels. The investigators acknowledged that it was impossible in their study to “discriminate between acute and long-term effects of exenatide on beta-cell function.”10 So, in my opinion, the challenge remains to show that meaningful long-term effects on beta-cell function can be achieved with incretin-based therapy.
That said, there is no doubt that the incretin-based therapies bring a new dimension to our ability to treat diabetes. The articles in this supplement will provide both the specialist and nonspecialist with a better understanding of these relatively new therapies.
- The Diabetes Control and Complications Trial Research Group. The effect of intensive treatment of diabetes on the development and progression of long-term complications in insulin-dependent diabetes mellitus. N Engl J Med 1993; 329:977–986.
- UK Prospective Diabetes Study (UKPDS) Group. Intensive blood-glucose control with sulphonylureas or insulin compared with conventional treatment and risk of complications in patients with type 2 diabetes (UKPDS 33). Lancet 1998; 352:837–853.
- UK Prospective Diabetes Study (UKPDS) Group. Effect of intensive blood-glucose control with metformin on complications in overweight patients with type 2 diabetes (UKPDS 34). Lancet 1998; 352:854–865.
- Nathan DM, Cleary PA, Backlund JY, et al. Intensive diabetes treatment and cardiovascular disease in patients with type 1 diabetes. N Engl J Med 2005; 353:2643–2653.
- Holman RR, Paul SK, Bethel MA, Matthews DR, Neil HA. 10-year follow-up of intensive glucose control in type 2 diabetes. N Engl J Med 2008; 359:1577–1589.
- Nissen SE, Wolski K. Effect of rosiglitazone on the risk of myocardial infarction and death from cardiovascular causes. N Engl J Med 2007; 356:2457–2471.
- UK Prospective Diabetes Study Group. UK prospective diabetes study 16: overview of 6 years’ therapy of type II diabetes: a progressive disease. Diabetes 1995; 44:1249–1258.
- Kahn SE, Haffner SM, Heise MA, et al. Glycemic durability of rosiglitazone, metformin, or glyburide monotherapy. N Engl J Med 2006; 355:2427–2443.
- Baggio LL, Drucker DJ. Biology of incretins: GLP-1 and GIP. Gastroenterology 2007; 132:2131–2157.
- Bunck MC, Diamant M, Cornér A, et al. One-year treatment with exenatide improves beta-cell function, compared with insulin glargine, in metformin-treated type 2 diabetes patients: a randomized, controlled trial. Diabetes Care 2009; 32:762–768.
Almost a decade into the 21st century, the global epidemic of diabetes—which accelerated in the 1970s—shows no sign of slowing. At the same time, our insights into both type 1 and type 2 diabetes mellitus (T2DM) have increased at a similarly rapid rate.
At the beginning of the 1970s, it was far from clear whether improved glycemic control made much difference in the long-term well-being of people with diabetes other than to relieve their symptoms of hyperglycemia and decrease the likelihood of diabetic ketoacidosis or hyperglycemic hyperosmolar nonketotic coma. Concerns were expressed about the risk/benefit ratio of antihyperglycemic drugs—so there is nothing new under the sun! The drugs available in the United States were limited to insulin and sulfonylureas. The rest of the world also had access to metformin, but, in truth, its potential was underestimated until much later.
RECOGNIZING THE VALUE OF GLYCEMIC CONTROL
Out of this milieu of scientific uncertainty grew the two clinical trials that effectively ended the debate about the value of glycemic control: the Diabetes Control and Complications Trial (DCCT)1 for type 1 diabetes, and the United Kingdom Prospective Diabetes Study (UKPDS)2,3 for T2DM. The conduct of these trials was facilitated by the timely demonstration of the utility of glycosylated hemoglobin (HbA1c) as an objective measure of glycemic control, and of microalbuminuria as a marker of early nephropathy.
Both the DCCT and the UKPDS, in their initial “end of study” analyses in the 1990s, established the role of glycemic control in reducing the risk of retinopathy, neuropathy, and nephropathy—the microvascular complications of diabetes. Additionally, the UKPDS demonstrated that in T2DM, hypertension management was at least as important as glycemic control in reducing the risk of microvascular complications.
Neither the DCCT nor the UKPDS was powered to determine initially whether glycemic control was a risk factor for cardiovascular disease; however, careful longer-term surveillance of the patient cohorts in the studies has recently borne fruit in this regard. Reports from both studies have shown that efforts to control glycemia early in the course of diabetes are rewarded many years later by a decreased risk of cardiovascular events and death.4,5 This is true even when excellent glycemic control achieved early on is not sustained indefinitely. It has also become widely recognized that the management of diabetes, with prevention of microvascular and cardiovascular disease as major aims, involves much more than a simple preoccupation with glycemic control—important as that is.
NEW TREATMENT OPTIONS
Concurrent with the DCCT and the UKPDS being conducted with, in effect, the therapeutic tools of the 1970s, considerable strides were being made in the development of new classes of antihyperglycemic agents for use in T2DM. These include the thiazolidinediones (TZDs), alpha-glucosidase inhibitors, nonsulfonylurea insulin secretagogues (also known as glinides), and, more recently, the incretin-based drugs that are the focus of this supplement to the Cleveland Clinic Journal of Medicine.
Understandable enthusiasm for tapping into the hitherto unexploited pathways and mechanisms targeted by a new drug class is inevitably tempered by known, or sometimes unforeseen, adverse effects. Some of the adverse effects typically associated with antihyperglycemic drugs used before the incretin-based therapies became available include hypoglycemia, weight gain, and fluid retention; all of these are perceived as possibly increasing the risk of the very thing we are striving to avoid in diabetes—cardiovascular morbidity and mortality. Such is the concern about this risk—epitomized, rightly or wrongly, in the controversial meta-analysis of clinical trials involving rosiglitazone6—that the US Food and Drug Administration now requires new antihyperglycemic drugs not only to meet efficacy standards for improving glycemia but also to show no sign of increased cardiovascular risk. The requirement must be met in preapproval trials, to be followed by postmarketing studies to prove the lack of cardiovascular risk.
As the contributions in this supplement point out, incretin-based therapies generally are either weight neutral or promote weight loss; by their modes of action, they are unlikely to cause hypoglycemia; and, as shown thus far, they are unassociated with fluid retention or increased likelihood of heart failure. Continued vigilance regarding cardiovascular risk will be important for the new incretin-based therapies, however.
BETA-CELL FUNCTION STILL A CHALLENGE
Another aspect of T2DM highlighted by the UKPDS is the degree of pancreatic beta-cell function loss—typically about 50% or more—at the time of clinical diagnosis, and the steady decline in function thereafter.7 This, as much as the understandable fatigue with lifestyle modification that normal humans experience, accounts for the frequent failure of oral antihyperglycemic monotherapy or dual therapy to maintain satisfactory glycemic control over the years. Relieving hyperglycemia at the time of diagnosis by any means usually leads to a temporary improvement in beta-cell function, but the possibility of slowing or even reversing the long-term decline has been an elusive therapeutic goal.
Although direct quantitative assessment of beta-cell function in humans is difficult in routine practice or outside of strict research protocols, a randomized study comparing different monotherapies for T2DM showed that over several years, the rise in HbA1c was more gradual with rosiglitazone than with glyburide or metformin; this suggests that, at least compared with metformin and sulfonylureas, the TZDs may have some longer-term benefit with respect to beta-cell function.8
That incretin-based treatments may help preserve or improve beta-cell function has been suggested by animal data.9 Proving that that is the case in humans will be much more challenging. A recent randomized study in patients with T2DM already taking metformin showed that addition of exenatide for 1 year resulted in improved beta-cell function, assessed by C-peptide responses to glucose and to arginine during a combined euglycemic-hyperinsulinemic and hyperglycemic clamp procedure. The improvement was evident compared with baseline function and with patients randomized to receive insulin glargine in addition to metformin for a year.10 However, 4 weeks after exenatide and glargine were discontinued, the beta-cell function had reverted to the pretreatment level and was not significantly different in the two groups of patients. Moreover, 3 months after treatment discontinuation, the HbA1c levels, which had decreased during the year to a similar extent in both groups, had returned to pretreatment levels. The investigators acknowledged that it was impossible in their study to “discriminate between acute and long-term effects of exenatide on beta-cell function.”10 So, in my opinion, the challenge remains to show that meaningful long-term effects on beta-cell function can be achieved with incretin-based therapy.
That said, there is no doubt that the incretin-based therapies bring a new dimension to our ability to treat diabetes. The articles in this supplement will provide both the specialist and nonspecialist with a better understanding of these relatively new therapies.
- The Diabetes Control and Complications Trial Research Group. The effect of intensive treatment of diabetes on the development and progression of long-term complications in insulin-dependent diabetes mellitus. N Engl J Med 1993; 329:977–986.
- UK Prospective Diabetes Study (UKPDS) Group. Intensive blood-glucose control with sulphonylureas or insulin compared with conventional treatment and risk of complications in patients with type 2 diabetes (UKPDS 33). Lancet 1998; 352:837–853.
- UK Prospective Diabetes Study (UKPDS) Group. Effect of intensive blood-glucose control with metformin on complications in overweight patients with type 2 diabetes (UKPDS 34). Lancet 1998; 352:854–865.
- Nathan DM, Cleary PA, Backlund JY, et al. Intensive diabetes treatment and cardiovascular disease in patients with type 1 diabetes. N Engl J Med 2005; 353:2643–2653.
- Holman RR, Paul SK, Bethel MA, Matthews DR, Neil HA. 10-year follow-up of intensive glucose control in type 2 diabetes. N Engl J Med 2008; 359:1577–1589.
- Nissen SE, Wolski K. Effect of rosiglitazone on the risk of myocardial infarction and death from cardiovascular causes. N Engl J Med 2007; 356:2457–2471.
- UK Prospective Diabetes Study Group. UK prospective diabetes study 16: overview of 6 years’ therapy of type II diabetes: a progressive disease. Diabetes 1995; 44:1249–1258.
- Kahn SE, Haffner SM, Heise MA, et al. Glycemic durability of rosiglitazone, metformin, or glyburide monotherapy. N Engl J Med 2006; 355:2427–2443.
- Baggio LL, Drucker DJ. Biology of incretins: GLP-1 and GIP. Gastroenterology 2007; 132:2131–2157.
- Bunck MC, Diamant M, Cornér A, et al. One-year treatment with exenatide improves beta-cell function, compared with insulin glargine, in metformin-treated type 2 diabetes patients: a randomized, controlled trial. Diabetes Care 2009; 32:762–768.
Current antihyperglycemic treatment strategies for patients with type 2 diabetes mellitus
Data from the Centers for Disease Control and Prevention indicate that almost 24 million Americans, or 7.8% of the population, have diabetes; 90% to 95% of these have type 2 diabetes mellitus (T2DM).1 Diabetes and excessive weight often coexist. An analysis of data from the 1999–2002 National Health and Nutrition Examination Survey (NHANES) showed that among individuals with diabetes, 85% were overweight or obese and 55% were obese.2
Gaps remain in the management of T2DM between the goals for clinical parameters of care (eg, control of glucose, blood pressure [BP], and lipids) and actual clinical practice.3 NHANES data reveal that glycemic control improved from a mean glycosylated hemoglobin A1c (HbA1c) of 7.82% in 1999–2000 to 7.18% in 2003–2004.4 Hazard models based on the United Kingdom Prospective Diabetes Study (UKPDS) 10-year outcomes data in 4,320 newly diagnosed T2DM patients suggest that a sustained decrease in HbA1c of 0.511 percentage points could reduce diabetes complications by 10.7%.4,5
Additional analysis of NHANES data showed that in 2003–2004, about 57% of individuals achieved glycemic control, 48% reached BP targets, and 50% achieved target cholesterol goals.Only about 13% of diabetes patients achieved their target goals for all three parameters concurrently.6
This article reviews the association between cardiometabolic risk and the current antihyperglycemic treatments for patients with T2DM, with a focus on the role of incretin-related therapies.
THE IMPORTANCE OF CARDIOMETABOLIC RISK IN T2DM
Cardiovascular disease (CVD) is the leading cause of morbidity and mortality among people with diabetes and is the reported cause of mortality in up to 65% of deaths in persons with diabetes in the United States.7 The risk of CVD is two- to fourfold greater among adults with diabetes than among adults who do not have diabetes.8 The risk of CVD in patients with T2DM was evident in the UKPDS 17, where macrovascular complications, including CVD, were about twice as common as microvascular complications (20% vs 9%) after 9 years of follow-up.9 A study that involved more than 44,000 patients showed an almost double rate of mortality from all causes among individuals with T2DM compared with those with no diabetes (hazard ratio, 1.93; 95% confidence interval, 1.89 to 1.97).10 Current guidelines recommend aggressive management of CV risk factors, including BP control, correction of atherogenic dyslipidemia, glycemic control, weight reduction for those who are overweight or obese, and smoking cessation for those who smoke.3,11 Lifestyle interventions, including weight reduction and appropriately prescribed physical activity, result in reduced CV risk factors, which can help slow the progression of T2DM.12
GOALS OF T2DM THERAPY
Several studies have demonstrated that glycemic control can delay or prevent the development and progression of microvascular complications.13,14 UKPDS 33 showed that more intensive blood glucose control (median HbA1c 7.0%) in patients with T2DM followed over 10 years significantly (P = .029) reduced the risk for any diabetes-related end point by 12% compared with conventional therapy (median HbA1c 7.9%). Most of the risk reduction was accounted for by a 25% risk reduction in microvascular end points (P = .0099).13 Another report (UKPDS 35) demonstrated that HbA1c was strongly related to microvascular effects, with a 1% reduction in HbA1c associated with a 37% reduction in microvascular complications.14
Does intensive glucose control reduce CV risk?
To resolve the ongoing question of whether intensive glucose control can lead to a reduction in CV risk in patients with T2DM, three large, long-term trials were conducted within the last decade.15–18 Two of these, the Action to Control Cardiovascular Risk in Diabetes (ACCORD) and Action in Diabetes and Vascular Disease: Preterax and Diamicron Modified Release Controlled Evaluation (ADVANCE) trials, each enrolled more than 10,000 previously treated patients with long-standing T2DM. Patients were randomized to standard or intensive glycemic control for 3.5 years in the ACCORD trial and for 5 years in the ADVANCE trial.15,16
The ACCORD and ADVANCE trials, along with the smaller Veterans Administration Diabetes Trial (VADT) (N = 1,791), failed to show that more intensive glycemic control significantly reduced CVD.15–17 Additionally, the glycemic control component of ACCORD was halted because of increased mortality in the intensive arm compared with the standard arm.15 Further analyses of ACCORD data presented at the 69th Scientific Sessions of the American Diabetes Association (ADA) showed that HbA1c values lower than 7.0% did not explain the increased mortality. The 20% higher risk of death for every 1.0% increase in HbA1c greater than 6.0% suggests that glucose concentrations even lower than the general HbA1c goal of less than 7.0% may be appropriate in some patients.18 The most recent finding from VADT was that CV risk was dependent on disease duration and presence of comorbidities. Intensive therapy seemed to work best in patients with diabetes of less than 15 years’ duration, while risk of a CV event was more than doubled with intensive therapy in patients having diabetes for more than 21 years.
Clarification of treatment goals
A position statement of the ADA and a scientific statement of the American College of Cardiology Foundation and the American Heart Association19 concluded that the “evidence obtained from ACCORD, ADVANCE, and VADT does not suggest the need for major changes in glycemic control targets but, rather, additional clarification of the language that has consistently stressed individualization.” They state that while the general HbA1c goal of less than 7.0% seems reasonable, even lower HbA1c goals may be appropriate for some patients if they can be achieved without significant hypoglycemia or other adverse effects. Such patients might include those with diabetes of short duration, long life expectancy, or no significant CVD or hypoglycemia. Conversely, higher HbA1c goals may be appropriate for patients with limited life expectancy, a history of severe hypoglycemia, established microvascular or macrovascular complications, significant other comorbid conditions, or longstanding diabetes in whom an HbA1c of less than 7.0% has been difficult to attain despite optimal treatment and diabetes self-management education.19
Long-term risk reduction
A 10-year, postinterventional follow-up study (UKPDS 80) of the UKPDS survivor cohort was reported recently.20 Results showed that despite an early loss of glycemic differences between patients treated with diet and those treated with intensive regimens (sulfonylurea or insulin; metformin in overweight patients), the pharmacotherapy group demonstrated a prolonged reduction in microvascular risk as well as a significant reduction in the risk for myocardial infarction (15% [P = .01] in the sulfonylurea-insulin group and 33% [P = .005] in the metformin group) and death from any cause.20 This suggests that early improvement in glycemic control is associated with long-term benefits in the micro- and macrovascular health of patients with T2DM.
Additionally, the recent long-term follow-up of the Steno-2 study21 showed that a multifactorial intervention striving for intensive glucose, BP, and lipid control that included the use of renin-angiotensin system blockers, aspirin, and lipid-lowering agents not only reduced the risk of nonfatal CVD among patients with T2DM and microalbuminuria, but also had sustained beneficial effects on vascular complications and on rates of death from any cause and from CV causes. From a health care payer perspective, intensive multifactorial intervention was more likely to be cost-effective than conventional treatment in Denmark, especially if applied in a primary care setting.22
Comprehensive care needed
The lower-than-expected rates of CV outcomes in the ACCORD, ADVANCE, VADT, and Steno-2 studies reinforce the importance of comprehensive diabetes care that treats not only hyperglycemia but also elevated BP and dyslipidemia; these are considered the “ABCs” of diabetes.11,19 The 2009 ADA standards of medical care guidelines recommend that for most T2DM patients, HbA1c should be maintained at less than 7.0%,3 while the American Association of Clinical Endocrinologists (AACE) 2007 guidelines state that HbA1c should be 6.5% or less.11 Both organizations stress the importance of individualized goals, as discussed above, and advocate BP goals of less than 130/80 mm Hg and dyslipidemia goals of low-density lipoprotein cholesterol (LDL-C) less than 100 mg/dL, high-density lipoprotein cholesterol (HDL-C) greater than 40 mg/dL for men and 50 mg/dL for women, and triglycerides less than 150 mg/dL. It is recommended that an optional LDL-C goal of less than 70 mg/dL be considered for individuals with overt CVD.
CURRENT ANTIHYPERGLYCEMIC TREATMENT STRATEGIES
In response to new insights from clinical research and emerging treatment strategies, disease-specific organizations and medical specialty societies regularly revise and update their treatment guidelines and algorithms. These resources recommend that glycemic progress should be regularly monitored and pharmacologic therapy titrated or new drugs added promptly if glycemic goals are not met after 2 to 3 months.
Several algorithms combine scientific evidence with expert clinical opinion to guide physicians in treating their patients with T2DM. The American College of Endocrinology (ACE)/AACE road maps are designed to help develop individualized treatment regimens to achieve an HbA1c of 6.5% or less.23 The algorithm from a writing group assembled by the ADA and the European Association for the Study of Diabetes (EASD) similarly promotes pharmacologic treatment together with lifestyle modifications to maintain a glycemic goal of HbA1c less than 7.0%.24
OVERVIEW OF ANTIHYPERGLYCEMIC TREATMENT APPROACHES
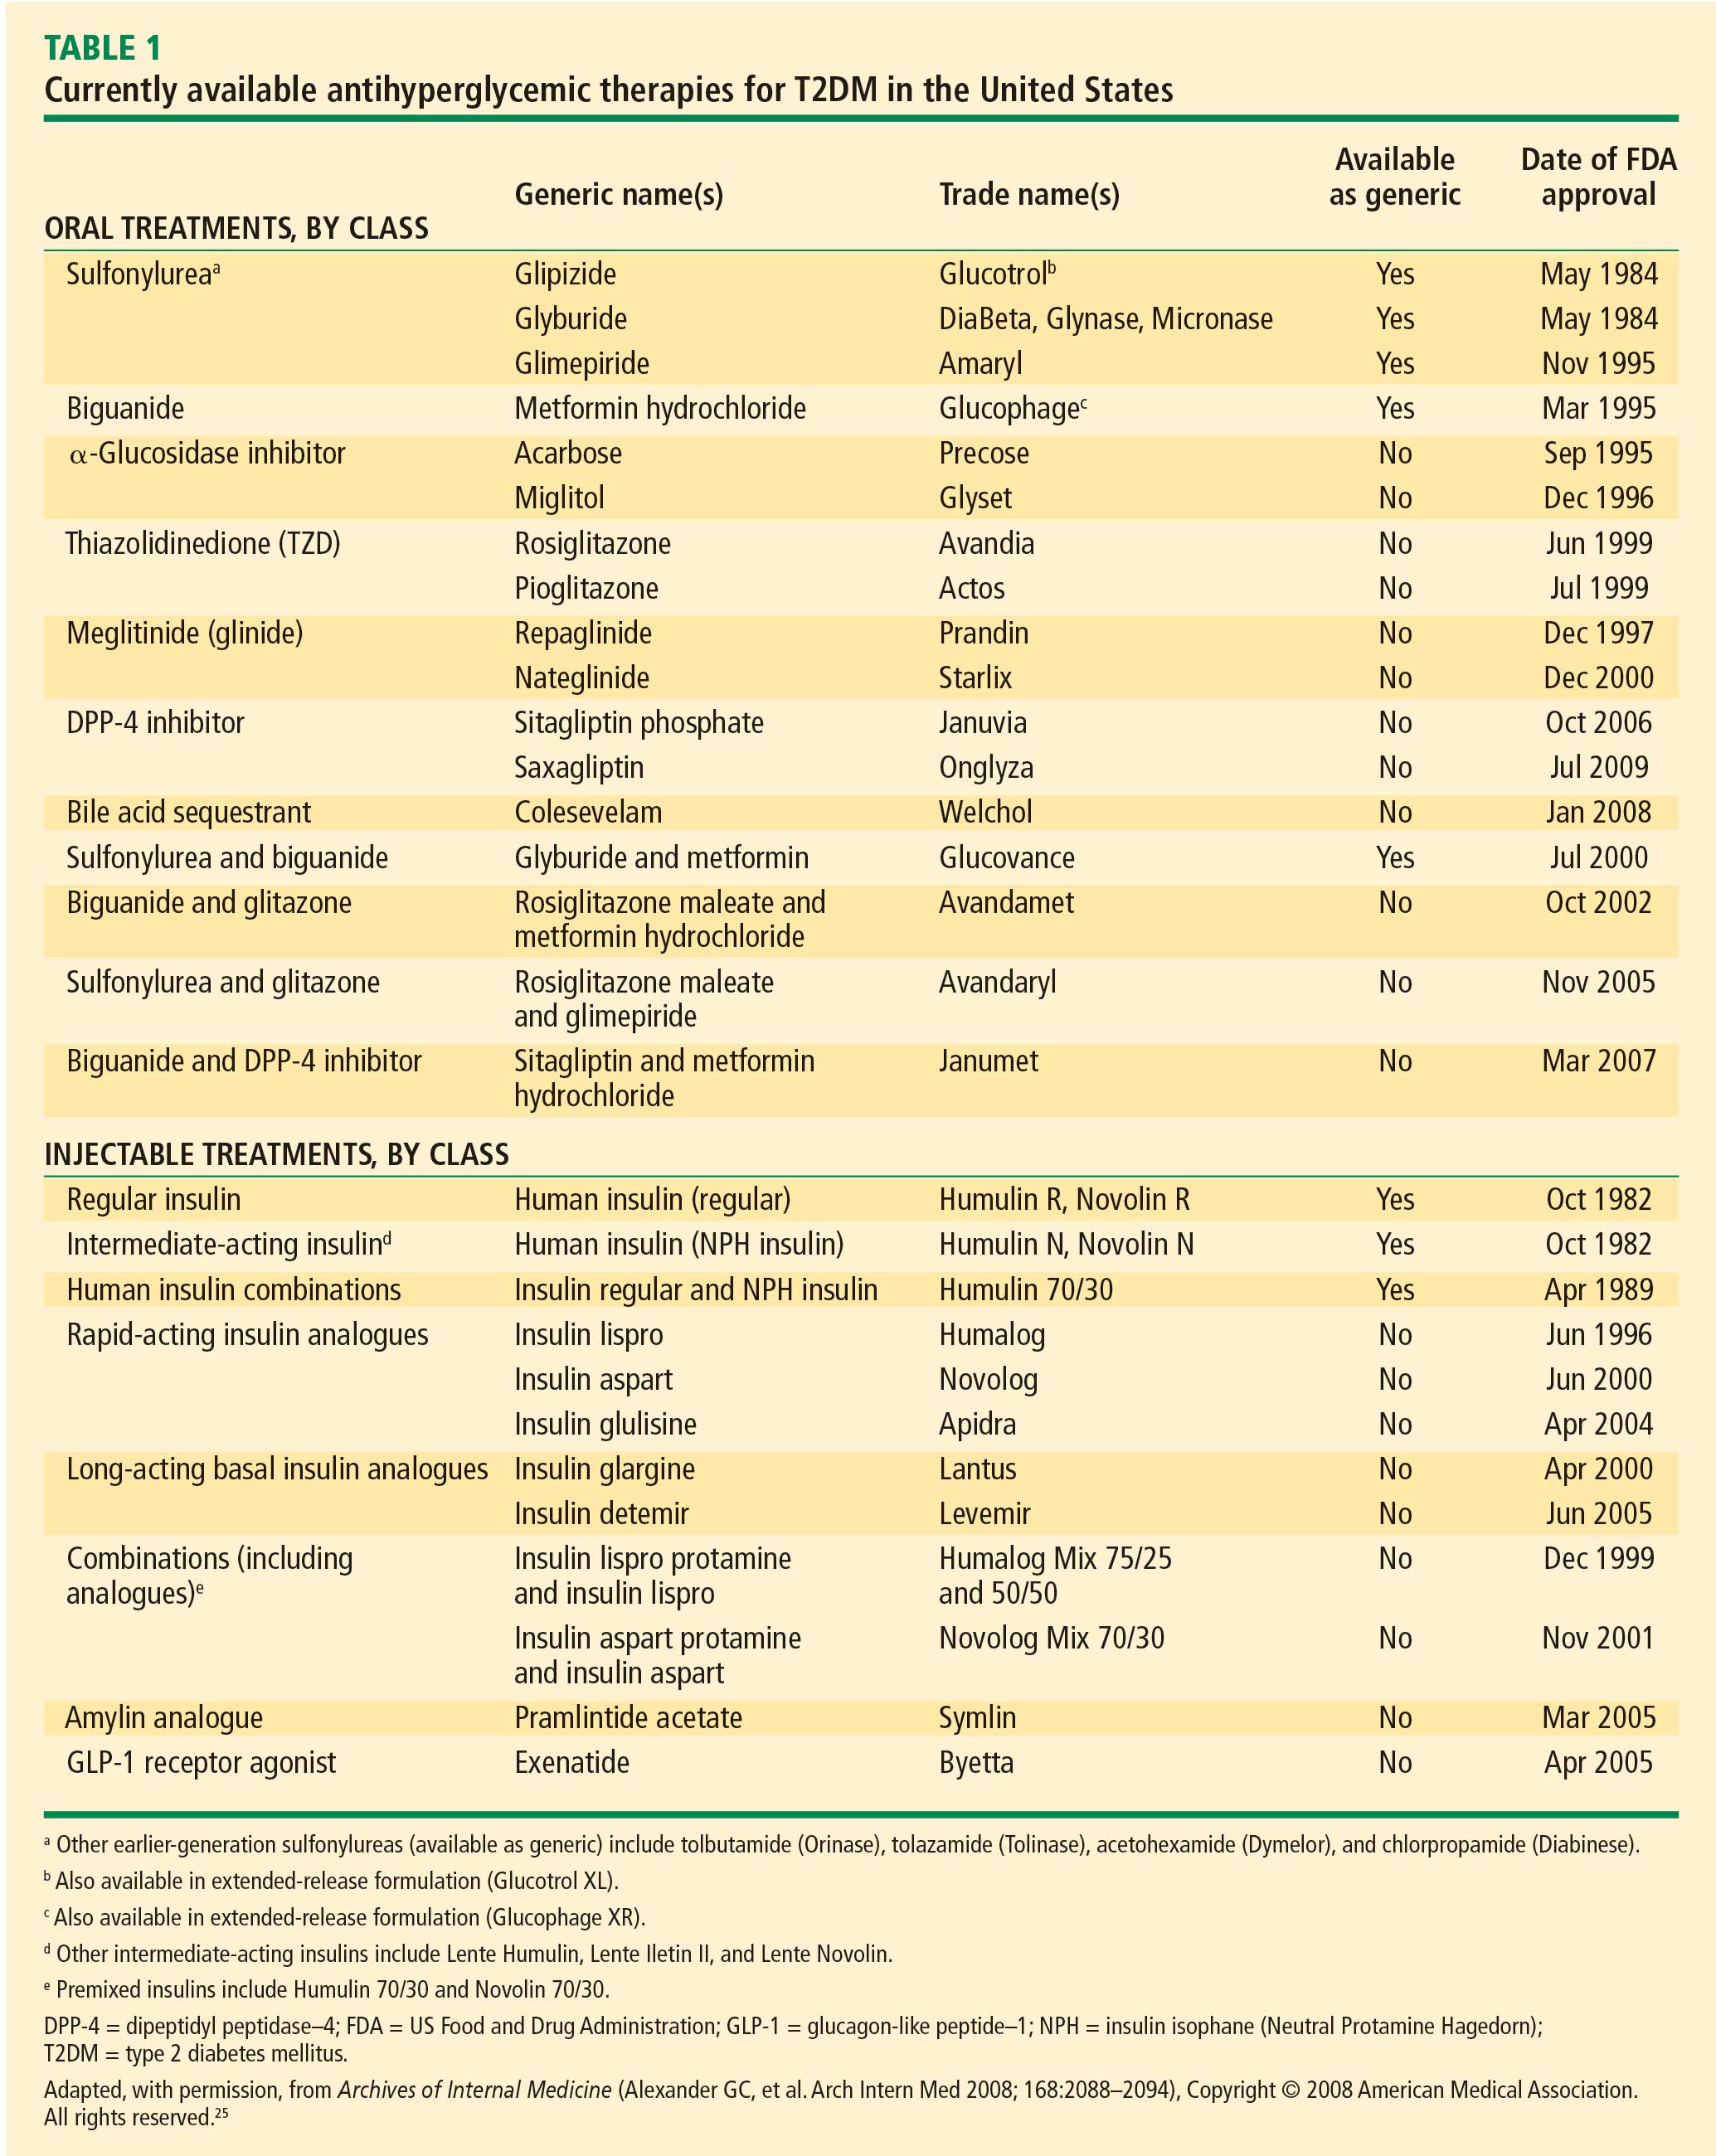
Initial oral therapy
T2DM is usually treated initially with a single oral agent. Consistent with the progressive nature of the disease, patients often eventually require one or more additional oral agents and in many cases insulin.13,27 Choice of specific agents is based on individual patient circumstances, including the need for weight loss and control of fasting versus postprandial glucose, the presence of dyslipidemia and hypertension, and the risk for and potential consequences of hypoglycemia.24 T2DM patients with severely uncontrolled and symptomatic hyperglycemia are best treated, at least initially, with a combination of insulin therapy and lifestyle intervention, often with metformin.
Metformin. The recently revised ADA/EASD writing group algorithm recommends that patients not requiring initial insulin begin treatment with metformin at the time of diagnosis unless there are contraindications.24 Metformin is not associated with hypoglycemia and is considered weight-neutral, although some patients may lose weight.28
Sulfonylureas. Sulfonylureas stimulate insulin secretion from pancreatic beta cells; their use may be associated with hypoglycemia and weight gain. Mechanisms for weight gain with sulfonylureas include reduction of glucosuria and increased caloric intake to prevent or treat hypoglycemia.11,28 Nateglinide and repaglinide are nonsulfonylurea oral insulin secretagogues. They result in rapid and relatively short-lived insulin responses and are usually administered three times a day, before each meal. Their use may be associated with weight gain and hypoglycemia.11
Thiazolidinediones. Thiazolidinediones (TZD) increase insulin sensitivity in muscle, adipose tissue, and the liver. Hypoglycemia is uncommon with TZD monotherapy but weight gain related to increased and redistributed adiposity and fluid retention frequently occurs.
Alpha-glucosidase inhibitors. The alpha-glucosidase inhibitors are administered before meals and primarily reduce postprandial hyperglycemia. They are generally weight-neutral.28
Insulin. Insulin and insulin analogues are the most effective antihyperglycemic agents, but their use can be associated with hypoglycemia and clinically significant weight gain.28
Colesevelam. Colesevelam is a bile acid sequestrant that was recently approved by the US Food and Drug Administration as an antihyperglycemic therapy in people with T2DM. At a dosage of 1.875 g BID or 3.75 g QD in combination with a sulfonylurea, metformin, or insulin therapy, reductions in HbA1c compared with placebo in clinical trials of colesevelam have ranged from –0.5% to –0.7% (P < .02). Frequency of hypoglycemia and weight gain is low with this agent.26
Weight management. Weight reduction is important for overweight or obese patients with T2DM.27,28 Even moderate weight loss (5% of body weight) can be associated with improved insulin action and reduced hyperglycemia.29 Conversely, weight gain has been shown to worsen hyperglycemia and other CV risk factors. Treatment-related weight gain can also lead to decreased regimen adherence, contributing to poor glycemic control.28
THE ROLE OF INCRETIN HORMONES AND INCRETIN-BASED THERAPIES IN T2DM PATIENTS
Over the last few years, the role of incretin hormones and their contribution to diabetes pathophysiology has become more apparent. The incretin effect refers to the observation that orally administered glucose elicits a greater insulin response than does glucose administered intravenously to produce equivalent blood glucose concentrations.30,31 The incretin effect is diminished in patients with T2DM.
Hormone mediation of the incretin effect
The two hormones that mediate the incretin effect are GIP (also known as gastric inhibitory polypeptide or glucose-dependent insulinotropic polypeptide) and glucagon-like peptide−1 (GLP-1).30,31 GLP-1 has several glucoregulatory actions, including enhancement of endogenous insulin release and suppression of inappropriate glucagon secretion, both in a glucose-dependent manner. Therefore, these effects of GLP-1 occur only when glucose concentrations are elevated, thereby minimizing the risk of hypoglycemia. GLP-1 also regulates gastric emptying; infusions of GLP-1 can slow the accelerated emptying that is often present in T2DM patients. GLP-1 also increases satiety and decreases food intake via a central mechanism.31
Because GLP-1 is rapidly inactivated by the enzyme dipeptidyl peptidase–4 (DPP-4), therapeutic use of GLP-1 would require continuous infusion, which is impractical.30,31 Two strategies have been used to produce incretin-related therapies. One, inhibition of the DPP-4 enzyme, results in a two- to threefold enhancement of endogenous GLP-1. The other, involving agents that resist breakdown by DPP-4 but bind to and activate the GLP-1 receptor, produces glucoregulatory effects similar to those of GLP-1.30
Following subcutaneous (SC) injection, GLP-1 receptor agonists enhance insulin secretion and suppress inappropriately elevated glucagon, both in a glucose-dependent manner, as well as slow gastric emptying and enhance satiety.30 DPP-4 inhibitors provide glucose-dependent enhanced insulin secretion and glucagon suppression, but they do not have the same effects on gastric emptying or satiety.
Clinically, the GLP-1 receptor agonists improve glycemia and are associated with weight loss.32–35 Adverse gastrointestinal symptoms are relatively common during the first few weeks of treatment. DPP-4 inhibitors improve glycemia but are weight-neutral and are not generally associated with significant gastrointestinal symptoms.32,36–38
Incretin-based therapies
Incretin-based therapies are currently part of the antihyperglycemic armamentarium.25,32 The AACE guidelines11 and the ACE/AACE roadmaps23 include the GLP-1 receptor agonist exenatide and the DPP-4 inhibitor sitagliptin among antihyperglycemic therapies for patients with T2DM. The most recent update of the consensus algorithm statement of a joint ADA/EASD writing group included GLP-1 receptor agonists (but not DPP-4 inhibitors) in tier 2 of preferred agents, especially for patients who have concerns related to weight and hypoglycemia.24 They noted that DPP-4 inhibitors may be appropriate choices in selected patients.
DPP-4 inhibitors: sitagliptin, saxagliptin. Until recently, sitagliptin was the only DPP-4 inhibitor available in the United States. Sitagliptin is approved by the FDA for treatment of T2DM at a recommended oral dosage of 100 mg QD, either as monotherapy or in combination with other oral antihyperglycemic medications. The dosage of sitagliptin should be reduced to 50 mg/day in patients with creatinine clearance (CrCl) levels that are between 30 mL/min and 50 mL/min and to 25 mg/day in those with CrCl less than 30 mL/min.39
In a meta-analysis of incretin-based therapies, DPP-4 inhibitors produced a reduction in HbA1c compared with placebo (weighted mean difference of –0.74%; 95% confidence interval, –0.85% to –0.62%).32 DPP-4 inhibitor antihyperglycemic efficacy has been shown to be similar whether used as a monotherapy or add-on therapy.32,37,38 This same meta-analysis showed DPP-4 inhibitors as having a neutral effect on weight.32 More recently, a single-pill combination of metformin and sitagliptin was approved.40
A study comparing metformin, sitagliptin, and the combination of the two as initial monotherapy in T2DM patients with a baseline HbA1c of 8.8% showed 24-week HbA1c reductions from baseline of –0.66% with sitagliptin 100 mg QD, –0.82% with metformin 500 mg BID, and –1.90% with sitagliptin 50 mg + metformin 1,000 mg BID.41
On July 31, 2009, the FDA approved another DPP-4 inhibitor, saxagliptin, for the treatment of T2DM either as monotherapy or in combination with metformin, a sulfonylurea, or a TZD.42
GLP-1 receptor agonist: exenatide. Exenatide, the only FDA-approved GLP-1 receptor agonist, is the synthetic version of exendin-4, which binds to the human GLP-1 receptor and in vitro possesses many of the glucoregulatory effects of endogenous GLP-1.30,32 Exenatide is indicated as monotherapy or adjunctive therapy for patients with T2DM who have not achieved adequate glycemic control with metformin, a sulfonylurea, a TZD, or metformin in combination with a sulfonylurea or a TZD.43 Exenatide is administered by SC injection BID at a starting dosage of 5 mg BID for 4 weeks, followed by an increase to 10 mg BID.
Exenatide has been shown not only to enhance glucose-dependent insulin secretion but also to restore impaired first-phase insulin response in subjects with T2DM. Exenatide also helps control postprandial glycemic excursions by suppressing inappropriate glucagon secretion, slowing accelerated gastric emptying, and enhancing satiety. The increased satiety results in decreased food intake and weight loss.31,44 In a recent head-to-head crossover study, exenatide was shown to be more effective than sitagliptin in lowering postprandial glucose concentrations, increasing insulin secretion, and reducing postprandial glucagon secretion.45 Exenatide also slowed gastric emptying and reduced caloric intake.
Exenatide, in most studies, resulted in a placebo-subtracted HbA1c reduction of approximately –1.0% and in one study lowered HbA1c from baseline by –1.5%. Completer analyses have shown HbA1c reductions of –1.0% up to 3 years and –0.8% up to 3.5 years. Exenatide has also been associated with a mean weight loss of as much as –3.6 kg at 30 weeks and as much as –5.3 kg at 3.5 years.33–35,46,47 A 1-year study showed that exenatide improved beta-cell secretory function compared with insulin glargine in metformin-treated patients with T2DM.48 Long-term data, including findings from completed and intention-to-treat analyses of 82 weeks49 to at least 3 years47 have demonstrated that exenatide improved CV risk factors, including those related to BP, lipids, and hepatic injury biomarkers.
Therapies in development
Incretin-based therapies in development include a novel once-weekly formulation of exenatide; taspoglutide, another once-weekly GLP-1 receptor agonist; and liraglutide, a GLP-1 receptor agonist that is administered once daily.50 Liraglutide is currently being evaluated in clinical trials as a once-daily SC injection.51–53 Liraglutide has been reported to reduce HbA1c by –1.1% at 26 weeks and up to –1.14% at 52 weeks and result in weight loss (up to –2.8 kg at 26 weeks and up to –2.5 kg at 52 weeks) in patients with T2DM who are treatment-naïve or taking other antidiabetes agents, including metformin, sulfonylurea, and TZD.51–53 Evaluation of the once-weekly formulation of exenatide showed reductions in HbA1c of –1.9% at 30 weeks and –2.0% at 52 weeks with a weight loss of –3.7 kg at 30 weeks and –4.1 kg over 52 weeks of treatment.46,54
CONCLUSION
In the United States, the epidemics of excessive weight and T2DM have contributed to an increased medical risk for many individuals. Comprehensive diabetes treatments targeting not only hyperglycemia but also frequently associated overweight/obesity, hypertension, and dyslipidemia will be required to reduce such risk. Current treatment strategies have evolved based on updated clinical guidelines and trials, as well as practice experience, including those related to newer agents. Incretin-based therapies, such as the GLP-1 receptor agonist, exenatide, and the DPP-4 inhibitors, sitagliptin and saxagliptin, are important additions to the treatment armamentarium, offering a reduction in hyperglycemia and beneficial effects on weight (reduction with exenatide and neutral with sitagliptin), and have been shown to improve several CV risk factors.
- National Institute of Diabetes and Digestive and Kidney Diseases. National Diabetes Statistics, 2007 fact sheet. Bethesda, MD: US Department of Health and Human Services, National Institutes of Health, 2008. Available at: http://www.diabetes.niddk.nih.gov/dm/pubs/statistics/index.htm. Accessed September 16, 2009.
- Centers for Disease Control and Prevention (CDC). Prevalence of overweight and obesity among adults with diagnosed diabetes: United States, 1988–1994 and 1999–2002. MMWR Morb Mortal Wkly Rep 2004; 53:1066–1068.
- American Diabetes Association. Standards of medical care in diabetes: 2009. Diabetes Care 2009; 32(suppl 1):S13–S61.
- Hoerger TJ, Segel JE, Gregg EW, Saaddine JB. Is glycemic control improving in U.S. adults? Diabetes Care 2008; 31:81–86.
- Stratton IM, Cull CA, Adler AI, Matthews DR, Neil HA, Holman RR. Additive effects of glycaemia and blood pressure exposure on risk of complications in type 2 diabetes: a prospective observational study (UKPDS 75). Diabetologia 2006; 49:1761–1769.
- Ong KL, Cheung BM, Wong LY, Wat NM, Tan KC, Lam KS. Prevalence, treatment, and control of diagnosed diabetes in the U.S. National Health and Nutrition Examination Survey 1999–2004. Ann Epidemiol 2008; 18:222–229.
- Engelgau MM, Geiss LS, Saaddine JB, et al. The evolving diabetes burden in the United States. Ann Intern Med 2004; 140:945–950.
- Fox CS, Coady S, Sorlie PD, et al. Trends in cardiovascular complications of diabetes. JAMA 2004; 292:2495–2499.
- Turner R, Cull C, Holman R. United Kingdom Prospective Diabetes Study 17: a 9-year update of a randomized, controlled trial on the effect of improved metabolic control on complications in noninsulin-dependent diabetes mellitus. Ann Intern Med 1996; 124(1 Pt 2):136–145.
- Mulnier HE, Seaman HE, Raleigh VS, Soedamah-Muthu SS, Colhoun HM, Lawrenson RA. Mortality in people with type 2 diabetes in the UK. Diabet Med 2006; 23:516–521.
- AACE Diabetes Mellitus Clinical Practice Guidelines Task Force. American Association of Clinical Endocrinologists medical guidelines for clinical practice for the management of diabetes mellitus. Endocr Pract 2007; 13(suppl 1):S4–S68.
- American Diabetes Association. Nutrition recommendations and interventions for diabetes: a position statement of the American Diabetes Association. Diabetes Care 2008; 31(suppl 1):S61−S78.
- UK Prospective Diabetes Study (UKPDS) Group. Intensive blood-glucose control with sulphonylureas or insulin compared with conventional treatment and risk of complications in patients with type 2 diabetes (UKPDS 33). Lancet 1998; 352:837–853.
- Stratton IM, Adler AI, Neil HA, et al. Association of glycaemia with macrovascular and microvascular complications of type 2 diabetes (UKPDS 35): prospective observational study. BMJ 2000; 321:405–412.
- The Action to Control Cardiovascular Risk in Diabetes Study Group. Effects of intensive glucose lowering in type 2 diabetes. N Engl J Med 2008; 358:2545–2559.
- The ADVANCE Collaborative Group. Intensive blood glucose control and vascular outcomes in patients with type 2 diabetes. N Engl J Med 2008; 358:2560–2572.
- Duckworth W, Abraira C, Moritz T, et al; for the VADT Investigators. Glucose control and vascular complications in veterans with type 2 diabetes. N Engl J Med 2009; 360:129–139.
- Kerr M. ADA 2009: intensive glycemic control not directly linked to excess cardiovascular risk. Medscape Medical News Web site. http://www.medscape.com/viewarticle/704260_print. Published June 11, 2009. Accessed September 16, 2009.
- Skyler JS, Bergenstal R, Bonow RO, et al. Intensive glycemic control and the prevention of cardiovascular events: implications of the ACCORD, ADVANCE, and VA diabetes trials: a position statement of the American Diabetes Association and a scientific statement of the American College of Cardiology Foundation and the American Heart Association. Diabetes Care 2009; 32:187–192.
- Holman RR, Paul SK, Bethel MA, Matthews DR, Neil HA. 10-year follow-up of intensive glucose control in type 2 diabetes. N Engl J Med 2008; 359:1577–1589.
- Gaede P, Lund-Andersen H, Parving HH, Pedersen O. Effect of a multifactorial intervention on mortality in type 2 diabetes. N Engl J Med 2008; 358:580–591.
- Gaede P, Valentine WJ, Palmer AJ, et al. Cost-effectiveness of intensified versus conventional multifactorial intervention in type 2 diabetes: results and projections from the Steno-2 study. Diabetes Care 2008; 31:1510–1515.
- ACE/AACE Diabetes Road Map Task Force. Road maps to achieve glycemic control in type 2 diabetes mellitus. Endocr Pract 2007; 13:260–268.
- Nathan DM, Buse JB, Davidson MB, et al. Medical management of hyperglycemia in type 2 diabetes: a consensus algorithm for the initiation and adjustment of therapy: a consensus statement of the American Diabetes Association and the European Association for the Study of Diabetes. Diabetes Care 2009; 32:193–203.
- Alexander GC, Sehgal NL, Moloney RM, Stafford RS. National trends in treatment of type 2 diabetes mellitus, 1994–2007. Arch Intern Med 2008; 168:2088–2094.
- Sonnett TE, Levien TL, Neumiller JJ, Gates BJ, Setter SM. Colesevelam hydrochloride for the treatment of type 2 diabetes mellitus. Clin Ther 2009; 31:245–259.
- DeFronzo RA. Pharmacologic therapy for type 2 diabetes mellitus. Ann Intern Med 1999; 131:281–303.
- Purnell JQ, Weyer C. Weight effect of current and experimental drugs for diabetes mellitus: from promotion to alleviation of obesity. Treat Endocrinol 2003; 2:33–47.
- Klein S, Sheard NF, Pi-Sunyer X, et al. Weight management through lifestyle modification for the prevention and management of type 2 diabetes: rationale and strategies: a statement of the American Diabetes Association, the North American Association for the Study of Obesity, and the American Society for Clinical Nutrition. Diabetes Care 2004; 27:2067–2073.
- Stonehouse A, Okerson T, Kendall D, Maggs D. Emerging incretin based therapies for type 2 diabetes: incretin mimetics and DPP-4 inhibitors. Curr Diabetes Rev 2008; 4:101–109.
- Drucker DJ. The biology of incretin hormones. Cell Metab 2006; 3:153–165.
- Amori RE, Lau J, Pittas AG. Efficacy and safety of incretin therapy in type 2 diabetes: systematic review and meta-analysis. JAMA 2007; 298:194–206.
- Buse JB, Henry RR, Han J, et al. Effects of exenatide (exendin-4) on glycemic control over 30 weeks in sulfonylurea-treated patients with type 2 diabetes. Diabetes Care 2004; 27:2628–2635.
- DeFronzo RA, Ratner RE, Han J, Kim DD, Fineman MS, Baron AD. Effects of exenatide (exendin-4) on glycemic control and weight over 30 weeks in metformin-treated patients with type 2 diabetes. Diabetes Care 2005; 28:1092–1100.
- Kendall DM, Riddle MC, Rosenstock J, et al. Effects of exenatide (exendin-4) on glycemic control over 30 weeks in patients with type 2 diabetes treated with metformin and a sulfonylurea. Diabetes Care 2005; 28:1083–1091.
- Aschner P, Kipnes MS, Lunceford JK, et al. Effect of the dipeptidyl peptidase-4 inhibitor sitagliptin as monotherapy on glycemic control in patients with type 2 diabetes. Diabetes Care 2006; 29:2632−2637.
- Charbonnel B, Karasik A, Liu J, Wu M, Meininger G, for the Sitagliptin Study 020 Group. Efficacy and safety of the dipeptidyl peptidase-4 inhibitor sitagliptin added to ongoing metformin therapy in patients with type 2 diabetes inadequately controlled with metformin alone. Diabetes Care 2006; 29:2638–2643.
- Scott R, Wu M, Sanchez M, Stein P. Efficacy and tolerability of the dipeptidyl peptidase-4 inhibitor sitagliptin as monotherapy over 12 weeks in patients with type 2 diabetes. Int J Clin Pract 2007; 61:171–180.
- Januvia. Physicians’ Desk Reference. 63rd edition. Montvale, NJ: Physicians’ Desk Reference Inc; 2008:2048–2054.
- Janumet. Physicians’ Desk Reference. 63rd edition. Montvale, NJ: Physicians’ Desk Reference Inc; 2008:2041–2048.
- Goldstein BJ, Feinglos MN, Lunceford JK, Johnson J, Williams-Herman DE, for the Sitagliptin 036 Study Group. Effect of initial combination therapy with sitagliptin, a dipeptidyl peptidase-4 inhibitor, and metformin on glycemic control in patients with type 2 diabetes. Diabetes Care 2007; 30:1979–1987.
- US Department of Health and Human Services. FDA approves new drug treatment for type 2 diabetes. US Food and Drug Administration Web site. http://www.fda.gov/newsevents/newsroom/pressannouncements/ucm174780.htm. Published July 31, 2009. Accessed September 18, 2009.
- Byetta [package insert]. San Diego, CA: Amylin Pharmaceuticals, Inc.; 2009.
- Edwards CM, Stanley SA, Davis R, et al. Exendin-4 reduces fasting and postprandial glucose and decreases energy intake in healthy volunteers. Am J Physiol Endocrinol Metab 2001; 281:E155–E161.
- DeFronzo RA, Okerson T, Viswanathan P, Guan X, Holcombe JH, MacConell L. Effects of exenatide versus sitagliptin on postprandial glucose, insulin and glucagon secretion, gastric emptying, and caloric intake: a randomized, cross-over study. Curr Med Res Opin 2008; 24:2943–2952.
- Drucker DJ, Buse JB, Taylor K, et al. Exenatide once weekly versus twice daily for the treatment of type 2 diabetes: a randomised, open-label, non-inferiority study. Lancet 2008; 372:1240–1250.
- Klonoff DC, Buse JB, Nielsen LL, et al. Exenatide effects on diabetes, obesity, cardiovascular risk factors and hepatic biomarkers in patients with type 2 diabetes treated for at least 3 years. Curr Med Res Opin 2008; 24:275–286.
- Bunck MC, Diamant M, Cornér A, et al. One-year treatment with exenatide improves beta-cell function, compared with insulin glargine, in metformin-treated type 2 diabetic patients: a randomized, controlled trial. Diabetes Care 2009; 32:762–768.
- Blonde L, Klein EJ, Han J, et al. Interim analysis of the effects of exenatide treatment on A1C, weight and cardiovascular risk factors over 82 weeks in 314 overweight patients with type 2 diabetes. Diabetes Obes Metab 2006; 8:436–447.
- Baggio LL, Drucker DJ, Maida A, Lamont BJ. ADA 2008: incretin-based therapeutics. MedscapeCME Web site. http://www.medscape.com/viewprogram/15786. Accessed September 18, 2009.
- Garber A, Henry R, Ratner R, et al. Liraglutide versus glimepiride monotherapy for type 2 diabetes (LEAD-3 Mono): a randomised, 52-week, phase III, double-blind, parallel-treatment trial. Lancet 2009; 373:473–481.
- Nauck M, Frid A, Hermansen K, et al. Efficacy and safety comparison of liraglutide, glimepiride, and placebo, all in combination with metformin, in type 2 diabetes: the LEAD (liraglutide effect and action in diabetes)-2 study. Diabetes Care 2009; 32:84–90.
- Marre M, Shaw J, Brändle M, et al. Liraglutide, a once-daily human GLP-1 analogue, added to a sulphonylurea over 26 weeks produces greater improvements in glycaemic and weight control compared with adding rosiglitazone or placebo in subjects with type 2 diabetes (LEAD-1 SU). Diabet Med 2009; 26:268–278.
- Bergenstal RM, Kim T, Trautmann M, Zhuang D, Okerson T, Taylor K. Exenatide once weekly elicited improvements in blood pressure and lipid profile over 52 weeks in patients with type 2 diabetes. Circulation 2008; 118:S1086. Abstract 1239.
Data from the Centers for Disease Control and Prevention indicate that almost 24 million Americans, or 7.8% of the population, have diabetes; 90% to 95% of these have type 2 diabetes mellitus (T2DM).1 Diabetes and excessive weight often coexist. An analysis of data from the 1999–2002 National Health and Nutrition Examination Survey (NHANES) showed that among individuals with diabetes, 85% were overweight or obese and 55% were obese.2
Gaps remain in the management of T2DM between the goals for clinical parameters of care (eg, control of glucose, blood pressure [BP], and lipids) and actual clinical practice.3 NHANES data reveal that glycemic control improved from a mean glycosylated hemoglobin A1c (HbA1c) of 7.82% in 1999–2000 to 7.18% in 2003–2004.4 Hazard models based on the United Kingdom Prospective Diabetes Study (UKPDS) 10-year outcomes data in 4,320 newly diagnosed T2DM patients suggest that a sustained decrease in HbA1c of 0.511 percentage points could reduce diabetes complications by 10.7%.4,5
Additional analysis of NHANES data showed that in 2003–2004, about 57% of individuals achieved glycemic control, 48% reached BP targets, and 50% achieved target cholesterol goals.Only about 13% of diabetes patients achieved their target goals for all three parameters concurrently.6
This article reviews the association between cardiometabolic risk and the current antihyperglycemic treatments for patients with T2DM, with a focus on the role of incretin-related therapies.
THE IMPORTANCE OF CARDIOMETABOLIC RISK IN T2DM
Cardiovascular disease (CVD) is the leading cause of morbidity and mortality among people with diabetes and is the reported cause of mortality in up to 65% of deaths in persons with diabetes in the United States.7 The risk of CVD is two- to fourfold greater among adults with diabetes than among adults who do not have diabetes.8 The risk of CVD in patients with T2DM was evident in the UKPDS 17, where macrovascular complications, including CVD, were about twice as common as microvascular complications (20% vs 9%) after 9 years of follow-up.9 A study that involved more than 44,000 patients showed an almost double rate of mortality from all causes among individuals with T2DM compared with those with no diabetes (hazard ratio, 1.93; 95% confidence interval, 1.89 to 1.97).10 Current guidelines recommend aggressive management of CV risk factors, including BP control, correction of atherogenic dyslipidemia, glycemic control, weight reduction for those who are overweight or obese, and smoking cessation for those who smoke.3,11 Lifestyle interventions, including weight reduction and appropriately prescribed physical activity, result in reduced CV risk factors, which can help slow the progression of T2DM.12
GOALS OF T2DM THERAPY
Several studies have demonstrated that glycemic control can delay or prevent the development and progression of microvascular complications.13,14 UKPDS 33 showed that more intensive blood glucose control (median HbA1c 7.0%) in patients with T2DM followed over 10 years significantly (P = .029) reduced the risk for any diabetes-related end point by 12% compared with conventional therapy (median HbA1c 7.9%). Most of the risk reduction was accounted for by a 25% risk reduction in microvascular end points (P = .0099).13 Another report (UKPDS 35) demonstrated that HbA1c was strongly related to microvascular effects, with a 1% reduction in HbA1c associated with a 37% reduction in microvascular complications.14
Does intensive glucose control reduce CV risk?
To resolve the ongoing question of whether intensive glucose control can lead to a reduction in CV risk in patients with T2DM, three large, long-term trials were conducted within the last decade.15–18 Two of these, the Action to Control Cardiovascular Risk in Diabetes (ACCORD) and Action in Diabetes and Vascular Disease: Preterax and Diamicron Modified Release Controlled Evaluation (ADVANCE) trials, each enrolled more than 10,000 previously treated patients with long-standing T2DM. Patients were randomized to standard or intensive glycemic control for 3.5 years in the ACCORD trial and for 5 years in the ADVANCE trial.15,16
The ACCORD and ADVANCE trials, along with the smaller Veterans Administration Diabetes Trial (VADT) (N = 1,791), failed to show that more intensive glycemic control significantly reduced CVD.15–17 Additionally, the glycemic control component of ACCORD was halted because of increased mortality in the intensive arm compared with the standard arm.15 Further analyses of ACCORD data presented at the 69th Scientific Sessions of the American Diabetes Association (ADA) showed that HbA1c values lower than 7.0% did not explain the increased mortality. The 20% higher risk of death for every 1.0% increase in HbA1c greater than 6.0% suggests that glucose concentrations even lower than the general HbA1c goal of less than 7.0% may be appropriate in some patients.18 The most recent finding from VADT was that CV risk was dependent on disease duration and presence of comorbidities. Intensive therapy seemed to work best in patients with diabetes of less than 15 years’ duration, while risk of a CV event was more than doubled with intensive therapy in patients having diabetes for more than 21 years.
Clarification of treatment goals
A position statement of the ADA and a scientific statement of the American College of Cardiology Foundation and the American Heart Association19 concluded that the “evidence obtained from ACCORD, ADVANCE, and VADT does not suggest the need for major changes in glycemic control targets but, rather, additional clarification of the language that has consistently stressed individualization.” They state that while the general HbA1c goal of less than 7.0% seems reasonable, even lower HbA1c goals may be appropriate for some patients if they can be achieved without significant hypoglycemia or other adverse effects. Such patients might include those with diabetes of short duration, long life expectancy, or no significant CVD or hypoglycemia. Conversely, higher HbA1c goals may be appropriate for patients with limited life expectancy, a history of severe hypoglycemia, established microvascular or macrovascular complications, significant other comorbid conditions, or longstanding diabetes in whom an HbA1c of less than 7.0% has been difficult to attain despite optimal treatment and diabetes self-management education.19
Long-term risk reduction
A 10-year, postinterventional follow-up study (UKPDS 80) of the UKPDS survivor cohort was reported recently.20 Results showed that despite an early loss of glycemic differences between patients treated with diet and those treated with intensive regimens (sulfonylurea or insulin; metformin in overweight patients), the pharmacotherapy group demonstrated a prolonged reduction in microvascular risk as well as a significant reduction in the risk for myocardial infarction (15% [P = .01] in the sulfonylurea-insulin group and 33% [P = .005] in the metformin group) and death from any cause.20 This suggests that early improvement in glycemic control is associated with long-term benefits in the micro- and macrovascular health of patients with T2DM.
Additionally, the recent long-term follow-up of the Steno-2 study21 showed that a multifactorial intervention striving for intensive glucose, BP, and lipid control that included the use of renin-angiotensin system blockers, aspirin, and lipid-lowering agents not only reduced the risk of nonfatal CVD among patients with T2DM and microalbuminuria, but also had sustained beneficial effects on vascular complications and on rates of death from any cause and from CV causes. From a health care payer perspective, intensive multifactorial intervention was more likely to be cost-effective than conventional treatment in Denmark, especially if applied in a primary care setting.22
Comprehensive care needed
The lower-than-expected rates of CV outcomes in the ACCORD, ADVANCE, VADT, and Steno-2 studies reinforce the importance of comprehensive diabetes care that treats not only hyperglycemia but also elevated BP and dyslipidemia; these are considered the “ABCs” of diabetes.11,19 The 2009 ADA standards of medical care guidelines recommend that for most T2DM patients, HbA1c should be maintained at less than 7.0%,3 while the American Association of Clinical Endocrinologists (AACE) 2007 guidelines state that HbA1c should be 6.5% or less.11 Both organizations stress the importance of individualized goals, as discussed above, and advocate BP goals of less than 130/80 mm Hg and dyslipidemia goals of low-density lipoprotein cholesterol (LDL-C) less than 100 mg/dL, high-density lipoprotein cholesterol (HDL-C) greater than 40 mg/dL for men and 50 mg/dL for women, and triglycerides less than 150 mg/dL. It is recommended that an optional LDL-C goal of less than 70 mg/dL be considered for individuals with overt CVD.
CURRENT ANTIHYPERGLYCEMIC TREATMENT STRATEGIES
In response to new insights from clinical research and emerging treatment strategies, disease-specific organizations and medical specialty societies regularly revise and update their treatment guidelines and algorithms. These resources recommend that glycemic progress should be regularly monitored and pharmacologic therapy titrated or new drugs added promptly if glycemic goals are not met after 2 to 3 months.
Several algorithms combine scientific evidence with expert clinical opinion to guide physicians in treating their patients with T2DM. The American College of Endocrinology (ACE)/AACE road maps are designed to help develop individualized treatment regimens to achieve an HbA1c of 6.5% or less.23 The algorithm from a writing group assembled by the ADA and the European Association for the Study of Diabetes (EASD) similarly promotes pharmacologic treatment together with lifestyle modifications to maintain a glycemic goal of HbA1c less than 7.0%.24
OVERVIEW OF ANTIHYPERGLYCEMIC TREATMENT APPROACHES
Initial oral therapy
T2DM is usually treated initially with a single oral agent. Consistent with the progressive nature of the disease, patients often eventually require one or more additional oral agents and in many cases insulin.13,27 Choice of specific agents is based on individual patient circumstances, including the need for weight loss and control of fasting versus postprandial glucose, the presence of dyslipidemia and hypertension, and the risk for and potential consequences of hypoglycemia.24 T2DM patients with severely uncontrolled and symptomatic hyperglycemia are best treated, at least initially, with a combination of insulin therapy and lifestyle intervention, often with metformin.
Metformin. The recently revised ADA/EASD writing group algorithm recommends that patients not requiring initial insulin begin treatment with metformin at the time of diagnosis unless there are contraindications.24 Metformin is not associated with hypoglycemia and is considered weight-neutral, although some patients may lose weight.28
Sulfonylureas. Sulfonylureas stimulate insulin secretion from pancreatic beta cells; their use may be associated with hypoglycemia and weight gain. Mechanisms for weight gain with sulfonylureas include reduction of glucosuria and increased caloric intake to prevent or treat hypoglycemia.11,28 Nateglinide and repaglinide are nonsulfonylurea oral insulin secretagogues. They result in rapid and relatively short-lived insulin responses and are usually administered three times a day, before each meal. Their use may be associated with weight gain and hypoglycemia.11
Thiazolidinediones. Thiazolidinediones (TZD) increase insulin sensitivity in muscle, adipose tissue, and the liver. Hypoglycemia is uncommon with TZD monotherapy but weight gain related to increased and redistributed adiposity and fluid retention frequently occurs.
Alpha-glucosidase inhibitors. The alpha-glucosidase inhibitors are administered before meals and primarily reduce postprandial hyperglycemia. They are generally weight-neutral.28
Insulin. Insulin and insulin analogues are the most effective antihyperglycemic agents, but their use can be associated with hypoglycemia and clinically significant weight gain.28
Colesevelam. Colesevelam is a bile acid sequestrant that was recently approved by the US Food and Drug Administration as an antihyperglycemic therapy in people with T2DM. At a dosage of 1.875 g BID or 3.75 g QD in combination with a sulfonylurea, metformin, or insulin therapy, reductions in HbA1c compared with placebo in clinical trials of colesevelam have ranged from –0.5% to –0.7% (P < .02). Frequency of hypoglycemia and weight gain is low with this agent.26
Weight management. Weight reduction is important for overweight or obese patients with T2DM.27,28 Even moderate weight loss (5% of body weight) can be associated with improved insulin action and reduced hyperglycemia.29 Conversely, weight gain has been shown to worsen hyperglycemia and other CV risk factors. Treatment-related weight gain can also lead to decreased regimen adherence, contributing to poor glycemic control.28
THE ROLE OF INCRETIN HORMONES AND INCRETIN-BASED THERAPIES IN T2DM PATIENTS
Over the last few years, the role of incretin hormones and their contribution to diabetes pathophysiology has become more apparent. The incretin effect refers to the observation that orally administered glucose elicits a greater insulin response than does glucose administered intravenously to produce equivalent blood glucose concentrations.30,31 The incretin effect is diminished in patients with T2DM.
Hormone mediation of the incretin effect
The two hormones that mediate the incretin effect are GIP (also known as gastric inhibitory polypeptide or glucose-dependent insulinotropic polypeptide) and glucagon-like peptide−1 (GLP-1).30,31 GLP-1 has several glucoregulatory actions, including enhancement of endogenous insulin release and suppression of inappropriate glucagon secretion, both in a glucose-dependent manner. Therefore, these effects of GLP-1 occur only when glucose concentrations are elevated, thereby minimizing the risk of hypoglycemia. GLP-1 also regulates gastric emptying; infusions of GLP-1 can slow the accelerated emptying that is often present in T2DM patients. GLP-1 also increases satiety and decreases food intake via a central mechanism.31
Because GLP-1 is rapidly inactivated by the enzyme dipeptidyl peptidase–4 (DPP-4), therapeutic use of GLP-1 would require continuous infusion, which is impractical.30,31 Two strategies have been used to produce incretin-related therapies. One, inhibition of the DPP-4 enzyme, results in a two- to threefold enhancement of endogenous GLP-1. The other, involving agents that resist breakdown by DPP-4 but bind to and activate the GLP-1 receptor, produces glucoregulatory effects similar to those of GLP-1.30
Following subcutaneous (SC) injection, GLP-1 receptor agonists enhance insulin secretion and suppress inappropriately elevated glucagon, both in a glucose-dependent manner, as well as slow gastric emptying and enhance satiety.30 DPP-4 inhibitors provide glucose-dependent enhanced insulin secretion and glucagon suppression, but they do not have the same effects on gastric emptying or satiety.
Clinically, the GLP-1 receptor agonists improve glycemia and are associated with weight loss.32–35 Adverse gastrointestinal symptoms are relatively common during the first few weeks of treatment. DPP-4 inhibitors improve glycemia but are weight-neutral and are not generally associated with significant gastrointestinal symptoms.32,36–38
Incretin-based therapies
Incretin-based therapies are currently part of the antihyperglycemic armamentarium.25,32 The AACE guidelines11 and the ACE/AACE roadmaps23 include the GLP-1 receptor agonist exenatide and the DPP-4 inhibitor sitagliptin among antihyperglycemic therapies for patients with T2DM. The most recent update of the consensus algorithm statement of a joint ADA/EASD writing group included GLP-1 receptor agonists (but not DPP-4 inhibitors) in tier 2 of preferred agents, especially for patients who have concerns related to weight and hypoglycemia.24 They noted that DPP-4 inhibitors may be appropriate choices in selected patients.
DPP-4 inhibitors: sitagliptin, saxagliptin. Until recently, sitagliptin was the only DPP-4 inhibitor available in the United States. Sitagliptin is approved by the FDA for treatment of T2DM at a recommended oral dosage of 100 mg QD, either as monotherapy or in combination with other oral antihyperglycemic medications. The dosage of sitagliptin should be reduced to 50 mg/day in patients with creatinine clearance (CrCl) levels that are between 30 mL/min and 50 mL/min and to 25 mg/day in those with CrCl less than 30 mL/min.39
In a meta-analysis of incretin-based therapies, DPP-4 inhibitors produced a reduction in HbA1c compared with placebo (weighted mean difference of –0.74%; 95% confidence interval, –0.85% to –0.62%).32 DPP-4 inhibitor antihyperglycemic efficacy has been shown to be similar whether used as a monotherapy or add-on therapy.32,37,38 This same meta-analysis showed DPP-4 inhibitors as having a neutral effect on weight.32 More recently, a single-pill combination of metformin and sitagliptin was approved.40
A study comparing metformin, sitagliptin, and the combination of the two as initial monotherapy in T2DM patients with a baseline HbA1c of 8.8% showed 24-week HbA1c reductions from baseline of –0.66% with sitagliptin 100 mg QD, –0.82% with metformin 500 mg BID, and –1.90% with sitagliptin 50 mg + metformin 1,000 mg BID.41
On July 31, 2009, the FDA approved another DPP-4 inhibitor, saxagliptin, for the treatment of T2DM either as monotherapy or in combination with metformin, a sulfonylurea, or a TZD.42
GLP-1 receptor agonist: exenatide. Exenatide, the only FDA-approved GLP-1 receptor agonist, is the synthetic version of exendin-4, which binds to the human GLP-1 receptor and in vitro possesses many of the glucoregulatory effects of endogenous GLP-1.30,32 Exenatide is indicated as monotherapy or adjunctive therapy for patients with T2DM who have not achieved adequate glycemic control with metformin, a sulfonylurea, a TZD, or metformin in combination with a sulfonylurea or a TZD.43 Exenatide is administered by SC injection BID at a starting dosage of 5 mg BID for 4 weeks, followed by an increase to 10 mg BID.
Exenatide has been shown not only to enhance glucose-dependent insulin secretion but also to restore impaired first-phase insulin response in subjects with T2DM. Exenatide also helps control postprandial glycemic excursions by suppressing inappropriate glucagon secretion, slowing accelerated gastric emptying, and enhancing satiety. The increased satiety results in decreased food intake and weight loss.31,44 In a recent head-to-head crossover study, exenatide was shown to be more effective than sitagliptin in lowering postprandial glucose concentrations, increasing insulin secretion, and reducing postprandial glucagon secretion.45 Exenatide also slowed gastric emptying and reduced caloric intake.
Exenatide, in most studies, resulted in a placebo-subtracted HbA1c reduction of approximately –1.0% and in one study lowered HbA1c from baseline by –1.5%. Completer analyses have shown HbA1c reductions of –1.0% up to 3 years and –0.8% up to 3.5 years. Exenatide has also been associated with a mean weight loss of as much as –3.6 kg at 30 weeks and as much as –5.3 kg at 3.5 years.33–35,46,47 A 1-year study showed that exenatide improved beta-cell secretory function compared with insulin glargine in metformin-treated patients with T2DM.48 Long-term data, including findings from completed and intention-to-treat analyses of 82 weeks49 to at least 3 years47 have demonstrated that exenatide improved CV risk factors, including those related to BP, lipids, and hepatic injury biomarkers.
Therapies in development
Incretin-based therapies in development include a novel once-weekly formulation of exenatide; taspoglutide, another once-weekly GLP-1 receptor agonist; and liraglutide, a GLP-1 receptor agonist that is administered once daily.50 Liraglutide is currently being evaluated in clinical trials as a once-daily SC injection.51–53 Liraglutide has been reported to reduce HbA1c by –1.1% at 26 weeks and up to –1.14% at 52 weeks and result in weight loss (up to –2.8 kg at 26 weeks and up to –2.5 kg at 52 weeks) in patients with T2DM who are treatment-naïve or taking other antidiabetes agents, including metformin, sulfonylurea, and TZD.51–53 Evaluation of the once-weekly formulation of exenatide showed reductions in HbA1c of –1.9% at 30 weeks and –2.0% at 52 weeks with a weight loss of –3.7 kg at 30 weeks and –4.1 kg over 52 weeks of treatment.46,54
CONCLUSION
In the United States, the epidemics of excessive weight and T2DM have contributed to an increased medical risk for many individuals. Comprehensive diabetes treatments targeting not only hyperglycemia but also frequently associated overweight/obesity, hypertension, and dyslipidemia will be required to reduce such risk. Current treatment strategies have evolved based on updated clinical guidelines and trials, as well as practice experience, including those related to newer agents. Incretin-based therapies, such as the GLP-1 receptor agonist, exenatide, and the DPP-4 inhibitors, sitagliptin and saxagliptin, are important additions to the treatment armamentarium, offering a reduction in hyperglycemia and beneficial effects on weight (reduction with exenatide and neutral with sitagliptin), and have been shown to improve several CV risk factors.
- National Institute of Diabetes and Digestive and Kidney Diseases. National Diabetes Statistics, 2007 fact sheet. Bethesda, MD: US Department of Health and Human Services, National Institutes of Health, 2008. Available at: http://www.diabetes.niddk.nih.gov/dm/pubs/statistics/index.htm. Accessed September 16, 2009.
- Centers for Disease Control and Prevention (CDC). Prevalence of overweight and obesity among adults with diagnosed diabetes: United States, 1988–1994 and 1999–2002. MMWR Morb Mortal Wkly Rep 2004; 53:1066–1068.
- American Diabetes Association. Standards of medical care in diabetes: 2009. Diabetes Care 2009; 32(suppl 1):S13–S61.
- Hoerger TJ, Segel JE, Gregg EW, Saaddine JB. Is glycemic control improving in U.S. adults? Diabetes Care 2008; 31:81–86.
- Stratton IM, Cull CA, Adler AI, Matthews DR, Neil HA, Holman RR. Additive effects of glycaemia and blood pressure exposure on risk of complications in type 2 diabetes: a prospective observational study (UKPDS 75). Diabetologia 2006; 49:1761–1769.
- Ong KL, Cheung BM, Wong LY, Wat NM, Tan KC, Lam KS. Prevalence, treatment, and control of diagnosed diabetes in the U.S. National Health and Nutrition Examination Survey 1999–2004. Ann Epidemiol 2008; 18:222–229.
- Engelgau MM, Geiss LS, Saaddine JB, et al. The evolving diabetes burden in the United States. Ann Intern Med 2004; 140:945–950.
- Fox CS, Coady S, Sorlie PD, et al. Trends in cardiovascular complications of diabetes. JAMA 2004; 292:2495–2499.
- Turner R, Cull C, Holman R. United Kingdom Prospective Diabetes Study 17: a 9-year update of a randomized, controlled trial on the effect of improved metabolic control on complications in noninsulin-dependent diabetes mellitus. Ann Intern Med 1996; 124(1 Pt 2):136–145.
- Mulnier HE, Seaman HE, Raleigh VS, Soedamah-Muthu SS, Colhoun HM, Lawrenson RA. Mortality in people with type 2 diabetes in the UK. Diabet Med 2006; 23:516–521.
- AACE Diabetes Mellitus Clinical Practice Guidelines Task Force. American Association of Clinical Endocrinologists medical guidelines for clinical practice for the management of diabetes mellitus. Endocr Pract 2007; 13(suppl 1):S4–S68.
- American Diabetes Association. Nutrition recommendations and interventions for diabetes: a position statement of the American Diabetes Association. Diabetes Care 2008; 31(suppl 1):S61−S78.
- UK Prospective Diabetes Study (UKPDS) Group. Intensive blood-glucose control with sulphonylureas or insulin compared with conventional treatment and risk of complications in patients with type 2 diabetes (UKPDS 33). Lancet 1998; 352:837–853.
- Stratton IM, Adler AI, Neil HA, et al. Association of glycaemia with macrovascular and microvascular complications of type 2 diabetes (UKPDS 35): prospective observational study. BMJ 2000; 321:405–412.
- The Action to Control Cardiovascular Risk in Diabetes Study Group. Effects of intensive glucose lowering in type 2 diabetes. N Engl J Med 2008; 358:2545–2559.
- The ADVANCE Collaborative Group. Intensive blood glucose control and vascular outcomes in patients with type 2 diabetes. N Engl J Med 2008; 358:2560–2572.
- Duckworth W, Abraira C, Moritz T, et al; for the VADT Investigators. Glucose control and vascular complications in veterans with type 2 diabetes. N Engl J Med 2009; 360:129–139.
- Kerr M. ADA 2009: intensive glycemic control not directly linked to excess cardiovascular risk. Medscape Medical News Web site. http://www.medscape.com/viewarticle/704260_print. Published June 11, 2009. Accessed September 16, 2009.
- Skyler JS, Bergenstal R, Bonow RO, et al. Intensive glycemic control and the prevention of cardiovascular events: implications of the ACCORD, ADVANCE, and VA diabetes trials: a position statement of the American Diabetes Association and a scientific statement of the American College of Cardiology Foundation and the American Heart Association. Diabetes Care 2009; 32:187–192.
- Holman RR, Paul SK, Bethel MA, Matthews DR, Neil HA. 10-year follow-up of intensive glucose control in type 2 diabetes. N Engl J Med 2008; 359:1577–1589.
- Gaede P, Lund-Andersen H, Parving HH, Pedersen O. Effect of a multifactorial intervention on mortality in type 2 diabetes. N Engl J Med 2008; 358:580–591.
- Gaede P, Valentine WJ, Palmer AJ, et al. Cost-effectiveness of intensified versus conventional multifactorial intervention in type 2 diabetes: results and projections from the Steno-2 study. Diabetes Care 2008; 31:1510–1515.
- ACE/AACE Diabetes Road Map Task Force. Road maps to achieve glycemic control in type 2 diabetes mellitus. Endocr Pract 2007; 13:260–268.
- Nathan DM, Buse JB, Davidson MB, et al. Medical management of hyperglycemia in type 2 diabetes: a consensus algorithm for the initiation and adjustment of therapy: a consensus statement of the American Diabetes Association and the European Association for the Study of Diabetes. Diabetes Care 2009; 32:193–203.
- Alexander GC, Sehgal NL, Moloney RM, Stafford RS. National trends in treatment of type 2 diabetes mellitus, 1994–2007. Arch Intern Med 2008; 168:2088–2094.
- Sonnett TE, Levien TL, Neumiller JJ, Gates BJ, Setter SM. Colesevelam hydrochloride for the treatment of type 2 diabetes mellitus. Clin Ther 2009; 31:245–259.
- DeFronzo RA. Pharmacologic therapy for type 2 diabetes mellitus. Ann Intern Med 1999; 131:281–303.
- Purnell JQ, Weyer C. Weight effect of current and experimental drugs for diabetes mellitus: from promotion to alleviation of obesity. Treat Endocrinol 2003; 2:33–47.
- Klein S, Sheard NF, Pi-Sunyer X, et al. Weight management through lifestyle modification for the prevention and management of type 2 diabetes: rationale and strategies: a statement of the American Diabetes Association, the North American Association for the Study of Obesity, and the American Society for Clinical Nutrition. Diabetes Care 2004; 27:2067–2073.
- Stonehouse A, Okerson T, Kendall D, Maggs D. Emerging incretin based therapies for type 2 diabetes: incretin mimetics and DPP-4 inhibitors. Curr Diabetes Rev 2008; 4:101–109.
- Drucker DJ. The biology of incretin hormones. Cell Metab 2006; 3:153–165.
- Amori RE, Lau J, Pittas AG. Efficacy and safety of incretin therapy in type 2 diabetes: systematic review and meta-analysis. JAMA 2007; 298:194–206.
- Buse JB, Henry RR, Han J, et al. Effects of exenatide (exendin-4) on glycemic control over 30 weeks in sulfonylurea-treated patients with type 2 diabetes. Diabetes Care 2004; 27:2628–2635.
- DeFronzo RA, Ratner RE, Han J, Kim DD, Fineman MS, Baron AD. Effects of exenatide (exendin-4) on glycemic control and weight over 30 weeks in metformin-treated patients with type 2 diabetes. Diabetes Care 2005; 28:1092–1100.
- Kendall DM, Riddle MC, Rosenstock J, et al. Effects of exenatide (exendin-4) on glycemic control over 30 weeks in patients with type 2 diabetes treated with metformin and a sulfonylurea. Diabetes Care 2005; 28:1083–1091.
- Aschner P, Kipnes MS, Lunceford JK, et al. Effect of the dipeptidyl peptidase-4 inhibitor sitagliptin as monotherapy on glycemic control in patients with type 2 diabetes. Diabetes Care 2006; 29:2632−2637.
- Charbonnel B, Karasik A, Liu J, Wu M, Meininger G, for the Sitagliptin Study 020 Group. Efficacy and safety of the dipeptidyl peptidase-4 inhibitor sitagliptin added to ongoing metformin therapy in patients with type 2 diabetes inadequately controlled with metformin alone. Diabetes Care 2006; 29:2638–2643.
- Scott R, Wu M, Sanchez M, Stein P. Efficacy and tolerability of the dipeptidyl peptidase-4 inhibitor sitagliptin as monotherapy over 12 weeks in patients with type 2 diabetes. Int J Clin Pract 2007; 61:171–180.
- Januvia. Physicians’ Desk Reference. 63rd edition. Montvale, NJ: Physicians’ Desk Reference Inc; 2008:2048–2054.
- Janumet. Physicians’ Desk Reference. 63rd edition. Montvale, NJ: Physicians’ Desk Reference Inc; 2008:2041–2048.
- Goldstein BJ, Feinglos MN, Lunceford JK, Johnson J, Williams-Herman DE, for the Sitagliptin 036 Study Group. Effect of initial combination therapy with sitagliptin, a dipeptidyl peptidase-4 inhibitor, and metformin on glycemic control in patients with type 2 diabetes. Diabetes Care 2007; 30:1979–1987.
- US Department of Health and Human Services. FDA approves new drug treatment for type 2 diabetes. US Food and Drug Administration Web site. http://www.fda.gov/newsevents/newsroom/pressannouncements/ucm174780.htm. Published July 31, 2009. Accessed September 18, 2009.
- Byetta [package insert]. San Diego, CA: Amylin Pharmaceuticals, Inc.; 2009.
- Edwards CM, Stanley SA, Davis R, et al. Exendin-4 reduces fasting and postprandial glucose and decreases energy intake in healthy volunteers. Am J Physiol Endocrinol Metab 2001; 281:E155–E161.
- DeFronzo RA, Okerson T, Viswanathan P, Guan X, Holcombe JH, MacConell L. Effects of exenatide versus sitagliptin on postprandial glucose, insulin and glucagon secretion, gastric emptying, and caloric intake: a randomized, cross-over study. Curr Med Res Opin 2008; 24:2943–2952.
- Drucker DJ, Buse JB, Taylor K, et al. Exenatide once weekly versus twice daily for the treatment of type 2 diabetes: a randomised, open-label, non-inferiority study. Lancet 2008; 372:1240–1250.
- Klonoff DC, Buse JB, Nielsen LL, et al. Exenatide effects on diabetes, obesity, cardiovascular risk factors and hepatic biomarkers in patients with type 2 diabetes treated for at least 3 years. Curr Med Res Opin 2008; 24:275–286.
- Bunck MC, Diamant M, Cornér A, et al. One-year treatment with exenatide improves beta-cell function, compared with insulin glargine, in metformin-treated type 2 diabetic patients: a randomized, controlled trial. Diabetes Care 2009; 32:762–768.
- Blonde L, Klein EJ, Han J, et al. Interim analysis of the effects of exenatide treatment on A1C, weight and cardiovascular risk factors over 82 weeks in 314 overweight patients with type 2 diabetes. Diabetes Obes Metab 2006; 8:436–447.
- Baggio LL, Drucker DJ, Maida A, Lamont BJ. ADA 2008: incretin-based therapeutics. MedscapeCME Web site. http://www.medscape.com/viewprogram/15786. Accessed September 18, 2009.
- Garber A, Henry R, Ratner R, et al. Liraglutide versus glimepiride monotherapy for type 2 diabetes (LEAD-3 Mono): a randomised, 52-week, phase III, double-blind, parallel-treatment trial. Lancet 2009; 373:473–481.
- Nauck M, Frid A, Hermansen K, et al. Efficacy and safety comparison of liraglutide, glimepiride, and placebo, all in combination with metformin, in type 2 diabetes: the LEAD (liraglutide effect and action in diabetes)-2 study. Diabetes Care 2009; 32:84–90.
- Marre M, Shaw J, Brändle M, et al. Liraglutide, a once-daily human GLP-1 analogue, added to a sulphonylurea over 26 weeks produces greater improvements in glycaemic and weight control compared with adding rosiglitazone or placebo in subjects with type 2 diabetes (LEAD-1 SU). Diabet Med 2009; 26:268–278.
- Bergenstal RM, Kim T, Trautmann M, Zhuang D, Okerson T, Taylor K. Exenatide once weekly elicited improvements in blood pressure and lipid profile over 52 weeks in patients with type 2 diabetes. Circulation 2008; 118:S1086. Abstract 1239.
KEY POINTS
- Up to 65% of deaths among people with diabetes are caused by cardiovascular disease.
- Glycemic control can delay or slow the progression of microvascular complications.
- In addition to hyperglycemia, comprehensive diabetes therapy must target cardiovascular disease–related risk factors, including excess weight/obesity, elevated blood pressure, and abnormal lipid concentrations.
- Diminished incretin hormonal activity contributes to the pathophysiology of diabetes.