User login
Immune Thrombocytopenia
Introduction
Immune thrombocytopenia (ITP) is a common acquired autoimmune disease characterized by low platelet counts and an increased risk of bleeding. The incidence of ITP is approximately 3.3 per 100,000 adults.1 There is considerable controversy about all aspects of the disease, with little “hard” data on which to base decisions given the lack of randomized clinical trials to address most clinical questions. This article reviews the presentation and diagnosis of ITP and its treatment options and discusses management of ITP in specific clinical situations.
Pathogenesis and Epidemiology
ITP is caused by autoantibodies binding to platelet surface proteins, most often to the platelet receptor GP IIb/IIIa.2-4 These antibody-coated platelets then bind to Fc receptors in macrophages and are removed from circulation. The initiating event in ITP is unknown. It is speculated that the patient responds to a viral or bacterial infection by creating antibodies which cross-react with the platelet receptors. Continued exposure to platelets perpetuates the immune response. ITP that occurs in childhood appears to be an acute response to viral infection and usually resolves. ITP in adults may occur in any age group but is seen especially in young women.
Despite the increased platelet destruction that occurs in ITP, the production of new platelets often is not significantly increased. This is most likely due to lack of an increase in thrombopoietin, the predominant platelet growth factor.5
It had been thought that most adult patients who present with ITP go on to have a chronic course, but more recent studies have shown this is not the case. In modern series the percentage of patients who are “cured” with steroids ranges from 30% to 70%.6–9 In addition, it has been appreciated that even in patients with modest thrombocytopenia, no therapy is required if the platelet count remains higher than 30 × 103/µL. However, this leaves a considerable number of patients who will require chronic therapy.
Clinical Presentation
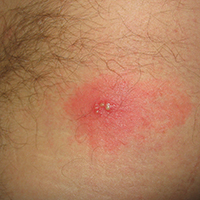
Presentation can range from a symptomatic patient with low platelets found on a routine blood count to a patient with massive bleeding. Typically, patients first present with petechiae (small bruises 1 mm in size) on the shins. True petechiae are seen only in severe thrombocytopenia. Patients will also report frequent bruising and bleeding from the gums. Patients with very low platelet counts will notice “wet purpura,” which is characterized by blood-filled bullae in the oral cavity. Life-threatening bleeding is a very unusual presenting sign unless other problems (trauma, ulcers) are present. The physical examination is only remarkable for stigmata of bleeding such as the petechiae. The presence of splenomegaly or lymphadenopathy weighs strongly against a diagnosis of ITP. Many patients with ITP will note fatigue when their platelets counts are lower.10
Diagnosis
Extremely low platelet counts with a normal blood smear and an otherwise healthy patient are diagnostic of ITP. The platelet count cutoff for considering ITP is 100 × 103/µL as the majority of patients with counts in the 100 to 150 × 103/µL range will not develop greater thrombocytopenia.11 Also, the platelet count decreases with age (9 × 10³/µL per decade in one study), and this also needs to be factored into the evaluation.12 The finding of relatives with ITP should raise suspicion for congenital thrombocytopenia.13 One should question the patient carefully about drug exposure (see Drug-Induced Thrombocytopenia), especially about over-the-counter medicines, “natural” remedies, or recreational drugs.
There is no laboratory test that rules in ITP; rather, it is a diagnosis of exclusion. The blood smear should be carefully examined for evidence of microangiopathic hemolytic anemias (schistocytes), bone marrow disease (blasts, teardrop cells), or any other evidence of a primary bone marrow disease. In ITP, the platelets can be larger than normal, but finding some platelets the size of red cells should raise the issue of congenital thrombocytopenia.14 Pseudo-thrombocytopenia, which is the clumping of platelets due to a reaction to the EDTA anticoagulant in the tube, should be excluded. The diagnosis is established by drawing the blood in a citrated (blue-top) tube to perform the platelet count. There is no role for antiplatelet antibody assay because this test lacks sensitivity and specificity. In a patient without a history of autoimmune disease or symptoms, empiric testing for autoimmune disease is not recommended.
Patients who present with ITP should be tested for both HIV and hepatitis C infection.15,16 These are the most common viral causes of secondary ITP, and both have prognostic and treatment implications. Some authorities also recommend checking thyroid function as hypothyroidism can present or aggravate the thrombocytopenia.
The role of bone marrow examination is controversial.17 Patients with a classic presentation of ITP (young woman, normal blood smear) do not require a bone marrow exam before therapy is initiated, although patients who do not respond to initial therapy should have a bone marrow aspiration. The rare entity amegakaryocytic thrombocytopenia can present with a clinical picture similar to that of ITP, but amegakaryocytic thrombocytopenia will not respond to steroids. Bone marrow aspiration reveals the absence of megakaryocytes in this entity. It is rare, however, that another hematologic disease is diagnosed in patients with a classic clinical presentation of ITP.
In the future, measurement of thrombopoietin and reticulated platelets may provide clues to the diagnosis.4 Patients with ITP paradoxically have normal or only mildly elevated thrombopoietin levels. The finding of a significantly elevated thrombopoietin level should lead to questioning of the diagnosis. One can also measure “reticulated platelets,” which are analogous to red cell reticulocytes. Patients with ITP (or any platelet destructive disorders) will have high levels of reticulated platelets. These tests are not recommended for routine evaluation, but may be helpful in difficult cases.
Treatment
In general, therapy in ITP should be guided by the patient’s signs of bleeding and not by unquestioning adherence to measuring platelet levels,15 as patients tolerate thrombocytopenia well. It is unusual to have life-threatening bleeding with platelet counts greater than 5 × 10³/µL in the absence of mechanical lesions. Despite the low platelet count in patients with ITP, the overall mortality is estimated to be only 0.3% to 1.3%.18 It is sobering that in one study the rate of death from infections was twice as high as that from bleeding.19 Rare patients will have antibodies that interfere with the function of the platelet, and these patients can have profound bleeding with only modestly lowered platelet counts.20 A suggested cut-off for treating newly diagnosed patients is 30 × 103/µL.21
Initial Therapy
The primary therapy of ITP is glucocorticoids, either prednisone or dexamethasone. In the past prednisone at a dose of 60 to 80 mg/day was started at the time of diagnosis (Table 1). 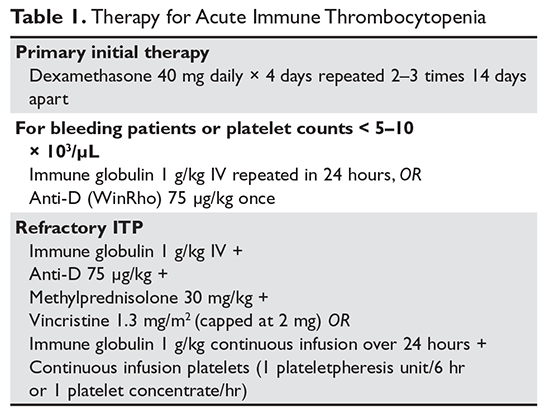
For rapid induction of a response, there are 2 options. A single dose of intravenous immune globulin (IVIG) at 1 g/kg or intravenous anti-D immunoglobulin (anti-D) at 50 to 75 µg/kg can induce a response in more than 80% of patients in 24 to 48 hours.21,24 IVIG has several drawbacks. It can cause aseptic meningitis, and in patients with vascular disease the increased viscosity can induce ischemia. There is also a considerable fluid load delivered with the IVIG, and it needs to be given over several hours.
The use of anti-D is limited to Rh-positive patients who have not had a splenectomy. It should not be used in patients who are Coombs positive due to the risk of provoking more hemolysis. Rarely anti-D has been reported to cause a severe hemolytic disseminated intravascular coagulation syndrome (1:20,000 patients), which has led to restrictions in its use.25 Although the drug can be rapidly given over 15 minutes, due to these concerns current recommendations are now to observe patients for 8 hours after their dose and to perform a urine dipstick test for blood at 2, 4, and 8 hours. Concerns about this rare but serious side effect have led to a dramatic decrease in the use of anti-D.
For patients who are severely thrombocytopenic and do not respond to initial therapy, there are 2 options for raising the platelet counts. One is to use a combination of IVIG, methylprednisolone, vincristine, and/or anti-D.26 The combination of IVIG and anti-D may be synergistic since these agents block different Fc receptors. A response of 71% has been reported for this 3- or 4-drug combination in a series of 35 patients.26 The other option is to treat with a continuous infusion of platelets (1 unit over 6 hours) and IVIG 1 g/kg for 24 hours. Response rates of 62.7% have been reported with this combination, and this rapid rise in platelets can allow time for other therapies to take effect.27,28
Patients with severe thrombocytopenia who relapse with reduction of steroids or who do not respond to steroids have several options for further management. Repeated doses of IVIG can transiently raise the platelet count, and some patients may only need several courses of therapy over the course of many months. One study showed that 60% of patients could delay or defer therapy by receiving multiple doses of anti-D. However, 30% of patients did eventually receive splenectomy and 20% of patients required ongoing therapy with anti-D.29 In a randomized trial comparing early use of anti-D to steroids to avoid splenectomy, there was no difference in splenectomy rate (38% versus 42%).30 Finally, an option as mentioned above is to try a 6-month course of pulse dexamethasone 40 mg/day for 4 days, repeated every 28 days.
Options for Refractory ITP
There are multiple options for patients who do not respond to initial ITP therapies. These can be divided into several broad groups: curative therapies (splenectomy and rituximab), thrombopoietin receptor agonists, and anecdotal therapies.
Splenectomy
In patients with severe thrombocytopenia who do not respond or who relapse with lower doses of prednisone, splenectomy should be strongly considered. Splenectomy will induce a good response in 60% to 70% of patients and is durable in most patients. In 2 recently published reviews of splenectomy, the complete response rate was 67% and the total response rate was 88% to 90%%.8,31 Between 15% and 28% of patients relapsed over 5 years, with most recurrences occurring in the first 2 years. Splenectomy carries a short-term surgical risk, and the life-long risk of increased susceptibility to overwhelming sepsis is discussed below. However, the absolute magnitude of these risks is low and is often lower than the risks of continued prednisone therapy or of continued cytotoxic therapy.
Timing of splenectomy depends on the patient’s presentation. Most patients should be given a 6-month trial of steroids or other therapies before proceeding to splenectomy.31 However, patients who persist with severe thrombocytopenia despite initial therapies or who are suffering intolerable side effects from therapy should be considered sooner for splenectomy.31 In the George review, multiple factors such as responding to IVIG were found not to be predictive of response to splenectomy.8
Method of splenectomy appears not to matter.21 Rates of finding accessory spleens are just as high or higher with laparoscopic splenectomy and the patient can recover faster. In patients who are severely thrombocytopenic, open splenectomy can allow for quicker control of the vascular access of the spleen.
Rates of splenectomy in recent years have decreased for many reasons,32 including the acceptance of lower platelet counts in asymptomatic patients and the availability of alternative therapies such as rituximab. In addition, despite abundant data for good outcomes, there is a concern that splenectomy responses are not durable. Although splenectomy will not cure every patient with ITP, splenectomy is the therapy with the most patients, the longest follow-up, and the most consistent rate of cure, and it should be discussed with every ITP patient who does not respond to initial therapy and needs further treatment.
The risk of overwhelming sepsis varies by indications for splenectomy but appears to be about 1%.33,34 The use of pneumococcal vaccine and recognition of this syndrome have helped reduce the risk. Asplenic patients need to be counseled about the risk of overwhelming infections, should be vaccinated for pneumococcus, meningococcus, and Haemophilus influenzae, and should wear an ID bracelet.35–37 Patients previously vaccinated for pneumococcus should be re-vaccinated every 3 to 5 years. The role of prophylactic antibiotics in adults is controversial, but patients under the age of 18 should be on penicillin VK 250 mg orally twice daily.
Rituximab
Rituximab has been shown to be very active in ITP. Most studies used the standard dose of 375 mg/m2 weekly for 4 weeks, but other studies have shown that 1000 mg twice 14 days apart (ie, on days 1 and 15) resulted in the same response rate and may be more convenient for patients.38,39 The response time can vary, with patients either showing a rapid response or requiring up to 8 weeks for their counts to go up. Although experience is limited, the response seems to be durable, especially in those patients whose counts rise higher than 150 × 103/µL; in patients who relapse, a response can be re-induced with a repeat course. Overall the response rate for rituximab is about 60%, but only approximately 20% to 40% of patients will remain in long-term remission.40–42 There is no evidence yet that “maintenance” therapy or monitoring CD19/CD20 cells can help further the duration of remission.
Whether to give rituximab pre- or post-splenectomy is also uncertain. An advantage of presplenectomy rituximab is that many patients will achieve remission, delaying the need for surgery. Also, rituximab is a good option for patients whose medical conditions put them at high risk for complications with splenectomy. However, it is unknown whether rituximab poses any long-term risks, while the long-term risks of splenectomy are well-defined. Rituximab is the only curative option left for patients who have failed splenectomy and is a reasonable option for these patients.
There is an intriguing trial in which patients were randomly assigned to dexamethasone alone versus dexamethasone plus rituximab upon presentation with ITP; those who were refractory to dexamethasone alone received salvage therapy with dexamethasone plus rituximab.43 The dexamethasone plus rituximab group had an overall higher rate of sustained remission at 6 months than the dexamethasone group, 63% versus 36%. Interestingly, patients who failed their first course of dexamethasone but then were “salvaged” with dexamethasone/rituximab had a similar overall response rate of 56%, suggesting that saving the addition of rituximab for steroid failures may be an effective option.
Although not “chemotherapy,” rituximab is not without risks. Patients can develop infusion reactions, which can be severe in 1% to 2% of patients. In a meta-analysis the fatal reaction rate was 2.9%.40 Patients with chronic hepatitis B infections can experience reactivation with rituximab, and thus all patients should be screened before treatment. Finally, the very rare but devastating complication of progressive multifocal leukoencephalopathy has been reported.
Thrombopoietin Receptor Agonists
Although patients with ITP have low platelet counts, studies starting with Dameshek have shown that these patients also have reduced production of platelets.44 Despite the very low circulating platelet count, levels of the platelet growth factor thrombopoietin (TPO) are not raised.45 Seminal studies with recombinant TPO in the 1990s showed that ITP patients responded to thrombopoietin-stimulating protein, but the formation of anti-TPO antibodies halted trials with the first generation of these agents. Two TPO receptor agonists (TPO-RA) are approved for use in patients with ITP.
Romiplostim. Romiplostim is a peptibody, a combination of a peptide that binds and stimulates the TPO receptor and an Fc domain to extend its half-life.46 It is administered in a weekly subcutaneous dose starting at 1 to 3 µg/kg. Use of romiplostim in ITP patients produces a response rate of 80% to 88%, with 87% of patients being able to wean off or decrease other anti-ITP medications.47 In a long-term extension study, the response was again high at 87%.48 These studies have also shown a reduced incidence of bleeding.
The major side effect of romiplostim seen in clinical trials was marrow reticulin formation, which occurred in up to 5.6% of patients.47,48 The clinical course in these patients is the development of anemia and a myelophthisic blood smear with teardrop cells and nucleated red cells. These changes appear to reverse with cessation of the drug. The bone marrow shows increased reticulin formation but rarely, if ever, shows the collagen deposition seen with primary myelofibrosis.
Thrombosis has also been seen, with a rate of 0.08 to 0.1 cases per 100 patient-weeks,49 but it remains unclear if this is due to the drug, part of the natural history of ITP, or expected complications in older patients undergoing any type of medical therapy. Surprisingly, despite the low platelet counts, patients with ITP in one study had double the risk of venous thrombosis, demonstrating that ITP itself can be a risk factor for thrombosis.50 These trials have shown no long-term concerns for other clinical problems such as liver disease.
Eltrombopag. The other available TPO-RA is eltrombopag,51 an oral agent that stimulates the TPO receptor by binding the transmembrane domain and activating it. The drug is given orally starting at 50 mg/day (25 mg for patients of Asian ancestry or with liver disease) and can be dose escalated to 75 mg/day. The drug needs to be taken on an empty stomach. Eltrombopag has been shown to be effective in chronic ITP, with response rates of 59% to 80% and reduction in use of rescue medications.47,51,52 As with romiplostim, the incidence of bleeding was also decreased with eltrombopag in these trials.47,51
Clinical trials demonstrated that eltrombopag shares with romiplostim the risk for marrow fibrosis. A side effect unique to eltrombopag observed in these trials was a 3% to 7% incidence of elevated liver function tests.21,52 These abnormal findings appeared to resolve in most patients, but liver function tests need to be monitored in patients receiving eltrombopag.
Clinical use. The clearest indication for the use of TPO-RAs is in patients who have failed several therapies and remain symptomatic or are on intolerable doses of other medications such as prednisone. The clear benefits are their relative safety and high rates of success. The main drawback of TPO-RAs is the need for continuing therapy as the platelet count will return to baseline shortly after these agents are stopped. Currently there is no clear indication for one medication over the other. The advantages of romiplostim are great flexibility in dosing (1–10 µg/kg week) and no concerns about drug interaction. The current drawback of romiplostim is the Food and Drug Administration’s requirement for patients to receive the drug from a clinic and not at home. Eltrombopag offers the advantage of oral use, but it has a limited dose range and potential for drug interactions. Both agents have been associated with marrow reticulin formation, although in clinical use this risk appears to be very low.53
Other Options
In the literature there are numerous options for the treatment of ITP.54,55 Most of these studies are anecdotal, enrolled small number of patients, and sometimes included patients with mild thrombocytopenia, but these therapeutic options can be tried in patients who are refractory to standard therapies and have bleeding. The agents with the greatest amount of supporting data are danazol, vincristine, azathioprine, cyclophosphamide, and fostamatinib.
Danazol 200 mg 4 times daily is thought to downregulate the macrophage Fc receptor. The onset of action may be delayed and a therapeutic trial of up to 4 to 6 months is advised. Danazol is very effective in patients with antiphospholipid antibody syndrome who develop ITP and may be more effective in premenopausal women.56 Once a response is seen, danazol should be continued for 6 months and then an attempt to wean the patient off the agent should be made. A partial response can be seen in 70% to 90% of patients, but a complete response is rare.54
Vincristine 1.4 mg/m2 weekly has a low response rate, but if a response is going to occur, it will occur rapidly within 2 weeks. Thus, a prolonged trial of vincristine is not needed; if no platelet rise is seen in several weeks, the drug should be stopped. Again, partial responses are more common than complete response—50% to 63% versus 0% to 6%.54Azathioprine 150 mg orally daily, like danazol, demonstrates a delayed response and requires several months to assess for response. However, 19% to 25% of patients may have a complete response.54 It has been reported that the related agent mycophenolate 1000 mg twice daily is also effective in ITP.57
Cyclophosphamide 1 g/m2 intravenously repeated every 28 days has been reported to have a response rate of up to 40%.58 Although considered more aggressive, this is a standard immunosuppressive dose and should be considered in patients with very low platelet counts. Patients who have not responded to single-agent cyclophosphamide may respond to multi-agent chemotherapy with agents such as etoposide and vincristine plus cyclophosphamide.59
Fostamatinib, a spleen tyrosine kinase (SYK) inhibitor, is currently under investigation for the treatment of ITP.60 This agent prevents phagocytosis of antibody-coated platelets by macrophages. In early studies fostamatinib has been well tolerated at a dose of 150 mg twice daily, with 75% of patients showing a response. Large phase 3 trials are underway, and if the earlier promising results hold up fostamatinib may be a novel option for refractory patients.
A Practical Approach to Refractory ITP
One approach is to divide patients into bleeders, or those with either very low platelet counts (< 5 × 10³/µL) or who have had significant bleeding in the past, and nonbleeders, or those with platelet counts above 5 × 10³/µL and no history of severe bleeding. Bleeders who do not respond adequately to splenectomy should first start with rituximab since it is not cytotoxic and is the only other “curative” therapy (Table 2). 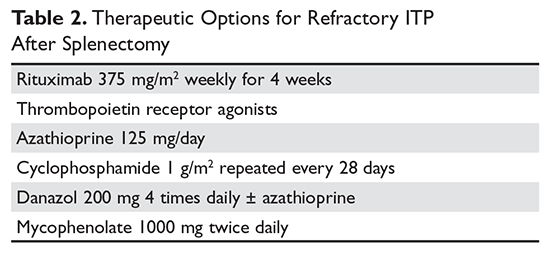
Nonbleeders should be tried on danazol and other relatively safe agents. If this fails, rituximab or TPO-RAs can be considered. Before one considers cytotoxic therapy, the risk of the therapy must be weighed against the risk posed by the thrombocytopenia. The mortality from ITP is fairly low (5%) and is restricted to patients with severe disease. Patients with only moderate thrombocytopenia and no bleeding are better served with conservative management. There is little justification for the use of continuous steroid therapy in this group of patients given the long-term risks of this therapy.
Special Situations
Surgery
Patients with ITP who need surgery either for splenectomy or for other reasons should have their platelet counts raised to a level greater than 20 to 30 × 103/µL before surgery. Most patients with ITP have increased platelet function and will not have excessive bleeding with these platelet counts. For patients with platelet counts below this level, an infusion of immune globulin or anti-D may rapidly increase the platelet counts. If the surgery is elective, short-term use of TPO-RAs to raise the counts can also be considered.
Pregnancy
Up to 10% of pregnant women will develop low platelet counts during their pregnancy.61,62 The most common etiology is gestational thrombocytopenia, which is an exaggeration of the lowered platelet count seen in pregnancy. Counts may fall as low as 50 × 103/µL at the time of delivery. No therapy is required as the fetus is not affected and the mother does not have an increased risk of bleeding. Pregnancy complications such as HELLP syndrome and thrombotic microangiopathies also present with low platelet counts, but these can be diagnosed by history.61,63
Women with ITP can either develop the disease during pregnancy or have a worsening of the symptoms.64 Counts often drop dramatically during the first trimester. Early management should be conservative with low doses of prednisone to keep the count above 10 × 103/µL.21 Immunoglobulin is also effective,65 but there are rare reports of pulmonary edema. Rarely patients who are refractory will require splenectomy, which may be safely performed in the second trimester. For delivery the count should be greater than 30 × 103/µL and for an epidural greater than 50 × 103/µL.64 There are reports of the use of TPO-RAs in pregnancy, and this can be considered for refractory cases.66
Most controversy centers on management of the delivery. In the past it was feared that fetal thrombocytopenia could lead to intracranial hemorrhage, and Caesarean section was always recommended. It now appears that most cases of intracranial hemorrhage were due to alloimmune thrombocytopenia and not ITP. Furthermore, the nadir of the baby’s platelet count is not at birth but several days after. It appears the safest course is to proceed with a vaginal or C-section delivery determined by obstetrical indications and then immediately check the baby’s platelet count. If the platelet count is low in the neonate, immunoglobulin will raise the count. Since the neonatal thrombocytopenia is due to passive transfer of maternal antibody, the platelet destruction will abate in 4 to 6 weeks.
Pediatric Patients
The incidence of ITP in children is 2.2 to 5.3 per 100,000 children.1 There are several distinct differences in pediatric ITP. Most cases will resolve in weeks, with only a minority of patients transforming into chronic ITP (5%–10%). Also, the rates of serious bleeding are lower in children than in adults, with intracranial hemorrhage rates of 0.1% to 0.5% being seen.67 For most patients with no or mild bleeding, management now is observation alone regardless of platelet count because it is felt that the risks of therapies are higher than the risk of bleeding.21 For patients with bleeding, IVIG, anti-D, or a short course of steroids can be used. Given the risk of overwhelming sepsis, splenectomy is often deferred as long as possible. Rituximab is increasingly being used in children due to concerns about use of agents such a cyclophosphamide or azathioprine in children.68 Abundant data on use of TPO-RAs in children showing high response rates and safety support their use, and these should be considered in refractory ITP before any cytotoxic agent.69–71
Helicobacter Pylori Infection
There has been much interest in the relationship between H. pylori and ITP.16,72,73H. pylori infections have been associated with a variety of autoimmune diseases, and there is a confusing literature on this infection and ITP. Several meta-analyses have shown that eradication of H. pylori will result in an ITP response rate of 20% to 30%, but responses curiously appear to be limited to certain geographic areas such as Japan and Italy but not the United States. In patients with recalcitrant ITP, especially in geographic areas with high incidence, it may be worthwhile to check for H. pylori infection and treat accordingly if positive.
Drug-Induced Thrombocytopenia
Patients with drug-induced thrombocytopenia present with very low (< 10 × 103/µL) platelet counts 1 to 3 weeks after starting a new medication.74–76 In patients with a possible drug-induced thrombocytopenia, the primary therapy is to stop the suspect drug.77 If there are multiple new medications, the best approach is to stop any drug that has been strongly associated with thrombocytopenia (Table 3).74,78,79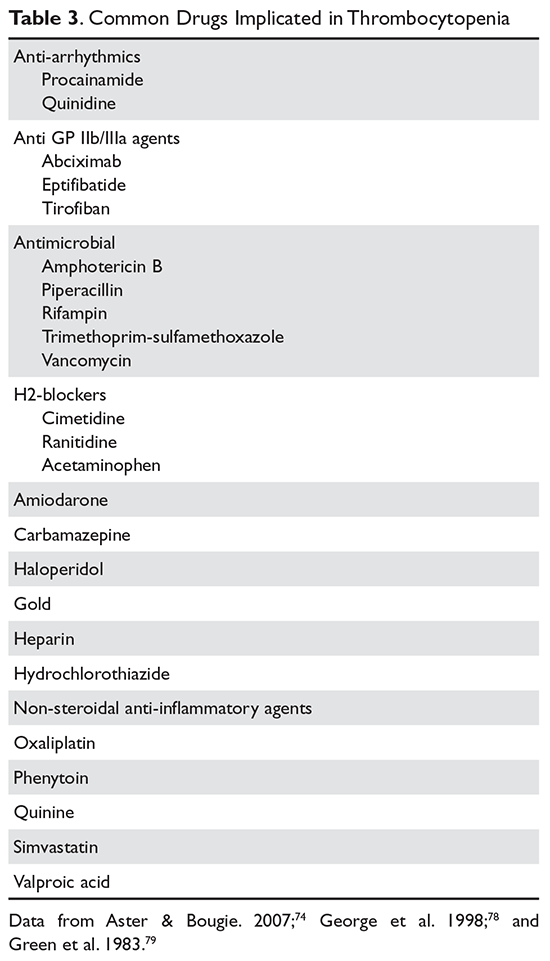
Immune globulin, corticosteroids, or intravenous anti‑D have been suggested as useful in drug‑related thrombocytopenia. However, since most of these thrombocytopenic patients recover when the agent is cleared from the body, this therapy is probably not necessary and withholding treatment avoids exposing the patients to the adverse events associated with further therapy.
Evans Syndrome
Evans syndrome is defined as the combination of autoimmune hemolytic anemia (AIHA) and ITP.80,81 These cytopenias can present simultaneously or sequentially. Patients with Evans syndrome are thought to have a more severe disease process, to be more prone to bleeding, and to be more difficult to treat, but the rarity of this syndrome makes this hard to quantify.
The classic clinical presentation of Evans syndrome is severe anemia and thrombocytopenia. Children with Evans syndrome often have complex immunodeficiencies such as autoimmune lymphoproliferative syndrome.82,83 In adults, Evans syndrome most often complicates other autoimmune diseases such as lupus. There are increasing reports of Evans syndrome occurring as a complication of T-cell lymphomas. Often the autoimmune disease can predate the lymphoma diagnosis by months or even years.
In theory the diagnostic approach is straightforward by showing a Coombs-positive hemolytic anemia in the setting of a clinical diagnosis of immune thrombocytopenia. The blood smear will show spherocytes and a diminished platelet count. The presence of other abnormal red cell forms should raise the possibility of an alternative diagnosis. It is unclear how vigorously one should search for other underlying diseases. Many patients will already have the diagnosis of an underlying autoimmune disease. The presence of lymphadenopathy should raise concern for lymphoma.
Initial therapy is high-dose steroids (2 mg/kg/day). IVIG should be added if severe thrombocytopenia is present. Patients who cannot be weaned off prednisone or relapse after prednisone should be considered for splenectomy, although these patients are at higher risk of relapsing.80 Increasingly rituximab is being used with success.84,85 For patients who fail splenectomy and rituximab, aggressive immunosuppression should be considered. Increasing data support the benefits of sirolimus, and this should be considered for refractory patients.86 For patients with Evans syndrome due to underlying lymphoma, antineoplastic therapy often results in prompt resolution of the symptoms. Recurrence of the autoimmune cytopenias often heralds relapse.
1. Terrell DR, Beebe LA, Vesely SK, et al. The incidence of immune thrombocytopenic purpura in children and adults: A critical review of published reports. Am J Hematol 2010;85:174–80.
2. McMillan R, Lopez-Dee J, Bowditch R. Clonal restriction of platelet-associated anti-GPIIb/IIIa autoantibodies in patients with chronic ITP. Thromb Haemost 2001;85:821–3.
3. Aster RH, George JN, McMillan R, Ganguly P. Workshop on autoimmune (idiopathic) thrombocytopenic purpura: Pathogenesis and new approaches to therapy. Am J Hematol 1998;58:231–4.
4. Toltl LJ, Arnold DM. Pathophysiology and management of chronic immune thrombocytopenia: focusing on what matters. Br J Haematol 2011;152:52–60.
5. Kuter DJ, Gernsheimer TB. Thrombopoietin and platelet production in chronic immune thrombocytopenia. Hematol Oncol Clin North Am 2009;23:1193–211.
6. Pamuk GE, Pamuk ON, Baslar Z, et al. Overview of 321 patients with idiopathic thrombocytopenic purpura. Retrospective analysis of the clinical features and response to therapy. Ann Hematol 2002;81:436–40.
7. Stasi R, Stipa E, Masi M, et al. Long-term observation of 208 adults with chronic idiopathic thrombocytopenic purpura. Am J Med 1995;98:436–42.
8. Kojouri K, Vesely SK, Terrell DR, George JN. Splenectomy for adult patients with idiopathic thrombocytopenic purpura: a systematic review to assess long-term platelet count responses, prediction of response, and surgical complications. Blood 2004;104:2623–34.
9. Matschke J, Muller-Beissenhirtz H, Novotny J, et al. A randomized trial of daily prednisone versus pulsed dexamethasone in treatment-naive adult patients with immune thrombocytopenia: EIS 2002 study. Acta Haematol 2016;136:101–7.
10. Newton JL, Reese JA, Watson SI, et al. Fatigue in adult patients with primary immune thrombocytopenia. Eur J Haematol 2011;86:420–9.
11. Stasi R, Amadori S, Osborn J, et al. Long-term outcome of otherwise healthy individuals with incidentally discovered borderline thrombocytopenia. PLoS Med 2006;3:e24.
12. Biino G, Balduini CL, Casula L, et al. Analysis of 12,517 inhabitants of a Sardinian geographic isolate reveals that predispositions to thrombocytopenia and thrombocytosis are inherited traits. Haematologica 2011;96:96–101.
13. Drachman JG. Inherited thrombocytopenia: when a low platelet count does not mean ITP. Blood 2004;103:390–8.
14. Geddis AE, Balduini CL. Diagnosis of immune thrombocytopenic purpura in children. Curr Opin Hematol 2007;14:520–5.
15. Provan D, Stasi R, Newland AC, et al. International consensus report on the investigation and management of primary immune thrombocytopenia. Blood 2010;115:168–86.
16. Stasi R, Willis F, Shannon MS, Gordon-Smith EC. Infectious causes of chronic immune thrombocytopenia. Hematol Oncol Clin North Am 2009;23:1275–97.
17. Jubelirer SJ, Harpold R. The role of the bone marrow examination in the diagnosis of immune thrombocytopenic purpura: case series and literature review. Clin Appl Thromb Hemost 2002;8:73–6.
18. George JN. Management of patients with refractory immune thrombocytopenic purpura. J Thromb Haemost 2006;4:1664–72.
19. Portielje JE, Westendorp RG, Kluin-Nelemans HC, Brand A. Morbidity and mortality in adults with idiopathic thrombocytopenic purpura. Blood 2001;97:2549–54.
20. McMillan R, Bowditch RD, Tani P, et al. A non-thrombocytopenic bleeding disorder due to an IgG4- kappa anti-GPIIb/IIIa autoantibody. Br J Haematol 1996;95:747–9.
21. Neunert C, Lim W, Crowther M, et al. The American Society of Hematology 2011 evidence-based practice guideline for immune thrombocytopenia. Blood 2011;117:4190–207.22. Mazzucconi MG, Fazi P, Bernasconi S, et al. Therapy with high-dose dexamethasone (HD-DXM) in previously untreated patients affected by idiopathic thrombocytopenic purpura: a GIMEMA experience. Blood 2007;109:1401–7.
23. Wei Y, Ji XB, Wang YW, et al. High-dose dexamethasone vs prednisone for treatment of adult immune thrombocytopenia: a prospective multicenter randomized trial. Blood 2016;127:296–302.
24. Newman GC, Novoa MV, Fodero EM, et al. A dose of 75 microg/kg/d of i.v. anti-D increases the platelet count more rapidly and for a longer period of time than 50 microg/kg/d in adults with immune thrombocytopenic purpura. Br J Haematol 2001;112:1076–8.
25. Gaines AR. Acute onset hemoglobinemia and/or hemoglobinuria and sequelae following Rho(D) immune globulin intravenous administration in immune thrombocytopenic purpura patients. Blood 2000;95:2523–9.
26. Boruchov DM, Gururangan S, Driscoll MC, Bussel JB. Multiagent induction and maintenance therapy for patients with refractory immune thrombocytopenic purpura (ITP). Blood 2007;110:3526–31.
27. Spahr JE, Rodgers GM. Treatment of immune-mediated thrombocytopenia purpura with concurrent intravenous immunoglobulin and platelet transfusion: a retrospective review of 40 patients. Am J Hematol 2008;83:122–5.
28. Olson SR, Chu C, Shatzel JJ, Deloughery TG. The “platelet boilermaker”: A treatment protocol to rapidly increase platelets in patients with immune-mediated thrombocytopenia. Am J Hematol 2016;91:E330–1.
29. Cooper N, Woloski BM, Fodero EM, et al. Does treatment with intermittent infusions of intravenous anti-D allow a proportion of adults with recently diagnosed immune thrombocytopenic purpura to avoid splenectomy? Blood 2002;99:1922–7.
30. George JN, Raskob GE, Vesely SK, et al. Initial management of immune thrombocytopenic purpura in adults: a randomized controlled trial comparing intermittent anti-D with routine care. Am J Hematol 2003;74:161–9.
31. Mikhael J, Northridge K, Lindquist K, et al. Short-term and long-term failure of laparoscopic splenectomy in adult immune thrombocytopenic purpura patients: a systematic review. Am J Hematol 2009;84:743–8.
32. Palandri F, Polverelli N, Sollazzo D, et al. Have splenectomy rate and main outcomes of ITP changed after the introduction of new treatments? A monocentric study in the outpatient setting during 35 years. Am J Hematol 2016;91:E267–72.
33. Landgren O, Bjorkholm M, Konradsen HB, et al. A prospective study on antibody response to repeated vaccinations with pneumococcal capsular polysaccharide in splenectomized individuals with special reference to Hodgkin’s lymphoma. J Intern Med 2004;255:664–73.
34. Bisharat N, Omari H, Lavi I, Raz R. Risk of infection and death among post-splenectomy patients. J Infect 2001;43:182–6.
35. Mileno MD, Bia FJ. The compromised traveler. Infect Dis Clin North Am 1998;12:369–412.
36. Guidelines for the prevention and treatment of infection in patients with an absent or dysfunctional spleen. Working Party of the British Committee for Standards in Haematology Clinical Haematology Task Force. BMJ 1996;312:430–4.
37. Ericsson CD. Travellers with pre-existing medical conditions. Int J Antimicrob Agents 2003;21:181–8.
38. Tran H, Brighton T, Grigg A, et al. A multi-centre, single-arm, open-label study evaluating the safety and efficacy of fixed dose rituximab in patients with refractory, relapsed or chronic idiopathic thrombocytopenic purpura (R-ITP1000 study). Br J Haematol 2014;167:243–51.
39. Mahevas M, Ebbo M, Audia S, et al. Efficacy and safety of rituximab given at 1,000 mg on days 1 and 15 compared to the standard regimen to treat adult immune thrombocytopenia. Am J Hematol 2013;88:858–61.
40. Arnold DM, Dentali F, Crowther MA, et al. Systematic review: efficacy and safety of rituximab for adults with idiopathic thrombocytopenic purpura. Ann Intern Med 2007;146:25–33.
41. Khellaf M, Charles-Nelson A, Fain O, et al. Safety and efficacy of rituximab in adult immune thrombocytopenia: results from a prospective registry including 248 patients. Blood 2014;124:3228–36.
42. Ghanima W, Khelif A, Waage A, et al. Rituximab as second-line treatment for adult immune thrombocytopenia (the RITP trial): a multicentre, randomised, double-blind, placebo-controlled trial. Lancet 2015;385:1653–61.
43. Zaja F, Baccarani M, Mazza P, et al. Dexamethasone plus rituximab yields higher sustained response rates than dexamethasone monotherapy in adults with primary immune thrombocytopenia. Blood 2010;115:2755–62.
44. Dameshek W, Miller EB. The megakaryocytes in idiopathic thrombocytopenic purpura, a form of hypersplenism. Blood 1946;1:27–50.
45. Kuter DJ. Thrombopoietin and thrombopoietin mimetics in the treatment of thrombocytopenia. Annu Rev Med 2009;60:193–206.
46. Bussel JB, Kuter DJ, George JN, et al. AMG 531, a thrombopoiesis-stimulating protein, for chronic ITP. N Engl J Med 2006;355:1672–81.
47. Bussel JB, Provan D, Shamsi T, et al. Effect of eltrombopag on platelet counts and bleeding during treatment of chronic idiopathic thrombocytopenic purpura: a randomised, double-blind, placebo-controlled trial. Lancet 2009;373:641–8.
48. Bussel JB, Kuter DJ, Pullarkat V, et al. Safety and efficacy of long-term treatment with romiplostim in thrombocytopenic patients with chronic ITP. Blood 2009;113:2161–71.
49. Gernsheimer TB, George JN, Aledort LM, et al. Evaluation of bleeding and thrombotic events during long-term use of romiplostim in patients with chronic immune thrombocytopenia (ITP). J Thromb Haemost 2010;8:1372–82.
50. Severinsen MT, Engebjerg MC, Farkas DK, et al. Risk of venous thromboembolism in patients with primary chronic immune thrombocytopenia: a Danish population-based cohort study. Br J Haematol 2011;152:360–2.
51. Bussel JB, Cheng G, Saleh MN, et al. Eltrombopag for the treatment of chronic idiopathic thrombocytopenic purpura. N Engl J Med 2007;357:2237–47.
52. Cheng G, Saleh MN, Marcher C, et al. Eltrombopag for management of chronic immune thrombocytopenia (RAISE): a 6-month, randomised, phase 3 study. Lancet 2011;377:393–402.
53. Brynes RK, Orazi A, Theodore D, et al. Evaluation of bone marrow reticulin in patients with chronic immune thrombocytopenia treated with eltrombopag: Data from the EXTEND study. Am J Hematol 2015;90:598–601.
54. George JN, Kojouri K, Perdue JJ, Vesely SK. Management of patients with chronic, refractory idiopathic thrombocytopenic purpura. Semin Hematol 2000;37:290–8.
55. McMillan R. Therapy for adults with refractory chronic immune thrombocytopenic purpura. Ann Intern Med 1997;126:307–14.
56. Blanco R, Martinez-Taboada VM, Rodriguez-Valverde V, et al. Successful therapy with danazol in refractory autoimmune thrombocytopenia associated with rheumatic diseases. Br J Rheumatol 1997;36:1095–9.
57. Provan D, Moss AJ, Newland AC, Bussel JB. Efficacy of mycophenolate mofetil as single-agent therapy for refractory immune thrombocytopenic purpura. Am J Hematol 2006;81:19–25.
58. Reiner A, Gernsheimer T, Slichter SJ. Pulse cyclophosphamide therapy for refractory autoimmune thrombocytopenic purpura. Blood 1995;85:351–8.
59. Figueroa M, Gehlsen J, Hammond D, et al. Combination chemotherapy in refractory immune thrombocytopenic purpura. N Engl J Med 1993;328:1226–9.
60. Newland A, Lee EJ, McDonald V, Bussel JB. Fostamatinib for persistent/chronic adult immune thrombocytopenia. Immunotherapy 2 Oct 2017.
61. McCrae KR. Thrombocytopenia in pregnancy. Hematology Am Soc Hematol Educ Program 2010;2010:397–402.
62. Gernsheimer T, McCrae KR. Immune thrombocytopenic purpura in pregnancy. Curr Opin Hematol 2007;14:574–80.
63. DeLoughery TG. Critical care clotting catastrophies. Crit Care Clin 2005;21:531–62.
64. Stavrou E, McCrae KR. Immune thrombocytopenia in pregnancy. Hematol Oncol Clin North Am 2009;23:1299–316.
65. Sun D, Shehata N, Ye XY, et al. Corticosteroids compared with intravenous immunoglobulin for the treatment of immune thrombocytopenia in pregnancy. Blood 2016;128:1329–35.
66. Kong Z, Qin P, Xiao S, et al. A novel recombinant human thrombopoietin therapy for the management of immune thrombocytopenia in pregnancy. Blood 2017;130:1097–103.
67. Psaila B, Petrovic A, Page LK, et al. Intracranial hemorrhage (ICH) in children with immune thrombocytopenia (ITP): study of 40 cases. Blood 2009;114:4777–83.
68. Journeycake JM. Childhood immune thrombocytopenia: role of rituximab, recombinant thrombopoietin, and other new therapeutics. Hematology Am Soc Hematol Educ Program 2012;2012:444–9.
69. Zhang J, Liang Y, Ai Y, et al. Thrombopoietin-receptor agonists for children with immune thrombocytopenia: a systematic review. Expert Opin Pharmacother 2017;18:1543–51.
70. Tarantino MD, Bussel JB, Blanchette VS, et al. Romiplostim in children with immune thrombocytopenia: a phase 3, randomised, double-blind, placebo-controlled study. Lancet 2016;388:45–54.71. Grainger JD, Locatelli F, Chotsampancharoen T, et al. Eltrombopag for children with chronic immune thrombocytopenia (PETIT2): a randomised, multicentre, placebo-controlled trial. Lancet 2015;386:1649–58.
72. Stasi R, Sarpatwari A, Segal JB, et al. Effects of eradication of Helicobacter pylori infection in patients with immune thrombocytopenic purpura: a systematic review. Blood 2009;113:1231–40.
73. Arnold DM, Bernotas A, Nazi I, et al. Platelet count response to H. pylori treatment in patients with immune thrombocytopenic purpura with and without H. pylori infection: a systematic review. Haematologica 2009;94:850–6.
74. Aster RH, Bougie DW. Drug-induced immune thrombocytopenia. N Engl J Med 2007;357:580–7.
75. Reese JA, Li X, Hauben M, et al. Identifying drugs that cause acute thrombocytopenia: an analysis using 3 distinct methods. Blood 2010;116:2127–33.
76. Aster RH, Curtis BR, McFarland JG, Bougie DW. Drug-induced immune thrombocytopenia: pathogenesis, diagnosis and management. J Thromb Haemost 2009;7:911–8.
77. Zondor SD, George JN, Medina PJ. Treatment of drug-induced thrombocytopenia. Expert Opin Drug Saf 2002;1:173–80.
78. George JN, Raskob GE, Shah SR, et al. Drug-induced thrombocytopenia: A systematic review of published case reports. Ann Intern Med 1998;129:886–90.
79. Green D, Hougie C, Kazmier FJ, et al. Report of the working party on acquired inhibitors of coagulation: studies of the “lupus” anticoagulant. Thromb Haemost 1983;49:144–6.
80. Michel M, Chanet V, Dechartres A, et al. The spectrum of Evans syndrome in adults: new insight into the disease based on the analysis of 68 cases. Blood 2009;114:3167–72.
81. Dhingra KK, Jain D, Mandal S, et al. Evans syndrome: a study of six cases with review of literature. Hematology 2008;13:356–60.
82. Notarangelo LD. Primary immunodeficiencies (PIDs) presenting with cytopenias. Hematology Am Soc Hematol Educ Program 2009:139–43.
83. Martinez-Valdez L, Deya-Martinez A, Giner MT, et al. Evans syndrome as first manifestation of primary immunodeficiency in clinical practice. J Pediatr Hematol Oncol 2017;39:490–4.
84. Shanafelt TD, Madueme HL, Wolf RC, Tefferi A. Rituximab for immune cytopenia in adults: idiopathic thrombocytopenic purpura, autoimmune hemolytic anemia, and Evans syndrome. Mayo Clin Proc 2003;78:1340–6.
85. Mantadakis E, Danilatou V, Stiakaki E, Kalmanti M. Rituximab for refractory Evans syndrome and other immune-mediated hematologic diseases. Am J Hematol 2004;77:303–10.
86. Jasinski S, Weinblatt ME, Glasser CL. Sirolimus as an effective agent in the treatment of immune thrombocytopenia (ITP) and Evans syndrome (ES): a single institution’s experience. J Pediatr Hematol Oncol 2017;39:420–4.
Introduction
Immune thrombocytopenia (ITP) is a common acquired autoimmune disease characterized by low platelet counts and an increased risk of bleeding. The incidence of ITP is approximately 3.3 per 100,000 adults.1 There is considerable controversy about all aspects of the disease, with little “hard” data on which to base decisions given the lack of randomized clinical trials to address most clinical questions. This article reviews the presentation and diagnosis of ITP and its treatment options and discusses management of ITP in specific clinical situations.
Pathogenesis and Epidemiology
ITP is caused by autoantibodies binding to platelet surface proteins, most often to the platelet receptor GP IIb/IIIa.2-4 These antibody-coated platelets then bind to Fc receptors in macrophages and are removed from circulation. The initiating event in ITP is unknown. It is speculated that the patient responds to a viral or bacterial infection by creating antibodies which cross-react with the platelet receptors. Continued exposure to platelets perpetuates the immune response. ITP that occurs in childhood appears to be an acute response to viral infection and usually resolves. ITP in adults may occur in any age group but is seen especially in young women.
Despite the increased platelet destruction that occurs in ITP, the production of new platelets often is not significantly increased. This is most likely due to lack of an increase in thrombopoietin, the predominant platelet growth factor.5
It had been thought that most adult patients who present with ITP go on to have a chronic course, but more recent studies have shown this is not the case. In modern series the percentage of patients who are “cured” with steroids ranges from 30% to 70%.6–9 In addition, it has been appreciated that even in patients with modest thrombocytopenia, no therapy is required if the platelet count remains higher than 30 × 103/µL. However, this leaves a considerable number of patients who will require chronic therapy.
Clinical Presentation
Presentation can range from a symptomatic patient with low platelets found on a routine blood count to a patient with massive bleeding. Typically, patients first present with petechiae (small bruises 1 mm in size) on the shins. True petechiae are seen only in severe thrombocytopenia. Patients will also report frequent bruising and bleeding from the gums. Patients with very low platelet counts will notice “wet purpura,” which is characterized by blood-filled bullae in the oral cavity. Life-threatening bleeding is a very unusual presenting sign unless other problems (trauma, ulcers) are present. The physical examination is only remarkable for stigmata of bleeding such as the petechiae. The presence of splenomegaly or lymphadenopathy weighs strongly against a diagnosis of ITP. Many patients with ITP will note fatigue when their platelets counts are lower.10
Diagnosis
Extremely low platelet counts with a normal blood smear and an otherwise healthy patient are diagnostic of ITP. The platelet count cutoff for considering ITP is 100 × 103/µL as the majority of patients with counts in the 100 to 150 × 103/µL range will not develop greater thrombocytopenia.11 Also, the platelet count decreases with age (9 × 10³/µL per decade in one study), and this also needs to be factored into the evaluation.12 The finding of relatives with ITP should raise suspicion for congenital thrombocytopenia.13 One should question the patient carefully about drug exposure (see Drug-Induced Thrombocytopenia), especially about over-the-counter medicines, “natural” remedies, or recreational drugs.
There is no laboratory test that rules in ITP; rather, it is a diagnosis of exclusion. The blood smear should be carefully examined for evidence of microangiopathic hemolytic anemias (schistocytes), bone marrow disease (blasts, teardrop cells), or any other evidence of a primary bone marrow disease. In ITP, the platelets can be larger than normal, but finding some platelets the size of red cells should raise the issue of congenital thrombocytopenia.14 Pseudo-thrombocytopenia, which is the clumping of platelets due to a reaction to the EDTA anticoagulant in the tube, should be excluded. The diagnosis is established by drawing the blood in a citrated (blue-top) tube to perform the platelet count. There is no role for antiplatelet antibody assay because this test lacks sensitivity and specificity. In a patient without a history of autoimmune disease or symptoms, empiric testing for autoimmune disease is not recommended.
Patients who present with ITP should be tested for both HIV and hepatitis C infection.15,16 These are the most common viral causes of secondary ITP, and both have prognostic and treatment implications. Some authorities also recommend checking thyroid function as hypothyroidism can present or aggravate the thrombocytopenia.
The role of bone marrow examination is controversial.17 Patients with a classic presentation of ITP (young woman, normal blood smear) do not require a bone marrow exam before therapy is initiated, although patients who do not respond to initial therapy should have a bone marrow aspiration. The rare entity amegakaryocytic thrombocytopenia can present with a clinical picture similar to that of ITP, but amegakaryocytic thrombocytopenia will not respond to steroids. Bone marrow aspiration reveals the absence of megakaryocytes in this entity. It is rare, however, that another hematologic disease is diagnosed in patients with a classic clinical presentation of ITP.
In the future, measurement of thrombopoietin and reticulated platelets may provide clues to the diagnosis.4 Patients with ITP paradoxically have normal or only mildly elevated thrombopoietin levels. The finding of a significantly elevated thrombopoietin level should lead to questioning of the diagnosis. One can also measure “reticulated platelets,” which are analogous to red cell reticulocytes. Patients with ITP (or any platelet destructive disorders) will have high levels of reticulated platelets. These tests are not recommended for routine evaluation, but may be helpful in difficult cases.
Treatment
In general, therapy in ITP should be guided by the patient’s signs of bleeding and not by unquestioning adherence to measuring platelet levels,15 as patients tolerate thrombocytopenia well. It is unusual to have life-threatening bleeding with platelet counts greater than 5 × 10³/µL in the absence of mechanical lesions. Despite the low platelet count in patients with ITP, the overall mortality is estimated to be only 0.3% to 1.3%.18 It is sobering that in one study the rate of death from infections was twice as high as that from bleeding.19 Rare patients will have antibodies that interfere with the function of the platelet, and these patients can have profound bleeding with only modestly lowered platelet counts.20 A suggested cut-off for treating newly diagnosed patients is 30 × 103/µL.21
Initial Therapy
The primary therapy of ITP is glucocorticoids, either prednisone or dexamethasone. In the past prednisone at a dose of 60 to 80 mg/day was started at the time of diagnosis (Table 1).
For rapid induction of a response, there are 2 options. A single dose of intravenous immune globulin (IVIG) at 1 g/kg or intravenous anti-D immunoglobulin (anti-D) at 50 to 75 µg/kg can induce a response in more than 80% of patients in 24 to 48 hours.21,24 IVIG has several drawbacks. It can cause aseptic meningitis, and in patients with vascular disease the increased viscosity can induce ischemia. There is also a considerable fluid load delivered with the IVIG, and it needs to be given over several hours.
The use of anti-D is limited to Rh-positive patients who have not had a splenectomy. It should not be used in patients who are Coombs positive due to the risk of provoking more hemolysis. Rarely anti-D has been reported to cause a severe hemolytic disseminated intravascular coagulation syndrome (1:20,000 patients), which has led to restrictions in its use.25 Although the drug can be rapidly given over 15 minutes, due to these concerns current recommendations are now to observe patients for 8 hours after their dose and to perform a urine dipstick test for blood at 2, 4, and 8 hours. Concerns about this rare but serious side effect have led to a dramatic decrease in the use of anti-D.
For patients who are severely thrombocytopenic and do not respond to initial therapy, there are 2 options for raising the platelet counts. One is to use a combination of IVIG, methylprednisolone, vincristine, and/or anti-D.26 The combination of IVIG and anti-D may be synergistic since these agents block different Fc receptors. A response of 71% has been reported for this 3- or 4-drug combination in a series of 35 patients.26 The other option is to treat with a continuous infusion of platelets (1 unit over 6 hours) and IVIG 1 g/kg for 24 hours. Response rates of 62.7% have been reported with this combination, and this rapid rise in platelets can allow time for other therapies to take effect.27,28
Patients with severe thrombocytopenia who relapse with reduction of steroids or who do not respond to steroids have several options for further management. Repeated doses of IVIG can transiently raise the platelet count, and some patients may only need several courses of therapy over the course of many months. One study showed that 60% of patients could delay or defer therapy by receiving multiple doses of anti-D. However, 30% of patients did eventually receive splenectomy and 20% of patients required ongoing therapy with anti-D.29 In a randomized trial comparing early use of anti-D to steroids to avoid splenectomy, there was no difference in splenectomy rate (38% versus 42%).30 Finally, an option as mentioned above is to try a 6-month course of pulse dexamethasone 40 mg/day for 4 days, repeated every 28 days.
Options for Refractory ITP
There are multiple options for patients who do not respond to initial ITP therapies. These can be divided into several broad groups: curative therapies (splenectomy and rituximab), thrombopoietin receptor agonists, and anecdotal therapies.
Splenectomy
In patients with severe thrombocytopenia who do not respond or who relapse with lower doses of prednisone, splenectomy should be strongly considered. Splenectomy will induce a good response in 60% to 70% of patients and is durable in most patients. In 2 recently published reviews of splenectomy, the complete response rate was 67% and the total response rate was 88% to 90%%.8,31 Between 15% and 28% of patients relapsed over 5 years, with most recurrences occurring in the first 2 years. Splenectomy carries a short-term surgical risk, and the life-long risk of increased susceptibility to overwhelming sepsis is discussed below. However, the absolute magnitude of these risks is low and is often lower than the risks of continued prednisone therapy or of continued cytotoxic therapy.
Timing of splenectomy depends on the patient’s presentation. Most patients should be given a 6-month trial of steroids or other therapies before proceeding to splenectomy.31 However, patients who persist with severe thrombocytopenia despite initial therapies or who are suffering intolerable side effects from therapy should be considered sooner for splenectomy.31 In the George review, multiple factors such as responding to IVIG were found not to be predictive of response to splenectomy.8
Method of splenectomy appears not to matter.21 Rates of finding accessory spleens are just as high or higher with laparoscopic splenectomy and the patient can recover faster. In patients who are severely thrombocytopenic, open splenectomy can allow for quicker control of the vascular access of the spleen.
Rates of splenectomy in recent years have decreased for many reasons,32 including the acceptance of lower platelet counts in asymptomatic patients and the availability of alternative therapies such as rituximab. In addition, despite abundant data for good outcomes, there is a concern that splenectomy responses are not durable. Although splenectomy will not cure every patient with ITP, splenectomy is the therapy with the most patients, the longest follow-up, and the most consistent rate of cure, and it should be discussed with every ITP patient who does not respond to initial therapy and needs further treatment.
The risk of overwhelming sepsis varies by indications for splenectomy but appears to be about 1%.33,34 The use of pneumococcal vaccine and recognition of this syndrome have helped reduce the risk. Asplenic patients need to be counseled about the risk of overwhelming infections, should be vaccinated for pneumococcus, meningococcus, and Haemophilus influenzae, and should wear an ID bracelet.35–37 Patients previously vaccinated for pneumococcus should be re-vaccinated every 3 to 5 years. The role of prophylactic antibiotics in adults is controversial, but patients under the age of 18 should be on penicillin VK 250 mg orally twice daily.
Rituximab
Rituximab has been shown to be very active in ITP. Most studies used the standard dose of 375 mg/m2 weekly for 4 weeks, but other studies have shown that 1000 mg twice 14 days apart (ie, on days 1 and 15) resulted in the same response rate and may be more convenient for patients.38,39 The response time can vary, with patients either showing a rapid response or requiring up to 8 weeks for their counts to go up. Although experience is limited, the response seems to be durable, especially in those patients whose counts rise higher than 150 × 103/µL; in patients who relapse, a response can be re-induced with a repeat course. Overall the response rate for rituximab is about 60%, but only approximately 20% to 40% of patients will remain in long-term remission.40–42 There is no evidence yet that “maintenance” therapy or monitoring CD19/CD20 cells can help further the duration of remission.
Whether to give rituximab pre- or post-splenectomy is also uncertain. An advantage of presplenectomy rituximab is that many patients will achieve remission, delaying the need for surgery. Also, rituximab is a good option for patients whose medical conditions put them at high risk for complications with splenectomy. However, it is unknown whether rituximab poses any long-term risks, while the long-term risks of splenectomy are well-defined. Rituximab is the only curative option left for patients who have failed splenectomy and is a reasonable option for these patients.
There is an intriguing trial in which patients were randomly assigned to dexamethasone alone versus dexamethasone plus rituximab upon presentation with ITP; those who were refractory to dexamethasone alone received salvage therapy with dexamethasone plus rituximab.43 The dexamethasone plus rituximab group had an overall higher rate of sustained remission at 6 months than the dexamethasone group, 63% versus 36%. Interestingly, patients who failed their first course of dexamethasone but then were “salvaged” with dexamethasone/rituximab had a similar overall response rate of 56%, suggesting that saving the addition of rituximab for steroid failures may be an effective option.
Although not “chemotherapy,” rituximab is not without risks. Patients can develop infusion reactions, which can be severe in 1% to 2% of patients. In a meta-analysis the fatal reaction rate was 2.9%.40 Patients with chronic hepatitis B infections can experience reactivation with rituximab, and thus all patients should be screened before treatment. Finally, the very rare but devastating complication of progressive multifocal leukoencephalopathy has been reported.
Thrombopoietin Receptor Agonists
Although patients with ITP have low platelet counts, studies starting with Dameshek have shown that these patients also have reduced production of platelets.44 Despite the very low circulating platelet count, levels of the platelet growth factor thrombopoietin (TPO) are not raised.45 Seminal studies with recombinant TPO in the 1990s showed that ITP patients responded to thrombopoietin-stimulating protein, but the formation of anti-TPO antibodies halted trials with the first generation of these agents. Two TPO receptor agonists (TPO-RA) are approved for use in patients with ITP.
Romiplostim. Romiplostim is a peptibody, a combination of a peptide that binds and stimulates the TPO receptor and an Fc domain to extend its half-life.46 It is administered in a weekly subcutaneous dose starting at 1 to 3 µg/kg. Use of romiplostim in ITP patients produces a response rate of 80% to 88%, with 87% of patients being able to wean off or decrease other anti-ITP medications.47 In a long-term extension study, the response was again high at 87%.48 These studies have also shown a reduced incidence of bleeding.
The major side effect of romiplostim seen in clinical trials was marrow reticulin formation, which occurred in up to 5.6% of patients.47,48 The clinical course in these patients is the development of anemia and a myelophthisic blood smear with teardrop cells and nucleated red cells. These changes appear to reverse with cessation of the drug. The bone marrow shows increased reticulin formation but rarely, if ever, shows the collagen deposition seen with primary myelofibrosis.
Thrombosis has also been seen, with a rate of 0.08 to 0.1 cases per 100 patient-weeks,49 but it remains unclear if this is due to the drug, part of the natural history of ITP, or expected complications in older patients undergoing any type of medical therapy. Surprisingly, despite the low platelet counts, patients with ITP in one study had double the risk of venous thrombosis, demonstrating that ITP itself can be a risk factor for thrombosis.50 These trials have shown no long-term concerns for other clinical problems such as liver disease.
Eltrombopag. The other available TPO-RA is eltrombopag,51 an oral agent that stimulates the TPO receptor by binding the transmembrane domain and activating it. The drug is given orally starting at 50 mg/day (25 mg for patients of Asian ancestry or with liver disease) and can be dose escalated to 75 mg/day. The drug needs to be taken on an empty stomach. Eltrombopag has been shown to be effective in chronic ITP, with response rates of 59% to 80% and reduction in use of rescue medications.47,51,52 As with romiplostim, the incidence of bleeding was also decreased with eltrombopag in these trials.47,51
Clinical trials demonstrated that eltrombopag shares with romiplostim the risk for marrow fibrosis. A side effect unique to eltrombopag observed in these trials was a 3% to 7% incidence of elevated liver function tests.21,52 These abnormal findings appeared to resolve in most patients, but liver function tests need to be monitored in patients receiving eltrombopag.
Clinical use. The clearest indication for the use of TPO-RAs is in patients who have failed several therapies and remain symptomatic or are on intolerable doses of other medications such as prednisone. The clear benefits are their relative safety and high rates of success. The main drawback of TPO-RAs is the need for continuing therapy as the platelet count will return to baseline shortly after these agents are stopped. Currently there is no clear indication for one medication over the other. The advantages of romiplostim are great flexibility in dosing (1–10 µg/kg week) and no concerns about drug interaction. The current drawback of romiplostim is the Food and Drug Administration’s requirement for patients to receive the drug from a clinic and not at home. Eltrombopag offers the advantage of oral use, but it has a limited dose range and potential for drug interactions. Both agents have been associated with marrow reticulin formation, although in clinical use this risk appears to be very low.53
Other Options
In the literature there are numerous options for the treatment of ITP.54,55 Most of these studies are anecdotal, enrolled small number of patients, and sometimes included patients with mild thrombocytopenia, but these therapeutic options can be tried in patients who are refractory to standard therapies and have bleeding. The agents with the greatest amount of supporting data are danazol, vincristine, azathioprine, cyclophosphamide, and fostamatinib.
Danazol 200 mg 4 times daily is thought to downregulate the macrophage Fc receptor. The onset of action may be delayed and a therapeutic trial of up to 4 to 6 months is advised. Danazol is very effective in patients with antiphospholipid antibody syndrome who develop ITP and may be more effective in premenopausal women.56 Once a response is seen, danazol should be continued for 6 months and then an attempt to wean the patient off the agent should be made. A partial response can be seen in 70% to 90% of patients, but a complete response is rare.54
Vincristine 1.4 mg/m2 weekly has a low response rate, but if a response is going to occur, it will occur rapidly within 2 weeks. Thus, a prolonged trial of vincristine is not needed; if no platelet rise is seen in several weeks, the drug should be stopped. Again, partial responses are more common than complete response—50% to 63% versus 0% to 6%.54Azathioprine 150 mg orally daily, like danazol, demonstrates a delayed response and requires several months to assess for response. However, 19% to 25% of patients may have a complete response.54 It has been reported that the related agent mycophenolate 1000 mg twice daily is also effective in ITP.57
Cyclophosphamide 1 g/m2 intravenously repeated every 28 days has been reported to have a response rate of up to 40%.58 Although considered more aggressive, this is a standard immunosuppressive dose and should be considered in patients with very low platelet counts. Patients who have not responded to single-agent cyclophosphamide may respond to multi-agent chemotherapy with agents such as etoposide and vincristine plus cyclophosphamide.59
Fostamatinib, a spleen tyrosine kinase (SYK) inhibitor, is currently under investigation for the treatment of ITP.60 This agent prevents phagocytosis of antibody-coated platelets by macrophages. In early studies fostamatinib has been well tolerated at a dose of 150 mg twice daily, with 75% of patients showing a response. Large phase 3 trials are underway, and if the earlier promising results hold up fostamatinib may be a novel option for refractory patients.
A Practical Approach to Refractory ITP
One approach is to divide patients into bleeders, or those with either very low platelet counts (< 5 × 10³/µL) or who have had significant bleeding in the past, and nonbleeders, or those with platelet counts above 5 × 10³/µL and no history of severe bleeding. Bleeders who do not respond adequately to splenectomy should first start with rituximab since it is not cytotoxic and is the only other “curative” therapy (Table 2).
Nonbleeders should be tried on danazol and other relatively safe agents. If this fails, rituximab or TPO-RAs can be considered. Before one considers cytotoxic therapy, the risk of the therapy must be weighed against the risk posed by the thrombocytopenia. The mortality from ITP is fairly low (5%) and is restricted to patients with severe disease. Patients with only moderate thrombocytopenia and no bleeding are better served with conservative management. There is little justification for the use of continuous steroid therapy in this group of patients given the long-term risks of this therapy.
Special Situations
Surgery
Patients with ITP who need surgery either for splenectomy or for other reasons should have their platelet counts raised to a level greater than 20 to 30 × 103/µL before surgery. Most patients with ITP have increased platelet function and will not have excessive bleeding with these platelet counts. For patients with platelet counts below this level, an infusion of immune globulin or anti-D may rapidly increase the platelet counts. If the surgery is elective, short-term use of TPO-RAs to raise the counts can also be considered.
Pregnancy
Up to 10% of pregnant women will develop low platelet counts during their pregnancy.61,62 The most common etiology is gestational thrombocytopenia, which is an exaggeration of the lowered platelet count seen in pregnancy. Counts may fall as low as 50 × 103/µL at the time of delivery. No therapy is required as the fetus is not affected and the mother does not have an increased risk of bleeding. Pregnancy complications such as HELLP syndrome and thrombotic microangiopathies also present with low platelet counts, but these can be diagnosed by history.61,63
Women with ITP can either develop the disease during pregnancy or have a worsening of the symptoms.64 Counts often drop dramatically during the first trimester. Early management should be conservative with low doses of prednisone to keep the count above 10 × 103/µL.21 Immunoglobulin is also effective,65 but there are rare reports of pulmonary edema. Rarely patients who are refractory will require splenectomy, which may be safely performed in the second trimester. For delivery the count should be greater than 30 × 103/µL and for an epidural greater than 50 × 103/µL.64 There are reports of the use of TPO-RAs in pregnancy, and this can be considered for refractory cases.66
Most controversy centers on management of the delivery. In the past it was feared that fetal thrombocytopenia could lead to intracranial hemorrhage, and Caesarean section was always recommended. It now appears that most cases of intracranial hemorrhage were due to alloimmune thrombocytopenia and not ITP. Furthermore, the nadir of the baby’s platelet count is not at birth but several days after. It appears the safest course is to proceed with a vaginal or C-section delivery determined by obstetrical indications and then immediately check the baby’s platelet count. If the platelet count is low in the neonate, immunoglobulin will raise the count. Since the neonatal thrombocytopenia is due to passive transfer of maternal antibody, the platelet destruction will abate in 4 to 6 weeks.
Pediatric Patients
The incidence of ITP in children is 2.2 to 5.3 per 100,000 children.1 There are several distinct differences in pediatric ITP. Most cases will resolve in weeks, with only a minority of patients transforming into chronic ITP (5%–10%). Also, the rates of serious bleeding are lower in children than in adults, with intracranial hemorrhage rates of 0.1% to 0.5% being seen.67 For most patients with no or mild bleeding, management now is observation alone regardless of platelet count because it is felt that the risks of therapies are higher than the risk of bleeding.21 For patients with bleeding, IVIG, anti-D, or a short course of steroids can be used. Given the risk of overwhelming sepsis, splenectomy is often deferred as long as possible. Rituximab is increasingly being used in children due to concerns about use of agents such a cyclophosphamide or azathioprine in children.68 Abundant data on use of TPO-RAs in children showing high response rates and safety support their use, and these should be considered in refractory ITP before any cytotoxic agent.69–71
Helicobacter Pylori Infection
There has been much interest in the relationship between H. pylori and ITP.16,72,73H. pylori infections have been associated with a variety of autoimmune diseases, and there is a confusing literature on this infection and ITP. Several meta-analyses have shown that eradication of H. pylori will result in an ITP response rate of 20% to 30%, but responses curiously appear to be limited to certain geographic areas such as Japan and Italy but not the United States. In patients with recalcitrant ITP, especially in geographic areas with high incidence, it may be worthwhile to check for H. pylori infection and treat accordingly if positive.
Drug-Induced Thrombocytopenia
Patients with drug-induced thrombocytopenia present with very low (< 10 × 103/µL) platelet counts 1 to 3 weeks after starting a new medication.74–76 In patients with a possible drug-induced thrombocytopenia, the primary therapy is to stop the suspect drug.77 If there are multiple new medications, the best approach is to stop any drug that has been strongly associated with thrombocytopenia (Table 3).74,78,79
Immune globulin, corticosteroids, or intravenous anti‑D have been suggested as useful in drug‑related thrombocytopenia. However, since most of these thrombocytopenic patients recover when the agent is cleared from the body, this therapy is probably not necessary and withholding treatment avoids exposing the patients to the adverse events associated with further therapy.
Evans Syndrome
Evans syndrome is defined as the combination of autoimmune hemolytic anemia (AIHA) and ITP.80,81 These cytopenias can present simultaneously or sequentially. Patients with Evans syndrome are thought to have a more severe disease process, to be more prone to bleeding, and to be more difficult to treat, but the rarity of this syndrome makes this hard to quantify.
The classic clinical presentation of Evans syndrome is severe anemia and thrombocytopenia. Children with Evans syndrome often have complex immunodeficiencies such as autoimmune lymphoproliferative syndrome.82,83 In adults, Evans syndrome most often complicates other autoimmune diseases such as lupus. There are increasing reports of Evans syndrome occurring as a complication of T-cell lymphomas. Often the autoimmune disease can predate the lymphoma diagnosis by months or even years.
In theory the diagnostic approach is straightforward by showing a Coombs-positive hemolytic anemia in the setting of a clinical diagnosis of immune thrombocytopenia. The blood smear will show spherocytes and a diminished platelet count. The presence of other abnormal red cell forms should raise the possibility of an alternative diagnosis. It is unclear how vigorously one should search for other underlying diseases. Many patients will already have the diagnosis of an underlying autoimmune disease. The presence of lymphadenopathy should raise concern for lymphoma.
Initial therapy is high-dose steroids (2 mg/kg/day). IVIG should be added if severe thrombocytopenia is present. Patients who cannot be weaned off prednisone or relapse after prednisone should be considered for splenectomy, although these patients are at higher risk of relapsing.80 Increasingly rituximab is being used with success.84,85 For patients who fail splenectomy and rituximab, aggressive immunosuppression should be considered. Increasing data support the benefits of sirolimus, and this should be considered for refractory patients.86 For patients with Evans syndrome due to underlying lymphoma, antineoplastic therapy often results in prompt resolution of the symptoms. Recurrence of the autoimmune cytopenias often heralds relapse.
1. Terrell DR, Beebe LA, Vesely SK, et al. The incidence of immune thrombocytopenic purpura in children and adults: A critical review of published reports. Am J Hematol 2010;85:174–80.
2. McMillan R, Lopez-Dee J, Bowditch R. Clonal restriction of platelet-associated anti-GPIIb/IIIa autoantibodies in patients with chronic ITP. Thromb Haemost 2001;85:821–3.
3. Aster RH, George JN, McMillan R, Ganguly P. Workshop on autoimmune (idiopathic) thrombocytopenic purpura: Pathogenesis and new approaches to therapy. Am J Hematol 1998;58:231–4.
4. Toltl LJ, Arnold DM. Pathophysiology and management of chronic immune thrombocytopenia: focusing on what matters. Br J Haematol 2011;152:52–60.
5. Kuter DJ, Gernsheimer TB. Thrombopoietin and platelet production in chronic immune thrombocytopenia. Hematol Oncol Clin North Am 2009;23:1193–211.
6. Pamuk GE, Pamuk ON, Baslar Z, et al. Overview of 321 patients with idiopathic thrombocytopenic purpura. Retrospective analysis of the clinical features and response to therapy. Ann Hematol 2002;81:436–40.
7. Stasi R, Stipa E, Masi M, et al. Long-term observation of 208 adults with chronic idiopathic thrombocytopenic purpura. Am J Med 1995;98:436–42.
8. Kojouri K, Vesely SK, Terrell DR, George JN. Splenectomy for adult patients with idiopathic thrombocytopenic purpura: a systematic review to assess long-term platelet count responses, prediction of response, and surgical complications. Blood 2004;104:2623–34.
9. Matschke J, Muller-Beissenhirtz H, Novotny J, et al. A randomized trial of daily prednisone versus pulsed dexamethasone in treatment-naive adult patients with immune thrombocytopenia: EIS 2002 study. Acta Haematol 2016;136:101–7.
10. Newton JL, Reese JA, Watson SI, et al. Fatigue in adult patients with primary immune thrombocytopenia. Eur J Haematol 2011;86:420–9.
11. Stasi R, Amadori S, Osborn J, et al. Long-term outcome of otherwise healthy individuals with incidentally discovered borderline thrombocytopenia. PLoS Med 2006;3:e24.
12. Biino G, Balduini CL, Casula L, et al. Analysis of 12,517 inhabitants of a Sardinian geographic isolate reveals that predispositions to thrombocytopenia and thrombocytosis are inherited traits. Haematologica 2011;96:96–101.
13. Drachman JG. Inherited thrombocytopenia: when a low platelet count does not mean ITP. Blood 2004;103:390–8.
14. Geddis AE, Balduini CL. Diagnosis of immune thrombocytopenic purpura in children. Curr Opin Hematol 2007;14:520–5.
15. Provan D, Stasi R, Newland AC, et al. International consensus report on the investigation and management of primary immune thrombocytopenia. Blood 2010;115:168–86.
16. Stasi R, Willis F, Shannon MS, Gordon-Smith EC. Infectious causes of chronic immune thrombocytopenia. Hematol Oncol Clin North Am 2009;23:1275–97.
17. Jubelirer SJ, Harpold R. The role of the bone marrow examination in the diagnosis of immune thrombocytopenic purpura: case series and literature review. Clin Appl Thromb Hemost 2002;8:73–6.
18. George JN. Management of patients with refractory immune thrombocytopenic purpura. J Thromb Haemost 2006;4:1664–72.
19. Portielje JE, Westendorp RG, Kluin-Nelemans HC, Brand A. Morbidity and mortality in adults with idiopathic thrombocytopenic purpura. Blood 2001;97:2549–54.
20. McMillan R, Bowditch RD, Tani P, et al. A non-thrombocytopenic bleeding disorder due to an IgG4- kappa anti-GPIIb/IIIa autoantibody. Br J Haematol 1996;95:747–9.
21. Neunert C, Lim W, Crowther M, et al. The American Society of Hematology 2011 evidence-based practice guideline for immune thrombocytopenia. Blood 2011;117:4190–207.22. Mazzucconi MG, Fazi P, Bernasconi S, et al. Therapy with high-dose dexamethasone (HD-DXM) in previously untreated patients affected by idiopathic thrombocytopenic purpura: a GIMEMA experience. Blood 2007;109:1401–7.
23. Wei Y, Ji XB, Wang YW, et al. High-dose dexamethasone vs prednisone for treatment of adult immune thrombocytopenia: a prospective multicenter randomized trial. Blood 2016;127:296–302.
24. Newman GC, Novoa MV, Fodero EM, et al. A dose of 75 microg/kg/d of i.v. anti-D increases the platelet count more rapidly and for a longer period of time than 50 microg/kg/d in adults with immune thrombocytopenic purpura. Br J Haematol 2001;112:1076–8.
25. Gaines AR. Acute onset hemoglobinemia and/or hemoglobinuria and sequelae following Rho(D) immune globulin intravenous administration in immune thrombocytopenic purpura patients. Blood 2000;95:2523–9.
26. Boruchov DM, Gururangan S, Driscoll MC, Bussel JB. Multiagent induction and maintenance therapy for patients with refractory immune thrombocytopenic purpura (ITP). Blood 2007;110:3526–31.
27. Spahr JE, Rodgers GM. Treatment of immune-mediated thrombocytopenia purpura with concurrent intravenous immunoglobulin and platelet transfusion: a retrospective review of 40 patients. Am J Hematol 2008;83:122–5.
28. Olson SR, Chu C, Shatzel JJ, Deloughery TG. The “platelet boilermaker”: A treatment protocol to rapidly increase platelets in patients with immune-mediated thrombocytopenia. Am J Hematol 2016;91:E330–1.
29. Cooper N, Woloski BM, Fodero EM, et al. Does treatment with intermittent infusions of intravenous anti-D allow a proportion of adults with recently diagnosed immune thrombocytopenic purpura to avoid splenectomy? Blood 2002;99:1922–7.
30. George JN, Raskob GE, Vesely SK, et al. Initial management of immune thrombocytopenic purpura in adults: a randomized controlled trial comparing intermittent anti-D with routine care. Am J Hematol 2003;74:161–9.
31. Mikhael J, Northridge K, Lindquist K, et al. Short-term and long-term failure of laparoscopic splenectomy in adult immune thrombocytopenic purpura patients: a systematic review. Am J Hematol 2009;84:743–8.
32. Palandri F, Polverelli N, Sollazzo D, et al. Have splenectomy rate and main outcomes of ITP changed after the introduction of new treatments? A monocentric study in the outpatient setting during 35 years. Am J Hematol 2016;91:E267–72.
33. Landgren O, Bjorkholm M, Konradsen HB, et al. A prospective study on antibody response to repeated vaccinations with pneumococcal capsular polysaccharide in splenectomized individuals with special reference to Hodgkin’s lymphoma. J Intern Med 2004;255:664–73.
34. Bisharat N, Omari H, Lavi I, Raz R. Risk of infection and death among post-splenectomy patients. J Infect 2001;43:182–6.
35. Mileno MD, Bia FJ. The compromised traveler. Infect Dis Clin North Am 1998;12:369–412.
36. Guidelines for the prevention and treatment of infection in patients with an absent or dysfunctional spleen. Working Party of the British Committee for Standards in Haematology Clinical Haematology Task Force. BMJ 1996;312:430–4.
37. Ericsson CD. Travellers with pre-existing medical conditions. Int J Antimicrob Agents 2003;21:181–8.
38. Tran H, Brighton T, Grigg A, et al. A multi-centre, single-arm, open-label study evaluating the safety and efficacy of fixed dose rituximab in patients with refractory, relapsed or chronic idiopathic thrombocytopenic purpura (R-ITP1000 study). Br J Haematol 2014;167:243–51.
39. Mahevas M, Ebbo M, Audia S, et al. Efficacy and safety of rituximab given at 1,000 mg on days 1 and 15 compared to the standard regimen to treat adult immune thrombocytopenia. Am J Hematol 2013;88:858–61.
40. Arnold DM, Dentali F, Crowther MA, et al. Systematic review: efficacy and safety of rituximab for adults with idiopathic thrombocytopenic purpura. Ann Intern Med 2007;146:25–33.
41. Khellaf M, Charles-Nelson A, Fain O, et al. Safety and efficacy of rituximab in adult immune thrombocytopenia: results from a prospective registry including 248 patients. Blood 2014;124:3228–36.
42. Ghanima W, Khelif A, Waage A, et al. Rituximab as second-line treatment for adult immune thrombocytopenia (the RITP trial): a multicentre, randomised, double-blind, placebo-controlled trial. Lancet 2015;385:1653–61.
43. Zaja F, Baccarani M, Mazza P, et al. Dexamethasone plus rituximab yields higher sustained response rates than dexamethasone monotherapy in adults with primary immune thrombocytopenia. Blood 2010;115:2755–62.
44. Dameshek W, Miller EB. The megakaryocytes in idiopathic thrombocytopenic purpura, a form of hypersplenism. Blood 1946;1:27–50.
45. Kuter DJ. Thrombopoietin and thrombopoietin mimetics in the treatment of thrombocytopenia. Annu Rev Med 2009;60:193–206.
46. Bussel JB, Kuter DJ, George JN, et al. AMG 531, a thrombopoiesis-stimulating protein, for chronic ITP. N Engl J Med 2006;355:1672–81.
47. Bussel JB, Provan D, Shamsi T, et al. Effect of eltrombopag on platelet counts and bleeding during treatment of chronic idiopathic thrombocytopenic purpura: a randomised, double-blind, placebo-controlled trial. Lancet 2009;373:641–8.
48. Bussel JB, Kuter DJ, Pullarkat V, et al. Safety and efficacy of long-term treatment with romiplostim in thrombocytopenic patients with chronic ITP. Blood 2009;113:2161–71.
49. Gernsheimer TB, George JN, Aledort LM, et al. Evaluation of bleeding and thrombotic events during long-term use of romiplostim in patients with chronic immune thrombocytopenia (ITP). J Thromb Haemost 2010;8:1372–82.
50. Severinsen MT, Engebjerg MC, Farkas DK, et al. Risk of venous thromboembolism in patients with primary chronic immune thrombocytopenia: a Danish population-based cohort study. Br J Haematol 2011;152:360–2.
51. Bussel JB, Cheng G, Saleh MN, et al. Eltrombopag for the treatment of chronic idiopathic thrombocytopenic purpura. N Engl J Med 2007;357:2237–47.
52. Cheng G, Saleh MN, Marcher C, et al. Eltrombopag for management of chronic immune thrombocytopenia (RAISE): a 6-month, randomised, phase 3 study. Lancet 2011;377:393–402.
53. Brynes RK, Orazi A, Theodore D, et al. Evaluation of bone marrow reticulin in patients with chronic immune thrombocytopenia treated with eltrombopag: Data from the EXTEND study. Am J Hematol 2015;90:598–601.
54. George JN, Kojouri K, Perdue JJ, Vesely SK. Management of patients with chronic, refractory idiopathic thrombocytopenic purpura. Semin Hematol 2000;37:290–8.
55. McMillan R. Therapy for adults with refractory chronic immune thrombocytopenic purpura. Ann Intern Med 1997;126:307–14.
56. Blanco R, Martinez-Taboada VM, Rodriguez-Valverde V, et al. Successful therapy with danazol in refractory autoimmune thrombocytopenia associated with rheumatic diseases. Br J Rheumatol 1997;36:1095–9.
57. Provan D, Moss AJ, Newland AC, Bussel JB. Efficacy of mycophenolate mofetil as single-agent therapy for refractory immune thrombocytopenic purpura. Am J Hematol 2006;81:19–25.
58. Reiner A, Gernsheimer T, Slichter SJ. Pulse cyclophosphamide therapy for refractory autoimmune thrombocytopenic purpura. Blood 1995;85:351–8.
59. Figueroa M, Gehlsen J, Hammond D, et al. Combination chemotherapy in refractory immune thrombocytopenic purpura. N Engl J Med 1993;328:1226–9.
60. Newland A, Lee EJ, McDonald V, Bussel JB. Fostamatinib for persistent/chronic adult immune thrombocytopenia. Immunotherapy 2 Oct 2017.
61. McCrae KR. Thrombocytopenia in pregnancy. Hematology Am Soc Hematol Educ Program 2010;2010:397–402.
62. Gernsheimer T, McCrae KR. Immune thrombocytopenic purpura in pregnancy. Curr Opin Hematol 2007;14:574–80.
63. DeLoughery TG. Critical care clotting catastrophies. Crit Care Clin 2005;21:531–62.
64. Stavrou E, McCrae KR. Immune thrombocytopenia in pregnancy. Hematol Oncol Clin North Am 2009;23:1299–316.
65. Sun D, Shehata N, Ye XY, et al. Corticosteroids compared with intravenous immunoglobulin for the treatment of immune thrombocytopenia in pregnancy. Blood 2016;128:1329–35.
66. Kong Z, Qin P, Xiao S, et al. A novel recombinant human thrombopoietin therapy for the management of immune thrombocytopenia in pregnancy. Blood 2017;130:1097–103.
67. Psaila B, Petrovic A, Page LK, et al. Intracranial hemorrhage (ICH) in children with immune thrombocytopenia (ITP): study of 40 cases. Blood 2009;114:4777–83.
68. Journeycake JM. Childhood immune thrombocytopenia: role of rituximab, recombinant thrombopoietin, and other new therapeutics. Hematology Am Soc Hematol Educ Program 2012;2012:444–9.
69. Zhang J, Liang Y, Ai Y, et al. Thrombopoietin-receptor agonists for children with immune thrombocytopenia: a systematic review. Expert Opin Pharmacother 2017;18:1543–51.
70. Tarantino MD, Bussel JB, Blanchette VS, et al. Romiplostim in children with immune thrombocytopenia: a phase 3, randomised, double-blind, placebo-controlled study. Lancet 2016;388:45–54.71. Grainger JD, Locatelli F, Chotsampancharoen T, et al. Eltrombopag for children with chronic immune thrombocytopenia (PETIT2): a randomised, multicentre, placebo-controlled trial. Lancet 2015;386:1649–58.
72. Stasi R, Sarpatwari A, Segal JB, et al. Effects of eradication of Helicobacter pylori infection in patients with immune thrombocytopenic purpura: a systematic review. Blood 2009;113:1231–40.
73. Arnold DM, Bernotas A, Nazi I, et al. Platelet count response to H. pylori treatment in patients with immune thrombocytopenic purpura with and without H. pylori infection: a systematic review. Haematologica 2009;94:850–6.
74. Aster RH, Bougie DW. Drug-induced immune thrombocytopenia. N Engl J Med 2007;357:580–7.
75. Reese JA, Li X, Hauben M, et al. Identifying drugs that cause acute thrombocytopenia: an analysis using 3 distinct methods. Blood 2010;116:2127–33.
76. Aster RH, Curtis BR, McFarland JG, Bougie DW. Drug-induced immune thrombocytopenia: pathogenesis, diagnosis and management. J Thromb Haemost 2009;7:911–8.
77. Zondor SD, George JN, Medina PJ. Treatment of drug-induced thrombocytopenia. Expert Opin Drug Saf 2002;1:173–80.
78. George JN, Raskob GE, Shah SR, et al. Drug-induced thrombocytopenia: A systematic review of published case reports. Ann Intern Med 1998;129:886–90.
79. Green D, Hougie C, Kazmier FJ, et al. Report of the working party on acquired inhibitors of coagulation: studies of the “lupus” anticoagulant. Thromb Haemost 1983;49:144–6.
80. Michel M, Chanet V, Dechartres A, et al. The spectrum of Evans syndrome in adults: new insight into the disease based on the analysis of 68 cases. Blood 2009;114:3167–72.
81. Dhingra KK, Jain D, Mandal S, et al. Evans syndrome: a study of six cases with review of literature. Hematology 2008;13:356–60.
82. Notarangelo LD. Primary immunodeficiencies (PIDs) presenting with cytopenias. Hematology Am Soc Hematol Educ Program 2009:139–43.
83. Martinez-Valdez L, Deya-Martinez A, Giner MT, et al. Evans syndrome as first manifestation of primary immunodeficiency in clinical practice. J Pediatr Hematol Oncol 2017;39:490–4.
84. Shanafelt TD, Madueme HL, Wolf RC, Tefferi A. Rituximab for immune cytopenia in adults: idiopathic thrombocytopenic purpura, autoimmune hemolytic anemia, and Evans syndrome. Mayo Clin Proc 2003;78:1340–6.
85. Mantadakis E, Danilatou V, Stiakaki E, Kalmanti M. Rituximab for refractory Evans syndrome and other immune-mediated hematologic diseases. Am J Hematol 2004;77:303–10.
86. Jasinski S, Weinblatt ME, Glasser CL. Sirolimus as an effective agent in the treatment of immune thrombocytopenia (ITP) and Evans syndrome (ES): a single institution’s experience. J Pediatr Hematol Oncol 2017;39:420–4.
Hairy Cell Leukemia
Introduction
Hairy cell leukemia (HCL) is a rare chronic lymphoproliferative disorder, with only approximately 2000 new cases diagnosed in the United States each year.1 It is now recognized that there are 2 distinct categories of HCL, classic HCL (cHCL) and variant HCL (vHCL), with vHCL now classified as a separate entity under the World Health Organization Classification of Hematopoietic Tumors.2 For this reason, the 2 diseases will be discussed separately. However, they do bear many clinical and microscopic similarities and because of this were originally indistinguishable using diagnostic techniques previously available. Even in the modern era using immunophenotypic, molecular, and genetic testing, differentiating between the classic and variant disease subtypes is sometimes difficult.
For cHCL the median age of diagnosis is 55 years, with vHCL occurring in patients who are somewhat older; HCL has been described only in the adult population, with 1 exception.3,4 There is a 4:1 male predominance, and Caucasians are more frequently affected than other ethnic groups. While the cause of the disease remains largely unknown, it has been observed to occur more frequently in farmers and in persons exposed to pesticides and/or herbicides, petroleum products, and ionizing radiation.4 The Institute of Medicine recently updated their position regarding veterans and Agent Orange, stating that there is sufficient evidence of an association between herbicides and chronic lymphoid leukemias (including HCL) to consider these diseases linked to exposure.5 Familial forms have also been described that are associated with specific HLA haplotypes, indicating a possible hereditary component.6 Most likely, a combination of environmental and genetic factors ultimately contributes to the development of HCL.
In recent years enormous progress has been made with respect to new insights into the biology of cHCL and vHCL, with significant refinement of diagnostic criteria. In addition, tremendous advances have occurred in both treatment and supportive care regimens, which have resulted in a dramatically increased overall life expectancy as well as decreased disease-related morbidity. This has meant that more patients are affected by HCL over time and are more likely to require care for relapsed HCL or associated comorbidities. Although no curative treatment options exist outside of allogeneic transplantation, therapeutic improvements have resulted in patients with cHCL having a life expectancy similar to that of unaffected patients, increasing the need for vigilance to prevent foreseeable complications.
Biology and Patheogenisis
The family of HCLs are chronic B-cell malignancies that account for approximately 2% of all diagnosed leukemias.7 The first detailed characterization of HCL as a distinct clinical entity was performed by Dr. Bouroncle and colleagues at the Ohio State University in 1958.8 Originally called leukemic reticuloendotheliosis, it was renamed HCL following more detailed description of the unique morphology of these malignant cells.9 Significant advances have recently been made in identifying distinctive genetic, immunophenotypic, and morphologic features that distinguish HCL from other B-cell malignancies.
HCL B cells tend to accumulate in the bone marrow, splenic red pulp, and (in some cases) peripheral blood. Unlike other lymphoproliferative disorders, HCL only rarely results in lymphadenopathy. HCL derives its name from the distinct appearance of the malignant hairy cells (Figure). Morphologically, HCL cells are mature, small lymphoid B-cells with a round or oval nucleus and abundant pale blue cytoplasm. Irregular projections of cytoplasm and microvilli give the cells a serrated, “hairy” appearance.10 The biological significance of these fine hair-like projections remains unknown and is an area of ongoing investigation. Gene expression profiling has revealed that HCL B cells are most similar to splenic marginal zone B cells and memory B cells.11–13 A recent analysis of common genetic alterations in HCL suggests that the cell of origin is in fact the hematopoietic stem cell.14 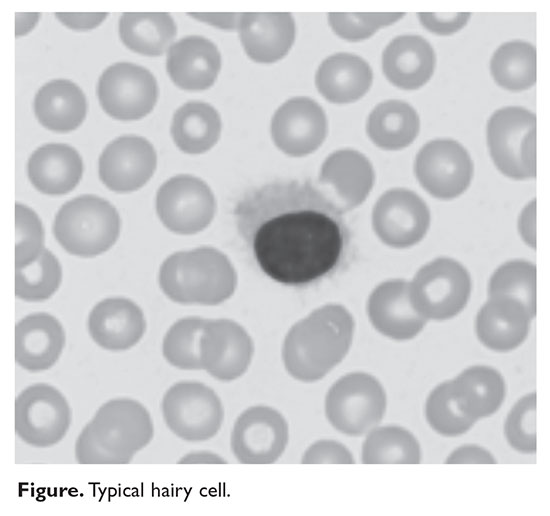
Compared to other hematologic malignancies, the genomic profile of HCL is relatively stable, with few chromosomal defects or translocations observed. A seminal study by Tiacci and colleagues revealed that the BRAF V600E mutation was present in 47 out of 47 cHCL cases examined, results that have since been replicated by other groups, confirming that BRAF V600E is a hallmark mutation in cHCL.15 The BRAF V600E gain-of-function mutation results in constitutive activation of the serine-threonine protein kinase B-Raf, which regulates the mitogen-activated protein kinase (MAPK)/RAF-MEK-ERK pathway. Indeed, cHCL B cells have elevated MAPK signaling, leading to enhancement of growth and survival.16 This specific mutation in the BRAF gene is also seen in a number of solid tumor malignancies including melanoma and thyroid cancer, and represents a therapeutic target using BRAF inhibitors already developed to treat these malignancies.17 Testing for BRAF V600E by polymerase chain reaction or immunohistochemical staining is now routinely performed when HCL is suspected.
While BRAF V600E is identified in nearly all cases of cHCL, it is rare in vHCL.18 The variant type of HCL was classified as a distinct clinical entity in 2008 and can now often be distinguished from cHCL on the basis of BRAF mutational status, among other differences. Interestingly, in the rare cases of BRAF V600E–negative cHCL, other mutations in BRAF or downstream targets as well as aberrant activation of the RAF-MEK-ERK signaling cascade are observed, indicating that this pathway is critical in HCL and may still represent a viable therapeutic target. Expression of the IGHV4-34 immunoglobulin rearrangement, while more common in vHCL, has also been identified in 10% of cHCL cases and appears to confer poor prognosis.19 Other mutated genes that have been identified in HCL include CDKN1B, TP53, U2AF1, ARID1A, EZH2, and KDM6A.20
Classic HCL is characterized by the immunophenotypic expression of CD11c, CD25, CD103, and CD123, with kappa or lambda light chain restriction indicating clonality; HCL B cells are generally negative for CD5, CD10, CD23, CD27, and CD79b. In contrast, vHCL often lacks expression of CD25 and CD123.18 The B-cell receptor (BCR) is expressed on hairy cells and its activation promotes proliferation and survival in vitro.21 The role of BCR signaling in B-cell malignancies is increasingly recognized, and therapies that target the BCR and associated signaling molecules offer an attractive treatment strategy.22 HCL B cells also typically express CD19, CD20, CD22, CD79a, CD200, CD1d, and annexin A1. Tartrate-resistant acid phosphatase (TRAP) positivity by immunohistochemistry is a hallmark of cHCL. Interestingly, changes to the patient’s original immunophenotype have been observed following treatment and upon disease recurrence, highlighting the importance of tracking immunophenotype throughout the course of disease.
Diagnosis
Prior to the advent of annual screening evaluations with routine examination of complete blood counts (CBC), patients were most often diagnosed with HCL when they presented with symptoms of the disease such as splenomegaly, infections, or complications of anemia or thrombocytopenia.23 In the current era, patients are more likely to be incidentally diagnosed when they are found to have an abnormal value on a CBC. Any blood lineage may be affected and patients may have pancytopenia or isolated cytopenias. Of note, monocytopenia is a common finding in cHCL that is not entirely understood. The cells typical of cHCL do not usually circulate in the peripheral blood, but if present would appear as mature lymphocytes with villous cytoplasmic projections, pale blue cytoplasm, and reniform nuclei with open chromatin (Figure).9 Even if the morphologic examination is highly suggestive of HCL, additional testing is required to differentiate between cHCL, vHCL, and other hematologic malignancies which may also have cytoplasmic projections. A complete assessment of the immunophenotype, molecular profile, and cytogenetic features is required to arrive at this diagnosis.
The international Hairy Cell Leukemia Foundation recently published consensus guidelines for the diagnosis and treatment of HCL.24 These guidelines recommend that patients undergo examination of the peripheral blood for morphology and immunophenotyping and further recommend obtaining bone marrow core and aspirate biopsy samples for immunophenotyping via immunohistochemical staining and flow cytometry. The characteristic immunophenotype of cHCL is a population of monoclonal B lymphocytes which co-express CD19, CD20, CD11c, CD25, CD103, and CD123. Variant HCL is characterized by a very similar immunophenotype but is usually negative for CD25 and CD123. It is notable that CD25 positivity may be lost following treatment, and the absence of this marker should not be used as the sole basis of a cHCL versus vHCL diagnosis. Because marrow fibrosis in HCL may prevent a marrow aspirate from being obtained, many of the key diagnostic studies are performed on the core biopsy, including morphological evaluation and immunohistochemical stains such as CD20 (a pan-B cell antigen), annexin-1 (an anti-inflammatory protein expressed only in cHCL), and VE1 (a BRAF V600E stain).
As noted above, recurrent cytogenetic abnormalities have now been identified that may inform the diagnosis or prognosis of HCL. Next-generation sequencing and other testing of the genetic landscape are taking on a larger role in subtype differentiation, and it is likely that future guidelines will recommend evaluation for significant mutations. Given that BRAF V600E mutation status is a key feature of cHCL and is absent in vHCL, it is important to perform this testing at the time of diagnosis whenever possible. The mutation may be detected via VE1 immunohistochemical staining, allele-specific polymerase chain reaction, or next-generation sequencing. Other less sensitive tests exist but are utilized less frequently.
Minimal Residual Disease
There is currently no accepted standard for minimal residual disease (MRD) monitoring in HCL. While detection of MRD has been clearly associated with increased risk of disease progression, cHCL cells typically do not circulate in the peripheral blood, limiting the use of peripheral blood immunophenotyping for quantitative MRD assessment. For quantitative monitoring of marrow involvement by HCL, immunohistochemical staining of the bone marrow core biopsy is usually required. Staining may be performed for CD20, or, in patients who have received anti-CD20 therapy, DBA.44, VE-1, or CD79a. There is currently not a consensus regarding what level of disease involvement constitutes MRD. One group studied this issue and found that relapse could be predicted by evaluating MRD by percentage of positive cells in the marrow by immunohistochemical staining, with less than 1% involvement having the lowest risk for disease relapse and greater than 5% having the highest risk for disease relapse.25 A recent study evaluated MRD patterns in the peripheral blood of 32 cHCL patients who had completed frontline therapy. This group performed flow cytometry on the peripheral blood of patients at 1, 3, 6, and 12 months following therapy. All patients had achieved a complete response with initial therapy and peripheral blood MRD negativity at the completion of therapy. At a median follow-up of 100 months post therapy, 5 patients converted from peripheral blood–MRD negative to peripheral blood–MRD positive, and 6 patients developed overt disease progression. In all patients who progressed, progression was preceded by an increase in detectable peripheral blood MRD cells.26 Although larger studies are needed, peripheral blood flow cytometric monitoring for MRD may be a useful adjunct to predict ongoing response or impending relapse. In addition, newer, more sensitive methods of disease monitoring may ultimately supplant flow cytometry.
Risk Stratification
Although much progress has been made in the risk stratification profiling of hematologic malignancies in general, HCL has unfortunately lagged behind in this effort. The most recent risk stratification analysis was performed in 1982 by Jansen and colleagues.27 This group of researchers performed a retrospective analysis of 391 HCL patients treated at 22 centers. One of the central questions in their analysis was survival time from diagnosis in patients who had not yet undergone splenectomy (a standard treatment at the time). This group consisted of a total of 154 patients. As this study predated modern pathological and molecular testing, clinical and laboratory features were examined, and these mostly consisted of physical exam findings and analysis of the peripheral blood. This group found that several factors influenced the survival of these patients, including duration of symptoms prior to diagnosis, the degree of splenomegaly, hemoglobin level, and number of hairy cells in the peripheral blood. However, because of interobserver variation for the majority of these variables, only hemoglobin and spleen size were included in the proportional hazard model. Using only these 2 variables, the authors were able to determine 3 clinical stages for HCL (Table 1). The stages were found to correlate with median survival: patients with stage 1 disease had a median survival not reached at 72 months, but patients with stage 2 disease had a median survival of 18 months, which decreased to only 12 months in patients with stage 3 disease. 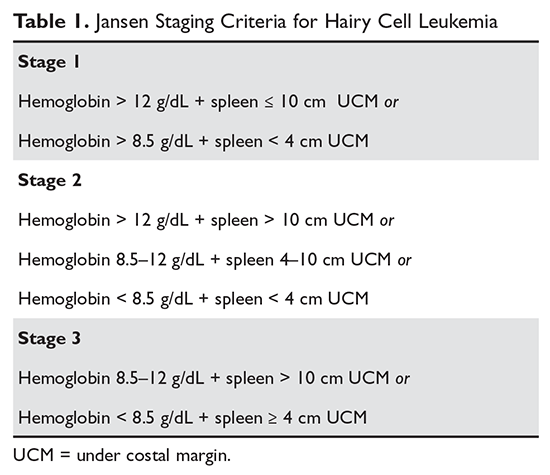
Because the majority of patients with HCL in the modern era will be diagnosed prior to reaching stage 3, a risk stratification system incorporating clinical features, laboratory parameters, and molecular and genetic testing is of considerable interest and is a subject of ongoing research. Ultimately, the goal will be to identify patients at higher risk of early relapse so that more intensive therapies can be applied to initial treatment that will result in longer treatment-free intervals.
Treatment
Because there is no curative treatment for either cHCL or vHCL outside allogeneic transplantation, and it is not clear that early treatment leads to better outcomes in HCL, patients do not always receive treatment at the time of diagnosis or relapse. The general consensus is that patients should be treated if there is a declining trend in hematologic parameters or they experience symptoms from the disease.24 Current consensus guidelines recommend treatment when any of the following hematologic parameters are met: hemoglobin less than 11 g/dL, platelet count less than 100 × 103/µL, or absolute neutrophil count less than 1000/µL.24 These parameters are surrogate markers that indicate compromised bone marrow function. Cytopenias may also be caused by splenomegaly, and symptomatic splenomegaly with or without cytopenias is an indication for treatment. A small number of patients with HCL (approximately 10%) do not require immediate therapy after diagnosis and are monitored by their provider until treatment is indicated.
First-Line Therapy
Despite advances in targeted therapies for HCL, because no treatment has been shown to extend the treatment-free interval longer than chemotherapy, treatment with a purine nucleoside analog is usually the recommended first-line therapy. This includes either cladribine or pentostatin. Both agents appear to be equally effective, and the choice of therapy is determined by the treating physician based on his or her experience. Cladribine administration has been studied using a number of different schedules and routes: intravenous continuous infusion (0.1 mg/kg) for 7 days, intravenous infusion (0.14 mg/kg/day) over 2 hours on a 5-day regimen, or alternatively subcutaneously (0.1–0.14 mg/kg/day) on a once-per-day or once-per-week regimen (Table 2).28,29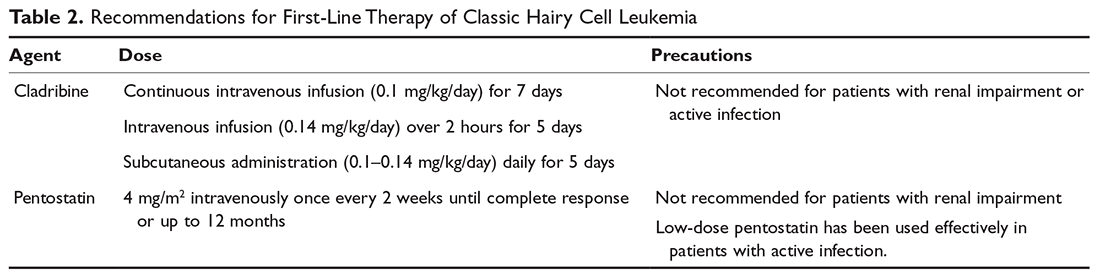
Unlike cHCL, vHCL remains difficult to treat and early disease progression is common. The best outcomes have been seen in patients who have received combination chemo-immunotherapy such as purine nucleoside analog therapy plus rituximab or bendamustine plus rituximab.31 One pilot study of bendamustine plus rituximab in 12 patients found an overall response rate of 100%, with the majority of patients achieving a complete response.31 For patients who achieved a complete response, the median duration of response had not been reached, but patients achieving only a partial response had a median duration of response of only 20 months, indicating there is a subgroup of patients who will require a different treatment approach.32 A randomized phase 2 trial of rituximab with either pentostatin or bendamustine is ongoing.33
Assessment of Response
Response assessment involves physical examination for estimation of spleen size, assessment of hematologic parameters, and a bone marrow biopsy for evaluation of marrow response. It is recommended that the bone marrow biopsy be performed 4 to 6 months following cladribine administration, or after completion of 12 doses of pentostatin. Detailed response assessment criteria are shown in Table 3. 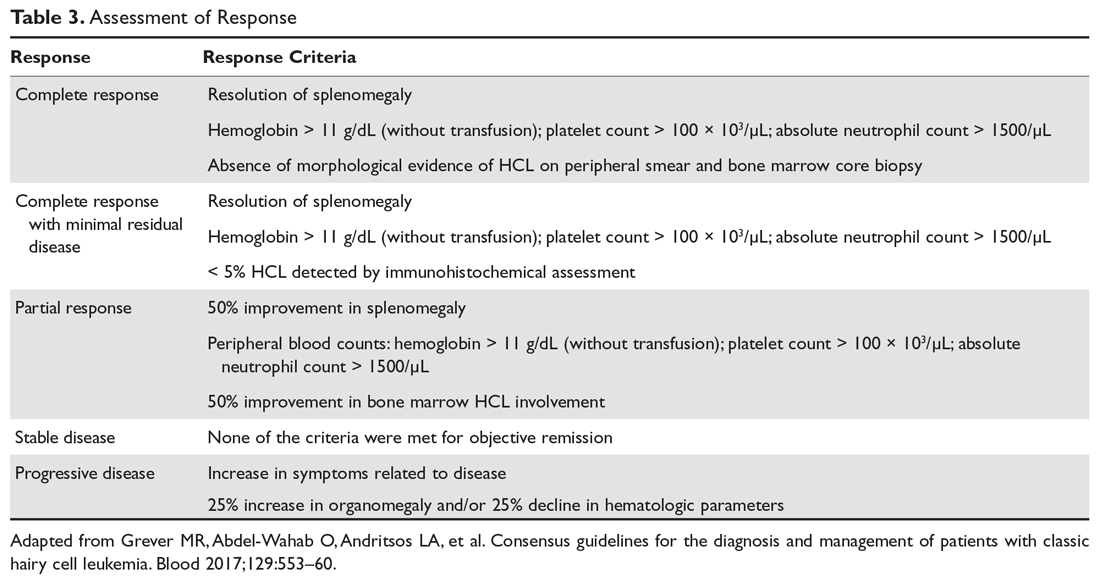
Second-Line Therapy
Although the majority of patients treated with purine analogs will achieve durable remissions, approximately 40% of patients will eventually require second-line therapy. Criteria for treatment at relapse are the same as the criteria for initial therapy, including symptomatic disease or progressive anemia, thrombocytopenia, or neutropenia. The choice of treatment is based on clinical parameters and the duration of the previous remission. If the initial remission was longer than 65 months and the patient is eligible to receive chemotherapy, re-treatment with initial therapy is recommended. For a remission between 24 and 65 months, re-treatment with a purine analog combined with an anti-CD20 monoclonal antibody may be considered.34 If the first remission is shorter than 24 months, confirmation of the original diagnosis as well as consideration for testing for additional mutations with therapeutic targets (BRAF V600E, MAP2K1) should be considered before a treatment decision is made. For these patients, alternative therapies, including investigational agents, should be considered.24
Monoclonal antibody therapy has been studied in both the up-front setting and in relapsed or refractory HCL.35 An initial study of 15 patients with relapsed HCL found an overall response rate of 80%, with 8 patients achieving a complete response. A subsequent study of 26 patients who relapsed after cladribine therapy found an overall response rate of 80%, with a complete response rate of 32%. Median relapse-free survival was 27 months.36 Ravandi and others studied rituximab in the up-front setting in combination with cladribine, and found an overall response rate of 100%, including in patients with vHCL. At the time of publication of the study results, the median survival had not been reached.37 As has been seen with other lymphoid malignancies, concurrent therapy with rituximab appears to enhance the activity of the agent with which it is combined. While its use in the up-front setting remains an area of active investigation, there is a clear role for chemo-immunotherapy in the relapsed setting.
In patients with cHCL, excellent results including complete remissions have been reported with the use of BRAF inhibitors, both as a single agent and when combined with anti-CD20 therapy. The 2 commercially available BRAF inhibitors are vemurafenib and dabrafenib, and both have been tested in relapsed cHCL.38,39 The first study of vemurafenib was reported by Tiacci and colleagues, who found an overall response rate of 96% after a median of 8 weeks and a 100% response rate after a median of 12 weeks, with complete response rates up to 42%.38 The median relapse-free survival was 23 months (decreasing to only 6 months in patients who achieved only a partial remission), indicating that these agents will likely need to be administered in combination with other effective therapies with non-overlapping toxicities. Vemurafenib has been administered concurrently with rituximab, and preliminary results of this combination therapy showed early rates of complete responses.40 Dabrafenib has been reported for use as a single agent in cHCL and clinical trials are underway evaluating its efficacy when administered with trametinib, a MEK inhibitor.39,41 Of note, patients receiving BRAF inhibitors frequently develop cutaneous complications of RAF inhibition including cutaneous squamous cell carcinomas and keratoacanthomas, and close dermatologic surveillance is required.
Variant HCL does not harbor the BRAF V600E mutation, but up to half of patients have been found to have mutations of MAP2K1, which upregulates MEK1 expression.42 Trametinib is approved by the US Food and Drug Administration for the treatment of patients with melanoma at a dose of 2 mg orally daily, and has been successfully used to treat 1 patient with vHCL.43 Further evaluation of this targeted therapy is underway.
Ibrutinib, a Bruton tyrosine kinase inhibitor, and moxetumomab pasudotox, an immunotoxin conjugate, are currently being studied in National Institutes of Health–sponsored multi-institutional trials for patients with HCL. Ibrutinib is administered orally at 420 mg per day until relapse.44 Moxetumomab pasudotox was tested at different doses between 5 and 50 μg/kg intravenously every other day for 3 doses for up to 16 cycles unless they experienced disease progression or developed neutralizing antibodies.45 Both agents have been shown to have significant activity in cHCL and vHCL and will likely be included in the treatment armamentarium once trials are completed. Second-line therapy options are summarized in Table 4.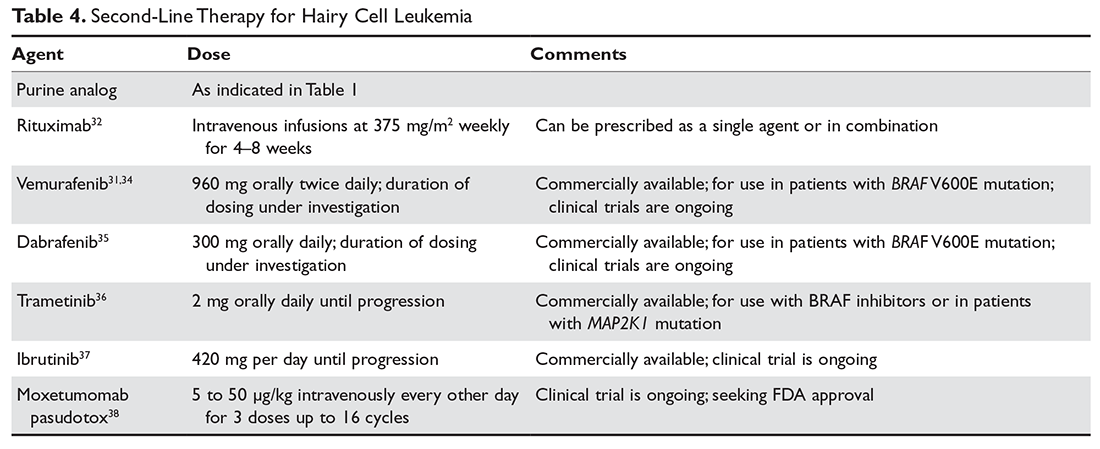
Complications and Supportive Care
The complications of HCL may be separated into the pre-, intra-, and post-treatment periods. At the time of diagnosis and prior to the initiation of therapy, marrow infiltration by HCL frequently leads to cytopenias which cause symptomatic anemia, infection, and/or bleeding complications. Many patients develop splenomegaly, which may further lower the blood counts and which is experienced as abdominal fullness or distention, with early satiety leading to weight loss. Patients may also experience constitutional symptoms with fatigue, fevers in the absence of infection, and unintentional weight loss even without splenomegaly.
For patients who initiate therapy with purine nucleoside analogs, the early part of treatment is associated with the greatest risk of morbidity and mortality. Chemotherapy leads to both immunosuppression (altered cellular immunity) as well as myelosuppression. Thus, patients who are already in need of treatment because of disease-related cytopenias will experience an abrupt and sometimes significant decline in the peripheral blood counts. The treatment period prior to recovery of neutrophils requires the greatest vigilance. Because patients are profoundly immunocompromised, febrile neutropenia is a common complication leading to hospital admission and the cause is often difficult to identify. Treatment with broad-spectrum antibiotics, investigation for opportunistic and viral infections, and considerations for antifungal prophylaxis or therapy are required in this setting. It is recommended that all patients treated with purine nucleoside analogs receive prophylactic antimicrobials for herpes simplex virus and varicella zoster virus, as well as prophylaxis against Pneumocystis jirovecii. Unfortunately, growth factor support has not proven successful in this patient population but is not contraindicated.46
Following successful completion of therapy, patients may remain functionally immunocompromised for a significant period of time even with a normal neutrophil count. Monitoring of the CD4 count may help to determine when prophylactic antimicrobials may be discontinued. A CD4 count greater than 200 cells/µL is generally considered to be adequate for prevention of opportunistic infections. Although immunizations have not been well studied in HCL, it is recommended that patients receive annual influenza immunizations as well as age-appropriate immunizations against Streptococcus pneumoniae and other infectious illnesses as indicated. Live viral vaccines such as the currently available herpes zoster vaccine can lead to infections in this patient population and are not recommended.
Like many hematologic malignancies, HCL may be associated with comorbid conditions related to immune dysfunction. There is a known association with an increased risk of second primary malignancies, which may predate the diagnosis of HCL.47 Therefore, it is recommended that patients continue annual cancer screenings as well as undergo prompt evaluation for potential symptoms of second malignancies. In addition, it is thought that there may be an increased risk for autoimmune disorders such as inflammatory arthritis or immune-mediated cytopenias. One case-control study found a possible association between autoimmune diseases and HCL, noting that at times these diseases are diagnosed concurrently.48 However, because of the rarity of the disease it has been difficult to quantify these associated conditions in a systematic way. There is currently an international patient data registry under development for the systematic study of HCL and its complications which may answer many of these questions.
Survivorship and quality of life are important considerations in chronic diseases. It is not uncommon for patients to develop anxiety related to the trauma of diagnosis and treatment, especially when intensive care has been required. Patients may have lingering fears regarding concerns of developing infections due to exposure to ill persons or fears regarding risk of relapse and need for re-treatment. A proactive approach with partnership with psychosocial oncology may be of benefit, especially when symptoms of post-traumatic stress disorder are evident.
Conclusion
HCL is a rare, chronic lymphoid malignancy that is now subclassified into classic and variant HCL. Further investigations into the disease subtypes will allow more precise disease definitions, and these studies are underway. Renewed efforts toward updated risk stratification and clinical staging systems will be important aspects of these investigations. Refinements in treatment and supportive care have resulted in greatly improved overall survival, which has translated into larger numbers of people living with HCL. However, new treatment paradigms for vHCL are needed as the progression-free survival in this disease remains significantly lower than that of cHCL. Future efforts toward understanding survivorship issues and management of long-term treatment and disease-related complications will be critical for ensuring good quality of life for patients living with HCL.
1. Teras LR, Desantis DE, Cerhan JR, et al. 2016 US lymphoid malignancy statistics by World Health Organization subtypes. CA Cancer J Clin 2016;66:443–59.
2. Swerdlow SH, Campo E, Harris NL, et al. WHO classification of tumours of haematopoietic and lymphoid tissues. 4th ed. Lyon, France: IARC; 2008.
3. Yetgin S, Olcay L, Yenicesu I, et al. Relapse in hairy cell leukemia due to isolated nodular skin infiltration. Pediatr Hematol Oncol 2001;18:415–7.
4. Tadmor T, Polliack A. Epidemiology and environmental risk in hairy cell leukemia. Best Pract Res Clin Haematol 2015;28:175–9.
5. Veterans and agent orange: update 2014. Mil Med 2017;182:1619–20.
6. Villemagne B, Bay JO, Tournilhac O, et al. Two new cases of familial hairy cell leukemia associated with HLA haplotypes A2, B7, Bw4, Bw6. Leuk Lymphoma 2005;46:243–5.
7. Chandran R, Gardiner SK, Smith SD, Spurgeon SE. Improved survival in hairy cell leukaemia over three decades: a SEER database analysis of prognostic factors. Br J Haematol 2013;163:407–9.
8. Bouroncle BA, Wiseman BK, Doan CA. Leukemic reticuloendotheliosis. Blood 1958;13:609–30.
9. Schrek R, Donnelly WJ. “Hairy” cells in blood in lymphoreticular neoplastic disease and “flagellated” cells of normal lymph nodes. Blood 1966;27:199–211.
10. Polliack A, Tadmor T. Surface topography of hairy cell leukemia cells compared to other leukemias as seen by scanning electron microscopy. Leuk Lymphoma 2011;52 Suppl 2:14–7.
11. Miranda RN, Cousar JB, Hammer RD, et al. Somatic mutation analysis of IgH variable regions reveals that tumor cells of most parafollicular (monocytoid) B-cell lymphoma, splenic marginal zone B-cell lymphoma, and some hairy cell leukemia are composed of memory B lymphocytes. Hum Pathol 1999;30:306–12.
12. Vanhentenrijk V, Tierens A, Wlodarska I, et al. V(H) gene analysis of hairy cell leukemia reveals a homogeneous mutation status and suggests its marginal zone B-cell origin. Leukemia 2004;18:1729–32.
13. Basso K, Liso A, Tiacci E, et al. Gene expression profiling of hairy cell leukemia reveals a phenotype related to memory B cells with altered expression of chemokine and adhesion receptors. J Exp Med 2004;199:59–68.
14. Chung SS, Kim E, Park JH, et al. Hematopoietic stem cell origin of BRAFV600E mutations in hairy cell leukemia. Sci Transl Med 2014;6:238ra71.
15. Tiacci E, Trifonov V, Schiavoni G, et al. BRAF mutations in hairy-cell leukemia. N Engl J Med 2011;364:2305–15.
16. Kamiguti AS, Harris RJ, Slupsky JR, et al. Regulation of hairy-cell survival through constitutive activation of mitogen-activated protein kinase pathways. Oncogene 2003;22:2272–84.
17. Rahman MA, Salajegheh A, Smith RA, Lam AK. BRAF inhibitors: From the laboratory to clinical trials. Crit Rev Oncol Hematol 2014;90:220–32.
18. Shao H, Calvo KR, Gronborg M, et al. Distinguishing hairy cell leukemia variant from hairy cell leukemia: development and validation of diagnostic criteria. Leuk Res 2013;37:401–9.
19. Xi L, Arons E, Navarro W, et al. Both variant and IGHV4-34-expressing hairy cell leukemia lack the BRAF V600E mutation. Blood 2012;119:3330–2.
20. Jain P, Pemmaraju N, Ravandi F. Update on the biology and treatment options for hairy cell leukemia. Curr Treat Options Oncol 2014;15:187–209.
21. Sivina M, Kreitman RJ, Arons E, et al. The bruton tyrosine kinase inhibitor ibrutinib (PCI-32765) blocks hairy cell leukaemia survival, proliferation and B cell receptor signalling: a new therapeutic approach. Br J Haematol 2014;166:177–88.
22. Jaglowski SM, Jones JA, Nagar V, et al. Safety and activity of BTK inhibitor ibrutinib combined with ofatumumab in chronic lymphocytic leukemia: a phase 1b/2 study. Blood 2015;126:842–50.
23. Andritsos LA, Grever MR. Historical overview of hairy cell leukemia. Best Pract Res Clin Haematol 2015;28:166–74.
24. Grever MR, Abdel-Wahab O, Andritsos LA, et al. Consensus guidelines for the diagnosis and management of patients with classic hairy cell leukemia. Blood 2017;129:553–60.
25. Mhawech-Fauceglia P, Oberholzer M, Aschenafi S, et al. Potential predictive patterns of minimal residual disease detected by immunohistochemistry on bone marrow biopsy specimens during a long-term follow-up in patients treated with cladribine for hairy cell leukemia. Arch Pathol Lab Med 2006;130:374–7.
26. Ortiz-Maldonado V, Villamor N, Baumann T, et al., Is there a role for minimal residual disease monitoring in the management of patients with hairy-cell leukaemia? Br J Haematol 2017 Aug 18.
27. Jansen J, Hermans J. Clinical staging system for hairy-cell leukemia. Blood 1982;60:571–7.
28. Grever MR, Lozanski G. Modern strategies for hairy cell leukemia. J Clin Oncol 2011;29:583–90.
29. Ravandi F, O’Brien S, Jorgensen J, et al. Phase 2 study of cladribine followed by rituximab in patients with hairy cell leukemia. Blood 2011;118:3818–23.
30. Grever M, Kopecky K, Foucar MK, et al. Randomized comparison of pentostatin versus interferon alfa-2a in previously untreated patients with hairy cell leukemia: an intergroup study. J Clin Oncol 1995;13:974–82.
31. Kreitman RJ, Wilson W, Calvo KR, et al. Cladribine with immediate rituximab for the treatment of patients with variant hairy cell leukemia. Clin Cancer Res 2013;19:6873–81.
32. Burotto M, Stetler-Stevenson M, Arons E, et al. Bendamustine and rituximab in relapsed and refractory hairy cell leukemia. Clin Cancer Res 2013;19:6313–21.
33. Randomized phase II trial of rituximab with either pentostatin or bendamustine for multiply relapsed or refractory hairy cell leukemia. 2017 [cited 2017 Oct 26]; NCT01059786. https://clinicaltrials.gov/ct2/show/NCT01059786.
34. Else M, Dearden CE, Matutes E, et al. Rituximab with pentostatin or cladribine: an effective combination treatment for hairy cell leukemia after disease recurrence. Leuk Lymphoma 2011;52 Suppl 2:75–8.
35. Thomas DA, O’Brien S, Bueso-Ramos C, et al. Rituximab in relapsed or refractory hairy cell leukemia. Blood 2003;102:3906–11.
36. Zenhäusern R, Simcock M, Gratwohl A, et al. Rituximab in patients with hairy cell leukemia relapsing after treatment with 2-chlorodeoxyadenosine (SAKK 31/98). Haematologica 2008;93(9):1426–8.
37. Ravandi F, O’Brien S, Jorgensen J, et al. Phase 2 study of cladribine followed by rituximab in patients with hairy cell leukemia. Blood 2011;118:3818–23.
38. Tiacci E, Park JH, De Carolis L, et al. Targeting mutant BRAF in relapsed or refractory hairy-cell leukemia. N Engl J Med 2015;373:1733–47.
39. Blachly JS, Lozanski G, Lucas DM, et al. Cotreatment of hairy cell leukemia and melanoma with the BRAF inhibitor dabrafenib. J Natl Compr Canc Netw 2015;13:9–13.
40. Tiacci E, De Carolis L, Zaja F, et al. Vemurafenib plus rituximab in hairy cell leukemia: a promisingchemotherapy-free regimen for relapsed or refractory patients. Blood 2016;128:1.
41. A phase II, open-label study in subjects with BRAF V600E-mutated rare cancers with several histologies to investigate the clinical efficacy and safety of the combination therapy of dabrafenib and trametinib. 2017 [cited 2017 Oct 26]; NCT02034110. https://clinicaltrials.gov/ct2/show/NCT02034110.
42. Waterfall JJ, Arons E, Walker RL, et al. High prevalence of MAP2K1 mutations in variant and IGHV4-34-expressing hairy-cell leukemias. Nat Genet 2014;46:8–10.
43. Andritsos LA, Grieselhuber NR, Anghelina M, et al. Trametinib for the treatment of IGHV4-34, MAP2K1-mutant variant hairy cell leukemia. Leuk Lymphoma 2017 Sep 18:1–4.
44. Byrd JC, Furman RR, Coutre SE, et al. Three-year follow-up of treatment-naïve and previously treated patients with CLL and SLL receiving single-agent ibrutinib. Blood 2015;125:2497–506.
45. Kreitman RJ, Tallman MS, Robak T, et al. Phase I trial of anti-CD22 recombinant immunotoxin moxetumomab pasudotox (CAT-8015 or HA22) in patients with hairy cell leukemia. J Clin Oncol 2012;30:1822–8.
46. Saven A, Burian C, Adusumalli J, Koziol JA. Filgrastim for cladribine-induced neutropenic fever in patients with hairy cell leukemia. Blood 1999;93:2471–7.
47. Cornet E, Tomowiak C, Tanguy-Schmidt A, et al. Long-term follow-up and second malignancies in 487 patients with hairy cell leukaemia. Br J Haematol 2014;166:390–400.
48. Anderson LA, Engels EA. Autoimmune conditions and hairy cell leukemia: an exploratory case-control study. J Hematol Oncol 2010;3:35.
Introduction
Hairy cell leukemia (HCL) is a rare chronic lymphoproliferative disorder, with only approximately 2000 new cases diagnosed in the United States each year.1 It is now recognized that there are 2 distinct categories of HCL, classic HCL (cHCL) and variant HCL (vHCL), with vHCL now classified as a separate entity under the World Health Organization Classification of Hematopoietic Tumors.2 For this reason, the 2 diseases will be discussed separately. However, they do bear many clinical and microscopic similarities and because of this were originally indistinguishable using diagnostic techniques previously available. Even in the modern era using immunophenotypic, molecular, and genetic testing, differentiating between the classic and variant disease subtypes is sometimes difficult.
For cHCL the median age of diagnosis is 55 years, with vHCL occurring in patients who are somewhat older; HCL has been described only in the adult population, with 1 exception.3,4 There is a 4:1 male predominance, and Caucasians are more frequently affected than other ethnic groups. While the cause of the disease remains largely unknown, it has been observed to occur more frequently in farmers and in persons exposed to pesticides and/or herbicides, petroleum products, and ionizing radiation.4 The Institute of Medicine recently updated their position regarding veterans and Agent Orange, stating that there is sufficient evidence of an association between herbicides and chronic lymphoid leukemias (including HCL) to consider these diseases linked to exposure.5 Familial forms have also been described that are associated with specific HLA haplotypes, indicating a possible hereditary component.6 Most likely, a combination of environmental and genetic factors ultimately contributes to the development of HCL.
In recent years enormous progress has been made with respect to new insights into the biology of cHCL and vHCL, with significant refinement of diagnostic criteria. In addition, tremendous advances have occurred in both treatment and supportive care regimens, which have resulted in a dramatically increased overall life expectancy as well as decreased disease-related morbidity. This has meant that more patients are affected by HCL over time and are more likely to require care for relapsed HCL or associated comorbidities. Although no curative treatment options exist outside of allogeneic transplantation, therapeutic improvements have resulted in patients with cHCL having a life expectancy similar to that of unaffected patients, increasing the need for vigilance to prevent foreseeable complications.
Biology and Patheogenisis
The family of HCLs are chronic B-cell malignancies that account for approximately 2% of all diagnosed leukemias.7 The first detailed characterization of HCL as a distinct clinical entity was performed by Dr. Bouroncle and colleagues at the Ohio State University in 1958.8 Originally called leukemic reticuloendotheliosis, it was renamed HCL following more detailed description of the unique morphology of these malignant cells.9 Significant advances have recently been made in identifying distinctive genetic, immunophenotypic, and morphologic features that distinguish HCL from other B-cell malignancies.
HCL B cells tend to accumulate in the bone marrow, splenic red pulp, and (in some cases) peripheral blood. Unlike other lymphoproliferative disorders, HCL only rarely results in lymphadenopathy. HCL derives its name from the distinct appearance of the malignant hairy cells (Figure). Morphologically, HCL cells are mature, small lymphoid B-cells with a round or oval nucleus and abundant pale blue cytoplasm. Irregular projections of cytoplasm and microvilli give the cells a serrated, “hairy” appearance.10 The biological significance of these fine hair-like projections remains unknown and is an area of ongoing investigation. Gene expression profiling has revealed that HCL B cells are most similar to splenic marginal zone B cells and memory B cells.11–13 A recent analysis of common genetic alterations in HCL suggests that the cell of origin is in fact the hematopoietic stem cell.14
Compared to other hematologic malignancies, the genomic profile of HCL is relatively stable, with few chromosomal defects or translocations observed. A seminal study by Tiacci and colleagues revealed that the BRAF V600E mutation was present in 47 out of 47 cHCL cases examined, results that have since been replicated by other groups, confirming that BRAF V600E is a hallmark mutation in cHCL.15 The BRAF V600E gain-of-function mutation results in constitutive activation of the serine-threonine protein kinase B-Raf, which regulates the mitogen-activated protein kinase (MAPK)/RAF-MEK-ERK pathway. Indeed, cHCL B cells have elevated MAPK signaling, leading to enhancement of growth and survival.16 This specific mutation in the BRAF gene is also seen in a number of solid tumor malignancies including melanoma and thyroid cancer, and represents a therapeutic target using BRAF inhibitors already developed to treat these malignancies.17 Testing for BRAF V600E by polymerase chain reaction or immunohistochemical staining is now routinely performed when HCL is suspected.
While BRAF V600E is identified in nearly all cases of cHCL, it is rare in vHCL.18 The variant type of HCL was classified as a distinct clinical entity in 2008 and can now often be distinguished from cHCL on the basis of BRAF mutational status, among other differences. Interestingly, in the rare cases of BRAF V600E–negative cHCL, other mutations in BRAF or downstream targets as well as aberrant activation of the RAF-MEK-ERK signaling cascade are observed, indicating that this pathway is critical in HCL and may still represent a viable therapeutic target. Expression of the IGHV4-34 immunoglobulin rearrangement, while more common in vHCL, has also been identified in 10% of cHCL cases and appears to confer poor prognosis.19 Other mutated genes that have been identified in HCL include CDKN1B, TP53, U2AF1, ARID1A, EZH2, and KDM6A.20
Classic HCL is characterized by the immunophenotypic expression of CD11c, CD25, CD103, and CD123, with kappa or lambda light chain restriction indicating clonality; HCL B cells are generally negative for CD5, CD10, CD23, CD27, and CD79b. In contrast, vHCL often lacks expression of CD25 and CD123.18 The B-cell receptor (BCR) is expressed on hairy cells and its activation promotes proliferation and survival in vitro.21 The role of BCR signaling in B-cell malignancies is increasingly recognized, and therapies that target the BCR and associated signaling molecules offer an attractive treatment strategy.22 HCL B cells also typically express CD19, CD20, CD22, CD79a, CD200, CD1d, and annexin A1. Tartrate-resistant acid phosphatase (TRAP) positivity by immunohistochemistry is a hallmark of cHCL. Interestingly, changes to the patient’s original immunophenotype have been observed following treatment and upon disease recurrence, highlighting the importance of tracking immunophenotype throughout the course of disease.
Diagnosis
Prior to the advent of annual screening evaluations with routine examination of complete blood counts (CBC), patients were most often diagnosed with HCL when they presented with symptoms of the disease such as splenomegaly, infections, or complications of anemia or thrombocytopenia.23 In the current era, patients are more likely to be incidentally diagnosed when they are found to have an abnormal value on a CBC. Any blood lineage may be affected and patients may have pancytopenia or isolated cytopenias. Of note, monocytopenia is a common finding in cHCL that is not entirely understood. The cells typical of cHCL do not usually circulate in the peripheral blood, but if present would appear as mature lymphocytes with villous cytoplasmic projections, pale blue cytoplasm, and reniform nuclei with open chromatin (Figure).9 Even if the morphologic examination is highly suggestive of HCL, additional testing is required to differentiate between cHCL, vHCL, and other hematologic malignancies which may also have cytoplasmic projections. A complete assessment of the immunophenotype, molecular profile, and cytogenetic features is required to arrive at this diagnosis.
The international Hairy Cell Leukemia Foundation recently published consensus guidelines for the diagnosis and treatment of HCL.24 These guidelines recommend that patients undergo examination of the peripheral blood for morphology and immunophenotyping and further recommend obtaining bone marrow core and aspirate biopsy samples for immunophenotyping via immunohistochemical staining and flow cytometry. The characteristic immunophenotype of cHCL is a population of monoclonal B lymphocytes which co-express CD19, CD20, CD11c, CD25, CD103, and CD123. Variant HCL is characterized by a very similar immunophenotype but is usually negative for CD25 and CD123. It is notable that CD25 positivity may be lost following treatment, and the absence of this marker should not be used as the sole basis of a cHCL versus vHCL diagnosis. Because marrow fibrosis in HCL may prevent a marrow aspirate from being obtained, many of the key diagnostic studies are performed on the core biopsy, including morphological evaluation and immunohistochemical stains such as CD20 (a pan-B cell antigen), annexin-1 (an anti-inflammatory protein expressed only in cHCL), and VE1 (a BRAF V600E stain).
As noted above, recurrent cytogenetic abnormalities have now been identified that may inform the diagnosis or prognosis of HCL. Next-generation sequencing and other testing of the genetic landscape are taking on a larger role in subtype differentiation, and it is likely that future guidelines will recommend evaluation for significant mutations. Given that BRAF V600E mutation status is a key feature of cHCL and is absent in vHCL, it is important to perform this testing at the time of diagnosis whenever possible. The mutation may be detected via VE1 immunohistochemical staining, allele-specific polymerase chain reaction, or next-generation sequencing. Other less sensitive tests exist but are utilized less frequently.
Minimal Residual Disease
There is currently no accepted standard for minimal residual disease (MRD) monitoring in HCL. While detection of MRD has been clearly associated with increased risk of disease progression, cHCL cells typically do not circulate in the peripheral blood, limiting the use of peripheral blood immunophenotyping for quantitative MRD assessment. For quantitative monitoring of marrow involvement by HCL, immunohistochemical staining of the bone marrow core biopsy is usually required. Staining may be performed for CD20, or, in patients who have received anti-CD20 therapy, DBA.44, VE-1, or CD79a. There is currently not a consensus regarding what level of disease involvement constitutes MRD. One group studied this issue and found that relapse could be predicted by evaluating MRD by percentage of positive cells in the marrow by immunohistochemical staining, with less than 1% involvement having the lowest risk for disease relapse and greater than 5% having the highest risk for disease relapse.25 A recent study evaluated MRD patterns in the peripheral blood of 32 cHCL patients who had completed frontline therapy. This group performed flow cytometry on the peripheral blood of patients at 1, 3, 6, and 12 months following therapy. All patients had achieved a complete response with initial therapy and peripheral blood MRD negativity at the completion of therapy. At a median follow-up of 100 months post therapy, 5 patients converted from peripheral blood–MRD negative to peripheral blood–MRD positive, and 6 patients developed overt disease progression. In all patients who progressed, progression was preceded by an increase in detectable peripheral blood MRD cells.26 Although larger studies are needed, peripheral blood flow cytometric monitoring for MRD may be a useful adjunct to predict ongoing response or impending relapse. In addition, newer, more sensitive methods of disease monitoring may ultimately supplant flow cytometry.
Risk Stratification
Although much progress has been made in the risk stratification profiling of hematologic malignancies in general, HCL has unfortunately lagged behind in this effort. The most recent risk stratification analysis was performed in 1982 by Jansen and colleagues.27 This group of researchers performed a retrospective analysis of 391 HCL patients treated at 22 centers. One of the central questions in their analysis was survival time from diagnosis in patients who had not yet undergone splenectomy (a standard treatment at the time). This group consisted of a total of 154 patients. As this study predated modern pathological and molecular testing, clinical and laboratory features were examined, and these mostly consisted of physical exam findings and analysis of the peripheral blood. This group found that several factors influenced the survival of these patients, including duration of symptoms prior to diagnosis, the degree of splenomegaly, hemoglobin level, and number of hairy cells in the peripheral blood. However, because of interobserver variation for the majority of these variables, only hemoglobin and spleen size were included in the proportional hazard model. Using only these 2 variables, the authors were able to determine 3 clinical stages for HCL (Table 1). The stages were found to correlate with median survival: patients with stage 1 disease had a median survival not reached at 72 months, but patients with stage 2 disease had a median survival of 18 months, which decreased to only 12 months in patients with stage 3 disease.
Because the majority of patients with HCL in the modern era will be diagnosed prior to reaching stage 3, a risk stratification system incorporating clinical features, laboratory parameters, and molecular and genetic testing is of considerable interest and is a subject of ongoing research. Ultimately, the goal will be to identify patients at higher risk of early relapse so that more intensive therapies can be applied to initial treatment that will result in longer treatment-free intervals.
Treatment
Because there is no curative treatment for either cHCL or vHCL outside allogeneic transplantation, and it is not clear that early treatment leads to better outcomes in HCL, patients do not always receive treatment at the time of diagnosis or relapse. The general consensus is that patients should be treated if there is a declining trend in hematologic parameters or they experience symptoms from the disease.24 Current consensus guidelines recommend treatment when any of the following hematologic parameters are met: hemoglobin less than 11 g/dL, platelet count less than 100 × 103/µL, or absolute neutrophil count less than 1000/µL.24 These parameters are surrogate markers that indicate compromised bone marrow function. Cytopenias may also be caused by splenomegaly, and symptomatic splenomegaly with or without cytopenias is an indication for treatment. A small number of patients with HCL (approximately 10%) do not require immediate therapy after diagnosis and are monitored by their provider until treatment is indicated.
First-Line Therapy
Despite advances in targeted therapies for HCL, because no treatment has been shown to extend the treatment-free interval longer than chemotherapy, treatment with a purine nucleoside analog is usually the recommended first-line therapy. This includes either cladribine or pentostatin. Both agents appear to be equally effective, and the choice of therapy is determined by the treating physician based on his or her experience. Cladribine administration has been studied using a number of different schedules and routes: intravenous continuous infusion (0.1 mg/kg) for 7 days, intravenous infusion (0.14 mg/kg/day) over 2 hours on a 5-day regimen, or alternatively subcutaneously (0.1–0.14 mg/kg/day) on a once-per-day or once-per-week regimen (Table 2).28,29
Unlike cHCL, vHCL remains difficult to treat and early disease progression is common. The best outcomes have been seen in patients who have received combination chemo-immunotherapy such as purine nucleoside analog therapy plus rituximab or bendamustine plus rituximab.31 One pilot study of bendamustine plus rituximab in 12 patients found an overall response rate of 100%, with the majority of patients achieving a complete response.31 For patients who achieved a complete response, the median duration of response had not been reached, but patients achieving only a partial response had a median duration of response of only 20 months, indicating there is a subgroup of patients who will require a different treatment approach.32 A randomized phase 2 trial of rituximab with either pentostatin or bendamustine is ongoing.33
Assessment of Response
Response assessment involves physical examination for estimation of spleen size, assessment of hematologic parameters, and a bone marrow biopsy for evaluation of marrow response. It is recommended that the bone marrow biopsy be performed 4 to 6 months following cladribine administration, or after completion of 12 doses of pentostatin. Detailed response assessment criteria are shown in Table 3.
Second-Line Therapy
Although the majority of patients treated with purine analogs will achieve durable remissions, approximately 40% of patients will eventually require second-line therapy. Criteria for treatment at relapse are the same as the criteria for initial therapy, including symptomatic disease or progressive anemia, thrombocytopenia, or neutropenia. The choice of treatment is based on clinical parameters and the duration of the previous remission. If the initial remission was longer than 65 months and the patient is eligible to receive chemotherapy, re-treatment with initial therapy is recommended. For a remission between 24 and 65 months, re-treatment with a purine analog combined with an anti-CD20 monoclonal antibody may be considered.34 If the first remission is shorter than 24 months, confirmation of the original diagnosis as well as consideration for testing for additional mutations with therapeutic targets (BRAF V600E, MAP2K1) should be considered before a treatment decision is made. For these patients, alternative therapies, including investigational agents, should be considered.24
Monoclonal antibody therapy has been studied in both the up-front setting and in relapsed or refractory HCL.35 An initial study of 15 patients with relapsed HCL found an overall response rate of 80%, with 8 patients achieving a complete response. A subsequent study of 26 patients who relapsed after cladribine therapy found an overall response rate of 80%, with a complete response rate of 32%. Median relapse-free survival was 27 months.36 Ravandi and others studied rituximab in the up-front setting in combination with cladribine, and found an overall response rate of 100%, including in patients with vHCL. At the time of publication of the study results, the median survival had not been reached.37 As has been seen with other lymphoid malignancies, concurrent therapy with rituximab appears to enhance the activity of the agent with which it is combined. While its use in the up-front setting remains an area of active investigation, there is a clear role for chemo-immunotherapy in the relapsed setting.
In patients with cHCL, excellent results including complete remissions have been reported with the use of BRAF inhibitors, both as a single agent and when combined with anti-CD20 therapy. The 2 commercially available BRAF inhibitors are vemurafenib and dabrafenib, and both have been tested in relapsed cHCL.38,39 The first study of vemurafenib was reported by Tiacci and colleagues, who found an overall response rate of 96% after a median of 8 weeks and a 100% response rate after a median of 12 weeks, with complete response rates up to 42%.38 The median relapse-free survival was 23 months (decreasing to only 6 months in patients who achieved only a partial remission), indicating that these agents will likely need to be administered in combination with other effective therapies with non-overlapping toxicities. Vemurafenib has been administered concurrently with rituximab, and preliminary results of this combination therapy showed early rates of complete responses.40 Dabrafenib has been reported for use as a single agent in cHCL and clinical trials are underway evaluating its efficacy when administered with trametinib, a MEK inhibitor.39,41 Of note, patients receiving BRAF inhibitors frequently develop cutaneous complications of RAF inhibition including cutaneous squamous cell carcinomas and keratoacanthomas, and close dermatologic surveillance is required.
Variant HCL does not harbor the BRAF V600E mutation, but up to half of patients have been found to have mutations of MAP2K1, which upregulates MEK1 expression.42 Trametinib is approved by the US Food and Drug Administration for the treatment of patients with melanoma at a dose of 2 mg orally daily, and has been successfully used to treat 1 patient with vHCL.43 Further evaluation of this targeted therapy is underway.
Ibrutinib, a Bruton tyrosine kinase inhibitor, and moxetumomab pasudotox, an immunotoxin conjugate, are currently being studied in National Institutes of Health–sponsored multi-institutional trials for patients with HCL. Ibrutinib is administered orally at 420 mg per day until relapse.44 Moxetumomab pasudotox was tested at different doses between 5 and 50 μg/kg intravenously every other day for 3 doses for up to 16 cycles unless they experienced disease progression or developed neutralizing antibodies.45 Both agents have been shown to have significant activity in cHCL and vHCL and will likely be included in the treatment armamentarium once trials are completed. Second-line therapy options are summarized in Table 4.
Complications and Supportive Care
The complications of HCL may be separated into the pre-, intra-, and post-treatment periods. At the time of diagnosis and prior to the initiation of therapy, marrow infiltration by HCL frequently leads to cytopenias which cause symptomatic anemia, infection, and/or bleeding complications. Many patients develop splenomegaly, which may further lower the blood counts and which is experienced as abdominal fullness or distention, with early satiety leading to weight loss. Patients may also experience constitutional symptoms with fatigue, fevers in the absence of infection, and unintentional weight loss even without splenomegaly.
For patients who initiate therapy with purine nucleoside analogs, the early part of treatment is associated with the greatest risk of morbidity and mortality. Chemotherapy leads to both immunosuppression (altered cellular immunity) as well as myelosuppression. Thus, patients who are already in need of treatment because of disease-related cytopenias will experience an abrupt and sometimes significant decline in the peripheral blood counts. The treatment period prior to recovery of neutrophils requires the greatest vigilance. Because patients are profoundly immunocompromised, febrile neutropenia is a common complication leading to hospital admission and the cause is often difficult to identify. Treatment with broad-spectrum antibiotics, investigation for opportunistic and viral infections, and considerations for antifungal prophylaxis or therapy are required in this setting. It is recommended that all patients treated with purine nucleoside analogs receive prophylactic antimicrobials for herpes simplex virus and varicella zoster virus, as well as prophylaxis against Pneumocystis jirovecii. Unfortunately, growth factor support has not proven successful in this patient population but is not contraindicated.46
Following successful completion of therapy, patients may remain functionally immunocompromised for a significant period of time even with a normal neutrophil count. Monitoring of the CD4 count may help to determine when prophylactic antimicrobials may be discontinued. A CD4 count greater than 200 cells/µL is generally considered to be adequate for prevention of opportunistic infections. Although immunizations have not been well studied in HCL, it is recommended that patients receive annual influenza immunizations as well as age-appropriate immunizations against Streptococcus pneumoniae and other infectious illnesses as indicated. Live viral vaccines such as the currently available herpes zoster vaccine can lead to infections in this patient population and are not recommended.
Like many hematologic malignancies, HCL may be associated with comorbid conditions related to immune dysfunction. There is a known association with an increased risk of second primary malignancies, which may predate the diagnosis of HCL.47 Therefore, it is recommended that patients continue annual cancer screenings as well as undergo prompt evaluation for potential symptoms of second malignancies. In addition, it is thought that there may be an increased risk for autoimmune disorders such as inflammatory arthritis or immune-mediated cytopenias. One case-control study found a possible association between autoimmune diseases and HCL, noting that at times these diseases are diagnosed concurrently.48 However, because of the rarity of the disease it has been difficult to quantify these associated conditions in a systematic way. There is currently an international patient data registry under development for the systematic study of HCL and its complications which may answer many of these questions.
Survivorship and quality of life are important considerations in chronic diseases. It is not uncommon for patients to develop anxiety related to the trauma of diagnosis and treatment, especially when intensive care has been required. Patients may have lingering fears regarding concerns of developing infections due to exposure to ill persons or fears regarding risk of relapse and need for re-treatment. A proactive approach with partnership with psychosocial oncology may be of benefit, especially when symptoms of post-traumatic stress disorder are evident.
Conclusion
HCL is a rare, chronic lymphoid malignancy that is now subclassified into classic and variant HCL. Further investigations into the disease subtypes will allow more precise disease definitions, and these studies are underway. Renewed efforts toward updated risk stratification and clinical staging systems will be important aspects of these investigations. Refinements in treatment and supportive care have resulted in greatly improved overall survival, which has translated into larger numbers of people living with HCL. However, new treatment paradigms for vHCL are needed as the progression-free survival in this disease remains significantly lower than that of cHCL. Future efforts toward understanding survivorship issues and management of long-term treatment and disease-related complications will be critical for ensuring good quality of life for patients living with HCL.
1. Teras LR, Desantis DE, Cerhan JR, et al. 2016 US lymphoid malignancy statistics by World Health Organization subtypes. CA Cancer J Clin 2016;66:443–59.
2. Swerdlow SH, Campo E, Harris NL, et al. WHO classification of tumours of haematopoietic and lymphoid tissues. 4th ed. Lyon, France: IARC; 2008.
3. Yetgin S, Olcay L, Yenicesu I, et al. Relapse in hairy cell leukemia due to isolated nodular skin infiltration. Pediatr Hematol Oncol 2001;18:415–7.
4. Tadmor T, Polliack A. Epidemiology and environmental risk in hairy cell leukemia. Best Pract Res Clin Haematol 2015;28:175–9.
5. Veterans and agent orange: update 2014. Mil Med 2017;182:1619–20.
6. Villemagne B, Bay JO, Tournilhac O, et al. Two new cases of familial hairy cell leukemia associated with HLA haplotypes A2, B7, Bw4, Bw6. Leuk Lymphoma 2005;46:243–5.
7. Chandran R, Gardiner SK, Smith SD, Spurgeon SE. Improved survival in hairy cell leukaemia over three decades: a SEER database analysis of prognostic factors. Br J Haematol 2013;163:407–9.
8. Bouroncle BA, Wiseman BK, Doan CA. Leukemic reticuloendotheliosis. Blood 1958;13:609–30.
9. Schrek R, Donnelly WJ. “Hairy” cells in blood in lymphoreticular neoplastic disease and “flagellated” cells of normal lymph nodes. Blood 1966;27:199–211.
10. Polliack A, Tadmor T. Surface topography of hairy cell leukemia cells compared to other leukemias as seen by scanning electron microscopy. Leuk Lymphoma 2011;52 Suppl 2:14–7.
11. Miranda RN, Cousar JB, Hammer RD, et al. Somatic mutation analysis of IgH variable regions reveals that tumor cells of most parafollicular (monocytoid) B-cell lymphoma, splenic marginal zone B-cell lymphoma, and some hairy cell leukemia are composed of memory B lymphocytes. Hum Pathol 1999;30:306–12.
12. Vanhentenrijk V, Tierens A, Wlodarska I, et al. V(H) gene analysis of hairy cell leukemia reveals a homogeneous mutation status and suggests its marginal zone B-cell origin. Leukemia 2004;18:1729–32.
13. Basso K, Liso A, Tiacci E, et al. Gene expression profiling of hairy cell leukemia reveals a phenotype related to memory B cells with altered expression of chemokine and adhesion receptors. J Exp Med 2004;199:59–68.
14. Chung SS, Kim E, Park JH, et al. Hematopoietic stem cell origin of BRAFV600E mutations in hairy cell leukemia. Sci Transl Med 2014;6:238ra71.
15. Tiacci E, Trifonov V, Schiavoni G, et al. BRAF mutations in hairy-cell leukemia. N Engl J Med 2011;364:2305–15.
16. Kamiguti AS, Harris RJ, Slupsky JR, et al. Regulation of hairy-cell survival through constitutive activation of mitogen-activated protein kinase pathways. Oncogene 2003;22:2272–84.
17. Rahman MA, Salajegheh A, Smith RA, Lam AK. BRAF inhibitors: From the laboratory to clinical trials. Crit Rev Oncol Hematol 2014;90:220–32.
18. Shao H, Calvo KR, Gronborg M, et al. Distinguishing hairy cell leukemia variant from hairy cell leukemia: development and validation of diagnostic criteria. Leuk Res 2013;37:401–9.
19. Xi L, Arons E, Navarro W, et al. Both variant and IGHV4-34-expressing hairy cell leukemia lack the BRAF V600E mutation. Blood 2012;119:3330–2.
20. Jain P, Pemmaraju N, Ravandi F. Update on the biology and treatment options for hairy cell leukemia. Curr Treat Options Oncol 2014;15:187–209.
21. Sivina M, Kreitman RJ, Arons E, et al. The bruton tyrosine kinase inhibitor ibrutinib (PCI-32765) blocks hairy cell leukaemia survival, proliferation and B cell receptor signalling: a new therapeutic approach. Br J Haematol 2014;166:177–88.
22. Jaglowski SM, Jones JA, Nagar V, et al. Safety and activity of BTK inhibitor ibrutinib combined with ofatumumab in chronic lymphocytic leukemia: a phase 1b/2 study. Blood 2015;126:842–50.
23. Andritsos LA, Grever MR. Historical overview of hairy cell leukemia. Best Pract Res Clin Haematol 2015;28:166–74.
24. Grever MR, Abdel-Wahab O, Andritsos LA, et al. Consensus guidelines for the diagnosis and management of patients with classic hairy cell leukemia. Blood 2017;129:553–60.
25. Mhawech-Fauceglia P, Oberholzer M, Aschenafi S, et al. Potential predictive patterns of minimal residual disease detected by immunohistochemistry on bone marrow biopsy specimens during a long-term follow-up in patients treated with cladribine for hairy cell leukemia. Arch Pathol Lab Med 2006;130:374–7.
26. Ortiz-Maldonado V, Villamor N, Baumann T, et al., Is there a role for minimal residual disease monitoring in the management of patients with hairy-cell leukaemia? Br J Haematol 2017 Aug 18.
27. Jansen J, Hermans J. Clinical staging system for hairy-cell leukemia. Blood 1982;60:571–7.
28. Grever MR, Lozanski G. Modern strategies for hairy cell leukemia. J Clin Oncol 2011;29:583–90.
29. Ravandi F, O’Brien S, Jorgensen J, et al. Phase 2 study of cladribine followed by rituximab in patients with hairy cell leukemia. Blood 2011;118:3818–23.
30. Grever M, Kopecky K, Foucar MK, et al. Randomized comparison of pentostatin versus interferon alfa-2a in previously untreated patients with hairy cell leukemia: an intergroup study. J Clin Oncol 1995;13:974–82.
31. Kreitman RJ, Wilson W, Calvo KR, et al. Cladribine with immediate rituximab for the treatment of patients with variant hairy cell leukemia. Clin Cancer Res 2013;19:6873–81.
32. Burotto M, Stetler-Stevenson M, Arons E, et al. Bendamustine and rituximab in relapsed and refractory hairy cell leukemia. Clin Cancer Res 2013;19:6313–21.
33. Randomized phase II trial of rituximab with either pentostatin or bendamustine for multiply relapsed or refractory hairy cell leukemia. 2017 [cited 2017 Oct 26]; NCT01059786. https://clinicaltrials.gov/ct2/show/NCT01059786.
34. Else M, Dearden CE, Matutes E, et al. Rituximab with pentostatin or cladribine: an effective combination treatment for hairy cell leukemia after disease recurrence. Leuk Lymphoma 2011;52 Suppl 2:75–8.
35. Thomas DA, O’Brien S, Bueso-Ramos C, et al. Rituximab in relapsed or refractory hairy cell leukemia. Blood 2003;102:3906–11.
36. Zenhäusern R, Simcock M, Gratwohl A, et al. Rituximab in patients with hairy cell leukemia relapsing after treatment with 2-chlorodeoxyadenosine (SAKK 31/98). Haematologica 2008;93(9):1426–8.
37. Ravandi F, O’Brien S, Jorgensen J, et al. Phase 2 study of cladribine followed by rituximab in patients with hairy cell leukemia. Blood 2011;118:3818–23.
38. Tiacci E, Park JH, De Carolis L, et al. Targeting mutant BRAF in relapsed or refractory hairy-cell leukemia. N Engl J Med 2015;373:1733–47.
39. Blachly JS, Lozanski G, Lucas DM, et al. Cotreatment of hairy cell leukemia and melanoma with the BRAF inhibitor dabrafenib. J Natl Compr Canc Netw 2015;13:9–13.
40. Tiacci E, De Carolis L, Zaja F, et al. Vemurafenib plus rituximab in hairy cell leukemia: a promisingchemotherapy-free regimen for relapsed or refractory patients. Blood 2016;128:1.
41. A phase II, open-label study in subjects with BRAF V600E-mutated rare cancers with several histologies to investigate the clinical efficacy and safety of the combination therapy of dabrafenib and trametinib. 2017 [cited 2017 Oct 26]; NCT02034110. https://clinicaltrials.gov/ct2/show/NCT02034110.
42. Waterfall JJ, Arons E, Walker RL, et al. High prevalence of MAP2K1 mutations in variant and IGHV4-34-expressing hairy-cell leukemias. Nat Genet 2014;46:8–10.
43. Andritsos LA, Grieselhuber NR, Anghelina M, et al. Trametinib for the treatment of IGHV4-34, MAP2K1-mutant variant hairy cell leukemia. Leuk Lymphoma 2017 Sep 18:1–4.
44. Byrd JC, Furman RR, Coutre SE, et al. Three-year follow-up of treatment-naïve and previously treated patients with CLL and SLL receiving single-agent ibrutinib. Blood 2015;125:2497–506.
45. Kreitman RJ, Tallman MS, Robak T, et al. Phase I trial of anti-CD22 recombinant immunotoxin moxetumomab pasudotox (CAT-8015 or HA22) in patients with hairy cell leukemia. J Clin Oncol 2012;30:1822–8.
46. Saven A, Burian C, Adusumalli J, Koziol JA. Filgrastim for cladribine-induced neutropenic fever in patients with hairy cell leukemia. Blood 1999;93:2471–7.
47. Cornet E, Tomowiak C, Tanguy-Schmidt A, et al. Long-term follow-up and second malignancies in 487 patients with hairy cell leukaemia. Br J Haematol 2014;166:390–400.
48. Anderson LA, Engels EA. Autoimmune conditions and hairy cell leukemia: an exploratory case-control study. J Hematol Oncol 2010;3:35.
Genomic Testing in Women with Early-Stage Hormone Receptor–Positive, HER2-Negative Breast Cancer
Introduction
Over the past several decades, while the incidence of breast cancer has increased, breast cancer mortality has decreased. This decrease is likely due to both early detection and advances in systemic therapy. However, with more widespread use of screening mammography, there are increasing concerns about potential overdiagnosis of cancer.1 One key challenge is that breast cancer is a heterogeneous disease. Improved tools for determining breast cancer biology can help physicians individualize treatments. Patients with low-risk cancers can be approached with less aggressive treatments, thus preventing unnecessary toxicities, while those with higher-risk cancers remain treated appropriately with more aggressive therapies.
Traditionally, adjuvant chemotherapy was recommended based on tumor features such as stage (tumor size, regional nodal involvement), grade, expression of hormone receptors (estrogen receptor [ER] and progesterone receptor [PR]) and human epidermal growth factor receptor-2 (HER2), and patient features (age, menopausal status). However, this approach is not accurate enough to guide individualized treatment approaches, which are based on the risk for recurrence and the reduction in this risk that can be achieved with various systemic treatments. In particular, women with low-risk hormone receptor (HR)–positive, HER2-negative breast cancers could be spared the toxicities of cytotoxic chemotherapies without compromising the prognosis.
Beyond chemotherapy, endocrine therapies also have risks, especially when given over extended periods of time. Recently, extended endocrine therapy has been shown to prevent late recurrences of HR-positive breast cancers. In the National Cancer Institute of Canada Clinical Trials Group’s MA.17R study, extended endocrine therapy with letrozole for a total of 10 years (beyond 5 years of an aromatase inhibitor [AI]) decreased the risk for breast cancer recurrence or the occurrence of contralateral breast cancer by 34%.2 However, the overall survival was similar between the 2 groups and the disease-free survival benefits were not confirmed in other studies.3–5 Identifying the subgroup of patients who benefit from this extended AI therapy is important in the era of personalized medicine. Several tumor genomic assays have been developed to provide additional prognostic and predictive information with the goal of individualizing adjuvant therapies for breast cancer. Although assays are also being evaluated in HER2-positive and triple-negative breast cancer, this review will focus on HR-positive, HER2-negative breast cancer.
Tests for Guiding Adjuvant Chemotherapy Decisions
Case Study
Initial Presentation
A 54-year-old postmenopausal woman with no significant past medical history presents with an abnormal screening mammogram, which shows a focal asymmetry in the 10 o’clock position at middle depth of the left breast. Further work-up with a diagnostic mammogram and ultrasound of the left breast shows a suspicious hypoechoic solid mass with irregular margins measuring 17 mm. The patient undergoes an ultrasound-guided core needle biopsy of the suspicious mass, the results of which are consistent with an invasive ductal carcinoma, Nottingham grade 2, ER strongly positive (95%), PR weakly positive (5%), HER2-negative, and Ki-67 of 15%. She undergoes a left partial mastectomy and sentinel lymph node biopsy, with final pathology demonstrating a single focus of invasive ductal carcinoma, measuring 2.2 cm in greatest dimension with no evidence of lymphovascular invasion. Margins are clear and 2 sentinel lymph nodes are negative for metastatic disease (final pathologic stage IIA, pT2 pN0 cM0). She is referred to medical oncology to discuss adjuvant systemic therapy.
- Can additional testing be used to determine prognosis and guide systemic therapy recommendations for early-stage HR-positive/HER2-negative breast cancer?
After a diagnosis of early-stage breast cancer, the key clinical question faced by the patient and medical oncologist is: what is the individual’s risk for a metastatic breast cancer recurrence and thus the risk for death due to breast cancer? Once the risk for recurrence is established, systemic adjuvant chemotherapy, endocrine therapy, and/or HER2-directed therapy are considered based on the receptor status (ER/PR and HER2) to reduce this risk. HR-positive, HER2-negative breast cancer is the most common type of breast cancer. Although adjuvant endocrine therapy has significantly reduced the risk for recurrence and improved survival for patients with HR-positive breast cancer,6 the role of adjuvant chemotherapy for this subset of breast cancer remains unclear. Prior to genomic testing, the recommendation for adjuvant chemotherapy for HR-positive/HER2-negative tumors was primarily based on patient age and tumor stage and grade. However, chemotherapy overtreatment remained a concern given the potential short- and long-term risks of chemotherapy. Further studies into HR-positive/HER2-negative tumors have shown that these tumors can be divided into 2 main subtypes, luminal A and luminal B.7 These subtypes represent unique biology and differ in terms of prognosis and response to endocrine therapy and chemotherapy. Luminal A tumors are strongly endocrine responsive and have a good prognosis, while luminal B tumors are less endocrine responsive and are associated with a poorer prognosis; the addition of adjuvant chemotherapy is often considered for luminal B tumors.8 Several tests, including tumor genomic assays, are now available to help with delineating the tumor subtype and aid in decision-making regarding adjuvant chemotherapy for HR-positive/HER2-negative breast cancers.
Ki-67 Assays, Including IHC4 and PEPI
Proliferation is a hallmark of cancer cells.9 Ki-67, a nuclear nonhistone protein whose expression varies in intensity throughout the cell cycle, has been used as a measurement of tumor cell proliferation.10 Two large meta-analyses have demonstrated that high Ki-67 expression in breast tumors is independently associated with worse disease-free and overall survival rates.11,12 Ki-67 expression has also been used to classify HR-positive tumors as luminal A or B. After classifying tumor subtypes based on intrinsic gene expression profiling, Cheang and colleagues determined that a Ki-67 cut point of 13.25% differentiated luminal A and B tumors.13 However, the ideal cut point for Ki-67 remains unclear, as the sensitivity and specificity in this study was 77% and 78%, respectively. Others have combined Ki-67 with standard ER, PR, and HER2 testing. This immunohistochemical 4 (IHC4) score, which weighs each of these variables, was validated in postmenopausal patients from the ATAC (Arimidex, Tamoxifen, Alone or in Combination) trial who had ER-positive tumors and did not receive chemotherapy.14 The prognostic information from the IHC4 was similar to that seen with the 21-gene recurrence score (Oncotype DX), which is discussed later in this article. The key challenge with Ki-67 testing currently is the lack of a validated test methodology and intra-observer variability in interpreting the Ki-67 results.15 Recent series have suggested that Ki-67 be considered as a continuous marker rather than a set cut point.16 These issues continue to impact the clinical utility of Ki-67 for decision-making for adjuvant chemotherapy.
Ki-67 and the preoperative endocrine prognostic index (PEPI) score have been explored in the neoadjuvant setting to separate postmenopausal women with endocrine-sensitive versus intrinsically resistant disease and identify patients at risk for recurrent disease.17 The on-treatment levels of Ki-67 in response to endocrine therapy have been shown to be more prognostic than baseline values, and a decrease in Ki-67 as early as 2 weeks after initiation of neoadjuvant endocrine therapy is associated with endocrine-sensitive tumors and improved outcome. The PEPI score was developed through retrospective analysis of the P024 trial18 to evaluate the relationship between post-neoadjuvant endocrine therapy tumor characteristics and risk for early relapse. The score was subsequently validated in an independent data set from the IMPACT (Immediate Preoperative Anastrozole, Tamoxifen, or Combined with Tamoxifen) trial.19 Patients with low pathological stage (0 or 1) and a favorable biomarker profile (PEPI score 0) at surgery had the best prognosis in the absence of chemotherapy. On the other hand, higher pathological stage at surgery and a poor biomarker profile with loss of ER positivity or persistently elevated Ki-67 (PEPI score of 3) identified de novo endocrine-resistant tumors that are higher risk for early relapse.20 The ongoing Alliance A011106 ALTERNATE trial (ALTernate approaches for clinical stage II or III Estrogen Receptor positive breast cancer NeoAdjuvant TrEatment in postmenopausal women, NCT01953588) is a phase 3 study to prospectively test this hypothesis.
21-Gene Recurrence Score (Onco type DX Assay)
The 21-gene Oncotype DX assay is conducted on paraffin-embedded tumor tissue and measures the expression of 16 cancer related genes and 5 reference genes using quantitative polymerase chain reaction (PCR). The genes included in this assay are mainly related to proliferation (including Ki-67), invasion, and HER2 or estrogen signaling.21 Originally, the 21-gene recurrence score assay was analyzed as a prognostic biomarker tool in a prospective-retrospective biomarker substudy of the National Surgical Adjuvant Breast and Bowel Project (NSABP) B-14 clinical trial in which patients with node-negative, ER-positive tumors were randomly assigned to receive tamoxifen or placebo without chemotherapy.22 Using the standard reported values of low risk (< 18), intermediate risk (18–30), or high risk (≥ 31) for recurrence, among the tamoxifen-treated patients, cancers with a high-risk recurrence score had a significantly worse rate of distant recurrence and overall survival.21 Inferior breast cancer survival in cancers with a high recurrence score was also confirmed in other series of endocrine-treated patients with node-negative and node-positive disease.23–25
The predictive utility of the 21-gene recurrence score for endocrine therapy has also been evaluated. A comparison of the placebo- and tamoxifen-treated patients from the NSABP B-14 trial demonstrated that the 21-gene recurrence score predicted benefit from tamoxifen in cancers with low- or intermediate-risk recurrence scores.26 However, there was no benefit from the use of tamoxifen over placebo in cancers with high-risk recurrence scores. To date, this intriguing data has not been prospectively confirmed, and thus the 21-gene recurrence score is not used to avoid endocrine therapy.
The 21-gene recurrence score is primarily used by oncologists to aid in decision-making regarding adjuvant chemotherapy in patients with node-negative and node-positive (with up to 3 positive lymph nodes), HR-positive/HER2-negative breast cancers. The predictive utility of the 21-gene recurrence score for adjuvant chemotherapy was initially tested using tumor samples from the NSABP B-20 study. This study initially compared adjuvant tamoxifen alone with tamoxifen plus chemotherapy in patients with node-negative, HR-positive tumors. The prospective-retrospective biomarker analysis showed that the patients with high-risk 21-gene recurrence scores benefited from the addition of chemotherapy, whereas those with low or intermediate risk did not have an improved freedom from distant recurrence with chemotherapy.27 Similarly, an analysis from the prospective phase 3 Southwest Oncology Group (SWOG) 8814 trial comparing tamoxifen to tamoxifen with chemotherapy showed that for node-positive tumors, chemotherapy benefit was only seen in those with high 21-gene recurrence scores.24
Prospective studies are now starting to report results regarding the predictive role of the 21-gene recurrence score. The TAILORx (Trial Assigning Individualized Options for Treatment) trial includes women with node-negative, HR-positive/HER2-negative tumors measuring 0.6 to 5 cm. All patients were treated with standard-of-care endocrine therapy for at least 5 years. Chemotherapy was determined based on the 21-gene recurrence score results on the primary tumor. The 21-gene recurrence score cutoffs were changed to low (0–10), intermediate (11–25), and high (≥ 26). Patients with scores of 26 or higher were treated with chemotherapy, and those with intermediate scores were randomly assigned to chemotherapy or no chemotherapy; results from this cohort are still pending. However, excellent breast cancer outcomes with endocrine therapy alone were reported from the 1626 (15.9% of total cohort) prospectively followed patients with low recurrence score tumors. The 5-year invasive disease-free survival was 93.8%, with overall survival of 98%.28 Given that 5 years is appropriate follow-up to see any chemotherapy benefit, this data supports the recommendation for no chemotherapy in this cohort of patients with very low 21-gene recurrence scores.
The RxPONDER (Rx for Positive Node, Endocrine Responsive Breast Cancer) trial is evaluating women with 1 to 3 node-positive, HR-positive, HER2-negative tumors. In this trial, patients with 21-gene recurrence scores of 0 to 25 were assigned to adjuvant chemotherapy or none. Those with scores of 26 or higher were assigned to chemotherapy. All patients received standard adjuvant endocrine therapy. This study has completed accrual and results are pending. Of note, TAILORx and RxPONDER did not investigate the potential lack of benefit of endocrine therapy in cancers with high recurrence scores. Furthermore, despite data suggesting that chemotherapy may not even benefit women with 4 or more nodes involved but who have a low recurrence score,24 due to the lack of prospective data in this cohort and the quite high risk for distant recurrence, chemotherapy continues to be the standard of care for these patients.
PAM50 (Breast Cancer Prognostic Gene Signature)
Using microarray and quantitative reverse transcriptase PCR (RT-PCR) on formalin-fixed paraffin-embedded (FFPE) tissues, the Breast Cancer Prognostic Gene Signature (PAM50) assay was initially developed to identify intrinsic breast cancer subtypes, including luminal A, luminal B, HER2-enriched, and basal-like.7,29 Based on the prediction analysis of microarray (PAM) method, the assay measures the expression levels of 50 genes, provides a risk category (low, intermediate, and high), and generates a numerical risk of recurrence score (ROR). The intrinsic subtype and ROR have been shown to add significant prognostic value to the clinicopathological characteristics of tumors. Clinical validity of PAM50 was evaluated in postmenopausal women with HR-positive early-stage breast cancer treated in the prospective ATAC and ABCSG-8 (Austrian Breast and Colorectal Cancer Study Group 8) trials.30,31 In 1017 patients with ER-positive breast cancer treated with anastrozole or tamoxifen in the ATAC trial, ROR added significant prognostic information beyond the clinical treatment score (integrated prognostic information from nodal status, tumor size, histopathologic grade, age, and anastrozole or tamoxifen treatment) in all patients. Also, compared with the 21-gene recurrence score, ROR provided more prognostic information in ER-positive, node-negative disease and better differentiation of intermediate- and higher-risk groups. Fewer patients were categorized as intermediate risk by ROR and more as high risk, which could reduce the uncertainty in the estimate of clinical benefit from chemotherapy.30 The clinical utility of PAM50 as a prognostic model was also validated in 1478 postmenopausal women with ER-positive early-stage breast cancer enrolled in the ABCSG-8 trial. In this study, ROR assigned 47% of patients with node-negative disease to the low-risk category. In this low-risk group, the 10-year metastasis risk was less than 3.5%, indicating lack of benefit from additional chemotherapy.31 A key limitation of the PAM50 is the lack of any prospective studies with this assay.
PAM50 has been designed to be carried out in any qualified pathology laboratory. Moreover, the ROR score provides additional prognostic information about risk of late recurrence, which will be discussed in the next section.
70-Gene Breast Cancer Recurrence Assay (MammaPrint)
MammaPrint is a 70-gene assay that was initially developed using an unsupervised, hierarchical clustering algorithm on whole-genome expression arrays with early-stage breast cancer. Among 295 consecutive patients who had MammaPrint testing, those classified with a good-prognosis tumor signature (n = 115) had an excellent 10-year survival rate (94.5%) compared to those with a poor-prognosis signature (54.5%), and the signature remained prognostic upon multivariate analysis.32 Subsequently, a pooled analysis comparing outcomes by MammaPrint score in patients with node-negative or 1 to 3 node-positive breast cancers treated as per discretion of their medical team with either adjuvant chemotherapy plus endocrine therapy or endocrine therapy alone reported that only those patients with a high-risk score benefited from chemotherapy.33 Recently, a prospective phase 3 study (MINDACT [Microarray In Node negative Disease may Avoid ChemoTherapy]) evaluating the utility of MammaPrint for adjuvant chemotherapy decision-making reported results.34 In this study, 6693 women with early-stage breast cancer were assessed by clinical risk and genomic risk using MammaPrint. Those with low clinical and genomic risk did not receive chemotherapy, while those with high clinical and genomic risk all received chemotherapy. The primary goal of the study was to assess whether forgoing chemotherapy would be associated with a low rate of recurrence in those patients with a low-risk prognostic MammaPrint signature but high clinical risk. A total of 1550 patients (23.2%) were in the discordant group, and the majority of these patients had HR-positive disease (98.1%). Without chemotherapy, the rate of survival without distant metastasis at 5 years in this group was 94.7% (95% confidence interval [CI] 92.5% to 96.2%), which met the primary endpoint. Of note, initially, MammaPrint was only available for fresh tissue analysis, but recent advances in RNA processing now allow for this analysis on FFPE tissue.35
Summary
These genomic and biomarker assays can identify different subsets of HR-positive breast cancers, including those patients who have tumors with an excellent prognosis with endocrine therapies alone. Thus, we now have the tools to help avoid the toxicities of chemotherapy in many women with early-stage breast cancer. 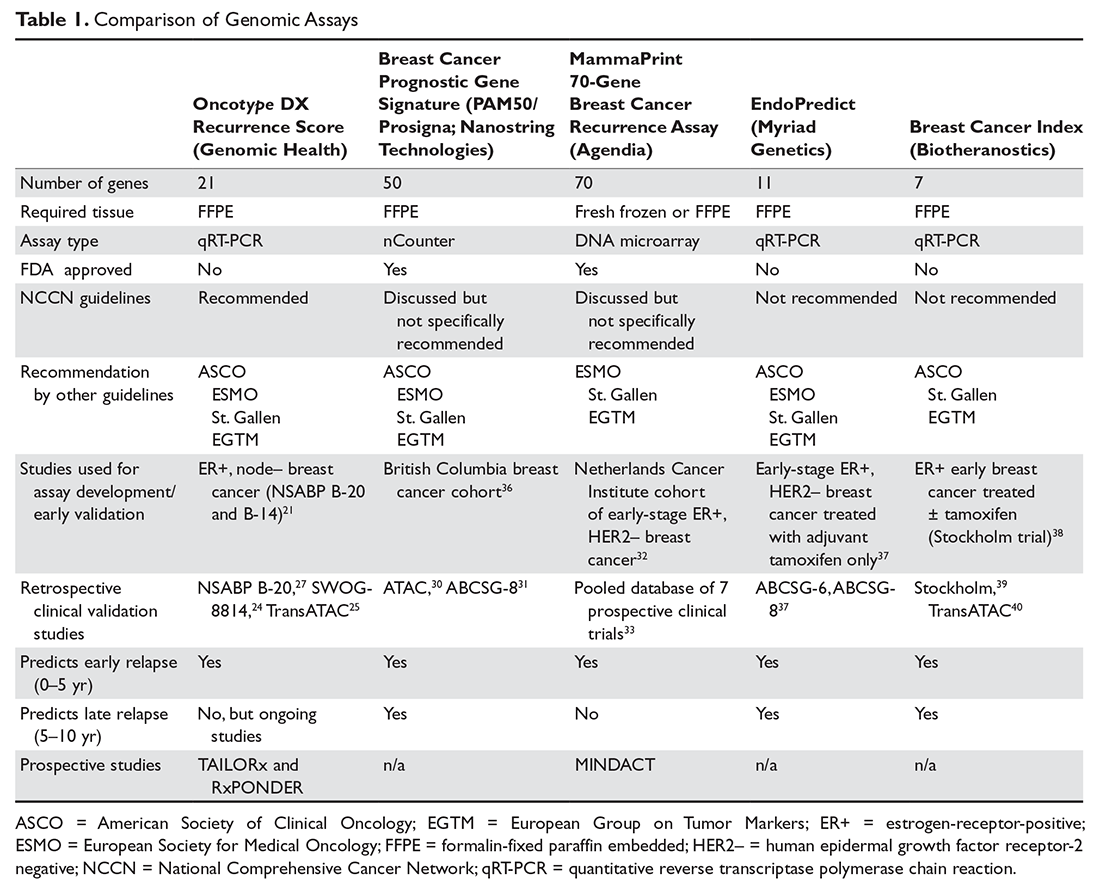
Tests for Assessing Risk for Late Recurrence
Case Continued
The patient undergoes 21-gene recurrence score testing, which shows a low recurrence score of 10, estimating the 10-year risk of distant recurrence to be approximately 7% with 5 years of tamoxifen. Chemotherapy is not recommended. The patient completes adjuvant whole breast radiation therapy, and then, based on data supporting AIs over tamoxifen in postmenopausal women, she is started on anastrozole.41 She initially experiences mild side effects from treatment, including fatigue, arthralgia, and vaginal dryness, but her symptoms are able to be managed. As she approaches 5 years of adjuvant endocrine therapy with anastrozole, she is struggling with rotator cuff injury and is anxious about recurrence, but has no evidence of recurrent cancer. Her bone density scan in the beginning of her fourth year of therapy shows a decrease in bone mineral density, with the lowest T score of –1.5 at the left femoral neck, consistent with osteopenia. She has been treated with calcium and vitamin D supplements.
- How long should this patient continue treatment with anastrozole?
The risk for recurrence is highest during the first 5 years after diagnosis for all patients with early breast cancer.42 Although HR-positive breast cancers have a better prognosis than HR-negative disease, the pattern of recurrence is different between the 2 groups, and it is estimated that approximately half of the recurrences among patients with HR-positive early breast cancer occur after the first 5 years from diagnosis. Annualized hazard of recurrence in HR-positive breast cancer has been shown to remain elevated and fairly stable beyond 10 years, even for those with low tumor burden and node-negative disease.43 Prospective trials showed that for women with HR-positive early breast cancer, 5 years of adjuvant tamoxifen could substantially reduce recurrence rates and improve survival, and this became the standard of care.44 AIs are considered the standard of care for adjuvant endocrine therapy in most postmenopausal women, as they result in a significantly lower recurrence rate compared with tamoxifen, either as initial adjuvant therapy or sequentially following 2 to 3 years of tamoxifen.45
Due to the risk for later recurrences with HR-positive breast cancer, more patients and oncologists are considering extended endocrine therapy. This is based on results from the ATLAS (Adjuvant Tamoxifen: Longer Against Shorter) and aTTOM (Adjuvant Tamoxifen–To Offer More?) studies, both of which showed that women with HR-positive breast cancer who continued tamoxifen for 10 years had a lower late recurrence rate and a lower breast cancer mortality rate compared with those who stopped at 5 years.46,47 Furthermore, the NCIC MA.17 trial evaluated extended endocrine therapy in postmenopausal women with 5 years of letrozole following 5 years of tamoxifen. Letrozole was shown to improve both disease-free and distant disease-free survival. The overall survival benefit was limited to patients with node-positive disease.48 A summary of studies of extended endocrine therapy for HR-positive breast cancers is shown in Table 2.2,3,46–49 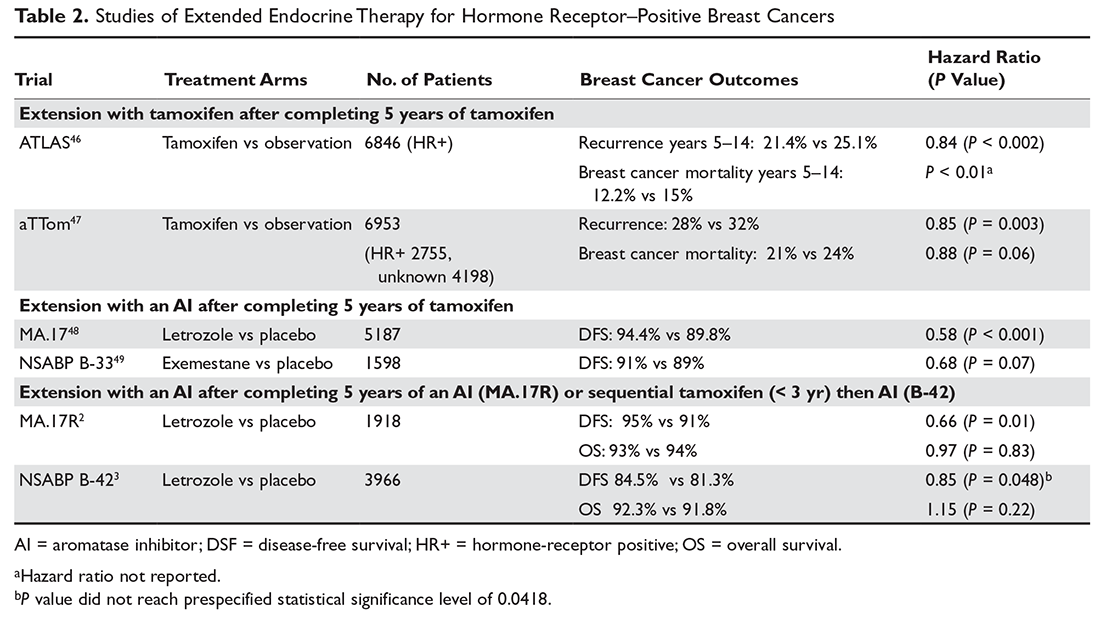
However, extending AI therapy from 5 years to 10 years is not clearly beneficial. In the MA.17R trial, although longer AI therapy resulted in significantly better disease-free survival (95% versus 91%, hazard ratio 0.66, P = 0.01), this was primarily due to a lower incidence of contralateral breast cancer in those taking the AI compared with placebo. The distant recurrence risks were similar and low (4.4% versus 5.5%), and there was no overall survival difference.2 Also, the NSABP B-42 study, which was presented at the 2016 San Antonio Breast Cancer Symposium, did not meet its predefined endpoint for benefit from extending adjuvant AI therapy with letrozole beyond 5 years.3 Thus, the absolute benefit from extended endocrine therapy has been modest across these studies. Although endocrine therapy is considered relatively safe and well tolerated, side effects can be significant and even associated with morbidity. Ideally, extended endocrine therapy should be offered to the subset of patients who would benefit the most. Several genomic diagnostic assays, including the EndoPredict test, PAM50, and the Breast Cancer Index (BCI) tests, specifically assess the risk for late recurrence in HR-positive cancers.
PAM50
Studies suggest that the ROR score also has value in predicting late recurrences. Analysis of data in patients enrolled in the ABCSG-8 trial showed that ROR could identify patients with endocrine-sensitive disease who are at low risk for late relapse and could be spared from unwanted toxicities of extended endocrine therapies. In 1246 ABCSG-8 patients between years 5 and 15, the PAM50 ROR demonstrated an absolute risk of distant recurrence of 2.4% in the low-risk group, as compared with 17.5% in the high-risk group.50 Also, a combined analysis of patients from both the ATAC and ABCSG-8 trials demonstrated the utility of ROR in identifying this subgroup of patients with low risk for late relapse.51
EndoPredict
EndoPredict is another quantitative RT-PCR–based assay which uses FFPE tissues to calculate a risk score based on 8 cancer-related and 3 reference genes. The score is combined with clinicopathological factors including tumor size and nodal status to make a comprehensive risk score (EPclin). EPclin is used to dichotomize patients into EndoPredict low- and high-risk groups. EndoPredict has been validated in 2 cohorts of patients enrolled in separate randomized studies, ABCSG-6 and ABCSG-8. EP provided prognostic information beyond clinicopathological variables to predict distant recurrence in patients with HR-positive/HER2-negative early breast cancer.37 More important, EndoPredict has been shown to predict early (years 0–5) versus late (> 5 years after diagnosis) recurrences and identify a low-risk subset of patients who would not be expected to benefit from further treatment beyond 5 years of endocrine therapy.52 Recently, EndoPredict and EPclin were compared with the 21-gene (Oncotype DX) recurrence score in a patient population from the TransATAC study. Both EndoPredict and EPclin provided more prognostic information compared to the 21-gene recurrence score and identified early and late relapse events.53 EndoPredict is the first multigene expression assay that could be routinely performed in decentralized molecular pathological laboratories with a short turnaround time.54
Breast Cancer Index
The BCI is a RT-PCR–based gene expression assay that consists of 2 gene expression biomarkers: molecular grade index (MGI) and HOXB13/IL17BR (H/I). The BCI was developed as a prognostic test to assess risk for breast cancer recurrence using a cohort of ER-positive patients (n = 588) treated with adjuvant tamoxifen versus observation from the prospective randomized Stockholm trial.38 In this blinded retrospective study, H/I and MGI were measured and a continuous risk model (BCI) was developed in the tamoxifen-treated group. More than 50% of the patients in this group were classified as having a low risk of recurrence. The rate of distant recurrence or death in this low-risk group at 10 years was less than 3%. The performance of the BCI model was then tested in the untreated arm of the Stockholm trial. In the untreated arm, BCI classified 53%, 27%, and 20% of patients as low, intermediate, and high risk, respectively. The rate of distant metastasis at 10 years in these risk groups was 8.3% (95% CI 4.7% to 14.4%), 22.9% (95% CI 14.5% to 35.2%), and 28.5% (95% CI 17.9% to 43.6%), respectively, and the rate of breast cancer–specific mortality was 5.1% (95% CI 1.3% to 8.7%), 19.8% (95% CI 10.0% to 28.6%), and 28.8% (95% CI 15.3% to 40.2%).38
The prognostic and predictive values of the BCI have been validated in other large, randomized studies and in patients with both node-negative and node-positive disease.39,55 The predictive value of the endocrine-response biomarker, the H/I ratio, has been demonstrated in randomized studies. In the MA.17 trial, a high H/I ratio was associated with increased risk for late recurrence in the absence of letrozole. However, extended endocrine therapy with letrozole in patients with high H/I ratios predicted benefit from therapy and decreased the probability of late disease recurrence.56 BCI was also compared to IHC4 and the 21-gene recurrence score in the TransATAC study and was the only test to show prognostic significance for both early (0–5 years) and late (5–10 year) recurrence.40
The impact of the BCI results on physicians’ recommendations for extended endocrine therapy was assessed by a prospective study. This study showed that the test result had a significant effect on both physician treatment recommendation and patient satisfaction. BCI testing resulted in a change in physician recommendations for extended endocrine therapy, with an overall decrease in recommendations for extended endocrine therapy from 74% to 54%. Knowledge of the test result also led to improved patient satisfaction and decreased anxiety.57
Summary
Due to the risk for late recurrence, extended endocrine therapy is being recommended for many patients with HR-positive breast cancers. Multiple genomic assays are being developed to better understand an individual’s risk for late recurrence and the potential for benefit from extended endocrine therapies. However, none of the assays has been validated in prospective randomized studies. Further validation is needed prior to routine use of these assays.
Case Continued
A BCI test is done and the result shows 4.3% BCI low-risk category in years 5–10, which is consistent with a low likelihood of benefit from extended endocrine therapy. After discussing the results of the BCI test in the context of no survival benefit from extending AIs beyond 5 years, both the patient and her oncologist feel comfortable with discontinuing endocrine therapy at the end of 5 years.
Conclusion
Reduction in breast cancer mortality is mainly the result of improved systemic treatments. With advances in breast cancer screening tools in recent years, the rate of cancer detection has increased. This has raised concerns regarding overdiagnosis. To prevent unwanted toxicities associated with overtreatment, better treatment decision tools are needed. Several genomic assays are currently available and widely used to provide prognostic and predictive information and aid in decisions regarding appropriate use of adjuvant chemotherapy in HR-positive/HER2-negative early-stage breast cancer. Ongoing studies are refining the cutoffs for these assays and expanding the applicability to node-positive breast cancers. Furthermore, with several studies now showing benefit from the use of extended endocrine therapy, some of these assays may be able to identify the subset of patients who are at increased risk for late recurrence and who might benefit from extended endocrine therapy. Advances in molecular testing has enabled clinicians to offer more personalized treatments to their patients, improve patients’ compliance, and decrease anxiety and conflict associated with management decisions. Although small numbers of patients with HER2-positive and triple-negative breast cancers were also included in some of these studies, use of genomic assays in this subset of patients is very limited and currently not recommended.
1. Welch HG, Prorok PC, O’Malley AJ, Kramer BS. Breast-cancer tumor size, overdiagnosis, and mammography screening effectiveness. N Engl J Med 2016;375:1438–47.
2. Goss PE, Ingle JN, Pritchard KI, et al. Extending aromatase-inhibitor adjuvant therapy to 10 years. N Engl J Med 2016;375:209–19.
3. Mamounas E, Bandos H, Lembersky B. A randomized, double-blinded, placebo-controlled clinical trial of extended adjuvant endocrine therapy with letrozole in postmenopausal women with hormone-receptor-positive breast cancer who have completed previous adjuvant treatment with an aromatase inhibitor. In: Proceedings from the San Antonio Breast Cancer Symposium; December 6–10, 2016; San Antonio, TX. Abstract S1-05.
4. Tjan-Heijnen VC, Van Hellemond IE, Peer PG, et al: First results from the multicenter phase III DATA study comparing 3 versus 6 years of anastrozole after 2-3 years of tamoxifen in postmenopausal women with hormone receptor-positive early breast cancer. In: Proceedings from the San Antonio Breast Cancer Symposium; December 6–10, 2016; San Antonio, TX. Abstract S1-03.
5. Blok EJ, Van de Velde CJH, Meershoek-Klein Kranenbarg EM, et al: Optimal duration of extended letrozole treatment after 5 years of adjuvant endocrine therapy. In: Proceedings from the San Antonio Breast Cancer Symposium; December 6–10, 2016; San Antonio, TX. Abstract S1-04.
6. Effects of chemotherapy and hormonal therapy for early breast cancer on recurrence and 15-year survival: an overview of the randomised trials. Early Breast Cancer Trialists’ Collaborative Group. Lancet 2005;365:1687–717.
7. Perou CM, Sorlie T, Eisen MB, et al. Molecular portraits of human breast tumours. Nature 2000;406:747–52.
8. Coates AS, Winer EP, Goldhirsch A, et al. Tailoring therapies--improving the management of early breast cancer: St Gallen International Expert Consensus on the Primary Therapy of Early Breast Cancer 2015. Ann Oncol 2015;26:1533–46.
9. Hanahan D, Weinberg RA. The hallmarks of cancer. Cell 2000;100:57–70.
10. Urruticoechea A, Smith IE, Dowsett M. Proliferation marker Ki-67 in early breast cancer. J Clin Oncol 2005;23:7212–20.
11. de Azambuja E, Cardoso F, de Castro G Jr, et al. Ki-67 as prognostic marker in early breast cancer: a meta-analysis of published studies involving 12,155 patients. Br J Cancer 2007;96:1504–13.
12. Petrelli F, Viale G, Cabiddu M, Barni S. Prognostic value of different cut-off levels of Ki-67 in breast cancer: a systematic review and meta-analysis of 64,196 patients. Breast Cancer Res Treat 2015;153:477–91.
13. Cheang MC, Chia SK, Voduc D, et al. Ki67 index, HER2 status, and prognosis of patients with luminal B breast cancer. J Natl Cancer Inst 2009;101:736–50.
14. Cuzick J, Dowsett M, Pineda S, et al. Prognostic value of a combined estrogen receptor, progesterone receptor, Ki-67, and human epidermal growth factor receptor 2 immunohistochemical score and com-parison with the Genomic Health recurrence score in early breast cancer. J Clin Oncol 2011;29:4273–8.
15. Pathmanathan N, Balleine RL. Ki67 and proliferation in breast cancer. J Clin Pathol 2013;66:512–6.
16. Denkert C, Budczies J, von Minckwitz G, et al. Strategies for developing Ki67 as a useful biomarker in breast cancer. Breast 2015; 24 Suppl 2:S67–72.
17. Ma CX, Bose R, Ellis MJ. Prognostic and predictive biomarkers of endocrine responsiveness for estrogen receptor positive breast cancer. Adv Exp Med Biol 2016;882:125–54.
18. Eiermann W, Paepke S, Appfelstaedt J, et al. Preoperative treatment of postmenopausal breast cancer patients with letrozole: a randomized double-blind multicenter study. Ann Oncol 2001;12:1527–32.
19. Smith IE, Dowsett M, Ebbs SR, et al. Neoadjuvant treatment of postmenopausal breast cancer with anastrozole, tamoxifen, or both in combination: the Immediate Preoperative Anas-trozole, Tamoxifen, or Combined with Tamoxifen (IMPACT) multicenter double-blind randomized trial. J Clin Oncol 2005;23:5108–16.
20. Ellis MJ, Tao Y, Luo J, et al. Outcome prediction for estrogen receptor-positive breast cancer based on postneoadjuvant endocrine therapy tumor characteristics. J Natl Cancer Inst 2008;100:1380–8.
21. Paik S, Shak S, Tang G, et al. A multigene assay to predict recurrence of tamoxifen-treated, node-negative breast cancer. N Engl J Med 2004;351:2817–26.
22. Fisher B, Jeong JH, Bryant J, et al. Treatment of lymph-node-negative, oestrogen-receptor-positive breast cancer: long-term findings from National Surgical Adjuvant Breast and Bowel Project randomised clinical trials. Lancet 2004;364:858–68.
23. Habel LA, Shak S, Jacobs MK, et al. A population-based study of tumor gene expression and risk of breast cancer death among lymph node-negative patients. Breast Cancer Res 2006;8:R25.
24. Albain KS, Barlow WE, Shak S, et al. Prognostic and predictive value of the 21-gene recurrence score assay in postmenopausal women with node-positive, oestrogen-receptor-positive breast cancer on chemotherapy: a retrospective analysis of a randomised trial. Lancet Oncol 2010;11:55–65.
25. Dowsett M, Cuzick J, Wale C, et al. Prediction of risk of distant recurrence using the 21-gene recurrence score in node-negative and node-positive postmenopausal patients with breast cancer treated with anastrozole or tamoxifen: a TransATAC study. J Clin Oncol 2010;28:1829–34.
26. Paik S, Shak S, Tang G, et al. Expression of the 21 genes in the recurrence score assay and tamoxifen clinical benefit in the NSABP study B-14 of node negative, estrogen receptor positive breast cancer. J Clin Oncol 2005;23: suppl:510.
27. Paik S, Tang G, Shak S, et al. Gene expression and benefit of chemotherapy in women with node-negative, estrogen receptor-positive breast cancer. J Clin Oncol 2006;24:3726–34.
28. Sparano JA, Gray RJ, Makower DF, et al. Prospective validation of a 21-gene expression assay in breast cancer. N Engl J Med 2015;373:2005–14.
29. Parker JS, Mullins M, Cheang MC, et al. Supervised risk predictor of breast cancer based on intrinsic subtypes. J Clin Oncol 2009;27:1160–7.
30. Dowsett M, Sestak I, Lopez-Knowles E, et al. Comparison of PAM50 risk of recurrence score with oncotype DX and IHC4 for predicting risk of distant recurrence after endocrine therapy. J Clin Oncol 2013;31:2783–90.
31. Gnant M, Filipits M, Greil R, et al. Predicting distant recurrence in receptor-positive breast cancer patients with limited clinicopathological risk: using the PAM50 Risk of Recurrence score in 1478 post-menopausal patients of the ABCSG-8 trial treated with adjuvant endocrine therapy alone. Ann Oncol 2014;25:339–45.
32. van de Vijver MJ, He YD, van’t Veer LJ, et al. A gene-expression signature as a predictor of survival in breast cancer. N Engl J Med 2002;347:1999–2009.
33. Knauer M, Mook S, Rutgers EJ, et al. The predictive value of the 70-gene signature for adjuvant chemotherapy in early breast cancer. Breast Cancer Res Treat 2010;120:655–61.
34. Cardoso F, van’t Veer LJ, Bogaerts J, et al. 70-gene signature as an aid to treatment decisions in early-stage breast cancer. N Engl J Med 2016;375:717–29.
35. Sapino A, Roepman P, Linn SC, et al. MammaPrint molecular diagnostics on formalin-fixed, paraffin-embedded tissue. J Mol Diagn 2014;16:190–7.
36. Nielsen TO, Parker JS, Leung S, et al. A comparison of PAM50 intrinsic subtyping with immunohistochemistry and clinical prognostic factors in tamoxifen-treated estrogen receptor-positive breast cancer. Clin Cancer Res 2010;16:5222–32.
37. Filipits M, Rudas M, Jakesz R, et al. A new molecular predictor of distant recurrence in ER-positive, HER2-negative breast cancer adds independent information to conventional clinical risk factors. Clin Cancer Res 2011;17:6012–20.
38. Jerevall PL, Ma XJ, Li H, et al. Prognostic utility of HOXB13:IL17BR and molecular grade index in early-stage breast cancer patients from the Stockholm trial. Br J Cancer 2011;104:1762–9.
39. Zhang Y, Schnabel CA, Schroeder BE, et al. Breast cancer index identifies early-stage estrogen receptor-positive breast cancer patients at risk for early- and late-distant recurrence. Clin Cancer Res 2013;19:4196–205.
40. Sgroi DC, Sestak I, Cuzick J, et al. Prediction of late distant recurrence in patients with oestrogen-receptor-positive breast cancer: a prospective comparison of the breast-cancer index (BCI) assay, 21-gene recurrence score, and IHC4 in the TransATAC study population. Lancet Oncol 2013;14:1067–76.
41. Burstein HJ, Griggs JJ, Prestrud AA, Temin S. American society of clinical oncology clinical practice guideline update on adjuvant endocrine therapy for women with hormone receptor-positive breast cancer. J Oncol Pract 2010;6:243–6.
42. Saphner T, Tormey DC, Gray R. Annual hazard rates of recurrence for breast cancer after primary therapy. J Clin Oncol 1996;14:2738–46.
43. Colleoni M, Sun Z, Price KN, et al. Annual hazard rates of recurrence for breast cancer during 24 years of follow-up: results from the International Breast Cancer Study Group Trials I to V. J Clin Oncol 2016;34:927–35.
44. Davies C, Godwin J, Gray R, et al. Relevance of breast cancer hormone receptors and other factors to the efficacy of adjuvant tamoxifen: patient-level meta-analysis of randomised trials. Lancet 2011;378:771–84.
45. Dowsett M, Forbes JF, Bradley R, et al. Aromatase inhibitors versus tamoxifen in early breast cancer: patient-level meta-analysis of the randomised trials. Lancet 2015;386:1341–52.
46. Davies C, Pan H, Godwin J, et al. Long-term effects of continuing adjuvant tamoxifen to 10 years versus stopping at 5 years after diagnosis of oestrogen receptor-positive breast cancer: ATLAS, a randomised trial. Lancet 2013;381:805–16.
47. Gray R, Rea D, Handley K, et al. aTTom: Long-term effects of continuing adjuvant tamoxifen to 10 years versus stopping at 5 years in 6,953 women with early breast cancer. J Clin Oncol 2013;31 (suppl):5.
48. Goss PE, Ingle JN, Martino S, et al. Randomized trial of letrozole following tamoxifen as extended adjuvant therapy in receptor-positive breast cancer: updated findings from NCIC CTG MA.17. J Natl Cancer Inst 2005;97:1262–71.
49. Mamounas EP, Jeong JH, Wickerham DL, et al. Benefit from exemestane as extended adjuvant therapy after 5 years of adjuvant tamoxifen: intention-to-treat analysis of the National Surgical Adjuvant Breast and Bowel Project B-33 trial. J Clin Oncol 2008;26:1965–71.
50. Filipits M, Nielsen TO, Rudas M, et al. The PAM50 risk-of-recurrence score predicts risk for late distant recurrence after endocrine therapy in postmenopausal women with endocrine-responsive early breast cancer. Clin Cancer Res 2014;20:1298–305.
51. Sestak I, Cuzick J, Dowsett M, et al. Prediction of late distant recurrence after 5 years of endocrine treatment: a combined analysis of patients from the Austrian breast and colorectal cancer study group 8 and arimidex, tamoxifen alone or in combination randomized trials using the PAM50 risk of recurrence score. J Clin Oncol 2015;33:916–22.
52. Dubsky P, Brase JC, Jakesz R, et al. The EndoPredict score provides prognostic information on late distant metastases in ER+/HER2- breast cancer patients. Br J Cancer 2013;109:2959–64.
53. Buus R, Sestak I, Kronenwett R, et al. Comparison of EndoPredict and EPclin with Oncotype DX Recurrence Score for prediction of risk of distant recurrence after endocrine therapy. J Natl Cancer Inst 2016;108:djw149.
54. Muller BM, Keil E, Lehmann A, et al. The EndoPredict gene-expression assay in clinical practice - performance and impact on clinical decisions. PLoS One 2013;8:e68252.
55. Sgroi DC, Chapman JA, Badovinac-Crnjevic T, et al. Assessment of the prognostic and predictive utility of the Breast Cancer Index (BCI): an NCIC CTG MA.14 study. Breast Cancer Res 2016;18:1.
56. Sgroi DC, Carney E, Zarrella E, et al. Prediction of late disease recurrence and extended adjuvant letrozole benefit by the HOXB13/IL17BR biomarker. J Natl Cancer Inst 2013;105:1036–42.
57. Sanft T, Aktas B, Schroeder B, et al. Prospective assessment of the decision-making impact of the Breast Cancer Index in recommending extended adjuvant endocrine therapy for patients with early-stage ER-positive breast cancer. Breast Cancer Res Treat 2015;154:533–41.
Introduction
Over the past several decades, while the incidence of breast cancer has increased, breast cancer mortality has decreased. This decrease is likely due to both early detection and advances in systemic therapy. However, with more widespread use of screening mammography, there are increasing concerns about potential overdiagnosis of cancer.1 One key challenge is that breast cancer is a heterogeneous disease. Improved tools for determining breast cancer biology can help physicians individualize treatments. Patients with low-risk cancers can be approached with less aggressive treatments, thus preventing unnecessary toxicities, while those with higher-risk cancers remain treated appropriately with more aggressive therapies.
Traditionally, adjuvant chemotherapy was recommended based on tumor features such as stage (tumor size, regional nodal involvement), grade, expression of hormone receptors (estrogen receptor [ER] and progesterone receptor [PR]) and human epidermal growth factor receptor-2 (HER2), and patient features (age, menopausal status). However, this approach is not accurate enough to guide individualized treatment approaches, which are based on the risk for recurrence and the reduction in this risk that can be achieved with various systemic treatments. In particular, women with low-risk hormone receptor (HR)–positive, HER2-negative breast cancers could be spared the toxicities of cytotoxic chemotherapies without compromising the prognosis.
Beyond chemotherapy, endocrine therapies also have risks, especially when given over extended periods of time. Recently, extended endocrine therapy has been shown to prevent late recurrences of HR-positive breast cancers. In the National Cancer Institute of Canada Clinical Trials Group’s MA.17R study, extended endocrine therapy with letrozole for a total of 10 years (beyond 5 years of an aromatase inhibitor [AI]) decreased the risk for breast cancer recurrence or the occurrence of contralateral breast cancer by 34%.2 However, the overall survival was similar between the 2 groups and the disease-free survival benefits were not confirmed in other studies.3–5 Identifying the subgroup of patients who benefit from this extended AI therapy is important in the era of personalized medicine. Several tumor genomic assays have been developed to provide additional prognostic and predictive information with the goal of individualizing adjuvant therapies for breast cancer. Although assays are also being evaluated in HER2-positive and triple-negative breast cancer, this review will focus on HR-positive, HER2-negative breast cancer.
Tests for Guiding Adjuvant Chemotherapy Decisions
Case Study
Initial Presentation
A 54-year-old postmenopausal woman with no significant past medical history presents with an abnormal screening mammogram, which shows a focal asymmetry in the 10 o’clock position at middle depth of the left breast. Further work-up with a diagnostic mammogram and ultrasound of the left breast shows a suspicious hypoechoic solid mass with irregular margins measuring 17 mm. The patient undergoes an ultrasound-guided core needle biopsy of the suspicious mass, the results of which are consistent with an invasive ductal carcinoma, Nottingham grade 2, ER strongly positive (95%), PR weakly positive (5%), HER2-negative, and Ki-67 of 15%. She undergoes a left partial mastectomy and sentinel lymph node biopsy, with final pathology demonstrating a single focus of invasive ductal carcinoma, measuring 2.2 cm in greatest dimension with no evidence of lymphovascular invasion. Margins are clear and 2 sentinel lymph nodes are negative for metastatic disease (final pathologic stage IIA, pT2 pN0 cM0). She is referred to medical oncology to discuss adjuvant systemic therapy.
- Can additional testing be used to determine prognosis and guide systemic therapy recommendations for early-stage HR-positive/HER2-negative breast cancer?
After a diagnosis of early-stage breast cancer, the key clinical question faced by the patient and medical oncologist is: what is the individual’s risk for a metastatic breast cancer recurrence and thus the risk for death due to breast cancer? Once the risk for recurrence is established, systemic adjuvant chemotherapy, endocrine therapy, and/or HER2-directed therapy are considered based on the receptor status (ER/PR and HER2) to reduce this risk. HR-positive, HER2-negative breast cancer is the most common type of breast cancer. Although adjuvant endocrine therapy has significantly reduced the risk for recurrence and improved survival for patients with HR-positive breast cancer,6 the role of adjuvant chemotherapy for this subset of breast cancer remains unclear. Prior to genomic testing, the recommendation for adjuvant chemotherapy for HR-positive/HER2-negative tumors was primarily based on patient age and tumor stage and grade. However, chemotherapy overtreatment remained a concern given the potential short- and long-term risks of chemotherapy. Further studies into HR-positive/HER2-negative tumors have shown that these tumors can be divided into 2 main subtypes, luminal A and luminal B.7 These subtypes represent unique biology and differ in terms of prognosis and response to endocrine therapy and chemotherapy. Luminal A tumors are strongly endocrine responsive and have a good prognosis, while luminal B tumors are less endocrine responsive and are associated with a poorer prognosis; the addition of adjuvant chemotherapy is often considered for luminal B tumors.8 Several tests, including tumor genomic assays, are now available to help with delineating the tumor subtype and aid in decision-making regarding adjuvant chemotherapy for HR-positive/HER2-negative breast cancers.
Ki-67 Assays, Including IHC4 and PEPI
Proliferation is a hallmark of cancer cells.9 Ki-67, a nuclear nonhistone protein whose expression varies in intensity throughout the cell cycle, has been used as a measurement of tumor cell proliferation.10 Two large meta-analyses have demonstrated that high Ki-67 expression in breast tumors is independently associated with worse disease-free and overall survival rates.11,12 Ki-67 expression has also been used to classify HR-positive tumors as luminal A or B. After classifying tumor subtypes based on intrinsic gene expression profiling, Cheang and colleagues determined that a Ki-67 cut point of 13.25% differentiated luminal A and B tumors.13 However, the ideal cut point for Ki-67 remains unclear, as the sensitivity and specificity in this study was 77% and 78%, respectively. Others have combined Ki-67 with standard ER, PR, and HER2 testing. This immunohistochemical 4 (IHC4) score, which weighs each of these variables, was validated in postmenopausal patients from the ATAC (Arimidex, Tamoxifen, Alone or in Combination) trial who had ER-positive tumors and did not receive chemotherapy.14 The prognostic information from the IHC4 was similar to that seen with the 21-gene recurrence score (Oncotype DX), which is discussed later in this article. The key challenge with Ki-67 testing currently is the lack of a validated test methodology and intra-observer variability in interpreting the Ki-67 results.15 Recent series have suggested that Ki-67 be considered as a continuous marker rather than a set cut point.16 These issues continue to impact the clinical utility of Ki-67 for decision-making for adjuvant chemotherapy.
Ki-67 and the preoperative endocrine prognostic index (PEPI) score have been explored in the neoadjuvant setting to separate postmenopausal women with endocrine-sensitive versus intrinsically resistant disease and identify patients at risk for recurrent disease.17 The on-treatment levels of Ki-67 in response to endocrine therapy have been shown to be more prognostic than baseline values, and a decrease in Ki-67 as early as 2 weeks after initiation of neoadjuvant endocrine therapy is associated with endocrine-sensitive tumors and improved outcome. The PEPI score was developed through retrospective analysis of the P024 trial18 to evaluate the relationship between post-neoadjuvant endocrine therapy tumor characteristics and risk for early relapse. The score was subsequently validated in an independent data set from the IMPACT (Immediate Preoperative Anastrozole, Tamoxifen, or Combined with Tamoxifen) trial.19 Patients with low pathological stage (0 or 1) and a favorable biomarker profile (PEPI score 0) at surgery had the best prognosis in the absence of chemotherapy. On the other hand, higher pathological stage at surgery and a poor biomarker profile with loss of ER positivity or persistently elevated Ki-67 (PEPI score of 3) identified de novo endocrine-resistant tumors that are higher risk for early relapse.20 The ongoing Alliance A011106 ALTERNATE trial (ALTernate approaches for clinical stage II or III Estrogen Receptor positive breast cancer NeoAdjuvant TrEatment in postmenopausal women, NCT01953588) is a phase 3 study to prospectively test this hypothesis.
21-Gene Recurrence Score (Onco type DX Assay)
The 21-gene Oncotype DX assay is conducted on paraffin-embedded tumor tissue and measures the expression of 16 cancer related genes and 5 reference genes using quantitative polymerase chain reaction (PCR). The genes included in this assay are mainly related to proliferation (including Ki-67), invasion, and HER2 or estrogen signaling.21 Originally, the 21-gene recurrence score assay was analyzed as a prognostic biomarker tool in a prospective-retrospective biomarker substudy of the National Surgical Adjuvant Breast and Bowel Project (NSABP) B-14 clinical trial in which patients with node-negative, ER-positive tumors were randomly assigned to receive tamoxifen or placebo without chemotherapy.22 Using the standard reported values of low risk (< 18), intermediate risk (18–30), or high risk (≥ 31) for recurrence, among the tamoxifen-treated patients, cancers with a high-risk recurrence score had a significantly worse rate of distant recurrence and overall survival.21 Inferior breast cancer survival in cancers with a high recurrence score was also confirmed in other series of endocrine-treated patients with node-negative and node-positive disease.23–25
The predictive utility of the 21-gene recurrence score for endocrine therapy has also been evaluated. A comparison of the placebo- and tamoxifen-treated patients from the NSABP B-14 trial demonstrated that the 21-gene recurrence score predicted benefit from tamoxifen in cancers with low- or intermediate-risk recurrence scores.26 However, there was no benefit from the use of tamoxifen over placebo in cancers with high-risk recurrence scores. To date, this intriguing data has not been prospectively confirmed, and thus the 21-gene recurrence score is not used to avoid endocrine therapy.
The 21-gene recurrence score is primarily used by oncologists to aid in decision-making regarding adjuvant chemotherapy in patients with node-negative and node-positive (with up to 3 positive lymph nodes), HR-positive/HER2-negative breast cancers. The predictive utility of the 21-gene recurrence score for adjuvant chemotherapy was initially tested using tumor samples from the NSABP B-20 study. This study initially compared adjuvant tamoxifen alone with tamoxifen plus chemotherapy in patients with node-negative, HR-positive tumors. The prospective-retrospective biomarker analysis showed that the patients with high-risk 21-gene recurrence scores benefited from the addition of chemotherapy, whereas those with low or intermediate risk did not have an improved freedom from distant recurrence with chemotherapy.27 Similarly, an analysis from the prospective phase 3 Southwest Oncology Group (SWOG) 8814 trial comparing tamoxifen to tamoxifen with chemotherapy showed that for node-positive tumors, chemotherapy benefit was only seen in those with high 21-gene recurrence scores.24
Prospective studies are now starting to report results regarding the predictive role of the 21-gene recurrence score. The TAILORx (Trial Assigning Individualized Options for Treatment) trial includes women with node-negative, HR-positive/HER2-negative tumors measuring 0.6 to 5 cm. All patients were treated with standard-of-care endocrine therapy for at least 5 years. Chemotherapy was determined based on the 21-gene recurrence score results on the primary tumor. The 21-gene recurrence score cutoffs were changed to low (0–10), intermediate (11–25), and high (≥ 26). Patients with scores of 26 or higher were treated with chemotherapy, and those with intermediate scores were randomly assigned to chemotherapy or no chemotherapy; results from this cohort are still pending. However, excellent breast cancer outcomes with endocrine therapy alone were reported from the 1626 (15.9% of total cohort) prospectively followed patients with low recurrence score tumors. The 5-year invasive disease-free survival was 93.8%, with overall survival of 98%.28 Given that 5 years is appropriate follow-up to see any chemotherapy benefit, this data supports the recommendation for no chemotherapy in this cohort of patients with very low 21-gene recurrence scores.
The RxPONDER (Rx for Positive Node, Endocrine Responsive Breast Cancer) trial is evaluating women with 1 to 3 node-positive, HR-positive, HER2-negative tumors. In this trial, patients with 21-gene recurrence scores of 0 to 25 were assigned to adjuvant chemotherapy or none. Those with scores of 26 or higher were assigned to chemotherapy. All patients received standard adjuvant endocrine therapy. This study has completed accrual and results are pending. Of note, TAILORx and RxPONDER did not investigate the potential lack of benefit of endocrine therapy in cancers with high recurrence scores. Furthermore, despite data suggesting that chemotherapy may not even benefit women with 4 or more nodes involved but who have a low recurrence score,24 due to the lack of prospective data in this cohort and the quite high risk for distant recurrence, chemotherapy continues to be the standard of care for these patients.
PAM50 (Breast Cancer Prognostic Gene Signature)
Using microarray and quantitative reverse transcriptase PCR (RT-PCR) on formalin-fixed paraffin-embedded (FFPE) tissues, the Breast Cancer Prognostic Gene Signature (PAM50) assay was initially developed to identify intrinsic breast cancer subtypes, including luminal A, luminal B, HER2-enriched, and basal-like.7,29 Based on the prediction analysis of microarray (PAM) method, the assay measures the expression levels of 50 genes, provides a risk category (low, intermediate, and high), and generates a numerical risk of recurrence score (ROR). The intrinsic subtype and ROR have been shown to add significant prognostic value to the clinicopathological characteristics of tumors. Clinical validity of PAM50 was evaluated in postmenopausal women with HR-positive early-stage breast cancer treated in the prospective ATAC and ABCSG-8 (Austrian Breast and Colorectal Cancer Study Group 8) trials.30,31 In 1017 patients with ER-positive breast cancer treated with anastrozole or tamoxifen in the ATAC trial, ROR added significant prognostic information beyond the clinical treatment score (integrated prognostic information from nodal status, tumor size, histopathologic grade, age, and anastrozole or tamoxifen treatment) in all patients. Also, compared with the 21-gene recurrence score, ROR provided more prognostic information in ER-positive, node-negative disease and better differentiation of intermediate- and higher-risk groups. Fewer patients were categorized as intermediate risk by ROR and more as high risk, which could reduce the uncertainty in the estimate of clinical benefit from chemotherapy.30 The clinical utility of PAM50 as a prognostic model was also validated in 1478 postmenopausal women with ER-positive early-stage breast cancer enrolled in the ABCSG-8 trial. In this study, ROR assigned 47% of patients with node-negative disease to the low-risk category. In this low-risk group, the 10-year metastasis risk was less than 3.5%, indicating lack of benefit from additional chemotherapy.31 A key limitation of the PAM50 is the lack of any prospective studies with this assay.
PAM50 has been designed to be carried out in any qualified pathology laboratory. Moreover, the ROR score provides additional prognostic information about risk of late recurrence, which will be discussed in the next section.
70-Gene Breast Cancer Recurrence Assay (MammaPrint)
MammaPrint is a 70-gene assay that was initially developed using an unsupervised, hierarchical clustering algorithm on whole-genome expression arrays with early-stage breast cancer. Among 295 consecutive patients who had MammaPrint testing, those classified with a good-prognosis tumor signature (n = 115) had an excellent 10-year survival rate (94.5%) compared to those with a poor-prognosis signature (54.5%), and the signature remained prognostic upon multivariate analysis.32 Subsequently, a pooled analysis comparing outcomes by MammaPrint score in patients with node-negative or 1 to 3 node-positive breast cancers treated as per discretion of their medical team with either adjuvant chemotherapy plus endocrine therapy or endocrine therapy alone reported that only those patients with a high-risk score benefited from chemotherapy.33 Recently, a prospective phase 3 study (MINDACT [Microarray In Node negative Disease may Avoid ChemoTherapy]) evaluating the utility of MammaPrint for adjuvant chemotherapy decision-making reported results.34 In this study, 6693 women with early-stage breast cancer were assessed by clinical risk and genomic risk using MammaPrint. Those with low clinical and genomic risk did not receive chemotherapy, while those with high clinical and genomic risk all received chemotherapy. The primary goal of the study was to assess whether forgoing chemotherapy would be associated with a low rate of recurrence in those patients with a low-risk prognostic MammaPrint signature but high clinical risk. A total of 1550 patients (23.2%) were in the discordant group, and the majority of these patients had HR-positive disease (98.1%). Without chemotherapy, the rate of survival without distant metastasis at 5 years in this group was 94.7% (95% confidence interval [CI] 92.5% to 96.2%), which met the primary endpoint. Of note, initially, MammaPrint was only available for fresh tissue analysis, but recent advances in RNA processing now allow for this analysis on FFPE tissue.35
Summary
These genomic and biomarker assays can identify different subsets of HR-positive breast cancers, including those patients who have tumors with an excellent prognosis with endocrine therapies alone. Thus, we now have the tools to help avoid the toxicities of chemotherapy in many women with early-stage breast cancer.
Tests for Assessing Risk for Late Recurrence
Case Continued
The patient undergoes 21-gene recurrence score testing, which shows a low recurrence score of 10, estimating the 10-year risk of distant recurrence to be approximately 7% with 5 years of tamoxifen. Chemotherapy is not recommended. The patient completes adjuvant whole breast radiation therapy, and then, based on data supporting AIs over tamoxifen in postmenopausal women, she is started on anastrozole.41 She initially experiences mild side effects from treatment, including fatigue, arthralgia, and vaginal dryness, but her symptoms are able to be managed. As she approaches 5 years of adjuvant endocrine therapy with anastrozole, she is struggling with rotator cuff injury and is anxious about recurrence, but has no evidence of recurrent cancer. Her bone density scan in the beginning of her fourth year of therapy shows a decrease in bone mineral density, with the lowest T score of –1.5 at the left femoral neck, consistent with osteopenia. She has been treated with calcium and vitamin D supplements.
- How long should this patient continue treatment with anastrozole?
The risk for recurrence is highest during the first 5 years after diagnosis for all patients with early breast cancer.42 Although HR-positive breast cancers have a better prognosis than HR-negative disease, the pattern of recurrence is different between the 2 groups, and it is estimated that approximately half of the recurrences among patients with HR-positive early breast cancer occur after the first 5 years from diagnosis. Annualized hazard of recurrence in HR-positive breast cancer has been shown to remain elevated and fairly stable beyond 10 years, even for those with low tumor burden and node-negative disease.43 Prospective trials showed that for women with HR-positive early breast cancer, 5 years of adjuvant tamoxifen could substantially reduce recurrence rates and improve survival, and this became the standard of care.44 AIs are considered the standard of care for adjuvant endocrine therapy in most postmenopausal women, as they result in a significantly lower recurrence rate compared with tamoxifen, either as initial adjuvant therapy or sequentially following 2 to 3 years of tamoxifen.45
Due to the risk for later recurrences with HR-positive breast cancer, more patients and oncologists are considering extended endocrine therapy. This is based on results from the ATLAS (Adjuvant Tamoxifen: Longer Against Shorter) and aTTOM (Adjuvant Tamoxifen–To Offer More?) studies, both of which showed that women with HR-positive breast cancer who continued tamoxifen for 10 years had a lower late recurrence rate and a lower breast cancer mortality rate compared with those who stopped at 5 years.46,47 Furthermore, the NCIC MA.17 trial evaluated extended endocrine therapy in postmenopausal women with 5 years of letrozole following 5 years of tamoxifen. Letrozole was shown to improve both disease-free and distant disease-free survival. The overall survival benefit was limited to patients with node-positive disease.48 A summary of studies of extended endocrine therapy for HR-positive breast cancers is shown in Table 2.2,3,46–49
However, extending AI therapy from 5 years to 10 years is not clearly beneficial. In the MA.17R trial, although longer AI therapy resulted in significantly better disease-free survival (95% versus 91%, hazard ratio 0.66, P = 0.01), this was primarily due to a lower incidence of contralateral breast cancer in those taking the AI compared with placebo. The distant recurrence risks were similar and low (4.4% versus 5.5%), and there was no overall survival difference.2 Also, the NSABP B-42 study, which was presented at the 2016 San Antonio Breast Cancer Symposium, did not meet its predefined endpoint for benefit from extending adjuvant AI therapy with letrozole beyond 5 years.3 Thus, the absolute benefit from extended endocrine therapy has been modest across these studies. Although endocrine therapy is considered relatively safe and well tolerated, side effects can be significant and even associated with morbidity. Ideally, extended endocrine therapy should be offered to the subset of patients who would benefit the most. Several genomic diagnostic assays, including the EndoPredict test, PAM50, and the Breast Cancer Index (BCI) tests, specifically assess the risk for late recurrence in HR-positive cancers.
PAM50
Studies suggest that the ROR score also has value in predicting late recurrences. Analysis of data in patients enrolled in the ABCSG-8 trial showed that ROR could identify patients with endocrine-sensitive disease who are at low risk for late relapse and could be spared from unwanted toxicities of extended endocrine therapies. In 1246 ABCSG-8 patients between years 5 and 15, the PAM50 ROR demonstrated an absolute risk of distant recurrence of 2.4% in the low-risk group, as compared with 17.5% in the high-risk group.50 Also, a combined analysis of patients from both the ATAC and ABCSG-8 trials demonstrated the utility of ROR in identifying this subgroup of patients with low risk for late relapse.51
EndoPredict
EndoPredict is another quantitative RT-PCR–based assay which uses FFPE tissues to calculate a risk score based on 8 cancer-related and 3 reference genes. The score is combined with clinicopathological factors including tumor size and nodal status to make a comprehensive risk score (EPclin). EPclin is used to dichotomize patients into EndoPredict low- and high-risk groups. EndoPredict has been validated in 2 cohorts of patients enrolled in separate randomized studies, ABCSG-6 and ABCSG-8. EP provided prognostic information beyond clinicopathological variables to predict distant recurrence in patients with HR-positive/HER2-negative early breast cancer.37 More important, EndoPredict has been shown to predict early (years 0–5) versus late (> 5 years after diagnosis) recurrences and identify a low-risk subset of patients who would not be expected to benefit from further treatment beyond 5 years of endocrine therapy.52 Recently, EndoPredict and EPclin were compared with the 21-gene (Oncotype DX) recurrence score in a patient population from the TransATAC study. Both EndoPredict and EPclin provided more prognostic information compared to the 21-gene recurrence score and identified early and late relapse events.53 EndoPredict is the first multigene expression assay that could be routinely performed in decentralized molecular pathological laboratories with a short turnaround time.54
Breast Cancer Index
The BCI is a RT-PCR–based gene expression assay that consists of 2 gene expression biomarkers: molecular grade index (MGI) and HOXB13/IL17BR (H/I). The BCI was developed as a prognostic test to assess risk for breast cancer recurrence using a cohort of ER-positive patients (n = 588) treated with adjuvant tamoxifen versus observation from the prospective randomized Stockholm trial.38 In this blinded retrospective study, H/I and MGI were measured and a continuous risk model (BCI) was developed in the tamoxifen-treated group. More than 50% of the patients in this group were classified as having a low risk of recurrence. The rate of distant recurrence or death in this low-risk group at 10 years was less than 3%. The performance of the BCI model was then tested in the untreated arm of the Stockholm trial. In the untreated arm, BCI classified 53%, 27%, and 20% of patients as low, intermediate, and high risk, respectively. The rate of distant metastasis at 10 years in these risk groups was 8.3% (95% CI 4.7% to 14.4%), 22.9% (95% CI 14.5% to 35.2%), and 28.5% (95% CI 17.9% to 43.6%), respectively, and the rate of breast cancer–specific mortality was 5.1% (95% CI 1.3% to 8.7%), 19.8% (95% CI 10.0% to 28.6%), and 28.8% (95% CI 15.3% to 40.2%).38
The prognostic and predictive values of the BCI have been validated in other large, randomized studies and in patients with both node-negative and node-positive disease.39,55 The predictive value of the endocrine-response biomarker, the H/I ratio, has been demonstrated in randomized studies. In the MA.17 trial, a high H/I ratio was associated with increased risk for late recurrence in the absence of letrozole. However, extended endocrine therapy with letrozole in patients with high H/I ratios predicted benefit from therapy and decreased the probability of late disease recurrence.56 BCI was also compared to IHC4 and the 21-gene recurrence score in the TransATAC study and was the only test to show prognostic significance for both early (0–5 years) and late (5–10 year) recurrence.40
The impact of the BCI results on physicians’ recommendations for extended endocrine therapy was assessed by a prospective study. This study showed that the test result had a significant effect on both physician treatment recommendation and patient satisfaction. BCI testing resulted in a change in physician recommendations for extended endocrine therapy, with an overall decrease in recommendations for extended endocrine therapy from 74% to 54%. Knowledge of the test result also led to improved patient satisfaction and decreased anxiety.57
Summary
Due to the risk for late recurrence, extended endocrine therapy is being recommended for many patients with HR-positive breast cancers. Multiple genomic assays are being developed to better understand an individual’s risk for late recurrence and the potential for benefit from extended endocrine therapies. However, none of the assays has been validated in prospective randomized studies. Further validation is needed prior to routine use of these assays.
Case Continued
A BCI test is done and the result shows 4.3% BCI low-risk category in years 5–10, which is consistent with a low likelihood of benefit from extended endocrine therapy. After discussing the results of the BCI test in the context of no survival benefit from extending AIs beyond 5 years, both the patient and her oncologist feel comfortable with discontinuing endocrine therapy at the end of 5 years.
Conclusion
Reduction in breast cancer mortality is mainly the result of improved systemic treatments. With advances in breast cancer screening tools in recent years, the rate of cancer detection has increased. This has raised concerns regarding overdiagnosis. To prevent unwanted toxicities associated with overtreatment, better treatment decision tools are needed. Several genomic assays are currently available and widely used to provide prognostic and predictive information and aid in decisions regarding appropriate use of adjuvant chemotherapy in HR-positive/HER2-negative early-stage breast cancer. Ongoing studies are refining the cutoffs for these assays and expanding the applicability to node-positive breast cancers. Furthermore, with several studies now showing benefit from the use of extended endocrine therapy, some of these assays may be able to identify the subset of patients who are at increased risk for late recurrence and who might benefit from extended endocrine therapy. Advances in molecular testing has enabled clinicians to offer more personalized treatments to their patients, improve patients’ compliance, and decrease anxiety and conflict associated with management decisions. Although small numbers of patients with HER2-positive and triple-negative breast cancers were also included in some of these studies, use of genomic assays in this subset of patients is very limited and currently not recommended.
1. Welch HG, Prorok PC, O’Malley AJ, Kramer BS. Breast-cancer tumor size, overdiagnosis, and mammography screening effectiveness. N Engl J Med 2016;375:1438–47.
2. Goss PE, Ingle JN, Pritchard KI, et al. Extending aromatase-inhibitor adjuvant therapy to 10 years. N Engl J Med 2016;375:209–19.
3. Mamounas E, Bandos H, Lembersky B. A randomized, double-blinded, placebo-controlled clinical trial of extended adjuvant endocrine therapy with letrozole in postmenopausal women with hormone-receptor-positive breast cancer who have completed previous adjuvant treatment with an aromatase inhibitor. In: Proceedings from the San Antonio Breast Cancer Symposium; December 6–10, 2016; San Antonio, TX. Abstract S1-05.
4. Tjan-Heijnen VC, Van Hellemond IE, Peer PG, et al: First results from the multicenter phase III DATA study comparing 3 versus 6 years of anastrozole after 2-3 years of tamoxifen in postmenopausal women with hormone receptor-positive early breast cancer. In: Proceedings from the San Antonio Breast Cancer Symposium; December 6–10, 2016; San Antonio, TX. Abstract S1-03.
5. Blok EJ, Van de Velde CJH, Meershoek-Klein Kranenbarg EM, et al: Optimal duration of extended letrozole treatment after 5 years of adjuvant endocrine therapy. In: Proceedings from the San Antonio Breast Cancer Symposium; December 6–10, 2016; San Antonio, TX. Abstract S1-04.
6. Effects of chemotherapy and hormonal therapy for early breast cancer on recurrence and 15-year survival: an overview of the randomised trials. Early Breast Cancer Trialists’ Collaborative Group. Lancet 2005;365:1687–717.
7. Perou CM, Sorlie T, Eisen MB, et al. Molecular portraits of human breast tumours. Nature 2000;406:747–52.
8. Coates AS, Winer EP, Goldhirsch A, et al. Tailoring therapies--improving the management of early breast cancer: St Gallen International Expert Consensus on the Primary Therapy of Early Breast Cancer 2015. Ann Oncol 2015;26:1533–46.
9. Hanahan D, Weinberg RA. The hallmarks of cancer. Cell 2000;100:57–70.
10. Urruticoechea A, Smith IE, Dowsett M. Proliferation marker Ki-67 in early breast cancer. J Clin Oncol 2005;23:7212–20.
11. de Azambuja E, Cardoso F, de Castro G Jr, et al. Ki-67 as prognostic marker in early breast cancer: a meta-analysis of published studies involving 12,155 patients. Br J Cancer 2007;96:1504–13.
12. Petrelli F, Viale G, Cabiddu M, Barni S. Prognostic value of different cut-off levels of Ki-67 in breast cancer: a systematic review and meta-analysis of 64,196 patients. Breast Cancer Res Treat 2015;153:477–91.
13. Cheang MC, Chia SK, Voduc D, et al. Ki67 index, HER2 status, and prognosis of patients with luminal B breast cancer. J Natl Cancer Inst 2009;101:736–50.
14. Cuzick J, Dowsett M, Pineda S, et al. Prognostic value of a combined estrogen receptor, progesterone receptor, Ki-67, and human epidermal growth factor receptor 2 immunohistochemical score and com-parison with the Genomic Health recurrence score in early breast cancer. J Clin Oncol 2011;29:4273–8.
15. Pathmanathan N, Balleine RL. Ki67 and proliferation in breast cancer. J Clin Pathol 2013;66:512–6.
16. Denkert C, Budczies J, von Minckwitz G, et al. Strategies for developing Ki67 as a useful biomarker in breast cancer. Breast 2015; 24 Suppl 2:S67–72.
17. Ma CX, Bose R, Ellis MJ. Prognostic and predictive biomarkers of endocrine responsiveness for estrogen receptor positive breast cancer. Adv Exp Med Biol 2016;882:125–54.
18. Eiermann W, Paepke S, Appfelstaedt J, et al. Preoperative treatment of postmenopausal breast cancer patients with letrozole: a randomized double-blind multicenter study. Ann Oncol 2001;12:1527–32.
19. Smith IE, Dowsett M, Ebbs SR, et al. Neoadjuvant treatment of postmenopausal breast cancer with anastrozole, tamoxifen, or both in combination: the Immediate Preoperative Anas-trozole, Tamoxifen, or Combined with Tamoxifen (IMPACT) multicenter double-blind randomized trial. J Clin Oncol 2005;23:5108–16.
20. Ellis MJ, Tao Y, Luo J, et al. Outcome prediction for estrogen receptor-positive breast cancer based on postneoadjuvant endocrine therapy tumor characteristics. J Natl Cancer Inst 2008;100:1380–8.
21. Paik S, Shak S, Tang G, et al. A multigene assay to predict recurrence of tamoxifen-treated, node-negative breast cancer. N Engl J Med 2004;351:2817–26.
22. Fisher B, Jeong JH, Bryant J, et al. Treatment of lymph-node-negative, oestrogen-receptor-positive breast cancer: long-term findings from National Surgical Adjuvant Breast and Bowel Project randomised clinical trials. Lancet 2004;364:858–68.
23. Habel LA, Shak S, Jacobs MK, et al. A population-based study of tumor gene expression and risk of breast cancer death among lymph node-negative patients. Breast Cancer Res 2006;8:R25.
24. Albain KS, Barlow WE, Shak S, et al. Prognostic and predictive value of the 21-gene recurrence score assay in postmenopausal women with node-positive, oestrogen-receptor-positive breast cancer on chemotherapy: a retrospective analysis of a randomised trial. Lancet Oncol 2010;11:55–65.
25. Dowsett M, Cuzick J, Wale C, et al. Prediction of risk of distant recurrence using the 21-gene recurrence score in node-negative and node-positive postmenopausal patients with breast cancer treated with anastrozole or tamoxifen: a TransATAC study. J Clin Oncol 2010;28:1829–34.
26. Paik S, Shak S, Tang G, et al. Expression of the 21 genes in the recurrence score assay and tamoxifen clinical benefit in the NSABP study B-14 of node negative, estrogen receptor positive breast cancer. J Clin Oncol 2005;23: suppl:510.
27. Paik S, Tang G, Shak S, et al. Gene expression and benefit of chemotherapy in women with node-negative, estrogen receptor-positive breast cancer. J Clin Oncol 2006;24:3726–34.
28. Sparano JA, Gray RJ, Makower DF, et al. Prospective validation of a 21-gene expression assay in breast cancer. N Engl J Med 2015;373:2005–14.
29. Parker JS, Mullins M, Cheang MC, et al. Supervised risk predictor of breast cancer based on intrinsic subtypes. J Clin Oncol 2009;27:1160–7.
30. Dowsett M, Sestak I, Lopez-Knowles E, et al. Comparison of PAM50 risk of recurrence score with oncotype DX and IHC4 for predicting risk of distant recurrence after endocrine therapy. J Clin Oncol 2013;31:2783–90.
31. Gnant M, Filipits M, Greil R, et al. Predicting distant recurrence in receptor-positive breast cancer patients with limited clinicopathological risk: using the PAM50 Risk of Recurrence score in 1478 post-menopausal patients of the ABCSG-8 trial treated with adjuvant endocrine therapy alone. Ann Oncol 2014;25:339–45.
32. van de Vijver MJ, He YD, van’t Veer LJ, et al. A gene-expression signature as a predictor of survival in breast cancer. N Engl J Med 2002;347:1999–2009.
33. Knauer M, Mook S, Rutgers EJ, et al. The predictive value of the 70-gene signature for adjuvant chemotherapy in early breast cancer. Breast Cancer Res Treat 2010;120:655–61.
34. Cardoso F, van’t Veer LJ, Bogaerts J, et al. 70-gene signature as an aid to treatment decisions in early-stage breast cancer. N Engl J Med 2016;375:717–29.
35. Sapino A, Roepman P, Linn SC, et al. MammaPrint molecular diagnostics on formalin-fixed, paraffin-embedded tissue. J Mol Diagn 2014;16:190–7.
36. Nielsen TO, Parker JS, Leung S, et al. A comparison of PAM50 intrinsic subtyping with immunohistochemistry and clinical prognostic factors in tamoxifen-treated estrogen receptor-positive breast cancer. Clin Cancer Res 2010;16:5222–32.
37. Filipits M, Rudas M, Jakesz R, et al. A new molecular predictor of distant recurrence in ER-positive, HER2-negative breast cancer adds independent information to conventional clinical risk factors. Clin Cancer Res 2011;17:6012–20.
38. Jerevall PL, Ma XJ, Li H, et al. Prognostic utility of HOXB13:IL17BR and molecular grade index in early-stage breast cancer patients from the Stockholm trial. Br J Cancer 2011;104:1762–9.
39. Zhang Y, Schnabel CA, Schroeder BE, et al. Breast cancer index identifies early-stage estrogen receptor-positive breast cancer patients at risk for early- and late-distant recurrence. Clin Cancer Res 2013;19:4196–205.
40. Sgroi DC, Sestak I, Cuzick J, et al. Prediction of late distant recurrence in patients with oestrogen-receptor-positive breast cancer: a prospective comparison of the breast-cancer index (BCI) assay, 21-gene recurrence score, and IHC4 in the TransATAC study population. Lancet Oncol 2013;14:1067–76.
41. Burstein HJ, Griggs JJ, Prestrud AA, Temin S. American society of clinical oncology clinical practice guideline update on adjuvant endocrine therapy for women with hormone receptor-positive breast cancer. J Oncol Pract 2010;6:243–6.
42. Saphner T, Tormey DC, Gray R. Annual hazard rates of recurrence for breast cancer after primary therapy. J Clin Oncol 1996;14:2738–46.
43. Colleoni M, Sun Z, Price KN, et al. Annual hazard rates of recurrence for breast cancer during 24 years of follow-up: results from the International Breast Cancer Study Group Trials I to V. J Clin Oncol 2016;34:927–35.
44. Davies C, Godwin J, Gray R, et al. Relevance of breast cancer hormone receptors and other factors to the efficacy of adjuvant tamoxifen: patient-level meta-analysis of randomised trials. Lancet 2011;378:771–84.
45. Dowsett M, Forbes JF, Bradley R, et al. Aromatase inhibitors versus tamoxifen in early breast cancer: patient-level meta-analysis of the randomised trials. Lancet 2015;386:1341–52.
46. Davies C, Pan H, Godwin J, et al. Long-term effects of continuing adjuvant tamoxifen to 10 years versus stopping at 5 years after diagnosis of oestrogen receptor-positive breast cancer: ATLAS, a randomised trial. Lancet 2013;381:805–16.
47. Gray R, Rea D, Handley K, et al. aTTom: Long-term effects of continuing adjuvant tamoxifen to 10 years versus stopping at 5 years in 6,953 women with early breast cancer. J Clin Oncol 2013;31 (suppl):5.
48. Goss PE, Ingle JN, Martino S, et al. Randomized trial of letrozole following tamoxifen as extended adjuvant therapy in receptor-positive breast cancer: updated findings from NCIC CTG MA.17. J Natl Cancer Inst 2005;97:1262–71.
49. Mamounas EP, Jeong JH, Wickerham DL, et al. Benefit from exemestane as extended adjuvant therapy after 5 years of adjuvant tamoxifen: intention-to-treat analysis of the National Surgical Adjuvant Breast and Bowel Project B-33 trial. J Clin Oncol 2008;26:1965–71.
50. Filipits M, Nielsen TO, Rudas M, et al. The PAM50 risk-of-recurrence score predicts risk for late distant recurrence after endocrine therapy in postmenopausal women with endocrine-responsive early breast cancer. Clin Cancer Res 2014;20:1298–305.
51. Sestak I, Cuzick J, Dowsett M, et al. Prediction of late distant recurrence after 5 years of endocrine treatment: a combined analysis of patients from the Austrian breast and colorectal cancer study group 8 and arimidex, tamoxifen alone or in combination randomized trials using the PAM50 risk of recurrence score. J Clin Oncol 2015;33:916–22.
52. Dubsky P, Brase JC, Jakesz R, et al. The EndoPredict score provides prognostic information on late distant metastases in ER+/HER2- breast cancer patients. Br J Cancer 2013;109:2959–64.
53. Buus R, Sestak I, Kronenwett R, et al. Comparison of EndoPredict and EPclin with Oncotype DX Recurrence Score for prediction of risk of distant recurrence after endocrine therapy. J Natl Cancer Inst 2016;108:djw149.
54. Muller BM, Keil E, Lehmann A, et al. The EndoPredict gene-expression assay in clinical practice - performance and impact on clinical decisions. PLoS One 2013;8:e68252.
55. Sgroi DC, Chapman JA, Badovinac-Crnjevic T, et al. Assessment of the prognostic and predictive utility of the Breast Cancer Index (BCI): an NCIC CTG MA.14 study. Breast Cancer Res 2016;18:1.
56. Sgroi DC, Carney E, Zarrella E, et al. Prediction of late disease recurrence and extended adjuvant letrozole benefit by the HOXB13/IL17BR biomarker. J Natl Cancer Inst 2013;105:1036–42.
57. Sanft T, Aktas B, Schroeder B, et al. Prospective assessment of the decision-making impact of the Breast Cancer Index in recommending extended adjuvant endocrine therapy for patients with early-stage ER-positive breast cancer. Breast Cancer Res Treat 2015;154:533–41.
Guidance for the Clinical Management of Thirdhand Smoke Exposure in the Child Health Care Setting
From the Center for Child and Adolescent Health Research and Policy, Division of General Academic Pediatrics, Massachusetts General Hospital for Children, and the Tobacco Research and Treatment Center, Massachusetts General Hospital, Boston, MA.
Abstract
- Objective: To explain the concept of thirdhand smoke and how it can be used to protect the health of children and improve delivery of tobacco control interventions for parents in the child health care setting.
- Methods: Review of the literature and descriptive report.
- Results: The thirdhand smoke concept has been used in the CEASE intervention to improve the delivery of tobacco control counseling and services to parents. Materials and techniques have been developed for the child health care setting that use the concept of thirdhand smoke. Scientific findings demonstrate that thirdhand smoke exposure is harmful and establishes the need for clinicians to communicate the cessation imperative: the only way to protect non-smoking household members from thirdhand smoke is for all household smokers to quit smoking completely. As the scientific knowledge of thirdhand smoke increases, advocates will likely rely on it to encourage completely smoke-free places.
- Conclusion: Recent scientific studies on thirdhand smoke are impelling further research on the topic, spurring the creation of tobacco control policies to protect people from thridhand smoke and stimulating improvements to the delivery of tobacco control counseling and services to parents in child health care settings.
Key words: thirdhand smoke; smoking; tobacco; indoor air quality; smoking cessation; pediatrics.
While “thirdhand smoke” may be a relatively new term, it is rooted in an old concept—the particulate matter and residue from tobacco smoke left behind after tobacco is burned. In 1953, Dr. Ernest Wynder and his colleagues from the Washington University School of Medicine in St. Louis showed that condensate made from the residue of cigarette smoke causes cancer [1]. This residue left behind by burning cigarettes is now known as thirdhand smoke [2]. Dr. Wynder used acetone to rinse the leftover tobacco smoke residue from a smoking chamber where he had burned cigarettes. He then painted the solution of acetone and thirdhand smoke residue onto the backs of mice. The results of Dr. Wynder’s study demonstrated that exposed mice developed cancerous skin lesions, whereas mice exposed to the acetone alone did not display skin lesions. Dr. Wynder sounded an alarm bell in his manuscript when he wrote, “Such studies, in view of the corollary clinical data relating smoking to various types of cancer, appear urgent. They may result not only in furthering our knowledge of carcinogenesis, but in promoting some practical aspects of cancer prevention [1].”
Decades of research has been conducted since Dr. Wynder’s discovery to definitively conclude that smoking tobacco and exposure to secondhand tobacco smoke is harmful to human health. It is estimated that 480,000 annual premature deaths in the United States alone are attributable to smoking and exposure to secondhand smoke [3]. The World Health Organization estimates that worldwide tobacco use is responsible for more than 7 million deaths per year, with 890,000 of those deaths caused by secondhand smoke exposure of nonsmokers [4]. Epidemiological evidence of the harm posed by tobacco has spurred the U.S Surgeon General to conclude that there is no risk-free level of exposure to tobacco smoke [5]. Despite the overwhelming evidence implicating tobacco as the cause of an unprecedented amount of disease resulting from the use of a consumer product, only recently has a dedicated research agenda been pursued to study what Dr. Wynder urgently called for back in 1953: further exploration of the health effects of thirdhand tobacco smoke.
The term "thirdhand smoke" was first coined in 2006 by researchers with the Clinical Effort Against Secondhand Smoke Exposure (CEASE) program at Massachusetts General Hospital in Boston [6], and recent research has begun to shed considerable light on the topic. In 2011, a research consortium of scientists funded by the Tobacco-Related Disease Research Program [7] in California was set up to conduct pioneering research on the characterization, exposure and health effects of thirdhand tobacco smoke [8]. Research findings from this consortium and other scientists from around the world are quickly expanding and disseminating knowledge on this important topic.
While the research on thirdhand smoke is ongoing, this paper summarizes the current literature most relevant to the pediatric population and outlines clinical and policy recommendations to protect children and families from the harms of exposure to thirdhand smoke.
What Is Thirdhand Smoke and How Is It Different from Secondhand Smoke?
Thirdhand smoke is a result of combusted tobacco, most often from smoking cigarettes, pipes, cigars, or cigarillos. Thirdhand smoke remains on surfaces and in dust for a longtime after smoking happens, reacts with oxidants and other compounds to form secondary pollutants, and is re-emitted as a gas and/or resuspended when particles are disturbed and go back into the air where they can be inhaled [9]. One dramatic example of how thirdhand smoke can remain on surfaces long after secondhand smoke dissipates was discovered on the ornate constellation ceiling in the main concourse of the Grand Central Terminal in New York City. According to Sam Roberts, a correspondent for the New York Times and the author of a book about the historic train station, the dark residue that accumulated on the concourse ceiling over decades and was originally believed to be the result of soot from train engines was primarily residue from tobacco smoke [10–12]. It wasn’t until a restoration in the 1990s when workers scrubbed the tar and nicotine residue from the ceiling could the elaborate design of the zodiac signs and constellations be seen again [13]. A similar process takes place inside homes, where smoke residue accumulates on surfaces such as walls and ceilings after smoking happens. Owners of homes that have been previously smoked in are faced with unanswered questions about how to clean up the toxic substances left behind.
When tobacco is smoked, the particulates contained in secondhand smoke settle on surfaces; this contamination is absorbed deep into materials such as hair, clothes, carpeting, furniture, and wallboard [9,14]. After depositing onto surfaces, the chemicals undergo an aging process, which changes the chemical structure of the smoke pollutants. The nicotine in thirdhand smoke residue reacts with common indoor air pollutants, such as nitrous acid and ozone, to form hazardous substances. When the nicotine present in thirdhand smoke reacts with nitrous acid, it forms carcinogenic tobacco-specific nitrosamines such as NNK and NNN [15–17]. Nicotine also reacts with ozone to form additional harmful ultrafine particles that can embed deep within the lungs when inhaled [18]. As thirdhand smoke ages, it becomes more toxic [15]. The aged particles then undergo a process called “off-gassing,” in which gas is continuously re-emitted from these surfaces back into the air [19]. This process of off-gassing occurs long after cigarettes have been smoked indoors [19,20]. Thirdhand smoke particles can also be inhaled when they get resuspended into the air after contaminated surfaces are disturbed [21].
Common practices employed by smokers, like smoking in different rooms, using fans to diffuse the smoke, or opening windows, do not prevent the formation and inhalation of thirdhand smoke by people living or visiting these indoor spaces [22]. Environments with potential thirdhand smoke exposure include homes of smokers [23], apartments and homes previously occupied by smokers [24], multiunit housing where smoking is permitted [25], automobiles that have been smoked in [26], hotel rooms where smoking is permitted [27], and other indoor places where smoking has occurred.
Research Supports Having Completely Smoke-Free Environments
Recent research has shown that exposure to thirdhand smoke is harmful. These findings, many of which are described below, offer strong support in favor of advocating for environments free of thirdhand smoke contamination for families and children.
Genetic Damage from Thirdhand Smoke Exposure
In 2013, researchers from the Lawrence Berkeley National Laboratory were the first to demonstrate that thirdhand smoke causes significant genetic damage to human cells [28]. Using in vitro assays, the researchers showed that thirdhand smoke is a cause of harm to human DNA in the form of strand breaks and oxidative damage, which leads to mutations that can cause cancer. The researches also specifically tested the effect of NNA, a tobacco-specific nitrosamine that is commonly found in thirdhand smoke but not in secondhand smoke, on human cell cultures and found that it caused significant damage to DNA [28].
Children Show Elevated Biomarkers of Thirdhand Smoke Exposure in Their Urine and Hair Samples
In 2004, Matt and colleagues described how they collected household dust samples from living rooms and infants’ bedrooms [23]. Their research demonstrated that nicotine accumulated on the living room and infants’ bedroom surfaces of the homes belonging to smokers. Significantly higher amounts of urine cotinine, a biomarker for exposure to nicotine, were detected among infants who lived in homes where smoking happens inside compared to homes where smokers go outside to smoke [23]. As well, a study published in 2017 that measured the presence of hand nicotine on children of smokers who presented to the emergency room for an illness possibly related to tobacco smoke exposure detected hand nicotine on the hands of each child who participated in this pilot study. The researchers found a positive correlation between the amount of nicotine found on children’s hands and the amount of cotinine, a biomarker for nicotine exposure, detected in the children’s saliva [29].
Children Are Exposed to Higher Ratios of Thirdhand Smoke than Adults
In 2009, researchers discovered that the thirdhand smoke ratio of tobacco-specific nitrosamines to nicotine increases during the aging process [9]. Biomarkers measured in the urine can now be used to estimate the degree to which people have been exposed to secondhand or thirdhand smoke based on the ratio of the thirdhand smoke biomarker NNK and nicotine. Toddlers who live with adults who smoke have higher NNK/nicotine ratios, suggesting that they are exposed to a higher ratio of thirdhand smoke compared to secondhand smoke than adults [30]. Young children are likely exposed to higher ratios of thirdhand smoke as they spend more time on the floor, where thirdhand smoke accumulates. They frequently put their hands and other objects into their mouths. Young children breathe faster than adults, increasing their inhalation exposure and also have thinner skin, making dermal absorption more efficient [9].
Modeling Excess Cancer Risk
A 2014 United Kingdom study used official sources of toxicological data about chemicals detected in thirdhand smoke–contaminated homes to assess excess cancer risk posed from thirdhand smoke [17]. Using dust samples collected from homes where a smoker lived, they estimate that the median lifetime excess cancer risk from the exposure to all the nitrosamines present in thirdhand smoke is 9.6 additional cancer cases per 100,000 children exposed and could be as high as 1 excess cancer case per 1000 children exposed. The researchers concluded that young children aged 1 to 6 are at an especially increased risk for cancer because of their frequent contact with surfaces contaminated with thirdhand smoke and their ingestion of the particulate matter that settles on surfaces after smoking takes place [17].
Infants in Health Care Facilities Are Exposed to Thirdhand Smoke
Researchers have observed biomarkers confirming thirdhand smoke exposure in the urine of infants in the NICU. Found in incubators and cribs, particulates are likely being deposited in the NICU from visitors who have thirdhand smoke on their clothing, skin, and hair [31].
Animal Studies Link Thirdhand Smoke Exposure to Common Human Disease
Mice exposed to thirdhand smoke under conditions meant to simulate levels similar to human exposure are pre-diabetic, are at higher risk of developing metabolic syndrome, have inflammatory markers in the lungs that increase the risk for asthma, show slow wound healing, develop nonalcoholic fatty liver disease, and become behaviorally hyperactive [32]. Another recent study published in 2017 showed that mice exposed to thirdhand smoke after birth weighed less than mice not exposed to thirdhand smoke. Additionally, mice exposed to thirdhand smoke early in life showed changes in white blood cell counts that persisted into adulthood [9,33].
Summary
In summary, recent research makes a compelling case for invoking the precautionary principle to ensure that children avoid exposures to thirdhand smoke in their homes, cars, and healthcare settings. Studies reveal that:
- children live in homes where thirdhand smoke is present and this exposure is detectable in their bodies [23]
- concentrations of thirdhand smoke exposure observed in children are disproportionately higher than adults [30]
- chemicals present in thirdhand smoke cause damage to DNA [28]
- thirdhand smoke contains carcinogens that put exposed children at increased risk of cancer [17]
- thirdhand smoke is being detected within medical settings [34] and in the bodies of medically-vulnerable children [29], and
- animal studies have linked exposure to thirdhand smoke to a number of adverse health conditions commonly seen in today’s pediatric population such as metabolic syndrome, prediabetes, asthma, hyperactivity [32] and low birth weight [33].
Using the Thirdhand Smoke Concept in Clinical Practice
The clinical setting is an ideal place to address thirdhand smoke with families as a component of a comprehensive tobacco control strategy.
The Cessation Imperative—A Novel Motivational Message Prompted by Thirdhand Smoke
While there are potentially many ways to address thirdhand smoke exposure with families, the CEASE program has been used in the primary care setting to train child health care clinicians and office staff to address second- and thirdhand smoke. The training also educates clinicians on providing cessation counseling and resources to families with the goal of helping all family members become tobacco free, as well as to helping families keep completely smoke-free homes and cars [35,36]. The concept of thirdhand smoke creates what we have coined the cessation imperative [36]. The cessation imperative is based on the notion that the only way to protect non-smoking family and household members from thirdhand smoke is for all household smokers to quit smoking completely. Smoking, even when not in the presence of children, can expose others to toxic contaminates that settle on the surfaces of the home, the car as well as to the skin, hair, and clothing of family members who smoke. A discussion with parents about eliminating only secondhand smoke exposure for children does not adequately address how continued smoking, even when children are not present, can be harmful. The thirdhand smoke concept can be presented early, making it an efficient way to advocate for completely smoke-free families.
Thirdhand Smoke Counseling Helps Clinicians Achieve Key Tobacco Control Goals
The American Academy of Pediatrics (AAP) and the American Academy of Family Physicians (AAFP) recommend that health care providers deliver advice to parents regarding establishing smoke-free homes and cars and provide information about how their smoking adversely affects their children’s health [37,38]. It is AAP and AAFP policy that health care providers provide tobacco dependence treatment and referral to cessation services to help adult family members quit smoking [38,39]. Successfully integrating counseling around the topic of thirdhand smoke into existing smoking cessation service delivery is possible. The CEASE research and implementation team developed and disseminated educational content to clinicians about thirdhand smoke through AAP courses delivered online [40] as well as made presentations to clinicians at AAP-sponsored training sessions. Thirdhand smoke messaging has been included in the CEASE practice trainings so that participating clinicians in pediatric offices are equipped to engage parents on this topic. Further information about these educational resources and opportunities can be obtained from the AAP Julius B. Richmond Center of Excellence website [41] and from the Massachusetts General Hospital CEASE program’s website [42].
Counseling parents about thirdhand smoke can help assist parents with their smoking in the critical context of their child’s care. Most parents see their child’s health care clinician more often than their own [43]. Increasing the number of pediatric clinical encounters where parental smoking is addressed while also increasing the effectiveness of these clinical encounters by increasing parents’ motivation to protect their children from tobacco smoke exposure are important goals. The topic of thirdhand smoke is a novel concept that clinicians can use to engage with parents around their smoking in a new way. Recent research conducted by the CEASE team suggests that counseling parents in the pediatric setting about thirdhand smoke can be useful in helping achieve tobacco control goals with families. Parent’s belief about thirdhand smoke is associated with the likelihood the parent will take concrete steps to protect their child. Parents who believe thirdhand smoke is harmful are more likely to protect their children from exposure by adopting strictly enforced smoke-free home and car rules [44]. Parents who changed their thirdhand smoke beliefs over the course of a year to believing that thirdhand smoke is harmful were more likely to try to quit smoking [44].
Child health care clinicians are effective at influencing parents’ beliefs about the potential harm thirdhand smoke poses to their children. Parents who received advice from pediatricians to quit smoking or to adopt smoke-free home or policies were more likely to believe that thirdhand smoke was harmful to the health of children [45]. Fathers (as compared with mothers) and parents who smoked more cigarettes each day were less likely to accept that thirdhand smoke is harmful to children [45]. Conversely, delivering effective educational messages and counseling around the topic of thirdhand smoke to parents may help promote smoke-free rules and acceptance of cessation assistance.
Protect Patients from Thirdhand Smoke Risks
All health care settings should be completely smoke-free. Smoking bans help protect all families and children from second and thirdhand smoke exposure. It is especially important for medically vulnerable children to visit facilities free from all forms of tobacco smoke contamination. CEASE trainings encourage practices to implement a zone of wellness on the grounds of the healthcare facility by completely banning smoking. The CEASE implementation team also trains practice leaders to reach out to all staff that use tobacco and offer resources and support for quitting. Having a non-smoking staff sets a great example for families who visit the healthcare facility, and reduces the likelihood of bringing thirdhand smoke contaminates into the facility. Creating a policy that addresses thirdhand smoke exposure is a concrete step that health care organizations can take to protect patients.
Thirdhand Smoke Resources Developed and/or Used by the CEASE Program
The CEASE program has developed and/or identified a number of clinical resources to educate parents and clinicians about thirdhand smoke. These free resources can enhance awareness of thirdhand smoke and help promote the use of the thirdhand smoke concept in clinical practice. 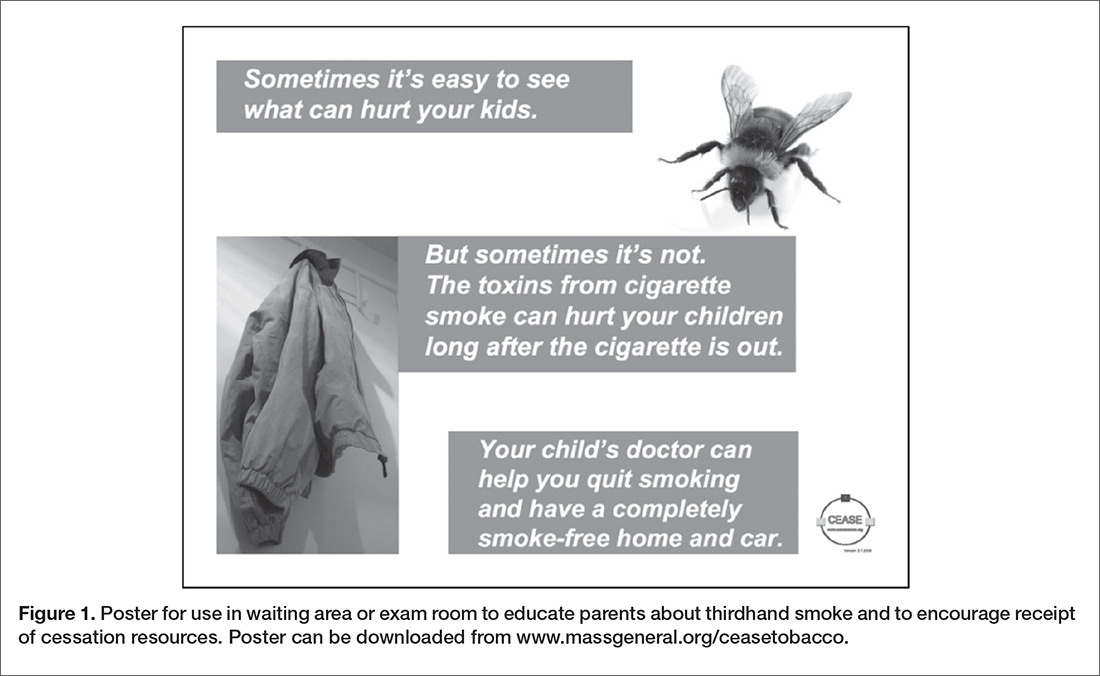
- Posters with messages designed to educate parents about thirdhand smoke to encourage receipt of cessation resources were created for use in waiting areas and exam rooms of child health care practices. A poster for clinical practice (Figure 1) can be downloaded and printed from the CEASE program website [42].
- Health education handouts that directly address thirdhand smoke exposure are available. The handouts can be taken home to family members who are not present at the visit and contain the telephone number for the tobacco quitline service, which connects smokers in the United States with free telephone support for smoking cessation. Handouts for clinical practice can be downloaded and printed from the CEASE program website. Figure 2 shows a handout that encourages parents to keep a smoke-free car by pointing out that tobacco smoke stays in the car long after the cigarette is out.

- Videos about thirdhand smoke can be viewed by parents while in child health care offices or shared on practice websites or social media platforms. The CEASE program encourages practices to distribute videos about thirdhand smoke to introduce parents to the concept of thirdhand smoke and to encourage parents to engage in a discussion with their child’s clinicians about ways to limit thirdhand smoke exposure. Suitable videos for parental viewing include the 2 listed below, which highlight information from the Thirdhand Smoke Research Consortium.
-University of California Riverside https://youtu.be/i1rhqRy-2e8
-San Diego State University https://youtu.be/rqzi-9sXLdU - Letters for landlords and management companies were created to stress the importance of providing a smoke-free living environment for children. The letters are meant to be signed by the child’s health care provider. The letters state that eliminating smoking in their buildings would result in landlords that “Pay less for cleaning and turnover fees.” Landlord letter templates can be downloaded and printed from the CEASE program website [42].
- Educational content for child health care clinicians about thirdhand smoke and how to counsel parents is included in the American Academy of Pediatrics Education in Quality Improvement for Pediatric Practice (EQIPP) online course entitled “Eliminating Tobacco” Use and Exposure to Secondhand Smoke. A section devoted to educating clinicians on the topic of thirdhand smoke is presented in this course. The course can be accessed through the AAP website and it qualifies for American Board of Pediatrics maintenance of certification part IV credit [40].

The CEASE team has worked with mass media outlets to communicate the messages about thirdhand smoke to build public awareness. The Today Show helped to popularize the concept of thirdhand smoke in 2009 after a paper published in the journal Pediatrics linked thirdhand smoke beliefs to home smoking bans [2].
Systems Approaches to Reduce Thirdhand Smoke Exposure
Public Policy Approaches
A clear policy agenda can help people protect their families from exposure to thirdhand smoke [46]. Policy approaches that have worked for lead, asbestos, and radon are examples of common household contaminants that are regulated using different mechanisms in an effort to protect the public health [46]. Strengths and weaknesses in each of these different approaches should be carefully considered when developing a comprehensive policy agenda to address thirdhand smoke. Recently, research on the health effects of thirdhand smoke spurred the passage of California legislative bill AB 1819 that “prohibits smoking tobacco at all times in the homes of licensed family child care homes and in areas where children are present [47].” As well, a recent US Department of Housing and Urban Development rule was finalized that requires all public housing agencies to implement a smoke-free policy by 30 July 2018 [48]. Smoke-free housing protects occupants from both secondhand and thirdhand smoke exposure. Pediatricians and other child health care professionals are well positioned to advocate for legislative actions that protect children from harmful exposures to thirdhand smoke.
Practice Change in Child Health Care Settings
Designing health care systems to screen for tobacco smoke exposure and to provide evidence-based cessation resources for all smokers is one of the best ways to reduce exposures to thirdhand smoke. Preventing thirdhand smoke exposure can work as novel messaging to promote tobacco cessation programs. Developing electronic medical record systems that allow for documentation of the smoking status of household members and whether or not homes and cars are completely smokefree can be particularly helpful tools for child health care providers when addressing thirdhand smoke with families. Good documentation about smoke-free homes and cars can enhance follow-up discussions with families as they work towards reducing thirdhand smoke exposures.
Summary
The thirdhand smoke concept has been used to improve delivery of tobacco control counseling and services for parents in the child health care context. Free materials are available that utilize thirdhand smoke messaging. As the science of thirdhand smoke matures, it will increasingly be used to help promote completely smoke-free places. The existing research on thirdhand smoke establishes the need for clinicians to communicate the cessation imperative. By using it, clinicians can help all smokers and non-smokers understand that there is no way to smoke tobacco without exposing friends and family.
Corresponding author: Jeremy E. Drehmer, MPH, 125 Nashua St., Suite 860, Boston, MA 02114, jdrehmer@ mgh.harvard.edu.
Financial disclosures: None
1. Wynder EL, Graham EA, Croninger AB, et al. Experimental production of carcinoma with cigarette tar experimental production of carcinoma with cigarette tar. 1953;36:855–64.
2. Winickoff JP, Friebely J, Tanski SE, et al. Beliefs about the health effects of “thirdhand” smoke and home smoking bans. Pediatrics 2009;123:e74–9.
3. US Department of Health and Human Services. The health consequences of smoking- 50 years of progress: a report of the Surgeon General, Executive Summary. 2014.
4. World Health Organization. Tobacco fact sheet [Internet]. [cited 2017 Aug 15]. Available at www.who.int/mediacentre/factsheets/fs339/en/.
5. U.S. Department of Health and Human Services. The health consequences of involuntary exposure to tobacco smoke: a report of the Surgeon General. Atlanta (GA); 2006.
6. Winickoff J, Friebely J, Tanski S, et al. Beliefs about the health effects of third-hand smoke predict home and car smoking bans. In: Poster presented at the 2006 Pediatric Academic Societies Meeting. San Francisco, CA; 2006.
7. Tobacco-Related Disease Research Program [Internet]. Accessed 2017 Jul 7 at www.trdrp.org.
8. Matt GE, Quintana PJ, Destaillats H, et al. Thirdhand tobacco smoke: emerging evidence and arguments for a multidisciplinary research agenda. Environ Health Perspect 2011;119:1218–26.
9. Jacob P, Benowitz NL, Destaillats H, et al. Thirdhand smoke: new evidence, challenges, and future directions. Chem Res Toxicol 2017;30:270–94.
10. Roberts S, Hamill P. Grand Central: how a train station transformed America. Grand Central Publishing; 2013.
11. Sachs S. From gritty depot, a glittery destination; refurbished Grand Central terminal, worthy of its name, is reopened. New York Times 1998 Oct 2.
12. Grand Central: an engine of scientific innovation [Internet]. National Public Radio - Talk of the Nation; 2013. Available at www.npr.org/templates/transcript/transcript.php?storyId=175054273.
13. Lueck TJ. Work starts 100 feet above Grand Central commuters. New York Times 1996 Sep 20.
14. Van Loy MD, Nazaroff WW, Daisey JM. Nicotine as a marker for environmental tobacco smoke: implications of sorption on indoor surface materials. J Air Waste Manag Assoc 1998;48:959–68.
15. Sleiman M, Gundel LA, Pankow JF, et al. Formation of carcinogens indoors by surface-mediated reactions of nicotine with nitrous acid, leading to potential thirdhand smoke hazards. Proc Natl Acad Sci U S A 2010;107:6576–81.
16. Xue J, Yang S, Seng S. Mechanisms of cancer induction by tobacco-specific NNK and NNN. Cancers (Basel) 2014;6:1138–56.
17. Ramirez N, Ozel MZ, Lewis AC, et al. Exposure to nitrosamines in thirdhand tobacco smoke increases cancer risk in non-smokers. Environ Int 2014;71:139–47.
18. Destaillats H, Singer BC, Lee SK, Gundel LA. Effect of ozone on nicotine desorption from model surfaces: evidence for heterogeneous chemistry. Environ Sci Technol 2006;40:1799–805.
19. Singer BC, Hodgson AT, Guevarra KS, et al. Gas-phase organics in environmental tobacco smoke. 1. Effects of smoking rate, ventilation, and furnishing level on emission factors. Env Sci Technol 2002;36:846–53.
20. Singer BC, Hodgson AT, Nazaroff WW. Gas-phase organics in environmental tobacco smoke: 2. Exposure-relevant emission factors and indirect exposures from habitual smoking. Atmos Environ 2003;37:5551–61.
21. Becquemin MH, Bertholon JF, Bentayeb M, et al. Third-hand smoking: indoor measurements of concentration and sizes of cigarette smoke particles after resuspension. Tob Control 2010;19:347–8.
22. Centers for Disease Control and Prevention [Internet]. How can we protect our children from secondhand smoke: a parent’s guide. Accessed 2017 Aug 15 at www.cdc.gov/tobacco/basic_information/secondhand_smoke/protect_children/pdfs/protect_children_guide.pdf.
23. Matt GE, Quintana PJ, Hovell MF, et al. Households contaminated by environmental tobacco smoke: sources of infant exposures. Tob Control 2004;13:29–37.
24. Matt GE, Quintana PJE, Zakarian JM, et al. When smokers move out and non-smokers move in: residential thirdhand smoke pollution and exposure. Tob Control 2011;20:e1.
25. Kraev TA, Adamkiewicz G, Hammond SK, Spengler JD. Indoor concentrations of nicotine in low-income, multi-unit housing: associations with smoking behaviours and housing characteristics. Tob Control 2009;18:438–44.
26. Matt GE, Quintana PJE, Hovell MF, et al. Residual tobacco smoke pollution in used cars for sale: air, dust, and surfaces. Nicotine Tob Res 2008;10:1467–75.
27. Matt GE, Quintana PJE, Fortmann AL, et al. Thirdhand smoke and exposure in California hotels: non-smoking rooms fail to protect non-smoking hotel guests from tobacco smoke exposure. Tob Control 2014;23:264–72.
28. Hang B, Sarker AH, Havel C, et al. Thirdhand smoke causes DNA damage in human cells. Mutagenesis 2013;28:381–91.
29. Mahabee-Gittens EM, Merianos AL, Matt GE. Preliminary evidence that high levels of nicotine on children’s hands may contribute to overall tobacco smoke exposure. Tob Control 2017 Mar 30.
30. Hovell MF, Zakarian JM, Matt GE, et al. Counseling to reduce children’s secondhand smoke exposure and help parents quit smoking: a controlled trial. Nicotine Tob Res 2009;11:1383–94.
31. Northrup TF, Khan AM, Jacob 3rd P, et al. Thirdhand smoke contamination in hospital settings: assessing exposure risk for vulnerable paediatric patients. Tob Control 2016; 25: 619–23.
32. Martins-Green M, Adhami N, Frankos M, et al. Cigarette smoke toxins deposited on surfaces: Implications for human health. PLoS One 2014;9:1–12.
33. Hang B, Snijders AM, Huang Y, et al. Early exposure to thirdhand cigarette smoke affects body mass and the development of immunity in mice. Sci Rep 2017;7:41915.
34. Northrup TF, Matt GE, Hovell MF, et al. Thirdhand smoke in the homes of medically fragile children: Assessing the impact of indoor smoking levels and smoking bans. Nicotine Tob Res 2016;18:1290–8.
35. Marbin JN, Purdy CN, Klaas K, et al. The Clinical Effort against Secondhand Smoke Exposure (CEASE) California: implementing a pediatric clinical intervention to reduce secondhand smoke exposure. Clin Pediatr (Phila) 2016;1(3).
36. Winickoff JP, Hipple B, Drehmer J, et al. The Clinical Effort Against Secondhand Smoke Exposure (CEASE) intervention: A decade of lessons learned. J Clin Outcomes Manag 2012;19:414–9.
37. Farber HJ, Groner J, Walley S, Nelson K. Protecting children from tobacco, nicotine, and tobacco smoke. Pediatrics 2015;136:e1439–67.
38. American Academy of Family Physicians [Internet]. AAFP policies. Tobacco use, prevention, and cessation. Accessed 2017 Aug 29 at www.aafp.org/about/policies/all/tobacco-smoking.html.
39. Farber HJ, Walley SC, Groner JA, et al. Clinical practice policy to protect children from tobacco, nicotine, and tobacco smoke. Pediatrics 2015;136:1008–17.
40. Drehmer J, Hipple B, Murphy S, Winickoff JP. EQIPP: Eliminating tobacco use and exposure to secondhand smoke [online course] PediaLink [Internet]. American Academy of Pediatrics. 2014. Available at bit.ly/eliminate-tobacco-responsive.
41. The American Academy of Pediatrics Julius B. Richmond Center of Excellence [Internet]. Accessed 2017 Aug 9 at www.aap.org/en-us/advocacy-and-policy/aap-health-initiatives/Richmond-Center/Pages/default.aspx.
42. Clinical Effort Against Secondhand Smoke Exposure [Internet]. Accessed at www.massgeneral.org/ceasetobacco/.
43. Winickoff JP, Nabi-Burza E, Chang Y, et al. Implementation of a parental tobacco control intervention in pediatric practice. Pediatrics 2013;132:109–17.
44. Drehmer JE, Ossip DJ, Nabi-Burza E, et al. Thirdhand smoke beliefs of parents. Pediatrics 2014;133:e850–6.
45. Drehmer JE, Ossip DJ, Rigotti NA, et al. Pediatrician interventions and thirdhand smoke beliefs of parents. Am J Prev Med 2012;43:533–6.
46. Samet JM, Chanson D, Wipfli H. The challenges of limiting exposure to THS in vulnerable populations. Curr Environ Health Rep 2015;2:215–25.
47. Thirdhand Smoke Research Consortium [Internet]. Accessed 2017 Aug 15 at www.trdrp.org/highlights-news-events/thirdhand-smoke-consortium.html.
48. Office of the Federal Register (US) [Internet]. Rule instituting smoke-free public housing. 2016. Available at www.federalregister.gov/documents/2016/12/05/2016-28986/instituting-smoke-free-public-housing.
From the Center for Child and Adolescent Health Research and Policy, Division of General Academic Pediatrics, Massachusetts General Hospital for Children, and the Tobacco Research and Treatment Center, Massachusetts General Hospital, Boston, MA.
Abstract
- Objective: To explain the concept of thirdhand smoke and how it can be used to protect the health of children and improve delivery of tobacco control interventions for parents in the child health care setting.
- Methods: Review of the literature and descriptive report.
- Results: The thirdhand smoke concept has been used in the CEASE intervention to improve the delivery of tobacco control counseling and services to parents. Materials and techniques have been developed for the child health care setting that use the concept of thirdhand smoke. Scientific findings demonstrate that thirdhand smoke exposure is harmful and establishes the need for clinicians to communicate the cessation imperative: the only way to protect non-smoking household members from thirdhand smoke is for all household smokers to quit smoking completely. As the scientific knowledge of thirdhand smoke increases, advocates will likely rely on it to encourage completely smoke-free places.
- Conclusion: Recent scientific studies on thirdhand smoke are impelling further research on the topic, spurring the creation of tobacco control policies to protect people from thridhand smoke and stimulating improvements to the delivery of tobacco control counseling and services to parents in child health care settings.
Key words: thirdhand smoke; smoking; tobacco; indoor air quality; smoking cessation; pediatrics.
While “thirdhand smoke” may be a relatively new term, it is rooted in an old concept—the particulate matter and residue from tobacco smoke left behind after tobacco is burned. In 1953, Dr. Ernest Wynder and his colleagues from the Washington University School of Medicine in St. Louis showed that condensate made from the residue of cigarette smoke causes cancer [1]. This residue left behind by burning cigarettes is now known as thirdhand smoke [2]. Dr. Wynder used acetone to rinse the leftover tobacco smoke residue from a smoking chamber where he had burned cigarettes. He then painted the solution of acetone and thirdhand smoke residue onto the backs of mice. The results of Dr. Wynder’s study demonstrated that exposed mice developed cancerous skin lesions, whereas mice exposed to the acetone alone did not display skin lesions. Dr. Wynder sounded an alarm bell in his manuscript when he wrote, “Such studies, in view of the corollary clinical data relating smoking to various types of cancer, appear urgent. They may result not only in furthering our knowledge of carcinogenesis, but in promoting some practical aspects of cancer prevention [1].”
Decades of research has been conducted since Dr. Wynder’s discovery to definitively conclude that smoking tobacco and exposure to secondhand tobacco smoke is harmful to human health. It is estimated that 480,000 annual premature deaths in the United States alone are attributable to smoking and exposure to secondhand smoke [3]. The World Health Organization estimates that worldwide tobacco use is responsible for more than 7 million deaths per year, with 890,000 of those deaths caused by secondhand smoke exposure of nonsmokers [4]. Epidemiological evidence of the harm posed by tobacco has spurred the U.S Surgeon General to conclude that there is no risk-free level of exposure to tobacco smoke [5]. Despite the overwhelming evidence implicating tobacco as the cause of an unprecedented amount of disease resulting from the use of a consumer product, only recently has a dedicated research agenda been pursued to study what Dr. Wynder urgently called for back in 1953: further exploration of the health effects of thirdhand tobacco smoke.
The term "thirdhand smoke" was first coined in 2006 by researchers with the Clinical Effort Against Secondhand Smoke Exposure (CEASE) program at Massachusetts General Hospital in Boston [6], and recent research has begun to shed considerable light on the topic. In 2011, a research consortium of scientists funded by the Tobacco-Related Disease Research Program [7] in California was set up to conduct pioneering research on the characterization, exposure and health effects of thirdhand tobacco smoke [8]. Research findings from this consortium and other scientists from around the world are quickly expanding and disseminating knowledge on this important topic.
While the research on thirdhand smoke is ongoing, this paper summarizes the current literature most relevant to the pediatric population and outlines clinical and policy recommendations to protect children and families from the harms of exposure to thirdhand smoke.
What Is Thirdhand Smoke and How Is It Different from Secondhand Smoke?
Thirdhand smoke is a result of combusted tobacco, most often from smoking cigarettes, pipes, cigars, or cigarillos. Thirdhand smoke remains on surfaces and in dust for a longtime after smoking happens, reacts with oxidants and other compounds to form secondary pollutants, and is re-emitted as a gas and/or resuspended when particles are disturbed and go back into the air where they can be inhaled [9]. One dramatic example of how thirdhand smoke can remain on surfaces long after secondhand smoke dissipates was discovered on the ornate constellation ceiling in the main concourse of the Grand Central Terminal in New York City. According to Sam Roberts, a correspondent for the New York Times and the author of a book about the historic train station, the dark residue that accumulated on the concourse ceiling over decades and was originally believed to be the result of soot from train engines was primarily residue from tobacco smoke [10–12]. It wasn’t until a restoration in the 1990s when workers scrubbed the tar and nicotine residue from the ceiling could the elaborate design of the zodiac signs and constellations be seen again [13]. A similar process takes place inside homes, where smoke residue accumulates on surfaces such as walls and ceilings after smoking happens. Owners of homes that have been previously smoked in are faced with unanswered questions about how to clean up the toxic substances left behind.
When tobacco is smoked, the particulates contained in secondhand smoke settle on surfaces; this contamination is absorbed deep into materials such as hair, clothes, carpeting, furniture, and wallboard [9,14]. After depositing onto surfaces, the chemicals undergo an aging process, which changes the chemical structure of the smoke pollutants. The nicotine in thirdhand smoke residue reacts with common indoor air pollutants, such as nitrous acid and ozone, to form hazardous substances. When the nicotine present in thirdhand smoke reacts with nitrous acid, it forms carcinogenic tobacco-specific nitrosamines such as NNK and NNN [15–17]. Nicotine also reacts with ozone to form additional harmful ultrafine particles that can embed deep within the lungs when inhaled [18]. As thirdhand smoke ages, it becomes more toxic [15]. The aged particles then undergo a process called “off-gassing,” in which gas is continuously re-emitted from these surfaces back into the air [19]. This process of off-gassing occurs long after cigarettes have been smoked indoors [19,20]. Thirdhand smoke particles can also be inhaled when they get resuspended into the air after contaminated surfaces are disturbed [21].
Common practices employed by smokers, like smoking in different rooms, using fans to diffuse the smoke, or opening windows, do not prevent the formation and inhalation of thirdhand smoke by people living or visiting these indoor spaces [22]. Environments with potential thirdhand smoke exposure include homes of smokers [23], apartments and homes previously occupied by smokers [24], multiunit housing where smoking is permitted [25], automobiles that have been smoked in [26], hotel rooms where smoking is permitted [27], and other indoor places where smoking has occurred.
Research Supports Having Completely Smoke-Free Environments
Recent research has shown that exposure to thirdhand smoke is harmful. These findings, many of which are described below, offer strong support in favor of advocating for environments free of thirdhand smoke contamination for families and children.
Genetic Damage from Thirdhand Smoke Exposure
In 2013, researchers from the Lawrence Berkeley National Laboratory were the first to demonstrate that thirdhand smoke causes significant genetic damage to human cells [28]. Using in vitro assays, the researchers showed that thirdhand smoke is a cause of harm to human DNA in the form of strand breaks and oxidative damage, which leads to mutations that can cause cancer. The researches also specifically tested the effect of NNA, a tobacco-specific nitrosamine that is commonly found in thirdhand smoke but not in secondhand smoke, on human cell cultures and found that it caused significant damage to DNA [28].
Children Show Elevated Biomarkers of Thirdhand Smoke Exposure in Their Urine and Hair Samples
In 2004, Matt and colleagues described how they collected household dust samples from living rooms and infants’ bedrooms [23]. Their research demonstrated that nicotine accumulated on the living room and infants’ bedroom surfaces of the homes belonging to smokers. Significantly higher amounts of urine cotinine, a biomarker for exposure to nicotine, were detected among infants who lived in homes where smoking happens inside compared to homes where smokers go outside to smoke [23]. As well, a study published in 2017 that measured the presence of hand nicotine on children of smokers who presented to the emergency room for an illness possibly related to tobacco smoke exposure detected hand nicotine on the hands of each child who participated in this pilot study. The researchers found a positive correlation between the amount of nicotine found on children’s hands and the amount of cotinine, a biomarker for nicotine exposure, detected in the children’s saliva [29].
Children Are Exposed to Higher Ratios of Thirdhand Smoke than Adults
In 2009, researchers discovered that the thirdhand smoke ratio of tobacco-specific nitrosamines to nicotine increases during the aging process [9]. Biomarkers measured in the urine can now be used to estimate the degree to which people have been exposed to secondhand or thirdhand smoke based on the ratio of the thirdhand smoke biomarker NNK and nicotine. Toddlers who live with adults who smoke have higher NNK/nicotine ratios, suggesting that they are exposed to a higher ratio of thirdhand smoke compared to secondhand smoke than adults [30]. Young children are likely exposed to higher ratios of thirdhand smoke as they spend more time on the floor, where thirdhand smoke accumulates. They frequently put their hands and other objects into their mouths. Young children breathe faster than adults, increasing their inhalation exposure and also have thinner skin, making dermal absorption more efficient [9].
Modeling Excess Cancer Risk
A 2014 United Kingdom study used official sources of toxicological data about chemicals detected in thirdhand smoke–contaminated homes to assess excess cancer risk posed from thirdhand smoke [17]. Using dust samples collected from homes where a smoker lived, they estimate that the median lifetime excess cancer risk from the exposure to all the nitrosamines present in thirdhand smoke is 9.6 additional cancer cases per 100,000 children exposed and could be as high as 1 excess cancer case per 1000 children exposed. The researchers concluded that young children aged 1 to 6 are at an especially increased risk for cancer because of their frequent contact with surfaces contaminated with thirdhand smoke and their ingestion of the particulate matter that settles on surfaces after smoking takes place [17].
Infants in Health Care Facilities Are Exposed to Thirdhand Smoke
Researchers have observed biomarkers confirming thirdhand smoke exposure in the urine of infants in the NICU. Found in incubators and cribs, particulates are likely being deposited in the NICU from visitors who have thirdhand smoke on their clothing, skin, and hair [31].
Animal Studies Link Thirdhand Smoke Exposure to Common Human Disease
Mice exposed to thirdhand smoke under conditions meant to simulate levels similar to human exposure are pre-diabetic, are at higher risk of developing metabolic syndrome, have inflammatory markers in the lungs that increase the risk for asthma, show slow wound healing, develop nonalcoholic fatty liver disease, and become behaviorally hyperactive [32]. Another recent study published in 2017 showed that mice exposed to thirdhand smoke after birth weighed less than mice not exposed to thirdhand smoke. Additionally, mice exposed to thirdhand smoke early in life showed changes in white blood cell counts that persisted into adulthood [9,33].
Summary
In summary, recent research makes a compelling case for invoking the precautionary principle to ensure that children avoid exposures to thirdhand smoke in their homes, cars, and healthcare settings. Studies reveal that:
- children live in homes where thirdhand smoke is present and this exposure is detectable in their bodies [23]
- concentrations of thirdhand smoke exposure observed in children are disproportionately higher than adults [30]
- chemicals present in thirdhand smoke cause damage to DNA [28]
- thirdhand smoke contains carcinogens that put exposed children at increased risk of cancer [17]
- thirdhand smoke is being detected within medical settings [34] and in the bodies of medically-vulnerable children [29], and
- animal studies have linked exposure to thirdhand smoke to a number of adverse health conditions commonly seen in today’s pediatric population such as metabolic syndrome, prediabetes, asthma, hyperactivity [32] and low birth weight [33].
Using the Thirdhand Smoke Concept in Clinical Practice
The clinical setting is an ideal place to address thirdhand smoke with families as a component of a comprehensive tobacco control strategy.
The Cessation Imperative—A Novel Motivational Message Prompted by Thirdhand Smoke
While there are potentially many ways to address thirdhand smoke exposure with families, the CEASE program has been used in the primary care setting to train child health care clinicians and office staff to address second- and thirdhand smoke. The training also educates clinicians on providing cessation counseling and resources to families with the goal of helping all family members become tobacco free, as well as to helping families keep completely smoke-free homes and cars [35,36]. The concept of thirdhand smoke creates what we have coined the cessation imperative [36]. The cessation imperative is based on the notion that the only way to protect non-smoking family and household members from thirdhand smoke is for all household smokers to quit smoking completely. Smoking, even when not in the presence of children, can expose others to toxic contaminates that settle on the surfaces of the home, the car as well as to the skin, hair, and clothing of family members who smoke. A discussion with parents about eliminating only secondhand smoke exposure for children does not adequately address how continued smoking, even when children are not present, can be harmful. The thirdhand smoke concept can be presented early, making it an efficient way to advocate for completely smoke-free families.
Thirdhand Smoke Counseling Helps Clinicians Achieve Key Tobacco Control Goals
The American Academy of Pediatrics (AAP) and the American Academy of Family Physicians (AAFP) recommend that health care providers deliver advice to parents regarding establishing smoke-free homes and cars and provide information about how their smoking adversely affects their children’s health [37,38]. It is AAP and AAFP policy that health care providers provide tobacco dependence treatment and referral to cessation services to help adult family members quit smoking [38,39]. Successfully integrating counseling around the topic of thirdhand smoke into existing smoking cessation service delivery is possible. The CEASE research and implementation team developed and disseminated educational content to clinicians about thirdhand smoke through AAP courses delivered online [40] as well as made presentations to clinicians at AAP-sponsored training sessions. Thirdhand smoke messaging has been included in the CEASE practice trainings so that participating clinicians in pediatric offices are equipped to engage parents on this topic. Further information about these educational resources and opportunities can be obtained from the AAP Julius B. Richmond Center of Excellence website [41] and from the Massachusetts General Hospital CEASE program’s website [42].
Counseling parents about thirdhand smoke can help assist parents with their smoking in the critical context of their child’s care. Most parents see their child’s health care clinician more often than their own [43]. Increasing the number of pediatric clinical encounters where parental smoking is addressed while also increasing the effectiveness of these clinical encounters by increasing parents’ motivation to protect their children from tobacco smoke exposure are important goals. The topic of thirdhand smoke is a novel concept that clinicians can use to engage with parents around their smoking in a new way. Recent research conducted by the CEASE team suggests that counseling parents in the pediatric setting about thirdhand smoke can be useful in helping achieve tobacco control goals with families. Parent’s belief about thirdhand smoke is associated with the likelihood the parent will take concrete steps to protect their child. Parents who believe thirdhand smoke is harmful are more likely to protect their children from exposure by adopting strictly enforced smoke-free home and car rules [44]. Parents who changed their thirdhand smoke beliefs over the course of a year to believing that thirdhand smoke is harmful were more likely to try to quit smoking [44].
Child health care clinicians are effective at influencing parents’ beliefs about the potential harm thirdhand smoke poses to their children. Parents who received advice from pediatricians to quit smoking or to adopt smoke-free home or policies were more likely to believe that thirdhand smoke was harmful to the health of children [45]. Fathers (as compared with mothers) and parents who smoked more cigarettes each day were less likely to accept that thirdhand smoke is harmful to children [45]. Conversely, delivering effective educational messages and counseling around the topic of thirdhand smoke to parents may help promote smoke-free rules and acceptance of cessation assistance.
Protect Patients from Thirdhand Smoke Risks
All health care settings should be completely smoke-free. Smoking bans help protect all families and children from second and thirdhand smoke exposure. It is especially important for medically vulnerable children to visit facilities free from all forms of tobacco smoke contamination. CEASE trainings encourage practices to implement a zone of wellness on the grounds of the healthcare facility by completely banning smoking. The CEASE implementation team also trains practice leaders to reach out to all staff that use tobacco and offer resources and support for quitting. Having a non-smoking staff sets a great example for families who visit the healthcare facility, and reduces the likelihood of bringing thirdhand smoke contaminates into the facility. Creating a policy that addresses thirdhand smoke exposure is a concrete step that health care organizations can take to protect patients.
Thirdhand Smoke Resources Developed and/or Used by the CEASE Program
The CEASE program has developed and/or identified a number of clinical resources to educate parents and clinicians about thirdhand smoke. These free resources can enhance awareness of thirdhand smoke and help promote the use of the thirdhand smoke concept in clinical practice.
- Posters with messages designed to educate parents about thirdhand smoke to encourage receipt of cessation resources were created for use in waiting areas and exam rooms of child health care practices. A poster for clinical practice (Figure 1) can be downloaded and printed from the CEASE program website [42].
- Health education handouts that directly address thirdhand smoke exposure are available. The handouts can be taken home to family members who are not present at the visit and contain the telephone number for the tobacco quitline service, which connects smokers in the United States with free telephone support for smoking cessation. Handouts for clinical practice can be downloaded and printed from the CEASE program website. Figure 2 shows a handout that encourages parents to keep a smoke-free car by pointing out that tobacco smoke stays in the car long after the cigarette is out.
- Videos about thirdhand smoke can be viewed by parents while in child health care offices or shared on practice websites or social media platforms. The CEASE program encourages practices to distribute videos about thirdhand smoke to introduce parents to the concept of thirdhand smoke and to encourage parents to engage in a discussion with their child’s clinicians about ways to limit thirdhand smoke exposure. Suitable videos for parental viewing include the 2 listed below, which highlight information from the Thirdhand Smoke Research Consortium.
-University of California Riverside https://youtu.be/i1rhqRy-2e8
-San Diego State University https://youtu.be/rqzi-9sXLdU - Letters for landlords and management companies were created to stress the importance of providing a smoke-free living environment for children. The letters are meant to be signed by the child’s health care provider. The letters state that eliminating smoking in their buildings would result in landlords that “Pay less for cleaning and turnover fees.” Landlord letter templates can be downloaded and printed from the CEASE program website [42].
- Educational content for child health care clinicians about thirdhand smoke and how to counsel parents is included in the American Academy of Pediatrics Education in Quality Improvement for Pediatric Practice (EQIPP) online course entitled “Eliminating Tobacco” Use and Exposure to Secondhand Smoke. A section devoted to educating clinicians on the topic of thirdhand smoke is presented in this course. The course can be accessed through the AAP website and it qualifies for American Board of Pediatrics maintenance of certification part IV credit [40].
The CEASE team has worked with mass media outlets to communicate the messages about thirdhand smoke to build public awareness. The Today Show helped to popularize the concept of thirdhand smoke in 2009 after a paper published in the journal Pediatrics linked thirdhand smoke beliefs to home smoking bans [2].
Systems Approaches to Reduce Thirdhand Smoke Exposure
Public Policy Approaches
A clear policy agenda can help people protect their families from exposure to thirdhand smoke [46]. Policy approaches that have worked for lead, asbestos, and radon are examples of common household contaminants that are regulated using different mechanisms in an effort to protect the public health [46]. Strengths and weaknesses in each of these different approaches should be carefully considered when developing a comprehensive policy agenda to address thirdhand smoke. Recently, research on the health effects of thirdhand smoke spurred the passage of California legislative bill AB 1819 that “prohibits smoking tobacco at all times in the homes of licensed family child care homes and in areas where children are present [47].” As well, a recent US Department of Housing and Urban Development rule was finalized that requires all public housing agencies to implement a smoke-free policy by 30 July 2018 [48]. Smoke-free housing protects occupants from both secondhand and thirdhand smoke exposure. Pediatricians and other child health care professionals are well positioned to advocate for legislative actions that protect children from harmful exposures to thirdhand smoke.
Practice Change in Child Health Care Settings
Designing health care systems to screen for tobacco smoke exposure and to provide evidence-based cessation resources for all smokers is one of the best ways to reduce exposures to thirdhand smoke. Preventing thirdhand smoke exposure can work as novel messaging to promote tobacco cessation programs. Developing electronic medical record systems that allow for documentation of the smoking status of household members and whether or not homes and cars are completely smokefree can be particularly helpful tools for child health care providers when addressing thirdhand smoke with families. Good documentation about smoke-free homes and cars can enhance follow-up discussions with families as they work towards reducing thirdhand smoke exposures.
Summary
The thirdhand smoke concept has been used to improve delivery of tobacco control counseling and services for parents in the child health care context. Free materials are available that utilize thirdhand smoke messaging. As the science of thirdhand smoke matures, it will increasingly be used to help promote completely smoke-free places. The existing research on thirdhand smoke establishes the need for clinicians to communicate the cessation imperative. By using it, clinicians can help all smokers and non-smokers understand that there is no way to smoke tobacco without exposing friends and family.
Corresponding author: Jeremy E. Drehmer, MPH, 125 Nashua St., Suite 860, Boston, MA 02114, jdrehmer@ mgh.harvard.edu.
Financial disclosures: None
1. Wynder EL, Graham EA, Croninger AB, et al. Experimental production of carcinoma with cigarette tar experimental production of carcinoma with cigarette tar. 1953;36:855–64.
2. Winickoff JP, Friebely J, Tanski SE, et al. Beliefs about the health effects of “thirdhand” smoke and home smoking bans. Pediatrics 2009;123:e74–9.
3. US Department of Health and Human Services. The health consequences of smoking- 50 years of progress: a report of the Surgeon General, Executive Summary. 2014.
4. World Health Organization. Tobacco fact sheet [Internet]. [cited 2017 Aug 15]. Available at www.who.int/mediacentre/factsheets/fs339/en/.
5. U.S. Department of Health and Human Services. The health consequences of involuntary exposure to tobacco smoke: a report of the Surgeon General. Atlanta (GA); 2006.
6. Winickoff J, Friebely J, Tanski S, et al. Beliefs about the health effects of third-hand smoke predict home and car smoking bans. In: Poster presented at the 2006 Pediatric Academic Societies Meeting. San Francisco, CA; 2006.
7. Tobacco-Related Disease Research Program [Internet]. Accessed 2017 Jul 7 at www.trdrp.org.
8. Matt GE, Quintana PJ, Destaillats H, et al. Thirdhand tobacco smoke: emerging evidence and arguments for a multidisciplinary research agenda. Environ Health Perspect 2011;119:1218–26.
9. Jacob P, Benowitz NL, Destaillats H, et al. Thirdhand smoke: new evidence, challenges, and future directions. Chem Res Toxicol 2017;30:270–94.
10. Roberts S, Hamill P. Grand Central: how a train station transformed America. Grand Central Publishing; 2013.
11. Sachs S. From gritty depot, a glittery destination; refurbished Grand Central terminal, worthy of its name, is reopened. New York Times 1998 Oct 2.
12. Grand Central: an engine of scientific innovation [Internet]. National Public Radio - Talk of the Nation; 2013. Available at www.npr.org/templates/transcript/transcript.php?storyId=175054273.
13. Lueck TJ. Work starts 100 feet above Grand Central commuters. New York Times 1996 Sep 20.
14. Van Loy MD, Nazaroff WW, Daisey JM. Nicotine as a marker for environmental tobacco smoke: implications of sorption on indoor surface materials. J Air Waste Manag Assoc 1998;48:959–68.
15. Sleiman M, Gundel LA, Pankow JF, et al. Formation of carcinogens indoors by surface-mediated reactions of nicotine with nitrous acid, leading to potential thirdhand smoke hazards. Proc Natl Acad Sci U S A 2010;107:6576–81.
16. Xue J, Yang S, Seng S. Mechanisms of cancer induction by tobacco-specific NNK and NNN. Cancers (Basel) 2014;6:1138–56.
17. Ramirez N, Ozel MZ, Lewis AC, et al. Exposure to nitrosamines in thirdhand tobacco smoke increases cancer risk in non-smokers. Environ Int 2014;71:139–47.
18. Destaillats H, Singer BC, Lee SK, Gundel LA. Effect of ozone on nicotine desorption from model surfaces: evidence for heterogeneous chemistry. Environ Sci Technol 2006;40:1799–805.
19. Singer BC, Hodgson AT, Guevarra KS, et al. Gas-phase organics in environmental tobacco smoke. 1. Effects of smoking rate, ventilation, and furnishing level on emission factors. Env Sci Technol 2002;36:846–53.
20. Singer BC, Hodgson AT, Nazaroff WW. Gas-phase organics in environmental tobacco smoke: 2. Exposure-relevant emission factors and indirect exposures from habitual smoking. Atmos Environ 2003;37:5551–61.
21. Becquemin MH, Bertholon JF, Bentayeb M, et al. Third-hand smoking: indoor measurements of concentration and sizes of cigarette smoke particles after resuspension. Tob Control 2010;19:347–8.
22. Centers for Disease Control and Prevention [Internet]. How can we protect our children from secondhand smoke: a parent’s guide. Accessed 2017 Aug 15 at www.cdc.gov/tobacco/basic_information/secondhand_smoke/protect_children/pdfs/protect_children_guide.pdf.
23. Matt GE, Quintana PJ, Hovell MF, et al. Households contaminated by environmental tobacco smoke: sources of infant exposures. Tob Control 2004;13:29–37.
24. Matt GE, Quintana PJE, Zakarian JM, et al. When smokers move out and non-smokers move in: residential thirdhand smoke pollution and exposure. Tob Control 2011;20:e1.
25. Kraev TA, Adamkiewicz G, Hammond SK, Spengler JD. Indoor concentrations of nicotine in low-income, multi-unit housing: associations with smoking behaviours and housing characteristics. Tob Control 2009;18:438–44.
26. Matt GE, Quintana PJE, Hovell MF, et al. Residual tobacco smoke pollution in used cars for sale: air, dust, and surfaces. Nicotine Tob Res 2008;10:1467–75.
27. Matt GE, Quintana PJE, Fortmann AL, et al. Thirdhand smoke and exposure in California hotels: non-smoking rooms fail to protect non-smoking hotel guests from tobacco smoke exposure. Tob Control 2014;23:264–72.
28. Hang B, Sarker AH, Havel C, et al. Thirdhand smoke causes DNA damage in human cells. Mutagenesis 2013;28:381–91.
29. Mahabee-Gittens EM, Merianos AL, Matt GE. Preliminary evidence that high levels of nicotine on children’s hands may contribute to overall tobacco smoke exposure. Tob Control 2017 Mar 30.
30. Hovell MF, Zakarian JM, Matt GE, et al. Counseling to reduce children’s secondhand smoke exposure and help parents quit smoking: a controlled trial. Nicotine Tob Res 2009;11:1383–94.
31. Northrup TF, Khan AM, Jacob 3rd P, et al. Thirdhand smoke contamination in hospital settings: assessing exposure risk for vulnerable paediatric patients. Tob Control 2016; 25: 619–23.
32. Martins-Green M, Adhami N, Frankos M, et al. Cigarette smoke toxins deposited on surfaces: Implications for human health. PLoS One 2014;9:1–12.
33. Hang B, Snijders AM, Huang Y, et al. Early exposure to thirdhand cigarette smoke affects body mass and the development of immunity in mice. Sci Rep 2017;7:41915.
34. Northrup TF, Matt GE, Hovell MF, et al. Thirdhand smoke in the homes of medically fragile children: Assessing the impact of indoor smoking levels and smoking bans. Nicotine Tob Res 2016;18:1290–8.
35. Marbin JN, Purdy CN, Klaas K, et al. The Clinical Effort against Secondhand Smoke Exposure (CEASE) California: implementing a pediatric clinical intervention to reduce secondhand smoke exposure. Clin Pediatr (Phila) 2016;1(3).
36. Winickoff JP, Hipple B, Drehmer J, et al. The Clinical Effort Against Secondhand Smoke Exposure (CEASE) intervention: A decade of lessons learned. J Clin Outcomes Manag 2012;19:414–9.
37. Farber HJ, Groner J, Walley S, Nelson K. Protecting children from tobacco, nicotine, and tobacco smoke. Pediatrics 2015;136:e1439–67.
38. American Academy of Family Physicians [Internet]. AAFP policies. Tobacco use, prevention, and cessation. Accessed 2017 Aug 29 at www.aafp.org/about/policies/all/tobacco-smoking.html.
39. Farber HJ, Walley SC, Groner JA, et al. Clinical practice policy to protect children from tobacco, nicotine, and tobacco smoke. Pediatrics 2015;136:1008–17.
40. Drehmer J, Hipple B, Murphy S, Winickoff JP. EQIPP: Eliminating tobacco use and exposure to secondhand smoke [online course] PediaLink [Internet]. American Academy of Pediatrics. 2014. Available at bit.ly/eliminate-tobacco-responsive.
41. The American Academy of Pediatrics Julius B. Richmond Center of Excellence [Internet]. Accessed 2017 Aug 9 at www.aap.org/en-us/advocacy-and-policy/aap-health-initiatives/Richmond-Center/Pages/default.aspx.
42. Clinical Effort Against Secondhand Smoke Exposure [Internet]. Accessed at www.massgeneral.org/ceasetobacco/.
43. Winickoff JP, Nabi-Burza E, Chang Y, et al. Implementation of a parental tobacco control intervention in pediatric practice. Pediatrics 2013;132:109–17.
44. Drehmer JE, Ossip DJ, Nabi-Burza E, et al. Thirdhand smoke beliefs of parents. Pediatrics 2014;133:e850–6.
45. Drehmer JE, Ossip DJ, Rigotti NA, et al. Pediatrician interventions and thirdhand smoke beliefs of parents. Am J Prev Med 2012;43:533–6.
46. Samet JM, Chanson D, Wipfli H. The challenges of limiting exposure to THS in vulnerable populations. Curr Environ Health Rep 2015;2:215–25.
47. Thirdhand Smoke Research Consortium [Internet]. Accessed 2017 Aug 15 at www.trdrp.org/highlights-news-events/thirdhand-smoke-consortium.html.
48. Office of the Federal Register (US) [Internet]. Rule instituting smoke-free public housing. 2016. Available at www.federalregister.gov/documents/2016/12/05/2016-28986/instituting-smoke-free-public-housing.
Barriers and Facilitators to Adopting Nursing Home Culture Change
From RTI International, Waltham, MA, and Brown University School of Public Health, Providence, RI.
Abstract
- Objective: To review the nursing home culture change literature and identify common barriers to and facilitators of nursing home culture change adoption. Nursing home culture change aims to make nursing homes less institutional by providing more resident-centered care, making environments more homelike, and empowering direct care staff.
- Methods: We reviewed the research literature on nursing home culture change, especially as related to implementation and outcomes.
- Results: Adoption of nursing home culture change practices has been steadily increasing in the past decade, but some practices are more likely to be adopted than others. A commonly reported barrier to culture change adoption is staff resistance to change. Studies suggest that this resistance can be overcome by changes to management practices, including good communication, providing training and education, and leadership support.
- Conclusion: The numerous benefits of nursing home culture change are apparent in the literature. Barriers to its adoption may be overcome by making improvements to nursing home management practices.
Nursing home culture change is a philosophy and combination of diverse practices aimed at making nursing homes less institutional and more resident-centered [1]. Nursing homes have been depicted as dehumanizing “total institutions” [2–4] in which the quality of residents’ lives and the quality of care are generally poor, daily life is medically regimented, only residents’ basic physical needs receive attention [5–8], and direct care workers are subject to poor working conditions for the lowest possible pay [9,10]. Since the 1980s, transforming the culture of nursing homes to be more humanizing, resident-centered, empowering, and homelike has been a primary mission of many stakeholder groups, including nursing home residents and care workers and their advocates [11].
Comprehensive culture change requires transformation of the nursing home environment from that of an institution to that of a home, implementation of more resident-centered care practices, empowerment of direct care staff, and flattening of the traditional organizational hierarchy so that residents and direct-care workers are actively involved in planning and implementing changes that empower them [12,13]. Culture change requires both technical changes, which are relatively straightforward efforts to address issues within a system while fundamentally keeping the system intact, and adaptive changes, which are more complex and entail reforming fundamental values that underlie the system and demand changes to the system itself [14,15].
Over time, nursing home culture change has gained widespread mainstream support. In 2009, the federal government issued new interpretive guidelines for use by nursing home inspectors that call for nursing homes to have more homelike environments and to support more resident-centered care [16]. The Centers for Medicare & Medicaid Services also required state quality improvement organizations to work with nursing homes on culture change efforts [1]. Some states effectively incentivize culture change by tying nursing home reimbursement rates and pay-for-performance policies to the implementation of culture change practices [17]. In addition to federal and state regulations, some nursing home corporations encourage or require facility administrators to implement culture change practices [18]. Overall, nursing homes are pushed to implement culture change practices on many fronts. The promise of beneficial outcomes of culture change also motivates implementation of some culture change practices [19].
In this article, we discuss the key elements of culture change, review the research examining the association between culture change and outcomes, identify key barriers to culture change, and offer suggestions from the literature for overcoming resistance to culture change.
Elements of Culture Change
Changing the Physical Environment
Changing the physical environment of nursing homes to be less institutional and more homelike is a core component of culture change [1]. These include both exterior and interior changes. Exterior changes can include adding walkways, patios, and gardens; interior changes include replacing nurses’ stations with desks, creating resident common areas, introducing the use of linens in dining areas, personalizing mailboxes outside of resident rooms, and adding small kitchens on units [20]. Other ideas for making environments more homelike include providing residents with the choice of colors for painting rooms and the choice of corridor/unit names and replacing public announcement systems with staff pagers [20].
Although changes to the physical environment may be considered cost-prohibitive, many of these changes entail minor and inexpensive enhancements that can help make environments more intimate and reminiscent of home than are traditional nursing homes [21,22]. Additionally, some environmental changes, such as adding raised gardens and walkways, can be designed not only to make the environment more homelike but also to help residents to engage in meaningful activities and connect to former roles, such as those of a homemaker, gardener, or farmer [21–23].
Providing Resident-Centered Care
Making care resident-centered entails enhancing resident choice and decision making and focusing the delivery of services on residents’ needs and preferences. According to Banaszak-Holl and colleagues [24], resident-centered approaches often emphasize the importance of shifting institutional norms and values and drawing employees’ attention to the needs of residents. This cultural shift in values and norms may be signaled by the implementation of practices that strengthen residents’ autonomy regarding everyday decisions. For example, as part of a resident-centered approach, residents would be offered choices and encouraged to make their own decisions about things personally affecting them, such as what to wear or when to go to bed, eating schedules, and menus [1,17,25].
Empowering Care Aides
Nursing home staff empowerment, particularly the empowerment of nursing assistants and other “hands-on” care aides—who are the predominant workforce in nursing homes and provide the vast bulk of care [26]—is a core component of culture change [1]. Such staff empowerment generally entails enhanced participation in decision making and increased autonomy. Staff empowerment practices that were examined in a national survey of nursing home directors [17] included:
- Staff work together to cover shifts when someone cannot come to work
- Staff cross-trained to perform tasks outside of their assigned job duties
- Staff involved in planning social events
- Nursing assistants take part in quality improvement teams
- Nursing assistants know when a resident’s care plan has changed
- Nursing assistants who receive extra training or education receive bonuses or raises
- Nursing assistants can choose which the residents for whom they provide care
We found that the staff empowerment practices most commonly implemented by nursing homes included nursing assistants knowing when a resident’s care plan has changed and staff working together to cover shifts when someone can’t come to work, but it was uncommon for nursing homes to permit nursing assistants to choose which residents they care for [17].
Outcomes of Culture Change
Research over the past 2 decades has examined the outcomes of culture change and the challenges involved in its implementation. Culture change is intended to improve the quality of life for nursing home residents, but the impact of culture change interventions is not clear. Shier and colleagues [27] conducted a comprehensive review of the peer-reviewed and gray literature on culture change published between 2005 and 2012 and found that studies varied widely in scope and evidence was inconsistent. They concluded that there is not yet sufficient evidence to provide specific guidance to nursing homes interested in implementing culture change [27]. The reviewed studies (27 peer-reviewed and 9 gray literature) also were noted to include small sample sizes and restricted geographic coverage, which both limit generalizability.
Although the literature had substantial limitations, Shier and colleagues [27] found numerous beneficial outcomes of culture change. Statistically significant improvements in numerous resident outcome measures were found to be associated with the implementation of culture change practices, including measures of resident quality of life/well-being, engagement and activities, functional status, satisfaction, mood (depression), anxiety/behavior/agitation, and pain/comfort. Two quality of care and services outcome measures also showed significant improvement associated with culture change practices, including increased completion of advance care plans and improved quality of workers’ approach to residents. Various staff outcome measures also showed significant improvement associated with culture change, including improvements in staff turnover/retention, satisfaction/well-being/burnout, absenteeism, knowledge, and attitude. Additionally, studies have shown culture change to be associated with improvements in select organizational outcome measures including operations costs, occupancy rates, revenue/profits, and family satisfaction. Four of the 36 studies reported negative outcomes of culture change. These negative outcomes included increased resident fear/anxiety [28], increased resident incontinence, decreased resident engagement in activities, decreased family engagement [29,30], decreased resident well-being [31], and increased physical incidents [32]. Notably, negative outcomes often co-occurred with positive outcomes [27,28].
To address the limitations of previous culture change research, such as small sample sizes and limited geographic coverage, and to explain some of the previous equivocal findings from quality studies when the extent of culture change practice implementation was not considered or measured, we collaborated on a national study to understand whether nursing home introduction of culture change practices is associated with improved quality [33]. We identified 824 U.S. nursing homes that had implemented some culture change practices, and we classified them by level of culture change practice implementation (high versus low). In nursing homes with high levels of culture change practice implementation, the introduction of nursing home culture change was associated with significant improvements in some care processes (eg, decreased prevalence of restraints, tube feeding, and pressure ulcers; increased proportion of residents on bladder training programs) and improvements in some resident outcomes, including slightly fewer hospitalizations. Among nursing homes with lower levels of culture change practice implementation, the introduction of culture change was associated with fewer health-related and quality-of-life survey deficiencies, but also with a significant increase in the number of resident hospitalizations [33]. Conclusive evidence regarding the impact of nursing homes implementing specific culture change practices or a comprehensive array of culture change practices on resident outcomes and quality of life remains needed, but numerous benefits of culture change are apparent in the literature.
Diffusion of Culture Change Practices
As culture change is widely supported and shows promise for beneficial outcomes, culture change practices are increasingly being implemented in nursing homes nationally. In 2007, a Commonwealth Fund survey found 56% of directors of nursing in U.S. nursing homes reported any culture change implementation or leadership commitment to implementation, but only 5% reported that culture change had completely changed the way the nursing home cared for residents in all areas of the nursing home [34]. In contrast, by 2010, 85% of directors of nursing reported at least partial culture change implementation and 13% reported that culture change had completely changed the way the nursing home cared for residents in all areas [14]. In a more recent survey of nursing home administrators, 16% reported that culture change had completely changed the way the nursing home cared for residents in all areas [35].
Barriers to Culture Change Implementation
Although the growth of culture change in the nursing home industry in the past decade has been impressive, implementation of comprehensive culture change has lagged behind. This is because one notable feature of nursing home culture change is that it is a philosophy that consists of many related practices. As noted above, implementing culture change can involve changes to physical environments, resident-centered care practices, and staff empowerment. This means that facilities can choose to implement as many or as few changes as they would like, and research has shown that there has been a lot of variation in which culture change practices are implemented. For example, in previous research we found that facilities interested in attracting highly reimbursed Medicare rehabilitation patients were more likely to implement hotel-style changes to their physical environments than they were to implement resident-centered care practices or forms of staff empowerment [19]. Sterns and colleagues [36] found that facilities were more likely to implement less complex practices (eg, allowing residents to choose when they go to bed) than more complex practices (eg, involving staff and residents in organizational decision making). The authors suggest that differences in commitment of facility leaders to comprehensive culture change may have contributed to these differences.
Attributes of facility leaders and other aspects of organizational context have been shown to contribute to more and less successful culture change implementation. For example, Scalzi and colleagues [37] found that some important barriers to culture change implementation were not involving all staff in culture change activities and a lack of corporate level support for these efforts. Schuldheis [38] examined differences in organizational context and its role in culture change among 9 Oregon facilities; 3 facilities successfully implemented culture change practices and 6 facilities did not. Results showed that a facility’s existing organizational culture, attention to sustainability, management practices, and staff involvement were important to the success of the initiative. Similarly, Rosemond and colleagues [39] conducted a study involving 8 North Carolina nursing homes. They determined that unsuccessful culture change initiatives could be attributed to the organizations’ readiness for change, a lack of high quality management communications, and unfavorable perceptions of culture change by direct-care workers. A study conducted in 4 nursing homes by Munroe et al [40] found that formal culture change training provided by professional trainers produced better outcomes than informal “train the trainer” sessions provided by other facility managers. Bowers and colleagues [41] also found that unsuccessful implementation of the Green House model of culture change was likely related to a lack of training resources for staff. Similarly, after an in-depth ethnographic study of culture change implementation, Lopez [42] found that it was unrealistic to expect direct-care workers to perform their jobs in radically new ways without being provided with ongoing support from management.
Resistance to Change: A Key Barrier
Our own research sought to understand the barriers and challenges nursing home administrators faced when implementing culture change in their facilities and the strategies they used to overcome them. In interviews conducted with 64 administrators who had participated in a previous nationally representative survey about culture change implementation, administrators reported a wide variety of barriers, including old and outdated physical plants, the costs of some changes, and issues with unions [18]. A key barrier that administrators reported facing was resistance to change on the part of nursing facility staff, residents, and residents’ family members [43]. Administrators reported that residents were resistant to change primarily because they had been institutionalized in their thinking. In other words, nursing homes had essentially trained residents to expect things to be done at certain times and in certain ways. Resistance among staff reportedly included resistance to the overall concept of culture change and to specific culture change practices. Often, staff perceived that changes related to culture change implementation involved additional work or effort on their part without additional resources, but this was not the only reason for resistance. Most often staff, especially longer-term staff, simply were resistant to making any changes to their usual routines or duties.
This type of resistance to change among staff is not unique to culture change implementation and has long been a commonly cited barrier in the organizational change literature. For example, in a 1954 Harvard Business Review article, Lawrence [44] stated that resistance to change was “the most baffling and recalcitrant of the problems which business executives face.” Since that time, resistance to change has been extensively studied as have methods for overcoming such resistance.
Recommendations for Overcoming Resistance to Culture Change
In seminal work on employee resistance to change conducted shortly after World War II, Coch and French [45] challenged the concept that resistance to change was the result of flaws or inadequacies on the part of staff, which would make addressing resistance difficult. Instead, they proposed, and proved through experimental methods, that resistance arose primarily from the context within which the changes were taking place. In other words, they found that managers could ameliorate resistance to change through changes to management and leadership practices. In their experiment, resistance to change in a manufacturing plant was overcome when management effectively communicated to staff the reasons for the change and engaged staff in planning for the desired changes. Studies on the barriers and facilitators of culture change implementation in nursing facilities have similarly found that facility leaders can take steps to address, or even avoid, staff resistance to change.
In our own research, we have found that resistance to change is a common barrier faced by facility leaders. We also found that resistance to change was unique among barriers in that, although strategies used to address other types of barriers varied widely, administrators consistently reported using the same strategies to address and overcome resistance to change. These strategies all involved management and leadership activities, including education and training and improved communication. In addition, administrators discussed in detail the ways they tailored education and communication to their facility’s unique needs. They also indicated that these efforts should be ongoing, communication should be two-way, and that all staff should be included [43].
Good Communication
One important tool for avoiding or overcoming resistance to culture change that facility administrators reported was good communication. They reported that open and bidirectional communication fostered feedback about ongoing culture change efforts and encouraged engagement and buy-in from staff. They also suggested that it is important that this type of communication be ongoing. Good communication about culture change, in particular, included providing a strong rationale for the changes and involved getting input from staff before and during implementation [43].
These findings are similar to other studies of culture change which have found that culture change implementation should involve staff at all levels [37] and that facility leaders should follow through on the plans that have been communicated [39]. Interestingly, the importance of good and open communication has also been identified as important to other forms of nursing facility quality improvement [46].
Training and Education
The facility administrators we interviewed also reported providing education and training for staff about culture change in a variety of ways, including as part of regular in-service training and as a component of new employee orientation. The training materials used were often obtained from the leading culture change organizations. However, importantly, administrators reported tailoring these trainings to the specific needs of their employees or unique context of their facility. For example, administrators reported breaking up long training sessions into shorter segments provided over a longer period of time or organizing trainings to be provided to small groups on the units rather than in more didactic conference-style settings [43]. Administrators explained that providing training in this way was more palatable to staff and helped incorporate learning into everyday care.
Other studies of nursing home culture change have also found training and education to be important to implementation. For example, in a study of a labor-management partnership for culture change implementation, Leutz and colleagues [47] found training of staff from all disciplines by culture change experts to be an important element of successful implementation. Training topics included those that were very general, such as gerontology, and very specific, including person-centered care. Staff were paid for their time participating in training, which took place at their facilities to make participation easier. The trainings were also staggered over the course of several months, so that staff had time to use what they had learned between sessions and could discuss their experiences at the later sessions.
Munroe and colleagues [40] conducted a study of culture change training using pre-post test survey methods and found that formal training had more of an effect on staff than informal training. In the study, staff at 2 facilities received formal education from a consulting group while staff at 2 other facilities then received informal training from the staff of one of the formally trained facilities. An important conclusion of the authors was that the formal training did a better job than the informal training of helping facility leaders and managers view their relationships with staff differently. This suggests that facility leaders and managers may have to alter their management styles to create the supportive context within which culture change efforts can succeed [48].
Leadership Support
Good communication and training/education can be thought of as 2 examples of leadership support, and support from facility leaders and managers has been found, in multiple studies, to be critical to successful culture change efforts. For example, in a recent study of nursing facility culture change in the Netherlands, Snoeren and colleagues [49] found that facility managers can facilitate culture change implementation by supporting a variety of staff needs and promoting the facilities’ new desired values. Another study found that facilities with leaders who are supportive and foster staff flexibility, such as allowing staff to be creative in their problem-solving and have decentralized decision-making, were more likely to report having implemented culture change [24].
In a study focused specifically on facility leadership style and its relation to culture change implementation, Corazzini and colleagues [50] found an adaptive leadership style to be important to culture change implementation. Adaptive leadership styles are ones that acknowledge the importance of staff relationships and recognize that complex changes, like those often implemented in culture change efforts, require complex solutions that will likely evolve over time. These authors conclude that culture change implementation necessitates development of new normative values and behaviors and can, therefore, not be accomplished by simply generating new rules and procedures [50].
Of course, not all nursing facility leaders have the management skills needed to perform in these adaptive and flexible ways. Therefore, management training for facility leaders may be an important first step in a facility’s culture change efforts [51]. This type of training may help improve communication skills and allow facility leaders to perform in more adaptive and flexible ways to better meet the needs of their particular facility and staff. Research also suggests that culture change training for facility leaders may help them to form new and better relationships with staff [40], an important element of culture change.
Conclusion
Nursing home culture change aims to improve care quality and resident satisfaction through changes to physical environments, resident care practices, and staff empowerment. These include both relatively simple technical changes and more complex changes. Nursing home managers and leaders have reported a variety of barriers to implementing nursing home culture change. A common barrier cited is staff resistance to change. Many decades of research in the organizational change literature and more recent research on culture change implementation suggest steps that facility managers and leaders can take to avoid or overcome this resistance. These steps include providing management support, especially in the form of good communication and training and education.
Corresponding author: Denise A. Tyler, PhD, RTI International, 307 Waverly Oaks Rd., Waltham, MA 02452, [email protected].
Financial disclosures: None.
1. Koren MJ. Person-centered care for nursing home residents: The culture-change movement. Health Affairs 2010;29:1–6.
2. Goffman E. Asylums: essays on the social situation of mental patients and other inmates. Garden City, NY: Anchor Books; 1961.
3. Kane RA, Caplan AL. Everyday ethics: resolving dilemmas in nursing home life. New York: Springer; 1990.
4. Mor V, Branco K, Fleishma J, et al. The structure of social engagement among nursing home residents. J Gerontol B Psycholog Sci Soc Sci 1995;50:P1–P8.
5. Foner N. The caregiving dilemma: work in an American nursing home. Berkeley, CA: University of California Press; 1993.
6. Gubrium J. Living and dying at Murray Manor. New York: St. Martins; 1976.
7. Kayser-Jones JS. Old, alone, and neglected: care of the aged in the United States and Scotland. Berkeley, CA: University of California Press; 1990.
8. Vladeck B. Unloving care: the nursing home tragedy. New York: Basic Books; 1980.
9. Diamond T. Social policy and everyday life in nursing homes: a critical ethnography. Soc Sci Med 1986;23:1287–95.
10. Kalleberg A, Reskin BF, Hudson K. Bad jobs in America: standard and nonstandard employment relations and job quality in the United States. Am Sociolog Rev 2000;65:256–78.
11. Rahman AN, Schnelle JF. The nursing home culture-change movement: recent past, present, and future directions for research. Gerontologist 2008;48:142–8.
12. White-Chu EF, Graves WJ, Godfrey SM, et al. Beyond the medical model: the culture change revolution in long-term care. J Am Med Dir Assoc 2009;10:370–8.
13. Misiorski S, Kahn K. Changing the culture of long-term care: Moving beyond programmatic change. J Soc Work Long-Term Care 2006;3:137–46.
14. Anderson RA, Bailey DEJ, Wu B, et al. Adaptive leadership framework for chronic illness: framing a research agenda for transforming care delivery. Adv Nurs Sci 2015;38:83–95.
15. Bailey DE, Docherty S, Adams JA, et al. Studying the clinical encounter with the adaptive leadership framework. J Healthc Leadersh 2012;4:83–91.
16. Centers for Medicare & Medicaid Services Manual System. Revisions to Appendix PP “Guidance to Surveyors of Long Term Care Facilities” Washington, DC: Department of Health and Human Services 2009. Accessed at http://www.cms.gov/Regulations-and-Guidance/Guidance/Transmittals/downloads/R48SOMA.pdf.
17. Miller SC, Looze J, Shield R, et al. Culture change practice in US nursing homes: prevalence and variation by state Medicaid reimbursement policies. Gerontologist 2014;54:434–45.
18. Shield R, Looze J, Tyler D, et al. Why and how do nursing homes implement culture change practices? Insights from qualitative interviews in a mixed methods study. J Appl Gerontol 2014;33:737–63.
19. Lepore MJ, Shield RR, Looze J, et al. Medicare and Medicaid reimbursement rates for nursing homes motivate select culture change practices but not comprehensive culture change. J Aging Soc Pol 2015;27:215–31.
20. Shield RR, Tyler D, Lepore M, et al. Would you do that in your home? Making nursing homes home-like in culture change implementation. J Housing Elderly 2014;28:383–98.
21. Cutler L, Kane RA. As great as all outdoors. J Hous Elderly 2006;19:29–48.
22. Jurkowsky ET. Implementing culture change in long-term care: Benchmarks and strategies for management and practice. New York: Springer; 2013.
23. Wang D , Glicksman A. “Being grounded”: Benefits of gardening for older adults in low-income housing. J Hous Elderly 2013;27:89–104.
24. Banaszak-Holl J, Castle NG, Lin M, Spreitzer G. An assessment of cultural values and resident-centered culture change in US nursing facilities. Healthc Manage Rev 2013;38:295.
25. White-Chu EF, Graves WJ, Godfrey SM, et al. Beyond the medical model: the culture change revolution in long-term care. J Am Med Dir Assoc 2009;10:370–8.
26. Stone RI. Developing a quality direct care workforce: searching for solutions. Pub Pol Aging Rep 2017.
27. Shier V, Khodyakov D, Cohen LW, et al. What does the evidence really say about culture change in nursing homes? Gerontologist 2014;54:S6–S16.
28. Fritsch T, Kwak J, Grant S, et al. Impact of TimeSlips, a creative expression intervention program, on nursing home residents with dementia and their caregivers. Gerontologist 2009;49:117–27.
29. Kane RA, Lum TY, Cutler LJ, et al. Resident outcomes in small-house nursing homes: a longitudinal evaluation of the initial Green House program. J Am Geriatr Soc 2007;55:832-9.
30. Lum TY, Kane RA, Cutler LJ, Yu TC. Effects of Green House nursing homes on residents’ families. Healthc Financ Rev 2008;30:35–51.
31. Brooker DJ, Woolley RJ, Lee D. Enriching opportunities for people living with dementia in nursing homes: an evaluation of a multi-level activity-based model of care. Aging Ment Health 2007;11:361–70.
32. Detweiler MB, Murphy PF, Myers LC, Kim KY. Does a wander garden influence inappropriate behaviors in dementia residents? Am J Alzheimers Dis Other Dement 2008;23:31–45.
33. Miller SC, Lepore M, Lima JC, et al. Does the introduction of nursing home culture change practices improve quality? J Am Geriatr Soc 2014;62:1675–82.
34. Doty MM, Koren MJ, Sturla EL. Culture change in nursing homes: how far have we come? Findings from the Commonweath Fund 2007 National Survey of Nursing Homes; 2008. Accessed at http://www.commonwealthfund.org/Publications/Fund-Reports/2008/May/Culture-Change-in-Nursing-Homes--How-Far-Have-We-Come--Findings-From-The-Commonwealth-Fund-2007-Nati.aspx.
35. Miller SC, Tyler D, Shield R, et al. Nursing home culture change: study framework and survey instrument design. Presentation at the International Association of Gerontology and Geriatrics meeting, San Francisco, CA; 2017.
36. Sterns S, Miller SC, Allen S. The complexity of implementing culture change practices in nursing homes. J Am Med Dir Assoc 2010;11:511–8.
37. Scalzi CC, Evans LK, Barstow A, Hostvedt K. Barriers and enablers to changing organizational culture in nursing homes. Nurs Admin Q 2006;30:368–72.
38. Schuldheis S. Initiating person-centered care practices in long-term care facilities. J Gerontol Nurs 2007;33:47.
39. Rosemond CA, Hanson LC, Ennett ST, et al. Implementing person-centered care in nursing homes. Healthc Manage Rev 2012;37:257–66.
40. Munroe DJ, Kaza PL, Howard D. Culture-change training: Nursing facility staff perceptions of culture change. Geriatr Nurs 2011;32:400–7.
41. Bowers BJ, Nolet K. Developing the Green House nursing care team: Variations on development and implementation. Gerontologist 2014;54:S53–64.
42. Lopez SH. Culture change management in long-term care: a shop-floor view. Pol Soc 2006;34:55–80.
43. Tyler DA, Lepore M, Shield RR, et al. Overcoming resistance to culture change: nursing home administrators’ use of education, training, and communication. Gerontol Geriatr Educ 2014;35:321–36.
44. Lawrence PR. How to deal with resistance to change. Harvard Bus Rev 1954;May/June:49–57.
45. Coch L, French JRP. Overcoming resistance to change. Hum Relat 1948;1:512–32.
46. Scott-Cawiezell J, Schenkman M, Moore L, et al. Exploring nursing home staff’s perceptions of communication and leadership to facilitate quality improvement. J Nurs Care Qual 2004;19:242–52.
47. Leutz W, Bishop CE, Dodson L. Role for a labor–management partnership in nursing home person-centered care. Gerontologist 2009;50:340–51.
48. Tyler DA, Parker VA. Nursing home culture, teamwork, and culture change. J Res Nurs 2011;16:37–49.
49. Snoeren MM, Janssen BM, Niessen TJ, Abma TA. Nurturing cultural change in care for older people: seeing the cherry tree blossom. Health Care Anal 2016;24:349–73.
50. Corazzini K, Twersky J, White HK, et al. Implementing culture change in nursing homes: an adaptive leadership framework. Gerontologist 2014;55:616–27.
51. Morgan JC, Haviland SB, Woodside MA, Konrad TR. Fostering supportive learning environments in long-term care: the case of WIN A STEP UP. Gerontol Geriatr Educ 2007;28:55–75.
From RTI International, Waltham, MA, and Brown University School of Public Health, Providence, RI.
Abstract
- Objective: To review the nursing home culture change literature and identify common barriers to and facilitators of nursing home culture change adoption. Nursing home culture change aims to make nursing homes less institutional by providing more resident-centered care, making environments more homelike, and empowering direct care staff.
- Methods: We reviewed the research literature on nursing home culture change, especially as related to implementation and outcomes.
- Results: Adoption of nursing home culture change practices has been steadily increasing in the past decade, but some practices are more likely to be adopted than others. A commonly reported barrier to culture change adoption is staff resistance to change. Studies suggest that this resistance can be overcome by changes to management practices, including good communication, providing training and education, and leadership support.
- Conclusion: The numerous benefits of nursing home culture change are apparent in the literature. Barriers to its adoption may be overcome by making improvements to nursing home management practices.
Nursing home culture change is a philosophy and combination of diverse practices aimed at making nursing homes less institutional and more resident-centered [1]. Nursing homes have been depicted as dehumanizing “total institutions” [2–4] in which the quality of residents’ lives and the quality of care are generally poor, daily life is medically regimented, only residents’ basic physical needs receive attention [5–8], and direct care workers are subject to poor working conditions for the lowest possible pay [9,10]. Since the 1980s, transforming the culture of nursing homes to be more humanizing, resident-centered, empowering, and homelike has been a primary mission of many stakeholder groups, including nursing home residents and care workers and their advocates [11].
Comprehensive culture change requires transformation of the nursing home environment from that of an institution to that of a home, implementation of more resident-centered care practices, empowerment of direct care staff, and flattening of the traditional organizational hierarchy so that residents and direct-care workers are actively involved in planning and implementing changes that empower them [12,13]. Culture change requires both technical changes, which are relatively straightforward efforts to address issues within a system while fundamentally keeping the system intact, and adaptive changes, which are more complex and entail reforming fundamental values that underlie the system and demand changes to the system itself [14,15].
Over time, nursing home culture change has gained widespread mainstream support. In 2009, the federal government issued new interpretive guidelines for use by nursing home inspectors that call for nursing homes to have more homelike environments and to support more resident-centered care [16]. The Centers for Medicare & Medicaid Services also required state quality improvement organizations to work with nursing homes on culture change efforts [1]. Some states effectively incentivize culture change by tying nursing home reimbursement rates and pay-for-performance policies to the implementation of culture change practices [17]. In addition to federal and state regulations, some nursing home corporations encourage or require facility administrators to implement culture change practices [18]. Overall, nursing homes are pushed to implement culture change practices on many fronts. The promise of beneficial outcomes of culture change also motivates implementation of some culture change practices [19].
In this article, we discuss the key elements of culture change, review the research examining the association between culture change and outcomes, identify key barriers to culture change, and offer suggestions from the literature for overcoming resistance to culture change.
Elements of Culture Change
Changing the Physical Environment
Changing the physical environment of nursing homes to be less institutional and more homelike is a core component of culture change [1]. These include both exterior and interior changes. Exterior changes can include adding walkways, patios, and gardens; interior changes include replacing nurses’ stations with desks, creating resident common areas, introducing the use of linens in dining areas, personalizing mailboxes outside of resident rooms, and adding small kitchens on units [20]. Other ideas for making environments more homelike include providing residents with the choice of colors for painting rooms and the choice of corridor/unit names and replacing public announcement systems with staff pagers [20].
Although changes to the physical environment may be considered cost-prohibitive, many of these changes entail minor and inexpensive enhancements that can help make environments more intimate and reminiscent of home than are traditional nursing homes [21,22]. Additionally, some environmental changes, such as adding raised gardens and walkways, can be designed not only to make the environment more homelike but also to help residents to engage in meaningful activities and connect to former roles, such as those of a homemaker, gardener, or farmer [21–23].
Providing Resident-Centered Care
Making care resident-centered entails enhancing resident choice and decision making and focusing the delivery of services on residents’ needs and preferences. According to Banaszak-Holl and colleagues [24], resident-centered approaches often emphasize the importance of shifting institutional norms and values and drawing employees’ attention to the needs of residents. This cultural shift in values and norms may be signaled by the implementation of practices that strengthen residents’ autonomy regarding everyday decisions. For example, as part of a resident-centered approach, residents would be offered choices and encouraged to make their own decisions about things personally affecting them, such as what to wear or when to go to bed, eating schedules, and menus [1,17,25].
Empowering Care Aides
Nursing home staff empowerment, particularly the empowerment of nursing assistants and other “hands-on” care aides—who are the predominant workforce in nursing homes and provide the vast bulk of care [26]—is a core component of culture change [1]. Such staff empowerment generally entails enhanced participation in decision making and increased autonomy. Staff empowerment practices that were examined in a national survey of nursing home directors [17] included:
- Staff work together to cover shifts when someone cannot come to work
- Staff cross-trained to perform tasks outside of their assigned job duties
- Staff involved in planning social events
- Nursing assistants take part in quality improvement teams
- Nursing assistants know when a resident’s care plan has changed
- Nursing assistants who receive extra training or education receive bonuses or raises
- Nursing assistants can choose which the residents for whom they provide care
We found that the staff empowerment practices most commonly implemented by nursing homes included nursing assistants knowing when a resident’s care plan has changed and staff working together to cover shifts when someone can’t come to work, but it was uncommon for nursing homes to permit nursing assistants to choose which residents they care for [17].
Outcomes of Culture Change
Research over the past 2 decades has examined the outcomes of culture change and the challenges involved in its implementation. Culture change is intended to improve the quality of life for nursing home residents, but the impact of culture change interventions is not clear. Shier and colleagues [27] conducted a comprehensive review of the peer-reviewed and gray literature on culture change published between 2005 and 2012 and found that studies varied widely in scope and evidence was inconsistent. They concluded that there is not yet sufficient evidence to provide specific guidance to nursing homes interested in implementing culture change [27]. The reviewed studies (27 peer-reviewed and 9 gray literature) also were noted to include small sample sizes and restricted geographic coverage, which both limit generalizability.
Although the literature had substantial limitations, Shier and colleagues [27] found numerous beneficial outcomes of culture change. Statistically significant improvements in numerous resident outcome measures were found to be associated with the implementation of culture change practices, including measures of resident quality of life/well-being, engagement and activities, functional status, satisfaction, mood (depression), anxiety/behavior/agitation, and pain/comfort. Two quality of care and services outcome measures also showed significant improvement associated with culture change practices, including increased completion of advance care plans and improved quality of workers’ approach to residents. Various staff outcome measures also showed significant improvement associated with culture change, including improvements in staff turnover/retention, satisfaction/well-being/burnout, absenteeism, knowledge, and attitude. Additionally, studies have shown culture change to be associated with improvements in select organizational outcome measures including operations costs, occupancy rates, revenue/profits, and family satisfaction. Four of the 36 studies reported negative outcomes of culture change. These negative outcomes included increased resident fear/anxiety [28], increased resident incontinence, decreased resident engagement in activities, decreased family engagement [29,30], decreased resident well-being [31], and increased physical incidents [32]. Notably, negative outcomes often co-occurred with positive outcomes [27,28].
To address the limitations of previous culture change research, such as small sample sizes and limited geographic coverage, and to explain some of the previous equivocal findings from quality studies when the extent of culture change practice implementation was not considered or measured, we collaborated on a national study to understand whether nursing home introduction of culture change practices is associated with improved quality [33]. We identified 824 U.S. nursing homes that had implemented some culture change practices, and we classified them by level of culture change practice implementation (high versus low). In nursing homes with high levels of culture change practice implementation, the introduction of nursing home culture change was associated with significant improvements in some care processes (eg, decreased prevalence of restraints, tube feeding, and pressure ulcers; increased proportion of residents on bladder training programs) and improvements in some resident outcomes, including slightly fewer hospitalizations. Among nursing homes with lower levels of culture change practice implementation, the introduction of culture change was associated with fewer health-related and quality-of-life survey deficiencies, but also with a significant increase in the number of resident hospitalizations [33]. Conclusive evidence regarding the impact of nursing homes implementing specific culture change practices or a comprehensive array of culture change practices on resident outcomes and quality of life remains needed, but numerous benefits of culture change are apparent in the literature.
Diffusion of Culture Change Practices
As culture change is widely supported and shows promise for beneficial outcomes, culture change practices are increasingly being implemented in nursing homes nationally. In 2007, a Commonwealth Fund survey found 56% of directors of nursing in U.S. nursing homes reported any culture change implementation or leadership commitment to implementation, but only 5% reported that culture change had completely changed the way the nursing home cared for residents in all areas of the nursing home [34]. In contrast, by 2010, 85% of directors of nursing reported at least partial culture change implementation and 13% reported that culture change had completely changed the way the nursing home cared for residents in all areas [14]. In a more recent survey of nursing home administrators, 16% reported that culture change had completely changed the way the nursing home cared for residents in all areas [35].
Barriers to Culture Change Implementation
Although the growth of culture change in the nursing home industry in the past decade has been impressive, implementation of comprehensive culture change has lagged behind. This is because one notable feature of nursing home culture change is that it is a philosophy that consists of many related practices. As noted above, implementing culture change can involve changes to physical environments, resident-centered care practices, and staff empowerment. This means that facilities can choose to implement as many or as few changes as they would like, and research has shown that there has been a lot of variation in which culture change practices are implemented. For example, in previous research we found that facilities interested in attracting highly reimbursed Medicare rehabilitation patients were more likely to implement hotel-style changes to their physical environments than they were to implement resident-centered care practices or forms of staff empowerment [19]. Sterns and colleagues [36] found that facilities were more likely to implement less complex practices (eg, allowing residents to choose when they go to bed) than more complex practices (eg, involving staff and residents in organizational decision making). The authors suggest that differences in commitment of facility leaders to comprehensive culture change may have contributed to these differences.
Attributes of facility leaders and other aspects of organizational context have been shown to contribute to more and less successful culture change implementation. For example, Scalzi and colleagues [37] found that some important barriers to culture change implementation were not involving all staff in culture change activities and a lack of corporate level support for these efforts. Schuldheis [38] examined differences in organizational context and its role in culture change among 9 Oregon facilities; 3 facilities successfully implemented culture change practices and 6 facilities did not. Results showed that a facility’s existing organizational culture, attention to sustainability, management practices, and staff involvement were important to the success of the initiative. Similarly, Rosemond and colleagues [39] conducted a study involving 8 North Carolina nursing homes. They determined that unsuccessful culture change initiatives could be attributed to the organizations’ readiness for change, a lack of high quality management communications, and unfavorable perceptions of culture change by direct-care workers. A study conducted in 4 nursing homes by Munroe et al [40] found that formal culture change training provided by professional trainers produced better outcomes than informal “train the trainer” sessions provided by other facility managers. Bowers and colleagues [41] also found that unsuccessful implementation of the Green House model of culture change was likely related to a lack of training resources for staff. Similarly, after an in-depth ethnographic study of culture change implementation, Lopez [42] found that it was unrealistic to expect direct-care workers to perform their jobs in radically new ways without being provided with ongoing support from management.
Resistance to Change: A Key Barrier
Our own research sought to understand the barriers and challenges nursing home administrators faced when implementing culture change in their facilities and the strategies they used to overcome them. In interviews conducted with 64 administrators who had participated in a previous nationally representative survey about culture change implementation, administrators reported a wide variety of barriers, including old and outdated physical plants, the costs of some changes, and issues with unions [18]. A key barrier that administrators reported facing was resistance to change on the part of nursing facility staff, residents, and residents’ family members [43]. Administrators reported that residents were resistant to change primarily because they had been institutionalized in their thinking. In other words, nursing homes had essentially trained residents to expect things to be done at certain times and in certain ways. Resistance among staff reportedly included resistance to the overall concept of culture change and to specific culture change practices. Often, staff perceived that changes related to culture change implementation involved additional work or effort on their part without additional resources, but this was not the only reason for resistance. Most often staff, especially longer-term staff, simply were resistant to making any changes to their usual routines or duties.
This type of resistance to change among staff is not unique to culture change implementation and has long been a commonly cited barrier in the organizational change literature. For example, in a 1954 Harvard Business Review article, Lawrence [44] stated that resistance to change was “the most baffling and recalcitrant of the problems which business executives face.” Since that time, resistance to change has been extensively studied as have methods for overcoming such resistance.
Recommendations for Overcoming Resistance to Culture Change
In seminal work on employee resistance to change conducted shortly after World War II, Coch and French [45] challenged the concept that resistance to change was the result of flaws or inadequacies on the part of staff, which would make addressing resistance difficult. Instead, they proposed, and proved through experimental methods, that resistance arose primarily from the context within which the changes were taking place. In other words, they found that managers could ameliorate resistance to change through changes to management and leadership practices. In their experiment, resistance to change in a manufacturing plant was overcome when management effectively communicated to staff the reasons for the change and engaged staff in planning for the desired changes. Studies on the barriers and facilitators of culture change implementation in nursing facilities have similarly found that facility leaders can take steps to address, or even avoid, staff resistance to change.
In our own research, we have found that resistance to change is a common barrier faced by facility leaders. We also found that resistance to change was unique among barriers in that, although strategies used to address other types of barriers varied widely, administrators consistently reported using the same strategies to address and overcome resistance to change. These strategies all involved management and leadership activities, including education and training and improved communication. In addition, administrators discussed in detail the ways they tailored education and communication to their facility’s unique needs. They also indicated that these efforts should be ongoing, communication should be two-way, and that all staff should be included [43].
Good Communication
One important tool for avoiding or overcoming resistance to culture change that facility administrators reported was good communication. They reported that open and bidirectional communication fostered feedback about ongoing culture change efforts and encouraged engagement and buy-in from staff. They also suggested that it is important that this type of communication be ongoing. Good communication about culture change, in particular, included providing a strong rationale for the changes and involved getting input from staff before and during implementation [43].
These findings are similar to other studies of culture change which have found that culture change implementation should involve staff at all levels [37] and that facility leaders should follow through on the plans that have been communicated [39]. Interestingly, the importance of good and open communication has also been identified as important to other forms of nursing facility quality improvement [46].
Training and Education
The facility administrators we interviewed also reported providing education and training for staff about culture change in a variety of ways, including as part of regular in-service training and as a component of new employee orientation. The training materials used were often obtained from the leading culture change organizations. However, importantly, administrators reported tailoring these trainings to the specific needs of their employees or unique context of their facility. For example, administrators reported breaking up long training sessions into shorter segments provided over a longer period of time or organizing trainings to be provided to small groups on the units rather than in more didactic conference-style settings [43]. Administrators explained that providing training in this way was more palatable to staff and helped incorporate learning into everyday care.
Other studies of nursing home culture change have also found training and education to be important to implementation. For example, in a study of a labor-management partnership for culture change implementation, Leutz and colleagues [47] found training of staff from all disciplines by culture change experts to be an important element of successful implementation. Training topics included those that were very general, such as gerontology, and very specific, including person-centered care. Staff were paid for their time participating in training, which took place at their facilities to make participation easier. The trainings were also staggered over the course of several months, so that staff had time to use what they had learned between sessions and could discuss their experiences at the later sessions.
Munroe and colleagues [40] conducted a study of culture change training using pre-post test survey methods and found that formal training had more of an effect on staff than informal training. In the study, staff at 2 facilities received formal education from a consulting group while staff at 2 other facilities then received informal training from the staff of one of the formally trained facilities. An important conclusion of the authors was that the formal training did a better job than the informal training of helping facility leaders and managers view their relationships with staff differently. This suggests that facility leaders and managers may have to alter their management styles to create the supportive context within which culture change efforts can succeed [48].
Leadership Support
Good communication and training/education can be thought of as 2 examples of leadership support, and support from facility leaders and managers has been found, in multiple studies, to be critical to successful culture change efforts. For example, in a recent study of nursing facility culture change in the Netherlands, Snoeren and colleagues [49] found that facility managers can facilitate culture change implementation by supporting a variety of staff needs and promoting the facilities’ new desired values. Another study found that facilities with leaders who are supportive and foster staff flexibility, such as allowing staff to be creative in their problem-solving and have decentralized decision-making, were more likely to report having implemented culture change [24].
In a study focused specifically on facility leadership style and its relation to culture change implementation, Corazzini and colleagues [50] found an adaptive leadership style to be important to culture change implementation. Adaptive leadership styles are ones that acknowledge the importance of staff relationships and recognize that complex changes, like those often implemented in culture change efforts, require complex solutions that will likely evolve over time. These authors conclude that culture change implementation necessitates development of new normative values and behaviors and can, therefore, not be accomplished by simply generating new rules and procedures [50].
Of course, not all nursing facility leaders have the management skills needed to perform in these adaptive and flexible ways. Therefore, management training for facility leaders may be an important first step in a facility’s culture change efforts [51]. This type of training may help improve communication skills and allow facility leaders to perform in more adaptive and flexible ways to better meet the needs of their particular facility and staff. Research also suggests that culture change training for facility leaders may help them to form new and better relationships with staff [40], an important element of culture change.
Conclusion
Nursing home culture change aims to improve care quality and resident satisfaction through changes to physical environments, resident care practices, and staff empowerment. These include both relatively simple technical changes and more complex changes. Nursing home managers and leaders have reported a variety of barriers to implementing nursing home culture change. A common barrier cited is staff resistance to change. Many decades of research in the organizational change literature and more recent research on culture change implementation suggest steps that facility managers and leaders can take to avoid or overcome this resistance. These steps include providing management support, especially in the form of good communication and training and education.
Corresponding author: Denise A. Tyler, PhD, RTI International, 307 Waverly Oaks Rd., Waltham, MA 02452, [email protected].
Financial disclosures: None.
1. Koren MJ. Person-centered care for nursing home residents: The culture-change movement. Health Affairs 2010;29:1–6.
2. Goffman E. Asylums: essays on the social situation of mental patients and other inmates. Garden City, NY: Anchor Books; 1961.
3. Kane RA, Caplan AL. Everyday ethics: resolving dilemmas in nursing home life. New York: Springer; 1990.
4. Mor V, Branco K, Fleishma J, et al. The structure of social engagement among nursing home residents. J Gerontol B Psycholog Sci Soc Sci 1995;50:P1–P8.
5. Foner N. The caregiving dilemma: work in an American nursing home. Berkeley, CA: University of California Press; 1993.
6. Gubrium J. Living and dying at Murray Manor. New York: St. Martins; 1976.
7. Kayser-Jones JS. Old, alone, and neglected: care of the aged in the United States and Scotland. Berkeley, CA: University of California Press; 1990.
8. Vladeck B. Unloving care: the nursing home tragedy. New York: Basic Books; 1980.
9. Diamond T. Social policy and everyday life in nursing homes: a critical ethnography. Soc Sci Med 1986;23:1287–95.
10. Kalleberg A, Reskin BF, Hudson K. Bad jobs in America: standard and nonstandard employment relations and job quality in the United States. Am Sociolog Rev 2000;65:256–78.
11. Rahman AN, Schnelle JF. The nursing home culture-change movement: recent past, present, and future directions for research. Gerontologist 2008;48:142–8.
12. White-Chu EF, Graves WJ, Godfrey SM, et al. Beyond the medical model: the culture change revolution in long-term care. J Am Med Dir Assoc 2009;10:370–8.
13. Misiorski S, Kahn K. Changing the culture of long-term care: Moving beyond programmatic change. J Soc Work Long-Term Care 2006;3:137–46.
14. Anderson RA, Bailey DEJ, Wu B, et al. Adaptive leadership framework for chronic illness: framing a research agenda for transforming care delivery. Adv Nurs Sci 2015;38:83–95.
15. Bailey DE, Docherty S, Adams JA, et al. Studying the clinical encounter with the adaptive leadership framework. J Healthc Leadersh 2012;4:83–91.
16. Centers for Medicare & Medicaid Services Manual System. Revisions to Appendix PP “Guidance to Surveyors of Long Term Care Facilities” Washington, DC: Department of Health and Human Services 2009. Accessed at http://www.cms.gov/Regulations-and-Guidance/Guidance/Transmittals/downloads/R48SOMA.pdf.
17. Miller SC, Looze J, Shield R, et al. Culture change practice in US nursing homes: prevalence and variation by state Medicaid reimbursement policies. Gerontologist 2014;54:434–45.
18. Shield R, Looze J, Tyler D, et al. Why and how do nursing homes implement culture change practices? Insights from qualitative interviews in a mixed methods study. J Appl Gerontol 2014;33:737–63.
19. Lepore MJ, Shield RR, Looze J, et al. Medicare and Medicaid reimbursement rates for nursing homes motivate select culture change practices but not comprehensive culture change. J Aging Soc Pol 2015;27:215–31.
20. Shield RR, Tyler D, Lepore M, et al. Would you do that in your home? Making nursing homes home-like in culture change implementation. J Housing Elderly 2014;28:383–98.
21. Cutler L, Kane RA. As great as all outdoors. J Hous Elderly 2006;19:29–48.
22. Jurkowsky ET. Implementing culture change in long-term care: Benchmarks and strategies for management and practice. New York: Springer; 2013.
23. Wang D , Glicksman A. “Being grounded”: Benefits of gardening for older adults in low-income housing. J Hous Elderly 2013;27:89–104.
24. Banaszak-Holl J, Castle NG, Lin M, Spreitzer G. An assessment of cultural values and resident-centered culture change in US nursing facilities. Healthc Manage Rev 2013;38:295.
25. White-Chu EF, Graves WJ, Godfrey SM, et al. Beyond the medical model: the culture change revolution in long-term care. J Am Med Dir Assoc 2009;10:370–8.
26. Stone RI. Developing a quality direct care workforce: searching for solutions. Pub Pol Aging Rep 2017.
27. Shier V, Khodyakov D, Cohen LW, et al. What does the evidence really say about culture change in nursing homes? Gerontologist 2014;54:S6–S16.
28. Fritsch T, Kwak J, Grant S, et al. Impact of TimeSlips, a creative expression intervention program, on nursing home residents with dementia and their caregivers. Gerontologist 2009;49:117–27.
29. Kane RA, Lum TY, Cutler LJ, et al. Resident outcomes in small-house nursing homes: a longitudinal evaluation of the initial Green House program. J Am Geriatr Soc 2007;55:832-9.
30. Lum TY, Kane RA, Cutler LJ, Yu TC. Effects of Green House nursing homes on residents’ families. Healthc Financ Rev 2008;30:35–51.
31. Brooker DJ, Woolley RJ, Lee D. Enriching opportunities for people living with dementia in nursing homes: an evaluation of a multi-level activity-based model of care. Aging Ment Health 2007;11:361–70.
32. Detweiler MB, Murphy PF, Myers LC, Kim KY. Does a wander garden influence inappropriate behaviors in dementia residents? Am J Alzheimers Dis Other Dement 2008;23:31–45.
33. Miller SC, Lepore M, Lima JC, et al. Does the introduction of nursing home culture change practices improve quality? J Am Geriatr Soc 2014;62:1675–82.
34. Doty MM, Koren MJ, Sturla EL. Culture change in nursing homes: how far have we come? Findings from the Commonweath Fund 2007 National Survey of Nursing Homes; 2008. Accessed at http://www.commonwealthfund.org/Publications/Fund-Reports/2008/May/Culture-Change-in-Nursing-Homes--How-Far-Have-We-Come--Findings-From-The-Commonwealth-Fund-2007-Nati.aspx.
35. Miller SC, Tyler D, Shield R, et al. Nursing home culture change: study framework and survey instrument design. Presentation at the International Association of Gerontology and Geriatrics meeting, San Francisco, CA; 2017.
36. Sterns S, Miller SC, Allen S. The complexity of implementing culture change practices in nursing homes. J Am Med Dir Assoc 2010;11:511–8.
37. Scalzi CC, Evans LK, Barstow A, Hostvedt K. Barriers and enablers to changing organizational culture in nursing homes. Nurs Admin Q 2006;30:368–72.
38. Schuldheis S. Initiating person-centered care practices in long-term care facilities. J Gerontol Nurs 2007;33:47.
39. Rosemond CA, Hanson LC, Ennett ST, et al. Implementing person-centered care in nursing homes. Healthc Manage Rev 2012;37:257–66.
40. Munroe DJ, Kaza PL, Howard D. Culture-change training: Nursing facility staff perceptions of culture change. Geriatr Nurs 2011;32:400–7.
41. Bowers BJ, Nolet K. Developing the Green House nursing care team: Variations on development and implementation. Gerontologist 2014;54:S53–64.
42. Lopez SH. Culture change management in long-term care: a shop-floor view. Pol Soc 2006;34:55–80.
43. Tyler DA, Lepore M, Shield RR, et al. Overcoming resistance to culture change: nursing home administrators’ use of education, training, and communication. Gerontol Geriatr Educ 2014;35:321–36.
44. Lawrence PR. How to deal with resistance to change. Harvard Bus Rev 1954;May/June:49–57.
45. Coch L, French JRP. Overcoming resistance to change. Hum Relat 1948;1:512–32.
46. Scott-Cawiezell J, Schenkman M, Moore L, et al. Exploring nursing home staff’s perceptions of communication and leadership to facilitate quality improvement. J Nurs Care Qual 2004;19:242–52.
47. Leutz W, Bishop CE, Dodson L. Role for a labor–management partnership in nursing home person-centered care. Gerontologist 2009;50:340–51.
48. Tyler DA, Parker VA. Nursing home culture, teamwork, and culture change. J Res Nurs 2011;16:37–49.
49. Snoeren MM, Janssen BM, Niessen TJ, Abma TA. Nurturing cultural change in care for older people: seeing the cherry tree blossom. Health Care Anal 2016;24:349–73.
50. Corazzini K, Twersky J, White HK, et al. Implementing culture change in nursing homes: an adaptive leadership framework. Gerontologist 2014;55:616–27.
51. Morgan JC, Haviland SB, Woodside MA, Konrad TR. Fostering supportive learning environments in long-term care: the case of WIN A STEP UP. Gerontol Geriatr Educ 2007;28:55–75.
Decreasing the Incidence of Surgical-Site Infections After Total Joint Arthroplasty
Take-Home Points
- SSIs after TJA pose a substantial burden on patients, surgeons, and the healthcare system.
- While different forms of preoperative skin preparation have shown varying outcomes after TJA, the importance of preoperative patient optimization (nutritional status, immune function, etc) cannot be overstated.
- Intraoperative infection prevention measures include cutaneous preparation, gloving, body exhaust suits, surgical drapes, OR staff traffic and ventilation flow, and antibiotic-loaded cement.
- Antibiotic prophylaxis for dental procedures in TJA patients continues to remain a controversial issue with conflicting recommendations.
- SSIs have considerable financial costs and require increased resource utilization. Given the significant economic burden associated with TJA infections, it is imperative for orthopedists to establish practical and cost-effective strategies to prevent these devastating complications.
Surgical-site infection (SSI), a potentially devastating complication of lower extremity total joint arthroplasty (TJA), is estimated to occur in 1% to 2.5% of cases annually.1 Infection after TJA places a significant burden on patients, surgeons, and the healthcare system. Revision procedures that address infection after total hip arthroplasty (THA) are associated with more hospitalizations, more operations, longer hospital stay, and higher outpatient costs in comparison with primary THAs and revision surgeries for aseptic loosening.2 If left untreated, a SSI can go deeper into the joint and develop into a periprosthetic infection, which can be disastrous and costly. A periprosthetic joint infection study that used 2001 to 2009 Nationwide Inpatient Sample (NIS) data found that the cost of revision procedures increased to $560 million from $320 million, and was projected to reach $1.62 billion by 2020.3 Furthermore, society incurs indirect costs as a result of patient disability and loss of wages and productivity.2 Therefore, the issue of infection after TJA is even more crucial in our cost-conscious healthcare environment.
Patient optimization, advances in surgical technique, sterile protocol, and operative procedures have been effective in reducing bacterial counts at incision sites and minimizing SSIs. As a result, infection rates have leveled off after rising for a decade.4 Although infection prevention modalities have their differences, routine use is fundamental and recommended by the Hospital Infection Control Practices Advisory Committee.5 Furthermore, both the US Centers for Disease Control and Prevention (CDC) and its Healthcare Infection Control Practices Advisory Committee6,7 recently updated their SSI prevention guidelines by incorporating evidence-based methodology, an element missing from earlier recommendations.
The etiologies of postoperative SSIs have been discussed ad nauseam, but there are few reports summarizing the literature on infection prevention modalities. In this review, we identify and examine SSI prevention strategies as they relate to lower extremity TJA. Specifically, we discuss the literature on the preoperative, intraoperative, and postoperative actions that can be taken to reduce the incidence of SSIs after TJA. We also highlight the economic implications of SSIs that occur after TJA.
Methods
For this review, we performed a literature search with PubMed, EBSCOhost, and Scopus. We looked for reports published between the inception of each database and July 2016. Combinations of various search terms were used: surgical site, infection, total joint arthroplasty, knee, hip, preoperative, intraoperative, perioperative, postoperative, preparation, nutrition, ventilation, antibiotic, body exhaust suit, gloves, drain, costs, economic, and payment.
Our search identified 195 abstracts. Drs. Mistry and Chughtai reviewed these to determine which articles were relevant. For any uncertainties, consensus was reached with the help of Dr. Delanois. Of the 195 articles, 103 were potentially relevant, and 54 of the 103 were excluded for being not relevant to preventing SSIs after TJA or for being written in a language other than English. The references in the remaining articles were assessed, and those with potentially relevant titles were selected for abstract review. This step provided another 35 articles. After all exclusions, 48 articles remained. We discuss these in the context of preoperative, intraoperative, and postoperative measures and economic impact.
Results
Preoperative Measures
Skin Preparation. Preoperative skin preparation methods include standard washing and rinsing, antiseptic soaps, and iodine-based or chlorhexidine gluconate-based antiseptic showers or skin cloths. Iodine-based antiseptics are effective against a wide range of Gram-positive and Gram-negative bacteria, fungi, and viruses. These agents penetrate the cell wall, oxidize the microbial contents, and replace those contents with free iodine molecules.8 Iodophors are free iodine molecules associated with a polymer (eg, polyvinylpyrrolidone); the iodophor povidone-iodine is bactericidal.9 Chlorhexidine gluconate-based solutions are effective against many types of yeast, Gram-positive and Gram-negative bacteria, and a wide variety of viruses.9 Both solutions are useful. Patients with an allergy to iodine can use chlorhexidine. Table 1 summarizes the studies on preoperative measures for preventing SSIs.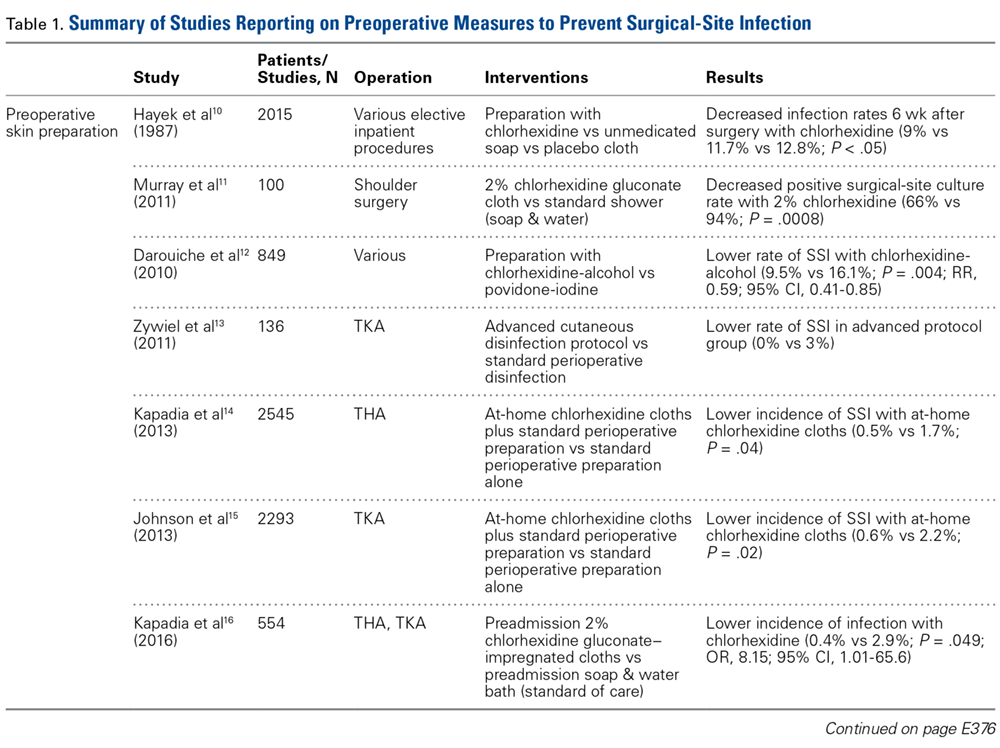
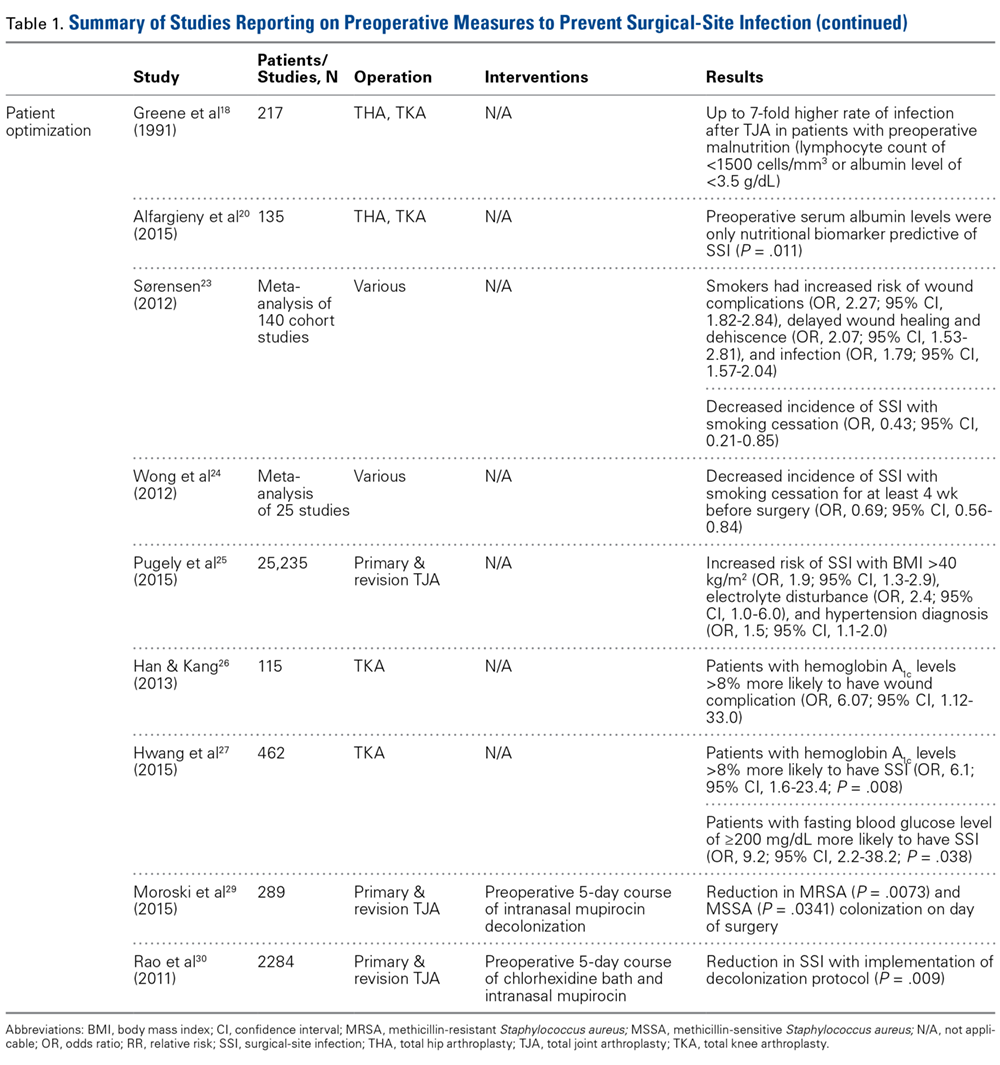
There is no shortage of evidence of the efficacy of these antiseptics in minimizing the incidence of SSIs. Hayek and colleagues10 prospectively analyzed use of different preoperative skin preparation methods in 2015 patients. Six weeks after surgery, the infection rate was significantly lower with use of chlorhexidine than with use of an unmedicated bar of soap or placebo cloth (9% vs 11.7% and 12.8%, respectively; P < .05). In a study of 100 patients, Murray and colleagues11 found the overall bacterial culture rate was significantly lower for those who used a 2% chlorhexidine gluconate cloth before shoulder surgery than for those who took a standard shower with soap (66% vs 94%; P = .0008). Darouiche and colleagues12 found the overall SSI rate was significantly lower for 409 surgical patients prepared with chlorhexidine-alcohol than for 440 prepared with povidone-iodine (9.5% vs 16.1%; P = .004; relative risk [RR], 0.59; 95% confidence interval [CI], 0.41-0.85).
Chlorhexidine gluconate-impregnated cloths have also had promising results, which may be attributed to general ease of use and potentially improved patient adherence. Zywiel and colleagues13 reported no SSIs in 136 patients who used these cloths at home before total knee arthroplasty (TKA) and 21 SSIs (3.0%) in 711 patients who did not use the cloths. In a study of 2545 THA patients, Kapadia and colleagues14 noted a significantly lower incidence of SSIs with at-home preoperative use of chlorhexidine cloths than with only in-hospital perioperative skin preparation (0.5% vs 1.7%; P = .04). In 2293 TKAs, Johnson and colleagues15 similarly found a lower incidence of SSIs with at-home preoperative use of chlorhexidine cloths (0.6% vs 2.2%; P = .02). In another prospective, randomized trial, Kapadia and colleagues16 compared 275 patients who used chlorhexidine cloths the night before and the morning of lower extremity TJA surgery with 279 patients who underwent standard-of-care preparation (preadmission bathing with antibacterial soap and water). The chlorhexidine cohort had a lower overall incidence of infection (0.4% vs 2.9%; P = .049), and the standard-of-care cohort had a stronger association with infection (odds ratio [OR], 8.15; 95% CI, 1.01-65.6).
Patient Optimization. Poor nutritional status may compromise immune function, potentially resulting in delayed healing, increased risk of infection, and, ultimately, negative postoperative outcomes. Malnutrition can be diagnosed on the basis of a prealbumin level of <15 mg/dL (normal, 15-30 mg/dL), a serum albumin level of <3.4 g/dL (normal, 3.4-5.4 g/dL), or a total lymphocyte count under 1200 cells/μL (normal, 3900-10,000 cells/μL).17-19 Greene and colleagues18 found that patients with preoperative malnutrition had up to a 7-fold higher rate of infection after TJA. In a study of 135 THAs and TKAs, Alfargieny and colleagues20 found preoperative serum albumin was the only nutritional biomarker predictive of SSI (P = .011). Furthermore, patients who take immunomodulating medications (eg, for inflammatory arthropathies) should temporarily discontinue them before surgery in order to lower their risk of infection.21
Smoking is well established as a major risk factor for poor outcomes after surgery. It is postulated that the vasoconstrictive effects of nicotine and the hypoxic effects of carbon monoxide contribute to poor wound healing.22 In a meta-analysis of 4 studies, Sørensen23 found smokers were at increased risk for wound complications (OR, 2.27; 95% CI, 1.82-2.84), delayed wound healing and dehiscence (OR, 2.07; 95% CI, 1.53-2.81), and infection (OR, 1.79; 95% CI, 1.57-2.04). Moreover, smoking cessation decreased the incidence of SSIs (OR, 0.43; 95% CI, 0.21-0.85). A meta- analysis by Wong and colleagues24 revealed an inflection point for improved outcomes in patients who abstained from smoking for at least 4 weeks before surgery. Risk of infection was lower for these patients than for current smokers (OR, 0.69; 95% CI, 0.56-0.84).
Other comorbidities contribute to SSIs as well. In their analysis of American College of Surgeons National Surgical Quality Improvement Program registry data on 25,235 patients who underwent primary and revision lower extremity TJA, Pugely and colleagues25 found that, in the primary TJA cohort, body mass index (BMI) of >40 kg/m2 (OR, 1.9; 95% CI, 1.3-2.9), electrolyte disturbance (OR, 2.4; 95% CI, 1.0-6.0), and hypertension diagnosis (OR, 1.5; 95% CI, 1.1-2.0) increased the risk of SSI within 30 days. Furthermore, diabetes mellitus delays collagen synthesis, impairs lymphocyte function, and impairs wound healing, which may lead to poor recovery and higher risk of infection.26 In a study of 167 TKAs performed in 115 patients with type 2 diabetes mellitus, Han and Kang26 found that wound complications were 6 times more likely in those with hemoglobin A1c (HbA1c) levels higher than 8% than in those with lower HbA1c levels (OR, 6.07; 95% CI, 1.12-33.0). In a similar study of 462 patients with diabetes, Hwang and colleagues27 found a higher likelihood of superficial SSIs in patients with HbA1c levels >8% (OR, 6.1; 95% CI, 1.6-23.4; P = .008). This association was also found in patients with a fasting blood glucose level of >200 mg/dL (OR, 9.2; 95% CI, 2.2-38.2; P = .038).
Methicillin-resistant Staphylococcus aureus (MRSA) is thought to account for 10% to 25% of all periprosthetic infections in the United States.28 Nasal colonization by this pathogen increases the risk for SSIs; however, decolonization protocols have proved useful in decreasing the rates of colonization. Moroski and colleagues29 assessed the efficacy of a preoperative 5-day course of intranasal mupirocin in 289 primary or revision TJA patients. Before surgery, 12 patients had positive MRSA cultures, and 44 had positive methicillin-sensitive S aureus (MSSA) cultures. On day of surgery, a significant reduction in MRSA (P = .0073) and MSSA (P = .0341) colonization was noted. Rao and colleagues30 found that the infection rate decreased from 2.7% to 1.2% in 2284 TJA patients treated with a decolonization protocol (P = .009).
Intraoperative Measures
Cutaneous Preparation. The solutions used in perioperative skin preparation are similar to those used preoperatively: povidone-iodine, alcohol, and chlorhexidine. The efficacy of these preparations varies. Table 2 summarizes the studies on intraoperative measures for preventing SSIs. 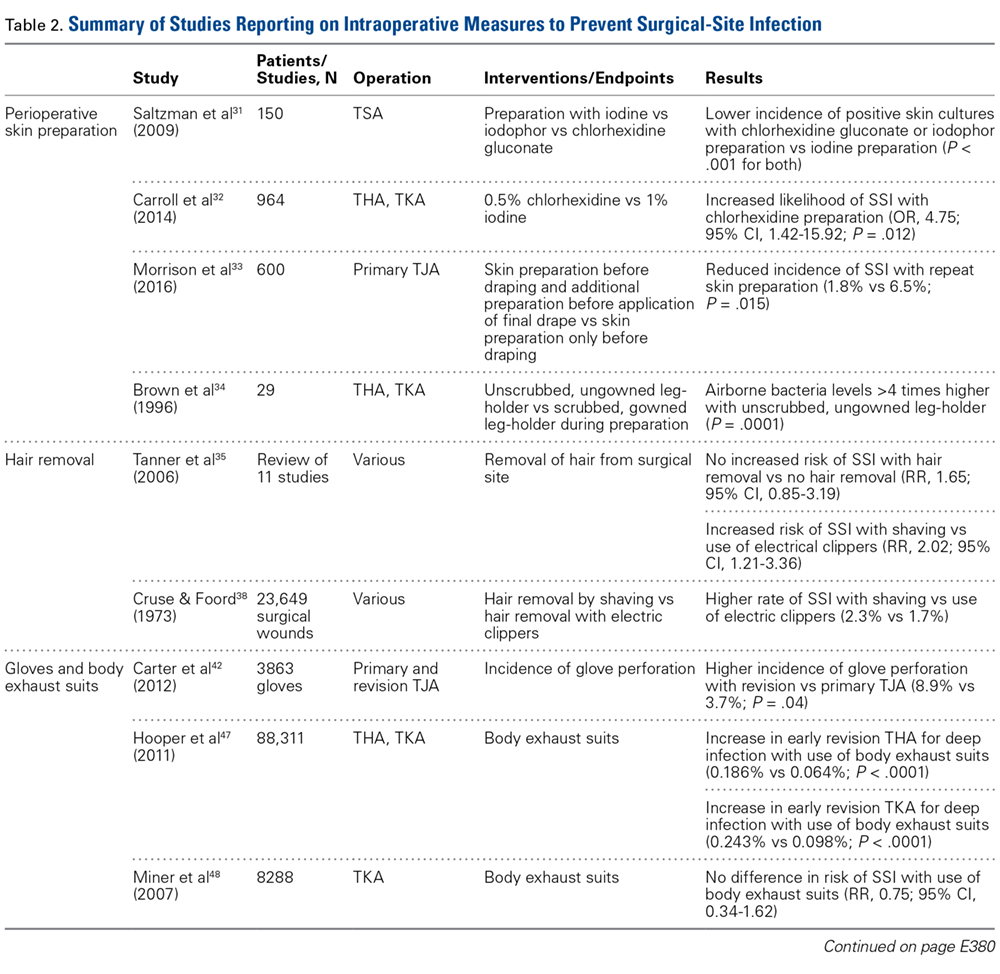
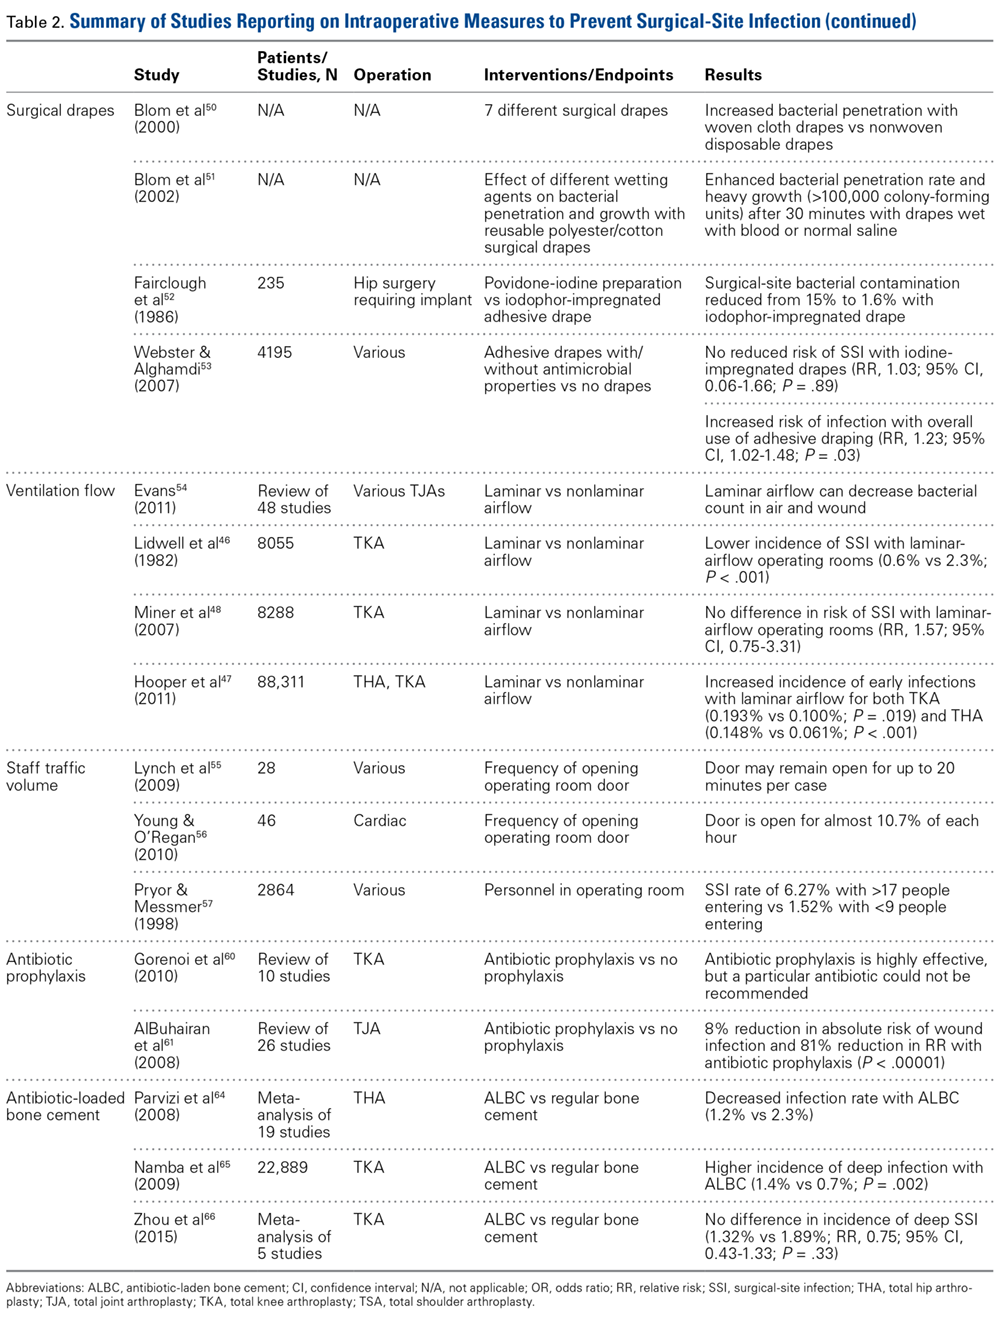
The literature also highlights the importance of technique in incision-site preparation. In a prospective study, Morrison and colleagues33 randomly assigned 600 primary TJA patients to either (1) use of alcohol and povidone-iodine before draping, with additional preparation with iodine povacrylex (DuraPrep) and isopropyl alcohol before application of the final drape (300-patient intervention group) or (2) only use of alcohol and povidone-iodine before draping (300-patient control group). At the final follow-up, the incidence of SSI was significantly lower in the intervention group than in the control group (1.8% vs 6.5%; P = .015). In another study that assessed perioperative skin preparation methods, Brown and colleagues34 found that airborne bacteria levels in operating rooms were >4 times higher with patients whose legs were prepared by a scrubbed, gowned leg-holder than with patients whose legs were prepared by an unscrubbed, ungowned leg-holder (P = .0001).
Hair Removal. Although removing hair from surgical sites is common practice, the literature advocating it varies. A large comprehensive review35 revealed no increased risk of SSI with removing vs not removing hair (RR, 1.65; 95% CI, 0.85-3.19). On the other hand, some hair removal methods may affect the incidence of infection. For example, use of electric hair clippers is presumed to reduce the risk of SSIs, whereas traditional razors may compromise the epidermal barriers and create a pathway for bacterial colonization.5,36,37 In the aforementioned review,35 SSIs were more than twice as likely to occur with hair removed by shaving than with hair removed by electric clippers (RR, 2.02; 95% CI, 1.21-3.36). Cruse and Foord38 found a higher rate of SSIs with hair removed by shaving than with hair removed by clipping (2.3% vs 1.7%). Most surgeons agree that, if given the choice, they would remove hair with electric clippers rather than razors.
Gloves. Almost all orthopedists double their gloves for TJA cases. Over several studies, the incidence of glove perforation during orthopedic procedures has ranged from 3.6% to 26%,39-41 depending on the operating room personnel and glove layering studied. Orthopedists must know this startling finding, as surgical glove perforation is associated with an increase in the rate of SSIs, from 1.7% to 5.7%.38 Carter and colleagues42 found the highest risk of glove perforation occurs when double-gloved attending surgeons, adult reconstruction fellows, and registered nurses initially assist during primary and revision TJA. In their study, outer and inner glove layers were perforated 2.5% of the time. All outer-layer perforations were noticed, but inner-layer perforations went unnoticed 81% of the time, which poses a potential hazard for both patients and healthcare personnel. In addition, there was a significant increase in the incidence of glove perforations for attending surgeons during revision TJA vs primary TJA (8.9% vs 3.7%; P = .04). This finding may be expected given the complexity of revision procedures, the presence of sharp bony and metal edges, and the longer operative times. Giving more attention to glove perforations during arthroplasties may mitigate the risk of SSI. As soon as a perforation is noticed, the glove should be removed and replaced.
Body Exhaust Suits. Early TJAs had infection rates approaching 10%.43 Bacterial-laden particles shed from surgical staff were postulated to be the cause,44,45 and this idea prompted the development of new technology, such as body exhaust suits, which have demonstrated up to a 20-fold reduction in airborne bacterial contamination and decreased incidence of deep infection, from 1% to 0.1%, as compared with conventional surgical attire.46 However, the efficacy of these suits was recently challenged. Hooper and colleagues47 assessed >88,000 TJA cases in the New Zealand Joint Registry and found a significant increase in early revision THA for deep infection with vs without use of body exhaust suits (0.186% vs 0.064%; P < .0001). The incidence of revision TKAs for deep infections with use of these suits was similar (0.243% vs 0.098%; P < .001). Many of the surgeons surveyed indicated their peripheral vision was limited by the suits, which may contribute to sterile field contamination. By contrast, Miner and colleagues48 were unable to determine an increased risk of SSI with use of body exhaust suits (RR, 0.75; 95% CI, 0.34-1.62), though there was a trend toward more infections without suits. Moreover, these suits are effective in reducing mean air bacterial counts (P = .014), but it is not known if this method correlates with mean wound bacterial counts (r = –.011) and therefore increases the risk of SSI.49
Surgical Drapes. Surgical draping, including cloths, iodine-impregnated materials, and woven or unwoven materials, is the standard of care worldwide. The particular draping technique usually varies by surgeon. Plastic drapes are better barriers than cloth drapes, as found in a study by Blom and colleagues50: Bacterial growth rates were almost 10 times higher with use of wet woven cloth drapes than with plastic surgical drapes. These findings were supported in another, similar study by Blom and colleagues51: Wetting drapes with blood or normal saline enhanced bacterial penetration. In addition, wetting drapes with chlorhexidine or iodine reduced but did not eliminate bacterial penetration. Fairclough and colleagues52 emphasized that iodine-impregnated drapes reduced surgical-site bacterial contamination from 15% to 1.6%. However, a Cochrane review53 found these drapes had no effect on the SSI rate (RR, 1.03; 95% CI, 0.06-1.66; P = .89), though the risk of infection was slightly higher with adhesive draping than with no drape (RR, 1.23; 95% CI, 1.02-1.48; P = .03).
Ventilation Flow. Laminar-airflow systems are widely used to prevent SSIs after TJA. Horizontal-flow and vertical-flow ventilation provides and maintains ultra-clean air in the operating room. Evans54 found the bacterial counts in the air and the wound were lower with laminar airflow than without this airflow. The amount of airborne bacterial colony-forming units and dust large enough to carry bacteria was reduced to 1 or 2 particles more than 2 μm/m3 with use of a typical laminar- airflow system. In comparing 3922 TKA patients in laminar-airflow operating rooms with 4133 patients in conventional rooms, Lidwell and colleagues46 found a significantly lower incidence of SSIs in patients in laminar-airflow operating rooms (0.6% vs 2.3%; P < .001).
Conversely, Miner and colleagues48 did not find a lower risk of SSI with laminar-airflow systems (RR, 1.57; 95% CI, 0.75-3.31). In addition, in their analysis of >88,000 cases from the New Zealand Joint Registry, Hooper and colleagues47 found that the incidence of early infections was higher with laminar-airflow systems than with standard airflow systems for both TKA (0.193% vs 0.100%; P = .019) and THA (0.148% vs 0.061%; P < .001). They postulated that vertically oriented airflow may have transmitted contaminated particles into the surgical sites. Additional evidence may be needed to resolve these conflicting findings and determine whether clean-air practices provide significant clinical benefit in the operating room.
Staff Traffic Volume. When staff enters or exits the operating room or makes extra movements during a procedure, airflow near the wound is disturbed and no longer able to remove sufficient airborne pathogens from the sterile field. The laminar- airflow pattern may be disrupted each time the operating room doors open and close, potentially allowing airborne pathogens to be introduced near the patient. Lynch and colleagues55 found the operating room door opened almost 50 times per hour, and it took about 20 seconds to close each time. As a result, the door may remain open for up to 20 minutes per case, causing substantial airflow disruption and potentially ineffective removal of airborne bacterial particles. Similarly, Young and O’Regan56 found the operating room door opened about 19 times per hour and took 20 seconds to close each time. The theater door was open an estimated 10.7% of each hour of sterile procedure. Presence of more staff also increases airborne bacterial counts. Pryor and Messmer57 evaluated a cohort of 2864 patients to determine the effect of number of personnel in the operating theater on the incidence of SSIs. Infection rates were 6.27% with >17 different people entering the room and 1.52% with <9 different people entering the room. Restricting the number of people in the room may be one of the easiest and most efficient ways to prevent SSI.
Systemic Antibiotic Prophylaxis. Perioperative antibiotic use is vital in minimizing the risk of infection after TJA. The Surgical Care Improvement Project recommended beginning the first antimicrobial dose either within 60 minutes before surgical incision (for cephalosporin) or within 2 hours before incision (for vancomycin) and discontinuing the prophylactic antimicrobial agents within 24 hours after surgery ends.58,59 However, Gorenoi and colleagues60 were unable to recommend a way to select particular antibiotics, as they found no difference in the effectiveness of various antibiotic agents used in TKA. A systematic review by AlBuhairan and colleagues61 revealed that antibiotic prophylaxis (vs no prophylaxis) reduced the absolute risk of a SSI by 8% and the relative risk by 81% (P < 0.0001). These findings are supported by evidence of the efficacy of perioperative antibiotics in reducing the incidence of SSI.62,63 Antibiotic regimens should be based on susceptibility and availability, depending on hospital prevalence of infections. Even more, patients should receive prophylaxis in a timely manner. Finally, bacteriostatic antibiotics (vancomycin) should not be used on their own for preoperative prophylaxis.
Antibiotic Cement. Antibiotic-loaded bone cement (ALBC), which locally releases antimicrobials in high concentration, is often used in revision joint arthroplasty, but use in primary joint arthroplasty remains controversial. In a study of THA patients, Parvizi and colleagues64 found infection rates of 1.2% with 2.3% with and without use of ALBC, respectively. Other studies have had opposing results. Namba and colleagues65 evaluated 22,889 primary TKAs, 2030 (8.9%) of which used ALBC. The incidence of deep infection was significantly higher with ALBC than with regular bone cement (1.4% vs 0.7%; P = .002). In addition, a meta- analysis of >6500 primary TKA patients, by Zhou and colleagues,66 revealed no significant difference in the incidence of deep SSIs with use of ALBC vs regular cement (1.32% vs 1.89%; RR, 0.75; 95% CI, 0.43-1.33; P = .33). More evidence is needed to determine the efficacy of ALBC in primary TJA. International Consensus Meeting on Periprosthetic Joint Infection participants recommended use of ALBC in high-risk patients, including patients who are obese or immunosuppressed or have diabetes or a prior history of infection.67
Postoperative Measures
Antibiotic Prophylaxis. The American Academy of Orthopaedic Surgeons (AAOS) and the American Dental Association (ADA) have suggestions for antibiotic prophylaxis for patients at increased risk for infection. As of 2015, the ADA no longer recommends antibiotic prophylaxis for patients with prosthetic joint implants,68 whereas the AAOS considers all patients with TJA to be at risk.69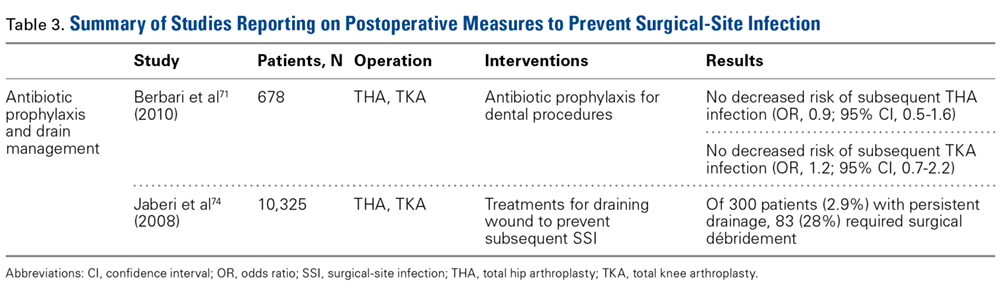
Although recommendations exist, the actual risk of infection resulting from dental procedures and the role of antibiotic prophylaxis are not well defined. Berbari and colleagues71 found that antibiotic prophylaxis in high- or low-risk dental procedures did not decrease the risk of subsequent THA infection (OR, 0.9; 95% CI, 0.5-1.6) or TKA infection (OR, 1.2; 95% CI, 0.7-2.2). Moreover, the risk of infection was no higher for patients who had a prosthetic hip or knee and underwent a high- or low-risk dental procedure without antibiotic prophylaxis (OR, 0.8; 95% CI, 0.4-1.6) than for similar patients who did not undergo a dental procedure (OR, 0.6; 95% CI, 0.4-1.1). Some studies highlight the low level of evidence supporting antibiotic prophylaxis during dental procedures.72,73 However, there is no evidence of adverse effects of antibiotic prophylaxis. Given the potential high risk of infection after such procedures, a more robust body of evidence is needed to reach consensus.
Evacuation Drain Management. Prolonged use of surgical evacuation drains may be a risk factor for SSI. Therefore, early drain removal is paramount. Higher infection rates with prolonged drain use have been found in patients with persistent wound drainage, including malnourished, obese, and over-anticoagulated patients. Patients with wounds persistently draining for >1 week should undergo superficial wound irrigation and débridement. Jaberi and colleagues74 assessed 10,325 TJA patients and found that the majority of persistent drainage ceased within 1 week with use of less invasive measures, including oral antibiotics and local wound care. Furthermore, only 28% of patients with persistent drainage underwent surgical débridement. It is unclear if this practice alone is appropriate. Infection should always be suspected and treated aggressively, and cultures should be obtained from synovial fluid before antibiotics are started, unless there is an obvious superficial infection that does not require further work-up.67
Economic Impact
SSIs remain a significant healthcare issue, and the social and financial costs are staggering. Without appropriate measures in place, these complications will place a larger burden on the healthcare system primarily as a result of longer hospital stays, multiple procedures, and increased resource utilization.75 Given the risk of progression to prosthetic joint infection, early preventive interventions must be explored.
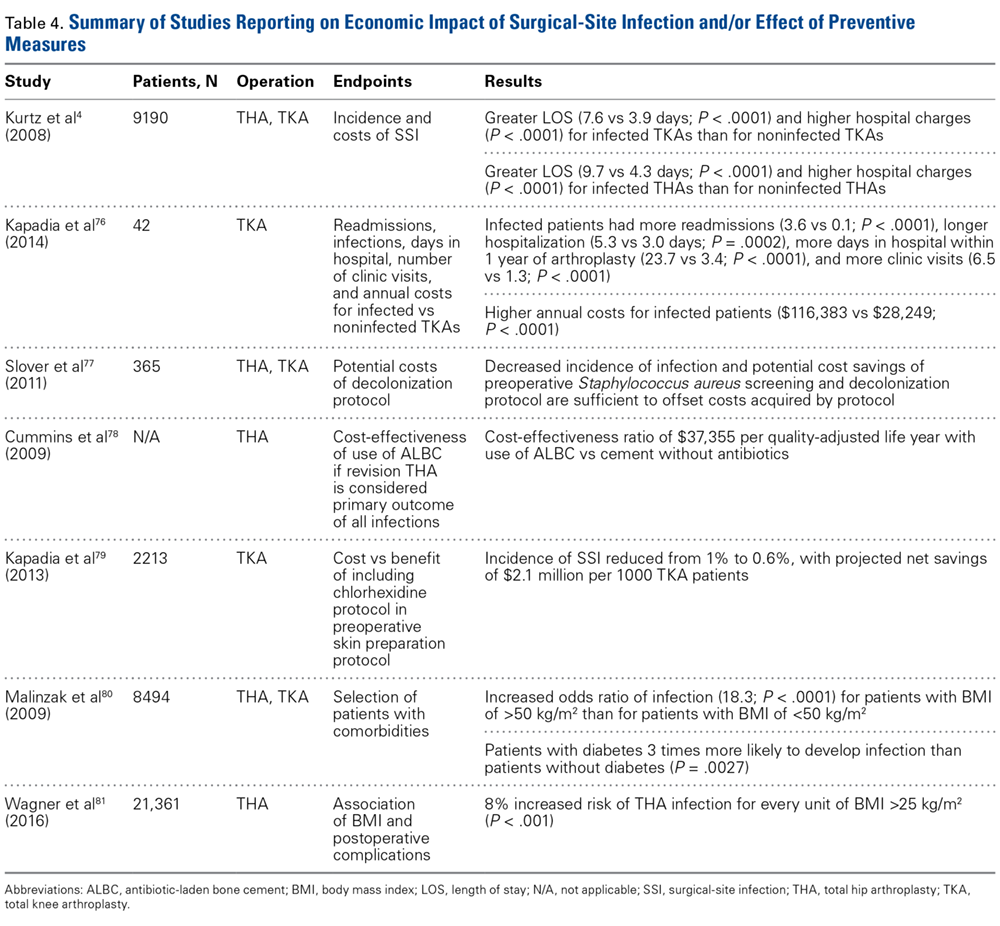
Improved patient selection may be an important factor in reducing SSIs. In an analysis of 8494 joint arthroplasties, Malinzak and colleagues80 noted that patients with a BMI of >50 kg/m2 had an increased OR of infection of 21.3 compared to those with BMI <50 kg/m2. Wagner and colleagues81 analyzed 21,361 THAs and found that, for every BMI unit over 25 kg/m2, there was an 8% increased risk of joint infection (P < .001). Although it is unknown if there is an association between reduction in preoperative BMI and reduction in postoperative complication risk, it may still be worthwhile and cost-effective to modify this and similar risk factors before elective procedures.
Market forces are becoming a larger consideration in healthcare and are being driven by provider competition.82 Treatment outcomes, quality of care, and healthcare prices have gained attention as a means of estimating potential costs.83 In 2011, the Centers for Medicare & Medicaid Services (CMS) advanced the Bundled Payments for Care Improvement (BPCI) initiative, which aimed to provide better coordinated care of higher quality and lower cost.84 This led to development of the Comprehensive Care for Joint Replacement (CJR) program, which gives beneficiaries flexibility in choosing services and ensures that providers adhere to required standards. During its 5-year test period beginning in 2016, the CJR program is projected to save CMS $153 million.84 Under this program, the institution where TJA is performed is responsible for all the costs of related care from time of surgery through 90 days after hospital discharge—which is known as an “episode of care.” If the cost incurred during an episode exceeds an established target cost (as determined by CMS), the hospital must repay Medicare the difference. Conversely, if the cost of an episode is less than the established target cost, the hospital is rewarded with the difference. Bundling payments for a single episode of care in this manner is thought to incentivize providers and hospitals to give patients more comprehensive and coordinated care. Given the substantial economic burden associated with joint arthroplasty infections, it is imperative for orthopedists to establish practical and cost-effective strategies that can prevent these disastrous complications.
Conclusion
SSIs are a devastating burden to patients, surgeons, and other healthcare providers. In recent years, new discoveries and innovations have helped mitigate the incidence of these complications of THA and TKA. However, the incidence of SSIs may rise with the increasing use of TJAs and with the development of new drug-resistant pathogens. In addition, the increasing number of TJAs performed on overweight and high-risk patients means the costs of postoperative infections will be substantial. With new reimbursement models in place, hospitals and providers are being held more accountable for the care they deliver during and after TJA. Consequently, more emphasis should be placed on techniques that are proved to minimize the incidence of SSIs.
1. National Nosocomial Infections Surveillance System. National Nosocomial Infections Surveillance (NNIS) System report, data summary from January 1992 through June 2004, issued October 2004. Am J Infect Control. 2004;32(8):470-485.
2. Bozic KJ, Ries MD. The impact of infection after total hip arthroplasty on hospital and surgeon resource utilization. J Bone Joint Surg Am. 2005;87(8):1746-1751.
3. Kurtz SM, Lau E, Watson H, Schmier JK, Parvizi J. Economic burden of periprosthetic joint infection in the United States. J Arthroplasty. 2012;27(8 suppl):61-65.e61.
4. Kurtz SM, Lau E, Schmier J, Ong KL, Zhao K, Parvizi J. Infection burden for hip and knee arthroplasty in the United States. J Arthroplasty. 2008;23(7):984-991.
5. Mangram AJ, Horan TC, Pearson ML, Silver LC, Jarvis WR. Guideline for prevention of surgical site infection, 1999. Hospital Infection Control Practices Advisory Committee. Infect Control Hosp Epidemiol. 1999;20(4):250-278.
6. Berrios-Torres SI. Evidence-based update to the U.S. Centers for Disease Control and Prevention and Healthcare Infection Control Practices Advisory Committee guideline for the prevention of surgical site infection: developmental process. Surg Infect (Larchmt). 2016;17(2):256-261.
7 Mangram AJ, Horan TC, Pearson ML, Silver LC, Jarvis WR. Guideline for prevention of surgical site infection, 1999. Centers for Disease Control and Prevention (CDC) Hospital Infection Control Practices Advisory Committee. Am J Infect Control. 1999;27(2):97-132.
8. Marchetti MG, Kampf G, Finzi G, Salvatorelli G. Evaluation of the bactericidal effect of five products for surgical hand disinfection according to prEN 12054 and prEN 12791. J Hosp Infect. 2003;54(1):63-67.
9. Reichman DE, Greenberg JA. Reducing surgical site infections: a review. Rev Obstet Gynecol. 2009;2(4):212-221.
10. Hayek LJ, Emerson JM, Gardner AM. A placebo-controlled trial of the effect of two preoperative baths or showers with chlorhexidine detergent on postoperative wound infection rates. J Hosp Infect. 1987;10(2):165-172.
11. Murray MR, Saltzman MD, Gryzlo SM, Terry MA, Woodward CC, Nuber GW. Efficacy of preoperative home use of 2% chlorhexidine gluconate cloth before shoulder surgery. J Shoulder Elbow Surg. 2011;20(6):928-933.
12. Darouiche RO, Wall MJ Jr, Itani KM, et al. Chlorhexidine-alcohol versus povidone-iodine for surgical-site antisepsis. N Engl J Med. 2010;362(1):18-26.
13. Zywiel MG, Daley JA, Delanois RE, Naziri Q, Johnson AJ, Mont MA. Advance pre-operative chlorhexidine reduces the incidence of surgical site infections in knee arthroplasty. Int Orthop. 2011;35(7):1001-1006.
14. Kapadia BH, Johnson AJ, Daley JA, Issa K, Mont MA. Pre-admission cutaneous chlorhexidine preparation reduces surgical site infections in total hip arthroplasty. J Arthroplasty. 2013;28(3):490-493.
15. Johnson AJ, Kapadia BH, Daley JA, Molina CB, Mont MA. Chlorhexidine reduces infections in knee arthroplasty. J Knee Surg. 2013;26(3):213-218.
16. Kapadia BH, Elmallah RK, Mont MA. A randomized, clinical trial of preadmission chlorhexidine skin preparation for lower extremity total joint arthroplasty. J Arthroplasty. 2016;31(12):2856-2861.
17. Mainous MR, Deitch EA. Nutrition and infection. Surg Clin North Am. 1994;74(3):659-676.
18. Greene KA, Wilde AH, Stulberg BN. Preoperative nutritional status of total joint patients. Relationship to postoperative wound complications. J Arthroplasty. 1991;6(4):321-325.
19. Del Savio GC, Zelicof SB, Wexler LM, et al. Preoperative nutritional status and outcome of elective total hip replacement. Clin Orthop Relat Res. 1996;(326):153-161.
20. Alfargieny R, Bodalal Z, Bendardaf R, El-Fadli M, Langhi S. Nutritional status as a predictive marker for surgical site infection in total joint arthroplasty. Avicenna J Med. 2015;5(4):117-122.
21. Bridges SL Jr, Lopez-Mendez A, Han KH, Tracy IC, Alarcon GS. Should methotrexate be discontinued before elective orthopedic surgery in patients with rheumatoid arthritis? J Rheumatol. 1991;18(7):984-988.
22. Silverstein P. Smoking and wound healing. Am J Med. 1992;93(1A):22S-24S.
23. Sørensen LT. Wound healing and infection in surgery. The clinical impact of smoking and smoking cessation: a systematic review and meta-analysis. Arch Surg. 2012;147(4):373-383.
24. Wong J, Lam DP, Abrishami A, Chan MT, Chung F. Short-term preoperative smoking cessation and postoperative complications: a systematic review and meta-analysis. Can J Anaesth. 2012;59(3):268-279.
25. Pugely AJ, Martin CT, Gao Y, Schweizer ML, Callaghan JJ. The incidence of and risk factors for 30-day surgical site infections following primary and revision total joint arthroplasty. J Arthroplasty. 2015;30(9 suppl):47-50.
26. Han HS, Kang SB. Relations between long-term glycemic control and postoperative wound and infectious complications after total knee arthroplasty in type 2 diabetics. Clin Orthop Surg. 2013;5(2):118-123.
27. Hwang JS, Kim SJ, Bamne AB, Na YG, Kim TK. Do glycemic markers predict occurrence of complications after total knee arthroplasty in patients with diabetes? Clin Orthop Relat Res. 2015;473(5):1726-1731.
28. Whiteside LA, Peppers M, Nayfeh TA, Roy ME. Methicillin-resistant Staphylococcus aureus in TKA treated with revision and direct intra-articular antibiotic infusion. Clin Orthop Relat Res. 2011;469(1):26-33.
29. Moroski NM, Woolwine S, Schwarzkopf R. Is preoperative staphylococcal decolonization efficient in total joint arthroplasty. J Arthroplasty. 2015;30(3):444-446.
30. Rao N, Cannella BA, Crossett LS, Yates AJ Jr, McGough RL 3rd, Hamilton CW. Preoperative screening/decolonization for Staphylococcus aureus to prevent orthopedic surgical site infection: prospective cohort study with 2-year follow-up. J Arthroplasty. 2011;26(8):1501-1507.
31. Saltzman MD, Nuber GW, Gryzlo SM, Marecek GS, Koh JL. Efficacy of surgical preparation solutions in shoulder surgery. J Bone Joint Surg Am. 2009;91(8):1949-1953.
32. Carroll K, Dowsey M, Choong P, Peel T. Risk factors for superficial wound complications in hip and knee arthroplasty. Clin Microbiol Infect. 2014;20(2):130-135.
33. Morrison TN, Chen AF, Taneja M, Kucukdurmaz F, Rothman RH, Parvizi J. Single vs repeat surgical skin preparations for reducing surgical site infection after total joint arthroplasty: a prospective, randomized, double-blinded study. J Arthroplasty. 2016;31(6):1289-1294.
34. Brown AR, Taylor GJ, Gregg PJ. Air contamination during skin preparation and draping in joint replacement surgery. J Bone Joint Surg Br. 1996;78(1):92-94.
35. Tanner J, Woodings D, Moncaster K. Preoperative hair removal to reduce surgical site infection. Cochrane Database Syst Rev. 2006;(3):CD004122.
36. Mishriki SF, Law DJ, Jeffery PJ. Factors affecting the incidence of postoperative wound infection. J Hosp Infect. 1990;16(3):223-230.
37. Harrop JS, Styliaras JC, Ooi YC, Radcliff KE, Vaccaro AR, Wu C. Contributing factors to surgical site infections. J Am Acad Orthop Surg. 2012;20(2):94-101.
38. Cruse PJ, Foord R. A five-year prospective study of 23,649 surgical wounds. Arch Surg. 1973;107(2):206-210.
39. Laine T, Aarnio P. Glove perforation in orthopaedic and trauma surgery. A comparison between single, double indicator gloving and double gloving with two regular gloves. J Bone Joint Surg Br. 2004;86(6):898-900.
40. Ersozlu S, Sahin O, Ozgur AF, Akkaya T, Tuncay C. Glove punctures in major and minor orthopaedic surgery with double gloving. Acta Orthop Belg. 2007;73(6):760-764.
41. Chan KY, Singh VA, Oun BH, To BH. The rate of glove perforations in orthopaedic procedures: single versus double gloving. A prospective study. Med J Malaysia. 2006;61(suppl B):3-7.
42. Carter AH, Casper DS, Parvizi J, Austin MS. A prospective analysis of glove perforation in primary and revision total hip and total knee arthroplasty. J Arthroplasty. 2012;27(7):1271-1275.
43. Charnley J. A clean-air operating enclosure. Br J Surg. 1964;51:202-205.
44. Whyte W, Hodgson R, Tinkler J. The importance of airborne bacterial contamination of wounds. J Hosp Infect. 1982;3(2):123-135.
45. Owers KL, James E, Bannister GC. Source of bacterial shedding in laminar flow theatres. J Hosp Infect. 2004;58(3):230-232.
46. Lidwell OM, Lowbury EJ, Whyte W, Blowers R, Stanley SJ, Lowe D. Effect of ultraclean air in operating rooms on deep sepsis in the joint after total hip or knee replacement: a randomised study. Br Med J (Clin Res Ed). 1982;285(6334):10-14.
47. Hooper GJ, Rothwell AG, Frampton C, Wyatt MC. Does the use of laminar flow and space suits reduce early deep infection after total hip and knee replacement? The ten-year results of the New Zealand Joint Registry. J Bone Joint Surg Br. 2011;93(1):85-90.
48. Miner AL, Losina E, Katz JN, Fossel AH, Platt R. Deep infection after total knee replacement: impact of laminar airflow systems and body exhaust suits in the modern operating room. Infect Control Hosp Epidemiol. 2007;28(2):222-226.
49. Der Tavitian J, Ong SM, Taub NA, Taylor GJ. Body-exhaust suit versus occlusive clothing. A randomised, prospective trial using air and wound bacterial counts. J Bone Joint Surg Br. 2003;85(4):490-494.
50. Blom A, Estela C, Bowker K, MacGowan A, Hardy JR. The passage of bacteria through surgical drapes. Ann R Coll Surg Engl. 2000;82(6):405-407.
51. Blom AW, Gozzard C, Heal J, Bowker K, Estela CM. Bacterial strike-through of re-usable surgical drapes: the effect of different wetting agents. J Hosp Infect. 2002;52(1):52-55.
52. Fairclough JA, Johnson D, Mackie I. The prevention of wound contamination by skin organisms by the pre-operative application of an iodophor impregnated plastic adhesive drape. J Int Med Res. 1986;14(2):105-109.
53. Webster J, Alghamdi AA. Use of plastic adhesive drapes during surgery for preventing surgical site infection. Cochrane Database Syst Rev. 2007;(4):CD006353.
54. Evans RP. Current concepts for clean air and total joint arthroplasty: laminar airflow and ultraviolet radiation: a systematic review. Clin Orthop Relat Res. 2011;469(4):945-953.
55. Lynch RJ, Englesbe MJ, Sturm L, et al. Measurement of foot traffic in the operating room: implications for infection control. Am J Med Qual. 2009;24(1):45-52.
56. Young RS, O’Regan DJ. Cardiac surgical theatre traffic: time for traffic calming measures? Interact Cardiovasc Thorac Surg. 2010;10(4):526-529.
57. Pryor F, Messmer PR. The effect of traffic patterns in the OR on surgical site infections. AORN J. 1998;68(4):649-660.
58. Bratzler DW, Houck PM; Surgical Infection Prevention Guidelines Writers Workgroup, American Academy of Orthopaedic Surgeons, American Association of Critical Care Nurses, et al. Antimicrobial prophylaxis for surgery: an advisory statement from the National Surgical Infection Prevention Project. Clin Infect Dis. 2004;38(12):1706-1715.
59. Rosenberger LH, Politano AD, Sawyer RG. The Surgical Care Improvement Project and prevention of post-operative infection, including surgical site infection. Surg Infect (Larchmt). 2011;12(3):163-168.
60. Gorenoi V, Schonermark MP, Hagen A. Prevention of infection after knee arthroplasty. GMS Health Technol Assess. 2010;6:Doc10.
61. AlBuhairan B, Hind D, Hutchinson A. Antibiotic prophylaxis for wound infections in total joint arthroplasty: a systematic review. J Bone Joint Surg Br. 2008;90(7):915-919.
62. Bratzler DW, Houck PM; Surgical Infection Prevention Guideline Writers Workgroup. Antimicrobial prophylaxis for surgery: an advisory statement from the National Surgical Infection Prevention Project. Am J Surg. 2005;189(4):395-404.
63. Quenon JL, Eveillard M, Vivien A, et al. Evaluation of current practices in surgical antimicrobial prophylaxis in primary total hip prosthesis—a multicentre survey in private and public French hospitals. J Hosp Infect. 2004;56(3):202-207.
64. Parvizi J, Saleh KJ, Ragland PS, Pour AE, Mont MA. Efficacy of antibiotic-impregnated cement in total hip replacement. Acta Orthop. 2008;79(3):335-341.
65. Namba RS, Chen Y, Paxton EW, Slipchenko T, Fithian DC. Outcomes of routine use of antibiotic-loaded cement in primary total knee arthroplasty. J Arthroplasty. 2009;24(6 suppl):44-47.
66. Zhou Y, Li L, Zhou Q, et al. Lack of efficacy of prophylactic application of antibiotic-loaded bone cement for prevention of infection in primary total knee arthroplasty: results of a meta-analysis. Surg Infect (Larchmt). 2015;16(2):183-187.
67. Leopold SS. Consensus statement from the International Consensus Meeting on Periprosthetic Joint Infection. Clin Orthop Relat Res. 2013;471(12):3731-3732.
68. Sollecito TP, Abt E, Lockhart PB, et al. The use of prophylactic antibiotics prior to dental procedures in patients with prosthetic joints: evidence-based clinical practice guideline for dental practitioners—a report of the American Dental Association Council on Scientific Affairs. J Am Dent Assoc. 2015;146(1):11-16.e18.
69. Watters W 3rd, Rethman MP, Hanson NB, et al. Prevention of orthopaedic implant infection in patients undergoing dental procedures. J Am Acad Orthop Surg. 2013;21(3):180-189.
70. Merchant VA; American Academy of Orthopaedic Surgeons, American Dental Association. The new AAOS/ADA clinical practice guidelines for management of patients with prosthetic joint replacements. J Mich Dent Assoc. 2013;95(2):16, 74.
71. Berbari EF, Osmon DR, Carr A, et al. Dental procedures as risk factors for prosthetic hip or knee infection: a hospital-based prospective case–control study. Clin Infect Dis. 2010;50(1):8-16.
72. Little JW, Jacobson JJ, Lockhart PB; American Academy of Oral Medicine. The dental treatment of patients with joint replacements: a position paper from the American Academy of Oral Medicine. J Am Dent Assoc. 2010;141(6):667-671.
73. Curry S, Phillips H. Joint arthroplasty, dental treatment, and antibiotics: a review. J Arthroplasty. 2002;17(1):111-113.
74. Jaberi FM, Parvizi J, Haytmanek CT, Joshi A, Purtill J. Procrastination of wound drainage and malnutrition affect the outcome of joint arthroplasty. Clin Orthop Relat Res. 2008;466(6):1368-1371.
75. Stone PW. Economic burden of healthcare-associated infections: an American perspective. Expert Rev Pharmacoecon Outcomes Res. 2009;9(5):417-422.
76. Kapadia BH, McElroy MJ, Issa K, Johnson AJ, Bozic KJ, Mont MA. The economic impact of periprosthetic infections following total knee arthroplasty at a specialized tertiary-care center. J Arthroplasty. 2014;29(5):929-932.
77. Slover J, Haas JP, Quirno M, Phillips MS, Bosco JA 3rd. Cost-effectiveness of a Staphylococcus aureus screening and decolonization program for high-risk orthopedic patients. J Arthroplasty. 2011;26(3):360-365.
78. Cummins JS, Tomek IM, Kantor SR, Furnes O, Engesaeter LB, Finlayson SR. Cost-effectiveness of antibiotic-impregnated bone cement used in primary total hip arthroplasty. J Bone Joint Surg Am. 2009;91(3):634-641.
79. Kapadia BH, Johnson AJ, Issa K, Mont MA. Economic evaluation of chlorhexidine cloths on healthcare costs due to surgical site infections following total knee arthroplasty. J Arthroplasty. 2013;28(7):1061-1065.
80. Malinzak RA, Ritter MA, Berend ME, Meding JB, Olberding EM, Davis KE. Morbidly obese, diabetic, younger, and unilateral joint arthroplasty patients have elevated total joint arthroplasty infection rates. J Arthroplasty. 2009;24(6 suppl):84-88.
81. Wagner ER, Kamath AF, Fruth KM, Harmsen WS, Berry DJ. Effect of body mass index on complications and reoperations after total hip arthroplasty. J Bone Joint Surg Am. 2016;98(3):169-179.
82 Broex EC, van Asselt AD, Bruggeman CA, van Tiel FH. Surgical site infections: how high are the costs? J Hosp Infect. 2009;72(3):193-201.
83. Anderson DJ, Kirkland KB, Kaye KS, et al. Underresourced hospital infection control and prevention programs: penny wise, pound foolish? Infect Control Hosp Epidemiol. 2007;28(7):767-773.
84. Centers for Medicare & Medicaid Services (CMS), HHS. Medicare program; comprehensive care for joint replacement payment model for acute care hospitals furnishing lower extremity joint replacement services. Final rule. Fed Regist. 2015;80(226):73273-73554.
Take-Home Points
- SSIs after TJA pose a substantial burden on patients, surgeons, and the healthcare system.
- While different forms of preoperative skin preparation have shown varying outcomes after TJA, the importance of preoperative patient optimization (nutritional status, immune function, etc) cannot be overstated.
- Intraoperative infection prevention measures include cutaneous preparation, gloving, body exhaust suits, surgical drapes, OR staff traffic and ventilation flow, and antibiotic-loaded cement.
- Antibiotic prophylaxis for dental procedures in TJA patients continues to remain a controversial issue with conflicting recommendations.
- SSIs have considerable financial costs and require increased resource utilization. Given the significant economic burden associated with TJA infections, it is imperative for orthopedists to establish practical and cost-effective strategies to prevent these devastating complications.
Surgical-site infection (SSI), a potentially devastating complication of lower extremity total joint arthroplasty (TJA), is estimated to occur in 1% to 2.5% of cases annually.1 Infection after TJA places a significant burden on patients, surgeons, and the healthcare system. Revision procedures that address infection after total hip arthroplasty (THA) are associated with more hospitalizations, more operations, longer hospital stay, and higher outpatient costs in comparison with primary THAs and revision surgeries for aseptic loosening.2 If left untreated, a SSI can go deeper into the joint and develop into a periprosthetic infection, which can be disastrous and costly. A periprosthetic joint infection study that used 2001 to 2009 Nationwide Inpatient Sample (NIS) data found that the cost of revision procedures increased to $560 million from $320 million, and was projected to reach $1.62 billion by 2020.3 Furthermore, society incurs indirect costs as a result of patient disability and loss of wages and productivity.2 Therefore, the issue of infection after TJA is even more crucial in our cost-conscious healthcare environment.
Patient optimization, advances in surgical technique, sterile protocol, and operative procedures have been effective in reducing bacterial counts at incision sites and minimizing SSIs. As a result, infection rates have leveled off after rising for a decade.4 Although infection prevention modalities have their differences, routine use is fundamental and recommended by the Hospital Infection Control Practices Advisory Committee.5 Furthermore, both the US Centers for Disease Control and Prevention (CDC) and its Healthcare Infection Control Practices Advisory Committee6,7 recently updated their SSI prevention guidelines by incorporating evidence-based methodology, an element missing from earlier recommendations.
The etiologies of postoperative SSIs have been discussed ad nauseam, but there are few reports summarizing the literature on infection prevention modalities. In this review, we identify and examine SSI prevention strategies as they relate to lower extremity TJA. Specifically, we discuss the literature on the preoperative, intraoperative, and postoperative actions that can be taken to reduce the incidence of SSIs after TJA. We also highlight the economic implications of SSIs that occur after TJA.
Methods
For this review, we performed a literature search with PubMed, EBSCOhost, and Scopus. We looked for reports published between the inception of each database and July 2016. Combinations of various search terms were used: surgical site, infection, total joint arthroplasty, knee, hip, preoperative, intraoperative, perioperative, postoperative, preparation, nutrition, ventilation, antibiotic, body exhaust suit, gloves, drain, costs, economic, and payment.
Our search identified 195 abstracts. Drs. Mistry and Chughtai reviewed these to determine which articles were relevant. For any uncertainties, consensus was reached with the help of Dr. Delanois. Of the 195 articles, 103 were potentially relevant, and 54 of the 103 were excluded for being not relevant to preventing SSIs after TJA or for being written in a language other than English. The references in the remaining articles were assessed, and those with potentially relevant titles were selected for abstract review. This step provided another 35 articles. After all exclusions, 48 articles remained. We discuss these in the context of preoperative, intraoperative, and postoperative measures and economic impact.
Results
Preoperative Measures
Skin Preparation. Preoperative skin preparation methods include standard washing and rinsing, antiseptic soaps, and iodine-based or chlorhexidine gluconate-based antiseptic showers or skin cloths. Iodine-based antiseptics are effective against a wide range of Gram-positive and Gram-negative bacteria, fungi, and viruses. These agents penetrate the cell wall, oxidize the microbial contents, and replace those contents with free iodine molecules.8 Iodophors are free iodine molecules associated with a polymer (eg, polyvinylpyrrolidone); the iodophor povidone-iodine is bactericidal.9 Chlorhexidine gluconate-based solutions are effective against many types of yeast, Gram-positive and Gram-negative bacteria, and a wide variety of viruses.9 Both solutions are useful. Patients with an allergy to iodine can use chlorhexidine. Table 1 summarizes the studies on preoperative measures for preventing SSIs.
There is no shortage of evidence of the efficacy of these antiseptics in minimizing the incidence of SSIs. Hayek and colleagues10 prospectively analyzed use of different preoperative skin preparation methods in 2015 patients. Six weeks after surgery, the infection rate was significantly lower with use of chlorhexidine than with use of an unmedicated bar of soap or placebo cloth (9% vs 11.7% and 12.8%, respectively; P < .05). In a study of 100 patients, Murray and colleagues11 found the overall bacterial culture rate was significantly lower for those who used a 2% chlorhexidine gluconate cloth before shoulder surgery than for those who took a standard shower with soap (66% vs 94%; P = .0008). Darouiche and colleagues12 found the overall SSI rate was significantly lower for 409 surgical patients prepared with chlorhexidine-alcohol than for 440 prepared with povidone-iodine (9.5% vs 16.1%; P = .004; relative risk [RR], 0.59; 95% confidence interval [CI], 0.41-0.85).
Chlorhexidine gluconate-impregnated cloths have also had promising results, which may be attributed to general ease of use and potentially improved patient adherence. Zywiel and colleagues13 reported no SSIs in 136 patients who used these cloths at home before total knee arthroplasty (TKA) and 21 SSIs (3.0%) in 711 patients who did not use the cloths. In a study of 2545 THA patients, Kapadia and colleagues14 noted a significantly lower incidence of SSIs with at-home preoperative use of chlorhexidine cloths than with only in-hospital perioperative skin preparation (0.5% vs 1.7%; P = .04). In 2293 TKAs, Johnson and colleagues15 similarly found a lower incidence of SSIs with at-home preoperative use of chlorhexidine cloths (0.6% vs 2.2%; P = .02). In another prospective, randomized trial, Kapadia and colleagues16 compared 275 patients who used chlorhexidine cloths the night before and the morning of lower extremity TJA surgery with 279 patients who underwent standard-of-care preparation (preadmission bathing with antibacterial soap and water). The chlorhexidine cohort had a lower overall incidence of infection (0.4% vs 2.9%; P = .049), and the standard-of-care cohort had a stronger association with infection (odds ratio [OR], 8.15; 95% CI, 1.01-65.6).
Patient Optimization. Poor nutritional status may compromise immune function, potentially resulting in delayed healing, increased risk of infection, and, ultimately, negative postoperative outcomes. Malnutrition can be diagnosed on the basis of a prealbumin level of <15 mg/dL (normal, 15-30 mg/dL), a serum albumin level of <3.4 g/dL (normal, 3.4-5.4 g/dL), or a total lymphocyte count under 1200 cells/μL (normal, 3900-10,000 cells/μL).17-19 Greene and colleagues18 found that patients with preoperative malnutrition had up to a 7-fold higher rate of infection after TJA. In a study of 135 THAs and TKAs, Alfargieny and colleagues20 found preoperative serum albumin was the only nutritional biomarker predictive of SSI (P = .011). Furthermore, patients who take immunomodulating medications (eg, for inflammatory arthropathies) should temporarily discontinue them before surgery in order to lower their risk of infection.21
Smoking is well established as a major risk factor for poor outcomes after surgery. It is postulated that the vasoconstrictive effects of nicotine and the hypoxic effects of carbon monoxide contribute to poor wound healing.22 In a meta-analysis of 4 studies, Sørensen23 found smokers were at increased risk for wound complications (OR, 2.27; 95% CI, 1.82-2.84), delayed wound healing and dehiscence (OR, 2.07; 95% CI, 1.53-2.81), and infection (OR, 1.79; 95% CI, 1.57-2.04). Moreover, smoking cessation decreased the incidence of SSIs (OR, 0.43; 95% CI, 0.21-0.85). A meta- analysis by Wong and colleagues24 revealed an inflection point for improved outcomes in patients who abstained from smoking for at least 4 weeks before surgery. Risk of infection was lower for these patients than for current smokers (OR, 0.69; 95% CI, 0.56-0.84).
Other comorbidities contribute to SSIs as well. In their analysis of American College of Surgeons National Surgical Quality Improvement Program registry data on 25,235 patients who underwent primary and revision lower extremity TJA, Pugely and colleagues25 found that, in the primary TJA cohort, body mass index (BMI) of >40 kg/m2 (OR, 1.9; 95% CI, 1.3-2.9), electrolyte disturbance (OR, 2.4; 95% CI, 1.0-6.0), and hypertension diagnosis (OR, 1.5; 95% CI, 1.1-2.0) increased the risk of SSI within 30 days. Furthermore, diabetes mellitus delays collagen synthesis, impairs lymphocyte function, and impairs wound healing, which may lead to poor recovery and higher risk of infection.26 In a study of 167 TKAs performed in 115 patients with type 2 diabetes mellitus, Han and Kang26 found that wound complications were 6 times more likely in those with hemoglobin A1c (HbA1c) levels higher than 8% than in those with lower HbA1c levels (OR, 6.07; 95% CI, 1.12-33.0). In a similar study of 462 patients with diabetes, Hwang and colleagues27 found a higher likelihood of superficial SSIs in patients with HbA1c levels >8% (OR, 6.1; 95% CI, 1.6-23.4; P = .008). This association was also found in patients with a fasting blood glucose level of >200 mg/dL (OR, 9.2; 95% CI, 2.2-38.2; P = .038).
Methicillin-resistant Staphylococcus aureus (MRSA) is thought to account for 10% to 25% of all periprosthetic infections in the United States.28 Nasal colonization by this pathogen increases the risk for SSIs; however, decolonization protocols have proved useful in decreasing the rates of colonization. Moroski and colleagues29 assessed the efficacy of a preoperative 5-day course of intranasal mupirocin in 289 primary or revision TJA patients. Before surgery, 12 patients had positive MRSA cultures, and 44 had positive methicillin-sensitive S aureus (MSSA) cultures. On day of surgery, a significant reduction in MRSA (P = .0073) and MSSA (P = .0341) colonization was noted. Rao and colleagues30 found that the infection rate decreased from 2.7% to 1.2% in 2284 TJA patients treated with a decolonization protocol (P = .009).
Intraoperative Measures
Cutaneous Preparation. The solutions used in perioperative skin preparation are similar to those used preoperatively: povidone-iodine, alcohol, and chlorhexidine. The efficacy of these preparations varies. Table 2 summarizes the studies on intraoperative measures for preventing SSIs.
The literature also highlights the importance of technique in incision-site preparation. In a prospective study, Morrison and colleagues33 randomly assigned 600 primary TJA patients to either (1) use of alcohol and povidone-iodine before draping, with additional preparation with iodine povacrylex (DuraPrep) and isopropyl alcohol before application of the final drape (300-patient intervention group) or (2) only use of alcohol and povidone-iodine before draping (300-patient control group). At the final follow-up, the incidence of SSI was significantly lower in the intervention group than in the control group (1.8% vs 6.5%; P = .015). In another study that assessed perioperative skin preparation methods, Brown and colleagues34 found that airborne bacteria levels in operating rooms were >4 times higher with patients whose legs were prepared by a scrubbed, gowned leg-holder than with patients whose legs were prepared by an unscrubbed, ungowned leg-holder (P = .0001).
Hair Removal. Although removing hair from surgical sites is common practice, the literature advocating it varies. A large comprehensive review35 revealed no increased risk of SSI with removing vs not removing hair (RR, 1.65; 95% CI, 0.85-3.19). On the other hand, some hair removal methods may affect the incidence of infection. For example, use of electric hair clippers is presumed to reduce the risk of SSIs, whereas traditional razors may compromise the epidermal barriers and create a pathway for bacterial colonization.5,36,37 In the aforementioned review,35 SSIs were more than twice as likely to occur with hair removed by shaving than with hair removed by electric clippers (RR, 2.02; 95% CI, 1.21-3.36). Cruse and Foord38 found a higher rate of SSIs with hair removed by shaving than with hair removed by clipping (2.3% vs 1.7%). Most surgeons agree that, if given the choice, they would remove hair with electric clippers rather than razors.
Gloves. Almost all orthopedists double their gloves for TJA cases. Over several studies, the incidence of glove perforation during orthopedic procedures has ranged from 3.6% to 26%,39-41 depending on the operating room personnel and glove layering studied. Orthopedists must know this startling finding, as surgical glove perforation is associated with an increase in the rate of SSIs, from 1.7% to 5.7%.38 Carter and colleagues42 found the highest risk of glove perforation occurs when double-gloved attending surgeons, adult reconstruction fellows, and registered nurses initially assist during primary and revision TJA. In their study, outer and inner glove layers were perforated 2.5% of the time. All outer-layer perforations were noticed, but inner-layer perforations went unnoticed 81% of the time, which poses a potential hazard for both patients and healthcare personnel. In addition, there was a significant increase in the incidence of glove perforations for attending surgeons during revision TJA vs primary TJA (8.9% vs 3.7%; P = .04). This finding may be expected given the complexity of revision procedures, the presence of sharp bony and metal edges, and the longer operative times. Giving more attention to glove perforations during arthroplasties may mitigate the risk of SSI. As soon as a perforation is noticed, the glove should be removed and replaced.
Body Exhaust Suits. Early TJAs had infection rates approaching 10%.43 Bacterial-laden particles shed from surgical staff were postulated to be the cause,44,45 and this idea prompted the development of new technology, such as body exhaust suits, which have demonstrated up to a 20-fold reduction in airborne bacterial contamination and decreased incidence of deep infection, from 1% to 0.1%, as compared with conventional surgical attire.46 However, the efficacy of these suits was recently challenged. Hooper and colleagues47 assessed >88,000 TJA cases in the New Zealand Joint Registry and found a significant increase in early revision THA for deep infection with vs without use of body exhaust suits (0.186% vs 0.064%; P < .0001). The incidence of revision TKAs for deep infections with use of these suits was similar (0.243% vs 0.098%; P < .001). Many of the surgeons surveyed indicated their peripheral vision was limited by the suits, which may contribute to sterile field contamination. By contrast, Miner and colleagues48 were unable to determine an increased risk of SSI with use of body exhaust suits (RR, 0.75; 95% CI, 0.34-1.62), though there was a trend toward more infections without suits. Moreover, these suits are effective in reducing mean air bacterial counts (P = .014), but it is not known if this method correlates with mean wound bacterial counts (r = –.011) and therefore increases the risk of SSI.49
Surgical Drapes. Surgical draping, including cloths, iodine-impregnated materials, and woven or unwoven materials, is the standard of care worldwide. The particular draping technique usually varies by surgeon. Plastic drapes are better barriers than cloth drapes, as found in a study by Blom and colleagues50: Bacterial growth rates were almost 10 times higher with use of wet woven cloth drapes than with plastic surgical drapes. These findings were supported in another, similar study by Blom and colleagues51: Wetting drapes with blood or normal saline enhanced bacterial penetration. In addition, wetting drapes with chlorhexidine or iodine reduced but did not eliminate bacterial penetration. Fairclough and colleagues52 emphasized that iodine-impregnated drapes reduced surgical-site bacterial contamination from 15% to 1.6%. However, a Cochrane review53 found these drapes had no effect on the SSI rate (RR, 1.03; 95% CI, 0.06-1.66; P = .89), though the risk of infection was slightly higher with adhesive draping than with no drape (RR, 1.23; 95% CI, 1.02-1.48; P = .03).
Ventilation Flow. Laminar-airflow systems are widely used to prevent SSIs after TJA. Horizontal-flow and vertical-flow ventilation provides and maintains ultra-clean air in the operating room. Evans54 found the bacterial counts in the air and the wound were lower with laminar airflow than without this airflow. The amount of airborne bacterial colony-forming units and dust large enough to carry bacteria was reduced to 1 or 2 particles more than 2 μm/m3 with use of a typical laminar- airflow system. In comparing 3922 TKA patients in laminar-airflow operating rooms with 4133 patients in conventional rooms, Lidwell and colleagues46 found a significantly lower incidence of SSIs in patients in laminar-airflow operating rooms (0.6% vs 2.3%; P < .001).
Conversely, Miner and colleagues48 did not find a lower risk of SSI with laminar-airflow systems (RR, 1.57; 95% CI, 0.75-3.31). In addition, in their analysis of >88,000 cases from the New Zealand Joint Registry, Hooper and colleagues47 found that the incidence of early infections was higher with laminar-airflow systems than with standard airflow systems for both TKA (0.193% vs 0.100%; P = .019) and THA (0.148% vs 0.061%; P < .001). They postulated that vertically oriented airflow may have transmitted contaminated particles into the surgical sites. Additional evidence may be needed to resolve these conflicting findings and determine whether clean-air practices provide significant clinical benefit in the operating room.
Staff Traffic Volume. When staff enters or exits the operating room or makes extra movements during a procedure, airflow near the wound is disturbed and no longer able to remove sufficient airborne pathogens from the sterile field. The laminar- airflow pattern may be disrupted each time the operating room doors open and close, potentially allowing airborne pathogens to be introduced near the patient. Lynch and colleagues55 found the operating room door opened almost 50 times per hour, and it took about 20 seconds to close each time. As a result, the door may remain open for up to 20 minutes per case, causing substantial airflow disruption and potentially ineffective removal of airborne bacterial particles. Similarly, Young and O’Regan56 found the operating room door opened about 19 times per hour and took 20 seconds to close each time. The theater door was open an estimated 10.7% of each hour of sterile procedure. Presence of more staff also increases airborne bacterial counts. Pryor and Messmer57 evaluated a cohort of 2864 patients to determine the effect of number of personnel in the operating theater on the incidence of SSIs. Infection rates were 6.27% with >17 different people entering the room and 1.52% with <9 different people entering the room. Restricting the number of people in the room may be one of the easiest and most efficient ways to prevent SSI.
Systemic Antibiotic Prophylaxis. Perioperative antibiotic use is vital in minimizing the risk of infection after TJA. The Surgical Care Improvement Project recommended beginning the first antimicrobial dose either within 60 minutes before surgical incision (for cephalosporin) or within 2 hours before incision (for vancomycin) and discontinuing the prophylactic antimicrobial agents within 24 hours after surgery ends.58,59 However, Gorenoi and colleagues60 were unable to recommend a way to select particular antibiotics, as they found no difference in the effectiveness of various antibiotic agents used in TKA. A systematic review by AlBuhairan and colleagues61 revealed that antibiotic prophylaxis (vs no prophylaxis) reduced the absolute risk of a SSI by 8% and the relative risk by 81% (P < 0.0001). These findings are supported by evidence of the efficacy of perioperative antibiotics in reducing the incidence of SSI.62,63 Antibiotic regimens should be based on susceptibility and availability, depending on hospital prevalence of infections. Even more, patients should receive prophylaxis in a timely manner. Finally, bacteriostatic antibiotics (vancomycin) should not be used on their own for preoperative prophylaxis.
Antibiotic Cement. Antibiotic-loaded bone cement (ALBC), which locally releases antimicrobials in high concentration, is often used in revision joint arthroplasty, but use in primary joint arthroplasty remains controversial. In a study of THA patients, Parvizi and colleagues64 found infection rates of 1.2% with 2.3% with and without use of ALBC, respectively. Other studies have had opposing results. Namba and colleagues65 evaluated 22,889 primary TKAs, 2030 (8.9%) of which used ALBC. The incidence of deep infection was significantly higher with ALBC than with regular bone cement (1.4% vs 0.7%; P = .002). In addition, a meta- analysis of >6500 primary TKA patients, by Zhou and colleagues,66 revealed no significant difference in the incidence of deep SSIs with use of ALBC vs regular cement (1.32% vs 1.89%; RR, 0.75; 95% CI, 0.43-1.33; P = .33). More evidence is needed to determine the efficacy of ALBC in primary TJA. International Consensus Meeting on Periprosthetic Joint Infection participants recommended use of ALBC in high-risk patients, including patients who are obese or immunosuppressed or have diabetes or a prior history of infection.67
Postoperative Measures
Antibiotic Prophylaxis. The American Academy of Orthopaedic Surgeons (AAOS) and the American Dental Association (ADA) have suggestions for antibiotic prophylaxis for patients at increased risk for infection. As of 2015, the ADA no longer recommends antibiotic prophylaxis for patients with prosthetic joint implants,68 whereas the AAOS considers all patients with TJA to be at risk.69
Although recommendations exist, the actual risk of infection resulting from dental procedures and the role of antibiotic prophylaxis are not well defined. Berbari and colleagues71 found that antibiotic prophylaxis in high- or low-risk dental procedures did not decrease the risk of subsequent THA infection (OR, 0.9; 95% CI, 0.5-1.6) or TKA infection (OR, 1.2; 95% CI, 0.7-2.2). Moreover, the risk of infection was no higher for patients who had a prosthetic hip or knee and underwent a high- or low-risk dental procedure without antibiotic prophylaxis (OR, 0.8; 95% CI, 0.4-1.6) than for similar patients who did not undergo a dental procedure (OR, 0.6; 95% CI, 0.4-1.1). Some studies highlight the low level of evidence supporting antibiotic prophylaxis during dental procedures.72,73 However, there is no evidence of adverse effects of antibiotic prophylaxis. Given the potential high risk of infection after such procedures, a more robust body of evidence is needed to reach consensus.
Evacuation Drain Management. Prolonged use of surgical evacuation drains may be a risk factor for SSI. Therefore, early drain removal is paramount. Higher infection rates with prolonged drain use have been found in patients with persistent wound drainage, including malnourished, obese, and over-anticoagulated patients. Patients with wounds persistently draining for >1 week should undergo superficial wound irrigation and débridement. Jaberi and colleagues74 assessed 10,325 TJA patients and found that the majority of persistent drainage ceased within 1 week with use of less invasive measures, including oral antibiotics and local wound care. Furthermore, only 28% of patients with persistent drainage underwent surgical débridement. It is unclear if this practice alone is appropriate. Infection should always be suspected and treated aggressively, and cultures should be obtained from synovial fluid before antibiotics are started, unless there is an obvious superficial infection that does not require further work-up.67
Economic Impact
SSIs remain a significant healthcare issue, and the social and financial costs are staggering. Without appropriate measures in place, these complications will place a larger burden on the healthcare system primarily as a result of longer hospital stays, multiple procedures, and increased resource utilization.75 Given the risk of progression to prosthetic joint infection, early preventive interventions must be explored.
Improved patient selection may be an important factor in reducing SSIs. In an analysis of 8494 joint arthroplasties, Malinzak and colleagues80 noted that patients with a BMI of >50 kg/m2 had an increased OR of infection of 21.3 compared to those with BMI <50 kg/m2. Wagner and colleagues81 analyzed 21,361 THAs and found that, for every BMI unit over 25 kg/m2, there was an 8% increased risk of joint infection (P < .001). Although it is unknown if there is an association between reduction in preoperative BMI and reduction in postoperative complication risk, it may still be worthwhile and cost-effective to modify this and similar risk factors before elective procedures.
Market forces are becoming a larger consideration in healthcare and are being driven by provider competition.82 Treatment outcomes, quality of care, and healthcare prices have gained attention as a means of estimating potential costs.83 In 2011, the Centers for Medicare & Medicaid Services (CMS) advanced the Bundled Payments for Care Improvement (BPCI) initiative, which aimed to provide better coordinated care of higher quality and lower cost.84 This led to development of the Comprehensive Care for Joint Replacement (CJR) program, which gives beneficiaries flexibility in choosing services and ensures that providers adhere to required standards. During its 5-year test period beginning in 2016, the CJR program is projected to save CMS $153 million.84 Under this program, the institution where TJA is performed is responsible for all the costs of related care from time of surgery through 90 days after hospital discharge—which is known as an “episode of care.” If the cost incurred during an episode exceeds an established target cost (as determined by CMS), the hospital must repay Medicare the difference. Conversely, if the cost of an episode is less than the established target cost, the hospital is rewarded with the difference. Bundling payments for a single episode of care in this manner is thought to incentivize providers and hospitals to give patients more comprehensive and coordinated care. Given the substantial economic burden associated with joint arthroplasty infections, it is imperative for orthopedists to establish practical and cost-effective strategies that can prevent these disastrous complications.
Conclusion
SSIs are a devastating burden to patients, surgeons, and other healthcare providers. In recent years, new discoveries and innovations have helped mitigate the incidence of these complications of THA and TKA. However, the incidence of SSIs may rise with the increasing use of TJAs and with the development of new drug-resistant pathogens. In addition, the increasing number of TJAs performed on overweight and high-risk patients means the costs of postoperative infections will be substantial. With new reimbursement models in place, hospitals and providers are being held more accountable for the care they deliver during and after TJA. Consequently, more emphasis should be placed on techniques that are proved to minimize the incidence of SSIs.
1. National Nosocomial Infections Surveillance System. National Nosocomial Infections Surveillance (NNIS) System report, data summary from January 1992 through June 2004, issued October 2004. Am J Infect Control. 2004;32(8):470-485.
2. Bozic KJ, Ries MD. The impact of infection after total hip arthroplasty on hospital and surgeon resource utilization. J Bone Joint Surg Am. 2005;87(8):1746-1751.
3. Kurtz SM, Lau E, Watson H, Schmier JK, Parvizi J. Economic burden of periprosthetic joint infection in the United States. J Arthroplasty. 2012;27(8 suppl):61-65.e61.
4. Kurtz SM, Lau E, Schmier J, Ong KL, Zhao K, Parvizi J. Infection burden for hip and knee arthroplasty in the United States. J Arthroplasty. 2008;23(7):984-991.
5. Mangram AJ, Horan TC, Pearson ML, Silver LC, Jarvis WR. Guideline for prevention of surgical site infection, 1999. Hospital Infection Control Practices Advisory Committee. Infect Control Hosp Epidemiol. 1999;20(4):250-278.
6. Berrios-Torres SI. Evidence-based update to the U.S. Centers for Disease Control and Prevention and Healthcare Infection Control Practices Advisory Committee guideline for the prevention of surgical site infection: developmental process. Surg Infect (Larchmt). 2016;17(2):256-261.
7 Mangram AJ, Horan TC, Pearson ML, Silver LC, Jarvis WR. Guideline for prevention of surgical site infection, 1999. Centers for Disease Control and Prevention (CDC) Hospital Infection Control Practices Advisory Committee. Am J Infect Control. 1999;27(2):97-132.
8. Marchetti MG, Kampf G, Finzi G, Salvatorelli G. Evaluation of the bactericidal effect of five products for surgical hand disinfection according to prEN 12054 and prEN 12791. J Hosp Infect. 2003;54(1):63-67.
9. Reichman DE, Greenberg JA. Reducing surgical site infections: a review. Rev Obstet Gynecol. 2009;2(4):212-221.
10. Hayek LJ, Emerson JM, Gardner AM. A placebo-controlled trial of the effect of two preoperative baths or showers with chlorhexidine detergent on postoperative wound infection rates. J Hosp Infect. 1987;10(2):165-172.
11. Murray MR, Saltzman MD, Gryzlo SM, Terry MA, Woodward CC, Nuber GW. Efficacy of preoperative home use of 2% chlorhexidine gluconate cloth before shoulder surgery. J Shoulder Elbow Surg. 2011;20(6):928-933.
12. Darouiche RO, Wall MJ Jr, Itani KM, et al. Chlorhexidine-alcohol versus povidone-iodine for surgical-site antisepsis. N Engl J Med. 2010;362(1):18-26.
13. Zywiel MG, Daley JA, Delanois RE, Naziri Q, Johnson AJ, Mont MA. Advance pre-operative chlorhexidine reduces the incidence of surgical site infections in knee arthroplasty. Int Orthop. 2011;35(7):1001-1006.
14. Kapadia BH, Johnson AJ, Daley JA, Issa K, Mont MA. Pre-admission cutaneous chlorhexidine preparation reduces surgical site infections in total hip arthroplasty. J Arthroplasty. 2013;28(3):490-493.
15. Johnson AJ, Kapadia BH, Daley JA, Molina CB, Mont MA. Chlorhexidine reduces infections in knee arthroplasty. J Knee Surg. 2013;26(3):213-218.
16. Kapadia BH, Elmallah RK, Mont MA. A randomized, clinical trial of preadmission chlorhexidine skin preparation for lower extremity total joint arthroplasty. J Arthroplasty. 2016;31(12):2856-2861.
17. Mainous MR, Deitch EA. Nutrition and infection. Surg Clin North Am. 1994;74(3):659-676.
18. Greene KA, Wilde AH, Stulberg BN. Preoperative nutritional status of total joint patients. Relationship to postoperative wound complications. J Arthroplasty. 1991;6(4):321-325.
19. Del Savio GC, Zelicof SB, Wexler LM, et al. Preoperative nutritional status and outcome of elective total hip replacement. Clin Orthop Relat Res. 1996;(326):153-161.
20. Alfargieny R, Bodalal Z, Bendardaf R, El-Fadli M, Langhi S. Nutritional status as a predictive marker for surgical site infection in total joint arthroplasty. Avicenna J Med. 2015;5(4):117-122.
21. Bridges SL Jr, Lopez-Mendez A, Han KH, Tracy IC, Alarcon GS. Should methotrexate be discontinued before elective orthopedic surgery in patients with rheumatoid arthritis? J Rheumatol. 1991;18(7):984-988.
22. Silverstein P. Smoking and wound healing. Am J Med. 1992;93(1A):22S-24S.
23. Sørensen LT. Wound healing and infection in surgery. The clinical impact of smoking and smoking cessation: a systematic review and meta-analysis. Arch Surg. 2012;147(4):373-383.
24. Wong J, Lam DP, Abrishami A, Chan MT, Chung F. Short-term preoperative smoking cessation and postoperative complications: a systematic review and meta-analysis. Can J Anaesth. 2012;59(3):268-279.
25. Pugely AJ, Martin CT, Gao Y, Schweizer ML, Callaghan JJ. The incidence of and risk factors for 30-day surgical site infections following primary and revision total joint arthroplasty. J Arthroplasty. 2015;30(9 suppl):47-50.
26. Han HS, Kang SB. Relations between long-term glycemic control and postoperative wound and infectious complications after total knee arthroplasty in type 2 diabetics. Clin Orthop Surg. 2013;5(2):118-123.
27. Hwang JS, Kim SJ, Bamne AB, Na YG, Kim TK. Do glycemic markers predict occurrence of complications after total knee arthroplasty in patients with diabetes? Clin Orthop Relat Res. 2015;473(5):1726-1731.
28. Whiteside LA, Peppers M, Nayfeh TA, Roy ME. Methicillin-resistant Staphylococcus aureus in TKA treated with revision and direct intra-articular antibiotic infusion. Clin Orthop Relat Res. 2011;469(1):26-33.
29. Moroski NM, Woolwine S, Schwarzkopf R. Is preoperative staphylococcal decolonization efficient in total joint arthroplasty. J Arthroplasty. 2015;30(3):444-446.
30. Rao N, Cannella BA, Crossett LS, Yates AJ Jr, McGough RL 3rd, Hamilton CW. Preoperative screening/decolonization for Staphylococcus aureus to prevent orthopedic surgical site infection: prospective cohort study with 2-year follow-up. J Arthroplasty. 2011;26(8):1501-1507.
31. Saltzman MD, Nuber GW, Gryzlo SM, Marecek GS, Koh JL. Efficacy of surgical preparation solutions in shoulder surgery. J Bone Joint Surg Am. 2009;91(8):1949-1953.
32. Carroll K, Dowsey M, Choong P, Peel T. Risk factors for superficial wound complications in hip and knee arthroplasty. Clin Microbiol Infect. 2014;20(2):130-135.
33. Morrison TN, Chen AF, Taneja M, Kucukdurmaz F, Rothman RH, Parvizi J. Single vs repeat surgical skin preparations for reducing surgical site infection after total joint arthroplasty: a prospective, randomized, double-blinded study. J Arthroplasty. 2016;31(6):1289-1294.
34. Brown AR, Taylor GJ, Gregg PJ. Air contamination during skin preparation and draping in joint replacement surgery. J Bone Joint Surg Br. 1996;78(1):92-94.
35. Tanner J, Woodings D, Moncaster K. Preoperative hair removal to reduce surgical site infection. Cochrane Database Syst Rev. 2006;(3):CD004122.
36. Mishriki SF, Law DJ, Jeffery PJ. Factors affecting the incidence of postoperative wound infection. J Hosp Infect. 1990;16(3):223-230.
37. Harrop JS, Styliaras JC, Ooi YC, Radcliff KE, Vaccaro AR, Wu C. Contributing factors to surgical site infections. J Am Acad Orthop Surg. 2012;20(2):94-101.
38. Cruse PJ, Foord R. A five-year prospective study of 23,649 surgical wounds. Arch Surg. 1973;107(2):206-210.
39. Laine T, Aarnio P. Glove perforation in orthopaedic and trauma surgery. A comparison between single, double indicator gloving and double gloving with two regular gloves. J Bone Joint Surg Br. 2004;86(6):898-900.
40. Ersozlu S, Sahin O, Ozgur AF, Akkaya T, Tuncay C. Glove punctures in major and minor orthopaedic surgery with double gloving. Acta Orthop Belg. 2007;73(6):760-764.
41. Chan KY, Singh VA, Oun BH, To BH. The rate of glove perforations in orthopaedic procedures: single versus double gloving. A prospective study. Med J Malaysia. 2006;61(suppl B):3-7.
42. Carter AH, Casper DS, Parvizi J, Austin MS. A prospective analysis of glove perforation in primary and revision total hip and total knee arthroplasty. J Arthroplasty. 2012;27(7):1271-1275.
43. Charnley J. A clean-air operating enclosure. Br J Surg. 1964;51:202-205.
44. Whyte W, Hodgson R, Tinkler J. The importance of airborne bacterial contamination of wounds. J Hosp Infect. 1982;3(2):123-135.
45. Owers KL, James E, Bannister GC. Source of bacterial shedding in laminar flow theatres. J Hosp Infect. 2004;58(3):230-232.
46. Lidwell OM, Lowbury EJ, Whyte W, Blowers R, Stanley SJ, Lowe D. Effect of ultraclean air in operating rooms on deep sepsis in the joint after total hip or knee replacement: a randomised study. Br Med J (Clin Res Ed). 1982;285(6334):10-14.
47. Hooper GJ, Rothwell AG, Frampton C, Wyatt MC. Does the use of laminar flow and space suits reduce early deep infection after total hip and knee replacement? The ten-year results of the New Zealand Joint Registry. J Bone Joint Surg Br. 2011;93(1):85-90.
48. Miner AL, Losina E, Katz JN, Fossel AH, Platt R. Deep infection after total knee replacement: impact of laminar airflow systems and body exhaust suits in the modern operating room. Infect Control Hosp Epidemiol. 2007;28(2):222-226.
49. Der Tavitian J, Ong SM, Taub NA, Taylor GJ. Body-exhaust suit versus occlusive clothing. A randomised, prospective trial using air and wound bacterial counts. J Bone Joint Surg Br. 2003;85(4):490-494.
50. Blom A, Estela C, Bowker K, MacGowan A, Hardy JR. The passage of bacteria through surgical drapes. Ann R Coll Surg Engl. 2000;82(6):405-407.
51. Blom AW, Gozzard C, Heal J, Bowker K, Estela CM. Bacterial strike-through of re-usable surgical drapes: the effect of different wetting agents. J Hosp Infect. 2002;52(1):52-55.
52. Fairclough JA, Johnson D, Mackie I. The prevention of wound contamination by skin organisms by the pre-operative application of an iodophor impregnated plastic adhesive drape. J Int Med Res. 1986;14(2):105-109.
53. Webster J, Alghamdi AA. Use of plastic adhesive drapes during surgery for preventing surgical site infection. Cochrane Database Syst Rev. 2007;(4):CD006353.
54. Evans RP. Current concepts for clean air and total joint arthroplasty: laminar airflow and ultraviolet radiation: a systematic review. Clin Orthop Relat Res. 2011;469(4):945-953.
55. Lynch RJ, Englesbe MJ, Sturm L, et al. Measurement of foot traffic in the operating room: implications for infection control. Am J Med Qual. 2009;24(1):45-52.
56. Young RS, O’Regan DJ. Cardiac surgical theatre traffic: time for traffic calming measures? Interact Cardiovasc Thorac Surg. 2010;10(4):526-529.
57. Pryor F, Messmer PR. The effect of traffic patterns in the OR on surgical site infections. AORN J. 1998;68(4):649-660.
58. Bratzler DW, Houck PM; Surgical Infection Prevention Guidelines Writers Workgroup, American Academy of Orthopaedic Surgeons, American Association of Critical Care Nurses, et al. Antimicrobial prophylaxis for surgery: an advisory statement from the National Surgical Infection Prevention Project. Clin Infect Dis. 2004;38(12):1706-1715.
59. Rosenberger LH, Politano AD, Sawyer RG. The Surgical Care Improvement Project and prevention of post-operative infection, including surgical site infection. Surg Infect (Larchmt). 2011;12(3):163-168.
60. Gorenoi V, Schonermark MP, Hagen A. Prevention of infection after knee arthroplasty. GMS Health Technol Assess. 2010;6:Doc10.
61. AlBuhairan B, Hind D, Hutchinson A. Antibiotic prophylaxis for wound infections in total joint arthroplasty: a systematic review. J Bone Joint Surg Br. 2008;90(7):915-919.
62. Bratzler DW, Houck PM; Surgical Infection Prevention Guideline Writers Workgroup. Antimicrobial prophylaxis for surgery: an advisory statement from the National Surgical Infection Prevention Project. Am J Surg. 2005;189(4):395-404.
63. Quenon JL, Eveillard M, Vivien A, et al. Evaluation of current practices in surgical antimicrobial prophylaxis in primary total hip prosthesis—a multicentre survey in private and public French hospitals. J Hosp Infect. 2004;56(3):202-207.
64. Parvizi J, Saleh KJ, Ragland PS, Pour AE, Mont MA. Efficacy of antibiotic-impregnated cement in total hip replacement. Acta Orthop. 2008;79(3):335-341.
65. Namba RS, Chen Y, Paxton EW, Slipchenko T, Fithian DC. Outcomes of routine use of antibiotic-loaded cement in primary total knee arthroplasty. J Arthroplasty. 2009;24(6 suppl):44-47.
66. Zhou Y, Li L, Zhou Q, et al. Lack of efficacy of prophylactic application of antibiotic-loaded bone cement for prevention of infection in primary total knee arthroplasty: results of a meta-analysis. Surg Infect (Larchmt). 2015;16(2):183-187.
67. Leopold SS. Consensus statement from the International Consensus Meeting on Periprosthetic Joint Infection. Clin Orthop Relat Res. 2013;471(12):3731-3732.
68. Sollecito TP, Abt E, Lockhart PB, et al. The use of prophylactic antibiotics prior to dental procedures in patients with prosthetic joints: evidence-based clinical practice guideline for dental practitioners—a report of the American Dental Association Council on Scientific Affairs. J Am Dent Assoc. 2015;146(1):11-16.e18.
69. Watters W 3rd, Rethman MP, Hanson NB, et al. Prevention of orthopaedic implant infection in patients undergoing dental procedures. J Am Acad Orthop Surg. 2013;21(3):180-189.
70. Merchant VA; American Academy of Orthopaedic Surgeons, American Dental Association. The new AAOS/ADA clinical practice guidelines for management of patients with prosthetic joint replacements. J Mich Dent Assoc. 2013;95(2):16, 74.
71. Berbari EF, Osmon DR, Carr A, et al. Dental procedures as risk factors for prosthetic hip or knee infection: a hospital-based prospective case–control study. Clin Infect Dis. 2010;50(1):8-16.
72. Little JW, Jacobson JJ, Lockhart PB; American Academy of Oral Medicine. The dental treatment of patients with joint replacements: a position paper from the American Academy of Oral Medicine. J Am Dent Assoc. 2010;141(6):667-671.
73. Curry S, Phillips H. Joint arthroplasty, dental treatment, and antibiotics: a review. J Arthroplasty. 2002;17(1):111-113.
74. Jaberi FM, Parvizi J, Haytmanek CT, Joshi A, Purtill J. Procrastination of wound drainage and malnutrition affect the outcome of joint arthroplasty. Clin Orthop Relat Res. 2008;466(6):1368-1371.
75. Stone PW. Economic burden of healthcare-associated infections: an American perspective. Expert Rev Pharmacoecon Outcomes Res. 2009;9(5):417-422.
76. Kapadia BH, McElroy MJ, Issa K, Johnson AJ, Bozic KJ, Mont MA. The economic impact of periprosthetic infections following total knee arthroplasty at a specialized tertiary-care center. J Arthroplasty. 2014;29(5):929-932.
77. Slover J, Haas JP, Quirno M, Phillips MS, Bosco JA 3rd. Cost-effectiveness of a Staphylococcus aureus screening and decolonization program for high-risk orthopedic patients. J Arthroplasty. 2011;26(3):360-365.
78. Cummins JS, Tomek IM, Kantor SR, Furnes O, Engesaeter LB, Finlayson SR. Cost-effectiveness of antibiotic-impregnated bone cement used in primary total hip arthroplasty. J Bone Joint Surg Am. 2009;91(3):634-641.
79. Kapadia BH, Johnson AJ, Issa K, Mont MA. Economic evaluation of chlorhexidine cloths on healthcare costs due to surgical site infections following total knee arthroplasty. J Arthroplasty. 2013;28(7):1061-1065.
80. Malinzak RA, Ritter MA, Berend ME, Meding JB, Olberding EM, Davis KE. Morbidly obese, diabetic, younger, and unilateral joint arthroplasty patients have elevated total joint arthroplasty infection rates. J Arthroplasty. 2009;24(6 suppl):84-88.
81. Wagner ER, Kamath AF, Fruth KM, Harmsen WS, Berry DJ. Effect of body mass index on complications and reoperations after total hip arthroplasty. J Bone Joint Surg Am. 2016;98(3):169-179.
82 Broex EC, van Asselt AD, Bruggeman CA, van Tiel FH. Surgical site infections: how high are the costs? J Hosp Infect. 2009;72(3):193-201.
83. Anderson DJ, Kirkland KB, Kaye KS, et al. Underresourced hospital infection control and prevention programs: penny wise, pound foolish? Infect Control Hosp Epidemiol. 2007;28(7):767-773.
84. Centers for Medicare & Medicaid Services (CMS), HHS. Medicare program; comprehensive care for joint replacement payment model for acute care hospitals furnishing lower extremity joint replacement services. Final rule. Fed Regist. 2015;80(226):73273-73554.
Acute Management of Severe Asymptomatic Hypertension
IN THIS ARTICLE
- Patient history; what to ask
- Cardiovascular risk factors
- Disposition pathway
- Oral medications
Approximately one in three US adults, or about 75 million people, have high blood pressure (BP), which has been defined as a BP of 140/90 mm Hg or higher.1 Unfortunately, only about half (54%) of those affected have their condition under optimal control.1 From an epidemiologic standpoint, hypertension has the distinction of being the most common chronic condition in the US, affecting about 54% of persons ages 55 to 64 and about 73% of those 75 and older.2,3 It is the number one reason patients schedule office visits with physicians; it accounts for the most prescriptions; and it is a major risk factor for heart disease and stroke, as well as a significant contributor to mortality throughout the world.4
HYPERTENSIVE URGENCY VS EMERGENCY
Hypertensive urgencies and emergencies account for approximately 27% of all medical emergencies and 2% to 3% of all annual visits to the emergency department (ED).5 Hypertensive urgency, or severe asymptomatic hypertension, is a common complaint in urgent care clinics and primary care offices as well. It is often defined as a systolic BP (SBP) of ≥ 160 mm Hg and/or a diastolic BP (DBP) ≥ 100 mm Hg with no associated end-organ damage.5-7 Patients may experience hypertensive urgency if they have been noncompliant with their antihypertensive drug regimen; present with pain; have white-coat hypertension or anxiety; or use recreational drugs (eg, sympathomimetics).5,8-10
Alternatively, hypertensive emergency, also known as hypertensive crisis, is generally defined as elevated BP > 180/120 mm Hg. Equally important, it is associated with signs, symptoms, or laboratory values indicative of target end-organ damage, such as cerebrovascular accident, myocardial infarction (MI), aortic dissection, acute left ventricular failure, acute pulmonary edema, acute renal failure, acute mental status changes (hypertensive encephalopathy), and eclampsia.5,7,8,11,12
Determining appropriate management for patients with hypertensive urgency is controversial among clinicians. Practice patterns range from full screening and “rule-outs”—with prompt initiation of antihypertensive agents, regardless of whether the patient is symptomatic—to sending the patient home with minimal screening, laboratory testing, or treatment.
This article offers a guided approach to managing patients with hypertensive urgency in a logical fashion, based on risk stratification, thereby avoiding both extremes (extensive unnecessary workup or discharge without workup resulting in adverse outcomes). It is vital to differentiate between patients with hypertensive emergency, in which BP should be lowered in minutes, and patients with hypertensive urgency, in which BP can be lowered more slowly.12
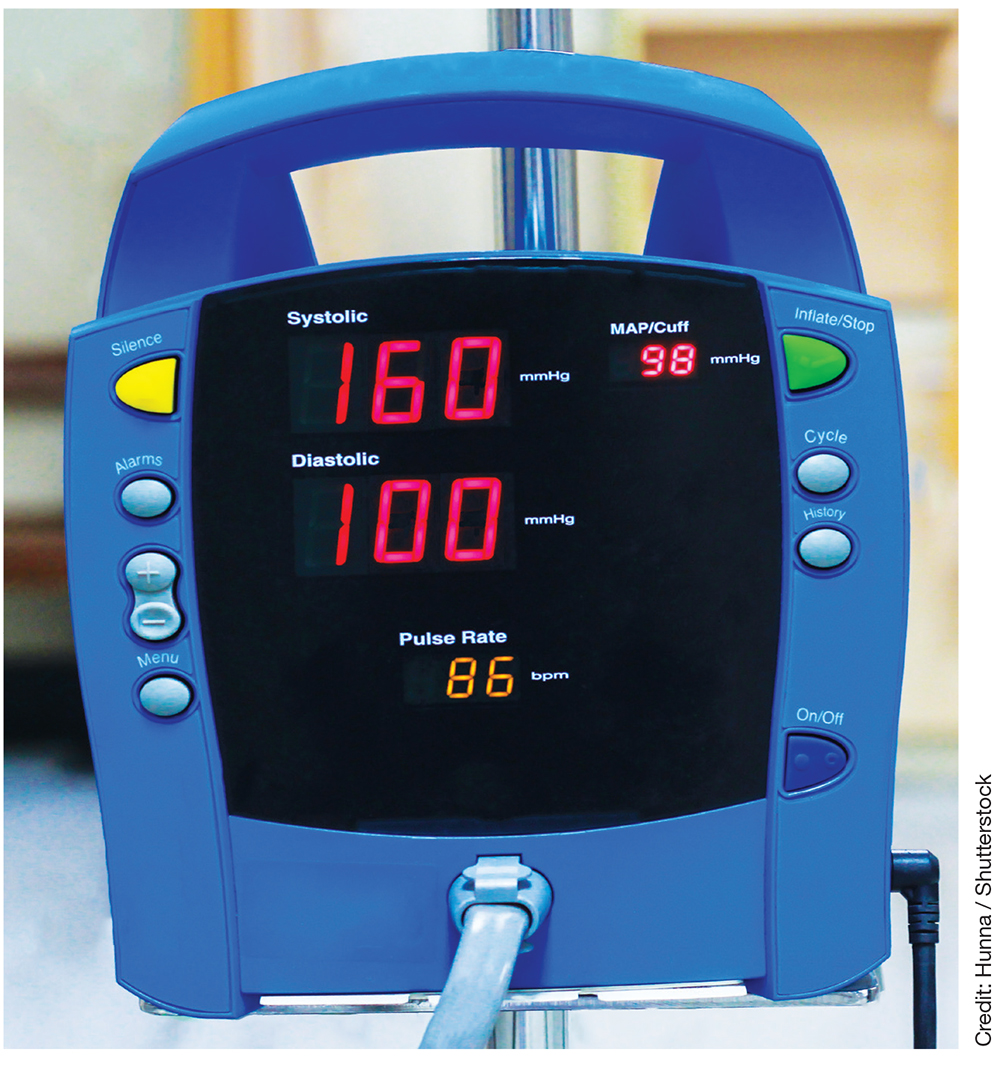
PATHOPHYSIOLOGY
Normally, when BP increases, blood vessel diameter changes in response; this autoregulation serves to limit damage. However, when BP increases abruptly, the body’s ability to hemodynamically calibrate to such a rapid change is impeded, thus allowing for potential end-organ damage.5,12 The increased vascular resistance observed in many patients with hypertension appears to be an autoregulatory process that helps to maintain a normal or viable level of tissue blood flow and organ perfusion despite the increased BP, rather than a primary cause of the hypertension.13
The exact physiology of hypertensive urgencies is not clearly understood, because of the multifactorial nature of the process. One leading theory is that circulating humoral vasoconstrictors cause an abrupt increase in systemic vascular resistance, which in turn causes mechanical shear stress to the endothelial wall. This endothelial damage promotes more vasoconstriction, platelet aggregation, and activation of the renin-angiotensin-aldosterone system, which thereby increases release of angiotensin II and various cytokines.14
HISTORY AND PHYSICAL
A detailed medical history is of utmost importance in distinguishing patients who present with asymptomatic hypertensive urgency from those experiencing a hypertensive emergency. In addition, obtain a full medication list, including any nutritional supplements or illicit drugs the patient may be taking. Question the patient regarding medication adherence; some may not be taking antihypertensive agents as prescribed or may have altered the dosing frequency in an effort to extend the duration of their prescription.5,8 Table 1 lists pertinent questions to ask at presentation; the answers will dictate who needs further workup and possible admission as well as who will require screening for end-organ damage.7
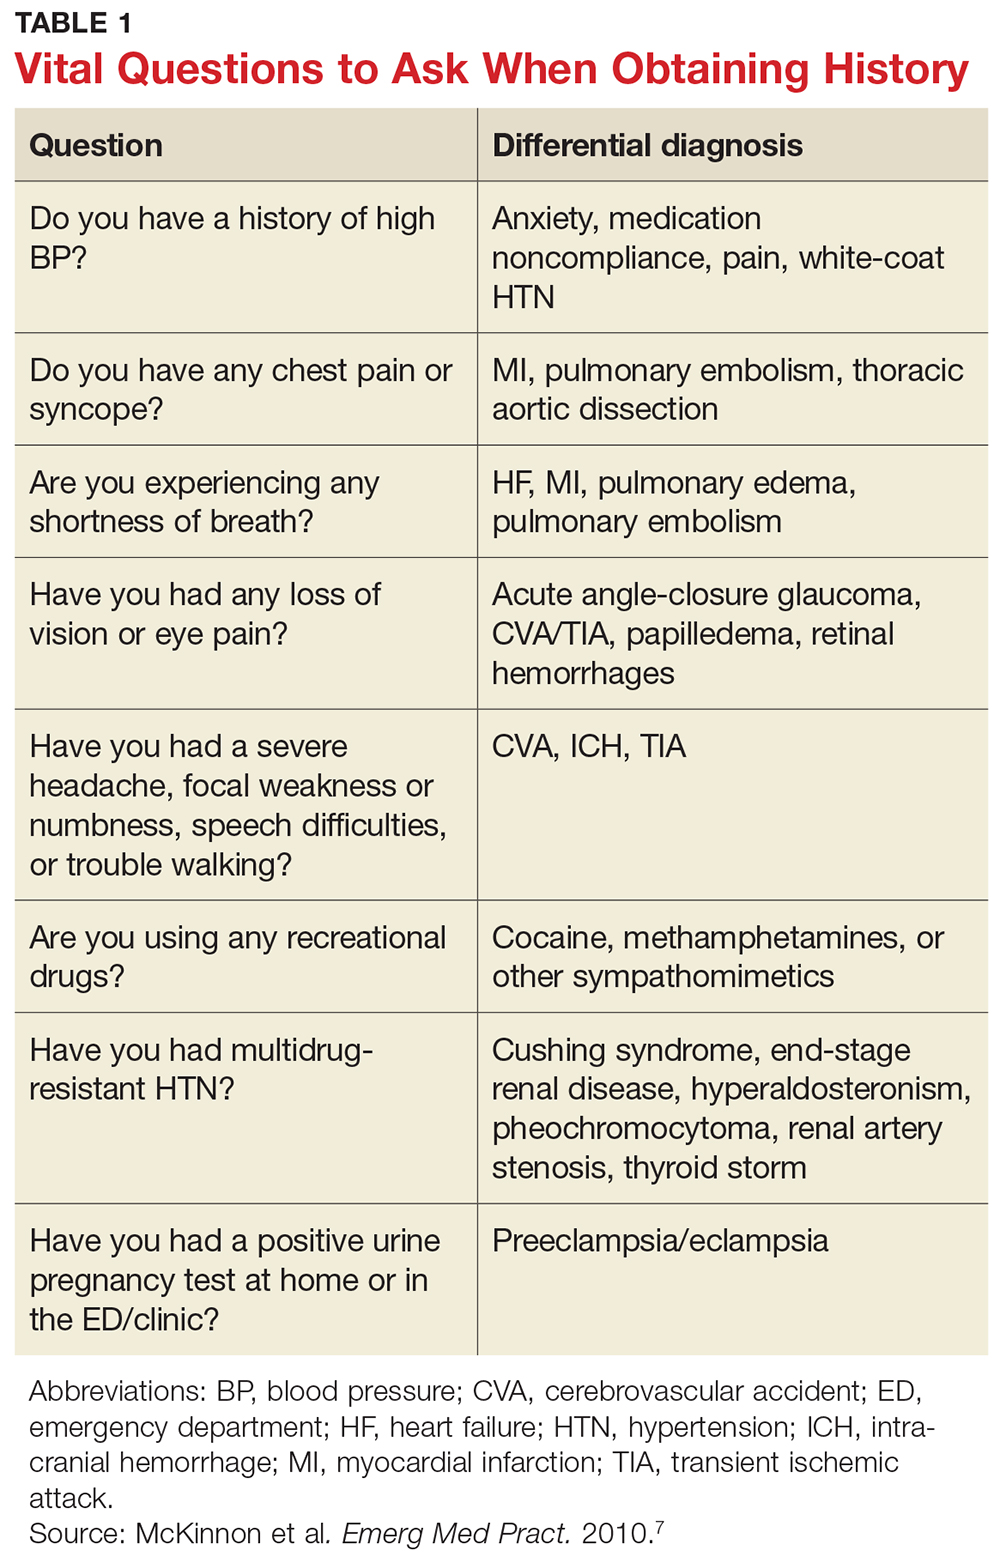
The physical exam should focus primarily on a thorough cardiopulmonary and neurologic examination, as well as funduscopic examination, if needed. A complete set of vital signs should be recorded upon the patient’s arrival to the ED or clinic and should be repeated on the opposite arm for verification. Beginning with the eyes, conduct a thorough funduscopic examination to evaluate for papilledema or hemorrhages.5 During the cardiopulmonary exam, attention should be focused on signs of congestive heart failure and/or pulmonary edema, such as increased jugular vein distension, an S3 gallop, peripheral edema, and pulmonary rales. The neurologic exam is essential in evaluating for cerebrovascular accident, transient ischemic attack, or intracranial hemorrhage. A full cranial nerve examination is necessary, in addition to motor and sensory testing, at minimum.5,9
RISK STRATIFICATION
According to the 2013 Task Force of the European Society of Hypertension (ESH) and the European Society of Cardiology (ESC), several risk factors contribute to overall cardiovascular risk in asymptomatic patients presenting with severe hypertension (see Table 2).8 This report has been monumental in linking grades of hypertension directly to cardiovascular risk factors, but it differs from that recently published by the Eighth Joint National Committee (JNC 8), which offers evidence-based guidelines for the management of high BP in the general population of adults (with some modifications for individuals with diabetes or chronic kidney disease or of black ethnicity).15
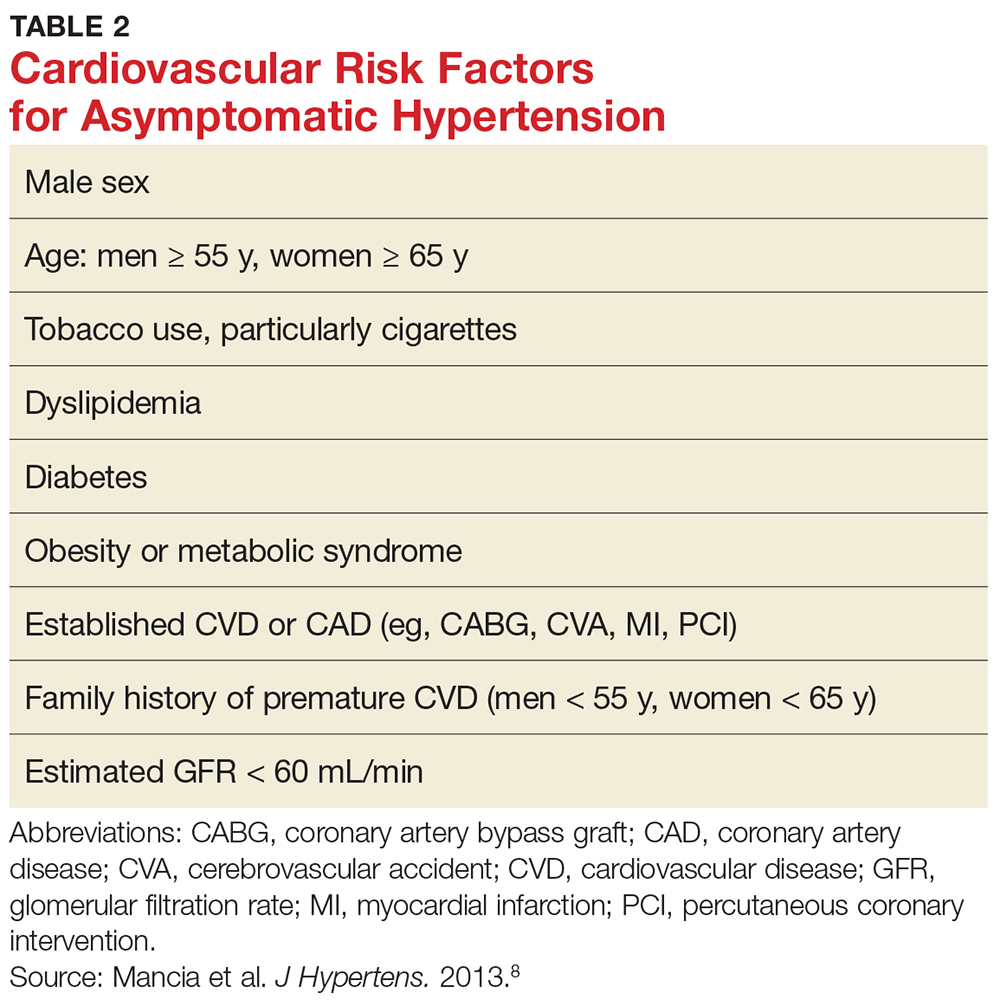
According to the ESH/ESC study, patients with one or two risk factors who have grade 1 hypertension (SBP 140-159 mm Hg) are at moderate risk for cardiovascular disease (CVD) and patients with grade 2 (SBP 160-179 mm Hg) or grade 3 (SBP ≥ 180 mm Hg) hypertension are at moderate-to-high risk and high risk, respectively.8 Patients with three or more risk factors, or who already have end-organ damage, diabetes, or chronic kidney disease, enter the high-risk category for CVD even at grade 1 hypertension.8
These cardiovascular risk factors can and should be used as guidelines for deciding who needs further screening and who may have benign causes of severe hypertension (eg, white-coat hypertension, anxiety) that can be managed safely in an outpatient setting. In the author’s opinion, patients with known cardiovascular risk factors, those with signs or symptoms of end-organ damage, and those with test results suggestive of end-organ damage should have a more immediate treatment strategy initiated.
Numerous observational studies have shown a direct relationship between systemic hypertension and CVD risk in men and women of various ages, races, and ethnicities, regardless of other risk factors for CVD.12 In patients with diabetes, uncontrolled hypertension is a strong predictor of cardiovascular morbidity and mortality and of progressive nephropathy leading to chronic kidney disease.8
SCREENING
Results from the following tests may provide useful clues in the workup of a patient with hypertensive urgency.
Basic metabolic panel. Many EDs and primary care offices offer point-of-care testing that can typically give a rapid (< 10 min) result of a basic metabolic panel. This useful, quick screening tool can identify renal failure due to chronic untreated hypertension, acute renal failure, or other disease states that cause electrolyte abnormalities such as hyperaldosteronism (hypertension with hypokalemia) or Cushing syndrome (hypertension with hypernatremia and hyperkalemia).7
Cardiac enzymes. Measurement of cardiac troponins (T or I) may provide confirmatory evidence of myocardial necrosis within two to three hours of suspected acute MI.16,17 These tests are now available in most EDs and some clinics with point-of-care testing. A variety of current guidelines advocate repeat cardiac enzyme measurements at various time points, depending on results of initial testing and concomitant risk factors. These protocols vary by facility.
ECG. Obtaining an ECG is another quick, easy, and useful way to screen patients presenting with severe hypertensive urgency. Evidence of left ventricular hypertrophy suggests an increased risk for MI, stroke, heart failure, and sudden death.7,18-20 The Cornell criteria of summing the R wave in aVL and the S wave in V3, with a cutoff of 2.8 mV in men and 2.0 mV in women, has been shown to be the best predictor of future cardiovascular mortality.7 While an isolated finding of left ventricular hypertrophy on an ECG—in and of itself—may have limited value for an individual patient, this finding coupled with other risk factors may alter the provider’s assessment.
Chest radiograph. A chest radiograph can be helpful when used in conjunction with physical exam findings that suggest pulmonary edema and cardiomegaly.7 Widened mediastinum and tortuous aorta may also be evident on chest x-ray, necessitating further workup and imaging.
Urinalysis. In a patient presenting with asymptomatic hypertensive urgency, a urine dipstick result that shows new-onset proteinuria, while not definitive for diagnosis of nephrotic syndrome, may certainly prove helpful in the patient’s workup.5,13
Urine drug screen. In patients without a history of hypertension who present with asymptomatic hypertensive urgency, the urine drug screen may ascertain exposure to cocaine, amphetamine, or phencyclidine.
Pregnancy test. A pregnancy test is essential for any female patient of childbearing age presenting to the ED, and a positive result may be concerning for preeclampsia in a hypertensive patient with no prior history of the condition.7
TREATMENT
Knowing who to treat and when is a vast area of debate among emergency and primary care providers. Patients with hypertension who have established risk factors are known to have worse outcomes than those who may be otherwise healthy. Some clinicians believe that patients presenting with hypertensive urgency should be discharged home without screening and/or treatment. However, because uncontrolled severe hypertension can lead to acute complications (eg, MI, cerebrovascular accident), in practice, many providers are unwilling to send the patient home without workup.12 The patient’s condition must be viewed in the context of the entire disease spectrum, including risk factors.
The Figure offers a disposition pathway of recommendations based on risk stratification as well as screening tools for some of the less common causes of hypertensive urgency. Regardless of the results of screening tests or the decision to treat, affected patients require close primary care follow-up. Many of these patients may need further testing and careful management of their BP medication regimen.
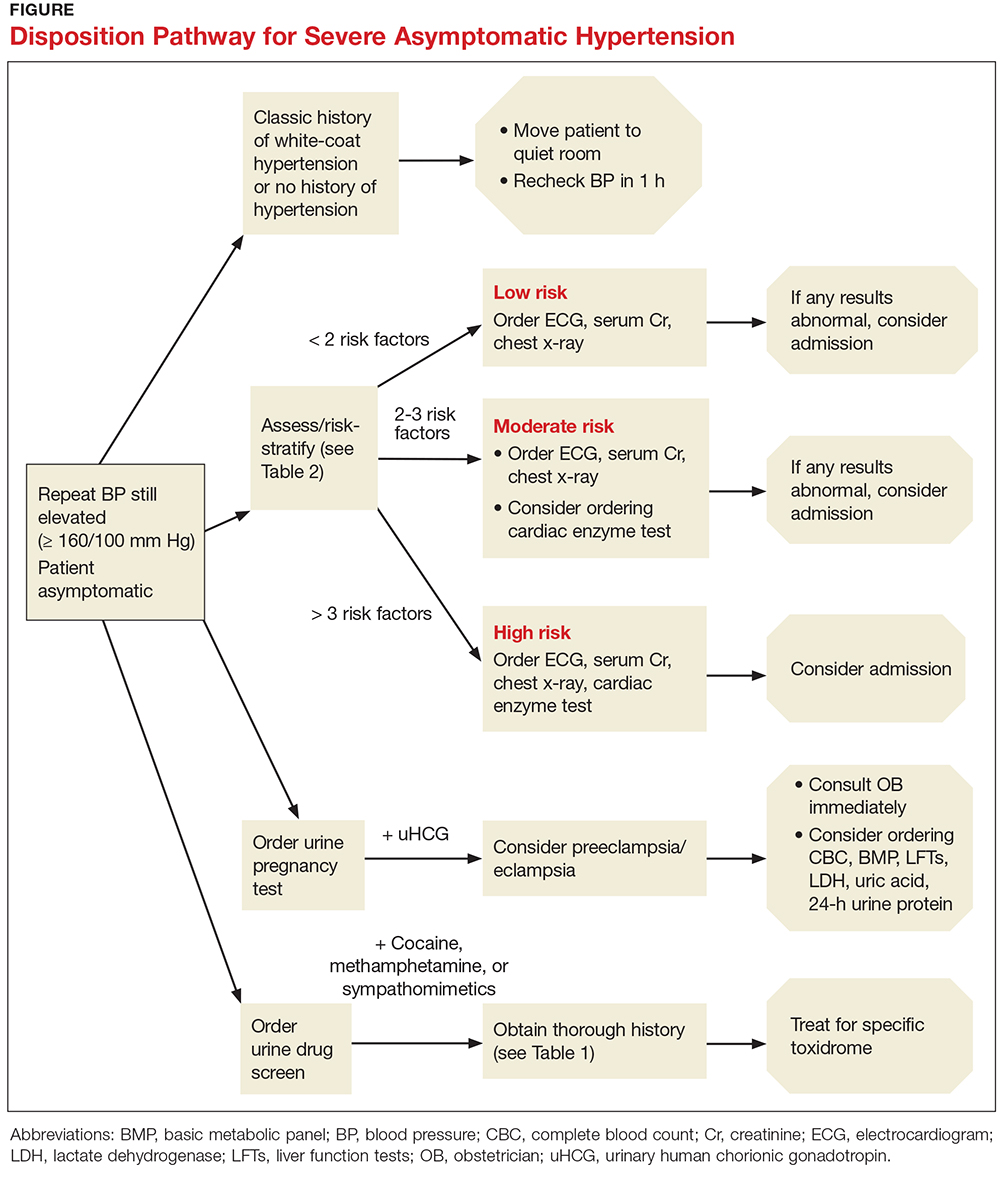
How to treat
For patients with severe asymptomatic hypertension, if the history, physical, and screening tests do not show evidence of end-organ damage, BP can be controlled within 24 to 48 hours.5,10,11,21 In adults with hypertensive urgency, the most reasonable goal is to reduce the BP to ≤ 160/100 mm Hg5-7; however, the mean arterial pressure should not be lowered by more than 25% within the first two to three hours.13
Patients at high risk for imminent neurovascular, cardiovascular, renovascular, or pulmonary events should have their BP lowered over a period of hours, not minutes. In fact, there is evidence that rapid lowering of BP in asymptomatic patients may cause adverse outcomes.6 For example, in patients with acute ischemic stroke, increases in cerebral perfusion pressure promote an increase in vascular resistance—but decreasing the cerebral perfusion pressure abruptly will thereby decrease the cerebral blood flow, potentially causing cerebral ischemia or a worsening of the stroke.9,14
Treatment options
A broad spectrum of therapeutic options has proven helpful in lowering BP over a short period of time, including oral captopril, clonidine, hydralazine, labetalol, and hydrochlorothiazide (see Table 3).7,9,12,15 Nifedipine is contraindicated because of the abrupt and often unpredictable reduction in BP and associated myocardial ischemia, especially in patients with MI or left ventricular hypertrophy.14,22,23 In cases of hypertensive urgency secondary to cocaine abuse, benzodiazepines would be the drug of choice and ß-blockers should be avoided due to the risk for coronary vasoconstriction.7
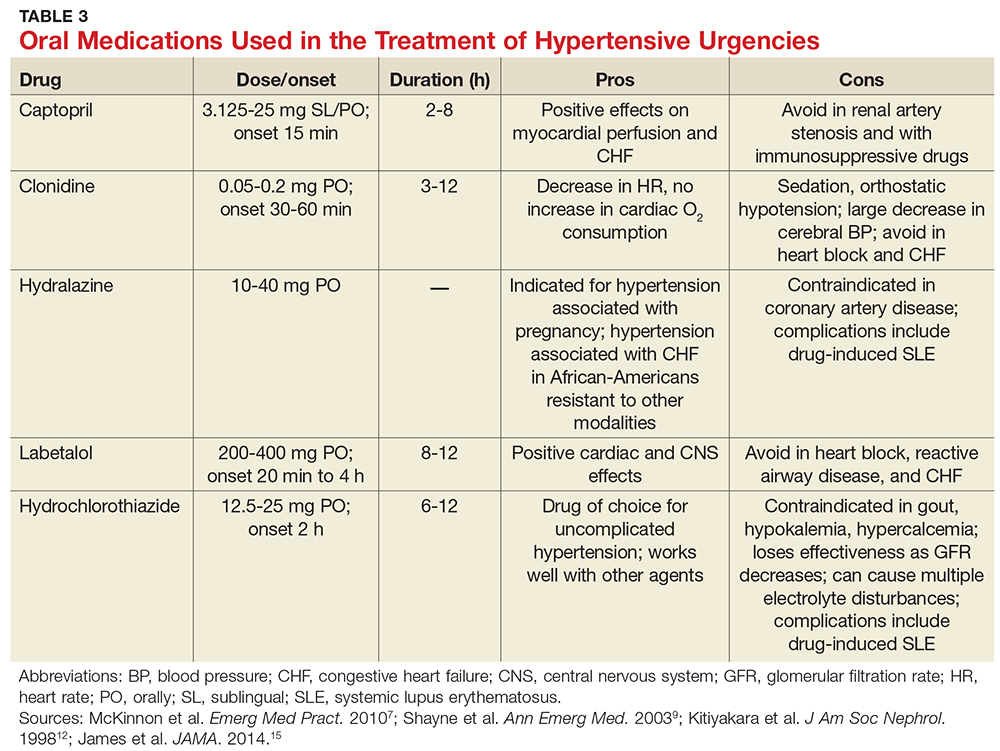
For patients with previously treated hypertension, the following options are reasonable: Increase the dose of the current antihypertensive medication; add another agent; reinstitute prior antihypertensive medications in nonadherent patients; or add a diuretic.
In patients with previously untreated hypertension, no clear evidence supports using one particular agent over another. However, initial treatment options that are generally considered safe include an ACE inhibitor, an angiotensin receptor blocker, a calcium channel blocker, or a thiazide diuretic.15 A few examples of medications within these categories include lisinopril (10 mg PO qd), losartan (50 mg PO qd), amlodipine (2.5 mg PO qd), or hydrochlorothiazide (25 mg PO qd).
Close follow-up is essential when an antihypertensive medication is started or reinstituted. Encourage the patient to reestablish care with their primary care provider (if you do not fill that role). You may need to refer the patient to a new provider or, in some cases, have the patient return to the ED for a repeat BP check.
CONCLUSION
The challenges of managing patients with hypertensive urgency are complicated by low follow-up rates with primary physicians, difficulty in obtaining referrals and follow-up for the patient, and hesitancy of providers to start patients on new BP medications. This article clarifies a well-defined algorithm for how to screen and risk-stratify patients who present to the ED or primary care office with hypertensive urgency.
1. CDC. High blood pressure fact sheet. www.cdc.gov/dhdsp/data_statistics/fact_sheets/fs_bloodpressure.htm. Accessed September 26, 2017.
2. Decker WW, Godwin SA, Hess EP, et al; American College of Emergency Physicians Clinical Policies Subcommittee (Writing Committee) on Asymptomatic Hypertension in the ED. Clinical policy: critical issues in the evaluation and management of adult patients with asymptomatic hypertension in the emergency department. Ann Emerg Med. 2006;47(3):237-249.
3. CDC. High blood pressure facts. www.cdc.gov/bloodpressure/facts.htm. Accessed October 19, 2017.
4. World Health Organization. Global Health Risks: Mortality and Burden of Disease Attributable to Selected Major Risks. Geneva, Switzerland: WHO; 2009. www.who.int/healthinfo/global_burden_disease/GlobalHealthRisks_report_full.pdf. Accessed October 19, 2017.
5. Stewart DL, Feinstein SE, Colgan R. Hypertensive urgencies and emergencies. Prim Care. 2006;33(3):613-623.
6. Wolf SJ, Lo B, Shih RD, et al; American College of Emergency Physicians Clinical Policies Committee. Clinical policy: critical issues in the evaluation and management of adult patients in the emergency department with asymptomatic elevated blood pressure. Ann Emerg Med. 2013;62(1):59-68.
7. McKinnon M, O’Neill JM. Hypertension in the emergency department: treat now, later, or not at all. Emerg Med Pract. 2010;12(6):1-22.
8. Mancia G, Fagard R, Narkiewicz K, et al. 2013 ESH/ESC Guidelines for the management of arterial hypertension: the Task Force for the management of arterial hypertension of the European Society of Hypertension (ESH) and of the European Society of Cardiology (ESC). J Hypertens. 2013;31(7): 1281-1357.
9. Shayne PH, Pitts SR. Severely increased blood pressure in the emergency department. Ann Emerg Med. 2003;41(4): 513-529.
10. Aggarwal M, Khan IA. Hypertensive crisis: hypertensive emergencies and urgencies. Cardiol Clin. 2006;24(1):135-146.
11. Houston MC. The comparative effects of clonidine hydrochloride and nifedipine in the treatment of hypertensive crises. Am Heart J. 1998;115(1 pt 1):152-159.
12. Kitiyakara C, Guaman NJ. Malignant hypertension and hypertensive emergencies. J Am Soc Nephrol. 1998;9(1):133-142.
13. Elliott WJ. Hypertensive emergencies. Crit Care Clin. 2001;17(2):435-451.
14. Papadopoulos DP, Mourouzis I, Thomopoulos C, et al. Hypertension crisis. Blood Press. 2010;19(6):328-336.
15. James PA, Oparil S, Carter BL, et al. 2014 evidence-based guideline for the management of high blood pressure in adults: report from the panel members appointed to the Eighth Joint National Committee (JNC 8). JAMA. 2014;311(5):507-520.
16. Keller T, Zeller T, Peetz D, et al. Sensitive troponin I assay in early diagnosis of acute myocardial infarction. N Engl J Med. 2009;361(9):868-877.
17. Reichlin T, Hochholzer W, Bassetti S, et al. Early diagnosis of myocardial infarction with sensitive cardiac troponin assays. N Engl J Med. 2009;361(9):858-867.
18. Ghali JK, Kadakia S, Cooper RS, Liao YL. Impact of left ventricular hypertrophy on ventricular arrhythmias in the absence of coronary artery disease. J Am Coll Cardiol. 1991;17(6):1277-1282.
19. Bang CN, Soliman EZ, Simpson LM, et al. Electrocardiographic left ventricular hypertrophy predicts cardiovascular morbidity and mortality in hypertensive patients: the ALLHAT study. Am J Hypertens. 2017;30(9):914-922.
20. Hsieh BP, Pham MX, Froelicher VF. Prognostic value of electrocardiographic criteria for left ventricular hypertrophy. Am Heart J. 2005;150(1):161-167.
21. Kinsella K, Baraff LJ. Initiation of therapy for asymptomatic hypertension in the emergency department. Ann Emerg Med. 2009;54(6):791-792.
22. O’Mailia JJ, Sander GE, Giles TD. Nifedipine-associated myocardial ischemia or infarction in the treatment of hypertensive urgencies. Ann Intern Med. 1987;107(2):185-186.
23. Grossman E, Messerli FH, Grodzicki T, Kowey P. Should a moratorium be placed on sublingual nifedipine capsules given for hypertensive emergencies and pseudoemergencies? JAMA. 1996;276(16):1328-1331.
IN THIS ARTICLE
- Patient history; what to ask
- Cardiovascular risk factors
- Disposition pathway
- Oral medications
Approximately one in three US adults, or about 75 million people, have high blood pressure (BP), which has been defined as a BP of 140/90 mm Hg or higher.1 Unfortunately, only about half (54%) of those affected have their condition under optimal control.1 From an epidemiologic standpoint, hypertension has the distinction of being the most common chronic condition in the US, affecting about 54% of persons ages 55 to 64 and about 73% of those 75 and older.2,3 It is the number one reason patients schedule office visits with physicians; it accounts for the most prescriptions; and it is a major risk factor for heart disease and stroke, as well as a significant contributor to mortality throughout the world.4
HYPERTENSIVE URGENCY VS EMERGENCY
Hypertensive urgencies and emergencies account for approximately 27% of all medical emergencies and 2% to 3% of all annual visits to the emergency department (ED).5 Hypertensive urgency, or severe asymptomatic hypertension, is a common complaint in urgent care clinics and primary care offices as well. It is often defined as a systolic BP (SBP) of ≥ 160 mm Hg and/or a diastolic BP (DBP) ≥ 100 mm Hg with no associated end-organ damage.5-7 Patients may experience hypertensive urgency if they have been noncompliant with their antihypertensive drug regimen; present with pain; have white-coat hypertension or anxiety; or use recreational drugs (eg, sympathomimetics).5,8-10
Alternatively, hypertensive emergency, also known as hypertensive crisis, is generally defined as elevated BP > 180/120 mm Hg. Equally important, it is associated with signs, symptoms, or laboratory values indicative of target end-organ damage, such as cerebrovascular accident, myocardial infarction (MI), aortic dissection, acute left ventricular failure, acute pulmonary edema, acute renal failure, acute mental status changes (hypertensive encephalopathy), and eclampsia.5,7,8,11,12
Determining appropriate management for patients with hypertensive urgency is controversial among clinicians. Practice patterns range from full screening and “rule-outs”—with prompt initiation of antihypertensive agents, regardless of whether the patient is symptomatic—to sending the patient home with minimal screening, laboratory testing, or treatment.
This article offers a guided approach to managing patients with hypertensive urgency in a logical fashion, based on risk stratification, thereby avoiding both extremes (extensive unnecessary workup or discharge without workup resulting in adverse outcomes). It is vital to differentiate between patients with hypertensive emergency, in which BP should be lowered in minutes, and patients with hypertensive urgency, in which BP can be lowered more slowly.12
PATHOPHYSIOLOGY
Normally, when BP increases, blood vessel diameter changes in response; this autoregulation serves to limit damage. However, when BP increases abruptly, the body’s ability to hemodynamically calibrate to such a rapid change is impeded, thus allowing for potential end-organ damage.5,12 The increased vascular resistance observed in many patients with hypertension appears to be an autoregulatory process that helps to maintain a normal or viable level of tissue blood flow and organ perfusion despite the increased BP, rather than a primary cause of the hypertension.13
The exact physiology of hypertensive urgencies is not clearly understood, because of the multifactorial nature of the process. One leading theory is that circulating humoral vasoconstrictors cause an abrupt increase in systemic vascular resistance, which in turn causes mechanical shear stress to the endothelial wall. This endothelial damage promotes more vasoconstriction, platelet aggregation, and activation of the renin-angiotensin-aldosterone system, which thereby increases release of angiotensin II and various cytokines.14
HISTORY AND PHYSICAL
A detailed medical history is of utmost importance in distinguishing patients who present with asymptomatic hypertensive urgency from those experiencing a hypertensive emergency. In addition, obtain a full medication list, including any nutritional supplements or illicit drugs the patient may be taking. Question the patient regarding medication adherence; some may not be taking antihypertensive agents as prescribed or may have altered the dosing frequency in an effort to extend the duration of their prescription.5,8 Table 1 lists pertinent questions to ask at presentation; the answers will dictate who needs further workup and possible admission as well as who will require screening for end-organ damage.7
The physical exam should focus primarily on a thorough cardiopulmonary and neurologic examination, as well as funduscopic examination, if needed. A complete set of vital signs should be recorded upon the patient’s arrival to the ED or clinic and should be repeated on the opposite arm for verification. Beginning with the eyes, conduct a thorough funduscopic examination to evaluate for papilledema or hemorrhages.5 During the cardiopulmonary exam, attention should be focused on signs of congestive heart failure and/or pulmonary edema, such as increased jugular vein distension, an S3 gallop, peripheral edema, and pulmonary rales. The neurologic exam is essential in evaluating for cerebrovascular accident, transient ischemic attack, or intracranial hemorrhage. A full cranial nerve examination is necessary, in addition to motor and sensory testing, at minimum.5,9
RISK STRATIFICATION
According to the 2013 Task Force of the European Society of Hypertension (ESH) and the European Society of Cardiology (ESC), several risk factors contribute to overall cardiovascular risk in asymptomatic patients presenting with severe hypertension (see Table 2).8 This report has been monumental in linking grades of hypertension directly to cardiovascular risk factors, but it differs from that recently published by the Eighth Joint National Committee (JNC 8), which offers evidence-based guidelines for the management of high BP in the general population of adults (with some modifications for individuals with diabetes or chronic kidney disease or of black ethnicity).15
According to the ESH/ESC study, patients with one or two risk factors who have grade 1 hypertension (SBP 140-159 mm Hg) are at moderate risk for cardiovascular disease (CVD) and patients with grade 2 (SBP 160-179 mm Hg) or grade 3 (SBP ≥ 180 mm Hg) hypertension are at moderate-to-high risk and high risk, respectively.8 Patients with three or more risk factors, or who already have end-organ damage, diabetes, or chronic kidney disease, enter the high-risk category for CVD even at grade 1 hypertension.8
These cardiovascular risk factors can and should be used as guidelines for deciding who needs further screening and who may have benign causes of severe hypertension (eg, white-coat hypertension, anxiety) that can be managed safely in an outpatient setting. In the author’s opinion, patients with known cardiovascular risk factors, those with signs or symptoms of end-organ damage, and those with test results suggestive of end-organ damage should have a more immediate treatment strategy initiated.
Numerous observational studies have shown a direct relationship between systemic hypertension and CVD risk in men and women of various ages, races, and ethnicities, regardless of other risk factors for CVD.12 In patients with diabetes, uncontrolled hypertension is a strong predictor of cardiovascular morbidity and mortality and of progressive nephropathy leading to chronic kidney disease.8
SCREENING
Results from the following tests may provide useful clues in the workup of a patient with hypertensive urgency.
Basic metabolic panel. Many EDs and primary care offices offer point-of-care testing that can typically give a rapid (< 10 min) result of a basic metabolic panel. This useful, quick screening tool can identify renal failure due to chronic untreated hypertension, acute renal failure, or other disease states that cause electrolyte abnormalities such as hyperaldosteronism (hypertension with hypokalemia) or Cushing syndrome (hypertension with hypernatremia and hyperkalemia).7
Cardiac enzymes. Measurement of cardiac troponins (T or I) may provide confirmatory evidence of myocardial necrosis within two to three hours of suspected acute MI.16,17 These tests are now available in most EDs and some clinics with point-of-care testing. A variety of current guidelines advocate repeat cardiac enzyme measurements at various time points, depending on results of initial testing and concomitant risk factors. These protocols vary by facility.
ECG. Obtaining an ECG is another quick, easy, and useful way to screen patients presenting with severe hypertensive urgency. Evidence of left ventricular hypertrophy suggests an increased risk for MI, stroke, heart failure, and sudden death.7,18-20 The Cornell criteria of summing the R wave in aVL and the S wave in V3, with a cutoff of 2.8 mV in men and 2.0 mV in women, has been shown to be the best predictor of future cardiovascular mortality.7 While an isolated finding of left ventricular hypertrophy on an ECG—in and of itself—may have limited value for an individual patient, this finding coupled with other risk factors may alter the provider’s assessment.
Chest radiograph. A chest radiograph can be helpful when used in conjunction with physical exam findings that suggest pulmonary edema and cardiomegaly.7 Widened mediastinum and tortuous aorta may also be evident on chest x-ray, necessitating further workup and imaging.
Urinalysis. In a patient presenting with asymptomatic hypertensive urgency, a urine dipstick result that shows new-onset proteinuria, while not definitive for diagnosis of nephrotic syndrome, may certainly prove helpful in the patient’s workup.5,13
Urine drug screen. In patients without a history of hypertension who present with asymptomatic hypertensive urgency, the urine drug screen may ascertain exposure to cocaine, amphetamine, or phencyclidine.
Pregnancy test. A pregnancy test is essential for any female patient of childbearing age presenting to the ED, and a positive result may be concerning for preeclampsia in a hypertensive patient with no prior history of the condition.7
TREATMENT
Knowing who to treat and when is a vast area of debate among emergency and primary care providers. Patients with hypertension who have established risk factors are known to have worse outcomes than those who may be otherwise healthy. Some clinicians believe that patients presenting with hypertensive urgency should be discharged home without screening and/or treatment. However, because uncontrolled severe hypertension can lead to acute complications (eg, MI, cerebrovascular accident), in practice, many providers are unwilling to send the patient home without workup.12 The patient’s condition must be viewed in the context of the entire disease spectrum, including risk factors.
The Figure offers a disposition pathway of recommendations based on risk stratification as well as screening tools for some of the less common causes of hypertensive urgency. Regardless of the results of screening tests or the decision to treat, affected patients require close primary care follow-up. Many of these patients may need further testing and careful management of their BP medication regimen.
How to treat
For patients with severe asymptomatic hypertension, if the history, physical, and screening tests do not show evidence of end-organ damage, BP can be controlled within 24 to 48 hours.5,10,11,21 In adults with hypertensive urgency, the most reasonable goal is to reduce the BP to ≤ 160/100 mm Hg5-7; however, the mean arterial pressure should not be lowered by more than 25% within the first two to three hours.13
Patients at high risk for imminent neurovascular, cardiovascular, renovascular, or pulmonary events should have their BP lowered over a period of hours, not minutes. In fact, there is evidence that rapid lowering of BP in asymptomatic patients may cause adverse outcomes.6 For example, in patients with acute ischemic stroke, increases in cerebral perfusion pressure promote an increase in vascular resistance—but decreasing the cerebral perfusion pressure abruptly will thereby decrease the cerebral blood flow, potentially causing cerebral ischemia or a worsening of the stroke.9,14
Treatment options
A broad spectrum of therapeutic options has proven helpful in lowering BP over a short period of time, including oral captopril, clonidine, hydralazine, labetalol, and hydrochlorothiazide (see Table 3).7,9,12,15 Nifedipine is contraindicated because of the abrupt and often unpredictable reduction in BP and associated myocardial ischemia, especially in patients with MI or left ventricular hypertrophy.14,22,23 In cases of hypertensive urgency secondary to cocaine abuse, benzodiazepines would be the drug of choice and ß-blockers should be avoided due to the risk for coronary vasoconstriction.7
For patients with previously treated hypertension, the following options are reasonable: Increase the dose of the current antihypertensive medication; add another agent; reinstitute prior antihypertensive medications in nonadherent patients; or add a diuretic.
In patients with previously untreated hypertension, no clear evidence supports using one particular agent over another. However, initial treatment options that are generally considered safe include an ACE inhibitor, an angiotensin receptor blocker, a calcium channel blocker, or a thiazide diuretic.15 A few examples of medications within these categories include lisinopril (10 mg PO qd), losartan (50 mg PO qd), amlodipine (2.5 mg PO qd), or hydrochlorothiazide (25 mg PO qd).
Close follow-up is essential when an antihypertensive medication is started or reinstituted. Encourage the patient to reestablish care with their primary care provider (if you do not fill that role). You may need to refer the patient to a new provider or, in some cases, have the patient return to the ED for a repeat BP check.
CONCLUSION
The challenges of managing patients with hypertensive urgency are complicated by low follow-up rates with primary physicians, difficulty in obtaining referrals and follow-up for the patient, and hesitancy of providers to start patients on new BP medications. This article clarifies a well-defined algorithm for how to screen and risk-stratify patients who present to the ED or primary care office with hypertensive urgency.
1. CDC. High blood pressure fact sheet. www.cdc.gov/dhdsp/data_statistics/fact_sheets/fs_bloodpressure.htm. Accessed September 26, 2017.
2. Decker WW, Godwin SA, Hess EP, et al; American College of Emergency Physicians Clinical Policies Subcommittee (Writing Committee) on Asymptomatic Hypertension in the ED. Clinical policy: critical issues in the evaluation and management of adult patients with asymptomatic hypertension in the emergency department. Ann Emerg Med. 2006;47(3):237-249.
3. CDC. High blood pressure facts. www.cdc.gov/bloodpressure/facts.htm. Accessed October 19, 2017.
4. World Health Organization. Global Health Risks: Mortality and Burden of Disease Attributable to Selected Major Risks. Geneva, Switzerland: WHO; 2009. www.who.int/healthinfo/global_burden_disease/GlobalHealthRisks_report_full.pdf. Accessed October 19, 2017.
5. Stewart DL, Feinstein SE, Colgan R. Hypertensive urgencies and emergencies. Prim Care. 2006;33(3):613-623.
6. Wolf SJ, Lo B, Shih RD, et al; American College of Emergency Physicians Clinical Policies Committee. Clinical policy: critical issues in the evaluation and management of adult patients in the emergency department with asymptomatic elevated blood pressure. Ann Emerg Med. 2013;62(1):59-68.
7. McKinnon M, O’Neill JM. Hypertension in the emergency department: treat now, later, or not at all. Emerg Med Pract. 2010;12(6):1-22.
8. Mancia G, Fagard R, Narkiewicz K, et al. 2013 ESH/ESC Guidelines for the management of arterial hypertension: the Task Force for the management of arterial hypertension of the European Society of Hypertension (ESH) and of the European Society of Cardiology (ESC). J Hypertens. 2013;31(7): 1281-1357.
9. Shayne PH, Pitts SR. Severely increased blood pressure in the emergency department. Ann Emerg Med. 2003;41(4): 513-529.
10. Aggarwal M, Khan IA. Hypertensive crisis: hypertensive emergencies and urgencies. Cardiol Clin. 2006;24(1):135-146.
11. Houston MC. The comparative effects of clonidine hydrochloride and nifedipine in the treatment of hypertensive crises. Am Heart J. 1998;115(1 pt 1):152-159.
12. Kitiyakara C, Guaman NJ. Malignant hypertension and hypertensive emergencies. J Am Soc Nephrol. 1998;9(1):133-142.
13. Elliott WJ. Hypertensive emergencies. Crit Care Clin. 2001;17(2):435-451.
14. Papadopoulos DP, Mourouzis I, Thomopoulos C, et al. Hypertension crisis. Blood Press. 2010;19(6):328-336.
15. James PA, Oparil S, Carter BL, et al. 2014 evidence-based guideline for the management of high blood pressure in adults: report from the panel members appointed to the Eighth Joint National Committee (JNC 8). JAMA. 2014;311(5):507-520.
16. Keller T, Zeller T, Peetz D, et al. Sensitive troponin I assay in early diagnosis of acute myocardial infarction. N Engl J Med. 2009;361(9):868-877.
17. Reichlin T, Hochholzer W, Bassetti S, et al. Early diagnosis of myocardial infarction with sensitive cardiac troponin assays. N Engl J Med. 2009;361(9):858-867.
18. Ghali JK, Kadakia S, Cooper RS, Liao YL. Impact of left ventricular hypertrophy on ventricular arrhythmias in the absence of coronary artery disease. J Am Coll Cardiol. 1991;17(6):1277-1282.
19. Bang CN, Soliman EZ, Simpson LM, et al. Electrocardiographic left ventricular hypertrophy predicts cardiovascular morbidity and mortality in hypertensive patients: the ALLHAT study. Am J Hypertens. 2017;30(9):914-922.
20. Hsieh BP, Pham MX, Froelicher VF. Prognostic value of electrocardiographic criteria for left ventricular hypertrophy. Am Heart J. 2005;150(1):161-167.
21. Kinsella K, Baraff LJ. Initiation of therapy for asymptomatic hypertension in the emergency department. Ann Emerg Med. 2009;54(6):791-792.
22. O’Mailia JJ, Sander GE, Giles TD. Nifedipine-associated myocardial ischemia or infarction in the treatment of hypertensive urgencies. Ann Intern Med. 1987;107(2):185-186.
23. Grossman E, Messerli FH, Grodzicki T, Kowey P. Should a moratorium be placed on sublingual nifedipine capsules given for hypertensive emergencies and pseudoemergencies? JAMA. 1996;276(16):1328-1331.

Implementing Patient-Reported Outcome Measures in Your Practice: Pearls and Pitfalls
Take-Home Points
- Systematic use of PROMs allows physicians to review data on pain, physical function, and psychological status to aid in clinical decision-making and best practices.
- PROMs should include both general outcome measures (VAS, SF-36, or EQ-5D) and reliable, valid, and responsive disease specific measures.
- PROM questionnaires should collect pertinent information while limiting the length to maximize patient compliance and reliability.
- PROMIS has been developed to standardize questionnaires, but generality for specific orthopedic procedures may result in less effective measures.
- PROMs can also be used for predictive modeling, which has the potential to help develop more cost-effective care and predict expected outcomes and recovery trajectories for individual patients.
Owing to their unique ability to recognize patients as stakeholders in their own healthcare, patient-reported outcome measures (PROMs) are becoming increasingly popular in the assessment of medical and surgical outcomes.1 PROMs are an outcome measures subset in which patients complete questionnaires about their perceptions of their overall health status and specific health limitations. By systematically using PROMs before and after a clearly defined episode of care, clinicians can collect data on perceived pain level, physical function, and psychological status and use the data to validate use of surgical procedures and shape clinical decisions about best practices.2-4 Although mortality and morbidity rates and other traditional measures are valuable in assessing outcomes, they do not represent or communicate the larger impact of an episode of care. As many orthopedic procedures are elective, and some are low-risk, the evaluation of changes in quality of life and self-reported functional improvement is an important addition to morbidity and mortality rates in capturing the true impact of a surgical procedure and recovery. The patient’s preoperative and postoperative perspectives on his or her health status have become important as well; our healthcare system has been placing more emphasis on patient-centered quality care.2,5
Although PROMs have many benefits, implementation in an orthopedic surgery practice has its challenges. With so many PROMs available, selecting those that fit the patient population for a specialized orthopedic surgery practice can be difficult. In addition, although PROM data are essential for research and for measuring individual or institutional recovery trajectories for surgical procedures, in a busy practice getting patients to provide these data can be difficult.
PROMs are heavily used for outcomes assessment in the orthopedics literature, but there are few resources for orthopedic surgeons who want to implement PROMs in their practices. In this article, we review the literature on the challenges of effectively implementing PROMs in an orthopedic surgery practice.
PROM Selection Considerations
PROMs can be categorized as either generic or disease-specific,4 but together they are used to adequately capture the impact, both broad and local, of an orthopedic condition.
Generic Outcome Measures
Generic outcome measures apply to a range of subspecialties or anatomical regions, allowing for evaluation of a patient’s overall health or quality of life. The most widely accepted measure of pain is the visual analog scale (VAS). The VAS for pain quantifies the level of pain a patient experiences at a given time on a graphic sliding scale from 0 (no pain) to 10 (worst possible pain). The VAS is used in clinical evaluation of pain and in reported outcomes literature.6,7
Many generic PROMs assess mental health status in addition to physical limitations. Poor preoperative mental health status has been recognized as a predictor of worse outcomes across a variety of orthopedic procedures.8,9 Therefore, to assess the overall influence of an orthopedic condition, it is important to include at least 1 generic PROM that assesses mental health status before and after an episode of care. Generic PROMs commonly used in orthopedic surgery include the 36-Item Short Form Health Survey (SF-36), the shorter SF-12, the Veterans RAND 12-Item Health Survey (VR-12), the World Health Organization Disability Assessment Schedule (WHODAS), the European Quality of Life-5 Dimensions (EQ-5D) index, and the 10-item Patient-Reported Outcomes Measurement Information System Global Health (PROMIS-10) scale.10-14
Some generic outcome measures (eg, the EQ-5D index) offer the “utility” calculation, which represents a preference for a patient’s desired health status. Such utilities allow for a measurement of quality of life, represented by quality-adjusted life years (QALY), which is a standardized measure of disease burden. Calculated QALY from measures such as the EQ-5D can be used in cost-effectiveness analyses of surgical interventions and have been used to validate use of procedures, particularly in arthroplasty.15-17
Disease-Specific Outcome Measures
Likewise, there is a range of disease-specific PROMs validated for use in orthopedic surgery, and providers select PROMs that fit their scope of practice. In anatomical regions such as the knee, hip, and shoulder, disease-specific outcome measures vary significantly by subspecialty and patient population. When selecting disease-specific PROMs, providers must consider tools such as reliability, validity, responsiveness, and available population norms. One study used Evaluating Measures of Patient-Reported Outcomes (EMPRO) to assess the quality of a PROM in shoulders and concluded that the American Shoulder and Elbow Surgeons (ASES) index, the Simple Shoulder Test (SST), and the Oxford Shoulder Score (OSS) were all supported for use in practice.18 It is important to note that reliability, validity, and responsiveness of a PROM may vary with the diagnosis or the patient population studied. For example, the SST was found to be responsive in assessing rotator cuff injury but not as useful in assessing shoulder instability or arthritis.19 Variable responsiveness highlights the need for a diagnosis-based level of PROM customization. For example, patients who undergo a surgical intervention for shoulder instability are given a customized survey, which includes PROMs specific to their condition, such as the Western Ontario Shoulder Instability (WOSI) index.20 For patients with knee instability, similar considerations apply; specific measures such as the Lysholm score and the Tenger Activity Scale capture the impact of injury in physically demanding activities.21 When selecting disease-specific PROMs, providers should consult articles like those by Davidson and Keating22 and Bent and colleagues,23 who present provider-friendly tools that can be used to examine the effectiveness of a PROM, and provide additional background information on selecting disease-specific PROMs. For hip and knee arthroplasty subspecialties, the International Society of Arthroplasty Registries (ISAR) created a working group that determines best practices for PROM collection and identifies PROMs most commonly reported in arthroplasty.24
Questionnaire Length Considerations
When PROMs are used in a practice, a balance must be struck between gathering enough information to determine functionality and limiting the patient burden of questionnaire length. A decision to use several PROMs all at once, at a single data collection point, can lengthen the questionnaire significantly. One study found that, with use of longer questionnaires, patients may lose interest, resulting in decreased reliability and compliance.25 For example, providers who use the long (42-item) Knee Injury and Osteoarthritis Outcome Score (KOOS) questionnaire to assess knee function are often limited in what other PROMs they may administer at the same time. Efforts to shorten this questionnaire while still capturing necessary information led to the development of the 7-item KOOS Jr, which was validated for use in knee arthroplasty and had its 7 items drawn from the original 42.26 Similarly, the 40-item Hip Disability and Osteoarthritis Outcome Score (HOOS) questionnaire was shortened to the 6-item HOOS Jr, which was validated for use in hip arthroplasty,27 and the generic SF-36 was shortened to the SF-12.11 Providers trying to build an outcomes database while minimizing patient burden should consider using the shorter versions of these questionnaires but should also consider their validity, as KOOS Jr and HOOS Jr have been validated for use only in knee and hip arthroplasty and not in other knee and hip conditions.
PROM Data Collection Considerations
Comprehensive collection of longitudinal PROM data poses many challenges for providers and patients. For providers, the greatest challenges are infrastructure, technology, and the personnel needed to administer and store paper or electronic surveys. For patients, the most common survey completion barriers are questionnaire length, confusing or irrelevant content, and, in the case of some older adults, inability to complete surveys electronically.25
Identifying a nonresponsive or noncompliant patient population is an important issue in collecting PROM data for research or other purposes. A study of factors associated with higher nonresponse rates in elective surgery patients (N = 135,474) found that noncompliance was higher for males, patients under age 55 years, nonwhites, patients in the lowest socioeconomic quintile, patients living alone, patients needing assistance in completing questionnaires, and patients who previously underwent surgery for their condition.28 In a systematic review of methods that increased the response rates of postal and electronic surveys, Edwards and colleagues29 found significantly higher odds of response for patients who were prenotified of the survey, given shorter questionnaires, or given a deadline for survey completion. Of note, response rates were lower when the word survey was used in the subject line of an email.
PROM distribution has evolved with the rise of technological advances that allow for electronic survey distribution and data capture. Several studies have found that electronically administered PROMs have high response rates.3,30,31 In a study of patients who underwent total hip arthroplasty, Rolfson and colleagues32 found that response rates were significantly higher for those who were surveyed on paper than for those surveyed over the internet. A randomized controlled study found that, compared with paper surveys, digital tablet surveys effectively and reliably collected PROM data; in addition, digital tablets provided instant data storage, and improved survey completion by requiring that all questions be answered before the survey could be submitted.33 However, age, race/ethnicity, and income disparities in technology use must be considered when administering internet-based follow-up surveys and analyzing data collected with web-based methods.34 A study of total joint arthroplasty candidates found that several groups were less likely to complete electronic PROM questionnaires: patients over age 75 years, Hispanic or black patients, patients with Medicare or Medicaid, patients who previously underwent orthopedic surgery, patients undergoing revision total joint arthroplasty, patients with other comorbidities, and patients whose primary language was not English.35 Providers interested in implementing PROMs must consider their patient population when selecting a method for survey distribution and follow-up. A study found that a majority of PROMs were written at a level many patients may not have understood, because of their literacy level or age; this lack of understanding created a barrier to compliance in many patient populations.36
PROM Limitations and PROMIS Use
Use of PROMs has its limitations. The large variety of PROMs available for use in orthopedic surgery has led to several standardization initiatives. The National Institutes of Health funded the development of PROMIS, a person-centered measures database that evaluates and monitors the physical, social, and emotional health of adults and children.37 The goal of PROMIS is to develop a standardized method of selecting PROMs, so that all medical disciplines and subspecialties can choose an applicable set of questions from the PROMIS question bank and use it in practice. Orthopedic surgery can use questions pertaining to physical functioning of the lower and upper extremities as well as quality of life and mental health. PROMIS physical function questions have been validated for use in several areas of orthopedic surgery.38-40 A disadvantage of PROMIS is the overgenerality of its questions, which may not be as effective in capturing the implications of specific diagnoses. For example, it is difficult to use generalized questions to determine the implications of a diagnosis such as shoulder instability, which may affect only higher functioning activities or sports. More research on best PROM selection practices is needed in order to either standardize PROMs or move toward use of a single database such as PROMIS.
Future Directions in PROM Applications
PROMs are being used for research and patient engagement, but there are many other applications on the horizon. As already mentioned, predictive modeling is of particular interest. The existence of vast collaborative PROM databases that capture a diverse patient population introduces the possibility of creating models capable of predicting a patient outcome and enhancing shared decision-making.3 Predicting good or excellent patient outcomes for specific patient populations may allow elimination of certain postoperative visits, thereby creating more cost-effective care and reducing the burden of unnecessary clinic visits for both patients and physicians.
As with other healthcare areas, PROM data collection technology is rapidly advancing. Not only has electronic technology almost entirely replaced paper-and-pencil collection methods, but a new method of outcome data collection has been developed: computerized adaptive testing (CAT). CAT uses item-response theory to minimize the number of questions patients must answer in order for validated and reliable outcome scores to be calculated. According to multiple studies, CAT used across several questionnaires has reliably assessed PROMs while minimizing floor and ceiling effects, eliminating irrelevant questions, and shortening survey completion time.41-43
Besides becoming more patient-friendly and accessible across multiple interfaces (mobile devices and computers), PROMs are also beginning to be integrated into the electronic medical record, allowing easier access to information during chart reviews. Use of statistical and predictive modeling, as described by Chang,3 could give PROMs a role in clinical decision-making. Informing patients of their expected outcome and recovery trajectory—based on demographics, comorbidities, preoperative functional status, and other factors—could influence their decision to undergo surgical intervention. As Halawi and colleagues44 pointed out, it is important to discuss patient expectations before surgery, as unrealistic ones can negatively affect outcomes and lead to dissatisfaction. With clinicians having ready access to statistics and models in patient charts, we may see a transformation in clinical practices and surgical decision-making.
Conclusion
PROMs offer many ways to improve research and clinical care in orthopedic surgery. However, implementing PROMs in practice is not without challenges. Interested orthopedic surgeons should select the PROMs that are most appropriate—reliable, validated, and responsive to their patient population. Electronic distribution of PROM questionnaires is effective and allows data to be stored on entry, but orthopedic surgeons must consider their patient population to ensure accurate data capture and compliance in longitudinal surveys. Proper implementation of PROMs in a practice can allow clinicians to formulate expectations for postoperative recovery and set reasonable postoperative goals while engaging patients in improving quality of care.
1. Howie L, Hirsch B, Locklear T, Abernethy AP. Assessing the value of patient-generated data to comparative effectiveness research. Health Aff (Millwood). 2014;33(7):1220-1228.
2. Haywood KL. Patient-reported outcome I: measuring what matters in musculoskeletal care. Musculoskeletal Care. 2006;4(4):187-203.
3. Chang CH. Patient-reported outcomes measurement and management with innovative methodologies and technologies. Qual Life Res. 2007;16(suppl 1):157-166.
4. Black N. Patient reported outcome measures could help transform healthcare. BMJ. 2013;346:f167.
5. Porter ME. A strategy for health care reform—toward a value-based system. N Engl J Med. 2009;361(2):109-112.
6. Scott J, Huskisson EC. Graphic representation of pain. Pain. 1976;2(2):175-184.
7. de Nies F, Fidler MW. Visual analog scale for the assessment of total hip arthroplasty. J Arthroplasty. 1997;12(4):416-419.
8. Ayers DC, Franklin PD, Ring DC. The role of emotional health in functional outcomes after orthopaedic surgery: extending the biopsychosocial model to orthopaedics: AOA critical issues. J Bone Joint Surg Am. 2013;95(21):e165.
9. Edwards RR, Haythornthwaite JA, Smith MT, Klick B, Katz JN. Catastrophizing and depressive symptoms as prospective predictors of outcomes following total knee replacement. Pain Res Manag. 2009;14(4):307-311.
10. Patel AA, Donegan D, Albert T. The 36-Item Short Form. J Am Acad Orthop Surg. 2007;15(2):126-134.
11. Ware J Jr, Kosinski M, Keller SD. A 12-Item Short-Form Health Survey: construction of scales and preliminary tests of reliability and validity. Med Care. 1996;34(3):220-233.
12. About the VR-36, VR-12 and VR-6D. Boston University School of Public Health website. http://www.bu.edu/sph/research/research-landing-page/vr-36-vr-12-and-vr-6d/. Accessed October 4, 2017.
13. Jansson KA, Granath F. Health-related quality of life (EQ-5D) before and after orthopedic surgery. Acta Orthop. 2011;82(1):82-89.
14. Oak SR, Strnad GJ, Bena J, et al. Responsiveness comparison of the EQ-5D, PROMIS Global Health, and VR-12 questionnaires in knee arthroscopy. Orthop J Sports Med. 2016;4(12):2325967116674714.
15. Lavernia CJ, Iacobelli DA, Brooks L, Villa JM. The cost-utility of total hip arthroplasty: earlier intervention, improved economics. J Arthroplasty. 2015;30(6):945-949.
16. Mather RC 3rd, Watters TS, Orlando LA, Bolognesi MP, Moorman CT 3rd. Cost effectiveness analysis of hemiarthroplasty and total shoulder arthroplasty. J Shoulder Elbow Surg. 2010;19(3):325-334.
17. Brauer CA, Rosen AB, Olchanski NV, Neumann PJ. Cost-utility analyses in orthopaedic surgery. J Bone Joint Surg Am. 2005;87(6):1253-1259.
18. Schmidt S, Ferrer M, González M, et al; EMPRO Group. Evaluation of shoulder-specific patient-reported outcome measures: a systematic and standardized comparison of available evidence. J Shoulder Elbow Surg. 2014;23(3):434-444.
19. Godfrey J, Hamman R, Lowenstein S, Briggs K, Kocher M. Reliability, validity, and responsiveness of the Simple Shoulder Test: psychometric properties by age and injury type. J Shoulder Elbow Surg. 2007;16(3):260-267.
20. Kirkley A, Griffin S, McLintock H, Ng L. The development and evaluation of a disease-specific quality of life measurement tool for shoulder instability. The Western Ontario Shoulder Instability Index (WOSI). Am J Sports Med. 1998;26(6):764-772.
21. Briggs KK, Lysholm J, Tegner Y, Rodkey WG, Kocher MS, Steadman JR. The reliability, validity, and responsiveness of the Lysholm score and Tegner Activity Scale for anterior cruciate ligament injuries of the knee: 25 years later. Am J Sports Med. 2009;37(5):890-897.
22. Davidson M, Keating J. Patient-reported outcome measures (PROMs): how should I interpret reports of measurement properties? A practical guide for clinicians and researchers who are not biostatisticians. Br J Sports Med. 2014;48(9):792-796.
23. Bent NP, Wright CC, Rushton AB, Batt ME. Selecting outcome measures in sports medicine: a guide for practitioners using the example of anterior cruciate ligament rehabilitation. Br J Sports Med. 2009;43(13):1006-1012.
24. Rolfson O, Eresian Chenok K, Bohm E, et al; Patient-Reported Outcome Measures Working Group of the International Society of Arthroplasty Registries. Patient-reported outcome measures in arthroplasty registries. Acta Orthop. 2016;87(suppl 1):3-8.
25. Franklin PD, Lewallen D, Bozic K, Hallstrom B, Jiranek W, Ayers DC. Implementation of patient-reported outcome measures in U.S. total joint replacement registries: rationale, status, and plans. J Bone Joint Surg Am. 2014;96(suppl 1):104-109.
26. Lyman S, Lee YY, Franklin PD, Li W, Cross MB, Padgett DE. Validation of the KOOS, JR: a short-form knee arthroplasty outcomes survey. Clin Orthop Relat Res. 2016;474(6):1461-1471.
27. Lyman S, Lee YY, Franklin PD, Li W, Mayman DJ, Padgett DE. Validation of the HOOS, JR: a short-form hip replacement survey. Clin Orthop Relat Res. 2016;474(6):1472-1482.
28. Hutchings A, Neuburger J, Grosse Frie K, Black N, van der Meulen J. Factors associated with non-response in routine use of patient reported outcome measures after elective surgery in England. Health Qual Life Outcomes. 2012;10:34.
29. Edwards PJ, Roberts I, Clarke MJ, et al. Methods to increase response to postal and electronic questionnaires. Cochrane Database Syst Rev. 2009;(3):MR000008.
30. Gakhar H, McConnell B, Apostolopoulos AP, Lewis P. A pilot study investigating the use of at-home, web-based questionnaires compiling patient-reported outcome measures following total hip and knee replacement surgeries. J Long Term Eff Med Implants. 2013;23(1):39-43.
31. Bojcic JL, Sue VM, Huon TS, Maletis GB, Inacio MC. Comparison of paper and electronic surveys for measuring patient-reported outcomes after anterior cruciate ligament reconstruction. Perm J. 2014;18(3):22-26.
32. Rolfson O, Salomonsson R, Dahlberg LE, Garellick G. Internet-based follow-up questionnaire for measuring patient-reported outcome after total hip replacement surgery—reliability and response rate. Value Health. 2011;14(2):316-321.
33. Shah KN, Hofmann MR, Schwarzkopf R, et al. Patient-reported outcome measures: how do digital tablets stack up to paper forms? A randomized, controlled study. Am J Orthop. 2016;45(7):E451-E457.
34. Kaiser Family Foundation. The Digital Divide and Access to Health Information Online. http://kff.org/disparities-policy/poll-finding/the-digital-divide-and-access-to-health/. Published April 1, 2011. Accessed October 4, 2017.
35. Schamber EM, Takemoto SK, Chenok KE, Bozic KJ. Barriers to completion of patient reported outcome measures. J Arthroplasty. 2013;28(9):1449-1453.
36. El-Daly I, Ibraheim H, Rajakulendran K, Culpan P, Bates P. Are patient-reported outcome measures in orthopaedics easily read by patients? Clin Orthop Relat Res. 2016;474(1):246-255.
37. Intro to PROMIS. 2016. Health Measures website. http://www.healthmeasures.net/explore-measurement-systems/promis/intro-to-promis. Accessed October 4, 2017.
38. Hung M, Baumhauer JF, Latt LD, Saltzman CL, SooHoo NF, Hunt KJ; National Orthopaedic Foot & Ankle Outcomes Research Network. Validation of PROMIS ® Physical Function computerized adaptive tests for orthopaedic foot and ankle outcome research. Clin Orthop Relat Res. 2013;471(11):3466-3474.
39. Hung M, Clegg DO, Greene T, Saltzman CL. Evaluation of the PROMIS Physical Function item bank in orthopaedic patients. J Orthop Res. 2011;29(6):947-953.
40. Tyser AR, Beckmann J, Franklin JD, et al. Evaluation of the PROMIS Physical Function computer adaptive test in the upper extremity. J Hand Surg Am. 2014;39(10):2047-2051.e4.
41. Hung M, Stuart AR, Higgins TF, Saltzman CL, Kubiak EN. Computerized adaptive testing using the PROMIS Physical Function item bank reduces test burden with less ceiling effects compared with the Short Musculoskeletal Function Assessment in orthopaedic trauma patients. J Orthop Trauma. 2014;28(8):439-443.
42. Hung M, Clegg DO, Greene T, Weir C, Saltzman CL. A lower extremity physical function computerized adaptive testing instrument for orthopaedic patients. Foot Ankle Int. 2012;33(4):326-335.
43. Döring AC, Nota SP, Hageman MG, Ring DC. Measurement of upper extremity disability using the Patient-Reported Outcomes Measurement Information System. J Hand Surg Am. 2014;39(6):1160-1165.
44. Halawi MJ, Greene K, Barsoum WK. Optimizing outcomes of total joint arthroplasty under the comprehensive care for joint replacement model. Am J Orthop. 2016;45(3):E112-E113.
Take-Home Points
- Systematic use of PROMs allows physicians to review data on pain, physical function, and psychological status to aid in clinical decision-making and best practices.
- PROMs should include both general outcome measures (VAS, SF-36, or EQ-5D) and reliable, valid, and responsive disease specific measures.
- PROM questionnaires should collect pertinent information while limiting the length to maximize patient compliance and reliability.
- PROMIS has been developed to standardize questionnaires, but generality for specific orthopedic procedures may result in less effective measures.
- PROMs can also be used for predictive modeling, which has the potential to help develop more cost-effective care and predict expected outcomes and recovery trajectories for individual patients.
Owing to their unique ability to recognize patients as stakeholders in their own healthcare, patient-reported outcome measures (PROMs) are becoming increasingly popular in the assessment of medical and surgical outcomes.1 PROMs are an outcome measures subset in which patients complete questionnaires about their perceptions of their overall health status and specific health limitations. By systematically using PROMs before and after a clearly defined episode of care, clinicians can collect data on perceived pain level, physical function, and psychological status and use the data to validate use of surgical procedures and shape clinical decisions about best practices.2-4 Although mortality and morbidity rates and other traditional measures are valuable in assessing outcomes, they do not represent or communicate the larger impact of an episode of care. As many orthopedic procedures are elective, and some are low-risk, the evaluation of changes in quality of life and self-reported functional improvement is an important addition to morbidity and mortality rates in capturing the true impact of a surgical procedure and recovery. The patient’s preoperative and postoperative perspectives on his or her health status have become important as well; our healthcare system has been placing more emphasis on patient-centered quality care.2,5
Although PROMs have many benefits, implementation in an orthopedic surgery practice has its challenges. With so many PROMs available, selecting those that fit the patient population for a specialized orthopedic surgery practice can be difficult. In addition, although PROM data are essential for research and for measuring individual or institutional recovery trajectories for surgical procedures, in a busy practice getting patients to provide these data can be difficult.
PROMs are heavily used for outcomes assessment in the orthopedics literature, but there are few resources for orthopedic surgeons who want to implement PROMs in their practices. In this article, we review the literature on the challenges of effectively implementing PROMs in an orthopedic surgery practice.
PROM Selection Considerations
PROMs can be categorized as either generic or disease-specific,4 but together they are used to adequately capture the impact, both broad and local, of an orthopedic condition.
Generic Outcome Measures
Generic outcome measures apply to a range of subspecialties or anatomical regions, allowing for evaluation of a patient’s overall health or quality of life. The most widely accepted measure of pain is the visual analog scale (VAS). The VAS for pain quantifies the level of pain a patient experiences at a given time on a graphic sliding scale from 0 (no pain) to 10 (worst possible pain). The VAS is used in clinical evaluation of pain and in reported outcomes literature.6,7
Many generic PROMs assess mental health status in addition to physical limitations. Poor preoperative mental health status has been recognized as a predictor of worse outcomes across a variety of orthopedic procedures.8,9 Therefore, to assess the overall influence of an orthopedic condition, it is important to include at least 1 generic PROM that assesses mental health status before and after an episode of care. Generic PROMs commonly used in orthopedic surgery include the 36-Item Short Form Health Survey (SF-36), the shorter SF-12, the Veterans RAND 12-Item Health Survey (VR-12), the World Health Organization Disability Assessment Schedule (WHODAS), the European Quality of Life-5 Dimensions (EQ-5D) index, and the 10-item Patient-Reported Outcomes Measurement Information System Global Health (PROMIS-10) scale.10-14
Some generic outcome measures (eg, the EQ-5D index) offer the “utility” calculation, which represents a preference for a patient’s desired health status. Such utilities allow for a measurement of quality of life, represented by quality-adjusted life years (QALY), which is a standardized measure of disease burden. Calculated QALY from measures such as the EQ-5D can be used in cost-effectiveness analyses of surgical interventions and have been used to validate use of procedures, particularly in arthroplasty.15-17
Disease-Specific Outcome Measures
Likewise, there is a range of disease-specific PROMs validated for use in orthopedic surgery, and providers select PROMs that fit their scope of practice. In anatomical regions such as the knee, hip, and shoulder, disease-specific outcome measures vary significantly by subspecialty and patient population. When selecting disease-specific PROMs, providers must consider tools such as reliability, validity, responsiveness, and available population norms. One study used Evaluating Measures of Patient-Reported Outcomes (EMPRO) to assess the quality of a PROM in shoulders and concluded that the American Shoulder and Elbow Surgeons (ASES) index, the Simple Shoulder Test (SST), and the Oxford Shoulder Score (OSS) were all supported for use in practice.18 It is important to note that reliability, validity, and responsiveness of a PROM may vary with the diagnosis or the patient population studied. For example, the SST was found to be responsive in assessing rotator cuff injury but not as useful in assessing shoulder instability or arthritis.19 Variable responsiveness highlights the need for a diagnosis-based level of PROM customization. For example, patients who undergo a surgical intervention for shoulder instability are given a customized survey, which includes PROMs specific to their condition, such as the Western Ontario Shoulder Instability (WOSI) index.20 For patients with knee instability, similar considerations apply; specific measures such as the Lysholm score and the Tenger Activity Scale capture the impact of injury in physically demanding activities.21 When selecting disease-specific PROMs, providers should consult articles like those by Davidson and Keating22 and Bent and colleagues,23 who present provider-friendly tools that can be used to examine the effectiveness of a PROM, and provide additional background information on selecting disease-specific PROMs. For hip and knee arthroplasty subspecialties, the International Society of Arthroplasty Registries (ISAR) created a working group that determines best practices for PROM collection and identifies PROMs most commonly reported in arthroplasty.24
Questionnaire Length Considerations
When PROMs are used in a practice, a balance must be struck between gathering enough information to determine functionality and limiting the patient burden of questionnaire length. A decision to use several PROMs all at once, at a single data collection point, can lengthen the questionnaire significantly. One study found that, with use of longer questionnaires, patients may lose interest, resulting in decreased reliability and compliance.25 For example, providers who use the long (42-item) Knee Injury and Osteoarthritis Outcome Score (KOOS) questionnaire to assess knee function are often limited in what other PROMs they may administer at the same time. Efforts to shorten this questionnaire while still capturing necessary information led to the development of the 7-item KOOS Jr, which was validated for use in knee arthroplasty and had its 7 items drawn from the original 42.26 Similarly, the 40-item Hip Disability and Osteoarthritis Outcome Score (HOOS) questionnaire was shortened to the 6-item HOOS Jr, which was validated for use in hip arthroplasty,27 and the generic SF-36 was shortened to the SF-12.11 Providers trying to build an outcomes database while minimizing patient burden should consider using the shorter versions of these questionnaires but should also consider their validity, as KOOS Jr and HOOS Jr have been validated for use only in knee and hip arthroplasty and not in other knee and hip conditions.
PROM Data Collection Considerations
Comprehensive collection of longitudinal PROM data poses many challenges for providers and patients. For providers, the greatest challenges are infrastructure, technology, and the personnel needed to administer and store paper or electronic surveys. For patients, the most common survey completion barriers are questionnaire length, confusing or irrelevant content, and, in the case of some older adults, inability to complete surveys electronically.25
Identifying a nonresponsive or noncompliant patient population is an important issue in collecting PROM data for research or other purposes. A study of factors associated with higher nonresponse rates in elective surgery patients (N = 135,474) found that noncompliance was higher for males, patients under age 55 years, nonwhites, patients in the lowest socioeconomic quintile, patients living alone, patients needing assistance in completing questionnaires, and patients who previously underwent surgery for their condition.28 In a systematic review of methods that increased the response rates of postal and electronic surveys, Edwards and colleagues29 found significantly higher odds of response for patients who were prenotified of the survey, given shorter questionnaires, or given a deadline for survey completion. Of note, response rates were lower when the word survey was used in the subject line of an email.
PROM distribution has evolved with the rise of technological advances that allow for electronic survey distribution and data capture. Several studies have found that electronically administered PROMs have high response rates.3,30,31 In a study of patients who underwent total hip arthroplasty, Rolfson and colleagues32 found that response rates were significantly higher for those who were surveyed on paper than for those surveyed over the internet. A randomized controlled study found that, compared with paper surveys, digital tablet surveys effectively and reliably collected PROM data; in addition, digital tablets provided instant data storage, and improved survey completion by requiring that all questions be answered before the survey could be submitted.33 However, age, race/ethnicity, and income disparities in technology use must be considered when administering internet-based follow-up surveys and analyzing data collected with web-based methods.34 A study of total joint arthroplasty candidates found that several groups were less likely to complete electronic PROM questionnaires: patients over age 75 years, Hispanic or black patients, patients with Medicare or Medicaid, patients who previously underwent orthopedic surgery, patients undergoing revision total joint arthroplasty, patients with other comorbidities, and patients whose primary language was not English.35 Providers interested in implementing PROMs must consider their patient population when selecting a method for survey distribution and follow-up. A study found that a majority of PROMs were written at a level many patients may not have understood, because of their literacy level or age; this lack of understanding created a barrier to compliance in many patient populations.36
PROM Limitations and PROMIS Use
Use of PROMs has its limitations. The large variety of PROMs available for use in orthopedic surgery has led to several standardization initiatives. The National Institutes of Health funded the development of PROMIS, a person-centered measures database that evaluates and monitors the physical, social, and emotional health of adults and children.37 The goal of PROMIS is to develop a standardized method of selecting PROMs, so that all medical disciplines and subspecialties can choose an applicable set of questions from the PROMIS question bank and use it in practice. Orthopedic surgery can use questions pertaining to physical functioning of the lower and upper extremities as well as quality of life and mental health. PROMIS physical function questions have been validated for use in several areas of orthopedic surgery.38-40 A disadvantage of PROMIS is the overgenerality of its questions, which may not be as effective in capturing the implications of specific diagnoses. For example, it is difficult to use generalized questions to determine the implications of a diagnosis such as shoulder instability, which may affect only higher functioning activities or sports. More research on best PROM selection practices is needed in order to either standardize PROMs or move toward use of a single database such as PROMIS.
Future Directions in PROM Applications
PROMs are being used for research and patient engagement, but there are many other applications on the horizon. As already mentioned, predictive modeling is of particular interest. The existence of vast collaborative PROM databases that capture a diverse patient population introduces the possibility of creating models capable of predicting a patient outcome and enhancing shared decision-making.3 Predicting good or excellent patient outcomes for specific patient populations may allow elimination of certain postoperative visits, thereby creating more cost-effective care and reducing the burden of unnecessary clinic visits for both patients and physicians.
As with other healthcare areas, PROM data collection technology is rapidly advancing. Not only has electronic technology almost entirely replaced paper-and-pencil collection methods, but a new method of outcome data collection has been developed: computerized adaptive testing (CAT). CAT uses item-response theory to minimize the number of questions patients must answer in order for validated and reliable outcome scores to be calculated. According to multiple studies, CAT used across several questionnaires has reliably assessed PROMs while minimizing floor and ceiling effects, eliminating irrelevant questions, and shortening survey completion time.41-43
Besides becoming more patient-friendly and accessible across multiple interfaces (mobile devices and computers), PROMs are also beginning to be integrated into the electronic medical record, allowing easier access to information during chart reviews. Use of statistical and predictive modeling, as described by Chang,3 could give PROMs a role in clinical decision-making. Informing patients of their expected outcome and recovery trajectory—based on demographics, comorbidities, preoperative functional status, and other factors—could influence their decision to undergo surgical intervention. As Halawi and colleagues44 pointed out, it is important to discuss patient expectations before surgery, as unrealistic ones can negatively affect outcomes and lead to dissatisfaction. With clinicians having ready access to statistics and models in patient charts, we may see a transformation in clinical practices and surgical decision-making.
Conclusion
PROMs offer many ways to improve research and clinical care in orthopedic surgery. However, implementing PROMs in practice is not without challenges. Interested orthopedic surgeons should select the PROMs that are most appropriate—reliable, validated, and responsive to their patient population. Electronic distribution of PROM questionnaires is effective and allows data to be stored on entry, but orthopedic surgeons must consider their patient population to ensure accurate data capture and compliance in longitudinal surveys. Proper implementation of PROMs in a practice can allow clinicians to formulate expectations for postoperative recovery and set reasonable postoperative goals while engaging patients in improving quality of care.
1. Howie L, Hirsch B, Locklear T, Abernethy AP. Assessing the value of patient-generated data to comparative effectiveness research. Health Aff (Millwood). 2014;33(7):1220-1228.
2. Haywood KL. Patient-reported outcome I: measuring what matters in musculoskeletal care. Musculoskeletal Care. 2006;4(4):187-203.
3. Chang CH. Patient-reported outcomes measurement and management with innovative methodologies and technologies. Qual Life Res. 2007;16(suppl 1):157-166.
4. Black N. Patient reported outcome measures could help transform healthcare. BMJ. 2013;346:f167.
5. Porter ME. A strategy for health care reform—toward a value-based system. N Engl J Med. 2009;361(2):109-112.
6. Scott J, Huskisson EC. Graphic representation of pain. Pain. 1976;2(2):175-184.
7. de Nies F, Fidler MW. Visual analog scale for the assessment of total hip arthroplasty. J Arthroplasty. 1997;12(4):416-419.
8. Ayers DC, Franklin PD, Ring DC. The role of emotional health in functional outcomes after orthopaedic surgery: extending the biopsychosocial model to orthopaedics: AOA critical issues. J Bone Joint Surg Am. 2013;95(21):e165.
9. Edwards RR, Haythornthwaite JA, Smith MT, Klick B, Katz JN. Catastrophizing and depressive symptoms as prospective predictors of outcomes following total knee replacement. Pain Res Manag. 2009;14(4):307-311.
10. Patel AA, Donegan D, Albert T. The 36-Item Short Form. J Am Acad Orthop Surg. 2007;15(2):126-134.
11. Ware J Jr, Kosinski M, Keller SD. A 12-Item Short-Form Health Survey: construction of scales and preliminary tests of reliability and validity. Med Care. 1996;34(3):220-233.
12. About the VR-36, VR-12 and VR-6D. Boston University School of Public Health website. http://www.bu.edu/sph/research/research-landing-page/vr-36-vr-12-and-vr-6d/. Accessed October 4, 2017.
13. Jansson KA, Granath F. Health-related quality of life (EQ-5D) before and after orthopedic surgery. Acta Orthop. 2011;82(1):82-89.
14. Oak SR, Strnad GJ, Bena J, et al. Responsiveness comparison of the EQ-5D, PROMIS Global Health, and VR-12 questionnaires in knee arthroscopy. Orthop J Sports Med. 2016;4(12):2325967116674714.
15. Lavernia CJ, Iacobelli DA, Brooks L, Villa JM. The cost-utility of total hip arthroplasty: earlier intervention, improved economics. J Arthroplasty. 2015;30(6):945-949.
16. Mather RC 3rd, Watters TS, Orlando LA, Bolognesi MP, Moorman CT 3rd. Cost effectiveness analysis of hemiarthroplasty and total shoulder arthroplasty. J Shoulder Elbow Surg. 2010;19(3):325-334.
17. Brauer CA, Rosen AB, Olchanski NV, Neumann PJ. Cost-utility analyses in orthopaedic surgery. J Bone Joint Surg Am. 2005;87(6):1253-1259.
18. Schmidt S, Ferrer M, González M, et al; EMPRO Group. Evaluation of shoulder-specific patient-reported outcome measures: a systematic and standardized comparison of available evidence. J Shoulder Elbow Surg. 2014;23(3):434-444.
19. Godfrey J, Hamman R, Lowenstein S, Briggs K, Kocher M. Reliability, validity, and responsiveness of the Simple Shoulder Test: psychometric properties by age and injury type. J Shoulder Elbow Surg. 2007;16(3):260-267.
20. Kirkley A, Griffin S, McLintock H, Ng L. The development and evaluation of a disease-specific quality of life measurement tool for shoulder instability. The Western Ontario Shoulder Instability Index (WOSI). Am J Sports Med. 1998;26(6):764-772.
21. Briggs KK, Lysholm J, Tegner Y, Rodkey WG, Kocher MS, Steadman JR. The reliability, validity, and responsiveness of the Lysholm score and Tegner Activity Scale for anterior cruciate ligament injuries of the knee: 25 years later. Am J Sports Med. 2009;37(5):890-897.
22. Davidson M, Keating J. Patient-reported outcome measures (PROMs): how should I interpret reports of measurement properties? A practical guide for clinicians and researchers who are not biostatisticians. Br J Sports Med. 2014;48(9):792-796.
23. Bent NP, Wright CC, Rushton AB, Batt ME. Selecting outcome measures in sports medicine: a guide for practitioners using the example of anterior cruciate ligament rehabilitation. Br J Sports Med. 2009;43(13):1006-1012.
24. Rolfson O, Eresian Chenok K, Bohm E, et al; Patient-Reported Outcome Measures Working Group of the International Society of Arthroplasty Registries. Patient-reported outcome measures in arthroplasty registries. Acta Orthop. 2016;87(suppl 1):3-8.
25. Franklin PD, Lewallen D, Bozic K, Hallstrom B, Jiranek W, Ayers DC. Implementation of patient-reported outcome measures in U.S. total joint replacement registries: rationale, status, and plans. J Bone Joint Surg Am. 2014;96(suppl 1):104-109.
26. Lyman S, Lee YY, Franklin PD, Li W, Cross MB, Padgett DE. Validation of the KOOS, JR: a short-form knee arthroplasty outcomes survey. Clin Orthop Relat Res. 2016;474(6):1461-1471.
27. Lyman S, Lee YY, Franklin PD, Li W, Mayman DJ, Padgett DE. Validation of the HOOS, JR: a short-form hip replacement survey. Clin Orthop Relat Res. 2016;474(6):1472-1482.
28. Hutchings A, Neuburger J, Grosse Frie K, Black N, van der Meulen J. Factors associated with non-response in routine use of patient reported outcome measures after elective surgery in England. Health Qual Life Outcomes. 2012;10:34.
29. Edwards PJ, Roberts I, Clarke MJ, et al. Methods to increase response to postal and electronic questionnaires. Cochrane Database Syst Rev. 2009;(3):MR000008.
30. Gakhar H, McConnell B, Apostolopoulos AP, Lewis P. A pilot study investigating the use of at-home, web-based questionnaires compiling patient-reported outcome measures following total hip and knee replacement surgeries. J Long Term Eff Med Implants. 2013;23(1):39-43.
31. Bojcic JL, Sue VM, Huon TS, Maletis GB, Inacio MC. Comparison of paper and electronic surveys for measuring patient-reported outcomes after anterior cruciate ligament reconstruction. Perm J. 2014;18(3):22-26.
32. Rolfson O, Salomonsson R, Dahlberg LE, Garellick G. Internet-based follow-up questionnaire for measuring patient-reported outcome after total hip replacement surgery—reliability and response rate. Value Health. 2011;14(2):316-321.
33. Shah KN, Hofmann MR, Schwarzkopf R, et al. Patient-reported outcome measures: how do digital tablets stack up to paper forms? A randomized, controlled study. Am J Orthop. 2016;45(7):E451-E457.
34. Kaiser Family Foundation. The Digital Divide and Access to Health Information Online. http://kff.org/disparities-policy/poll-finding/the-digital-divide-and-access-to-health/. Published April 1, 2011. Accessed October 4, 2017.
35. Schamber EM, Takemoto SK, Chenok KE, Bozic KJ. Barriers to completion of patient reported outcome measures. J Arthroplasty. 2013;28(9):1449-1453.
36. El-Daly I, Ibraheim H, Rajakulendran K, Culpan P, Bates P. Are patient-reported outcome measures in orthopaedics easily read by patients? Clin Orthop Relat Res. 2016;474(1):246-255.
37. Intro to PROMIS. 2016. Health Measures website. http://www.healthmeasures.net/explore-measurement-systems/promis/intro-to-promis. Accessed October 4, 2017.
38. Hung M, Baumhauer JF, Latt LD, Saltzman CL, SooHoo NF, Hunt KJ; National Orthopaedic Foot & Ankle Outcomes Research Network. Validation of PROMIS ® Physical Function computerized adaptive tests for orthopaedic foot and ankle outcome research. Clin Orthop Relat Res. 2013;471(11):3466-3474.
39. Hung M, Clegg DO, Greene T, Saltzman CL. Evaluation of the PROMIS Physical Function item bank in orthopaedic patients. J Orthop Res. 2011;29(6):947-953.
40. Tyser AR, Beckmann J, Franklin JD, et al. Evaluation of the PROMIS Physical Function computer adaptive test in the upper extremity. J Hand Surg Am. 2014;39(10):2047-2051.e4.
41. Hung M, Stuart AR, Higgins TF, Saltzman CL, Kubiak EN. Computerized adaptive testing using the PROMIS Physical Function item bank reduces test burden with less ceiling effects compared with the Short Musculoskeletal Function Assessment in orthopaedic trauma patients. J Orthop Trauma. 2014;28(8):439-443.
42. Hung M, Clegg DO, Greene T, Weir C, Saltzman CL. A lower extremity physical function computerized adaptive testing instrument for orthopaedic patients. Foot Ankle Int. 2012;33(4):326-335.
43. Döring AC, Nota SP, Hageman MG, Ring DC. Measurement of upper extremity disability using the Patient-Reported Outcomes Measurement Information System. J Hand Surg Am. 2014;39(6):1160-1165.
44. Halawi MJ, Greene K, Barsoum WK. Optimizing outcomes of total joint arthroplasty under the comprehensive care for joint replacement model. Am J Orthop. 2016;45(3):E112-E113.
Genital herpes: Diagnostic and management considerations in pregnant women
Genital herpes is a common infection caused by herpes simplex virus type 1 (HSV-1) or herpes simplex virus type 2 (HSV-2). Although life-threatening health consequences of HSV infection after infancy are uncommon, women with genital herpes remain at risk for recurrent symptoms, which can be associated with significant physical and psychosocial distress. These patients also can transmit the disease to their partners and neonates, and have a 2- to 3-fold increased risk of HIV acquisition. In this article, we review the diagnosis and management of genital herpes in pregnant women.
CASE Asymptomatic pregnant patient tests positive for herpes
Sarah is a healthy 32-year-old (G1P0) presenting at 8 weeks’ gestation for her first prenatal visit. She requests HSV testing as she learned that genital herpes is common and it can be transmitted to the baby. You order the HSV-2 IgG assay from your laboratory, which performs the HerpeSelect HSV-2 enzyme immunoassay as the standard test. The test result is positive, with an index value of 2.2 (the manufacturer defines an index value >1.1 as positive). Repeat testing in 4 weeks returns positive results again, with an index value of 2.8.
The patient is distressed at this news. She has no history of genital lesions or symptoms consistent with genital herpes and is worried that her husband has been unfaithful. How would you manage this case?
How prevalent is HSV?
Genital herpes is a chronic viral infection transmitted through close contact with a person who is shedding the virus from genital or oral mucosa. In the United States, the National Health and Nutrition Examination Survey indicated an HSV-2 seroprevalence of 16% among persons aged 14 to 49 in 2005–2010, a decline from 21% in 1988–1991.1 The prevalence among women is twice as high as among men, at 20% versus 11%, respectively. Among those with HSV-2, 87% are not aware that they are infected; they are at risk of infecting their partners, however.1
In the same age group, the prevalence of HSV-1 is 54%.2 The seroprevalence of HSV-1 in adolescents declined from 39% in 1999–2004 to 30% in 2005–2010, resulting in a high number of young people who are seronegative at the time of sexual debut. Concurrently, genital HSV-1 has emerged as a frequent cause of first-episode genital herpes, often associated with oral-genital contact during sexual debut.2,3
When evaluating patients for possible genital herpes provide general educational messages regarding HSV infection and obtain a detailed medical and sexual history to determine the best diagnostic approach.
What are the clinical features of genital HSV infection?
The clinical manifestations of genital herpes vary according to whether the infection is primary, nonprimary first episode, or recurrent.
Primary infection. During primary infection,which occurs 4 to 12 days after sexual exposure and in the absence of pre-existing antibodies to HSV-1 or HSV-2, patients may experience genital and systemic symptoms (FIGURE and TABLE 1). Since this infection usually occurs in otherwise healthy people, for many, this is the most severe disease that they have experienced. However, most patients with primary infection develop mild, atypical, or completely asymptomatic presentation and are not diagnosed at the time of HSV acquisition. Whether primary infection is caused by HSV-1 or HSV-2 cannot be differentiated based on the clinical presentation alone.
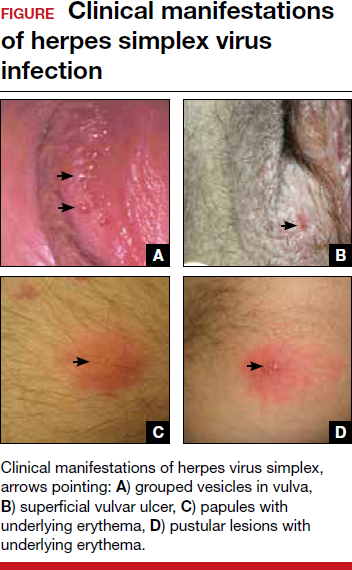
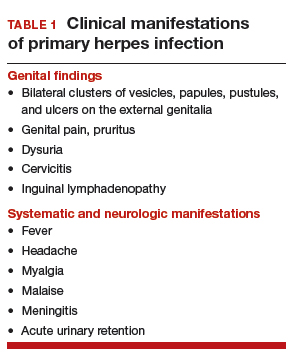
Nonprimary first episode infection. In a nonprimary infection, newly acquired infection with HSV-1 or HSV-2 occurs in a person with pre-existing antibodies to the other virus. Almost always, this means new HSV-2 infection in a HSV-1 seropositive person, as prior HSV-2 infection appears to protect against HSV-1 acquisition. In general, the clinical presentation of nonprimary infection is somewhat milder and the rate of complications is lower, but clinically the overlap is great, and antibody tests are needed to define whether the patient has primary or nonprimary infection.4
Recurrent genital herpes infection occurs in most patients with genital herpes. The rate of recurrence is low in patients with genital HSV-1 and often high in patients with genital HSV-2 infection. The median number of recurrences is 1 in the first year of genital HSV-1 infection, and many patients will not have any recurrences following the first year. By contrast, in patients with genital HSV-2 infection, the median number of recurrences is 4, and a high rate of recurrences can continue for many years. Prodromal symptoms (localized irritation, paresthesias, and pruritus) can precede recurrences, which usually present with fewer lesions and last a shorter time than primary infection. Recurrent genital lesions tend to heal in approximately 5 to 10 days in the absence of antiviral treatment, and systemic symptoms are uncommon.5
Asymptomatic viral shedding. After resolution of a primary HSV infection, people shed the virus in the genital tract despite symptom absence. Asymptomatic shedding tends to be more frequent and prolonged with primary genital HSV-2 infection compared with HSV-1 infection.6,7 The frequency of HSV shedding is highest in the first year of infection, and decreases subsequently.8 However, it is likely to persist intermittently for many years. Because the natural history is so strikingly different in genital HSV-1 versus HSV-2, identification of the viral type is important for prognostic information.
The first HSV episode does not necessarily indicate a new or recent infection—in about 25% of persons it represents the first recognized genital herpes episode. Additional serologic and virologic evaluation can be pursued to determine if the first episode represents a new infection.
Read about the diagnostic tests for genital HSV.
What diagnostic tests are available for genital herpes?
Most HSV infections are clinically silent. Therefore, laboratory tests are required to diagnose the infection. Even if symptoms are present, diagnoses based only on clinical presentation have a 20% false-positive rate. Always confirm diagnosis by laboratory assay.9 Furthermore, couples that are discordant for HSV-2 by history are often concordant by serologic assays, as the transmission already has occurred but was not recognized. In these cases, the direction of transmission cannot be determined, and stable couples often experience relief learning that they are not discordant.
Related article:
Effective treatment of recurrent bacterial vaginosis
Several laboratory tools for HSV diagnosis based on direct viral detection and antibody detection can be used in clinical settings (TABLE 2). Among patients with symptomatic genital herpes, a sample from the lesion can be used to confirm and identify viral type. Because polymerase chain reaction (PCR) is substantially more sensitive than viral culture and increasingly available it has emerged as the preferred test.9 Viral culture is highly specific (>99%), but sensitivity varies according to collection technique and stage of the lesions. (The test is less sensitive when lesions are healing.)9,10 Antigen detection by immunofluorescence (direct fluorescent antibody) detects HSV from active lesions with high specificity, but sensitivity is low. Cytologic identification of infected cells (using Tzanck or Pap test) has limited utility for diagnosis due to low sensitivity and specificity.9
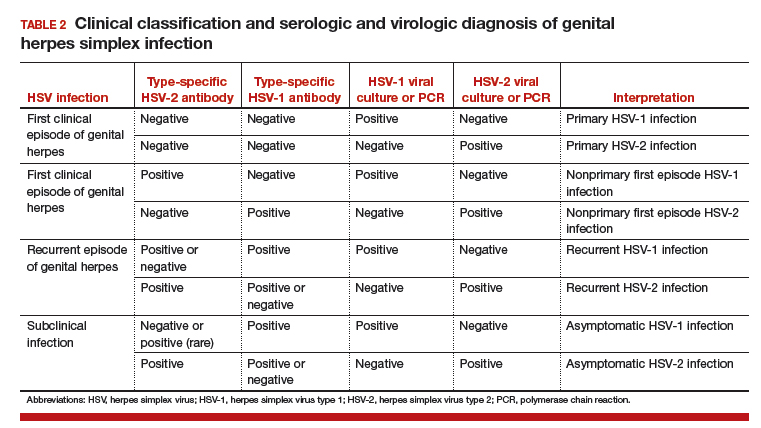
Type-specific antibodies to HSV develop during the first several weeks after acquisition and persist indefinitely.11 Most accurate type-specific serologic tests are based on detection of glycoprotein G1 and glycoprotein G2 for HSV-1 and HSV-2, respectively.
HerpeSelect HSV-2 enzyme immunoassay (EIA) is one of the most commonly used tests in the United States. The manufacturer considers results with index values 1.1 or greater as showing HSV-2 infection. Unfortunately, low positive results, often with a defined index value of 1.1 to 3.5, are frequently false positive. These low positive values should be confirmed with another test, such as Western blot.9
Western blot has been considered the gold standard assay for HSV-1 and HSV-2 antibody detection; this test is available at the University of Washington in Seattle. When comparing the HSV-1 EIA and HSV-2 EIA with the Western blot assay in clinical practice, the estimated sensitivity and specificity are 70.2% and 91.6%, respectively, for HSV-1 and 91.9% and 57.4%, respectively, for HSV-2.12
HerpeSelect HSV-2 Immunoblot testing should not be considered as confirmatory because this assay detects the same antigen as the HSV-2 EIA. Serologic tests based on detection of HSV-IgM should not be used for diagnosis of genital herpes as IgM response can present during a new infection or HSV reactivation and because IgM responses are not type-specific. Clearly, more accurate commercial type-specific antibody tests are needed.
Specific HSV antibodies can take up to 12 weeks to develop. Therefore, repeat serologic testing for patients in whom initial HSV antibody results are negative yet recent genital herpes acquisition is suspected.11 A confirmed positive HSV-2 antibody test indicates anogenital infection, even in a person who lacks genital symptoms. This finding became evident through a study of 53 HSV-2 seropositive patients who lacked a history of genital herpes. Patients were followed for 3 months, and all but 1 developed either virologic or clinical (or both) evidence of genital herpes.13
In the absence of genital or orolabial symptoms among individuals with positive HSV-1, serologic testing cannot distinguish anogenital from orolabial infection. Most of these infections may represent oral HSV-1 infection; however, given increasing occurrence of genital HSV-1 infection, this could also represent a genital infection.
What are the clinical uses of type-specific HSV serology?
Type-specific serologic tests are helpful in diagnosing patients with atypical or asymptomatic infection and managing the care of persons whose sex partners have genital herpes. Serologic testing can be useful to confirm a clinical diagnosis of HSV, to determine whether atypical lesions or symptoms are attributable to HSV, and as part of evaluation for sexually transmitted diseases in select patients. Screening for HSV-1 and HSV-2 in the general population is not supported by the Centers for Disease Control and Prevention (CDC) or the US Preventive Services Task Force (USPSTF) for several reasons9,10:
- suboptimal performance of commercial HSV antibody tests
- low positive predictive value of these tests in low prevalence HSV settings
- lack of widely available confirmatory testing
- lack of cost-effectiveness
- potential for psychological harm.
Read about treating HSV infection during pregnancy.
Case Continued…
Because Sarah did not have a history of genital herpes, a serum sample was tested by the University of Washington Western blot. The results indicated that Sarah is seronegative for HSV-1 and HSV-2.
Sarah, who is now at 16 weeks’ gestation, returns for evaluation of new genital pain. On examination, she has several shallow ulcerations on the labia and bilateral tender inguinal adenopathy. Her husband recently had cold sores. She is anxious and would like to know if she has genital herpes and if her baby is at risk for HSV infection. You swab the base of a lesion for HSV PCR testing and start antiviral treatment.
Treating HSV infection during pregnancy
Women presenting with a new genital ulcer consistent with HSV should receive empiric antiviral treatment while awaiting confirmatory diagnostic laboratory testing, even during pregnancy. Antiviral therapy with acyclovir, valacyclovir, and famciclovir is the backbone of management of most symptomatic patients with herpes. Antiviral drugs can reduce signs and symptoms of first or recurrent genital herpes and can be used for daily suppressive therapy to prevent recurrences. These drugs do not eradicate the infection or alter the risk of frequency or severity after the drug is discontinued.
Antiviral advantages/disadvantages. Acyclovir is the least expensive drug, but valacyclovir is the most convenient therapy given its less frequent dosing. Acyclovir and valacyclovir are equally efficacious in treating first-episode genital herpes infection with respect to duration of viral shedding, time of healing, duration of pain, and time to symptom clearance. Two randomized clinical trials showed similar benefits of acyclovir and valacyclovir for suppressive therapy management of genital herpes.14,15 Only 1 study compared the efficacy of famciclovir to valacyclovir for suppression and showed that valacyclovir was more effective.16 The cost of famciclovir is usually higher, and it has the least data on use in pregnant women. Acyclovir therapy can be safely used throughout pregnancy and during breastfeeding.9 Antiviral regimens for the treatment of genital HSV in pregnant and nonpregnant women recommended by the CDC are summarized in TABLE 3.17
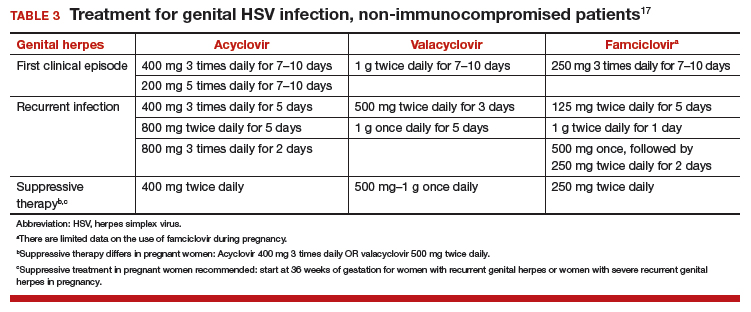
Related article:
5 ways to reduce infection risk during pregnancy
Will your patient’s infant develop neonatal herpes infection?
Neonatal herpes is a potentially devastating infection that results from exposure to HSV from the maternal genital tract at vaginal delivery. Most cases occur in infants born to women who lack a history of genital herpes.18 In a large cohort study conducted in Washington State, isolation of HSV at the time of labor was strongly associated with vertical transmission (odds ratio [OR], 346).19 The risk of neonatal herpes increased among women shedding HSV-1 compared with HSV-2 (OR, 16.5). The highest risk of transmission to the neonate is in women who acquire genital herpes in a period close to the delivery (30% to 50% risk of transmission), compared with women with a prenatal history of herpes or who acquired herpes early in pregnancy (about 1% to 3% risk of transmission), most likely due to protective HSV-specific maternal antibodies and lower viral load during reactivation versus primary infection.18
Neonatal HSV-1 infection also has been reported in neonates born to women with primary HSV-1 gingivostomatitis during pregnancy; 70% of these women had oral clinical symptoms during the peripartum period.20 Potential mechanisms are exposure to infected genital secretions, direct maternal hematogenous spread, or oral shedding from close contacts.
Although prenatal HSV screening is not recommended by the CDC or USPSTF, serologic testing could be helpful when identifying appropriate pregnancy management for women with a prior history of HSV infection. It also could be beneficial in identifying women without HSV to guide counseling prevention for HSV acquisition. In patients presenting with active genital lesions, viral-specific diagnostic evaluation should be obtained. In those with a history of laboratory confirmed genital herpes, no additional testing is warranted.
Preventing neonatal herpes
There are no prevention strategies for neonatal herpes in the United States, and the incidence of neonatal herpes has not changed in several decades.10 The current treatment guidelines focus on managing women who may be at risk for HSV acquisition during pregnancy and the management of genital lesions in women during pregnancy.9,10,21
When the partner has HSV. Women who have no history of genital herpes or who are seronegative for HSV-2 should avoid intercourse during the third trimester with a partner known to have genital herpes.9 Those who have no history of orolabial herpes or who are seronegative for HSV-1 and have a seropositive partner should avoid receptive oral-genital contact and genital intercourse.9 Condoms can reduce but not eliminate the risk of HSV transmission; to effectively avoid genital herpes infection, abstinence is recommended.
When the patient has HSV. When managing the care of a pregnant woman with genital herpes evaluate for clinical symptoms and timing of infection or recurrence relative to time of delivery:
- Monitor women with a mild recurrence of HSV during the first 35 weeks of pregnancy without antiviral treatment, as most of the recurrent episodes of genital herpes are short.
- Consider antivirals for women with severe symptoms or multiple recurrences.
- Offer women with a history of genital lesions suppressive antiviral therapy at 36 weeks of gestation until delivery.21
In a meta-analysis of 7 randomized trials, 1,249 women with a history of genital herpes prior to or during pregnancy received prophylaxis with either acyclovir or valacyclovir versus placebo or no treatment at 36 weeks of gestation. Antiviral therapy reduced the risk of HSV recurrence at delivery (relative risk [RR], 0.28), cesarean delivery in those with recurrent genital herpes (RR, 0.3), and asymptomatic shedding at delivery (RR, 0.14).22 No data are available regarding the effectiveness of this approach to prevention of neonatal HSV, and case reports confirm neonatal HSV in infants born to women who received suppressive antiviral therapy at the end of pregnancy.23
When cesarean delivery is warranted. At the time of delivery, ask all women about symptoms of genital herpes, including prodromal symptoms, and examine them for genital lesions. For women with active lesions or prodromal symptoms, offer cesarean delivery at the onset of labor or rupture of membranes—this recommendation is supported by the CDC and the American College of Obstetricians and Gynecologists.9,21 The protective effect of cesarean delivery was evaluated in a large cohort study that found: among women who were shedding HSV at the time of delivery, neonates born by cesarean delivery were less likely to develop HSV infection compared with those born through vaginal delivery (1.2% vs 7.7%, respectively).19 Cesarean delivery is not indicated in patients with a history of HSV without clinical recurrence or prodrome at delivery, as such women have a very low risk of transmitting the infection to the neonate.24
Avoid transcervical antepartum obstetric procedures to reduce the risk of placenta or membrane HSV infection; however, transabdominal invasive procedures can be performed safely, even in the presence of active genital lesions.21 Intrapartum procedures that can cause fetal skin disruption, such as use of fetal scalp electrode or forceps, are risk factors for HSV transmission and should be avoided in women with a history of genital herpes.
Related articles:
8 common questions about newborn circumcision
Case Resolved
Sarah’s genital lesion PCR results returned positive for HSV-1. She probably acquired the infection from oral-genital sex with her husband who likely has oral HSV-1, given the history of cold sores. You treat Sarah with acyclovir 400 mg 3 times per day for 7 days. At 36 weeks’ gestation, Sarah begins suppressive antiviral therapy until delivery. She spontaneously labors at 39 weeks’ gestation; at that time, she has no genital lesions and she delivers vaginally a healthy baby.
Share your thoughts! Send your Letter to the Editor to [email protected]. Please include your name and the city and state in which you practice.
- Fanfair RN, Zaidi A, Taylor LD, Xu F, Gottlieb S, Markowitz L. Trends in seroprevalence of herpes simplex virus type 2 among non-Hispanic blacks and non-Hispanic whites aged 14 to 49 years–United States, 1988 to 2010. Sex Transm Dis. 2013;40(11):860–864.
- Bradley H, Markowitz LE, Gibson T, McQuillan GM. Seroprevalence of herpes simplex virus types 1 and 2–United States, 1999-2010. J Infect Dis. 2014;209(3):325–333.
- Bernstein DI, Bellamy AR, Hook EW, 3rd, et al. Epidemiology, clinical presentation, and antibody response to primary infection with herpes simplex virus type 1 and type 2 in young women. Clin Infect Dis. 2013;56(3):344–351.
- Kimberlin DW, Rouse DJ. Clinical practice. Genital herpes. N Engl J Med. 2004;350(19):1970–1977.
- Corey L, Adams HG, Brown ZA, Holmes KK. Genital herpes simplex virus infections: clinical manifestations, course, and complications. Ann Intern Med. 1983;98(6):958–972.
- Wald A, Zeh J, Selke S, Ashley RL, Corey L. Virologic characteristics of subclinical and symptomatic genital herpes infections. N Engl J Med. 1995;333(12):770–775.
- Reeves WC, Corey L, Adams HG, Vontver LA, Holmes KK. Risk of recurrence after first episodes of genital herpes. Relation to HSV type and antibody response. N Engl J Med. 1981;305(6):315–319.
- Phipps W, Saracino M, Magaret A, et al. Persistent genital herpes simplex virus-2 shedding years following the first clinical episode. J Infect Dis. 2011;203(2):180–187.
- Workowski KA, Bolan GA; Centers for Disease Control and Prevention. Sexually transmitted diseases treatment guidelines, 2015. MMWR Recomm Rep. 2015;64(RR-03):1–137.
- Bibbins-Domingo K, Grossman DC, Curry SJ, et al; US Preventive Task Force. Serologic screening for genital herpes infection: US Preventive Services Task Force Recommendation Statement. JAMA. 2016;316(23):2525–2530.
- Gupta R, Warren T, Wald A. Genital herpes. Lancet. 2007;370(9605):2127–2137.
- Agyemang E, Le QA, Warren T, et al. Performance of commercial enzyme-linked immunoassays 1 (EIA) for diagnosis of herpes simplex virus-1 and herpes simplex virus-2 infection in a clinical setting. Sex Transm Dis. 2017; doi:10.1097/olq.0000000000000689.
- Wald A, Zeh J, Selke S, et al. Reactivation of genital herpes simplex virus type 2 infection in asymptomatic seropositive persons. N Engl J Med. 2000;342(12):844–850.
- Gupta R, Wald A, Krantz E, et al. Valacyclovir and acyclovir for suppression of shedding of herpes simplex virus in the genital tract. J Infect Dis. 2004;190(8):1374–1381.
- Reitano M, Tyring S, Lang W, et al. Valaciclovir for the suppression of recurrent genital herpes simplex virus infection: a large-scale dose range-finding study. International Valaciclovir HSV Study Group. J Infect Dis. 1998;178(3): 603–610.
- Wald A, Selke S, Warren T, et al. Comparative efficacy of famciclovir and valacyclovir for suppression of recurrent genital herpes and viral shedding. Sex Transm Dis. 2006;33(9):529–533.
- Workowski KA, Bolan GA; Centers for Disease Control and Prevention. Sexually transmitted diseases treatment guidelines, 2015 [published correction appears in MMWR Recomm Rep. 2015;64(33):924]. MMWR Recomm Rep. 2015;64(RR-03):1–137.
- Corey L, Wald A. Maternal and neonatal herpes simplex virus infections. N Engl J Med. 2009;361(14):1376–1385.
- Brown ZA, Wald A, Morrow RA, Selke S, Zeh J, Corey L. Effect of serologic status and cesarean delivery on transmission rates of herpes simplex virus from mother to infant. JAMA. 2003;289(2):203–209.
- Healy SA, Mohan KM, Melvin AJ, Wald A. Primary maternal herpes simplex virus-1 gingivostomatitis during pregnancy and neonatal herpes: case series and literature review. J Pediatric Infect Dis Soc. 2012;1(4):299–305.
- American College of Obstetricians and Gynecoloigsts Committee on Practice Bulletins. ACOG Practice Bulletin No. 82: Management of herpes in pregnancy. Obstet Gynecol. 2007;109(6):1489–1498.
- Hollier LM, Wendel GD. Third trimester antiviral prophylaxis for preventing maternal genital herpes simplex virus (HSV) recurrences and neonatal infection. Cochrane Database Syst Rev. 2008(1):CD004946.
- Pinninti SG, Angara R, Feja KN, et al. Neonatal herpes disease following maternal antenatal antiviral suppressive therapy: a multicenter case series. J Pediatr. 2012;161(1):134–138.e1–e3.
- Vontver LA, Hickok DE, Brown Z, Reid L, Corey L. Recurrent genital herpes simplex virus infection in pregnancy: infant outcome and frequency of asymptomatic recurrences. American journal of obstetrics and gynecology. 1982;143(1):75–84.

Dr. Stankiewicz Karita is Infectious Disease Fellow, Division of Allergy and Infectious Diseases, Department of Medicine at the University of Washington, Seattle.
Dr. Wald is Professor, Department of Medicine, Department of Laboratory Medicine, and Department of Epidemiology at the University of Washington, Seattle, and Joint Member, Vaccine and Infectious Disease Division, Fred Hutchinson Cancer Research Center, Seattle, Washington.
Dr. Wald reports receiving research funding from Genocea and Vical, being a consultant to AiCuris and GlaxoSmithKline, and receiving paid travel from Admedus. Dr. Stankiewicz Karita reports no financial relationships relevant to this article.
Genital herpes is a common infection caused by herpes simplex virus type 1 (HSV-1) or herpes simplex virus type 2 (HSV-2). Although life-threatening health consequences of HSV infection after infancy are uncommon, women with genital herpes remain at risk for recurrent symptoms, which can be associated with significant physical and psychosocial distress. These patients also can transmit the disease to their partners and neonates, and have a 2- to 3-fold increased risk of HIV acquisition. In this article, we review the diagnosis and management of genital herpes in pregnant women.
CASE Asymptomatic pregnant patient tests positive for herpes
Sarah is a healthy 32-year-old (G1P0) presenting at 8 weeks’ gestation for her first prenatal visit. She requests HSV testing as she learned that genital herpes is common and it can be transmitted to the baby. You order the HSV-2 IgG assay from your laboratory, which performs the HerpeSelect HSV-2 enzyme immunoassay as the standard test. The test result is positive, with an index value of 2.2 (the manufacturer defines an index value >1.1 as positive). Repeat testing in 4 weeks returns positive results again, with an index value of 2.8.
The patient is distressed at this news. She has no history of genital lesions or symptoms consistent with genital herpes and is worried that her husband has been unfaithful. How would you manage this case?
How prevalent is HSV?
Genital herpes is a chronic viral infection transmitted through close contact with a person who is shedding the virus from genital or oral mucosa. In the United States, the National Health and Nutrition Examination Survey indicated an HSV-2 seroprevalence of 16% among persons aged 14 to 49 in 2005–2010, a decline from 21% in 1988–1991.1 The prevalence among women is twice as high as among men, at 20% versus 11%, respectively. Among those with HSV-2, 87% are not aware that they are infected; they are at risk of infecting their partners, however.1
In the same age group, the prevalence of HSV-1 is 54%.2 The seroprevalence of HSV-1 in adolescents declined from 39% in 1999–2004 to 30% in 2005–2010, resulting in a high number of young people who are seronegative at the time of sexual debut. Concurrently, genital HSV-1 has emerged as a frequent cause of first-episode genital herpes, often associated with oral-genital contact during sexual debut.2,3
When evaluating patients for possible genital herpes provide general educational messages regarding HSV infection and obtain a detailed medical and sexual history to determine the best diagnostic approach.
What are the clinical features of genital HSV infection?
The clinical manifestations of genital herpes vary according to whether the infection is primary, nonprimary first episode, or recurrent.
Primary infection. During primary infection,which occurs 4 to 12 days after sexual exposure and in the absence of pre-existing antibodies to HSV-1 or HSV-2, patients may experience genital and systemic symptoms (FIGURE and TABLE 1). Since this infection usually occurs in otherwise healthy people, for many, this is the most severe disease that they have experienced. However, most patients with primary infection develop mild, atypical, or completely asymptomatic presentation and are not diagnosed at the time of HSV acquisition. Whether primary infection is caused by HSV-1 or HSV-2 cannot be differentiated based on the clinical presentation alone.
Nonprimary first episode infection. In a nonprimary infection, newly acquired infection with HSV-1 or HSV-2 occurs in a person with pre-existing antibodies to the other virus. Almost always, this means new HSV-2 infection in a HSV-1 seropositive person, as prior HSV-2 infection appears to protect against HSV-1 acquisition. In general, the clinical presentation of nonprimary infection is somewhat milder and the rate of complications is lower, but clinically the overlap is great, and antibody tests are needed to define whether the patient has primary or nonprimary infection.4
Recurrent genital herpes infection occurs in most patients with genital herpes. The rate of recurrence is low in patients with genital HSV-1 and often high in patients with genital HSV-2 infection. The median number of recurrences is 1 in the first year of genital HSV-1 infection, and many patients will not have any recurrences following the first year. By contrast, in patients with genital HSV-2 infection, the median number of recurrences is 4, and a high rate of recurrences can continue for many years. Prodromal symptoms (localized irritation, paresthesias, and pruritus) can precede recurrences, which usually present with fewer lesions and last a shorter time than primary infection. Recurrent genital lesions tend to heal in approximately 5 to 10 days in the absence of antiviral treatment, and systemic symptoms are uncommon.5
Asymptomatic viral shedding. After resolution of a primary HSV infection, people shed the virus in the genital tract despite symptom absence. Asymptomatic shedding tends to be more frequent and prolonged with primary genital HSV-2 infection compared with HSV-1 infection.6,7 The frequency of HSV shedding is highest in the first year of infection, and decreases subsequently.8 However, it is likely to persist intermittently for many years. Because the natural history is so strikingly different in genital HSV-1 versus HSV-2, identification of the viral type is important for prognostic information.
The first HSV episode does not necessarily indicate a new or recent infection—in about 25% of persons it represents the first recognized genital herpes episode. Additional serologic and virologic evaluation can be pursued to determine if the first episode represents a new infection.
Read about the diagnostic tests for genital HSV.
What diagnostic tests are available for genital herpes?
Most HSV infections are clinically silent. Therefore, laboratory tests are required to diagnose the infection. Even if symptoms are present, diagnoses based only on clinical presentation have a 20% false-positive rate. Always confirm diagnosis by laboratory assay.9 Furthermore, couples that are discordant for HSV-2 by history are often concordant by serologic assays, as the transmission already has occurred but was not recognized. In these cases, the direction of transmission cannot be determined, and stable couples often experience relief learning that they are not discordant.
Related article:
Effective treatment of recurrent bacterial vaginosis
Several laboratory tools for HSV diagnosis based on direct viral detection and antibody detection can be used in clinical settings (TABLE 2). Among patients with symptomatic genital herpes, a sample from the lesion can be used to confirm and identify viral type. Because polymerase chain reaction (PCR) is substantially more sensitive than viral culture and increasingly available it has emerged as the preferred test.9 Viral culture is highly specific (>99%), but sensitivity varies according to collection technique and stage of the lesions. (The test is less sensitive when lesions are healing.)9,10 Antigen detection by immunofluorescence (direct fluorescent antibody) detects HSV from active lesions with high specificity, but sensitivity is low. Cytologic identification of infected cells (using Tzanck or Pap test) has limited utility for diagnosis due to low sensitivity and specificity.9
Type-specific antibodies to HSV develop during the first several weeks after acquisition and persist indefinitely.11 Most accurate type-specific serologic tests are based on detection of glycoprotein G1 and glycoprotein G2 for HSV-1 and HSV-2, respectively.
HerpeSelect HSV-2 enzyme immunoassay (EIA) is one of the most commonly used tests in the United States. The manufacturer considers results with index values 1.1 or greater as showing HSV-2 infection. Unfortunately, low positive results, often with a defined index value of 1.1 to 3.5, are frequently false positive. These low positive values should be confirmed with another test, such as Western blot.9
Western blot has been considered the gold standard assay for HSV-1 and HSV-2 antibody detection; this test is available at the University of Washington in Seattle. When comparing the HSV-1 EIA and HSV-2 EIA with the Western blot assay in clinical practice, the estimated sensitivity and specificity are 70.2% and 91.6%, respectively, for HSV-1 and 91.9% and 57.4%, respectively, for HSV-2.12
HerpeSelect HSV-2 Immunoblot testing should not be considered as confirmatory because this assay detects the same antigen as the HSV-2 EIA. Serologic tests based on detection of HSV-IgM should not be used for diagnosis of genital herpes as IgM response can present during a new infection or HSV reactivation and because IgM responses are not type-specific. Clearly, more accurate commercial type-specific antibody tests are needed.
Specific HSV antibodies can take up to 12 weeks to develop. Therefore, repeat serologic testing for patients in whom initial HSV antibody results are negative yet recent genital herpes acquisition is suspected.11 A confirmed positive HSV-2 antibody test indicates anogenital infection, even in a person who lacks genital symptoms. This finding became evident through a study of 53 HSV-2 seropositive patients who lacked a history of genital herpes. Patients were followed for 3 months, and all but 1 developed either virologic or clinical (or both) evidence of genital herpes.13
In the absence of genital or orolabial symptoms among individuals with positive HSV-1, serologic testing cannot distinguish anogenital from orolabial infection. Most of these infections may represent oral HSV-1 infection; however, given increasing occurrence of genital HSV-1 infection, this could also represent a genital infection.
What are the clinical uses of type-specific HSV serology?
Type-specific serologic tests are helpful in diagnosing patients with atypical or asymptomatic infection and managing the care of persons whose sex partners have genital herpes. Serologic testing can be useful to confirm a clinical diagnosis of HSV, to determine whether atypical lesions or symptoms are attributable to HSV, and as part of evaluation for sexually transmitted diseases in select patients. Screening for HSV-1 and HSV-2 in the general population is not supported by the Centers for Disease Control and Prevention (CDC) or the US Preventive Services Task Force (USPSTF) for several reasons9,10:
- suboptimal performance of commercial HSV antibody tests
- low positive predictive value of these tests in low prevalence HSV settings
- lack of widely available confirmatory testing
- lack of cost-effectiveness
- potential for psychological harm.
Read about treating HSV infection during pregnancy.
Case Continued…
Because Sarah did not have a history of genital herpes, a serum sample was tested by the University of Washington Western blot. The results indicated that Sarah is seronegative for HSV-1 and HSV-2.
Sarah, who is now at 16 weeks’ gestation, returns for evaluation of new genital pain. On examination, she has several shallow ulcerations on the labia and bilateral tender inguinal adenopathy. Her husband recently had cold sores. She is anxious and would like to know if she has genital herpes and if her baby is at risk for HSV infection. You swab the base of a lesion for HSV PCR testing and start antiviral treatment.
Treating HSV infection during pregnancy
Women presenting with a new genital ulcer consistent with HSV should receive empiric antiviral treatment while awaiting confirmatory diagnostic laboratory testing, even during pregnancy. Antiviral therapy with acyclovir, valacyclovir, and famciclovir is the backbone of management of most symptomatic patients with herpes. Antiviral drugs can reduce signs and symptoms of first or recurrent genital herpes and can be used for daily suppressive therapy to prevent recurrences. These drugs do not eradicate the infection or alter the risk of frequency or severity after the drug is discontinued.
Antiviral advantages/disadvantages. Acyclovir is the least expensive drug, but valacyclovir is the most convenient therapy given its less frequent dosing. Acyclovir and valacyclovir are equally efficacious in treating first-episode genital herpes infection with respect to duration of viral shedding, time of healing, duration of pain, and time to symptom clearance. Two randomized clinical trials showed similar benefits of acyclovir and valacyclovir for suppressive therapy management of genital herpes.14,15 Only 1 study compared the efficacy of famciclovir to valacyclovir for suppression and showed that valacyclovir was more effective.16 The cost of famciclovir is usually higher, and it has the least data on use in pregnant women. Acyclovir therapy can be safely used throughout pregnancy and during breastfeeding.9 Antiviral regimens for the treatment of genital HSV in pregnant and nonpregnant women recommended by the CDC are summarized in TABLE 3.17
Related article:
5 ways to reduce infection risk during pregnancy
Will your patient’s infant develop neonatal herpes infection?
Neonatal herpes is a potentially devastating infection that results from exposure to HSV from the maternal genital tract at vaginal delivery. Most cases occur in infants born to women who lack a history of genital herpes.18 In a large cohort study conducted in Washington State, isolation of HSV at the time of labor was strongly associated with vertical transmission (odds ratio [OR], 346).19 The risk of neonatal herpes increased among women shedding HSV-1 compared with HSV-2 (OR, 16.5). The highest risk of transmission to the neonate is in women who acquire genital herpes in a period close to the delivery (30% to 50% risk of transmission), compared with women with a prenatal history of herpes or who acquired herpes early in pregnancy (about 1% to 3% risk of transmission), most likely due to protective HSV-specific maternal antibodies and lower viral load during reactivation versus primary infection.18
Neonatal HSV-1 infection also has been reported in neonates born to women with primary HSV-1 gingivostomatitis during pregnancy; 70% of these women had oral clinical symptoms during the peripartum period.20 Potential mechanisms are exposure to infected genital secretions, direct maternal hematogenous spread, or oral shedding from close contacts.
Although prenatal HSV screening is not recommended by the CDC or USPSTF, serologic testing could be helpful when identifying appropriate pregnancy management for women with a prior history of HSV infection. It also could be beneficial in identifying women without HSV to guide counseling prevention for HSV acquisition. In patients presenting with active genital lesions, viral-specific diagnostic evaluation should be obtained. In those with a history of laboratory confirmed genital herpes, no additional testing is warranted.
Preventing neonatal herpes
There are no prevention strategies for neonatal herpes in the United States, and the incidence of neonatal herpes has not changed in several decades.10 The current treatment guidelines focus on managing women who may be at risk for HSV acquisition during pregnancy and the management of genital lesions in women during pregnancy.9,10,21
When the partner has HSV. Women who have no history of genital herpes or who are seronegative for HSV-2 should avoid intercourse during the third trimester with a partner known to have genital herpes.9 Those who have no history of orolabial herpes or who are seronegative for HSV-1 and have a seropositive partner should avoid receptive oral-genital contact and genital intercourse.9 Condoms can reduce but not eliminate the risk of HSV transmission; to effectively avoid genital herpes infection, abstinence is recommended.
When the patient has HSV. When managing the care of a pregnant woman with genital herpes evaluate for clinical symptoms and timing of infection or recurrence relative to time of delivery:
- Monitor women with a mild recurrence of HSV during the first 35 weeks of pregnancy without antiviral treatment, as most of the recurrent episodes of genital herpes are short.
- Consider antivirals for women with severe symptoms or multiple recurrences.
- Offer women with a history of genital lesions suppressive antiviral therapy at 36 weeks of gestation until delivery.21
In a meta-analysis of 7 randomized trials, 1,249 women with a history of genital herpes prior to or during pregnancy received prophylaxis with either acyclovir or valacyclovir versus placebo or no treatment at 36 weeks of gestation. Antiviral therapy reduced the risk of HSV recurrence at delivery (relative risk [RR], 0.28), cesarean delivery in those with recurrent genital herpes (RR, 0.3), and asymptomatic shedding at delivery (RR, 0.14).22 No data are available regarding the effectiveness of this approach to prevention of neonatal HSV, and case reports confirm neonatal HSV in infants born to women who received suppressive antiviral therapy at the end of pregnancy.23
When cesarean delivery is warranted. At the time of delivery, ask all women about symptoms of genital herpes, including prodromal symptoms, and examine them for genital lesions. For women with active lesions or prodromal symptoms, offer cesarean delivery at the onset of labor or rupture of membranes—this recommendation is supported by the CDC and the American College of Obstetricians and Gynecologists.9,21 The protective effect of cesarean delivery was evaluated in a large cohort study that found: among women who were shedding HSV at the time of delivery, neonates born by cesarean delivery were less likely to develop HSV infection compared with those born through vaginal delivery (1.2% vs 7.7%, respectively).19 Cesarean delivery is not indicated in patients with a history of HSV without clinical recurrence or prodrome at delivery, as such women have a very low risk of transmitting the infection to the neonate.24
Avoid transcervical antepartum obstetric procedures to reduce the risk of placenta or membrane HSV infection; however, transabdominal invasive procedures can be performed safely, even in the presence of active genital lesions.21 Intrapartum procedures that can cause fetal skin disruption, such as use of fetal scalp electrode or forceps, are risk factors for HSV transmission and should be avoided in women with a history of genital herpes.
Related articles:
8 common questions about newborn circumcision
Case Resolved
Sarah’s genital lesion PCR results returned positive for HSV-1. She probably acquired the infection from oral-genital sex with her husband who likely has oral HSV-1, given the history of cold sores. You treat Sarah with acyclovir 400 mg 3 times per day for 7 days. At 36 weeks’ gestation, Sarah begins suppressive antiviral therapy until delivery. She spontaneously labors at 39 weeks’ gestation; at that time, she has no genital lesions and she delivers vaginally a healthy baby.
Share your thoughts! Send your Letter to the Editor to [email protected]. Please include your name and the city and state in which you practice.
- Fanfair RN, Zaidi A, Taylor LD, Xu F, Gottlieb S, Markowitz L. Trends in seroprevalence of herpes simplex virus type 2 among non-Hispanic blacks and non-Hispanic whites aged 14 to 49 years–United States, 1988 to 2010. Sex Transm Dis. 2013;40(11):860–864.
- Bradley H, Markowitz LE, Gibson T, McQuillan GM. Seroprevalence of herpes simplex virus types 1 and 2–United States, 1999-2010. J Infect Dis. 2014;209(3):325–333.
- Bernstein DI, Bellamy AR, Hook EW, 3rd, et al. Epidemiology, clinical presentation, and antibody response to primary infection with herpes simplex virus type 1 and type 2 in young women. Clin Infect Dis. 2013;56(3):344–351.
- Kimberlin DW, Rouse DJ. Clinical practice. Genital herpes. N Engl J Med. 2004;350(19):1970–1977.
- Corey L, Adams HG, Brown ZA, Holmes KK. Genital herpes simplex virus infections: clinical manifestations, course, and complications. Ann Intern Med. 1983;98(6):958–972.
- Wald A, Zeh J, Selke S, Ashley RL, Corey L. Virologic characteristics of subclinical and symptomatic genital herpes infections. N Engl J Med. 1995;333(12):770–775.
- Reeves WC, Corey L, Adams HG, Vontver LA, Holmes KK. Risk of recurrence after first episodes of genital herpes. Relation to HSV type and antibody response. N Engl J Med. 1981;305(6):315–319.
- Phipps W, Saracino M, Magaret A, et al. Persistent genital herpes simplex virus-2 shedding years following the first clinical episode. J Infect Dis. 2011;203(2):180–187.
- Workowski KA, Bolan GA; Centers for Disease Control and Prevention. Sexually transmitted diseases treatment guidelines, 2015. MMWR Recomm Rep. 2015;64(RR-03):1–137.
- Bibbins-Domingo K, Grossman DC, Curry SJ, et al; US Preventive Task Force. Serologic screening for genital herpes infection: US Preventive Services Task Force Recommendation Statement. JAMA. 2016;316(23):2525–2530.
- Gupta R, Warren T, Wald A. Genital herpes. Lancet. 2007;370(9605):2127–2137.
- Agyemang E, Le QA, Warren T, et al. Performance of commercial enzyme-linked immunoassays 1 (EIA) for diagnosis of herpes simplex virus-1 and herpes simplex virus-2 infection in a clinical setting. Sex Transm Dis. 2017; doi:10.1097/olq.0000000000000689.
- Wald A, Zeh J, Selke S, et al. Reactivation of genital herpes simplex virus type 2 infection in asymptomatic seropositive persons. N Engl J Med. 2000;342(12):844–850.
- Gupta R, Wald A, Krantz E, et al. Valacyclovir and acyclovir for suppression of shedding of herpes simplex virus in the genital tract. J Infect Dis. 2004;190(8):1374–1381.
- Reitano M, Tyring S, Lang W, et al. Valaciclovir for the suppression of recurrent genital herpes simplex virus infection: a large-scale dose range-finding study. International Valaciclovir HSV Study Group. J Infect Dis. 1998;178(3): 603–610.
- Wald A, Selke S, Warren T, et al. Comparative efficacy of famciclovir and valacyclovir for suppression of recurrent genital herpes and viral shedding. Sex Transm Dis. 2006;33(9):529–533.
- Workowski KA, Bolan GA; Centers for Disease Control and Prevention. Sexually transmitted diseases treatment guidelines, 2015 [published correction appears in MMWR Recomm Rep. 2015;64(33):924]. MMWR Recomm Rep. 2015;64(RR-03):1–137.
- Corey L, Wald A. Maternal and neonatal herpes simplex virus infections. N Engl J Med. 2009;361(14):1376–1385.
- Brown ZA, Wald A, Morrow RA, Selke S, Zeh J, Corey L. Effect of serologic status and cesarean delivery on transmission rates of herpes simplex virus from mother to infant. JAMA. 2003;289(2):203–209.
- Healy SA, Mohan KM, Melvin AJ, Wald A. Primary maternal herpes simplex virus-1 gingivostomatitis during pregnancy and neonatal herpes: case series and literature review. J Pediatric Infect Dis Soc. 2012;1(4):299–305.
- American College of Obstetricians and Gynecoloigsts Committee on Practice Bulletins. ACOG Practice Bulletin No. 82: Management of herpes in pregnancy. Obstet Gynecol. 2007;109(6):1489–1498.
- Hollier LM, Wendel GD. Third trimester antiviral prophylaxis for preventing maternal genital herpes simplex virus (HSV) recurrences and neonatal infection. Cochrane Database Syst Rev. 2008(1):CD004946.
- Pinninti SG, Angara R, Feja KN, et al. Neonatal herpes disease following maternal antenatal antiviral suppressive therapy: a multicenter case series. J Pediatr. 2012;161(1):134–138.e1–e3.
- Vontver LA, Hickok DE, Brown Z, Reid L, Corey L. Recurrent genital herpes simplex virus infection in pregnancy: infant outcome and frequency of asymptomatic recurrences. American journal of obstetrics and gynecology. 1982;143(1):75–84.