User login
Uterus transplantation comes to the United States
After previous attempts in Turkey and Saudi Arabia, the first successful uterine transplantation occurred in 2013. The team of successful surgeons was located in Gothenburg, Sweden, led by Mats Brännström, MD. The team performed 9 transplants in all, and the first birth of a healthy baby boy in October 2014 marked a medical breakthrough.1 The woman who received the transplanted uterus was born without one, a condition known as Mayer-Rokitanksy-Küster-Hauser syndrome, a cause of uterine factor infertility (UFI).
The previous options for having a child for women with UFI (which is the absence of a functional uterus, either congenital or acquired) were adoption or a gestational carrier/surrogacy.2 Surrogacy is not an option for many women, however, as in many countries, including Sweden, the use of gestational carriers and its associated contracts is illegal. All Muslim countries prohibit gestational carriers. Surrogacy also is prohibited in 3 US states, including New York, Michigan, and Arizona. Laws in other US states vary widely.3
Tommaso Falcone, MD, professor and chair, Department of Obstetrics and Gynecology, at the Cleveland Clinic in Cleveland, Ohio, is now co–Principal Investigator on a clinical trial assessing uterine transplantation at his institution, the first such surgeries to be performed in the United States. There will be 7 phases involved in the study: primary and secondary screening, medical evaluation, in vitro fertilization (IVF) with cryopreservation of sufficient number of embryos, transplantation and use of antirejection drugs, embryo transfer, pregnancy/delivery, and ultimately removal of the transplanted uterus. The study team is approved to enroll 10 women.4
OBG Management recently caught up with Dr. Falcone on his groundbreaking, and controversial, endeavor.
OBG Management: When did the thought of performing uterus transplantation enter your mind?
Tommaso Falcone, MD: The idea for uterus transplants was brought to my attention for the first time in Boston in 2007, at an annual meeting of the International Society for Fertility Preservation (ISFP). It was the inaugural meeting for ISFP, a society focused on helping women with cancer to protect their fertility. In 2007, we talked about the standard topics regarding fertility preservation: IVF and ovarian tissue cryopreservation. Then, right at the end of the meeting, was a presentation on uterus transplantation. Upon hearing the presenter, my thought was, “This will never happen in America, for many reasons.”
As time went on, I concentrated my energy more on ovarian tissue transplants for fertility preservation. Then a couple of years ago Andreas G. Tzakis, MD, a transplant surgeon from the University of Miami joined the Cleveland Clinic Florida. Dr. Tzakis was involved with the Swedish Group, including Mats Brännström’s transplant work in humans.
Of course, Dr. Tzakis had had a completely different journey to lead him to uterus transplantation. But as the director of solid organ transplant surgery at the Cleveland Clinic hospital in Florida, he said to me, “I think we should do this. There are many women who have asked for this procedure.” I was not sure at first, but I was interested in going to Sweden to see Dr. Brännström perform his last of 9 uterus transplants.
In Sweden, I asked Dr. Brännström if I could meet the women he already had performed the transplants on. I had certain preconceived notions on which types of women would accept this kind of major surgery to treat their infertility due to absence of a uterus. I expected perhaps that these women could have been coerced into accepting this surgery as a plausible option since surrogacy was not possible for them. I found out, as people usually do, that my preconceived notions were wrong. The women that I met said, “No, we’ve done this because we wanted to.” The women had independently come to a decision that experiencing pregnancy was important in their lives. There was no coercion. They understood the risks. However, I did not meet the uterus donors.
When I got on the plane to return home, I said to myself, we have to offer this service because it is part of the choices that women have to treat their reproductive infertility.
OBG Management: What are the hurdles you have had to overcome to bring this groundbreaking surgery to the Cleveland Clinic?
Dr. Falcone, MD: As soon as I returned from Sweden, we began the internal review board (IRB) approval process, which was extremely long. The first decision was: Do we use a live donor, as they do in Sweden, in America?
We analyzed the data from the Swedes and found that the surgery is very long for the donor and it put some of the donors, especially those who were older and placed on hormones, at risk for venous thromboembolism. (No blood clots had occurred in the Swedish trial.) In addition, there were some complications for patients. Although not major complications, we felt that these could be limited.
To remove the variable of risks for the donor, we decided that we would go in another direction and use the typical approach to donor transplants that is taken in this country, which is to use cadaveric, or brain dead, donors. The use of deceased donors allows us to isolate larger vascular pedicles for transplantation. Although we do not have IRB approval for live donors we are working in animal models to come up with an alternative technique to obtain vessels appropriate for anastomosis.
To address complications for the recipient, including the necessity to continually take antirejection, or immunosuppressive, medications, our recommendation to patients who undergo uterus transplantation surgery is to remove the uterus after delivery of 2 babies. Our plan at that time will be to perform a cesarean delivery and remove the uterus.
Right now in the process we are going through the screening phase and beginning IVF. We are approved for 10 women, and all potential recipients went through the necessary criteria, including psychological counseling. During IVF, each woman needs to have between 6 and 10 embryos (blastocysts).
OBG Management: Do you think that organ transplant pioneers foresaw successful transplantation of a uterus?
Dr. Falcone, MD: I do not think Dr. Tzakis, who is a transplant pioneer and has been doing this his entire career of 25 years or so, even foresaw this. This is something that has evolved over time. The first transplants (of kidney, heart, and liver) were to save lives. Subsequently, quality-of- life transplants have occurred, such as the face transplant and the larynx transplant. Uterus transplants are not to save lives, but they do improve quality of life, and I think that is what is important.
There is a lot of controversy surrounding this procedure—just like many aspects of reproductive medicine. A lot of what we do is full of controversy: IVF, gestational carriers, and genetic screening in utero. But we are in the quality-of-life era with transplantation medicine. If women have a strong desire to carry their own child, and surrogacy is not an option, then this may be one.
Tommasso Falcone, MD, was co-director of the Pelvic Anatomy and Gynecologic Surgery (PAGS) Symposium held in Las Vegas, Nevada, December 10–12, 2015. He offered workshops and seminars during the Scientific Program on diverse topics, including: hysteroscopy; ultrasonography; pelvic and abdominal anatomy; myometomy; hysterectomy; endometriosis; avoiding laparoscopic complications; medicolegal considerations; and surgical tips and techniques.
Share your thoughts! Send your Letter to the Editor to [email protected]. Please include your name and the city and state in which you practice.
- Brännström M, Johannesson L, Bokström H. Livebirth after uterus transplantation. Lancet. 2015;385(9968):607−616.
- Barbieri RL. Uterus transplantation: Medical breakthrough or surgical folly? OBG Manag. 2015;27(4):8, 10, 12.
- Surrogacy laws in the United States. Milwaukee Wisconsin Journal Sentinel Web site. http://www.jsonline.com/news/health/163772546.html. Published August 4, 2012. Accessed January 19, 2016.
- Uterine transplantation for the treatment of uterine factor infertility. ClinicalTrials.gov Web site. https://clinicaltrials.gov/ct2/show/NCT02573415. Updated October 28, 2015. Accessed January 19, 2016.
Q&A with Tommaso Falcone, MD

Dr. Falcone is Professor and Chair, Department of Obstetrics and Gynecology, at the Cleveland Clinic, Cleveland, Ohio.
The author reports no financial relationships relevant to this article.
Q&A with Tommaso Falcone, MD
Dr. Falcone is Professor and Chair, Department of Obstetrics and Gynecology, at the Cleveland Clinic, Cleveland, Ohio.
The author reports no financial relationships relevant to this article.
Q&A with Tommaso Falcone, MD
Dr. Falcone is Professor and Chair, Department of Obstetrics and Gynecology, at the Cleveland Clinic, Cleveland, Ohio.
The author reports no financial relationships relevant to this article.
After previous attempts in Turkey and Saudi Arabia, the first successful uterine transplantation occurred in 2013. The team of successful surgeons was located in Gothenburg, Sweden, led by Mats Brännström, MD. The team performed 9 transplants in all, and the first birth of a healthy baby boy in October 2014 marked a medical breakthrough.1 The woman who received the transplanted uterus was born without one, a condition known as Mayer-Rokitanksy-Küster-Hauser syndrome, a cause of uterine factor infertility (UFI).
The previous options for having a child for women with UFI (which is the absence of a functional uterus, either congenital or acquired) were adoption or a gestational carrier/surrogacy.2 Surrogacy is not an option for many women, however, as in many countries, including Sweden, the use of gestational carriers and its associated contracts is illegal. All Muslim countries prohibit gestational carriers. Surrogacy also is prohibited in 3 US states, including New York, Michigan, and Arizona. Laws in other US states vary widely.3
Tommaso Falcone, MD, professor and chair, Department of Obstetrics and Gynecology, at the Cleveland Clinic in Cleveland, Ohio, is now co–Principal Investigator on a clinical trial assessing uterine transplantation at his institution, the first such surgeries to be performed in the United States. There will be 7 phases involved in the study: primary and secondary screening, medical evaluation, in vitro fertilization (IVF) with cryopreservation of sufficient number of embryos, transplantation and use of antirejection drugs, embryo transfer, pregnancy/delivery, and ultimately removal of the transplanted uterus. The study team is approved to enroll 10 women.4
OBG Management recently caught up with Dr. Falcone on his groundbreaking, and controversial, endeavor.
OBG Management: When did the thought of performing uterus transplantation enter your mind?
Tommaso Falcone, MD: The idea for uterus transplants was brought to my attention for the first time in Boston in 2007, at an annual meeting of the International Society for Fertility Preservation (ISFP). It was the inaugural meeting for ISFP, a society focused on helping women with cancer to protect their fertility. In 2007, we talked about the standard topics regarding fertility preservation: IVF and ovarian tissue cryopreservation. Then, right at the end of the meeting, was a presentation on uterus transplantation. Upon hearing the presenter, my thought was, “This will never happen in America, for many reasons.”
As time went on, I concentrated my energy more on ovarian tissue transplants for fertility preservation. Then a couple of years ago Andreas G. Tzakis, MD, a transplant surgeon from the University of Miami joined the Cleveland Clinic Florida. Dr. Tzakis was involved with the Swedish Group, including Mats Brännström’s transplant work in humans.
Of course, Dr. Tzakis had had a completely different journey to lead him to uterus transplantation. But as the director of solid organ transplant surgery at the Cleveland Clinic hospital in Florida, he said to me, “I think we should do this. There are many women who have asked for this procedure.” I was not sure at first, but I was interested in going to Sweden to see Dr. Brännström perform his last of 9 uterus transplants.
In Sweden, I asked Dr. Brännström if I could meet the women he already had performed the transplants on. I had certain preconceived notions on which types of women would accept this kind of major surgery to treat their infertility due to absence of a uterus. I expected perhaps that these women could have been coerced into accepting this surgery as a plausible option since surrogacy was not possible for them. I found out, as people usually do, that my preconceived notions were wrong. The women that I met said, “No, we’ve done this because we wanted to.” The women had independently come to a decision that experiencing pregnancy was important in their lives. There was no coercion. They understood the risks. However, I did not meet the uterus donors.
When I got on the plane to return home, I said to myself, we have to offer this service because it is part of the choices that women have to treat their reproductive infertility.
OBG Management: What are the hurdles you have had to overcome to bring this groundbreaking surgery to the Cleveland Clinic?
Dr. Falcone, MD: As soon as I returned from Sweden, we began the internal review board (IRB) approval process, which was extremely long. The first decision was: Do we use a live donor, as they do in Sweden, in America?
We analyzed the data from the Swedes and found that the surgery is very long for the donor and it put some of the donors, especially those who were older and placed on hormones, at risk for venous thromboembolism. (No blood clots had occurred in the Swedish trial.) In addition, there were some complications for patients. Although not major complications, we felt that these could be limited.
To remove the variable of risks for the donor, we decided that we would go in another direction and use the typical approach to donor transplants that is taken in this country, which is to use cadaveric, or brain dead, donors. The use of deceased donors allows us to isolate larger vascular pedicles for transplantation. Although we do not have IRB approval for live donors we are working in animal models to come up with an alternative technique to obtain vessels appropriate for anastomosis.
To address complications for the recipient, including the necessity to continually take antirejection, or immunosuppressive, medications, our recommendation to patients who undergo uterus transplantation surgery is to remove the uterus after delivery of 2 babies. Our plan at that time will be to perform a cesarean delivery and remove the uterus.
Right now in the process we are going through the screening phase and beginning IVF. We are approved for 10 women, and all potential recipients went through the necessary criteria, including psychological counseling. During IVF, each woman needs to have between 6 and 10 embryos (blastocysts).
OBG Management: Do you think that organ transplant pioneers foresaw successful transplantation of a uterus?
Dr. Falcone, MD: I do not think Dr. Tzakis, who is a transplant pioneer and has been doing this his entire career of 25 years or so, even foresaw this. This is something that has evolved over time. The first transplants (of kidney, heart, and liver) were to save lives. Subsequently, quality-of- life transplants have occurred, such as the face transplant and the larynx transplant. Uterus transplants are not to save lives, but they do improve quality of life, and I think that is what is important.
There is a lot of controversy surrounding this procedure—just like many aspects of reproductive medicine. A lot of what we do is full of controversy: IVF, gestational carriers, and genetic screening in utero. But we are in the quality-of-life era with transplantation medicine. If women have a strong desire to carry their own child, and surrogacy is not an option, then this may be one.
Tommasso Falcone, MD, was co-director of the Pelvic Anatomy and Gynecologic Surgery (PAGS) Symposium held in Las Vegas, Nevada, December 10–12, 2015. He offered workshops and seminars during the Scientific Program on diverse topics, including: hysteroscopy; ultrasonography; pelvic and abdominal anatomy; myometomy; hysterectomy; endometriosis; avoiding laparoscopic complications; medicolegal considerations; and surgical tips and techniques.
Share your thoughts! Send your Letter to the Editor to [email protected]. Please include your name and the city and state in which you practice.
- Brännström M, Johannesson L, Bokström H. Livebirth after uterus transplantation. Lancet. 2015;385(9968):607−616.
- Barbieri RL. Uterus transplantation: Medical breakthrough or surgical folly? OBG Manag. 2015;27(4):8, 10, 12.
- Surrogacy laws in the United States. Milwaukee Wisconsin Journal Sentinel Web site. http://www.jsonline.com/news/health/163772546.html. Published August 4, 2012. Accessed January 19, 2016.
- Uterine transplantation for the treatment of uterine factor infertility. ClinicalTrials.gov Web site. https://clinicaltrials.gov/ct2/show/NCT02573415. Updated October 28, 2015. Accessed January 19, 2016.
In this Article
- Hurdles to IRB approval
- The quality-of-life era in transplant medicine
Is double-layer closure with unlocked first-layer associated with better uterine scar healing than locked single-layer closure?
Cesarean delivery (CD), the most common surgery performed worldwide, is associated with increased morbidity and mortality compared with vaginal delivery. More than 230 randomized controlled trials (RCTs) have been published on varying technical aspects of CD, yet uncertainty remains regarding the optimal approach(es) to minimize perinatal morbidity.
Previous trials of one such technique, uterine closure, have not demonstrated short-term outcome differences among those randomized to single- versus double-layer closure. Results of long-term outcomes such as uterine rupture remain unclear. Emerging evidence also has associated cesarean scar defects with gynecologic problems like dysmenorrhea, pelvic pain, and postmenstrual spotting, further highlighting the importance of identifying surgical techniques that optimize uterine scar healing after CD.
Details of the study
In their recent RCT, Roberge and colleagues randomly assigned 81 women with singleton pregnancies undergoing elective primary CD (at ≥38 0/7 weeks) and compared the following uterine closure types on residual myometrial thickness during postpartum transvaginal ultrasound at 6 months:
- single-layer locked closure (control)
- double-layer locked closure
- double-layer unlocked closure.
In addition to addressing the single- versus double-layer debate, this study highlights another important aspect of closure technique: locked versus unlocked first-layer suture closure. The residual myometrial thickness, a surrogate measure of uterine scar healing, was significantly greater in those women randomly assigned to double-layer (locked or unlocked) closure compared with controls. Additionally, total myometrial thickness significantly increased in the double- layer unlocked closure group. There were no differences in the short-term outcomes of operative time or estimated blood loss among any of the groups.
Based on these findings, the authors advocate for double-layer unlocked uterine closure during CD to maximize uterine scar healing.
Bottom line
Double-layer uterine closure with unlocked first-layer at CD appears to maximize postpartum uterine scar thickness compared with other techniques; it remains unclear, however, if this improves short- or long-term outcomes. What this evidence means for practice
While residual and total myometrial thickness presents a feasible, albeit indirect, assessment of uterine scar healing, it remains unclear if double-layer unlocked first-layer closure decreases long-term adverse outcomes, such as subsequent uterine rupture, cesarean scar defects, or gynecologic morbidity compared with other techniques. Nevertheless, this study highlights the importance of future research specifying both single- or double-layer and locked or unlocked uterine closure techniques.
— Joshua D. Dahlke, MD
Share your thoughts! Send your Letter to the Editor to [email protected]. Please include your name and the city and state in which you practice.

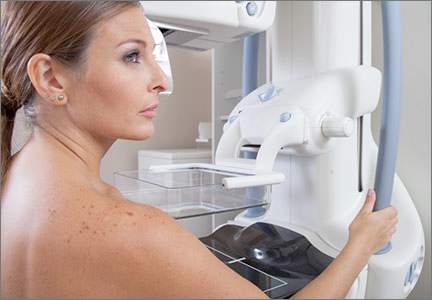
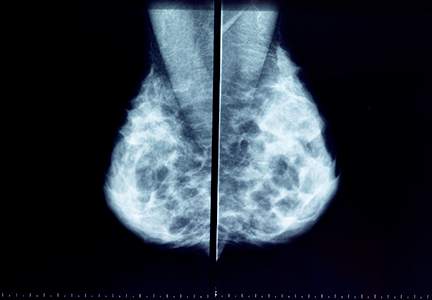
No surprises from the USPSTF with new guidance on screening mammography
In 2009, the US Preventive Services Task Force (USPSTF) recommended that biennial mammography screening in average-risk women begin at age 50.1 New guidelines, that take into account reviews and modeling studies, clarify the earlier USPSTF recommendations, paying particular attention to individualized screening for women aged 40 to 49, use of tomosynthesis, and supplemental evaluation for women with radiologically dense breasts.
The new guidance only applies to women at average risk for breast cancer (not to those at substantially higher-than-average risk), including those with prior breast cancer or biopsy-confirmed high-risk lesions (eg, atypical hyperplasia), certain genetic conditions (such as BRCA1 or BRCA2 mutation), or histories of chest irradiation (eg, Hodgkin lymphoma).
Major statements:
- Biennial screening is recommended for women aged 50 to 74 (B recommendation; definitions of USPSTF grades are available online at ).
- Initiation of screening before age 50 should be individualized depending on patient preferences (C recommendation).
- For women aged ≥75, current evidence is insufficient to assess benefits and harms of screening (I statement).
- Current evidence is insufficient to assess the benefits and harms of adding tomosynthesis to conventional screening mammography (I statement).
- For women with radiologically dense breasts, current evidence is insufficient to assess the benefits and harms of adjunctive ultrasound, magnetic resonance imaging (MRI), or tomosynthesis (I statement).2
The Task Force generated controversy with its 2009 recommendation that screening begin at age 50 in average-risk women. The current guidance clarifies that repetitive screening of women through 10 years reduces breast cancer deaths by 4 (aged 40–49), 8 (aged 50–59), and 21 (aged 60–69) per 10,000 women, respectively.2
The term “overdiagnosis” refers to detection and treatment of invasive and noninvasive (usually ductal carcinoma in situ) lesions that would have gone undetected without screening and would not have caused health problems. The USPSTF acknowledges that, while overdiagnosis represents the principal harm from screening, estimating overdiagnosis rates is challenging (best estimates range from 1 in 5 to 1 in 8 breast cancers diagnosed in screened women).2–4 False-positive results, which lead to unnecessary additional imaging and biopsies,3,4 can represent an additional harm of screening mammography.
The rationale for recommending that average-risk women begin screening at age 50 is based on the relatively smaller benefits and greater harms incurred when younger women are screened;3,4 however, in noting that most of the screening benefits for women in their 40s are realized starting at age 45, the USPSTF guidance opens the door to average-risk women to begin screening at that age (congruent with the November 2015 American Cancer Society recommendations5). Also, women with a first-degree relative with breast cancer may want to initiate screening at age 40.
Regarding screening frequency, annual screening generates minimal if any benefit while increasing the potential for harm3,4; thus, for most women at average risk for breast cancer, biennial screening provides the best benefit–harm balance.
What about use of tomosynthesis and women with dense breasts?
Tomosynthesis, which can be performed along with conventional digital screening mammography, seems to diminish the need for follow-up imaging while also increasing cancer detection rates.6 However, whether these additional cancers represent overdiagnosis remains unknown. Furthermore, tomosynthesis can expose women to about twice the radiation as conventional digital screening.7
Twenty-four states currently mandate that patients with dense breasts identified at screening be notified. Although increased breast density is a common independent risk factor for breast cancer, the degree of radiographic density can vary substantially from one screen to the next in the same woman. Evidence for or against adjunctive imaging is very limited in women found to have dense breasts in an otherwise negative mammogram, and suggests that ultrasonography and MRI (as well as tomosynthesis) can detect additional breast cancers while also generating more false-positive results.8 Thus, the USPSTF does not recommend specific screening strategies for women with dense breasts.
How I counsel my patients
I plan to continue recommending screening based on USPSTF guidance. However, I also will continue to support the preferences of many of my patients to:
- initiate screening before age 50
- undergo screening annually
- continue screening after age 74.
You and your patients alike may find the USPSTF’s Summary for Patients9 (http://annals.org/article.aspx?articleid=2480981&resultClick=3) to be helpful when navigating this territory.
Share your thoughts! Send your Letter to the Editor to [email protected]. Please include your name and the city and state in which you practice.
- US Preventive Services Task Force. Screening for breast cancer: US Preventive Services Task Force recommendation statement. Ann Intern Med. 2009;151(10):716−726.
- Siu AL; US Preventive Services Task Force. Screening for breast cancer: US Preventive Services Task Force recommendation statement [published online ahead of print January 12, 2016]. Ann Intern Med. doi:10.7326/M15-2886.
- Nelson HD, Pappas M, Cantor A, Griffin J, Daeges M, Humphrey L. Harms of breast cancer screening: systematic review to update the 2009 US Preventive Services Task Force recommendation [published online ahead of print January 12, 2016]. Ann Intern Med. doi: 10.7326/M15-0970.
- Mandelblatt JS, Stout NK, Schechter CB, et al. Collaborative modeling of the benefits and harms associated with different US breast cancer screening strategies [published online ahead of print January 12, 2016]. Ann Intern Med. doi: 10.7326 /M15-1536.
- Oeffinger KC, Fontham ET, Etzioni R, et al; American Cancer Society. Breast cancer screening for women at average risk: 2015 guideline update from the American Cancer Society. JAMA. 2015;314(15):1599−1614.
- Nelson HD, OMeara ES, Kerlikowski K, Balch S, Miglioretti D. Factors associated with rates of false-positive and false-negative results from digital mammography screening: an analysis of registry data [published online ahead of print January 12, 2016]. Ann Intern Med. doi: 10.7326/M15-0971.
- Miglioretti DL, Lange J, van den Broek JJ, et al. Radiation-induced breast cancer incidence and mortality from digital mammography screening: a modeling study [published online ahead of print January 12, 2016]. Ann Intern Med. doi: 10.7326 /M15-1241.
- Melnikow J, Fenton JJ, Whitlock EP, et al. Supplemental screening for breast cancer in women with dense breasts: a systematic review for the US Preventive Services Task Force [published online ahead of print January 12, 2016]. Ann Intern Med. doi: 10.7326/M15-1789.
- Siu AL; US Preventive Services Task Force. Screening for breast cancer: US Preventive Services Task Force Recommendation Statement (Summary for Patients). Ann Intern Med. 2016:164:279–296. http://annals.org/article.aspx?articleid=2480981&resultClick=3. Published January 12, 2016. Accessed January 25, 2016.

Andrew M. Kaunitz, MD
Dr. Kaunitz is University of Florida Research Foundation Professor and Associate Chairman, Department of Obstetrics and Gynecology, University of Florida College of Medicine–Jacksonville. He directs Menopause and Gynecologic Ultrasound Services, UF Women’s Health Specialists–Emerson. He serves on the OBG Management Board of Editors.
The author reports no financial relationships relevant to this article.
In 2009, the US Preventive Services Task Force (USPSTF) recommended that biennial mammography screening in average-risk women begin at age 50.1 New guidelines, that take into account reviews and modeling studies, clarify the earlier USPSTF recommendations, paying particular attention to individualized screening for women aged 40 to 49, use of tomosynthesis, and supplemental evaluation for women with radiologically dense breasts.
The new guidance only applies to women at average risk for breast cancer (not to those at substantially higher-than-average risk), including those with prior breast cancer or biopsy-confirmed high-risk lesions (eg, atypical hyperplasia), certain genetic conditions (such as BRCA1 or BRCA2 mutation), or histories of chest irradiation (eg, Hodgkin lymphoma).
Major statements:
- Biennial screening is recommended for women aged 50 to 74 (B recommendation; definitions of USPSTF grades are available online at ).
- Initiation of screening before age 50 should be individualized depending on patient preferences (C recommendation).
- For women aged ≥75, current evidence is insufficient to assess benefits and harms of screening (I statement).
- Current evidence is insufficient to assess the benefits and harms of adding tomosynthesis to conventional screening mammography (I statement).
- For women with radiologically dense breasts, current evidence is insufficient to assess the benefits and harms of adjunctive ultrasound, magnetic resonance imaging (MRI), or tomosynthesis (I statement).2
The Task Force generated controversy with its 2009 recommendation that screening begin at age 50 in average-risk women. The current guidance clarifies that repetitive screening of women through 10 years reduces breast cancer deaths by 4 (aged 40–49), 8 (aged 50–59), and 21 (aged 60–69) per 10,000 women, respectively.2
The term “overdiagnosis” refers to detection and treatment of invasive and noninvasive (usually ductal carcinoma in situ) lesions that would have gone undetected without screening and would not have caused health problems. The USPSTF acknowledges that, while overdiagnosis represents the principal harm from screening, estimating overdiagnosis rates is challenging (best estimates range from 1 in 5 to 1 in 8 breast cancers diagnosed in screened women).2–4 False-positive results, which lead to unnecessary additional imaging and biopsies,3,4 can represent an additional harm of screening mammography.
The rationale for recommending that average-risk women begin screening at age 50 is based on the relatively smaller benefits and greater harms incurred when younger women are screened;3,4 however, in noting that most of the screening benefits for women in their 40s are realized starting at age 45, the USPSTF guidance opens the door to average-risk women to begin screening at that age (congruent with the November 2015 American Cancer Society recommendations5). Also, women with a first-degree relative with breast cancer may want to initiate screening at age 40.
Regarding screening frequency, annual screening generates minimal if any benefit while increasing the potential for harm3,4; thus, for most women at average risk for breast cancer, biennial screening provides the best benefit–harm balance.
What about use of tomosynthesis and women with dense breasts?
Tomosynthesis, which can be performed along with conventional digital screening mammography, seems to diminish the need for follow-up imaging while also increasing cancer detection rates.6 However, whether these additional cancers represent overdiagnosis remains unknown. Furthermore, tomosynthesis can expose women to about twice the radiation as conventional digital screening.7
Twenty-four states currently mandate that patients with dense breasts identified at screening be notified. Although increased breast density is a common independent risk factor for breast cancer, the degree of radiographic density can vary substantially from one screen to the next in the same woman. Evidence for or against adjunctive imaging is very limited in women found to have dense breasts in an otherwise negative mammogram, and suggests that ultrasonography and MRI (as well as tomosynthesis) can detect additional breast cancers while also generating more false-positive results.8 Thus, the USPSTF does not recommend specific screening strategies for women with dense breasts.
How I counsel my patients
I plan to continue recommending screening based on USPSTF guidance. However, I also will continue to support the preferences of many of my patients to:
- initiate screening before age 50
- undergo screening annually
- continue screening after age 74.
You and your patients alike may find the USPSTF’s Summary for Patients9 (http://annals.org/article.aspx?articleid=2480981&resultClick=3) to be helpful when navigating this territory.
Share your thoughts! Send your Letter to the Editor to [email protected]. Please include your name and the city and state in which you practice.
- US Preventive Services Task Force. Screening for breast cancer: US Preventive Services Task Force recommendation statement. Ann Intern Med. 2009;151(10):716−726.
- Siu AL; US Preventive Services Task Force. Screening for breast cancer: US Preventive Services Task Force recommendation statement [published online ahead of print January 12, 2016]. Ann Intern Med. doi:10.7326/M15-2886.
- Nelson HD, Pappas M, Cantor A, Griffin J, Daeges M, Humphrey L. Harms of breast cancer screening: systematic review to update the 2009 US Preventive Services Task Force recommendation [published online ahead of print January 12, 2016]. Ann Intern Med. doi: 10.7326/M15-0970.
- Mandelblatt JS, Stout NK, Schechter CB, et al. Collaborative modeling of the benefits and harms associated with different US breast cancer screening strategies [published online ahead of print January 12, 2016]. Ann Intern Med. doi: 10.7326 /M15-1536.
- Oeffinger KC, Fontham ET, Etzioni R, et al; American Cancer Society. Breast cancer screening for women at average risk: 2015 guideline update from the American Cancer Society. JAMA. 2015;314(15):1599−1614.
- Nelson HD, OMeara ES, Kerlikowski K, Balch S, Miglioretti D. Factors associated with rates of false-positive and false-negative results from digital mammography screening: an analysis of registry data [published online ahead of print January 12, 2016]. Ann Intern Med. doi: 10.7326/M15-0971.
- Miglioretti DL, Lange J, van den Broek JJ, et al. Radiation-induced breast cancer incidence and mortality from digital mammography screening: a modeling study [published online ahead of print January 12, 2016]. Ann Intern Med. doi: 10.7326 /M15-1241.
- Melnikow J, Fenton JJ, Whitlock EP, et al. Supplemental screening for breast cancer in women with dense breasts: a systematic review for the US Preventive Services Task Force [published online ahead of print January 12, 2016]. Ann Intern Med. doi: 10.7326/M15-1789.
- Siu AL; US Preventive Services Task Force. Screening for breast cancer: US Preventive Services Task Force Recommendation Statement (Summary for Patients). Ann Intern Med. 2016:164:279–296. http://annals.org/article.aspx?articleid=2480981&resultClick=3. Published January 12, 2016. Accessed January 25, 2016.
A New Schedule Could Be Better for Your Hospitalist Group
Present “hospitalist” in a word association exercise to a wide range of healthcare personnel in clinical and administrative roles, and many would instantly respond with “seven-on/seven-off schedule.”
Some numbers from SHM’s 2014 State of Hospital Medicine report:
- 53.8%: Portion of hospitalist groups using a seven-on/seven-off schedule.
- 182: Median number of shifts worked annually by a full-time hospitalist (standard contract hours, does not include “extra” shifts).
- 65%: Portion of groups having day shifts that are 12.0–13.9 hours in length.
These numbers suggest to me that, at least outside of academia, the standard hospitalist is working 12-hour shifts on a seven-on/seven-off schedule. And that mirrors my experience working on-site with hundreds of hospitalist groups across the country.
In other words, the hospitalist marketplace has spoken unambiguously regarding the favored work schedule. In some ways, it is a defining feature of hospitalist practice. In the same way that a defining characteristic of Millennials is devotion to social media and that air travel is associated with cramped seats, this work schedule is a defining characteristic for hospitalists.
Schedule Benefits? Many …
There is a reason for its popularity: It is simple to understand and operationalize, it provides for good hospitalist-patient continuity, and having every other week off is often cited as a principle reason for becoming a hospitalist (in many cases, it might only take a clerk or administrator a few hours to create a group’s work schedule for a whole year). Many hospitalist groups have followed this schedule for a decade or longer, and while they might have periodically discussed moving to an entirely different model, most have stuck with what they know.
I’m convinced this schedule will be around for many years to come.
Not Ideal in All Respects
Despite this schedule’s popularity, I regularly talk with hospitalists who say it has become very stressful and monotonous. They say they would really like to change to something else but feel stuck by the complexity of alternative models and the difficulty achieving consensus within the group regarding what model offers enough advantages—and acceptable costs—to be worth it.
They cite as shortcomings of the seven-on/seven-off schedule:
- It can be a Herculean task to alter the schedule to arrange a day or two off during the regularly scheduled week. They often give up on the effort, and over time, this can lead to some resentment toward their work.
- There is a tendency to adopt a systole-diastole lifestyle, with no activities other than work during the week on (e.g., no trips to the gym, dinners out with family, etc.) and an effort to move all of these into the week off. They’ll say, “What other profession requires one to shut down their personal life for seven days every other week?”
- It can be difficult to reliably use the seven days off productively. Sometimes it might be better to return to work after only two to four days off if at other times it were easy to arrange more than seven consecutive days off.
- The “switch day” can be difficult for the hospital. Such schedules nearly always are arranged so that all the doctors conclude seven days of work on the same day and are replaced by others the following day. Every hospitalist patient (typically more than half of all patients in the hospital) gets a new doctor on the same day, and the whole hospital runs less efficiently as a result.
Change Your Schedule?
Who am I kidding? Few groups, probably none to be precise, are likely to change their schedule as a result of reading this column. But I’m among what seems to be a small contingent who believe alternative schedules can work. Whether your group decides to pursue a different model should be entirely up to its members, but it is worthwhile to periodically discuss the costs and benefits of your current schedule as well as what other options might be practical. In most cases the discussion will conclude without any significant change, but discussing it periodically might turn up worthwhile small adjustments.
But if your group is ready to make a meaningful change away from a rigid seven-on/seven-off schedule, the first step could be to vary the number of days off. No longer would all in the group switch on the same day; only one doctor would switch at a time (unless there are more than seven day shifts), and that could occur on any day of the week.
To illustrate, let’s say you’re in a group with four day shifts. For this week, Dr. Plant might start Monday after four days off, Dr. Bonham has had 11 days off and starts Tuesday, Dr. Page starts Friday after nine days off, and Dr. Jones starts Saturday after six days off. Each will work seven consecutive day shifts, and the number of off days will vary depending on their own wishes and the needs of the group. This is much more complicated to schedule, but varying the switch day and number of days off between weeks can be good for work-life balance.
Some will quickly identify difficulties, such as how to get the kids’ nanny to match a varying work schedule like this. I know many hospitalists who have done this successfully and are glad they did, but I’m sure there are also many for whom changing to a schedule like this might require moving from their current terrific childcare arrangements to a new one, something that they (justifiably) are unwilling to do.
And if your group successfully moves to a seven-on/X-off schedule (i.e., varied number of days off), you could next think about varying the number of consecutive days worked. Maybe it could range from no fewer than five or six (to preserve reasonable continuity) to as many as 10 or 11 as long as you have the stamina.
I don’t have research proving this would be a better schedule. But my own career, and the experiences of a number of others I’ve spoken with, is enough to convince me it’s worth considering. TH
Can transabdominal ultrasound exclude short cervix?
Preterm birth (PTB) remains a major cause of perinatal morbidity and mortality, and so its prediction and prevention are 2 of the most important issues in obstetrics. Cervical length (CL) measured by ultrasound has been shown to be the best predictor; several interventions (vaginal progesterone and cerclage) have been shown to be effective at reducing PTB if a short CL is identified. In fact, both the American College of Obstetricians and Gynecologists (ACOG) and the Society for Maternal-Fetal Medicine (SMFM) recommend CL being measured every 2 weeks from 16 to 23 weeks in singletons with prior spontaneous PTB (sPTB), with cerclage placed for CL less than 25 mm. Moreover, both ACOG and SMFM recommend that “universal CL screening” (CL measured in singletons without a prior sPTB) be considered as a single measurement at about 18 to 23 weeks.
Details of the study
Rhoades and colleagues present data on CL screening done by transabdominal ultrasound (TAU), as an alternative to transvaginal ultrasound (TVU). This study confirms early data:
- TAU cannot visualize CL in several women (20.6%).
- To make sure a high sensitivity (92.9% in this study) is achieved to detect a TVU CL less than 30 mm, a high cutoff (in this case 35 mm) needs to be used with TAU. Nonetheless, 7% of women with a short TVU CL would not be detected, raising clinical and legal issues.
- A high percentage (in this case 32.4%; 103/318) of women screened by TAU would screen positive (TAU CL less than 35 mm) and therefore need to have a TVU anyway.
- Overall, more than 50% (in this study 53%–20.6% because TAU could not visualize CL, and 32.4% because TAU was less than 35 mm) of women having TAU CL screening would need to have TVU anyway! In the largest study comparing TAU to TVU CL screening (TABLE1–6), 66% of women screened by TAU would have to be screened also by TVU.5
There are several other reasons why TVU is considered the gold standard for CL screening, and instead TAU CL should be avoided as possible. All randomized controlled trials that showed benefit from interventions (vaginal progesterone, cerclage, pessary) aimed at decreasing PTB in women with short CL used TVU CL screening and never TAU CL screening. In addition, TAU CL is less accurate than TVU CL screening. On TAU, fetal parts can obscure the cervix, obesity makes it hard to visualize CL, the distance between probe and cervix is longer, manual pressure can mask CL shortening, and bladder filling can elongate CL.7 Cost-effectiveness studies show that TVU CL screening is more effective, and less costly, compared with TAU CL screening, even in singletons without a prior sPTB.8
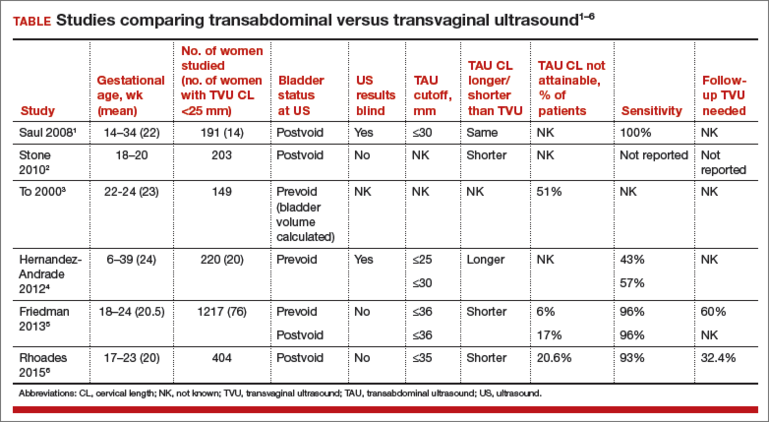
Societies such as ACOG and SMFM all have recommended TVU CL for prediction and prevention of PTB, over TAU CL.9,10 Importantly, a TVU CL should be done by sonographers educated and trained formally, through such programs as those made available by SMFM.11
What this evidence means for practice
If CL assessment is done, TVU should be preferred, as it is the gold standard, and not TAU.
>>Vincenzo Berghella, MD
Share your thoughts on this article! Send your Letter to the Editor to [email protected]. Please include your name and the city and state in which you practice.
- Saul LL, Kurtzman JT, Hagemann C, Ghamsary M, Wing DA. Is transabdominal sonography of the cervix after voiding a reliable method of cervical length assessment? J Ultrasound Med. 2008;27(9):1305−1311.
- Stone PR, Chan EH, McCowan LM, Taylor RS, Mitchell JM; SCOPE Consortium. Aust N Z J Obstet Gynaecol. 2010;50(6):523−527.
- To MS, Skentou C, Cicero S, Nicolaides KH. Cervical assessment at the routine 23-weeks’ scan: problems with transabdominal sonography. Ultrasound Obstet Gynecol 2000;15(4):292−296.
- Hernandez-Andrade E, Romero R, Ahn H, et al. Transabdominal evaluation of uterine cervical length during pregnancy fails to identify a substantial number of women with a short cervix. 2012;25(9):1682−1689.
- Friedman AM, Srinivas SK, Parry S, et al. Can transabdominal ultrasound be used as a screening test for short cervical length? Am J Obstet Gynecol. 2013;208(3):190.e1−e7.
- Rhoades JS, Park JM, Stout MJ, Macones GA, Cahill AG, Tuuli MG. Can transabdominal cervical length measurement exclude short cervix? 2015 Nov 2. [Epub ahead of print]
- Berghella V, Bega G, Tolosa JE, Berghella M. Ultrasound assessment of the cervix. Clin Obstet Gynecol. 2003; 46(4):947–623.
- Miller ES, Grobman WA. Cost-effectiveness of transabdominal ultrasound for cervical length screening for preterm birth prevention. Am J Obstet Gynecol. 2013;209(6): 546.e1–e6.
- American College of Obstetricians and Gynecologists. Practice bulletin No. 130: prediction and prevention of preterm birth. Obstet Gynecol. 2012;120(4):964–973.
- Society for Maternal-Fetal Medicine Publications Committee; Berghella V. Progesterone and preterm birth prevention: translating clinical trial data into clinical practice. Am J Obstet Gynecol. 2012;206(5):376–386.
- Cervical Length Education and Review (CLEAR) guidelines. https://clear.perinatalquality.org. Published 2015. Accessed December 15, 2015.
Preterm birth (PTB) remains a major cause of perinatal morbidity and mortality, and so its prediction and prevention are 2 of the most important issues in obstetrics. Cervical length (CL) measured by ultrasound has been shown to be the best predictor; several interventions (vaginal progesterone and cerclage) have been shown to be effective at reducing PTB if a short CL is identified. In fact, both the American College of Obstetricians and Gynecologists (ACOG) and the Society for Maternal-Fetal Medicine (SMFM) recommend CL being measured every 2 weeks from 16 to 23 weeks in singletons with prior spontaneous PTB (sPTB), with cerclage placed for CL less than 25 mm. Moreover, both ACOG and SMFM recommend that “universal CL screening” (CL measured in singletons without a prior sPTB) be considered as a single measurement at about 18 to 23 weeks.
Details of the study
Rhoades and colleagues present data on CL screening done by transabdominal ultrasound (TAU), as an alternative to transvaginal ultrasound (TVU). This study confirms early data:
- TAU cannot visualize CL in several women (20.6%).
- To make sure a high sensitivity (92.9% in this study) is achieved to detect a TVU CL less than 30 mm, a high cutoff (in this case 35 mm) needs to be used with TAU. Nonetheless, 7% of women with a short TVU CL would not be detected, raising clinical and legal issues.
- A high percentage (in this case 32.4%; 103/318) of women screened by TAU would screen positive (TAU CL less than 35 mm) and therefore need to have a TVU anyway.
- Overall, more than 50% (in this study 53%–20.6% because TAU could not visualize CL, and 32.4% because TAU was less than 35 mm) of women having TAU CL screening would need to have TVU anyway! In the largest study comparing TAU to TVU CL screening (TABLE1–6), 66% of women screened by TAU would have to be screened also by TVU.5
There are several other reasons why TVU is considered the gold standard for CL screening, and instead TAU CL should be avoided as possible. All randomized controlled trials that showed benefit from interventions (vaginal progesterone, cerclage, pessary) aimed at decreasing PTB in women with short CL used TVU CL screening and never TAU CL screening. In addition, TAU CL is less accurate than TVU CL screening. On TAU, fetal parts can obscure the cervix, obesity makes it hard to visualize CL, the distance between probe and cervix is longer, manual pressure can mask CL shortening, and bladder filling can elongate CL.7 Cost-effectiveness studies show that TVU CL screening is more effective, and less costly, compared with TAU CL screening, even in singletons without a prior sPTB.8
Societies such as ACOG and SMFM all have recommended TVU CL for prediction and prevention of PTB, over TAU CL.9,10 Importantly, a TVU CL should be done by sonographers educated and trained formally, through such programs as those made available by SMFM.11
What this evidence means for practice
If CL assessment is done, TVU should be preferred, as it is the gold standard, and not TAU.
>>Vincenzo Berghella, MD
Share your thoughts on this article! Send your Letter to the Editor to [email protected]. Please include your name and the city and state in which you practice.
- Saul LL, Kurtzman JT, Hagemann C, Ghamsary M, Wing DA. Is transabdominal sonography of the cervix after voiding a reliable method of cervical length assessment? J Ultrasound Med. 2008;27(9):1305−1311.
- Stone PR, Chan EH, McCowan LM, Taylor RS, Mitchell JM; SCOPE Consortium. Aust N Z J Obstet Gynaecol. 2010;50(6):523−527.
- To MS, Skentou C, Cicero S, Nicolaides KH. Cervical assessment at the routine 23-weeks’ scan: problems with transabdominal sonography. Ultrasound Obstet Gynecol 2000;15(4):292−296.
- Hernandez-Andrade E, Romero R, Ahn H, et al. Transabdominal evaluation of uterine cervical length during pregnancy fails to identify a substantial number of women with a short cervix. 2012;25(9):1682−1689.
- Friedman AM, Srinivas SK, Parry S, et al. Can transabdominal ultrasound be used as a screening test for short cervical length? Am J Obstet Gynecol. 2013;208(3):190.e1−e7.
- Rhoades JS, Park JM, Stout MJ, Macones GA, Cahill AG, Tuuli MG. Can transabdominal cervical length measurement exclude short cervix? 2015 Nov 2. [Epub ahead of print]
- Berghella V, Bega G, Tolosa JE, Berghella M. Ultrasound assessment of the cervix. Clin Obstet Gynecol. 2003; 46(4):947–623.
- Miller ES, Grobman WA. Cost-effectiveness of transabdominal ultrasound for cervical length screening for preterm birth prevention. Am J Obstet Gynecol. 2013;209(6): 546.e1–e6.
- American College of Obstetricians and Gynecologists. Practice bulletin No. 130: prediction and prevention of preterm birth. Obstet Gynecol. 2012;120(4):964–973.
- Society for Maternal-Fetal Medicine Publications Committee; Berghella V. Progesterone and preterm birth prevention: translating clinical trial data into clinical practice. Am J Obstet Gynecol. 2012;206(5):376–386.
- Cervical Length Education and Review (CLEAR) guidelines. https://clear.perinatalquality.org. Published 2015. Accessed December 15, 2015.
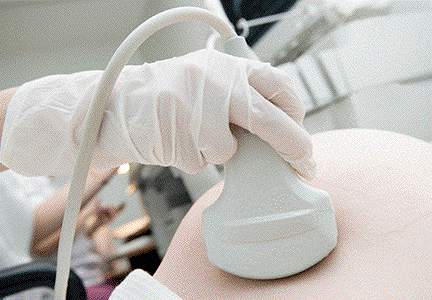
Concerns Grow as Top Clinicians Choose Nonclinical Roles
On a spring day a couple of years ago, I met with some internal medicine residents in a “Healthcare Systems Immersion” elective. I was to provide thoughts about the nonclinical portion of my work that I spend consulting with other hospitalist groups.

I asked for their thoughts about whether the ranks of doctors providing direct bedside care were losing too many of the most talented clinicians to nonclinical roles. The most vocal resident was confident that was not the case; these doctors would ultimately have a positive impact on the care of larger numbers of patients through administrative work than through direct patient care.
I wonder if she is right.
Numerous Hospitalists Opt for Nonnclinical Work
It seems like lots of hospitalists are transitioning to nonclinical work. My experience is that most who have administrative or other nonclinical roles continue—for part of their time—to provide direct patient care. But some leave clinical work behind altogether. Some of them are very prominent people in our field, like the top physician at CMS, the current U.S. Surgeon General, and this year’s most influential physician executive as judged by Modern Healthcare. I think it is pretty cool that these people come from our specialty.
I couldn’t find published survey data on the portion of hospitalists, or doctors in any specialty, who have entirely (or almost entirely) nonclinical roles. My impression is that this was a vanishingly small number across all specialties 30 or 40 years ago, but it seems to have increased pretty dramatically in the last 10 years. At the start of my career, few hospitals had a physician in an administrative position. Now it is common.
Physician leadership roles now include information technology (CMIO), quality (CQO), leader of the employed physician group, and hospital CEO (at least two hospitalists I know are in this role). And there are lots of nonclinical roles for doctors outside of hospitals.
Pros, Cons for Healthcare
I’ve had mixed feelings watching many people leave clinical practice. Most of them, like those mentioned above, continue to make important contributions to our healthcare system; they improve the services and care patients receive. Yet it seems like some of the best clinicians are taken from active practice and are difficult to replace.
At the start of my career, the few doctors who left clinical practice for nonclinical work tended to do so late in their careers. Now many make this choice very early in their careers. Of the six or seven residents I met with above, several planned to pursue entirely nonclinical work either immediately upon completing residency or after just a few years of clinical practice. They were at one of the top internal medicine programs in the country and will, presumably, provide direct clinical care to a really small number of patients over their careers.
It makes me wonder if there is a meaningful effect of more talented people having, and exercising, the option to leave clinical practice, resulting in a tilt toward somewhat-less-talented doctors left to treat patients. I hope there is no meaningful effect in this direction, but I’m not sure.
Reasons to Move
My experience is that most doctors who have left clinical work will wax eloquent about how they really loved it and weren’t fleeing it but did so because they wanted to “try something new” or contribute to healthcare in other ways. I’m suspicious that for many of them this isn’t entirely true. Some must have been fleeing it. They were burned out, tired of being on call, and so on, and were eager to find relief from clinical work more than they were “drawn to a new career challenge.” They just don’t want to admit it.
I sometimes think about what several nationally prominent hospitalist leaders have said to me over my career. Not long ago, one said, “Wow. You’re still seeing patients and making rounds? I can’t believe it. You need to find something better.”
This doctor seemed to equate an entire career spent in clinical practice as something done mostly by those who aren’t talented enough to have other options. What a change from 30 or 40 years ago.
Several years ago, in a very moving conversation, another nationally prominent hospitalist leader told me, “It’s all about the patient and how we care for them at the bedside. There’s no better way we can spend our time.”
The Best Career
Within a few years, he left clinical practice entirely, even though he was still mid-career.
I hold in highest esteem hospitalists and other doctors who spend a full career in direct patient care and do it well. At the top of that list is my own dad, who is up there with Osler when it comes to dedicated physicians.
Of course, those who spend most or all of their time in nonclinical work really can make important contributions that help the healthcare system better serve patients, in some cases clearly making a bigger difference for more patients than they could via direct clinical care. We need talented people in both roles, but we also need to always be looking for ways to minimize the numbers of doctors who feel the need to flee a clinical career.
Like many hospitalists, I think about these things a lot when making decisions about my own career. I hope we all have the wisdom to make the best choices for ourselves, and for the patients we set out to serve when we entered medical school. TH
On a spring day a couple of years ago, I met with some internal medicine residents in a “Healthcare Systems Immersion” elective. I was to provide thoughts about the nonclinical portion of my work that I spend consulting with other hospitalist groups.
I asked for their thoughts about whether the ranks of doctors providing direct bedside care were losing too many of the most talented clinicians to nonclinical roles. The most vocal resident was confident that was not the case; these doctors would ultimately have a positive impact on the care of larger numbers of patients through administrative work than through direct patient care.
I wonder if she is right.
Numerous Hospitalists Opt for Nonnclinical Work
It seems like lots of hospitalists are transitioning to nonclinical work. My experience is that most who have administrative or other nonclinical roles continue—for part of their time—to provide direct patient care. But some leave clinical work behind altogether. Some of them are very prominent people in our field, like the top physician at CMS, the current U.S. Surgeon General, and this year’s most influential physician executive as judged by Modern Healthcare. I think it is pretty cool that these people come from our specialty.
I couldn’t find published survey data on the portion of hospitalists, or doctors in any specialty, who have entirely (or almost entirely) nonclinical roles. My impression is that this was a vanishingly small number across all specialties 30 or 40 years ago, but it seems to have increased pretty dramatically in the last 10 years. At the start of my career, few hospitals had a physician in an administrative position. Now it is common.
Physician leadership roles now include information technology (CMIO), quality (CQO), leader of the employed physician group, and hospital CEO (at least two hospitalists I know are in this role). And there are lots of nonclinical roles for doctors outside of hospitals.
Pros, Cons for Healthcare
I’ve had mixed feelings watching many people leave clinical practice. Most of them, like those mentioned above, continue to make important contributions to our healthcare system; they improve the services and care patients receive. Yet it seems like some of the best clinicians are taken from active practice and are difficult to replace.
At the start of my career, the few doctors who left clinical practice for nonclinical work tended to do so late in their careers. Now many make this choice very early in their careers. Of the six or seven residents I met with above, several planned to pursue entirely nonclinical work either immediately upon completing residency or after just a few years of clinical practice. They were at one of the top internal medicine programs in the country and will, presumably, provide direct clinical care to a really small number of patients over their careers.
It makes me wonder if there is a meaningful effect of more talented people having, and exercising, the option to leave clinical practice, resulting in a tilt toward somewhat-less-talented doctors left to treat patients. I hope there is no meaningful effect in this direction, but I’m not sure.
Reasons to Move
My experience is that most doctors who have left clinical work will wax eloquent about how they really loved it and weren’t fleeing it but did so because they wanted to “try something new” or contribute to healthcare in other ways. I’m suspicious that for many of them this isn’t entirely true. Some must have been fleeing it. They were burned out, tired of being on call, and so on, and were eager to find relief from clinical work more than they were “drawn to a new career challenge.” They just don’t want to admit it.
I sometimes think about what several nationally prominent hospitalist leaders have said to me over my career. Not long ago, one said, “Wow. You’re still seeing patients and making rounds? I can’t believe it. You need to find something better.”
This doctor seemed to equate an entire career spent in clinical practice as something done mostly by those who aren’t talented enough to have other options. What a change from 30 or 40 years ago.
Several years ago, in a very moving conversation, another nationally prominent hospitalist leader told me, “It’s all about the patient and how we care for them at the bedside. There’s no better way we can spend our time.”
The Best Career
Within a few years, he left clinical practice entirely, even though he was still mid-career.
I hold in highest esteem hospitalists and other doctors who spend a full career in direct patient care and do it well. At the top of that list is my own dad, who is up there with Osler when it comes to dedicated physicians.
Of course, those who spend most or all of their time in nonclinical work really can make important contributions that help the healthcare system better serve patients, in some cases clearly making a bigger difference for more patients than they could via direct clinical care. We need talented people in both roles, but we also need to always be looking for ways to minimize the numbers of doctors who feel the need to flee a clinical career.
Like many hospitalists, I think about these things a lot when making decisions about my own career. I hope we all have the wisdom to make the best choices for ourselves, and for the patients we set out to serve when we entered medical school. TH

Expert shares ‘recipe’ for kidney stone disease
SAN DIEGO – The prevalence of kidney stone disease appears to be rising in the United States.
According to an analysis of responses from the 2007-2012 National Health and Nutrition Examination Survey (NHANES), 8.8% of people in the United States have kidney stone disease (Eur Urol. 2012 Jul;62[1]:160-5), up from a prevalence of 5.2% observed in the 1988-1994 NHANES.

“There’s also been a marked increase in emergency room visits for kidney stones: 91% between 1994 and 2006,” Dr. Anna L. Zisman said at the meeting sponsored by the American Society of Nephrology.
“Unfortunately, it doesn’t only affect adults. There has been an increased incidence in ER visits for kids as well.” Though good national data on the incidence of kidney stone disease in children are lacking, one study conducted in South Carolina found that the incidence of ER visits in children rose from 8 per 100,000 in 1996 to more than 18 per 100,000 in 2007 (J Pediatr. 2010 Jul;157[1]:132-7).
What’s driving these increases? Dr. Zisman, a nephrologist at the University of Chicago, discussed a “recipe” for how to create a kidney stone, with heredity as the first step.
“Pick your parents well,” she said. “The familial clustering index is higher for nephrolithiasis than for diabetes and hypertension. A family history of stone disease is present in 16%-37% of stone formers, compared with 4%-12% of healthy controls. And the heritability estimates – how much of a given disease or trait can be attributable to genetic predisposition – is somewhere between 46% and 63%.”
According to Mayo Clinic researchers, heritable traits for kidney stone disease based on 24-hour urine measurements, adjusted for diet, include calcium, magnesium, pH, and citrate (Clin J Am Soc Nephrol. 2014 May;9[5]:943-50).
“Hypercalciuria is the most well-established risk factor for stone disease,” Dr. Zisman said. “Up to 50% of subjects with stones have a history of hypercalciuria, and 43% of first-degree relatives of hypercalciuric patients have hypercalciuria.”
Race and gender are two factors people can’t control in their risk for kidney stone disease. NHANES data suggest that non-Hispanic whites are at highest risk for stone formation, compared with Hispanics and non-Hispanic blacks. However, among whites and all of the racial categories, males have a higher risk than females.
Step two in the recipe for stone formation is timing: Age matters.
According to an analysis of 49,976 men who participated in the Health Professionals Follow-Up Study, the highest risk of stone formation was in male patients in their 40s (J Am Soc Nephrol. 2004 Dec;15[12]:3225-32). By the time white males reach their 70s, the prevalence is almost 19%, while the prevalence for white women in their 70s is 9.4% (Eur Urol. 2012 Jul;62[1]:160-5).
Step three in the recipe is location. According to Dr. Zisman, the prevalence of kidney stone disease across the world is quite varied. “That likely has to do with both genetic predispositions as well as environmental factors,” she noted. “For example, Iran, which has a pretty warm climate, has a prevalence of 5.7%, Greece 15.2%, whereas Argentina only 4%. In the United States, data suggest that the highest incidence of stone disease is in the south. It is suspected that this is due to more men working outside in manual labor in the heat, but that’s just a hypothesis.”
Step four in the recipe involves the role of certain nutrients. For example, a higher daily calcium intake is associated with a lower risk of kidney stone formation. “The theory is that with higher dietary calcium, your urine oxalate tends to drop,” she said. Increased intake of magnesium, protein, potassium, and fluid are also associated with decreased stone formation.
On the other hand, a higher daily vitamin C intake is associated with an increased risk of stone formation. Specifically, a daily intake of more than 1,000 mg confers a 41% increased risk, compared with a lower intake. “The theory there is that vitamin C intake, once absorbed, results in a higher urine oxalate,” Dr. Zisman said.
Current epidemiology literature draws no clear association between a high-sodium diet and the development of kidney stones. From a clinical standpoint, however, “I think everyone would recommend a low-sodium diet because of the physiologic mechanisms leading to higher urine calcium,” she said.
Higher body mass index and increased waist circumference also impact the risk of developing kidney stones, especially among women. “The higher [they are], the greater the risk,” Dr. Zisman said. “We know that as weight goes up, urinary pH drops. Another potential reason is that as body weight goes up, urinary oxalate goes up as well.”
Step five in the recipe for stone formation is occupation. A study from Israel found that lifeguards in that country faced about a 20-fold increased risk of kidney stones, compared with that of the general population (Adv Exp Med Biol. 1980;128:467-72). Meanwhile, a study of glass factory workers in Italy found that the prevalence of kidney stones was 8.5% among those exposed to blast furnace sites, compared with 2.4% among those who worked in ambient temperatures (P = .03) (J Urol 1993 Dec;150[6]:1757-60). A similar finding was observed in a more recent study of steel factory workers in Brazil (Urology 2005;65[5]:858-61).
Variations to the “recipe” for kidney stones include certain genetic diseases such as primary hyperoxaluria and Dent disease; anatomic variations such as horseshoe kidney and ileal conduits; coexisting disease such as inflammatory bowel disease and primary hyperparathyroidism; and effects from medication such as acetazolamide/topiramate and prednisone.
“Mix up genetic predisposition, environmental factors, and dietary/lifestyle factors and add the magic ingredient,” Dr. Zisman concluded. “There is something that is affecting some people and not others. We don’t know what that is, and we clearly need more research.”
Dr. Zisman reported having no financial disclosures.
SAN DIEGO – The prevalence of kidney stone disease appears to be rising in the United States.
According to an analysis of responses from the 2007-2012 National Health and Nutrition Examination Survey (NHANES), 8.8% of people in the United States have kidney stone disease (Eur Urol. 2012 Jul;62[1]:160-5), up from a prevalence of 5.2% observed in the 1988-1994 NHANES.
“There’s also been a marked increase in emergency room visits for kidney stones: 91% between 1994 and 2006,” Dr. Anna L. Zisman said at the meeting sponsored by the American Society of Nephrology.
“Unfortunately, it doesn’t only affect adults. There has been an increased incidence in ER visits for kids as well.” Though good national data on the incidence of kidney stone disease in children are lacking, one study conducted in South Carolina found that the incidence of ER visits in children rose from 8 per 100,000 in 1996 to more than 18 per 100,000 in 2007 (J Pediatr. 2010 Jul;157[1]:132-7).
What’s driving these increases? Dr. Zisman, a nephrologist at the University of Chicago, discussed a “recipe” for how to create a kidney stone, with heredity as the first step.
“Pick your parents well,” she said. “The familial clustering index is higher for nephrolithiasis than for diabetes and hypertension. A family history of stone disease is present in 16%-37% of stone formers, compared with 4%-12% of healthy controls. And the heritability estimates – how much of a given disease or trait can be attributable to genetic predisposition – is somewhere between 46% and 63%.”
According to Mayo Clinic researchers, heritable traits for kidney stone disease based on 24-hour urine measurements, adjusted for diet, include calcium, magnesium, pH, and citrate (Clin J Am Soc Nephrol. 2014 May;9[5]:943-50).
“Hypercalciuria is the most well-established risk factor for stone disease,” Dr. Zisman said. “Up to 50% of subjects with stones have a history of hypercalciuria, and 43% of first-degree relatives of hypercalciuric patients have hypercalciuria.”
Race and gender are two factors people can’t control in their risk for kidney stone disease. NHANES data suggest that non-Hispanic whites are at highest risk for stone formation, compared with Hispanics and non-Hispanic blacks. However, among whites and all of the racial categories, males have a higher risk than females.
Step two in the recipe for stone formation is timing: Age matters.
According to an analysis of 49,976 men who participated in the Health Professionals Follow-Up Study, the highest risk of stone formation was in male patients in their 40s (J Am Soc Nephrol. 2004 Dec;15[12]:3225-32). By the time white males reach their 70s, the prevalence is almost 19%, while the prevalence for white women in their 70s is 9.4% (Eur Urol. 2012 Jul;62[1]:160-5).
Step three in the recipe is location. According to Dr. Zisman, the prevalence of kidney stone disease across the world is quite varied. “That likely has to do with both genetic predispositions as well as environmental factors,” she noted. “For example, Iran, which has a pretty warm climate, has a prevalence of 5.7%, Greece 15.2%, whereas Argentina only 4%. In the United States, data suggest that the highest incidence of stone disease is in the south. It is suspected that this is due to more men working outside in manual labor in the heat, but that’s just a hypothesis.”
Step four in the recipe involves the role of certain nutrients. For example, a higher daily calcium intake is associated with a lower risk of kidney stone formation. “The theory is that with higher dietary calcium, your urine oxalate tends to drop,” she said. Increased intake of magnesium, protein, potassium, and fluid are also associated with decreased stone formation.
On the other hand, a higher daily vitamin C intake is associated with an increased risk of stone formation. Specifically, a daily intake of more than 1,000 mg confers a 41% increased risk, compared with a lower intake. “The theory there is that vitamin C intake, once absorbed, results in a higher urine oxalate,” Dr. Zisman said.
Current epidemiology literature draws no clear association between a high-sodium diet and the development of kidney stones. From a clinical standpoint, however, “I think everyone would recommend a low-sodium diet because of the physiologic mechanisms leading to higher urine calcium,” she said.
Higher body mass index and increased waist circumference also impact the risk of developing kidney stones, especially among women. “The higher [they are], the greater the risk,” Dr. Zisman said. “We know that as weight goes up, urinary pH drops. Another potential reason is that as body weight goes up, urinary oxalate goes up as well.”
Step five in the recipe for stone formation is occupation. A study from Israel found that lifeguards in that country faced about a 20-fold increased risk of kidney stones, compared with that of the general population (Adv Exp Med Biol. 1980;128:467-72). Meanwhile, a study of glass factory workers in Italy found that the prevalence of kidney stones was 8.5% among those exposed to blast furnace sites, compared with 2.4% among those who worked in ambient temperatures (P = .03) (J Urol 1993 Dec;150[6]:1757-60). A similar finding was observed in a more recent study of steel factory workers in Brazil (Urology 2005;65[5]:858-61).
Variations to the “recipe” for kidney stones include certain genetic diseases such as primary hyperoxaluria and Dent disease; anatomic variations such as horseshoe kidney and ileal conduits; coexisting disease such as inflammatory bowel disease and primary hyperparathyroidism; and effects from medication such as acetazolamide/topiramate and prednisone.
“Mix up genetic predisposition, environmental factors, and dietary/lifestyle factors and add the magic ingredient,” Dr. Zisman concluded. “There is something that is affecting some people and not others. We don’t know what that is, and we clearly need more research.”
Dr. Zisman reported having no financial disclosures.
EXPERT ANALYSIS AT KIDNEY WEEK 2015

Does the Mediterranean diet reduce the risk of breast cancer?
The Mediterranean diet, characterized by an emphasis on plant foods, fish, and olive oil, is known to have cardiovascular benefits. This study by Toledo and colleagues is a secondary analysis of a large randomized trial that assessed the impact of the Mediterranean diet versus a recommended low-fat diet in patients at elevated risk for cardiovascular disease (CVD). The larger trial was stopped after 4.8 years of follow-up, when findings of early cardiovascular benefit became evident.
The 4,282 women in the trial, all of whom were white, were randomly allocated to one of the following groups:
- Mediterranean diet supplemented by EVOO. Participants were given 1 L of EVOO a week for the study duration. At baseline and quarterly thereafter, dieticians ran individual and group sessions. In individual sessions, participants completed a 14-item dietary screening questionnaire to assess adherence to the diet.
- Mediterranean diet supplemented by mixed nuts. Participants were given 30 g of mixed nuts per day (15 g walnuts, 7.5 g hazelnuts, and 7.5 g almonds). They also took part in individual and group sessions at baseline and quarterly thereafter, and completed the same screening questionnaire as the first group.
- A control group. Participants were advised to reduce dietary fat. They also underwent dietary training at the baseline visit and completed the 14-item screener. Thereafter, during the first 3 years of the trial, they received annual mailing of a leaflet explaining the low-fat diet. In 2006, however, the protocol was amended to include personalized advice and quarterly group sessions, with use of a separate 9-item dietary screener. The control group also received gifts of nonfood items as incentives.
Physical activity was not promoted in any group.
Findings of the trialAfter a median follow-up of 4.8 years, 35 confirmed cases of invasive breast cancer occurred among participants in the trial, who ranged in age from 60 to 80 years. The observed rate (per 1,000 person-years) of breast cancer was 1.1 for women following the Mediterranean diet supplemented with EVOO, 1.8 for women on the diet supplemented by mixed nuts, and 2.9 for the control group.
Women allocated to the Mediterranean diet with EVOO had a 62% reduced risk of invasive breast cancer (95% confidence interval [CI], 0.16–0.87). Women allocated to the same diet with mixed nuts had a 38% reduced risk of breast cancer, but this finding was not statistically significant.
Note that women in the control group failed to reduce their total fat intake substantially, even though they were advised to do so, although saturated fat intake remained below 10%.
Strengths and limitations of the trialAlthough the incidence of breast cancer is lower in Mediterranean countries, this is the first randomized trial to assess the impact of the Mediterranean diet on risk of this disease.
Because breast cancer was not the primary outcome, investigators were unable to verify if or when participants underwent mammography screening. However, randomization resulted in large groups of participants between whom mammographic status likely was comparable.
The lack of ethnic diversity represents another limitation.
Toledo and colleagues describe differences between olive oils in general and EVOO, including biologic mechanisms that might result in breast cancer prophylaxis.
WHAT THIS EVIDENCE MEANS FOR PRACTICEGiven the known cardiovascular benefits, it is reasonable to suggest to our menopausal patients that a Mediterranean diet with EVOO may reduce their risk of breast cancer.
—Andrew M. Kaunitz, MD
Share your thoughts on this article! Send your Letter to the Editor to [email protected]. Please include your name and the city and state in which you practice.
46 experts pen open letter to the FDA on uterine power morcellation
As gynecologists are well aware, in November 2014, the FDA issued a safety communication, warning “against the use of laparoscopic power morcellators in the majority of women undergoing myomectomy or hysterectomy for treatment of fibroids.” Now, a group of 46 experts in gynecologic surgery, including Dr. Eva Chalas, question the FDA’s decision and provide their own clinical recommendations for FDA consideration.
In this interview with Dr. Chalas, she discusses:
|
Reference
- US Food and Drug Administration. Updated: Laparoscopic Uterine Power Morcellation in Hysterectomy and Myomectomy: FDA Safety Communication. November 24, 2014. http://www.fda.gov/MedicalDevices/Safety/AlertsandNotices/ucm424443.htm. Accessed November 19, 2015.
As gynecologists are well aware, in November 2014, the FDA issued a safety communication, warning “against the use of laparoscopic power morcellators in the majority of women undergoing myomectomy or hysterectomy for treatment of fibroids.” Now, a group of 46 experts in gynecologic surgery, including Dr. Eva Chalas, question the FDA’s decision and provide their own clinical recommendations for FDA consideration.
In this interview with Dr. Chalas, she discusses:
|
Reference
- US Food and Drug Administration. Updated: Laparoscopic Uterine Power Morcellation in Hysterectomy and Myomectomy: FDA Safety Communication. November 24, 2014. http://www.fda.gov/MedicalDevices/Safety/AlertsandNotices/ucm424443.htm. Accessed November 19, 2015.
Reference
- US Food and Drug Administration. Updated: Laparoscopic Uterine Power Morcellation in Hysterectomy and Myomectomy: FDA Safety Communication. November 24, 2014. http://www.fda.gov/MedicalDevices/Safety/AlertsandNotices/ucm424443.htm. Accessed November 19, 2015.

Annual screening mammography beginning at age 40 saves the most lives
With the recent publication of new American Cancer Society (ACS) guidelines on breast cancer screening,1 we finally have achieved a consensus. All major organizations, including the US Preventive Services Task Force (USPSTF), agree that the most lives are saved by annual screening beginning at age 40. This is the only science-backed finding of their reviews.
Here is a statement from the USPSTF: “[We] found adequate evidence that mammography screening reduces breast cancer mortality in women ages 40 to 74 years.”2 And from the ACS: “Women should have the opportunity to begin annual screening between the ages of 40 and 44 years.”1
Regrettably, the USPSTF, whose guidelines determine insurance coverage, endangers women by going on to suggest that they can wait until the age of 50 to begin screening and then wait a full 2 years between screens.
The new ACS guidelines have been misreported as recommending the initiation of annual screening at age 45, moving to biennial screening at the age of 55. This misunderstanding arose because the ACS describes annual screening starting at age 40 as a “qualified recommendation.” However, it defines this qualified recommendation as meaning that “The majority of individuals in this situation would want the suggested course of action, but many would not.”1
Why would screening guidelines be based on “what many [women] would not” choose? No one forces women at any age to participate in screening. Each woman, regardless of age, should choose for herself whether or not to participate in screening. In fact, the ACS panel provides no data on what screening option women would prefer. Members of the ACS and USPSTF panels, none of whom provides care for women with breast cancer, injected their own personal biases to qualify what the scientific evidence shows by claiming to have “weighed” benefits against “harms.” Yet they provide no description of the scale that was used. They state only that there are 2 major harms: “false positives” and “overdiagnosis.”
“False positive” is a misnomerRecalls from screening have been called, pejoratively, “false positives,” leading some to believe that women are being told that they have breast cancer when they do not. In reality, most recalled women ultimately are told that there is no reason for concern.
Approximately 10% of US women who undergo screening mammography are recalled—the same percentage as for Pap testing.3 (The ACS and USPSTF panels ignore the benefit for the 90% of women who are reassured by a negative screen.)
Among the women recalled, more than half are told that everything is fine, based on a few extra pictures or an ultrasound. Approximately 25% (2.5% of those screened) are asked to return in 6 months just to be careful, and approximately 20% (2% of women screened) will be advised to undergo imaging-guided needle biopsy using local anesthesia. Among these women, 20% to 40% will be found to have cancer.4
This figure is much higher than in the past, when women had “lumps” surgically removed, only 15% of which were cancer. Most of these lesions were larger and less likely to be cured than screen-detected cancers.5
Panels fail to justify breast cancer deaths that would occur with proposed screening intervalsThe main reason the ACS and USPSTF panels decided to compromise on their recommendations was to try to reduce the number of recalls, yet they never explain how many fewer recalls are equivalent to allowing a death that could have been avoided by annual screening starting at age 40.
The National Cancer Institute’s Cancer Intervention and Surveillance Modeling Network (CISNET)—used by both panels—shows that, if women in their 40s wait until age 50 and then are screened every 2 years (as the USPSTF recommends), as many as 100,000 lives will be lost that could have been saved by annual screening starting at age 40.6 If women wait until age 45 to begin annual screening and then shift to biennial screening at age 55 (as the ACS recommends), more than 38,000 women now in their 40s will die, unnecessarily, as a result.7
Neither panel states how many recalls avoided are equivalent to allowing so many avoidable, premature deaths.
No invasive cancers resolve spontaneouslyThe other alleged harm of screening is “overdiagnosis”—the exaggerated suggestion that mammography screening finds tens of thousands of breast cancers each year that, if left undetected, would disappear on their own.8,9 Such analyses have been shown to be scientifically unsupportable.10–13 In fact, no one has ever seen an invasive breast cancer disappear on its own without therapy. The claim is tens of thousands each year, yet no one has seen a single case.
There certainly are legitimate questions about the need to treat all cases of ductal carcinoma in situ (DCIS). However, if an invasive breast cancer is found during screening and then left alone, it will grow to become a palpable cancer, with lethal capability.
Here are the proven facts about breast cancer screening
- The most lives are saved when annual screening begins at age 40. This fact has been proven by randomized, controlled trials.14,15 All of the data models in CISNET agree that the most lives are saved by annual screening beginning at age 40.16
- There is no scientific or biological reason to use the age of 50 as a threshold for screening. None of the parameters of screening changes abruptly at age 50—or any other age.17
- More than 30,000 new cases of breast cancer occur each year among women in their 40s.18
- More than 40% of years of life lost to breast cancer are among women diagnosed in their 40s.19 The ACS found that the years of life lost to breast cancer for women aged 40 to 44 are the same as for women aged 55 to 59.2
- Despite access to modern therapies, numerous observational studies show that when screening is introduced into the population, the breast cancer death rate goes down, in relation to participation in screening, for women aged 40 and older.20–35
- In the 2 largest Harvard teaching hospitals, more than 70% of women who died from breast cancer were among the 20% who were not participating in screening, including women in their 40s, despite the fact that all had access to modern therapies.36 It is likely that many of the 40,000 women who still die in the United States each year, despite improvements in therapy, were also not participating in screening.
- The death rate from breast cancer remained unchanged from 1940 until screening began in the mid-1980s. Soon after, in 1990, the rate began to fall for the first time in 50 years. Today, 36% fewer women die each year from breast cancer.37 Men with breast cancer have access to the same therapies but, in 1990, the death rate for men began to increase as it began to fall for women. The death rate for men remained elevated until 2005 and then returned to 1990 levels, where it has remained, as the death rate for women has continued to decline.38 Women are being screened, whereas men present with larger and later-stage cancers. Therapy has improved, but the most lives are saved when breast cancer is treated early.
Why not screen only high-risk women? It has been suggested that only high-risk women should participate in screening. However, women who inherit a genetic predisposition account for only about 10% of breast cancers each year.39 If we add to that number other women with family histories or other known risk factors, these cases account for another 15% of cancers.40
Regrettably, high-risk women account for only a quarter of breast cancers diagnosed each year. If only high-risk women are screened, the vast majority of women who develop breast cancer (75%) will not benefit from early detection.
The bottom line Mammography is not perfect. It does not find all cancers and does not find all cancers early enough for a cure. However, there is no universal cure on the horizon, while screening is available today and is saving thousands of lives each year.
All women should have access to, and be encouraged to participate in, annual screening starting at age 40.
Share your thoughts on this article! Send your Letter to the Editor to [email protected]. Please include your name and the city and state in which you practice.
- Oeffinger KC, Fontham ET, Etzioni R, et al. Breast cancer screening for women at average risk. 2015 guideline update from the American Cancer Society. JAMA. 2015;314(15):1599–1614.
- U.S. Preventive Services Task Force. Draft Recommendation Statement. Breast Cancer: Screening [Web page]. Rockville, MD: USPSTF Program Office; 2015. http://www.uspreventiveservicestaskforce.org/Page/Document/RecommendationStatementDraft/breast-cancer-screening1. Accessed November 11, 2015.
- Saraiya M, Irwin KL, Carlin L, et al. Cervical cancer screening and management practices among providers in the National Breast and Cervical Cancer Early Detection Program (NBCCEDP). Cancer. 2007;110(5):1024–1032.
- Rosenberg RD, Yankaskas BC, Abraham LA, et al. Performance benchmarks for screening mammography. Radiology. 2006;241(1):55–66.
- Spivey GH, Perry BW, Clark VA, et al. Predicting the risk of cancer at the time of breast biopsy. Am Surg.1982;48(7):326–332.
- Hendrick RE, Helvie MA. USPSTF Guidelines on screening mammography recommendations: science ignored. Am J Roentgenol. 2011; 196(2): W112–116.
- Based on CISNET models. Personal communication: R. Edward Hendrick, PhD.
- Jorgensen KJ, Gotzsche PC. Overdiagnosis in publicly organised mammography screening programmes: systematic review of incidence trends. BMJ. 2009;339:b2587.
- Bleyer A, Welch HG. Effect of three decades of screening mammography on breast-cancer incidence. N Engl J Med. 2012;367(21):1998–2005.
- Puliti D, Duffy SW, Miccinesi G, et al; EUROSCREEN Working Group. Overdiagnosis in mammographic screening for breast cancer in Europe: a literature review. J Med Screen. 2012;19(suppl 1):42–56.
- Kopans DB. Arguments against mammography screening continue to be based on faulty science. Oncologist. 2014;19(2):107–112.
- Helvie MA, Chang JT, Hendrick RE, Banerjee M. Reduction in late-stage breast cancer incidence in the mammography era: implications for overdiagnosis of invasive cancer. Cancer. 2014;120(17):2649–2656.
- Etzioni R, Xia J, Hubbard R, Weiss NS, Gulati R. A reality check for overdiagnosis estimates associated with breast cancer screening. J Natl Cancer Inst. 2014;106(12). doi: 10.1093/jnci/dju315.
- Duffy SW, Tabar L, Smith RA. The mammographicscreening trials: commentary on the recent work by Olsen and Gotzsche. CA Cancer J Clin. 2002;52(2):68–71.
- Hendrick RE, Smith RA, Rutledge JH, Smart CR. Benefit of screening mammography in women ages 40-49: a new meta-analysis of randomized controlled trials. J Natl Cancer Inst Monogr. 1997;22:87–92.
- Mandelblatt JS, Cronin KA, Bailey S, et al; Breast Cancer Working Group of the Cancer Intervention and Surveillance Modeling Network. Effects of mammography screening under different screening schedules: model estimates of potential benefits and harms. Ann Intern Med. 2009;151(10):738–747.
- Kopans DB, Moore RH, McCarthy KA, et al. Biasing the interpretation of mammography screening data by age grouping: nothing changes abruptly at age 50. Breast J. 1998;4(3):139–145.
- US Census Bureau. 2000 Census Summary File 1 and 2010 Census Summary File 1 show 21,996,493 women ages 40-49 and SEER shows 95.5 cancers per 100,000 for these women, which means 34,578 cancers.
- Shapiro S. Evidence on screening for breast cancer from a randomized trial. Cancer. 1977;39(6 suppl):2772–2278.
- Tabar L, Vitak B, Tony HH, Yen MF, Duffy SW, Smith RA. Beyond randomized controlled trials: organized mammographic screening substantially reduces breast carcinoma mortality. Cancer. 2001;91(9):1724–1731.
- Kopans DB. Beyond randomized, controlled trials: organized mammographic screening substantially reduces breast cancer mortality. Cancer. 2002;94(2):580–581.
- Duffy SW, Tabar L, Chen H, et al. The impact of organized mammography service screening on breast carcinoma mortality in seven Swedish counties. Cancer. 2002;95(3):458–469.
- Otto SJ, Fracheboud J, Looman CWN, et al; National Evaluation Team for Breast Cancer Screening. Initiation of population-based mammography screening in Dutch municipalities and effect on breast-cancer mortality: a systematic review. Lancet. 2003;361(9367):411–417.
- Swedish Organised Service Screening Evaluation Group. Reduction in breast cancer mortality from organized service screening with mammography: 1. Further confirmation with extended data. Cancer Epidemiol Biomarkers Prev. 2006;15(1):45–51.
- Coldman A, Phillips N, Warren L, Kan L. Breast cancer mortality after screening mammography in British Columbia women. Int J Cancer. 2007;120(5):1076–1080.
- Jonsson H, Bordás P, Wallin H, Nyström L, Lenner P. Service screening with mammography in Northern Sweden: effects on breast cancer mortality—an update. J Med Screen. 2007;14(2):87–93.
- Paap E, Holland R, den Heeten GJ, et al. A remarkable reduction of breast cancer deaths in screened versus unscreened women: a case-referent study. Cancer Causes Control. 2010;21(10):1569–1573.
- Otto SJ, Fracheboud J, Verbeek ALM, et al; National Evaluation Team for Breast Cancer Screening. Mammography screening and risk of breast cancer death: a population-based case– control study. Cancer Epidemiol Biomarkers Prev. 2012;21(1):66–73.
- van Schoor G, Moss SM, Otten JD, et al. Increasingly strong reduction in breast cancer mortality due to screening. Br J Cancer. 2011;104(6):910–914.
- Mandelblatt JS, Cronin KA, Bailey S, et al; Breast Cancer Working Group of the Cancer Intervention and Surveillance Modeling Network. Effects of mammography screening under different screening schedules: model estimates of potential benefits and harms. Ann Intern Med. 2009;151(10):738–747.
- Hellquist BN, Duffy SW, Abdsaleh S, et al. Effectiveness of population-based service screening with mammography for women ages 40 to 49 years: evaluation of the Swedish Mammography Screening in Young Women (SCRY) cohort. Cancer. 2011;117(4):714–722.
- Broeders M, Moss S, Nyström L, et al; EUROSCREEN Working Group. The impact of mammographic screening on breast cancer mortality in Europe: a review of observational studies. J Med Screen. 2012;19(suppl 1):14–25.
- Hofvind S, Ursin G, Tretli S, Sebuødegård S, Møller B. Breast cancer mortality in participants of the Norwegian Breast Cancer Screening Program. Cancer. 2013;119(17):3106–3112.
- Sigurdsson K, Olafsdóttir EJ. Population-based service mammography screening: the Icelandic experience. Breast Cancer (Dove Med Press). 2013;5:17–25.
- Coldman A, Phillips N, Wilson C, et al. Pan- Canadian study of mammography screening and mortality from breast cancer. J Natl Cancer Inst. 2014;106(11):dju261.
- Webb ML, Cady B, Michaelson JS, et al. A failure analysis of invasive breast cancer: most deaths from disease occur in women not regularly screened. Cancer. 2014;120(18):2839–2846.
- DeSantis CE, Fedewa SA, Goding Sauer A, Kramer JL, Smith RA, Jemal A. Breast cancer statistics, 2015: Convergence of incidence rates between black and white women. CA Cancer J Clin. 2015 Oct 29. doi: 10.3322/caac.21320.
- National Cancer Institute. Surveillance, Epidemiology, and End Results Program. http://seer.cancer.gov/archive/csr/1975_2010/browse_csr.php?sectionSEL=4&pageSEL=sect_04_table.06.html. Accessed November 16, 2015.
- Claus EB, Schildkraut JM, Thompson WD, Risch NJ. The genetic attributable risk of breast and ovarian cancer. Cancer. 1996;77(11):2318–2324.
- Seidman H, Stellman SD, Mushinski MH. A different perspective on breast cancer risk factors: some implications of nonattributable risk. Cancer. 1982;32(5):301–313.

Dr. Kopans is Professor of Radiology at Harvard Medical School and Senior Radiologist in the Breast Imaging Division at Massachusetts General Hospital in Boston, Massachusetts.
Dr. Kopans reports that he receives grant or research support from General Electric and is a consultant to General Electric and Hologic. Massachusetts General Hospital holds his patent on digital breast tomosynthesis.
With the recent publication of new American Cancer Society (ACS) guidelines on breast cancer screening,1 we finally have achieved a consensus. All major organizations, including the US Preventive Services Task Force (USPSTF), agree that the most lives are saved by annual screening beginning at age 40. This is the only science-backed finding of their reviews.
Here is a statement from the USPSTF: “[We] found adequate evidence that mammography screening reduces breast cancer mortality in women ages 40 to 74 years.”2 And from the ACS: “Women should have the opportunity to begin annual screening between the ages of 40 and 44 years.”1
Regrettably, the USPSTF, whose guidelines determine insurance coverage, endangers women by going on to suggest that they can wait until the age of 50 to begin screening and then wait a full 2 years between screens.
The new ACS guidelines have been misreported as recommending the initiation of annual screening at age 45, moving to biennial screening at the age of 55. This misunderstanding arose because the ACS describes annual screening starting at age 40 as a “qualified recommendation.” However, it defines this qualified recommendation as meaning that “The majority of individuals in this situation would want the suggested course of action, but many would not.”1
Why would screening guidelines be based on “what many [women] would not” choose? No one forces women at any age to participate in screening. Each woman, regardless of age, should choose for herself whether or not to participate in screening. In fact, the ACS panel provides no data on what screening option women would prefer. Members of the ACS and USPSTF panels, none of whom provides care for women with breast cancer, injected their own personal biases to qualify what the scientific evidence shows by claiming to have “weighed” benefits against “harms.” Yet they provide no description of the scale that was used. They state only that there are 2 major harms: “false positives” and “overdiagnosis.”
“False positive” is a misnomerRecalls from screening have been called, pejoratively, “false positives,” leading some to believe that women are being told that they have breast cancer when they do not. In reality, most recalled women ultimately are told that there is no reason for concern.
Approximately 10% of US women who undergo screening mammography are recalled—the same percentage as for Pap testing.3 (The ACS and USPSTF panels ignore the benefit for the 90% of women who are reassured by a negative screen.)
Among the women recalled, more than half are told that everything is fine, based on a few extra pictures or an ultrasound. Approximately 25% (2.5% of those screened) are asked to return in 6 months just to be careful, and approximately 20% (2% of women screened) will be advised to undergo imaging-guided needle biopsy using local anesthesia. Among these women, 20% to 40% will be found to have cancer.4
This figure is much higher than in the past, when women had “lumps” surgically removed, only 15% of which were cancer. Most of these lesions were larger and less likely to be cured than screen-detected cancers.5
Panels fail to justify breast cancer deaths that would occur with proposed screening intervalsThe main reason the ACS and USPSTF panels decided to compromise on their recommendations was to try to reduce the number of recalls, yet they never explain how many fewer recalls are equivalent to allowing a death that could have been avoided by annual screening starting at age 40.
The National Cancer Institute’s Cancer Intervention and Surveillance Modeling Network (CISNET)—used by both panels—shows that, if women in their 40s wait until age 50 and then are screened every 2 years (as the USPSTF recommends), as many as 100,000 lives will be lost that could have been saved by annual screening starting at age 40.6 If women wait until age 45 to begin annual screening and then shift to biennial screening at age 55 (as the ACS recommends), more than 38,000 women now in their 40s will die, unnecessarily, as a result.7
Neither panel states how many recalls avoided are equivalent to allowing so many avoidable, premature deaths.
No invasive cancers resolve spontaneouslyThe other alleged harm of screening is “overdiagnosis”—the exaggerated suggestion that mammography screening finds tens of thousands of breast cancers each year that, if left undetected, would disappear on their own.8,9 Such analyses have been shown to be scientifically unsupportable.10–13 In fact, no one has ever seen an invasive breast cancer disappear on its own without therapy. The claim is tens of thousands each year, yet no one has seen a single case.
There certainly are legitimate questions about the need to treat all cases of ductal carcinoma in situ (DCIS). However, if an invasive breast cancer is found during screening and then left alone, it will grow to become a palpable cancer, with lethal capability.
Here are the proven facts about breast cancer screening
- The most lives are saved when annual screening begins at age 40. This fact has been proven by randomized, controlled trials.14,15 All of the data models in CISNET agree that the most lives are saved by annual screening beginning at age 40.16
- There is no scientific or biological reason to use the age of 50 as a threshold for screening. None of the parameters of screening changes abruptly at age 50—or any other age.17
- More than 30,000 new cases of breast cancer occur each year among women in their 40s.18
- More than 40% of years of life lost to breast cancer are among women diagnosed in their 40s.19 The ACS found that the years of life lost to breast cancer for women aged 40 to 44 are the same as for women aged 55 to 59.2
- Despite access to modern therapies, numerous observational studies show that when screening is introduced into the population, the breast cancer death rate goes down, in relation to participation in screening, for women aged 40 and older.20–35
- In the 2 largest Harvard teaching hospitals, more than 70% of women who died from breast cancer were among the 20% who were not participating in screening, including women in their 40s, despite the fact that all had access to modern therapies.36 It is likely that many of the 40,000 women who still die in the United States each year, despite improvements in therapy, were also not participating in screening.
- The death rate from breast cancer remained unchanged from 1940 until screening began in the mid-1980s. Soon after, in 1990, the rate began to fall for the first time in 50 years. Today, 36% fewer women die each year from breast cancer.37 Men with breast cancer have access to the same therapies but, in 1990, the death rate for men began to increase as it began to fall for women. The death rate for men remained elevated until 2005 and then returned to 1990 levels, where it has remained, as the death rate for women has continued to decline.38 Women are being screened, whereas men present with larger and later-stage cancers. Therapy has improved, but the most lives are saved when breast cancer is treated early.
Why not screen only high-risk women? It has been suggested that only high-risk women should participate in screening. However, women who inherit a genetic predisposition account for only about 10% of breast cancers each year.39 If we add to that number other women with family histories or other known risk factors, these cases account for another 15% of cancers.40
Regrettably, high-risk women account for only a quarter of breast cancers diagnosed each year. If only high-risk women are screened, the vast majority of women who develop breast cancer (75%) will not benefit from early detection.
The bottom line Mammography is not perfect. It does not find all cancers and does not find all cancers early enough for a cure. However, there is no universal cure on the horizon, while screening is available today and is saving thousands of lives each year.
All women should have access to, and be encouraged to participate in, annual screening starting at age 40.
Share your thoughts on this article! Send your Letter to the Editor to [email protected]. Please include your name and the city and state in which you practice.
- Oeffinger KC, Fontham ET, Etzioni R, et al. Breast cancer screening for women at average risk. 2015 guideline update from the American Cancer Society. JAMA. 2015;314(15):1599–1614.
- U.S. Preventive Services Task Force. Draft Recommendation Statement. Breast Cancer: Screening [Web page]. Rockville, MD: USPSTF Program Office; 2015. http://www.uspreventiveservicestaskforce.org/Page/Document/RecommendationStatementDraft/breast-cancer-screening1. Accessed November 11, 2015.
- Saraiya M, Irwin KL, Carlin L, et al. Cervical cancer screening and management practices among providers in the National Breast and Cervical Cancer Early Detection Program (NBCCEDP). Cancer. 2007;110(5):1024–1032.
- Rosenberg RD, Yankaskas BC, Abraham LA, et al. Performance benchmarks for screening mammography. Radiology. 2006;241(1):55–66.
- Spivey GH, Perry BW, Clark VA, et al. Predicting the risk of cancer at the time of breast biopsy. Am Surg.1982;48(7):326–332.
- Hendrick RE, Helvie MA. USPSTF Guidelines on screening mammography recommendations: science ignored. Am J Roentgenol. 2011; 196(2): W112–116.
- Based on CISNET models. Personal communication: R. Edward Hendrick, PhD.
- Jorgensen KJ, Gotzsche PC. Overdiagnosis in publicly organised mammography screening programmes: systematic review of incidence trends. BMJ. 2009;339:b2587.
- Bleyer A, Welch HG. Effect of three decades of screening mammography on breast-cancer incidence. N Engl J Med. 2012;367(21):1998–2005.
- Puliti D, Duffy SW, Miccinesi G, et al; EUROSCREEN Working Group. Overdiagnosis in mammographic screening for breast cancer in Europe: a literature review. J Med Screen. 2012;19(suppl 1):42–56.
- Kopans DB. Arguments against mammography screening continue to be based on faulty science. Oncologist. 2014;19(2):107–112.
- Helvie MA, Chang JT, Hendrick RE, Banerjee M. Reduction in late-stage breast cancer incidence in the mammography era: implications for overdiagnosis of invasive cancer. Cancer. 2014;120(17):2649–2656.
- Etzioni R, Xia J, Hubbard R, Weiss NS, Gulati R. A reality check for overdiagnosis estimates associated with breast cancer screening. J Natl Cancer Inst. 2014;106(12). doi: 10.1093/jnci/dju315.
- Duffy SW, Tabar L, Smith RA. The mammographicscreening trials: commentary on the recent work by Olsen and Gotzsche. CA Cancer J Clin. 2002;52(2):68–71.
- Hendrick RE, Smith RA, Rutledge JH, Smart CR. Benefit of screening mammography in women ages 40-49: a new meta-analysis of randomized controlled trials. J Natl Cancer Inst Monogr. 1997;22:87–92.
- Mandelblatt JS, Cronin KA, Bailey S, et al; Breast Cancer Working Group of the Cancer Intervention and Surveillance Modeling Network. Effects of mammography screening under different screening schedules: model estimates of potential benefits and harms. Ann Intern Med. 2009;151(10):738–747.
- Kopans DB, Moore RH, McCarthy KA, et al. Biasing the interpretation of mammography screening data by age grouping: nothing changes abruptly at age 50. Breast J. 1998;4(3):139–145.
- US Census Bureau. 2000 Census Summary File 1 and 2010 Census Summary File 1 show 21,996,493 women ages 40-49 and SEER shows 95.5 cancers per 100,000 for these women, which means 34,578 cancers.
- Shapiro S. Evidence on screening for breast cancer from a randomized trial. Cancer. 1977;39(6 suppl):2772–2278.
- Tabar L, Vitak B, Tony HH, Yen MF, Duffy SW, Smith RA. Beyond randomized controlled trials: organized mammographic screening substantially reduces breast carcinoma mortality. Cancer. 2001;91(9):1724–1731.
- Kopans DB. Beyond randomized, controlled trials: organized mammographic screening substantially reduces breast cancer mortality. Cancer. 2002;94(2):580–581.
- Duffy SW, Tabar L, Chen H, et al. The impact of organized mammography service screening on breast carcinoma mortality in seven Swedish counties. Cancer. 2002;95(3):458–469.
- Otto SJ, Fracheboud J, Looman CWN, et al; National Evaluation Team for Breast Cancer Screening. Initiation of population-based mammography screening in Dutch municipalities and effect on breast-cancer mortality: a systematic review. Lancet. 2003;361(9367):411–417.
- Swedish Organised Service Screening Evaluation Group. Reduction in breast cancer mortality from organized service screening with mammography: 1. Further confirmation with extended data. Cancer Epidemiol Biomarkers Prev. 2006;15(1):45–51.
- Coldman A, Phillips N, Warren L, Kan L. Breast cancer mortality after screening mammography in British Columbia women. Int J Cancer. 2007;120(5):1076–1080.
- Jonsson H, Bordás P, Wallin H, Nyström L, Lenner P. Service screening with mammography in Northern Sweden: effects on breast cancer mortality—an update. J Med Screen. 2007;14(2):87–93.
- Paap E, Holland R, den Heeten GJ, et al. A remarkable reduction of breast cancer deaths in screened versus unscreened women: a case-referent study. Cancer Causes Control. 2010;21(10):1569–1573.
- Otto SJ, Fracheboud J, Verbeek ALM, et al; National Evaluation Team for Breast Cancer Screening. Mammography screening and risk of breast cancer death: a population-based case– control study. Cancer Epidemiol Biomarkers Prev. 2012;21(1):66–73.
- van Schoor G, Moss SM, Otten JD, et al. Increasingly strong reduction in breast cancer mortality due to screening. Br J Cancer. 2011;104(6):910–914.
- Mandelblatt JS, Cronin KA, Bailey S, et al; Breast Cancer Working Group of the Cancer Intervention and Surveillance Modeling Network. Effects of mammography screening under different screening schedules: model estimates of potential benefits and harms. Ann Intern Med. 2009;151(10):738–747.
- Hellquist BN, Duffy SW, Abdsaleh S, et al. Effectiveness of population-based service screening with mammography for women ages 40 to 49 years: evaluation of the Swedish Mammography Screening in Young Women (SCRY) cohort. Cancer. 2011;117(4):714–722.
- Broeders M, Moss S, Nyström L, et al; EUROSCREEN Working Group. The impact of mammographic screening on breast cancer mortality in Europe: a review of observational studies. J Med Screen. 2012;19(suppl 1):14–25.
- Hofvind S, Ursin G, Tretli S, Sebuødegård S, Møller B. Breast cancer mortality in participants of the Norwegian Breast Cancer Screening Program. Cancer. 2013;119(17):3106–3112.
- Sigurdsson K, Olafsdóttir EJ. Population-based service mammography screening: the Icelandic experience. Breast Cancer (Dove Med Press). 2013;5:17–25.
- Coldman A, Phillips N, Wilson C, et al. Pan- Canadian study of mammography screening and mortality from breast cancer. J Natl Cancer Inst. 2014;106(11):dju261.
- Webb ML, Cady B, Michaelson JS, et al. A failure analysis of invasive breast cancer: most deaths from disease occur in women not regularly screened. Cancer. 2014;120(18):2839–2846.
- DeSantis CE, Fedewa SA, Goding Sauer A, Kramer JL, Smith RA, Jemal A. Breast cancer statistics, 2015: Convergence of incidence rates between black and white women. CA Cancer J Clin. 2015 Oct 29. doi: 10.3322/caac.21320.
- National Cancer Institute. Surveillance, Epidemiology, and End Results Program. http://seer.cancer.gov/archive/csr/1975_2010/browse_csr.php?sectionSEL=4&pageSEL=sect_04_table.06.html. Accessed November 16, 2015.
- Claus EB, Schildkraut JM, Thompson WD, Risch NJ. The genetic attributable risk of breast and ovarian cancer. Cancer. 1996;77(11):2318–2324.
- Seidman H, Stellman SD, Mushinski MH. A different perspective on breast cancer risk factors: some implications of nonattributable risk. Cancer. 1982;32(5):301–313.