User login
Poison ivy: How effective are available treatments?
ABSTRACT
Purpose To determine the characteristics and clinical course of Rhus dermatitis in patients who seek assistance from primary care clinicians, as well as treatment approaches used by patients and recommended by clinicians, and treatment approaches associated with better outcomes.
Methods This was a prospective cohort study with standardized baseline data collection on patients and their rashes, followed by examination of patient-completed diaries of signs, symptoms, and treatments.
Results Thirty-six clinicians identified 186 interested patients, of which 89 completed and returned diaries and consent forms. Of those 89 patients, 92% reported pruritus; 91%, erythema; 87%, papules; and 49%, vesicles or bullae at baseline. Their rashes involved the head/face/neck, 61%; trunk, 56%; legs, 54%; and arms, 22%.
From the date of clinical consultation, the mean (standard deviation [SD]; range) duration of any symptom or sign was 14.4 days (8.0; 1-43). Patients most often had tried a topical antipruritic, astringent, or low-potency corticosteroid before seeking care. Clinicians prescribed oral or parenteral corticosteroids 81% of the time, sometimes in combination with a high-potency topical c
Conclusions Patients who visit a primary care clinician for Rhus dermatitis can expect the rash to last another 2 weeks on average (total duration: one day to 6 weeks) regardless of what treatment is prescribed. Parenteral corticosteroids plus high-potency topical corticosteroids may reduce the duration of the itching.
Rhus dermatitis (poison ivy, oak, and sumac) is a common cause of contact dermatitis throughout the United States. The condition is usually mild and often not brought to the attention of primary care clinicians. Some patients, however, do see a health care provider for treatment, most often because of pruritus. This form of contact dermatitis results from a type IV hypersensitivity reaction to urushiol, a colorless oil in the leaves, stem, root, and fruit of poison ivy, poison oak, and poison sumac. The reaction, which occurs 24 to 72 hours following contact with the skin, can be prevented by washing the skin promptly with a detergent soap after exposure. By the age of 8, most people are sensitized to urushiol.1
According to most standard texts and clinical reviews, untreated Rhus dermatitis usually resolves in one to 3 weeks. What is not known is whether particular patient or rash characteristics might affect prognosis and thereby influence treatment recommendations—eg, age, gender, race, location of the rash, prior episodes, chronic illnesses such as diabetes, or chronic use of medications such as nonsteroidal anti-inflammatory drugs and corticosteroids.
Impetus for our study. An informal survey of 10 clinician members of the Oklahoma Physicians Resource/Research Network (OKPRN), a statewide practice-based research network, suggested that primary care clinicians treat between one and 10 patients with poison ivy each week during the spring, summer, and fall (median 2.5). Their reported armamentarium included more than 15 different over-the-counter topical agents, several oral antihistamines, and a variety of topical, oral, and parenteral corticosteroids.
Surprisingly, there is very little published evidence on which to base treatment decisions. Using PubMed and the search terms, Rhus dermatitis, poison ivy, and poison oak, we found only 3 placebo-controlled clinical trials of Rhus dermatitis treatments in the English language literature after 1966. Based on these studies, Zanfel, a mixture of alcohol-soluble and anionic surfactant, may be somewhat effective, but pimecrolimus and jewelweed extract were no more effective than placebo.2-4 There is some evidence that topical corticosteroids are effective only before vesicles appear.5 In one uncontrolled study, intramuscular injection of betamethasone and dexamethasone yielded about a 30% reduction in symptoms within 48 hours.6 Assuming that systemic corticosteroids do produce benefit, however, the most effective dose and duration of treatment have not been determined.7,8
To address some of these gaps in our knowledge base, OKPRN members asked that we undertake a longitudinal cohort study of patients reporting to primary care practices.
METHODS
We conducted this study between May 2010 and October 2014. The project was approved by the University of Oklahoma Health Sciences Center Institutional Review Board. Clinician members of OKPRN were invited to participate in the study via listserv, fax, or letter. We instructed clinicians and office staff to ask patients with Rhus dermatitis if they might be interested in participating in a study, which would require that they keep a symptom diary and would earn them a $20 gift card. Interested patients were given a packet of information, and a member of the research team later called the patients with additional information, including an explanation of informed consent and instructions on completing and returning the diary and written consent form.
Clinicians recorded information about the patient and the rash on a customized template, releasing it to the team after written consent was obtained from the patient. Categories for characterizing the rash were head/face, arms/hands, trunk, and legs/feet. A subset of 5 participating clinicians, selected to include a variety of practice types and patient populations, were also asked to produce, from their billing software, the number of patients and encounters in which poison ivy was addressed in each month of 2013.
On the diary, patients were instructed to record the presence or absence of pruritus, erythema, raised lesions, and vesicles/bullae at the end of each day until the rash resolved, or for 6 weeks following onset of the rash, whichever came first. Patients were asked to mail their diaries to the principal investigator once they were free of symptoms for one week or after 6 weeks from the onset of symptoms, whichever came first.
We asked both patients and clinicians to report medications used before and after the primary care encounter. A member of the research team assigned these medications to one of 12 categories: topical antihistamines, topical soaps (eg, Zanfel or Tecnu), topical astringents, other topical antipruritics, topical aloe vera, topical bleach, low-potency topical corticosteroids, moderate-potency topical corticosteroids, high-potency topical corticosteroids, oral antihistamines, oral corticosteroids, and parenteral corticosteroids.
We used independent T-tests to evaluate associations between baseline variables, patient-initiated treatments, and clinician-initiated treatments and the time to complete resolution of individual signs and symptoms and complete resolution of all signs and symptoms following the clinical encounter. We created additional outcome variables for initial resolution followed by recurrence of itching, erythema, papules, and vesicles. The purpose of these variables was to determine if some treatments were initially effective but without lasting effect.
We used the chi square test to assess associations between clinician-initiated treatments and recurrence of signs or symptoms following initial resolution. To account for chance associations resulting from multiple analyses, we chose to set the level of statistical significance at P=.01. However, because of the lower-than-projected sample size, we chose to also report variables with P<.05 so that the reader could judge the likelihood that a larger sample might have disclosed other important associations.
We assumed that an average of 4 categories of treatment would be tried (eg, topical corticosteroids, systemic corticosteroids, topical antihistamines, and other topical agents), and that the mean number of days until resolution would be 21, with a standard deviation (SD) of 4 days. Setting power at 80% and alpha at .05, we calculated it would take 105 patients per group (N=420) to detect a difference of 2 days in time until resolution.
RESULTS
Over the 5-year study period, 36 clinicians identified 186 patients who expressed an interest in the study, and they transmitted the patient contact information to the research team. Patients were seen in a traditional primary care setting. All 186 patients were enrolled by phone. However, only 89 completed and returned their diaries and signed consent forms; of these, 60% were female, 92% were white, 4% were black, 4% were American Indians, 2% were Hispanic, and 7% had diabetes mellitus.
Five practices contributed data on numbers of poison ivy encounters per month and total encounters per month for the year 2013. They included an inner city academic practice in central Oklahoma and a rural community health center, a suburban private practice, and 2 private practices in a town of 30,000 in eastern Oklahoma. The largest average number of encounters occurred between April and August.
The distribution of enrolled-patient visits by month and season corresponded roughly to the proportions of all patient visits for poison ivy, with 1% occurring in the winter, 35% in the spring, 55% during the summer, and 9% in the fall. Virtually all study participants (92%) complained of pruritus and had erythema (91%) and papules (87%). Forty-nine percent had vesicles or bullae. The area of the body most often affected was the head/face/neck, 61%, followed by the trunk, 56%; legs, 54%; and arms, 22%.
From the date of initial clinical consultation, the mean/median (SD; range) duration of symptoms and signs were: pruritus, 10.9/9 days (7.1; 0-43); erythema, 13.7/13 days (7.7; 0-42); papules, 10.1/9.5 days (6.5; 0-37); and vesicles, 5.3/5 days (4.1; 0-15). The mean/median (SD; range) duration of any symptom or sign was 14.4/13.5 days (8; 1-43). Rashes with vesicles tended to last longer (16.1 vs 12.9 days), but this difference did not reach statistical significance.
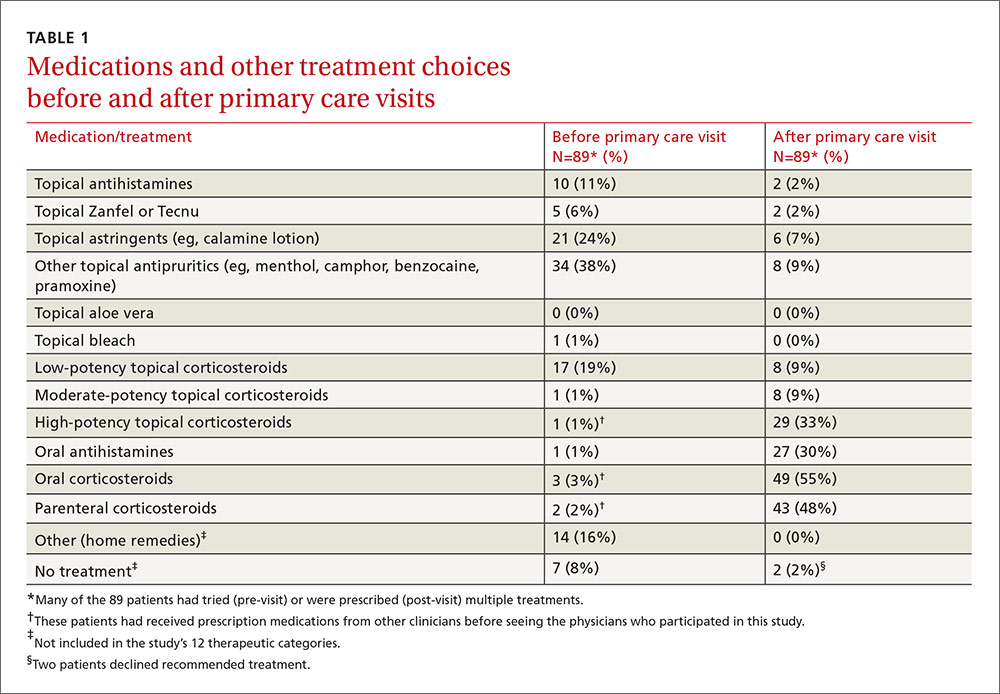
Treatments used by patients before and after their primary care visit are shown in TABLE 1. Seventy-three percent of patients had tried something from one treatment category before consulting a clinician, and 31% had tried something from more than one category. They were most likely to have used a topical antipruritic, astringent, or low-potency corticosteroid, or a combination of these. Clinicians always recommended some treatment and, in 76% of cases, treatments from more than one category. They most often prescribed oral or parenteral corticosteroids (81% of the time), sometimes in combination with a high-potency topical corticosteroid (25% of the time) or oral antihistamine (31%).
No statistically significant associations were found between the baseline non-treatment variables and duration of symptoms and signs. Patient-initiated treatments were also not associated with duration of symptoms and signs following the initial clinician visit.
Of the treatments prescribed by clinicians or independently chosen by patients following their initial office visit, only systemic corticosteroids plus high-potency topical corticosteroids were associated with a significantly shorter duration of itching (P=.005). No treatment was associated with reduced duration of erythema, papules, or vesicles. Use of topical soaps was associated with a longer duration of papules (P<.0001) and of total duration of signs or symptoms (P=.0004) compared with other treatments.
Location and characteristics of the rash were not associated with likelihood of recurrence following treatment. Post-visit use of a topical soap was associated with recurrence of itching (P=.001) and erythema (P=.01). Recurrence of erythema was also more frequent in patients prescribed topical astringents (beta coefficient=0.28; P=.008), and recurrence of papules was more common in patients treated with low-potency topical corticosteroids (P<.0001). These results and several others that almost reached statistical significance are shown in TABLE 2.
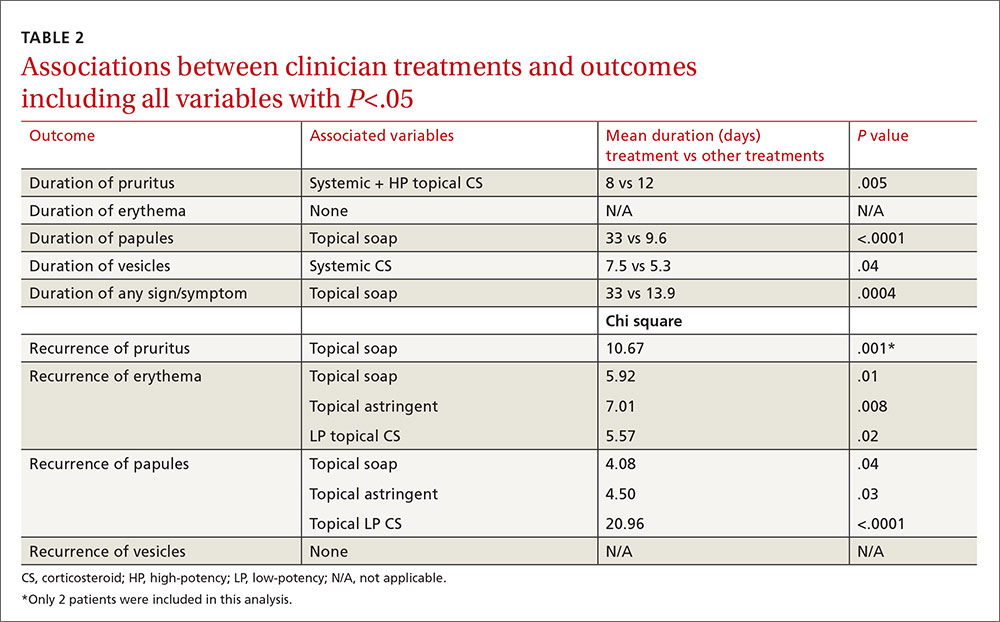
In the multivariable models, the only variable associated with duration of pruritus was the combination of systemic and high-potency topical corticosteroids (8 vs 12 days.) Use of only parenteral or only high-potency topical corticosteroids did not predict shorter duration of pruritus. Use of topical soaps was associated with longer duration of papules (33 vs 9.6 days) and longer duration of any symptoms (33 vs 13.9 days). It was also associated with a higher likelihood of recurrence of pruritus (chi square test [χ2], 10.67) and recurrence of erythema (χ2, 5.92) after initial resolution. Topical astringent use was predictive of recurrence of erythema (χ2, 7.01) and use of low-potency corticosteroids was associated with recurrence of papules (χ2, 20.96).
DISCUSSION
While network clinicians felt that studying poison ivy was of interest and importance, and we had preliminary survey information to suggest it was a common problem treated in primary care, our data suggest that clinical encounters for poison ivy are actually quite uncommon (less than 0.4% of all encounters) even during peak months. Our problems with recruitment were therefore unexpected, and we ended up with far fewer enrolled patients than we had projected, and needed, based on our power analysis. Also based on our preliminary survey, we anticipated considerably more variation in treatment approach than we found. Most clinicians recommended either an oral, parenteral, or high-potency topical corticosteroid, and some also recommended an oral antihistamine, usually diphenhydramine.
The literature and common sense suggest that most patients who seek medical treatment for poison ivy are primarily concerned about itching. Even with the smaller-than-anticipated number of participants in this study, we were able to show that the combination of a systemic (oral or parenteral) corticosteroid and a high-potency topical corticosteroid was associated with a statistically significant shorter duration of pruritus with no recurrence following treatment. We found no evidence that systemic corticosteroids alone, parenteral corticosteroids alone, or high-potency topical corticosteroids alone had any effect on duration of signs or symptoms, even at an alpha of .05. We also found no evidence that oral antihistamines were associated with a shorter duration of pruritus (P=.06); with a larger sample size, we might have found a difference.
Since only 2 patients used topical soaps following their initial clinician visit, the associations between use of these products and longer duration of signs and symptoms and with recurrence of signs and symptoms, although statistically significant, should be viewed with skepticism and with an eye toward possible confounders (eg, people who used these agents may have been more likely to notice and record minor symptoms). Furthermore, these agents have been effective only when used before or at the onset of the rash.
Study limitations. The study has a number of limitations. It had a high drop-out rate. Some patients might not have had poison ivy, but it is generally considered easy to diagnose with accuracy. We cannot be sure that all of the enrolled patients had Rhus dermatitis. Enrollment was based on the clinical impression of the patients’ primary care clinicians. The sample size reduced the power of the study to detect small differences in treatment effects and prevented more complex analyses (eg, combinations of medications, interactions).
The possibility of self-selection bias, weaknesses of the cohort design, and patient-reported outcome measures were additional limitations. The study was also carried out in a single southwestern state, which may not be representative of some other locations. However, it is one of only a few studies published on Rhus dermatitis and possibly the only one conducted in primary care settings.
CORRESPONDENCE
Cara Vaught, MPH, University of Oklahoma Health Sciences Center, Department of Family and Preventive Medicine, 900 NE 10th Street, Oklahoma City, OK 73104; [email protected].
ACKNOWLEDGEMENT
The authors thank the Oklahoma Physicians Resource/Research Network (OKPRN) and the OKPRN clinician members (as well as their staff and patients) for their contributions to this study. The authors also thank Bradley Long, Matthew Marr, and Kellie Hetherington for their involvement in the data collection for this study.
1. Epstein WL. Occupational poison ivy and oak dermatitis. Dermatol Clin. 1994;12:511-516.
2. Long D, Ballentine NH, Marks JG Jr. Treatment of poison ivy/oak allergic contact dermatitis with an extract of jewelweed. Am J Contact Dermat. 1997;8:150-153.
3. Amrol D, Keitel D, Hagaman D, et al. Topical pimecrolimus in the treatment of human allergic contact dermatitis. Ann Allergy Asthma Immunol. 2003;91:563-566.
4. Davila A, Laurora M, Fulton J, et al. A new topical agent, Zanfel, ameliorates urushiol-induced Toxicodendron allergic contact dermatitis [abstract 364]. Ann Emerg Med. 2003;42(suppl 4):S98.
5. Vernon HJ, Olsen EA. A controlled trial of clobetasol propionate ointment 0.05% in the treatment of experimentally induced Rhus dermatitis. J Am Acad Dermatol. 1990;23:829-832.
6. Dickey RF. Parenteral short-term corticosteroid therapy in moderate to severe dermatoses. A comparative multiclinic study. Cutis. 1976;17:179-193.
7. Goodall J. Oral corticosteroids for poison ivy dermatitis. CMAJ. 2002;166:300-301.
8. Moe JF. How much steroid for poison ivy? Postgrad Med. 1999;106:21,24.
ABSTRACT
Purpose To determine the characteristics and clinical course of Rhus dermatitis in patients who seek assistance from primary care clinicians, as well as treatment approaches used by patients and recommended by clinicians, and treatment approaches associated with better outcomes.
Methods This was a prospective cohort study with standardized baseline data collection on patients and their rashes, followed by examination of patient-completed diaries of signs, symptoms, and treatments.
Results Thirty-six clinicians identified 186 interested patients, of which 89 completed and returned diaries and consent forms. Of those 89 patients, 92% reported pruritus; 91%, erythema; 87%, papules; and 49%, vesicles or bullae at baseline. Their rashes involved the head/face/neck, 61%; trunk, 56%; legs, 54%; and arms, 22%.
From the date of clinical consultation, the mean (standard deviation [SD]; range) duration of any symptom or sign was 14.4 days (8.0; 1-43). Patients most often had tried a topical antipruritic, astringent, or low-potency corticosteroid before seeking care. Clinicians prescribed oral or parenteral corticosteroids 81% of the time, sometimes in combination with a high-potency topical c
Conclusions Patients who visit a primary care clinician for Rhus dermatitis can expect the rash to last another 2 weeks on average (total duration: one day to 6 weeks) regardless of what treatment is prescribed. Parenteral corticosteroids plus high-potency topical corticosteroids may reduce the duration of the itching.
Rhus dermatitis (poison ivy, oak, and sumac) is a common cause of contact dermatitis throughout the United States. The condition is usually mild and often not brought to the attention of primary care clinicians. Some patients, however, do see a health care provider for treatment, most often because of pruritus. This form of contact dermatitis results from a type IV hypersensitivity reaction to urushiol, a colorless oil in the leaves, stem, root, and fruit of poison ivy, poison oak, and poison sumac. The reaction, which occurs 24 to 72 hours following contact with the skin, can be prevented by washing the skin promptly with a detergent soap after exposure. By the age of 8, most people are sensitized to urushiol.1
According to most standard texts and clinical reviews, untreated Rhus dermatitis usually resolves in one to 3 weeks. What is not known is whether particular patient or rash characteristics might affect prognosis and thereby influence treatment recommendations—eg, age, gender, race, location of the rash, prior episodes, chronic illnesses such as diabetes, or chronic use of medications such as nonsteroidal anti-inflammatory drugs and corticosteroids.
Impetus for our study. An informal survey of 10 clinician members of the Oklahoma Physicians Resource/Research Network (OKPRN), a statewide practice-based research network, suggested that primary care clinicians treat between one and 10 patients with poison ivy each week during the spring, summer, and fall (median 2.5). Their reported armamentarium included more than 15 different over-the-counter topical agents, several oral antihistamines, and a variety of topical, oral, and parenteral corticosteroids.
Surprisingly, there is very little published evidence on which to base treatment decisions. Using PubMed and the search terms, Rhus dermatitis, poison ivy, and poison oak, we found only 3 placebo-controlled clinical trials of Rhus dermatitis treatments in the English language literature after 1966. Based on these studies, Zanfel, a mixture of alcohol-soluble and anionic surfactant, may be somewhat effective, but pimecrolimus and jewelweed extract were no more effective than placebo.2-4 There is some evidence that topical corticosteroids are effective only before vesicles appear.5 In one uncontrolled study, intramuscular injection of betamethasone and dexamethasone yielded about a 30% reduction in symptoms within 48 hours.6 Assuming that systemic corticosteroids do produce benefit, however, the most effective dose and duration of treatment have not been determined.7,8
To address some of these gaps in our knowledge base, OKPRN members asked that we undertake a longitudinal cohort study of patients reporting to primary care practices.
METHODS
We conducted this study between May 2010 and October 2014. The project was approved by the University of Oklahoma Health Sciences Center Institutional Review Board. Clinician members of OKPRN were invited to participate in the study via listserv, fax, or letter. We instructed clinicians and office staff to ask patients with Rhus dermatitis if they might be interested in participating in a study, which would require that they keep a symptom diary and would earn them a $20 gift card. Interested patients were given a packet of information, and a member of the research team later called the patients with additional information, including an explanation of informed consent and instructions on completing and returning the diary and written consent form.
Clinicians recorded information about the patient and the rash on a customized template, releasing it to the team after written consent was obtained from the patient. Categories for characterizing the rash were head/face, arms/hands, trunk, and legs/feet. A subset of 5 participating clinicians, selected to include a variety of practice types and patient populations, were also asked to produce, from their billing software, the number of patients and encounters in which poison ivy was addressed in each month of 2013.
On the diary, patients were instructed to record the presence or absence of pruritus, erythema, raised lesions, and vesicles/bullae at the end of each day until the rash resolved, or for 6 weeks following onset of the rash, whichever came first. Patients were asked to mail their diaries to the principal investigator once they were free of symptoms for one week or after 6 weeks from the onset of symptoms, whichever came first.
We asked both patients and clinicians to report medications used before and after the primary care encounter. A member of the research team assigned these medications to one of 12 categories: topical antihistamines, topical soaps (eg, Zanfel or Tecnu), topical astringents, other topical antipruritics, topical aloe vera, topical bleach, low-potency topical corticosteroids, moderate-potency topical corticosteroids, high-potency topical corticosteroids, oral antihistamines, oral corticosteroids, and parenteral corticosteroids.
We used independent T-tests to evaluate associations between baseline variables, patient-initiated treatments, and clinician-initiated treatments and the time to complete resolution of individual signs and symptoms and complete resolution of all signs and symptoms following the clinical encounter. We created additional outcome variables for initial resolution followed by recurrence of itching, erythema, papules, and vesicles. The purpose of these variables was to determine if some treatments were initially effective but without lasting effect.
We used the chi square test to assess associations between clinician-initiated treatments and recurrence of signs or symptoms following initial resolution. To account for chance associations resulting from multiple analyses, we chose to set the level of statistical significance at P=.01. However, because of the lower-than-projected sample size, we chose to also report variables with P<.05 so that the reader could judge the likelihood that a larger sample might have disclosed other important associations.
We assumed that an average of 4 categories of treatment would be tried (eg, topical corticosteroids, systemic corticosteroids, topical antihistamines, and other topical agents), and that the mean number of days until resolution would be 21, with a standard deviation (SD) of 4 days. Setting power at 80% and alpha at .05, we calculated it would take 105 patients per group (N=420) to detect a difference of 2 days in time until resolution.
RESULTS
Over the 5-year study period, 36 clinicians identified 186 patients who expressed an interest in the study, and they transmitted the patient contact information to the research team. Patients were seen in a traditional primary care setting. All 186 patients were enrolled by phone. However, only 89 completed and returned their diaries and signed consent forms; of these, 60% were female, 92% were white, 4% were black, 4% were American Indians, 2% were Hispanic, and 7% had diabetes mellitus.
Five practices contributed data on numbers of poison ivy encounters per month and total encounters per month for the year 2013. They included an inner city academic practice in central Oklahoma and a rural community health center, a suburban private practice, and 2 private practices in a town of 30,000 in eastern Oklahoma. The largest average number of encounters occurred between April and August.
The distribution of enrolled-patient visits by month and season corresponded roughly to the proportions of all patient visits for poison ivy, with 1% occurring in the winter, 35% in the spring, 55% during the summer, and 9% in the fall. Virtually all study participants (92%) complained of pruritus and had erythema (91%) and papules (87%). Forty-nine percent had vesicles or bullae. The area of the body most often affected was the head/face/neck, 61%, followed by the trunk, 56%; legs, 54%; and arms, 22%.
From the date of initial clinical consultation, the mean/median (SD; range) duration of symptoms and signs were: pruritus, 10.9/9 days (7.1; 0-43); erythema, 13.7/13 days (7.7; 0-42); papules, 10.1/9.5 days (6.5; 0-37); and vesicles, 5.3/5 days (4.1; 0-15). The mean/median (SD; range) duration of any symptom or sign was 14.4/13.5 days (8; 1-43). Rashes with vesicles tended to last longer (16.1 vs 12.9 days), but this difference did not reach statistical significance.
Treatments used by patients before and after their primary care visit are shown in TABLE 1. Seventy-three percent of patients had tried something from one treatment category before consulting a clinician, and 31% had tried something from more than one category. They were most likely to have used a topical antipruritic, astringent, or low-potency corticosteroid, or a combination of these. Clinicians always recommended some treatment and, in 76% of cases, treatments from more than one category. They most often prescribed oral or parenteral corticosteroids (81% of the time), sometimes in combination with a high-potency topical corticosteroid (25% of the time) or oral antihistamine (31%).
No statistically significant associations were found between the baseline non-treatment variables and duration of symptoms and signs. Patient-initiated treatments were also not associated with duration of symptoms and signs following the initial clinician visit.
Of the treatments prescribed by clinicians or independently chosen by patients following their initial office visit, only systemic corticosteroids plus high-potency topical corticosteroids were associated with a significantly shorter duration of itching (P=.005). No treatment was associated with reduced duration of erythema, papules, or vesicles. Use of topical soaps was associated with a longer duration of papules (P<.0001) and of total duration of signs or symptoms (P=.0004) compared with other treatments.
Location and characteristics of the rash were not associated with likelihood of recurrence following treatment. Post-visit use of a topical soap was associated with recurrence of itching (P=.001) and erythema (P=.01). Recurrence of erythema was also more frequent in patients prescribed topical astringents (beta coefficient=0.28; P=.008), and recurrence of papules was more common in patients treated with low-potency topical corticosteroids (P<.0001). These results and several others that almost reached statistical significance are shown in TABLE 2.
In the multivariable models, the only variable associated with duration of pruritus was the combination of systemic and high-potency topical corticosteroids (8 vs 12 days.) Use of only parenteral or only high-potency topical corticosteroids did not predict shorter duration of pruritus. Use of topical soaps was associated with longer duration of papules (33 vs 9.6 days) and longer duration of any symptoms (33 vs 13.9 days). It was also associated with a higher likelihood of recurrence of pruritus (chi square test [χ2], 10.67) and recurrence of erythema (χ2, 5.92) after initial resolution. Topical astringent use was predictive of recurrence of erythema (χ2, 7.01) and use of low-potency corticosteroids was associated with recurrence of papules (χ2, 20.96).
DISCUSSION
While network clinicians felt that studying poison ivy was of interest and importance, and we had preliminary survey information to suggest it was a common problem treated in primary care, our data suggest that clinical encounters for poison ivy are actually quite uncommon (less than 0.4% of all encounters) even during peak months. Our problems with recruitment were therefore unexpected, and we ended up with far fewer enrolled patients than we had projected, and needed, based on our power analysis. Also based on our preliminary survey, we anticipated considerably more variation in treatment approach than we found. Most clinicians recommended either an oral, parenteral, or high-potency topical corticosteroid, and some also recommended an oral antihistamine, usually diphenhydramine.
The literature and common sense suggest that most patients who seek medical treatment for poison ivy are primarily concerned about itching. Even with the smaller-than-anticipated number of participants in this study, we were able to show that the combination of a systemic (oral or parenteral) corticosteroid and a high-potency topical corticosteroid was associated with a statistically significant shorter duration of pruritus with no recurrence following treatment. We found no evidence that systemic corticosteroids alone, parenteral corticosteroids alone, or high-potency topical corticosteroids alone had any effect on duration of signs or symptoms, even at an alpha of .05. We also found no evidence that oral antihistamines were associated with a shorter duration of pruritus (P=.06); with a larger sample size, we might have found a difference.
Since only 2 patients used topical soaps following their initial clinician visit, the associations between use of these products and longer duration of signs and symptoms and with recurrence of signs and symptoms, although statistically significant, should be viewed with skepticism and with an eye toward possible confounders (eg, people who used these agents may have been more likely to notice and record minor symptoms). Furthermore, these agents have been effective only when used before or at the onset of the rash.
Study limitations. The study has a number of limitations. It had a high drop-out rate. Some patients might not have had poison ivy, but it is generally considered easy to diagnose with accuracy. We cannot be sure that all of the enrolled patients had Rhus dermatitis. Enrollment was based on the clinical impression of the patients’ primary care clinicians. The sample size reduced the power of the study to detect small differences in treatment effects and prevented more complex analyses (eg, combinations of medications, interactions).
The possibility of self-selection bias, weaknesses of the cohort design, and patient-reported outcome measures were additional limitations. The study was also carried out in a single southwestern state, which may not be representative of some other locations. However, it is one of only a few studies published on Rhus dermatitis and possibly the only one conducted in primary care settings.
CORRESPONDENCE
Cara Vaught, MPH, University of Oklahoma Health Sciences Center, Department of Family and Preventive Medicine, 900 NE 10th Street, Oklahoma City, OK 73104; [email protected].
ACKNOWLEDGEMENT
The authors thank the Oklahoma Physicians Resource/Research Network (OKPRN) and the OKPRN clinician members (as well as their staff and patients) for their contributions to this study. The authors also thank Bradley Long, Matthew Marr, and Kellie Hetherington for their involvement in the data collection for this study.
1. Epstein WL. Occupational poison ivy and oak dermatitis. Dermatol Clin. 1994;12:511-516.
2. Long D, Ballentine NH, Marks JG Jr. Treatment of poison ivy/oak allergic contact dermatitis with an extract of jewelweed. Am J Contact Dermat. 1997;8:150-153.
3. Amrol D, Keitel D, Hagaman D, et al. Topical pimecrolimus in the treatment of human allergic contact dermatitis. Ann Allergy Asthma Immunol. 2003;91:563-566.
4. Davila A, Laurora M, Fulton J, et al. A new topical agent, Zanfel, ameliorates urushiol-induced Toxicodendron allergic contact dermatitis [abstract 364]. Ann Emerg Med. 2003;42(suppl 4):S98.
5. Vernon HJ, Olsen EA. A controlled trial of clobetasol propionate ointment 0.05% in the treatment of experimentally induced Rhus dermatitis. J Am Acad Dermatol. 1990;23:829-832.
6. Dickey RF. Parenteral short-term corticosteroid therapy in moderate to severe dermatoses. A comparative multiclinic study. Cutis. 1976;17:179-193.
7. Goodall J. Oral corticosteroids for poison ivy dermatitis. CMAJ. 2002;166:300-301.
8. Moe JF. How much steroid for poison ivy? Postgrad Med. 1999;106:21,24.

Reasons Behind the Ink
Tattoos have been viewed as one of the most exotic forms of art for thousands of years. In ancient times, tattoos were used mainly for therapeutic and status purposes. According to British archeologist Joann Fletcher, the oldest evidence of tattoo use was found on the famous “Iceman,” a 5200-year-old frozen mummy that was discovered more than 20 years ago.1 Tattoos were thought to be a form of therapy used to decrease joint pain. On the other hand, the ancient Egyptians used tattoos as symbols of wealth and high status; surprisingly, only women were tattooed. Fletcher also reported that tattoos were used as a form of therapy during pregnancy in upper-class women.1
Tattoos have served different purposes in the last few centuries, making their way to the United States at the start of the 20th century.2 New York City became the tattoo capital of the country. During this early period, male artists often would tattoo their wives so that they could advertise their work. After the Prohibition era, tattoos became widely used within the US Military, becoming a way to show pride and patriotism.2
Due to the permanent nature of tattoos, we sought to understand the reasons for obtaining this particular genre of body art. The purpose of this study was to provide a greater understanding of the current demographics of individuals who get tattoos, looking at specific trends in age and level of education of those who get tattoos as well as the motivation for tattoo placement. As dermatologists, it is essential to understand this patient population to be able to provide services (ie, tattoo removal) in the safe setting of a physician’s office.
Methods
The study was conducted at a private dermatology clinic in the Chicago (Illinois) metropolitan area with no institutional review board approval. Between January 2011 and December 2012, local patients with at least 1 tattoo were asked, with assumed consent, to fill out an investigator-developed survey containing 18 multiple-choice questions regarding age, educational and family background, and other factors. The race and gender of the respondents as well as the number of patients who declined to complete the survey were not recorded.
Results
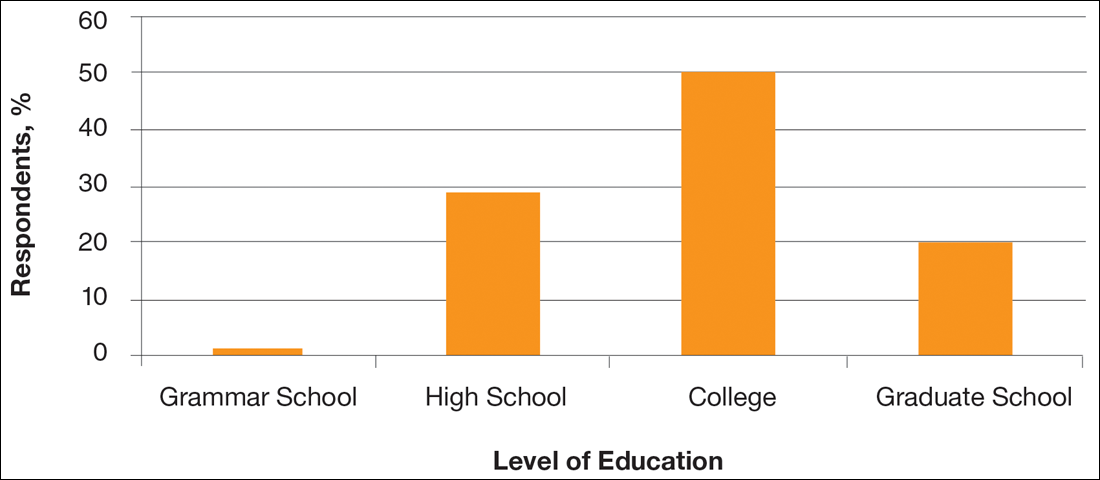
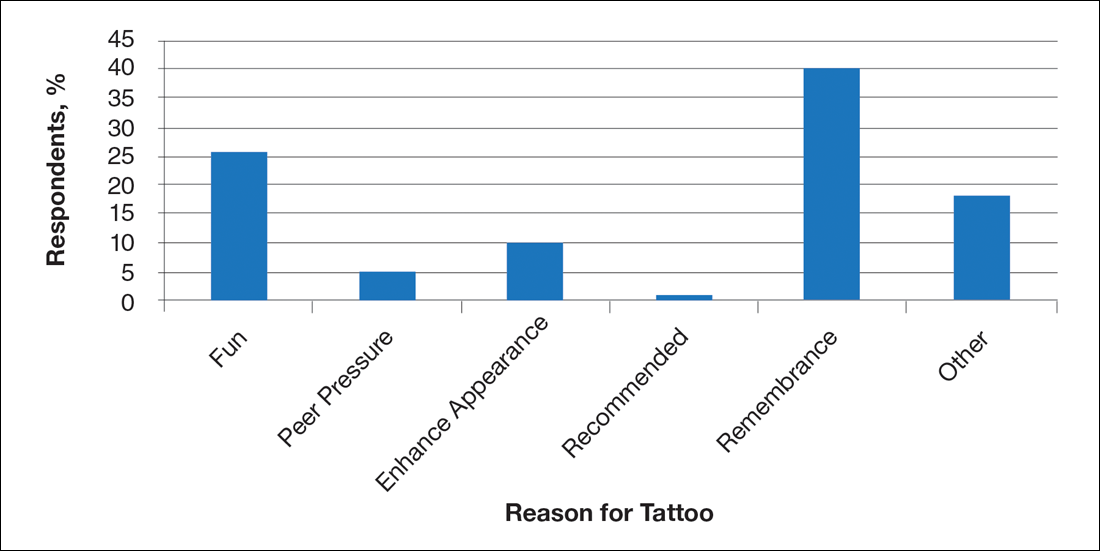
A total of 363 patients completed the in-person survey. Responses were tabulated and converted into percentages for comparison (N=363). Data analysis was divided into 3 parameters: education level, health concerns, and motivation for getting a tattoo. Figure 1 shows that 70% of respondents had obtained a college degree or higher.
With regard to health concerns associated with tattoos, the majority of respondents (71%) claimed they were not concerned with the health risks (eg, infection with human immunodeficiency virus or hepatitis C virus) associated with getting a tattoo. Also, only 6% of respondents admitted to being under the influence of drugs or alcohol at the time of getting a tattoo. Of 21 respondents who claimed drugs and/or alcohol were part of their tattoo experience, the highest level of education was high school in 7 respondents and 2 got their first tattoo when they were younger than 14 years.
Survey results revealed that the majority of respondents got a tattoo as an act of rememberance (Figure 2). For example, one respondent reported getting a tattoo for religious purposes, while another got a tattoo to celebrate and mark each level of completed education (ie, high school, college, graduate school). However, a high percentage of respondents (26%) got a tattoo for fun.
Comment
Although ancient tattoos were used for therapeutic purposes, this study revealed that tattoos are now obtained by individuals with higher levels of education to remember a loved one or purely for enjoyment. The potential health risks associated with getting a tattoo did not deter the respondents in this study. Converse to the popular belief that individuals are under the influence of drugs and/or alcohol when getting a tattoo, our study found that only 6% of respondents were under the influence. A comparable trend was found among US military service members in a similar study.3 The majority of respondents did not regret their tattoos and did not report taking a mind-altering substance. Tattoos serve as a symbol of one’s proud individualism.3 However, a 2001 study found a correlation between greater use of alcohol and marijuana among college students with tattoos and piecings.4 These circumstances may lead patients to seek consultation from a dermatologist for tattoo removal. Therefore, it is important to have a better understanding of this particular patient population to facilitate care in an efficient manner.
Evaluation of the gender and race of survey respondents would be useful in the future. Financial status of respondents also may be explored, as wealth and status were used by the ancient Egyptians to determine who could get a tattoo. A follow-up analysis on removal of tattoos also will be explored in the future.
- Lineberry C. Tattoos: the ancient and mysterious history. Smithsonian. http://www.smithsonianmag.com/history-archaeology/tattoo.html. Published January 1, 2007. Accessed April 29, 2016.
- Bickerstaff L. Tattoos: fad, fashion, or folly? Odyssey. 2005;14:34-36.
- Lande RG, Bahroo BA, Soumoff A. United States military service members and their tattoos: a descriptive study. Mil Med. 2013;178:921-925.
- Forbes GB. College students with tattoos and piercings: motives, family experiences, personality factors, and perception by others. Psychol Rep. 2001;89:774-786.
Tattoos have been viewed as one of the most exotic forms of art for thousands of years. In ancient times, tattoos were used mainly for therapeutic and status purposes. According to British archeologist Joann Fletcher, the oldest evidence of tattoo use was found on the famous “Iceman,” a 5200-year-old frozen mummy that was discovered more than 20 years ago.1 Tattoos were thought to be a form of therapy used to decrease joint pain. On the other hand, the ancient Egyptians used tattoos as symbols of wealth and high status; surprisingly, only women were tattooed. Fletcher also reported that tattoos were used as a form of therapy during pregnancy in upper-class women.1
Tattoos have served different purposes in the last few centuries, making their way to the United States at the start of the 20th century.2 New York City became the tattoo capital of the country. During this early period, male artists often would tattoo their wives so that they could advertise their work. After the Prohibition era, tattoos became widely used within the US Military, becoming a way to show pride and patriotism.2
Due to the permanent nature of tattoos, we sought to understand the reasons for obtaining this particular genre of body art. The purpose of this study was to provide a greater understanding of the current demographics of individuals who get tattoos, looking at specific trends in age and level of education of those who get tattoos as well as the motivation for tattoo placement. As dermatologists, it is essential to understand this patient population to be able to provide services (ie, tattoo removal) in the safe setting of a physician’s office.
Methods
The study was conducted at a private dermatology clinic in the Chicago (Illinois) metropolitan area with no institutional review board approval. Between January 2011 and December 2012, local patients with at least 1 tattoo were asked, with assumed consent, to fill out an investigator-developed survey containing 18 multiple-choice questions regarding age, educational and family background, and other factors. The race and gender of the respondents as well as the number of patients who declined to complete the survey were not recorded.
Results
A total of 363 patients completed the in-person survey. Responses were tabulated and converted into percentages for comparison (N=363). Data analysis was divided into 3 parameters: education level, health concerns, and motivation for getting a tattoo. Figure 1 shows that 70% of respondents had obtained a college degree or higher.
With regard to health concerns associated with tattoos, the majority of respondents (71%) claimed they were not concerned with the health risks (eg, infection with human immunodeficiency virus or hepatitis C virus) associated with getting a tattoo. Also, only 6% of respondents admitted to being under the influence of drugs or alcohol at the time of getting a tattoo. Of 21 respondents who claimed drugs and/or alcohol were part of their tattoo experience, the highest level of education was high school in 7 respondents and 2 got their first tattoo when they were younger than 14 years.
Survey results revealed that the majority of respondents got a tattoo as an act of rememberance (Figure 2). For example, one respondent reported getting a tattoo for religious purposes, while another got a tattoo to celebrate and mark each level of completed education (ie, high school, college, graduate school). However, a high percentage of respondents (26%) got a tattoo for fun.
Comment
Although ancient tattoos were used for therapeutic purposes, this study revealed that tattoos are now obtained by individuals with higher levels of education to remember a loved one or purely for enjoyment. The potential health risks associated with getting a tattoo did not deter the respondents in this study. Converse to the popular belief that individuals are under the influence of drugs and/or alcohol when getting a tattoo, our study found that only 6% of respondents were under the influence. A comparable trend was found among US military service members in a similar study.3 The majority of respondents did not regret their tattoos and did not report taking a mind-altering substance. Tattoos serve as a symbol of one’s proud individualism.3 However, a 2001 study found a correlation between greater use of alcohol and marijuana among college students with tattoos and piecings.4 These circumstances may lead patients to seek consultation from a dermatologist for tattoo removal. Therefore, it is important to have a better understanding of this particular patient population to facilitate care in an efficient manner.
Evaluation of the gender and race of survey respondents would be useful in the future. Financial status of respondents also may be explored, as wealth and status were used by the ancient Egyptians to determine who could get a tattoo. A follow-up analysis on removal of tattoos also will be explored in the future.
- Lineberry C. Tattoos: the ancient and mysterious history. Smithsonian. http://www.smithsonianmag.com/history-archaeology/tattoo.html. Published January 1, 2007. Accessed April 29, 2016.
- Bickerstaff L. Tattoos: fad, fashion, or folly? Odyssey. 2005;14:34-36.
- Lande RG, Bahroo BA, Soumoff A. United States military service members and their tattoos: a descriptive study. Mil Med. 2013;178:921-925.
- Forbes GB. College students with tattoos and piercings: motives, family experiences, personality factors, and perception by others. Psychol Rep. 2001;89:774-786.
Practice Points
- Individuals who get tattoos often are more educated and well informed than previously thought, more likely leading them to seek removal if desired.
- Our results indicate that tattoos are not regretted as often as previously speculated.
Risk Factors for Early Readmission After Anatomical or Reverse Total Shoulder Arthroplasty
Hospital readmissions are undesirable and expensive.1 The Centers for Medicare & Medicaid Services (CMS) use hospital readmission rates as one measure of healthcare quality and hospital performance.2 In addition, the Patient Protection and Affordable Care Act of 2010 established a provision that decreases payments to hospitals with above-average readmission rates.3 Total knee arthroplasties (TKAs) and total hip arthroplasties (THAs) are among the most common surgical procedures leading to readmission and cost almost $20 billion dollars annually in the Medicare population alone.1 Identifying factors that lead to readmissions after certain popular procedures may be a way to improve healthcare quality and outcomes while decreasing costs.
One such operation is shoulder arthroplasty (SA), which has surged in popularity over the past decade and is projected to increase faster than TKAs and THAs.4-6 SA is used to treat a variety of shoulder conditions, including osteoarthritis, inflammatory arthritis, severe proximal humeral fracture, avascular necrosis, and rotator cuff tear arthropathy.7-12 Much as with knee and hip arthroplasty, good outcomes have been reported with SA: decreased pain, improved range of motion, and high patient satisfaction.10,13 However, there have been few studies of rates of readmission after SA and the associated risk factors.3,14,15 The reported rates of early readmission after SA have ranged from 5.6% to 7.3%.3,14,15 These rates are comparable to rates of readmission after TKA (4.0%-6.6%) and THA (3.5%-8.4%).15-17Recently, CMS introduced legislation to void payments for hospital-acquired conditions (HACs), preventable medical conditions that patients develop during or as a result of their hospital care and that were not present on admission.18 Although many factors contribute to readmission, a recent study regarding all-cause readmission during the first 30 days after discharge found that almost 50% of 30-day readmissions after knee and hip replacements were potentially preventable.19 HACs resulting in readmission after SAs make up 9.3% to 34.5% of all readmissions, after anatomical total shoulder arthroplasties (ATSAs) and reverse total shoulder arthroplasties (RTSAs).3,14 The most common HACs include retained foreign body after surgery, air embolism, falls and trauma, catheter-associated urinary tract infection (CAUTI), surgical-site infection, deep vein thrombosis (DVT), and pulmonary embolism (PE).18 Raines and colleagues16 found that HACs accounted for 41.7% of all complications in knee or hip arthroplasty and that HACs were the greatest predictors of early readmission after both procedures.
We conducted a study to evaluate rates of readmission within 30 days after ATSA and RTSA and to describe the independent risk factors for readmission. We hypothesized that the rate of readmission after SA would be similar to the rate after knee and hip arthroplasty and that readmission risk factors would be similar. Elucidating these rates and associated risk factors may ultimately help to minimize the burden of disability on patients and the burden of financial costs on healthcare institutions.
Materials and Methods
Institutional Review Board approval was not required for this study, and all data used were de-identified to Health Insurance Portability and Accountability Act (HIPAA) standards. We used the American College of Surgeons (ACS) National Surgical Quality Improvement Program (NSQIP) database for this study. The NSQIP was developed in the 1990s to improve surgical quality in the Veterans Health Administration and was later adapted by the ACS.20 NSQIP follows patients for 30 days after operations and provides clinical data and outcome measures that are closely regulated and internally audited.21 The program has continued to expand and now includes more than 400 institutions. The NSQIP database has been validated as a reliable source of surgical outcomes data, including outcomes data for orthopedic procedures, and has been used in other studies of readmissions.17,22
In the present study, the ACS-NSQIP files for the period 2011-2013 were queried for all total shoulder arthroplasties (TSAs) (Current Procedural Terminology [CPT] code 23472, which includes ATSA and RTSA). Descriptive analysis was performed to determine the overall readmission rate as well as the percentages of readmissions for medical and surgical complications. Reasons for readmission were collected from 2012 and 2013 (information from 2011 was absent).
The various patient parameters compiled within the database were examined in a review of ATSAs and RTSAs. Demographics, comorbidities, operative characteristics, and predischarge complications were amassed from these data. Demographics included age, sex, race, body mass index, smoking status, preoperative functional health status, and American Society of Anesthesiologists (ASA) score. Comorbidities included diabetes mellitus, hypertension, chronic corticosteroid use, coagulation disorder, peripheral vascular disease, chronic obstructive pulmonary disease (COPD), cardiac comorbidity (including congestive heart failure, history of myocardial infarction, previous coronary intervention or cardiac surgery, and angina), renal comorbidity (including acute renal failure and preoperative dialysis), neurologic comorbidity (including impaired sensorium, hemiplegia, history of transient ischemic attack, and history of cerebrovascular accident with or without residual deficit), and preoperative blood transfusion. Operative characteristics included resident involvement, operative time more than 1 SD from the mean (>164.4 minutes), intraoperative blood transfusion, and revision surgery. Predischarge complications included pneumonia, CAUTI, DVT, PE, postoperative bleeding that required transfusion, cerebrovascular accident, myocardial infarction, and sepsis. Surgical-site infection, CAUTI, DVT, and PE were selected for analysis because these HACs are common in our cohort.
After the data on these characteristics were collected, univariate analysis was performed to determine association with any readmission. Factors with P < .20 were then entered into multivariate analysis to determine independent risk factors for readmission. This P value was selected to make the model inclusive of any potentially important predictor. Univariate analysis was performed using the Fisher exact test. Multivariate analysis was performed using backward conditional binary logistic regression. Statistical significance was set at P < .05. All analysis was performed with SPSS Version 22.0 (SPSS).
Results
This study included a combined total of 3501 ATSAs and RTSAs performed between 2011 and 2013. The overall readmission rate was 2.7%. The associated diagnosis for readmission was available for 54% of the readmitted patients. Of the known readmission diagnoses, 33% were secondary to HACs. 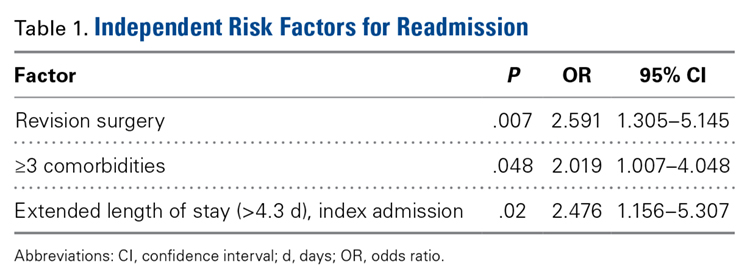
Of the 51 readmissions, 34 (67%) were for medical complications, and 17 (33%) were for surgical complications. Pneumonia was the most common medical complication (11.8%), followed by UTI (7.8%), DVT (5.9%), PE (5.9%), and renal insufficiency (3.9%). Surgical-site infection was the most common surgical complication (13.7%), followed by prosthetic joint dislocation (9.8%) and hematoma (3.9%). 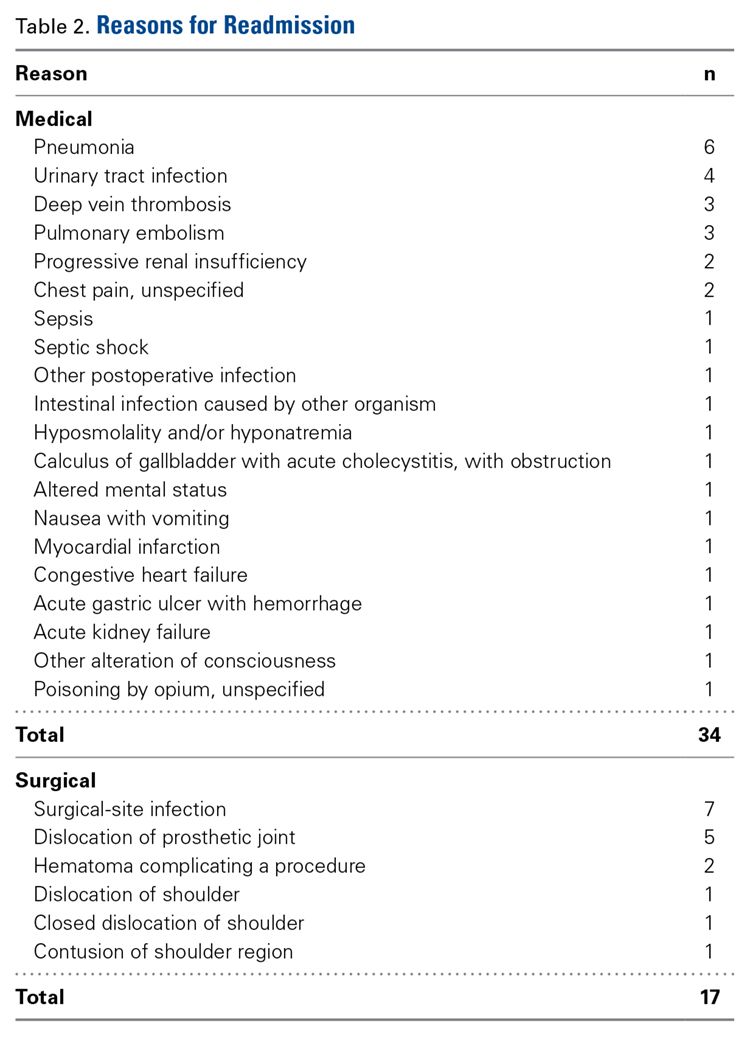
Other risk factors significantly (P < .05) associated with readmission were age over 75 years, dependent functional status, ASA score of 4 or higher, cardiac comorbidity, 2 or more comorbidities, postoperative CAUTI, extended LOS, and revision surgery (Table 3). 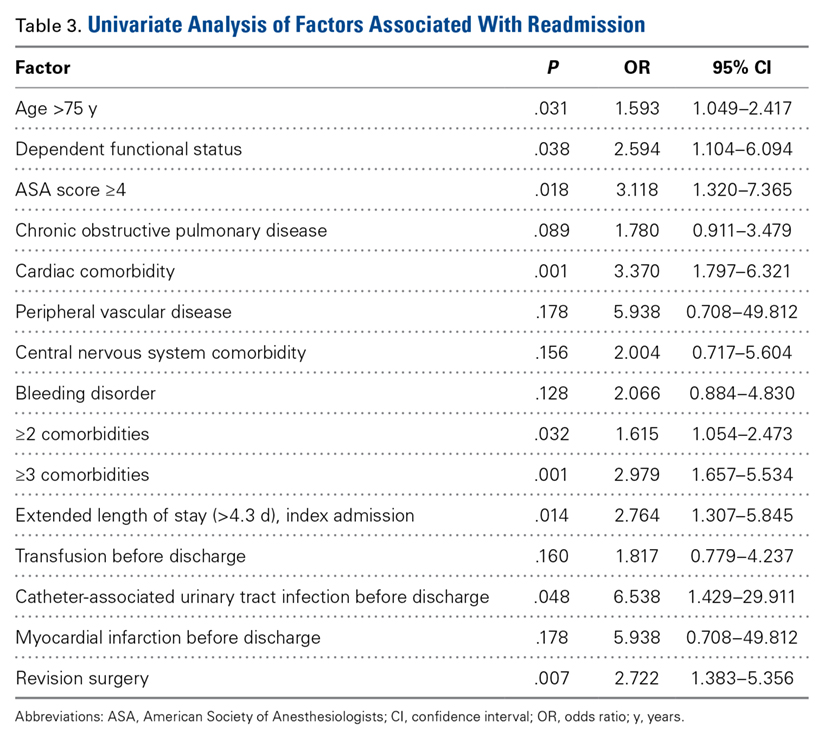
Discussion
Hospital readmissions are important because they represent quality of care and play a role in patient outcomes. Arthroplasty research has focused mainly on readmissions after primary knee and hip replacements.23-25 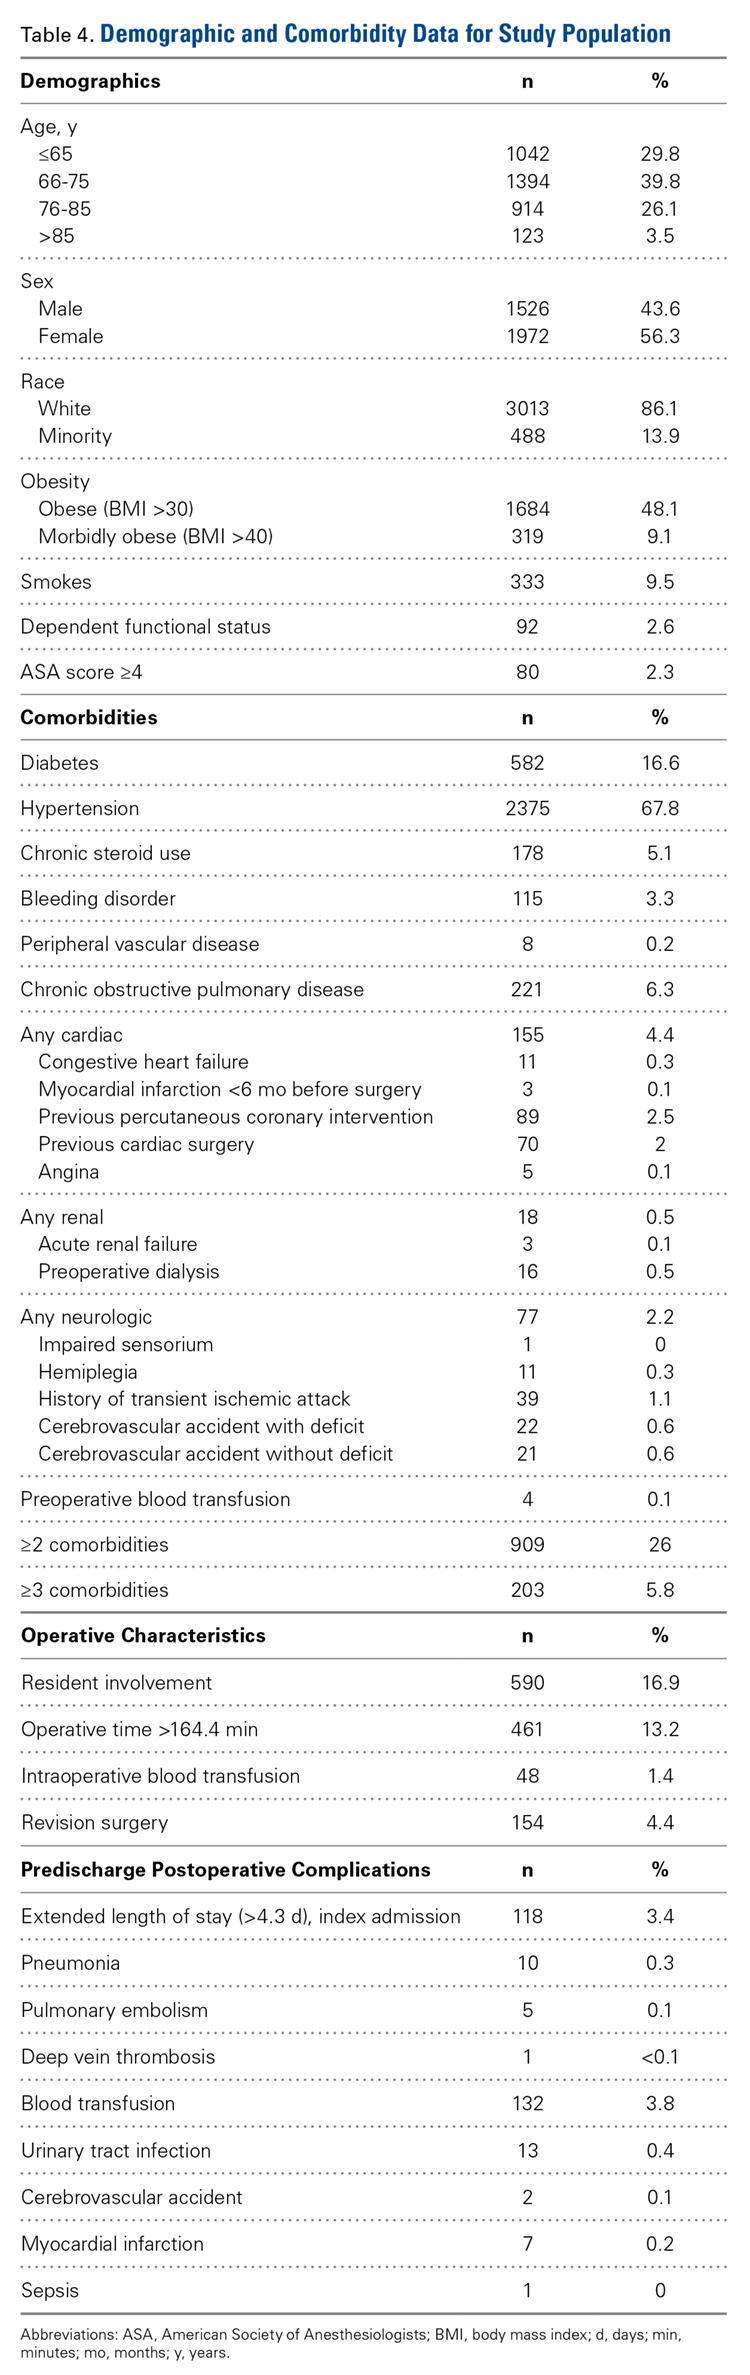
Historical rates of early readmission after SA14 are comparable to those found in our study. Previously identified risk factors have included increasing age, Medicaid insurance status, low-volume surgical centers, and SA type.3 Mahoney and colleagues14 reported a 90-day readmission rate of 5.9%, but, when they removed hemiarthroplasty replacement from the analysis and shortened the readmission timeline to 30 days, the readmission rate was identical to the 2.7% rate in the present study. In their series from a single high-volume institution, the highest 90-day readmission rate was found for hemiarthroplasty (8.8%), followed by RTSA (6.6%) and ATSA (4.5%). In a study by Schairer and colleagues,3 the readmission rate was also influenced by replacement type, but their results differed from those of Mahoney and colleagues.14 Schairer and colleagues3 analyzed data from 7 state inpatient databases and found that the highest readmission rate was associated with RTSA (11.2%), followed by hemiarthroplasty (8.2%) and ATSA (6.0%). In both series, RTSA readmission rates were higher than ATSA readmission rates—consistent with the complication profiles of these procedures, with RTSA often provided as a surgery of last resort, after failure of other procedures, including ATSA.26 The lower 30-day readmission rate in the present study may be attributable to the fact that some surgical and medical complications may not have developed within this short time. Nonetheless, the majority of readmissions typically present within the first 30 days after SA.14,15 Other factors, including hospital volume, surgeon volume, race, and hospital type, may also influence readmission rates but could not be compared between
The present study found that revision surgery, 3 or more comorbidities, and extended LOS (>4.3 days) more than doubled the risk of readmission. Published SA revision rates range from 5% to 42%, with most revisions performed for instability, dislocation, infection, and component loosening.6,29 Complication rates are higher for revision SA than for primary SA, which may explain why revisions predispose patients to readmission.30 Compared with primary SAs, revision SAs are also more likely to be RTSAs, and these salvage procedures have been found to have high complication rates.31 In the present study, the most common comorbidities were hypertension, diabetes, and COPD; the literature supports these as some of the most common comorbid medical conditions in patients who undergo ATSA or RTSA.5,26,32 Furthermore, all 3 of these comorbidities have been shown to be independent predictors of increased postoperative complications in patients who undergo SA, which ultimately would increase the risk of readmission.3,26,33,34 Last, extended LOS has also been shown to increase the risk of unplanned readmissions after orthopedic procedures.35 Risk factors associated with increased LOS after ATSA or RTSA include female sex, advanced age, multiple comorbidities, and postoperative complications.32Several other factors must be noted with respect to individual risk for readmission. In the present study, age over 75 years, dependent functional status, ASA score of 4 or higher, and cardiac comorbidity were found to have a significant association with readmission. Increased age is a risk factor for increased postoperative complications, more medical comorbidities, and increased LOS.34,36 Older people are at higher risk of developing osteoarthritis and rotator cuff tear arthropathy and are more likely to undergo SA.5,6 Older people also are more likely to be dependent, which itself is a risk factor for readmission.19 An ASA score of 3 or 4 has been found to be associated with increased LOS and complications after SA, and cardiac comorbidities predispose patients to a variety of complications.34,36,37In studies that have combined surgical and medical factors, rates of complications early after ATSA and RTSA have ranged from 3.6% to 17.8%.26,38,39 After SAs, medical complications (80%) are more common than surgical complications (20%).39 In the present cohort, many more readmissions were for medical complications (67%) than for surgical complications (33%). In addition, Schairer and colleagues3 found medical complications associated with more than 80% of readmissions after SA.3 Infection was the most common medical reason (pneumonia) and surgical reason (surgical-site infection) for readmission—consistent with findings of other studies.3,35,40 Infection has accounted for 9.4% to 41.4% of readmissions after ATSA and RTSA.3,14In joint arthroplasty, infection occurs more often in patients with coexisting medical comorbidities, leading to higher mortality and increased LOS.41 Prosthetic joint dislocation was common as well—similar to findings in other studies.3,10In the present study, 33% of known readmission diagnoses were secondary to HACs. Surgical-site infection was the most common, followed by CAUTI, DVT, and PE. In another study, of knee and hip arthroplasties, HACs accounted for more than 40% of all complications and were the strongest predictor of early readmission.16 In SA studies, HACs were responsible for 9.3% to 34.5% of readmissions after ATSA and RTSA.3,14 Our finding (33%) is more in line with Mahoney and colleagues14 (34.5%) than Schairer and colleagues3 (9.3%). One explanation for the large discrepancy with Schairer and colleagues3 is that UTI was not among the medical reasons for readmission in their study, but it was in ours. Another difference is that we used a database that included data from multiple institutions. Last, Schairer and colleagues3 excluded revision SAs from their analysis (complication rates are higher for revision SAs than for primary SAs30). They also excluded cases of SA used for fracture (shown to increase the risk for PE42). The US Department of Health and Human Services estimated that patients experienced 1.3 million fewer HACs during the period 2010-2013, corresponding to a 17% decline over the 3 years.43 This translates to an estimated 50,000 fewer mortalities, and $12 billion saved in healthcare costs, over the same period.43 Preventing HACs helps reduce readmission rates while improving patient outcomes and decreasing healthcare costs.
This study had several limitations. We could not differentiate between ATSA and RTSA readmission rates because, for the study period, these procedures are collectively organized under a common CPT code in the NSQIP database. Readmission and complication rates are higher for RTSAs than for ATSAs.3,14 In addition, our data were limited to hospitals that were participating in NSQIP, which could lead to selection bias. We studied rates of only those readmissions and complications that occurred within 30 days, but many complications develop after 30 days, and these increase the readmission rate. Last, reasons for readmission were not recorded for 2011, so this information was available only for the final 2 years of the study. Despite these limitations, NSQIP still allows for a powerful study, as it includes multiple institutions and a very large cohort.
Conclusion
With medical costs increasing, focus has shifted to quality care and good outcomes with the goal of reducing readmissions and complications after various procedures. SA has recently become more popular because of its multiple indications, and this trend will continue. In the present study, the rate of readmission within 30 days after ATSA or RTSA was 2.7%. Revision surgery, 3 or more comorbidities, and extended LOS were independent risk factors that more than doubled the risk of readmission. Understanding the risk factors for short-term readmission will allow for better patient care and decreased costs, and will benefit the healthcare system as a whole.
Am J Orthop. 2016;45(6):E386-E392. Copyright Frontline Medical Communications Inc. 2016. All rights reserved.
1. Jencks SF, Williams MV, Coleman EA. Rehospitalizations among patients in the Medicare fee-for-service program. N Engl J Med. 2009;360(14):1418-1428.
2. Axon RN, Williams MV. Hospital readmission as an accountability measure. JAMA. 2011;305(5):504-505.
3. Schairer WW, Zhang AL, Feeley BT. Hospital readmissions after primary shoulder arthroplasty. J Shoulder Elbow Surg. 2014;23(9):1349-1355.
4. Day JS, Lau E, Ong KL, Williams GR, Ramsey ML, Kurtz SM. Prevalence and projections of total shoulder and elbow arthroplasty in the United States to 2015. J Shoulder Elbow Surg. 2010;19(8):1115-1120.
5. Kim SH, Wise BL, Zhang Y, Szabo RM. Increasing incidence of shoulder arthroplasty in the United States. J Bone Joint Surg Am. 2011;93(24):2249-2254.
6. Jain NB, Yamaguchi K. The contribution of reverse shoulder arthroplasty to utilization of primary shoulder arthroplasty. J Shoulder Elbow Surg. 2014;23(12):1905-1912.
7. Bartelt R, Sperling JW, Schleck CD, Cofield RH. Shoulder arthroplasty in patients aged fifty-five years or younger with osteoarthritis. J Shoulder Elbow Surg. 2011;20(1):123-130.
8. Chalmers PN, Slikker W 3rd, Mall NA, et al. Reverse total shoulder arthroplasty for acute proximal humeral fracture: comparison to open reduction–internal fixation and hemiarthroplasty. J Shoulder Elbow Surg. 2014;23(2):197-204.
9. Norris TR, Iannotti JP. Functional outcome after shoulder arthroplasty for primary osteoarthritis: a multicenter study. J Shoulder Elbow Surg. 2002;11(2):130-135.
10. Wall B, Nové-Josserand L, O’Connor DP, Edwards TB, Walch G. Reverse total shoulder arthroplasty: a review of results according to etiology. J Bone Joint Surg Am. 2007;89(7):1476-1485.
11. Fevang BT, Lygre SH, Bertelsen G, Skredderstuen A, Havelin LI, Furnes O. Good function after shoulder arthroplasty. Acta Orthop. 2012;83(5):467-473.
12. Orfaly RM, Rockwood CA Jr, Esenyel CZ, Wirth MA. Shoulder arthroplasty in cases with avascular necrosis of the humeral head. J Shoulder Elbow Surg. 2007;16(3 suppl):S27-S32.
13. Sperling JW, Cofield RH, Rowland CM. Minimum fifteen-year follow-up of Neer hemiarthroplasty and total shoulder arthroplasty in patients aged fifty years or younger. J Shoulder Elbow Surg. 2004;13(6):604-613.
14. Mahoney A, Bosco JA 3rd, Zuckerman JD. Readmission after shoulder arthroplasty. J Shoulder Elbow Surg. 2014;23(3):377-381.
15. Fehringer EV, Mikuls TR, Michaud KD, Henderson WG, O’Dell JR. Shoulder arthroplasties have fewer complications than hip or knee arthroplasties in US veterans. Clin Orthop Relat Res. 2010;468(3):717-722.
16. Raines BT, Ponce BA, Reed RD, Richman JS, Hawn MT. Hospital acquired conditions are the strongest predictor for early readmission: an analysis of 26,710 arthroplasties. J Arthroplasty. 2015;30(8):1299-1307.
17. Pugely AJ, Callaghan JJ, Martin CT, Cram P, Gao Y. Incidence of and risk factors for 30-day readmission following elective primary total joint arthroplasty: analysis from the ACS-NSQIP. J Arthroplasty. 2013;28(9):1499-1504.
18. Centers for Medicare & Medicaid Services. Hospital-Acquired Conditions. http://www.cms.gov/Medicare/Medicare-Fee-for-Service-Payment/HospitalAcqCond/Hospital-Acquired_Conditions.html. Published 2014. Accessed May 21, 2015.
19. Feigenbaum P, Neuwirth E, Trowbridge L, et al. Factors contributing to all-cause 30-day readmissions: a structured case series across 18 hospitals. Med Care. 2012;50(7):599-605.
20. Hall BL, Hamilton BH, Richards K, Bilimoria KY, Cohen ME, Ko CY. Does surgical quality improve in the American College of Surgeons National Surgical Quality Improvement Program: an evaluation of all participating hospitals. Ann Surg. 2009;250(3):363-376.
21. American College of Surgeons. About ACS NSQIP. http://www.facs.org/quality-programs/acs-nsqip/about. Published 2015. Accessed June 14, 2015.
22. Shiloach M, Frencher SK Jr, Steeger JE, et al. Toward robust information: data quality and inter-rater reliability in the American College of Surgeons National Surgical Quality Improvement Program. J Am Coll Surg. 2010;210(1):6-16.
23. Bini SA, Fithian DC, Paxton LW, Khatod MX, Inacio MC, Namba RS. Does discharge disposition after primary total joint arthroplasty affect readmission rates? J Arthroplasty. 2010;25(1):114-117.
24. Husted H, Otte KS, Kristensen BB, Orsnes T, Kehlet H. Readmissions after fast-track hip and knee arthroplasty. Arch Orthop Trauma Surg. 2010;130(9):1185-1191.
25. Vorhies JS, Wang Y, Herndon J, Maloney WJ, Huddleston JI. Readmission and length of stay after total hip arthroplasty in a national Medicare sample. J Arthroplasty. 2011;26(6 suppl):119-123.
26. Ponce BA, Oladeji LO, Rogers ME, Menendez ME. Comparative analysis of anatomic and reverse total shoulder arthroplasty: in-hospital outcomes and costs. J Shoulder Elbow Surg. 2015;24(3):460-467.
27. Bozic KJ, Maselli J, Pekow PS, Lindenauer PK, Vail TP, Auerbach AD. The influence of procedure volumes and standardization of care on quality and efficiency in total joint replacement surgery. J Bone Joint Surg Am. 2010;92(16):2643-2652.
28. Tsai TC, Orav EJ, Joynt KE. Disparities in surgical 30-day readmission rates for Medicare beneficiaries by race and site of care. Ann Surg. 2014;259(6):1086-1090.
29. Bohsali KI, Wirth MA, Rockwood CA Jr. Complications of total shoulder arthroplasty. J Bone Joint Surg Am. 2006;88(10):2279-2292.
30. Saltzman BM, Chalmers PN, Gupta AK, Romeo AA, Nicholson GP. Complication rates comparing primary with revision reverse total shoulder arthroplasty. J Shoulder Elbow Surg. 2014;23(11):1647-1654.
31. Black EM, Roberts SM, Siegel E, Yannopoulos P, Higgins LD, Warner JJ. Reverse shoulder arthroplasty as salvage for failed prior arthroplasty in patients 65 years of age or younger. J Shoulder Elbow Surg. 2014;23(7):1036-1042.
32. Menendez ME, Baker DK, Fryberger CT, Ponce BA. Predictors of extended length of stay after elective shoulder arthroplasty. J Shoulder Elbow Surg. 2015;24(10):1527-1533.
33. Jain NB, Guller U, Pietrobon R, Bond TK, Higgins LD. Comorbidities increase complication rates in patients having arthroplasty. Clin Orthop Relat Res. 2005;(435):232-238.
34. Martin CT, Gao Y, Pugely AJ, Wolf BR. 30-day morbidity and mortality after elective shoulder arthroscopy: a review of 9410 cases. J Shoulder Elbow Surg. 2013;22(12):1667-1675.e1.
35. Dailey EA, Cizik A, Kasten J, Chapman JR, Lee MJ. Risk factors for readmission of orthopaedic surgical patients. J Bone Joint Surg Am. 2013;95(11):1012-1019.
36. Dunn JC, Lanzi J, Kusnezov N, Bader J, Waterman BR, Belmont PJ Jr. Predictors of length of stay after elective total shoulder arthroplasty in the United States. J Shoulder Elbow Surg. 2015;24(5):754-759.
37. Maile MD, Engoren MC, Tremper KK, Jewell E, Kheterpal S. Worsening preoperative heart failure is associated with mortality and noncardiac complications, but not myocardial infarction after noncardiac surgery: a retrospective cohort study. Anesth Analg. 2014;119(3):522-532.
38. Farng E, Zingmond D, Krenek L, Soohoo NF. Factors predicting complication rates after primary shoulder arthroplasty. J Shoulder Elbow Surg. 2011;20(4):557-563.
39. Waterman BR, Dunn JC, Bader J, Urrea L, Schoenfeld AJ, Belmont PJ Jr. Thirty-day morbidity and mortality after elective total shoulder arthroplasty: patient-based and surgical risk factors. J Shoulder Elbow Surg. 2015;24(1):24-30.
40. Kassin MT, Owen RM, Perez SD, et al. Risk factors for 30-day hospital readmission among general surgery patients. J Am Coll Surg. 2012;215(3):322-330.
41. Poultsides LA, Ma Y, Della Valle AG, Chiu YL, Sculco TP, Memtsoudis SG. In-hospital surgical site infections after primary hip and knee arthroplasty—incidence and risk factors. J Arthroplasty. 2013;28(3):385-389.
42. Young BL, Menendez ME, Baker DK, Ponce BA. Factors associated with in-hospital pulmonary embolism after shoulder arthroplasty. J Shoulder Elbow Surg. 2015;24(10):e271-e278.
43. US Department of Health and Human Services. Efforts to improve patient safety result in 1.3 million fewer patient harms, 50,000 lives saved and $12 billion in health spending avoided [press release]. http://www.hhs.gov/news/press/2014pres/12/20141202a.html. Published December 2, 2014. Accessed May 25, 2015.
Hospital readmissions are undesirable and expensive.1 The Centers for Medicare & Medicaid Services (CMS) use hospital readmission rates as one measure of healthcare quality and hospital performance.2 In addition, the Patient Protection and Affordable Care Act of 2010 established a provision that decreases payments to hospitals with above-average readmission rates.3 Total knee arthroplasties (TKAs) and total hip arthroplasties (THAs) are among the most common surgical procedures leading to readmission and cost almost $20 billion dollars annually in the Medicare population alone.1 Identifying factors that lead to readmissions after certain popular procedures may be a way to improve healthcare quality and outcomes while decreasing costs.
One such operation is shoulder arthroplasty (SA), which has surged in popularity over the past decade and is projected to increase faster than TKAs and THAs.4-6 SA is used to treat a variety of shoulder conditions, including osteoarthritis, inflammatory arthritis, severe proximal humeral fracture, avascular necrosis, and rotator cuff tear arthropathy.7-12 Much as with knee and hip arthroplasty, good outcomes have been reported with SA: decreased pain, improved range of motion, and high patient satisfaction.10,13 However, there have been few studies of rates of readmission after SA and the associated risk factors.3,14,15 The reported rates of early readmission after SA have ranged from 5.6% to 7.3%.3,14,15 These rates are comparable to rates of readmission after TKA (4.0%-6.6%) and THA (3.5%-8.4%).15-17Recently, CMS introduced legislation to void payments for hospital-acquired conditions (HACs), preventable medical conditions that patients develop during or as a result of their hospital care and that were not present on admission.18 Although many factors contribute to readmission, a recent study regarding all-cause readmission during the first 30 days after discharge found that almost 50% of 30-day readmissions after knee and hip replacements were potentially preventable.19 HACs resulting in readmission after SAs make up 9.3% to 34.5% of all readmissions, after anatomical total shoulder arthroplasties (ATSAs) and reverse total shoulder arthroplasties (RTSAs).3,14 The most common HACs include retained foreign body after surgery, air embolism, falls and trauma, catheter-associated urinary tract infection (CAUTI), surgical-site infection, deep vein thrombosis (DVT), and pulmonary embolism (PE).18 Raines and colleagues16 found that HACs accounted for 41.7% of all complications in knee or hip arthroplasty and that HACs were the greatest predictors of early readmission after both procedures.
We conducted a study to evaluate rates of readmission within 30 days after ATSA and RTSA and to describe the independent risk factors for readmission. We hypothesized that the rate of readmission after SA would be similar to the rate after knee and hip arthroplasty and that readmission risk factors would be similar. Elucidating these rates and associated risk factors may ultimately help to minimize the burden of disability on patients and the burden of financial costs on healthcare institutions.
Materials and Methods
Institutional Review Board approval was not required for this study, and all data used were de-identified to Health Insurance Portability and Accountability Act (HIPAA) standards. We used the American College of Surgeons (ACS) National Surgical Quality Improvement Program (NSQIP) database for this study. The NSQIP was developed in the 1990s to improve surgical quality in the Veterans Health Administration and was later adapted by the ACS.20 NSQIP follows patients for 30 days after operations and provides clinical data and outcome measures that are closely regulated and internally audited.21 The program has continued to expand and now includes more than 400 institutions. The NSQIP database has been validated as a reliable source of surgical outcomes data, including outcomes data for orthopedic procedures, and has been used in other studies of readmissions.17,22
In the present study, the ACS-NSQIP files for the period 2011-2013 were queried for all total shoulder arthroplasties (TSAs) (Current Procedural Terminology [CPT] code 23472, which includes ATSA and RTSA). Descriptive analysis was performed to determine the overall readmission rate as well as the percentages of readmissions for medical and surgical complications. Reasons for readmission were collected from 2012 and 2013 (information from 2011 was absent).
The various patient parameters compiled within the database were examined in a review of ATSAs and RTSAs. Demographics, comorbidities, operative characteristics, and predischarge complications were amassed from these data. Demographics included age, sex, race, body mass index, smoking status, preoperative functional health status, and American Society of Anesthesiologists (ASA) score. Comorbidities included diabetes mellitus, hypertension, chronic corticosteroid use, coagulation disorder, peripheral vascular disease, chronic obstructive pulmonary disease (COPD), cardiac comorbidity (including congestive heart failure, history of myocardial infarction, previous coronary intervention or cardiac surgery, and angina), renal comorbidity (including acute renal failure and preoperative dialysis), neurologic comorbidity (including impaired sensorium, hemiplegia, history of transient ischemic attack, and history of cerebrovascular accident with or without residual deficit), and preoperative blood transfusion. Operative characteristics included resident involvement, operative time more than 1 SD from the mean (>164.4 minutes), intraoperative blood transfusion, and revision surgery. Predischarge complications included pneumonia, CAUTI, DVT, PE, postoperative bleeding that required transfusion, cerebrovascular accident, myocardial infarction, and sepsis. Surgical-site infection, CAUTI, DVT, and PE were selected for analysis because these HACs are common in our cohort.
After the data on these characteristics were collected, univariate analysis was performed to determine association with any readmission. Factors with P < .20 were then entered into multivariate analysis to determine independent risk factors for readmission. This P value was selected to make the model inclusive of any potentially important predictor. Univariate analysis was performed using the Fisher exact test. Multivariate analysis was performed using backward conditional binary logistic regression. Statistical significance was set at P < .05. All analysis was performed with SPSS Version 22.0 (SPSS).
Results
This study included a combined total of 3501 ATSAs and RTSAs performed between 2011 and 2013. The overall readmission rate was 2.7%. The associated diagnosis for readmission was available for 54% of the readmitted patients. Of the known readmission diagnoses, 33% were secondary to HACs.
Of the 51 readmissions, 34 (67%) were for medical complications, and 17 (33%) were for surgical complications. Pneumonia was the most common medical complication (11.8%), followed by UTI (7.8%), DVT (5.9%), PE (5.9%), and renal insufficiency (3.9%). Surgical-site infection was the most common surgical complication (13.7%), followed by prosthetic joint dislocation (9.8%) and hematoma (3.9%).
Other risk factors significantly (P < .05) associated with readmission were age over 75 years, dependent functional status, ASA score of 4 or higher, cardiac comorbidity, 2 or more comorbidities, postoperative CAUTI, extended LOS, and revision surgery (Table 3).
Discussion
Hospital readmissions are important because they represent quality of care and play a role in patient outcomes. Arthroplasty research has focused mainly on readmissions after primary knee and hip replacements.23-25
Historical rates of early readmission after SA14 are comparable to those found in our study. Previously identified risk factors have included increasing age, Medicaid insurance status, low-volume surgical centers, and SA type.3 Mahoney and colleagues14 reported a 90-day readmission rate of 5.9%, but, when they removed hemiarthroplasty replacement from the analysis and shortened the readmission timeline to 30 days, the readmission rate was identical to the 2.7% rate in the present study. In their series from a single high-volume institution, the highest 90-day readmission rate was found for hemiarthroplasty (8.8%), followed by RTSA (6.6%) and ATSA (4.5%). In a study by Schairer and colleagues,3 the readmission rate was also influenced by replacement type, but their results differed from those of Mahoney and colleagues.14 Schairer and colleagues3 analyzed data from 7 state inpatient databases and found that the highest readmission rate was associated with RTSA (11.2%), followed by hemiarthroplasty (8.2%) and ATSA (6.0%). In both series, RTSA readmission rates were higher than ATSA readmission rates—consistent with the complication profiles of these procedures, with RTSA often provided as a surgery of last resort, after failure of other procedures, including ATSA.26 The lower 30-day readmission rate in the present study may be attributable to the fact that some surgical and medical complications may not have developed within this short time. Nonetheless, the majority of readmissions typically present within the first 30 days after SA.14,15 Other factors, including hospital volume, surgeon volume, race, and hospital type, may also influence readmission rates but could not be compared between
The present study found that revision surgery, 3 or more comorbidities, and extended LOS (>4.3 days) more than doubled the risk of readmission. Published SA revision rates range from 5% to 42%, with most revisions performed for instability, dislocation, infection, and component loosening.6,29 Complication rates are higher for revision SA than for primary SA, which may explain why revisions predispose patients to readmission.30 Compared with primary SAs, revision SAs are also more likely to be RTSAs, and these salvage procedures have been found to have high complication rates.31 In the present study, the most common comorbidities were hypertension, diabetes, and COPD; the literature supports these as some of the most common comorbid medical conditions in patients who undergo ATSA or RTSA.5,26,32 Furthermore, all 3 of these comorbidities have been shown to be independent predictors of increased postoperative complications in patients who undergo SA, which ultimately would increase the risk of readmission.3,26,33,34 Last, extended LOS has also been shown to increase the risk of unplanned readmissions after orthopedic procedures.35 Risk factors associated with increased LOS after ATSA or RTSA include female sex, advanced age, multiple comorbidities, and postoperative complications.32Several other factors must be noted with respect to individual risk for readmission. In the present study, age over 75 years, dependent functional status, ASA score of 4 or higher, and cardiac comorbidity were found to have a significant association with readmission. Increased age is a risk factor for increased postoperative complications, more medical comorbidities, and increased LOS.34,36 Older people are at higher risk of developing osteoarthritis and rotator cuff tear arthropathy and are more likely to undergo SA.5,6 Older people also are more likely to be dependent, which itself is a risk factor for readmission.19 An ASA score of 3 or 4 has been found to be associated with increased LOS and complications after SA, and cardiac comorbidities predispose patients to a variety of complications.34,36,37In studies that have combined surgical and medical factors, rates of complications early after ATSA and RTSA have ranged from 3.6% to 17.8%.26,38,39 After SAs, medical complications (80%) are more common than surgical complications (20%).39 In the present cohort, many more readmissions were for medical complications (67%) than for surgical complications (33%). In addition, Schairer and colleagues3 found medical complications associated with more than 80% of readmissions after SA.3 Infection was the most common medical reason (pneumonia) and surgical reason (surgical-site infection) for readmission—consistent with findings of other studies.3,35,40 Infection has accounted for 9.4% to 41.4% of readmissions after ATSA and RTSA.3,14In joint arthroplasty, infection occurs more often in patients with coexisting medical comorbidities, leading to higher mortality and increased LOS.41 Prosthetic joint dislocation was common as well—similar to findings in other studies.3,10In the present study, 33% of known readmission diagnoses were secondary to HACs. Surgical-site infection was the most common, followed by CAUTI, DVT, and PE. In another study, of knee and hip arthroplasties, HACs accounted for more than 40% of all complications and were the strongest predictor of early readmission.16 In SA studies, HACs were responsible for 9.3% to 34.5% of readmissions after ATSA and RTSA.3,14 Our finding (33%) is more in line with Mahoney and colleagues14 (34.5%) than Schairer and colleagues3 (9.3%). One explanation for the large discrepancy with Schairer and colleagues3 is that UTI was not among the medical reasons for readmission in their study, but it was in ours. Another difference is that we used a database that included data from multiple institutions. Last, Schairer and colleagues3 excluded revision SAs from their analysis (complication rates are higher for revision SAs than for primary SAs30). They also excluded cases of SA used for fracture (shown to increase the risk for PE42). The US Department of Health and Human Services estimated that patients experienced 1.3 million fewer HACs during the period 2010-2013, corresponding to a 17% decline over the 3 years.43 This translates to an estimated 50,000 fewer mortalities, and $12 billion saved in healthcare costs, over the same period.43 Preventing HACs helps reduce readmission rates while improving patient outcomes and decreasing healthcare costs.
This study had several limitations. We could not differentiate between ATSA and RTSA readmission rates because, for the study period, these procedures are collectively organized under a common CPT code in the NSQIP database. Readmission and complication rates are higher for RTSAs than for ATSAs.3,14 In addition, our data were limited to hospitals that were participating in NSQIP, which could lead to selection bias. We studied rates of only those readmissions and complications that occurred within 30 days, but many complications develop after 30 days, and these increase the readmission rate. Last, reasons for readmission were not recorded for 2011, so this information was available only for the final 2 years of the study. Despite these limitations, NSQIP still allows for a powerful study, as it includes multiple institutions and a very large cohort.
Conclusion
With medical costs increasing, focus has shifted to quality care and good outcomes with the goal of reducing readmissions and complications after various procedures. SA has recently become more popular because of its multiple indications, and this trend will continue. In the present study, the rate of readmission within 30 days after ATSA or RTSA was 2.7%. Revision surgery, 3 or more comorbidities, and extended LOS were independent risk factors that more than doubled the risk of readmission. Understanding the risk factors for short-term readmission will allow for better patient care and decreased costs, and will benefit the healthcare system as a whole.
Am J Orthop. 2016;45(6):E386-E392. Copyright Frontline Medical Communications Inc. 2016. All rights reserved.
1. Jencks SF, Williams MV, Coleman EA. Rehospitalizations among patients in the Medicare fee-for-service program. N Engl J Med. 2009;360(14):1418-1428.
2. Axon RN, Williams MV. Hospital readmission as an accountability measure. JAMA. 2011;305(5):504-505.
3. Schairer WW, Zhang AL, Feeley BT. Hospital readmissions after primary shoulder arthroplasty. J Shoulder Elbow Surg. 2014;23(9):1349-1355.
4. Day JS, Lau E, Ong KL, Williams GR, Ramsey ML, Kurtz SM. Prevalence and projections of total shoulder and elbow arthroplasty in the United States to 2015. J Shoulder Elbow Surg. 2010;19(8):1115-1120.
5. Kim SH, Wise BL, Zhang Y, Szabo RM. Increasing incidence of shoulder arthroplasty in the United States. J Bone Joint Surg Am. 2011;93(24):2249-2254.
6. Jain NB, Yamaguchi K. The contribution of reverse shoulder arthroplasty to utilization of primary shoulder arthroplasty. J Shoulder Elbow Surg. 2014;23(12):1905-1912.
7. Bartelt R, Sperling JW, Schleck CD, Cofield RH. Shoulder arthroplasty in patients aged fifty-five years or younger with osteoarthritis. J Shoulder Elbow Surg. 2011;20(1):123-130.
8. Chalmers PN, Slikker W 3rd, Mall NA, et al. Reverse total shoulder arthroplasty for acute proximal humeral fracture: comparison to open reduction–internal fixation and hemiarthroplasty. J Shoulder Elbow Surg. 2014;23(2):197-204.
9. Norris TR, Iannotti JP. Functional outcome after shoulder arthroplasty for primary osteoarthritis: a multicenter study. J Shoulder Elbow Surg. 2002;11(2):130-135.
10. Wall B, Nové-Josserand L, O’Connor DP, Edwards TB, Walch G. Reverse total shoulder arthroplasty: a review of results according to etiology. J Bone Joint Surg Am. 2007;89(7):1476-1485.
11. Fevang BT, Lygre SH, Bertelsen G, Skredderstuen A, Havelin LI, Furnes O. Good function after shoulder arthroplasty. Acta Orthop. 2012;83(5):467-473.
12. Orfaly RM, Rockwood CA Jr, Esenyel CZ, Wirth MA. Shoulder arthroplasty in cases with avascular necrosis of the humeral head. J Shoulder Elbow Surg. 2007;16(3 suppl):S27-S32.
13. Sperling JW, Cofield RH, Rowland CM. Minimum fifteen-year follow-up of Neer hemiarthroplasty and total shoulder arthroplasty in patients aged fifty years or younger. J Shoulder Elbow Surg. 2004;13(6):604-613.
14. Mahoney A, Bosco JA 3rd, Zuckerman JD. Readmission after shoulder arthroplasty. J Shoulder Elbow Surg. 2014;23(3):377-381.
15. Fehringer EV, Mikuls TR, Michaud KD, Henderson WG, O’Dell JR. Shoulder arthroplasties have fewer complications than hip or knee arthroplasties in US veterans. Clin Orthop Relat Res. 2010;468(3):717-722.
16. Raines BT, Ponce BA, Reed RD, Richman JS, Hawn MT. Hospital acquired conditions are the strongest predictor for early readmission: an analysis of 26,710 arthroplasties. J Arthroplasty. 2015;30(8):1299-1307.
17. Pugely AJ, Callaghan JJ, Martin CT, Cram P, Gao Y. Incidence of and risk factors for 30-day readmission following elective primary total joint arthroplasty: analysis from the ACS-NSQIP. J Arthroplasty. 2013;28(9):1499-1504.
18. Centers for Medicare & Medicaid Services. Hospital-Acquired Conditions. http://www.cms.gov/Medicare/Medicare-Fee-for-Service-Payment/HospitalAcqCond/Hospital-Acquired_Conditions.html. Published 2014. Accessed May 21, 2015.
19. Feigenbaum P, Neuwirth E, Trowbridge L, et al. Factors contributing to all-cause 30-day readmissions: a structured case series across 18 hospitals. Med Care. 2012;50(7):599-605.
20. Hall BL, Hamilton BH, Richards K, Bilimoria KY, Cohen ME, Ko CY. Does surgical quality improve in the American College of Surgeons National Surgical Quality Improvement Program: an evaluation of all participating hospitals. Ann Surg. 2009;250(3):363-376.
21. American College of Surgeons. About ACS NSQIP. http://www.facs.org/quality-programs/acs-nsqip/about. Published 2015. Accessed June 14, 2015.
22. Shiloach M, Frencher SK Jr, Steeger JE, et al. Toward robust information: data quality and inter-rater reliability in the American College of Surgeons National Surgical Quality Improvement Program. J Am Coll Surg. 2010;210(1):6-16.
23. Bini SA, Fithian DC, Paxton LW, Khatod MX, Inacio MC, Namba RS. Does discharge disposition after primary total joint arthroplasty affect readmission rates? J Arthroplasty. 2010;25(1):114-117.
24. Husted H, Otte KS, Kristensen BB, Orsnes T, Kehlet H. Readmissions after fast-track hip and knee arthroplasty. Arch Orthop Trauma Surg. 2010;130(9):1185-1191.
25. Vorhies JS, Wang Y, Herndon J, Maloney WJ, Huddleston JI. Readmission and length of stay after total hip arthroplasty in a national Medicare sample. J Arthroplasty. 2011;26(6 suppl):119-123.
26. Ponce BA, Oladeji LO, Rogers ME, Menendez ME. Comparative analysis of anatomic and reverse total shoulder arthroplasty: in-hospital outcomes and costs. J Shoulder Elbow Surg. 2015;24(3):460-467.
27. Bozic KJ, Maselli J, Pekow PS, Lindenauer PK, Vail TP, Auerbach AD. The influence of procedure volumes and standardization of care on quality and efficiency in total joint replacement surgery. J Bone Joint Surg Am. 2010;92(16):2643-2652.
28. Tsai TC, Orav EJ, Joynt KE. Disparities in surgical 30-day readmission rates for Medicare beneficiaries by race and site of care. Ann Surg. 2014;259(6):1086-1090.
29. Bohsali KI, Wirth MA, Rockwood CA Jr. Complications of total shoulder arthroplasty. J Bone Joint Surg Am. 2006;88(10):2279-2292.
30. Saltzman BM, Chalmers PN, Gupta AK, Romeo AA, Nicholson GP. Complication rates comparing primary with revision reverse total shoulder arthroplasty. J Shoulder Elbow Surg. 2014;23(11):1647-1654.
31. Black EM, Roberts SM, Siegel E, Yannopoulos P, Higgins LD, Warner JJ. Reverse shoulder arthroplasty as salvage for failed prior arthroplasty in patients 65 years of age or younger. J Shoulder Elbow Surg. 2014;23(7):1036-1042.
32. Menendez ME, Baker DK, Fryberger CT, Ponce BA. Predictors of extended length of stay after elective shoulder arthroplasty. J Shoulder Elbow Surg. 2015;24(10):1527-1533.
33. Jain NB, Guller U, Pietrobon R, Bond TK, Higgins LD. Comorbidities increase complication rates in patients having arthroplasty. Clin Orthop Relat Res. 2005;(435):232-238.
34. Martin CT, Gao Y, Pugely AJ, Wolf BR. 30-day morbidity and mortality after elective shoulder arthroscopy: a review of 9410 cases. J Shoulder Elbow Surg. 2013;22(12):1667-1675.e1.
35. Dailey EA, Cizik A, Kasten J, Chapman JR, Lee MJ. Risk factors for readmission of orthopaedic surgical patients. J Bone Joint Surg Am. 2013;95(11):1012-1019.
36. Dunn JC, Lanzi J, Kusnezov N, Bader J, Waterman BR, Belmont PJ Jr. Predictors of length of stay after elective total shoulder arthroplasty in the United States. J Shoulder Elbow Surg. 2015;24(5):754-759.
37. Maile MD, Engoren MC, Tremper KK, Jewell E, Kheterpal S. Worsening preoperative heart failure is associated with mortality and noncardiac complications, but not myocardial infarction after noncardiac surgery: a retrospective cohort study. Anesth Analg. 2014;119(3):522-532.
38. Farng E, Zingmond D, Krenek L, Soohoo NF. Factors predicting complication rates after primary shoulder arthroplasty. J Shoulder Elbow Surg. 2011;20(4):557-563.
39. Waterman BR, Dunn JC, Bader J, Urrea L, Schoenfeld AJ, Belmont PJ Jr. Thirty-day morbidity and mortality after elective total shoulder arthroplasty: patient-based and surgical risk factors. J Shoulder Elbow Surg. 2015;24(1):24-30.
40. Kassin MT, Owen RM, Perez SD, et al. Risk factors for 30-day hospital readmission among general surgery patients. J Am Coll Surg. 2012;215(3):322-330.
41. Poultsides LA, Ma Y, Della Valle AG, Chiu YL, Sculco TP, Memtsoudis SG. In-hospital surgical site infections after primary hip and knee arthroplasty—incidence and risk factors. J Arthroplasty. 2013;28(3):385-389.
42. Young BL, Menendez ME, Baker DK, Ponce BA. Factors associated with in-hospital pulmonary embolism after shoulder arthroplasty. J Shoulder Elbow Surg. 2015;24(10):e271-e278.
43. US Department of Health and Human Services. Efforts to improve patient safety result in 1.3 million fewer patient harms, 50,000 lives saved and $12 billion in health spending avoided [press release]. http://www.hhs.gov/news/press/2014pres/12/20141202a.html. Published December 2, 2014. Accessed May 25, 2015.
An Automated Electronic Tool to Assess the Risk of 30-Day Readmission: Validation of Predictive Performance
From the Divisions of Hospital Medicine (Drs. Dawson, Chirila, Bhide, and Burton) and Biomedical Statistics and Informatics (Ms. Thomas), Mayo Clinic, Jacksonville, FL, and the Division of Hospital Medicine, Mayo Clinic, Phoenix, AZ (Dr. Cannon).
Abstract
- Objective: To validate an electronic tool created to identify inpatients who are at risk of readmission within 30 days and quantify the predictive performance of the readmission risk score (RRS).
- Methods: Retrospective cohort study including inpa-tients who were discharged between 1 Nov 2012 and 31 Dec 2012. The ability of the RRS to discriminate between those who did and did not have a 30-day urgent readmission was quantified by the c statistic. Calibration was assessed by plotting the observed and predicted probability of 30-day urgent readmission. Predicted probabilities were obtained from generalized estimating equations, clustering on patient.
- Results: Of 1689 hospital inpatient discharges (1515 patients), 159 (9.4%) had a 30-day urgent readmission. The RRS had some discriminative ability (c statistic: 0.612; 95% confidence interval: 0.570–0.655) and good calibration.
- Conclusions: Our study shows that the RRS has some discriminative ability. The automated tool can be used to estimate the probability of a 30-day urgent readmission.
Hospital readmissions are increasingly scrutinized by the Center for Medicare and Medicaid Services and other payers due to their frequency and high cost. It is estimated that up to 25% of all patients discharged from acute care hospitals are readmitted within 30 days [1]. To address this problem, the Center for Medicare and Medicaid Services is using these rates as one of the benchmarks for quality for hospitals and health care organizations and has begun to assess penalties to those institutions with the highest rates. This scrutiny and the desire for better patient care transitions has resulted in most hospitals implementing various initiatives to reduce potentially avoidable readmissions.
Multiple interventions have been shown to reduce readmissions [2,3]. These interventions have varying effectiveness and are often labor intensive and thus costly to the institutions implementing them. In fact, no one intervention has been shown to be effective alone [4], and it may take several concurrent interventions targeting the highest risk patients to improve transitions of care at discharge that result in reduced readmissions. Many experts do recommend risk stratifying patients in order to target interventions to the highest risk patients for effective use of resources [5,6]. Several risk factor assessments have been proposed with varying success [7–13]. Multiple factors can limit the effectiveness of these risk stratification profiles. They may have low sensitivity and specificity, be based solely on retrospective data, be limited to certain populations, or be created from administrative data only without taking psychosocial factors into consideration [14].
An effective risk assessment ideally would encompass multiple known risk factors including certain comorbidities such as malignancy and heart failure, psychosocial factors such as health literacy and social support, and administrative data including payment source and demographics. All of these have been shown in prior studies to contribute to readmissions [7–13]. In addition, availability of the assessment early in the hospitalization would allow for interventions throughout the hospital stay to mitigate the effect of these factors where possible. To address these needs, our institution formed a readmission task force in January 2010 to review published literature on hospital 30-day readmissions and create a readmission risk score (RRS). The aim of this study was to quantify the predictive performance of the RRS after it was first implemented into the electronic medical record (EMR) in November 2012.
Methods
Study Design and Cohort
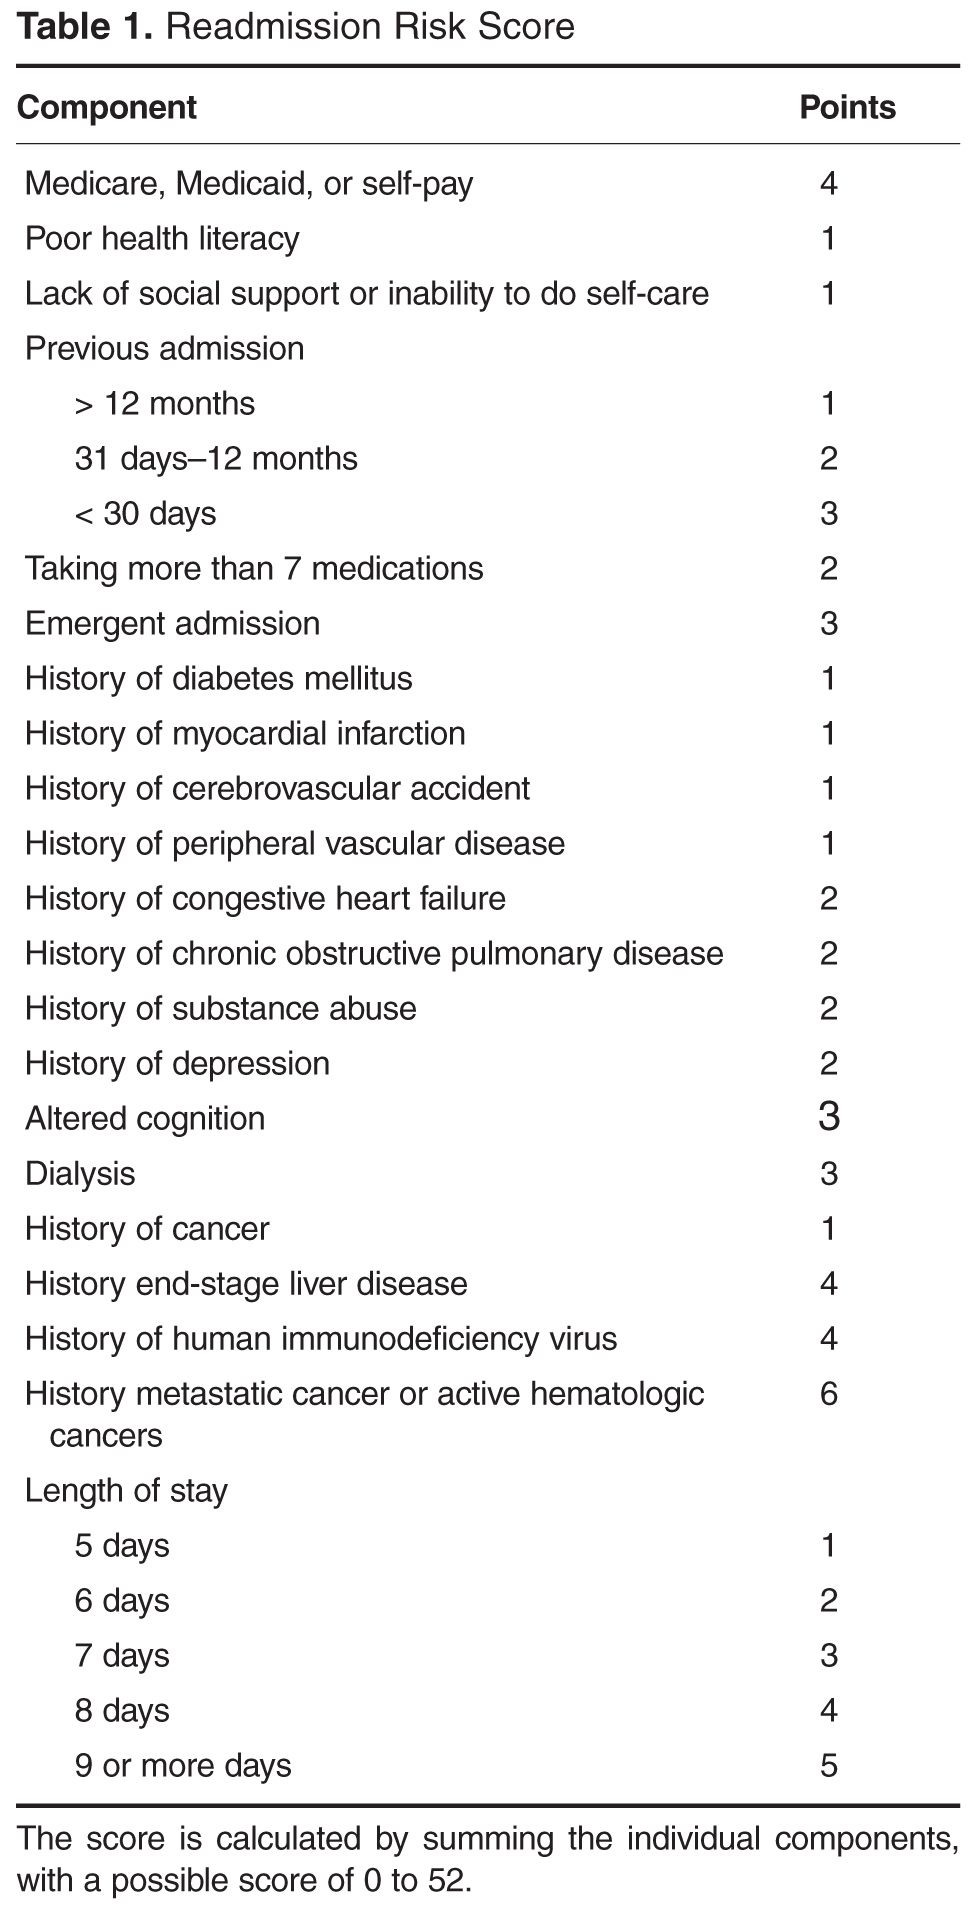
All consecutive adult inpatients who were discharged between 1 November 2012 and 31 December 2012 were included in this retrospective cohort study. This narrow time frame corresponded to the period from RRS tool implementation to the start of readmission interventions. We excluded hospitalizations if the patient died in the hospital.
Outcome Measures
The primary outcome was a 30-day urgent readmission, which included readmissions categorized as either emergency, urgent, or semi-urgent. Secondary outcomes included any 30-day readmission and 30-day death. Only readmissions to Mayo Clinic were examined.
Predictors
In collaboration with the information technology department, an algorithm was written to extract data from the EMR for each patient within 24 hours of admission to the hospital. This data was retrieved from existing repositories of patient information, such as demographic information, payer source, medication list, problem list, and past medical history. In addition, each patient was interviewed by a nurse at the time of admission, and the nurse completed an “admission profile” in the EMR that confirmed or entered past medical history, medications, social support at home, depression symptoms, and learning styles, among other information (Table 1). The algorithm was able to extract data from this evaluation also, so that each element of the risk score was correlated to at least one data source in the EMR. The algorithm then assigned the correct value to each element, and the total score was electronically calculated and placed in a discrete cell in each patient’s record. The algorithm was automatically run again 48 hours after the initial scoring in order to assure completeness of the information. If the patient had a length of stay greater than 5 days, an additional score was generated to include the length of stay component.
Statistical Analysis
The predictive performance of the RRS was assessed by evaluating the discrimination and calibration. Discrimination is the ability of the RRS to separate those who had a 30-day urgent readmission and those who did not. Discrimination was quantified by the c statistic, which is equivalent to the area under the receiver operating characteristic curve in this study owing to the use of binary endpoints. A c statistic of 1.0 would indicate that the RRS perfectly predicts 30-day urgent readmission while a c statistic of 0.5 would indicate the RRS has no apparent accuracy in predicting 30-day urgent readmission. Calibration assesses how closely predicted outcomes agree with observed outcomes. The predicted probability of 30-day urgent readmission was estimated utilizing a generalized estimating equation model, clustering on patient, with RRS as the only predictor variable. Inpatient discharges were divided into deciles of the predicted probabilities for 30-day urgent readmission. Agreement of the predicted and observed outcomes was displayed graphically according to decile of the predicted outcomes. All analyses were performed using SAS (version 9.3, SAS Institute, Cary, NC) and R statistical software (version 3.1.1, R Foundation for Statistical Computing, Vienna, Austria).
Results
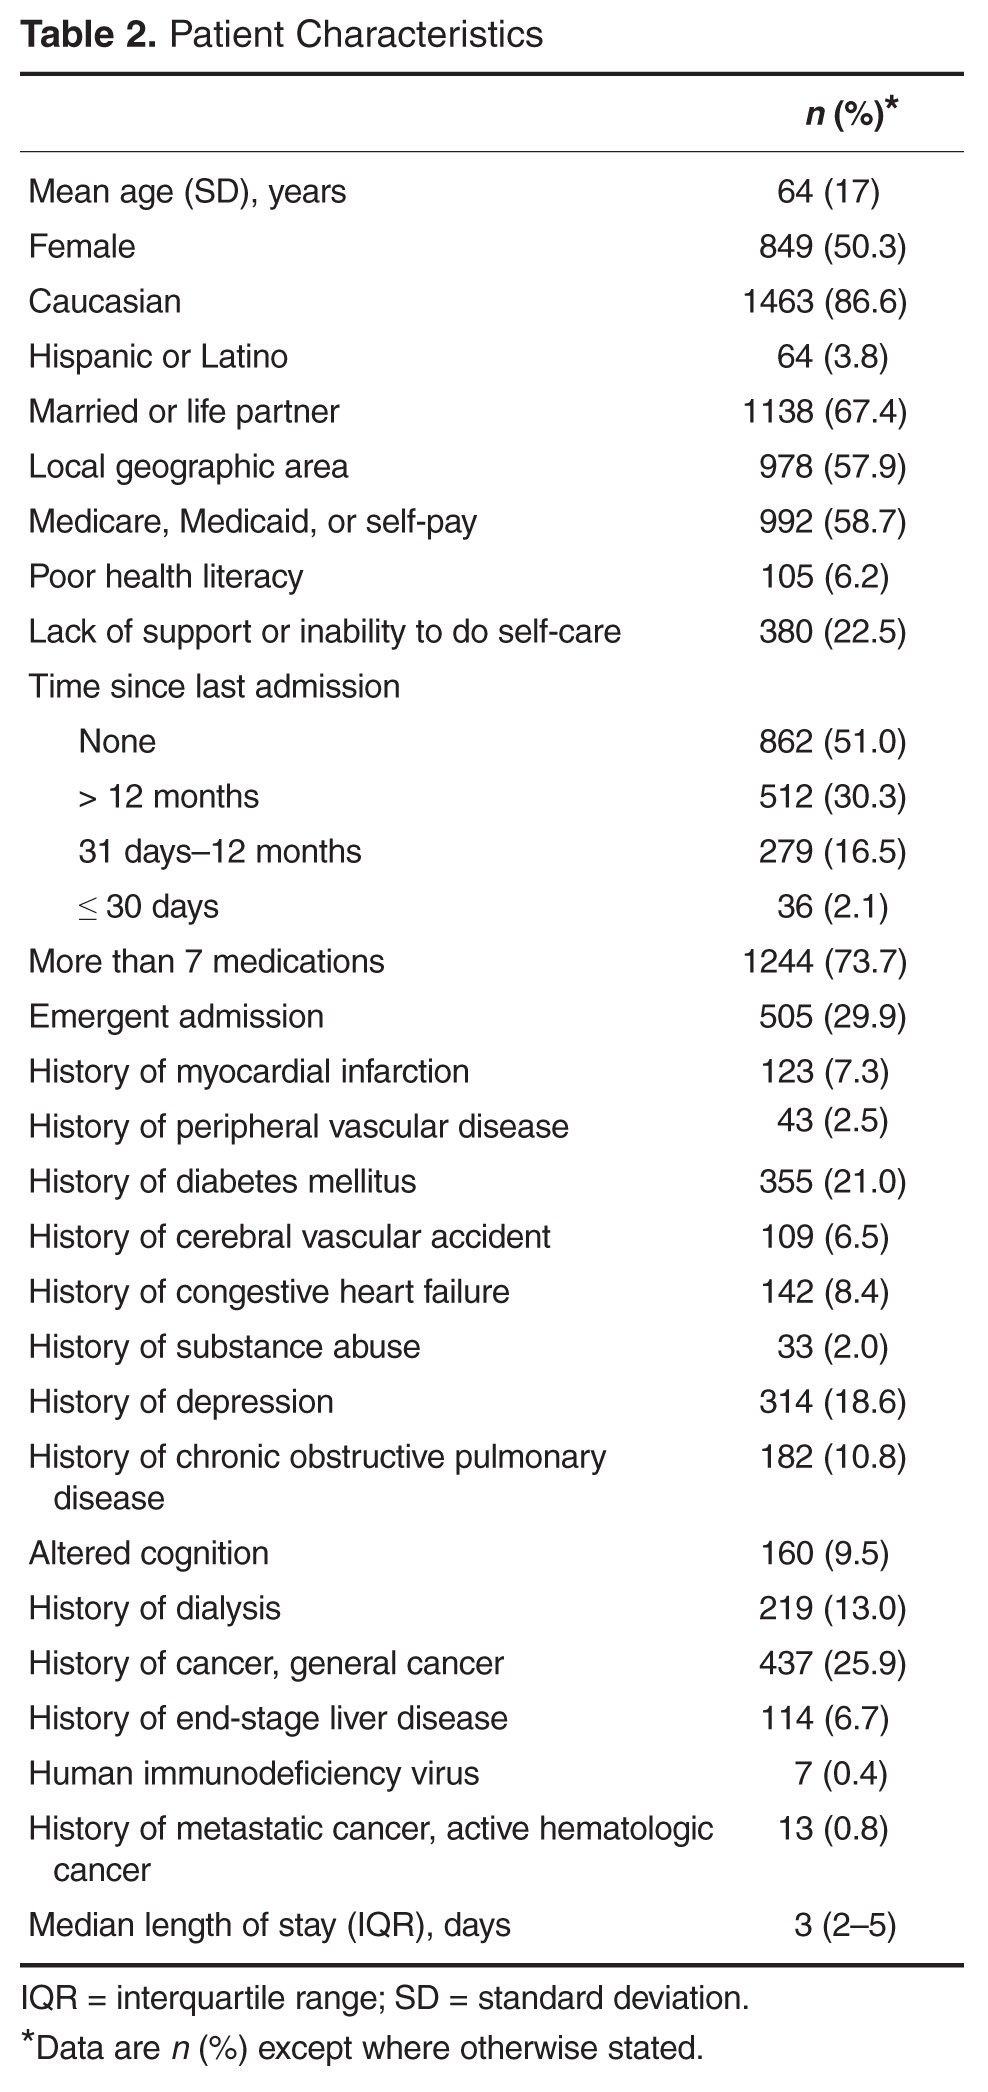
The RRS was significantly associated with 30-day urgent readmission (odds ratio [OR] for 1-point increase in the RRS, 1.07 [95% confidence interval {CI} 1.05–1.10]; P < 0.001). A c statistic of 0.612 (95% CI 0.570–0.655) indicates that the RRS has some ability to discriminate between those with and without a 30-day urgent readmission (Figure, Table 3). The expected and observed probabilities of 30-day urgent readmission were similar in each decile of the RRS. The calibration (Table 4) shows that although there is some deviation between the observed and expected probabilities, 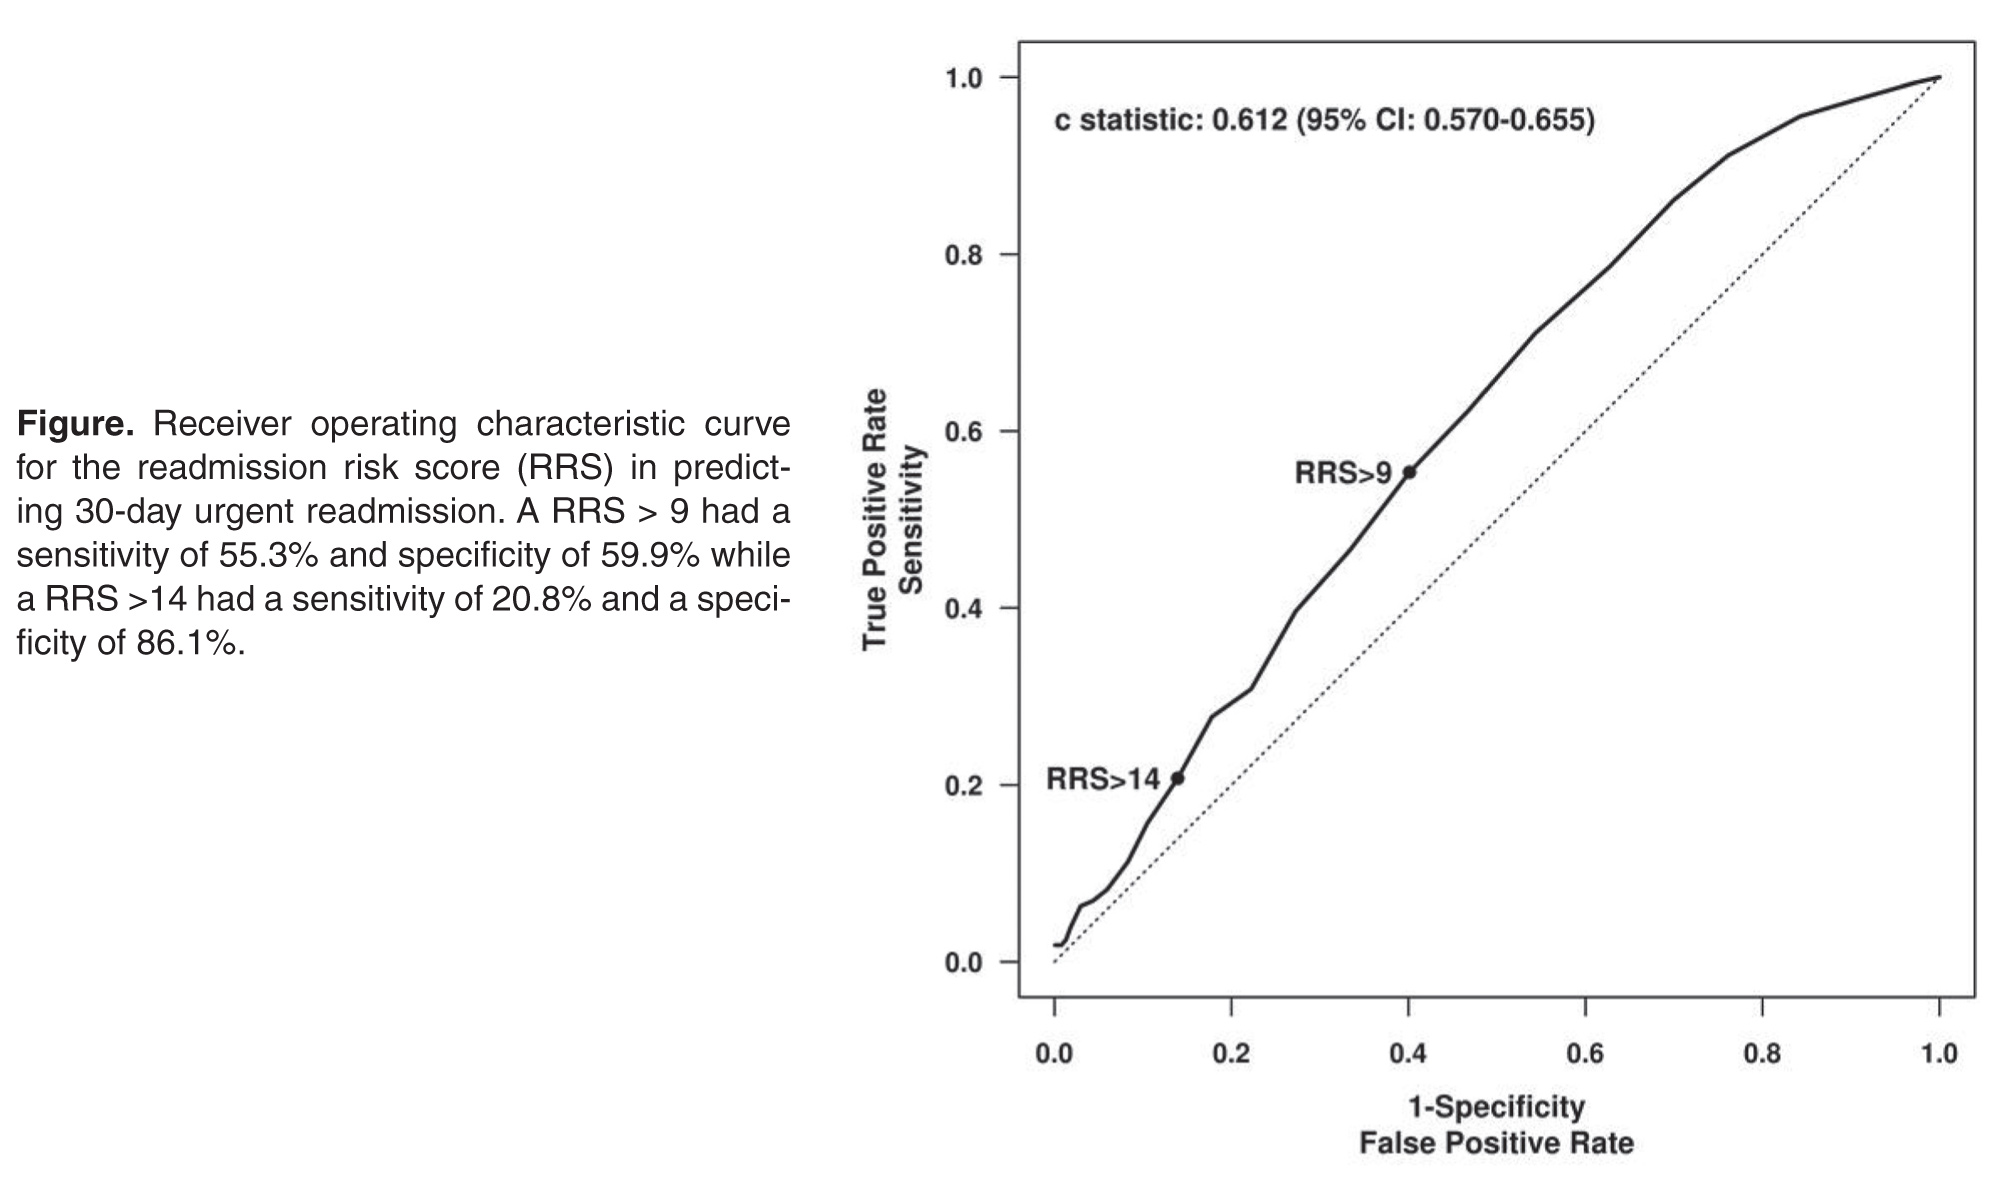
The RRS was also significantly associated with each of the secondary outcome measures. The odds ratios for a 1-point increase in the RRS for any 30-day readmission was 1.06 (95% CI 1.03–1.09, P < 0.001) and the c statistic was 0.591 (95% CI 0.551–0.631, Table 2). The odds ratios for a 1-point increase in the 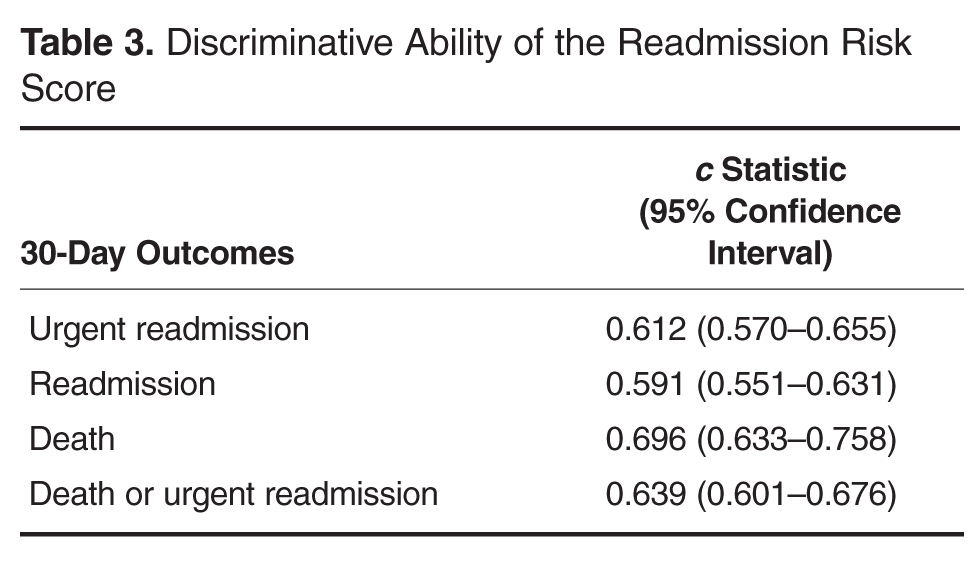
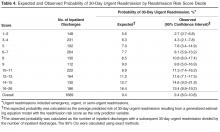
Discussion

Our study provides evidence that the RRS has some ability to discriminate between patients who did and did not have a 30-day urgent readmission (c statistic 0.612 [95% CI 0.570–0.655]). More importantly the calibration appears to be good particularly in the higher risk patients, which are the most crucial to identify in order to target interventions.
In addition to predicting the risk of readmission, our method of risk evaluation has several other advantages. First, the risk score is assigned to each patient within 24 to 48 hours of admission by using elements available at the time of, or soon after, admission. This early evaluation during the hospitalization identifies patients who could benefit from interventions throughout the stay that could help mitigate the risks and allow for a safer transition. Other studies have used elements available only at discharge, such as lab values and length of stay [7,11]. Donze et al used 7 elements in a validated scoring system, but several of the elements were discharge values and the risk assessment system had a fair discriminatory value with a c statistic of 0.71, similar to our results. The advantage to having the score available at admission is that several of the factors used to compose the RRS could be addressed during the hospitalization, including increased education for those with greater than 7 medications, intensive care management intervention for those with a lack of social support, and increased or modified education for those with low health literacy.
Second, the score is derived entirely from elements available in the EMR, thus the score is calculated automatically within 24 hours of admission and displayed in the chart for all providers to access. This eliminates any need for individual chart review or patient evaluation outside the normal admission process, making this system extremely efficient. Van Walraven et al [9] devised a scoring system using length of stay, acuity of admission, comorbidities and emergency department use (LACE index), with a validation c statistic of 0.684, which again is similar to our results. However, the LACE index uses the Charlson comorbidity index as a measure of patient comorbidity and this can be cumbersome to calculate in clinical practice. Having the score automatically available to all providers caring for the patient increases their awareness of the patient’s level of risk. Allaudeen and colleagues showed that providers are unable to intuitively predict those patients who are at high-risk for readmission [15]; therefore, an objective, readily available risk stratification is necessary to inform the providers.
Third, the risk scoring system uses elements from varied sources to include social, medical, and individual factors, all of which have been shown to increase risk of 30-day readmissions [9,15]. An accurate risk scoring system, ideally, should include elements from multiple sources, and use of the EMR allows for this varied compilation. The risk evaluation is done on every patient, regardless of admitting diagnosis, and in spite of this heterogeneous population, it was still found to be significantly accurate. Prior studies have looked at individual populations [7,10,12,13,16]; however, this can miss many patient populations that are also high-risk. Tailoring individual risk algorithms by diagnosis can also be labor intensive.
Our study has limitations. It is a retrospective study and included a relatively short study period of 2 months. This period was chosen because it represented the time from when the RRS was first implemented to when interventions to reduce readmission according to the RRS began, however, it still encompassed a significant number of discharges. We were only able to evaluate readmissions to our own facility; therefore, patients readmitted to other facilities were not included. Although readmission to any facility is undesirable, having a risk scoring system that can reliably predict readmission to the index admission hospital is still helpful. In addition, we only validated the risk score on patients in our own facility. A larger population from multiple facilities would be helpful for further validation. In spite of this limitation we would expect that most of our readmissions return to our own facility given our community setting. In fact, based on Medicare data for readmissions to all facilities, the difference in readmission rate between our facility and all facilities differs by less than 4%.
In summary, we developed a comprehensive risk scoring system that proved to be moderately predictive of readmission that encompasses multiple factors, is available to all providers early in a hospitalization, and is completely automated via the EMR. Further studies are ongoing to refine this score and improve the predictive performance.
Corresponding author: Nancy L. Dawson, MD, Division of Hospital Medicine, Mayo Clinic, 4500 San Pablo Road, Jacksonville, FL 32224, [email protected].
Financial disclosures: None.
1. Elixhauser A, Steiner C. Statistical Brief #153: Readmissions to U.S. hospitals by diagnosis, 2010. Agency for Healthcare Research and Quality; 2013. Available at www.hcup-us.ahrq.gov/reports/statbriefs/sb153.pdf.
2. Jack BW, Chetty VK, Anthony D, et al. A reengineered hospital discharge program to decrease rehospitalization: a randomized trial. Ann Intern Med 2009;150:178–87.
3. Boutwell A, Hwu S. Effective interventions to reduce rehospitalizations: a survey of the published evidence. Cambridge, MA: Institute for Healthcare Improvement; 2009. Available at www.ihi.org/resources/Pages/Publications/EffectiveInterventionsReduceRehospitalizationsASurveyPublishedEvidence.aspx.
4. Hansen LO, Young RS, Hinami K, et al. Interventions to reduce 30-day rehospitalization: a systematic review. Ann Intern Med 2011;155:520–8.
5. Kripalani S, Theobald CN, Anctil B, Vasilevskis EE. Reducing hospital readmission rates: current strategies and future directions. Ann Rev Med 2014;65:471–85.
6. Osei-Anto A, Joshi M, Audet AM, et al. Health care leader action guide to reduce avoidable readmissions. Chicago: Health Research & Educational Trust; 2010. Available at www.hret.org/care/projects/resources/readmissions_cp.pdf.
7. Zaya M, Phan A, Schwarz ER. Predictors of re-hospitalization in patients with chronic heart failure. World J Cardiol 2012;4:23–30.
8. Hu J, Gonsahn MD, Nerenz DR. Socioeconomic status and readmissions: evidence from an urban teaching hospital. Health Aff (Millwood) 2014;33:778–85.
9. van Walraven C, Dhalla IA, Bell C, et al. Derivation and validation of an index to predict early death or unplanned readmission after discharge from hospital to the community. CMAJ 2010;182:551–7.
10. Rana S, Tran T, Luo W, et al. Predicting unplanned readmission after myocardial infarction from routinely collected administrative hospital data. Aust Health Rev 2014;38:377–82.
11. Donze J, Aujesky D, Williams D, Schnipper JL. Potentially avoidable 30-day hospital readmissions in medical patients: derivation and validation of a prediction model. JAMA Intern Med 2013;173:632–8.
12. Kogon B, Jain A, Oster M, et al. Risk factors associated with readmission after pediatric cardiothoracic surgery. Ann Thorac Surg 2012;94:865–73.
13. Harhay M, Lin E, Pai A, et al. Early rehospitalization after kidney transplantation: assessing preventability and prognosis. Am J Transplant 2013;13:3164–72.
14. Preventing unnecessary readmissions: transcending the hospital’s four walls to achieve collaborative care coordination. The Advisory Board Company; 2010. Available at www.advisory.com/research/physician-executive-council/studies/2010/preventing-unnecessary-readmissions.
15. Allaudeen N, Schnipper JL, Orav EJ, et al. Inability of providers to predict unplanned readmissions. J Gen Intern Med 2011;26:771–6.
16. Calvillo-King L, Arnold D, Eubank KJ, et al. Impact of social factors on risk of readmission or mortality in pneumonia and heart failure: systematic review. J Gen Intern Med 2013;28:269–82.
From the Divisions of Hospital Medicine (Drs. Dawson, Chirila, Bhide, and Burton) and Biomedical Statistics and Informatics (Ms. Thomas), Mayo Clinic, Jacksonville, FL, and the Division of Hospital Medicine, Mayo Clinic, Phoenix, AZ (Dr. Cannon).
Abstract
- Objective: To validate an electronic tool created to identify inpatients who are at risk of readmission within 30 days and quantify the predictive performance of the readmission risk score (RRS).
- Methods: Retrospective cohort study including inpa-tients who were discharged between 1 Nov 2012 and 31 Dec 2012. The ability of the RRS to discriminate between those who did and did not have a 30-day urgent readmission was quantified by the c statistic. Calibration was assessed by plotting the observed and predicted probability of 30-day urgent readmission. Predicted probabilities were obtained from generalized estimating equations, clustering on patient.
- Results: Of 1689 hospital inpatient discharges (1515 patients), 159 (9.4%) had a 30-day urgent readmission. The RRS had some discriminative ability (c statistic: 0.612; 95% confidence interval: 0.570–0.655) and good calibration.
- Conclusions: Our study shows that the RRS has some discriminative ability. The automated tool can be used to estimate the probability of a 30-day urgent readmission.
Hospital readmissions are increasingly scrutinized by the Center for Medicare and Medicaid Services and other payers due to their frequency and high cost. It is estimated that up to 25% of all patients discharged from acute care hospitals are readmitted within 30 days [1]. To address this problem, the Center for Medicare and Medicaid Services is using these rates as one of the benchmarks for quality for hospitals and health care organizations and has begun to assess penalties to those institutions with the highest rates. This scrutiny and the desire for better patient care transitions has resulted in most hospitals implementing various initiatives to reduce potentially avoidable readmissions.
Multiple interventions have been shown to reduce readmissions [2,3]. These interventions have varying effectiveness and are often labor intensive and thus costly to the institutions implementing them. In fact, no one intervention has been shown to be effective alone [4], and it may take several concurrent interventions targeting the highest risk patients to improve transitions of care at discharge that result in reduced readmissions. Many experts do recommend risk stratifying patients in order to target interventions to the highest risk patients for effective use of resources [5,6]. Several risk factor assessments have been proposed with varying success [7–13]. Multiple factors can limit the effectiveness of these risk stratification profiles. They may have low sensitivity and specificity, be based solely on retrospective data, be limited to certain populations, or be created from administrative data only without taking psychosocial factors into consideration [14].
An effective risk assessment ideally would encompass multiple known risk factors including certain comorbidities such as malignancy and heart failure, psychosocial factors such as health literacy and social support, and administrative data including payment source and demographics. All of these have been shown in prior studies to contribute to readmissions [7–13]. In addition, availability of the assessment early in the hospitalization would allow for interventions throughout the hospital stay to mitigate the effect of these factors where possible. To address these needs, our institution formed a readmission task force in January 2010 to review published literature on hospital 30-day readmissions and create a readmission risk score (RRS). The aim of this study was to quantify the predictive performance of the RRS after it was first implemented into the electronic medical record (EMR) in November 2012.
Methods
Study Design and Cohort
All consecutive adult inpatients who were discharged between 1 November 2012 and 31 December 2012 were included in this retrospective cohort study. This narrow time frame corresponded to the period from RRS tool implementation to the start of readmission interventions. We excluded hospitalizations if the patient died in the hospital.
Outcome Measures
The primary outcome was a 30-day urgent readmission, which included readmissions categorized as either emergency, urgent, or semi-urgent. Secondary outcomes included any 30-day readmission and 30-day death. Only readmissions to Mayo Clinic were examined.
Predictors
In collaboration with the information technology department, an algorithm was written to extract data from the EMR for each patient within 24 hours of admission to the hospital. This data was retrieved from existing repositories of patient information, such as demographic information, payer source, medication list, problem list, and past medical history. In addition, each patient was interviewed by a nurse at the time of admission, and the nurse completed an “admission profile” in the EMR that confirmed or entered past medical history, medications, social support at home, depression symptoms, and learning styles, among other information (Table 1). The algorithm was able to extract data from this evaluation also, so that each element of the risk score was correlated to at least one data source in the EMR. The algorithm then assigned the correct value to each element, and the total score was electronically calculated and placed in a discrete cell in each patient’s record. The algorithm was automatically run again 48 hours after the initial scoring in order to assure completeness of the information. If the patient had a length of stay greater than 5 days, an additional score was generated to include the length of stay component.
Statistical Analysis
The predictive performance of the RRS was assessed by evaluating the discrimination and calibration. Discrimination is the ability of the RRS to separate those who had a 30-day urgent readmission and those who did not. Discrimination was quantified by the c statistic, which is equivalent to the area under the receiver operating characteristic curve in this study owing to the use of binary endpoints. A c statistic of 1.0 would indicate that the RRS perfectly predicts 30-day urgent readmission while a c statistic of 0.5 would indicate the RRS has no apparent accuracy in predicting 30-day urgent readmission. Calibration assesses how closely predicted outcomes agree with observed outcomes. The predicted probability of 30-day urgent readmission was estimated utilizing a generalized estimating equation model, clustering on patient, with RRS as the only predictor variable. Inpatient discharges were divided into deciles of the predicted probabilities for 30-day urgent readmission. Agreement of the predicted and observed outcomes was displayed graphically according to decile of the predicted outcomes. All analyses were performed using SAS (version 9.3, SAS Institute, Cary, NC) and R statistical software (version 3.1.1, R Foundation for Statistical Computing, Vienna, Austria).
Results
The RRS was significantly associated with 30-day urgent readmission (odds ratio [OR] for 1-point increase in the RRS, 1.07 [95% confidence interval {CI} 1.05–1.10]; P < 0.001). A c statistic of 0.612 (95% CI 0.570–0.655) indicates that the RRS has some ability to discriminate between those with and without a 30-day urgent readmission (Figure, Table 3). The expected and observed probabilities of 30-day urgent readmission were similar in each decile of the RRS. The calibration (Table 4) shows that although there is some deviation between the observed and expected probabilities,
The RRS was also significantly associated with each of the secondary outcome measures. The odds ratios for a 1-point increase in the RRS for any 30-day readmission was 1.06 (95% CI 1.03–1.09, P < 0.001) and the c statistic was 0.591 (95% CI 0.551–0.631, Table 2). The odds ratios for a 1-point increase in the
Discussion
Our study provides evidence that the RRS has some ability to discriminate between patients who did and did not have a 30-day urgent readmission (c statistic 0.612 [95% CI 0.570–0.655]). More importantly the calibration appears to be good particularly in the higher risk patients, which are the most crucial to identify in order to target interventions.
In addition to predicting the risk of readmission, our method of risk evaluation has several other advantages. First, the risk score is assigned to each patient within 24 to 48 hours of admission by using elements available at the time of, or soon after, admission. This early evaluation during the hospitalization identifies patients who could benefit from interventions throughout the stay that could help mitigate the risks and allow for a safer transition. Other studies have used elements available only at discharge, such as lab values and length of stay [7,11]. Donze et al used 7 elements in a validated scoring system, but several of the elements were discharge values and the risk assessment system had a fair discriminatory value with a c statistic of 0.71, similar to our results. The advantage to having the score available at admission is that several of the factors used to compose the RRS could be addressed during the hospitalization, including increased education for those with greater than 7 medications, intensive care management intervention for those with a lack of social support, and increased or modified education for those with low health literacy.
Second, the score is derived entirely from elements available in the EMR, thus the score is calculated automatically within 24 hours of admission and displayed in the chart for all providers to access. This eliminates any need for individual chart review or patient evaluation outside the normal admission process, making this system extremely efficient. Van Walraven et al [9] devised a scoring system using length of stay, acuity of admission, comorbidities and emergency department use (LACE index), with a validation c statistic of 0.684, which again is similar to our results. However, the LACE index uses the Charlson comorbidity index as a measure of patient comorbidity and this can be cumbersome to calculate in clinical practice. Having the score automatically available to all providers caring for the patient increases their awareness of the patient’s level of risk. Allaudeen and colleagues showed that providers are unable to intuitively predict those patients who are at high-risk for readmission [15]; therefore, an objective, readily available risk stratification is necessary to inform the providers.
Third, the risk scoring system uses elements from varied sources to include social, medical, and individual factors, all of which have been shown to increase risk of 30-day readmissions [9,15]. An accurate risk scoring system, ideally, should include elements from multiple sources, and use of the EMR allows for this varied compilation. The risk evaluation is done on every patient, regardless of admitting diagnosis, and in spite of this heterogeneous population, it was still found to be significantly accurate. Prior studies have looked at individual populations [7,10,12,13,16]; however, this can miss many patient populations that are also high-risk. Tailoring individual risk algorithms by diagnosis can also be labor intensive.
Our study has limitations. It is a retrospective study and included a relatively short study period of 2 months. This period was chosen because it represented the time from when the RRS was first implemented to when interventions to reduce readmission according to the RRS began, however, it still encompassed a significant number of discharges. We were only able to evaluate readmissions to our own facility; therefore, patients readmitted to other facilities were not included. Although readmission to any facility is undesirable, having a risk scoring system that can reliably predict readmission to the index admission hospital is still helpful. In addition, we only validated the risk score on patients in our own facility. A larger population from multiple facilities would be helpful for further validation. In spite of this limitation we would expect that most of our readmissions return to our own facility given our community setting. In fact, based on Medicare data for readmissions to all facilities, the difference in readmission rate between our facility and all facilities differs by less than 4%.
In summary, we developed a comprehensive risk scoring system that proved to be moderately predictive of readmission that encompasses multiple factors, is available to all providers early in a hospitalization, and is completely automated via the EMR. Further studies are ongoing to refine this score and improve the predictive performance.
Corresponding author: Nancy L. Dawson, MD, Division of Hospital Medicine, Mayo Clinic, 4500 San Pablo Road, Jacksonville, FL 32224, [email protected].
Financial disclosures: None.
1. Elixhauser A, Steiner C. Statistical Brief #153: Readmissions to U.S. hospitals by diagnosis, 2010. Agency for Healthcare Research and Quality; 2013. Available at www.hcup-us.ahrq.gov/reports/statbriefs/sb153.pdf.
2. Jack BW, Chetty VK, Anthony D, et al. A reengineered hospital discharge program to decrease rehospitalization: a randomized trial. Ann Intern Med 2009;150:178–87.
3. Boutwell A, Hwu S. Effective interventions to reduce rehospitalizations: a survey of the published evidence. Cambridge, MA: Institute for Healthcare Improvement; 2009. Available at www.ihi.org/resources/Pages/Publications/EffectiveInterventionsReduceRehospitalizationsASurveyPublishedEvidence.aspx.
4. Hansen LO, Young RS, Hinami K, et al. Interventions to reduce 30-day rehospitalization: a systematic review. Ann Intern Med 2011;155:520–8.
5. Kripalani S, Theobald CN, Anctil B, Vasilevskis EE. Reducing hospital readmission rates: current strategies and future directions. Ann Rev Med 2014;65:471–85.
6. Osei-Anto A, Joshi M, Audet AM, et al. Health care leader action guide to reduce avoidable readmissions. Chicago: Health Research & Educational Trust; 2010. Available at www.hret.org/care/projects/resources/readmissions_cp.pdf.
7. Zaya M, Phan A, Schwarz ER. Predictors of re-hospitalization in patients with chronic heart failure. World J Cardiol 2012;4:23–30.
8. Hu J, Gonsahn MD, Nerenz DR. Socioeconomic status and readmissions: evidence from an urban teaching hospital. Health Aff (Millwood) 2014;33:778–85.
9. van Walraven C, Dhalla IA, Bell C, et al. Derivation and validation of an index to predict early death or unplanned readmission after discharge from hospital to the community. CMAJ 2010;182:551–7.
10. Rana S, Tran T, Luo W, et al. Predicting unplanned readmission after myocardial infarction from routinely collected administrative hospital data. Aust Health Rev 2014;38:377–82.
11. Donze J, Aujesky D, Williams D, Schnipper JL. Potentially avoidable 30-day hospital readmissions in medical patients: derivation and validation of a prediction model. JAMA Intern Med 2013;173:632–8.
12. Kogon B, Jain A, Oster M, et al. Risk factors associated with readmission after pediatric cardiothoracic surgery. Ann Thorac Surg 2012;94:865–73.
13. Harhay M, Lin E, Pai A, et al. Early rehospitalization after kidney transplantation: assessing preventability and prognosis. Am J Transplant 2013;13:3164–72.
14. Preventing unnecessary readmissions: transcending the hospital’s four walls to achieve collaborative care coordination. The Advisory Board Company; 2010. Available at www.advisory.com/research/physician-executive-council/studies/2010/preventing-unnecessary-readmissions.
15. Allaudeen N, Schnipper JL, Orav EJ, et al. Inability of providers to predict unplanned readmissions. J Gen Intern Med 2011;26:771–6.
16. Calvillo-King L, Arnold D, Eubank KJ, et al. Impact of social factors on risk of readmission or mortality in pneumonia and heart failure: systematic review. J Gen Intern Med 2013;28:269–82.
Incidence of and Risk Factors for Symptomatic Venous Thromboembolism After Shoulder Arthroplasty
Venous thromboembolism (VTE) after shoulder arthroplasty (SA) is relatively uncommon. Reported rates of VTE development are highly variable, ranging from 0.2% to 13% (pulmonary embolism [PE], 0.2%-10.8%; deep venous thrombosis [DVT], 0.1%-13%).1-4 Sources of this variability include different methods of capturing cases (small clinical series vs large database studies, which capture mainly hospital readmissions), differences in defining or detecting VTE, and different patient populations (fracture vs osteoarthritis).1-3 Most studies have also tried to identify factors associated with increased risk for VTE. Risk factors associated with development of VTE after SA include history of VTE, advanced age, prolonged operating room time, higher body mass index (BMI), trauma, history of cancer, female sex, and raised Charlson Comorbidity Index (CCI).1-7 Limitations of clinical series include the smaller number of reporting institutions—a potential source of bias given regional variability.1,3,4,7 Limitations of large state or national databases include capturing only events coded during inpatient admission and capturing readmissions for complications at the same institution. This underreporting may lead to very conservative estimates of VTE incidence.2,5,6,8
In this study, we retrospectively identified all the SAs performed at a single institution over a 13-year period and evaluated the cases for development of VTE (DVT, PE). We hypothesized that the VTE rate would be lower than the very high rates reported by Hoxie and colleagues1 and Willis and colleagues4 but higher than those reported for large state or national databases.2,3 We also evaluated clotting risk factors, including many never analyzed before.
Materials and Methods
After obtaining Institutional Review Board approval for this study, we searched our database for all SAs performed at our institution between January 1999 and May 2012 and identified cases in which symptomatic VTE developed within the first 90 days after surgery. Charts were reviewed for information on medical history, surgical procedure, and in-hospital and out-of-hospital care within the 90-day postoperative period. We recorded data on symptomatic VTE (DVT, PE) as documented by lower or upper extremity duplex ultrasonography (US) or chest computed tomography (CT) angiography. There had been no routine screening of patients; duplex US or CT angiography was performed only if a patient was clinically symptomatic (leg swelling, leg pain, shortness of breath, tachycardia, chest pain) for a potential DVT or PE. For a patient who had repeat SAs on the same shoulder or bilateral SAs at different times, only the first procedure was included in the analysis. Arthroplasties performed for fracture were excluded.
Study data were collected and managed with REDCap (Research Electronic Data Capture) tools hosted at the University of Utah School of Medicine.9 Continuous and discrete data collected on medical history and postoperative course included BMI, age at surgery, preoperative hemoglobin (Hb) and hematocrit (Hct) levels, days in hospital, days until out of bed and days until ambulation (both documented in nursing and physical therapy notes), postoperative Hb and Hct levels, and CCI. Categorical data included sex, diagnosis (primary osteoarthritis, rotator cuff arthropathy, rheumatoid arthritis, failed hemiarthroplasty [HA], failed total SA [TSA], others), attending surgeon, procedure (TSA, HA, reverse TSA, revision SA), anesthesia (general endotracheal anesthesia [GETA] alone, interscalene nerve block alone, GETA plus block), prophylactic use of aspirin after surgery, presence of various medical comorbidities (diabetes, hypertension, cardiac disease, clotting disorders, cancer), hormone replacement therapy, family history of a clotting disorder, and VTE consequences (cardiac events, death).
Statistical Analysis
Descriptive statistics were calculated to summarize aspects of the surgical procedures, the study cohort’s demographics and medical histories, and the incidence of VTE. Logistic regression analysis was performed to explore the association between development of VTE (DVT, PE) and potential risk factors. Unadjusted odds ratios (ORs) were estimated for the risk factors of age, BMI, revision SA, CCI, prophylactic use of aspirin after surgery, preoperative history of VTE, preoperative and postoperative Hb and Hct levels, diabetes, anesthesia (GETA with and without interscalene nerve block), family history of a clotting disorder, days until out of bed, hormone replacement therapy, race, discharge home or to rehabilitation, distance traveled for surgery, hypertension, cardiac disease, cement use, and history of cancer. In addition, ORs were adjusted for age, BMI, and revision SA. For all statistical tests, significance was set at P < .05. All analyses were performed with SAS Version 9.3 (SAS Institute).
Results
We identified 533 SAs: 245 anatomical TSAs, 112 reverse TSAs, 92 HAs, and 84 revision SAs. Three different surgeons performed the procedures, and no patients were lost to follow-up within the first 90 days after surgery. Although SAs were performed for various diagnoses, more than 50% (274) of the SAs were for primary osteoarthritis; 97 were performed for rotator cuff arthropathy, 16 for rheumatoid arthritis, 43 for failed HA, 23 for failed TSA, and 79 for other diagnoses.
Of the 533 patients, 288 were female and 245 were male. Mean age at surgery was 65.2 years (range, 16-93 years). Mean (SD) BMI was 29.2 (6.4) kg/m2. Mean (SD) preoperative Hb level was 13.7 (1.8) g/dL, and mean preoperative Hct level was 40.1% (4.8%). Mean (SD) length of hospital stay was 2.6 (1.5) days. Mean (SD) time before patients were out of bed was 1.1 (0.7) days. On postoperative day 1, mean Hb level was 11.1 (1.7) g/dL, and mean (SD) Hct level was 33.2% (4.8%). Mean (SD) CCI was 1.1 (0.9).
Anesthesia for the 533 patients consisted of GETA (209 patients, 39.0%), interscalene nerve block (2, 0.4%), or GETA with nerve block (314, 59.0%). After surgery, 125 patients (24.3%) received aspirin as prophylaxis. Diabetes was reported by 83 patients, hypertension by 286, cardiac disease by 74, a history of a clotting disorder by 2, a family history of a clotting disorder by 8, ongoing cancer by 4, a history of cancer by 67, and hormone replacement therapy by 104.
For the entire cohort of 533 patients, the symptomatic VTE rate was 2.6% (14 patients), the DVT rate was 0.9% (5), and the PE rate was 2.3% (12). Although VTE did not cause any deaths, there were 3 cardiac events. 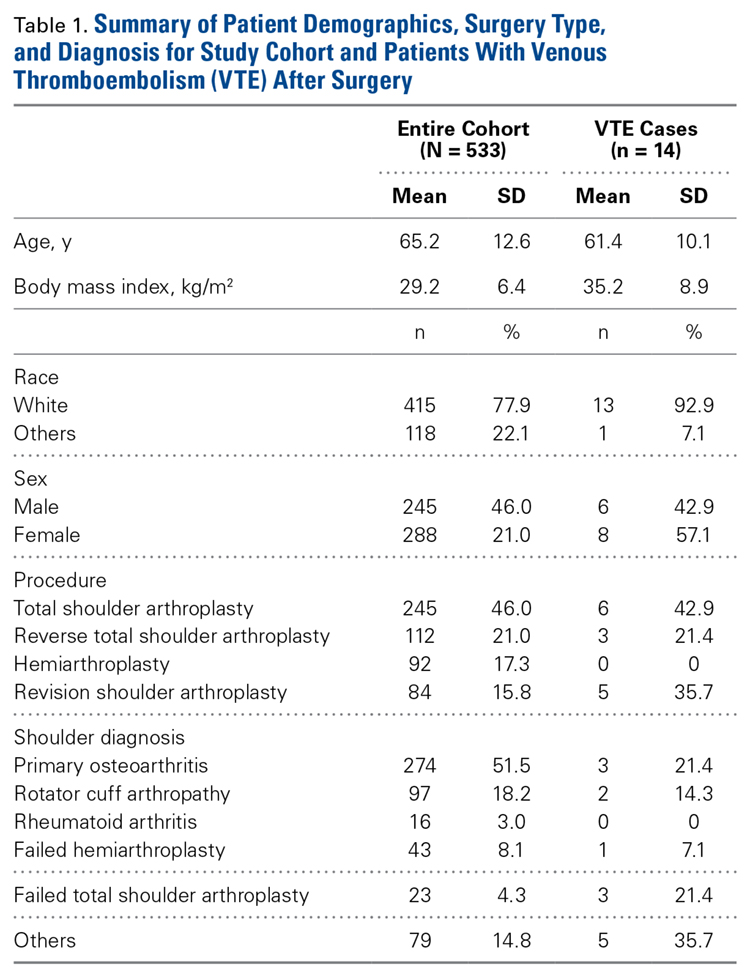
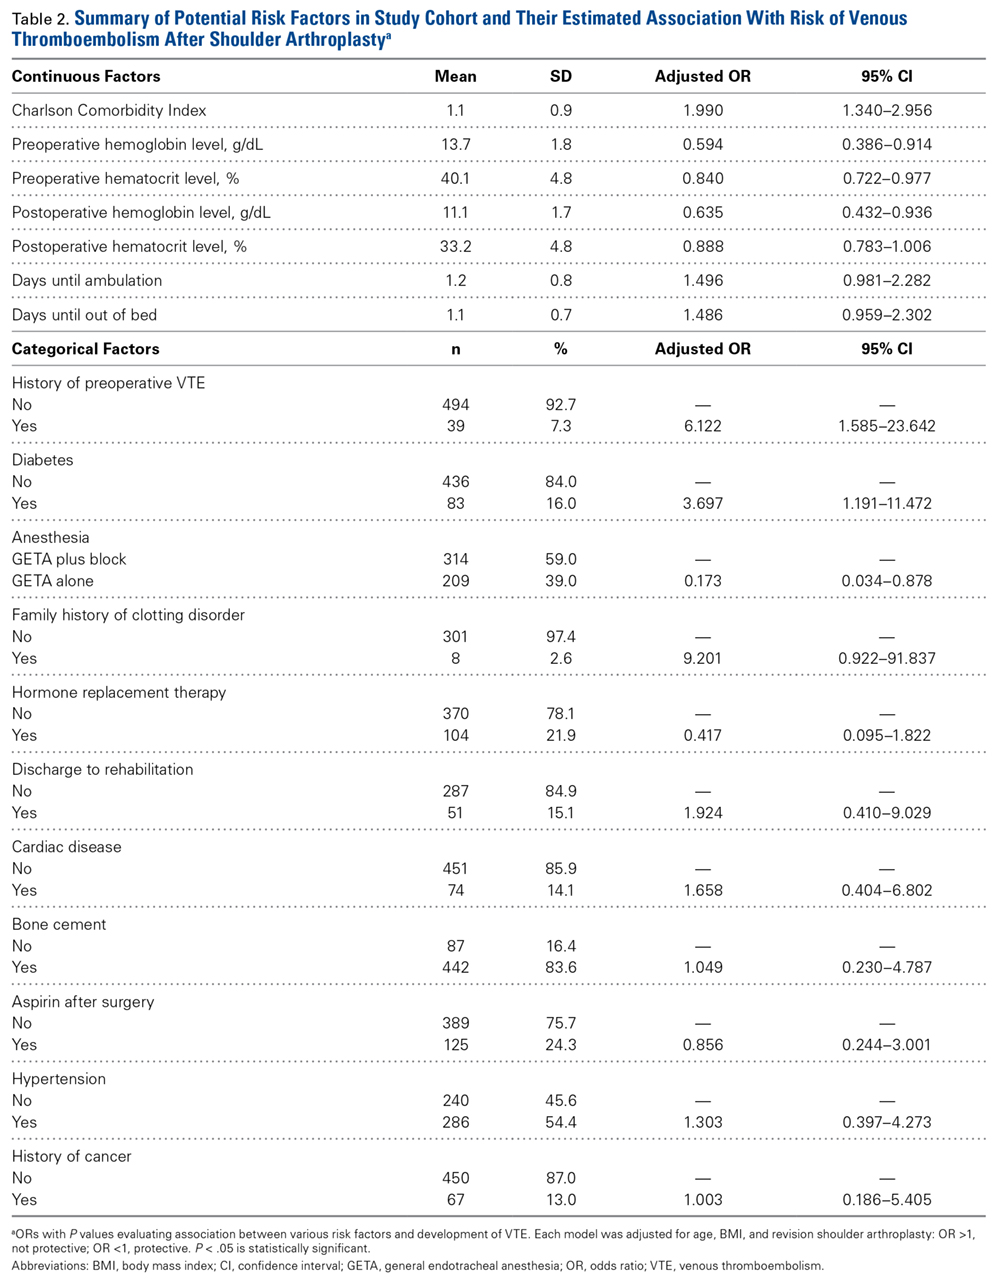
Discussion
VTE after SA is rare. We report an overall VTE incidence of 2.6%, with DVT at 0.9% and PE at 2.3%. These rates are similar to those reported in clinical series and significantly higher than those reported for large institutional or national databases.2-7 Our results also support a previously reported trend: The ratio of PE to DVT for SA is significantly higher than historically reported ratios for lower extremity arthroplasty.2,6-8 We have identified many VTE risk factors: raised CCI, preoperative thrombotic event, lower preoperative Hb and Hct levels, lower postoperative Hb level, diabetes, use of GETA without interscalene nerve block, higher BMI, and revision SA. Results of other studies support 3 findings (higher BMI, raised CCI, preoperative thrombotic event); new findings include correlation with Hb and Hct levels, diabetes, type of anesthesia, and revision SA.6,7 Identification of these other factors may be useful in making treatment decisions in patients symptomatic after SA and in lowering the threshold for performing diagnostic tests in these patients at risk for VTE.
Reported rates of VTE after SA are highly variable, ranging from 0.2% to 13%.10 Our rationale for investigating VTE rates at a single institution was to estimate the rates that can be expected in a university-based practice and to determine whether these rates are high enough to warrant routine thromboprophylaxis. The rate variability seems to result in part from variability in the data sources. Most studies that have reported very low VTE rates typically used large state or national databases, which likely were subject to underreporting.
Lyman and colleagues6 found 0.5% DVT and 0.2% PE rates in a New York state hospital database, but only in-hospital immediate postoperative symptomatic complications were included; slightly delayed complications may have been missed. Farng and colleagues5 reported a 0.6% VTE rate, but only inpatient (immediate postoperative or readmission) events were included; all outpatient events were missed. Jameson and colleagues,2 using a national database that included only cases involving inpatient treatment, reported 0% DVT and 0.2% PE rates, again missing outpatient events, and relying on appropriate coding to capture events. Using electronic health records from a large healthcare system, Navarro and colleagues8 queried for VTE cases and reported 0.5% DVT and 0.5% PE rates. The inclusiveness of their data source for the outcome of interest was potentially improved relative to national or statewide databases—and the resulting data reported in their study should reflect that improvement. However, the authors relied on ICD–9 (International Classification of Diseases, Ninth Revision) coding to screen for VTE events and excluded patients with prior VTE, preoperative prophylaxis (enoxaparin or warfarin), or follow-up of <90 days. As patients with prior VTE are those most at risk (present study OR, 6-7), excluding them significantly reduces the overall incidence of clotting reported.
Only 4 studies specifically used information drawn directly from physicians’ clinic notes, vs data retrieved (using code-based queries) from databases.1,3,4,7 These studies may provide a better representation of the rate of VTE after SA, as they were not reliant on codes, included both inpatient and outpatient events, and were inclusive of outpatient follow-up of at least 3 months.
Three of the 4 studies used the Mayo Clinic Total Joint Registry.1,3,4 Hoxie and colleagues1 reported an 11% rate of PE after HA performed for fracture (we excluded SA for fracture). As several other investigators have reported an association between trauma and increased risk for VTE, postoperative anticoagulation should be considered in this patient population (though it was not the focus of the present study).6-8 Sperling and Cofield3 and Singh and colleagues7 reported on the risk for PE among SA patients at the Mayo Clinic. Sperling and Cofield3 included only those events that occurred within the first 7 days after surgery; Singh and colleagues7 included events out to 90 days after surgery. Sperling and Cofield3 reported a 0.17% PE rate; Singh and colleagues7 reported 0.6% PE and 0.1% DVT rates. Sperling and Cofield3 reported on 2885 SAs; Singh and colleagues7 reported on 4019 SAs from the same database. As it is unclear whether these 2 studies had complete information on all patients, underreporting may be an issue. Information was obtained through “clinic visits, medical records and/or standardized mailed and telephone-administered questionnaires.”7The fourth study, a prospective study of 100 patients by Willis and colleagues,4 had the best data on development of symptomatic PE after SA. The authors reported a 2% PE rate and a high (13%) DVT rate. Because US was not performed before the surgical procedures, the number of patients with new and existing DVT cases could not be determined. However, all PEs were new, and the 2% rate found there is similar to the 2.3% in our study. Therefore, we think these rates capture the data most accurately and avoid the underreporting that marks large databases.4Studies have identified various factors that increase the risk for VTE after SA. Singh and colleagues7 identified the risk factors of age over 70 years, female sex, higher BMI (25-29.9 kg/m2), CCI above 1, traumatic etiology, prior history of VTE, and HA. However, their use of univariate regression analysis may have confounded the effects—one factor may have become a surrogate for another (ie, trauma and HA, as most fractures treated with SA during the study period were treated with HA). Lyman and colleagues6 also found advanced age and trauma were associated with higher VTE risk, and reported prior history of cancer as a risk factor as well. Navarro and colleagues8 identified trauma as a risk factor, as in the other 2 studies.6,7 Our data support prior history of VTE, higher BMI, and raised CCI as increasing the risk for VTE.
Other factors identified in the present study are use of GETA without interscalene nerve block, lower preoperative and postoperative Hb levels, diabetes, and revision SA. Because of the limited number of events, only ORs with and without limited control of confounders were performed. Just as in the study by Singh and colleagues,7 uncontrolled confounding could have occurred. A nerve block may be protective, as less postoperative pain may allow patients quicker mobilization and therapy. Diabetes may be a surrogate for other medical comorbidities, as reflected by the higher overall risk with raised CCI. Lower preoperative and postoperative Hb levels were associated with clotting and may be representative of patients with poorer overall health and more complicated surgical procedures (eg, revision SA). In an earlier study, we found increased risk for transfusions in revision SA relative to primary SA.11 Lower preoperative Hb level correlated with development of VTE after lower extremity arthroplasty.12 Postoperative use of aspirin was not found to significantly reduce the incidence of clotting, though this finding may have resulted from lack of power. Therefore, from the present data, there is nothing to conclude about the efficacy of aspirin in preventing thrombosis.
Our findings can be placed in the context of the Virchow triad. Specifically, 3 categories of factors are thought to contribute to thrombosis: hypercoagulability, hemodynamic stasis, and endothelial injury. In grouping factors, we identified prior thrombotic event and obesity as increasing hypercoagulability; revision SA, more comorbidities, lower Hb and Hct levels, diabetes, and GETA as increasing hemodynamic stasis; and revision SA (longer operating room times) as leading to stasis. More comorbidities can be associated with delayed postoperative ambulation, and diabetes and lower Hb and Hct levels can be surrogates for more comorbidities. Surgery performed with the patient under GETA without interscalene nerve block can lead to higher levels of pain and less early mobility.
The present findings have made us more aware of patients at risk for VTE, and we have lowered our threshold for evaluating them for potential clots. Before this study, we used warfarin or enoxaparin for anticoagulation in patients with a history of VTE or active cancer. We are continuing this protocol, but not with other patients. Patients with many comorbidities, lower preoperative Hb level, revision SA, high BMI, or diabetes are carefully monitored for clots early in the postoperative course. Our new threshold for these high-risk patients is to order diagnostic testing, including duplex US or CT angiography. Now, even mild oxygen requirements or mild tachycardia within postoperative week 1 typically prompt a study in these patients. We hope this increased awareness will limit the potential negative consequences associated with development of VTE. Given the present data, we do not think the simple presence of increased comorbidities, lower preoperative Hb, revision SA, high BMI or diabetes should rule out performing SA; rather, it should increase surgeons’ postoperative vigilance in evaluating for potential clots.
Limitations of our study include its retrospective nature and reliance on clinic chart review. Patients were not directly questioned about venous thrombus at follow-up, so all events may not have been captured. Although retrospective review has its drawbacks, it allows for accurate identification of events, even uncoded events. Therefore, more events are likely to be captured with this technique than with large database analyses using only coding information. We tried to identify as many cases as possible by reviewing all outpatient records (orthopedic, nonorthopedic), inpatient records, radiologic studies, and scanned outside records. Another limitation is that having a small number of VTE events limited our ability to perform a multivariate analysis, and uncontrolled confounding likely resulted. Only a very large multi-institutional study can capture enough events to allow a multivariate analysis. A third limitation is that the small number of events may have underpowered the study. Having more patients would have allowed other potential factors to be identified as being significantly associated with VTE. Last, as the study captured only symptomatic VTE events, it may have underreported VTE events. Given our complete review of the medical records, however, most clinically significant events likely were captured.
Conclusion
VTE after SA is rare. In our single-institution study, the symptomatic DVT rate was 0.9%, and the symptomatic PE rate was 2.3%. Risk factors associated with clotting included prior VTE, higher BMI, lower preoperative and postoperative Hb levels, raised CCI, diabetes, use of GETA without interscalene nerve block, and revision SA. Risk factors can be used to identify patients who may benefit from a more scrutinized postoperative evaluation and from increased surgeon awareness of the potential for VTE development. Rates of VTE can be used to counsel SA patients regarding overall surgical risks.
Am J Orthop. 2016;45(6):E379-E385. Copyright Frontline Medical Communications Inc. 2016. All rights reserved.
1. Hoxie SC, Sperling JW, Cofield RH. Pulmonary embolism after operative treatment of proximal humeral fractures. J Shoulder Elbow Surg. 2007;16(6):782-783.
2. Jameson SS, James P, Howcroft DW, et al. Venous thromboembolic events are rare after shoulder surgery: analysis of a national database. J Shoulder Elbow Surg. 2011;20(5):764-770.
3. Sperling JW, Cofield RH. Pulmonary embolism following shoulder arthroplasty. J Bone Joint Surg Am. 2002;84(11):1939-1941.
4. Willis AA, Warren RF, Craig EV, et al. Deep vein thrombosis after reconstructive shoulder arthroplasty: a prospective observational study. J Shoulder Elbow Surg. 2009;18(1):100-106.
5. Farng E, Zingmond D, Krenek L, Soohoo NF. Factors predicting complication rates after primary shoulder arthroplasty. J Shoulder Elbow Surg. 2011;20(4):557-563.
6. Lyman S, Sherman S, Carter TI, Bach PB, Mandl LA, Marx RG. Prevalence and risk factors for symptomatic thromboembolic events after shoulder arthroplasty. Clin Orthop Relat Res. 2006;(448):152-156.
7. Singh JA, Sperling JW, Cofield RH. Cardiopulmonary complications after primary shoulder arthroplasty: a cohort study. Semin Arthritis Rheum. 2012;41(5):689-697.
8. Navarro RA, Inacio MC, Burke MF, Costouros JG, Yian EH. Risk of thromboembolism in shoulder arthroplasty: effect of implant type and traumatic indication. Clin Orthop Relat Res. 2013;471(5):1576-1581.
9. Harris PA, Taylor R, Thielke R, Payne J, Gonzalez N, Conde JG. Research electronic data capture (REDCap)—a metadata-driven methodology and workflow process for providing translational research informatics support. J Biomed Inform. 2009;42(2):377-381.
10. Saleh HE, Pennings AL, ElMaraghy AW. Venous thromboembolism after shoulder arthroplasty: a systematic review. J Shoulder Elbow Surg. 2013;22(10):1440-1448.
11. Hardy JC, Hung M, Snow BJ, et al. Blood transfusion associated with shoulder arthroplasty. J Shoulder Elbow Surg. 2013;22(2):233-239.
12. Gangireddy C, Rectenwald JR, Upchurch GR, et al. Risk factors and clinical impact of postoperative symptomatic venous thromboembolism. J Vasc Surg. 2007;45(2):335-341.
Venous thromboembolism (VTE) after shoulder arthroplasty (SA) is relatively uncommon. Reported rates of VTE development are highly variable, ranging from 0.2% to 13% (pulmonary embolism [PE], 0.2%-10.8%; deep venous thrombosis [DVT], 0.1%-13%).1-4 Sources of this variability include different methods of capturing cases (small clinical series vs large database studies, which capture mainly hospital readmissions), differences in defining or detecting VTE, and different patient populations (fracture vs osteoarthritis).1-3 Most studies have also tried to identify factors associated with increased risk for VTE. Risk factors associated with development of VTE after SA include history of VTE, advanced age, prolonged operating room time, higher body mass index (BMI), trauma, history of cancer, female sex, and raised Charlson Comorbidity Index (CCI).1-7 Limitations of clinical series include the smaller number of reporting institutions—a potential source of bias given regional variability.1,3,4,7 Limitations of large state or national databases include capturing only events coded during inpatient admission and capturing readmissions for complications at the same institution. This underreporting may lead to very conservative estimates of VTE incidence.2,5,6,8
In this study, we retrospectively identified all the SAs performed at a single institution over a 13-year period and evaluated the cases for development of VTE (DVT, PE). We hypothesized that the VTE rate would be lower than the very high rates reported by Hoxie and colleagues1 and Willis and colleagues4 but higher than those reported for large state or national databases.2,3 We also evaluated clotting risk factors, including many never analyzed before.
Materials and Methods
After obtaining Institutional Review Board approval for this study, we searched our database for all SAs performed at our institution between January 1999 and May 2012 and identified cases in which symptomatic VTE developed within the first 90 days after surgery. Charts were reviewed for information on medical history, surgical procedure, and in-hospital and out-of-hospital care within the 90-day postoperative period. We recorded data on symptomatic VTE (DVT, PE) as documented by lower or upper extremity duplex ultrasonography (US) or chest computed tomography (CT) angiography. There had been no routine screening of patients; duplex US or CT angiography was performed only if a patient was clinically symptomatic (leg swelling, leg pain, shortness of breath, tachycardia, chest pain) for a potential DVT or PE. For a patient who had repeat SAs on the same shoulder or bilateral SAs at different times, only the first procedure was included in the analysis. Arthroplasties performed for fracture were excluded.
Study data were collected and managed with REDCap (Research Electronic Data Capture) tools hosted at the University of Utah School of Medicine.9 Continuous and discrete data collected on medical history and postoperative course included BMI, age at surgery, preoperative hemoglobin (Hb) and hematocrit (Hct) levels, days in hospital, days until out of bed and days until ambulation (both documented in nursing and physical therapy notes), postoperative Hb and Hct levels, and CCI. Categorical data included sex, diagnosis (primary osteoarthritis, rotator cuff arthropathy, rheumatoid arthritis, failed hemiarthroplasty [HA], failed total SA [TSA], others), attending surgeon, procedure (TSA, HA, reverse TSA, revision SA), anesthesia (general endotracheal anesthesia [GETA] alone, interscalene nerve block alone, GETA plus block), prophylactic use of aspirin after surgery, presence of various medical comorbidities (diabetes, hypertension, cardiac disease, clotting disorders, cancer), hormone replacement therapy, family history of a clotting disorder, and VTE consequences (cardiac events, death).
Statistical Analysis
Descriptive statistics were calculated to summarize aspects of the surgical procedures, the study cohort’s demographics and medical histories, and the incidence of VTE. Logistic regression analysis was performed to explore the association between development of VTE (DVT, PE) and potential risk factors. Unadjusted odds ratios (ORs) were estimated for the risk factors of age, BMI, revision SA, CCI, prophylactic use of aspirin after surgery, preoperative history of VTE, preoperative and postoperative Hb and Hct levels, diabetes, anesthesia (GETA with and without interscalene nerve block), family history of a clotting disorder, days until out of bed, hormone replacement therapy, race, discharge home or to rehabilitation, distance traveled for surgery, hypertension, cardiac disease, cement use, and history of cancer. In addition, ORs were adjusted for age, BMI, and revision SA. For all statistical tests, significance was set at P < .05. All analyses were performed with SAS Version 9.3 (SAS Institute).
Results
We identified 533 SAs: 245 anatomical TSAs, 112 reverse TSAs, 92 HAs, and 84 revision SAs. Three different surgeons performed the procedures, and no patients were lost to follow-up within the first 90 days after surgery. Although SAs were performed for various diagnoses, more than 50% (274) of the SAs were for primary osteoarthritis; 97 were performed for rotator cuff arthropathy, 16 for rheumatoid arthritis, 43 for failed HA, 23 for failed TSA, and 79 for other diagnoses.
Of the 533 patients, 288 were female and 245 were male. Mean age at surgery was 65.2 years (range, 16-93 years). Mean (SD) BMI was 29.2 (6.4) kg/m2. Mean (SD) preoperative Hb level was 13.7 (1.8) g/dL, and mean preoperative Hct level was 40.1% (4.8%). Mean (SD) length of hospital stay was 2.6 (1.5) days. Mean (SD) time before patients were out of bed was 1.1 (0.7) days. On postoperative day 1, mean Hb level was 11.1 (1.7) g/dL, and mean (SD) Hct level was 33.2% (4.8%). Mean (SD) CCI was 1.1 (0.9).
Anesthesia for the 533 patients consisted of GETA (209 patients, 39.0%), interscalene nerve block (2, 0.4%), or GETA with nerve block (314, 59.0%). After surgery, 125 patients (24.3%) received aspirin as prophylaxis. Diabetes was reported by 83 patients, hypertension by 286, cardiac disease by 74, a history of a clotting disorder by 2, a family history of a clotting disorder by 8, ongoing cancer by 4, a history of cancer by 67, and hormone replacement therapy by 104.
For the entire cohort of 533 patients, the symptomatic VTE rate was 2.6% (14 patients), the DVT rate was 0.9% (5), and the PE rate was 2.3% (12). Although VTE did not cause any deaths, there were 3 cardiac events.
Discussion
VTE after SA is rare. We report an overall VTE incidence of 2.6%, with DVT at 0.9% and PE at 2.3%. These rates are similar to those reported in clinical series and significantly higher than those reported for large institutional or national databases.2-7 Our results also support a previously reported trend: The ratio of PE to DVT for SA is significantly higher than historically reported ratios for lower extremity arthroplasty.2,6-8 We have identified many VTE risk factors: raised CCI, preoperative thrombotic event, lower preoperative Hb and Hct levels, lower postoperative Hb level, diabetes, use of GETA without interscalene nerve block, higher BMI, and revision SA. Results of other studies support 3 findings (higher BMI, raised CCI, preoperative thrombotic event); new findings include correlation with Hb and Hct levels, diabetes, type of anesthesia, and revision SA.6,7 Identification of these other factors may be useful in making treatment decisions in patients symptomatic after SA and in lowering the threshold for performing diagnostic tests in these patients at risk for VTE.
Reported rates of VTE after SA are highly variable, ranging from 0.2% to 13%.10 Our rationale for investigating VTE rates at a single institution was to estimate the rates that can be expected in a university-based practice and to determine whether these rates are high enough to warrant routine thromboprophylaxis. The rate variability seems to result in part from variability in the data sources. Most studies that have reported very low VTE rates typically used large state or national databases, which likely were subject to underreporting.
Lyman and colleagues6 found 0.5% DVT and 0.2% PE rates in a New York state hospital database, but only in-hospital immediate postoperative symptomatic complications were included; slightly delayed complications may have been missed. Farng and colleagues5 reported a 0.6% VTE rate, but only inpatient (immediate postoperative or readmission) events were included; all outpatient events were missed. Jameson and colleagues,2 using a national database that included only cases involving inpatient treatment, reported 0% DVT and 0.2% PE rates, again missing outpatient events, and relying on appropriate coding to capture events. Using electronic health records from a large healthcare system, Navarro and colleagues8 queried for VTE cases and reported 0.5% DVT and 0.5% PE rates. The inclusiveness of their data source for the outcome of interest was potentially improved relative to national or statewide databases—and the resulting data reported in their study should reflect that improvement. However, the authors relied on ICD–9 (International Classification of Diseases, Ninth Revision) coding to screen for VTE events and excluded patients with prior VTE, preoperative prophylaxis (enoxaparin or warfarin), or follow-up of <90 days. As patients with prior VTE are those most at risk (present study OR, 6-7), excluding them significantly reduces the overall incidence of clotting reported.
Only 4 studies specifically used information drawn directly from physicians’ clinic notes, vs data retrieved (using code-based queries) from databases.1,3,4,7 These studies may provide a better representation of the rate of VTE after SA, as they were not reliant on codes, included both inpatient and outpatient events, and were inclusive of outpatient follow-up of at least 3 months.
Three of the 4 studies used the Mayo Clinic Total Joint Registry.1,3,4 Hoxie and colleagues1 reported an 11% rate of PE after HA performed for fracture (we excluded SA for fracture). As several other investigators have reported an association between trauma and increased risk for VTE, postoperative anticoagulation should be considered in this patient population (though it was not the focus of the present study).6-8 Sperling and Cofield3 and Singh and colleagues7 reported on the risk for PE among SA patients at the Mayo Clinic. Sperling and Cofield3 included only those events that occurred within the first 7 days after surgery; Singh and colleagues7 included events out to 90 days after surgery. Sperling and Cofield3 reported a 0.17% PE rate; Singh and colleagues7 reported 0.6% PE and 0.1% DVT rates. Sperling and Cofield3 reported on 2885 SAs; Singh and colleagues7 reported on 4019 SAs from the same database. As it is unclear whether these 2 studies had complete information on all patients, underreporting may be an issue. Information was obtained through “clinic visits, medical records and/or standardized mailed and telephone-administered questionnaires.”7The fourth study, a prospective study of 100 patients by Willis and colleagues,4 had the best data on development of symptomatic PE after SA. The authors reported a 2% PE rate and a high (13%) DVT rate. Because US was not performed before the surgical procedures, the number of patients with new and existing DVT cases could not be determined. However, all PEs were new, and the 2% rate found there is similar to the 2.3% in our study. Therefore, we think these rates capture the data most accurately and avoid the underreporting that marks large databases.4Studies have identified various factors that increase the risk for VTE after SA. Singh and colleagues7 identified the risk factors of age over 70 years, female sex, higher BMI (25-29.9 kg/m2), CCI above 1, traumatic etiology, prior history of VTE, and HA. However, their use of univariate regression analysis may have confounded the effects—one factor may have become a surrogate for another (ie, trauma and HA, as most fractures treated with SA during the study period were treated with HA). Lyman and colleagues6 also found advanced age and trauma were associated with higher VTE risk, and reported prior history of cancer as a risk factor as well. Navarro and colleagues8 identified trauma as a risk factor, as in the other 2 studies.6,7 Our data support prior history of VTE, higher BMI, and raised CCI as increasing the risk for VTE.
Other factors identified in the present study are use of GETA without interscalene nerve block, lower preoperative and postoperative Hb levels, diabetes, and revision SA. Because of the limited number of events, only ORs with and without limited control of confounders were performed. Just as in the study by Singh and colleagues,7 uncontrolled confounding could have occurred. A nerve block may be protective, as less postoperative pain may allow patients quicker mobilization and therapy. Diabetes may be a surrogate for other medical comorbidities, as reflected by the higher overall risk with raised CCI. Lower preoperative and postoperative Hb levels were associated with clotting and may be representative of patients with poorer overall health and more complicated surgical procedures (eg, revision SA). In an earlier study, we found increased risk for transfusions in revision SA relative to primary SA.11 Lower preoperative Hb level correlated with development of VTE after lower extremity arthroplasty.12 Postoperative use of aspirin was not found to significantly reduce the incidence of clotting, though this finding may have resulted from lack of power. Therefore, from the present data, there is nothing to conclude about the efficacy of aspirin in preventing thrombosis.
Our findings can be placed in the context of the Virchow triad. Specifically, 3 categories of factors are thought to contribute to thrombosis: hypercoagulability, hemodynamic stasis, and endothelial injury. In grouping factors, we identified prior thrombotic event and obesity as increasing hypercoagulability; revision SA, more comorbidities, lower Hb and Hct levels, diabetes, and GETA as increasing hemodynamic stasis; and revision SA (longer operating room times) as leading to stasis. More comorbidities can be associated with delayed postoperative ambulation, and diabetes and lower Hb and Hct levels can be surrogates for more comorbidities. Surgery performed with the patient under GETA without interscalene nerve block can lead to higher levels of pain and less early mobility.
The present findings have made us more aware of patients at risk for VTE, and we have lowered our threshold for evaluating them for potential clots. Before this study, we used warfarin or enoxaparin for anticoagulation in patients with a history of VTE or active cancer. We are continuing this protocol, but not with other patients. Patients with many comorbidities, lower preoperative Hb level, revision SA, high BMI, or diabetes are carefully monitored for clots early in the postoperative course. Our new threshold for these high-risk patients is to order diagnostic testing, including duplex US or CT angiography. Now, even mild oxygen requirements or mild tachycardia within postoperative week 1 typically prompt a study in these patients. We hope this increased awareness will limit the potential negative consequences associated with development of VTE. Given the present data, we do not think the simple presence of increased comorbidities, lower preoperative Hb, revision SA, high BMI or diabetes should rule out performing SA; rather, it should increase surgeons’ postoperative vigilance in evaluating for potential clots.
Limitations of our study include its retrospective nature and reliance on clinic chart review. Patients were not directly questioned about venous thrombus at follow-up, so all events may not have been captured. Although retrospective review has its drawbacks, it allows for accurate identification of events, even uncoded events. Therefore, more events are likely to be captured with this technique than with large database analyses using only coding information. We tried to identify as many cases as possible by reviewing all outpatient records (orthopedic, nonorthopedic), inpatient records, radiologic studies, and scanned outside records. Another limitation is that having a small number of VTE events limited our ability to perform a multivariate analysis, and uncontrolled confounding likely resulted. Only a very large multi-institutional study can capture enough events to allow a multivariate analysis. A third limitation is that the small number of events may have underpowered the study. Having more patients would have allowed other potential factors to be identified as being significantly associated with VTE. Last, as the study captured only symptomatic VTE events, it may have underreported VTE events. Given our complete review of the medical records, however, most clinically significant events likely were captured.
Conclusion
VTE after SA is rare. In our single-institution study, the symptomatic DVT rate was 0.9%, and the symptomatic PE rate was 2.3%. Risk factors associated with clotting included prior VTE, higher BMI, lower preoperative and postoperative Hb levels, raised CCI, diabetes, use of GETA without interscalene nerve block, and revision SA. Risk factors can be used to identify patients who may benefit from a more scrutinized postoperative evaluation and from increased surgeon awareness of the potential for VTE development. Rates of VTE can be used to counsel SA patients regarding overall surgical risks.
Am J Orthop. 2016;45(6):E379-E385. Copyright Frontline Medical Communications Inc. 2016. All rights reserved.
1. Hoxie SC, Sperling JW, Cofield RH. Pulmonary embolism after operative treatment of proximal humeral fractures. J Shoulder Elbow Surg. 2007;16(6):782-783.
2. Jameson SS, James P, Howcroft DW, et al. Venous thromboembolic events are rare after shoulder surgery: analysis of a national database. J Shoulder Elbow Surg. 2011;20(5):764-770.
3. Sperling JW, Cofield RH. Pulmonary embolism following shoulder arthroplasty. J Bone Joint Surg Am. 2002;84(11):1939-1941.
4. Willis AA, Warren RF, Craig EV, et al. Deep vein thrombosis after reconstructive shoulder arthroplasty: a prospective observational study. J Shoulder Elbow Surg. 2009;18(1):100-106.
5. Farng E, Zingmond D, Krenek L, Soohoo NF. Factors predicting complication rates after primary shoulder arthroplasty. J Shoulder Elbow Surg. 2011;20(4):557-563.
6. Lyman S, Sherman S, Carter TI, Bach PB, Mandl LA, Marx RG. Prevalence and risk factors for symptomatic thromboembolic events after shoulder arthroplasty. Clin Orthop Relat Res. 2006;(448):152-156.
7. Singh JA, Sperling JW, Cofield RH. Cardiopulmonary complications after primary shoulder arthroplasty: a cohort study. Semin Arthritis Rheum. 2012;41(5):689-697.
8. Navarro RA, Inacio MC, Burke MF, Costouros JG, Yian EH. Risk of thromboembolism in shoulder arthroplasty: effect of implant type and traumatic indication. Clin Orthop Relat Res. 2013;471(5):1576-1581.
9. Harris PA, Taylor R, Thielke R, Payne J, Gonzalez N, Conde JG. Research electronic data capture (REDCap)—a metadata-driven methodology and workflow process for providing translational research informatics support. J Biomed Inform. 2009;42(2):377-381.
10. Saleh HE, Pennings AL, ElMaraghy AW. Venous thromboembolism after shoulder arthroplasty: a systematic review. J Shoulder Elbow Surg. 2013;22(10):1440-1448.
11. Hardy JC, Hung M, Snow BJ, et al. Blood transfusion associated with shoulder arthroplasty. J Shoulder Elbow Surg. 2013;22(2):233-239.
12. Gangireddy C, Rectenwald JR, Upchurch GR, et al. Risk factors and clinical impact of postoperative symptomatic venous thromboembolism. J Vasc Surg. 2007;45(2):335-341.
Direct Anterior Versus Posterior Simultaneous Bilateral Total Hip Arthroplasties: No Major Differences at 90 Days
End-stage osteoarthritis of the hip is a debilitating disease that is reliably treated with total hip arthroplasty (THA).1 Up to 35% of patients who undergo THA eventually require contralateral THA.2,3 In patients who present with advanced bilateral disease and undergo unilateral THA, the risk of ultimately requiring a contralateral procedure is as high as 97%.3-6 In patients with bilateral hip disease, function is not fully optimized until both hips have been replaced, particularly in the setting of fixed flexion contractures.7-9 Naturally, there has been some interest in simultaneous bilateral THAs for select patients.
The potential benefits of bilateral THAs over staged procedures include faster overall rehabilitation, exposure to a single anesthetic, reduced hospital length of stay (LOS), and cost savings.10-12 However, opinion on recommending bilateral THAs is mixed. Although bilateral procedures historically have been fraught with perioperative complications,13,14 advances in surgical and anesthetic techniques have led to improved outcomes.15 Whether surgical approach is a factor in these outcomes is unclear.
The popularity of the direct anterior (DA) approach for THA has increased in recent years.16 Although the relative advantages of various approaches remain in debate, one potential benefit of the DA approach is supine positioning, which allows simultaneous bilateral THAs to be performed without the need for repositioning before proceeding with the contralateral side. However, simultaneous bilateral THAs performed through the DA approach and those performed through other surgical approaches are lacking in comparative outcomes data.17In this study, we evaluated operative times, transfusion requirements, hospital discharge data, and 90-day complication rates in patients who had simultaneous bilateral THAs through either the DA approach or the posterior approach.
Methods
Study Design
This single-center study was conducted at the Mayo Clinic in Rochester, Minnesota. After obtaining approval from our Institutional Review Board, we performed a retrospective cohort analysis. We used our institution’s total joint registry to identify all patients who underwent simultaneous bilateral THAs through either the DA approach or the posterior approach. The first bilateral THAs to use the DA approach at our institution were performed in 2012. To ensure that the DA and posterior groups’ perioperative management would be similar, we included only cases performed between 2012 and 2014.
There were 19 patients in the DA group and 21 in the posterior group. The groups were similar in mean age (54 vs 54 years; P = .90), sex (73% vs 57% males; P = .33), body mass index (BMI; 25 vs 28 kg/m2; P = .38), preoperative hemoglobin level (14.3 vs 14.0 g/dL; P = .37), preoperative diagnosis (71.1% vs 78.6% degenerative joint disease; P = .75), and American Society of Anesthesiologists (ASA) score (1.9 vs 2.0; P = .63) (Table 1). 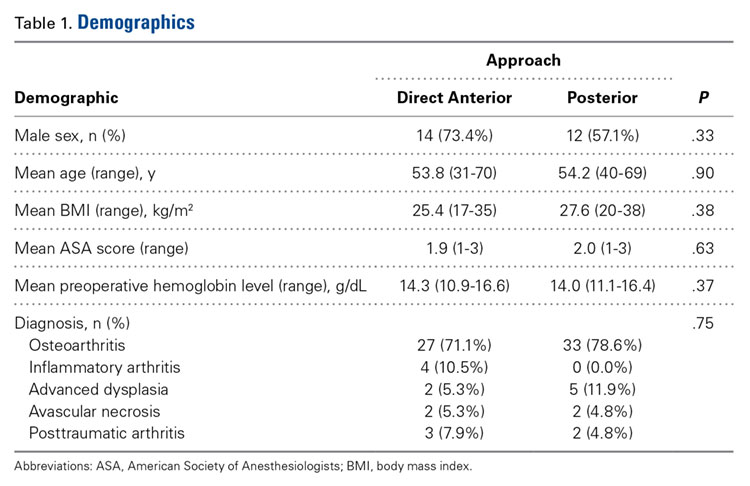
Patient Care
All cases were performed by 1 of 3 dedicated arthroplasty surgeons (Dr. Taunton, Dr. Sierra, Dr. Trousdale). Dr. Taunton exclusively uses the DA approach, and Dr. Sierra and Dr. Trousdale exclusively use the posterior approach. Patients in both groups received preoperative medical clearance and attended the same preoperative education class.
Patients in the DA group were positioned supine on an orthopedic table that allows hyperextension and adduction of the operative leg. Both hips were prepared and draped simultaneously. The most symptomatic hip was operated on first, with a sterile drape covering the contralateral hip. Between hips, fluoroscopy was moved to the other side of the operative suite, but no changes in positioning or preparation were necessary. A deep drain was placed on each side, and then was removed the morning of postoperative day 1. The same set of instruments was used on both sides.
Patients in the posterior group were positioned lateral on a regular operative table with hip rests. The most symptomatic hip was operated on first. After wound closure and dressing application, the patient was flipped to allow access to the contralateral hip and was prepared and draped again. The same instruments were used on each side. Drains were not used.
All patients received the same comprehensive multimodal pain management, which combined general and epidural anesthesia (remaining in place until postoperative day 2) and included an oral pain regimen of scheduled acetaminophen and as-needed tramadol and oxycodone. In all cases, intraoperative blood salvage and intravenous tranexamic acid (1 g at time of incision on first hip, 1 g at wound closure on second hip) were used. Preoperative autologous blood donation was not used. For deep vein thrombosis prophylaxis, patients were treated with bilateral sequential compression devices while hospitalized, but chemoprophylaxis was different between groups. Patients in the DA group received prophylactic low-molecular-weight heparin for 10 days, followed by twice-daily aspirin (325 mg) for 4 weeks. Patients in the posterior group received warfarin (goal international normalized ratio, 1.7-2.2) for 3 weeks, followed by twice-daily aspirin (325 mg) for 3 weeks. The decision to transfuse allogenic red blood cells was made by the treating surgeon, based on standardized hospital protocols, wherein patients are transfused for hemoglobin levels under 7.0 g/dL, or for hemoglobin levels less than 8.0 g/dL in the presence of persistent symptoms. All patients received care on an orthopedic specialty floor and were assisted by the same physical therapists. Discharge disposition was coordinated with the same group of social workers.
Two to 3 months after surgery, patients returned for routine examination and radiographs. All patients were followed up for at least 90 days.
Statistical Analysis
All outcomes were analyzed with appropriate summary statistics. Chi-square tests or logistic regression analyses (for categorical outcomes) were used to compare baseline covariates with perioperative outcomes, and 2-sample tests or Wilcoxon rank-sum tests were used to compare outcomes measured on a continuous scale. Odds ratios (ORs) with 95% confidence intervals (CIs) were calculated as appropriate. Operative time was calculated by adding time from incision to wound closure for both hips (room turnover time between hips was not included). Anesthesia time was defined as total time patients were in the operating room. All statistical tests were 2-sided, and the threshold for statistical significance was set at α = 0.05.
Results
Compared with patients who underwent simultaneous bilateral THAs through the posterior approach, patients who underwent simultaneous bilateral THAs through the DA approach had longer mean operative times (153 vs 106 min; P < .001) and anesthesia times (257 vs 221 min; P = .007). The 2 groups’ hospital stays were similar in length (3.1 vs 3.5 days; P = .31), but patients in the DA group were more likely to be discharged home (100.0% vs 71.4%; P = .02) (Table 2). 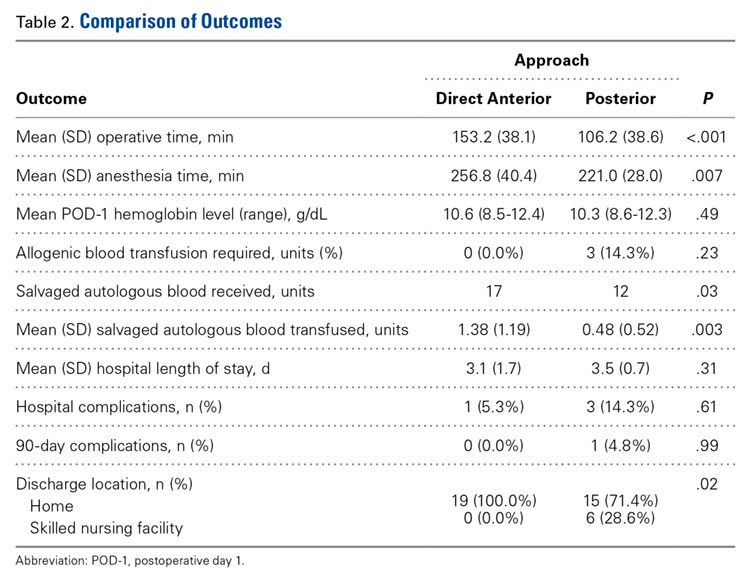
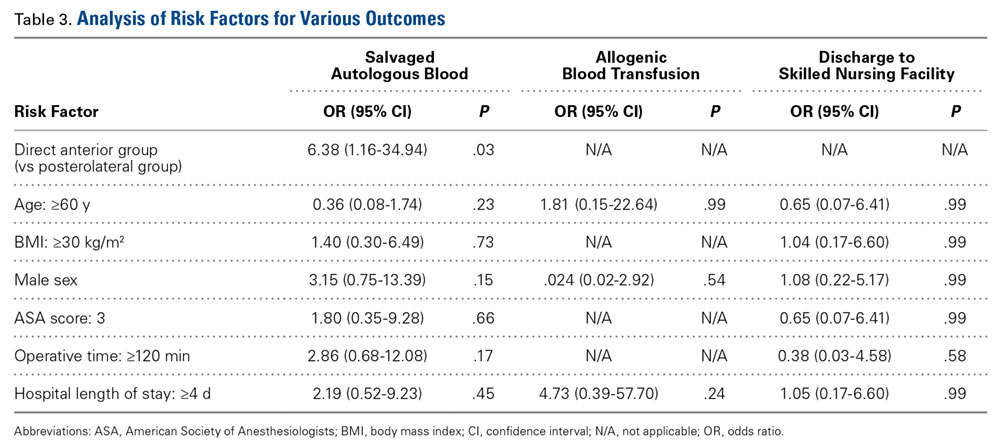
Patients in the DA group were more likely to have sufficient intraoperative blood salvage for autologous transfusion (89.5% vs 57.1%; OR, 6.4; 95% CI, 1.16-34.94; P = .03) (Table 3) and received more mean units of salvaged autologous blood (1.4 vs 0.5; P = .003) (Table 2). Allogenic blood was not given to any patients in the DA group, but 3 patients in the posterior group (14.3%) required allogenic blood transfusion (P = .23) (Table 2). Salvaged autologous and allogenic blood transfusion was not associated with sex, age 60 years or older, or hospital LOS of 4 days or more (Table 3). The groups’ mean hemoglobin levels, measured the morning of postoperative day 1, were similar: 10.6 g/dL (range, 8.5-12.4 g/dL) for the DA group and 10.3 g/dL (range 8.6-12.3 g/dL) for the posterior group (Table 2).
In-hospital complications were uncommon in both groups (5% vs 14%; P = .61) (Table 2). One patient in the posterior group sustained a unilateral dislocation the day of surgery, and closed reduction was required; other complications (1 ileus, 2 tachyarrhythmias) did not require intervention. Ninety-day complications were also rare; 1 patient in the posterior group developed a hematoma with wound drainage, and this was successfully managed conservatively. There were no reoperations or readmissions in either group (Table 2).
Discussion
Although bilateral procedures account for less than 1% of THAs in the United States,11 debate about their role in patients with severe bilateral hip disease continues. The potential benefits of a single episode of care must be weighed against the slightly increased risk for systemic complications.7,10-15 Recent innovations in perioperative management have been shown to minimize complications,15 but it is unclear whether surgical approach affects perioperative outcomes. Our goals in this study were to evaluate operative times, transfusion requirements, hospital discharge data, and 90-day complication rates in patients who underwent simultaneous bilateral THAs through either the DA approach or the posterior approach.
Patients in our DA group had longer operative and anesthesia times. Other studies have found longer operative times for the DA approach relative to the posterior approach in unilateral THAs.18 One potential benefit of the DA approach in the setting of simultaneous bilateral THAs is the ability to prepare and drape both sides before surgery and thereby keep the interruption between hips to a minimum. In the present study, however, time saved during turnover between hips was overshadowed by the time added for each THA.
Although it was uncommon for complications to occur within 90 days after surgery in this study, many patients are needed to fully investigate these rare occurrences. Because of inherent selection bias, these risks are difficult to directly compare in patients who undergo unilateral procedures. Although small studies have failed to clarify the issue,7,19,20 a recent review of the almost 20,000 bilateral THA cases in the US Nationwide Inpatient Sample database found that bilateral (vs unilateral) THAs were associated with increased risk of local and systemic complications.11 Therefore, bilateral THAs should be reserved for select cases, with attention given to excluding patients with preexisting cardiopulmonary disease and providing appropriate preoperative counseling.
Most studies have reported a higher transfusion rate in bilateral THAs relative to staged procedures.7,21-23 Allogenic blood transfusion leads to immune suppression, coagulopathy, and other systemic effects in general, and has been specifically associated with infection in patients who undergo total joint arthroplasty.24-29 Parvizi and colleagues17 reported reduced blood loss and fewer blood transfusions in patients who had simultaneous bilateral THAs through the DA approach, compared with the direct lateral approach. Patients in our DA group received more salvaged autologous blood, which we suppose was a function of longer operative times. However, postoperative hemoglobin levels and allogenic blood transfusion rates were statistically similar between the 2 groups. It is important to consider the increased risk of required allogenic blood transfusion associated with simultaneous bilateral THAs, but it is not fully clear if this risk is lower in THAs performed through the DA approach relative to other approaches. In our experience, the required transfusion risk is limited in DA and posterior approaches with use of contemporary perioperative blood management strategies.
Although hospital LOS is longer with simultaneous bilateral THAs than with unilateral THAs, historically it is shorter than the combined LOS of staged bilateral THAs.20 Patients in our study had a relatively short LOS after bilateral THAs, and there was no difference in LOS between groups. However, patients were more likely to be discharged home after bilateral THAs through the DA approach vs the posterior approach. Although discharge location was not affected by age, sex, ASA score, or LOS, unrecognized social factors unrelated to surgical approach likely influenced this finding.
This study should be interpreted in light of important limitations. Foremost, although data were prospectively collected, we examined them retrospectively. Thus, it is possible there may be unaccounted for differences between our DA and posterior THA groups. For example, the DA and posterior approaches were used by different surgeons with differing experience, technique, and preferences, all of which could have affected outcomes. Furthermore, our sample was relatively small (simultaneous bilateral THAs are performed relatively infrequently). Last, although anesthesia, pain management, blood conservation, and physical therapy were similar for the 2 groups, there was no standardized protocol for determining eligibility for simultaneous bilateral THAs.
In conclusion, we found that simultaneous bilateral THAs can be safely performed through either the DA approach or the posterior approach. Although the transition between hips is shorter with the DA approach, this time savings is overshadowed by the increased duration of each procedure. Transfusion rates are low in both groups, and in-hospital and 90-day complications are quite rare. Furthermore, patients can routinely be discharged home without elevating readmission rates. We will continue to perform simultaneous bilateral THAs through the DA approach or the posterior approach, according to surgeon preference.
Am J Orthop. 2016;45(6):E373-E378. Copyright Frontline Medical Communications Inc. 2016. All rights reserved.
1. Learmonth ID, Young C, Rorabeck C. The operation of the century: total hip replacement. Lancet. 2007;370(9597):1508-1519.
2. Sayeed SA, Johnson AJ, Jaffe DE, Mont MA. Incidence of contralateral THA after index THA for osteoarthritis. Clin Orthop Relat Res. 2012;470(2):535-540.
3. Sayeed SA, Trousdale RT, Barnes SA, Kaufman KR, Pagnano MW. Joint arthroplasty within 10 years after primary Charnley total hip arthroplasty. Am J Orthop. 2009;38(8):E141-E143.
4. Goker B, Doughan AM, Schnitzer TJ, Block JA. Quantification of progressive joint space narrowing in osteoarthritis of the hip: longitudinal analysis of the contralateral hip after total hip arthroplasty. Arthritis Rheum. 2000;43(5):988-994.
5. Husted H, Overgaard S, Laursen JO, et al. Need for bilateral arthroplasty for coxarthrosis. 1,477 replacements in 1,199 patients followed for 0-14 years. Acta Orthop Scand. 1996;67(5):421-423.
6. Ritter MA, Carr K, Herbst SA, et al. Outcome of the contralateral hip following total hip arthroplasty for osteoarthritis. J Arthroplasty. 1996;11(3):242-246.
7. Alfaro- Adrián J, Bayona F, Rech JA, Murray DW. One- or two-stage bilateral total hip replacement. J Arthroplasty. 1999;14(4):439-445.
8. Wykman A, Olsson E. Walking ability after total hip replacement. A comparison of gait analysis in unilateral and bilateral cases. J Bone Joint Surg Br. 1992;74(1):53-56.
9. Yoshii T, Jinno T, Morita S, et al. Postoperative hip motion and functional recovery after simultaneous bilateral total hip arthroplasty for bilateral osteoarthritis. J Orthop Sci. 2009;14(2):161-166.
10. Lorenze M, Huo MH, Zatorski LE, Keggi KJ. A comparison of the cost effectiveness of one-stage versus two-stage bilateral total hip replacement. Orthopedics. 1998;21(12):1249-1252.
11. Rasouli MR, Maltenfort MG, Ross D, Hozack WJ, Memtsoudis SG, Parvizi J. Perioperative morbidity and mortality following bilateral total hip arthroplasty. J Arthroplasty. 2014;29(1):142-148.
12. Reuben JD, Meyers SJ, Cox DD, Elliott M, Watson M, Shim SD. Cost comparison between bilateral simultaneous, staged, and unilateral total joint arthroplasty. J Arthroplasty. 1998;13(2):172-179.
13. Bracy D, Wroblewski BM. Bilateral Charnley arthroplasty as a single procedure. A report on 400 patients. J Bone Joint Surg Br. 1981;63(3):354-356.
14. Ritter MA, Randolph JC. Bilateral total hip arthroplasty: a simultaneous procedure. Acta Orthop Scand. 1976;47(2):203-208.
15. Ritter MA, Stringer EA. Bilateral total hip arthroplasty: a single procedure. Clin Orthop Relat Res. 1980;(149):185-190.
16. Matta JM, Shahrdar C, Ferguson T. Single-incision anterior approach for total hip arthroplasty on an orthopaedic table. Clin Orthop Relat Res. 2005;(441):115-124.
17. Parvizi J, Rasouli MR, Jaberi M, et al. Does the surgical approach in one stage bilateral total hip arthroplasty affect blood loss? Int Orthop. 2013;37(12):2357-2362.
18. Poehling-Monaghan KL, Kamath AF, Taunton MJ, Pagnano MW. Direct anterior versus miniposterior THA with the same advanced perioperative protocols: surprising early clinical results. Clin Orthop Relat Res. 2015;473(2):623-631.
19. Macaulay W, Salvati EA, Sculco TP, Pellicci PM. Single-stage bilateral total hip arthroplasty. J Am Acad Orthop Surg. 2002;10(3):217-221.
20. Romagnoli S, Zacchetti S, Perazzo P, Verde F, Banfi G, Viganò M. Simultaneous bilateral total hip arthroplasties do not lead to higher complication or allogeneic transfusion rates compared to unilateral procedures. Int Orthop. 2013;37(11):2125-2130.
21. Salvati EA, Hughes P, Lachiewicz P. Bilateral total hip-replacement arthroplasty in one stage. J Bone Joint Surg Am. 1978;60(5):640-644.
22. Parvizi J, Chaudhry S, Rasouli MR, et al. Who needs autologous blood donation in joint replacement? J Knee Surg. 2011;24(1):25-31.
23. Parvizi J, Mui A, Purtill JJ, Sharkey PF, Hozack WJ, Rothman RH. Total joint arthroplasty: when do fatal or near-fatal complications occur? J Bone Joint Surg Am. 2007;89(1):27-32.
24. Blair SD, Janvrin SB, McCollum CN, Greenhalgh RM. Effect of early blood transfusion on gastrointestinal haemorrhage. Br J Surg. 1986;73(10):783-785.
25. Blumberg N, Heal JM. Immunomodulation by blood transfusion: an evolving scientific and clinical challenge. Am J Med. 1996;101(3):299-308.
26. Hébert PC, Wells G, Blajchman MA, et al. A multicenter, randomized, controlled clinical trial of transfusion requirements in critical care. Transfusion Requirements in Critical Care Investigators, Canadian Critical Care Trials Group. N Engl J Med. 1999;340(6):409-417.
27. Iturbe T, Cornudella R, de Miguel R, et al. Hypercoagulability state in hip and knee surgery: influence of ABO antigenic system and allogenic transfusion. Transfus Sci. 1999;20(1):17-20.
28. Murphy P, Heal JM, Blumberg N. Infection or suspected infection after hip replacement surgery with autologous or homologous blood transfusions. Transfusion. 1991;31(3):212-217.
29. Watts CD, Pagnano MW. Minimising blood loss and transfusion in contemporary hip and knee arthroplasty. J Bone Joint Surg Br. 2012;94(11 suppl A):8-10.
End-stage osteoarthritis of the hip is a debilitating disease that is reliably treated with total hip arthroplasty (THA).1 Up to 35% of patients who undergo THA eventually require contralateral THA.2,3 In patients who present with advanced bilateral disease and undergo unilateral THA, the risk of ultimately requiring a contralateral procedure is as high as 97%.3-6 In patients with bilateral hip disease, function is not fully optimized until both hips have been replaced, particularly in the setting of fixed flexion contractures.7-9 Naturally, there has been some interest in simultaneous bilateral THAs for select patients.
The potential benefits of bilateral THAs over staged procedures include faster overall rehabilitation, exposure to a single anesthetic, reduced hospital length of stay (LOS), and cost savings.10-12 However, opinion on recommending bilateral THAs is mixed. Although bilateral procedures historically have been fraught with perioperative complications,13,14 advances in surgical and anesthetic techniques have led to improved outcomes.15 Whether surgical approach is a factor in these outcomes is unclear.
The popularity of the direct anterior (DA) approach for THA has increased in recent years.16 Although the relative advantages of various approaches remain in debate, one potential benefit of the DA approach is supine positioning, which allows simultaneous bilateral THAs to be performed without the need for repositioning before proceeding with the contralateral side. However, simultaneous bilateral THAs performed through the DA approach and those performed through other surgical approaches are lacking in comparative outcomes data.17In this study, we evaluated operative times, transfusion requirements, hospital discharge data, and 90-day complication rates in patients who had simultaneous bilateral THAs through either the DA approach or the posterior approach.
Methods
Study Design
This single-center study was conducted at the Mayo Clinic in Rochester, Minnesota. After obtaining approval from our Institutional Review Board, we performed a retrospective cohort analysis. We used our institution’s total joint registry to identify all patients who underwent simultaneous bilateral THAs through either the DA approach or the posterior approach. The first bilateral THAs to use the DA approach at our institution were performed in 2012. To ensure that the DA and posterior groups’ perioperative management would be similar, we included only cases performed between 2012 and 2014.
There were 19 patients in the DA group and 21 in the posterior group. The groups were similar in mean age (54 vs 54 years; P = .90), sex (73% vs 57% males; P = .33), body mass index (BMI; 25 vs 28 kg/m2; P = .38), preoperative hemoglobin level (14.3 vs 14.0 g/dL; P = .37), preoperative diagnosis (71.1% vs 78.6% degenerative joint disease; P = .75), and American Society of Anesthesiologists (ASA) score (1.9 vs 2.0; P = .63) (Table 1).
Patient Care
All cases were performed by 1 of 3 dedicated arthroplasty surgeons (Dr. Taunton, Dr. Sierra, Dr. Trousdale). Dr. Taunton exclusively uses the DA approach, and Dr. Sierra and Dr. Trousdale exclusively use the posterior approach. Patients in both groups received preoperative medical clearance and attended the same preoperative education class.
Patients in the DA group were positioned supine on an orthopedic table that allows hyperextension and adduction of the operative leg. Both hips were prepared and draped simultaneously. The most symptomatic hip was operated on first, with a sterile drape covering the contralateral hip. Between hips, fluoroscopy was moved to the other side of the operative suite, but no changes in positioning or preparation were necessary. A deep drain was placed on each side, and then was removed the morning of postoperative day 1. The same set of instruments was used on both sides.
Patients in the posterior group were positioned lateral on a regular operative table with hip rests. The most symptomatic hip was operated on first. After wound closure and dressing application, the patient was flipped to allow access to the contralateral hip and was prepared and draped again. The same instruments were used on each side. Drains were not used.
All patients received the same comprehensive multimodal pain management, which combined general and epidural anesthesia (remaining in place until postoperative day 2) and included an oral pain regimen of scheduled acetaminophen and as-needed tramadol and oxycodone. In all cases, intraoperative blood salvage and intravenous tranexamic acid (1 g at time of incision on first hip, 1 g at wound closure on second hip) were used. Preoperative autologous blood donation was not used. For deep vein thrombosis prophylaxis, patients were treated with bilateral sequential compression devices while hospitalized, but chemoprophylaxis was different between groups. Patients in the DA group received prophylactic low-molecular-weight heparin for 10 days, followed by twice-daily aspirin (325 mg) for 4 weeks. Patients in the posterior group received warfarin (goal international normalized ratio, 1.7-2.2) for 3 weeks, followed by twice-daily aspirin (325 mg) for 3 weeks. The decision to transfuse allogenic red blood cells was made by the treating surgeon, based on standardized hospital protocols, wherein patients are transfused for hemoglobin levels under 7.0 g/dL, or for hemoglobin levels less than 8.0 g/dL in the presence of persistent symptoms. All patients received care on an orthopedic specialty floor and were assisted by the same physical therapists. Discharge disposition was coordinated with the same group of social workers.
Two to 3 months after surgery, patients returned for routine examination and radiographs. All patients were followed up for at least 90 days.
Statistical Analysis
All outcomes were analyzed with appropriate summary statistics. Chi-square tests or logistic regression analyses (for categorical outcomes) were used to compare baseline covariates with perioperative outcomes, and 2-sample tests or Wilcoxon rank-sum tests were used to compare outcomes measured on a continuous scale. Odds ratios (ORs) with 95% confidence intervals (CIs) were calculated as appropriate. Operative time was calculated by adding time from incision to wound closure for both hips (room turnover time between hips was not included). Anesthesia time was defined as total time patients were in the operating room. All statistical tests were 2-sided, and the threshold for statistical significance was set at α = 0.05.
Results
Compared with patients who underwent simultaneous bilateral THAs through the posterior approach, patients who underwent simultaneous bilateral THAs through the DA approach had longer mean operative times (153 vs 106 min; P < .001) and anesthesia times (257 vs 221 min; P = .007). The 2 groups’ hospital stays were similar in length (3.1 vs 3.5 days; P = .31), but patients in the DA group were more likely to be discharged home (100.0% vs 71.4%; P = .02) (Table 2).
Patients in the DA group were more likely to have sufficient intraoperative blood salvage for autologous transfusion (89.5% vs 57.1%; OR, 6.4; 95% CI, 1.16-34.94; P = .03) (Table 3) and received more mean units of salvaged autologous blood (1.4 vs 0.5; P = .003) (Table 2). Allogenic blood was not given to any patients in the DA group, but 3 patients in the posterior group (14.3%) required allogenic blood transfusion (P = .23) (Table 2). Salvaged autologous and allogenic blood transfusion was not associated with sex, age 60 years or older, or hospital LOS of 4 days or more (Table 3). The groups’ mean hemoglobin levels, measured the morning of postoperative day 1, were similar: 10.6 g/dL (range, 8.5-12.4 g/dL) for the DA group and 10.3 g/dL (range 8.6-12.3 g/dL) for the posterior group (Table 2).
In-hospital complications were uncommon in both groups (5% vs 14%; P = .61) (Table 2). One patient in the posterior group sustained a unilateral dislocation the day of surgery, and closed reduction was required; other complications (1 ileus, 2 tachyarrhythmias) did not require intervention. Ninety-day complications were also rare; 1 patient in the posterior group developed a hematoma with wound drainage, and this was successfully managed conservatively. There were no reoperations or readmissions in either group (Table 2).
Discussion
Although bilateral procedures account for less than 1% of THAs in the United States,11 debate about their role in patients with severe bilateral hip disease continues. The potential benefits of a single episode of care must be weighed against the slightly increased risk for systemic complications.7,10-15 Recent innovations in perioperative management have been shown to minimize complications,15 but it is unclear whether surgical approach affects perioperative outcomes. Our goals in this study were to evaluate operative times, transfusion requirements, hospital discharge data, and 90-day complication rates in patients who underwent simultaneous bilateral THAs through either the DA approach or the posterior approach.
Patients in our DA group had longer operative and anesthesia times. Other studies have found longer operative times for the DA approach relative to the posterior approach in unilateral THAs.18 One potential benefit of the DA approach in the setting of simultaneous bilateral THAs is the ability to prepare and drape both sides before surgery and thereby keep the interruption between hips to a minimum. In the present study, however, time saved during turnover between hips was overshadowed by the time added for each THA.
Although it was uncommon for complications to occur within 90 days after surgery in this study, many patients are needed to fully investigate these rare occurrences. Because of inherent selection bias, these risks are difficult to directly compare in patients who undergo unilateral procedures. Although small studies have failed to clarify the issue,7,19,20 a recent review of the almost 20,000 bilateral THA cases in the US Nationwide Inpatient Sample database found that bilateral (vs unilateral) THAs were associated with increased risk of local and systemic complications.11 Therefore, bilateral THAs should be reserved for select cases, with attention given to excluding patients with preexisting cardiopulmonary disease and providing appropriate preoperative counseling.
Most studies have reported a higher transfusion rate in bilateral THAs relative to staged procedures.7,21-23 Allogenic blood transfusion leads to immune suppression, coagulopathy, and other systemic effects in general, and has been specifically associated with infection in patients who undergo total joint arthroplasty.24-29 Parvizi and colleagues17 reported reduced blood loss and fewer blood transfusions in patients who had simultaneous bilateral THAs through the DA approach, compared with the direct lateral approach. Patients in our DA group received more salvaged autologous blood, which we suppose was a function of longer operative times. However, postoperative hemoglobin levels and allogenic blood transfusion rates were statistically similar between the 2 groups. It is important to consider the increased risk of required allogenic blood transfusion associated with simultaneous bilateral THAs, but it is not fully clear if this risk is lower in THAs performed through the DA approach relative to other approaches. In our experience, the required transfusion risk is limited in DA and posterior approaches with use of contemporary perioperative blood management strategies.
Although hospital LOS is longer with simultaneous bilateral THAs than with unilateral THAs, historically it is shorter than the combined LOS of staged bilateral THAs.20 Patients in our study had a relatively short LOS after bilateral THAs, and there was no difference in LOS between groups. However, patients were more likely to be discharged home after bilateral THAs through the DA approach vs the posterior approach. Although discharge location was not affected by age, sex, ASA score, or LOS, unrecognized social factors unrelated to surgical approach likely influenced this finding.
This study should be interpreted in light of important limitations. Foremost, although data were prospectively collected, we examined them retrospectively. Thus, it is possible there may be unaccounted for differences between our DA and posterior THA groups. For example, the DA and posterior approaches were used by different surgeons with differing experience, technique, and preferences, all of which could have affected outcomes. Furthermore, our sample was relatively small (simultaneous bilateral THAs are performed relatively infrequently). Last, although anesthesia, pain management, blood conservation, and physical therapy were similar for the 2 groups, there was no standardized protocol for determining eligibility for simultaneous bilateral THAs.
In conclusion, we found that simultaneous bilateral THAs can be safely performed through either the DA approach or the posterior approach. Although the transition between hips is shorter with the DA approach, this time savings is overshadowed by the increased duration of each procedure. Transfusion rates are low in both groups, and in-hospital and 90-day complications are quite rare. Furthermore, patients can routinely be discharged home without elevating readmission rates. We will continue to perform simultaneous bilateral THAs through the DA approach or the posterior approach, according to surgeon preference.
Am J Orthop. 2016;45(6):E373-E378. Copyright Frontline Medical Communications Inc. 2016. All rights reserved.
1. Learmonth ID, Young C, Rorabeck C. The operation of the century: total hip replacement. Lancet. 2007;370(9597):1508-1519.
2. Sayeed SA, Johnson AJ, Jaffe DE, Mont MA. Incidence of contralateral THA after index THA for osteoarthritis. Clin Orthop Relat Res. 2012;470(2):535-540.
3. Sayeed SA, Trousdale RT, Barnes SA, Kaufman KR, Pagnano MW. Joint arthroplasty within 10 years after primary Charnley total hip arthroplasty. Am J Orthop. 2009;38(8):E141-E143.
4. Goker B, Doughan AM, Schnitzer TJ, Block JA. Quantification of progressive joint space narrowing in osteoarthritis of the hip: longitudinal analysis of the contralateral hip after total hip arthroplasty. Arthritis Rheum. 2000;43(5):988-994.
5. Husted H, Overgaard S, Laursen JO, et al. Need for bilateral arthroplasty for coxarthrosis. 1,477 replacements in 1,199 patients followed for 0-14 years. Acta Orthop Scand. 1996;67(5):421-423.
6. Ritter MA, Carr K, Herbst SA, et al. Outcome of the contralateral hip following total hip arthroplasty for osteoarthritis. J Arthroplasty. 1996;11(3):242-246.
7. Alfaro- Adrián J, Bayona F, Rech JA, Murray DW. One- or two-stage bilateral total hip replacement. J Arthroplasty. 1999;14(4):439-445.
8. Wykman A, Olsson E. Walking ability after total hip replacement. A comparison of gait analysis in unilateral and bilateral cases. J Bone Joint Surg Br. 1992;74(1):53-56.
9. Yoshii T, Jinno T, Morita S, et al. Postoperative hip motion and functional recovery after simultaneous bilateral total hip arthroplasty for bilateral osteoarthritis. J Orthop Sci. 2009;14(2):161-166.
10. Lorenze M, Huo MH, Zatorski LE, Keggi KJ. A comparison of the cost effectiveness of one-stage versus two-stage bilateral total hip replacement. Orthopedics. 1998;21(12):1249-1252.
11. Rasouli MR, Maltenfort MG, Ross D, Hozack WJ, Memtsoudis SG, Parvizi J. Perioperative morbidity and mortality following bilateral total hip arthroplasty. J Arthroplasty. 2014;29(1):142-148.
12. Reuben JD, Meyers SJ, Cox DD, Elliott M, Watson M, Shim SD. Cost comparison between bilateral simultaneous, staged, and unilateral total joint arthroplasty. J Arthroplasty. 1998;13(2):172-179.
13. Bracy D, Wroblewski BM. Bilateral Charnley arthroplasty as a single procedure. A report on 400 patients. J Bone Joint Surg Br. 1981;63(3):354-356.
14. Ritter MA, Randolph JC. Bilateral total hip arthroplasty: a simultaneous procedure. Acta Orthop Scand. 1976;47(2):203-208.
15. Ritter MA, Stringer EA. Bilateral total hip arthroplasty: a single procedure. Clin Orthop Relat Res. 1980;(149):185-190.
16. Matta JM, Shahrdar C, Ferguson T. Single-incision anterior approach for total hip arthroplasty on an orthopaedic table. Clin Orthop Relat Res. 2005;(441):115-124.
17. Parvizi J, Rasouli MR, Jaberi M, et al. Does the surgical approach in one stage bilateral total hip arthroplasty affect blood loss? Int Orthop. 2013;37(12):2357-2362.
18. Poehling-Monaghan KL, Kamath AF, Taunton MJ, Pagnano MW. Direct anterior versus miniposterior THA with the same advanced perioperative protocols: surprising early clinical results. Clin Orthop Relat Res. 2015;473(2):623-631.
19. Macaulay W, Salvati EA, Sculco TP, Pellicci PM. Single-stage bilateral total hip arthroplasty. J Am Acad Orthop Surg. 2002;10(3):217-221.
20. Romagnoli S, Zacchetti S, Perazzo P, Verde F, Banfi G, Viganò M. Simultaneous bilateral total hip arthroplasties do not lead to higher complication or allogeneic transfusion rates compared to unilateral procedures. Int Orthop. 2013;37(11):2125-2130.
21. Salvati EA, Hughes P, Lachiewicz P. Bilateral total hip-replacement arthroplasty in one stage. J Bone Joint Surg Am. 1978;60(5):640-644.
22. Parvizi J, Chaudhry S, Rasouli MR, et al. Who needs autologous blood donation in joint replacement? J Knee Surg. 2011;24(1):25-31.
23. Parvizi J, Mui A, Purtill JJ, Sharkey PF, Hozack WJ, Rothman RH. Total joint arthroplasty: when do fatal or near-fatal complications occur? J Bone Joint Surg Am. 2007;89(1):27-32.
24. Blair SD, Janvrin SB, McCollum CN, Greenhalgh RM. Effect of early blood transfusion on gastrointestinal haemorrhage. Br J Surg. 1986;73(10):783-785.
25. Blumberg N, Heal JM. Immunomodulation by blood transfusion: an evolving scientific and clinical challenge. Am J Med. 1996;101(3):299-308.
26. Hébert PC, Wells G, Blajchman MA, et al. A multicenter, randomized, controlled clinical trial of transfusion requirements in critical care. Transfusion Requirements in Critical Care Investigators, Canadian Critical Care Trials Group. N Engl J Med. 1999;340(6):409-417.
27. Iturbe T, Cornudella R, de Miguel R, et al. Hypercoagulability state in hip and knee surgery: influence of ABO antigenic system and allogenic transfusion. Transfus Sci. 1999;20(1):17-20.
28. Murphy P, Heal JM, Blumberg N. Infection or suspected infection after hip replacement surgery with autologous or homologous blood transfusions. Transfusion. 1991;31(3):212-217.
29. Watts CD, Pagnano MW. Minimising blood loss and transfusion in contemporary hip and knee arthroplasty. J Bone Joint Surg Br. 2012;94(11 suppl A):8-10.
Patient-Reported Outcomes of Azelaic Acid Foam 15% for Patients With Papulopustular Rosacea: Secondary Efficacy Results From a Randomized, Controlled, Double-blind, Phase 3 Trial
Rosacea is a chronic inflammatory disorder that may negatively impact patients’ quality of life (QOL).1,2 Papulopustular rosacea (PPR) is characterized by centrofacial inflammatory lesions and erythema as well as burning and stinging secondary to skin barrier dysfunction.3-5 Increasing rosacea severity is associated with greater rates of anxiety and depression and lower QOL6 as well as low self-esteem and feelings of embarrassment.7,8 Accordingly, assessing patient perceptions of rosacea treatments is necessary for understanding its impact on patient health.6,9
The Rosacea International Expert Group has emphasized the need to incorporate patient assessments of disease severity and QOL when developing therapeutic strategies for rosacea.7 Ease of use, sensory experience, and patient preference also are important dimensions in the evaluation of topical medications, as attributes of specific formulations may affect usability, adherence, and efficacy.10,11
An azelaic acid (AzA) 15% foam formulation, which was approved by the US Food and Drug Administration in 2015, was developed to deliver AzA in a vehicle designed to improve treatment experience in patients with mild to moderate PPR.12 Results from a clinical trial demonstrated superiority of AzA foam to vehicle foam for primary end points that included therapeutic success rate and change in inflammatory lesion count.13,14 Secondary end points assessed in the current analysis included patient perception of product usability, efficacy, and effect on QOL. These patient-reported outcome (PRO) results are reported here.
Methods
Study Design
The design of this phase 3 multicenter, randomized, double-blind, vehicle-controlled, parallel-group clinical trial was described in more detail in an earlier report.13 This study was approved by all appropriate institutional review boards. Eligible participants were 18 years and older with moderate or severe PPR, 12 to 50 inflammatory lesions, and persistent erythema with or without telangiectasia. Exclusion criteria included known nonresponse to AzA, current or prior use (within 6 weeks of randomization) of noninvestigational products to treat rosacea, and presence of other dermatoses that could interfere with rosacea evaluation.
Participants were randomized into the AzA foam or vehicle group (1:1 ratio). The study medication (0.5 g) or vehicle foam was applied twice daily to the entire face until the end of treatment (EoT) at 12 weeks. Efficacy and safety parameters were evaluated at baseline and at 4, 8, and 12 weeks of treatment, and at a follow-up visit 4 weeks after EoT (week 16).
Results for the coprimary efficacy end points—therapeutic success rate according to investigator global assessment and nominal change in inflammatory lesion count—were previously reported,13 as well as secondary efficacy outcomes including change in inflammatory lesion count, therapeutic response rate, and change in erythema rating.14
Patient-Reported Secondary Efficacy Outcomes
The secondary PRO end points were patient-reported global assessment of treatment response (rated as excellent, good, fair, none, or worse), global assessment of tolerability (rated as excellent, good, acceptable despite minor irritation, less acceptable due to continuous irritation, not acceptable, or no opinion), and opinion on cosmetic acceptability and practicability of product use in areas adjacent to the hairline (rated as very good, good, satisfactory, poor, or no opinion).
Additionally, QOL was measured by 3 validated standardized PRO tools, including the Rosacea Quality of Life Index (RosaQOL),15 the EuroQOL 5-dimension 5-level questionnaire (EQ-5D-5L),16 and the Dermatology Life Quality Index (DLQI). The RosaQOL is a rosacea-specific instrument assessing 3 constructs: (1) symptom, (2) emotion, and (3) function. The EQ-5D-5L questionnaire measures overall health status and comprises 5 constructs: (1) mobility, (2) self-care, (3) usual activities, (4) pain/discomfort, and (5) anxiety/depression. The DLQI is a general, dermatology-oriented instrument categorized into 6 constructs: (1) symptoms and feelings, (2) daily activities, (3) leisure, (4) work and school, (5) personal relationships, and (6) treatment.
Statistical Analyses
Patient-reported outcomes were analyzed in an exploratory manner and evaluated at EoT relative to baseline. Self-reported global assessment of treatment response and change in RosaQOL, EQ-5D-5L, and DLQI scores between AzA foam and vehicle foam groups were evaluated using the Wilcoxon rank sum test. Categorical change in the number of participants achieving an increase of 5 or more points in overall DLQI score was evaluated using a χ2 test.
Safety
Safety was analyzed for all randomized patients who were dispensed any study medication. All analyses were performed using SAS version 9.2.
Results
Of the 961 participants included in the study, 483 were randomized to receive AzA foam and 478 were randomized to receive vehicle foam. The mean age was 51.5 years, and the majority of participants were female (73.0%) and white (95.5%)(Table). At baseline, 834 (86.8%) participants had moderate PPR and 127 (13.2%) had severe PPR. The mean inflammatory lesion count (SD) was 21.4 (8.9). No significant differences in baseline characteristics were observed between treatment groups.

Patient-reported global assessment of treatment response differed between treatment groups at EoT (P<.001)(Figure 1). Higher ratings of treatment response were reported among the AzA foam group (excellent, 17.2%; good, 40.0%) versus vehicle foam (excellent, 9.7%; good, 35.0%). The number of participants reporting no treatment response was 13.1% in the AzA foam group, with 1.8% reporting worsening of their condition, while 19.4% of participants in the vehicle foam group reported no response, with 6.3% reporting worsening of their condition (Figure 1).
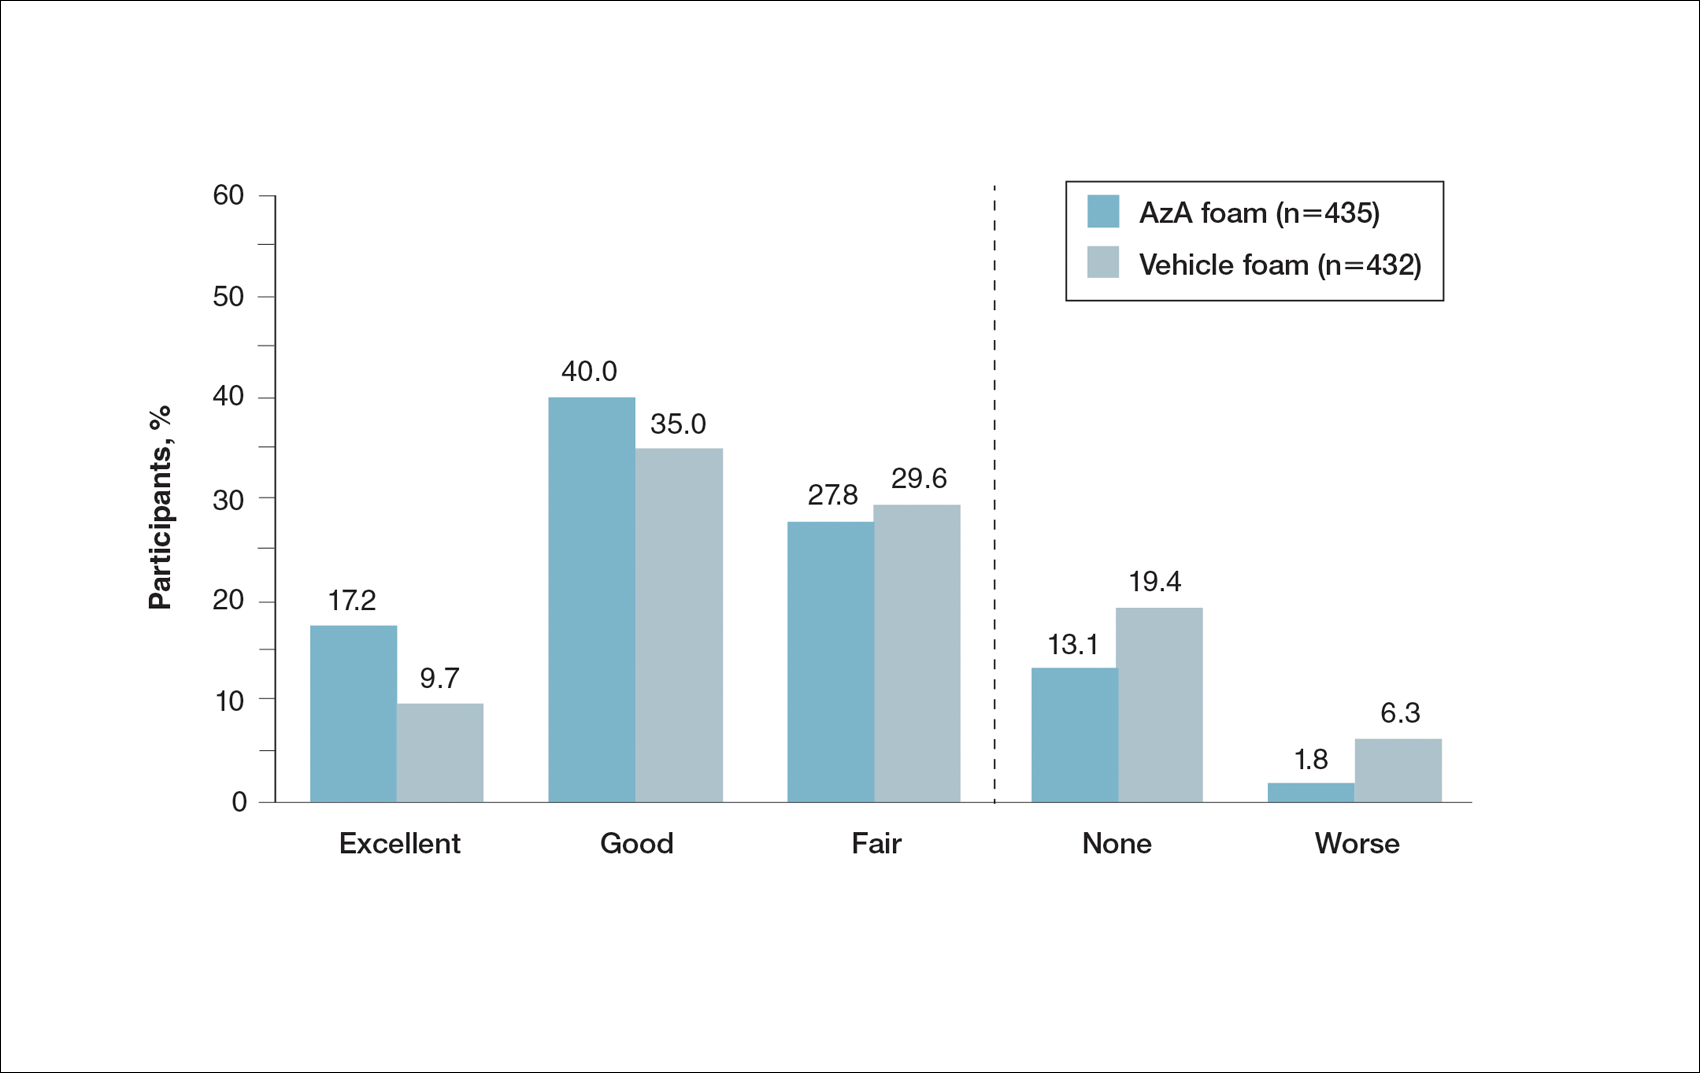
Tolerability was rated excellent or good in 67.8% of the AzA foam group versus 78.2% of the vehicle foam group (Figure 2A). Approximately 38.4% of the AzA foam group versus 38.2% of the vehicle foam group rated treatment tolerability as excellent, while 93.5% of the AzA foam group rated tolerability as acceptable, good, or excellent compared with 89.5% of the vehicle foam group. Only 1.4% of participants in the AzA foam group indicated that treatment was not acceptable due to irritation. In addition, a greater proportion of the AzA foam group reported cosmetic acceptability as very good versus the vehicle foam group (40.5% vs 28.7%)(Figure 2B), with two-thirds reporting cosmetic acceptability as very good or good. Practicability of product use in areas adjacent to the hairline was rated very good by substantial proportions of both the AzA foam and vehicle foam groups (42.8% vs 35.9%)(Figure 2C).
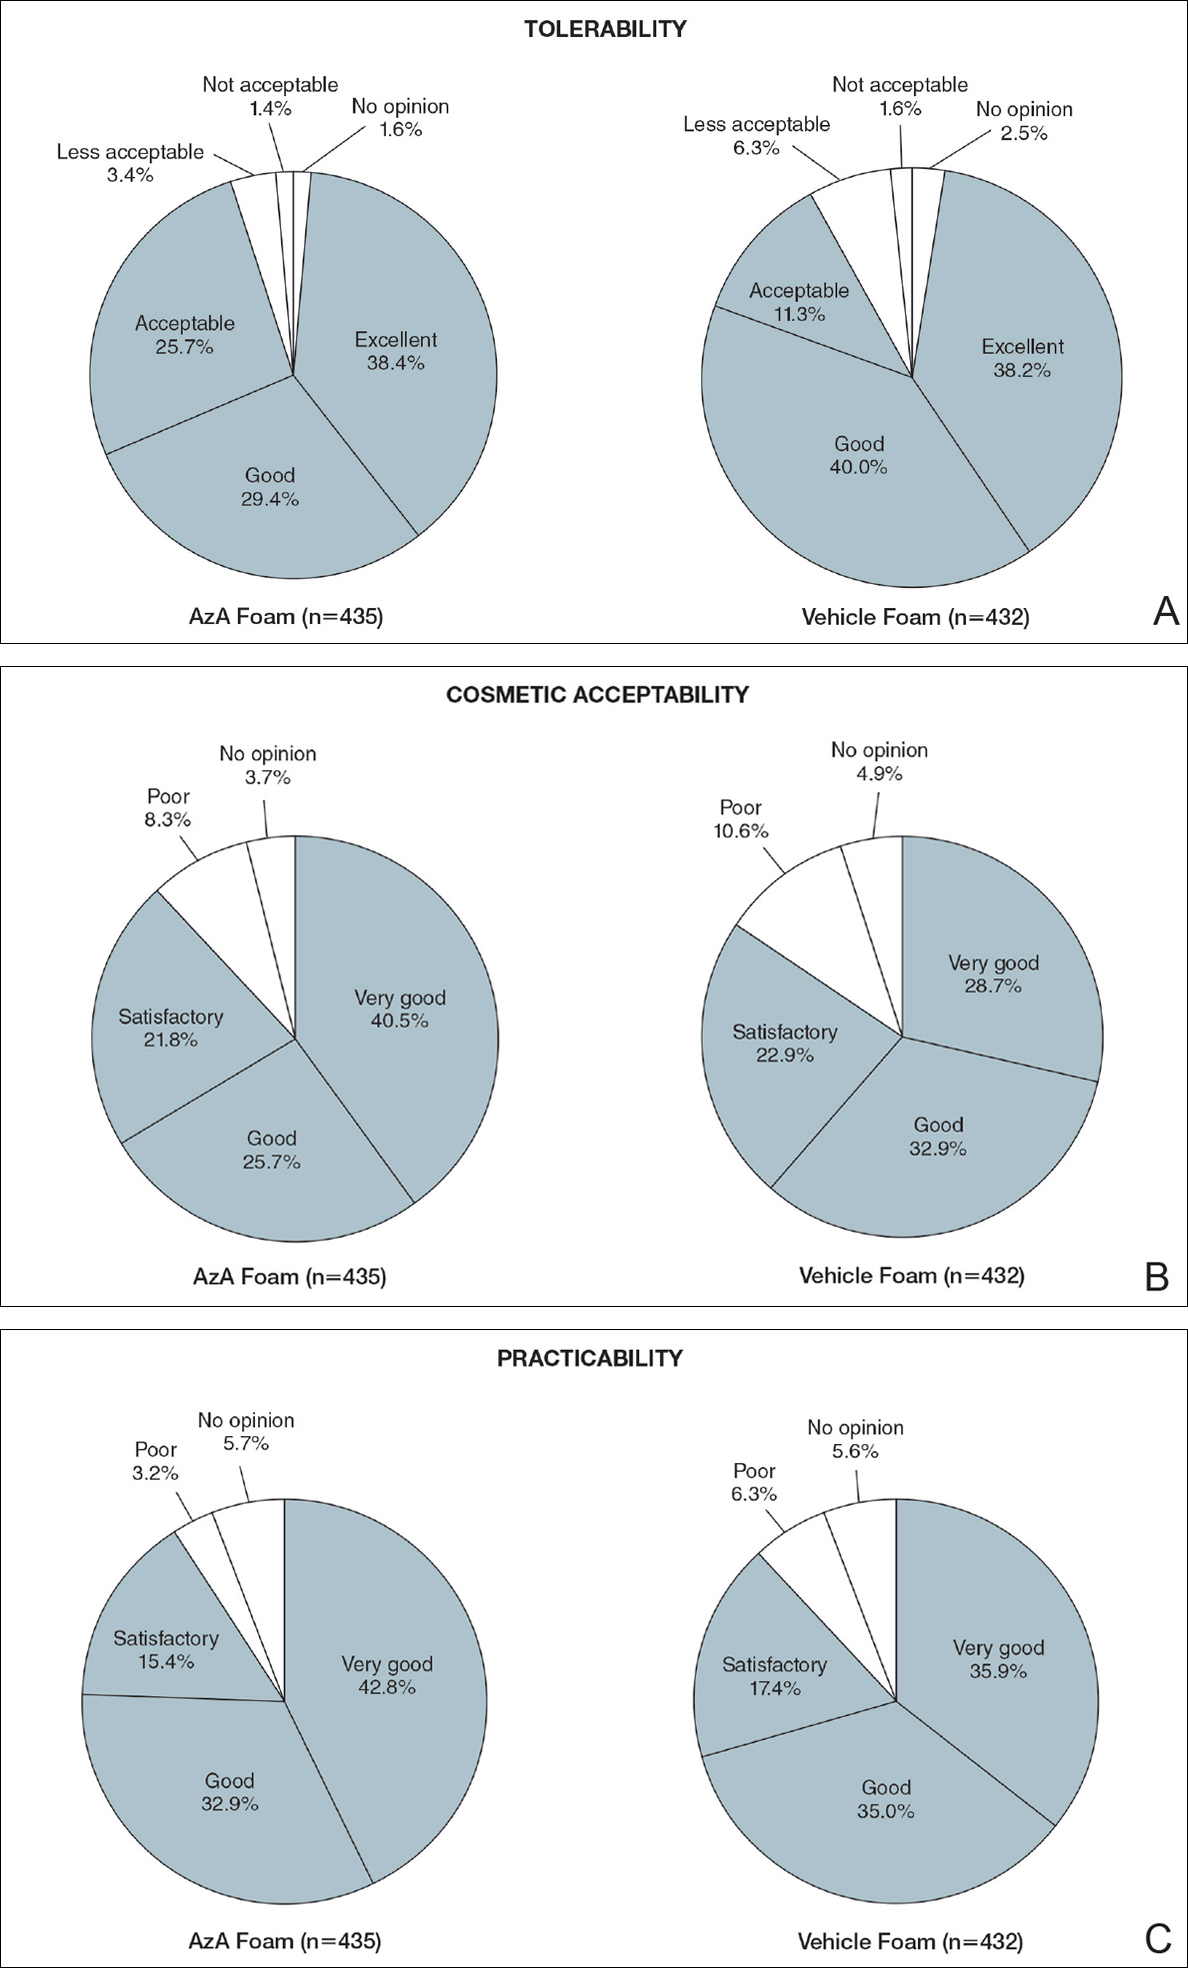
At baseline, average disease burden was moderate according to mean overall DLQI scores (SD) for the AzA foam (5.4 [4.8]) and vehicle foam (5.4 [4.9]) groups. Mean overall DLQI scores improved at EoT, with greater improvement occurring in the AzA foam group (2.6 vs 2.1; P=.018)(Figure 3). A larger proportion of participants in the AzA foam group versus the vehicle foam group also achieved a 5-point or more improvement in overall DLQI score (24.6% vs 19.0%; P=.047). Changes in specific DLQI subscore components were either balanced or in favor of the AzA foam group, including daily activities (0.5 vs 0.4; P=.019), symptoms and feelings (1.2 vs 1.0; P=.069), and leisure (0.5 vs 0.4; P=.012). Specific DLQI items with differences in scores between treatment groups from baseline included the following questions: Over the last week, how embarrassed or self-conscious have you been because of your skin? (P<.001); Over the last week, how much has your skin interfered with you going shopping or looking after your home or garden? (P=.005); Over the last week, how much has your skin affected any social or leisure activities? (P=.040); Over the last week, how much has your skin created problems with your partner or any of your close friends or relatives? (P=.001). Differences between treatment groups favored the AzA foam group for each of these items.
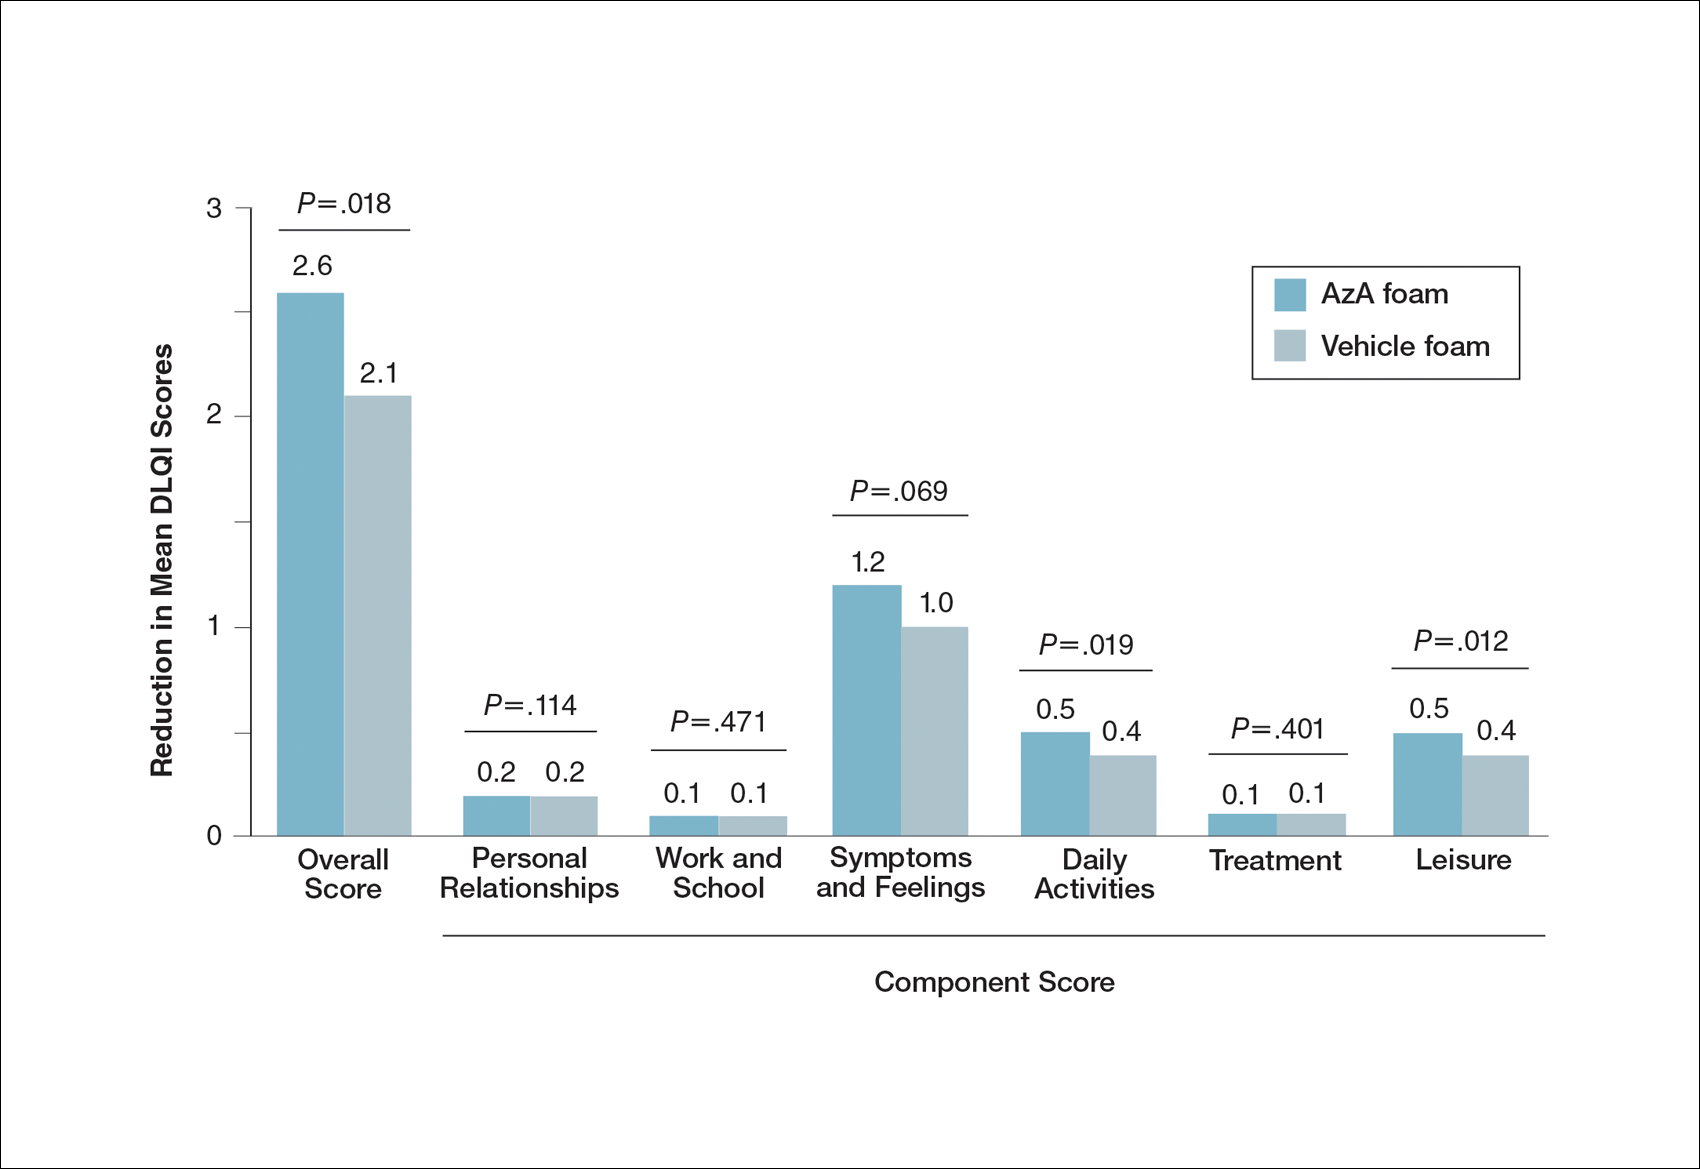
Participants in the AzA foam and vehicle foam groups also showed improvement in RosaQOL scores at EoT (6.8 vs 6.4; P=.67), while EQ-5D-5L scores changed minimally from baseline (0.006 vs 0.007; P=.50).
Safety
The incidence of drug-related adverse events (AEs) was greater in the AzA foam group versus the vehicle foam group (7.7% vs 4.8%). Drug-related AEs occurring in 1% of the AzA foam group were application-site pain including tenderness, stinging, and burning (3.5% for AzA foam vs 1.3% for vehicle foam); application-site pruritus (1.4% vs 0.4%); and application-site dryness (1.0% vs 0.6%). One drug-related AE of severe intensity—application-site dermatitis—occurred in the vehicle foam group; all other drug-related AEs were mild or moderate.14 More detailed safety results are described in a previous report.13
Comment
The PRO outcome data reported here are consistent with previously reported statistically significant improvements in investigator-assessed primary end points for the treatment of PPR with AzA foam.13,14 The data demonstrate that AzA foam benefits both clinical and patient-oriented dimensions of rosacea disease burden and suggest an association between positive treatment response and improved QOL.
Specifically, patient evaluation of treatment response to AzA foam was highly favorable, with 57.2% reporting excellent or good response and 85.1% reporting positive response overall. Recognizing the relapsing-remitting course of PPR, only 1.8% of the AzA foam group experienced worsening of disease at EoT.
The DLQI and RosaQOL instruments revealed notable improvements in QOL from baseline for both treatment groups. Although no significant differences in RosaQOL scores were observed between groups at EoT, significant differences in DLQI scores were detected. Almost one-quarter of participants in the AzA foam group achieved at least a 5-point improvement in DLQI score, exceeding the 4-point threshold for clinically meaningful change.17 Although little change in EQ-5D-5L scores was observed at EoT for both groups with no between-group differences, this finding is not unexpected, as this instrument assesses QOL dimensions such as loss of function, mobility, and ability to wash or dress, which are unlikely to be compromised in most rosacea patients.
Our results also underscore the importance of vehicle in the treatment of compromised skin. Studies of topical treatments for other dermatoses suggest that vehicle properties may reduce disease severity and improve QOL independent of active ingredients.10,18 For example, ease of application, minimal residue, and less time spent in application may explain the superiority of foam to other vehicles in the treatment of psoriasis.18 Our data demonstrating high cosmetic favorability of AzA foam are consistent with these prior observations. Increased tolerability of foam formulations also may affect response to treatment, in part by supporting adherence.18 Most participants receiving AzA foam described tolerability as excellent or good, and the discontinuation rate was low (1.2% of participants in the AzA foam group left the study due to AEs) in the setting of near-complete dosage administration (97% of expected doses applied).13
Conclusion
These results indicate that use of AzA foam as well as its novel vehicle results in high patient satisfaction and improved QOL. Although additional research is necessary to further delineate the relationship between PROs and other measures of clinical efficacy, our data demonstrate a positive treatment experience as perceived by patients that parallels the clinical efficacy of AzA foam for the treatment of PPR.13,14
Acknowledgment
Editorial support through inVentiv Medical Communications (New York, New York) was provided by Bayer Pharmaceuticals.
- Cardwell LA, Farhangian ME, Alinia H, et al. Psychological disorders associated with rosacea: analysis of unscripted comments. J Dermatol Surg. 2015;19:99-103.
- Moustafa F, Lewallen RS, Feldman SR. The psychological impact of rosacea and the influence of current management options. J Am Acad Dermatol. 2014;71:973-980.
- Wilkin J, Dahl M, Detmar M, et al. Standard classification of rosacea: report of the National Rosacea Society Expert Committee on the Classification and Staging of Rosacea. J Am Acad Dermatol. 2002;46:584-587.
- Yamasaki K, Gallo RL. The molecular pathology of rosacea. J Dermatol Sci. 2009;55:77-81.
- Del Rosso JQ. Advances in understanding and managing rosacea: part 1: connecting the dots between pathophysiological mechanisms and common clinical features of rosacea with emphasis on vascular changes and facial erythema. J Clin Aesthet Dermatol. 2012;5:16-25.
- Bohm D, Schwanitz P, Stock Gissendanner S, et al. Symptom severity and psychological sequelae in rosacea: results of a survey. Psychol Health Med. 2014;19:586-591.
- Elewski BE, Draelos Z, Dreno B, et al. Rosacea—global diversity and optimized outcome: proposed international consensus from the Rosacea International Expert Group. J Eur Acad Dermatol Venereol. 2011;25:188-200.
- Dirschka T, Micali G, Papadopoulos L, et al. Perceptions on the psychological impact of facial erythema associated with rosacea: results of international survey [published online May 29, 2015]. Dermatol Ther (Heidelb). 2015;5:117-127.
- Abram K, Silm H, Maaroos HI, et al. Subjective disease perception and symptoms of depression in relation to healthcare-seeking behaviour in patients with rosacea. Acta Derm Venereol. 2009;89:488-491.
- Stein L. Clinical studies of a new vehicle formulation for topical corticosteroids in the treatment of psoriasis. J Am Acad Dermatol. 2005;53(1, suppl 1):S39-S49.
- Yentzer BA, Camacho FT, Young T, et al. Good adherence and early efficacy using desonide hydrogel for atopic dermatitis: results from a program addressing patient compliance. J Drugs Dermatol. 2010;9:324-329.
- Finacea (azelaic acid) foam 15% [package insert]. Whippany, NJ: Bayer Pharmaceuticals; 2015.
- Draelos ZD, Elewski BE, Harper JC, et al. A phase 3 randomized, double-blind, vehicle-controlled trial of azelaic acid foam 15% in the treatment of papulopustular rosacea. Cutis. 2015;96:54-61.
- Solomon JA, Tyring S, Staedtler G, et al. Investigator-reported efficacy of azelaic acid foam 15% in patients with papulopustular rosacea: secondary efficacy outcomes from a randomized, controlled, double-blind, phase 3 trial. Cutis. 2016;98:187-194.
- Nicholson K, Abramova L, Chren MM, et al. A pilot quality-of-life instrument for acne rosacea. J Am Acad Dermatol. 2007;57:213-221.
- Herdman M, Gudex C, Lloyd A, et al. Development and preliminary testing of the new five-level version of EQ-5D (EQ-5D-5L). Qual Life Res. 2011;20:1727-1736.
- Basra MK, Salek MS, Camilleri L, et al. Determining the minimal clinically important difference and responsiveness of the Dermatology Life Quality Index (DLQI): further data. Dermatology. 2015;230:27-33.
- Bergstrom KG, Arambula K, Kimball AB. Medication formulation affects quality of life: a randomized single-blind study of clobetasol propionate foam 0.05% compared with a combined program of clobetasol cream 0.05% and solution 0.05% for the treatment of psoriasis. Cutis. 2003;72:407-411.
Rosacea is a chronic inflammatory disorder that may negatively impact patients’ quality of life (QOL).1,2 Papulopustular rosacea (PPR) is characterized by centrofacial inflammatory lesions and erythema as well as burning and stinging secondary to skin barrier dysfunction.3-5 Increasing rosacea severity is associated with greater rates of anxiety and depression and lower QOL6 as well as low self-esteem and feelings of embarrassment.7,8 Accordingly, assessing patient perceptions of rosacea treatments is necessary for understanding its impact on patient health.6,9
The Rosacea International Expert Group has emphasized the need to incorporate patient assessments of disease severity and QOL when developing therapeutic strategies for rosacea.7 Ease of use, sensory experience, and patient preference also are important dimensions in the evaluation of topical medications, as attributes of specific formulations may affect usability, adherence, and efficacy.10,11
An azelaic acid (AzA) 15% foam formulation, which was approved by the US Food and Drug Administration in 2015, was developed to deliver AzA in a vehicle designed to improve treatment experience in patients with mild to moderate PPR.12 Results from a clinical trial demonstrated superiority of AzA foam to vehicle foam for primary end points that included therapeutic success rate and change in inflammatory lesion count.13,14 Secondary end points assessed in the current analysis included patient perception of product usability, efficacy, and effect on QOL. These patient-reported outcome (PRO) results are reported here.
Methods
Study Design
The design of this phase 3 multicenter, randomized, double-blind, vehicle-controlled, parallel-group clinical trial was described in more detail in an earlier report.13 This study was approved by all appropriate institutional review boards. Eligible participants were 18 years and older with moderate or severe PPR, 12 to 50 inflammatory lesions, and persistent erythema with or without telangiectasia. Exclusion criteria included known nonresponse to AzA, current or prior use (within 6 weeks of randomization) of noninvestigational products to treat rosacea, and presence of other dermatoses that could interfere with rosacea evaluation.
Participants were randomized into the AzA foam or vehicle group (1:1 ratio). The study medication (0.5 g) or vehicle foam was applied twice daily to the entire face until the end of treatment (EoT) at 12 weeks. Efficacy and safety parameters were evaluated at baseline and at 4, 8, and 12 weeks of treatment, and at a follow-up visit 4 weeks after EoT (week 16).
Results for the coprimary efficacy end points—therapeutic success rate according to investigator global assessment and nominal change in inflammatory lesion count—were previously reported,13 as well as secondary efficacy outcomes including change in inflammatory lesion count, therapeutic response rate, and change in erythema rating.14
Patient-Reported Secondary Efficacy Outcomes
The secondary PRO end points were patient-reported global assessment of treatment response (rated as excellent, good, fair, none, or worse), global assessment of tolerability (rated as excellent, good, acceptable despite minor irritation, less acceptable due to continuous irritation, not acceptable, or no opinion), and opinion on cosmetic acceptability and practicability of product use in areas adjacent to the hairline (rated as very good, good, satisfactory, poor, or no opinion).
Additionally, QOL was measured by 3 validated standardized PRO tools, including the Rosacea Quality of Life Index (RosaQOL),15 the EuroQOL 5-dimension 5-level questionnaire (EQ-5D-5L),16 and the Dermatology Life Quality Index (DLQI). The RosaQOL is a rosacea-specific instrument assessing 3 constructs: (1) symptom, (2) emotion, and (3) function. The EQ-5D-5L questionnaire measures overall health status and comprises 5 constructs: (1) mobility, (2) self-care, (3) usual activities, (4) pain/discomfort, and (5) anxiety/depression. The DLQI is a general, dermatology-oriented instrument categorized into 6 constructs: (1) symptoms and feelings, (2) daily activities, (3) leisure, (4) work and school, (5) personal relationships, and (6) treatment.
Statistical Analyses
Patient-reported outcomes were analyzed in an exploratory manner and evaluated at EoT relative to baseline. Self-reported global assessment of treatment response and change in RosaQOL, EQ-5D-5L, and DLQI scores between AzA foam and vehicle foam groups were evaluated using the Wilcoxon rank sum test. Categorical change in the number of participants achieving an increase of 5 or more points in overall DLQI score was evaluated using a χ2 test.
Safety
Safety was analyzed for all randomized patients who were dispensed any study medication. All analyses were performed using SAS version 9.2.
Results
Of the 961 participants included in the study, 483 were randomized to receive AzA foam and 478 were randomized to receive vehicle foam. The mean age was 51.5 years, and the majority of participants were female (73.0%) and white (95.5%)(Table). At baseline, 834 (86.8%) participants had moderate PPR and 127 (13.2%) had severe PPR. The mean inflammatory lesion count (SD) was 21.4 (8.9). No significant differences in baseline characteristics were observed between treatment groups.
Patient-reported global assessment of treatment response differed between treatment groups at EoT (P<.001)(Figure 1). Higher ratings of treatment response were reported among the AzA foam group (excellent, 17.2%; good, 40.0%) versus vehicle foam (excellent, 9.7%; good, 35.0%). The number of participants reporting no treatment response was 13.1% in the AzA foam group, with 1.8% reporting worsening of their condition, while 19.4% of participants in the vehicle foam group reported no response, with 6.3% reporting worsening of their condition (Figure 1).
Tolerability was rated excellent or good in 67.8% of the AzA foam group versus 78.2% of the vehicle foam group (Figure 2A). Approximately 38.4% of the AzA foam group versus 38.2% of the vehicle foam group rated treatment tolerability as excellent, while 93.5% of the AzA foam group rated tolerability as acceptable, good, or excellent compared with 89.5% of the vehicle foam group. Only 1.4% of participants in the AzA foam group indicated that treatment was not acceptable due to irritation. In addition, a greater proportion of the AzA foam group reported cosmetic acceptability as very good versus the vehicle foam group (40.5% vs 28.7%)(Figure 2B), with two-thirds reporting cosmetic acceptability as very good or good. Practicability of product use in areas adjacent to the hairline was rated very good by substantial proportions of both the AzA foam and vehicle foam groups (42.8% vs 35.9%)(Figure 2C).
At baseline, average disease burden was moderate according to mean overall DLQI scores (SD) for the AzA foam (5.4 [4.8]) and vehicle foam (5.4 [4.9]) groups. Mean overall DLQI scores improved at EoT, with greater improvement occurring in the AzA foam group (2.6 vs 2.1; P=.018)(Figure 3). A larger proportion of participants in the AzA foam group versus the vehicle foam group also achieved a 5-point or more improvement in overall DLQI score (24.6% vs 19.0%; P=.047). Changes in specific DLQI subscore components were either balanced or in favor of the AzA foam group, including daily activities (0.5 vs 0.4; P=.019), symptoms and feelings (1.2 vs 1.0; P=.069), and leisure (0.5 vs 0.4; P=.012). Specific DLQI items with differences in scores between treatment groups from baseline included the following questions: Over the last week, how embarrassed or self-conscious have you been because of your skin? (P<.001); Over the last week, how much has your skin interfered with you going shopping or looking after your home or garden? (P=.005); Over the last week, how much has your skin affected any social or leisure activities? (P=.040); Over the last week, how much has your skin created problems with your partner or any of your close friends or relatives? (P=.001). Differences between treatment groups favored the AzA foam group for each of these items.
Participants in the AzA foam and vehicle foam groups also showed improvement in RosaQOL scores at EoT (6.8 vs 6.4; P=.67), while EQ-5D-5L scores changed minimally from baseline (0.006 vs 0.007; P=.50).
Safety
The incidence of drug-related adverse events (AEs) was greater in the AzA foam group versus the vehicle foam group (7.7% vs 4.8%). Drug-related AEs occurring in 1% of the AzA foam group were application-site pain including tenderness, stinging, and burning (3.5% for AzA foam vs 1.3% for vehicle foam); application-site pruritus (1.4% vs 0.4%); and application-site dryness (1.0% vs 0.6%). One drug-related AE of severe intensity—application-site dermatitis—occurred in the vehicle foam group; all other drug-related AEs were mild or moderate.14 More detailed safety results are described in a previous report.13
Comment
The PRO outcome data reported here are consistent with previously reported statistically significant improvements in investigator-assessed primary end points for the treatment of PPR with AzA foam.13,14 The data demonstrate that AzA foam benefits both clinical and patient-oriented dimensions of rosacea disease burden and suggest an association between positive treatment response and improved QOL.
Specifically, patient evaluation of treatment response to AzA foam was highly favorable, with 57.2% reporting excellent or good response and 85.1% reporting positive response overall. Recognizing the relapsing-remitting course of PPR, only 1.8% of the AzA foam group experienced worsening of disease at EoT.
The DLQI and RosaQOL instruments revealed notable improvements in QOL from baseline for both treatment groups. Although no significant differences in RosaQOL scores were observed between groups at EoT, significant differences in DLQI scores were detected. Almost one-quarter of participants in the AzA foam group achieved at least a 5-point improvement in DLQI score, exceeding the 4-point threshold for clinically meaningful change.17 Although little change in EQ-5D-5L scores was observed at EoT for both groups with no between-group differences, this finding is not unexpected, as this instrument assesses QOL dimensions such as loss of function, mobility, and ability to wash or dress, which are unlikely to be compromised in most rosacea patients.
Our results also underscore the importance of vehicle in the treatment of compromised skin. Studies of topical treatments for other dermatoses suggest that vehicle properties may reduce disease severity and improve QOL independent of active ingredients.10,18 For example, ease of application, minimal residue, and less time spent in application may explain the superiority of foam to other vehicles in the treatment of psoriasis.18 Our data demonstrating high cosmetic favorability of AzA foam are consistent with these prior observations. Increased tolerability of foam formulations also may affect response to treatment, in part by supporting adherence.18 Most participants receiving AzA foam described tolerability as excellent or good, and the discontinuation rate was low (1.2% of participants in the AzA foam group left the study due to AEs) in the setting of near-complete dosage administration (97% of expected doses applied).13
Conclusion
These results indicate that use of AzA foam as well as its novel vehicle results in high patient satisfaction and improved QOL. Although additional research is necessary to further delineate the relationship between PROs and other measures of clinical efficacy, our data demonstrate a positive treatment experience as perceived by patients that parallels the clinical efficacy of AzA foam for the treatment of PPR.13,14
Acknowledgment
Editorial support through inVentiv Medical Communications (New York, New York) was provided by Bayer Pharmaceuticals.
- Cardwell LA, Farhangian ME, Alinia H, et al. Psychological disorders associated with rosacea: analysis of unscripted comments. J Dermatol Surg. 2015;19:99-103.
- Moustafa F, Lewallen RS, Feldman SR. The psychological impact of rosacea and the influence of current management options. J Am Acad Dermatol. 2014;71:973-980.
- Wilkin J, Dahl M, Detmar M, et al. Standard classification of rosacea: report of the National Rosacea Society Expert Committee on the Classification and Staging of Rosacea. J Am Acad Dermatol. 2002;46:584-587.
- Yamasaki K, Gallo RL. The molecular pathology of rosacea. J Dermatol Sci. 2009;55:77-81.
- Del Rosso JQ. Advances in understanding and managing rosacea: part 1: connecting the dots between pathophysiological mechanisms and common clinical features of rosacea with emphasis on vascular changes and facial erythema. J Clin Aesthet Dermatol. 2012;5:16-25.
- Bohm D, Schwanitz P, Stock Gissendanner S, et al. Symptom severity and psychological sequelae in rosacea: results of a survey. Psychol Health Med. 2014;19:586-591.
- Elewski BE, Draelos Z, Dreno B, et al. Rosacea—global diversity and optimized outcome: proposed international consensus from the Rosacea International Expert Group. J Eur Acad Dermatol Venereol. 2011;25:188-200.
- Dirschka T, Micali G, Papadopoulos L, et al. Perceptions on the psychological impact of facial erythema associated with rosacea: results of international survey [published online May 29, 2015]. Dermatol Ther (Heidelb). 2015;5:117-127.
- Abram K, Silm H, Maaroos HI, et al. Subjective disease perception and symptoms of depression in relation to healthcare-seeking behaviour in patients with rosacea. Acta Derm Venereol. 2009;89:488-491.
- Stein L. Clinical studies of a new vehicle formulation for topical corticosteroids in the treatment of psoriasis. J Am Acad Dermatol. 2005;53(1, suppl 1):S39-S49.
- Yentzer BA, Camacho FT, Young T, et al. Good adherence and early efficacy using desonide hydrogel for atopic dermatitis: results from a program addressing patient compliance. J Drugs Dermatol. 2010;9:324-329.
- Finacea (azelaic acid) foam 15% [package insert]. Whippany, NJ: Bayer Pharmaceuticals; 2015.
- Draelos ZD, Elewski BE, Harper JC, et al. A phase 3 randomized, double-blind, vehicle-controlled trial of azelaic acid foam 15% in the treatment of papulopustular rosacea. Cutis. 2015;96:54-61.
- Solomon JA, Tyring S, Staedtler G, et al. Investigator-reported efficacy of azelaic acid foam 15% in patients with papulopustular rosacea: secondary efficacy outcomes from a randomized, controlled, double-blind, phase 3 trial. Cutis. 2016;98:187-194.
- Nicholson K, Abramova L, Chren MM, et al. A pilot quality-of-life instrument for acne rosacea. J Am Acad Dermatol. 2007;57:213-221.
- Herdman M, Gudex C, Lloyd A, et al. Development and preliminary testing of the new five-level version of EQ-5D (EQ-5D-5L). Qual Life Res. 2011;20:1727-1736.
- Basra MK, Salek MS, Camilleri L, et al. Determining the minimal clinically important difference and responsiveness of the Dermatology Life Quality Index (DLQI): further data. Dermatology. 2015;230:27-33.
- Bergstrom KG, Arambula K, Kimball AB. Medication formulation affects quality of life: a randomized single-blind study of clobetasol propionate foam 0.05% compared with a combined program of clobetasol cream 0.05% and solution 0.05% for the treatment of psoriasis. Cutis. 2003;72:407-411.
Practice Points
- Patient perceptions of treatment are an important consideration in developing topical therapeutic strategies for papulopustular rosacea.
- A novel hydrophilic foam formulation of azelaic acid (AzA) provided substantial benefits in patient-reported measures of treatment response and quality of life.
- Patients reported high levels of satisfaction with the usability, tolerability, and practicability of AzA foam.
- The positive treatment experience described by patients parallels investigator-reported measures of clinical efficacy reported elsewhere.
Ceramic Femoral Heads for All Patients? An Argument for Cost Containment in Hip Surgery
Total hip arthroplasty (THA) has revolutionized the practice of orthopedic surgery. The number of primary THAs performed in the United States alone is predicted to rise to 572,000 per year by 2030.1 Increasing demand requires a tighter focus on cost-effectiveness, particularly with regard to expensive postoperative complications. Trunnionosis and taper corrosion have recently emerged as problems in THA.2-7 No longer restricted to metal-on-metal bearings, these phenomena now affect an increasing number of metal-on-polyethylene THAs and are exacerbated by modularity.8 The emergence of these complications adds complexity to the diagnostic algorithm in patients who present with painful THAs. Furthermore, the diagnosis of either trunnionosis or taper corrosion calls for revision surgery. In response to the increase in these complications, a group of orthopedic professional societies developed an algorithm for managing suspected metal toxicity issues.9 However, increases in toxicity and patient morbidity, and the added costs of toxicity surveillance and revision surgery, will place a substantial economic burden on many health systems at a time when policy makers are implementing substantial changes to health delivery in an effort to contain costs while improving patient outcomes.
Although they are more expensive than cobalt-chrome heads, ceramic femoral heads make metal toxicity a nonissue and eliminate the need for toxicity surveillance protocols. Furthermore, ceramic femoral heads are thought to have longevity advantages (this relationship needs to be confirmed in long-term studies).
In this article, we provide a theoretical framework for debating whether use of ceramic femoral heads in all THA patients could represent a more cost-effective option over the long term.
Materials and Methods
Guidelines for the diagnostic algorithm for painful THA with suspected metal toxicity were obtained from a recent orthopedic professional society consensus statement.9 The cost of this work-up was obtained from the finance department at our institution (Table 1). 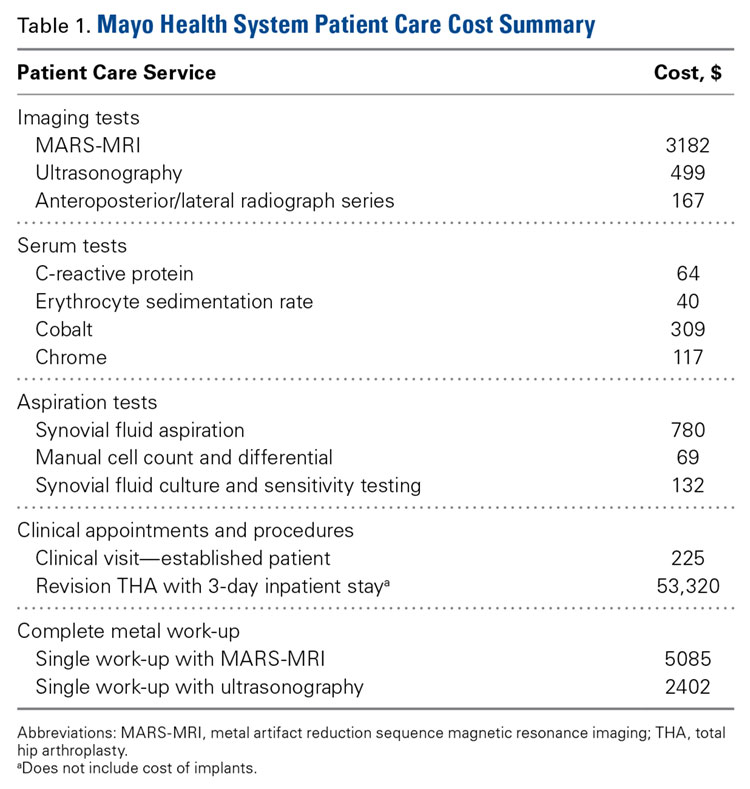
We created 2 metrics to analyze the cost difference between ceramic and cobalt-chrome femoral heads. The first metric was “ceramic surplus,” the extra cost of a ceramic femoral head above that of a cobalt-chrome femoral head, and the second was “maximum ceramic surplus,” the ceramic surplus cutoff value for which using ceramic femoral heads in all patients becomes more cost-effective than using cobalt-chrome heads. 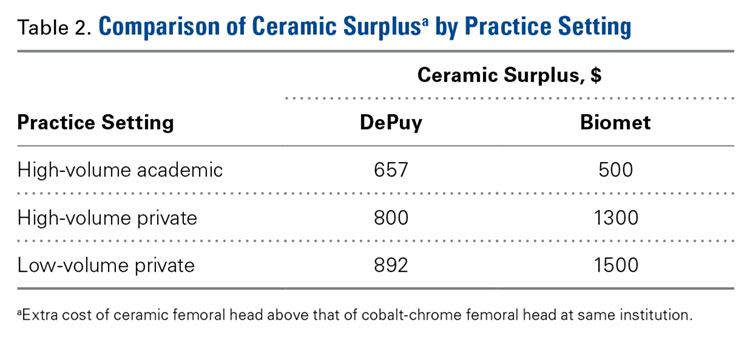
The cost of a metal work-up was determined for a single round of imaging tests (stratified by MRI and US), serum tests, aspiration tests, and clinic visit. These data were then combined with the cost of revision THA (Table 1) to create a series of maximum ceramic surplus models. In all these simulations, we assumed that about 7% of patients with metal-on-polyethylene THA would present with groin pain 1 to 2 years after surgery,10 and, working on this assumption, we applied a series of theoretical incidence ratios (12.5%, 25%, 50%) to both the percentage of patients who presented with a painful THA and received a metal toxicity work-up and the percentage of those who received the toxicity work-up and eventually needed revision surgery. For example, in the best-case scenario, the model assumes that 7% of THA patients present with pain and that 12.5% of the painful cohort receives a single work-up for metal toxicity (0.875% of all THAs). The best-case scenario then assumes that 12.5% of patients who receive a work-up for metal toxicity are eventually revised (0.11% of all THAs). By contrast, in the worst-case scenario, the model continues to assume that 7% of THA patients present with pain, but it also assumes that 50% of the painful cohort receives a single work-up for metal toxicity (3.5% of all THAs). 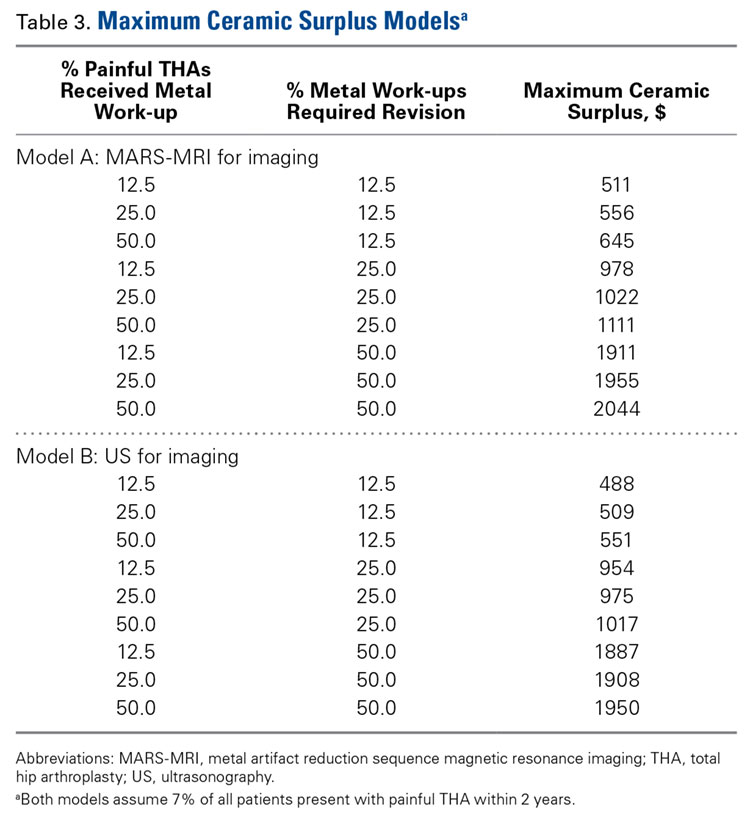
The lowest maximum ceramic surplus values were calculated from the best-case scenario, and the highest from the worst-case scenario. These steps were taken in keeping with the fact that a lower incidence of metal toxicity work-ups and revisions would require the price difference between ceramic and cobalt-chrome heads (ceramic surplus) to be small in order for ceramic heads in all patients to be cost-effective. The inverse is true for a high incidence of metal toxicity work-ups and revisions: A larger price difference between ceramic and cobalt-chrome femoral heads would be tolerable to still be cost-effective.
Results
A single metal toxicity work-up cost $5085 with MARS-MRI and $2402 with US (Table 1). Revision THA with a 3-day inpatient stay cost $53,320, and that figure does not include the cost of surgical implants or perioperative medications and devices, all of which have highly variable cost structures (Table 1). Ceramic surplus was as low as $500 in a high-volume academic practice and as high as $1500 in a low-volume private practice (Table 2). Maximum ceramic surplus ranged from $511 to $2044 in the models integrating MARS-MRI and from $488 to $1950 in the models integrating US (Table 3).
Discussion
Trunnionosis, corrosion, and metal toxicity are of increasing concern in hip implants that incorporate a cobalt-chrome femoral head, regardless of the counterpart articulation surface (metal, ceramic, polyethylene).2-8 In response to the added diagnostic challenge raised by these phenomena, a group of orthopedic professional societies developed an algorithm that can guide surgeons in the management of suspected corrosion or metal toxicity.9 In this protocol, toxicity surveillance in conjunction with potential revision surgery for metal-associated complications has the potential to increase patient morbidity and place a significant economic burden on many health systems. Given the recent emergence of trunnionosis, epidemiologic data on this complication are lacking.10 However, there is a substantial body of evidence showing devastating complications associated with adverse reactions to metal debris.11-17
Given the potential complications specific to cobalt-chrome femoral heads, we wanted to provide a theoretical framework for debating whether use of ceramic heads in all patients has the potential to be a more cost-effective option over the long term. Ceramic femoral heads are premium implants, certainly more expensive at initial point of care. One study based on a large community registry showed premium implants (eg, ceramic femoral heads) add a surplus averaging $1000.18 In our investigation, ceramic surplus varied with practice setting, from $500 to $1500. Lower costs were discovered in high-volume practice settings, indicating that a shift to increased use of ceramic femoral heads would likely decrease ceramic surplus for most institutions.
We used a series of simulations to predict maximum ceramic surplus after manipulation of theoretical incidence ratios. The main limitation of this study was our use of 7% as the incidence of painful THA within 1- to 2-year follow-up. This point estimate was derived from a manuscript that to our knowledge provides the most realistic estimate of this complication10; with use of more complete data in upcoming studies, however, the 7% figure could certainly change. As data are also lacking on the proportion of painful THAs that receive a metal work-up and on the proportion of metal work-ups that indicate revision surgery, we modeled values of 12.5%, 25%, and 50% for each of these metrics to cover a wide range of possibilities.
It is also true the model did not incorporate scenarios to account for the law of unintended consequences, which would caution that using ceramics for all patients may bring a new set of complications. Zirconia ceramic bearings have tended to fracture, with the vast majority of fractures occurring in the liner of ceramic-on-ceramic articulations. Midterm reports and laboratory data suggest this issue has largely been solved with the advent of delta ceramics, a composite containing only a small fraction of zirconia.19,20 Nevertheless, longer term in vivo data are needed to confirm the stability, longevity, and complication profile of these materials.
A final limitation of the present study is that the cost of a single metal toxicity work-up was based on just one institution. Grossly differing cost structures in other markets could alter the economic risk–benefit analysis we have described. However, we should note that the costs of tests, procedures, and appointments at our institution were uniform across a wide variety of practice settings in multiple regions of the United States, and thus are likely similar to the costs at a majority of practices.
Although our model took some liberties by necessity, it was also quite conservative in many respects. Many patients who undergo surveillance for metal toxicity undergo serial follow-ups; for this analysis, however, we considered the cost of only a single work-up. In addition, our proposed cost of revision surgery accounts only for facility and personnel costs during a 3-day inpatient stay and does not include the costs of implants, perioperative medications and devices, follow-up care, and potentially longer hospital stays or subsequent procedures, all of which can be highly variable and add considerable cost. Had any or all of these factors been incorporated into more complex modeling, the potential economic benefits of ceramic femoral heads would have been significantly greater.
After taking all these factors into account, our model found that maximum ceramic surplus ranged from $488 to $2044, depending on theoretical incidence ratio and imaging modality (Table 3). The lowest maximum ceramic surplus values ($511 for MARS-MRI protocol, $488 for US protocol) were based on the assumption that only 12.5% of patients who present with a painful THA receive a single metal work-up (0.875% of all THAs) and that only 12.5% of those patients are eventually revised (0.11% of all THAs). This outcome suggests ceramic femoral heads could be more cost-effective than cobalt-chrome femoral heads under these conservative projections when considering ceramic surplus is already as low as $500 at some high-volume centers. This figure would likely decline further in parallel with widespread growth in demand. Further study on the epidemiology of trunnionosis, corrosion, and metal toxicity in metal-on-polyethylene THA is needed to evaluate the economic validity of this proposal. Nevertheless, the superior safety profile of ceramic femoral heads with regard to metal toxicity indicates that wholesale use in THAs may in fact provide the most economical option on a societal scale.
Am J Orthop. 2016;45(6):E362-E366. Copyright Frontline Medical Communications Inc. 2016. All rights reserved.
1. Kurtz S, Ong K, Lau E, Mowat F, Halpern M. Projections of primary and revision hip and knee arthroplasty in the United States from 2005 to 2030. J Bone Joint Surg Am. 2007;89(4):780-785.
2. Cooper HJ. The local effects of metal corrosion in total hip arthroplasty. Orthop Clin North Am. 2014;45(1):9-18.
3. Cooper HJ, Della Valle CJ, Berger RA, et al. Corrosion at the head-neck taper as a cause for adverse local tissue reactions after total hip arthroplasty. J Bone Joint Surg Am. 2012;94(18):1655-1661.
4. Cooper HJ, Urban RM, Wixson RL, Meneghini RM, Jacobs JJ. Adverse local tissue reaction arising from corrosion at the femoral neck-body junction in a dual-taper stem with a cobalt-chromium modular neck. J Bone Joint Surg Am. 2013;95(10):865-872.
5. Jacobs JJ, Cooper HJ, Urban RM, Wixson RL, Della Valle CJ. What do we know about taper corrosion in total hip arthroplasty? J Arthroplasty. 2014;29(4):668-669.
6. Pastides PS, Dodd M, Sarraf KM, Willis-Owen CA. Trunnionosis: a pain in the neck. World J Orthop. 2013;4(4):161-166.
7. Shulman RM, Zywiel MG, Gandhi R, Davey JR, Salonen DC. Trunnionosis: the latest culprit in adverse reactions to metal debris following hip arthroplasty. Skeletal Radiol. 2015;44(3):433-440.
8. Mihalko WM, Wimmer MA, Pacione CA, Laurent MP, Murphy RF, Rider C. How have alternative bearings and modularity affected revision rates in total hip arthroplasty? Clin Orthop Relat Res. 2014;472(12):3747-3758.
9. Kwon YM, Lombardi AV, Jacobs JJ, Fehring TK, Lewis CG, Cabanela ME. Risk stratification algorithm for management of patients with metal-on-metal hip arthroplasty: consensus statement of the American Association of Hip and Knee Surgeons, the American Academy of Orthopaedic Surgeons, and the Hip Society. J Bone Joint Surg Am. 2014;96(1):e4.
10. Bartelt RB, Yuan BJ, Trousdale RT, Sierra RJ. The prevalence of groin pain after metal-on-metal total hip arthroplasty and total hip resurfacing. Clin Orthop Relat Res. 2010;468(9):2346-2356.
11. Bozic KJ, Lau EC, Ong KL, Vail TP, Rubash HE, Berry DJ. Comparative effectiveness of metal-on-metal and metal-on-polyethylene bearings in Medicare total hip arthroplasty patients. J Arthroplasty. 2012;27(8 suppl):37-40.
12. Cuckler JM. Metal-on-metal surface replacement: a triumph of hope over reason: affirms. Orthopedics. 2011;34(9):e439-e441.
13. de Steiger RN, Hang JR, Miller LN, Graves SE, Davidson DC. Five-year results of the ASR XL Acetabular System and the ASR Hip Resurfacing System: an analysis from the Australian Orthopaedic Association National Joint Replacement Registry. J Bone Joint Surg Am. 2011;93(24):2287-2293.
14. Fehring TK, Odum S, Sproul R, Weathersbee J. High frequency of adverse local tissue reactions in asymptomatic patients with metal-on-metal THA. Clin Orthop Relat Res. 2014;472(2):517-522.
15. Hasegawa M, Yoshida K, Wakabayashi H, Sudo A. Prevalence of adverse reactions to metal debris following metal-on-metal THA. Orthopedics. 2013;36(5):e606-e612.
16. Melvin JS, Karthikeyan T, Cope R, Fehring TK. Early failures in total hip arthroplasty—a changing paradigm. J Arthroplasty. 2014;29(6):1285-1288.
17. Wyles CC, Van Demark RE 3rd, Sierra RJ, Trousdale RT. High rate of infection after aseptic revision of failed metal-on-metal total hip arthroplasty. Clin Orthop Relat Res. 2014;472(2):509-516.
18. Gioe TJ, Sharma A, Tatman P, Mehle S. Do “premium” joint implants add value?: Analysis of high cost joint implants in a community registry. Clin Orthop Relat Res. 2011;469(1):48-54.
19. D’Antonio JA, Capello WN, Naughton M. Ceramic bearings for total hip arthroplasty have high survivorship at 10 years. Clin Orthop Relat Res. 2012;470(2):373-381.
20. D’Antonio JA, Capello WN, Naughton M. High survivorship with a titanium-encased alumina ceramic bearing for total hip arthroplasty. Clin Orthop Relat Res. 2014;472(2):611-616.
Total hip arthroplasty (THA) has revolutionized the practice of orthopedic surgery. The number of primary THAs performed in the United States alone is predicted to rise to 572,000 per year by 2030.1 Increasing demand requires a tighter focus on cost-effectiveness, particularly with regard to expensive postoperative complications. Trunnionosis and taper corrosion have recently emerged as problems in THA.2-7 No longer restricted to metal-on-metal bearings, these phenomena now affect an increasing number of metal-on-polyethylene THAs and are exacerbated by modularity.8 The emergence of these complications adds complexity to the diagnostic algorithm in patients who present with painful THAs. Furthermore, the diagnosis of either trunnionosis or taper corrosion calls for revision surgery. In response to the increase in these complications, a group of orthopedic professional societies developed an algorithm for managing suspected metal toxicity issues.9 However, increases in toxicity and patient morbidity, and the added costs of toxicity surveillance and revision surgery, will place a substantial economic burden on many health systems at a time when policy makers are implementing substantial changes to health delivery in an effort to contain costs while improving patient outcomes.
Although they are more expensive than cobalt-chrome heads, ceramic femoral heads make metal toxicity a nonissue and eliminate the need for toxicity surveillance protocols. Furthermore, ceramic femoral heads are thought to have longevity advantages (this relationship needs to be confirmed in long-term studies).
In this article, we provide a theoretical framework for debating whether use of ceramic femoral heads in all THA patients could represent a more cost-effective option over the long term.
Materials and Methods
Guidelines for the diagnostic algorithm for painful THA with suspected metal toxicity were obtained from a recent orthopedic professional society consensus statement.9 The cost of this work-up was obtained from the finance department at our institution (Table 1).
We created 2 metrics to analyze the cost difference between ceramic and cobalt-chrome femoral heads. The first metric was “ceramic surplus,” the extra cost of a ceramic femoral head above that of a cobalt-chrome femoral head, and the second was “maximum ceramic surplus,” the ceramic surplus cutoff value for which using ceramic femoral heads in all patients becomes more cost-effective than using cobalt-chrome heads.
The cost of a metal work-up was determined for a single round of imaging tests (stratified by MRI and US), serum tests, aspiration tests, and clinic visit. These data were then combined with the cost of revision THA (Table 1) to create a series of maximum ceramic surplus models. In all these simulations, we assumed that about 7% of patients with metal-on-polyethylene THA would present with groin pain 1 to 2 years after surgery,10 and, working on this assumption, we applied a series of theoretical incidence ratios (12.5%, 25%, 50%) to both the percentage of patients who presented with a painful THA and received a metal toxicity work-up and the percentage of those who received the toxicity work-up and eventually needed revision surgery. For example, in the best-case scenario, the model assumes that 7% of THA patients present with pain and that 12.5% of the painful cohort receives a single work-up for metal toxicity (0.875% of all THAs). The best-case scenario then assumes that 12.5% of patients who receive a work-up for metal toxicity are eventually revised (0.11% of all THAs). By contrast, in the worst-case scenario, the model continues to assume that 7% of THA patients present with pain, but it also assumes that 50% of the painful cohort receives a single work-up for metal toxicity (3.5% of all THAs).
The lowest maximum ceramic surplus values were calculated from the best-case scenario, and the highest from the worst-case scenario. These steps were taken in keeping with the fact that a lower incidence of metal toxicity work-ups and revisions would require the price difference between ceramic and cobalt-chrome heads (ceramic surplus) to be small in order for ceramic heads in all patients to be cost-effective. The inverse is true for a high incidence of metal toxicity work-ups and revisions: A larger price difference between ceramic and cobalt-chrome femoral heads would be tolerable to still be cost-effective.
Results
A single metal toxicity work-up cost $5085 with MARS-MRI and $2402 with US (Table 1). Revision THA with a 3-day inpatient stay cost $53,320, and that figure does not include the cost of surgical implants or perioperative medications and devices, all of which have highly variable cost structures (Table 1). Ceramic surplus was as low as $500 in a high-volume academic practice and as high as $1500 in a low-volume private practice (Table 2). Maximum ceramic surplus ranged from $511 to $2044 in the models integrating MARS-MRI and from $488 to $1950 in the models integrating US (Table 3).
Discussion
Trunnionosis, corrosion, and metal toxicity are of increasing concern in hip implants that incorporate a cobalt-chrome femoral head, regardless of the counterpart articulation surface (metal, ceramic, polyethylene).2-8 In response to the added diagnostic challenge raised by these phenomena, a group of orthopedic professional societies developed an algorithm that can guide surgeons in the management of suspected corrosion or metal toxicity.9 In this protocol, toxicity surveillance in conjunction with potential revision surgery for metal-associated complications has the potential to increase patient morbidity and place a significant economic burden on many health systems. Given the recent emergence of trunnionosis, epidemiologic data on this complication are lacking.10 However, there is a substantial body of evidence showing devastating complications associated with adverse reactions to metal debris.11-17
Given the potential complications specific to cobalt-chrome femoral heads, we wanted to provide a theoretical framework for debating whether use of ceramic heads in all patients has the potential to be a more cost-effective option over the long term. Ceramic femoral heads are premium implants, certainly more expensive at initial point of care. One study based on a large community registry showed premium implants (eg, ceramic femoral heads) add a surplus averaging $1000.18 In our investigation, ceramic surplus varied with practice setting, from $500 to $1500. Lower costs were discovered in high-volume practice settings, indicating that a shift to increased use of ceramic femoral heads would likely decrease ceramic surplus for most institutions.
We used a series of simulations to predict maximum ceramic surplus after manipulation of theoretical incidence ratios. The main limitation of this study was our use of 7% as the incidence of painful THA within 1- to 2-year follow-up. This point estimate was derived from a manuscript that to our knowledge provides the most realistic estimate of this complication10; with use of more complete data in upcoming studies, however, the 7% figure could certainly change. As data are also lacking on the proportion of painful THAs that receive a metal work-up and on the proportion of metal work-ups that indicate revision surgery, we modeled values of 12.5%, 25%, and 50% for each of these metrics to cover a wide range of possibilities.
It is also true the model did not incorporate scenarios to account for the law of unintended consequences, which would caution that using ceramics for all patients may bring a new set of complications. Zirconia ceramic bearings have tended to fracture, with the vast majority of fractures occurring in the liner of ceramic-on-ceramic articulations. Midterm reports and laboratory data suggest this issue has largely been solved with the advent of delta ceramics, a composite containing only a small fraction of zirconia.19,20 Nevertheless, longer term in vivo data are needed to confirm the stability, longevity, and complication profile of these materials.
A final limitation of the present study is that the cost of a single metal toxicity work-up was based on just one institution. Grossly differing cost structures in other markets could alter the economic risk–benefit analysis we have described. However, we should note that the costs of tests, procedures, and appointments at our institution were uniform across a wide variety of practice settings in multiple regions of the United States, and thus are likely similar to the costs at a majority of practices.
Although our model took some liberties by necessity, it was also quite conservative in many respects. Many patients who undergo surveillance for metal toxicity undergo serial follow-ups; for this analysis, however, we considered the cost of only a single work-up. In addition, our proposed cost of revision surgery accounts only for facility and personnel costs during a 3-day inpatient stay and does not include the costs of implants, perioperative medications and devices, follow-up care, and potentially longer hospital stays or subsequent procedures, all of which can be highly variable and add considerable cost. Had any or all of these factors been incorporated into more complex modeling, the potential economic benefits of ceramic femoral heads would have been significantly greater.
After taking all these factors into account, our model found that maximum ceramic surplus ranged from $488 to $2044, depending on theoretical incidence ratio and imaging modality (Table 3). The lowest maximum ceramic surplus values ($511 for MARS-MRI protocol, $488 for US protocol) were based on the assumption that only 12.5% of patients who present with a painful THA receive a single metal work-up (0.875% of all THAs) and that only 12.5% of those patients are eventually revised (0.11% of all THAs). This outcome suggests ceramic femoral heads could be more cost-effective than cobalt-chrome femoral heads under these conservative projections when considering ceramic surplus is already as low as $500 at some high-volume centers. This figure would likely decline further in parallel with widespread growth in demand. Further study on the epidemiology of trunnionosis, corrosion, and metal toxicity in metal-on-polyethylene THA is needed to evaluate the economic validity of this proposal. Nevertheless, the superior safety profile of ceramic femoral heads with regard to metal toxicity indicates that wholesale use in THAs may in fact provide the most economical option on a societal scale.
Am J Orthop. 2016;45(6):E362-E366. Copyright Frontline Medical Communications Inc. 2016. All rights reserved.
1. Kurtz S, Ong K, Lau E, Mowat F, Halpern M. Projections of primary and revision hip and knee arthroplasty in the United States from 2005 to 2030. J Bone Joint Surg Am. 2007;89(4):780-785.
2. Cooper HJ. The local effects of metal corrosion in total hip arthroplasty. Orthop Clin North Am. 2014;45(1):9-18.
3. Cooper HJ, Della Valle CJ, Berger RA, et al. Corrosion at the head-neck taper as a cause for adverse local tissue reactions after total hip arthroplasty. J Bone Joint Surg Am. 2012;94(18):1655-1661.
4. Cooper HJ, Urban RM, Wixson RL, Meneghini RM, Jacobs JJ. Adverse local tissue reaction arising from corrosion at the femoral neck-body junction in a dual-taper stem with a cobalt-chromium modular neck. J Bone Joint Surg Am. 2013;95(10):865-872.
5. Jacobs JJ, Cooper HJ, Urban RM, Wixson RL, Della Valle CJ. What do we know about taper corrosion in total hip arthroplasty? J Arthroplasty. 2014;29(4):668-669.
6. Pastides PS, Dodd M, Sarraf KM, Willis-Owen CA. Trunnionosis: a pain in the neck. World J Orthop. 2013;4(4):161-166.
7. Shulman RM, Zywiel MG, Gandhi R, Davey JR, Salonen DC. Trunnionosis: the latest culprit in adverse reactions to metal debris following hip arthroplasty. Skeletal Radiol. 2015;44(3):433-440.
8. Mihalko WM, Wimmer MA, Pacione CA, Laurent MP, Murphy RF, Rider C. How have alternative bearings and modularity affected revision rates in total hip arthroplasty? Clin Orthop Relat Res. 2014;472(12):3747-3758.
9. Kwon YM, Lombardi AV, Jacobs JJ, Fehring TK, Lewis CG, Cabanela ME. Risk stratification algorithm for management of patients with metal-on-metal hip arthroplasty: consensus statement of the American Association of Hip and Knee Surgeons, the American Academy of Orthopaedic Surgeons, and the Hip Society. J Bone Joint Surg Am. 2014;96(1):e4.
10. Bartelt RB, Yuan BJ, Trousdale RT, Sierra RJ. The prevalence of groin pain after metal-on-metal total hip arthroplasty and total hip resurfacing. Clin Orthop Relat Res. 2010;468(9):2346-2356.
11. Bozic KJ, Lau EC, Ong KL, Vail TP, Rubash HE, Berry DJ. Comparative effectiveness of metal-on-metal and metal-on-polyethylene bearings in Medicare total hip arthroplasty patients. J Arthroplasty. 2012;27(8 suppl):37-40.
12. Cuckler JM. Metal-on-metal surface replacement: a triumph of hope over reason: affirms. Orthopedics. 2011;34(9):e439-e441.
13. de Steiger RN, Hang JR, Miller LN, Graves SE, Davidson DC. Five-year results of the ASR XL Acetabular System and the ASR Hip Resurfacing System: an analysis from the Australian Orthopaedic Association National Joint Replacement Registry. J Bone Joint Surg Am. 2011;93(24):2287-2293.
14. Fehring TK, Odum S, Sproul R, Weathersbee J. High frequency of adverse local tissue reactions in asymptomatic patients with metal-on-metal THA. Clin Orthop Relat Res. 2014;472(2):517-522.
15. Hasegawa M, Yoshida K, Wakabayashi H, Sudo A. Prevalence of adverse reactions to metal debris following metal-on-metal THA. Orthopedics. 2013;36(5):e606-e612.
16. Melvin JS, Karthikeyan T, Cope R, Fehring TK. Early failures in total hip arthroplasty—a changing paradigm. J Arthroplasty. 2014;29(6):1285-1288.
17. Wyles CC, Van Demark RE 3rd, Sierra RJ, Trousdale RT. High rate of infection after aseptic revision of failed metal-on-metal total hip arthroplasty. Clin Orthop Relat Res. 2014;472(2):509-516.
18. Gioe TJ, Sharma A, Tatman P, Mehle S. Do “premium” joint implants add value?: Analysis of high cost joint implants in a community registry. Clin Orthop Relat Res. 2011;469(1):48-54.
19. D’Antonio JA, Capello WN, Naughton M. Ceramic bearings for total hip arthroplasty have high survivorship at 10 years. Clin Orthop Relat Res. 2012;470(2):373-381.
20. D’Antonio JA, Capello WN, Naughton M. High survivorship with a titanium-encased alumina ceramic bearing for total hip arthroplasty. Clin Orthop Relat Res. 2014;472(2):611-616.
Does Accelerated Physical Therapy After Elective Primary Hip and Knee Arthroplasty Facilitate Early Discharge?
Total hip arthroplasty (THA) and total knee arthroplasty (TKA) are among the most effective surgical procedures in modern medicine. Use of primary THA in the United States is projected to increase by 174% by 2030, to 532,000 cases annually, and the estimate for TKA is even greater.1 Hospital length of stay (LOS) accounts for a significant portion of the overall cost of these procedures. Reducing LOS to limit costs without compromising patient safety, satisfaction, and outcomes remains the goal at all joint arthroplasty centers. Rapid-recovery or fast-track clinical pathways limiting opioid use and emphasizing patient education and early (day-of-surgery) mobilization have been shown to reduce LOS without compromising patient outcomes.2-5 Factors correlated with LOS after THA include surgical approach, use of multimodal analgesia, obesity, age, and social situations or living conditions.4,6-10
Our institution recently implemented a protocol in which certified physical therapists provide accelerated (day-of-surgery) physical therapy (PT) for all total joint arthroplasty patients. For the study reported here, we hypothesized that, compared with PT started on postoperative day 1 (POD-1), PT started day of surgery (Day 0) would result in shorter LOS for unilateral primary THA and TKA patients. In addition, we wanted to evaluate any predischarge differences in function, as measured by gait distance, between the groups.
Methods
After obtaining Institutional Review Board approval, we retrospectively evaluated use of the new postoperative protocol (Day 0 PT) for primary THA and TKA patients. We reviewed all cases of primary unilateral THA or TKA performed by a single surgeon over the 12-month period immediately following initiation of the protocol. There were 116 THA cases and 126 TKA cases. Charts were reviewed for patient demographics, intraoperative data, in-hospital course, and PT session notes. Patients who had a PT session at any point on day of surgery were designated the Day 0 group, and patients who had PT starting the next day (POD-1) were designated the Non-Day 0 group. Although the medical records showed that Day 0 PT had been ordered in all cases, not all patients received PT on the day of their surgery; the most common reason was that they returned from postanesthesia care after the physical therapists’ work shift had ended. Another reason was patient noncompliance or unwillingness stemming from the prolonged effects of general anesthesia, diminished mental orientation, excess fatigue, or inadequate pain control. PT sessions after THA and TKA remained consistent over the study period, with twice daily sessions directed at patient mobility, range of motion, and gentle strengthening exercise. PT was performed only with patient consent.
Surgery
A combination of general and spinal anesthesia was used in almost all THA and TKA cases. In <5% of cases, either the patient refused spinal anesthesia, or it was unsuccessful. In addition, tranexamic acid was administered to limit blood loss in all THA and TKA cases. Of the 116 THAs performed over the study period, 3 were excluded (see below). Of the 113 patients included in the study, 88 (77.9%) used a minimally invasive posterolateral approach, 18 (15.9%) a direct anterior approach, and 7 (6.2%) an anterolateral approach. All THAs were performed with conventional instruments and uncemented components. All TKAs were performed with a standard medial parapatellar approach, conventional instruments, and a tourniquet; in each case, the patella was resurfaced, and cemented fixation was used. Drains were not used in any THA or TKA cases. A local anesthetic cocktail (100 mL of 0.25% ropivacaine, 15 mL of 0.5% ropivacaine, and 1 mL of 1:1000 epinephrine) was injected for postoperative analgesia in all THA and TKA cases.
There were 3 important intraoperative findings in the THA Day 0 group: 2 cases of incidental gluteus medius tendon tears requiring repair and 1 case of nondisplaced calcar fracture treated with a cerclage cable. The THA Non-Day 0 group and both TKA groups had no major intraoperative findings.
Physical Therapy
Day-of-surgery PT was ordered for all patients. Patients did not receive formal PT before surgery. The PT protocol consisted of subjective assessment of patient condition, expectations, and goals; lower limb strengthening exercises; and maximum gait training with use of an assistive device as tolerated. Standard hip movement restrictions were ordered for posterolateral approach patients to protect the soft-tissue repair. Continuous passive motion (CPM) was not used during this study period.
Discharge Criteria
Patients were cleared for discharge by a multidisciplinary team using several criteria: no medical condition that would require readmission, intact surgical incision without discharge or concerning erythema, adequate analgesia (oral medications), intact neurovascular examination, and PT goals achieved (independence with bed mobility, transfers, standing balance, and minimum gait distance of 150 feet). Patients who could not be discharged home because of family or occupation issues or because of problems with gait or transfer were referred to skilled nursing or home healthcare. Follow-up for wound assessment and for examination of radiographs and functional range of motion was planned for 2 to 3 weeks after surgery (all patients followed up). Two patients, 1 in the THA Non-Day 0 group and 1 in the TKA Day 0 group, had a mechanical fall 1 day before discharge, but there were no complication-related discharge delays. In addition, there were no readmissions during the first 4 weeks after surgery.
Excluded Patients
Of the 116 THA cases, 113 (63 Day 0, 50 Non-Day 0) were analyzed. To establish homogeneity between groups and remove potential confounding factors, we excluded 4 THA patients (all Non-Day 0) from analysis because of medical complications prolonging LOS. In 1 of these cases, the patient developed respiratory insufficiency and myocardial infarction on POD-3, and critical care support was required (LOS, 16 days). In another case, anticoagulation treatment led to the development of a hip hematoma on POD-9 and to treatment (evacuation) in the operating room (LOS, 14 days). The other 2 cases involved exacerbation of dysphagia from preexisting myasthenia gravis (LOS, 5 days) and Ogilvie syndrome, managed conservatively (LOS, 9 days).
Of the 126 TKA cases, 123 (97 Day 0, 26 Non-Day 0) were analyzed. Three TKA patients were excluded because of prolonged hospitalization for medical reasons: One developed a deep vein thrombosis, 1 acquired Clostridium difficile colitis (history of lung transplantation, multiple immunosuppressive drugs), and 1 developed respiratory insufficiency from asthma exacerbation.
Statistical Analysis
Power analysis (G*Power) was used to determine an appropriate sample size for comparison.11 Given a previously published mean LOS after THA of 4 days, the hypothesized mean LOS reducing that by at least 0.5 day to 3.5 days, a significance level set at 5%, a power of test set at 0.95, and an allocation ratio of 1, a minimum of 23 subjects would be needed in each group to attain a statistically significant difference using the nonparametric Mann-Whitney test. The Shapiro-Wilk test was used to assess data normality. Regarding statistical significance, the Mann-Whitney U test was used for non-normally distributed data, the 2-sided Fisher exact test and χ2 test for qualitative data and contingency, and the 2-tailed, unpaired, independent-samples Student t test for normally distributed data. Data were analyzed with SPSS Statistics for Windows Version 20 (IBM).
Results
TKA and THA patients had similar demographic profiles, types of anesthesia, operating room and surgery times, surgical approaches, and total number of PT sessions before discharge. Estimated blood loss, however, was significantly (P < .05) higher for Non-Day 0 patients than for Non-Day 0 patients (Table 1). 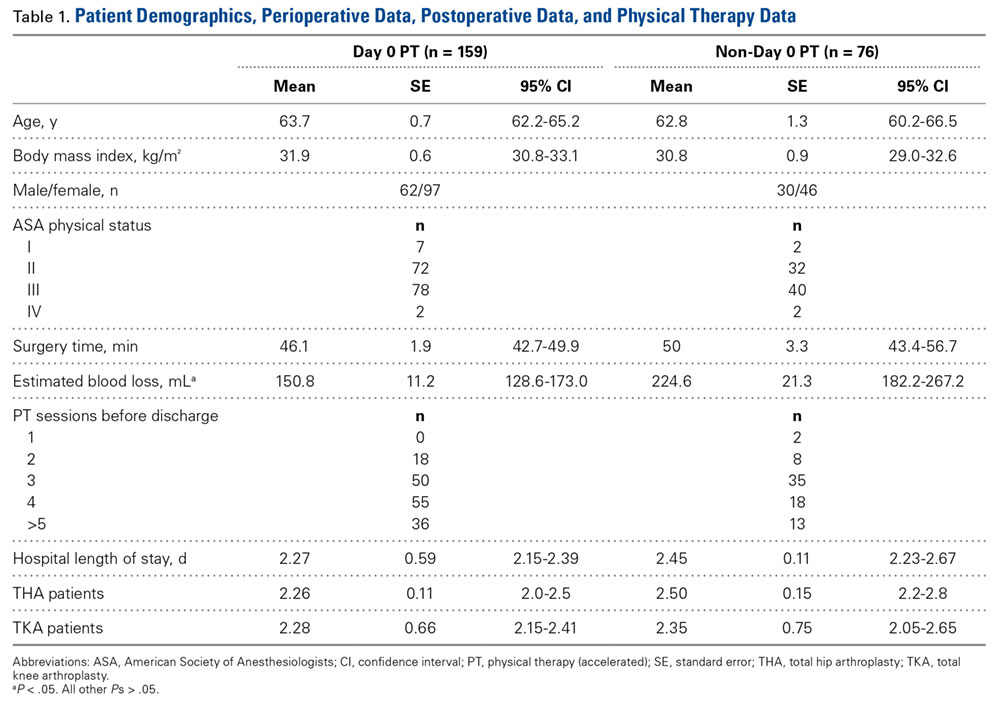
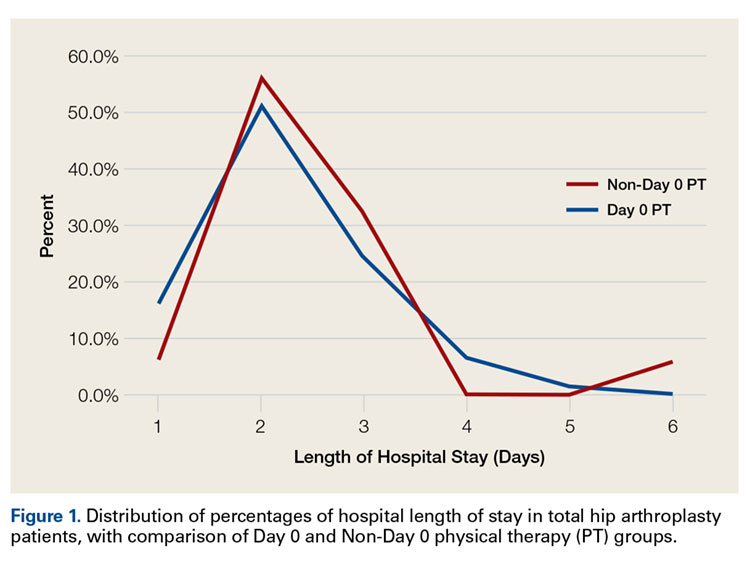
Mean (SD) distance ambulated during first PT session was 2-fold farther (P = .014) for Non-Day 0 patients, 84.1 (10.4) feet, than for Day 0 patients, 42.1 (6.4) feet. On POD-1, mean (SD) gait was significantly (P = .019) longer for Day 0 patients, 162.4 (12.9) feet, than for Non-Day 0 patients, 118 (11.7) feet (Figure 2). 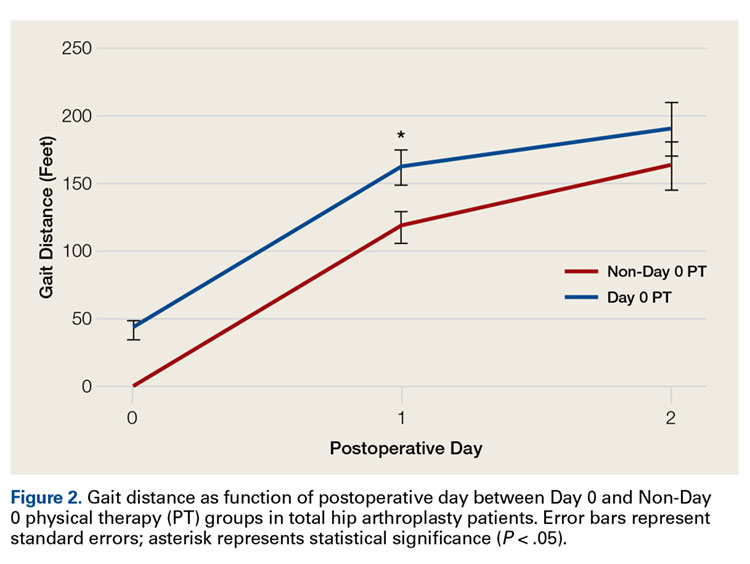
In TKA patients, although mean (SD) distance ambulated tended to be farther for the Day 0 group than for the Non-Day 0 group—114 (12.3) feet on POD-1 and 176 (15.2) feet on POD-2 for Day 0 vs 94 (22.2) feet on POD-1 and 148 (22.1) feet on POD-2 for Non-Day 0—the differences were not statistically significant. In addition, knee arc of motion during first PT session was statistically significantly (P = .3) higher for Day 0 patients, 69.1° (18.7°), than for Non-Day 0 patients, 61.7° (18.8°).
Statistical analysis revealed no difference in LOS based on surgical approach to the hip: 2.4 days for posterolateral (2.2 days for Day 0 and 2.6 days for Non-Day 0; P = .06); 2.1 days for direct anterior (2.1 days for Day 0 and 2.0 days for Non-Day 0; P = .7); and 2.7 days for anterolateral (3.0 days for Day 0 and 2.6 days for Non-Day 0; P = .6).
Discussion
Protocols for PT after THA and TKA remain unstandardized and largely dependent on institutions and surgeons. Factors permitting successful implementation of accelerated rehabilitation include patient motivation, adequate analgesia, and adequate support by physical therapists.12 A potential risk associated with accelerated PT after THA is dislocation, which did not occur in any patient in our Day 0 group. Other risks are increased pain and swelling leading to increased risk of falling and bleeding, which were not observed in our cohort. Although Day 0 PT was ordered in all cases in this study, only 55% of THA patients and 79% of TKA patients received PT the same day as their surgery. The delay can be addressed by making physical therapists’ work shifts more flexible for cases that finish later in the day and by providing preoperative education on the importance of day-of-surgery PT. Dr. Incavo and office staff routinely discuss discharge planning with all patients before surgery, but there was no stimulus protocol or communication to discuss or emphasize LOS with patients before surgery, and there was no questionnaire or survey given to assess patient expectations about PT and discharge.
Our finding of no statistically significant reduction in mean LOS after implementation of accelerated PT for THA or TKA differs from findings in multiple other reports.4,5,13-17 Baseline or control group mean LOS tended to be higher in previous studies3,5,18-23 (3.4-11.4 days) than in our control group (2.5 days) (Table 2). 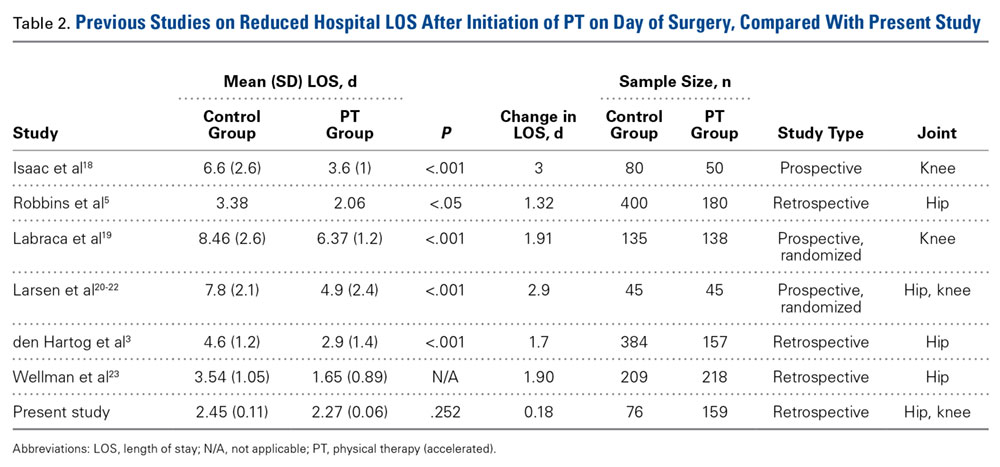
Conclusion
These results provide useful information for providers who are managing primary THA and TKA cases and seeking continual improvement in postoperative patient care and better resource allocation. Hospitals, particularly those operating in bundled-care environments, are increasingly coming under scrutiny to control costs. Our study results showed that the costs associated with Day 0 PT are justified for THA but not for TKA.
Am J Orthop. 2016;45(6):E337-E342. Copyright Frontline Medical Communications Inc. 2016. All rights reserved.
1. Kurtz S, Ong K, Lau E, Mowat F, Halpern M. Projections of primary and revision hip and knee arthroplasty in the United States from 2005 to 2030. J Bone Joint Surg Am. 2007;89(4):780-785.
2. Barbieri A, Vanhaecht K, Van Herck P, et al. Effects of clinical pathways in the joint replacement: a meta-analysis. BMC Med. 2009;7:32.
3. den Hartog YM, Mathijssen NM, Vehmeijer SB. Reduced length of hospital stay after the introduction of a rapid recovery protocol for primary THA procedures. Acta Orthop. 2013;84(5):444-447.
4. Husted H, Holm G, Jacobsen S. Predictors of length of stay and patient satisfaction after hip and knee replacement surgery: fast-track experience in 712 patients. Acta Orthop. 2008;79(2):168-173.
5. Robbins CE, Casey D, Bono JV, Murphy SB, Talmo CT, Ward DM. A multidisciplinary total hip arthroplasty protocol with accelerated postoperative rehabilitation: does the patient benefit? Am J Orthop. 2014;43(4):178-181.
6. den Hartog YM, Mathijssen NM, Hannink G, Vehmeijer SB. Which patient characteristics influence length of hospital stay after primary total hip arthroplasty in a ‘fast-track’ setting? Bone Joint J. 2015;97(1):19-23.
7. Forrest G, Fuchs M, Gutierrez A, Girardy J. Factors affecting length of stay and need for rehabilitation after hip and knee arthroplasty. J Arthroplasty. 1998;13(2):186-190.
8. Foote J, Panchoo K, Blair P, Bannister G. Length of stay following primary total hip replacement. Ann R Coll Surg Engl. 2009;91(6):500-504.
9. Sharma V, Morgan PM, Cheng EY. Factors influencing early rehabilitation after THA: a systematic review. Clin Orthop Relat Res. 2009;467(6):1400-1411.
10. Dorr LD, Maheshwari AV, Long WT, Wan Z, Sirianni LE. Early pain relief and function after posterior minimally invasive and conventional total hip arthroplasty. A prospective, randomized, blinded study. J Bone Joint Surg Am. 2007;89(6):1153-1160.
11. Faul F, Erdfelder E, Lang AG, Buchner A. G*Power 3: a flexible statistical power analysis program for the social, behavioral, and biomedical sciences. Behav Res Methods. 2007;39(2):175-191.
12. Ranawat AS, Ranawat CS. Pain management and accelerated rehabilitation for total hip and total knee arthroplasty. J Arthroplasty. 2007;22(7 suppl 3):12-15.
13. Husted H, Otte KS, Kristensen BB, Orsnes T, Kehlet H. Readmissions after fast-track hip and knee arthroplasty. Arch Orthop Trauma Surg. 2010;130(9):1185-1191.
14. Husted H, Lunn TH, Troelsen A, Gaarn-Larsen L, Kristensen BB, Kehlet H. Why still in hospital after fast-track hip and knee arthroplasty? Acta Orthop. 2011;82(6):679-684.
15. Husted H, Jensen CM, Solgaard S, Kehlet H. Reduced length of stay following hip and knee arthroplasty in Denmark 2000-2009: from research to implementation. Arch Orthop Trauma Surg. 2012;132(1):101-104.
16. Berger RA, Sanders SA, Thill ES, Sporer SM, Della Valle C. Newer anesthesia and rehabilitation protocols enable outpatient hip replacement in selected patients. Clin Orthop Relat Res. 2009;467(6):1424-1430.
17. Peck CN, Foster A, McLauchlan GJ. Reducing incision length or intensifying rehabilitation: what makes the difference to length of stay in total hip replacement in a UK setting? Int Orthop. 2006;30(5):395-398.
18. Isaac D, Falode T, Liu P, I’Anson H, Dillow K, Gill P. Accelerated rehabilitation after total knee replacement. Knee. 2005;12(5):346-350.
19. Labraca NS, Castro-Sánchez AM, Matarán-Peñarrocha GA, Arroyo-Morales M, Sánchez-Joya Mdel M, Moreno-Lorenzo C. Benefits of starting rehabilitation within 24 hours of primary total knee arthroplasty: randomized clinical trial. Clin Rehabil. 2011;25(6):557-566.
20. Larsen K, Hansen TB, Søballe K. Hip arthroplasty patients benefit from accelerated perioperative care and rehabilitation: a quasi-experimental study of 98 patients. Acta Orthop. 2008;79(5):624-630.
21. Larsen K, Hansen TB, Thomsen PB, Christiansen T, Søballe K. Cost-effectiveness of accelerated perioperative care and rehabilitation after total hip and knee arthroplasty. J Bone Joint Surg Am. 2009;91(4):761-772.
22. Larsen K, Sørensen OG, Hansen TB, Thomsen PB, Søballe K. Accelerated perioperative care and rehabilitation intervention for hip and knee replacement is effective: a randomized clinical trial involving 87 patients with 3 months of follow-up. Acta Orthop. 2008;79(2):149-159.
23. Wellman SS, Murphy AC, Gulcynski D. Murphy SB. Implementation of an accelerated mobilization protocol following primary total hip arthroplasty: impact on length of stay and disposition. Curr Rev Musculoskelet Med. 2011;4(3):84-90.
Total hip arthroplasty (THA) and total knee arthroplasty (TKA) are among the most effective surgical procedures in modern medicine. Use of primary THA in the United States is projected to increase by 174% by 2030, to 532,000 cases annually, and the estimate for TKA is even greater.1 Hospital length of stay (LOS) accounts for a significant portion of the overall cost of these procedures. Reducing LOS to limit costs without compromising patient safety, satisfaction, and outcomes remains the goal at all joint arthroplasty centers. Rapid-recovery or fast-track clinical pathways limiting opioid use and emphasizing patient education and early (day-of-surgery) mobilization have been shown to reduce LOS without compromising patient outcomes.2-5 Factors correlated with LOS after THA include surgical approach, use of multimodal analgesia, obesity, age, and social situations or living conditions.4,6-10
Our institution recently implemented a protocol in which certified physical therapists provide accelerated (day-of-surgery) physical therapy (PT) for all total joint arthroplasty patients. For the study reported here, we hypothesized that, compared with PT started on postoperative day 1 (POD-1), PT started day of surgery (Day 0) would result in shorter LOS for unilateral primary THA and TKA patients. In addition, we wanted to evaluate any predischarge differences in function, as measured by gait distance, between the groups.
Methods
After obtaining Institutional Review Board approval, we retrospectively evaluated use of the new postoperative protocol (Day 0 PT) for primary THA and TKA patients. We reviewed all cases of primary unilateral THA or TKA performed by a single surgeon over the 12-month period immediately following initiation of the protocol. There were 116 THA cases and 126 TKA cases. Charts were reviewed for patient demographics, intraoperative data, in-hospital course, and PT session notes. Patients who had a PT session at any point on day of surgery were designated the Day 0 group, and patients who had PT starting the next day (POD-1) were designated the Non-Day 0 group. Although the medical records showed that Day 0 PT had been ordered in all cases, not all patients received PT on the day of their surgery; the most common reason was that they returned from postanesthesia care after the physical therapists’ work shift had ended. Another reason was patient noncompliance or unwillingness stemming from the prolonged effects of general anesthesia, diminished mental orientation, excess fatigue, or inadequate pain control. PT sessions after THA and TKA remained consistent over the study period, with twice daily sessions directed at patient mobility, range of motion, and gentle strengthening exercise. PT was performed only with patient consent.
Surgery
A combination of general and spinal anesthesia was used in almost all THA and TKA cases. In <5% of cases, either the patient refused spinal anesthesia, or it was unsuccessful. In addition, tranexamic acid was administered to limit blood loss in all THA and TKA cases. Of the 116 THAs performed over the study period, 3 were excluded (see below). Of the 113 patients included in the study, 88 (77.9%) used a minimally invasive posterolateral approach, 18 (15.9%) a direct anterior approach, and 7 (6.2%) an anterolateral approach. All THAs were performed with conventional instruments and uncemented components. All TKAs were performed with a standard medial parapatellar approach, conventional instruments, and a tourniquet; in each case, the patella was resurfaced, and cemented fixation was used. Drains were not used in any THA or TKA cases. A local anesthetic cocktail (100 mL of 0.25% ropivacaine, 15 mL of 0.5% ropivacaine, and 1 mL of 1:1000 epinephrine) was injected for postoperative analgesia in all THA and TKA cases.
There were 3 important intraoperative findings in the THA Day 0 group: 2 cases of incidental gluteus medius tendon tears requiring repair and 1 case of nondisplaced calcar fracture treated with a cerclage cable. The THA Non-Day 0 group and both TKA groups had no major intraoperative findings.
Physical Therapy
Day-of-surgery PT was ordered for all patients. Patients did not receive formal PT before surgery. The PT protocol consisted of subjective assessment of patient condition, expectations, and goals; lower limb strengthening exercises; and maximum gait training with use of an assistive device as tolerated. Standard hip movement restrictions were ordered for posterolateral approach patients to protect the soft-tissue repair. Continuous passive motion (CPM) was not used during this study period.
Discharge Criteria
Patients were cleared for discharge by a multidisciplinary team using several criteria: no medical condition that would require readmission, intact surgical incision without discharge or concerning erythema, adequate analgesia (oral medications), intact neurovascular examination, and PT goals achieved (independence with bed mobility, transfers, standing balance, and minimum gait distance of 150 feet). Patients who could not be discharged home because of family or occupation issues or because of problems with gait or transfer were referred to skilled nursing or home healthcare. Follow-up for wound assessment and for examination of radiographs and functional range of motion was planned for 2 to 3 weeks after surgery (all patients followed up). Two patients, 1 in the THA Non-Day 0 group and 1 in the TKA Day 0 group, had a mechanical fall 1 day before discharge, but there were no complication-related discharge delays. In addition, there were no readmissions during the first 4 weeks after surgery.
Excluded Patients
Of the 116 THA cases, 113 (63 Day 0, 50 Non-Day 0) were analyzed. To establish homogeneity between groups and remove potential confounding factors, we excluded 4 THA patients (all Non-Day 0) from analysis because of medical complications prolonging LOS. In 1 of these cases, the patient developed respiratory insufficiency and myocardial infarction on POD-3, and critical care support was required (LOS, 16 days). In another case, anticoagulation treatment led to the development of a hip hematoma on POD-9 and to treatment (evacuation) in the operating room (LOS, 14 days). The other 2 cases involved exacerbation of dysphagia from preexisting myasthenia gravis (LOS, 5 days) and Ogilvie syndrome, managed conservatively (LOS, 9 days).
Of the 126 TKA cases, 123 (97 Day 0, 26 Non-Day 0) were analyzed. Three TKA patients were excluded because of prolonged hospitalization for medical reasons: One developed a deep vein thrombosis, 1 acquired Clostridium difficile colitis (history of lung transplantation, multiple immunosuppressive drugs), and 1 developed respiratory insufficiency from asthma exacerbation.
Statistical Analysis
Power analysis (G*Power) was used to determine an appropriate sample size for comparison.11 Given a previously published mean LOS after THA of 4 days, the hypothesized mean LOS reducing that by at least 0.5 day to 3.5 days, a significance level set at 5%, a power of test set at 0.95, and an allocation ratio of 1, a minimum of 23 subjects would be needed in each group to attain a statistically significant difference using the nonparametric Mann-Whitney test. The Shapiro-Wilk test was used to assess data normality. Regarding statistical significance, the Mann-Whitney U test was used for non-normally distributed data, the 2-sided Fisher exact test and χ2 test for qualitative data and contingency, and the 2-tailed, unpaired, independent-samples Student t test for normally distributed data. Data were analyzed with SPSS Statistics for Windows Version 20 (IBM).
Results
TKA and THA patients had similar demographic profiles, types of anesthesia, operating room and surgery times, surgical approaches, and total number of PT sessions before discharge. Estimated blood loss, however, was significantly (P < .05) higher for Non-Day 0 patients than for Non-Day 0 patients (Table 1).
Mean (SD) distance ambulated during first PT session was 2-fold farther (P = .014) for Non-Day 0 patients, 84.1 (10.4) feet, than for Day 0 patients, 42.1 (6.4) feet. On POD-1, mean (SD) gait was significantly (P = .019) longer for Day 0 patients, 162.4 (12.9) feet, than for Non-Day 0 patients, 118 (11.7) feet (Figure 2).
In TKA patients, although mean (SD) distance ambulated tended to be farther for the Day 0 group than for the Non-Day 0 group—114 (12.3) feet on POD-1 and 176 (15.2) feet on POD-2 for Day 0 vs 94 (22.2) feet on POD-1 and 148 (22.1) feet on POD-2 for Non-Day 0—the differences were not statistically significant. In addition, knee arc of motion during first PT session was statistically significantly (P = .3) higher for Day 0 patients, 69.1° (18.7°), than for Non-Day 0 patients, 61.7° (18.8°).
Statistical analysis revealed no difference in LOS based on surgical approach to the hip: 2.4 days for posterolateral (2.2 days for Day 0 and 2.6 days for Non-Day 0; P = .06); 2.1 days for direct anterior (2.1 days for Day 0 and 2.0 days for Non-Day 0; P = .7); and 2.7 days for anterolateral (3.0 days for Day 0 and 2.6 days for Non-Day 0; P = .6).
Discussion
Protocols for PT after THA and TKA remain unstandardized and largely dependent on institutions and surgeons. Factors permitting successful implementation of accelerated rehabilitation include patient motivation, adequate analgesia, and adequate support by physical therapists.12 A potential risk associated with accelerated PT after THA is dislocation, which did not occur in any patient in our Day 0 group. Other risks are increased pain and swelling leading to increased risk of falling and bleeding, which were not observed in our cohort. Although Day 0 PT was ordered in all cases in this study, only 55% of THA patients and 79% of TKA patients received PT the same day as their surgery. The delay can be addressed by making physical therapists’ work shifts more flexible for cases that finish later in the day and by providing preoperative education on the importance of day-of-surgery PT. Dr. Incavo and office staff routinely discuss discharge planning with all patients before surgery, but there was no stimulus protocol or communication to discuss or emphasize LOS with patients before surgery, and there was no questionnaire or survey given to assess patient expectations about PT and discharge.
Our finding of no statistically significant reduction in mean LOS after implementation of accelerated PT for THA or TKA differs from findings in multiple other reports.4,5,13-17 Baseline or control group mean LOS tended to be higher in previous studies3,5,18-23 (3.4-11.4 days) than in our control group (2.5 days) (Table 2).
Conclusion
These results provide useful information for providers who are managing primary THA and TKA cases and seeking continual improvement in postoperative patient care and better resource allocation. Hospitals, particularly those operating in bundled-care environments, are increasingly coming under scrutiny to control costs. Our study results showed that the costs associated with Day 0 PT are justified for THA but not for TKA.
Am J Orthop. 2016;45(6):E337-E342. Copyright Frontline Medical Communications Inc. 2016. All rights reserved.
1. Kurtz S, Ong K, Lau E, Mowat F, Halpern M. Projections of primary and revision hip and knee arthroplasty in the United States from 2005 to 2030. J Bone Joint Surg Am. 2007;89(4):780-785.
2. Barbieri A, Vanhaecht K, Van Herck P, et al. Effects of clinical pathways in the joint replacement: a meta-analysis. BMC Med. 2009;7:32.
3. den Hartog YM, Mathijssen NM, Vehmeijer SB. Reduced length of hospital stay after the introduction of a rapid recovery protocol for primary THA procedures. Acta Orthop. 2013;84(5):444-447.
4. Husted H, Holm G, Jacobsen S. Predictors of length of stay and patient satisfaction after hip and knee replacement surgery: fast-track experience in 712 patients. Acta Orthop. 2008;79(2):168-173.
5. Robbins CE, Casey D, Bono JV, Murphy SB, Talmo CT, Ward DM. A multidisciplinary total hip arthroplasty protocol with accelerated postoperative rehabilitation: does the patient benefit? Am J Orthop. 2014;43(4):178-181.
6. den Hartog YM, Mathijssen NM, Hannink G, Vehmeijer SB. Which patient characteristics influence length of hospital stay after primary total hip arthroplasty in a ‘fast-track’ setting? Bone Joint J. 2015;97(1):19-23.
7. Forrest G, Fuchs M, Gutierrez A, Girardy J. Factors affecting length of stay and need for rehabilitation after hip and knee arthroplasty. J Arthroplasty. 1998;13(2):186-190.
8. Foote J, Panchoo K, Blair P, Bannister G. Length of stay following primary total hip replacement. Ann R Coll Surg Engl. 2009;91(6):500-504.
9. Sharma V, Morgan PM, Cheng EY. Factors influencing early rehabilitation after THA: a systematic review. Clin Orthop Relat Res. 2009;467(6):1400-1411.
10. Dorr LD, Maheshwari AV, Long WT, Wan Z, Sirianni LE. Early pain relief and function after posterior minimally invasive and conventional total hip arthroplasty. A prospective, randomized, blinded study. J Bone Joint Surg Am. 2007;89(6):1153-1160.
11. Faul F, Erdfelder E, Lang AG, Buchner A. G*Power 3: a flexible statistical power analysis program for the social, behavioral, and biomedical sciences. Behav Res Methods. 2007;39(2):175-191.
12. Ranawat AS, Ranawat CS. Pain management and accelerated rehabilitation for total hip and total knee arthroplasty. J Arthroplasty. 2007;22(7 suppl 3):12-15.
13. Husted H, Otte KS, Kristensen BB, Orsnes T, Kehlet H. Readmissions after fast-track hip and knee arthroplasty. Arch Orthop Trauma Surg. 2010;130(9):1185-1191.
14. Husted H, Lunn TH, Troelsen A, Gaarn-Larsen L, Kristensen BB, Kehlet H. Why still in hospital after fast-track hip and knee arthroplasty? Acta Orthop. 2011;82(6):679-684.
15. Husted H, Jensen CM, Solgaard S, Kehlet H. Reduced length of stay following hip and knee arthroplasty in Denmark 2000-2009: from research to implementation. Arch Orthop Trauma Surg. 2012;132(1):101-104.
16. Berger RA, Sanders SA, Thill ES, Sporer SM, Della Valle C. Newer anesthesia and rehabilitation protocols enable outpatient hip replacement in selected patients. Clin Orthop Relat Res. 2009;467(6):1424-1430.
17. Peck CN, Foster A, McLauchlan GJ. Reducing incision length or intensifying rehabilitation: what makes the difference to length of stay in total hip replacement in a UK setting? Int Orthop. 2006;30(5):395-398.
18. Isaac D, Falode T, Liu P, I’Anson H, Dillow K, Gill P. Accelerated rehabilitation after total knee replacement. Knee. 2005;12(5):346-350.
19. Labraca NS, Castro-Sánchez AM, Matarán-Peñarrocha GA, Arroyo-Morales M, Sánchez-Joya Mdel M, Moreno-Lorenzo C. Benefits of starting rehabilitation within 24 hours of primary total knee arthroplasty: randomized clinical trial. Clin Rehabil. 2011;25(6):557-566.
20. Larsen K, Hansen TB, Søballe K. Hip arthroplasty patients benefit from accelerated perioperative care and rehabilitation: a quasi-experimental study of 98 patients. Acta Orthop. 2008;79(5):624-630.
21. Larsen K, Hansen TB, Thomsen PB, Christiansen T, Søballe K. Cost-effectiveness of accelerated perioperative care and rehabilitation after total hip and knee arthroplasty. J Bone Joint Surg Am. 2009;91(4):761-772.
22. Larsen K, Sørensen OG, Hansen TB, Thomsen PB, Søballe K. Accelerated perioperative care and rehabilitation intervention for hip and knee replacement is effective: a randomized clinical trial involving 87 patients with 3 months of follow-up. Acta Orthop. 2008;79(2):149-159.
23. Wellman SS, Murphy AC, Gulcynski D. Murphy SB. Implementation of an accelerated mobilization protocol following primary total hip arthroplasty: impact on length of stay and disposition. Curr Rev Musculoskelet Med. 2011;4(3):84-90.