User login
Assessment of Personal Medical History Knowledge in Adolescents with Sickle Cell Disease: A Pilot Study
From the Departments of Psychology (Ms. Zhao, Drs. Russell, Wesley, and Porter) and Hematology (Mss. Johnson and Pullen, Dr. Hankins), St. Jude Children’s Research Hospital, Memphis, TN.
Abstract
- Background: Children with sickle cell disease (SCD) are surviving into adulthood. Mastery of disease knowledge may facilitate treatment continuity in adult care.
- Objective: To assess the accuracy and extent of medical history knowledge among adolescents with SCD through the use of a personal health record (PHR) form.
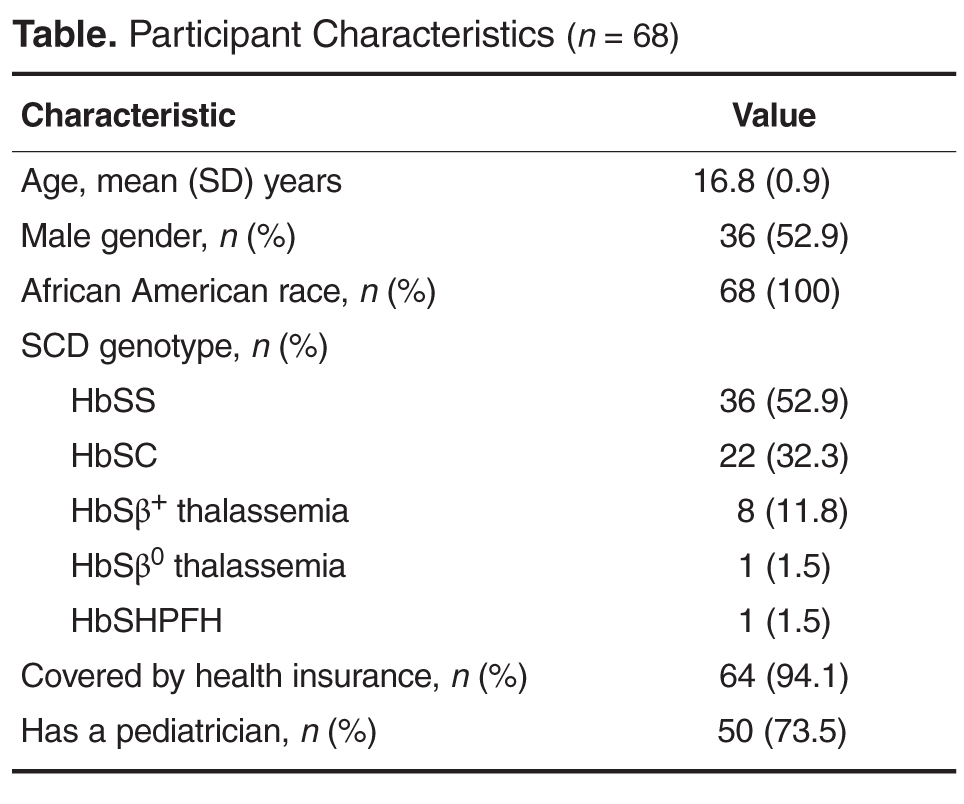
- Methods: 68 adolescent patients with SCD (52.9% male; mean age, 16.8 years; 100% African American) completed a PHR listing significant prior medical events (eg, disease complications, diagnostic evaluations, treatments). Responses were compared against participants’ electronic medical record. An agreement percentage was calculated to determine accuracy of knowledge.
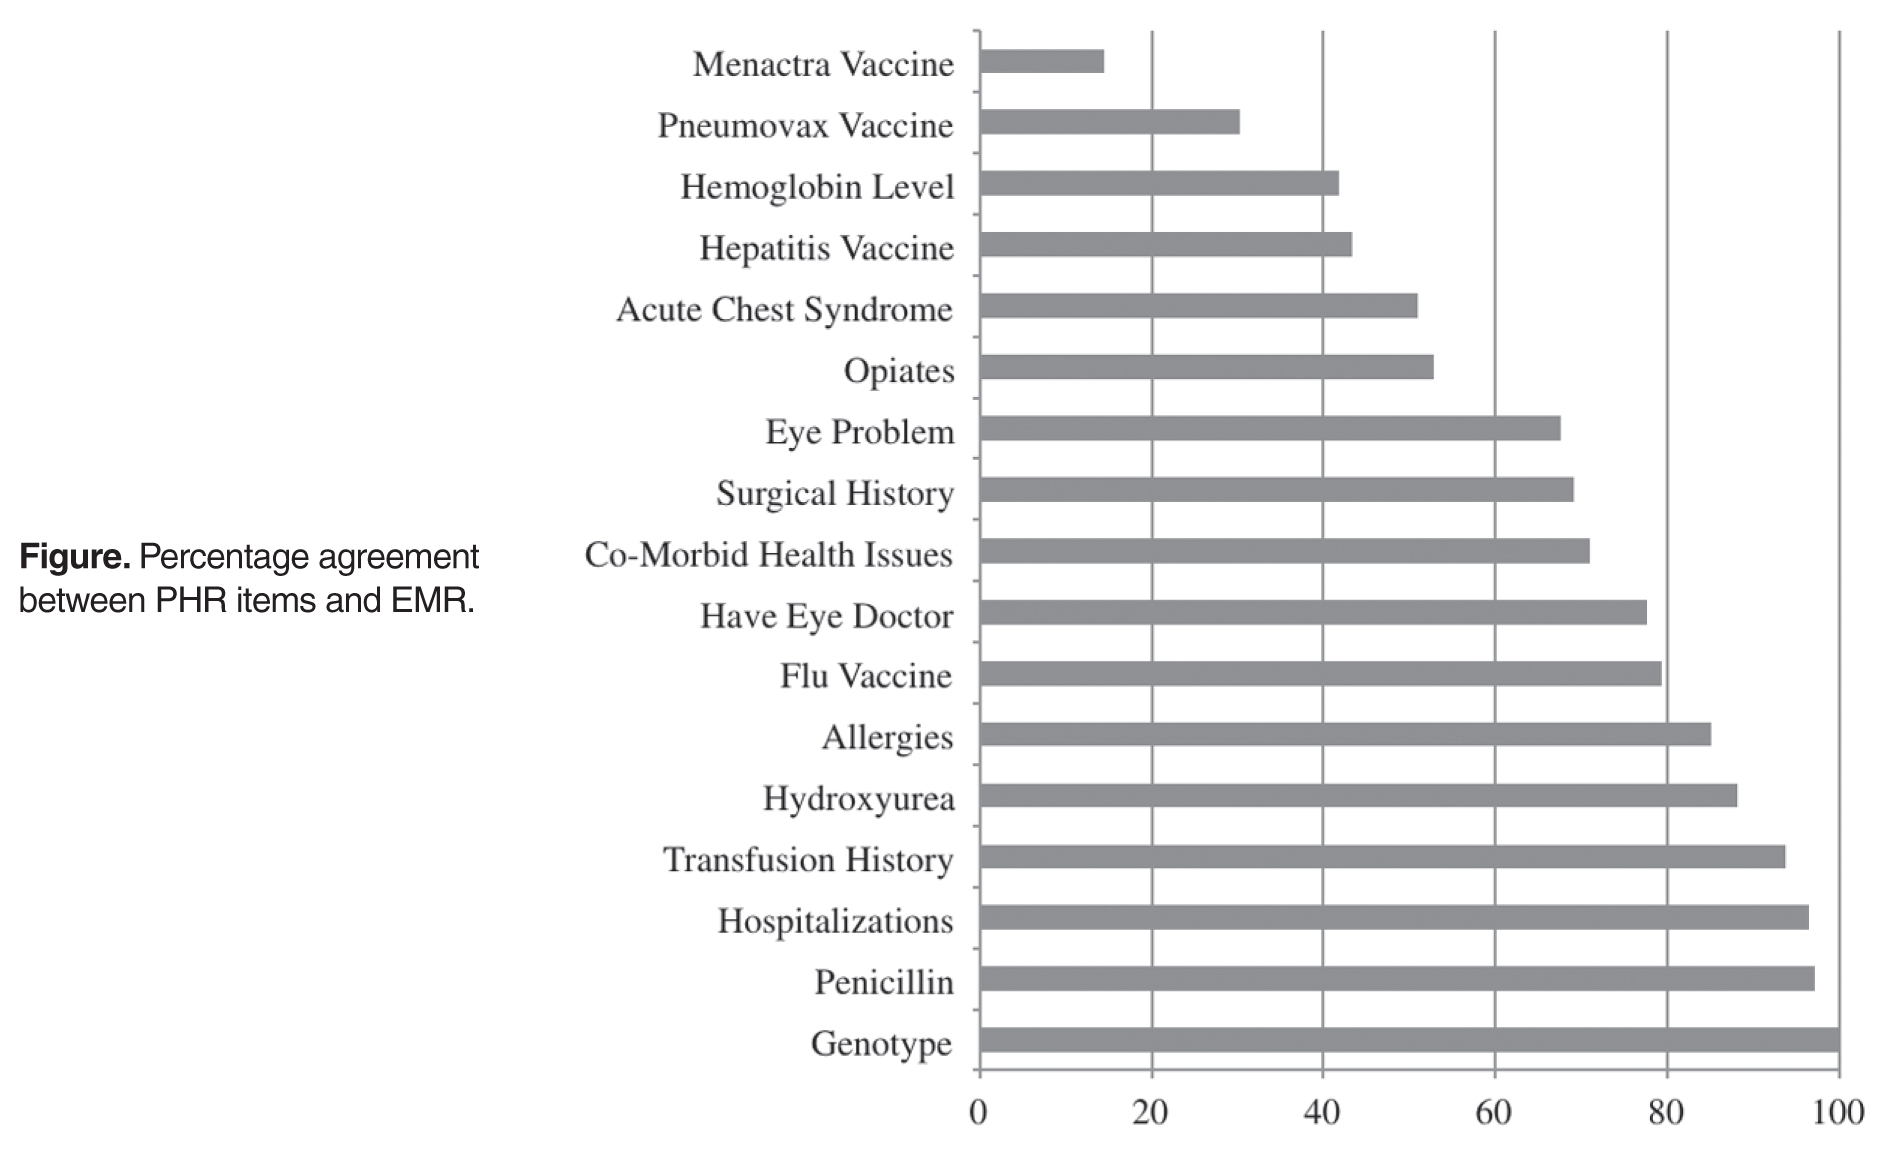
- Results: Most adolescents correctly reported their sickle cell genotype (100%), usage of penicillin (97.1%), prior hospitalizations (96.5%), history of prior blood transfusions (93.8%), usage of hydroxyurea (88.2%), and allergies (85.2%). Fewer adolescents accurately reported usage of opioids (52.9%), prior acute chest syndrome events (50.9%), baseline hemoglobin (41.8%), and hepatitis (43.3%), pneumovax (30.2%), and menactra (14.5%) vaccinations.
- Conclusion: Adolescents are aware of most but not all aspects of their medical history. The present findings can inform areas of knowledge deficits. Future targeted interventions for transition education and preparation may be tailored based on individual disease knowledge.
Sickle cell disease (SCD) is a genetic disorder characterized by abnormal sickle hemoglobin resulting in chronic hemolytic anemia and vaso-occlusion [1]. More than 95% of children with SCD in the United States survive into adulthood; however, young adults (YAs) are at risk for mortality shortly after transfer to adult health care [2–5]. Specifically, YAs with SCD (ages 18 to 30) have increased hospital utilization, emergency department visits, and mortality compared to other age-groups [4–7]. During this critical period, transition preparation that includes improving disease literacy and ensuring medical history knowledge may be necessary for optimal outcomes.
In the extant YA literature, significant gaps in medical history knowledge during the transition period were observed in pediatric cancer and inflammatory bowel disease patients [8,9]. YAs often require multidisciplinary management of their chronic disease complications [10]. Therefore, possessing comprehensive knowledge of personal health history may facilitate communication with different adult care providers and promote continuity of care. In the SCD transition literature, transition readiness measures have been developed to assess several aspects of knowledge, including medical and disease knowledge; however, these measures are primarily self-reported perceptions of knowledge and do not evaluate the accuracy of knowledge [11,12]. The current pilot study addresses this gap with the aim of assessing medical history knowledge accuracy in adolescents with SCD.
Methods
Participants
From March 2011 to January 2014, adolescents (aged 15–18 years) with SCD (any genotype) were approached during their regular health maintenance visits by hematology social workers. They were invited to complete the Personal Health Record (PHR) as an implementation effort of transition preparation within our pediatric SCD program.
Personal Health Record
The PHR was developed through literature review and discussions with area adult hematologists. The form was modeled after first visit intake forms used in adult hematology clinics. It was reviewed by the hematology medical team and the institution’s patient education committee. Prior to implementation, the form was piloted to obtain patient feedback on format and content. The PHR consists of 33 questions with 168 possible items/data points covering 12 domains: personal information (eg, contact information, SCD genotype), health provider information, personal health history (ie, health diagnoses), blood transfusion history, sickle cell pain events, hospitalization history in the previous year, diagnostic testing history (eg, laboratory tests), current medications, immunizations, advance directives, resource information (eg, disability benefits), and activities of daily living. Some questions required patients to check “Yes” or “No” (eg, “Have you been hospitalized in the past year? Have you received flu vaccine?”) while some required a written response (eg, “What medicines do you currently take?”).
Adolescents were instructed to complete the PHR independently without the help of their caregivers. After completing the form, the social worker reviewed the answers and/or asked participants’ perspectives about communicating health information to providers. A copy of the completed PHR was provided to the adolescent to promote continued education regarding medical history knowledge. The retrospective review of the PHR answers and participants’ characteristics was approved by the institutional review board with a waiver of consent from participants.
Statistical Methods
PHR answers were compared with each individual’s electronic medical record (EMR) for accuracy of responses. PHR responses were considered accurate only if they matched the information in the EMR. PHR items absent in the EMR were not coded (inability to verify the accuracy of responses) to capture the most accurate depiction of adolescents’ medical history knowledge. Coding was checked by at least 2 coders for response accuracy. Due to lack of EMR information for certain items, we could not verify the accuracy of many PHR items. Therefore, only items with at least 75% of data verified (across all patients who completed the PHR) were included in subsequent analyses.
Using SPSS (version 18), an agreement percentage was calculated for each patient across verifiable items and used as the primary outcome measure of knowledge accuracy. We used t tests to investigate gender or genotype differences in medical history accuracy. To examine genotype differences, we stratified the sample by SCD genotype: HbSS/Sβ0 thalassemia and HbSC/Sβ+ thalassemia [13].
Results
Patient Characteristics
Knowledge Accuracy Among Adolescents with SCD
Seventeen items in 6 PHR domains had the highest number of data points (at least 75% verified), and therefore were the only items that could be analyzed. Analyzed items included information about sickle cell genotype, eye doctor care, comorbid health issues (eg, asthma), allergies, hospitalizations, surgeries, transfusions, acute chest syndrome (ACS) episodes, eye problems, baseline hemoglobin level, and vaccination history as well as adolescents’ knowledge of current medications, including hydroxyurea, penicillin, and opioid pain medications.
Gender was not significantly associated with overall accuracy (P = 0.36). A significant difference was found in sickle genotype such that individuals with HbSC/Sβ+ thalassemia genotype (mean number of items, 8.23; SD = 1.70) were more accurate reporters of their medical history than those with HbSS/Sβ0 thalassemia genotype (mean number of items, 7.14; SD = 1.75; t(65) = –2.59, P = 0.01). Specifically, those with HbSS/Sβ0 thalassemia genotype were significantly less accurate reporters of vaccination history (meningococcus t(60) = 3.55, P = 0.001; pneumococcus t(60) = 2.46, P = 0.02; hepatitis t(64) = 2.18, P = 0.03, eye problems t(62) = 3.62; P = 0.001, and surgical history t(62) = 2.14, P = 0.04).
Discussion
In the present study, we utilized the PHR to assess the accuracy of medical history knowledge of adolescents with SCD preparing to transition to adult care. Most adolescents were accurate reporters of important disease-relevant information (eg, genotype, transfusion history, hydroxyurea use), which may be a result of these topics being frequently discussed or recently encountered. For example, 97% of adolescents accurately reported penicillin use which may be related to our program’s emphasis on infection prevention education. However, disease knowledge of immunization history, prior ACS events, and opioid medication use might have been more difficult to recall due to the long interval from their occurrence until the completion of the PHR. Further, frequent changes in opioid medication use may have impacted the accuracy of adolescents’ answers with EMR data.
Individuals with HbSC/Sβ+ thalassemia genotype were more accurate reporters of their medical history, but the magnitude of difference was not large. These individuals tend to have fewer health issues and therefore less health information to recall, leading to higher accuracy. Furthermore, evidence demonstrates that individuals with HbSS/Sβ0 thalassemia genotype are at greater risk for cerebrovascular events and subsequent cognitive deficits [14], leading to more memory deficits and difficulty understanding and retaining health information [15]. The results suggest that patient health literacy, or an individual’s capacity to understand basic health information [16], may be a mediating factor in assessing for transition readiness. This is especially important given SCD risk for cognitive deficits [17].
Only 17 PHR items were analyzed due to conservative selection of items. Thus the present findings are not representative of the entire medical history. Additionally, the accuracy of medical history knowledge results may be limited by conservatism with abstracting information from the EMR (PHR information was considered accurate if it matched the information found in their EMR). Finally, we did not systematically assess the feasibility and utility of the PHR; ongoing participant feedback would aid in improving the PHR tool and implementation. It would be important to validate the PHR in a larger sample. However, our study is the first to our knowledge to systematically evaluate medical history knowledge among youth with SCD.
Conclusion and Practice Implications
The present study demonstrates that use of the PHR during regular health maintenance visits can help identify gaps in knowledge among adolescents with SCD who are approaching transfer to adult care. Sufficient knowledge of one’s medical history is an important aspect in transition preparation as it can facilitate the communication of medical information, thereby ensuring continuity of care [18,19]. The PHR could be used to teach medical history knowledge, assess a patient’s level of transition readiness at different time points, and identify areas for further targeted intervention. Knowledge tools, such as the PHR, can be investigated prospectively to assess the association of disease literacy and clinical outcomes, serving as a possible predictive instrument for transition health outcomes.
Corresponding author: Jerlym S. Porter, PhD, MPH, St. Jude Children’s Research Hospital, Dept. of Psychology, 262 Danny Thomas Pl., Mail Stop 740, Memphis, TN 38105, [email protected].
Funding/support: This work was supported in part by HRSA grant 6 U1EMC19331-03-02 (PI: Hankins).
Financial disclosures: None.
Author contributions: conception and design, MJ, AP, KMW, JSH, JSP; analysis and interpretation of data, MSZ, KMR, JSP; drafting of article, MSZ, JSP; critical revision of the article, MSZ, MJ, AP, KMW, JSH, JSP; provision of study materials or patients, MJ, AP; statistical expertise, KMR; obtaining of funding, JSH; collection and assembly of data, MSZ, MJ, AP, KMR, KMW.
1. Quinn CT. Sickle cell disease in childhood: from newborn screening through transition to adult medical care. Pediatr Clin North Am 2013;60:1363–81.
2. Hassell KL. Population estimates of sickle cell disease in the U.S. Am J Prev Med 2010;38:S512–21.
3. Hamideh D, Alvarez O. Sickle cell disease related mortality in the United States (1999-2009). Pediatr Blood Cancer 2013;60:1482–6.
4. de Montalembert M, Guitton C. Transition from paediatric to adult care for patients with sickle cell disease. Br J Haematol 2014;164:630–5.
5. Quinn CT, Rogers ZR, McCavit TL, Buchanan GR. Improved survival of children and adolescents with sickle cell disease. Blood 2010;115:3447–52.
6. Brousseau DC, Owens PL, Mosso AL, et al. Acute care utilization and rehospitalizations for sickle cell disease. JAMA 2010;303:1288–94.
7. Lanzkron S, Carroll CP, Haywood Jr C. Mortality rates and age at death from sickle cell disease: U.S., 1979-2005. Public Health Rep 2013;128:110–6.
8. Kadan-Lottick NS, Robison LL, Gurney JG, et al. Childhood cancer survivors' knowledge about their past diagnosis and treatment: Childhood Cancer Survivor Study. JAMA 2002:287:1832–9.
9. Hait EJ, Barendse RM, Arnold JH, et al. Transition of adolescents with inflammatory bowel disease from pediatric to adult care: a survey of adult gastroenterologists. J Pediatr Gastroenterol Nutr 2009;48:61–5.
10. Kennedy A, Sawyer S. Transition from pediatric to adult services: are we getting it right? Curr Opin Pediatr 2008;20:403–9.
11. Sobota A, Akinlonu A, Champigny M, et al. Self-reported transition readiness among young adults with sickle cell disease. J Pediatr Hematol Oncol 2014;36:389–94.
12. Treadwell M, Johnson S, Sisler I, et al. Development of a sickle cell disease readiness for transition assessment. Int J Adolesc Med Health 2016;28:193–201.
13. Dampier C, Ely B, Brodecki D, et al. Pain characteristics and age-related pain trajectories in infants and young children with sickle cell disease. Pediatr Blood Cancer 2014;61:291–6.
14. Venkataraman A, Adams RJ. Neurologic complications of sickle cell disease. Handb Clin Neurol 2014;120:1015–25.
15. Porter JS, Matthews CS, Carroll YM, et al. Genetic education and sickle cell disease: feasibility and efficacy of a program tailored to adolescents. J Pediatr Hematol Oncol 2014;36:572–7.
16. Centers for Disease Control and Prevention. Health literacy. 2015. Accessed 26 Oct 2015 at www.cdc.gov/healthliteracy/index.html.
17. Armstrong FD, Thompson Jr RJ, Wang W, et al. Cognitive functioning and brain magnetic resonance imaging in children with sickle cell disease. Neuropsychology Committee of the Cooperative Study of Sickle Cell Disease. Pediatrics 1996;97:864–70.
18. Kanter J, Kruse-Jarres R. Management of sickle cell disease from childhood through adulthood. Blood Rev 2013;27:279–87.
19. Treadwell M, Telfair J, Gibson RW, et al. Transition from pediatric to adult care in sickle cell disease: establishing evidence-based practice and directions for research. Am J Hematol 2011;86:116–2.
From the Departments of Psychology (Ms. Zhao, Drs. Russell, Wesley, and Porter) and Hematology (Mss. Johnson and Pullen, Dr. Hankins), St. Jude Children’s Research Hospital, Memphis, TN.
Abstract
- Background: Children with sickle cell disease (SCD) are surviving into adulthood. Mastery of disease knowledge may facilitate treatment continuity in adult care.
- Objective: To assess the accuracy and extent of medical history knowledge among adolescents with SCD through the use of a personal health record (PHR) form.
- Methods: 68 adolescent patients with SCD (52.9% male; mean age, 16.8 years; 100% African American) completed a PHR listing significant prior medical events (eg, disease complications, diagnostic evaluations, treatments). Responses were compared against participants’ electronic medical record. An agreement percentage was calculated to determine accuracy of knowledge.
- Results: Most adolescents correctly reported their sickle cell genotype (100%), usage of penicillin (97.1%), prior hospitalizations (96.5%), history of prior blood transfusions (93.8%), usage of hydroxyurea (88.2%), and allergies (85.2%). Fewer adolescents accurately reported usage of opioids (52.9%), prior acute chest syndrome events (50.9%), baseline hemoglobin (41.8%), and hepatitis (43.3%), pneumovax (30.2%), and menactra (14.5%) vaccinations.
- Conclusion: Adolescents are aware of most but not all aspects of their medical history. The present findings can inform areas of knowledge deficits. Future targeted interventions for transition education and preparation may be tailored based on individual disease knowledge.
Sickle cell disease (SCD) is a genetic disorder characterized by abnormal sickle hemoglobin resulting in chronic hemolytic anemia and vaso-occlusion [1]. More than 95% of children with SCD in the United States survive into adulthood; however, young adults (YAs) are at risk for mortality shortly after transfer to adult health care [2–5]. Specifically, YAs with SCD (ages 18 to 30) have increased hospital utilization, emergency department visits, and mortality compared to other age-groups [4–7]. During this critical period, transition preparation that includes improving disease literacy and ensuring medical history knowledge may be necessary for optimal outcomes.
In the extant YA literature, significant gaps in medical history knowledge during the transition period were observed in pediatric cancer and inflammatory bowel disease patients [8,9]. YAs often require multidisciplinary management of their chronic disease complications [10]. Therefore, possessing comprehensive knowledge of personal health history may facilitate communication with different adult care providers and promote continuity of care. In the SCD transition literature, transition readiness measures have been developed to assess several aspects of knowledge, including medical and disease knowledge; however, these measures are primarily self-reported perceptions of knowledge and do not evaluate the accuracy of knowledge [11,12]. The current pilot study addresses this gap with the aim of assessing medical history knowledge accuracy in adolescents with SCD.
Methods
Participants
From March 2011 to January 2014, adolescents (aged 15–18 years) with SCD (any genotype) were approached during their regular health maintenance visits by hematology social workers. They were invited to complete the Personal Health Record (PHR) as an implementation effort of transition preparation within our pediatric SCD program.
Personal Health Record
The PHR was developed through literature review and discussions with area adult hematologists. The form was modeled after first visit intake forms used in adult hematology clinics. It was reviewed by the hematology medical team and the institution’s patient education committee. Prior to implementation, the form was piloted to obtain patient feedback on format and content. The PHR consists of 33 questions with 168 possible items/data points covering 12 domains: personal information (eg, contact information, SCD genotype), health provider information, personal health history (ie, health diagnoses), blood transfusion history, sickle cell pain events, hospitalization history in the previous year, diagnostic testing history (eg, laboratory tests), current medications, immunizations, advance directives, resource information (eg, disability benefits), and activities of daily living. Some questions required patients to check “Yes” or “No” (eg, “Have you been hospitalized in the past year? Have you received flu vaccine?”) while some required a written response (eg, “What medicines do you currently take?”).
Adolescents were instructed to complete the PHR independently without the help of their caregivers. After completing the form, the social worker reviewed the answers and/or asked participants’ perspectives about communicating health information to providers. A copy of the completed PHR was provided to the adolescent to promote continued education regarding medical history knowledge. The retrospective review of the PHR answers and participants’ characteristics was approved by the institutional review board with a waiver of consent from participants.
Statistical Methods
PHR answers were compared with each individual’s electronic medical record (EMR) for accuracy of responses. PHR responses were considered accurate only if they matched the information in the EMR. PHR items absent in the EMR were not coded (inability to verify the accuracy of responses) to capture the most accurate depiction of adolescents’ medical history knowledge. Coding was checked by at least 2 coders for response accuracy. Due to lack of EMR information for certain items, we could not verify the accuracy of many PHR items. Therefore, only items with at least 75% of data verified (across all patients who completed the PHR) were included in subsequent analyses.
Using SPSS (version 18), an agreement percentage was calculated for each patient across verifiable items and used as the primary outcome measure of knowledge accuracy. We used t tests to investigate gender or genotype differences in medical history accuracy. To examine genotype differences, we stratified the sample by SCD genotype: HbSS/Sβ0 thalassemia and HbSC/Sβ+ thalassemia [13].
Results
Patient Characteristics
Knowledge Accuracy Among Adolescents with SCD
Seventeen items in 6 PHR domains had the highest number of data points (at least 75% verified), and therefore were the only items that could be analyzed. Analyzed items included information about sickle cell genotype, eye doctor care, comorbid health issues (eg, asthma), allergies, hospitalizations, surgeries, transfusions, acute chest syndrome (ACS) episodes, eye problems, baseline hemoglobin level, and vaccination history as well as adolescents’ knowledge of current medications, including hydroxyurea, penicillin, and opioid pain medications.
Gender was not significantly associated with overall accuracy (P = 0.36). A significant difference was found in sickle genotype such that individuals with HbSC/Sβ+ thalassemia genotype (mean number of items, 8.23; SD = 1.70) were more accurate reporters of their medical history than those with HbSS/Sβ0 thalassemia genotype (mean number of items, 7.14; SD = 1.75; t(65) = –2.59, P = 0.01). Specifically, those with HbSS/Sβ0 thalassemia genotype were significantly less accurate reporters of vaccination history (meningococcus t(60) = 3.55, P = 0.001; pneumococcus t(60) = 2.46, P = 0.02; hepatitis t(64) = 2.18, P = 0.03, eye problems t(62) = 3.62; P = 0.001, and surgical history t(62) = 2.14, P = 0.04).
Discussion
In the present study, we utilized the PHR to assess the accuracy of medical history knowledge of adolescents with SCD preparing to transition to adult care. Most adolescents were accurate reporters of important disease-relevant information (eg, genotype, transfusion history, hydroxyurea use), which may be a result of these topics being frequently discussed or recently encountered. For example, 97% of adolescents accurately reported penicillin use which may be related to our program’s emphasis on infection prevention education. However, disease knowledge of immunization history, prior ACS events, and opioid medication use might have been more difficult to recall due to the long interval from their occurrence until the completion of the PHR. Further, frequent changes in opioid medication use may have impacted the accuracy of adolescents’ answers with EMR data.
Individuals with HbSC/Sβ+ thalassemia genotype were more accurate reporters of their medical history, but the magnitude of difference was not large. These individuals tend to have fewer health issues and therefore less health information to recall, leading to higher accuracy. Furthermore, evidence demonstrates that individuals with HbSS/Sβ0 thalassemia genotype are at greater risk for cerebrovascular events and subsequent cognitive deficits [14], leading to more memory deficits and difficulty understanding and retaining health information [15]. The results suggest that patient health literacy, or an individual’s capacity to understand basic health information [16], may be a mediating factor in assessing for transition readiness. This is especially important given SCD risk for cognitive deficits [17].
Only 17 PHR items were analyzed due to conservative selection of items. Thus the present findings are not representative of the entire medical history. Additionally, the accuracy of medical history knowledge results may be limited by conservatism with abstracting information from the EMR (PHR information was considered accurate if it matched the information found in their EMR). Finally, we did not systematically assess the feasibility and utility of the PHR; ongoing participant feedback would aid in improving the PHR tool and implementation. It would be important to validate the PHR in a larger sample. However, our study is the first to our knowledge to systematically evaluate medical history knowledge among youth with SCD.
Conclusion and Practice Implications
The present study demonstrates that use of the PHR during regular health maintenance visits can help identify gaps in knowledge among adolescents with SCD who are approaching transfer to adult care. Sufficient knowledge of one’s medical history is an important aspect in transition preparation as it can facilitate the communication of medical information, thereby ensuring continuity of care [18,19]. The PHR could be used to teach medical history knowledge, assess a patient’s level of transition readiness at different time points, and identify areas for further targeted intervention. Knowledge tools, such as the PHR, can be investigated prospectively to assess the association of disease literacy and clinical outcomes, serving as a possible predictive instrument for transition health outcomes.
Corresponding author: Jerlym S. Porter, PhD, MPH, St. Jude Children’s Research Hospital, Dept. of Psychology, 262 Danny Thomas Pl., Mail Stop 740, Memphis, TN 38105, [email protected].
Funding/support: This work was supported in part by HRSA grant 6 U1EMC19331-03-02 (PI: Hankins).
Financial disclosures: None.
Author contributions: conception and design, MJ, AP, KMW, JSH, JSP; analysis and interpretation of data, MSZ, KMR, JSP; drafting of article, MSZ, JSP; critical revision of the article, MSZ, MJ, AP, KMW, JSH, JSP; provision of study materials or patients, MJ, AP; statistical expertise, KMR; obtaining of funding, JSH; collection and assembly of data, MSZ, MJ, AP, KMR, KMW.
1. Quinn CT. Sickle cell disease in childhood: from newborn screening through transition to adult medical care. Pediatr Clin North Am 2013;60:1363–81.
2. Hassell KL. Population estimates of sickle cell disease in the U.S. Am J Prev Med 2010;38:S512–21.
3. Hamideh D, Alvarez O. Sickle cell disease related mortality in the United States (1999-2009). Pediatr Blood Cancer 2013;60:1482–6.
4. de Montalembert M, Guitton C. Transition from paediatric to adult care for patients with sickle cell disease. Br J Haematol 2014;164:630–5.
5. Quinn CT, Rogers ZR, McCavit TL, Buchanan GR. Improved survival of children and adolescents with sickle cell disease. Blood 2010;115:3447–52.
6. Brousseau DC, Owens PL, Mosso AL, et al. Acute care utilization and rehospitalizations for sickle cell disease. JAMA 2010;303:1288–94.
7. Lanzkron S, Carroll CP, Haywood Jr C. Mortality rates and age at death from sickle cell disease: U.S., 1979-2005. Public Health Rep 2013;128:110–6.
8. Kadan-Lottick NS, Robison LL, Gurney JG, et al. Childhood cancer survivors' knowledge about their past diagnosis and treatment: Childhood Cancer Survivor Study. JAMA 2002:287:1832–9.
9. Hait EJ, Barendse RM, Arnold JH, et al. Transition of adolescents with inflammatory bowel disease from pediatric to adult care: a survey of adult gastroenterologists. J Pediatr Gastroenterol Nutr 2009;48:61–5.
10. Kennedy A, Sawyer S. Transition from pediatric to adult services: are we getting it right? Curr Opin Pediatr 2008;20:403–9.
11. Sobota A, Akinlonu A, Champigny M, et al. Self-reported transition readiness among young adults with sickle cell disease. J Pediatr Hematol Oncol 2014;36:389–94.
12. Treadwell M, Johnson S, Sisler I, et al. Development of a sickle cell disease readiness for transition assessment. Int J Adolesc Med Health 2016;28:193–201.
13. Dampier C, Ely B, Brodecki D, et al. Pain characteristics and age-related pain trajectories in infants and young children with sickle cell disease. Pediatr Blood Cancer 2014;61:291–6.
14. Venkataraman A, Adams RJ. Neurologic complications of sickle cell disease. Handb Clin Neurol 2014;120:1015–25.
15. Porter JS, Matthews CS, Carroll YM, et al. Genetic education and sickle cell disease: feasibility and efficacy of a program tailored to adolescents. J Pediatr Hematol Oncol 2014;36:572–7.
16. Centers for Disease Control and Prevention. Health literacy. 2015. Accessed 26 Oct 2015 at www.cdc.gov/healthliteracy/index.html.
17. Armstrong FD, Thompson Jr RJ, Wang W, et al. Cognitive functioning and brain magnetic resonance imaging in children with sickle cell disease. Neuropsychology Committee of the Cooperative Study of Sickle Cell Disease. Pediatrics 1996;97:864–70.
18. Kanter J, Kruse-Jarres R. Management of sickle cell disease from childhood through adulthood. Blood Rev 2013;27:279–87.
19. Treadwell M, Telfair J, Gibson RW, et al. Transition from pediatric to adult care in sickle cell disease: establishing evidence-based practice and directions for research. Am J Hematol 2011;86:116–2.
Shoulder Arthroplasty: Disposition and Perioperative Outcomes in Patients With and Without Rheumatoid Arthritis
Shoulder arthroplasty (SA), including total SA (TSA) and reverse TSA, is an effective surgical treatment for fracture and primary or secondary degenerative disease of the shoulder.1 Over the past few decades, use of SA has increased dramatically, from about 5000 cases in 1990 to 7000 in 2000 and more than 26,000 in 2008.1,2
Complications associated with SA generally are classified as perioperative (occurring during the operative index) or long-term (postdischarge).3 Long-term complications include implant loosening, instability, revision, infection, rotator cuff tear, neural injury, and deltoid detachment.1,4,5 Perioperative complications, which are less commonly reported, include intraoperative fracture, infection, neural injury, venous thromboembolic events (VTEs, including pulmonary embolism [PE] and deep vein thrombosis [DVT]), transfusion, and death.3,6-10
SA is an attractive treatment option for patients with rheumatoid arthritis (RA), as the effects of pain on these patients are greater in the shoulder joint than in any other joint.11 Patients with RA pose unique orthopedic surgical challenges, including any combination of decreased bone mineralization, poor capsular tissue integrity, and osteonecrosis.3,12 In addition, RA patients may be taking immunosuppressive medications that have severe side effects, and they may require multiple surgeries.12,13 These factors predispose patients with RA to complications that include infection and wound dehiscence.3,5,12-14
The complex nature of RA has prompted investigators to examine outcome measures in this patient group. Hambright and colleagues3 used the Nationwide Inpatient Sample (NIS) to examine perioperative outcomes in RA patients who underwent TSA between 1988 and 2005.3 They found that TSA patients with RA had shorter and less costly hospital stays and were more likely to have a routine discharge.3 Using the same patient population drawn from the period 2006–2011, we conducted a study to determine if this unexpected trend persists as the number of TSAs and quality of postoperative care continue to increase. Given the potential for anemia of chronic disease and the systemic inflammatory nature of RA, we hypothesized that the perioperative complication profile of RA patients would be worse than that of non-RA patients.
Materials and Methods
NIS data were acquired for the period 2006–2011. The NIS is the largest publicly available all-payer inpatient database, with a random 20% sample of about 1000 US hospitals accounting for 7 to 8 million inpatient stays. The database supplies weights used to estimate national totals, at about 35 million inpatient visits per year. NIS inpatient data are limited to the operative index. Postdischarge information is not available. The NIS is managed by the Healthcare Cost and Utilization Project, which is sponsored by the Agency for Healthcare Research and Quality. The quality of NIS data is assessed and validated by an independent contractor. NIS data have been widely used to examine perioperative outcomes.15-17
NIS data cover patient and hospital demographics, hospital length of stay (LOS), discharge status, payer information, charges, and perioperative outcomes and procedure/diagnosis codes (ICD-9; International Classification of Diseases, Ninth Revision18).
As our Institutional Review Board (IRB) reviewed the database and determined the project was not human subject research, IRB involvement was not required. This study paralleled successful efforts with similar RA and non-RA patients who had shoulder and elbow surgery.3,19 SA patients were identified by ICD-9 procedure code 81.80, but this code does not specify whether the prosthesis was unconstrained, semiconstrained, or constrained. ICD-9 coding also does not specify whether the TSA was traditional or reverse. Patients with RA were identified by ICD-9 diagnosis codes 714.0, 714.1, and 714.2. Patients without one of these codes were placed in the non-RA cohort. Patients with codes associated with pathologic fractures secondary to metastatic cancer or bone malignant neoplasm as a secondary or primary diagnosis and patients who had revision surgery indicated by code 81.83 were excluded, as they have a disproportionately higher comorbidity burden.
After each cohort was defined, demographic data (age, sex, race, income quartile based on ZIP postal code) were compared, as were data on primary payer, hospital demographics, LOS (≤5 days, defined as perioperative index), discharge type, inflation-adjusted charges in 2014 dollars based on the Consumer Price Indexes (http://www.bls.gov/cpi/), and mortality. Perioperative complications—respiratory, gastrointestinal, genitourinary, accidental puncture/laceration, central nervous system, wound dehiscence, device-related (including embolism, fibrosis, hemorrhage, pain, stenosis, or thrombus caused by any device, implant, or graft), cardiac, hematoma/seroma, acute respiratory distress syndrome, postoperative shock, VTE, postoperative infection complications, and intraoperative transfusions—were considered using ICD-9 codes (996.X-999.X and 99.X, respectively).20 Although commonly used to determine perioperative comorbidity burden using ICD-9 coding, the modified Charlson index was not considered because RA is a component of the index and would therefore bias the variable.3,21
Statistical analyses, including χ2 tests and 2-sample t tests, were performed for categorical and continuous variables, respectively. P < .05 was considered significant. Fisher exact test was used for cohorts with fewer than 5 occurrences. Multivariate logistic regression models were then calculated to determine the effect of RA on different outcomes and complications, with age, race, sex, hospital region, hospital type, number of hospital beds, primary payer, and hospital ownership as covariates. Statistical analyses were performed using the R statistical programming language.22
Results
Of the 34,970 patients who underwent SA between 2006 and 2011, 1674 (4.8%) had a diagnosis of RA and 33,296 (95.2%) did not. On average, patients with RA tended to be younger than patients without RA (66.4 vs 69.1 years; P < .001), and a larger percentage of RA patients were female (75.5% vs 54.4%; P < .001). Compared with non-RA patients, RA patients comprised a different ethnic group and had a different expected primary payer (P < .001). SA patients with and without RA did not differ in income quartile based on ZIP code, total number of hospital beds, hospital region, or hospital teaching status (P = .34, .78, .59, and .82, respectively) (Table 1).
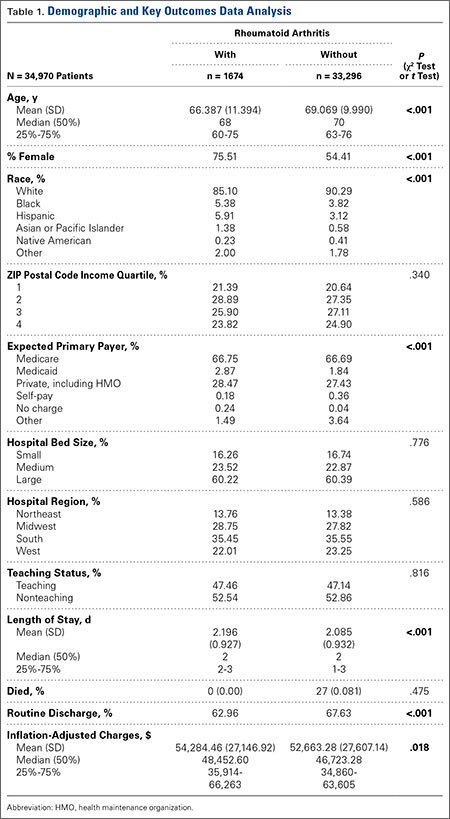
LOS was significantly (P < .001) statistically longer for RA patients (2.196 days) than for non-RA patients (2.085 days). RA patients were significantly less likely to be discharged home (63.0% vs 67.6%; P < .001). (Routine discharge was defined as discharge home, whereas nonroutine discharge was defined as discharge to a short-term hospital, skilled nursing facility, intermediate care, another type of facility, home health care, against medical advice, or death.) In addition, inflation-adjusted charges associated with SA were significantly higher (P = .018) for RA patients ($54,284) than for non-RA patients ($52,663) (Table 1).
Regarding the rates of complications that occurred during the perioperative index, there were no significant differences between RA and non-RA cohorts. These complications included respiratory, gastrointestinal, genitourinary, accidental puncture/laceration, central nervous system, wound dehiscence, device-related, cardiac, hematoma/seroma, acute respiratory distress syndrome, postoperative shock, VTE, and postoperative infection (Table 2). In addition, there was no significant difference in mortality between the groups (P = .48).
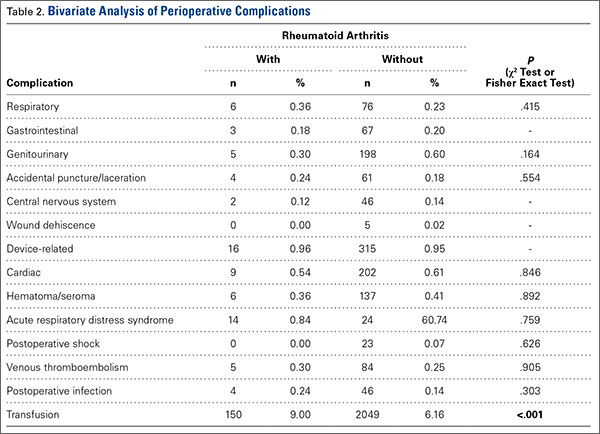
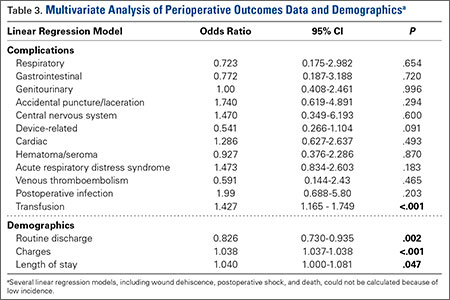
In TSA, blood transfusions were more likely (P < .001) to be given to RA patients (9.00%) than to non-RA patients (6.16%). Multivariate regression analyses were performed with age, race, sex, hospital region, hospital type, number of hospital beds, primary payer, and hospital ownership as covariates. These analyses revealed that transfusion (P < .001), discharge type (P = .002), total inflation-adjusted charges (P < .001), and LOS (P = .047) remained significant (Table 3).
Discussion
Large national databases like NIS allow study of uncommon medical occurrences and help delineate risks and trends that otherwise might be indeterminable. Although it has been suggested that patients with RA may have poorer long-term outcomes after SA, the perioperative risk profile indicates that TSA is well tolerated in RA patients during the operative index.3,23-25
The data on this study’s 34,970 patients, drawn from the period 2006–2011, demonstrated no significant differences in safety profile with respect to the 14 perioperative complications and outcomes examined, except blood transfusion rate. Rates of postoperative infection (RA, 0.24%; non-RA, 0.14%; P = .303), VTE (RA, 0.30%; non-RA, 0.25%; P = .905), and transfusion (RA, 9.00%; non-RA, 6.16%; P < .001) are of particular interest because of the severity of these situations.
Postoperative infection is a potentially serious complication and often occurs secondary to diabetes, RA, lupus erythematosus, prior surgery, or a nosocomial or remote source.1 The often costly treatment options include antibiotic suppression, irrigation and debridement with implant retention, 1-stage exchange with antibiotic-impregnated cement fixation, staged reimplantation, resection arthroplasty, arthrodesis, and amputation.1 The overall 0.14% infection rate determined in this study is lower than the 0.7% reported for SA patients in the literature.1 Given the nature of the NIS database, this rate underestimates the true postoperative infection rate, as any infection that occurred after the perioperative period is not captured.26 The present study’s perioperative infection rates (RA, 0.24%; non-RA, 0.14%) for the period 2006–2011 are comparable to the rates (RA, 0.17%; non-RA, 0.24%) reported by Hambright and colleagues3 for the same patient population over the preceding, 18-year period (1988–2005) and similarly do not significantly differ between groups. Although infection is uncommon in the immediate perioperative period, the ICD-9 codes used refer specifically to infection resulting from surgery and do not represent concomitant infection.
VTEs, which include PEs and DVTs, are rare but potentially life-threatening surgical complications.27,28 Mechanical prophylaxis and chemical prophylaxis have been recommended for major orthopedic surgery, particularly lower extremity surgery, such as total hip arthroplasty (THA) and total knee arthroplasty (TKA).28,29 In the present study, VTE rates were low, 0.30% (RA) and 0.25% (non-RA), and not significantly different in bivariate or multivariate analyses. These rates are comparable to those found in other national-database SA studies.28 VTEs that occur outside the index hospital admission are not captured in this database. Therefore, the rates in the present study may be lower than the true incidence after SA. Mortality secondary to VTE usually occurs within 24 hours but may occur up to 90 days after surgery. DVT rates, on the other hand, are difficult to evaluate because of differences in screening practices.27,28,30,31
That RA patients were more likely than non-RA patients to receive perioperative blood transfusions supports prior findings that SA patients with RA were more likely than SA patients with osteoarthritis (OA) to receive perioperative blood transfusions.8 RA patients have been shown to have high rates of anemia of chronic disease, ranging from 22% to 77%.32 During joint replacement, these patients often require transfusions.32,33 However, these findings differ from prior findings of no differences between RA and non-RA patients in the same patient population during the period 1988–2005.3 This difference may be a product of the constantly changing transfusion guidelines and increased use; transfusion rates increased 140% between 1997 and 2007, making transfusions the fastest growing common procedure in the United States during that time.34 There was no difference between RA and non-RA patients in household income (as determined by ZIP code analysis), number of hospital beds, hospital region, or hospital teaching status. Compared with non-RA patients, RA patients were more likely to be younger, female, and of a difference race and to have a different expected primary payer (P < .001).These findings are consistent with previous findings in the literature.3 In the present SA study, however, RA patients were more likely than non-RA patients to have longer LOS, higher inflation-adjusted hospital charges, and nonroutine discharge. These findings deviate from those of the study covering the preceding 18 years (1988–2005).3 Despite the findings of a changing environment of care for RA patients, by Hambright and colleagues3 and Weiss and colleagues,35 the trend appears to have shifted. Both groups had shorter average LOS than either group from the preceding 18 years.3 Although statistically significant in bivariate analysis, the difference in LOS between the 2 groups differed by an average of 0.11 day (2 hours 24 minutes) and was not clinically relevant.
In addition, the higher charges for patients with RA represent a deviation from the preceding 18 years.3 Other studies have also shown that RA is associated with increased cost in TSA.36 Patients with RA often have rotator cuff pathology, indicating reverse SA may be used more frequently.37,38 The increased implant cost associated with reverse SA may account for the increased costs in RA patients.39 As mentioned, TSA type is not captured in the NIS database. In addition, that RA patients were less likely than non-RA patients to have routine discharge may indicate RA cases are more complex because of their complications.1,5,14,40 A recent study of complications in RA patients (1163 who underwent THA, 2692 who underwent TKA) found that THA patients with RA were significantly more likely than THA patients with OA to dislocate, and TKA patients with RA were significantly more likely than TKA patients with OA to develop an infection after surgery.41 Postoperative dislocation has been shown to increase hospital costs in other orthopedic procedures.42 Also, during TSA, patients with RA are more likely than patients with OA to receive intraoperative blood transfusions.8 These complications—combined with the fact that RA is a chronic, progressive, systemic inflammatory disease that can affect soft tissue and blood vessel wall healing and is associated with medications having potential side effects—could contribute to the apparent increased hospital charges and LOS.3,12,13,43 Factors that include surgeon preference, impact of primary payer, and hospital practice may also affect final charges. Total charges in the NIS database include administrative fees, hospital costs, device-related costs, operating room costs, and ancillary staff costs. Total charges do not include professional fees and differ from the total cost that represents the amount reimbursed by the payer. Charges tend to correlate with but overestimate the total costs.44
This study had several important limitations. As mentioned, only events that occur during the operative admission are captured in the NIS database, and thus postoperative complications or serious adverse events that lead to readmission cannot be identified. In addition, outpatient TSAs are not captured in the NIS database, and thus inclusion of only inpatient procedures yields higher average LOS and total charges.45 Given the limited granularity of ICD-9 coding, this study could not determine RA severity, estimated blood loss, length of surgery, complication severity, type of TSA procedure/prosthesis, or cause of death. Although commonly used to determine comorbidity burden, the modified Charlson index could not be used, and therefore could not be entered as a covariate in multivariate analysis. Furthermore, the NIS database does not include imaging or patient-reported outcomes information, such as improvements in pain or function, which are of crucial importance in considering surgery.
Conclusion
Our findings corroborated findings that the demographics and the perioperative safety profile for TSA were similar for patients with and without RA. The risk for complications or death in the perioperative period was low. Compared with non-RA patients, RA patients had significantly higher charges and longer LOS and were less likely to be discharged home after surgery. The 0.11-day difference in LOS, though statistically significant, was not clinically relevant. These findings differ from those for the preceding, 18-year period (1988–2005). Future research should focus on the causes of these changes.
1. Bohsali KI, Wirth MA, Rockwood CA Jr. Complications of total shoulder arthroplasty. J Bone Joint Surg Am. 2006;88(10):2279-2292.
2. Kim SH, Wise BL, Zhang Y, Szabo RM. Increasing incidence of shoulder arthroplasty in the United States. J Bone Joint Surg Am. 2011;93(24):2249-2254.
3. Hambright D, Henderson RA, Cook C, Worrell T, Moorman CT, Bolognesi MP. A comparison of perioperative outcomes in patients with and without rheumatoid arthritis after receiving a total shoulder replacement arthroplasty. J Shoulder Elbow Surg. 2011;20(1):77-85.
4. van de Sande MA, Brand R, Rozing PM. Indications, complications, and results of shoulder arthroplasty. Scand J Rheumatol. 2006;35(6):426-434.
5. Wirth MA, Rockwood CA Jr. Complications of shoulder arthroplasty. Clin Orthop Relat Res. 1994;(307):47-69.
6. Young AA, Smith MM, Bacle G, Moraga C, Walch G. Early results of reverse shoulder arthroplasty in patients with rheumatoid arthritis. J Bone Joint Surg Am. 2011;93(20):
1915-1923.
7. Sperling JW, Kozak TK, Hanssen AD, Cofield RH. Infection after shoulder arthroplasty. Clin Orthop Relat Res. 2001;(382):206-216.
8. Sperling JW, Duncan SF, Cofield RH, Schleck CD, Harmsen WS. Incidence and risk factors for blood transfusion in shoulder arthroplasty. J Shoulder Elbow Surg. 2005;14(6):599-601.
9. Kumar S, Sperling JW, Haidukewych GH, Cofield RH. Periprosthetic humeral fractures after shoulder arthroplasty. J Bone Joint Surg Am. 2004;86(4):680-689.
10. Sperling JW, Cofield RH. Pulmonary embolism following shoulder arthroplasty. J Bone Joint Surg Am. 2002;84(11):1939-1941.
11. Tanaka E, Saito A, Kamitsuji S, et al. Impact of shoulder, elbow, and knee joint involvement on assessment of rheumatoid arthritis using the American College of Rheumatology core data set. Arthritis Rheum. 2005;53(6):864-871.
12. Nassar J, Cracchiolo A 3rd. Complications in surgery of the foot and ankle in patients with rheumatoid arthritis. Clin Orthop Relat Res. 2001;(391):140-152.
13. den Broeder AA, Creemers MC, Fransen J, et al. Risk factors for surgical site infections and other complications in elective surgery in patients with rheumatoid arthritis with special attention for anti-tumor necrosis factor: a large retrospective study. J Rheumatol. 2007;34(4):689-695.
14. Sanchez-Sotelo J. (i) Shoulder arthroplasty for osteoarthritis and rheumatoid arthritis. Curr Orthop. 2007;21(6):405-414.
15. Agency for Healthcare Research and Quality, Healthcare Cost and Utilization Project (HCUP). Overview of the National (Nationwide) Inpatient Sample (NIS). 2012. http://www.hcup-us.ahrq.gov/nisoverview.jsp. Accessed February 3, 2015.
16. Hervey SL, Purves HR, Guller U, Toth AP, Vail TP, Pietrobon R. Provider volume of total knee arthroplasties and patient outcomes in the HCUP-Nationwide Inpatient Sample. J Bone Joint Surg Am. 2003;85(9):1775-1783.
17. Noskin GA, Rubin RJ, Schentag JJ, et al. The burden of Staphylococcus aureus infections on hospitals in the United States: an analysis of the 2000 and 2001 Nationwide Inpatient Sample database. Arch Intern Med. 2005;165(15):1756-1761.
18. World Health Organization. International Classification of Diseases, Ninth Revision, Clinical Modification (ICD-9-CM). Geneva, Switzerland: World Health Organization; 2008.
19. Cook C, Hawkins R, Aldridge JM 3rd, Tolan S, Krupp R, Bolognesi M. Comparison of perioperative complications in patients with and without rheumatoid arthritis who receive total elbow replacement. J Shoulder Elbow Surg. 2009;18(1):21-26.
20. Goz V, Weinreb JH, McCarthy I, Schwab F, Lafage V, Errico TJ. Perioperative complications and mortality after spinal fusions: analysis of trends and risk factors. Spine. 2013;38(22):1970-1976.
21. Deyo RA, Cherkin DC, Ciol MA. Adapting a clinical comorbidity index for use with ICD-9-CM administrative databases. J Clin Epidemiol. 1992;45(6):613-619.
22. R: a language and environment for statistical computing [computer program]. Vienna, Austria: Foundation for Statistical Computing; 2012.
23. Cuomo F, Greller MJ, Zuckerman JD. The rheumatoid shoulder. Rheum Dis Clin North Am. 1998;24(1):67-82.
24. Kelly IG, Foster RS, Fisher WD. Neer total shoulder replacement in rheumatoid arthritis. J Bone Joint Surg Br. 1987;69(5):723-726.
25. Donigan JA, Frisella WA, Haase D, Dolan L, Wolf B. Pre-operative and intra-operative factors related to shoulder arthroplasty outcomes. Iowa Orthop J. 2009;29:60-66.
26. Deshmukh AV, Koris M, Zurakowski D, Thornhill TS. Total shoulder arthroplasty: long-term survivorship, functional outcome, and quality of life. J Shoulder Elbow Surg. 2005;14(5):471-479.
27. Willis AA, Warren RF, Craig EV, et al. Deep vein thrombosis after reconstructive shoulder arthroplasty: a prospective observational study. J Shoulder Elbow Surg. 2009;18(1):100-106.
28. Jameson SS, James P, Howcroft DW, et al. Venous thromboembolic events are rare after shoulder surgery: analysis of a national database. J Shoulder Elbow Surg. 2011;20(5):
764-770.
29. Falck-Ytter Y, Francis CW, Johanson NA, et al. Prevention of VTE in orthopedic surgery patients: antithrombotic therapy and prevention of thrombosis: American College of Chest Physicians evidence-based clinical practice guidelines. Chest J. 2012;141(2 suppl):e278S-e325S.
30. White CB, Sperling JW, Cofield RH, Rowland CM. Ninety-day mortality after shoulder arthroplasty. J Arthroplasty. 2003;18(7):886-888.
31. Lussana F, Squizzato A, Permunian ET, Cattaneo M. A systematic review on the effect of aspirin in the prevention of post-operative arterial thrombosis in patients undergoing total hip and total knee arthroplasty. Thromb Res. 2014;134(3):599-603.
32. Wilson A, Yu H, Goodnough LT, Nissenson AR. Prevalence and outcomes of anemia in rheumatoid arthritis: a systematic review of the literature. Am J Med. 2004;116(7):50-57.
33. Mercuriali F, Gualtieri G, Sinigaglia L, et al. Use of recombinant human erythropoietin to assist autologous blood donation by anemic rheumatoid arthritis patients undergoing major orthopedic surgery. Transfusion. 1994;34(6):501-506.
34. Shander A, Gross I, Hill S, et al. A new perspective on best transfusion practices. Blood Transfus. 2013;11(2):193-202.
35. Weiss RJ, Ehlin A, Montgomery SM, Wick MC, Stark A, Wretenberg P. Decrease of RA-related orthopaedic surgery of the upper limbs between 1998 and 2004: data from 54,579 Swedish RA inpatients. Rheumatology. 2008;47(4):491-494.
36. Davis DE, Paxton ES, Maltenfort M, Abboud J. Factors affecting hospital charges after total shoulder arthroplasty: an evaluation of the national inpatient sample database.
J Shoulder Elbow Surg. 2014;23(12):1860-1866.
37. Cuff D, Pupello D, Virani N, Levy J, Frankle M. Reverse shoulder arthroplasty for the treatment of rotator cuff deficiency. J Bone Joint Surg Am. 2008;90(6):1244-1251.
38. Rittmeister M, Kerschbaumer F. Grammont reverse total shoulder arthroplasty in patients with rheumatoid arthritis and nonreconstructible rotator cuff lesions. J Shoulder Elbow Surg. 2001;10(1):17-22.
39. Coe MP, Greiwe RM, Joshi R, et al. The cost-effectiveness of reverse total shoulder arthroplasty compared with hemiarthroplasty for rotator cuff tear arthropathy. J Shoulder Elbow Surg. 2012;21(10):1278-1288.
40. Garner RW, Mowat AG, Hazleman BL. Wound healing after operations of patients with rheumatoid arthritis. J Bone Joint Surg Br. 1973;55(1):134-144.
41. Ravi B, Croxford R, Hollands S, et al. Increased risk of complications following total joint arthroplasty in patients with rheumatoid arthritis. Arthritis Rheumatol. 2014;66(2):254-263.
42. Sanchez-Sotelo J, Haidukewych GJ, Boberg CJ. Hospital cost of dislocation after primary total hip arthroplasty. J Bone Joint Surg Am. 2006;88(2):290-294.
43. Ward MM. Decreases in rates of hospitalizations for manifestations of severe rheumatoid arthritis, 1983-2001. Arthritis Rheum. 2004;50(4):1122-1131.
44. Goz V, Weinreb JH, Schwab F, Lafage V, Errico TJ. Comparison of complications, costs, and length of stay of three different lumbar interbody fusion techniques: an analysis of the Nationwide Inpatient Sample database. Spine J. 2014;14(9):2019-2027.
45. Goz V, Errico TJ, Weinreb JH, et al. Vertebroplasty and kyphoplasty: national outcomes and trends in utilization from 2005 through 2010. Spine J. 2015;15(5):959-965.
Shoulder arthroplasty (SA), including total SA (TSA) and reverse TSA, is an effective surgical treatment for fracture and primary or secondary degenerative disease of the shoulder.1 Over the past few decades, use of SA has increased dramatically, from about 5000 cases in 1990 to 7000 in 2000 and more than 26,000 in 2008.1,2
Complications associated with SA generally are classified as perioperative (occurring during the operative index) or long-term (postdischarge).3 Long-term complications include implant loosening, instability, revision, infection, rotator cuff tear, neural injury, and deltoid detachment.1,4,5 Perioperative complications, which are less commonly reported, include intraoperative fracture, infection, neural injury, venous thromboembolic events (VTEs, including pulmonary embolism [PE] and deep vein thrombosis [DVT]), transfusion, and death.3,6-10
SA is an attractive treatment option for patients with rheumatoid arthritis (RA), as the effects of pain on these patients are greater in the shoulder joint than in any other joint.11 Patients with RA pose unique orthopedic surgical challenges, including any combination of decreased bone mineralization, poor capsular tissue integrity, and osteonecrosis.3,12 In addition, RA patients may be taking immunosuppressive medications that have severe side effects, and they may require multiple surgeries.12,13 These factors predispose patients with RA to complications that include infection and wound dehiscence.3,5,12-14
The complex nature of RA has prompted investigators to examine outcome measures in this patient group. Hambright and colleagues3 used the Nationwide Inpatient Sample (NIS) to examine perioperative outcomes in RA patients who underwent TSA between 1988 and 2005.3 They found that TSA patients with RA had shorter and less costly hospital stays and were more likely to have a routine discharge.3 Using the same patient population drawn from the period 2006–2011, we conducted a study to determine if this unexpected trend persists as the number of TSAs and quality of postoperative care continue to increase. Given the potential for anemia of chronic disease and the systemic inflammatory nature of RA, we hypothesized that the perioperative complication profile of RA patients would be worse than that of non-RA patients.
Materials and Methods
NIS data were acquired for the period 2006–2011. The NIS is the largest publicly available all-payer inpatient database, with a random 20% sample of about 1000 US hospitals accounting for 7 to 8 million inpatient stays. The database supplies weights used to estimate national totals, at about 35 million inpatient visits per year. NIS inpatient data are limited to the operative index. Postdischarge information is not available. The NIS is managed by the Healthcare Cost and Utilization Project, which is sponsored by the Agency for Healthcare Research and Quality. The quality of NIS data is assessed and validated by an independent contractor. NIS data have been widely used to examine perioperative outcomes.15-17
NIS data cover patient and hospital demographics, hospital length of stay (LOS), discharge status, payer information, charges, and perioperative outcomes and procedure/diagnosis codes (ICD-9; International Classification of Diseases, Ninth Revision18).
As our Institutional Review Board (IRB) reviewed the database and determined the project was not human subject research, IRB involvement was not required. This study paralleled successful efforts with similar RA and non-RA patients who had shoulder and elbow surgery.3,19 SA patients were identified by ICD-9 procedure code 81.80, but this code does not specify whether the prosthesis was unconstrained, semiconstrained, or constrained. ICD-9 coding also does not specify whether the TSA was traditional or reverse. Patients with RA were identified by ICD-9 diagnosis codes 714.0, 714.1, and 714.2. Patients without one of these codes were placed in the non-RA cohort. Patients with codes associated with pathologic fractures secondary to metastatic cancer or bone malignant neoplasm as a secondary or primary diagnosis and patients who had revision surgery indicated by code 81.83 were excluded, as they have a disproportionately higher comorbidity burden.
After each cohort was defined, demographic data (age, sex, race, income quartile based on ZIP postal code) were compared, as were data on primary payer, hospital demographics, LOS (≤5 days, defined as perioperative index), discharge type, inflation-adjusted charges in 2014 dollars based on the Consumer Price Indexes (http://www.bls.gov/cpi/), and mortality. Perioperative complications—respiratory, gastrointestinal, genitourinary, accidental puncture/laceration, central nervous system, wound dehiscence, device-related (including embolism, fibrosis, hemorrhage, pain, stenosis, or thrombus caused by any device, implant, or graft), cardiac, hematoma/seroma, acute respiratory distress syndrome, postoperative shock, VTE, postoperative infection complications, and intraoperative transfusions—were considered using ICD-9 codes (996.X-999.X and 99.X, respectively).20 Although commonly used to determine perioperative comorbidity burden using ICD-9 coding, the modified Charlson index was not considered because RA is a component of the index and would therefore bias the variable.3,21
Statistical analyses, including χ2 tests and 2-sample t tests, were performed for categorical and continuous variables, respectively. P < .05 was considered significant. Fisher exact test was used for cohorts with fewer than 5 occurrences. Multivariate logistic regression models were then calculated to determine the effect of RA on different outcomes and complications, with age, race, sex, hospital region, hospital type, number of hospital beds, primary payer, and hospital ownership as covariates. Statistical analyses were performed using the R statistical programming language.22
Results
Of the 34,970 patients who underwent SA between 2006 and 2011, 1674 (4.8%) had a diagnosis of RA and 33,296 (95.2%) did not. On average, patients with RA tended to be younger than patients without RA (66.4 vs 69.1 years; P < .001), and a larger percentage of RA patients were female (75.5% vs 54.4%; P < .001). Compared with non-RA patients, RA patients comprised a different ethnic group and had a different expected primary payer (P < .001). SA patients with and without RA did not differ in income quartile based on ZIP code, total number of hospital beds, hospital region, or hospital teaching status (P = .34, .78, .59, and .82, respectively) (Table 1).
LOS was significantly (P < .001) statistically longer for RA patients (2.196 days) than for non-RA patients (2.085 days). RA patients were significantly less likely to be discharged home (63.0% vs 67.6%; P < .001). (Routine discharge was defined as discharge home, whereas nonroutine discharge was defined as discharge to a short-term hospital, skilled nursing facility, intermediate care, another type of facility, home health care, against medical advice, or death.) In addition, inflation-adjusted charges associated with SA were significantly higher (P = .018) for RA patients ($54,284) than for non-RA patients ($52,663) (Table 1).
Regarding the rates of complications that occurred during the perioperative index, there were no significant differences between RA and non-RA cohorts. These complications included respiratory, gastrointestinal, genitourinary, accidental puncture/laceration, central nervous system, wound dehiscence, device-related, cardiac, hematoma/seroma, acute respiratory distress syndrome, postoperative shock, VTE, and postoperative infection (Table 2). In addition, there was no significant difference in mortality between the groups (P = .48).
In TSA, blood transfusions were more likely (P < .001) to be given to RA patients (9.00%) than to non-RA patients (6.16%). Multivariate regression analyses were performed with age, race, sex, hospital region, hospital type, number of hospital beds, primary payer, and hospital ownership as covariates. These analyses revealed that transfusion (P < .001), discharge type (P = .002), total inflation-adjusted charges (P < .001), and LOS (P = .047) remained significant (Table 3).
Discussion
Large national databases like NIS allow study of uncommon medical occurrences and help delineate risks and trends that otherwise might be indeterminable. Although it has been suggested that patients with RA may have poorer long-term outcomes after SA, the perioperative risk profile indicates that TSA is well tolerated in RA patients during the operative index.3,23-25
The data on this study’s 34,970 patients, drawn from the period 2006–2011, demonstrated no significant differences in safety profile with respect to the 14 perioperative complications and outcomes examined, except blood transfusion rate. Rates of postoperative infection (RA, 0.24%; non-RA, 0.14%; P = .303), VTE (RA, 0.30%; non-RA, 0.25%; P = .905), and transfusion (RA, 9.00%; non-RA, 6.16%; P < .001) are of particular interest because of the severity of these situations.
Postoperative infection is a potentially serious complication and often occurs secondary to diabetes, RA, lupus erythematosus, prior surgery, or a nosocomial or remote source.1 The often costly treatment options include antibiotic suppression, irrigation and debridement with implant retention, 1-stage exchange with antibiotic-impregnated cement fixation, staged reimplantation, resection arthroplasty, arthrodesis, and amputation.1 The overall 0.14% infection rate determined in this study is lower than the 0.7% reported for SA patients in the literature.1 Given the nature of the NIS database, this rate underestimates the true postoperative infection rate, as any infection that occurred after the perioperative period is not captured.26 The present study’s perioperative infection rates (RA, 0.24%; non-RA, 0.14%) for the period 2006–2011 are comparable to the rates (RA, 0.17%; non-RA, 0.24%) reported by Hambright and colleagues3 for the same patient population over the preceding, 18-year period (1988–2005) and similarly do not significantly differ between groups. Although infection is uncommon in the immediate perioperative period, the ICD-9 codes used refer specifically to infection resulting from surgery and do not represent concomitant infection.
VTEs, which include PEs and DVTs, are rare but potentially life-threatening surgical complications.27,28 Mechanical prophylaxis and chemical prophylaxis have been recommended for major orthopedic surgery, particularly lower extremity surgery, such as total hip arthroplasty (THA) and total knee arthroplasty (TKA).28,29 In the present study, VTE rates were low, 0.30% (RA) and 0.25% (non-RA), and not significantly different in bivariate or multivariate analyses. These rates are comparable to those found in other national-database SA studies.28 VTEs that occur outside the index hospital admission are not captured in this database. Therefore, the rates in the present study may be lower than the true incidence after SA. Mortality secondary to VTE usually occurs within 24 hours but may occur up to 90 days after surgery. DVT rates, on the other hand, are difficult to evaluate because of differences in screening practices.27,28,30,31
That RA patients were more likely than non-RA patients to receive perioperative blood transfusions supports prior findings that SA patients with RA were more likely than SA patients with osteoarthritis (OA) to receive perioperative blood transfusions.8 RA patients have been shown to have high rates of anemia of chronic disease, ranging from 22% to 77%.32 During joint replacement, these patients often require transfusions.32,33 However, these findings differ from prior findings of no differences between RA and non-RA patients in the same patient population during the period 1988–2005.3 This difference may be a product of the constantly changing transfusion guidelines and increased use; transfusion rates increased 140% between 1997 and 2007, making transfusions the fastest growing common procedure in the United States during that time.34 There was no difference between RA and non-RA patients in household income (as determined by ZIP code analysis), number of hospital beds, hospital region, or hospital teaching status. Compared with non-RA patients, RA patients were more likely to be younger, female, and of a difference race and to have a different expected primary payer (P < .001).These findings are consistent with previous findings in the literature.3 In the present SA study, however, RA patients were more likely than non-RA patients to have longer LOS, higher inflation-adjusted hospital charges, and nonroutine discharge. These findings deviate from those of the study covering the preceding 18 years (1988–2005).3 Despite the findings of a changing environment of care for RA patients, by Hambright and colleagues3 and Weiss and colleagues,35 the trend appears to have shifted. Both groups had shorter average LOS than either group from the preceding 18 years.3 Although statistically significant in bivariate analysis, the difference in LOS between the 2 groups differed by an average of 0.11 day (2 hours 24 minutes) and was not clinically relevant.
In addition, the higher charges for patients with RA represent a deviation from the preceding 18 years.3 Other studies have also shown that RA is associated with increased cost in TSA.36 Patients with RA often have rotator cuff pathology, indicating reverse SA may be used more frequently.37,38 The increased implant cost associated with reverse SA may account for the increased costs in RA patients.39 As mentioned, TSA type is not captured in the NIS database. In addition, that RA patients were less likely than non-RA patients to have routine discharge may indicate RA cases are more complex because of their complications.1,5,14,40 A recent study of complications in RA patients (1163 who underwent THA, 2692 who underwent TKA) found that THA patients with RA were significantly more likely than THA patients with OA to dislocate, and TKA patients with RA were significantly more likely than TKA patients with OA to develop an infection after surgery.41 Postoperative dislocation has been shown to increase hospital costs in other orthopedic procedures.42 Also, during TSA, patients with RA are more likely than patients with OA to receive intraoperative blood transfusions.8 These complications—combined with the fact that RA is a chronic, progressive, systemic inflammatory disease that can affect soft tissue and blood vessel wall healing and is associated with medications having potential side effects—could contribute to the apparent increased hospital charges and LOS.3,12,13,43 Factors that include surgeon preference, impact of primary payer, and hospital practice may also affect final charges. Total charges in the NIS database include administrative fees, hospital costs, device-related costs, operating room costs, and ancillary staff costs. Total charges do not include professional fees and differ from the total cost that represents the amount reimbursed by the payer. Charges tend to correlate with but overestimate the total costs.44
This study had several important limitations. As mentioned, only events that occur during the operative admission are captured in the NIS database, and thus postoperative complications or serious adverse events that lead to readmission cannot be identified. In addition, outpatient TSAs are not captured in the NIS database, and thus inclusion of only inpatient procedures yields higher average LOS and total charges.45 Given the limited granularity of ICD-9 coding, this study could not determine RA severity, estimated blood loss, length of surgery, complication severity, type of TSA procedure/prosthesis, or cause of death. Although commonly used to determine comorbidity burden, the modified Charlson index could not be used, and therefore could not be entered as a covariate in multivariate analysis. Furthermore, the NIS database does not include imaging or patient-reported outcomes information, such as improvements in pain or function, which are of crucial importance in considering surgery.
Conclusion
Our findings corroborated findings that the demographics and the perioperative safety profile for TSA were similar for patients with and without RA. The risk for complications or death in the perioperative period was low. Compared with non-RA patients, RA patients had significantly higher charges and longer LOS and were less likely to be discharged home after surgery. The 0.11-day difference in LOS, though statistically significant, was not clinically relevant. These findings differ from those for the preceding, 18-year period (1988–2005). Future research should focus on the causes of these changes.
1. Bohsali KI, Wirth MA, Rockwood CA Jr. Complications of total shoulder arthroplasty. J Bone Joint Surg Am. 2006;88(10):2279-2292.
2. Kim SH, Wise BL, Zhang Y, Szabo RM. Increasing incidence of shoulder arthroplasty in the United States. J Bone Joint Surg Am. 2011;93(24):2249-2254.
3. Hambright D, Henderson RA, Cook C, Worrell T, Moorman CT, Bolognesi MP. A comparison of perioperative outcomes in patients with and without rheumatoid arthritis after receiving a total shoulder replacement arthroplasty. J Shoulder Elbow Surg. 2011;20(1):77-85.
4. van de Sande MA, Brand R, Rozing PM. Indications, complications, and results of shoulder arthroplasty. Scand J Rheumatol. 2006;35(6):426-434.
5. Wirth MA, Rockwood CA Jr. Complications of shoulder arthroplasty. Clin Orthop Relat Res. 1994;(307):47-69.
6. Young AA, Smith MM, Bacle G, Moraga C, Walch G. Early results of reverse shoulder arthroplasty in patients with rheumatoid arthritis. J Bone Joint Surg Am. 2011;93(20):
1915-1923.
7. Sperling JW, Kozak TK, Hanssen AD, Cofield RH. Infection after shoulder arthroplasty. Clin Orthop Relat Res. 2001;(382):206-216.
8. Sperling JW, Duncan SF, Cofield RH, Schleck CD, Harmsen WS. Incidence and risk factors for blood transfusion in shoulder arthroplasty. J Shoulder Elbow Surg. 2005;14(6):599-601.
9. Kumar S, Sperling JW, Haidukewych GH, Cofield RH. Periprosthetic humeral fractures after shoulder arthroplasty. J Bone Joint Surg Am. 2004;86(4):680-689.
10. Sperling JW, Cofield RH. Pulmonary embolism following shoulder arthroplasty. J Bone Joint Surg Am. 2002;84(11):1939-1941.
11. Tanaka E, Saito A, Kamitsuji S, et al. Impact of shoulder, elbow, and knee joint involvement on assessment of rheumatoid arthritis using the American College of Rheumatology core data set. Arthritis Rheum. 2005;53(6):864-871.
12. Nassar J, Cracchiolo A 3rd. Complications in surgery of the foot and ankle in patients with rheumatoid arthritis. Clin Orthop Relat Res. 2001;(391):140-152.
13. den Broeder AA, Creemers MC, Fransen J, et al. Risk factors for surgical site infections and other complications in elective surgery in patients with rheumatoid arthritis with special attention for anti-tumor necrosis factor: a large retrospective study. J Rheumatol. 2007;34(4):689-695.
14. Sanchez-Sotelo J. (i) Shoulder arthroplasty for osteoarthritis and rheumatoid arthritis. Curr Orthop. 2007;21(6):405-414.
15. Agency for Healthcare Research and Quality, Healthcare Cost and Utilization Project (HCUP). Overview of the National (Nationwide) Inpatient Sample (NIS). 2012. http://www.hcup-us.ahrq.gov/nisoverview.jsp. Accessed February 3, 2015.
16. Hervey SL, Purves HR, Guller U, Toth AP, Vail TP, Pietrobon R. Provider volume of total knee arthroplasties and patient outcomes in the HCUP-Nationwide Inpatient Sample. J Bone Joint Surg Am. 2003;85(9):1775-1783.
17. Noskin GA, Rubin RJ, Schentag JJ, et al. The burden of Staphylococcus aureus infections on hospitals in the United States: an analysis of the 2000 and 2001 Nationwide Inpatient Sample database. Arch Intern Med. 2005;165(15):1756-1761.
18. World Health Organization. International Classification of Diseases, Ninth Revision, Clinical Modification (ICD-9-CM). Geneva, Switzerland: World Health Organization; 2008.
19. Cook C, Hawkins R, Aldridge JM 3rd, Tolan S, Krupp R, Bolognesi M. Comparison of perioperative complications in patients with and without rheumatoid arthritis who receive total elbow replacement. J Shoulder Elbow Surg. 2009;18(1):21-26.
20. Goz V, Weinreb JH, McCarthy I, Schwab F, Lafage V, Errico TJ. Perioperative complications and mortality after spinal fusions: analysis of trends and risk factors. Spine. 2013;38(22):1970-1976.
21. Deyo RA, Cherkin DC, Ciol MA. Adapting a clinical comorbidity index for use with ICD-9-CM administrative databases. J Clin Epidemiol. 1992;45(6):613-619.
22. R: a language and environment for statistical computing [computer program]. Vienna, Austria: Foundation for Statistical Computing; 2012.
23. Cuomo F, Greller MJ, Zuckerman JD. The rheumatoid shoulder. Rheum Dis Clin North Am. 1998;24(1):67-82.
24. Kelly IG, Foster RS, Fisher WD. Neer total shoulder replacement in rheumatoid arthritis. J Bone Joint Surg Br. 1987;69(5):723-726.
25. Donigan JA, Frisella WA, Haase D, Dolan L, Wolf B. Pre-operative and intra-operative factors related to shoulder arthroplasty outcomes. Iowa Orthop J. 2009;29:60-66.
26. Deshmukh AV, Koris M, Zurakowski D, Thornhill TS. Total shoulder arthroplasty: long-term survivorship, functional outcome, and quality of life. J Shoulder Elbow Surg. 2005;14(5):471-479.
27. Willis AA, Warren RF, Craig EV, et al. Deep vein thrombosis after reconstructive shoulder arthroplasty: a prospective observational study. J Shoulder Elbow Surg. 2009;18(1):100-106.
28. Jameson SS, James P, Howcroft DW, et al. Venous thromboembolic events are rare after shoulder surgery: analysis of a national database. J Shoulder Elbow Surg. 2011;20(5):
764-770.
29. Falck-Ytter Y, Francis CW, Johanson NA, et al. Prevention of VTE in orthopedic surgery patients: antithrombotic therapy and prevention of thrombosis: American College of Chest Physicians evidence-based clinical practice guidelines. Chest J. 2012;141(2 suppl):e278S-e325S.
30. White CB, Sperling JW, Cofield RH, Rowland CM. Ninety-day mortality after shoulder arthroplasty. J Arthroplasty. 2003;18(7):886-888.
31. Lussana F, Squizzato A, Permunian ET, Cattaneo M. A systematic review on the effect of aspirin in the prevention of post-operative arterial thrombosis in patients undergoing total hip and total knee arthroplasty. Thromb Res. 2014;134(3):599-603.
32. Wilson A, Yu H, Goodnough LT, Nissenson AR. Prevalence and outcomes of anemia in rheumatoid arthritis: a systematic review of the literature. Am J Med. 2004;116(7):50-57.
33. Mercuriali F, Gualtieri G, Sinigaglia L, et al. Use of recombinant human erythropoietin to assist autologous blood donation by anemic rheumatoid arthritis patients undergoing major orthopedic surgery. Transfusion. 1994;34(6):501-506.
34. Shander A, Gross I, Hill S, et al. A new perspective on best transfusion practices. Blood Transfus. 2013;11(2):193-202.
35. Weiss RJ, Ehlin A, Montgomery SM, Wick MC, Stark A, Wretenberg P. Decrease of RA-related orthopaedic surgery of the upper limbs between 1998 and 2004: data from 54,579 Swedish RA inpatients. Rheumatology. 2008;47(4):491-494.
36. Davis DE, Paxton ES, Maltenfort M, Abboud J. Factors affecting hospital charges after total shoulder arthroplasty: an evaluation of the national inpatient sample database.
J Shoulder Elbow Surg. 2014;23(12):1860-1866.
37. Cuff D, Pupello D, Virani N, Levy J, Frankle M. Reverse shoulder arthroplasty for the treatment of rotator cuff deficiency. J Bone Joint Surg Am. 2008;90(6):1244-1251.
38. Rittmeister M, Kerschbaumer F. Grammont reverse total shoulder arthroplasty in patients with rheumatoid arthritis and nonreconstructible rotator cuff lesions. J Shoulder Elbow Surg. 2001;10(1):17-22.
39. Coe MP, Greiwe RM, Joshi R, et al. The cost-effectiveness of reverse total shoulder arthroplasty compared with hemiarthroplasty for rotator cuff tear arthropathy. J Shoulder Elbow Surg. 2012;21(10):1278-1288.
40. Garner RW, Mowat AG, Hazleman BL. Wound healing after operations of patients with rheumatoid arthritis. J Bone Joint Surg Br. 1973;55(1):134-144.
41. Ravi B, Croxford R, Hollands S, et al. Increased risk of complications following total joint arthroplasty in patients with rheumatoid arthritis. Arthritis Rheumatol. 2014;66(2):254-263.
42. Sanchez-Sotelo J, Haidukewych GJ, Boberg CJ. Hospital cost of dislocation after primary total hip arthroplasty. J Bone Joint Surg Am. 2006;88(2):290-294.
43. Ward MM. Decreases in rates of hospitalizations for manifestations of severe rheumatoid arthritis, 1983-2001. Arthritis Rheum. 2004;50(4):1122-1131.
44. Goz V, Weinreb JH, Schwab F, Lafage V, Errico TJ. Comparison of complications, costs, and length of stay of three different lumbar interbody fusion techniques: an analysis of the Nationwide Inpatient Sample database. Spine J. 2014;14(9):2019-2027.
45. Goz V, Errico TJ, Weinreb JH, et al. Vertebroplasty and kyphoplasty: national outcomes and trends in utilization from 2005 through 2010. Spine J. 2015;15(5):959-965.
Resource Utilization and Satisfaction
The patient experience has become increasingly important to healthcare in the United States. It is now a metric used commonly to determine physician compensation and accounts for nearly 30% of the Centers for Medicare and Medicaid Services' (CMS) Value‐Based Purchasing (VBP) reimbursement for fiscal years 2015 and 2016.[1, 2]
In April 2015, CMS added a 5‐star patient experience score to its Hospital Compare website in an attempt to address the Affordable Care Act's call for transparent and easily understandable public reporting.[3] A hospital's principal score is the Summary Star Rating, which is based on responses to the Hospital Consumer Assessment of Healthcare Providers and Systems (HCAHPS) survey. The formulas used to calculate Summary Star Ratings have been reported by CMS.[4]
Studies published over the past decade suggest that gender, age, education level, length of hospital stay, travel distance, and other factors may influence patient satisfaction.[5, 6, 7, 8] One study utilizing a national dataset suggested that higher patient satisfaction was associated with greater inpatient healthcare utilization and higher healthcare expenditures.[9] It is therefore possible that emphasizing patient experience scores could adversely impact healthcare resource utilization. However, positive patient experience may also be an important independent dimension of quality for patients and correlate with improved clinical outcomes.[10]
We know of no literature describing patient factors associated with the Summary Star Rating. Given that this rating is now used as a standard metric by which patient experience can be compared across more than 3,500 hospitals,[11] data describing the association between patient‐level factors and the Summary Star Rating may provide hospitals with an opportunity to target improvement efforts. We aimed to determine the degree to which resource utilization is associated with a satisfaction score based on the Summary Star Rating methodology.
METHODS
The study was conducted at the University of Rochester Medical Center (URMC), an 830‐bed tertiary care center in upstate New York. This was a retrospective review of all HCAHPS surveys returned to URMC over a 27‐month period from January 1, 2012 to April 1, 2014. URMC follows the standard CMS process for determining which patients receive surveys as follows. During the study timeframe, HCAHPS surveys were mailed to patients 18 years of age and older who had an inpatient stay spanning at least 1 midnight. Surveys were mailed within 5 days of discharge, and were generally returned within 6 weeks. URMC did not utilize telephone or email surveys during the study period. Surveys were not sent to patients who (1) were transferred to another facility, (2) were discharged to hospice, (3) died during the hospitalization, (4) received psychiatric or rehabilitative services during the hospitalization, (5) had an international address, and/or (6) were prisoners.
The survey vendor (Press Ganey, South Bend, IN) for URMC provided raw data for returned surveys with patient answers to questions. Administrative and billing databases were used to add demographic and clinical data for the corresponding hospitalization to the dataset. These data included age, gender, payer status (public, private, self, charity), length of stay, number of attendings who saw the patient (based on encounters documented in the electronic medical record (EMR)), all discharge International Classification of Diseases, 9th Revision (ICD‐9) diagnoses for the hospitalization, total charges for the hospitalization, and intensive care unit (ICU) utilization as evidenced by a documented encounter with a member of the Division of Critical Care/Pulmonary Medicine.
CMS analyzes surveys within 1 of 3 clinical service categories (medical, surgical, or obstetrics/gynecology) based on the discharging service. To parallel this approach, each returned survey was placed into 1 of these categories based on the clinical service of the discharging physician. Patients placed in the obstetrics/gynecology category (n = 1317, 13%) will be analyzed in a future analysis given inherent differences in patient characteristics that require evaluation of other variables.
Approximations of CMS Summary Star Rating
The HCAHPS survey is a multiple‐choice questionnaire that includes several domains of patient satisfaction. Respondents are asked to rate areas of satisfaction with their hospital experience on a Likert scale. CMS uses a weighted average of Likert responses to a subset of HCAHPS questions to calculate a hospital's raw score in 11 domains, as well as an overall raw summary score. CMS then adjusts each raw score for differences between hospitals (eg, clustering, improvement over time, method of survey) to determine a hospital's star rating in each domain and an overall Summary Star Rating (the Summary Star Rating is the primary factor by which consumers can compare hospitals).[4] Because our data were from a single hospital system, the between‐hospital scoring adjustments utilized by CMS were not applicable. Instead, we calculated the raw scores exactly as CMS does prior to the adjustments. Thus, our scores reflect the scores that CMS would have given URMC during the study period prior to standardized adjustments; we refer to this as the raw satisfaction rating (RSR). We calculated an RSR for every eligible survey. The RSR was calculated as a continuous variable from 0 (lowest) to 1 (highest). Detailed explanation of our RSR calculation is available in the Supporting Information in the online version of this article.
Statistical Analysis
All analyses were performed in aggregate and by service (medical vs surgical). Categorical variables were summarized using frequencies with percentages. Comparisons across levels of categorical variables were performed with the 2 test. We report bivariate associations between the independent variables and RSRs in the top decile using unadjusted odds ratios (ORs) with 95% confidence intervals (CIs). Similarly, multivariable logistic regression was used for adjusted analyses. For the variables of severity of illness and resource intensity, the group with the lowest illness severity and lowest resource use served as the reference groups. We modeled patients without an ICU encounter and with an ICU encounter separately.
Charges, number of unique attendings encountered, and lengths of stay were highly correlated, and likely various measures of the same underlying construct of resource intensity, and therefore could not be entered into our models simultaneously. We combined these into a resource intensity score using factor analysis with a varimax rotation, and extracted factor scores for a single factor (supported by a scree plot). We then placed patients into 4 groups based on the distribution of the factor scores: low (25th percentile), moderate (25th50th percentile), major (50th75th percentile), and extreme (>75th percentile).
We used the Charlson‐Deyo comorbidity score as our disease severity index.[12] The index uses ICD‐9 diagnoses with points assigned for the impact of each diagnosis on morbidity and the points summed to an overall score. This provides a measure of disease severity for a patient based on the number of diagnoses and relative mortality of the individual diagnoses. Scores were categorized as 0 (representing no major illness burden), 1 to 3, 4 to 6, and >6.
All statistical analyses were performed using SAS version 9.4 (SAS Institute, Cary, NC), and P values 0.05 were considered statistically significant. This study was approved by the institutional review board at the University of Rochester Medical Center.
RESULTS
Our initial search identified 10,007 returned surveys (29% of eligible patients returned surveys during the study period). Of these, 5059 (51%) were categorized as medical, 3630 (36%) as surgical, and 1317 (13%) as obstetrics/gynecology. One survey did not have the service of the discharging physician recorded and was excluded. Cohort demographics and relationship to RSRs in the top decile for the 8689 medical and surgical patients can be found in Table 1. The most common discharge diagnosis‐related groups (DRGs) for medical patients were 247, percutaneous cardiovascular procedure with drug‐eluding stent without major complications or comorbidities (MCC) (3.8%); 871, septicemia or severe sepsis without mechanical ventilation >96 hours with MCC (2.7%); and 392, esophagitis, gastroenteritis, and miscellaneous digestive disorders with MCC (2.3%). The most common DRGs for surgical patients were 460, spinal fusion except cervical without MCC (3.5%); 328, stomach, esophageal and duodenal procedure without complication or comorbidities or MCC (3.3%); and 491, back and neck procedure excluding spinal fusion without complication or comorbidities or MCC (3.1%).
| Overall | Medical | Surgical | ||||||||||
|---|---|---|---|---|---|---|---|---|---|---|---|---|
| Total | 90th | Top Decile | P | Total | 90th | Top Decile | P | Total | 90th | Top Decile | P | |
| ||||||||||||
| Overall | 8,689 | 7,789 (90) | 900 (10) | 5,059 | 4,646 (92) | 413 (8) | 3,630 | 3,143 (87) | 487 (13) | |||
| Age, y | ||||||||||||
| 30 | 419 (5) | 371 (89) | 48 (12) | 0.001 | 218 (4) | 208 (95) | 10 (5) | 0.001 | 201 (6) | 163 (81) | 38 (19) | 0.001 |
| 3049 | 1,029 (12) | 902 (88) | 127 (12) | 533 (11) | 482 (90) | 51 (10) | 496 (14) | 420 (85) | 76 (15) | |||
| 5069 | 3,911 (45) | 3,450 (88) | 461 (12) | 2,136 (42) | 1,930 (90) | 206 (10) | 1,775 (49) | 1,520 (86) | 255 (14) | |||
| >69 | 3,330 (38) | 3,066 (92) | 264 (8) | 2,172 (43) | 2,026 (93) | 146 (7) | 1,158 (32) | 1,040 (90) | 118 (10) | |||
| Gender | ||||||||||||
| Male | 4,640 (53) | 4,142 (89) | 498 (11) | 0.220 | 2,596 (51) | 2,379 (92) | 217 (8) | 0.602 | 2,044 (56) | 1,763 (86) | 281 (14) | 0.506 |
| Female | 4,049 (47) | 3,647 (90) | 402 (10) | 2,463 (49) | 2,267 (92) | 196 (8) | 1,586 (44) | 1,380 (87) | 206 (13) | |||
| ICU encounter | ||||||||||||
| No | 7,122 (82) | 6,441 (90) | 681 (10) | 0.001 | 4,547 (90) | 4,193 (92) | 354 (8) | 0.001 | 2,575 (71) | 2,248 (87) | 327 (13) | 0.048 |
| Yes | 1,567 (18) | 1,348 (86) | 219 (14) | 512 (10) | 453 (89) | 59 (12) | 1,055 (29) | 895 (85) | 160 (15) | |||
| Payer | ||||||||||||
| Public | 5,564 (64) | 5,036 (91) | 528 (10) | 0.001 | 3,424 (68) | 3,161 (92) | 263 (8) | 0.163 | 2,140 (59) | 1,875 (88) | 265 (12) | 0.148 |
| Private | 3,064 (35) | 2,702 (88) | 362 (12) | 1,603 (32) | 1,458 (91) | 145 (9) | 1,461 (40) | 1,244 (85) | 217 (15) | |||
| Charity | 45 (1) | 37 (82) | 8 (18) | 25 (1) | 21 (84) | 4 (16) | 20 (1) | 16 (80) | 4 (20) | |||
| Self | 16 (0) | 14 (88) | 2 (13) | 7 (0) | 6 (86) | 1 (14) | 9 (0) | 8 (89) | 1 (11) | |||
| Length of stay, d | ||||||||||||
| 3 | 3,156 (36) | 2,930 (93) | 226 (7) | 0.001 | 1,961 (39) | 1,865 (95) | 96 (5) | 0.001 | 1,195 (33) | 1,065 (89) | 130 (11) | 0.001 |
| 36 | 3,330 (38) | 2,959 (89) | 371 (11) | 1,867 (37) | 1,702 (91) | 165 (9) | 1,463 (40) | 1,257 (86) | 206 (14) | |||
| >6 | 2,203 (25) | 1,900 (86) | 303 (14) | 1,231 (24) | 1,079 (88) | 152 (12) | 972 (27) | 821 (85) | 151 (16) | |||
| No. of attendings | ||||||||||||
| 4 | 3,959 (46) | 3,615 (91) | 344 (9) | 0.001 | 2,307 (46) | 2,160 (94) | 147 (6) | 0.001 | 1,652 (46) | 1,455 (88) | 197 (12) | 0.052 |
| 46 | 3,067 (35) | 2,711 (88) | 356 (12) | 1,836 (36) | 1,663 (91) | 173 (9) | 1,231 (34) | 1,048 (85) | 183 (15) | |||
| >6 | 1,663 (19) | 1,463 (88) | 200 (12) | 916 (18) | 823 (90) | 93 (10) | 747 (21) | 640 (86) | 107 (14) | |||
| Severity index* | ||||||||||||
| 0 (lowest) | 2,812 (32) | 2,505 (89) | 307 (11) | 0.272 | 1,273 (25) | 1,185 (93) | 88 (7) | 0.045 | 1,539 (42) | 1,320 (86) | 219 (14) | 0.261 |
| 13 | 4,253 (49) | 3,827 (90) | 426 (10) | 2,604 (52) | 2,395 (92) | 209 (8) | 1,649 (45) | 1,432 (87) | 217 (13) | |||
| 46 | 1163 (13) | 1,052 (91) | 111 (10) | 849 (17) | 770 (91) | 79 (9) | 314 (9) | 282 (90) | 32 (10) | |||
| >6 (highest) | 461 (5) | 405 (88) | 56 (12) | 333 (7) | 296 (89) | 37 (11) | 128 (4) | 109 (85) | 19 (15) | |||
| Charges, | ||||||||||||
| Low | 1,820 (21) | 1,707 (94) | 113 (6) | 0.001 | 1,426 (28) | 1,357 (95) | 69 (5) | 0.001 | 394 (11) | 350 (89) | 44 (11) | 0.007 |
| Medium | 5,094 (59) | 4,581 (90) | 513 (10) | 2,807 (56) | 2,582 (92) | 225 (8) | 2,287 (63) | 1,999 (87) | 288 (13) | |||
| High | 1,775 (20) | 1,501 (85) | 274 (15) | 826 (16) | 707 (86) | 119 (14) | 949 (26) | 794 (84) | 155 (16) | |||
Unadjusted analysis of medical and surgical patients identified significant associations of several variables with a top decile RSR (Table 2). Patients with longer lengths of stay (OR: 2.07, 95% CI: 1.72‐2.48), more attendings (OR: 1.44, 95% CI: 1.19‐1.73), and higher hospital charges (OR: 2.76, 95% CI: 2.19‐3.47) were more likely to report an RSR in the top decile. Patients without an ICU encounter (OR: 0.65, 95% CI: 0.55‐0.77) and on a medical service (OR: 0.57, 95% CI: 0.5‐ 0.66) were less likely to report an RSR in the top decile. Several associations were identified in only the medical or surgical cohorts. In the medical cohort, patients with the highest illness severity index (OR: 1.68, 95% CI: 1.12‐ 2.52) and with 7 different attending physicians (OR: 1.66, 95% CI: 1.27‐2.18) were more likely to report RSRs in the top decile. In the surgical cohort, patients 30 years of age (OR: 2.05, 95% CI 1.38‐3.07) were more likely to report an RSR in the top decile than patients >69 years of age. Insurance payer category and gender were not significantly associated with top decile RSRs.
| Overall | Medical | Surgical | ||||
|---|---|---|---|---|---|---|
| Odds Ratio (95% CI) | P | Odds Ratio (95% CI) | P | Odds Ratio (95% CI) | P | |
| ||||||
| Age, y | ||||||
| 30 | 1.5 (1.082.08) | 0.014 | 0.67 (0.351.29) | 0.227 | 2.05 (1.383.07) | 0.001 |
| 3049 | 1.64 (1.312.05) | .001 | 1.47 (1.052.05) | 0.024 | 1.59 (1.172.17) | 0.003 |
| 5069 | 1.55 (1.321.82) | .001 | 1.48 (1.191.85) | 0.001 | 1.48 (1.171.86) | 0.001 |
| >69 | Ref | Ref | Ref | |||
| Gender | ||||||
| Male | 1.09 (0.951.25) | 0.220 | 1.06 (0.861.29) | 0.602 | 1.07 (0.881.3) | 0.506 |
| Female | Ref | Ref | Ref | |||
| ICU encounter | ||||||
| No | 0.65 (0.550.77) | 0.001 | 0.65 (0.480.87) | 0.004 | 0.81 (0.661) | 0.048 |
| Yes | Ref | Ref | Ref | |||
| Payer | ||||||
| Public | 0.73 (0.173.24) | 0.683 | 0.5 (0.064.16) | 0.521 | 1.13 (0.149.08) | 0.908 |
| Private | 0.94 (0.214.14) | 0.933 | 0.6 (0.074.99) | 0.634 | 1.4 (0.1711.21) | 0.754 |
| Charity | 1.51 (0.298.02) | 0.626 | 1.14 (0.1112.25) | 0.912 | 2 (0.1920.97) | 0.563 |
| Self | Ref | Ref | Ref | |||
| Length of stay, d | ||||||
| 3 | Ref | Ref | Ref | |||
| 36 | 1.63 (1.371.93) | 0.001 | 1.88 (1.452.44) | 0.001 | 1.34 (1.061.7) | 0.014 |
| >6 | 2.07 (1.722.48) | 0.001 | 2.74 (2.13.57) | 0.001 | 1.51 (1.171.94) | 0.001 |
| No. of attendings | ||||||
| 4 | Ref | Ref | Ref | |||
| 46 | 1.38 (1.181.61) | 0.001 | 1.53 (1.221.92) | 0.001 | 1.29 (1.041.6) | 0.021 |
| >6 | 1.44 (1.191.73) | 0.001 | 1.66 (1.272.18) | 0.001 | 1.23 (0.961.59) | 0.102 |
| Severity index* | ||||||
| 0 (lowest) | Ref | Ref | Ref | |||
| 13 | 0.91 (0.781.06) | 0.224 | 1.18 (0.911.52) | 0.221 | 0.91 (0.751.12) | 0.380 |
| 46 | 0.86 (0.681.08) | 0.200 | 1.38 (1.011.9) | 0.046 | 0.68 (0.461.01) | 0.058 |
| >6 (highest) | 1.13 (0.831.53) | 0.436 | 1.68 (1.122.52) | 0.012 | 1.05 (0.631.75) | 0.849 |
| Charges | ||||||
| Low | Ref | Ref | Ref | |||
| Medium | 1.69 (1.372.09) | 0.001 | 1.71 (1.32.26) | 0.001 | 1.15 (0.821.61) | 0.428 |
| High | 2.76 (2.193.47) | 0.001 | 3.31 (2.434.51) | 0.001 | 1.55 (1.092.22) | 0.016 |
| Service | ||||||
| Medical | 0.57 (0.50.66) | 0.001 | ||||
| Surgical | Ref | |||||
Multivariable modeling (Table 3) for all patients without an ICU encounter suggested that (1) patients aged 30 years, 30 to 49 years, and 50 to 69 years were more likely to report top decile RSRs when compared to patients 70 years and older (OR: 1.61, 95% CI: 1.09‐2.36; OR: 1.44, 95% CI: 1.08‐1.93; and OR: 1.39, 95% CI: 1.13‐1.71, respectively) and (2), when compared to patients with extreme resource intensity scores, patients with higher resource intensity scores were more likely to report top decile RSRs (moderate [OR: 1.42, 95% CI: 1.11‐1.83], major [OR: 1.56, 95% CI: 1.22‐2.01], and extreme [OR: 2.29, 95% CI: 1.8‐2.92]. These results were relatively consistent within medical and surgical subgroups (Table 3).
| Overall | Medical | Surgical | ||||
|---|---|---|---|---|---|---|
| Odds Ratio (95% CI) | P | Odds Ratio (95% CI) | P | Odds Ratio (95% CI) | P | |
| ||||||
| Age, y | ||||||
| 30 | 1.61 (1.092.36) | 0.016 | 0.82 (0.41.7) | 0.596 | 2.31 (1.393.82) | 0.001 |
| 3049 | 1.44 (1.081.93) | 0.014 | 1.55 (1.032.32) | 0.034 | 1.41 (0.912.17) | 0.120 |
| 5069 | 1.39 (1.131.71) | 0.002 | 1.44 (1.11.88) | 0.008 | 1.39 (11.93) | 0.049 |
| >69 | Ref | Ref | Ref | |||
| Sex | ||||||
| Male | 1 (0.851.17) | 0.964 | 1 (0.81.25) | 0.975 | 0.99 (0.791.26) | 0.965 |
| Female | Ref | Ref | Ref | |||
| Payer | ||||||
| Public | 0.62 (0.142.8) | 0.531 | 0.42 (0.053.67) | 0.432 | 1.03 (0.128.59) | 0.978 |
| Private | 0.67 (0.153.02) | 0.599 | 0.42 (0.053.67) | 0.434 | 1.17 (0.149.69) | 0.884 |
| Charity | 1.54 (0.288.41) | 0.620 | 1 (0.0911.13) | 0.999 | 2.56 (0.2328.25) | 0.444 |
| Self | Ref | Ref | Ref | |||
| Severity index | ||||||
| 0 (lowest) | Ref | Ref | Ref | |||
| 13 | 1.07 (0.891.29) | 0.485 | 1.18 (0.881.58) | 0.267 | 1 (0.781.29) | 0.986 |
| 46 | 1.14 (0.861.51) | 0.377 | 1.42 (0.992.04) | 0.056 | 0.6 (0.331.1) | 0.100 |
| >6 (highest) | 1.31 (0.911.9) | 0.150 | 1.47 (0.932.33) | 0.097 | 1.1 (0.542.21) | 0.795 |
| Resource intensity score | ||||||
| Low | Ref | Ref | Ref | |||
| Moderate | 1.42 (1.111.83) | 0.006 | 1.6 (1.112.3) | 0.011 | 0.94 (0.661.34) | 0.722 |
| Major | 1.56 (1.222.01) | 0.001 | 1.69 (1.182.43) | 0.004 | 1.28 (0.911.8) | 0.151 |
| Extreme | 2.29 (1.82.92) | 0.001 | 2.72 (1.943.82) | 0.001 | 1.63 (1.172.26) | 0.004 |
| Service | ||||||
| Medical | 0.59 (0.50.69) | 0.001 | ||||
| Surgical | Ref | |||||
In those with at least 1 ICU attending encounter (see Supporting Table 1 in the online version of this article), no variables demonstrated significant association with top decile RSRs in the overall group or in the medical subgroup. For surgical patients with at least 1 ICU attending encounter (see Supporting Table 1 in the online version of this article), patients aged 30 to 49 and 50 to 69 years were more likely to provide top decile RSRs (OR: 1.93, 95% CI: 1.08‐3.46 and OR: 1.65, 95% CI 1.07‐2.53, respectively). Resource intensity was not significantly associated with top decile RSRs.
DISCUSSION
Our analysis suggests that, for patients on the general care floors, resource utilization is associated with the RSR and, therefore, potentially the CMS Summary Star Rating. Adjusting for severity of illness, patients with higher resource utilization were more likely to report top decile RSRs.
Prior data regarding utilization and satisfaction are mixed. In a 2‐year, prospective, national examination, patients in the highest quartile of patient satisfaction had increased healthcare and prescription drug expenditures as well as increased rates of hospitalization when compared with patients in the lowest quartile of patient satisfaction.[9] However, a recent national study of surgical administrative databases suggested hospitals with high patient satisfaction provided more efficient care.[13]
One reason for the conflicting data may be that large, national evaluations are unable to control for between‐hospital confounders (ie, hospital quality of care). By capturing all eligible returned surveys at 1 institution, our design allowed us to collect granular data. We found that in 1 hospital setting, patient population, facilities, and food services, patients receiving more clinical resources generally assigned higher ratings than patients receiving less.
It is possible that utilization is a proxy for serious illness, and that patients with serious illness receive more attention during hospitalization and are more satisfied when discharged in a good state of health. However, we did adjust for severity of illness in our model using the Charlson‐Deyo index and we suggest that, other factors being equal, hospitals with higher per‐patient expenditures may be assigned higher Summary Star Ratings.
CMS has recently implemented a number of metrics designed to decrease healthcare costs by improving quality, safety, and efficiency. Concurrently, CMS has also prioritized patient experience. The Summary Star Rating was created to provide healthcare consumers with an easy way to compare the patient experience between hospitals[4]; however, our data suggest that this metric may be at odds with inpatient cost savings and efficiency metrics.
Per‐patient spending becomes particularly salient when considering that in fiscal year 2016, CMS' hospital VBP reimbursement will include 2 metrics: an efficiency outcome measure labeled Medicare spending per beneficiary, and a patient experience outcome measure based on HCAHPS survey dimensions.[2] Together, these 2 metrics will comprise nearly half of the total VBP performance score used to determine reimbursement. Although our data suggest that these 2 VBP metrics may be correlated, it should be noted that we measured inpatient hospital charges, whereas the CMS efficiency outcome measure includes costs for episode of care spanning 3 days prior to hospitalization to 30 days after hospitalization.
Patient expectations likely play a role in satisfaction.[14, 15, 16] In an outpatient setting, physician fulfillment of patient requests has been associated with positive patient evaluations of care.[17] However, patients appear to value education, shared decision making, and provider empathy more than testing and intervention.[14, 18, 19, 20, 21, 22, 23] Perhaps, in the absence of the former attributes, patients use additional resource expenditure as a proxy.
It is not clear that higher resource expenditure improves outcomes. A landmark study of nearly 1 million Medicare enrollees by Fisher et al. suggests that, although Medicare patients in higher‐spending regions receive more care than those in lower‐spending regions, this does not result in better health outcomes, specifically with regard to mortality.[24, 25] Patients who live in areas of high hospital capacity use the hospital more frequently than do patients in areas of low hospital capacity, but this does not appear to result in improved mortality rates.[26] In fact, physicians in areas of high healthcare capacity report more difficulty maintaining high‐quality patient relationships and feel less able to provide high‐quality care than physicians in lower‐capacity areas.[27]
We hypothesize the cause of the association between resource utilization and patient satisfaction could be that patients (1) perceive that a doctor who allows them to stay longer in the hospital or who performs additional testing cares more about their well‐being and (2) that these patients feel more strongly that their concerns are being heard and addressed by their physicians. A systematic review of primary care patients identified many studies that found a positive association between meeting patient expectations and satisfaction with care, but also suggested that although patients frequently expect information, physicians misperceive this as an expectation of specific action.[28] A separate systematic review found that patient education in the form of decision aides can help patients develop more reasonable expectations and reduce utilization of certain discretionary procedures such as elective surgeries and prostate‐specific antigen testing.[29]
We did not specifically address clinical outcomes in our analysis because the clinical outcomes on which CMS currently adjusts VBP reimbursement focus on 30‐day mortality for specific diagnoses, nosocomial infections, and iatrogenic events.[30] Our data include only returned surveys from living patients, and it is likely that 30‐day mortality was similar throughout all subsets of patients. Additionally, the nosocomial and iatrogenic outcome measures used by CMS are sufficiently rare on the general floors and are unlikely to have significantly influenced our results.[31]
Our study has several strengths. Nearly all medical and surgical patient surveys returned during the study period were included, and therefore our calculations are likely to accurately reflect the Summary Star Rating that would have been assigned for the period. Second, the large sample size helps attenuate potential differences in commonly used outcome metrics. Third, by adjusting for a variety of demographic and clinical variables, we were able to decrease the likelihood of unidentified confounders.
Notably, we identified 38 (0.4%) surveys returned for patients under 18 years of age at admission. These surveys were included in our analysis because, to the best of our knowledge, they would have existed in the pool of surveys CMS could have used to assign a Summary Star Rating.
Our study also has limitations. First, geographically diverse data are needed to ensure generalizability. Second, we used the Charlson‐Deyo Comorbidity Index to describe the degree of illness for each patient. This index represents a patient's total illness burden but may not describe the relative severity of the patient's current illness relative to another patient. Third, we selected variables we felt were most likely to be associated with patient experience, but unidentified confounding remains possible. Fourth, attendings caring for ICU patients fall within the Division of Critical Care/Pulmonary Medicine. Therefore, we may have inadvertently placed patients into the ICU cohort who received a pulmonary/critical care consult on the general floors. Fifth, our data describe associations only for patients who returned surveys. Although there may be inherent biases in patients who return surveys, HCAHPS survey responses are used by CMS to determine a hospital's overall satisfaction score.
CONCLUSION
For patients who return HCAHPS surveys, resource utilization may be positively associated with a hospital's Summary Star Rating. These data suggest that hospitals with higher per‐patient expenditures may receive higher Summary Star Ratings, which could result in hospitals with higher per‐patient resource utilization appearing more attractive to healthcare consumers. Future studies should attempt to confirm our findings at other institutions and to determine causative factors.
Acknowledgements
The authors thank Jason Machan, PhD (Department of Orthopedics and Surgery, Warren Alpert Medical School, Brown University, Providence, Rhode Island) for his help with study design, and Ms. Brenda Foster (data analyst, University of Rochester Medical Center, Rochester, NY) for her help with data collection.
Disclosures: Nothing to report.
- , , . Redesigning physician compensation and improving ED performance. Healthc Financ Manage. 2011;65(6):114–117.
- QualityNet. Available at: https://www.qualitynet.org/dcs/ContentServer?c=Page97(13):1041–1048.
- , , , . Factors determining inpatient satisfaction with care. Soc Sci Med. 2002;54(4):493–504.
- , , , , . Patient satisfaction revisited: a multilevel approach. Soc Sci Med. 2009;69(1):68–75.
- , , , et al. Predictors of patient satisfaction with hospital health care. BMC Health Serv Res. 2006;6:102.
- , , , . The cost of satisfaction: a national study of patient satisfaction, health care utilization, expenditures, and mortality. Arch Intern Med. 2012;172(5):405–411.
- , , , , . Relationship between patient satisfaction with inpatient care and hospital readmission within 30 days. Am J Manag Care. 2011;17(1):41–48.
- Becker's Infection Control and Clinical Quality. Star Ratings go live on Hospital Compare: how many hospitals got 5 stars? Available at: http://www.beckershospitalreview.com/quality/star‐ratings‐go‐live‐on‐hospital‐compare‐how‐many‐hospitals‐got‐5‐stars.html. Published April 16, 2015. Accessed October 5, 2015.
- , , . Adapting a clinical comorbidity index for use with ICD‐9‐CM administrative databases. J Clin Epidemiol. 1992;45(6):613–619.
- , , . Patient satisfaction and quality of surgical care in US hospitals. Ann Surg. 2015;261(1):2–8.
- , , , , . Should health care providers be accountable for patients' care experiences? J Gen Intern Med. 2015;30(2):253–256.
- , , , , . Unmet expectations for care and the patient‐physician relationship. J Gen Intern Med. 2002;17(11):817–824.
- , , , et al. Do unmet expectations for specific tests, referrals, and new medications reduce patients' satisfaction? J Gen Intern Med. 2004;19(11):1080–1087.
- , , , , , . Request fulfillment in office practice: antecedents and relationship to outcomes. Med Care. 2002;40(1):38–51.
- , , , et al. Factors associated with patient satisfaction with care among dermatological outpatients. Br J Dermatol. 2001;145(4):617–623.
- , , , . Patient expectations of emergency department care: phase II—a cross‐sectional survey. CJEM. 2006;8(3):148–157.
- , , , , . Patients' perspectives on ideal physician behaviors. Mayo Clin Proc. 2006;81(3):338–344.
- , . What do people want from their health care? A qualitative study. J Participat Med. 2015;18:e10.
- , , . Evaluations of care by adults following a denial of an advertisement‐related prescription drug request: the role of expectations, symptom severity, and physician communication style. Soc Sci Med. 2006;62(4):888–899.
- , , , , , . Getting to “no”: strategies primary care physicians use to deny patient requests. Arch Intern Med. 2010;170(4):381–388.
- , , , , , . The implications of regional variations in Medicare spending. Part 1: the content, quality, and accessibility of care. Ann Intern Med. 2003;138(4):273–287.
- , , , , , . The implications of regional variations in Medicare spending. Part 2: health outcomes and satisfaction with care. Ann Intern Med. 2003;138(4):288–298.
- , , , et al. Associations among hospital capacity, utilization, and mortality of US Medicare beneficiaries, controlling for sociodemographic factors. Health Serv Res. 2000;34(6):1351–1362.
- , , , . Regional variations in health care intensity and physician perceptions of quality of care. Ann Intern Med. 2006;144(9):641–649.
- , , . Visit‐specific expectations and patient‐centered outcomes: a literature review. Arch Fam Med. 2000;9(10):1148–1155.
- , , , et al. Decision aids for people facing health treatment or screening decisions. Cochrane Database Syst Rev. 2014;1:CD001431.
- Centers for Medicare and Medicaid Services. Hospital Compare. Outcome domain. Available at: https://www.medicare.gov/hospitalcompare/data/outcome‐domain.html. Accessed October 5, 2015.
- Centers for Disease Control and Prevention. 2013 national and state healthcare‐associated infections progress report. Available at: www.cdc.gov/hai/progress‐report/index.html. Accessed October 5, 2015.
The patient experience has become increasingly important to healthcare in the United States. It is now a metric used commonly to determine physician compensation and accounts for nearly 30% of the Centers for Medicare and Medicaid Services' (CMS) Value‐Based Purchasing (VBP) reimbursement for fiscal years 2015 and 2016.[1, 2]
In April 2015, CMS added a 5‐star patient experience score to its Hospital Compare website in an attempt to address the Affordable Care Act's call for transparent and easily understandable public reporting.[3] A hospital's principal score is the Summary Star Rating, which is based on responses to the Hospital Consumer Assessment of Healthcare Providers and Systems (HCAHPS) survey. The formulas used to calculate Summary Star Ratings have been reported by CMS.[4]
Studies published over the past decade suggest that gender, age, education level, length of hospital stay, travel distance, and other factors may influence patient satisfaction.[5, 6, 7, 8] One study utilizing a national dataset suggested that higher patient satisfaction was associated with greater inpatient healthcare utilization and higher healthcare expenditures.[9] It is therefore possible that emphasizing patient experience scores could adversely impact healthcare resource utilization. However, positive patient experience may also be an important independent dimension of quality for patients and correlate with improved clinical outcomes.[10]
We know of no literature describing patient factors associated with the Summary Star Rating. Given that this rating is now used as a standard metric by which patient experience can be compared across more than 3,500 hospitals,[11] data describing the association between patient‐level factors and the Summary Star Rating may provide hospitals with an opportunity to target improvement efforts. We aimed to determine the degree to which resource utilization is associated with a satisfaction score based on the Summary Star Rating methodology.
METHODS
The study was conducted at the University of Rochester Medical Center (URMC), an 830‐bed tertiary care center in upstate New York. This was a retrospective review of all HCAHPS surveys returned to URMC over a 27‐month period from January 1, 2012 to April 1, 2014. URMC follows the standard CMS process for determining which patients receive surveys as follows. During the study timeframe, HCAHPS surveys were mailed to patients 18 years of age and older who had an inpatient stay spanning at least 1 midnight. Surveys were mailed within 5 days of discharge, and were generally returned within 6 weeks. URMC did not utilize telephone or email surveys during the study period. Surveys were not sent to patients who (1) were transferred to another facility, (2) were discharged to hospice, (3) died during the hospitalization, (4) received psychiatric or rehabilitative services during the hospitalization, (5) had an international address, and/or (6) were prisoners.
The survey vendor (Press Ganey, South Bend, IN) for URMC provided raw data for returned surveys with patient answers to questions. Administrative and billing databases were used to add demographic and clinical data for the corresponding hospitalization to the dataset. These data included age, gender, payer status (public, private, self, charity), length of stay, number of attendings who saw the patient (based on encounters documented in the electronic medical record (EMR)), all discharge International Classification of Diseases, 9th Revision (ICD‐9) diagnoses for the hospitalization, total charges for the hospitalization, and intensive care unit (ICU) utilization as evidenced by a documented encounter with a member of the Division of Critical Care/Pulmonary Medicine.
CMS analyzes surveys within 1 of 3 clinical service categories (medical, surgical, or obstetrics/gynecology) based on the discharging service. To parallel this approach, each returned survey was placed into 1 of these categories based on the clinical service of the discharging physician. Patients placed in the obstetrics/gynecology category (n = 1317, 13%) will be analyzed in a future analysis given inherent differences in patient characteristics that require evaluation of other variables.
Approximations of CMS Summary Star Rating
The HCAHPS survey is a multiple‐choice questionnaire that includes several domains of patient satisfaction. Respondents are asked to rate areas of satisfaction with their hospital experience on a Likert scale. CMS uses a weighted average of Likert responses to a subset of HCAHPS questions to calculate a hospital's raw score in 11 domains, as well as an overall raw summary score. CMS then adjusts each raw score for differences between hospitals (eg, clustering, improvement over time, method of survey) to determine a hospital's star rating in each domain and an overall Summary Star Rating (the Summary Star Rating is the primary factor by which consumers can compare hospitals).[4] Because our data were from a single hospital system, the between‐hospital scoring adjustments utilized by CMS were not applicable. Instead, we calculated the raw scores exactly as CMS does prior to the adjustments. Thus, our scores reflect the scores that CMS would have given URMC during the study period prior to standardized adjustments; we refer to this as the raw satisfaction rating (RSR). We calculated an RSR for every eligible survey. The RSR was calculated as a continuous variable from 0 (lowest) to 1 (highest). Detailed explanation of our RSR calculation is available in the Supporting Information in the online version of this article.
Statistical Analysis
All analyses were performed in aggregate and by service (medical vs surgical). Categorical variables were summarized using frequencies with percentages. Comparisons across levels of categorical variables were performed with the 2 test. We report bivariate associations between the independent variables and RSRs in the top decile using unadjusted odds ratios (ORs) with 95% confidence intervals (CIs). Similarly, multivariable logistic regression was used for adjusted analyses. For the variables of severity of illness and resource intensity, the group with the lowest illness severity and lowest resource use served as the reference groups. We modeled patients without an ICU encounter and with an ICU encounter separately.
Charges, number of unique attendings encountered, and lengths of stay were highly correlated, and likely various measures of the same underlying construct of resource intensity, and therefore could not be entered into our models simultaneously. We combined these into a resource intensity score using factor analysis with a varimax rotation, and extracted factor scores for a single factor (supported by a scree plot). We then placed patients into 4 groups based on the distribution of the factor scores: low (25th percentile), moderate (25th50th percentile), major (50th75th percentile), and extreme (>75th percentile).
We used the Charlson‐Deyo comorbidity score as our disease severity index.[12] The index uses ICD‐9 diagnoses with points assigned for the impact of each diagnosis on morbidity and the points summed to an overall score. This provides a measure of disease severity for a patient based on the number of diagnoses and relative mortality of the individual diagnoses. Scores were categorized as 0 (representing no major illness burden), 1 to 3, 4 to 6, and >6.
All statistical analyses were performed using SAS version 9.4 (SAS Institute, Cary, NC), and P values 0.05 were considered statistically significant. This study was approved by the institutional review board at the University of Rochester Medical Center.
RESULTS
Our initial search identified 10,007 returned surveys (29% of eligible patients returned surveys during the study period). Of these, 5059 (51%) were categorized as medical, 3630 (36%) as surgical, and 1317 (13%) as obstetrics/gynecology. One survey did not have the service of the discharging physician recorded and was excluded. Cohort demographics and relationship to RSRs in the top decile for the 8689 medical and surgical patients can be found in Table 1. The most common discharge diagnosis‐related groups (DRGs) for medical patients were 247, percutaneous cardiovascular procedure with drug‐eluding stent without major complications or comorbidities (MCC) (3.8%); 871, septicemia or severe sepsis without mechanical ventilation >96 hours with MCC (2.7%); and 392, esophagitis, gastroenteritis, and miscellaneous digestive disorders with MCC (2.3%). The most common DRGs for surgical patients were 460, spinal fusion except cervical without MCC (3.5%); 328, stomach, esophageal and duodenal procedure without complication or comorbidities or MCC (3.3%); and 491, back and neck procedure excluding spinal fusion without complication or comorbidities or MCC (3.1%).
| Overall | Medical | Surgical | ||||||||||
|---|---|---|---|---|---|---|---|---|---|---|---|---|
| Total | 90th | Top Decile | P | Total | 90th | Top Decile | P | Total | 90th | Top Decile | P | |
| ||||||||||||
| Overall | 8,689 | 7,789 (90) | 900 (10) | 5,059 | 4,646 (92) | 413 (8) | 3,630 | 3,143 (87) | 487 (13) | |||
| Age, y | ||||||||||||
| 30 | 419 (5) | 371 (89) | 48 (12) | 0.001 | 218 (4) | 208 (95) | 10 (5) | 0.001 | 201 (6) | 163 (81) | 38 (19) | 0.001 |
| 3049 | 1,029 (12) | 902 (88) | 127 (12) | 533 (11) | 482 (90) | 51 (10) | 496 (14) | 420 (85) | 76 (15) | |||
| 5069 | 3,911 (45) | 3,450 (88) | 461 (12) | 2,136 (42) | 1,930 (90) | 206 (10) | 1,775 (49) | 1,520 (86) | 255 (14) | |||
| >69 | 3,330 (38) | 3,066 (92) | 264 (8) | 2,172 (43) | 2,026 (93) | 146 (7) | 1,158 (32) | 1,040 (90) | 118 (10) | |||
| Gender | ||||||||||||
| Male | 4,640 (53) | 4,142 (89) | 498 (11) | 0.220 | 2,596 (51) | 2,379 (92) | 217 (8) | 0.602 | 2,044 (56) | 1,763 (86) | 281 (14) | 0.506 |
| Female | 4,049 (47) | 3,647 (90) | 402 (10) | 2,463 (49) | 2,267 (92) | 196 (8) | 1,586 (44) | 1,380 (87) | 206 (13) | |||
| ICU encounter | ||||||||||||
| No | 7,122 (82) | 6,441 (90) | 681 (10) | 0.001 | 4,547 (90) | 4,193 (92) | 354 (8) | 0.001 | 2,575 (71) | 2,248 (87) | 327 (13) | 0.048 |
| Yes | 1,567 (18) | 1,348 (86) | 219 (14) | 512 (10) | 453 (89) | 59 (12) | 1,055 (29) | 895 (85) | 160 (15) | |||
| Payer | ||||||||||||
| Public | 5,564 (64) | 5,036 (91) | 528 (10) | 0.001 | 3,424 (68) | 3,161 (92) | 263 (8) | 0.163 | 2,140 (59) | 1,875 (88) | 265 (12) | 0.148 |
| Private | 3,064 (35) | 2,702 (88) | 362 (12) | 1,603 (32) | 1,458 (91) | 145 (9) | 1,461 (40) | 1,244 (85) | 217 (15) | |||
| Charity | 45 (1) | 37 (82) | 8 (18) | 25 (1) | 21 (84) | 4 (16) | 20 (1) | 16 (80) | 4 (20) | |||
| Self | 16 (0) | 14 (88) | 2 (13) | 7 (0) | 6 (86) | 1 (14) | 9 (0) | 8 (89) | 1 (11) | |||
| Length of stay, d | ||||||||||||
| 3 | 3,156 (36) | 2,930 (93) | 226 (7) | 0.001 | 1,961 (39) | 1,865 (95) | 96 (5) | 0.001 | 1,195 (33) | 1,065 (89) | 130 (11) | 0.001 |
| 36 | 3,330 (38) | 2,959 (89) | 371 (11) | 1,867 (37) | 1,702 (91) | 165 (9) | 1,463 (40) | 1,257 (86) | 206 (14) | |||
| >6 | 2,203 (25) | 1,900 (86) | 303 (14) | 1,231 (24) | 1,079 (88) | 152 (12) | 972 (27) | 821 (85) | 151 (16) | |||
| No. of attendings | ||||||||||||
| 4 | 3,959 (46) | 3,615 (91) | 344 (9) | 0.001 | 2,307 (46) | 2,160 (94) | 147 (6) | 0.001 | 1,652 (46) | 1,455 (88) | 197 (12) | 0.052 |
| 46 | 3,067 (35) | 2,711 (88) | 356 (12) | 1,836 (36) | 1,663 (91) | 173 (9) | 1,231 (34) | 1,048 (85) | 183 (15) | |||
| >6 | 1,663 (19) | 1,463 (88) | 200 (12) | 916 (18) | 823 (90) | 93 (10) | 747 (21) | 640 (86) | 107 (14) | |||
| Severity index* | ||||||||||||
| 0 (lowest) | 2,812 (32) | 2,505 (89) | 307 (11) | 0.272 | 1,273 (25) | 1,185 (93) | 88 (7) | 0.045 | 1,539 (42) | 1,320 (86) | 219 (14) | 0.261 |
| 13 | 4,253 (49) | 3,827 (90) | 426 (10) | 2,604 (52) | 2,395 (92) | 209 (8) | 1,649 (45) | 1,432 (87) | 217 (13) | |||
| 46 | 1163 (13) | 1,052 (91) | 111 (10) | 849 (17) | 770 (91) | 79 (9) | 314 (9) | 282 (90) | 32 (10) | |||
| >6 (highest) | 461 (5) | 405 (88) | 56 (12) | 333 (7) | 296 (89) | 37 (11) | 128 (4) | 109 (85) | 19 (15) | |||
| Charges, | ||||||||||||
| Low | 1,820 (21) | 1,707 (94) | 113 (6) | 0.001 | 1,426 (28) | 1,357 (95) | 69 (5) | 0.001 | 394 (11) | 350 (89) | 44 (11) | 0.007 |
| Medium | 5,094 (59) | 4,581 (90) | 513 (10) | 2,807 (56) | 2,582 (92) | 225 (8) | 2,287 (63) | 1,999 (87) | 288 (13) | |||
| High | 1,775 (20) | 1,501 (85) | 274 (15) | 826 (16) | 707 (86) | 119 (14) | 949 (26) | 794 (84) | 155 (16) | |||
Unadjusted analysis of medical and surgical patients identified significant associations of several variables with a top decile RSR (Table 2). Patients with longer lengths of stay (OR: 2.07, 95% CI: 1.72‐2.48), more attendings (OR: 1.44, 95% CI: 1.19‐1.73), and higher hospital charges (OR: 2.76, 95% CI: 2.19‐3.47) were more likely to report an RSR in the top decile. Patients without an ICU encounter (OR: 0.65, 95% CI: 0.55‐0.77) and on a medical service (OR: 0.57, 95% CI: 0.5‐ 0.66) were less likely to report an RSR in the top decile. Several associations were identified in only the medical or surgical cohorts. In the medical cohort, patients with the highest illness severity index (OR: 1.68, 95% CI: 1.12‐ 2.52) and with 7 different attending physicians (OR: 1.66, 95% CI: 1.27‐2.18) were more likely to report RSRs in the top decile. In the surgical cohort, patients 30 years of age (OR: 2.05, 95% CI 1.38‐3.07) were more likely to report an RSR in the top decile than patients >69 years of age. Insurance payer category and gender were not significantly associated with top decile RSRs.
| Overall | Medical | Surgical | ||||
|---|---|---|---|---|---|---|
| Odds Ratio (95% CI) | P | Odds Ratio (95% CI) | P | Odds Ratio (95% CI) | P | |
| ||||||
| Age, y | ||||||
| 30 | 1.5 (1.082.08) | 0.014 | 0.67 (0.351.29) | 0.227 | 2.05 (1.383.07) | 0.001 |
| 3049 | 1.64 (1.312.05) | .001 | 1.47 (1.052.05) | 0.024 | 1.59 (1.172.17) | 0.003 |
| 5069 | 1.55 (1.321.82) | .001 | 1.48 (1.191.85) | 0.001 | 1.48 (1.171.86) | 0.001 |
| >69 | Ref | Ref | Ref | |||
| Gender | ||||||
| Male | 1.09 (0.951.25) | 0.220 | 1.06 (0.861.29) | 0.602 | 1.07 (0.881.3) | 0.506 |
| Female | Ref | Ref | Ref | |||
| ICU encounter | ||||||
| No | 0.65 (0.550.77) | 0.001 | 0.65 (0.480.87) | 0.004 | 0.81 (0.661) | 0.048 |
| Yes | Ref | Ref | Ref | |||
| Payer | ||||||
| Public | 0.73 (0.173.24) | 0.683 | 0.5 (0.064.16) | 0.521 | 1.13 (0.149.08) | 0.908 |
| Private | 0.94 (0.214.14) | 0.933 | 0.6 (0.074.99) | 0.634 | 1.4 (0.1711.21) | 0.754 |
| Charity | 1.51 (0.298.02) | 0.626 | 1.14 (0.1112.25) | 0.912 | 2 (0.1920.97) | 0.563 |
| Self | Ref | Ref | Ref | |||
| Length of stay, d | ||||||
| 3 | Ref | Ref | Ref | |||
| 36 | 1.63 (1.371.93) | 0.001 | 1.88 (1.452.44) | 0.001 | 1.34 (1.061.7) | 0.014 |
| >6 | 2.07 (1.722.48) | 0.001 | 2.74 (2.13.57) | 0.001 | 1.51 (1.171.94) | 0.001 |
| No. of attendings | ||||||
| 4 | Ref | Ref | Ref | |||
| 46 | 1.38 (1.181.61) | 0.001 | 1.53 (1.221.92) | 0.001 | 1.29 (1.041.6) | 0.021 |
| >6 | 1.44 (1.191.73) | 0.001 | 1.66 (1.272.18) | 0.001 | 1.23 (0.961.59) | 0.102 |
| Severity index* | ||||||
| 0 (lowest) | Ref | Ref | Ref | |||
| 13 | 0.91 (0.781.06) | 0.224 | 1.18 (0.911.52) | 0.221 | 0.91 (0.751.12) | 0.380 |
| 46 | 0.86 (0.681.08) | 0.200 | 1.38 (1.011.9) | 0.046 | 0.68 (0.461.01) | 0.058 |
| >6 (highest) | 1.13 (0.831.53) | 0.436 | 1.68 (1.122.52) | 0.012 | 1.05 (0.631.75) | 0.849 |
| Charges | ||||||
| Low | Ref | Ref | Ref | |||
| Medium | 1.69 (1.372.09) | 0.001 | 1.71 (1.32.26) | 0.001 | 1.15 (0.821.61) | 0.428 |
| High | 2.76 (2.193.47) | 0.001 | 3.31 (2.434.51) | 0.001 | 1.55 (1.092.22) | 0.016 |
| Service | ||||||
| Medical | 0.57 (0.50.66) | 0.001 | ||||
| Surgical | Ref | |||||
Multivariable modeling (Table 3) for all patients without an ICU encounter suggested that (1) patients aged 30 years, 30 to 49 years, and 50 to 69 years were more likely to report top decile RSRs when compared to patients 70 years and older (OR: 1.61, 95% CI: 1.09‐2.36; OR: 1.44, 95% CI: 1.08‐1.93; and OR: 1.39, 95% CI: 1.13‐1.71, respectively) and (2), when compared to patients with extreme resource intensity scores, patients with higher resource intensity scores were more likely to report top decile RSRs (moderate [OR: 1.42, 95% CI: 1.11‐1.83], major [OR: 1.56, 95% CI: 1.22‐2.01], and extreme [OR: 2.29, 95% CI: 1.8‐2.92]. These results were relatively consistent within medical and surgical subgroups (Table 3).
| Overall | Medical | Surgical | ||||
|---|---|---|---|---|---|---|
| Odds Ratio (95% CI) | P | Odds Ratio (95% CI) | P | Odds Ratio (95% CI) | P | |
| ||||||
| Age, y | ||||||
| 30 | 1.61 (1.092.36) | 0.016 | 0.82 (0.41.7) | 0.596 | 2.31 (1.393.82) | 0.001 |
| 3049 | 1.44 (1.081.93) | 0.014 | 1.55 (1.032.32) | 0.034 | 1.41 (0.912.17) | 0.120 |
| 5069 | 1.39 (1.131.71) | 0.002 | 1.44 (1.11.88) | 0.008 | 1.39 (11.93) | 0.049 |
| >69 | Ref | Ref | Ref | |||
| Sex | ||||||
| Male | 1 (0.851.17) | 0.964 | 1 (0.81.25) | 0.975 | 0.99 (0.791.26) | 0.965 |
| Female | Ref | Ref | Ref | |||
| Payer | ||||||
| Public | 0.62 (0.142.8) | 0.531 | 0.42 (0.053.67) | 0.432 | 1.03 (0.128.59) | 0.978 |
| Private | 0.67 (0.153.02) | 0.599 | 0.42 (0.053.67) | 0.434 | 1.17 (0.149.69) | 0.884 |
| Charity | 1.54 (0.288.41) | 0.620 | 1 (0.0911.13) | 0.999 | 2.56 (0.2328.25) | 0.444 |
| Self | Ref | Ref | Ref | |||
| Severity index | ||||||
| 0 (lowest) | Ref | Ref | Ref | |||
| 13 | 1.07 (0.891.29) | 0.485 | 1.18 (0.881.58) | 0.267 | 1 (0.781.29) | 0.986 |
| 46 | 1.14 (0.861.51) | 0.377 | 1.42 (0.992.04) | 0.056 | 0.6 (0.331.1) | 0.100 |
| >6 (highest) | 1.31 (0.911.9) | 0.150 | 1.47 (0.932.33) | 0.097 | 1.1 (0.542.21) | 0.795 |
| Resource intensity score | ||||||
| Low | Ref | Ref | Ref | |||
| Moderate | 1.42 (1.111.83) | 0.006 | 1.6 (1.112.3) | 0.011 | 0.94 (0.661.34) | 0.722 |
| Major | 1.56 (1.222.01) | 0.001 | 1.69 (1.182.43) | 0.004 | 1.28 (0.911.8) | 0.151 |
| Extreme | 2.29 (1.82.92) | 0.001 | 2.72 (1.943.82) | 0.001 | 1.63 (1.172.26) | 0.004 |
| Service | ||||||
| Medical | 0.59 (0.50.69) | 0.001 | ||||
| Surgical | Ref | |||||
In those with at least 1 ICU attending encounter (see Supporting Table 1 in the online version of this article), no variables demonstrated significant association with top decile RSRs in the overall group or in the medical subgroup. For surgical patients with at least 1 ICU attending encounter (see Supporting Table 1 in the online version of this article), patients aged 30 to 49 and 50 to 69 years were more likely to provide top decile RSRs (OR: 1.93, 95% CI: 1.08‐3.46 and OR: 1.65, 95% CI 1.07‐2.53, respectively). Resource intensity was not significantly associated with top decile RSRs.
DISCUSSION
Our analysis suggests that, for patients on the general care floors, resource utilization is associated with the RSR and, therefore, potentially the CMS Summary Star Rating. Adjusting for severity of illness, patients with higher resource utilization were more likely to report top decile RSRs.
Prior data regarding utilization and satisfaction are mixed. In a 2‐year, prospective, national examination, patients in the highest quartile of patient satisfaction had increased healthcare and prescription drug expenditures as well as increased rates of hospitalization when compared with patients in the lowest quartile of patient satisfaction.[9] However, a recent national study of surgical administrative databases suggested hospitals with high patient satisfaction provided more efficient care.[13]
One reason for the conflicting data may be that large, national evaluations are unable to control for between‐hospital confounders (ie, hospital quality of care). By capturing all eligible returned surveys at 1 institution, our design allowed us to collect granular data. We found that in 1 hospital setting, patient population, facilities, and food services, patients receiving more clinical resources generally assigned higher ratings than patients receiving less.
It is possible that utilization is a proxy for serious illness, and that patients with serious illness receive more attention during hospitalization and are more satisfied when discharged in a good state of health. However, we did adjust for severity of illness in our model using the Charlson‐Deyo index and we suggest that, other factors being equal, hospitals with higher per‐patient expenditures may be assigned higher Summary Star Ratings.
CMS has recently implemented a number of metrics designed to decrease healthcare costs by improving quality, safety, and efficiency. Concurrently, CMS has also prioritized patient experience. The Summary Star Rating was created to provide healthcare consumers with an easy way to compare the patient experience between hospitals[4]; however, our data suggest that this metric may be at odds with inpatient cost savings and efficiency metrics.
Per‐patient spending becomes particularly salient when considering that in fiscal year 2016, CMS' hospital VBP reimbursement will include 2 metrics: an efficiency outcome measure labeled Medicare spending per beneficiary, and a patient experience outcome measure based on HCAHPS survey dimensions.[2] Together, these 2 metrics will comprise nearly half of the total VBP performance score used to determine reimbursement. Although our data suggest that these 2 VBP metrics may be correlated, it should be noted that we measured inpatient hospital charges, whereas the CMS efficiency outcome measure includes costs for episode of care spanning 3 days prior to hospitalization to 30 days after hospitalization.
Patient expectations likely play a role in satisfaction.[14, 15, 16] In an outpatient setting, physician fulfillment of patient requests has been associated with positive patient evaluations of care.[17] However, patients appear to value education, shared decision making, and provider empathy more than testing and intervention.[14, 18, 19, 20, 21, 22, 23] Perhaps, in the absence of the former attributes, patients use additional resource expenditure as a proxy.
It is not clear that higher resource expenditure improves outcomes. A landmark study of nearly 1 million Medicare enrollees by Fisher et al. suggests that, although Medicare patients in higher‐spending regions receive more care than those in lower‐spending regions, this does not result in better health outcomes, specifically with regard to mortality.[24, 25] Patients who live in areas of high hospital capacity use the hospital more frequently than do patients in areas of low hospital capacity, but this does not appear to result in improved mortality rates.[26] In fact, physicians in areas of high healthcare capacity report more difficulty maintaining high‐quality patient relationships and feel less able to provide high‐quality care than physicians in lower‐capacity areas.[27]
We hypothesize the cause of the association between resource utilization and patient satisfaction could be that patients (1) perceive that a doctor who allows them to stay longer in the hospital or who performs additional testing cares more about their well‐being and (2) that these patients feel more strongly that their concerns are being heard and addressed by their physicians. A systematic review of primary care patients identified many studies that found a positive association between meeting patient expectations and satisfaction with care, but also suggested that although patients frequently expect information, physicians misperceive this as an expectation of specific action.[28] A separate systematic review found that patient education in the form of decision aides can help patients develop more reasonable expectations and reduce utilization of certain discretionary procedures such as elective surgeries and prostate‐specific antigen testing.[29]
We did not specifically address clinical outcomes in our analysis because the clinical outcomes on which CMS currently adjusts VBP reimbursement focus on 30‐day mortality for specific diagnoses, nosocomial infections, and iatrogenic events.[30] Our data include only returned surveys from living patients, and it is likely that 30‐day mortality was similar throughout all subsets of patients. Additionally, the nosocomial and iatrogenic outcome measures used by CMS are sufficiently rare on the general floors and are unlikely to have significantly influenced our results.[31]
Our study has several strengths. Nearly all medical and surgical patient surveys returned during the study period were included, and therefore our calculations are likely to accurately reflect the Summary Star Rating that would have been assigned for the period. Second, the large sample size helps attenuate potential differences in commonly used outcome metrics. Third, by adjusting for a variety of demographic and clinical variables, we were able to decrease the likelihood of unidentified confounders.
Notably, we identified 38 (0.4%) surveys returned for patients under 18 years of age at admission. These surveys were included in our analysis because, to the best of our knowledge, they would have existed in the pool of surveys CMS could have used to assign a Summary Star Rating.
Our study also has limitations. First, geographically diverse data are needed to ensure generalizability. Second, we used the Charlson‐Deyo Comorbidity Index to describe the degree of illness for each patient. This index represents a patient's total illness burden but may not describe the relative severity of the patient's current illness relative to another patient. Third, we selected variables we felt were most likely to be associated with patient experience, but unidentified confounding remains possible. Fourth, attendings caring for ICU patients fall within the Division of Critical Care/Pulmonary Medicine. Therefore, we may have inadvertently placed patients into the ICU cohort who received a pulmonary/critical care consult on the general floors. Fifth, our data describe associations only for patients who returned surveys. Although there may be inherent biases in patients who return surveys, HCAHPS survey responses are used by CMS to determine a hospital's overall satisfaction score.
CONCLUSION
For patients who return HCAHPS surveys, resource utilization may be positively associated with a hospital's Summary Star Rating. These data suggest that hospitals with higher per‐patient expenditures may receive higher Summary Star Ratings, which could result in hospitals with higher per‐patient resource utilization appearing more attractive to healthcare consumers. Future studies should attempt to confirm our findings at other institutions and to determine causative factors.
Acknowledgements
The authors thank Jason Machan, PhD (Department of Orthopedics and Surgery, Warren Alpert Medical School, Brown University, Providence, Rhode Island) for his help with study design, and Ms. Brenda Foster (data analyst, University of Rochester Medical Center, Rochester, NY) for her help with data collection.
Disclosures: Nothing to report.
- , , . Redesigning physician compensation and improving ED performance. Healthc Financ Manage. 2011;65(6):114–117.
- QualityNet. Available at: https://www.qualitynet.org/dcs/ContentServer?c=Page97(13):1041–1048.
- , , , . Factors determining inpatient satisfaction with care. Soc Sci Med. 2002;54(4):493–504.
- , , , , . Patient satisfaction revisited: a multilevel approach. Soc Sci Med. 2009;69(1):68–75.
- , , , et al. Predictors of patient satisfaction with hospital health care. BMC Health Serv Res. 2006;6:102.
- , , , . The cost of satisfaction: a national study of patient satisfaction, health care utilization, expenditures, and mortality. Arch Intern Med. 2012;172(5):405–411.
- , , , , . Relationship between patient satisfaction with inpatient care and hospital readmission within 30 days. Am J Manag Care. 2011;17(1):41–48.
- Becker's Infection Control and Clinical Quality. Star Ratings go live on Hospital Compare: how many hospitals got 5 stars? Available at: http://www.beckershospitalreview.com/quality/star‐ratings‐go‐live‐on‐hospital‐compare‐how‐many‐hospitals‐got‐5‐stars.html. Published April 16, 2015. Accessed October 5, 2015.
- , , . Adapting a clinical comorbidity index for use with ICD‐9‐CM administrative databases. J Clin Epidemiol. 1992;45(6):613–619.
- , , . Patient satisfaction and quality of surgical care in US hospitals. Ann Surg. 2015;261(1):2–8.
- , , , , . Should health care providers be accountable for patients' care experiences? J Gen Intern Med. 2015;30(2):253–256.
- , , , , . Unmet expectations for care and the patient‐physician relationship. J Gen Intern Med. 2002;17(11):817–824.
- , , , et al. Do unmet expectations for specific tests, referrals, and new medications reduce patients' satisfaction? J Gen Intern Med. 2004;19(11):1080–1087.
- , , , , , . Request fulfillment in office practice: antecedents and relationship to outcomes. Med Care. 2002;40(1):38–51.
- , , , et al. Factors associated with patient satisfaction with care among dermatological outpatients. Br J Dermatol. 2001;145(4):617–623.
- , , , . Patient expectations of emergency department care: phase II—a cross‐sectional survey. CJEM. 2006;8(3):148–157.
- , , , , . Patients' perspectives on ideal physician behaviors. Mayo Clin Proc. 2006;81(3):338–344.
- , . What do people want from their health care? A qualitative study. J Participat Med. 2015;18:e10.
- , , . Evaluations of care by adults following a denial of an advertisement‐related prescription drug request: the role of expectations, symptom severity, and physician communication style. Soc Sci Med. 2006;62(4):888–899.
- , , , , , . Getting to “no”: strategies primary care physicians use to deny patient requests. Arch Intern Med. 2010;170(4):381–388.
- , , , , , . The implications of regional variations in Medicare spending. Part 1: the content, quality, and accessibility of care. Ann Intern Med. 2003;138(4):273–287.
- , , , , , . The implications of regional variations in Medicare spending. Part 2: health outcomes and satisfaction with care. Ann Intern Med. 2003;138(4):288–298.
- , , , et al. Associations among hospital capacity, utilization, and mortality of US Medicare beneficiaries, controlling for sociodemographic factors. Health Serv Res. 2000;34(6):1351–1362.
- , , , . Regional variations in health care intensity and physician perceptions of quality of care. Ann Intern Med. 2006;144(9):641–649.
- , , . Visit‐specific expectations and patient‐centered outcomes: a literature review. Arch Fam Med. 2000;9(10):1148–1155.
- , , , et al. Decision aids for people facing health treatment or screening decisions. Cochrane Database Syst Rev. 2014;1:CD001431.
- Centers for Medicare and Medicaid Services. Hospital Compare. Outcome domain. Available at: https://www.medicare.gov/hospitalcompare/data/outcome‐domain.html. Accessed October 5, 2015.
- Centers for Disease Control and Prevention. 2013 national and state healthcare‐associated infections progress report. Available at: www.cdc.gov/hai/progress‐report/index.html. Accessed October 5, 2015.
Skin Lesions in Patients Treated With Imatinib Mesylate: A 5-Year Prospective Study
Imatinib mesylate (IM) represents the first-line treatment of chronic myeloid leukemia (CML) and gastrointestinal stromal tumors (GISTs). Its pharmacological activity is related to a specific action on several tyrosine kinases in different tumors, including Bcr-Abl in CML, c-Kit (CD117) in GIST, and platelet-derived growth factor receptor in dermatofibrosarcoma protuberans.1,2
Imatinib mesylate has been shown to improve progression-free survival and overall survival2; however, it also has several side effects. Among the adverse effects (AEs), less than 10% are nonhematologic, such as nausea, vomiting, diarrhea, muscle cramps, and cutaneous reactions.3,4
We followed patients who were treated with IM for 5 years to identify AEs of therapy.
Methods
The aim of this prospective study was to identify and collect data regarding IM cutaneous side effects so that clinicians can detect AEs early and differentiate them from AEs caused by other medications. All patients were subjected to a median of 5 years’ follow-up. We included all the patients treated with IM and excluded patients who had a history of eczematous dermatitis, psoriasis, renal impairment, or dyshidrosis palmoplantar. Before starting IM, all patients presented for a dermatologic visit. They were subsequently evaluated every 3 months.
The incidence rate was defined as the ratio of patients with cutaneous side effects and the total patients treated with IM. Furthermore, we calculated the ratio between each class of patient with a specific cutaneous manifestation and the entire cohort of patients with cutaneous side effects related to IM.
When necessary, microbiological, serological, and histopathological analyses were performed.
Results
In 60 months, we followed 220 patients treated with IM. Among them, 55 (25%) developed cutaneous side effects (35 males; 20 females). The incidence rate of the patients with cutaneous side effects was 1:4. The median age of the entire cohort was 52.5 years. Fifty patients were being treated for CML and 5 for GISTs. All patients received IM at a dosage of 400 mg daily.
The following skin diseases were observed in patients treated with IM (Table): 19 patients with maculopapular rash with pruritus (no maculopapular rash without pruritus was detected), 7 patients with eczematous dermatitis such as stasis dermatitis and seborrheic dermatitis, 6 patients with onychodystrophy melanonychia (Figure 1), 5 patients with psoriasis, 5 patients with skin cancers including basal cell carcinoma (BCC)(Figure 2), 3 patients with periorbital edema (Figure 3), 3 patients with mycosis, 3 patients with dermatofibromas, 2 patients with dyshidrosis palmoplantar, 1 patient with pityriasis rosea–like eruption (Figure 4), and 1 patient with actinic keratoses on the face. No hypopigmentation or hyperpigmentation, excluding the individual case of melanonychia, was observed.
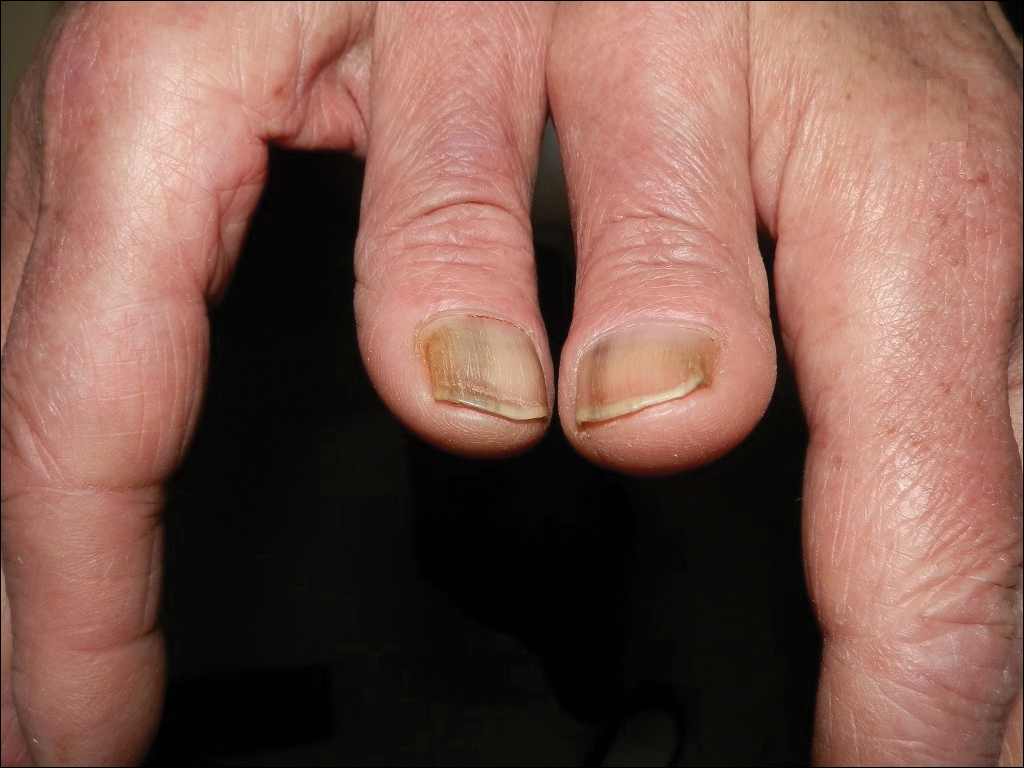

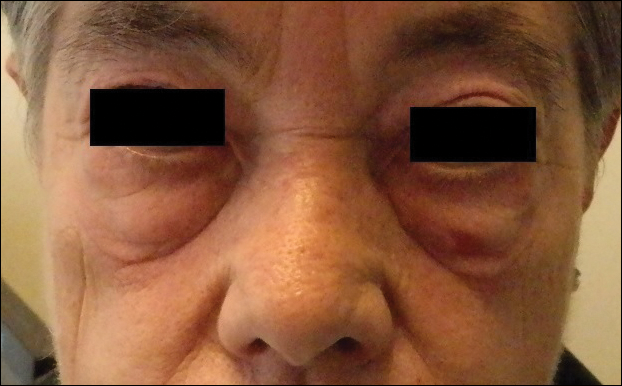

All cutaneous diseases reported in this study appeared after IM therapy (median, 3.8 months). The median time to onset for each cutaneous disorder is reported in the Table. During the first dermatologic visit before starting IM therapy, none of the patients showed any of these cutaneous diseases.
The adverse cutaneous reactions were treated with appropriate drugs. Generally, eczematous dermatitis was treated using topical steroids, emollients, and oral antihistamines. In patients with maculopapular rash with pruritus, oral corticosteroids (eg, betamethasone 3 mg daily or prednisolone 1 mg/kg) in association with antihistamine was necessary. Psoriasis was completely improved with topical betamethasone 0.5 mg and calcipotriol 50 µg. Skin cancers were treated with surgical excision with histologic examination. All treatments are outlined in the Table.
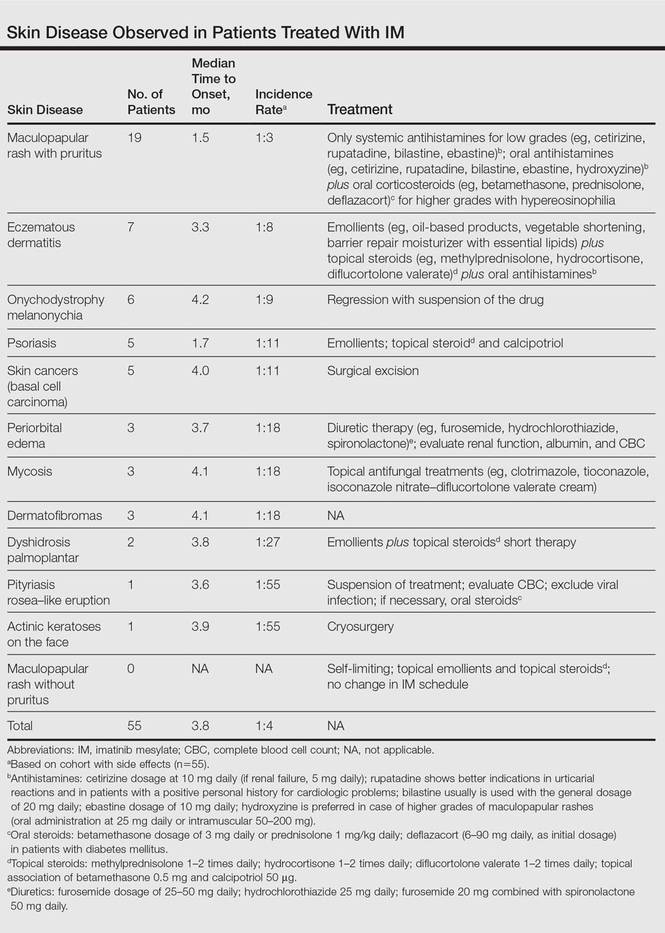
Imatinib mesylate therapy was suspended in 2 patients with maculopapular rash with moderate to severe pruritus; however, despite the temporary suspension of the drug and the appropriate therapies (corticosteroids and antihistamines), cutaneous side effects reappeared 7 to 10 days after therapy resumed. Therefore, the treatment was permanently suspended in these 2 cases and IM was replaced with erlotinib, a second-generation Bcr-Abl tyrosine kinase inhibitor.
Comment
The introduction of IM for the treatment of GIST and CML has changed the history of these diseases. The drug typically is well tolerated and few patients have reported severe AEs. Mild skin reactions are relatively frequent, ranging from 7% to 21% of patients treated.3 In our case, the percentage was relatively higher (25%), likely because of close monitoring of patients, with an increase in the incidence rate.
Imatinib mesylate cutaneous reactions are dose dependent.4 Indeed, in all our cases, the cutaneous reactions arose with an IM dosage of 400 mg daily, which is compatible with the definition of dose-independent cutaneous AEs.
The most common cutaneous AEs reported in the literature were swelling/edema and maculopapular rash. Swelling is the most common AE described during therapy with IM with an incidence of 63% to 84%.5 Swelling often involves the periorbital area and occurs approximately 6 weeks after starting IM. Although its pathogenesis is uncertain, it has been shown that IM blocks the platelet-derived growth factor receptor expressed on blood vessels that regulates the transportation transcapillary. The inhibition of this receptor can lead to increased pore pressure, resulting in edema and erythema. Maculopapular eruptions (50% of cases) often affect the trunk and the limbs and are accompanied by pruritus. Commonly, these rashes arise after 9 weeks of IM therapy. These eruptions are self-limiting and only topical emollients and steroids are required, without any change in IM schedule. To treat maculopapular eruptions with pruritus, oral steroids and antihistamines may be helpful, without suspending IM treatment. When grade 2 or 3 pruriginous maculopapular eruptions arise, the suspension of IM combined with steroids and antihistamines may be necessary. When the readministration of IM is required, it is mandatory to start IM at a lower dose (50–100 mg/d), administering prednisolone 0.5 to 1.0 mg/kg daily. Then, the steroid gradually can be tapered.6 Critical cutaneous AEs that are resistant to supportive measures warrant suspension of IM therapy. However, the incidence of this event is small (<1% of all patients).7
Regarding severe cutaneous AEs from IM therapy, Hsiao et al8 reported the case of Stevens-Johnson syndrome. In this case, IM was immediately stopped and systemic steroids were started. Rarely, erythroderma (grade 4 toxicity) can develop for which a prompt and perpetual suspension of IM is necessary and supportive care therapy with oral and topical steroids is recommended.9
Hyperpigmentation induced by IM, mostly in patients with Fitzpatrick skin types V to VI and with a general prevalence of 16% to 40% in treated patients, often is related to a mutation of c-Kit or other kinases that are activated rather than inhibited by the drug, resulting in overstimulation of melanogenesis.10 The prevalence of Fitzpatrick skin types I to III determined the absence of pigmentation changes in our cohort, excluding melanonychia. Hyperpigmentation was observed in the skin as well as the appendages such as nails, resulting in melanonychia (Figure 1). However, Brazzelli et al11 reported hypopigmentation in 5 white patients treated with IM; furthermore, they found a direct correlation between hypopigmentation and development of skin cancers in these patients. The susceptibility to develop skin cancers may persist, even without a clear manifestation of hypopigmentation, as reported in the current analysis. We documented BCC in 5 patients, 1 patient developed actinic keratoses, and 3 patients developed dermatofibromas. However, these neoplasms probably were not provoked by IM. On the contrary, we did not note squamous cell carcinoma, which was reported by Baskaynak et al12 in 2 CML patients treated with IM.
The administration of IM can be associated with exacerbation of psoriasis. Paradoxically, in genetically predisposed individuals, tumor necrosis factor α (TNF-α) antagonists, such as IM, seem to induce psoriasis, producing IFN-α rather than TNF-α and increasing inflammation.13 In fact, some research shows induction of psoriasis by anti–TNF-α drugs.14-16 Two cases of IM associated with psoriasis have been reported, and both cases represented an exacerbation of previously diagnosed psoriasis.13,17 On the contrary, in our analysis we reported 5 cases of psoriasis vulgaris induced by IM administration. Our patients developed cutaneous psoriatic lesions approximately 1.7 months after the start of IM therapy.
The pityriasis rosea–like eruption (Figure 4) presented as nonpruritic, erythematous, scaly patches on the trunk and extremities, and arose 3.6 months after the start of treatment. This particular cutaneous AE is rare. In 3 case reports, the IM dosage also was 400 mg daily.18-20 The pathophysiology of this rare skin reaction stems from the pharmacological effect of IM rather than a hypersensitivity reaction.18
Deininger et al7 reported that patients with a high basophil count (>20%) rarely show urticarial eruptions after IM due to histamine release from basophils. Premedication with an antihistamine was helpful and the urticarial eruption resolved after normalization in basophil count.7
Given the importance of IM for patients who have limited therapeutic alternatives for their disease and the ability to safely treat the cutaneous AEs, as demonstrated in our analysis, the suspension of IM for dermatological complications is necessary only in rare cases, as shown by the low number of patients (n=2) who had to discontinue therapy. The cutaneous AEs should be diagnosed and treated early with less impact on chemotherapy treatments. The administration of IM should involve a coordinated effort among oncologists and dermatologists to prevent important complications.
- Druker BJ, Talpaz M, Resta DJ, et al. Efficacy and safety of a specific inhibitor of the BCR-ABL tyrosine kinase in chronic myeloid leukemia. N Engl J Med. 2001;344:1031-1037.
- Scheinfeld N. Imatinib mesylate and dermatology part 2: a review of the cutaneous side effects of imatinib mesylate. J Drugs Dermatol. 2006;5:228-231.
- Breccia M, Carmosimo I, Russo E, et al. Early and tardive skin adverse events in chronic myeloid leukaemia patients treated with imatinib. Eur J Haematol. 2005;74:121-123.
- Ugurel S, Hildebrand R, Dippel E, et al. Dose dependent severe cutaneous reactions to imatinib. Br J Cancer. 2003;88:1157-1159.
- Valeyrie L, Bastuji-Garin S, Revuz J, et al. Adverse cutaneous reactions to imatinib (STI571) in Philadelphia chromosome-positive leukaemias: a prospective study of 54 patients. J Am Acad Dermatol. 2003;48:201-206.
- Scott LC, White JD, Reid R, et al. Management of skin toxicity related to the use of imatinibnmesylate (STI571, GlivecTM) for advanced stage gastrointestinal stromal tumors. Sarcoma. 2005;9:157-160.
- Deininger MW, O’Brien SG, Ford JM, et al. Practical management of patients with chronic myeloid leukemia receiving imatinib. J Clin Oncol. 2003;21:1637-1647.
- Hsiao LT, Chung HM, Lin JT, et al. Stevens-Johnson syndrome after treatment with STI571: a case report. Br J Haematol. 2002;117:620-622.
- Sehgal VN, Srivastava G, Sardana K. Erythroderma/exfoliative dermatitis: a synopsis. Int J Dermatol. 2004;43:39-47.
- Pietras K, Pahler J, Bergers G, et al. Functions of paracrine PDGF signaling in the proangiogenic tumor stroma revealed by pharmacological targeting. PLoS Med. 2008;5:e19.
- Brazzelli V, Prestinari F, Barbagallo T, et al. A long-term time course of colorimetric assessment of the effects of imatinib mesylate on skin pigmentation: a study of five patients. J Eur Acad Dermatol Venerol. 2007;21:384-387.
- Baskaynak G, Kreuzer KA, Schwarz M, et al. Squamous cutaneous epithelial cell carcinoma in two CML patients with progressive disease under imatinib treatment. Eur J Haematol. 2003;70:231-234.
- Cheng H, Geist DE, Piperdi M, et al. Management of imatinib-related exacerbation of psoriasis in a patient with a gastrointestinal stromal tumor. Australas J Dermatol. 2009;50:41-43.
- Faillace C, Duarte GV, Cunha RS, et al. Severe infliximab-induced psoriasis treated with adalimumab switching. Int J Dermatol. 2013;52:234-238.
- Iborra M, Beltrán B, Bastida G, et al. Infliximab and adalimumab-induced psoriasis in Crohn’s disease: a aradoxical side effect. J Crohns Colitis. 2011;5:157-161.
- Fernandes IC, Torres T, Sanches M, et al. Psoriasis induced by infliximab. Acta Med Port. 2011;24:709-712.
- Woo SM, Huh CH, Park KC, et al. Exacerbation of psoriasis in a chronic myelogenous leukemia patient treated with imatinib. J Dermatol. 2007;34:724-726.
- Brazzelli V, Prestinari F, Roveda E, et al. Pytiriasis rosea-like eruption during treatment with imatinib mesylate. description of 3 cases. J Am Acad Dermatol. 2005;53:240-243.
- Konstantapoulos K, Papadogianni A, Dimopoulou M, et al. Pytriasis rosea associated with imatinib (STI571, Gleevec). Dermatology. 2002;205:172-173.
- Cho AY, Kim DH, Im M, et al. Pityriasis rosealike drug eruption induced by imatinib mesylate (Gleevec). Ann Dermatol. 2011;23(suppl 3):360-363.
Imatinib mesylate (IM) represents the first-line treatment of chronic myeloid leukemia (CML) and gastrointestinal stromal tumors (GISTs). Its pharmacological activity is related to a specific action on several tyrosine kinases in different tumors, including Bcr-Abl in CML, c-Kit (CD117) in GIST, and platelet-derived growth factor receptor in dermatofibrosarcoma protuberans.1,2
Imatinib mesylate has been shown to improve progression-free survival and overall survival2; however, it also has several side effects. Among the adverse effects (AEs), less than 10% are nonhematologic, such as nausea, vomiting, diarrhea, muscle cramps, and cutaneous reactions.3,4
We followed patients who were treated with IM for 5 years to identify AEs of therapy.
Methods
The aim of this prospective study was to identify and collect data regarding IM cutaneous side effects so that clinicians can detect AEs early and differentiate them from AEs caused by other medications. All patients were subjected to a median of 5 years’ follow-up. We included all the patients treated with IM and excluded patients who had a history of eczematous dermatitis, psoriasis, renal impairment, or dyshidrosis palmoplantar. Before starting IM, all patients presented for a dermatologic visit. They were subsequently evaluated every 3 months.
The incidence rate was defined as the ratio of patients with cutaneous side effects and the total patients treated with IM. Furthermore, we calculated the ratio between each class of patient with a specific cutaneous manifestation and the entire cohort of patients with cutaneous side effects related to IM.
When necessary, microbiological, serological, and histopathological analyses were performed.
Results
In 60 months, we followed 220 patients treated with IM. Among them, 55 (25%) developed cutaneous side effects (35 males; 20 females). The incidence rate of the patients with cutaneous side effects was 1:4. The median age of the entire cohort was 52.5 years. Fifty patients were being treated for CML and 5 for GISTs. All patients received IM at a dosage of 400 mg daily.
The following skin diseases were observed in patients treated with IM (Table): 19 patients with maculopapular rash with pruritus (no maculopapular rash without pruritus was detected), 7 patients with eczematous dermatitis such as stasis dermatitis and seborrheic dermatitis, 6 patients with onychodystrophy melanonychia (Figure 1), 5 patients with psoriasis, 5 patients with skin cancers including basal cell carcinoma (BCC)(Figure 2), 3 patients with periorbital edema (Figure 3), 3 patients with mycosis, 3 patients with dermatofibromas, 2 patients with dyshidrosis palmoplantar, 1 patient with pityriasis rosea–like eruption (Figure 4), and 1 patient with actinic keratoses on the face. No hypopigmentation or hyperpigmentation, excluding the individual case of melanonychia, was observed.
All cutaneous diseases reported in this study appeared after IM therapy (median, 3.8 months). The median time to onset for each cutaneous disorder is reported in the Table. During the first dermatologic visit before starting IM therapy, none of the patients showed any of these cutaneous diseases.
The adverse cutaneous reactions were treated with appropriate drugs. Generally, eczematous dermatitis was treated using topical steroids, emollients, and oral antihistamines. In patients with maculopapular rash with pruritus, oral corticosteroids (eg, betamethasone 3 mg daily or prednisolone 1 mg/kg) in association with antihistamine was necessary. Psoriasis was completely improved with topical betamethasone 0.5 mg and calcipotriol 50 µg. Skin cancers were treated with surgical excision with histologic examination. All treatments are outlined in the Table.
Imatinib mesylate therapy was suspended in 2 patients with maculopapular rash with moderate to severe pruritus; however, despite the temporary suspension of the drug and the appropriate therapies (corticosteroids and antihistamines), cutaneous side effects reappeared 7 to 10 days after therapy resumed. Therefore, the treatment was permanently suspended in these 2 cases and IM was replaced with erlotinib, a second-generation Bcr-Abl tyrosine kinase inhibitor.
Comment
The introduction of IM for the treatment of GIST and CML has changed the history of these diseases. The drug typically is well tolerated and few patients have reported severe AEs. Mild skin reactions are relatively frequent, ranging from 7% to 21% of patients treated.3 In our case, the percentage was relatively higher (25%), likely because of close monitoring of patients, with an increase in the incidence rate.
Imatinib mesylate cutaneous reactions are dose dependent.4 Indeed, in all our cases, the cutaneous reactions arose with an IM dosage of 400 mg daily, which is compatible with the definition of dose-independent cutaneous AEs.
The most common cutaneous AEs reported in the literature were swelling/edema and maculopapular rash. Swelling is the most common AE described during therapy with IM with an incidence of 63% to 84%.5 Swelling often involves the periorbital area and occurs approximately 6 weeks after starting IM. Although its pathogenesis is uncertain, it has been shown that IM blocks the platelet-derived growth factor receptor expressed on blood vessels that regulates the transportation transcapillary. The inhibition of this receptor can lead to increased pore pressure, resulting in edema and erythema. Maculopapular eruptions (50% of cases) often affect the trunk and the limbs and are accompanied by pruritus. Commonly, these rashes arise after 9 weeks of IM therapy. These eruptions are self-limiting and only topical emollients and steroids are required, without any change in IM schedule. To treat maculopapular eruptions with pruritus, oral steroids and antihistamines may be helpful, without suspending IM treatment. When grade 2 or 3 pruriginous maculopapular eruptions arise, the suspension of IM combined with steroids and antihistamines may be necessary. When the readministration of IM is required, it is mandatory to start IM at a lower dose (50–100 mg/d), administering prednisolone 0.5 to 1.0 mg/kg daily. Then, the steroid gradually can be tapered.6 Critical cutaneous AEs that are resistant to supportive measures warrant suspension of IM therapy. However, the incidence of this event is small (<1% of all patients).7
Regarding severe cutaneous AEs from IM therapy, Hsiao et al8 reported the case of Stevens-Johnson syndrome. In this case, IM was immediately stopped and systemic steroids were started. Rarely, erythroderma (grade 4 toxicity) can develop for which a prompt and perpetual suspension of IM is necessary and supportive care therapy with oral and topical steroids is recommended.9
Hyperpigmentation induced by IM, mostly in patients with Fitzpatrick skin types V to VI and with a general prevalence of 16% to 40% in treated patients, often is related to a mutation of c-Kit or other kinases that are activated rather than inhibited by the drug, resulting in overstimulation of melanogenesis.10 The prevalence of Fitzpatrick skin types I to III determined the absence of pigmentation changes in our cohort, excluding melanonychia. Hyperpigmentation was observed in the skin as well as the appendages such as nails, resulting in melanonychia (Figure 1). However, Brazzelli et al11 reported hypopigmentation in 5 white patients treated with IM; furthermore, they found a direct correlation between hypopigmentation and development of skin cancers in these patients. The susceptibility to develop skin cancers may persist, even without a clear manifestation of hypopigmentation, as reported in the current analysis. We documented BCC in 5 patients, 1 patient developed actinic keratoses, and 3 patients developed dermatofibromas. However, these neoplasms probably were not provoked by IM. On the contrary, we did not note squamous cell carcinoma, which was reported by Baskaynak et al12 in 2 CML patients treated with IM.
The administration of IM can be associated with exacerbation of psoriasis. Paradoxically, in genetically predisposed individuals, tumor necrosis factor α (TNF-α) antagonists, such as IM, seem to induce psoriasis, producing IFN-α rather than TNF-α and increasing inflammation.13 In fact, some research shows induction of psoriasis by anti–TNF-α drugs.14-16 Two cases of IM associated with psoriasis have been reported, and both cases represented an exacerbation of previously diagnosed psoriasis.13,17 On the contrary, in our analysis we reported 5 cases of psoriasis vulgaris induced by IM administration. Our patients developed cutaneous psoriatic lesions approximately 1.7 months after the start of IM therapy.
The pityriasis rosea–like eruption (Figure 4) presented as nonpruritic, erythematous, scaly patches on the trunk and extremities, and arose 3.6 months after the start of treatment. This particular cutaneous AE is rare. In 3 case reports, the IM dosage also was 400 mg daily.18-20 The pathophysiology of this rare skin reaction stems from the pharmacological effect of IM rather than a hypersensitivity reaction.18
Deininger et al7 reported that patients with a high basophil count (>20%) rarely show urticarial eruptions after IM due to histamine release from basophils. Premedication with an antihistamine was helpful and the urticarial eruption resolved after normalization in basophil count.7
Given the importance of IM for patients who have limited therapeutic alternatives for their disease and the ability to safely treat the cutaneous AEs, as demonstrated in our analysis, the suspension of IM for dermatological complications is necessary only in rare cases, as shown by the low number of patients (n=2) who had to discontinue therapy. The cutaneous AEs should be diagnosed and treated early with less impact on chemotherapy treatments. The administration of IM should involve a coordinated effort among oncologists and dermatologists to prevent important complications.
- Druker BJ, Talpaz M, Resta DJ, et al. Efficacy and safety of a specific inhibitor of the BCR-ABL tyrosine kinase in chronic myeloid leukemia. N Engl J Med. 2001;344:1031-1037.
- Scheinfeld N. Imatinib mesylate and dermatology part 2: a review of the cutaneous side effects of imatinib mesylate. J Drugs Dermatol. 2006;5:228-231.
- Breccia M, Carmosimo I, Russo E, et al. Early and tardive skin adverse events in chronic myeloid leukaemia patients treated with imatinib. Eur J Haematol. 2005;74:121-123.
- Ugurel S, Hildebrand R, Dippel E, et al. Dose dependent severe cutaneous reactions to imatinib. Br J Cancer. 2003;88:1157-1159.
- Valeyrie L, Bastuji-Garin S, Revuz J, et al. Adverse cutaneous reactions to imatinib (STI571) in Philadelphia chromosome-positive leukaemias: a prospective study of 54 patients. J Am Acad Dermatol. 2003;48:201-206.
- Scott LC, White JD, Reid R, et al. Management of skin toxicity related to the use of imatinibnmesylate (STI571, GlivecTM) for advanced stage gastrointestinal stromal tumors. Sarcoma. 2005;9:157-160.
- Deininger MW, O’Brien SG, Ford JM, et al. Practical management of patients with chronic myeloid leukemia receiving imatinib. J Clin Oncol. 2003;21:1637-1647.
- Hsiao LT, Chung HM, Lin JT, et al. Stevens-Johnson syndrome after treatment with STI571: a case report. Br J Haematol. 2002;117:620-622.
- Sehgal VN, Srivastava G, Sardana K. Erythroderma/exfoliative dermatitis: a synopsis. Int J Dermatol. 2004;43:39-47.
- Pietras K, Pahler J, Bergers G, et al. Functions of paracrine PDGF signaling in the proangiogenic tumor stroma revealed by pharmacological targeting. PLoS Med. 2008;5:e19.
- Brazzelli V, Prestinari F, Barbagallo T, et al. A long-term time course of colorimetric assessment of the effects of imatinib mesylate on skin pigmentation: a study of five patients. J Eur Acad Dermatol Venerol. 2007;21:384-387.
- Baskaynak G, Kreuzer KA, Schwarz M, et al. Squamous cutaneous epithelial cell carcinoma in two CML patients with progressive disease under imatinib treatment. Eur J Haematol. 2003;70:231-234.
- Cheng H, Geist DE, Piperdi M, et al. Management of imatinib-related exacerbation of psoriasis in a patient with a gastrointestinal stromal tumor. Australas J Dermatol. 2009;50:41-43.
- Faillace C, Duarte GV, Cunha RS, et al. Severe infliximab-induced psoriasis treated with adalimumab switching. Int J Dermatol. 2013;52:234-238.
- Iborra M, Beltrán B, Bastida G, et al. Infliximab and adalimumab-induced psoriasis in Crohn’s disease: a aradoxical side effect. J Crohns Colitis. 2011;5:157-161.
- Fernandes IC, Torres T, Sanches M, et al. Psoriasis induced by infliximab. Acta Med Port. 2011;24:709-712.
- Woo SM, Huh CH, Park KC, et al. Exacerbation of psoriasis in a chronic myelogenous leukemia patient treated with imatinib. J Dermatol. 2007;34:724-726.
- Brazzelli V, Prestinari F, Roveda E, et al. Pytiriasis rosea-like eruption during treatment with imatinib mesylate. description of 3 cases. J Am Acad Dermatol. 2005;53:240-243.
- Konstantapoulos K, Papadogianni A, Dimopoulou M, et al. Pytriasis rosea associated with imatinib (STI571, Gleevec). Dermatology. 2002;205:172-173.
- Cho AY, Kim DH, Im M, et al. Pityriasis rosealike drug eruption induced by imatinib mesylate (Gleevec). Ann Dermatol. 2011;23(suppl 3):360-363.
Practice Points
- The most common cutaneous adverse reactions from imatinib mesylate (IM) are swelling and edema.
- Maculopapular rash with pruritus is one of the most common side effects from IM and can be effectively treated with oral or systemic antihistamines.
- The onset of periorbital edema requires a complete evaluation of renal function.

Linea Aspera as Rotational Landmark for Tumor Endoprostheses: A Computed Tomography Study
The distal or proximal femur with tumor endoprosthesis is commonly replaced after segmental resections for bone tumors, complex trauma, or revision arthroplasty. In conventional joint replacements, correct rotational alignment of the component is referenced off anatomical landmarks in the proximal or distal femur. After tumor resection, however, these landmarks are often not available for rotational orientation. There are no reports of studies validating a particular method of establishing rotation in these cases.
To establish a guide for rotational alignment of tumor endoprostheses, we set out to define the natural location of the linea aspera (LA) based on axial computed tomography (CT) scans. The LA is often the most outstanding visible bony landmark on a cross-section of the femur during surgery, and it would be helpful to know its normal orientation in relation to the true anteroposterior (AP) axis of the femur and to the femoral version. We wanted to answer these 5 questions:
1. Is the prominence of the LA easily identifiable on cross-section at different levels of the femoral shaft?
2. Does an axis passing through the LA correspond to the AP axis of the femur?
3. If not, is this axis offset internally or externally and by how much?
4. Is this offset constant at all levels of the femoral shaft?
5. How does the LA axis relate to the femoral neck axis at these levels?
The answers determine if the LA can be reliably used for rotational alignment of tumor endoprostheses.
Materials and Methods
After this study received Institutional Review Board approval, we retrospectively reviewed whole-body fluorine-18-deoxyglucose (FDG) positron emission tomography–computed tomography (PET-CT) studies performed in our hospital between 2003 and 2006 to identify those with full-length bilateral femur CT scans. These scans were available on the hospital’s computerized picture archiving system (General Electric). Patients could be included in the study as long as they were at least 18 years old at time of scan and did not have any pathology that deformed the femur, broke a cortex, or otherwise caused any gross asymmetry of the femur. Of the 72 patients with full-length femur CT scans, 3 were excluded: 1 with a congenital hip dysplasia, 1 with an old, malunited femoral fracture, and 1 who was 15 years old at time of scan.
Axial Slice Selection
For each patient, scout AP films were used to measure femoral shaft length from the top of the greater trochanter to the end of the lateral femoral condyle. The levels of the proximal third, midshaft, and distal third were then calculated based on this length. The LA was studied on the axial slices nearest these levels. Next, we scrolled through the scans to identify an axial slice that best showed the femoral neck axis. The literature on CT measurement of femoral anteversion is varied. Some articles describe a technique that uses 2 superimposed axial slices, and others describe a single axial slice.1-3 We used 1 axial slice to draw the femoral neck axis because our computer software could not superimpose 2 images on 1 screen and because the CT scans were not made under specific protocols to measure anteversion but rather were part of a cancer staging work-up. Axial cuts were made at 5-mm intervals, and not all scans included a single slice capturing the head, neck, and greater trochanter. Therefore, we used a (previously described) method in which the femoral neck axis is drawn on a slice that most captured the femoral neck, usually toward its base.4 Last, in order to draw the posterior condyle (PC) axis, we selected an axial slice that showed the posterior-most aspects of the femoral condyles at the intercondylar notch.
Determining Anteroposterior and Posterior Condyle Axes of Femur
As we made all measurements for each femur off a single CT scan, we were able to use a straight horizontal line—drawn on-screen with a software tool—as a reference for measuring rotation. On a distal femur cut, the PC axis is drawn by connecting the posterior-most points of both condyles. The software calculates the angle formed—the PC angle (Figure 1). This angle, the degree to which the PC axis deviates from a straight horizontal line on-screen, can be used to account for gross rotation of the limb on comparison of images. The AP axis of the femur is the axis perpendicular to the PC axis. As such, the PC angle can also be used to determine degree of deviation of the AP axis from a straight vertical line on-screen. The AP axis was used when calculating the LA axis at the various levels of the femur (Figure 2).
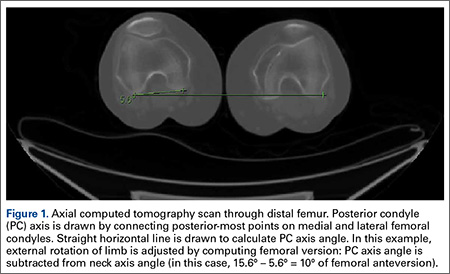
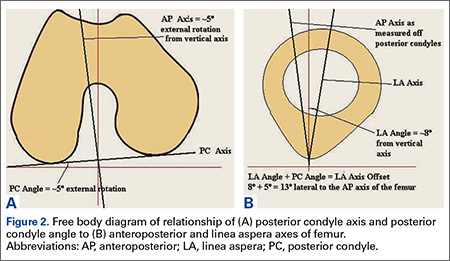
Femoral Version
We used the software tool to draw the femoral neck axis. From the end of this line, a straight horizontal line is drawn on-screen (Figure 3). The software calculates the angle formed—the femoral neck axis angle. We assigned a positive value for a femoral head that pointed anteriorly on the image and a negative value for a head that pointed posteriorly. Adjusting for external rotation of the limb involved calculating the femoral version by subtracting the PC angle from the neck axis angle; adjusting for internal rotation involved adding these 2 angles.
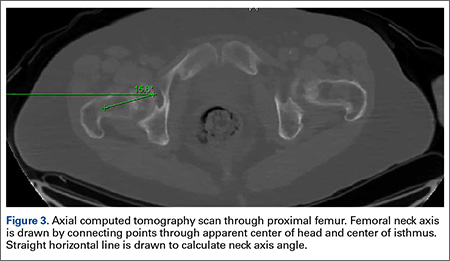
Linea Aspera Morphology
After viewing the first 20 CT scans, we identified 3 types of LA morphology. Type I presents as a thickening on the posterior cortex with a sharp apex; type II presents as a flat-faced but distinct ridge of bone between the medial and lateral lips; and in type III there is no distinct cortical thickening with blunted medial and lateral lips; the latter is always more prominent.
Linea Aspera Axis Offset
From the most posterior point of the LA, a line drawn forward bisecting the femoral canal defined the LA axis. In type I morphology, the posterior-most point was the apex; in type II, the middle of flat posterior surface was used as the starting point; in type III, the lateral lip was used, as it was sharper than the medial lip. This line is again referenced with a straight horizontal line across the image. The PC angle is then added to account for limb rotation, and the result is the LA angle. As the AP axis is perpendicular to the PC axis, the LA angle is subtracted from 90°; the difference represents the amount of offset of the LA axis from the AP axis. By convention, we assigned this a positive value for an LA lateral to the midpoint of the femur and a negative value for an LA medial to the midpoint (Figure 4).
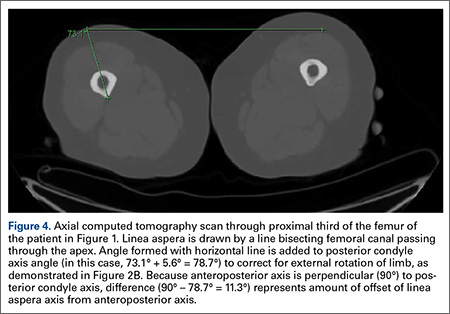
Linea Aspera Axis and Femoral Neck Axis
The angle between the LA axis and the PC axis was measured. The femoral version angle was subtracted from that angle to obtain the arc between the LA axis and the femoral neck axis.
Statistical Analyses
All analyses were performed with SAS 9.1 (SAS Institute). All tests were 2-sided and conducted at the .05 significance level. No adjustments were made for multiple testing. Statistical analysis was performed with nonparametric tests and without making assumptions about the distribution of the study population. Univariate analyses were performed to test for significant side-to-side differences in femoral length, femoral version angle, and LA torsion angles at each level. A multivariate analysis was performed to test for interactions between sex, side, and level. In all analyses, P < .05 was used as the cutoff value for statistical significance.
Results
Femoral lengths varied by side and sex. The left side was longer than the right by a mean of 1.3 mm (P = .008). With multivariate analysis taking into account sex and age (cumulated per decade), there was still a significant effect of side on femoral length. Sex also had a significant effect on femoral length, with females’ femurs shorter by 21.7 mm (standard error, 5.0 mm). Mean (SD) anteversion of the femoral neck was 7.9° (12.7°) on the left and 13.3° (13.0°) on the right; the difference between sides was significant (P < .001). In a multivariate analysis performed to identify potential predictors of femoral version, side still had a significant (P < .001) independent effect; sex and age did not have an effect.
LA morphology varied according to femoral shaft level (Table 1). The morphology was type I in 75% of patients at the distal femur and 74% of patients at the midshaft femur, while only 53% of patients had a type I morphology at the proximal femur. The proportion of type III morphology was larger in the proximal femur (41%) than in the other locations.
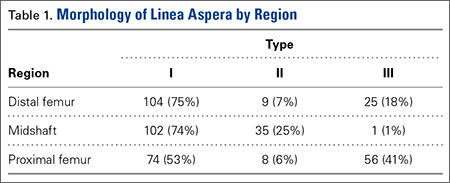
The LA axis of the femur did not correspond exactly to the AP axis at all femoral levels. At the distal femur, mean (SD) lateral offset of the LA axis was 5.5° (7.5°) on the left and 8.3° (8.9°) on the right. At the midshaft, mean (SD) medial offset of the LA axis was 3.1° (8.4°) on the left and 1.2° (7.9°) on the right. At the proximal femur, mean (SD) lateral offset of the LA axis was 5.4° (9.2°) on the left and 6.2° (8.3°) on the right. The side-to-side differences were statistically significant for the distal femur and midshaft but not the proximal femur. Table 2 lists the 95% confidence intervals for the mean values. As the range of differences was small (0.7°-2.8°), and the differences may not be clinically detected on gross inspection during surgery, we pooled both sides’ values to arrive at a single mean for each level. The LA axis was offset a mean (SD) of 6.9° (8.3°) laterally at the distal femur, 2.2° (8.2°) medially at the midshaft, and 5.8° (8.6°) laterally at the proximal femur. Figure 5 shows the frequency of distribution of LA axis offset.Offset of the LA axis from the AP axis of the femur was significantly (P < .001) different for each femoral level, even when a multivariate analysis was performed to determine the effect of sex, age, or side. Age and sex had no significant effect on mean offset of LA axis from AP axis.
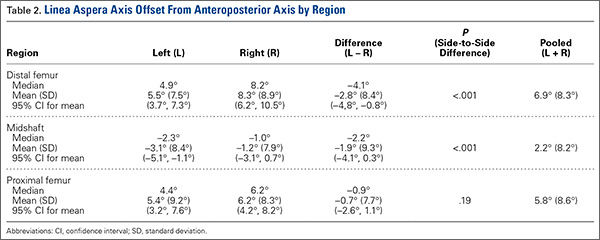
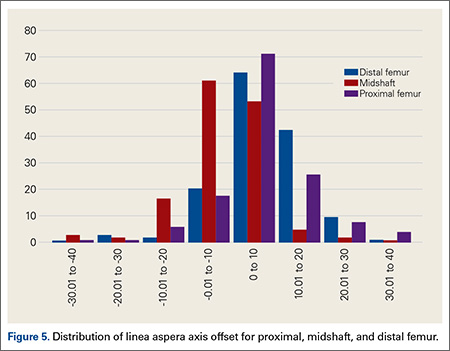
We compared the mean arc between femoral neck axis and LA axis after referencing both off the PC axis. At the distal femur, mean (SD) arc between these 2 axes was 76.6° (13.1°) on the left and 68.3° (13.6°) on the right (mean difference, 8.3°); at the midshaft, mean (SD) arc was 85.2° (13.5°) on the left and 77.9° (13.1°) on the right (mean difference, 7.4°); at the proximal femur, mean (SD) arc was 76.7° (11.9°) on the left and 70.5° (12.8°) on the right (mean difference, 6.2°). The side-to-side differences were statistically significant (P < .001) for all locations.
In multivariate analysis, sex and age did not have an effect on mean arc between the 2 axes. Side and femoral level, however, had a significant effect (P < .001).
Discussion
In total hip arthroplasty, the goal is to restore femoral anteversion, usually referenced to the remaining femoral neck segment.3 In total knee arthroplasty (TKA), proper rotation preserves normal patellofemoral tracking.5 Various landmarks are used, such as the PCs or the epicondyles. After tumor resections, these landmarks are often lost.6 However, there are no reports of studies validating a particular method of achieving proper rotational orientation of tumor endoprostheses, though several methods are being used. One method involves inserting 2 drill bits before osteotomy—one proximal to the intended level of resection on the anterior femur, and the other on the anterior tibial shaft. The straight line formed can establish a plane of rotation (and length), which the surgeon must aim to restore when the components are placed. This method is useful for distal femur resections but not proximal femur resections. Another method, based on the LA’s anatomical position on the posterior aspect of the femur,4 uses the prominence of the LA to align the prosthesis. With this method, the LA is assumed to be directly posterior (6 o’clock) on the femur. However, this assumption has not been confirmed by any study. A third method, described by Heck and Carnesale,5 involves marking the anterior aspect of the femur after resection and aligning the components to it. The authors cautioned against using the LA as a landmark, saying that its course is highly variable.
The LA is a narrow, elevated length of bone, with medial and lateral lips, that serves as an attachment site for muscles in the posterior thigh. Proximally, the LA presents with lateral, medial, and intermediate lips. In the midshaft, it is often elevated by an underlying bony ridge or pilaster complex. Distally, it diverges into 2 ridges that form the triangular popliteal surface.1,7 For the LA to be a reliable landmark, first it must be clearly identifiable on viewing a femoral cross-section. The LA that presents with type I or II morphology is distinctly identifiable, and an axis from its apex and bisecting the canal can easily be constructed. In our study, the LA presented with type I or II morphology in 82% of distal femoral sections and 99% of midshaft femoral sections. Therefore, the LA is a conspicuous landmark at these levels. In the proximal femur, 59% had type I or II morphology. Type III morphology could be identified on cross-sections by the persisting prominence of the lateral lip. However, it may be difficult to appreciate the LA with this morphology at surgery.
Once the LA is identified, its normal cross-sectional position must be defined. One way to do this is to establish the relationship of its axis (LA axis) to the true AP axis. Based on mean values, the LA axis is laterally offset 7º at the distal third of the femur, medially offset 2º at the midshaft, and laterally offset 6º at the proximal third. Therefore, for ideal placement with the LA used for orientation, the component must be internally rotated 7º relative to the LA for femoral resection at the distal third, externally rotated 2º for resection at the midshaft, and internally rotated 6º for resection at the proximal third. Studies have demonstrated that joint contact forces and mechanical alignment of the lower limb can be altered with as little as 5º of femoral malrotation.8,9 Although such a small degree of malrotation is often asymptomatic, it can have long-term effects on soft-tissue tension and patellar tracking.10,11 Rotating-platform mobile-bearing TKA designs can compensate for femoral malrotation, but they may have little to no effect on patellar tracking.12 Therefore, we think aligning the components as near as possible to their natural orientation can prove beneficial in long-term patient management.
Another way of defining the normal cross-sectional position of the LA is to relate it to the femoral neck axis. We measured the difference between these 2 axes. Mean differences were 72º (distal femur), 81.5º (midshaft), and 73.5º (proximal third). Mean arc differences at all levels were larger on the left side—a reflection of the femoral neck being less anteverted on that side in our measurements. Standard deviations were smaller for measurements of LA axis offset from AP axis (range, 7.5°-9.2°) than for measurements of arc between LA axis and femoral neck axis (range, 11.9°-13.6°). This finding indicates there is less variation in the former method, making it preferable for defining the cross-sectional position of the LA.
It has been said that the course of the LA is variable, and our data provide confirmation. The LA does not lie directly posterior (6 o’clock), and it does not trace a straight longitudinal course along the posterior femur, as demonstrated by the different LA axis offsets at 3 levels. However, we may still use it as a landmark if we remain aware how much the LA is offset from the AP axis at each femoral level. Figures 6A-6D, which show CT scans of a patient who underwent distal femoral resection and replacement with an endoprosthesis, illustrate how the LA axis was measured before surgery and how proper prosthesis placement was confirmed after surgery.
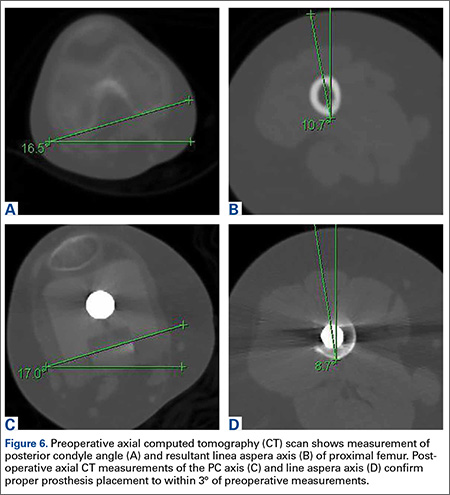
In hip arthroplasty, restoration of normal femoral version is the reference for endoprosthetic placement. The literature on “normal” femoral anteversion varies with the method used. In a review of studies on CT-measured adult femoral version, reported values ranged from 6.3° to 40°.2 Mean femoral version in our study ranged from 8° to 13°. Orthopedics textbooks generally put the value at 10° to 15º, and this seems to be the range that surgeons target.6 However, we found a statistically significant mean side-to-side difference of 5.4°. This finding is possibly explained by our large sample—it was larger than the samples used in other studies of CT-measured femoral version. Other studies have found mean side-to-side differences of up to 4.0º.5 Another explanation for our finding is that the studies may differ methodologically. The studies that established values for femoral anteversion were based on CT protocols—thinner slices (1-5 mm), use of foot holders to standardize limb rotation, use of 2 axial cuts in proximal femur to establish femoral neck axis2,13—designed specifically for this measurement. As the CT scans reviewed in our study are not designed for this purpose, errors in femoral version measurement may have been introduced, which may also explain why there is larger variation in measurements of the arc between the LA axis and the femoral neck axis.
Conclusion
The LA does not lie directly on the posterior surface of the femur. It deviates 6.9° laterally at the distal femur, 2.2° medially at the midshaft, and 6.9° laterally at the proximal third. As the LA is an easily identifiable structure on cross-sections of the femoral shaft at the midshaft and distal third of the femur, it may be useful as a rotational landmark for resections at these levels if these deviations are considered during tumor endoprosthetic replacements.
1. Desai SC, Willson S. Radiology of the linea aspera. Australas Radiol. 1985;29(3):273-274.
2. Kuo TY, Skedros JG, Bloebaum RD. Measurement of femoral anteversion by biplane radiography and computed tomography imaging: comparison with an anatomic reference. Invest Radiol. 2003;38(4):221-229.
3. Wines AP, McNicol D. Computed tomography measurement of the accuracy of component version in total hip arthroplasty. J Arthroplasty. 2006;21(5):696-701.
4. Gray H. Anatomy of the Human Body. Philadelphia, PA: Lea & Febiger; 1918.
5. Heck RK, Carnesale PG. General principles of tumors. In: Canale ST, ed. Campbell’s Operative Orthopaedics. Vol 1. 10th ed. St. Louis, MO: Mosby; 2003:733-791.
6. Katz, MA, Beck TD, Silber JS, Seldes RM, Lotke PA. Determining femoral rotational alignment in total knee arthroplasty: reliability of techniques. J Arthroplasty. 2001;16(3):301-305.
7. Pitt MJ. Radiology of the femoral linea aspera–pilaster complex: the track sign. Radiology. 1982;142(1):66.
8. Bretin P, O’Loughlin PF, Suero EM, et al. Influence of femoral malrotation on knee joint alignment and intra-articular contact pressures. Arch Orthop Trauma Surg. 2011;131(8):1115-1120.
9. Zihlmann MS, Stacoff A, Romero J, Quervain IK, Stüssi E. Biomechanical background and clinical observations of rotational malalignment in TKA: literature review and consequences. Clin Biomech. 2005;20(7):661-668.
10. Ghosh KM, Merican AM, Iranpour F, Deehan DJ, Amis AA. The effect of femoral component rotation on the extensor retinaculum of the knee. J Orthop Res. 2010;28(9):1136-1141.
11. Verlinden C, Uvin P, Labey L, Luyckx JP, Bellemans J, Vandenneucker H. The influence of malrotation of the femoral component in total knee replacement on the mechanics of patellofemoral contact during gait: an in vitro biomechanical study. J Bone Joint Surg Br. 2010;92(5):737-742.
12. Kessler O, Patil S, Colwell CW Jr, D’Lima DD. The effect of femoral component malrotation on patellar biomechanics. J Biomech. 2008;41(16):3332-3339.
13. Strecker W, Keppler P, Gebhard F, Kinzl L. Length and torsion of the lower limb. J Bone Joint Surg Br. 1997;79(6):1019-1023.
The distal or proximal femur with tumor endoprosthesis is commonly replaced after segmental resections for bone tumors, complex trauma, or revision arthroplasty. In conventional joint replacements, correct rotational alignment of the component is referenced off anatomical landmarks in the proximal or distal femur. After tumor resection, however, these landmarks are often not available for rotational orientation. There are no reports of studies validating a particular method of establishing rotation in these cases.
To establish a guide for rotational alignment of tumor endoprostheses, we set out to define the natural location of the linea aspera (LA) based on axial computed tomography (CT) scans. The LA is often the most outstanding visible bony landmark on a cross-section of the femur during surgery, and it would be helpful to know its normal orientation in relation to the true anteroposterior (AP) axis of the femur and to the femoral version. We wanted to answer these 5 questions:
1. Is the prominence of the LA easily identifiable on cross-section at different levels of the femoral shaft?
2. Does an axis passing through the LA correspond to the AP axis of the femur?
3. If not, is this axis offset internally or externally and by how much?
4. Is this offset constant at all levels of the femoral shaft?
5. How does the LA axis relate to the femoral neck axis at these levels?
The answers determine if the LA can be reliably used for rotational alignment of tumor endoprostheses.
Materials and Methods
After this study received Institutional Review Board approval, we retrospectively reviewed whole-body fluorine-18-deoxyglucose (FDG) positron emission tomography–computed tomography (PET-CT) studies performed in our hospital between 2003 and 2006 to identify those with full-length bilateral femur CT scans. These scans were available on the hospital’s computerized picture archiving system (General Electric). Patients could be included in the study as long as they were at least 18 years old at time of scan and did not have any pathology that deformed the femur, broke a cortex, or otherwise caused any gross asymmetry of the femur. Of the 72 patients with full-length femur CT scans, 3 were excluded: 1 with a congenital hip dysplasia, 1 with an old, malunited femoral fracture, and 1 who was 15 years old at time of scan.
Axial Slice Selection
For each patient, scout AP films were used to measure femoral shaft length from the top of the greater trochanter to the end of the lateral femoral condyle. The levels of the proximal third, midshaft, and distal third were then calculated based on this length. The LA was studied on the axial slices nearest these levels. Next, we scrolled through the scans to identify an axial slice that best showed the femoral neck axis. The literature on CT measurement of femoral anteversion is varied. Some articles describe a technique that uses 2 superimposed axial slices, and others describe a single axial slice.1-3 We used 1 axial slice to draw the femoral neck axis because our computer software could not superimpose 2 images on 1 screen and because the CT scans were not made under specific protocols to measure anteversion but rather were part of a cancer staging work-up. Axial cuts were made at 5-mm intervals, and not all scans included a single slice capturing the head, neck, and greater trochanter. Therefore, we used a (previously described) method in which the femoral neck axis is drawn on a slice that most captured the femoral neck, usually toward its base.4 Last, in order to draw the posterior condyle (PC) axis, we selected an axial slice that showed the posterior-most aspects of the femoral condyles at the intercondylar notch.
Determining Anteroposterior and Posterior Condyle Axes of Femur
As we made all measurements for each femur off a single CT scan, we were able to use a straight horizontal line—drawn on-screen with a software tool—as a reference for measuring rotation. On a distal femur cut, the PC axis is drawn by connecting the posterior-most points of both condyles. The software calculates the angle formed—the PC angle (Figure 1). This angle, the degree to which the PC axis deviates from a straight horizontal line on-screen, can be used to account for gross rotation of the limb on comparison of images. The AP axis of the femur is the axis perpendicular to the PC axis. As such, the PC angle can also be used to determine degree of deviation of the AP axis from a straight vertical line on-screen. The AP axis was used when calculating the LA axis at the various levels of the femur (Figure 2).
Femoral Version
We used the software tool to draw the femoral neck axis. From the end of this line, a straight horizontal line is drawn on-screen (Figure 3). The software calculates the angle formed—the femoral neck axis angle. We assigned a positive value for a femoral head that pointed anteriorly on the image and a negative value for a head that pointed posteriorly. Adjusting for external rotation of the limb involved calculating the femoral version by subtracting the PC angle from the neck axis angle; adjusting for internal rotation involved adding these 2 angles.
Linea Aspera Morphology
After viewing the first 20 CT scans, we identified 3 types of LA morphology. Type I presents as a thickening on the posterior cortex with a sharp apex; type II presents as a flat-faced but distinct ridge of bone between the medial and lateral lips; and in type III there is no distinct cortical thickening with blunted medial and lateral lips; the latter is always more prominent.
Linea Aspera Axis Offset
From the most posterior point of the LA, a line drawn forward bisecting the femoral canal defined the LA axis. In type I morphology, the posterior-most point was the apex; in type II, the middle of flat posterior surface was used as the starting point; in type III, the lateral lip was used, as it was sharper than the medial lip. This line is again referenced with a straight horizontal line across the image. The PC angle is then added to account for limb rotation, and the result is the LA angle. As the AP axis is perpendicular to the PC axis, the LA angle is subtracted from 90°; the difference represents the amount of offset of the LA axis from the AP axis. By convention, we assigned this a positive value for an LA lateral to the midpoint of the femur and a negative value for an LA medial to the midpoint (Figure 4).
Linea Aspera Axis and Femoral Neck Axis
The angle between the LA axis and the PC axis was measured. The femoral version angle was subtracted from that angle to obtain the arc between the LA axis and the femoral neck axis.
Statistical Analyses
All analyses were performed with SAS 9.1 (SAS Institute). All tests were 2-sided and conducted at the .05 significance level. No adjustments were made for multiple testing. Statistical analysis was performed with nonparametric tests and without making assumptions about the distribution of the study population. Univariate analyses were performed to test for significant side-to-side differences in femoral length, femoral version angle, and LA torsion angles at each level. A multivariate analysis was performed to test for interactions between sex, side, and level. In all analyses, P < .05 was used as the cutoff value for statistical significance.
Results
Femoral lengths varied by side and sex. The left side was longer than the right by a mean of 1.3 mm (P = .008). With multivariate analysis taking into account sex and age (cumulated per decade), there was still a significant effect of side on femoral length. Sex also had a significant effect on femoral length, with females’ femurs shorter by 21.7 mm (standard error, 5.0 mm). Mean (SD) anteversion of the femoral neck was 7.9° (12.7°) on the left and 13.3° (13.0°) on the right; the difference between sides was significant (P < .001). In a multivariate analysis performed to identify potential predictors of femoral version, side still had a significant (P < .001) independent effect; sex and age did not have an effect.
LA morphology varied according to femoral shaft level (Table 1). The morphology was type I in 75% of patients at the distal femur and 74% of patients at the midshaft femur, while only 53% of patients had a type I morphology at the proximal femur. The proportion of type III morphology was larger in the proximal femur (41%) than in the other locations.
The LA axis of the femur did not correspond exactly to the AP axis at all femoral levels. At the distal femur, mean (SD) lateral offset of the LA axis was 5.5° (7.5°) on the left and 8.3° (8.9°) on the right. At the midshaft, mean (SD) medial offset of the LA axis was 3.1° (8.4°) on the left and 1.2° (7.9°) on the right. At the proximal femur, mean (SD) lateral offset of the LA axis was 5.4° (9.2°) on the left and 6.2° (8.3°) on the right. The side-to-side differences were statistically significant for the distal femur and midshaft but not the proximal femur. Table 2 lists the 95% confidence intervals for the mean values. As the range of differences was small (0.7°-2.8°), and the differences may not be clinically detected on gross inspection during surgery, we pooled both sides’ values to arrive at a single mean for each level. The LA axis was offset a mean (SD) of 6.9° (8.3°) laterally at the distal femur, 2.2° (8.2°) medially at the midshaft, and 5.8° (8.6°) laterally at the proximal femur. Figure 5 shows the frequency of distribution of LA axis offset.Offset of the LA axis from the AP axis of the femur was significantly (P < .001) different for each femoral level, even when a multivariate analysis was performed to determine the effect of sex, age, or side. Age and sex had no significant effect on mean offset of LA axis from AP axis.
We compared the mean arc between femoral neck axis and LA axis after referencing both off the PC axis. At the distal femur, mean (SD) arc between these 2 axes was 76.6° (13.1°) on the left and 68.3° (13.6°) on the right (mean difference, 8.3°); at the midshaft, mean (SD) arc was 85.2° (13.5°) on the left and 77.9° (13.1°) on the right (mean difference, 7.4°); at the proximal femur, mean (SD) arc was 76.7° (11.9°) on the left and 70.5° (12.8°) on the right (mean difference, 6.2°). The side-to-side differences were statistically significant (P < .001) for all locations.
In multivariate analysis, sex and age did not have an effect on mean arc between the 2 axes. Side and femoral level, however, had a significant effect (P < .001).
Discussion
In total hip arthroplasty, the goal is to restore femoral anteversion, usually referenced to the remaining femoral neck segment.3 In total knee arthroplasty (TKA), proper rotation preserves normal patellofemoral tracking.5 Various landmarks are used, such as the PCs or the epicondyles. After tumor resections, these landmarks are often lost.6 However, there are no reports of studies validating a particular method of achieving proper rotational orientation of tumor endoprostheses, though several methods are being used. One method involves inserting 2 drill bits before osteotomy—one proximal to the intended level of resection on the anterior femur, and the other on the anterior tibial shaft. The straight line formed can establish a plane of rotation (and length), which the surgeon must aim to restore when the components are placed. This method is useful for distal femur resections but not proximal femur resections. Another method, based on the LA’s anatomical position on the posterior aspect of the femur,4 uses the prominence of the LA to align the prosthesis. With this method, the LA is assumed to be directly posterior (6 o’clock) on the femur. However, this assumption has not been confirmed by any study. A third method, described by Heck and Carnesale,5 involves marking the anterior aspect of the femur after resection and aligning the components to it. The authors cautioned against using the LA as a landmark, saying that its course is highly variable.
The LA is a narrow, elevated length of bone, with medial and lateral lips, that serves as an attachment site for muscles in the posterior thigh. Proximally, the LA presents with lateral, medial, and intermediate lips. In the midshaft, it is often elevated by an underlying bony ridge or pilaster complex. Distally, it diverges into 2 ridges that form the triangular popliteal surface.1,7 For the LA to be a reliable landmark, first it must be clearly identifiable on viewing a femoral cross-section. The LA that presents with type I or II morphology is distinctly identifiable, and an axis from its apex and bisecting the canal can easily be constructed. In our study, the LA presented with type I or II morphology in 82% of distal femoral sections and 99% of midshaft femoral sections. Therefore, the LA is a conspicuous landmark at these levels. In the proximal femur, 59% had type I or II morphology. Type III morphology could be identified on cross-sections by the persisting prominence of the lateral lip. However, it may be difficult to appreciate the LA with this morphology at surgery.
Once the LA is identified, its normal cross-sectional position must be defined. One way to do this is to establish the relationship of its axis (LA axis) to the true AP axis. Based on mean values, the LA axis is laterally offset 7º at the distal third of the femur, medially offset 2º at the midshaft, and laterally offset 6º at the proximal third. Therefore, for ideal placement with the LA used for orientation, the component must be internally rotated 7º relative to the LA for femoral resection at the distal third, externally rotated 2º for resection at the midshaft, and internally rotated 6º for resection at the proximal third. Studies have demonstrated that joint contact forces and mechanical alignment of the lower limb can be altered with as little as 5º of femoral malrotation.8,9 Although such a small degree of malrotation is often asymptomatic, it can have long-term effects on soft-tissue tension and patellar tracking.10,11 Rotating-platform mobile-bearing TKA designs can compensate for femoral malrotation, but they may have little to no effect on patellar tracking.12 Therefore, we think aligning the components as near as possible to their natural orientation can prove beneficial in long-term patient management.
Another way of defining the normal cross-sectional position of the LA is to relate it to the femoral neck axis. We measured the difference between these 2 axes. Mean differences were 72º (distal femur), 81.5º (midshaft), and 73.5º (proximal third). Mean arc differences at all levels were larger on the left side—a reflection of the femoral neck being less anteverted on that side in our measurements. Standard deviations were smaller for measurements of LA axis offset from AP axis (range, 7.5°-9.2°) than for measurements of arc between LA axis and femoral neck axis (range, 11.9°-13.6°). This finding indicates there is less variation in the former method, making it preferable for defining the cross-sectional position of the LA.
It has been said that the course of the LA is variable, and our data provide confirmation. The LA does not lie directly posterior (6 o’clock), and it does not trace a straight longitudinal course along the posterior femur, as demonstrated by the different LA axis offsets at 3 levels. However, we may still use it as a landmark if we remain aware how much the LA is offset from the AP axis at each femoral level. Figures 6A-6D, which show CT scans of a patient who underwent distal femoral resection and replacement with an endoprosthesis, illustrate how the LA axis was measured before surgery and how proper prosthesis placement was confirmed after surgery.
In hip arthroplasty, restoration of normal femoral version is the reference for endoprosthetic placement. The literature on “normal” femoral anteversion varies with the method used. In a review of studies on CT-measured adult femoral version, reported values ranged from 6.3° to 40°.2 Mean femoral version in our study ranged from 8° to 13°. Orthopedics textbooks generally put the value at 10° to 15º, and this seems to be the range that surgeons target.6 However, we found a statistically significant mean side-to-side difference of 5.4°. This finding is possibly explained by our large sample—it was larger than the samples used in other studies of CT-measured femoral version. Other studies have found mean side-to-side differences of up to 4.0º.5 Another explanation for our finding is that the studies may differ methodologically. The studies that established values for femoral anteversion were based on CT protocols—thinner slices (1-5 mm), use of foot holders to standardize limb rotation, use of 2 axial cuts in proximal femur to establish femoral neck axis2,13—designed specifically for this measurement. As the CT scans reviewed in our study are not designed for this purpose, errors in femoral version measurement may have been introduced, which may also explain why there is larger variation in measurements of the arc between the LA axis and the femoral neck axis.
Conclusion
The LA does not lie directly on the posterior surface of the femur. It deviates 6.9° laterally at the distal femur, 2.2° medially at the midshaft, and 6.9° laterally at the proximal third. As the LA is an easily identifiable structure on cross-sections of the femoral shaft at the midshaft and distal third of the femur, it may be useful as a rotational landmark for resections at these levels if these deviations are considered during tumor endoprosthetic replacements.
1. Desai SC, Willson S. Radiology of the linea aspera. Australas Radiol. 1985;29(3):273-274.
2. Kuo TY, Skedros JG, Bloebaum RD. Measurement of femoral anteversion by biplane radiography and computed tomography imaging: comparison with an anatomic reference. Invest Radiol. 2003;38(4):221-229.
3. Wines AP, McNicol D. Computed tomography measurement of the accuracy of component version in total hip arthroplasty. J Arthroplasty. 2006;21(5):696-701.
4. Gray H. Anatomy of the Human Body. Philadelphia, PA: Lea & Febiger; 1918.
5. Heck RK, Carnesale PG. General principles of tumors. In: Canale ST, ed. Campbell’s Operative Orthopaedics. Vol 1. 10th ed. St. Louis, MO: Mosby; 2003:733-791.
6. Katz, MA, Beck TD, Silber JS, Seldes RM, Lotke PA. Determining femoral rotational alignment in total knee arthroplasty: reliability of techniques. J Arthroplasty. 2001;16(3):301-305.
7. Pitt MJ. Radiology of the femoral linea aspera–pilaster complex: the track sign. Radiology. 1982;142(1):66.
8. Bretin P, O’Loughlin PF, Suero EM, et al. Influence of femoral malrotation on knee joint alignment and intra-articular contact pressures. Arch Orthop Trauma Surg. 2011;131(8):1115-1120.
9. Zihlmann MS, Stacoff A, Romero J, Quervain IK, Stüssi E. Biomechanical background and clinical observations of rotational malalignment in TKA: literature review and consequences. Clin Biomech. 2005;20(7):661-668.
10. Ghosh KM, Merican AM, Iranpour F, Deehan DJ, Amis AA. The effect of femoral component rotation on the extensor retinaculum of the knee. J Orthop Res. 2010;28(9):1136-1141.
11. Verlinden C, Uvin P, Labey L, Luyckx JP, Bellemans J, Vandenneucker H. The influence of malrotation of the femoral component in total knee replacement on the mechanics of patellofemoral contact during gait: an in vitro biomechanical study. J Bone Joint Surg Br. 2010;92(5):737-742.
12. Kessler O, Patil S, Colwell CW Jr, D’Lima DD. The effect of femoral component malrotation on patellar biomechanics. J Biomech. 2008;41(16):3332-3339.
13. Strecker W, Keppler P, Gebhard F, Kinzl L. Length and torsion of the lower limb. J Bone Joint Surg Br. 1997;79(6):1019-1023.
IVC and Mortality in ADHF
Heart failure costs the United States an excess of $30 billion annually, and costs are projected to increase to nearly $70 billion by 2030.[1] Heart failure accounts for over 1 million hospitalizations and is the leading cause of hospitalization in patients >65 years of age.[2] After hospitalization, approximately 50% of patients are readmitted within 6 months of hospital discharge.[3] Mortality rates from heart failure have improved but remain high.[4] Approximately 50% of patients diagnosed with heart failure die within 5 years, and the overall 1‐year mortality rate is 30%.[1]
Prognostic markers and scoring systems for acute decompensated heart failure (ADHF) continue to emerge, but few bedside tools are available to clinicians. Age, brain natriuretic peptide, and N‐terminal pro‐brain natriuretic peptide (NT‐proBNP) levels have been shown to correlate with postdischarge rates of readmission and mortality.[5] A study evaluating the prognostic value of a bedside inferior vena cava (IVC) ultrasound exam demonstrated that lack of improvement in IVC distention from admission to discharge was associated with higher 30‐day readmission rates.[6] Two studies using data from comprehensive transthoracic echocardiograms in heart failure patients demonstrated that a dilated, noncollapsible IVC is associated with higher risk of mortality; however, it is well recognized that obtaining comprehensive transthoracic echocardiograms in all patients hospitalized with heart failure is neither cost‐effective nor practical.[7]
In recent years, multiple studies have emerged demonstrating that noncardiologists can perform focused cardiac ultrasound exams with high reproducibility and accuracy to guide management of patients with ADHF.[8, 9, 10, 11, 12, 13, 14] However, it is unknown whether IVC characteristics from a focused cardiac ultrasound exam performed by a noncardiologist can predict mortality of patients hospitalized with ADHF. The aim of this study was to assess whether a hospitalist‐performed focused ultrasound exam to measure the IVC diameter at admission and discharge can predict mortality in a general medicine ward population hospitalized with ADHF.
METHODS
Study Design
A prospective, observational study of patients admitted to a general medicine ward with ADHF between January 2012 and March 2013 was performed using convenience sampling. The setting was a 247‐bed, university‐affiliated hospital in Madrid, Spain. Inclusion criteria were adult patients admitted with a primary diagnosis of ADHF per the European Society of Cardiology (ESC) criteria.[15] Exclusion criteria were admission to the intensive care unit for mechanical ventilation, need for chronic hemodialysis, or a noncardiac terminal illness with a life expectancy of less than 3 months. All patients provided written informed consent prior to enrollment. This study complies with the Declaration of Helsinki and was approved by the local ethics committee.
The primary outcome was all‐cause mortality at 90 days after hospitalization. The secondary outcomes were hospital readmission at 90 and 180 days, and mortality at 180 days. Patients were prospectively followed up at 30, 60, 90, and 180 days after discharge by telephone interview or by review of the patient's electronic health record. Patients who died within 90 days of discharge were categorized as nonsurvivors, whereas those alive at 90 days were categorized as survivors.
The following data were recorded on admission: age, gender, blood pressure, heart rate, functional class per New York Heart Association (NYHA) classification, comorbidities (hypertension, diabetes mellitus, atrial fibrillation, chronic obstructive pulmonary disease), primary etiology of heart failure, medications, electrocardiogram, NT‐terminal pro‐BNP, hemoglobin, albumin, creatinine, sodium, measurement of performance of activities of daily living (modified Barthel index), and comorbidity score (age‐adjusted Charlson score). A research coordinator interviewed subjects to gather data to calculate a modified Barthel index.[16] Age‐adjusted Charlson comorbidity scores were calculated using age and diagnoses per International Classification of Diseases, Ninth Revision coding.[17]
IVC Measurement
An internal medicine hospitalist with expertise in point‐of‐care ultrasonography (G.G.C.) performed all focused cardiac ultrasound exams to measure the IVC diameter and collapsibility at the time of admission and discharge. This physician was not involved in the inpatient medical management of study subjects. A second physician (N.J.S.) randomly reviewed 10% of the IVC images for quality assurance. Admission IVC measurements were acquired within 24 hours of arrival to the emergency department after the on‐call medical team was contacted to admit the patient. Measurement of the IVC maximum (IVCmax) and IVC minimum (IVCmin) diameters was obtained just distal to the hepatic veinIVC junction, or 2 cm from the IVCright atrial junction using a long‐axis view of the IVC. Measurement of the IVC diameter was consistent with the technique recommended by the American Society of Echocardiography and European Society of Echocardiography guidelines.[18, 19] The IVC collapsibility index (IVCCI) was calculated as (IVCmaxIVCmin)/IVCmax per guidelines.[18] Focused cardiac ultrasound exams were performed using a General Electric Logiq E device (GE Healthcare, Little Chalfont, United Kingdom) with a 3.5 MHz curvilinear transducer. Inpatient medical management by the primary medical team was guided by protocols from the ESC guidelines on the treatment of ADHF.[15] A comprehensive transthoracic echocardiogram (TTE) was performed on all study subjects by the echocardiography laboratory within 24 hours of hospitalization as part of the study protocol. One of 3 senior cardiologists read all comprehensive TTEs. NT‐proBNP was measured on admission and discharge by electrochemiluminescence.
Statistical Analysis
We calculated the required sample size based on published mortality and readmission rates. For our primary outcome of 90‐day mortality, we calculated a required sample size of 64 to achieve 80% power based on 90‐day and 1‐year mortality rates of 21% and 33%, respectively, among Spanish elderly patients (age 70 years) hospitalized with ADHF.[20] For our secondary outcome of 90‐day readmissions, we calculated a sample size of 28 based on a 41% readmission rate.[21] Therefore, our target subject enrollment was at least 70 patients to achieve a power of 80%.
Statistical analyses were performed using SPSS 17.0 statistical package (SPSS Inc., Chicago, IL). Subject characteristics that were categorical variables (demographics and comorbidities) were summarized as counts and percentages. Continuous variables, including IVC measurements, were summarized as means with standard deviations. Differences between categorical variables were analyzed using the Fisher exact test. Survival curves with log‐rank statistics were used to perform survival analysis. The nonparametric Mann‐Whitney U test was used to assess associations between the change in IVCCI, and readmissions and mortality at 90 and 180 days. Predictors of readmission and death were evaluated using a multivariate Cox proportional hazards regression analysis. Given the limited number of primary outcome events, we used age, IVC diameter, and log NT‐proBNP in the multivariate regression analysis based on past studies showing prognostic significance of these variables.[6, 22, 23, 24, 25, 26, 27, 28] Optimal cutoff values for IVC diameter for death and readmission prediction were determined by constructing receiver operating characteristic (ROC) curves and calculating the area under the curve (AUC) for different IVC diameters. NT‐proBNP values were log‐transformed to minimize skewing as reported in previous studies.[29]
RESULTS
Patient Characteristics
Ninety‐seven patients admitted with ADHF were recruited for the study. Optimal acoustic windows to measure the IVC diameter were acquired in 90 patients (93%). Because measurement of discharge IVC diameter was required to calculate the change from admission to discharge, 8 patients who died during initial hospitalization were excluded from the final data analysis. An additional two patients were excluded due to missing discharge NT‐proBNP measurement or missing comprehensive echocardiogram data. The study cohort from whom data were analyzed included 80 of 97 total patients (82%).
Baseline demographic, clinical, laboratory, and comprehensive echocardiographic characteristics of nonsurvivors and survivors at 90 days are demonstrated in Table 1. Eleven patients (13.7%) died during the first 90 days postdischarge, and all deaths were due to cardiovascular complications. Nonsurvivors were older (86 vs 76 years; P = 0.02), less independent in performance of their activities of daily living (Barthel index of 58.1 vs 81.9; P = 0.01), and were more likely to have advanced heart failure with an NYHA functional class of III or IV (72% vs 33%; P = 0.016). Atrial fibrillation (90% vs 55%; P = 0.008) and lower systolic blood pressure (127 mm Hg vs 147 mm Hg; P = 0.01) were more common in nonsurvivors than survivors, and fewer nonsurvivors were taking a ‐blocker (18% vs 59%; P = 0.01). Baseline comprehensive echocardiographic findings were similar between the survivors and nonsurvivors, except left atrial diameter was larger in nonsurvivors versus survivors (54 mm vs 49 mm; P = 0.04).
| Total Cohort, n = 80 | Nonsurvivors, n = 11 | Survivors, n = 69 | P Value | |
|---|---|---|---|---|
| ||||
| Demographics | ||||
| Age, y* | 78 (13) | 86 (7) | 76 (14) | 0.02 |
| Men, n (%) | 34 (42) | 3 (27) | 26 (38) | 0.3 |
| Vital signs* | ||||
| Heart rate, beats/min | 94 (23) | 99 (26) | 95 (23) | 0.5 |
| SBP, mm Hg | 141 (27) | 127 (22) | 147 (25) | 0.01 |
| Comorbidities, n (%) | ||||
| Hypertension | 72 (90) | 10 (91) | 54 (78) | 0.3 |
| Diabetes mellitus | 35 (44) | 3 (27) | 26 (38) | 0.3 |
| Atrial fibrillation | 48 (60) | 10 (90) | 38 (55) | 0.008 |
| COPD | 22 (27) | 3 (27) | 16 (23) | 0.5 |
| Etiology of heart failure | ||||
| Ischemic | 20 (25) | 1 (9) | 16 (23) | 0.1 |
| Hypertensive | 22 (27) | 2 (18) | 18 (26) | 0.4 |
| Valvulopathy | 29 (36) | 7 (64) | 19 (27) | 0.07 |
| Other | 18 (22) | 1 (9) | 16 (23) | 0.09 |
| NYHA IIIIV | 38 (47) | 8 (72) | 23 (33) | 0.016 |
| Charlson score* | 7.5 (2) | 9.0 (3) | 7.1 (2) | 0.02 |
| Barthel index* | 76 (31) | 58 (37) | 81.9 (28) | 0.01 |
| Medications | ||||
| ‐blocker | 44 (55) | 2 (18) | 41 (59) | 0.01 |
| ACE inhibitor/ARB | 48 (60) | 3 (27) | 35 (51) | 0.1 |
| Loop diuretic | 78 (97) | 10 (91) | 67 (97) | 0.9 |
| Aldosterone antagonist | 31 (39) | 4 (36) | 21 (30) | 0.4 |
| Lab results* | ||||
| Sodium, mmol/L | 137 (4.8) | 138 (6) | 139 (4) | 0.6 |
| Creatinine, umol/L | 1.24 (0.4) | 1.40 (0.5) | 1.17 (0.4) | 0.1 |
| eGFR, mL/min | 57.8 (20) | 51.2 (20) | 60.2 (19) | 0.1 |
| Albumin, g/L | 3.4 (0.4) | 3.3 (0.38) | 3.5 (0.41) | 0.1 |
| Hemoglobin, g/dL | 12.0 (2) | 10.9 (1.8) | 12.5 (2.0) | 0.01 |
| Echo parameters* | ||||
| LVEF, % | 52.1 (15) | 51.9 (17) | 51.6 (15) | 0.9 |
| LA diameter, mm | 50.1 (10) | 54 (11) | 49 (11) | 0.04 |
| RVDD, mm | 32.0 (11) | 34 (10) | 31 (11) | 0.2 |
| TAPSE, mm | 18.5 (7) | 17.4 (4) | 18.8 (7) | 0.6 |
| PASP, mm Hg | 51.2 (16) | 53.9 (17) | 50.2 (17) | 0.2 |
| Admission* | ||||
| NT‐proBNP, pg/mL | 8,816 (14,260) | 9,413 (5,703) | 8,762 (15,368) | 0.81 |
| Log NT‐proBNP | 3.66 (0.50) | 3.88 (0.31 | 3.62 (0.52) | 0.11 |
| IVCmax, cm | 2.12 (0.59) | 2.39 (0.37) | 2.06 (0.59) | 0.02 |
| IVCmin, cm | 1.63 (0.69) | 1.82 (0.66) | 1.56 (0.67) | 0.25 |
| IVCCI, % | 25.7 (0.16) | 25.9 (17.0) | 26.2 (16.0) | 0.95 |
| Discharge* | ||||
| NT‐proBNP, pg/mL | 3,132 (3,093) | 4,693 (4,383) | 2,909 (2,847) | 0.08 |
| Log NT‐proBNP | 3.27 (0.49) | 3.51 (0.37) | 3.23 (0.50) | 0.08 |
| IVCmax, cm | 1.87 (0.68) | 1.97 (0.54) | 1.81 (0.66) | 0.45 |
| IVCmin, cm | 1.33 (0.75) | 1.40 (0.65) | 1.27 (0.71) | 0.56 |
| IVCCI, % | 33.1 (0.20) | 32.0 (21.0) | 34.2 (19.0) | 0.74 |
From admission to discharge, the total study cohort demonstrated a highly statistically significant reduction in NT‐proBNP (8816 vs 3093; P 0.001), log NT‐proBNP (3.66 vs 3.27; P 0.001), IVCmax (2.12 vs 1.87; P 0.001), IVCmin (1.63 vs 1.33; P 0.001), and IVCCI (25.7% vs 33.1%; P 0.001). The admission and discharge NT‐proBNP and IVC characteristics of the survivors and nonsurvivors are displayed in Table 2. The only statistically significant difference between nonsurvivors and survivors was the admission IVCmax (2.39 vs 2.06; P = 0.02). There was not a statistically significant difference in the discharge IVCmax between nonsurvivors and survivors.
| Admission | Discharge | Difference (DischargeAdmission) | |||||||
|---|---|---|---|---|---|---|---|---|---|
| Nonsurvivors | Survivors | P Value | Nonsurvivors | Survivors | P Value | Nonsurvivors | Survivors | P Value | |
| |||||||||
| NT‐proBNP, pg/mL | 9,413 (5,703) | 8,762 (15,368) | 0.81 | 4,693 (4,383) | 2,909 (2,847) | 0.08 | 3,717 5,043 | 5,026 11,507 | 0.7 |
| Log NT‐proBNP | 3.88 0.31 | 3.62 0.52 | 0.11 | 3.51 0.37 | 3.23 0.50 | 0.08 | 0.29 0.36 | 0.38 0.37 | 0.4 |
| IVCmax, cm | 2.39 0.37 | 2.06 0.59 | 0.02 | 1.97 0.54 | 1.81 0.66 | 0.45 | 0.39 0.56 | 0.25 0.51 | 0.4 |
| IVCmin, cm | 1.82 0.66 | 1.56 0.67 | 0.25 | 1.40 0.65 | 1.27 0.71 | 0.56 | 0.37 0.52 | 0.30 0.64 | 0.7 |
| IVCCI, % | 25.9 17.0 | 26.2 16.0 | 0.95 | 32.0 21.0 | 34.2 19.0 | 0.74 | 3.7 7.9 | 8.3 22 | 0.5 |
Outcomes
For the primary outcome of 90‐day mortality, the ROC curves showed a similar AUC for the admission IVCmax diameter (AUC: 0.69; 95% confidence interval [CI]: 0.53‐0.85), log NT‐proBNP at discharge (AUC: 0.67; 95% CI: 0.49‐0.85), and log NT‐proBNP at admission (AUC: 0.69; 95% CI: 0.52‐0.85). The optimal cutoff value for the admission IVCmax diameter to predict mortality was 1.9 cm (sensitivity 100%, specificity 38%) based on the ROC curves (see Supporting Information, Appendices 1 and 2, in the online version of this article). An admission IVCmax diameter 1.9 cm was associated with a higher mortality rate at 90 days (25.4% vs 3.4%; P = 0.009) and 180 days (29.3% vs 3.4%; P = 0.003). The Cox survival curves showed significantly lower survival rates in patients with an admission IVCmax diameter 1.9 cm (74.1 vs 96.7%; P = 0.012) (Figures 1 and 2). Based on the multivariate Cox proportional hazards regression analysis with age, IVCmax diameter, and log NT‐proBNP at admission, the admission IVCmax diameter and age were independent predictors of 90‐ and 180‐day mortality. The hazard ratios for death by age, admission IVCmax diameter, and log NT‐proBNP are shown in Table 3.
| Endpoint | Variable | HR (95% CI) | P Value |
|---|---|---|---|
| |||
| 90‐day mortality | Age | 1.14 (1.031.26) | 0.009 |
| IVC diameter at admission | 5.88 (1.2128.1) | 0.025 | |
| Log NT‐proBNP at admission | 1.00 (1.001.00) | 0.910 | |
| 90‐day readmission | Age | 1.06 (1.001.12) | 0.025 |
| IVC diameter at admission | 3.20 (1.248.21) | 0.016 | |
| Log NT‐proBNP at discharge | 1.00 (1.001.00) | 0.910 | |
| 180‐day mortality | Age | 1.12 (1.031.22) | 0.007 |
| IVC diameter at admission | 4.77 (1.2118.7) | 0.025 | |
| Log NT‐proBNP at admission | 1.00 (1.001.00) | 0.610 | |
| 180‐day readmission | Age | 1.06 (1.011.11) | 0.009 |
| IVC diameter at admission | 2.56 (1.145.74) | 0.022 | |
| Log NT‐proBNP at discharge | 1.00 (1.001.00) | 0.610 | |

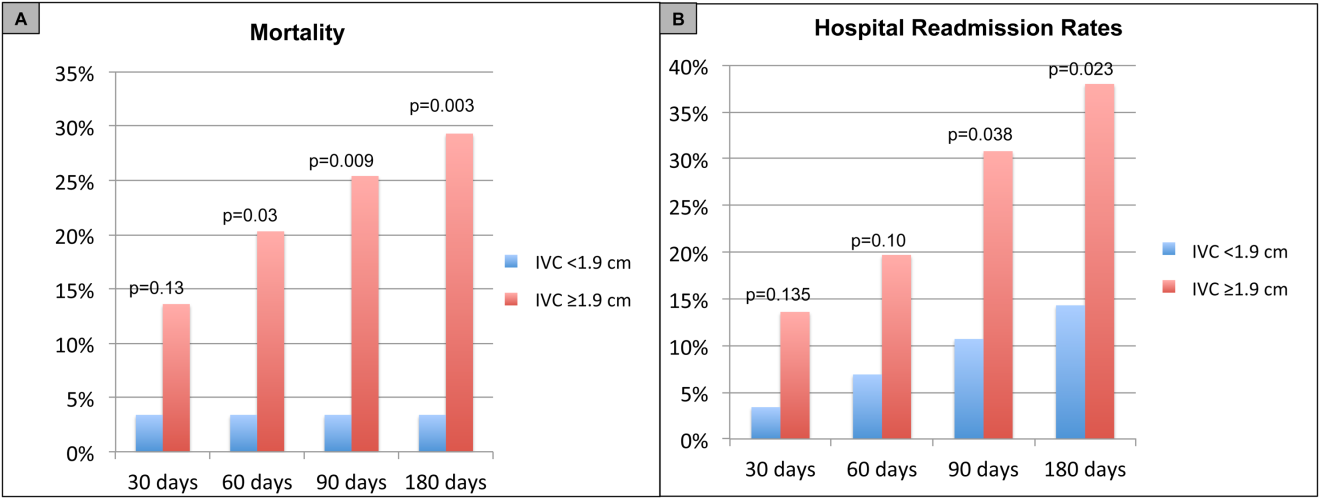
For the secondary outcome of 90‐day readmissions, 19 patients (24%) were readmitted, and the mean index admission IVCmax diameter was significantly greater in patients who were readmitted (2.36 vs 1.98 cm; P = 0.04). The ROC curves for readmission at 90 days showed that an index admission IVCmax diameter of 1.9 cm had the greatest AUC (0.61; 95% CI: 0.49‐0.74). The optimal cutoff value of an index admission IVCmax to predict readmission was also 1.9 cm (sensitivity 94%, specificity 42%) (see Supporting Information, Appendices 1 and 2, in the online version of this article). The Cox survival analysis showed that patients with an index admission IVCmax diameter 1.9 cm had a higher readmission rate at 90 days (30.8% vs 10.7%; P = 0.04) and 180 days (38.0 vs 14.3%; P = 0.02) (Figures 1 and 2). Using a multivariate Cox proportional regression analysis, the hazard ratios for the variables of age, admission IVCmax diameter, and log NT‐proBNP are shown in Table 3.
DISCUSSION
Our study found that a dilated IVC at admission is associated with a poor prognosis after hospitalization for ADHF. Patients with a dilated IVC 1.9 cm at admission had higher mortality and readmission rates at 90 and 180 days postdischarge.
The effect of a dilated IVC on mortality may be mediated through unrecognized right ventricular disease with or without significant pulmonary hypertension, supporting the notion that right heart function is an important determinant of prognosis in patients with ADHF.[30, 31] Similar to elevated jugular venous distension, bedside ultrasound examination of the IVC diameter can serve as a rapid and noninvasive measurement of right atrial pressure.[32] Elevated right atrial pressure is most often due to elevated left ventricular filling pressure transmitted via the pulmonary vasculature, but it is important to note that right‐ and left‐sided cardiac pressures are often discordant in heart failure patients.[33, 34]
Few studies have evaluated the prognostic value of IVC diameter and collapsibility in patients with heart failure. Nath et al.[24] evaluated the prognostic value of IVC diameter in stable veterans referred for outpatient echocardiography. Patients with a dilated IVC >2 cm that did not collapse with inspiration had higher 90‐day and 1‐year mortality rates. A subsequent study by Pellicori et al.[22] investigated the relationship between IVC diameter and other prognostic markers in stable cardiac patients. Pellicori et al. demonstrated that IVC diameter and serum NT‐proBNP levels were independent predictors of a composite endpoint of cardiovascular death or heart failure hospitalization at 1 year.[22] Most recently, Lee et al.[23] evaluated whether a dilated IVC in patients with a history of advanced systolic heart failure with a reduced ejection fraction of 30% and repeated hospitalizations (2) predicted worsening renal failure and adverse cardiovascular outcomes (death or hospitalization for ADHF). The study concluded that age, IVC diameter >2.1 cm, and worsening renal failure predicted cardiovascular death or hospitalization for ADHF.[23]
Our study demonstrated that an admission IVCmax 1.9 cm in hospitalized ADHF patients predicted higher postdischarge mortality at 90 and 180 days. Our findings are consistent with the above‐mentioned studies with a few important differences. First, all of our patients were hospitalized with acute decompensated heart failure. Nath et al. and Pellicori et al. evaluated stable ambulatory patients seen in an echocardiography lab and cardiology clinic, respectively. Only 12.1% of patients in the Nath study had a history of heart failure, and none were reported to have ADHF. More importantly, our study improves our understanding of patients with heart failure with a preserved ejection fraction, an important gap in the literature. The mean ejection fraction of patients in our study was 52% consistent with heart failure with preserved ejection fraction, whereas patients in the Pellicori et al. and Lee et al. studies had heart failure with reduced (42%) or severely reduced (30%) ejection fraction, respectively. We did not anticipate finding heart failure with preserved ejection fraction in the majority of patients, but our study's findings will add to our understanding of this increasingly common type of heart failure.
Compared to previous studies that utilized a registered diagnostic cardiac sonographer to obtain a comprehensive TTE to prognosticate patients, our study utilized point‐of‐care ultrasonography. Nath et al. commented that obtaining a comprehensive echocardiogram on every patient with ADHF is unlikely to be cost‐effective or feasible. Our study utilized a more realistic approach with a frontline internal medicinetrained hospitalist acquiring and interpreting images of the IVC at the bedside using a basic portable ultrasound machine.
Our study did not show that plasma natriuretic peptides levels are predictive of death or readmission after hospitalization for ADHF as shown in previous studies.[22, 35, 36] The small sample size, relatively low event rate, or predominance of heart failure with preserved ejection fraction may explain this inconsistency with prior studies.
Previous studies have reported hospital readmission rates for ADHF of 30% to 44% after 1 to 6 months.[6, 37] Goonewardena et al. showed a 41.3% readmission rate at 30 days in patients with severely reduced left ventricular ejection fraction (mean 29%), and readmitted patients had an IVCmax diameter >2 cm and an IVC collapsibility 50% on admission and discharge.[6] Carbone et al. demonstrated absence of improvement in the minimum IVC diameter from admission to discharge using hand‐carried ultrasound in patients with ischemic heart disease (ejection fraction 33%) predicted readmission at 60 days.[38] Hospital readmission rates in our study are consistent with these previously published studies. We found readmission rates for patients with ADHF and an admission IVCmax 1.9 cm to be 30.8% and 38.0% after 90 and 180 days, respectively.
Important limitations of our study are the small sample size and single institution setting. A larger sample size may have demonstrated that change in IVC diameter and NT‐proBNP levels from admission to discharge to be predictive of mortality or readmission. Further, we found an IVCmax diameter 1.9 cm to be the optimal cutoff to predict mortality, which is less than an IVCmax diameter >2.0 cm reported in other studies. The relatively smaller IVC diameter in Spanish heart failure patients may be explained by the lower body mass index of this population. An IVCmax diameter 1.9 cm was found to be the optimal cutoff to predict an elevated right atrial pressure >10 mm Hg in a study of Japanese cardiac patients with a relatively lower body mass index.[39] Another limitation is the timing of the admission IVC measurement within the first 24 hours of arrival to the hospital rather than immediately upon arrival to the emergency department. We were not able to control for interventions given in the emergency department prior to the measurement of the admission IVC, including doses of diuretics. Further, unlike the comprehensive TTEs in the United States, TTEs in Spain do not routinely include an assessment of the IVC. Therefore, we were not able to compare our bedside IVC measurements to those from a comprehensive TTE. An important limitation of our regression analysis is the inclusion of only 3 variables. The selection of variables (age, NT‐proBNP, and IVC diameter) was based on prior studies demonstrating their prognostic value.[6, 22, 25] Due to the low event rate (n = 11), we could not include in the regression model other variables that differed significantly between nonsurvivors and survivors, including NYHA class, presence of atrial fibrillation, and use of ‐blockers.
Perhaps in a larger study population the admission IVCmax diameter may not be as predictive of 90‐day mortality as other variables. The findings of our exploratory analysis should be confirmed in a future study with a larger sample size.
The clinical implications of our study are 3‐fold. First, our study demonstrates that IVC images acquired by a hospitalist at the bedside using a portable ultrasound machine can be used to predict postdischarge mortality and readmission of patients with ADHF. Second, the predominant type of heart failure in our study was heart failure with preserved ejection fraction. Currently, approximately 50% of patients hospitalized with ADHF have heart failure with preserved ejection fraction.[40] Our study adds to the understanding of prognosis of these patients whose heart failure pathophysiology is not well understood. Finally, palliative care services are underutilized in patients with advanced heart failure.[41, 42] IVC measurements and other prognostic markers in heart failure may guide discussions about goals of care with patients and families, and facilitate timely referrals for palliative care services.
CONCLUSIONS
Point‐of‐care ultrasound evaluation of IVC diameter at the time of admission can be used to prognosticate patients hospitalized with acute decompensated heart failure. An admission IVCmax diameter 1.9 cm is associated with a higher rate of 90‐day and 180‐day readmission and mortality after hospitalization. Future studies should evaluate the combination of IVC characteristics with other markers of severity of illness to prognosticate patients with heart failure.
Disclosures
This study was supported by a grant from the Madrid‐Castilla la Mancha Society of Internal Medicine. Dr. Restrepo is partially supported by award number K23HL096054 from the National Heart, Lung, and Blood Institute. The content is solely the responsibility of the authors and does not necessarily represent the official views of the National Heart, Lung, and Blood Institute or the National Institutes of Health. The authors report no conflicts of interest.
- , , , et al. Heart disease and stroke statistics—2015 update: a report from the American Heart Association. Circulation. 2015;131(4):e29–e322.
- , , . Hospitalization for congestive heart failure: United States, 2000–2010. NCHS Data Brief. 2012(108):1–8.
- , . Rehospitalization for heart failure: predict or prevent? Circulation. 2012;126(4):501–506.
- , , , et al. Generalizability and longitudinal outcomes of a national heart failure clinical registry: Comparison of Acute Decompensated Heart Failure National Registry (ADHERE) and non‐ADHERE Medicare beneficiaries. Am Heart J. 2010;160(5):885–892.
- , , , et al. Prognostic markers of acute decompensated heart failure: the emerging roles of cardiac biomarkers and prognostic scores. Arch Cardiovasc Dis. 2015;108(1):64–74.
- , , , et al. Comparison of hand‐carried ultrasound assessment of the inferior vena cava and N‐terminal pro‐brain natriuretic peptide for predicting readmission after hospitalization for acute decompensated heart failure. JACC Cardiovasc Imaging. 2008;1(5):595–601.
- , , , , . Echocardiography in acute heart failure: current perspectives. J Card Fail. 2016;22(1):82–94.
- , , , , . Usefulness of a hand‐held ultrasound device for bedside examination of left ventricular function. Am J Cardiol. 2002;90(9):1038–1039.
- , , , , , . Feasibility of point‐of‐care echocardiography by internal medicine house staff. Am Heart J. 2004;147(3):476–481.
- , , , , , . The use of small personal ultrasound devices by internists without formal training in echocardiography. Eur J Echocardiogr. 2003;4(2):141–147.
- , , , et al. Diagnostic accuracy of hospitalist‐performed hand‐carried ultrasound echocardiography after a brief training program. J Hosp Med. 2009;4(6):340–349.
- , , , . Point‐of‐care multi‐organ ultrasound improves diagnostic accuracy in adults presenting to the emergency department with acute dyspnea. West J Emerg Med. 2016;17(1):46–53.
- , , , , , . Acute heart failure: the role of focused emergency cardiopulmonary ultrasound in identification and early management. Eur J Heart Fail. 2015;17(12):1223–1227.
- , , , et al. Hand‐carried echocardiography by hospitalists: a randomized trial. Am J Med. 2011;124(8):766–774.
- , , , et al. ESC guidelines for the diagnosis and treatment of acute and chronic heart failure 2008: the Task Force for the diagnosis and treatment of acute and chronic heart failure 2008 of the European Society of Cardiology. Developed in collaboration with the Heart Failure Association of the ESC (HFA) and endorsed by the European Society of Intensive Care Medicine (ESICM). Eur J Heart Fail. 2008;10(10):933–989.
- , , , , , . Adaptation of the modified Barthel Index for use in physical medicine and rehabilitation in Turkey. Scand J Rehabil Med. 2000;32(2):87–92.
- , , , . Complications, comorbidities, and mortality: improving classification and prediction. Health Serv Res. 1997;32(2):229–238; discussion 239–242.
- , , , et al. Guidelines for the echocardiographic assessment of the right heart in adults: a report from the American Society of Echocardiography endorsed by the European Association of Echocardiography, a registered branch of the European Society of Cardiology, and the Canadian Society of Echocardiography. J Am Soc Echocardiogr. 2010;23(7):685–713; quiz 786–688.
- , , , et al. Recommendations for chamber quantification: a report from the American Society of Echocardiography's Guidelines and Standards Committee and the Chamber Quantification Writing Group, developed in conjunction with the European Association of Echocardiography, a branch of the European Society of Cardiology. J Am Soc Echocardiogr. 2005;18(12):1440–1463.
- , , , , . Mortality and functional evolution at one year after hospital admission due to heart failure (HF) in elderly patients. Arch Gerontol Geriatr. 2012;54(1):261–265.
- , , , et al. Early and long‐term outcomes of heart failure in elderly persons, 2001–2005. Arch Intern Med. 2008;168(22):2481–2488.
- , , , et al. IVC diameter in patients with chronic heart failure: relationships and prognostic significance. JACC Cardiovasc Imaging. 2013;6(1):16–28.
- , , , et al. Prognostic significance of dilated inferior vena cava in advanced decompensated heart failure. Int J Cardiovasc Imaging. 2014;30(7):1289–1295.
- , , . A dilated inferior vena cava is a marker of poor survival. Am Heart J. 2006;151(3):730–735.
- , , , et al. Predischarge B‐type natriuretic peptide assay for identifying patients at high risk of re‐admission after decompensated heart failure. J Am Coll Cardiol. 2004;43(4):635–641.
- , , , et al. A rapid bedside test for B‐type peptide predicts treatment outcomes in patients admitted for decompensated heart failure: a pilot study. J Am Coll Cardiol. 2001;37(2):386–391.
- , , , , , . N‐terminal‐pro‐brain natriuretic peptide predicts outcome after hospital discharge in heart failure patients. Circulation. 2004;110(15):2168–2174.
- , , , , , . Lowered B‐type natriuretic peptide in response to levosimendan or dobutamine treatment is associated with improved survival in patients with severe acutely decompensated heart failure. J Am Coll Cardiol. 2009;53(25):2343–2348.
- , , , . Long‐term clinical variation of NT‐proBNP in stable chronic heart failure patients. Eur Heart J. 2007;28(2):177–182.
- , , , et al. Right atrial volume index in chronic systolic heart failure and prognosis. JACC Cardiovasc Imaging. 2009;2(5):527–534.
- , , , et al. Pulmonary pressures and death in heart failure: a community study. J Am Coll Cardiol. 2012;59(3):222–231.
- , , , et al. A comparison by medicine residents of physical examination versus hand‐carried ultrasound for estimation of right atrial pressure. Am J Cardiol. 2007;99(11):1614–1616.
- , , . Noninvasive estimation of right atrial pressure from the inspiratory collapse of the inferior vena cava. Am J Cardiol. 1990;66(4):493–496.
- , , , , , . Relationship between right and left‐sided filling pressures in 1000 patients with advanced heart failure. J Heart Lung Transplant. 1999;18(11):1126–1132.
- , , , et al. Admission B‐type natriuretic peptide levels and in‐hospital mortality in acute decompensated heart failure. J Am Coll Cardiol. 2007;49(19):1943–1950.
- , , , et al. State of the art: using natriuretic peptide levels in clinical practice. Eur J Heart Fail. 2008;10(9):824–839.
- , , , et al. Readmission after hospitalization for congestive heart failure among Medicare beneficiaries. Arch Intern Med. 1997;157(1):99–104.
- , , , et al. Inferior vena cava parameters predict re‐admission in ischaemic heart failure. Eur J Clin Invest. 2014;44(4):341–349.
- , , , et al. Estimation of right atrial pressure on inferior vena cava ultrasound in Asian patients. Circ J. 2014;78(4):962–966.
- , , , , . Clinical presentation, management, and in‐hospital outcomes of patients admitted with acute decompensated heart failure with preserved systolic function: a report from the Acute Decompensated Heart Failure National Registry (ADHERE) Database. J Am Coll Cardiol. 2006;47(1):76–84.
- , , , , . Palliative care referral among patients hospitalized with advanced heart failure. J Palliat Med. 2014;17(10):1115–1120.
- , , . Engaging heart failure clinicians to increase palliative care referrals: overcoming barriers, improving techniques. J Palliat Med. 2014;17(7):753–760.
Heart failure costs the United States an excess of $30 billion annually, and costs are projected to increase to nearly $70 billion by 2030.[1] Heart failure accounts for over 1 million hospitalizations and is the leading cause of hospitalization in patients >65 years of age.[2] After hospitalization, approximately 50% of patients are readmitted within 6 months of hospital discharge.[3] Mortality rates from heart failure have improved but remain high.[4] Approximately 50% of patients diagnosed with heart failure die within 5 years, and the overall 1‐year mortality rate is 30%.[1]
Prognostic markers and scoring systems for acute decompensated heart failure (ADHF) continue to emerge, but few bedside tools are available to clinicians. Age, brain natriuretic peptide, and N‐terminal pro‐brain natriuretic peptide (NT‐proBNP) levels have been shown to correlate with postdischarge rates of readmission and mortality.[5] A study evaluating the prognostic value of a bedside inferior vena cava (IVC) ultrasound exam demonstrated that lack of improvement in IVC distention from admission to discharge was associated with higher 30‐day readmission rates.[6] Two studies using data from comprehensive transthoracic echocardiograms in heart failure patients demonstrated that a dilated, noncollapsible IVC is associated with higher risk of mortality; however, it is well recognized that obtaining comprehensive transthoracic echocardiograms in all patients hospitalized with heart failure is neither cost‐effective nor practical.[7]
In recent years, multiple studies have emerged demonstrating that noncardiologists can perform focused cardiac ultrasound exams with high reproducibility and accuracy to guide management of patients with ADHF.[8, 9, 10, 11, 12, 13, 14] However, it is unknown whether IVC characteristics from a focused cardiac ultrasound exam performed by a noncardiologist can predict mortality of patients hospitalized with ADHF. The aim of this study was to assess whether a hospitalist‐performed focused ultrasound exam to measure the IVC diameter at admission and discharge can predict mortality in a general medicine ward population hospitalized with ADHF.
METHODS
Study Design
A prospective, observational study of patients admitted to a general medicine ward with ADHF between January 2012 and March 2013 was performed using convenience sampling. The setting was a 247‐bed, university‐affiliated hospital in Madrid, Spain. Inclusion criteria were adult patients admitted with a primary diagnosis of ADHF per the European Society of Cardiology (ESC) criteria.[15] Exclusion criteria were admission to the intensive care unit for mechanical ventilation, need for chronic hemodialysis, or a noncardiac terminal illness with a life expectancy of less than 3 months. All patients provided written informed consent prior to enrollment. This study complies with the Declaration of Helsinki and was approved by the local ethics committee.
The primary outcome was all‐cause mortality at 90 days after hospitalization. The secondary outcomes were hospital readmission at 90 and 180 days, and mortality at 180 days. Patients were prospectively followed up at 30, 60, 90, and 180 days after discharge by telephone interview or by review of the patient's electronic health record. Patients who died within 90 days of discharge were categorized as nonsurvivors, whereas those alive at 90 days were categorized as survivors.
The following data were recorded on admission: age, gender, blood pressure, heart rate, functional class per New York Heart Association (NYHA) classification, comorbidities (hypertension, diabetes mellitus, atrial fibrillation, chronic obstructive pulmonary disease), primary etiology of heart failure, medications, electrocardiogram, NT‐terminal pro‐BNP, hemoglobin, albumin, creatinine, sodium, measurement of performance of activities of daily living (modified Barthel index), and comorbidity score (age‐adjusted Charlson score). A research coordinator interviewed subjects to gather data to calculate a modified Barthel index.[16] Age‐adjusted Charlson comorbidity scores were calculated using age and diagnoses per International Classification of Diseases, Ninth Revision coding.[17]
IVC Measurement
An internal medicine hospitalist with expertise in point‐of‐care ultrasonography (G.G.C.) performed all focused cardiac ultrasound exams to measure the IVC diameter and collapsibility at the time of admission and discharge. This physician was not involved in the inpatient medical management of study subjects. A second physician (N.J.S.) randomly reviewed 10% of the IVC images for quality assurance. Admission IVC measurements were acquired within 24 hours of arrival to the emergency department after the on‐call medical team was contacted to admit the patient. Measurement of the IVC maximum (IVCmax) and IVC minimum (IVCmin) diameters was obtained just distal to the hepatic veinIVC junction, or 2 cm from the IVCright atrial junction using a long‐axis view of the IVC. Measurement of the IVC diameter was consistent with the technique recommended by the American Society of Echocardiography and European Society of Echocardiography guidelines.[18, 19] The IVC collapsibility index (IVCCI) was calculated as (IVCmaxIVCmin)/IVCmax per guidelines.[18] Focused cardiac ultrasound exams were performed using a General Electric Logiq E device (GE Healthcare, Little Chalfont, United Kingdom) with a 3.5 MHz curvilinear transducer. Inpatient medical management by the primary medical team was guided by protocols from the ESC guidelines on the treatment of ADHF.[15] A comprehensive transthoracic echocardiogram (TTE) was performed on all study subjects by the echocardiography laboratory within 24 hours of hospitalization as part of the study protocol. One of 3 senior cardiologists read all comprehensive TTEs. NT‐proBNP was measured on admission and discharge by electrochemiluminescence.
Statistical Analysis
We calculated the required sample size based on published mortality and readmission rates. For our primary outcome of 90‐day mortality, we calculated a required sample size of 64 to achieve 80% power based on 90‐day and 1‐year mortality rates of 21% and 33%, respectively, among Spanish elderly patients (age 70 years) hospitalized with ADHF.[20] For our secondary outcome of 90‐day readmissions, we calculated a sample size of 28 based on a 41% readmission rate.[21] Therefore, our target subject enrollment was at least 70 patients to achieve a power of 80%.
Statistical analyses were performed using SPSS 17.0 statistical package (SPSS Inc., Chicago, IL). Subject characteristics that were categorical variables (demographics and comorbidities) were summarized as counts and percentages. Continuous variables, including IVC measurements, were summarized as means with standard deviations. Differences between categorical variables were analyzed using the Fisher exact test. Survival curves with log‐rank statistics were used to perform survival analysis. The nonparametric Mann‐Whitney U test was used to assess associations between the change in IVCCI, and readmissions and mortality at 90 and 180 days. Predictors of readmission and death were evaluated using a multivariate Cox proportional hazards regression analysis. Given the limited number of primary outcome events, we used age, IVC diameter, and log NT‐proBNP in the multivariate regression analysis based on past studies showing prognostic significance of these variables.[6, 22, 23, 24, 25, 26, 27, 28] Optimal cutoff values for IVC diameter for death and readmission prediction were determined by constructing receiver operating characteristic (ROC) curves and calculating the area under the curve (AUC) for different IVC diameters. NT‐proBNP values were log‐transformed to minimize skewing as reported in previous studies.[29]
RESULTS
Patient Characteristics
Ninety‐seven patients admitted with ADHF were recruited for the study. Optimal acoustic windows to measure the IVC diameter were acquired in 90 patients (93%). Because measurement of discharge IVC diameter was required to calculate the change from admission to discharge, 8 patients who died during initial hospitalization were excluded from the final data analysis. An additional two patients were excluded due to missing discharge NT‐proBNP measurement or missing comprehensive echocardiogram data. The study cohort from whom data were analyzed included 80 of 97 total patients (82%).
Baseline demographic, clinical, laboratory, and comprehensive echocardiographic characteristics of nonsurvivors and survivors at 90 days are demonstrated in Table 1. Eleven patients (13.7%) died during the first 90 days postdischarge, and all deaths were due to cardiovascular complications. Nonsurvivors were older (86 vs 76 years; P = 0.02), less independent in performance of their activities of daily living (Barthel index of 58.1 vs 81.9; P = 0.01), and were more likely to have advanced heart failure with an NYHA functional class of III or IV (72% vs 33%; P = 0.016). Atrial fibrillation (90% vs 55%; P = 0.008) and lower systolic blood pressure (127 mm Hg vs 147 mm Hg; P = 0.01) were more common in nonsurvivors than survivors, and fewer nonsurvivors were taking a ‐blocker (18% vs 59%; P = 0.01). Baseline comprehensive echocardiographic findings were similar between the survivors and nonsurvivors, except left atrial diameter was larger in nonsurvivors versus survivors (54 mm vs 49 mm; P = 0.04).
| Total Cohort, n = 80 | Nonsurvivors, n = 11 | Survivors, n = 69 | P Value | |
|---|---|---|---|---|
| ||||
| Demographics | ||||
| Age, y* | 78 (13) | 86 (7) | 76 (14) | 0.02 |
| Men, n (%) | 34 (42) | 3 (27) | 26 (38) | 0.3 |
| Vital signs* | ||||
| Heart rate, beats/min | 94 (23) | 99 (26) | 95 (23) | 0.5 |
| SBP, mm Hg | 141 (27) | 127 (22) | 147 (25) | 0.01 |
| Comorbidities, n (%) | ||||
| Hypertension | 72 (90) | 10 (91) | 54 (78) | 0.3 |
| Diabetes mellitus | 35 (44) | 3 (27) | 26 (38) | 0.3 |
| Atrial fibrillation | 48 (60) | 10 (90) | 38 (55) | 0.008 |
| COPD | 22 (27) | 3 (27) | 16 (23) | 0.5 |
| Etiology of heart failure | ||||
| Ischemic | 20 (25) | 1 (9) | 16 (23) | 0.1 |
| Hypertensive | 22 (27) | 2 (18) | 18 (26) | 0.4 |
| Valvulopathy | 29 (36) | 7 (64) | 19 (27) | 0.07 |
| Other | 18 (22) | 1 (9) | 16 (23) | 0.09 |
| NYHA IIIIV | 38 (47) | 8 (72) | 23 (33) | 0.016 |
| Charlson score* | 7.5 (2) | 9.0 (3) | 7.1 (2) | 0.02 |
| Barthel index* | 76 (31) | 58 (37) | 81.9 (28) | 0.01 |
| Medications | ||||
| ‐blocker | 44 (55) | 2 (18) | 41 (59) | 0.01 |
| ACE inhibitor/ARB | 48 (60) | 3 (27) | 35 (51) | 0.1 |
| Loop diuretic | 78 (97) | 10 (91) | 67 (97) | 0.9 |
| Aldosterone antagonist | 31 (39) | 4 (36) | 21 (30) | 0.4 |
| Lab results* | ||||
| Sodium, mmol/L | 137 (4.8) | 138 (6) | 139 (4) | 0.6 |
| Creatinine, umol/L | 1.24 (0.4) | 1.40 (0.5) | 1.17 (0.4) | 0.1 |
| eGFR, mL/min | 57.8 (20) | 51.2 (20) | 60.2 (19) | 0.1 |
| Albumin, g/L | 3.4 (0.4) | 3.3 (0.38) | 3.5 (0.41) | 0.1 |
| Hemoglobin, g/dL | 12.0 (2) | 10.9 (1.8) | 12.5 (2.0) | 0.01 |
| Echo parameters* | ||||
| LVEF, % | 52.1 (15) | 51.9 (17) | 51.6 (15) | 0.9 |
| LA diameter, mm | 50.1 (10) | 54 (11) | 49 (11) | 0.04 |
| RVDD, mm | 32.0 (11) | 34 (10) | 31 (11) | 0.2 |
| TAPSE, mm | 18.5 (7) | 17.4 (4) | 18.8 (7) | 0.6 |
| PASP, mm Hg | 51.2 (16) | 53.9 (17) | 50.2 (17) | 0.2 |
| Admission* | ||||
| NT‐proBNP, pg/mL | 8,816 (14,260) | 9,413 (5,703) | 8,762 (15,368) | 0.81 |
| Log NT‐proBNP | 3.66 (0.50) | 3.88 (0.31 | 3.62 (0.52) | 0.11 |
| IVCmax, cm | 2.12 (0.59) | 2.39 (0.37) | 2.06 (0.59) | 0.02 |
| IVCmin, cm | 1.63 (0.69) | 1.82 (0.66) | 1.56 (0.67) | 0.25 |
| IVCCI, % | 25.7 (0.16) | 25.9 (17.0) | 26.2 (16.0) | 0.95 |
| Discharge* | ||||
| NT‐proBNP, pg/mL | 3,132 (3,093) | 4,693 (4,383) | 2,909 (2,847) | 0.08 |
| Log NT‐proBNP | 3.27 (0.49) | 3.51 (0.37) | 3.23 (0.50) | 0.08 |
| IVCmax, cm | 1.87 (0.68) | 1.97 (0.54) | 1.81 (0.66) | 0.45 |
| IVCmin, cm | 1.33 (0.75) | 1.40 (0.65) | 1.27 (0.71) | 0.56 |
| IVCCI, % | 33.1 (0.20) | 32.0 (21.0) | 34.2 (19.0) | 0.74 |
From admission to discharge, the total study cohort demonstrated a highly statistically significant reduction in NT‐proBNP (8816 vs 3093; P 0.001), log NT‐proBNP (3.66 vs 3.27; P 0.001), IVCmax (2.12 vs 1.87; P 0.001), IVCmin (1.63 vs 1.33; P 0.001), and IVCCI (25.7% vs 33.1%; P 0.001). The admission and discharge NT‐proBNP and IVC characteristics of the survivors and nonsurvivors are displayed in Table 2. The only statistically significant difference between nonsurvivors and survivors was the admission IVCmax (2.39 vs 2.06; P = 0.02). There was not a statistically significant difference in the discharge IVCmax between nonsurvivors and survivors.
| Admission | Discharge | Difference (DischargeAdmission) | |||||||
|---|---|---|---|---|---|---|---|---|---|
| Nonsurvivors | Survivors | P Value | Nonsurvivors | Survivors | P Value | Nonsurvivors | Survivors | P Value | |
| |||||||||
| NT‐proBNP, pg/mL | 9,413 (5,703) | 8,762 (15,368) | 0.81 | 4,693 (4,383) | 2,909 (2,847) | 0.08 | 3,717 5,043 | 5,026 11,507 | 0.7 |
| Log NT‐proBNP | 3.88 0.31 | 3.62 0.52 | 0.11 | 3.51 0.37 | 3.23 0.50 | 0.08 | 0.29 0.36 | 0.38 0.37 | 0.4 |
| IVCmax, cm | 2.39 0.37 | 2.06 0.59 | 0.02 | 1.97 0.54 | 1.81 0.66 | 0.45 | 0.39 0.56 | 0.25 0.51 | 0.4 |
| IVCmin, cm | 1.82 0.66 | 1.56 0.67 | 0.25 | 1.40 0.65 | 1.27 0.71 | 0.56 | 0.37 0.52 | 0.30 0.64 | 0.7 |
| IVCCI, % | 25.9 17.0 | 26.2 16.0 | 0.95 | 32.0 21.0 | 34.2 19.0 | 0.74 | 3.7 7.9 | 8.3 22 | 0.5 |
Outcomes
For the primary outcome of 90‐day mortality, the ROC curves showed a similar AUC for the admission IVCmax diameter (AUC: 0.69; 95% confidence interval [CI]: 0.53‐0.85), log NT‐proBNP at discharge (AUC: 0.67; 95% CI: 0.49‐0.85), and log NT‐proBNP at admission (AUC: 0.69; 95% CI: 0.52‐0.85). The optimal cutoff value for the admission IVCmax diameter to predict mortality was 1.9 cm (sensitivity 100%, specificity 38%) based on the ROC curves (see Supporting Information, Appendices 1 and 2, in the online version of this article). An admission IVCmax diameter 1.9 cm was associated with a higher mortality rate at 90 days (25.4% vs 3.4%; P = 0.009) and 180 days (29.3% vs 3.4%; P = 0.003). The Cox survival curves showed significantly lower survival rates in patients with an admission IVCmax diameter 1.9 cm (74.1 vs 96.7%; P = 0.012) (Figures 1 and 2). Based on the multivariate Cox proportional hazards regression analysis with age, IVCmax diameter, and log NT‐proBNP at admission, the admission IVCmax diameter and age were independent predictors of 90‐ and 180‐day mortality. The hazard ratios for death by age, admission IVCmax diameter, and log NT‐proBNP are shown in Table 3.
| Endpoint | Variable | HR (95% CI) | P Value |
|---|---|---|---|
| |||
| 90‐day mortality | Age | 1.14 (1.031.26) | 0.009 |
| IVC diameter at admission | 5.88 (1.2128.1) | 0.025 | |
| Log NT‐proBNP at admission | 1.00 (1.001.00) | 0.910 | |
| 90‐day readmission | Age | 1.06 (1.001.12) | 0.025 |
| IVC diameter at admission | 3.20 (1.248.21) | 0.016 | |
| Log NT‐proBNP at discharge | 1.00 (1.001.00) | 0.910 | |
| 180‐day mortality | Age | 1.12 (1.031.22) | 0.007 |
| IVC diameter at admission | 4.77 (1.2118.7) | 0.025 | |
| Log NT‐proBNP at admission | 1.00 (1.001.00) | 0.610 | |
| 180‐day readmission | Age | 1.06 (1.011.11) | 0.009 |
| IVC diameter at admission | 2.56 (1.145.74) | 0.022 | |
| Log NT‐proBNP at discharge | 1.00 (1.001.00) | 0.610 | |
For the secondary outcome of 90‐day readmissions, 19 patients (24%) were readmitted, and the mean index admission IVCmax diameter was significantly greater in patients who were readmitted (2.36 vs 1.98 cm; P = 0.04). The ROC curves for readmission at 90 days showed that an index admission IVCmax diameter of 1.9 cm had the greatest AUC (0.61; 95% CI: 0.49‐0.74). The optimal cutoff value of an index admission IVCmax to predict readmission was also 1.9 cm (sensitivity 94%, specificity 42%) (see Supporting Information, Appendices 1 and 2, in the online version of this article). The Cox survival analysis showed that patients with an index admission IVCmax diameter 1.9 cm had a higher readmission rate at 90 days (30.8% vs 10.7%; P = 0.04) and 180 days (38.0 vs 14.3%; P = 0.02) (Figures 1 and 2). Using a multivariate Cox proportional regression analysis, the hazard ratios for the variables of age, admission IVCmax diameter, and log NT‐proBNP are shown in Table 3.
DISCUSSION
Our study found that a dilated IVC at admission is associated with a poor prognosis after hospitalization for ADHF. Patients with a dilated IVC 1.9 cm at admission had higher mortality and readmission rates at 90 and 180 days postdischarge.
The effect of a dilated IVC on mortality may be mediated through unrecognized right ventricular disease with or without significant pulmonary hypertension, supporting the notion that right heart function is an important determinant of prognosis in patients with ADHF.[30, 31] Similar to elevated jugular venous distension, bedside ultrasound examination of the IVC diameter can serve as a rapid and noninvasive measurement of right atrial pressure.[32] Elevated right atrial pressure is most often due to elevated left ventricular filling pressure transmitted via the pulmonary vasculature, but it is important to note that right‐ and left‐sided cardiac pressures are often discordant in heart failure patients.[33, 34]
Few studies have evaluated the prognostic value of IVC diameter and collapsibility in patients with heart failure. Nath et al.[24] evaluated the prognostic value of IVC diameter in stable veterans referred for outpatient echocardiography. Patients with a dilated IVC >2 cm that did not collapse with inspiration had higher 90‐day and 1‐year mortality rates. A subsequent study by Pellicori et al.[22] investigated the relationship between IVC diameter and other prognostic markers in stable cardiac patients. Pellicori et al. demonstrated that IVC diameter and serum NT‐proBNP levels were independent predictors of a composite endpoint of cardiovascular death or heart failure hospitalization at 1 year.[22] Most recently, Lee et al.[23] evaluated whether a dilated IVC in patients with a history of advanced systolic heart failure with a reduced ejection fraction of 30% and repeated hospitalizations (2) predicted worsening renal failure and adverse cardiovascular outcomes (death or hospitalization for ADHF). The study concluded that age, IVC diameter >2.1 cm, and worsening renal failure predicted cardiovascular death or hospitalization for ADHF.[23]
Our study demonstrated that an admission IVCmax 1.9 cm in hospitalized ADHF patients predicted higher postdischarge mortality at 90 and 180 days. Our findings are consistent with the above‐mentioned studies with a few important differences. First, all of our patients were hospitalized with acute decompensated heart failure. Nath et al. and Pellicori et al. evaluated stable ambulatory patients seen in an echocardiography lab and cardiology clinic, respectively. Only 12.1% of patients in the Nath study had a history of heart failure, and none were reported to have ADHF. More importantly, our study improves our understanding of patients with heart failure with a preserved ejection fraction, an important gap in the literature. The mean ejection fraction of patients in our study was 52% consistent with heart failure with preserved ejection fraction, whereas patients in the Pellicori et al. and Lee et al. studies had heart failure with reduced (42%) or severely reduced (30%) ejection fraction, respectively. We did not anticipate finding heart failure with preserved ejection fraction in the majority of patients, but our study's findings will add to our understanding of this increasingly common type of heart failure.
Compared to previous studies that utilized a registered diagnostic cardiac sonographer to obtain a comprehensive TTE to prognosticate patients, our study utilized point‐of‐care ultrasonography. Nath et al. commented that obtaining a comprehensive echocardiogram on every patient with ADHF is unlikely to be cost‐effective or feasible. Our study utilized a more realistic approach with a frontline internal medicinetrained hospitalist acquiring and interpreting images of the IVC at the bedside using a basic portable ultrasound machine.
Our study did not show that plasma natriuretic peptides levels are predictive of death or readmission after hospitalization for ADHF as shown in previous studies.[22, 35, 36] The small sample size, relatively low event rate, or predominance of heart failure with preserved ejection fraction may explain this inconsistency with prior studies.
Previous studies have reported hospital readmission rates for ADHF of 30% to 44% after 1 to 6 months.[6, 37] Goonewardena et al. showed a 41.3% readmission rate at 30 days in patients with severely reduced left ventricular ejection fraction (mean 29%), and readmitted patients had an IVCmax diameter >2 cm and an IVC collapsibility 50% on admission and discharge.[6] Carbone et al. demonstrated absence of improvement in the minimum IVC diameter from admission to discharge using hand‐carried ultrasound in patients with ischemic heart disease (ejection fraction 33%) predicted readmission at 60 days.[38] Hospital readmission rates in our study are consistent with these previously published studies. We found readmission rates for patients with ADHF and an admission IVCmax 1.9 cm to be 30.8% and 38.0% after 90 and 180 days, respectively.
Important limitations of our study are the small sample size and single institution setting. A larger sample size may have demonstrated that change in IVC diameter and NT‐proBNP levels from admission to discharge to be predictive of mortality or readmission. Further, we found an IVCmax diameter 1.9 cm to be the optimal cutoff to predict mortality, which is less than an IVCmax diameter >2.0 cm reported in other studies. The relatively smaller IVC diameter in Spanish heart failure patients may be explained by the lower body mass index of this population. An IVCmax diameter 1.9 cm was found to be the optimal cutoff to predict an elevated right atrial pressure >10 mm Hg in a study of Japanese cardiac patients with a relatively lower body mass index.[39] Another limitation is the timing of the admission IVC measurement within the first 24 hours of arrival to the hospital rather than immediately upon arrival to the emergency department. We were not able to control for interventions given in the emergency department prior to the measurement of the admission IVC, including doses of diuretics. Further, unlike the comprehensive TTEs in the United States, TTEs in Spain do not routinely include an assessment of the IVC. Therefore, we were not able to compare our bedside IVC measurements to those from a comprehensive TTE. An important limitation of our regression analysis is the inclusion of only 3 variables. The selection of variables (age, NT‐proBNP, and IVC diameter) was based on prior studies demonstrating their prognostic value.[6, 22, 25] Due to the low event rate (n = 11), we could not include in the regression model other variables that differed significantly between nonsurvivors and survivors, including NYHA class, presence of atrial fibrillation, and use of ‐blockers.
Perhaps in a larger study population the admission IVCmax diameter may not be as predictive of 90‐day mortality as other variables. The findings of our exploratory analysis should be confirmed in a future study with a larger sample size.
The clinical implications of our study are 3‐fold. First, our study demonstrates that IVC images acquired by a hospitalist at the bedside using a portable ultrasound machine can be used to predict postdischarge mortality and readmission of patients with ADHF. Second, the predominant type of heart failure in our study was heart failure with preserved ejection fraction. Currently, approximately 50% of patients hospitalized with ADHF have heart failure with preserved ejection fraction.[40] Our study adds to the understanding of prognosis of these patients whose heart failure pathophysiology is not well understood. Finally, palliative care services are underutilized in patients with advanced heart failure.[41, 42] IVC measurements and other prognostic markers in heart failure may guide discussions about goals of care with patients and families, and facilitate timely referrals for palliative care services.
CONCLUSIONS
Point‐of‐care ultrasound evaluation of IVC diameter at the time of admission can be used to prognosticate patients hospitalized with acute decompensated heart failure. An admission IVCmax diameter 1.9 cm is associated with a higher rate of 90‐day and 180‐day readmission and mortality after hospitalization. Future studies should evaluate the combination of IVC characteristics with other markers of severity of illness to prognosticate patients with heart failure.
Disclosures
This study was supported by a grant from the Madrid‐Castilla la Mancha Society of Internal Medicine. Dr. Restrepo is partially supported by award number K23HL096054 from the National Heart, Lung, and Blood Institute. The content is solely the responsibility of the authors and does not necessarily represent the official views of the National Heart, Lung, and Blood Institute or the National Institutes of Health. The authors report no conflicts of interest.
- , , , et al. Heart disease and stroke statistics—2015 update: a report from the American Heart Association. Circulation. 2015;131(4):e29–e322.
- , , . Hospitalization for congestive heart failure: United States, 2000–2010. NCHS Data Brief. 2012(108):1–8.
- , . Rehospitalization for heart failure: predict or prevent? Circulation. 2012;126(4):501–506.
- , , , et al. Generalizability and longitudinal outcomes of a national heart failure clinical registry: Comparison of Acute Decompensated Heart Failure National Registry (ADHERE) and non‐ADHERE Medicare beneficiaries. Am Heart J. 2010;160(5):885–892.
- , , , et al. Prognostic markers of acute decompensated heart failure: the emerging roles of cardiac biomarkers and prognostic scores. Arch Cardiovasc Dis. 2015;108(1):64–74.
- , , , et al. Comparison of hand‐carried ultrasound assessment of the inferior vena cava and N‐terminal pro‐brain natriuretic peptide for predicting readmission after hospitalization for acute decompensated heart failure. JACC Cardiovasc Imaging. 2008;1(5):595–601.
- , , , , . Echocardiography in acute heart failure: current perspectives. J Card Fail. 2016;22(1):82–94.
- , , , , . Usefulness of a hand‐held ultrasound device for bedside examination of left ventricular function. Am J Cardiol. 2002;90(9):1038–1039.
- , , , , , . Feasibility of point‐of‐care echocardiography by internal medicine house staff. Am Heart J. 2004;147(3):476–481.
- , , , , , . The use of small personal ultrasound devices by internists without formal training in echocardiography. Eur J Echocardiogr. 2003;4(2):141–147.
- , , , et al. Diagnostic accuracy of hospitalist‐performed hand‐carried ultrasound echocardiography after a brief training program. J Hosp Med. 2009;4(6):340–349.
- , , , . Point‐of‐care multi‐organ ultrasound improves diagnostic accuracy in adults presenting to the emergency department with acute dyspnea. West J Emerg Med. 2016;17(1):46–53.
- , , , , , . Acute heart failure: the role of focused emergency cardiopulmonary ultrasound in identification and early management. Eur J Heart Fail. 2015;17(12):1223–1227.
- , , , et al. Hand‐carried echocardiography by hospitalists: a randomized trial. Am J Med. 2011;124(8):766–774.
- , , , et al. ESC guidelines for the diagnosis and treatment of acute and chronic heart failure 2008: the Task Force for the diagnosis and treatment of acute and chronic heart failure 2008 of the European Society of Cardiology. Developed in collaboration with the Heart Failure Association of the ESC (HFA) and endorsed by the European Society of Intensive Care Medicine (ESICM). Eur J Heart Fail. 2008;10(10):933–989.
- , , , , , . Adaptation of the modified Barthel Index for use in physical medicine and rehabilitation in Turkey. Scand J Rehabil Med. 2000;32(2):87–92.
- , , , . Complications, comorbidities, and mortality: improving classification and prediction. Health Serv Res. 1997;32(2):229–238; discussion 239–242.
- , , , et al. Guidelines for the echocardiographic assessment of the right heart in adults: a report from the American Society of Echocardiography endorsed by the European Association of Echocardiography, a registered branch of the European Society of Cardiology, and the Canadian Society of Echocardiography. J Am Soc Echocardiogr. 2010;23(7):685–713; quiz 786–688.
- , , , et al. Recommendations for chamber quantification: a report from the American Society of Echocardiography's Guidelines and Standards Committee and the Chamber Quantification Writing Group, developed in conjunction with the European Association of Echocardiography, a branch of the European Society of Cardiology. J Am Soc Echocardiogr. 2005;18(12):1440–1463.
- , , , , . Mortality and functional evolution at one year after hospital admission due to heart failure (HF) in elderly patients. Arch Gerontol Geriatr. 2012;54(1):261–265.
- , , , et al. Early and long‐term outcomes of heart failure in elderly persons, 2001–2005. Arch Intern Med. 2008;168(22):2481–2488.
- , , , et al. IVC diameter in patients with chronic heart failure: relationships and prognostic significance. JACC Cardiovasc Imaging. 2013;6(1):16–28.
- , , , et al. Prognostic significance of dilated inferior vena cava in advanced decompensated heart failure. Int J Cardiovasc Imaging. 2014;30(7):1289–1295.
- , , . A dilated inferior vena cava is a marker of poor survival. Am Heart J. 2006;151(3):730–735.
- , , , et al. Predischarge B‐type natriuretic peptide assay for identifying patients at high risk of re‐admission after decompensated heart failure. J Am Coll Cardiol. 2004;43(4):635–641.
- , , , et al. A rapid bedside test for B‐type peptide predicts treatment outcomes in patients admitted for decompensated heart failure: a pilot study. J Am Coll Cardiol. 2001;37(2):386–391.
- , , , , , . N‐terminal‐pro‐brain natriuretic peptide predicts outcome after hospital discharge in heart failure patients. Circulation. 2004;110(15):2168–2174.
- , , , , , . Lowered B‐type natriuretic peptide in response to levosimendan or dobutamine treatment is associated with improved survival in patients with severe acutely decompensated heart failure. J Am Coll Cardiol. 2009;53(25):2343–2348.
- , , , . Long‐term clinical variation of NT‐proBNP in stable chronic heart failure patients. Eur Heart J. 2007;28(2):177–182.
- , , , et al. Right atrial volume index in chronic systolic heart failure and prognosis. JACC Cardiovasc Imaging. 2009;2(5):527–534.
- , , , et al. Pulmonary pressures and death in heart failure: a community study. J Am Coll Cardiol. 2012;59(3):222–231.
- , , , et al. A comparison by medicine residents of physical examination versus hand‐carried ultrasound for estimation of right atrial pressure. Am J Cardiol. 2007;99(11):1614–1616.
- , , . Noninvasive estimation of right atrial pressure from the inspiratory collapse of the inferior vena cava. Am J Cardiol. 1990;66(4):493–496.
- , , , , , . Relationship between right and left‐sided filling pressures in 1000 patients with advanced heart failure. J Heart Lung Transplant. 1999;18(11):1126–1132.
- , , , et al. Admission B‐type natriuretic peptide levels and in‐hospital mortality in acute decompensated heart failure. J Am Coll Cardiol. 2007;49(19):1943–1950.
- , , , et al. State of the art: using natriuretic peptide levels in clinical practice. Eur J Heart Fail. 2008;10(9):824–839.
- , , , et al. Readmission after hospitalization for congestive heart failure among Medicare beneficiaries. Arch Intern Med. 1997;157(1):99–104.
- , , , et al. Inferior vena cava parameters predict re‐admission in ischaemic heart failure. Eur J Clin Invest. 2014;44(4):341–349.
- , , , et al. Estimation of right atrial pressure on inferior vena cava ultrasound in Asian patients. Circ J. 2014;78(4):962–966.
- , , , , . Clinical presentation, management, and in‐hospital outcomes of patients admitted with acute decompensated heart failure with preserved systolic function: a report from the Acute Decompensated Heart Failure National Registry (ADHERE) Database. J Am Coll Cardiol. 2006;47(1):76–84.
- , , , , . Palliative care referral among patients hospitalized with advanced heart failure. J Palliat Med. 2014;17(10):1115–1120.
- , , . Engaging heart failure clinicians to increase palliative care referrals: overcoming barriers, improving techniques. J Palliat Med. 2014;17(7):753–760.
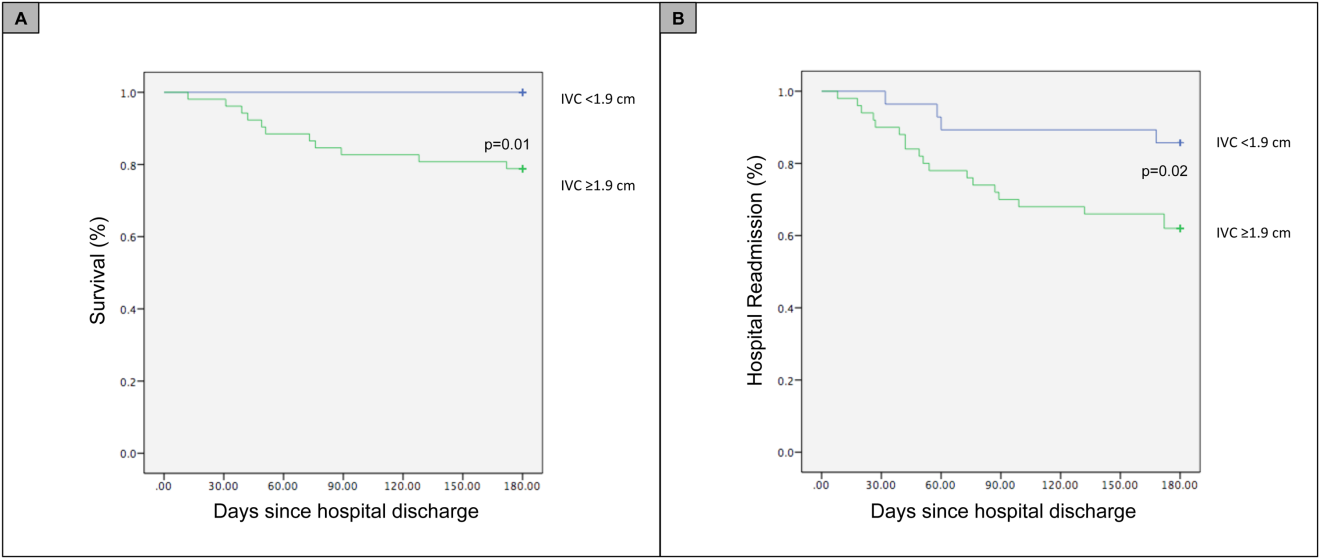
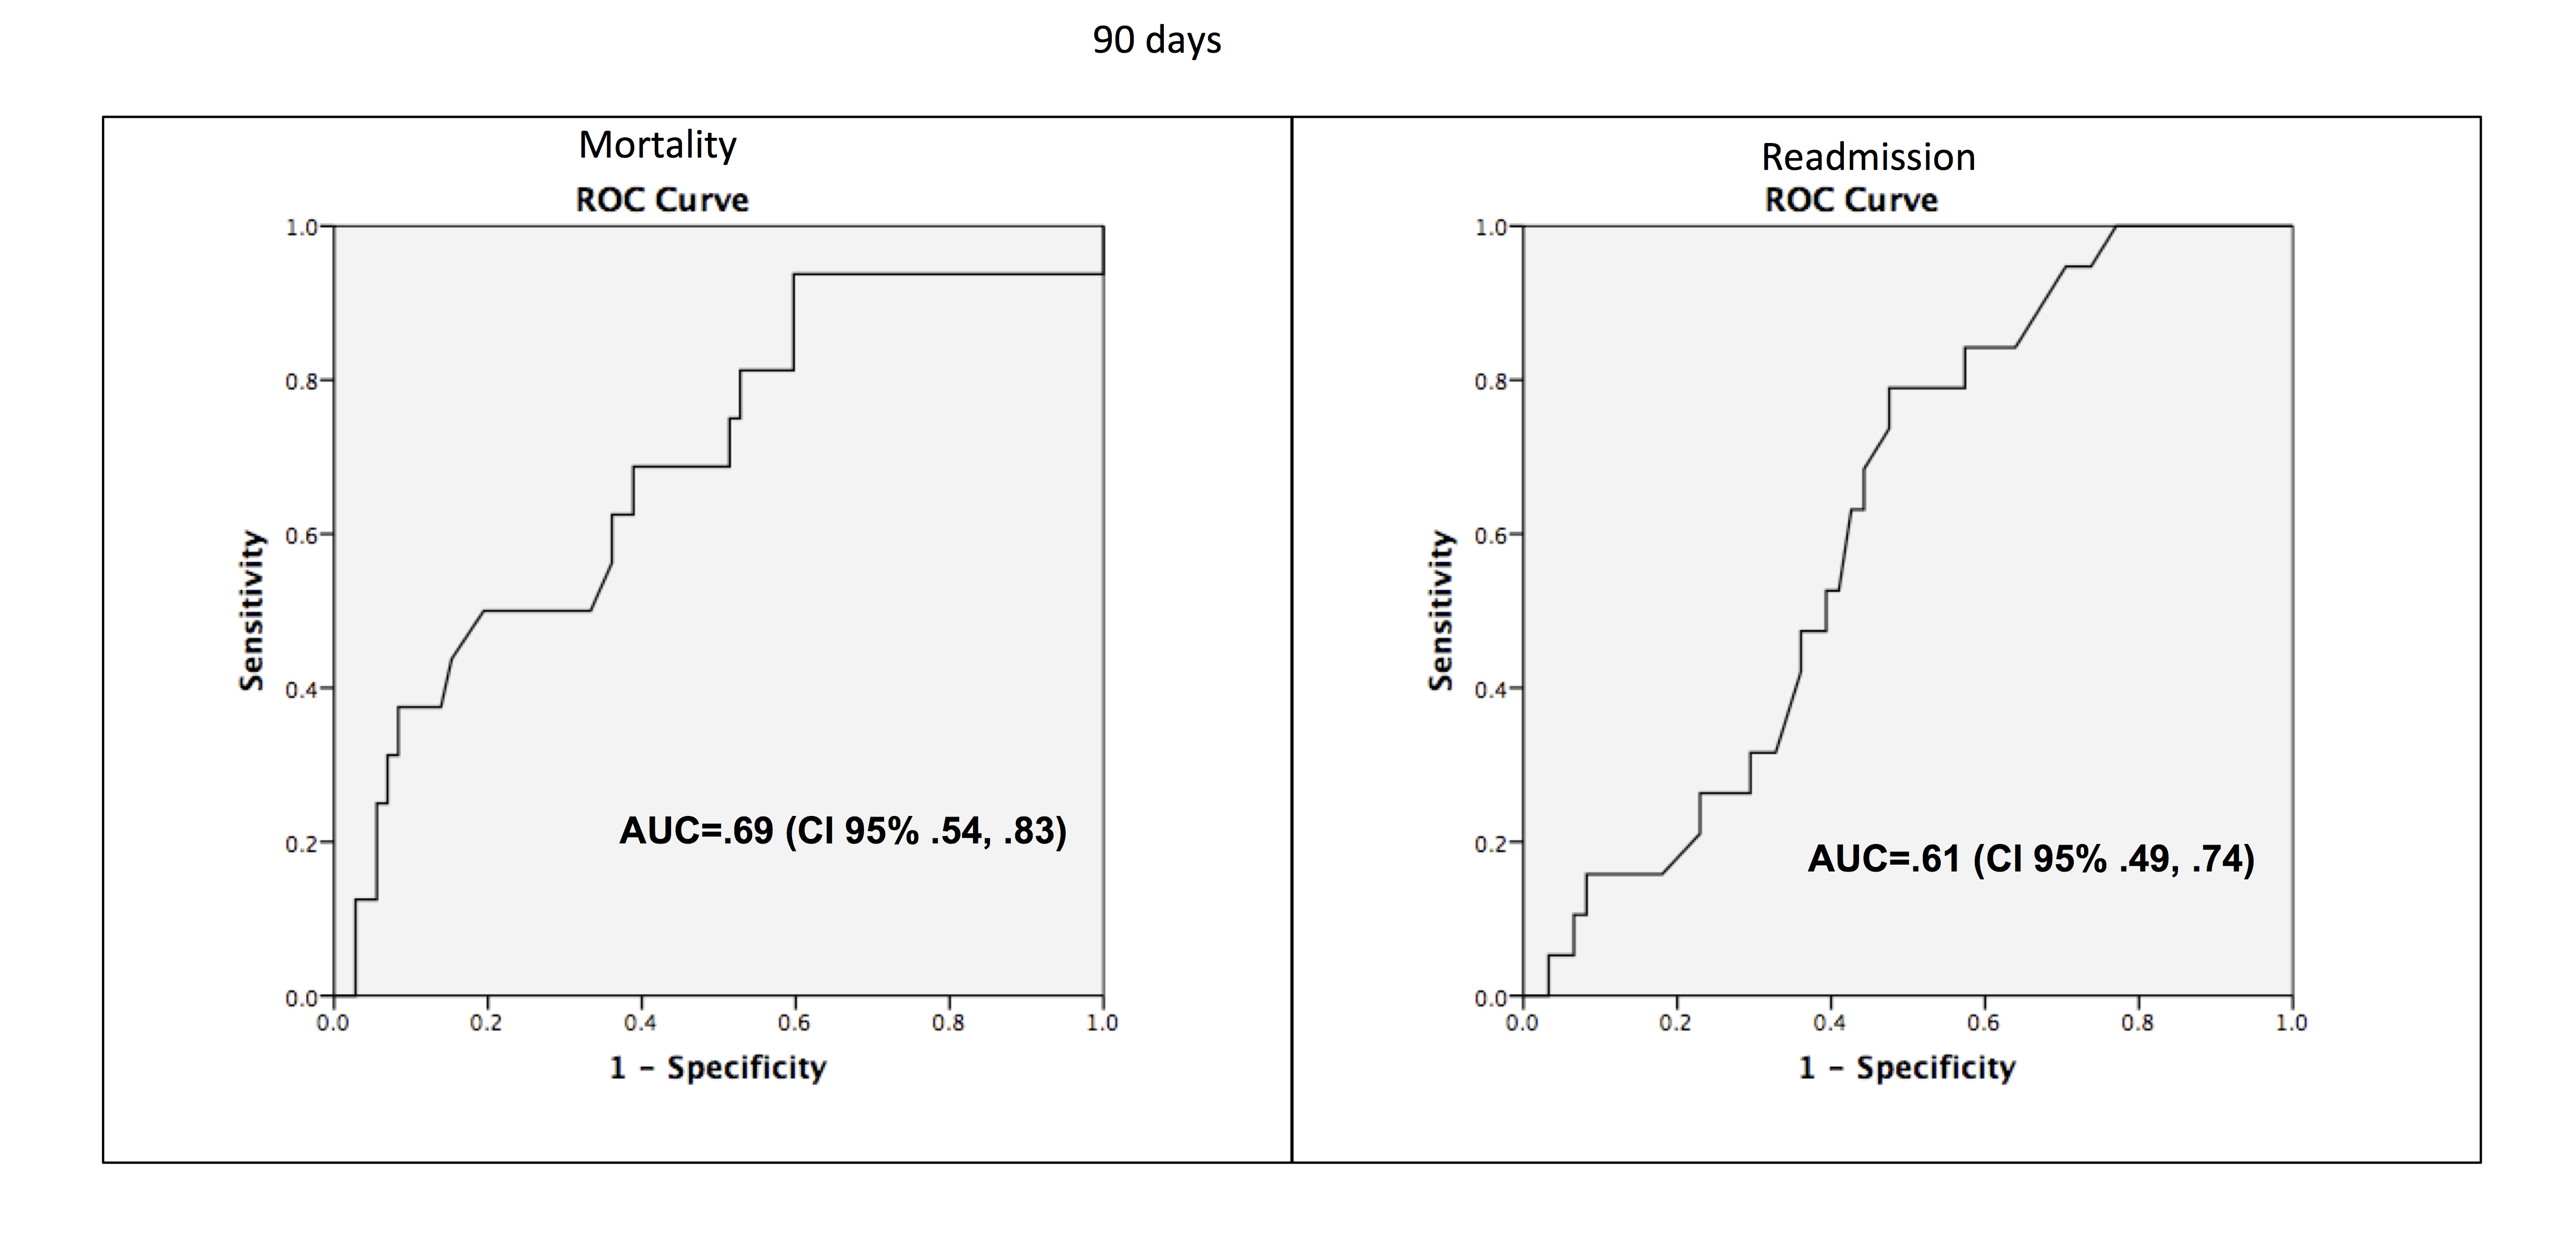
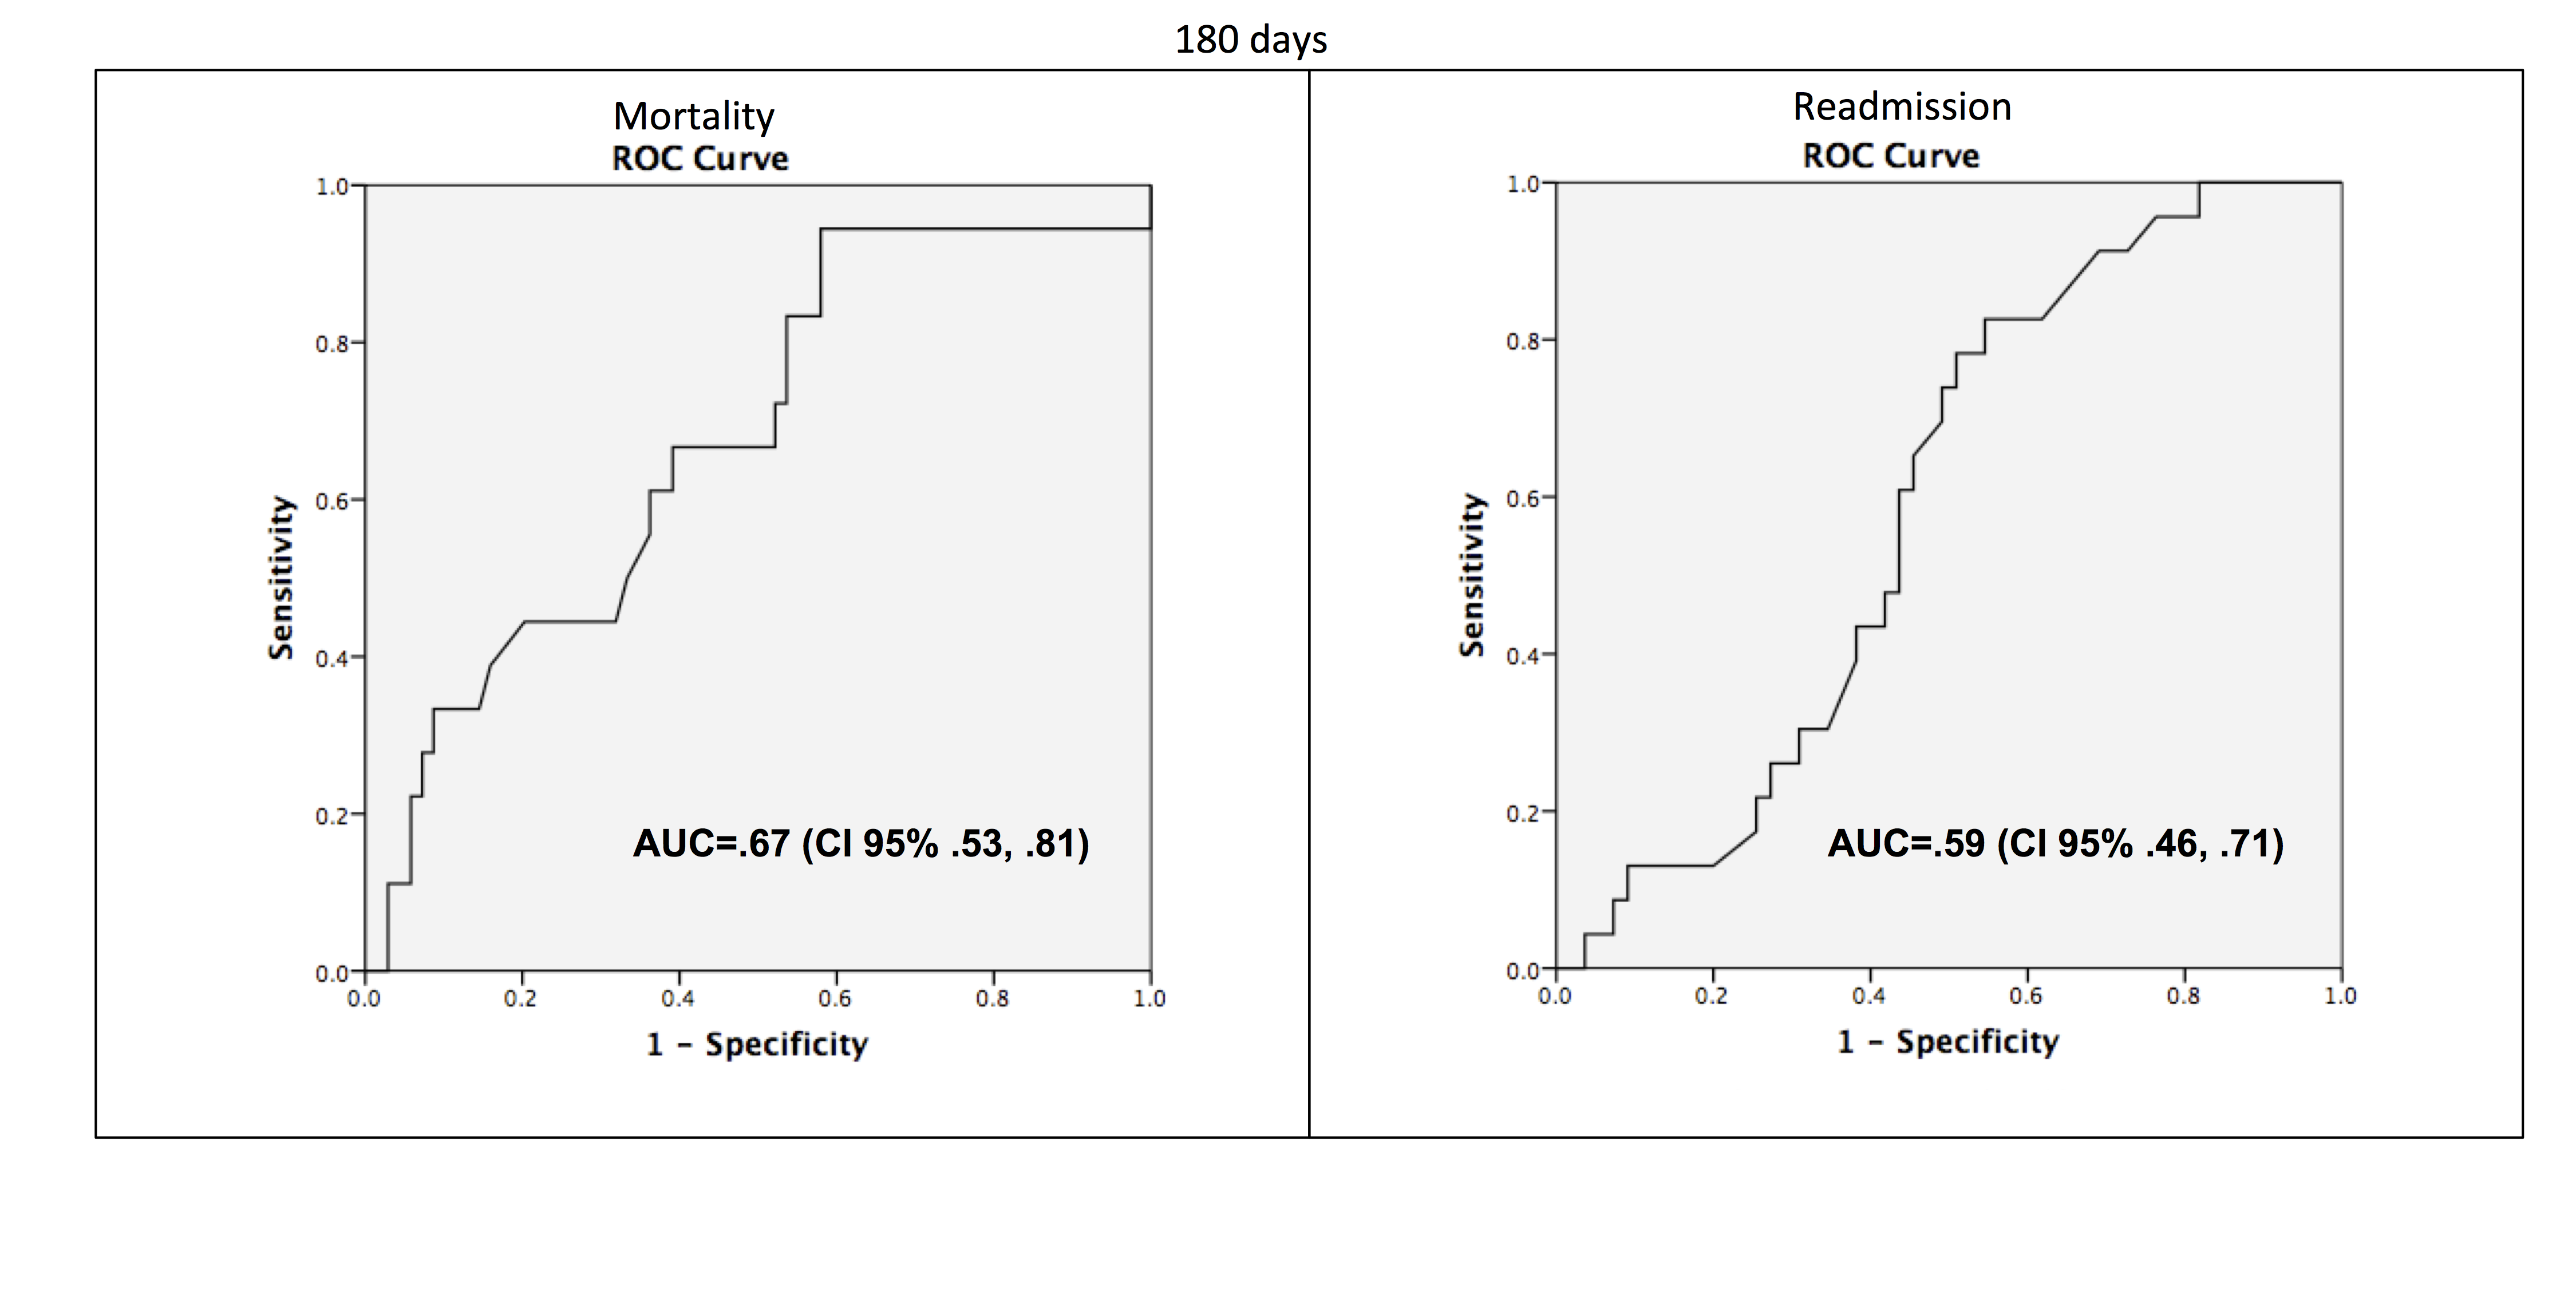
Mortality Due to Elevated Troponin
Acute coronary syndromes (ACS) are potentially lethal and present with a wide variety of symptoms. As such, physicians frequently order cardiac biomarkers, such as cardiac troponin, for patients with acute complaints. Elevated troponin is associated with higher risk of mortality regardless of the causes, which can be myriad, both chronic and acute.[1] Among patients with an elevated troponin, distinguishing ACS from non‐ACS can be challenging.
Making the distinction between ACS and non‐ACS troponin elevation is crucial because the underlying pathophysiology and subsequent management strategies are markedly different.[2] According to evidence‐based practice guidelines, ACS is managed with antiplatelet drugs, statins, and percutaneous coronary intervention, improving clinical outcomes.[3] In contrast, care for patients with non‐ACS troponin elevations is usually supportive, with a focus on the underlying conditions. The lack of specific treatment options for such patients is concerning given that several series have suggested that non‐ACS troponin patients may have a higher mortality risk than ACS patients.[4, 5, 6] Non‐ACS troponin elevation can be the result of a multitude of conditions.[7, 8] What remains unclear at this point is whether the excess mortality observed with non‐ACS troponin elevation is due to myocardial damage or to the underlying conditions that predispose to troponin release.
Using data from a quality improvement (QI) project collected at our Veterans Affairs (VA) medical center, we investigated the mortality risk associated with ACS and non‐ACS troponin elevation including an analysis of factors associated with mortality. We hypothesized that non‐ACS troponin elevation will have a higher mortality risk than troponin elevation due to ACS, and that important contributors to this relationship could be identified to provide direction for future investigation directed at modifying this mortality risk.
METHODS
We analyzed data that were prospectively collected for a quality initiative between 2006 and 2007. The project was a collaborative endeavor between cardiology, hospital medicine, and emergency medicine with the process goal of better identifying patients with ACS to hopefully improve outcomes. The QI team was consulted in real time to assist with treatment recommendations; no retrospective decisions were made regarding whether or not ACS was present. As the goal of the project was to improve cardiovascular outcomes, consultative advice was freely provided, and no physicians or teams were subject to any adverse repercussions for their diagnoses or management decisions.
A cardiologist‐led team was created to improve quality of care for myocardial infarction patients by evaluating all patients at our facility with an elevated troponin. On a daily basis, a specialist clinical coordinator (nurse practitioner or physician assistant) received a list of all patients with elevated troponin from the chemistry lab. The coordinator reviewed the patients' medical records with a cardiologist. A positive troponin was defined as a troponin T level of greater than 0.03 ng/mL (99th percentile at our facility). Each attending cardiologist prospectively determined if troponin elevation was related to clinical findings consistent with an ACS based on review of the patients' symptoms (duration, quality, severity, chronicity, and alleviating/aggravating factors), medical history, and noninvasive cardiac testing including electrocardiograms, cardiac biomarkers, and any other available imaging tests.
We have previously demonstrated that the cardiologists at our facility have a similar rate of diagnosing ACS.[9] All cardiologists at our facility maintain current American Board of Internal Medicine certification in cardiovascular disease and have academic appointments at the University of Florida College of Medicine. All patients were followed prospectively, and data on their medical history, acute evaluation, and outcomes were tracked in an electronic database. Given the higher risk of mortality with ST‐elevation myocardial infarction, such patients were excluded from this investigation. By definition, patients with unstable angina do not have elevated biomarkers and thus would not have been included in the database to begin with. Prospectively recorded data elements included: age, gender, chief complaint, tobacco use, presence of hypertension, hyperlipidemia, prior coronary disease, chronic kidney disease, diabetes mellitus, cardiac troponin values, serum creatinine, electrocardiogram (ECG) variables, Thrombolysis in Myocardial Infarction (TIMI) score, and if the patient was placed under hospice care or an active do‐not‐resuscitate (DNR) order. Additional data elements gathered at a later date included maximum temperature, white blood cell count, N‐terminal pro‐brain natriuretic peptide (NT‐proBNP), administration of advanced cardiac life support (ACLS), and admission to an intensive care unit (ICU). All consecutive patients with elevated troponin were included in the database; if patients were included more than once, we used their index evaluation only. All patients with troponin elevation after revascularization (percutaneous coronary intervention or coronary bypass surgery) were excluded. Our investigational design was reviewed by our institutional review board, who waived the requirement for formal written informed consent and approved use of data from this QI project for research purposes.
We focused this investigation on an analysis of all‐cause mortality in February 2014. We analyzed mortality at 30 days, 1 year, and 6 years. As secondary outcomes we analyzed the likelihood of the patients' chief complaint for the diagnosis of ACS and evaluated predictors of mortality based on Cox proportional hazard modeling. Mortality within the VA system is reliably tracked and compares favorably to the Social Security National Death Index Master File for accuracy.[10, 11]
Categorical variables were compared by 2 test. The Student t test was used to compare normally distributed continuous variables, and nonparametric tests were used for non‐normal distributions as appropriate. Mortality data at 30 days, 1 year, and 6 years were compared by log‐rank test and Kaplan‐Meier graphs. A formal power analysis was not performed; the entire available population was included. A Cox proportional hazard model was created to estimate mortality risk at each time point. Variables included in our Cox regression model were age, gender, history of coronary artery disease (CAD), hypertension, diabetes mellitus or hyperlipidemia, ACS diagnosis, dynamic ECG changes, TIMI risk score, initial troponin level, creatinine level at time of initial troponin (per mg/dL), presence of fever, maximum white blood cell count, NT‐proBNP level (per 1000 pg/mL), if ACLS was performed, if the patient was under hospice care, if there was a DNR order, and if they required ICU admission. This model was also constructed independently for the ACS and non‐ACS cohorts for mortality at 1 year. A forward stepwise model was used. Statistical results were considered significant at P 0.05. Statistical analyses were performed using SPSS version 21 (IBM, Armonk, NY).
RESULTS
Among the 761 patients, 502 (66.0%) were classified as non‐ACS and 259 (34.0%) as ACS (Table 1). The mean age was higher in the non‐ACS group (71 years vs 69 years in the ACS group, P = 0.006). Hypertension, diabetes mellitus, and prior CAD were frequent in both groups and not significantly different. Median initial troponin T was higher in the ACS group (0.12 ng/mL vs 0.06 ng/mL, P 0.001) as were the frequency of a TIMI risk score >2 (92.5% vs 74.3%, P 0.001) and new ECG changes (29.7% vs 8.2%, P 0.001). Hospice, DNR orders, and administration of ACLS were not different between groups; however, admission to the ICU was more frequent in the ACS group (44.8% vs 31.9%, P 0.001). Chest pain was the symptom with the highest positive predictive value for the diagnosis of ACS (63.3%), whereas the least predictive was altered mental status or confusion (18.0%) (Figure 1).
| Non‐ACS, N = 502 | ACS, N = 259 | P Value | |
|---|---|---|---|
| |||
| Baseline characteristics, n (%) | |||
| Age, y | 71 11 | 69 11 | 0.006 |
| Female | 6 (1.2%) | 1 (0.4%) | 0.27 |
| Coronary artery disease | 244 (48.6%) | 141 (54.4%) | 0.13 |
| Hypertension | 381 (75.9%) | 203 (78.4%) | 0.44 |
| Diabetes mellitus | 220 (43.8%) | 119 (45.9%) | 0.58 |
| Hyperlipidemia | 268 (53.4%) | 170 (65.6%) | 0.001 |
| Current smoker | 24 (4.8%) | 49 (18.9%) | 0.001 |
| Clinical presentation | |||
| Initial troponin T, ng/mL, median [IQR] | 0.06 [0.040.11] | 0.12 [0.050.32] | 0.001 |
| White cell count, 109/L, median [IQR] | 10 [8.014.0] | 11 [8.015.0] | 0.005 |
| NT‐proBNP, pg/mL, median [IQR] | 3,531 [1,20110,519] | 1,932 [3199,100] | 0.001 |
| Creatinine, mg/dL, median [IQR] | 1.6 [1.12.4] | 1.1 [0.91.5] | 0.001 |
| New ECG changes, no. (%) | 41 (8.2%) | 77 (29.7%) | 0.001 |
| TIMI score over 2, no. (%) | 365 (74.3%) | 235 (92.5%) | 0.001 |
| Fever (over 100.4 F), no. (%) | 75 (15.0%) | 38 (14.7%) | 0.91 |
| Hospice, no. (%) | 8 (1.6%) | 5 (1.9%) | 0.73 |
| Do not resuscitate, no. (%) | 62 (12.4%) | 30 (11.6%) | 0.76 |
| Intensive care admission, no. (%) | 160 (31.9%) | 116 (44.8%) | 0.001 |
| ACLS administered, no. (%) | 38 (7.6%) | 17 (6.6%) | 0.6 |
| Outcomes, no. (%) | |||
| Death, 30 days | 67 (13.3%) | 30 (11.6%) | 0.49 |
| Death, 1 year | 211 (42.0%) | 75 (29.0%) | 0.001 |
| Death, 6 years | 390 (77.7%) | 152 (58.7%) | 0.001 |

Mortality at 30 days was not different between the 2 groups, but mortality was higher for the non‐ACS cohort at 1 year and at 6 years (Table 1). Kaplan‐Meier curves demonstrate that mortality for the 2 cohorts begins to diverge between 30 and 60 days until approximately 2 years when the curves again are parallel (Figure 2).
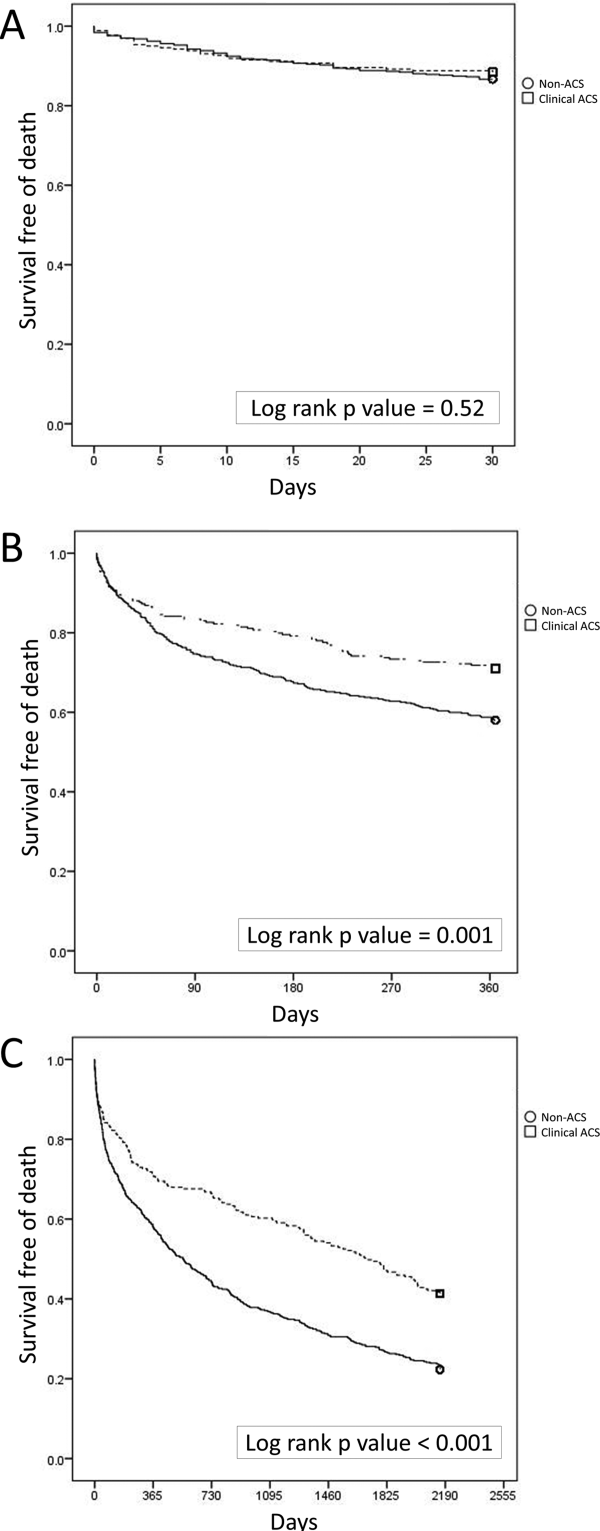
In Cox proportional hazards models, 5 factors were associated with higher mortality at 30 days, 1 year, and at 6 years: age, hospice, DNR order, need for ACLS, and admission to the ICU (Table 2). Additionally, at 1 and 6 years, NT‐proBNP and non‐ACS were associated with higher mortality. At 6 years, creatinine was an additional significant factor. We separated the ACS and non‐ACS cohorts and performed the same model for 1‐year mortality (Table 3). The models yielded similar factors associated with higher mortality: hospice, DNR order, need for ACLS, age, and NT‐proBNP, with ICU admission being significant only in the non‐ACS cohort.
| P Value | Hazard Ratio | 95% CI | |
|---|---|---|---|
| |||
| 30 days | |||
| Intensive care unit admission | 0.0001 | 2.18 | 1.283.72 |
| Hospice | 0.0001 | 4.67 | 1.9111.40 |
| Do not resuscitate | 0.0001 | 3.19 | 1.945.24 |
| ACLS performed | 0.0001 | 10.17 | 6.0317.17 |
| Age, per year | 0.0001 | 1.04 | 1.021.06 |
| 1 year | |||
| Intensive care unit admission | 0.0001 | 1.66 | 1.262.20 |
| Hospice | 0.0001 | 4.98 | 2.699.21 |
| Do not resuscitate | 0.0001 | 2.52 | 1.833.47 |
| Non‐ACS | 0.0001 | 1.57 | 1.192.08 |
| ACLS performed | 0.0001 | 6.03 | 4.178.72 |
| Age, per year | 0.0001 | 1.03 | 1.021.04 |
| NT‐proBNP, per 1,000 pg/mL | 0.0001 | 1.02 | 1.011.03 |
| Extended follow‐up | |||
| Intensive care unit admission | 0.0001 | 1.35 | 1.111.65 |
| Hospice | 0.0001 | 3.81 | 2.136.81 |
| Do not resuscitate | 0.0001 | 2.11 | 1.622.74 |
| Non‐ACS | 0.0001 | 1.53 | 1.251.88 |
| ACLS performed | 0.0001 | 4.19 | 3.015.84 |
| Age, per year | 0.0001 | 1.03 | 1.031.04 |
| Creatinine, per mg/dL | 0.02 | 1.06 | 1.011.12 |
| NT‐proBNP, per 1,000 pg/mL | 0.0001 | 1.02 | 1.021.03 |
| P Value | Hazard Ratio | 95% CI | |
|---|---|---|---|
| |||
| Non‐ACS | |||
| Intensive care unit admission | 0.0001 | 1.86 | 1.352.58 |
| Hospice | 0.0001 | 7.55 | 3.5715.93 |
| Do not resuscitate | 0.0001 | 2.33 | 1.603.41 |
| ACLS performed | 0.0001 | 4.42 | 2.836.92 |
| Age, per year | 0.0001 | 1.03 | 1.011.04 |
| NT‐proBNP, per 1,000 pg/mL | 0.002 | 1.02 | 1.011.03 |
| Clinical ACS | |||
| Hospice | 0.036 | 3.17 | 1.089.32 |
| Do not resuscitate | 0.003 | 2.49 | 1.364.55 |
| ACLS performed | 0.0001 | 12.04 | 6.3322.91 |
| Age, per year | 0.0001 | 1.05 | 1.021.07 |
| NT‐proBNP, per 1,000 pg/mL | 0.001 | 1.04 | 1.011.06 |
DISCUSSION
Our findings confirm the important, but perhaps not well‐recognized, fact that an elevated troponin without ACS is associated with higher mortality than with ACS. This has been previously observed in veteran and nonveteran populations.[4, 6, 8, 12] The novel finding from our investigation is that mortality risk with troponin elevation is most strongly associated with unmodifiable clinical factors that are plausible explanations of risk. Furthermore, the distribution of these factors between our 2 cohorts does not sufficiently explain the difference in risk between ACS and non‐ACS patients.
At each time point we evaluated, ICU admission and need for ACLS were associated with mortality. These are indicators of a severely ill population and are not surprising to find associated with mortality. Many hospitals have instituted some form of pre‐code approach or rapid response team to identify patients before they need ACLS. These efforts, although well meaning, have not yielded convincing results of effectiveness.[13] Hospice and DNR patients were also, not surprisingly, associated with higher mortality. Although these factors were statistically significant, the low prevalence suggests that they are not clinically impactful on the primary questions of the investigation. These factors can be altered but are not intended as modifiable as they reflect the wishes of patients and their decision makers. The distribution of the factors in our model, however, did not adequately explain the higher risk of death with non‐ACS troponin elevation. For example, ACLS administration, hospice care, and DNR orders were strong predictors but were similar between the groups. ICU admission was actually more common with ACS patients, despite strong association with mortality. Age and NT‐proBNP were associated with mortality and higher in the non‐ACS group; however the magnitude of hazard was less than for the other factors. These findings lead us back to the possible explanation that non‐ACS troponin elevation stands as an independent risk factor, and that ACS patients have a distinct advantage in the myriad treatments available. If ACS patients were misdiagnosed as non‐ACS and failed to receive appropriate treatments, that might have contributed to higher mortality; however, we consider that unlikely given that the goal of the QI project was to minimize missed ACS diagnoses.
The overall mortality risk in our study was high: 12.7% at 30 days and 37.6% at 1 year. This reflects the high‐risk population with elevated troponin seen at our facility with ages nearly 70 years and high prevalence of multiple cardiovascular risk factors. Despite a high event rate, many clinically relevant risk factors were not retained in our Cox hazard model. Among sepsis patients, elevation in troponin is associated with mortality[14]; however, in our population neither fever or white blood cell count were significant mortality factors. The relationship between chronic kidney disease and troponin is complex. Renal dysfunction may result in troponin elevation and troponin elevation is a predictor of risk within kidney disease patients.[15] In our study, we did not evaluate chronic kidney disease as a predictor, instead opting to use the serum creatinine. This was not associated with mortality except at the 6‐year time point.
The TIMI score was not associated with mortality in either the overall population or the ACS cohort. The proportion of patients in our cohort with TIMI score under 3 was 16.5% as compared with 21.6% in the original derivation study.[16] The limited data on the prognostic value of the TIMI score within a veteran population suggest a modest predictive capacity.[17] Our data raises the possibility that TIMI is not an optimal choice; however, our analysis only includes all‐cause mortality, different from the original intended use of TIMI, predicting a variety of major cardiac events.
Our data confirm that ACS can be detected in a wide range of clinical presentations. Within our population of troponin positive patients, those with chest pain were most likely to be diagnosed with ACS, although one‐third of chest pain patients were felt to have a non‐ACS diagnosis. On the opposite end of the spectrum, an elevation in troponin with altered mental status or confusion was rarely diagnosed as ACSonly 18% of the time. Many symptoms were poor predictors of ACS; however, none were low enough to disregard. Our data would suggest that most patients with elevated troponin warrant evaluation by a cardiovascular expert.
Our study population came from a single VA hospital that is comprised of elderly and predominantly male patients limiting applicability to other populations. Despite this, other investigations in younger populations and with a higher proportion of women have found similar mortality trends.[4, 8, 12] We did not have sufficient data to determine the cause of death or to further classify as cardiac versus noncardiac; knowledge of the cause of the specific death may better inform future investigations into this important clinical question. Our investigation did not use a standardized definition to determine ACS, a notable limitation that could introduce bias or variation in care. Because all determinations about ACS were made prospectively as part of a QI project, we have little reason to suspect any systematic bias to the determination of ACS. With regard to variation in care, we have previously presented data demonstrating consistent rates of ACS diagnosis across the physicians at our facility.
Based on our investigation and others on this topic, non‐ACS troponin elevation is a common, high‐risk clinical scenario. In our cohort, non‐ACS troponin elevation is about twice as frequent as ACS, and the problem is likely to grow dramatically within the next few years as ultrasensitive troponin assays are eventually approved for use in the United States. These assays are much more sensitive than the current assays, and may make it challenging to distinguish between someone with an acute supply/demand mismatch from someone with an elevated troponin due to chronic, but stable, illness such as CAD, heart failure, or diabetes. Non‐ACS troponin elevation remains poorly understood, with no viable treatment options other than addressing the pathophysiology resulting in the troponin elevation. Due to the heterogeneity of the diagnoses and pathophysiological conditions that result in elevated troponin, a unifying treatment is not likely feasible.
In conclusion, in this elderly, male veteran population, the mortality impact associated with a cardiac troponin elevation was not limited to ACS, as mortality was high among those without ACS. Factors independently associated with this non‐ACS mortality risk were plausible, but did not elucidate the reasons why non‐ACS troponin elevation carries a higher risk. Attempting to better understand the biological basis for the troponin elevation in these non‐ACS patients is a critical unmet need.
Disclosure
Nothing to report.
- , , , , . Prognostic significance of elevated troponin in non‐cardiac hospitalized patients: a systematic review and meta‐analysis. Ann Med. 2014;46:653–663.
- , , , , , ; Joint ESC/ACCF/AHA/WHF Task Force for Universal Definition of Myocardial Infarction. Third universal definition of myocardial infarction. J Am Coll Cardiol. 2012;60:1581–1598.
- , , , et al.; ACC/AHA Task Force Members; Society for Cardiovascular Angiography and Interventions and the Society of Thoracic Surgeons. 2014 AHA/ACC guideline for the management of patients with non‐st‐elevation acute coronary syndromes: executive summary: a report of the American College of Cardiology/American Heart Association Task Force on Practice Guidelines. Circulation. 2014;130:2354–2394.
- , , , , , . Acute coronary syndrome vs nonspecific troponin elevation: clinical predictors and survival analysis. Arch Intern Med. 2007;167:276–281.
- , , , , , , TOTAL‐AMI study group. Type 2 myocardial infarction in clinical practice. Heart. 2015;101:101–106.
- , , , et al. Outcomes of hospitalized patients with non‐acute coronary syndrome and elevated cardiac troponin level. Am J Med. 2011;124:630–635.
- , , , et al. Classification of myocardial infarction: frequency and features of type 2 myocardial infarction. Am J Med. 2013;126:789–797.
- , , , , . Cardiac troponin I elevation in hospitalized patients without acute coronary syndromes. Am J Cardiol. 2008;101:1384–1388.
- , , , . Inter‐provider variation in diagnoses and cardiac catheterization use (abstract). Cardiology. 2014;128:346.
- , , , . A primer and comparative review of major us mortality databases. Ann Epidemiol. 2002;12:462–468.
- , , . Assessment of vital status in department of veterans affairs national databases. Comparison with state death certificates. Ann Epidemiol. 2001;11:286–291.
- , , , , , . Raised cardiac troponin T levels in patients without acute coronary syndrome. Postgrad Med J. 2007;83:200–205.
- , , , , . Rapid response teams: a systematic review and meta‐analysis. Arch Intern Med. 2010;170:18–26.
- , , , , . Prognostic value of troponins in sepsis: a meta‐analysis. Intensive Care Med. 2013;39:1181–1189.
- , , , et al. Prognostic value of cardiac troponin in patients with chronic kidney disease without suspected acute coronary syndrome: a systematic review and meta‐analysis. Ann Intern Med. 2014;161:491–501.
- , , , et al. The TIMI risk score for unstable angina/non‐ST elevation MI: a method for prognostication and therapeutic decision making. JAMA. 2000;284:835–842.
- , , , , , . Usefulness of the TIMI risk score in predicting both short‐ and long‐term outcomes in the Veterans Affairs non‐Q‐wave myocardial infarction strategies in‐hospital (VANQWISH) trial. Am J Cardiol. 2002;90:922–926.
Acute coronary syndromes (ACS) are potentially lethal and present with a wide variety of symptoms. As such, physicians frequently order cardiac biomarkers, such as cardiac troponin, for patients with acute complaints. Elevated troponin is associated with higher risk of mortality regardless of the causes, which can be myriad, both chronic and acute.[1] Among patients with an elevated troponin, distinguishing ACS from non‐ACS can be challenging.
Making the distinction between ACS and non‐ACS troponin elevation is crucial because the underlying pathophysiology and subsequent management strategies are markedly different.[2] According to evidence‐based practice guidelines, ACS is managed with antiplatelet drugs, statins, and percutaneous coronary intervention, improving clinical outcomes.[3] In contrast, care for patients with non‐ACS troponin elevations is usually supportive, with a focus on the underlying conditions. The lack of specific treatment options for such patients is concerning given that several series have suggested that non‐ACS troponin patients may have a higher mortality risk than ACS patients.[4, 5, 6] Non‐ACS troponin elevation can be the result of a multitude of conditions.[7, 8] What remains unclear at this point is whether the excess mortality observed with non‐ACS troponin elevation is due to myocardial damage or to the underlying conditions that predispose to troponin release.
Using data from a quality improvement (QI) project collected at our Veterans Affairs (VA) medical center, we investigated the mortality risk associated with ACS and non‐ACS troponin elevation including an analysis of factors associated with mortality. We hypothesized that non‐ACS troponin elevation will have a higher mortality risk than troponin elevation due to ACS, and that important contributors to this relationship could be identified to provide direction for future investigation directed at modifying this mortality risk.
METHODS
We analyzed data that were prospectively collected for a quality initiative between 2006 and 2007. The project was a collaborative endeavor between cardiology, hospital medicine, and emergency medicine with the process goal of better identifying patients with ACS to hopefully improve outcomes. The QI team was consulted in real time to assist with treatment recommendations; no retrospective decisions were made regarding whether or not ACS was present. As the goal of the project was to improve cardiovascular outcomes, consultative advice was freely provided, and no physicians or teams were subject to any adverse repercussions for their diagnoses or management decisions.
A cardiologist‐led team was created to improve quality of care for myocardial infarction patients by evaluating all patients at our facility with an elevated troponin. On a daily basis, a specialist clinical coordinator (nurse practitioner or physician assistant) received a list of all patients with elevated troponin from the chemistry lab. The coordinator reviewed the patients' medical records with a cardiologist. A positive troponin was defined as a troponin T level of greater than 0.03 ng/mL (99th percentile at our facility). Each attending cardiologist prospectively determined if troponin elevation was related to clinical findings consistent with an ACS based on review of the patients' symptoms (duration, quality, severity, chronicity, and alleviating/aggravating factors), medical history, and noninvasive cardiac testing including electrocardiograms, cardiac biomarkers, and any other available imaging tests.
We have previously demonstrated that the cardiologists at our facility have a similar rate of diagnosing ACS.[9] All cardiologists at our facility maintain current American Board of Internal Medicine certification in cardiovascular disease and have academic appointments at the University of Florida College of Medicine. All patients were followed prospectively, and data on their medical history, acute evaluation, and outcomes were tracked in an electronic database. Given the higher risk of mortality with ST‐elevation myocardial infarction, such patients were excluded from this investigation. By definition, patients with unstable angina do not have elevated biomarkers and thus would not have been included in the database to begin with. Prospectively recorded data elements included: age, gender, chief complaint, tobacco use, presence of hypertension, hyperlipidemia, prior coronary disease, chronic kidney disease, diabetes mellitus, cardiac troponin values, serum creatinine, electrocardiogram (ECG) variables, Thrombolysis in Myocardial Infarction (TIMI) score, and if the patient was placed under hospice care or an active do‐not‐resuscitate (DNR) order. Additional data elements gathered at a later date included maximum temperature, white blood cell count, N‐terminal pro‐brain natriuretic peptide (NT‐proBNP), administration of advanced cardiac life support (ACLS), and admission to an intensive care unit (ICU). All consecutive patients with elevated troponin were included in the database; if patients were included more than once, we used their index evaluation only. All patients with troponin elevation after revascularization (percutaneous coronary intervention or coronary bypass surgery) were excluded. Our investigational design was reviewed by our institutional review board, who waived the requirement for formal written informed consent and approved use of data from this QI project for research purposes.
We focused this investigation on an analysis of all‐cause mortality in February 2014. We analyzed mortality at 30 days, 1 year, and 6 years. As secondary outcomes we analyzed the likelihood of the patients' chief complaint for the diagnosis of ACS and evaluated predictors of mortality based on Cox proportional hazard modeling. Mortality within the VA system is reliably tracked and compares favorably to the Social Security National Death Index Master File for accuracy.[10, 11]
Categorical variables were compared by 2 test. The Student t test was used to compare normally distributed continuous variables, and nonparametric tests were used for non‐normal distributions as appropriate. Mortality data at 30 days, 1 year, and 6 years were compared by log‐rank test and Kaplan‐Meier graphs. A formal power analysis was not performed; the entire available population was included. A Cox proportional hazard model was created to estimate mortality risk at each time point. Variables included in our Cox regression model were age, gender, history of coronary artery disease (CAD), hypertension, diabetes mellitus or hyperlipidemia, ACS diagnosis, dynamic ECG changes, TIMI risk score, initial troponin level, creatinine level at time of initial troponin (per mg/dL), presence of fever, maximum white blood cell count, NT‐proBNP level (per 1000 pg/mL), if ACLS was performed, if the patient was under hospice care, if there was a DNR order, and if they required ICU admission. This model was also constructed independently for the ACS and non‐ACS cohorts for mortality at 1 year. A forward stepwise model was used. Statistical results were considered significant at P 0.05. Statistical analyses were performed using SPSS version 21 (IBM, Armonk, NY).
RESULTS
Among the 761 patients, 502 (66.0%) were classified as non‐ACS and 259 (34.0%) as ACS (Table 1). The mean age was higher in the non‐ACS group (71 years vs 69 years in the ACS group, P = 0.006). Hypertension, diabetes mellitus, and prior CAD were frequent in both groups and not significantly different. Median initial troponin T was higher in the ACS group (0.12 ng/mL vs 0.06 ng/mL, P 0.001) as were the frequency of a TIMI risk score >2 (92.5% vs 74.3%, P 0.001) and new ECG changes (29.7% vs 8.2%, P 0.001). Hospice, DNR orders, and administration of ACLS were not different between groups; however, admission to the ICU was more frequent in the ACS group (44.8% vs 31.9%, P 0.001). Chest pain was the symptom with the highest positive predictive value for the diagnosis of ACS (63.3%), whereas the least predictive was altered mental status or confusion (18.0%) (Figure 1).
| Non‐ACS, N = 502 | ACS, N = 259 | P Value | |
|---|---|---|---|
| |||
| Baseline characteristics, n (%) | |||
| Age, y | 71 11 | 69 11 | 0.006 |
| Female | 6 (1.2%) | 1 (0.4%) | 0.27 |
| Coronary artery disease | 244 (48.6%) | 141 (54.4%) | 0.13 |
| Hypertension | 381 (75.9%) | 203 (78.4%) | 0.44 |
| Diabetes mellitus | 220 (43.8%) | 119 (45.9%) | 0.58 |
| Hyperlipidemia | 268 (53.4%) | 170 (65.6%) | 0.001 |
| Current smoker | 24 (4.8%) | 49 (18.9%) | 0.001 |
| Clinical presentation | |||
| Initial troponin T, ng/mL, median [IQR] | 0.06 [0.040.11] | 0.12 [0.050.32] | 0.001 |
| White cell count, 109/L, median [IQR] | 10 [8.014.0] | 11 [8.015.0] | 0.005 |
| NT‐proBNP, pg/mL, median [IQR] | 3,531 [1,20110,519] | 1,932 [3199,100] | 0.001 |
| Creatinine, mg/dL, median [IQR] | 1.6 [1.12.4] | 1.1 [0.91.5] | 0.001 |
| New ECG changes, no. (%) | 41 (8.2%) | 77 (29.7%) | 0.001 |
| TIMI score over 2, no. (%) | 365 (74.3%) | 235 (92.5%) | 0.001 |
| Fever (over 100.4 F), no. (%) | 75 (15.0%) | 38 (14.7%) | 0.91 |
| Hospice, no. (%) | 8 (1.6%) | 5 (1.9%) | 0.73 |
| Do not resuscitate, no. (%) | 62 (12.4%) | 30 (11.6%) | 0.76 |
| Intensive care admission, no. (%) | 160 (31.9%) | 116 (44.8%) | 0.001 |
| ACLS administered, no. (%) | 38 (7.6%) | 17 (6.6%) | 0.6 |
| Outcomes, no. (%) | |||
| Death, 30 days | 67 (13.3%) | 30 (11.6%) | 0.49 |
| Death, 1 year | 211 (42.0%) | 75 (29.0%) | 0.001 |
| Death, 6 years | 390 (77.7%) | 152 (58.7%) | 0.001 |
Mortality at 30 days was not different between the 2 groups, but mortality was higher for the non‐ACS cohort at 1 year and at 6 years (Table 1). Kaplan‐Meier curves demonstrate that mortality for the 2 cohorts begins to diverge between 30 and 60 days until approximately 2 years when the curves again are parallel (Figure 2).
In Cox proportional hazards models, 5 factors were associated with higher mortality at 30 days, 1 year, and at 6 years: age, hospice, DNR order, need for ACLS, and admission to the ICU (Table 2). Additionally, at 1 and 6 years, NT‐proBNP and non‐ACS were associated with higher mortality. At 6 years, creatinine was an additional significant factor. We separated the ACS and non‐ACS cohorts and performed the same model for 1‐year mortality (Table 3). The models yielded similar factors associated with higher mortality: hospice, DNR order, need for ACLS, age, and NT‐proBNP, with ICU admission being significant only in the non‐ACS cohort.
| P Value | Hazard Ratio | 95% CI | |
|---|---|---|---|
| |||
| 30 days | |||
| Intensive care unit admission | 0.0001 | 2.18 | 1.283.72 |
| Hospice | 0.0001 | 4.67 | 1.9111.40 |
| Do not resuscitate | 0.0001 | 3.19 | 1.945.24 |
| ACLS performed | 0.0001 | 10.17 | 6.0317.17 |
| Age, per year | 0.0001 | 1.04 | 1.021.06 |
| 1 year | |||
| Intensive care unit admission | 0.0001 | 1.66 | 1.262.20 |
| Hospice | 0.0001 | 4.98 | 2.699.21 |
| Do not resuscitate | 0.0001 | 2.52 | 1.833.47 |
| Non‐ACS | 0.0001 | 1.57 | 1.192.08 |
| ACLS performed | 0.0001 | 6.03 | 4.178.72 |
| Age, per year | 0.0001 | 1.03 | 1.021.04 |
| NT‐proBNP, per 1,000 pg/mL | 0.0001 | 1.02 | 1.011.03 |
| Extended follow‐up | |||
| Intensive care unit admission | 0.0001 | 1.35 | 1.111.65 |
| Hospice | 0.0001 | 3.81 | 2.136.81 |
| Do not resuscitate | 0.0001 | 2.11 | 1.622.74 |
| Non‐ACS | 0.0001 | 1.53 | 1.251.88 |
| ACLS performed | 0.0001 | 4.19 | 3.015.84 |
| Age, per year | 0.0001 | 1.03 | 1.031.04 |
| Creatinine, per mg/dL | 0.02 | 1.06 | 1.011.12 |
| NT‐proBNP, per 1,000 pg/mL | 0.0001 | 1.02 | 1.021.03 |
| P Value | Hazard Ratio | 95% CI | |
|---|---|---|---|
| |||
| Non‐ACS | |||
| Intensive care unit admission | 0.0001 | 1.86 | 1.352.58 |
| Hospice | 0.0001 | 7.55 | 3.5715.93 |
| Do not resuscitate | 0.0001 | 2.33 | 1.603.41 |
| ACLS performed | 0.0001 | 4.42 | 2.836.92 |
| Age, per year | 0.0001 | 1.03 | 1.011.04 |
| NT‐proBNP, per 1,000 pg/mL | 0.002 | 1.02 | 1.011.03 |
| Clinical ACS | |||
| Hospice | 0.036 | 3.17 | 1.089.32 |
| Do not resuscitate | 0.003 | 2.49 | 1.364.55 |
| ACLS performed | 0.0001 | 12.04 | 6.3322.91 |
| Age, per year | 0.0001 | 1.05 | 1.021.07 |
| NT‐proBNP, per 1,000 pg/mL | 0.001 | 1.04 | 1.011.06 |
DISCUSSION
Our findings confirm the important, but perhaps not well‐recognized, fact that an elevated troponin without ACS is associated with higher mortality than with ACS. This has been previously observed in veteran and nonveteran populations.[4, 6, 8, 12] The novel finding from our investigation is that mortality risk with troponin elevation is most strongly associated with unmodifiable clinical factors that are plausible explanations of risk. Furthermore, the distribution of these factors between our 2 cohorts does not sufficiently explain the difference in risk between ACS and non‐ACS patients.
At each time point we evaluated, ICU admission and need for ACLS were associated with mortality. These are indicators of a severely ill population and are not surprising to find associated with mortality. Many hospitals have instituted some form of pre‐code approach or rapid response team to identify patients before they need ACLS. These efforts, although well meaning, have not yielded convincing results of effectiveness.[13] Hospice and DNR patients were also, not surprisingly, associated with higher mortality. Although these factors were statistically significant, the low prevalence suggests that they are not clinically impactful on the primary questions of the investigation. These factors can be altered but are not intended as modifiable as they reflect the wishes of patients and their decision makers. The distribution of the factors in our model, however, did not adequately explain the higher risk of death with non‐ACS troponin elevation. For example, ACLS administration, hospice care, and DNR orders were strong predictors but were similar between the groups. ICU admission was actually more common with ACS patients, despite strong association with mortality. Age and NT‐proBNP were associated with mortality and higher in the non‐ACS group; however the magnitude of hazard was less than for the other factors. These findings lead us back to the possible explanation that non‐ACS troponin elevation stands as an independent risk factor, and that ACS patients have a distinct advantage in the myriad treatments available. If ACS patients were misdiagnosed as non‐ACS and failed to receive appropriate treatments, that might have contributed to higher mortality; however, we consider that unlikely given that the goal of the QI project was to minimize missed ACS diagnoses.
The overall mortality risk in our study was high: 12.7% at 30 days and 37.6% at 1 year. This reflects the high‐risk population with elevated troponin seen at our facility with ages nearly 70 years and high prevalence of multiple cardiovascular risk factors. Despite a high event rate, many clinically relevant risk factors were not retained in our Cox hazard model. Among sepsis patients, elevation in troponin is associated with mortality[14]; however, in our population neither fever or white blood cell count were significant mortality factors. The relationship between chronic kidney disease and troponin is complex. Renal dysfunction may result in troponin elevation and troponin elevation is a predictor of risk within kidney disease patients.[15] In our study, we did not evaluate chronic kidney disease as a predictor, instead opting to use the serum creatinine. This was not associated with mortality except at the 6‐year time point.
The TIMI score was not associated with mortality in either the overall population or the ACS cohort. The proportion of patients in our cohort with TIMI score under 3 was 16.5% as compared with 21.6% in the original derivation study.[16] The limited data on the prognostic value of the TIMI score within a veteran population suggest a modest predictive capacity.[17] Our data raises the possibility that TIMI is not an optimal choice; however, our analysis only includes all‐cause mortality, different from the original intended use of TIMI, predicting a variety of major cardiac events.
Our data confirm that ACS can be detected in a wide range of clinical presentations. Within our population of troponin positive patients, those with chest pain were most likely to be diagnosed with ACS, although one‐third of chest pain patients were felt to have a non‐ACS diagnosis. On the opposite end of the spectrum, an elevation in troponin with altered mental status or confusion was rarely diagnosed as ACSonly 18% of the time. Many symptoms were poor predictors of ACS; however, none were low enough to disregard. Our data would suggest that most patients with elevated troponin warrant evaluation by a cardiovascular expert.
Our study population came from a single VA hospital that is comprised of elderly and predominantly male patients limiting applicability to other populations. Despite this, other investigations in younger populations and with a higher proportion of women have found similar mortality trends.[4, 8, 12] We did not have sufficient data to determine the cause of death or to further classify as cardiac versus noncardiac; knowledge of the cause of the specific death may better inform future investigations into this important clinical question. Our investigation did not use a standardized definition to determine ACS, a notable limitation that could introduce bias or variation in care. Because all determinations about ACS were made prospectively as part of a QI project, we have little reason to suspect any systematic bias to the determination of ACS. With regard to variation in care, we have previously presented data demonstrating consistent rates of ACS diagnosis across the physicians at our facility.
Based on our investigation and others on this topic, non‐ACS troponin elevation is a common, high‐risk clinical scenario. In our cohort, non‐ACS troponin elevation is about twice as frequent as ACS, and the problem is likely to grow dramatically within the next few years as ultrasensitive troponin assays are eventually approved for use in the United States. These assays are much more sensitive than the current assays, and may make it challenging to distinguish between someone with an acute supply/demand mismatch from someone with an elevated troponin due to chronic, but stable, illness such as CAD, heart failure, or diabetes. Non‐ACS troponin elevation remains poorly understood, with no viable treatment options other than addressing the pathophysiology resulting in the troponin elevation. Due to the heterogeneity of the diagnoses and pathophysiological conditions that result in elevated troponin, a unifying treatment is not likely feasible.
In conclusion, in this elderly, male veteran population, the mortality impact associated with a cardiac troponin elevation was not limited to ACS, as mortality was high among those without ACS. Factors independently associated with this non‐ACS mortality risk were plausible, but did not elucidate the reasons why non‐ACS troponin elevation carries a higher risk. Attempting to better understand the biological basis for the troponin elevation in these non‐ACS patients is a critical unmet need.
Disclosure
Nothing to report.
- , , , , . Prognostic significance of elevated troponin in non‐cardiac hospitalized patients: a systematic review and meta‐analysis. Ann Med. 2014;46:653–663.
- , , , , , ; Joint ESC/ACCF/AHA/WHF Task Force for Universal Definition of Myocardial Infarction. Third universal definition of myocardial infarction. J Am Coll Cardiol. 2012;60:1581–1598.
- , , , et al.; ACC/AHA Task Force Members; Society for Cardiovascular Angiography and Interventions and the Society of Thoracic Surgeons. 2014 AHA/ACC guideline for the management of patients with non‐st‐elevation acute coronary syndromes: executive summary: a report of the American College of Cardiology/American Heart Association Task Force on Practice Guidelines. Circulation. 2014;130:2354–2394.
- , , , , , . Acute coronary syndrome vs nonspecific troponin elevation: clinical predictors and survival analysis. Arch Intern Med. 2007;167:276–281.
- , , , , , , TOTAL‐AMI study group. Type 2 myocardial infarction in clinical practice. Heart. 2015;101:101–106.
- , , , et al. Outcomes of hospitalized patients with non‐acute coronary syndrome and elevated cardiac troponin level. Am J Med. 2011;124:630–635.
- , , , et al. Classification of myocardial infarction: frequency and features of type 2 myocardial infarction. Am J Med. 2013;126:789–797.
- , , , , . Cardiac troponin I elevation in hospitalized patients without acute coronary syndromes. Am J Cardiol. 2008;101:1384–1388.
- , , , . Inter‐provider variation in diagnoses and cardiac catheterization use (abstract). Cardiology. 2014;128:346.
- , , , . A primer and comparative review of major us mortality databases. Ann Epidemiol. 2002;12:462–468.
- , , . Assessment of vital status in department of veterans affairs national databases. Comparison with state death certificates. Ann Epidemiol. 2001;11:286–291.
- , , , , , . Raised cardiac troponin T levels in patients without acute coronary syndrome. Postgrad Med J. 2007;83:200–205.
- , , , , . Rapid response teams: a systematic review and meta‐analysis. Arch Intern Med. 2010;170:18–26.
- , , , , . Prognostic value of troponins in sepsis: a meta‐analysis. Intensive Care Med. 2013;39:1181–1189.
- , , , et al. Prognostic value of cardiac troponin in patients with chronic kidney disease without suspected acute coronary syndrome: a systematic review and meta‐analysis. Ann Intern Med. 2014;161:491–501.
- , , , et al. The TIMI risk score for unstable angina/non‐ST elevation MI: a method for prognostication and therapeutic decision making. JAMA. 2000;284:835–842.
- , , , , , . Usefulness of the TIMI risk score in predicting both short‐ and long‐term outcomes in the Veterans Affairs non‐Q‐wave myocardial infarction strategies in‐hospital (VANQWISH) trial. Am J Cardiol. 2002;90:922–926.
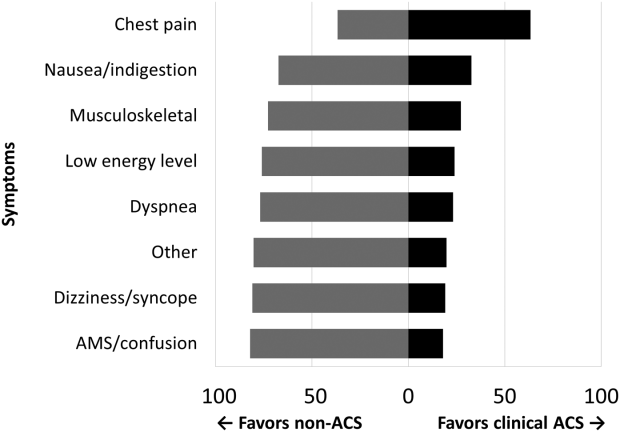
Clinical Alerts Predict Readmission
Rapid response systems (RRSs) have been developed to identify and treat deteriorating patients on general hospital units.[1] The most commonly proposed approach to the problem of identifying and stabilizing deteriorating hospitalized patients includes some combination of an early warning system to detect the deterioration and an RRS to deal with it. We previously demonstrated that a relatively simple hospital‐specific prediction model employing routine laboratory values and vital sign data is capable of predicting clinical deterioration, the need for intensive care unit (ICU) transfer, and hospital mortality in patients admitted to general medicine units.[2, 3, 4, 5, 6]
Hospital readmissions within 30 days of hospital discharge occur often and are difficult to predict. Starting in 2013, readmission penalties have been applied to specific conditions in the United States (acute myocardial infarction, heart failure, and pneumonia), with the expectation that additional conditions will be added to this group in years to come.[7, 8] Unfortunately, interventions developed to date have not been universally successful in preventing hospital readmissions for various medical conditions and patient types.[9] One potential explanation for this is the inability to reliably predict which patients are at risk for readmission to better target preventative interventions. Predictors of hospital readmission can be disease specific, such as the presence of multivessel disease in patients hospitalized with myocardial infarction,[10] or more general, such as lack of available medical follow‐up postdischarge.[11] Therefore, we performed a study to determine whether the occurrence of automated clinical deterioration alerts (CDAs) predicted 30‐day hospital readmission.
METHODS
Study Location
The study was conducted on 8 general medicine units of Barnes‐Jewish Hospital, a 1250‐bed academic medical center in St. Louis, Missouri (January 15, 2015December 12, 2015). Patient care on the inpatient medicine units is delivered by either attending hospitalist physicians or housestaff physicians under the supervision of an attending physician. The study was approved by the Washington University School of Medicine Human Studies Committee, and informed consent was waived.
Study Overview
We retrospectively evaluated all adult patients (aged >18 years) admitted through the emergency department or transferred directly to the general medicine units from other institutions. We excluded patients who died while hospitalized. All data were derived from the hospital informatics database provided by the Center for Clinical Excellence, BJC HealthCare.
Primary End Point
Readmission for any reason (ie, all‐cause readmission) to an acute care facility in the 30 days following discharge after the index hospitalization served as the primary end point. Barnes‐Jewish Hospital serves as the main teaching institution for BJC Healthcare, a large integrated healthcare system of both inpatient and outpatient care. The system includes a total of 12 hospitals and multiple community health locations in a compact geographic region surrounding and including St. Louis, Missouri, and we included readmission to any of these hospitals in our analysis. Persons treated within this healthcare system are, in nearly all cases, readmitted to 1 of the system's participating 12 hospitals. If a patient who receives healthcare in the system presents to a nonsystem hospital, he/she is often transferred back into the integrated system because of issues of insurance coverage. Patients with a 30‐day readmission were compared to those without a 30‐day readmission.
Variables
We recorded information regarding demographics, median income of the zip code of residence as a marker of socioeconomic status, admission to any BJC Healthcare facility within 6 months of the index admission, and comorbidities. To represent the global burden of comorbidities in each patient, we calculated their Charlson Comorbidity Index score.[12] Severity of illness was assessed using the All Patient RefinedDiagnosis Related Groups severity of illness score.
CDA Algorithm Overview
Details regarding the CDA model development and its implementation have been previously described in detail.[4, 5, 6] In brief, we applied logistic regression techniques to develop the CDA algorithm. Manually obtained vital signs, laboratory data, and pharmacy data inputted real time into the electronic medical record (EMR) were continuously assessed. The CDA algorithm searched for the 36 input variables (Table 1) as previously described from the EMR for all patients admitted to the 8 medicine units 24 hours per day and 7 days a week.[4, 5, 6] Values for every continuous parameter were scaled so that all measurements lay in the interval (0, 1) and were normalized by the minimum and maximum of the parameter. To capture the temporal effects in our data, we retain a sliding window of all the collected data points within the last 24 hours. We then subdivide these data into a series of n equally sized buckets (eg, 6 sequential buckets of 4 hours each). To capture variations within a bucket, we compute 3 values for each bucket: the minimum, maximum, and mean data points. Each of the resulting 3 n values are input to the logistic regression equation as separate variables.
| Age |
| Alanine aminotransferase |
| Alternative medicines |
| Anion gap |
| Anti‐infectives |
| Antineoplastics |
| Aspartate aminotransferase |
| Biologicals |
| Blood pressure, diastolic |
| Blood pressure, systolic |
| Calcium, serum |
| Calcium, serum, ionized |
| Cardiovascular agents |
| Central nervous system agents |
| Charlson Comorbidity Index |
| Coagulation modifiers |
| Estimated creatinine clearance |
| Gastrointestinal agents |
| Genitourinary tract agents |
| Hormones/hormone modifiers |
| Immunologic agents |
| Magnesium, serum |
| Metabolic agents |
| Miscellaneous agents |
| Nutritional products |
| Oxygen saturation, pulse oximetry |
| Phosphate, serum |
| Potassium, serum |
| Psychotherapeutic agents |
| Pulse |
| Radiologic agents |
| Respirations |
| Respiratory agents |
| Shock Index |
| Temperature |
| Topical agents |
The algorithm was first implemented in MATLAB (MathWorks, Natick, MA). For the purposes of training, we used a single 24‐hour window of data from each patient. The dataset's 36 input variables were divided into buckets and minimum/mean/maximum features wherever applicable, resulting in 398 variables. The first half of the original dataset was used to train the model. We then used the second half of the dataset as the validation dataset. We generated a predicted outcome for each case in the validation data, using the model parameter coefficients derived from the training data. We also employed bootstrap aggregation to improve classification accuracy and to address overfitting. We then applied various threshold cut points to convert these predictions into binary values and compared the results against the ICU transfer outcome. A threshold of 0.9760 for specificity was chosen to achieve a sensitivity of approximately 40%. These operating characteristics were chosen in turn to generate a manageable number of alerts per hospital nursing unit per day (estimated at 12 per nursing unit per day). At this cut point the C statistic was 0.8834, with an overall accuracy of 0.9292.[5] Patients with inputted data meeting the CDA threshold had a real‐time alert sent to the hospital rapid response team prompting a patient evaluation.
Statistical Analysis
The number of patients admitted to the 8 general medicine units of Barnes‐Jewish Hospital during the study period determined the sample size. Categorical variables were compared using 2 or Fisher exact test as appropriate. Continuous variables were compared using the Mann‐Whitney U test. All analyses were 2‐tailed, and a P value of 0.05 was assumed to represent statistical significance. We relied on logistic regression for identifying variables independently associated with 30‐day readmission. Based on univariate analysis, variables significant at P 0.15 were entered into the model. To arrive at the most parsimonious model, we utilized a stepwise backward elimination approach. We evaluated collinearity with the variance inflation factor. We report adjusted odds ratios (ORs) and 95% confidence intervals (CIs) where appropriate. The model's goodness of fit was assessed via calculation of the Hosmer‐Lemeshow test. Receiver operating characteristic (ROC) curves were used to compare the predictive models for 30‐day readmission with or without the CDA variable. All statistical analyses were performed using SPSS (version 22.0; IBM, Armonk, NY).
RESULTS
The final cohort had 3015 patients with a mean age of 57.5 17.5 years and 47.8% males. The most common reasons for hospital admission were infection or sepsis syndrome including pneumonia and urinary tract infections (23.6%), congestive heart failure or other cardiac conditions (18.4%), respiratory distress including chronic obstructive pulmonary disease (16.2%), acute or chronic renal failure (9.7%), gastrointestinal disorders (8.4%), and diabetes mellitus management (7.4%). Overall, there were 567 (18.8%) patients who were readmitted within 30 days of their hospital discharge date.
Table 2 shows the characteristics of patients readmitted within 30 days and of patients not requiring hospital readmission within 30 days. Patients requiring hospital readmission within 30 days were younger and had significantly more comorbidities as manifested by significantly greater Charlson scores and individual comorbidities including coronary artery disease, congestive heart disease, peripheral vascular disease, connective tissue disease, cirrhosis, diabetes mellitus with end‐organ complications, renal failure, and metastatic cancer. Patients with a 30‐day readmission had significantly longer duration of hospitalization, more emergency department visits in the 6 months prior to the index hospitalization, lower minimum hemoglobin measurements, higher minimum serum creatinine values, and were more likely to have Medicare or Medicaid insurance compared to patients without a 30‐day readmission.
| Variable | 30‐Day Readmission | P Value | |
|---|---|---|---|
| Yes (n = 567) | No (n = 2,448) | ||
| |||
| Age, y | 56.1 17.0 | 57.8 17.6 | 0.046 |
| Gender | |||
| Male | 252 (44.4) | 1,188 (48.5) | 0.079 |
| Female | 315 (55.6) | 1,260 (51.5) | |
| Race | |||
| Caucasian | 277 (48.9) | 1,234 (50.4) | 0.800 |
| African American | 257 (45.3) | 1,076 (44.0) | |
| Other | 33 (5.8) | 138 (5.6) | |
| Median income, dollars | 30,149 [25,23436,453] | 29,271 [24,83037,026] | 0.903 |
| BMI | 29.4 10.0 | 29.0 9.2 | 0.393 |
| APR‐DRG Severity of Illness Score | 2.6 0.4 | 2.5 0.5 | 0.152 |
| Charlson Comorbidity Index | 6 [39] | 5 [27] | 0.001 |
| ICU transfer during admission | 93 (16.4) | 410 (16.7) | 0.842 |
| Myocardial infarction | 83 (14.6) | 256 (10.5) | 0.005 |
| Congestive heart failure | 177 (31.2) | 540 (22.1) | 0.001 |
| Peripheral vascular disease | 76 (13.4) | 214 (8.7) | 0.001 |
| Cardiovascular disease | 69 (12.2) | 224 (9.2) | 0.029 |
| Dementia | 15 (2.6) | 80 (3.3) | 0.445 |
| Chronic obstructive pulmonary disease | 220 (38.8) | 855 (34.9) | 0.083 |
| Connective tissue disease | 45 (7.9) | 118 (4.8) | 0.003 |
| Peptic ulcer disease | 26 (4.6) | 111 (4.5) | 0.958 |
| Cirrhosis | 60 (10.6) | 141 (5.8) | 0.001 |
| Diabetes mellitus without end‐organ complications | 148 (26.1) | 625 (25.5) | 0.779 |
| Diabetes mellitus with end‐organ complications | 92 (16.2) | 197 (8.0) | 0.001 |
| Paralysis | 25 (4.4) | 77 (3.1) | 0.134 |
| Renal failure | 214 (37.7) | 620 (25.3) | 0.001 |
| Underlying malignancy | 85 (15.0) | 314 (12.8) | 0.171 |
| Metastatic cancer | 64 (11.3) | 163 (6.7) | 0.001 |
| Human immunodeficiency virus | 10 (1.8) | 47 (1.9) | 0.806 |
| Minimum hemoglobin, g/dL | 9.1 [7.411.4] | 10.7 [8.712.4] | 0.001 |
| Minimum creatinine, mg/dL | 1.12 [0.792.35] | 1.03 [0.791.63] | 0.006 |
| Length of stay, d | 3.8 [1.97.8] | 3.3 [1.85.9] | 0.001 |
| ED visit in the past year | 1 [03] | 0 [01] | 0.001 |
| Clinical deterioration alert triggered | 269 (47.4) | 872 (35.6%) | 0.001 |
| Insurance | |||
| Private | 111 (19.6) | 528 (21.6) | 0.020 |
| Medicare | 299 (52.7) | 1,217 (49.7) | |
| Medicaid | 129 (22.8) | 499 (20.4) | |
| Patient pay | 28 (4.9) | 204 (8.3) | |
There were 1141 (34.4%) patients that triggered a CDA. Patients triggering a CDA were significantly more likely to have a 30‐day readmission compared to those who did not trigger a CDA (23.6% vs 15.9%; P 0.001). Patients triggering a CDA were also significantly more likely to be readmitted within 60 days (31.7% vs 22.1%; P 0.001) and 90 days (35.8% vs 26.2%; P 0.001) compared to patients who did not trigger a CDA. Multiple logistic regression identified the triggering of a CDA to be independently associated with 30‐day readmission (OR: 1.40; 95% CI: 1.26‐1.55; P = 0.001) (Table 3). Other independent predictors of 30‐day readmission were: an emergency department visit in the previous 6 months, increasing age in 1‐year increments, presence of connective tissue disease, diabetes mellitus with end‐organ complications, chronic renal disease, cirrhosis, and metastatic cancer (Hosmer‐Lemeshow goodness of fit test, 0.363). Figure 1 reveals the ROC curves for the logistic regression model (Table 3) with and without the CDA variable. As the ROC curves document, the 2 models had similar sensitivity for the entire range of specificities. Reflecting this, the area under the ROC curve for the model inclusive of the CDA variable equaled 0.675 (95% CI: 0.649‐0.700), whereas the area under the ROC curve for the model excluding the CDA variable equaled 0.658 (95% CI: 0.632‐0.684).
| Variables | OR | 95% CI | P Value |
|---|---|---|---|
| |||
| Clinical deterioration alert | 1.40 | 1.261.55 | 0.001 |
| Age (1‐point increments) | 1.01 | 1.011.02 | 0.003 |
| Connective tissue disease | 1.63 | 1.341.98 | 0.012 |
| Cirrhosis | 1.25 | 1.171.33 | 0.001 |
| Diabetes mellitus with end‐organ complications | 1.23 | 1.131.33 | 0.010 |
| Chronic renal disease | 1.16 | 1.081.24 | 0.034 |
| Metastatic cancer | 1.12 | 1.081.17 | 0.002 |
| Emergency department visit in previous 6 months | 1.23 | 1.201.26 | 0.001 |

DISCUSSION
We demonstrated that the occurrence of an automated CDA is associated with increased risk for 30‐day hospital readmission. However, the addition of the CDA variable to the other variables identified to be independently associated with 30‐day readmission (Table 3) did not significantly add to the overall predictive accuracy of the derived logistic regression model. Other investigators have previously attempted to develop automated predictors of hospital readmission. Amarasingham et al. developed a real‐time electronic predictive model that identifies hospitalized heart failure patients at high risk for readmission or death from clinical and nonclinical risk factors present on admission.[13] Their electronic model demonstrated good discrimination for 30‐day mortality and readmission and performed as well, or better than, models developed by the Center for Medicaid and Medicare Services and the Acute Decompensated Heart Failure Registry. Similarly, Baillie et al. developed an automated prediction model that was effectively integrated into an existing EMR and identified patients on admission who were at risk for readmission within 30 days of discharge.[14] Our automated CDA differs from these previous risk predictors by surveying patients throughout their hospital stay as opposed to identifying risk for readmission at a single time point.
Several limitations of our study should be recognized. First, this was a noninterventional study aimed at examining the ability of CDAs to predict hospital readmission. Future studies are needed to assess whether the use of enhanced readmission prediction algorithms can be utilized to avert hospital readmissions. Second, the data derive from a single center, and this necessarily limits the generalizability of our findings. As such, our results may not reflect what one might see at other institutions. For example, Barnes‐Jewish Hospital has a regional referral pattern that includes community hospitals, regional long‐term acute care hospitals, nursing homes, and chronic wound, dialysis, and infusion clinics. This may explain, in part, the relatively high rate of hospital readmission observed in our cohort. Third, there is the possibility that CDAs were associated with readmission by chance given the number of potential predictor variables examined. The importance of CDAs as a determinant of rehospitalization requires confirmation in other independent populations. Fourth, it is likely that we did not capture all hospital readmissions, primarily those occurring outside of our hospital system. Therefore, we may have underestimated the actual rates of readmission for this cohort. Finally, we cannot be certain that all important predictors of hospital readmission were captured in this study.
The development of an accurate real‐time early warning system has the potential to identify patients at risk for various adverse outcomes including clinical deterioration, hospital death, and postdischarge readmission. By identifying patients at greatest risk for readmission, valuable healthcare resources can be better targeted to such populations. Our findings suggest that existing readmission predictors may suboptimally risk‐stratify patients, and it may be important to include additional clinical variables if pay for performance and other across‐institution comparisons are to be fair to institutions that care for more seriously ill patients. The variables identified as predictors of 30‐day hospital readmission in our study, with the exception of a CDA, are all readily identifiable clinical characteristics. The modest incremental value of a CDA to these clinical characteristics suggests that they would suffice for the identification of patients at high risk for hospital readmission. This is especially important for safety‐net institutions not routinely employing automated CDAs. These safety‐net hospitals provide a disproportionate level of care for patients who otherwise would have difficulty obtaining inpatient medical care and disproportionately carry the greatest burden of hospital readmissions.[15]
Disclosure
This study was funded in part by the Barnes‐Jewish Hospital Foundation and by grant number UL1 RR024992 from the National Center for Research Resources (NCRR), a component of the National Institutes of Health (NIH), and NIH Roadmap for Medical Research. Its contents are solely the responsibility of the authors and do not necessarily represent the official views of the NCRR or NIH.
- , , . Rapid‐response teams. N Engl J Med. 2011;365:139–146.
- , , , , , . Early prediction of septic shock in hospitalized patients. J Hosp Med. 2010;5:19–25.
- , , , et al. Implementation of a real‐time computerized sepsis alert in nonintensive care unit patients. Crit Care Med. 2011;39:469–473.
- , , , et al. Toward a two‐tier clinical warning system for hospitalized patients. AMIA Annu Symp Proc. 2011;2011:511–519.
- , , , et al. A trial of a real‐time alert for clinical deterioration in patients hospitalized on general medical wards. J Hosp Med. 2013;8:236–242.
- , , , et al. A randomized trial of real‐time automated clinical deterioration alerts sent to a rapid response team. J Hosp Med. 2014;9:424–429.
- , . Revisiting hospital readmissions JAMA. 2013;309:398–400.
- , , , . Adverse outcomes associated with delayed intensive care unit transfers in an integrated healthcare system. J Hosp Med. 2012;7:224–230.
- , , , , . Interventions to reduce 30‐day rehospitalization: a systematic review. Ann Intern Med. 2011; 155:520–528.
- , , , et al. International variation in and factors associated with hospital readmission after myocardial infarction. JAMA. 2012;307:66–74.
- , , , , . Predictors of early readmission among patients 40 to 64 years of age hospitalized for chronic obstructive pulmonary disease. Ann Am Thorac Soc. 2014;11:685–694.
- , , , , , . Assessing illness severity: does clinical judgement work? J Chronic Dis. 1986;39:439–452.
- , , , et al. An automated model to identify heart failure patients at risk for 30‐day readmission or death using electronic medical record data. Med Care. 2010;48:981–988.
- , , , et al. The readmission risk flag: using the electronic health record to automatically identify patients at risk for 30‐day readmission. J Hosp Med. 2013;8:689–695.
- , , . The Medicare hospital readmissions reduction program: time for reform. JAMA. 2015;314:347–348.
Rapid response systems (RRSs) have been developed to identify and treat deteriorating patients on general hospital units.[1] The most commonly proposed approach to the problem of identifying and stabilizing deteriorating hospitalized patients includes some combination of an early warning system to detect the deterioration and an RRS to deal with it. We previously demonstrated that a relatively simple hospital‐specific prediction model employing routine laboratory values and vital sign data is capable of predicting clinical deterioration, the need for intensive care unit (ICU) transfer, and hospital mortality in patients admitted to general medicine units.[2, 3, 4, 5, 6]
Hospital readmissions within 30 days of hospital discharge occur often and are difficult to predict. Starting in 2013, readmission penalties have been applied to specific conditions in the United States (acute myocardial infarction, heart failure, and pneumonia), with the expectation that additional conditions will be added to this group in years to come.[7, 8] Unfortunately, interventions developed to date have not been universally successful in preventing hospital readmissions for various medical conditions and patient types.[9] One potential explanation for this is the inability to reliably predict which patients are at risk for readmission to better target preventative interventions. Predictors of hospital readmission can be disease specific, such as the presence of multivessel disease in patients hospitalized with myocardial infarction,[10] or more general, such as lack of available medical follow‐up postdischarge.[11] Therefore, we performed a study to determine whether the occurrence of automated clinical deterioration alerts (CDAs) predicted 30‐day hospital readmission.
METHODS
Study Location
The study was conducted on 8 general medicine units of Barnes‐Jewish Hospital, a 1250‐bed academic medical center in St. Louis, Missouri (January 15, 2015December 12, 2015). Patient care on the inpatient medicine units is delivered by either attending hospitalist physicians or housestaff physicians under the supervision of an attending physician. The study was approved by the Washington University School of Medicine Human Studies Committee, and informed consent was waived.
Study Overview
We retrospectively evaluated all adult patients (aged >18 years) admitted through the emergency department or transferred directly to the general medicine units from other institutions. We excluded patients who died while hospitalized. All data were derived from the hospital informatics database provided by the Center for Clinical Excellence, BJC HealthCare.
Primary End Point
Readmission for any reason (ie, all‐cause readmission) to an acute care facility in the 30 days following discharge after the index hospitalization served as the primary end point. Barnes‐Jewish Hospital serves as the main teaching institution for BJC Healthcare, a large integrated healthcare system of both inpatient and outpatient care. The system includes a total of 12 hospitals and multiple community health locations in a compact geographic region surrounding and including St. Louis, Missouri, and we included readmission to any of these hospitals in our analysis. Persons treated within this healthcare system are, in nearly all cases, readmitted to 1 of the system's participating 12 hospitals. If a patient who receives healthcare in the system presents to a nonsystem hospital, he/she is often transferred back into the integrated system because of issues of insurance coverage. Patients with a 30‐day readmission were compared to those without a 30‐day readmission.
Variables
We recorded information regarding demographics, median income of the zip code of residence as a marker of socioeconomic status, admission to any BJC Healthcare facility within 6 months of the index admission, and comorbidities. To represent the global burden of comorbidities in each patient, we calculated their Charlson Comorbidity Index score.[12] Severity of illness was assessed using the All Patient RefinedDiagnosis Related Groups severity of illness score.
CDA Algorithm Overview
Details regarding the CDA model development and its implementation have been previously described in detail.[4, 5, 6] In brief, we applied logistic regression techniques to develop the CDA algorithm. Manually obtained vital signs, laboratory data, and pharmacy data inputted real time into the electronic medical record (EMR) were continuously assessed. The CDA algorithm searched for the 36 input variables (Table 1) as previously described from the EMR for all patients admitted to the 8 medicine units 24 hours per day and 7 days a week.[4, 5, 6] Values for every continuous parameter were scaled so that all measurements lay in the interval (0, 1) and were normalized by the minimum and maximum of the parameter. To capture the temporal effects in our data, we retain a sliding window of all the collected data points within the last 24 hours. We then subdivide these data into a series of n equally sized buckets (eg, 6 sequential buckets of 4 hours each). To capture variations within a bucket, we compute 3 values for each bucket: the minimum, maximum, and mean data points. Each of the resulting 3 n values are input to the logistic regression equation as separate variables.
| Age |
| Alanine aminotransferase |
| Alternative medicines |
| Anion gap |
| Anti‐infectives |
| Antineoplastics |
| Aspartate aminotransferase |
| Biologicals |
| Blood pressure, diastolic |
| Blood pressure, systolic |
| Calcium, serum |
| Calcium, serum, ionized |
| Cardiovascular agents |
| Central nervous system agents |
| Charlson Comorbidity Index |
| Coagulation modifiers |
| Estimated creatinine clearance |
| Gastrointestinal agents |
| Genitourinary tract agents |
| Hormones/hormone modifiers |
| Immunologic agents |
| Magnesium, serum |
| Metabolic agents |
| Miscellaneous agents |
| Nutritional products |
| Oxygen saturation, pulse oximetry |
| Phosphate, serum |
| Potassium, serum |
| Psychotherapeutic agents |
| Pulse |
| Radiologic agents |
| Respirations |
| Respiratory agents |
| Shock Index |
| Temperature |
| Topical agents |
The algorithm was first implemented in MATLAB (MathWorks, Natick, MA). For the purposes of training, we used a single 24‐hour window of data from each patient. The dataset's 36 input variables were divided into buckets and minimum/mean/maximum features wherever applicable, resulting in 398 variables. The first half of the original dataset was used to train the model. We then used the second half of the dataset as the validation dataset. We generated a predicted outcome for each case in the validation data, using the model parameter coefficients derived from the training data. We also employed bootstrap aggregation to improve classification accuracy and to address overfitting. We then applied various threshold cut points to convert these predictions into binary values and compared the results against the ICU transfer outcome. A threshold of 0.9760 for specificity was chosen to achieve a sensitivity of approximately 40%. These operating characteristics were chosen in turn to generate a manageable number of alerts per hospital nursing unit per day (estimated at 12 per nursing unit per day). At this cut point the C statistic was 0.8834, with an overall accuracy of 0.9292.[5] Patients with inputted data meeting the CDA threshold had a real‐time alert sent to the hospital rapid response team prompting a patient evaluation.
Statistical Analysis
The number of patients admitted to the 8 general medicine units of Barnes‐Jewish Hospital during the study period determined the sample size. Categorical variables were compared using 2 or Fisher exact test as appropriate. Continuous variables were compared using the Mann‐Whitney U test. All analyses were 2‐tailed, and a P value of 0.05 was assumed to represent statistical significance. We relied on logistic regression for identifying variables independently associated with 30‐day readmission. Based on univariate analysis, variables significant at P 0.15 were entered into the model. To arrive at the most parsimonious model, we utilized a stepwise backward elimination approach. We evaluated collinearity with the variance inflation factor. We report adjusted odds ratios (ORs) and 95% confidence intervals (CIs) where appropriate. The model's goodness of fit was assessed via calculation of the Hosmer‐Lemeshow test. Receiver operating characteristic (ROC) curves were used to compare the predictive models for 30‐day readmission with or without the CDA variable. All statistical analyses were performed using SPSS (version 22.0; IBM, Armonk, NY).
RESULTS
The final cohort had 3015 patients with a mean age of 57.5 17.5 years and 47.8% males. The most common reasons for hospital admission were infection or sepsis syndrome including pneumonia and urinary tract infections (23.6%), congestive heart failure or other cardiac conditions (18.4%), respiratory distress including chronic obstructive pulmonary disease (16.2%), acute or chronic renal failure (9.7%), gastrointestinal disorders (8.4%), and diabetes mellitus management (7.4%). Overall, there were 567 (18.8%) patients who were readmitted within 30 days of their hospital discharge date.
Table 2 shows the characteristics of patients readmitted within 30 days and of patients not requiring hospital readmission within 30 days. Patients requiring hospital readmission within 30 days were younger and had significantly more comorbidities as manifested by significantly greater Charlson scores and individual comorbidities including coronary artery disease, congestive heart disease, peripheral vascular disease, connective tissue disease, cirrhosis, diabetes mellitus with end‐organ complications, renal failure, and metastatic cancer. Patients with a 30‐day readmission had significantly longer duration of hospitalization, more emergency department visits in the 6 months prior to the index hospitalization, lower minimum hemoglobin measurements, higher minimum serum creatinine values, and were more likely to have Medicare or Medicaid insurance compared to patients without a 30‐day readmission.
| Variable | 30‐Day Readmission | P Value | |
|---|---|---|---|
| Yes (n = 567) | No (n = 2,448) | ||
| |||
| Age, y | 56.1 17.0 | 57.8 17.6 | 0.046 |
| Gender | |||
| Male | 252 (44.4) | 1,188 (48.5) | 0.079 |
| Female | 315 (55.6) | 1,260 (51.5) | |
| Race | |||
| Caucasian | 277 (48.9) | 1,234 (50.4) | 0.800 |
| African American | 257 (45.3) | 1,076 (44.0) | |
| Other | 33 (5.8) | 138 (5.6) | |
| Median income, dollars | 30,149 [25,23436,453] | 29,271 [24,83037,026] | 0.903 |
| BMI | 29.4 10.0 | 29.0 9.2 | 0.393 |
| APR‐DRG Severity of Illness Score | 2.6 0.4 | 2.5 0.5 | 0.152 |
| Charlson Comorbidity Index | 6 [39] | 5 [27] | 0.001 |
| ICU transfer during admission | 93 (16.4) | 410 (16.7) | 0.842 |
| Myocardial infarction | 83 (14.6) | 256 (10.5) | 0.005 |
| Congestive heart failure | 177 (31.2) | 540 (22.1) | 0.001 |
| Peripheral vascular disease | 76 (13.4) | 214 (8.7) | 0.001 |
| Cardiovascular disease | 69 (12.2) | 224 (9.2) | 0.029 |
| Dementia | 15 (2.6) | 80 (3.3) | 0.445 |
| Chronic obstructive pulmonary disease | 220 (38.8) | 855 (34.9) | 0.083 |
| Connective tissue disease | 45 (7.9) | 118 (4.8) | 0.003 |
| Peptic ulcer disease | 26 (4.6) | 111 (4.5) | 0.958 |
| Cirrhosis | 60 (10.6) | 141 (5.8) | 0.001 |
| Diabetes mellitus without end‐organ complications | 148 (26.1) | 625 (25.5) | 0.779 |
| Diabetes mellitus with end‐organ complications | 92 (16.2) | 197 (8.0) | 0.001 |
| Paralysis | 25 (4.4) | 77 (3.1) | 0.134 |
| Renal failure | 214 (37.7) | 620 (25.3) | 0.001 |
| Underlying malignancy | 85 (15.0) | 314 (12.8) | 0.171 |
| Metastatic cancer | 64 (11.3) | 163 (6.7) | 0.001 |
| Human immunodeficiency virus | 10 (1.8) | 47 (1.9) | 0.806 |
| Minimum hemoglobin, g/dL | 9.1 [7.411.4] | 10.7 [8.712.4] | 0.001 |
| Minimum creatinine, mg/dL | 1.12 [0.792.35] | 1.03 [0.791.63] | 0.006 |
| Length of stay, d | 3.8 [1.97.8] | 3.3 [1.85.9] | 0.001 |
| ED visit in the past year | 1 [03] | 0 [01] | 0.001 |
| Clinical deterioration alert triggered | 269 (47.4) | 872 (35.6%) | 0.001 |
| Insurance | |||
| Private | 111 (19.6) | 528 (21.6) | 0.020 |
| Medicare | 299 (52.7) | 1,217 (49.7) | |
| Medicaid | 129 (22.8) | 499 (20.4) | |
| Patient pay | 28 (4.9) | 204 (8.3) | |
There were 1141 (34.4%) patients that triggered a CDA. Patients triggering a CDA were significantly more likely to have a 30‐day readmission compared to those who did not trigger a CDA (23.6% vs 15.9%; P 0.001). Patients triggering a CDA were also significantly more likely to be readmitted within 60 days (31.7% vs 22.1%; P 0.001) and 90 days (35.8% vs 26.2%; P 0.001) compared to patients who did not trigger a CDA. Multiple logistic regression identified the triggering of a CDA to be independently associated with 30‐day readmission (OR: 1.40; 95% CI: 1.26‐1.55; P = 0.001) (Table 3). Other independent predictors of 30‐day readmission were: an emergency department visit in the previous 6 months, increasing age in 1‐year increments, presence of connective tissue disease, diabetes mellitus with end‐organ complications, chronic renal disease, cirrhosis, and metastatic cancer (Hosmer‐Lemeshow goodness of fit test, 0.363). Figure 1 reveals the ROC curves for the logistic regression model (Table 3) with and without the CDA variable. As the ROC curves document, the 2 models had similar sensitivity for the entire range of specificities. Reflecting this, the area under the ROC curve for the model inclusive of the CDA variable equaled 0.675 (95% CI: 0.649‐0.700), whereas the area under the ROC curve for the model excluding the CDA variable equaled 0.658 (95% CI: 0.632‐0.684).
| Variables | OR | 95% CI | P Value |
|---|---|---|---|
| |||
| Clinical deterioration alert | 1.40 | 1.261.55 | 0.001 |
| Age (1‐point increments) | 1.01 | 1.011.02 | 0.003 |
| Connective tissue disease | 1.63 | 1.341.98 | 0.012 |
| Cirrhosis | 1.25 | 1.171.33 | 0.001 |
| Diabetes mellitus with end‐organ complications | 1.23 | 1.131.33 | 0.010 |
| Chronic renal disease | 1.16 | 1.081.24 | 0.034 |
| Metastatic cancer | 1.12 | 1.081.17 | 0.002 |
| Emergency department visit in previous 6 months | 1.23 | 1.201.26 | 0.001 |
DISCUSSION
We demonstrated that the occurrence of an automated CDA is associated with increased risk for 30‐day hospital readmission. However, the addition of the CDA variable to the other variables identified to be independently associated with 30‐day readmission (Table 3) did not significantly add to the overall predictive accuracy of the derived logistic regression model. Other investigators have previously attempted to develop automated predictors of hospital readmission. Amarasingham et al. developed a real‐time electronic predictive model that identifies hospitalized heart failure patients at high risk for readmission or death from clinical and nonclinical risk factors present on admission.[13] Their electronic model demonstrated good discrimination for 30‐day mortality and readmission and performed as well, or better than, models developed by the Center for Medicaid and Medicare Services and the Acute Decompensated Heart Failure Registry. Similarly, Baillie et al. developed an automated prediction model that was effectively integrated into an existing EMR and identified patients on admission who were at risk for readmission within 30 days of discharge.[14] Our automated CDA differs from these previous risk predictors by surveying patients throughout their hospital stay as opposed to identifying risk for readmission at a single time point.
Several limitations of our study should be recognized. First, this was a noninterventional study aimed at examining the ability of CDAs to predict hospital readmission. Future studies are needed to assess whether the use of enhanced readmission prediction algorithms can be utilized to avert hospital readmissions. Second, the data derive from a single center, and this necessarily limits the generalizability of our findings. As such, our results may not reflect what one might see at other institutions. For example, Barnes‐Jewish Hospital has a regional referral pattern that includes community hospitals, regional long‐term acute care hospitals, nursing homes, and chronic wound, dialysis, and infusion clinics. This may explain, in part, the relatively high rate of hospital readmission observed in our cohort. Third, there is the possibility that CDAs were associated with readmission by chance given the number of potential predictor variables examined. The importance of CDAs as a determinant of rehospitalization requires confirmation in other independent populations. Fourth, it is likely that we did not capture all hospital readmissions, primarily those occurring outside of our hospital system. Therefore, we may have underestimated the actual rates of readmission for this cohort. Finally, we cannot be certain that all important predictors of hospital readmission were captured in this study.
The development of an accurate real‐time early warning system has the potential to identify patients at risk for various adverse outcomes including clinical deterioration, hospital death, and postdischarge readmission. By identifying patients at greatest risk for readmission, valuable healthcare resources can be better targeted to such populations. Our findings suggest that existing readmission predictors may suboptimally risk‐stratify patients, and it may be important to include additional clinical variables if pay for performance and other across‐institution comparisons are to be fair to institutions that care for more seriously ill patients. The variables identified as predictors of 30‐day hospital readmission in our study, with the exception of a CDA, are all readily identifiable clinical characteristics. The modest incremental value of a CDA to these clinical characteristics suggests that they would suffice for the identification of patients at high risk for hospital readmission. This is especially important for safety‐net institutions not routinely employing automated CDAs. These safety‐net hospitals provide a disproportionate level of care for patients who otherwise would have difficulty obtaining inpatient medical care and disproportionately carry the greatest burden of hospital readmissions.[15]
Disclosure
This study was funded in part by the Barnes‐Jewish Hospital Foundation and by grant number UL1 RR024992 from the National Center for Research Resources (NCRR), a component of the National Institutes of Health (NIH), and NIH Roadmap for Medical Research. Its contents are solely the responsibility of the authors and do not necessarily represent the official views of the NCRR or NIH.
- , , . Rapid‐response teams. N Engl J Med. 2011;365:139–146.
- , , , , , . Early prediction of septic shock in hospitalized patients. J Hosp Med. 2010;5:19–25.
- , , , et al. Implementation of a real‐time computerized sepsis alert in nonintensive care unit patients. Crit Care Med. 2011;39:469–473.
- , , , et al. Toward a two‐tier clinical warning system for hospitalized patients. AMIA Annu Symp Proc. 2011;2011:511–519.
- , , , et al. A trial of a real‐time alert for clinical deterioration in patients hospitalized on general medical wards. J Hosp Med. 2013;8:236–242.
- , , , et al. A randomized trial of real‐time automated clinical deterioration alerts sent to a rapid response team. J Hosp Med. 2014;9:424–429.
- , . Revisiting hospital readmissions JAMA. 2013;309:398–400.
- , , , . Adverse outcomes associated with delayed intensive care unit transfers in an integrated healthcare system. J Hosp Med. 2012;7:224–230.
- , , , , . Interventions to reduce 30‐day rehospitalization: a systematic review. Ann Intern Med. 2011; 155:520–528.
- , , , et al. International variation in and factors associated with hospital readmission after myocardial infarction. JAMA. 2012;307:66–74.
- , , , , . Predictors of early readmission among patients 40 to 64 years of age hospitalized for chronic obstructive pulmonary disease. Ann Am Thorac Soc. 2014;11:685–694.
- , , , , , . Assessing illness severity: does clinical judgement work? J Chronic Dis. 1986;39:439–452.
- , , , et al. An automated model to identify heart failure patients at risk for 30‐day readmission or death using electronic medical record data. Med Care. 2010;48:981–988.
- , , , et al. The readmission risk flag: using the electronic health record to automatically identify patients at risk for 30‐day readmission. J Hosp Med. 2013;8:689–695.
- , , . The Medicare hospital readmissions reduction program: time for reform. JAMA. 2015;314:347–348.
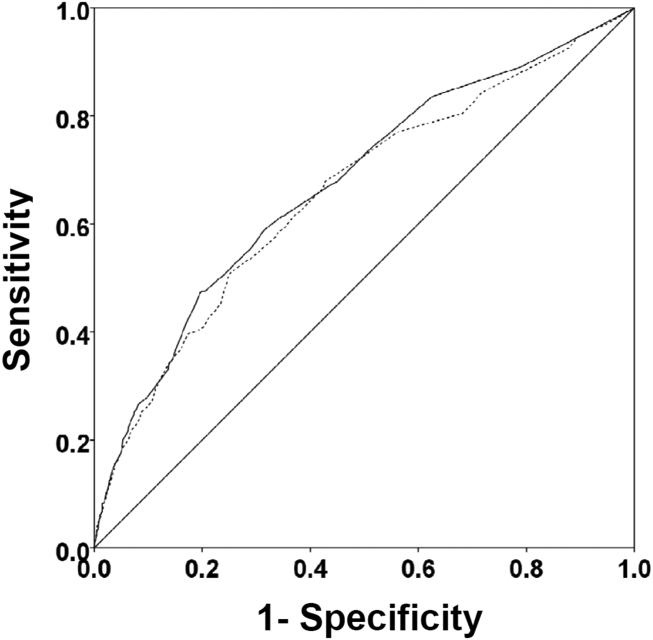
MAGS Prevalence in Older Adults
Geriatric syndromes are common clinical conditions in older adults that do not fall into specific disease categories. Unlike the traditional definition of a syndrome, geriatric syndrome refers to a condition that is mediated by multiple shared underlying risk factors.[1, 2] Conditions commonly referred to as geriatric syndromes include delirium, cognitive impairment, falls, unintentional weight loss, depressive symptoms, and incontinence. Even though many perceive it as medical misnomer,[3] geriatric syndromes have been shown to negatively impact quality of life and activities of daily living in older adults.[2] They are also associated with adverse outcomes such as increased healthcare utilization, functional decline, and mortality, even after adjusting for age and disease severity.[4, 5, 6] Hospitalized older adults, including those discharged to skilled nursing facilities (SNFs)[7, 8] are particularly at high risk for new‐onset or exacerbation of geriatric syndromes and poor outcomes.[7, 9, 10] However, hospital providers seldom assess, manage, or document geriatric syndromes because they are often overshadowed by disease conditions that lead to an acute episode requiring hospitalization (e.g., heart disease).[11]
Pharmacotherapy is the cornerstone of hospital treatment, and it is well‐known that it affects multiple physiologic systems causing side effects apart from the condition they are approved to treat. Given that geriatric syndromes are a result of impairments in multiple organ systems, it is plausible that pharmacotherapy may initiate or worsen these syndromes.[12] Medication‐related problems in older adults are well known. Polypharmacy and adverse drug events (as a result of drug‐drug/disease interactions and changes in pharmacokinetics and pharmacodynamics) are prevalent in multimorbid elderly patients.[13, 14, 15, 16] The prescribing cascade[17] increases the medication burden and may be a contributing factor for geriatric syndromes in hospitalized patients.[18] For instance, laxatives may be prescribed to counteract constipation caused by anticholinergic drugs.
The American Geriatric Society (AGS) Beers list[19, 20] and similar criteria[21] provide excellent resources to identify medications with potentially harmful interactions or adverse effects in older adults. Although these lists include medicines associated with a specific geriatric syndrome, they were not developed to explicitly link medicines across multiple geriatric syndromes, regardless of indication or appropriateness. For example, medications that effect important geriatric syndromes like unintentional weight/appetite loss, depression, and urinary incontinence are not extensively covered. In addition, disease‐appropriate medications (eg, ‐blockers for systolic heart failure), that may be associated with a geriatric syndrome (eg, falls) are not included; however, they may be important to consider for a patient and clinician who are weighing the disease benefits compared to the geriatric syndrome‐related risks. Finally, the AGS 2015 Beers criteria panel mentions the limitation that many medication associations may be excluded because older adults are less represented in clinical trials.[20] Clinicians are currently limited in identifying medications potentially contributing to a broad set of geriatric syndromes in their patients without a specific list of medications associated with geriatric syndromes (MAGS).[20]
In response to this gap, identifying these medications is important and should be a starting point in efforts toward prevention and treatment of geriatric syndromes. The 2 main objectives of this study were to first identify medications that may meaningfully contribute to 6 geriatric syndromes and subsequently describe the frequency of these medications in a population transitioning from acute care to postacute care to highlight the need and potential impact of such a list.
METHODS
This study included 2 phases that aligned with our 2 primary objectives. Phase 1 involved identifying medications associated with 6 geriatric syndromes, and phase 2 included a cross‐sectional analysis of the prevalence of these medications in a sample of patients discharged to SNFs.
Phase 1: Development of the MAGS List
Figure 1 depicts the underlying conceptual model and approach that was used in phase 1. The interaction between the patient factors and medication leads to polypharmacy that contributes to geriatric syndromes and additional adverse outcomes. As a starting point for mitigating geriatric syndromes, we used an iterative analytical process to identify a list of medications associated with the following geriatric syndromes that were documented to be highly prevalent in patients discharged to SNFs: cognitive impairment, delirium, falls, unintentional weight and/or appetite loss, urinary incontinence, and depression.[8] To be inclusive and sensitive, our approach differed from traditional systematic reviews, and in fact was meant to bring together much of the established systematic literature about disparate geriatric syndromes in 1 place, because patients often do not experience a geriatric syndrome in isolation, but rather experience multiple geriatric syndromes.[8] The MAGS list had 3 main inclusion criteria (Figure 1): (1) evidence in the published literature (systematic reviews, cohort studies, randomized clinical trials) that the medication is related to the syndrome, (2) expert panel opinion, and (3) drug databases (Lexicomp Online database[22] and/or US Food and Drug Administration [FDA]approved package inserts).[23] We generated an initial list of medications based on these 3 main criteria to identify medications with significant associations to each geriatric syndrome. The list was further expanded and vetted using an iterative review of each medication list as it related to each geriatric syndrome through a series of group meetings focused around each geriatric syndrome. Following further discussion, we obtained agreement among all team members for medications included in the final list. For each geriatric syndrome, we excluded medications from consideration if they were used to treat the same geriatric syndrome (eg, ‐adrenergic blockers used to treat incontinence in men were listed as associated with incontinence only in women). We classified medications according to the Established Pharmacologic Class available at the FDA website. We also compared our final MAGS list with the 2015 AGS Beer's list[20] by identifying medications that were related to the 6 geriatric syndromes. This included Beers[20]‐cited rationale of anticholinergic, extrapyramidal symptoms, orthostatic hypotension (eg, falls), high‐risk adverse central nervous system effects, sedating, cognitive decline (eg, antipsychotics), delirium, falls, fractures, incontinence, and gastrointestinal (eg, nausea, vomiting). Specifically, we assessed whether the medications were included as inappropriate by the AGS Beers 2015[20] list and also whether they documented the syndrome association for that medication.
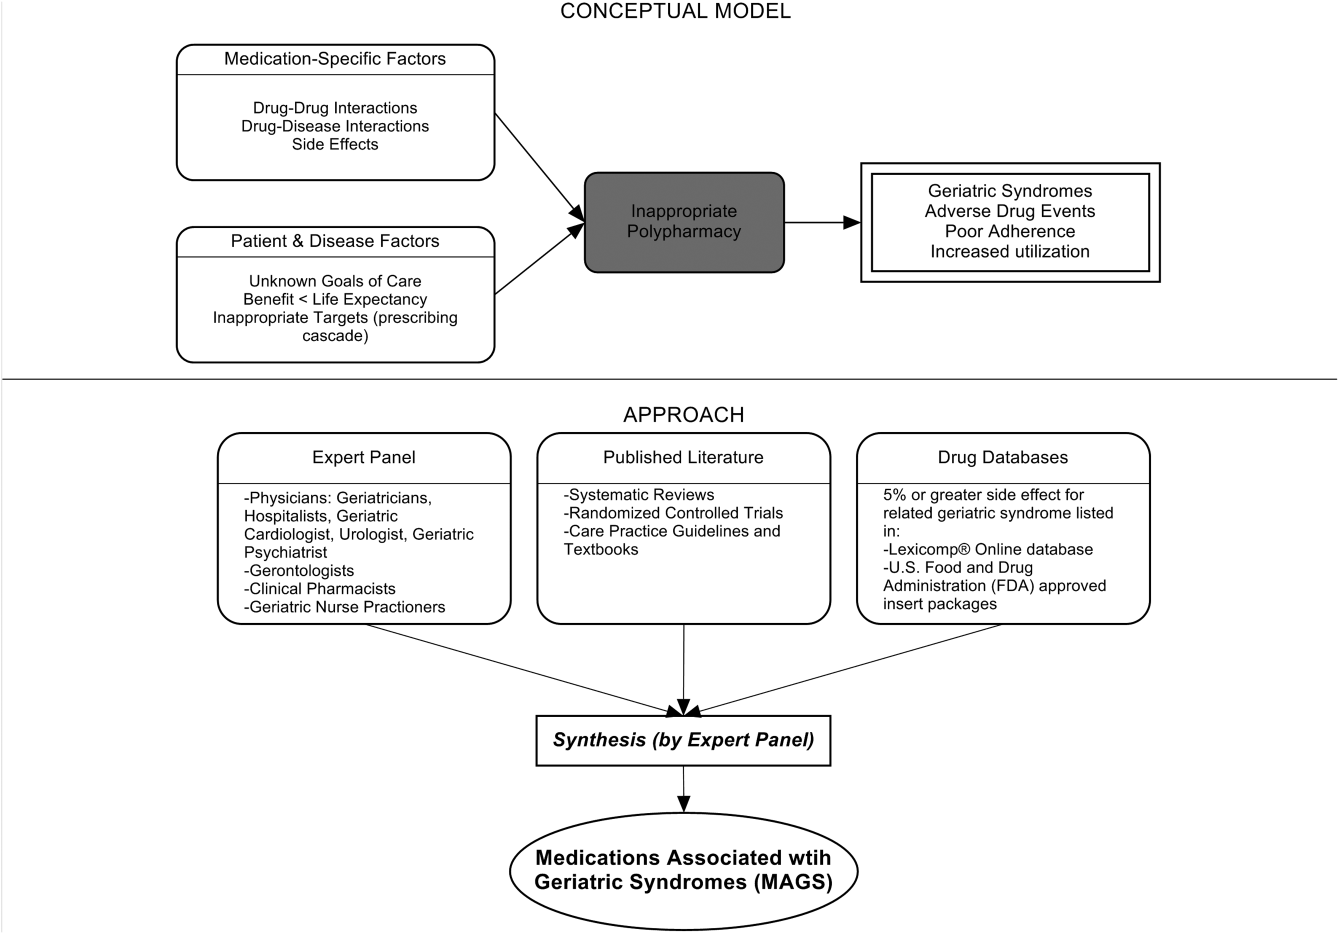
Phase 2: Prevalence of MAGS in Hospitalized Older Adults Discharged to SNFs
Sample
We next applied the MAGS list to a convenience sample of hospitalized patients discharged to SNFs to assess the prevalence of MAGS in this sample, and also to compare with the prevalence of Beers criteria[20] medications. Our sample was selected from data collected as part of a quality‐improvement project to reduce hospital readmissions in patients discharged to SNFs. The larger study enrolled a total 1093 medical and surgical patients who had Medicare insurance eligibility and were discharged from 1 large university hospital to 23 area SNFs from January 17, 2013 through July 31, 2014. The university institutional review board waived the requirement for written consent. For the purpose of this substudy. we selected the first 154 patients with complete chart abstraction (approximately 15% of the total) as a convenience sample.
Data Analysis
We applied descriptive statistics to summarize demographic and clinical characteristics of the convenience sample. To understand potential selection biases that could have resulted by the convenience sampling, we compared participant characteristics of the convenience sample (N = 154) with the characteristics of the remaining participants of the larger study (N = 939) using independent sample t tests and 2 tests for continuous and categorical measures, respectively. We applied the MAGS list and the AGS 2015 Beers criteria[20] for the sample of 154 and identified the medications associated with each of the 6 geriatric syndromes from the discharge medication lists completed by hospital clinical pharmacists. For each patient, we identified both scheduled and PRN (pro re nata, or as needed) medications associated with each geriatric syndrome. Thereafter, we determined whether the discharge list contained at least 1 medication associated with a geriatric syndrome per the MAGS list and the AGS Beers 2015 criteria,[20] and the percentage of overall medications that were part of the MAGS and Beers lists. Data were aggregated using means and standard deviations across syndromes (ie, number of discharge medications per syndrome per patient) along with the percentage of patients with 1 or more medications related to a specific syndrome and the percentage of medications that were MAGS. All analyses were performed using the SPSS statistical package (IBM SPSS Statistics for Windows, version 23.0; IBM, Armonk, NY).
RESULTS
Phase 1: MAGS List
The iterative process applied in this analysis generated a list of 513 medications associated with the 6 geriatric syndromes. The list of medications related to each syndrome and the corresponding rationale and relevant references for their inclusion is presented in the Supporting Information, Appendix 1, in the online version of this article. Table 1 summarizes these medications across 18 major drug categories. Antiepileptics were linked to all 6 geriatric syndromes, whereas antipsychotics, antidepressants, antiparkinsonism, and opioid agonists were associated with 5 syndromes. Ten of the 18 categories were associated with 3 geriatric syndromescognitive impairment, delirium, and falls. Four medication categories were associated with only 1 syndrome. Nonopioid/nonsteroidal anti‐inflammatory and/or analgesics and nonopioid cough suppressant and expectorant medications were associated with falls syndrome only. Hormone replacement medications were associated with depression only, and immunosuppressants were associated with unintentional weight and appetite loss only.
| Major Medication Category | Delirium | Cognitive Impairment | Falls | Unintentional Weight and Appetite Loss | Urinary Incontinence | Depression | Drug Class/Drug Within Each Category |
|---|---|---|---|---|---|---|---|
| |||||||
| Antipsychotics | ✓ | ✓ | ✓ | ✓ | Atypical and typical antipsychotics, buspirone | ||
| Antidepressants | ✓ | ✓ | ✓ | ✓ | ✓ | Tricyclic and tetracyclic antidepressants, serotonin reuptake inhibitors, serotonin and norepinephrine reuptake inhibitor, aminoketone | |
| Antiepileptics | ✓ | ✓ | ✓ | ✓ | ✓ | ✓ | Antiepileptics, mood stabilizers, barbiturates |
| Antiparkinsonism | ✓ | ✓ | ✓ | ✓ | ✓ | Aromatic amino acid decarboxylation inhibitor and catechol‐o‐methyltransferase inhibitor, catecholamine‐depleting sympatholytic, catechol‐o‐methyltransferase inhibitor, dopaminergic agonist, ergot derivative, monoamine oxidase inhibitor, nonergot dopamine agonist, | |
| Benzodiazapines | ✓ | ✓ | ✓ | Benzodiazapines only | |||
| Nonbenzodiazepine hypnotics | ✓ | ✓ | ✓ | Benzodiazepine analogs, nonbenzodiazepine hypnotics, tranquilizers, ‐aminobutyric acid A receptor agonist | |||
| Opioid agonists | ✓ | ✓ | ✓ | ✓ | ✓ | Full or partial opioid agonists, opiates, opioids | |
| Nonopioid/nonsteroidal anti‐inflammatory and/or analgesics | ✓ | Nonopioid analgesics, NSAIDs, COX‐2 selective inhibitor NSAIDs | |||||
| Antihypertensives | ✓ | ✓ | ✓ | Calcium channel blocker, ‐adrenergic blocker, angiotensin‐converting enzyme inhibitor, angiotensin 2 receptor blocker, ‐adrenergic blocker, diuretics (loop, potassium sparing, thiazide), nitrate vasodilators, aldosterone blocker | |||
| Antiarrhythmic | ✓ | ✓ | ✓ | Antiarrhythmics, cardiac glycosides | |||
| Antidiabetics | ✓ | ✓ | Insulin and insulin analogs, sulfonylureas, ‐glucosidase inhibitor, amylin analog, biguanide, glinide, GLP‐1 receptor agonist, glucagon‐like peptide‐1 agonist | ||||
| Anticholinergics and/or antihistaminics | ✓ | ✓ | ✓ | ✓ | Anticholinergics, histamine receptor antagonists, muscarininc antagonists, combined anticholinergics, and histamine receptor antagonists | ||
| Antiemetics | ✓ | ✓ | ✓ | Antiemetics, dopaminergic antagonists, dopamine‐2 receptor antagonist | |||
| Hormone replacement | ✓ | Corticosteroids, progestin, estrogen, estrogen agonist/antagonist, gonadotropin releasing hormone receptor agonist | |||||
| Muscle relaxers | ✓ | ✓ | ✓ | ✓ | Muscle relaxers | ||
| Immunosuppressants | ✓ | Calcineurin inhibitor immunosuppressant, folate analog metabolic inhibitor, purine antimetabolite | |||||
| Nonopioid cough suppressants and expectorants | ✓ | Expectorant, non‐narcotic antitussive, ‐1 agonist, uncompetitive N‐methyl‐D‐aspartate receptor antagonist | |||||
| Antimicrobials | ✓ | ✓ | Macrolide, cephalosporin, penicillin class, rifamycin, non‐nucleoside analog reverse transcriptase inhibitor, influenza A M2 protein inhibitor | ||||
| Others | ✓ | ✓ | ✓ | ✓ | ✓ | ✓ | ‐3‐adrenergic agonist, methylxanthine, cholinesterase inhibitor, interferon and , partial cholinergic nicotinic agonist, tyrosine hydroxylase, retinoid, serotonin‐1b and serotonin‐1d receptor agonist, stimulant laxative, vitamin K antagonist, platelet aggregation inhibitor |
Approximately 58% of the medications overlapped with the AGS 2015 Beer's Criteria[20] irrespective of whether the specific syndrome association was stated in the rationale.[20] Medications that overlapped were mostly in the delirium, cognitive impairment, and falls category with only a few overlaps in depression, unintentional weight loss, and urinary incontinence lists (see Supporting Information, Appendix 1, in the online version of this article).
Phase 2: Prevalence of MAGS
Among 154 participants, the mean age was 76.5 (10.6) years, 64.3% were female, 77.9% were white, and 96.1% non‐Hispanic. The median hospital length of stay was 6 days, with an interquartile range of 5 days. The orthopedic service discharged the highest proportion of patients (24%), followed by the geriatrics and internal medicine services, which each discharged 19.5% of the patients (Table 2). The remaining participants of the larger quality‐improvement project (N = 939) did not significantly differ on these demographic and clinical characteristics except for hospital length of stay, which was shorter in the sample analyzed (see Supporting Information, Appendix 2, in the online version of this article).
| Baseline Characteristics | Mean ( SD) or Percent (n) |
|---|---|
| |
| Age, y | 76.5 ( 10.6) |
| Sex | |
| Female | 64.3% (99) |
| Race | |
| White | 77.9% (126) |
| Black | 16.2% (25) |
| Unknown | 0.6% (1) |
| Declined | 0.6% (1) |
| Missing | 0.6% (1) |
| Ethnicity | |
| Non‐Hispanic | 96.1% (148) |
| Hispanic | 1.3% (2) |
| Unknown | 2.6% (4) |
| Hospital length of stay, d | 7.0 ( 4.2) |
| Hospital length of stay, d, median (IQR) | 6.0 (5.0) |
| No. of hospital discharge medications, count | 14.0 ( 4.7) |
| Discharge service | |
| Orthopedic service | 24.0% (37) |
| Geriatric service | 19.5% (30) |
| Internal medicine | 19.5% (30) |
| Other | 37.0% (57) |
Patients were discharged to SNFs with an average of 14.0 (4.7) medication orders. Overall, 43% (13%) of these discharge medication orders were MAGS. Every patient in the sample was ordered at least 1 medication associated with geriatric syndromes. Multiple MAGS were the norm, with an average of 5.9 (2.2) MAGS per patient. MAGS were also the norm, as 98.1% of the sample had medication orders associated with at least 2 different syndromes.
When the Beer's criteria[20] were applied to the medication orders (instead of the MAGS list), problematic medications appeared less common. Patients had an average of 3.04 (1.7) MAGS that were also listed on the AGS 2015 Beer's list,[20] representing an average of 22.3% of all discharge orders.
Table 3 illustrates the average number of medications per patient associated with each syndrome, and the percentage of patients (number in parentheses) discharged with at least 1 medication associated with each syndrome per the MAGS list and the Beers 2015 criteria.[20] For example, per the MAGS list, the syndrome most frequently associated with medications was falls, with patients discharged on an average of 5.5 (2.2) medications associated with falls, and 100% of the sample had at least 1 discharge medication associated with falls. Alternatively, the syndrome associated with the lowest frequency of medications was unintentional weight loss (with an average of 0.38 medications per patient), although 36% of these patients had more than 1 discharge medication associated with weight loss. As seen in Table 3, the mean and prevalence of 1 or more medications associated with each of the geriatric syndromes as identified by the Beers 2015 criteria[20] was lower than those identified by the MAGS list developed for this study.
| Geriatric Syndromes | Associated Medications per MAGS List | Associated Medications per AGS Beers 2015 Criteria | ||
|---|---|---|---|---|
| Mean SD | Percentage of Patients Receiving 1 Related Medication | Mean SD | Percentage of Patients Receiving 1 Related Medication | |
| ||||
| Cognitive impairment | 1.8 ( 1.2) | 84.4% (130) | 1.6 ( 1.2) | 78.6% (121) |
| Delirium | 1.4 ( 1.1) | 76.0% (117) | 1.3 ( 1.2) | 68.2% (105) |
| Falls | 5.5 ( 2.2) | 100% (154) | 2.6 ( 1.6) | 92.2% (142) |
| Unintentional weight and/or appetite loss | 0.4 ( 0.5) | 36.3% (56) | 0.1 ( 0.3) | 6.5% (10) |
| Urinary incontinence | 1.6 ( 1.0) | 85.7% (132) | 0.1 ( 0.2) | 5.8% (9) |
| Depression | 1.7 ( 1.0) | 90.9% (140) | 0.0 ( 0.0) | 0.0% (0) |
| All syndromes | 5.9 ( 2.2) | 100% (154) | 3.0 ( 1.7) | 95% (149) |
DISCUSSION
An iterative process of evidence review by a multidisciplinary panel resulted in a list of 513 medications associated with 6 common geriatric syndromes. This analysis demonstrated that hospitalized, older patients discharged to SNFs were frequently prescribed MAGS. The rate of prescribing ranged from 100% of patients with a medication associated with falls to 36% for unintentional weight loss. Moreover, an alarming 43% of all medications at hospital discharge were MAGS. For this vulnerable population, the combination of high prevalence of MAGS and high risk of geriatric syndromes emphasize a need to critically review the risks and benefits of MAGS throughout hospitalization and at the time of discharge.
A body of evidence demonstrates that many drugs in a typical older adult regimen have no specific clinical indication, are considered inappropriate, or have uncertain efficacy in the geriatric population.[24, 25, 26] This study builds on the foundational work described in landmark reviews such as the AGS Beers[20] and STOPP/START[21] (Screening Tool of Older Persons' Potentially Inappropriate Prescriptions/Screening Tool to Alert doctors to Right, i.e. appropriate indicated Treatment) criteria. Both of these tools, however, were specifically designed as screening tools to identify medications considered unsafe for older adults under most circumstances and within specific illness states.[19, 20, 21] They are most often utilized when starting a medication to avoid acute adverse events. In contrast, the MAGS list was developed to be inclusive of medications that are often appropriate for many medical diagnoses but may also contribute to underlying geriatric syndromes that are more chronic in nature. In addition, inclusion of such medicines increases the sensitivity of screening for medications that can be targeted through patient‐centered deprescribing efforts when clinically appropriate.
A major strength of this study is that we bring together evidence across a spectrum of geriatric syndromes commonly experienced by hospitalized elders. In addition to evaluating multiple syndromes, we applied multiple modalities; particularly the use of an iterative review process by a multidisciplinary team of experts and using Lexicomp and FDA insert packages for linking medications to specific geriatric conditions. The inclusion criteria were broadened beyond single sources of evidence in an effort to capture a comprehensive list of medications. As a result, the MAGS list can be implemented as a screening tool for deprescribing interventions and assessing medication appropriateness to address individual or clusters of geriatric syndromes within a patient.
In addition to expanding this knowledge base, clinical relevance of the MAGS list is highlighted by its application to a sample of hospitalized older adults discharged to SNFs, a cohort known to experience geriatric syndromes. In fact, 43% of patients' medications at hospital discharge were MAGS. Importantly, due to the cross‐sectional nature of this study, we cannot be certain if the medication caused or potentiated each of the geriatric syndromes. However, hospitals and SNFs are devoting major resources toward reduction of falls, avoidance of urinary catheter use, and reduction of preventable readmissions. These efforts can be complemented by considering the number of medications associated with falls, urinary incontinence, and overall MAGS burden. The striking prevalence of MAGS demonstrates a rigorous need to weigh the risks and benefits of these medications. Above all, the intent of this study is not to propose that any MAGS be reflexively stopped, but rather that the MAGS list should facilitate a holistic approach to care for the complex older adult. For example, standard therapies such as gabapentin may be appropriate for treating neuralgic pain but may also contribute to falls and urinary incontinence. Thus, alternative pain treatments could be selected in place of gabapentin for a 75‐year old patient who is experiencing recurrent falls and increasing incontinence. Therefore, the MAGS list enables a patient‐provider discussion wherein medications' therapeutic benefits can be weighed against risks posed by specific clusters of geriatric syndromes, potential impact on quality of life, and consistency with goals of care.
This study has some limitations. First, although we examined a broad number of geriatric syndromes, several other geriatric syndromes experienced by hospitalized older adults were not addressed including: fecal incontinence, insomnia, and functional impairment. These syndromes were intentionally excluded from the study a priori due to reasons of feasibility and scope. Second, unlike the Beer's 2015 criteria, the MAGS list does not sub‐classify associations of medications with geriatric syndromes for patients with specific diseases (eg, heart failure). In fact, our MAGS list included medications often indicated in treating these diagnoses. A clinician must work with the patient to weigh the disease‐specific benefits of some medications with the potential effect on geriatric syndrome symptoms and outcomes. Third, the instrument has a very high sensitivity, which was intended to generate an inclusive list of medications that enables providers to weigh risks of geriatric syndromes with the intended indication benefit. The objective is not to use this list as a reflexive tool but rather help clinicians identify a starting point to address geriatric syndromes in their patients to make patient‐centered medication decisions. Although the MAGS list is intentionally large (sensitive), the advent of advanced bioinformatics can enable MAGS to be assessed in the future for both clinical and research purposes. Fourth, FDA insert packages and Lexicomp databases report anything experienced by the patient while on the particular medication, but it might not necessarily imply a causative link. The high use of MAGS and the specific geriatric syndrome may coexist due to the high prevalence and interplay of multimorbidity, polypharmacy, and geriatric syndromes in this population. Last, the list was developed by expert panel members predominantly from a single institution, which may introduce bias. Despite these limitations, the prevalence of these medications in a sample of patients transitioning from acute to postacute care highlights the utility of the MAGS list in future clinical research and quality improvement endeavors.
In conclusion, the MAGS list provides a comprehensive and sensitive indicator of medications associated with any of 6 geriatric syndromes regardless of medication indication and appropriateness. The MAGS list provides an overall degree of medication burden with respect to geriatric syndromes and a foundation for future research to assess the relationship between the presence of geriatric syndromes and syndrome‐associated medications. The MAGS list is an important first step in summarizing the data that link medications to geriatric syndromes. Future studies are needed to broaden the analysis of MAGS for other common geriatric syndromes and to identify new and emerging medications not present during the time of this analysis. The MAGS list has the potential to facilitate deprescribing efforts needed to combat the epidemic of overprescribing that may be contributing to the burden of geriatric syndromes among older patients.
Acknowledgements
The authors thank Dr. Linda Beuscher, Dr. Patricia Blair Miller, Dr. Joseph Ouslander, Dr. William Stuart Reynolds, and Dr. Warren Taylor for providing their expertise and participating in the expert panel discussions that facilitated the development of the MAGS list. The authors also recognize the research support provided by Christopher Simon Coelho.
Disclosures: This research was supported by the Department of Health and Human Services, Centers for Medicare & Medicaid Services grant #1C1CMS331006 awarded to Principal Investigator, John F. Schnelle, PhD. Dr. Vasilevskis was supported by the National Institute on Aging of the National Institutes of Health award K23AG040157 and the Geriatric Research, Education and Clinical Center. Dr. Bell was supported by National Institute on Aging‐K award K23AG048347‐01A1. Dr. Mixon is supported by a Veterans Affairs Health Services Research & Development Career Development Award (12‐168). This research was also supported by the National Center for Advancing Translational Sciences Clinical and Translational Science award UL1TR000445. The contents of this publication are solely the responsibility of the authors and do not necessarily represent the official views of the US Department of Health and Human Services or any of its agencies, the National Center for Advancing Translation Science, the National Institutes of Health, or the Department of Veterans Affairs. Each coauthor contributed significantly to the manuscript. Dr. Kripalani has received stock/stock options from Bioscape Digital, LLC. None of the other authors have significant conflicts of interest to report related to this project or the results reported within this article.
- , , , . Geriatric syndromes: clinical, research, and policy implications of a core geriatric concept. J Am Geriatr Soc. 2007;55:780–791.
- , , , . Shared risk factors for falls, incontinence, and functional dependence. Unifying the approach to geriatric syndromes. JAMA. 1995;273:1348–1353.
- , , , . Geriatric syndromes: medical misnomer or progress in geriatrics? Neth J Med. 2003;61:83–87.
- , , , et al. Geriatric conditions in acutely hospitalized older patients: prevalence and one‐year survival and functional decline. PLoS One. 2011;6:e26951.
- , , , , . Geriatric conditions as predictors of increased number of hospital admissions and hospital bed days over one year: findings of a nationwide cohort of older adults from Taiwan. Arch Gerontol Geriatr. 2014;59:169–174.
- , , , , . Geriatric conditions and disability: the Health and Retirement Study. Ann Intern Med. 2007;147:156–164.
- , , , , , . A prospective cohort study of geriatric syndromes among older medical patients admitted to acute care hospitals. J Am Geriatr Soc. 2011;59:2001–2008.
- , , , et al. Geriatric syndromes in hospitalized older adults discharged to skilled nursing facilities. J Am Geriatr Soc. 2016;64(4):715–722.
- , , , et al. Discharge to a skilled nursing facility and subsequent clinical outcomes among older patients hospitalized for heart failure. Circ Heart Fail. 2011;4:293–300.
- . Hazards of hospitalization of the elderly. Ann Intern Med. 1993;118:219–223.
- , , , , . Geriatric syndromes in elderly patients admitted to an inpatient cardiology ward. J Hosp Med. 2007;2:394–400.
- , , , . Effect of hospitalization on inappropriate prescribing in elderly Medicare beneficiaries. J Am Geriatr Soc. 2015;63:699–707.
- , , , et al. Polypharmacy cutoff and outcomes: five or more medicines were used to identify community‐dwelling older men at risk of different adverse outcomes. J Clin Epidemiol. 2012;65:989–995.
- , , , , . Investigating polypharmacy and drug burden index in hospitalised older people. Intern Med J. 2013;43:912–918.
- , . Potentially harmful drug‐drug interactions in the elderly: a review. Am J Geriatr Pharmacother. 2011;9:364–377.
- , , , . Hospital admissions/visits associated with drug‐drug interactions: a systematic review and meta‐analysis. Pharmacoepidemiol Drug Saf. 2014;23:489–497.
- , . Optimising drug treatment for elderly people: the prescribing cascade. BMJ. 1997;315:1096–1099.
- , , , et al. Association between acute geriatric syndromes and medication‐related hospital admissions. Drugs Aging. 2012;29:691–699.
- American Geriatrics Society Beers Criteria Update Expert P. American Geriatrics Society updated Beers Criteria for potentially inappropriate medication use in older adults. J Am Geriatr Soc. 2012;60:616–631.
- By the American Geriatrics Society 2015 Beers Criteria Update Expert Panel. American Geriatrics Society 2015 updated Beers criteria for potentially inappropriate medication use in older adults. J Am Geriatr Soc. 2015;63:2227–2246.
- , . STOPP (Screening Tool of Older Persons' potentially inappropriate Prescriptions): application to acutely ill elderly patients and comparison with Beers' criteria. Age Ageing. 2008;37:673–679.
- , , , et al. Warfarin versus aspirin for stroke prevention in an elderly community population with atrial fibrillation (the Birmingham Atrial Fibrillation Treatment of the Aged Study, BAFTA): a randomised controlled trial. Lancet. 2007;370:493–503.
- U.S. Food and Drug Administration. Drugs. Available at: http://www.fda.gov/Drugs/default.htm. Accessed May 15th, 2015.
- , , , et al. Inappropriate medication use among frail elderly inpatients. Ann Pharmacother. 2004;38:9–14.
- , , , et al. Inappropriate medications in elderly ICU survivors: where to intervene? Arch Intern Med. 2011;171:1032–1034.
- , , , et al. Appropriateness of medication prescribing in ambulatory elderly patients. J Am Geriatr Soc. 1994;42:1241–1247.
Geriatric syndromes are common clinical conditions in older adults that do not fall into specific disease categories. Unlike the traditional definition of a syndrome, geriatric syndrome refers to a condition that is mediated by multiple shared underlying risk factors.[1, 2] Conditions commonly referred to as geriatric syndromes include delirium, cognitive impairment, falls, unintentional weight loss, depressive symptoms, and incontinence. Even though many perceive it as medical misnomer,[3] geriatric syndromes have been shown to negatively impact quality of life and activities of daily living in older adults.[2] They are also associated with adverse outcomes such as increased healthcare utilization, functional decline, and mortality, even after adjusting for age and disease severity.[4, 5, 6] Hospitalized older adults, including those discharged to skilled nursing facilities (SNFs)[7, 8] are particularly at high risk for new‐onset or exacerbation of geriatric syndromes and poor outcomes.[7, 9, 10] However, hospital providers seldom assess, manage, or document geriatric syndromes because they are often overshadowed by disease conditions that lead to an acute episode requiring hospitalization (e.g., heart disease).[11]
Pharmacotherapy is the cornerstone of hospital treatment, and it is well‐known that it affects multiple physiologic systems causing side effects apart from the condition they are approved to treat. Given that geriatric syndromes are a result of impairments in multiple organ systems, it is plausible that pharmacotherapy may initiate or worsen these syndromes.[12] Medication‐related problems in older adults are well known. Polypharmacy and adverse drug events (as a result of drug‐drug/disease interactions and changes in pharmacokinetics and pharmacodynamics) are prevalent in multimorbid elderly patients.[13, 14, 15, 16] The prescribing cascade[17] increases the medication burden and may be a contributing factor for geriatric syndromes in hospitalized patients.[18] For instance, laxatives may be prescribed to counteract constipation caused by anticholinergic drugs.
The American Geriatric Society (AGS) Beers list[19, 20] and similar criteria[21] provide excellent resources to identify medications with potentially harmful interactions or adverse effects in older adults. Although these lists include medicines associated with a specific geriatric syndrome, they were not developed to explicitly link medicines across multiple geriatric syndromes, regardless of indication or appropriateness. For example, medications that effect important geriatric syndromes like unintentional weight/appetite loss, depression, and urinary incontinence are not extensively covered. In addition, disease‐appropriate medications (eg, ‐blockers for systolic heart failure), that may be associated with a geriatric syndrome (eg, falls) are not included; however, they may be important to consider for a patient and clinician who are weighing the disease benefits compared to the geriatric syndrome‐related risks. Finally, the AGS 2015 Beers criteria panel mentions the limitation that many medication associations may be excluded because older adults are less represented in clinical trials.[20] Clinicians are currently limited in identifying medications potentially contributing to a broad set of geriatric syndromes in their patients without a specific list of medications associated with geriatric syndromes (MAGS).[20]
In response to this gap, identifying these medications is important and should be a starting point in efforts toward prevention and treatment of geriatric syndromes. The 2 main objectives of this study were to first identify medications that may meaningfully contribute to 6 geriatric syndromes and subsequently describe the frequency of these medications in a population transitioning from acute care to postacute care to highlight the need and potential impact of such a list.
METHODS
This study included 2 phases that aligned with our 2 primary objectives. Phase 1 involved identifying medications associated with 6 geriatric syndromes, and phase 2 included a cross‐sectional analysis of the prevalence of these medications in a sample of patients discharged to SNFs.
Phase 1: Development of the MAGS List
Figure 1 depicts the underlying conceptual model and approach that was used in phase 1. The interaction between the patient factors and medication leads to polypharmacy that contributes to geriatric syndromes and additional adverse outcomes. As a starting point for mitigating geriatric syndromes, we used an iterative analytical process to identify a list of medications associated with the following geriatric syndromes that were documented to be highly prevalent in patients discharged to SNFs: cognitive impairment, delirium, falls, unintentional weight and/or appetite loss, urinary incontinence, and depression.[8] To be inclusive and sensitive, our approach differed from traditional systematic reviews, and in fact was meant to bring together much of the established systematic literature about disparate geriatric syndromes in 1 place, because patients often do not experience a geriatric syndrome in isolation, but rather experience multiple geriatric syndromes.[8] The MAGS list had 3 main inclusion criteria (Figure 1): (1) evidence in the published literature (systematic reviews, cohort studies, randomized clinical trials) that the medication is related to the syndrome, (2) expert panel opinion, and (3) drug databases (Lexicomp Online database[22] and/or US Food and Drug Administration [FDA]approved package inserts).[23] We generated an initial list of medications based on these 3 main criteria to identify medications with significant associations to each geriatric syndrome. The list was further expanded and vetted using an iterative review of each medication list as it related to each geriatric syndrome through a series of group meetings focused around each geriatric syndrome. Following further discussion, we obtained agreement among all team members for medications included in the final list. For each geriatric syndrome, we excluded medications from consideration if they were used to treat the same geriatric syndrome (eg, ‐adrenergic blockers used to treat incontinence in men were listed as associated with incontinence only in women). We classified medications according to the Established Pharmacologic Class available at the FDA website. We also compared our final MAGS list with the 2015 AGS Beer's list[20] by identifying medications that were related to the 6 geriatric syndromes. This included Beers[20]‐cited rationale of anticholinergic, extrapyramidal symptoms, orthostatic hypotension (eg, falls), high‐risk adverse central nervous system effects, sedating, cognitive decline (eg, antipsychotics), delirium, falls, fractures, incontinence, and gastrointestinal (eg, nausea, vomiting). Specifically, we assessed whether the medications were included as inappropriate by the AGS Beers 2015[20] list and also whether they documented the syndrome association for that medication.
Phase 2: Prevalence of MAGS in Hospitalized Older Adults Discharged to SNFs
Sample
We next applied the MAGS list to a convenience sample of hospitalized patients discharged to SNFs to assess the prevalence of MAGS in this sample, and also to compare with the prevalence of Beers criteria[20] medications. Our sample was selected from data collected as part of a quality‐improvement project to reduce hospital readmissions in patients discharged to SNFs. The larger study enrolled a total 1093 medical and surgical patients who had Medicare insurance eligibility and were discharged from 1 large university hospital to 23 area SNFs from January 17, 2013 through July 31, 2014. The university institutional review board waived the requirement for written consent. For the purpose of this substudy. we selected the first 154 patients with complete chart abstraction (approximately 15% of the total) as a convenience sample.
Data Analysis
We applied descriptive statistics to summarize demographic and clinical characteristics of the convenience sample. To understand potential selection biases that could have resulted by the convenience sampling, we compared participant characteristics of the convenience sample (N = 154) with the characteristics of the remaining participants of the larger study (N = 939) using independent sample t tests and 2 tests for continuous and categorical measures, respectively. We applied the MAGS list and the AGS 2015 Beers criteria[20] for the sample of 154 and identified the medications associated with each of the 6 geriatric syndromes from the discharge medication lists completed by hospital clinical pharmacists. For each patient, we identified both scheduled and PRN (pro re nata, or as needed) medications associated with each geriatric syndrome. Thereafter, we determined whether the discharge list contained at least 1 medication associated with a geriatric syndrome per the MAGS list and the AGS Beers 2015 criteria,[20] and the percentage of overall medications that were part of the MAGS and Beers lists. Data were aggregated using means and standard deviations across syndromes (ie, number of discharge medications per syndrome per patient) along with the percentage of patients with 1 or more medications related to a specific syndrome and the percentage of medications that were MAGS. All analyses were performed using the SPSS statistical package (IBM SPSS Statistics for Windows, version 23.0; IBM, Armonk, NY).
RESULTS
Phase 1: MAGS List
The iterative process applied in this analysis generated a list of 513 medications associated with the 6 geriatric syndromes. The list of medications related to each syndrome and the corresponding rationale and relevant references for their inclusion is presented in the Supporting Information, Appendix 1, in the online version of this article. Table 1 summarizes these medications across 18 major drug categories. Antiepileptics were linked to all 6 geriatric syndromes, whereas antipsychotics, antidepressants, antiparkinsonism, and opioid agonists were associated with 5 syndromes. Ten of the 18 categories were associated with 3 geriatric syndromescognitive impairment, delirium, and falls. Four medication categories were associated with only 1 syndrome. Nonopioid/nonsteroidal anti‐inflammatory and/or analgesics and nonopioid cough suppressant and expectorant medications were associated with falls syndrome only. Hormone replacement medications were associated with depression only, and immunosuppressants were associated with unintentional weight and appetite loss only.
| Major Medication Category | Delirium | Cognitive Impairment | Falls | Unintentional Weight and Appetite Loss | Urinary Incontinence | Depression | Drug Class/Drug Within Each Category |
|---|---|---|---|---|---|---|---|
| |||||||
| Antipsychotics | ✓ | ✓ | ✓ | ✓ | Atypical and typical antipsychotics, buspirone | ||
| Antidepressants | ✓ | ✓ | ✓ | ✓ | ✓ | Tricyclic and tetracyclic antidepressants, serotonin reuptake inhibitors, serotonin and norepinephrine reuptake inhibitor, aminoketone | |
| Antiepileptics | ✓ | ✓ | ✓ | ✓ | ✓ | ✓ | Antiepileptics, mood stabilizers, barbiturates |
| Antiparkinsonism | ✓ | ✓ | ✓ | ✓ | ✓ | Aromatic amino acid decarboxylation inhibitor and catechol‐o‐methyltransferase inhibitor, catecholamine‐depleting sympatholytic, catechol‐o‐methyltransferase inhibitor, dopaminergic agonist, ergot derivative, monoamine oxidase inhibitor, nonergot dopamine agonist, | |
| Benzodiazapines | ✓ | ✓ | ✓ | Benzodiazapines only | |||
| Nonbenzodiazepine hypnotics | ✓ | ✓ | ✓ | Benzodiazepine analogs, nonbenzodiazepine hypnotics, tranquilizers, ‐aminobutyric acid A receptor agonist | |||
| Opioid agonists | ✓ | ✓ | ✓ | ✓ | ✓ | Full or partial opioid agonists, opiates, opioids | |
| Nonopioid/nonsteroidal anti‐inflammatory and/or analgesics | ✓ | Nonopioid analgesics, NSAIDs, COX‐2 selective inhibitor NSAIDs | |||||
| Antihypertensives | ✓ | ✓ | ✓ | Calcium channel blocker, ‐adrenergic blocker, angiotensin‐converting enzyme inhibitor, angiotensin 2 receptor blocker, ‐adrenergic blocker, diuretics (loop, potassium sparing, thiazide), nitrate vasodilators, aldosterone blocker | |||
| Antiarrhythmic | ✓ | ✓ | ✓ | Antiarrhythmics, cardiac glycosides | |||
| Antidiabetics | ✓ | ✓ | Insulin and insulin analogs, sulfonylureas, ‐glucosidase inhibitor, amylin analog, biguanide, glinide, GLP‐1 receptor agonist, glucagon‐like peptide‐1 agonist | ||||
| Anticholinergics and/or antihistaminics | ✓ | ✓ | ✓ | ✓ | Anticholinergics, histamine receptor antagonists, muscarininc antagonists, combined anticholinergics, and histamine receptor antagonists | ||
| Antiemetics | ✓ | ✓ | ✓ | Antiemetics, dopaminergic antagonists, dopamine‐2 receptor antagonist | |||
| Hormone replacement | ✓ | Corticosteroids, progestin, estrogen, estrogen agonist/antagonist, gonadotropin releasing hormone receptor agonist | |||||
| Muscle relaxers | ✓ | ✓ | ✓ | ✓ | Muscle relaxers | ||
| Immunosuppressants | ✓ | Calcineurin inhibitor immunosuppressant, folate analog metabolic inhibitor, purine antimetabolite | |||||
| Nonopioid cough suppressants and expectorants | ✓ | Expectorant, non‐narcotic antitussive, ‐1 agonist, uncompetitive N‐methyl‐D‐aspartate receptor antagonist | |||||
| Antimicrobials | ✓ | ✓ | Macrolide, cephalosporin, penicillin class, rifamycin, non‐nucleoside analog reverse transcriptase inhibitor, influenza A M2 protein inhibitor | ||||
| Others | ✓ | ✓ | ✓ | ✓ | ✓ | ✓ | ‐3‐adrenergic agonist, methylxanthine, cholinesterase inhibitor, interferon and , partial cholinergic nicotinic agonist, tyrosine hydroxylase, retinoid, serotonin‐1b and serotonin‐1d receptor agonist, stimulant laxative, vitamin K antagonist, platelet aggregation inhibitor |
Approximately 58% of the medications overlapped with the AGS 2015 Beer's Criteria[20] irrespective of whether the specific syndrome association was stated in the rationale.[20] Medications that overlapped were mostly in the delirium, cognitive impairment, and falls category with only a few overlaps in depression, unintentional weight loss, and urinary incontinence lists (see Supporting Information, Appendix 1, in the online version of this article).
Phase 2: Prevalence of MAGS
Among 154 participants, the mean age was 76.5 (10.6) years, 64.3% were female, 77.9% were white, and 96.1% non‐Hispanic. The median hospital length of stay was 6 days, with an interquartile range of 5 days. The orthopedic service discharged the highest proportion of patients (24%), followed by the geriatrics and internal medicine services, which each discharged 19.5% of the patients (Table 2). The remaining participants of the larger quality‐improvement project (N = 939) did not significantly differ on these demographic and clinical characteristics except for hospital length of stay, which was shorter in the sample analyzed (see Supporting Information, Appendix 2, in the online version of this article).
| Baseline Characteristics | Mean ( SD) or Percent (n) |
|---|---|
| |
| Age, y | 76.5 ( 10.6) |
| Sex | |
| Female | 64.3% (99) |
| Race | |
| White | 77.9% (126) |
| Black | 16.2% (25) |
| Unknown | 0.6% (1) |
| Declined | 0.6% (1) |
| Missing | 0.6% (1) |
| Ethnicity | |
| Non‐Hispanic | 96.1% (148) |
| Hispanic | 1.3% (2) |
| Unknown | 2.6% (4) |
| Hospital length of stay, d | 7.0 ( 4.2) |
| Hospital length of stay, d, median (IQR) | 6.0 (5.0) |
| No. of hospital discharge medications, count | 14.0 ( 4.7) |
| Discharge service | |
| Orthopedic service | 24.0% (37) |
| Geriatric service | 19.5% (30) |
| Internal medicine | 19.5% (30) |
| Other | 37.0% (57) |
Patients were discharged to SNFs with an average of 14.0 (4.7) medication orders. Overall, 43% (13%) of these discharge medication orders were MAGS. Every patient in the sample was ordered at least 1 medication associated with geriatric syndromes. Multiple MAGS were the norm, with an average of 5.9 (2.2) MAGS per patient. MAGS were also the norm, as 98.1% of the sample had medication orders associated with at least 2 different syndromes.
When the Beer's criteria[20] were applied to the medication orders (instead of the MAGS list), problematic medications appeared less common. Patients had an average of 3.04 (1.7) MAGS that were also listed on the AGS 2015 Beer's list,[20] representing an average of 22.3% of all discharge orders.
Table 3 illustrates the average number of medications per patient associated with each syndrome, and the percentage of patients (number in parentheses) discharged with at least 1 medication associated with each syndrome per the MAGS list and the Beers 2015 criteria.[20] For example, per the MAGS list, the syndrome most frequently associated with medications was falls, with patients discharged on an average of 5.5 (2.2) medications associated with falls, and 100% of the sample had at least 1 discharge medication associated with falls. Alternatively, the syndrome associated with the lowest frequency of medications was unintentional weight loss (with an average of 0.38 medications per patient), although 36% of these patients had more than 1 discharge medication associated with weight loss. As seen in Table 3, the mean and prevalence of 1 or more medications associated with each of the geriatric syndromes as identified by the Beers 2015 criteria[20] was lower than those identified by the MAGS list developed for this study.
| Geriatric Syndromes | Associated Medications per MAGS List | Associated Medications per AGS Beers 2015 Criteria | ||
|---|---|---|---|---|
| Mean SD | Percentage of Patients Receiving 1 Related Medication | Mean SD | Percentage of Patients Receiving 1 Related Medication | |
| ||||
| Cognitive impairment | 1.8 ( 1.2) | 84.4% (130) | 1.6 ( 1.2) | 78.6% (121) |
| Delirium | 1.4 ( 1.1) | 76.0% (117) | 1.3 ( 1.2) | 68.2% (105) |
| Falls | 5.5 ( 2.2) | 100% (154) | 2.6 ( 1.6) | 92.2% (142) |
| Unintentional weight and/or appetite loss | 0.4 ( 0.5) | 36.3% (56) | 0.1 ( 0.3) | 6.5% (10) |
| Urinary incontinence | 1.6 ( 1.0) | 85.7% (132) | 0.1 ( 0.2) | 5.8% (9) |
| Depression | 1.7 ( 1.0) | 90.9% (140) | 0.0 ( 0.0) | 0.0% (0) |
| All syndromes | 5.9 ( 2.2) | 100% (154) | 3.0 ( 1.7) | 95% (149) |
DISCUSSION
An iterative process of evidence review by a multidisciplinary panel resulted in a list of 513 medications associated with 6 common geriatric syndromes. This analysis demonstrated that hospitalized, older patients discharged to SNFs were frequently prescribed MAGS. The rate of prescribing ranged from 100% of patients with a medication associated with falls to 36% for unintentional weight loss. Moreover, an alarming 43% of all medications at hospital discharge were MAGS. For this vulnerable population, the combination of high prevalence of MAGS and high risk of geriatric syndromes emphasize a need to critically review the risks and benefits of MAGS throughout hospitalization and at the time of discharge.
A body of evidence demonstrates that many drugs in a typical older adult regimen have no specific clinical indication, are considered inappropriate, or have uncertain efficacy in the geriatric population.[24, 25, 26] This study builds on the foundational work described in landmark reviews such as the AGS Beers[20] and STOPP/START[21] (Screening Tool of Older Persons' Potentially Inappropriate Prescriptions/Screening Tool to Alert doctors to Right, i.e. appropriate indicated Treatment) criteria. Both of these tools, however, were specifically designed as screening tools to identify medications considered unsafe for older adults under most circumstances and within specific illness states.[19, 20, 21] They are most often utilized when starting a medication to avoid acute adverse events. In contrast, the MAGS list was developed to be inclusive of medications that are often appropriate for many medical diagnoses but may also contribute to underlying geriatric syndromes that are more chronic in nature. In addition, inclusion of such medicines increases the sensitivity of screening for medications that can be targeted through patient‐centered deprescribing efforts when clinically appropriate.
A major strength of this study is that we bring together evidence across a spectrum of geriatric syndromes commonly experienced by hospitalized elders. In addition to evaluating multiple syndromes, we applied multiple modalities; particularly the use of an iterative review process by a multidisciplinary team of experts and using Lexicomp and FDA insert packages for linking medications to specific geriatric conditions. The inclusion criteria were broadened beyond single sources of evidence in an effort to capture a comprehensive list of medications. As a result, the MAGS list can be implemented as a screening tool for deprescribing interventions and assessing medication appropriateness to address individual or clusters of geriatric syndromes within a patient.
In addition to expanding this knowledge base, clinical relevance of the MAGS list is highlighted by its application to a sample of hospitalized older adults discharged to SNFs, a cohort known to experience geriatric syndromes. In fact, 43% of patients' medications at hospital discharge were MAGS. Importantly, due to the cross‐sectional nature of this study, we cannot be certain if the medication caused or potentiated each of the geriatric syndromes. However, hospitals and SNFs are devoting major resources toward reduction of falls, avoidance of urinary catheter use, and reduction of preventable readmissions. These efforts can be complemented by considering the number of medications associated with falls, urinary incontinence, and overall MAGS burden. The striking prevalence of MAGS demonstrates a rigorous need to weigh the risks and benefits of these medications. Above all, the intent of this study is not to propose that any MAGS be reflexively stopped, but rather that the MAGS list should facilitate a holistic approach to care for the complex older adult. For example, standard therapies such as gabapentin may be appropriate for treating neuralgic pain but may also contribute to falls and urinary incontinence. Thus, alternative pain treatments could be selected in place of gabapentin for a 75‐year old patient who is experiencing recurrent falls and increasing incontinence. Therefore, the MAGS list enables a patient‐provider discussion wherein medications' therapeutic benefits can be weighed against risks posed by specific clusters of geriatric syndromes, potential impact on quality of life, and consistency with goals of care.
This study has some limitations. First, although we examined a broad number of geriatric syndromes, several other geriatric syndromes experienced by hospitalized older adults were not addressed including: fecal incontinence, insomnia, and functional impairment. These syndromes were intentionally excluded from the study a priori due to reasons of feasibility and scope. Second, unlike the Beer's 2015 criteria, the MAGS list does not sub‐classify associations of medications with geriatric syndromes for patients with specific diseases (eg, heart failure). In fact, our MAGS list included medications often indicated in treating these diagnoses. A clinician must work with the patient to weigh the disease‐specific benefits of some medications with the potential effect on geriatric syndrome symptoms and outcomes. Third, the instrument has a very high sensitivity, which was intended to generate an inclusive list of medications that enables providers to weigh risks of geriatric syndromes with the intended indication benefit. The objective is not to use this list as a reflexive tool but rather help clinicians identify a starting point to address geriatric syndromes in their patients to make patient‐centered medication decisions. Although the MAGS list is intentionally large (sensitive), the advent of advanced bioinformatics can enable MAGS to be assessed in the future for both clinical and research purposes. Fourth, FDA insert packages and Lexicomp databases report anything experienced by the patient while on the particular medication, but it might not necessarily imply a causative link. The high use of MAGS and the specific geriatric syndrome may coexist due to the high prevalence and interplay of multimorbidity, polypharmacy, and geriatric syndromes in this population. Last, the list was developed by expert panel members predominantly from a single institution, which may introduce bias. Despite these limitations, the prevalence of these medications in a sample of patients transitioning from acute to postacute care highlights the utility of the MAGS list in future clinical research and quality improvement endeavors.
In conclusion, the MAGS list provides a comprehensive and sensitive indicator of medications associated with any of 6 geriatric syndromes regardless of medication indication and appropriateness. The MAGS list provides an overall degree of medication burden with respect to geriatric syndromes and a foundation for future research to assess the relationship between the presence of geriatric syndromes and syndrome‐associated medications. The MAGS list is an important first step in summarizing the data that link medications to geriatric syndromes. Future studies are needed to broaden the analysis of MAGS for other common geriatric syndromes and to identify new and emerging medications not present during the time of this analysis. The MAGS list has the potential to facilitate deprescribing efforts needed to combat the epidemic of overprescribing that may be contributing to the burden of geriatric syndromes among older patients.
Acknowledgements
The authors thank Dr. Linda Beuscher, Dr. Patricia Blair Miller, Dr. Joseph Ouslander, Dr. William Stuart Reynolds, and Dr. Warren Taylor for providing their expertise and participating in the expert panel discussions that facilitated the development of the MAGS list. The authors also recognize the research support provided by Christopher Simon Coelho.
Disclosures: This research was supported by the Department of Health and Human Services, Centers for Medicare & Medicaid Services grant #1C1CMS331006 awarded to Principal Investigator, John F. Schnelle, PhD. Dr. Vasilevskis was supported by the National Institute on Aging of the National Institutes of Health award K23AG040157 and the Geriatric Research, Education and Clinical Center. Dr. Bell was supported by National Institute on Aging‐K award K23AG048347‐01A1. Dr. Mixon is supported by a Veterans Affairs Health Services Research & Development Career Development Award (12‐168). This research was also supported by the National Center for Advancing Translational Sciences Clinical and Translational Science award UL1TR000445. The contents of this publication are solely the responsibility of the authors and do not necessarily represent the official views of the US Department of Health and Human Services or any of its agencies, the National Center for Advancing Translation Science, the National Institutes of Health, or the Department of Veterans Affairs. Each coauthor contributed significantly to the manuscript. Dr. Kripalani has received stock/stock options from Bioscape Digital, LLC. None of the other authors have significant conflicts of interest to report related to this project or the results reported within this article.
- , , , . Geriatric syndromes: clinical, research, and policy implications of a core geriatric concept. J Am Geriatr Soc. 2007;55:780–791.
- , , , . Shared risk factors for falls, incontinence, and functional dependence. Unifying the approach to geriatric syndromes. JAMA. 1995;273:1348–1353.
- , , , . Geriatric syndromes: medical misnomer or progress in geriatrics? Neth J Med. 2003;61:83–87.
- , , , et al. Geriatric conditions in acutely hospitalized older patients: prevalence and one‐year survival and functional decline. PLoS One. 2011;6:e26951.
- , , , , . Geriatric conditions as predictors of increased number of hospital admissions and hospital bed days over one year: findings of a nationwide cohort of older adults from Taiwan. Arch Gerontol Geriatr. 2014;59:169–174.
- , , , , . Geriatric conditions and disability: the Health and Retirement Study. Ann Intern Med. 2007;147:156–164.
- , , , , , . A prospective cohort study of geriatric syndromes among older medical patients admitted to acute care hospitals. J Am Geriatr Soc. 2011;59:2001–2008.
- , , , et al. Geriatric syndromes in hospitalized older adults discharged to skilled nursing facilities. J Am Geriatr Soc. 2016;64(4):715–722.
- , , , et al. Discharge to a skilled nursing facility and subsequent clinical outcomes among older patients hospitalized for heart failure. Circ Heart Fail. 2011;4:293–300.
- . Hazards of hospitalization of the elderly. Ann Intern Med. 1993;118:219–223.
- , , , , . Geriatric syndromes in elderly patients admitted to an inpatient cardiology ward. J Hosp Med. 2007;2:394–400.
- , , , . Effect of hospitalization on inappropriate prescribing in elderly Medicare beneficiaries. J Am Geriatr Soc. 2015;63:699–707.
- , , , et al. Polypharmacy cutoff and outcomes: five or more medicines were used to identify community‐dwelling older men at risk of different adverse outcomes. J Clin Epidemiol. 2012;65:989–995.
- , , , , . Investigating polypharmacy and drug burden index in hospitalised older people. Intern Med J. 2013;43:912–918.
- , . Potentially harmful drug‐drug interactions in the elderly: a review. Am J Geriatr Pharmacother. 2011;9:364–377.
- , , , . Hospital admissions/visits associated with drug‐drug interactions: a systematic review and meta‐analysis. Pharmacoepidemiol Drug Saf. 2014;23:489–497.
- , . Optimising drug treatment for elderly people: the prescribing cascade. BMJ. 1997;315:1096–1099.
- , , , et al. Association between acute geriatric syndromes and medication‐related hospital admissions. Drugs Aging. 2012;29:691–699.
- American Geriatrics Society Beers Criteria Update Expert P. American Geriatrics Society updated Beers Criteria for potentially inappropriate medication use in older adults. J Am Geriatr Soc. 2012;60:616–631.
- By the American Geriatrics Society 2015 Beers Criteria Update Expert Panel. American Geriatrics Society 2015 updated Beers criteria for potentially inappropriate medication use in older adults. J Am Geriatr Soc. 2015;63:2227–2246.
- , . STOPP (Screening Tool of Older Persons' potentially inappropriate Prescriptions): application to acutely ill elderly patients and comparison with Beers' criteria. Age Ageing. 2008;37:673–679.
- , , , et al. Warfarin versus aspirin for stroke prevention in an elderly community population with atrial fibrillation (the Birmingham Atrial Fibrillation Treatment of the Aged Study, BAFTA): a randomised controlled trial. Lancet. 2007;370:493–503.
- U.S. Food and Drug Administration. Drugs. Available at: http://www.fda.gov/Drugs/default.htm. Accessed May 15th, 2015.
- , , , et al. Inappropriate medication use among frail elderly inpatients. Ann Pharmacother. 2004;38:9–14.
- , , , et al. Inappropriate medications in elderly ICU survivors: where to intervene? Arch Intern Med. 2011;171:1032–1034.
- , , , et al. Appropriateness of medication prescribing in ambulatory elderly patients. J Am Geriatr Soc. 1994;42:1241–1247.

The Effect of Orthopedic Advertising and Self-Promotion on a Naïve Population
In 1975, the American Medical Association (AMA) lifted the professional ban on physician advertising after a successful Federal Trade Commission suit.1 Since then, there has been a marked increase in the number of physicians marketing themselves directly to patients and consumers. With the pervasive nature of the Internet, never before has it been so easy and inexpensive to effectively communicate with a targeted population of people and influence their behavior. Few would dispute the role of advertising on consumer choices when used to sell products and services, change behavior, and educate consumers across all types of industries and professions. Thus, it is reasonable to hypothesize that the nature and content of a surgeon’s web presence could significantly affect patients’ decision-making and their impression of the orthopedic surgery profession.
There is a lack of consensus among physician organizations regarding physician advertising. For example, the American Association of Physicians and Surgeons (AAPS) takes an ethical stand on physician self-promotion. Their position states “The physician should not solicit patients. Professional reputation is the major source of patient referrals. The physician should be circumspect and restrained in dealing with the communication media, always avoiding self-aggrandizement.2” In contrast, the AMA has a less defined stance on physician self-promotion. With the exception of conflicts of interest and privacy guidelines, the AMA has few recommendations regarding the content of physician websites. The organization’s position states “There are no restrictions on advertising by physicians except those that can be specifically justified to protect the public from deceptive practices. …Nothing in this opinion is intended to discourage or to limit advertising and representations which are not false or deceptive.3” This guideline emphasizes accuracy of health-related information, but does not limit physician self-promotion or self-aggrandizement. The American Academy of Orthopaedic Surgeons (AAOS) holds a similar position. In their position statement on advertising by orthopedic surgeons, they encourage advertising and competition as “ethical and acceptable” as long as they are representing services in a “clear and accurate manner.”4 Furthermore, the AAOS also states that “An orthopaedic surgeon shall not use photographs, images, endorsements and/or statements in a false or misleading manner that communicate a degree of relief, safety, effectiveness, or benefits from orthopaedic care that are not representative of results attained by that orthopaedic surgeon.”4 The surgeon is responsible for his/her advertising materials and the content and claims therein, and is generally policed by peers through a complaint process with the AAOS.
Notably, up to 75% of Americans use the Internet for health-related information and this number is likely to increase.5Patients who utilize the Internet must choose from a vast array of search results for medical information from credible resources. Which sources are to be believed and relied upon? This depends on the health literacy among the general population. Inadequate health literacy is defined as “limited ability to obtain, process, and understand basic health information and services needed to make appropriate health decisions and follow instructions for treatment.”6 Patients have different levels of health literacy often unknown to even the most well-intentioned healthcare professional. It is often difficult to provide appropriate and meaningful information at a level that is most beneficial to the patient. It is estimated that 89 million people in the US have insufficient health literacy to understand treatments or preventive care.7 Certainly, with this information in mind, the orthopedic surgeon must consider his/her audience, and the potential for a fiduciary responsibility when preparing Internet content.
A tangible example of marketing results is the increasing popularity of robotic surgery over the last decade.8 Hospitals routinely advertise the availability of robotic surgery at their institution through various means, including roadside billboards. Despite limited evidence supporting a benefit of robotic surgery beyond less expensive conventional laparoscopic surgery, patients are increasingly seeking robotic surgery.8 With society’s increasing infatuation with technology, this is likely based on the presumption that robotic surgery is better and safer than conventional methods. It is likely that marketing pressure is at least partly responsible for the widespread adoption of robotic-assisted surgery and words used in marketing highlighting novelty have an important influence on patient preference.8
Orthopedic surgery, with its large proportion of elective surgeries, offers a unique venue to study differences in patient perceptions. Preoperative evaluations in orthopedics are often performed after an assessment of a surgeon’s reputation, which offers the patient an ability to choose their surgeon within their community.
We pondered how different promotional styles would affect potential patients’ perceptions. Would people believe that a self-promoting physician was more competent? Could fellow doctors “see through” the self-promotion of their peers? Based on the premise that advertising and self-promotion are undertaken because they are effective, we hypothesized that nonphysician patients perceive self-promoting orthopedic surgeons more favorably compared to members of the medical community.
Although numerous anonymous physician review sites exist, our analysis focused on surgeon self-promotion through personal websites or web pages. Within these sources, there exists a wide array of information and methods that physicians utilize to present themselves. Some physicians merely post their educational background and qualifications. This appears most often when the physician is associated with an academic institution and their profile is part of an institution’s website. Others post extensive self-promoting statements about technical skill and innovations in clinical practice. They sometimes include information regarding charity donations, level of community involvement, and practice philosophy.
Materials and Methods
Categorization of Surgeon Websites and Ratings
Surgeon websites were selected from the 5 largest population centers in the United States. Analysis was undertaken to categorize the self-promotion content of each selected website using an objective scale to quantitatively assess the number of times that physicians referred to themselves in a positive manner. A thorough search of the literature did not reveal any validated questionnaire or assessment tool usable for this purpose. Five blinded raters were asked to count the number of positive self-directed remarks made by the author of each website. Websites were ranked based on the number of such statements. No rater was exposed to any styling or graphical information from any website. Only textual statements were used for the purposes of this study. All statements were printed on paper and evaluated without the use of a computer to prevent any searching or contamination of the subject or rater pool.
Websites were considered as self-promoting (using language that promotes the physician beyond the use of basic facts), or non-self-promoting(presenting little beyond basic biographical information) based on the presence of many (more than 5) or few (less than 5) self-promoting statements. The breakpoint of 5 self-promoting statements served to highlight a clear transition between the 2 general types of websites and provided a good demarcation between self-promoters and non-self-promoters. This distinction allowed for the choosing of contrasting websites, which could directly probe the question in our hypothesis about the effect of such websites on naïve or surgeon-peer respondents.
Each website was judged independently by 5 blinded raters. Inter-rater reliability scores were then calculated using Fleiss’ Kappa to assess reliability of the categorization of self-promoter or non-self-promoter. This value was calculated to be k = .80, 95% confidence interval (0.58-1.01), which is suggestive of a “substantial level of agreement.”9 Websites categorized as non-self-promoting contained a mean number of self-promoting statements of less than 2 (0-1.8) as judged by the 5 raters. By contrast, websites categorized as self-promoting had a mean number of self-promoting statements of 6.4 or higher (6.4-22.6). When the self-promoting websites and the non-self-promoting websites were compared, they were significantly different in the number of self-promoting statements t (43) = 7.90, P < .001, with self-promoting websites having significantly more self-promoting statements than non-self-promoting websites.
Surveys and Respondents
Next, a survey of 10 questions of interest was developed. A thorough literature search revealed no validated measure or survey to measure the effects of surgeon or physician self-promotion. We developed a 10-question survey to prove the impressions and allow for assessment of differences between respondent groups to measure the effect of promotion. The questions (see Appendix for survey questions) included a forced Likert rating system. Each response occurs and is presented on a scale from 0 to 3 (0 = Strongly Disagree, 1 = Disagree, 2 = Agree, and 3 = Strongly Agree).
Respondents were true volunteers recruited from 2 groups that were termed “surgeon-peers” and “naïve subjects.” Surgeon-peers were board-certified orthopedic surgeons (N = 21, all with medical doctorates). Demographic breakdown of the surgeon-peers revealed them to be reflective of the general population of orthopedic surgeons (71.4% male, 28.6% female, 90.2% Caucasian, 4.8% African American, and 4.8% Asian, all with professional degrees). Naïve subjects (N = 24, average age 41 years) were selected based on the criterion of having no affiliation with a healthcare system and no history of interaction with an orthopedic surgery or surgery in general. The demographic breakdown of naïve subjects was 45.8% male, 54.2% female, 79.1% Caucasian, 16.7% African American, and 4.2% Asian. Half of the naïve respondents had a Bachelor’s degree, 17% had a Master’s degree, 4% had a professional degree, and 29% had a high school diploma. No volunteer, in either group, received any form of inducement or reward for participation so as not to skew any responses in favor of physicians.
All participants were asked to read each surgeon’s statements and then complete a survey for each statement. Volunteers were not informed of a surgeon’s calculated level of self-promotion, and they were presented the survey questions in random order. Survey completion required unreimbursed time of approximately 1 to 2 hours.
Statistical Methods
The data compiled was then analyzed with SAS/STAT Software (SAS Institute Inc.) and a LR Type III analysis using the GENMOD procedure. The method of analysis and presentation of data focuses on the relationship between respondents perceptions between the surgeon-peer and naïve subject groups. The P values presented are the significance of the testing of interactions comparing the difference between surgeon-peers and naïve subjects, and the differences in their responses to each question for self-promoters and non-self-promoters. Surgeon-peers answer questions differently based on their assessment of a self-promoter or non-self-promoter website. It is this difference that is compared to the analogous difference for naïve subjects and statistically evaluated. The LR statistic for type III analysis tests if the differences are significantly different, ie, if the difference between the 2 subject groups is statistically significant. All statistical methods were performed by a qualified statistician who helped guide the design of this study.
Results
Each respondent was asked if they were aware that misinformation about doctors exists on the Internet. Half of the naïve subjects affirmed awareness of this whereas the other half were unaware. All surgeon-peers were aware of the presence of misinformation regarding physicians on the Internet.
The results of the comparisons are shown in the Table. The columns show the average response to each question for self-promoters and non-self-promoters grouped by either surgeon-peer or naïve subject. In judging the overall accuracy of statements made on the Internet, naïve subjects found no difference between self-promoters and non-self-promoters, whereas surgeon-peers judged the difference to be large and significant in favor of non-self-promoting surgeons. Surgeon-peers generally rated non-self-promoters with significantly more positive Likert scores, indicating improved “competence”, “excellence”, and “better quality of care” when compared to naïve respondents (Table). The direction and magnitude of the difference was also striking, with the naïve respondents favoring self-promoters on all of these questions. This held true for the choice of orthopedic surgeon, where naïve responders favored self-promoters and surgeon-peers favored non-self-promoters. Moreover, naïve subjects believed that self-promoters would be significantly more likely to help them in the event of a complication, whereas surgeon-peers believed the opposite. Even when the direction of difference was the same in both groups, statistically significant differences in the responses were evident, as was the case when respondents were asked “Did the surgeon inflate his/her technical skills?” or “Did the author of this statement seem arrogant?” Both groups favored self-promoters for these questions, but the differences were larger among surgeon-peers, indicating that naïve subjects were somewhat less sensitive to the differences between promoters and non-self-promoters. There was no difference between surgeon-peers and naïve subjects in their expectations of sanctions against self-promoters’ licenses when compared to non-self-promoters, which was the only question to fail to garner a significant difference between respondents.
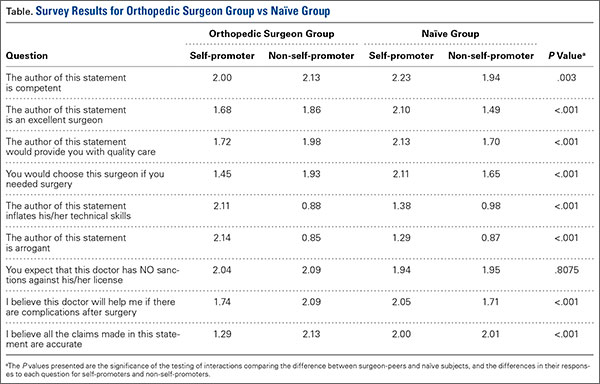
Discussion
This study explores the differences in the perceptions of physician websites between board-certified orthopedic surgeons and naïve individuals. These websites contain varying amounts of information presented in numerous ways. While we did not poll the website authors regarding their intent, the purpose of a website seems naturally to communicate believable information to the public. The information provided ranges widely from basic facts regarding education and contact information to statements regarding technical skills, reputation, television appearances, and the friendly nature of the office staff.
Our results suggest that board-certified orthopedic surgeons, peers of the writers of these websites, tend to view self-promoting surgeons more negatively than do their nonphysician counterparts. These findings support our hypothesis that self-promoting surgeons are perceived more favorably by the naïve, nonphysician population.
At first glance, our results suggest that the mere absence of a surgeon from the medium may affect the patient’s choice, because 50% of our naïve respondents indicated that they would use the Internet to choose a doctor. Interestingly, both the surgeon-peer group and naïve subjects were equally aware that misinformation exists on the Internet. However, when reviewing the websites, naïve subjects were significantly more likely to view self-promoters as more competent, more excellent, and more likely to provide quality care, and were more likely to choose the self-promoter if they needed surgery compared to the surgeon-peer group. The naïve group viewed self-promoters as less likely to inflate their technical skills but more likely to be arrogant. They viewed self-promoters as more likely to help if things went wrong and more likely to make accurate statements compared to the surgeon-peer group. This suggests that patients with little experience are more likely to choose a self-promoting physician than one who does not self-promote for reasons that cannot be proven true or false in the confines of a website. Further study is needed to see if perceptions based on web content translate into actual changes in healthcare choices.
This study had several limitations. Though statistically sound, the sample size of 45 people was small and should likely be expanded in further investigations to allow for analysis of demographics and socioeconomic factors. The study focused only on the text content of websites and purposely removed the influences of the other potential content mentioned previously. While a biography serves as an introduction, further research is needed to determine how initial perceptions affect future perceptions throughout the course of the patient-physician relationship. The small number of Internet biographies used cannot represent the vast array of information that could be displayed in numerous ways, but was necessary given the length of time donated by each uncompensated subject (1-2 hours). To minimize complexity, we purposefully ignored websites in the middle, somewhere in the continuum between self-promoting and non-self-promoting. Instead we selected websites that would be stark in their self-promotion to allow for the assessment of our hypothesis. Finally, this study was not designed to address economic implications of promotional advertising. The goal of much advertising is to generate revenue, and in the case of orthopedic surgery, one goal is likely attracting more patients, but this effect is beyond the scope of the current study. Given the elective nature of many orthopedic surgery procedures, the effect of promotional websites on a person’s decision to have surgery or not is an important topic for future study.
Taken together, the data suggests a profound influence of the content of the Internet website in the impressions made on different groups of people. These facts, although profound in their influence and unregulated by the medical profession, present both great opportunities and liabilities. The opportunities arise from the professional community to help guide what surgeons do to generate interest on the Internet. The liabilities arise on consideration of the consequences of self-promotion in the setting of real world surgical complications.
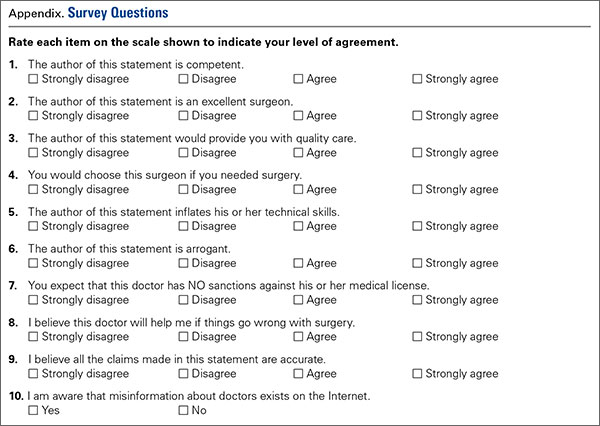
1. Tomycz ND. A profession selling out: lamenting the paradigm shift in physician advertising. J Med Ethics. 2006;32(1):26-28.
2. The principles of medical ethics of the Association of American Physicians and Surgeons. Association of American Physicians and Surgeons Web site. http://www.aapsonline.org/index.php/principles_of_medical_ethics. Accessed September 20, 2013.
3. Opinion 5.027 – Use of health-related online sites. American Medical Association Web site. http://www.ama-assn.org/ama/pub/physician-resources/medical-ethics/code-medical-ethics/opinion5027.page. Accessed September 10, 2013.
4. Standards of professionalism. Advertising by orthopaedic surgeons. Adopted April 18, 2007. American Academy of Orthopaedic Surgeons Web site. http://www.aaos.org/cc_files/aaosorg/member/profcomp/advertisingbyos.pdf. Accessed May 6, 2016.
5. Mostaghimi A, Crotty BH, Landon BE. The availability and nature of physician information on the internet. J Gen Intern Med. 2010;25(11):1152-1156.
6. Ad Hoc Committee on Health Literacy for the Council on Scientific Affairs, American Medical Association. Health Literacy: Report of the Council on Scientific Affairs. JAMA. 1999;281(6):552-557. doi:10.1001/jama.281.6.552.
7. Leroy G, Endicott JE, Mouradi O, Kauchak D, Just ML. Improving perceived and actual text difficulty for health information consumers using semi-automated methods. AMIA Annu Symp Proc. 2012;2012:522–531.
8. Dixon PR, Grant RC, Urbach DR. The impact of promotional language on patient preference for innovative procedures. J Am Coll Surg. 2013;217(3):S100.
9. Landis JR, Koch GG. A one-way components of variance model for categorical data. Biometrics. 1977;33(4):671–679.
In 1975, the American Medical Association (AMA) lifted the professional ban on physician advertising after a successful Federal Trade Commission suit.1 Since then, there has been a marked increase in the number of physicians marketing themselves directly to patients and consumers. With the pervasive nature of the Internet, never before has it been so easy and inexpensive to effectively communicate with a targeted population of people and influence their behavior. Few would dispute the role of advertising on consumer choices when used to sell products and services, change behavior, and educate consumers across all types of industries and professions. Thus, it is reasonable to hypothesize that the nature and content of a surgeon’s web presence could significantly affect patients’ decision-making and their impression of the orthopedic surgery profession.
There is a lack of consensus among physician organizations regarding physician advertising. For example, the American Association of Physicians and Surgeons (AAPS) takes an ethical stand on physician self-promotion. Their position states “The physician should not solicit patients. Professional reputation is the major source of patient referrals. The physician should be circumspect and restrained in dealing with the communication media, always avoiding self-aggrandizement.2” In contrast, the AMA has a less defined stance on physician self-promotion. With the exception of conflicts of interest and privacy guidelines, the AMA has few recommendations regarding the content of physician websites. The organization’s position states “There are no restrictions on advertising by physicians except those that can be specifically justified to protect the public from deceptive practices. …Nothing in this opinion is intended to discourage or to limit advertising and representations which are not false or deceptive.3” This guideline emphasizes accuracy of health-related information, but does not limit physician self-promotion or self-aggrandizement. The American Academy of Orthopaedic Surgeons (AAOS) holds a similar position. In their position statement on advertising by orthopedic surgeons, they encourage advertising and competition as “ethical and acceptable” as long as they are representing services in a “clear and accurate manner.”4 Furthermore, the AAOS also states that “An orthopaedic surgeon shall not use photographs, images, endorsements and/or statements in a false or misleading manner that communicate a degree of relief, safety, effectiveness, or benefits from orthopaedic care that are not representative of results attained by that orthopaedic surgeon.”4 The surgeon is responsible for his/her advertising materials and the content and claims therein, and is generally policed by peers through a complaint process with the AAOS.
Notably, up to 75% of Americans use the Internet for health-related information and this number is likely to increase.5Patients who utilize the Internet must choose from a vast array of search results for medical information from credible resources. Which sources are to be believed and relied upon? This depends on the health literacy among the general population. Inadequate health literacy is defined as “limited ability to obtain, process, and understand basic health information and services needed to make appropriate health decisions and follow instructions for treatment.”6 Patients have different levels of health literacy often unknown to even the most well-intentioned healthcare professional. It is often difficult to provide appropriate and meaningful information at a level that is most beneficial to the patient. It is estimated that 89 million people in the US have insufficient health literacy to understand treatments or preventive care.7 Certainly, with this information in mind, the orthopedic surgeon must consider his/her audience, and the potential for a fiduciary responsibility when preparing Internet content.
A tangible example of marketing results is the increasing popularity of robotic surgery over the last decade.8 Hospitals routinely advertise the availability of robotic surgery at their institution through various means, including roadside billboards. Despite limited evidence supporting a benefit of robotic surgery beyond less expensive conventional laparoscopic surgery, patients are increasingly seeking robotic surgery.8 With society’s increasing infatuation with technology, this is likely based on the presumption that robotic surgery is better and safer than conventional methods. It is likely that marketing pressure is at least partly responsible for the widespread adoption of robotic-assisted surgery and words used in marketing highlighting novelty have an important influence on patient preference.8
Orthopedic surgery, with its large proportion of elective surgeries, offers a unique venue to study differences in patient perceptions. Preoperative evaluations in orthopedics are often performed after an assessment of a surgeon’s reputation, which offers the patient an ability to choose their surgeon within their community.
We pondered how different promotional styles would affect potential patients’ perceptions. Would people believe that a self-promoting physician was more competent? Could fellow doctors “see through” the self-promotion of their peers? Based on the premise that advertising and self-promotion are undertaken because they are effective, we hypothesized that nonphysician patients perceive self-promoting orthopedic surgeons more favorably compared to members of the medical community.
Although numerous anonymous physician review sites exist, our analysis focused on surgeon self-promotion through personal websites or web pages. Within these sources, there exists a wide array of information and methods that physicians utilize to present themselves. Some physicians merely post their educational background and qualifications. This appears most often when the physician is associated with an academic institution and their profile is part of an institution’s website. Others post extensive self-promoting statements about technical skill and innovations in clinical practice. They sometimes include information regarding charity donations, level of community involvement, and practice philosophy.
Materials and Methods
Categorization of Surgeon Websites and Ratings
Surgeon websites were selected from the 5 largest population centers in the United States. Analysis was undertaken to categorize the self-promotion content of each selected website using an objective scale to quantitatively assess the number of times that physicians referred to themselves in a positive manner. A thorough search of the literature did not reveal any validated questionnaire or assessment tool usable for this purpose. Five blinded raters were asked to count the number of positive self-directed remarks made by the author of each website. Websites were ranked based on the number of such statements. No rater was exposed to any styling or graphical information from any website. Only textual statements were used for the purposes of this study. All statements were printed on paper and evaluated without the use of a computer to prevent any searching or contamination of the subject or rater pool.
Websites were considered as self-promoting (using language that promotes the physician beyond the use of basic facts), or non-self-promoting(presenting little beyond basic biographical information) based on the presence of many (more than 5) or few (less than 5) self-promoting statements. The breakpoint of 5 self-promoting statements served to highlight a clear transition between the 2 general types of websites and provided a good demarcation between self-promoters and non-self-promoters. This distinction allowed for the choosing of contrasting websites, which could directly probe the question in our hypothesis about the effect of such websites on naïve or surgeon-peer respondents.
Each website was judged independently by 5 blinded raters. Inter-rater reliability scores were then calculated using Fleiss’ Kappa to assess reliability of the categorization of self-promoter or non-self-promoter. This value was calculated to be k = .80, 95% confidence interval (0.58-1.01), which is suggestive of a “substantial level of agreement.”9 Websites categorized as non-self-promoting contained a mean number of self-promoting statements of less than 2 (0-1.8) as judged by the 5 raters. By contrast, websites categorized as self-promoting had a mean number of self-promoting statements of 6.4 or higher (6.4-22.6). When the self-promoting websites and the non-self-promoting websites were compared, they were significantly different in the number of self-promoting statements t (43) = 7.90, P < .001, with self-promoting websites having significantly more self-promoting statements than non-self-promoting websites.
Surveys and Respondents
Next, a survey of 10 questions of interest was developed. A thorough literature search revealed no validated measure or survey to measure the effects of surgeon or physician self-promotion. We developed a 10-question survey to prove the impressions and allow for assessment of differences between respondent groups to measure the effect of promotion. The questions (see Appendix for survey questions) included a forced Likert rating system. Each response occurs and is presented on a scale from 0 to 3 (0 = Strongly Disagree, 1 = Disagree, 2 = Agree, and 3 = Strongly Agree).
Respondents were true volunteers recruited from 2 groups that were termed “surgeon-peers” and “naïve subjects.” Surgeon-peers were board-certified orthopedic surgeons (N = 21, all with medical doctorates). Demographic breakdown of the surgeon-peers revealed them to be reflective of the general population of orthopedic surgeons (71.4% male, 28.6% female, 90.2% Caucasian, 4.8% African American, and 4.8% Asian, all with professional degrees). Naïve subjects (N = 24, average age 41 years) were selected based on the criterion of having no affiliation with a healthcare system and no history of interaction with an orthopedic surgery or surgery in general. The demographic breakdown of naïve subjects was 45.8% male, 54.2% female, 79.1% Caucasian, 16.7% African American, and 4.2% Asian. Half of the naïve respondents had a Bachelor’s degree, 17% had a Master’s degree, 4% had a professional degree, and 29% had a high school diploma. No volunteer, in either group, received any form of inducement or reward for participation so as not to skew any responses in favor of physicians.
All participants were asked to read each surgeon’s statements and then complete a survey for each statement. Volunteers were not informed of a surgeon’s calculated level of self-promotion, and they were presented the survey questions in random order. Survey completion required unreimbursed time of approximately 1 to 2 hours.
Statistical Methods
The data compiled was then analyzed with SAS/STAT Software (SAS Institute Inc.) and a LR Type III analysis using the GENMOD procedure. The method of analysis and presentation of data focuses on the relationship between respondents perceptions between the surgeon-peer and naïve subject groups. The P values presented are the significance of the testing of interactions comparing the difference between surgeon-peers and naïve subjects, and the differences in their responses to each question for self-promoters and non-self-promoters. Surgeon-peers answer questions differently based on their assessment of a self-promoter or non-self-promoter website. It is this difference that is compared to the analogous difference for naïve subjects and statistically evaluated. The LR statistic for type III analysis tests if the differences are significantly different, ie, if the difference between the 2 subject groups is statistically significant. All statistical methods were performed by a qualified statistician who helped guide the design of this study.
Results
Each respondent was asked if they were aware that misinformation about doctors exists on the Internet. Half of the naïve subjects affirmed awareness of this whereas the other half were unaware. All surgeon-peers were aware of the presence of misinformation regarding physicians on the Internet.
The results of the comparisons are shown in the Table. The columns show the average response to each question for self-promoters and non-self-promoters grouped by either surgeon-peer or naïve subject. In judging the overall accuracy of statements made on the Internet, naïve subjects found no difference between self-promoters and non-self-promoters, whereas surgeon-peers judged the difference to be large and significant in favor of non-self-promoting surgeons. Surgeon-peers generally rated non-self-promoters with significantly more positive Likert scores, indicating improved “competence”, “excellence”, and “better quality of care” when compared to naïve respondents (Table). The direction and magnitude of the difference was also striking, with the naïve respondents favoring self-promoters on all of these questions. This held true for the choice of orthopedic surgeon, where naïve responders favored self-promoters and surgeon-peers favored non-self-promoters. Moreover, naïve subjects believed that self-promoters would be significantly more likely to help them in the event of a complication, whereas surgeon-peers believed the opposite. Even when the direction of difference was the same in both groups, statistically significant differences in the responses were evident, as was the case when respondents were asked “Did the surgeon inflate his/her technical skills?” or “Did the author of this statement seem arrogant?” Both groups favored self-promoters for these questions, but the differences were larger among surgeon-peers, indicating that naïve subjects were somewhat less sensitive to the differences between promoters and non-self-promoters. There was no difference between surgeon-peers and naïve subjects in their expectations of sanctions against self-promoters’ licenses when compared to non-self-promoters, which was the only question to fail to garner a significant difference between respondents.
Discussion
This study explores the differences in the perceptions of physician websites between board-certified orthopedic surgeons and naïve individuals. These websites contain varying amounts of information presented in numerous ways. While we did not poll the website authors regarding their intent, the purpose of a website seems naturally to communicate believable information to the public. The information provided ranges widely from basic facts regarding education and contact information to statements regarding technical skills, reputation, television appearances, and the friendly nature of the office staff.
Our results suggest that board-certified orthopedic surgeons, peers of the writers of these websites, tend to view self-promoting surgeons more negatively than do their nonphysician counterparts. These findings support our hypothesis that self-promoting surgeons are perceived more favorably by the naïve, nonphysician population.
At first glance, our results suggest that the mere absence of a surgeon from the medium may affect the patient’s choice, because 50% of our naïve respondents indicated that they would use the Internet to choose a doctor. Interestingly, both the surgeon-peer group and naïve subjects were equally aware that misinformation exists on the Internet. However, when reviewing the websites, naïve subjects were significantly more likely to view self-promoters as more competent, more excellent, and more likely to provide quality care, and were more likely to choose the self-promoter if they needed surgery compared to the surgeon-peer group. The naïve group viewed self-promoters as less likely to inflate their technical skills but more likely to be arrogant. They viewed self-promoters as more likely to help if things went wrong and more likely to make accurate statements compared to the surgeon-peer group. This suggests that patients with little experience are more likely to choose a self-promoting physician than one who does not self-promote for reasons that cannot be proven true or false in the confines of a website. Further study is needed to see if perceptions based on web content translate into actual changes in healthcare choices.
This study had several limitations. Though statistically sound, the sample size of 45 people was small and should likely be expanded in further investigations to allow for analysis of demographics and socioeconomic factors. The study focused only on the text content of websites and purposely removed the influences of the other potential content mentioned previously. While a biography serves as an introduction, further research is needed to determine how initial perceptions affect future perceptions throughout the course of the patient-physician relationship. The small number of Internet biographies used cannot represent the vast array of information that could be displayed in numerous ways, but was necessary given the length of time donated by each uncompensated subject (1-2 hours). To minimize complexity, we purposefully ignored websites in the middle, somewhere in the continuum between self-promoting and non-self-promoting. Instead we selected websites that would be stark in their self-promotion to allow for the assessment of our hypothesis. Finally, this study was not designed to address economic implications of promotional advertising. The goal of much advertising is to generate revenue, and in the case of orthopedic surgery, one goal is likely attracting more patients, but this effect is beyond the scope of the current study. Given the elective nature of many orthopedic surgery procedures, the effect of promotional websites on a person’s decision to have surgery or not is an important topic for future study.
Taken together, the data suggests a profound influence of the content of the Internet website in the impressions made on different groups of people. These facts, although profound in their influence and unregulated by the medical profession, present both great opportunities and liabilities. The opportunities arise from the professional community to help guide what surgeons do to generate interest on the Internet. The liabilities arise on consideration of the consequences of self-promotion in the setting of real world surgical complications.
1. Tomycz ND. A profession selling out: lamenting the paradigm shift in physician advertising. J Med Ethics. 2006;32(1):26-28.
2. The principles of medical ethics of the Association of American Physicians and Surgeons. Association of American Physicians and Surgeons Web site. http://www.aapsonline.org/index.php/principles_of_medical_ethics. Accessed September 20, 2013.
3. Opinion 5.027 – Use of health-related online sites. American Medical Association Web site. http://www.ama-assn.org/ama/pub/physician-resources/medical-ethics/code-medical-ethics/opinion5027.page. Accessed September 10, 2013.
4. Standards of professionalism. Advertising by orthopaedic surgeons. Adopted April 18, 2007. American Academy of Orthopaedic Surgeons Web site. http://www.aaos.org/cc_files/aaosorg/member/profcomp/advertisingbyos.pdf. Accessed May 6, 2016.
5. Mostaghimi A, Crotty BH, Landon BE. The availability and nature of physician information on the internet. J Gen Intern Med. 2010;25(11):1152-1156.
6. Ad Hoc Committee on Health Literacy for the Council on Scientific Affairs, American Medical Association. Health Literacy: Report of the Council on Scientific Affairs. JAMA. 1999;281(6):552-557. doi:10.1001/jama.281.6.552.
7. Leroy G, Endicott JE, Mouradi O, Kauchak D, Just ML. Improving perceived and actual text difficulty for health information consumers using semi-automated methods. AMIA Annu Symp Proc. 2012;2012:522–531.
8. Dixon PR, Grant RC, Urbach DR. The impact of promotional language on patient preference for innovative procedures. J Am Coll Surg. 2013;217(3):S100.
9. Landis JR, Koch GG. A one-way components of variance model for categorical data. Biometrics. 1977;33(4):671–679.