User login
Is Roxithromycin Better than Amoxicillin in the Treatment of Acute Lower Respiratory Tract Infections in Primary Care?
OBJECTIVE: To assess the efficacy of roxithromycin relative to amoxicillin.
STUDY DESIGN: We conducted a double-blind randomized controlled trial of oral 500 mg amoxicillin 3 times per day vs oral 300 mg roxithromycin once a day for 10 days.
POPULATION: We included 196 adults who had presented to a general practitioner with lower respiratory tract infection (LRTI) and, in the physician’s opinion, needed antibiotic treatment.
OUTCOMES MEASURED: We measured clinical response after 10 and 28 days, defined in 4 ways: (1) decrease in LRTI symptoms; (2) complete absence of symptoms; (3) decrease in signs; and (4) complete absence of signs. Self-reported response included the decrease in symptoms and the time until resumption of impaired or abandoned daily activities on days 1 through 10, 21, and 27.
RESULTS: Clinical cure rates after the completion of antibiotic treatment (10 days) were not significantly different for the 2 groups. After 28 days, the roxithromycin group showed no increase in cure rate as evidenced by the decrease in symptoms, indicating a significantly lower cure rate. However, this difference did not alter physicians’ overall conclusion after complete follow-up that 90% of patients, regardless of age, had been effectively treated with either amoxicillin or roxithromycin.
CONCLUSIONS: The surplus value of roxithromycin was not confirmed. Amoxicillin remains a reliable first-choice antibiotic in the treatment of LRTI in general practice.
- Amoxicillin and roxithromycin are equally effective in the treatment of patients presenting with lower respiratory tract infections and needing antibiotic treatment.
- Most patients remain symptomatic after 10 days of treatment with either drug.
- The low incidence of atypical pathogens (Mycoplasma pneumoniae, Legionella pneumophila, and Chlamydia pneumoniae) in the Netherlands minimizes the potentially greater surplus value of macrolide antibiotics over amoxicillin.
Acute community-acquired lower respiratory tract infections (LRTIs) in adults include acute bronchitis, pneumonia, and infectious episodes in patients with asthma or chronic obstructive pulmonary disease (COPD). In acute bronchitis and exacerbations of COPD, the value of antibiotic therapy is doubtful; in pneumonia, however, it is widely accepted. Because distinguishing between these disease entities on clinical grounds alone is often impossible, deciding which patients would benefit from antibiotic treatment remains difficult.1-6In the Netherlands, as in the United States and Great Britain, antibiotics are prescribed for patients with acute bronchitis approximately 80% of the time.7-9
If a primary care physician (PCP) decides to treat LRTI with antibiotics, amoxicillin is the drug of first choice in the Netherlands.10-13 However, amoxicillin is not effective in infections caused by atypical organisms such as Mycoplasma pneumoniae, Chlamydia pneumoniae, and Legionella pneumophila, which are responsible for 1% to 50% of cases of LRTI.14-20 Roxithromycin and the newer macrolide antibiotics are recommended as drugs of choice for the empirical treatment of community-acquired pneumonia in low-risk patients in the United States and Canada21-23 because those drugs cover both typical and atypical pathogens. Amoxicillin has long proved to be a reliable drug and one to which the resistance of common respiratory tract pathogens (Streptococcus pneumoniae and Haemophilus influenzae) in the Netherlands is low.24-29
Community-based studies that evaluate treatment for LRTI are lacking. Also lacking are independent randomized controlled studies comparing amoxicillin with roxithromycin or other new macrolides for LRTI. Our double-blind randomized trial attempted to determine whether the preference for amoxicillin in the Netherlands is well founded. In the trial, patients with LRTI who in their PCP’s opinion needed antibiotic treatment were assigned to either amoxicillin or roxithromycin. We then compared the efficacy and safety of both drugs.
Methods
Eligibility criteria and baseline characteristics
Eligible study subjects were patients in the southern part of the Netherlands who presented with signs and symptoms of LRTI that their PCPs believed warranted antibiotic therapy. Table 1 lists the inclusion and exclusion criteria.
Baseline data (at day 1) were obtained to evaluate the comparability of prognostic factors between the intervention groups. The PCP performed an extensive medical history and physical examination. In addition, a sputum sample, oral washing, and nasopharyngeal swab were taken for bacteriologic examination. Venous blood samples were taken for blood chemistry, hematology, and serology (initial titers of the viral pathogens M pneumoniae and L pneumophila).
TABLE 1
CHECKLIST FOR PATIENT ELIGIBILITY
| Inclusion Criteria | Exclusion Criteria |
|---|---|
| A: Age 18 years or older |
|
| AND | |
| B: New* or increasing cough | |
| AND | |
| C: At least 1 of the following: | |
| 1) Shortness of breath | |
| 2) Wheezing | |
| 3) Chest pain | |
| 4) Auscultation abnormalities | |
| AND | |
| D: At least 1 of the following: | |
| 1) Fever (≥ 38°C) | |
| 2) Perspiring | |
| 3) Headache | |
| 4) Myalgia | |
| AND | |
| E: Diagnosis of LRTI according to PCP and | |
| F: Antibiotics required (in PCP’s opinion) | |
| * Onset within the previous 29 days. | |
| LRTI denotes lower respiratory tract infection; PCP, primary care physician. | |
Interventions
Once the samples had been collected, patients were randomly assigned to oral treatment with either 500 mg amoxicillin 3 times daily for 10 days or 300 mg roxithromycin once daily for 10 days. A computer program using random permuted blocks of 6 prepared a randomization list for each participating center. Batches of drug packages, each provided with a unique trial code, had been sent in advance to the participating general practices. A double-dummy technique achieved blinding of patients, treating physicians, and investigators to the assigned medication. This was necessary because amoxicillin and roxithromycin have different dosing schedules (3 times a day versus once daily) and are not identical in appearance (capsule versus tablet). All capsules and tablets had identical appearance and taste. All patients received both forms of their assigned medication. Compliance with medication regimens was measured by Medical Event Monitoring Systems (MEMS), an electronic recording system that compiles the dosing history of ambulatory patients taking oral medication.30
Chest X-Rays
Every patient underwent chest x-ray. The radiographs were reassessed for the presence or absence of infiltrate by a blinded independent senior radiologist. If the first and second radiologist disagreed, a third senior radiologist made a final assessment.
Follow-up
Follow-up consultations similar to the examination on day 1 took place on days 10 and 28. During treatment (days 1 through 10) and on days 21 and 27, follow-up was supplemented by a short diary in which patients recorded their symptoms and the times at which they resumed daily activities that they had abandoned or that had been impaired.
Outcomes measured
Efficacy was assessed by comparing the groups’ clinical response on day 10 (the primary outcome measure) and day 28 and their bacteriologic response on day 10. Satisfactory clinical response was defined in 4 ways: (1) decrease in symptoms of LRTI; (2) absence of symptoms of LRTI; (3) decrease in signs of LRTI; and (4) absence of signs of LRTI. All other outcomes were regarded as unsatisfactory responses.
Self-reported symptoms and time to resolution were compared between the 2 groups on days 1 through 10, 21, and 27. The percentage of patients who had abandoned daily activities or whose participation in daily activities had been impaired by illness was followed over time. Bacteriologic cure was defined as the absence of growth of a predominant bacterial pathogen (cultured at baseline) in a sputum sample taken on day 10.
We recorded patients’ compliance rates, frequency of adverse events, and acquired bacterial resistance. Compliance was defined as the number of doses taken divided by the number of doses prescribed.
Statistical analyses
The efficacy of amoxicillin and roxithromycin was evaluated using an intention-to-treat analysis. Differences were tested using a 2-sided chi-square test ( α= 0.05). Multiple logistic regression analysis was performed to analyze the effect of differences in baseline characteristics between the randomized groups. Differences in symptoms, time to resolution of symptoms, and time to resumption of abandoned and impaired daily activities were tested in life table analyses using the Gehan test. All statistical analyses were performed with Statistical Package for the Social Sciences software, version 8.0.
Results
Patient population
From January 1998 to April 1999, 25 PCPs from 15 practices recruited 196 patients aged 18 years to 89 years. Of these patients, 99 received amoxicillin and 97 received roxithromycin (Figure 1). The 2 groups’ demographic data, signs and symptoms, comorbidities, identified pathogens, and radiographic abnormalities were similar (Table 2). Multiple logistic regression analysis showed that none of the covariables altered the effects of the study medication.
TABLE 2
FINDINGS ON PRESENTATION
| Finding | Amoxicillin Group No. (%) | Roxithromycin Group No. (%) |
|---|---|---|
| Number of Patients | 99 (51) | 97 (49) |
| Demographic Data | ||
| Ratio of men to women | 46/53 | 53/44 |
| Mean age in years (SD) | 55 (15) | 50 (16) |
| Symptoms | ||
| Recent cough in number of days | ||
| 1–7 | 34 (36) | 41 (43) |
| 8–14 | 31 (33) | 25 (26) |
| 15–28 | 22 (23) | 23 (24) |
| No recent cough | 8 (8) | 6 (6) |
| Productive cough | 77 (78) | 84 (88) |
| Dyspnea | 78 (79) | 76 (79) |
| Wheezing | 68 (69) | 61 (64) |
| Risk Factors | ||
| Cigarette smoking | 36 (36) | 29 (31) |
| Comorbidity | ||
| None | 55 (56) | 48 (52) |
| Asthma | 19 (19) | 20 (22) |
| COPD | 17 (17) | 11 (12) |
| Heart failure | 3 (3) | 4 (4) |
| Diabetes mellitus | 2 (2) | 3 (3) |
| Other | 23 (24) | 21 (23) |
| Asthma medication prescribed at start of study | 16 (16) | 13 (14) |
| Signs | ||
| Auscultation abnormalities | 93 (94) | 87 (91) |
| Body temperature 38.0°C | 25 (26) | 22 (24) |
| Infection | ||
| Mild/moderate | 91 (93) | 89 (93) |
| Severe | 7 (7) | 7 (7) |
| Laboratory Tests | ||
| CRP, median (range) | 23 (2-228) | 26 (2-312) |
| ESR, median (range) | 21 (1-104) | 19 (1-121) |
| Leukocytes, median (range) | 8.3 (3.9-19.7) | 8.4 (4.3-15.4) |
| Patients with pathogens | 45 (45) | 46 (47) |
| Chest X-Ray | ||
| Infiltrate on chest x-ray | 14 (14) | 13 (14) |
| NOTE: Values are numbers (percentages) unless otherwise stated. Percentages are based on number of patients for each variable. | ||
| COPD denotes chronic obstructive pulmonary disease; CRP, C-reactive protein; ESR, erythrocyte sedimentation rate; SD, standard deviation. | ||
FIGURE 1
DISTRIBUTION OF PATIENTS FOR EFFICACY AND SAFETY ANALYSES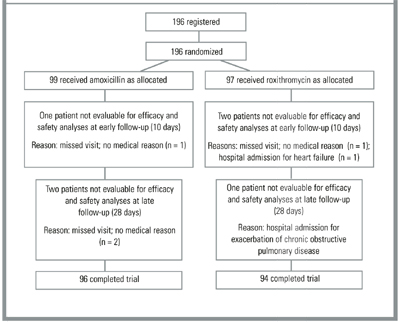
Clinical cure
Early Follow-Up. The rate of clinical cure, defined as the decrease in symptoms and signs at 10 days after randomization, was high and not significantly different between both groups. Using the stricter definition of clinical cure as the complete absence of symptoms and signs led to the same conclusion. Absolute cure rates using this strict definition were low (Table 3).
Physicians discontinued treatment with the study medication in 2 cases (1 amoxicillin and 1 roxithromycin) because of unsatisfactory clinical response. Both patients recovered rapidly after alternative antibiotic treatment. In one case, the patient discontinued amoxicillin after 8 days because of rash and urticaria and recovered quickly without further treatment.
Late Follow-Up. According to the physicians’ final assessments, the rate of clinical cure at 28 days was not significantly different between the 2 groups, although the percentage of patients who showed a decrease in symptoms was significantly higher in the amoxicillin group than in the roxithromycin group (Table 3). Again, cure rates were much lower when the strict definition of cure was used. Eleven patients in the amoxicillin group and 8 in the roxithromycin group were not clinically cured after 28 days. Of these patients, 10 (5 in each group) recovered shortly thereafter or did not consult their physician again for persisting symptoms of LRTI. Nine patients (6 in the amoxicillin group, 3 in the roxithromycin group) with exacerbation of COPD slowly returned to their baseline clinical situation. Four patients (3 in the amoxicillin group, 1 in the roxithromycin group) were found to have concomitant pulmonary cancer. Curative bilobectomy was performed in one of the patients. The others received palliative treatment.
TABLE 3
CLINICAL CURE RATE AT EARLY (10-DAY) AND LATE (28-DAY) FOLLOW-UP
| Characteristic | Amoxicillin No. (%) | Roxithromycin No. (%) | Relative Risk* (CI) |
|---|---|---|---|
| Decrease in Symptoms and Signs | |||
| Day 10 | |||
| Symptoms | 84/96 (88) | 90/95 (95) | 2.38 (0.87-6.48) |
| Signs (physical examination) | 85/98 (87) | 89/95 (94) | 2.10 (0.83-5.30) |
| Day 28 | |||
| Symptoms | 91/95 (96) | 79/93 (85) | 0.28 (0.10-0.82)† |
| Signs (physical examination) | 90/96 (94) | 87/94 (93) | 0.74 (0.29-2.41) |
| Absence of Symptoms and Signs | |||
| Day 10 | |||
| Symptoms | 18/96 (19) | 22/95 (23) | 2.38 (0.87-6.48) |
| Signs (physical examination) | 68/98 (69) | 76/95 (80) | 1.53 (0.93-2.53) |
| Day 28 | |||
| Symptoms | 59/95 (62) | 50/93 (54) | 0.82 (0.58-1.15) |
| Signs (physical examination) | 82/96 (85) | 80/94 (85) | 0.98 (0.49-1.94) |
| Fever (≥38°C) gone, day 10 | 21/25 (84) | 16/22 (73) | 1.37 (0.25-7.41) |
| Cure, final conclusion by physician, day 28 | 84/95 (88) | 86/94 (91) | 1.36 (0.57-3.23) |
| NOTE: Percentages are based on number of patients for each variable. | |||
| *Risk of no cure with amoxicillin vs roxithromycin. | |||
| †P < .05. | |||
Self-reported response over time
The time before resolution of symptoms according to the patients’ diaries was similar for patients treated with amoxicillin and those treated with roxithromycin (Figures 2A and 2B). The percentage of patients who had abandoned daily activities was followed over time. At baseline, more than half of the patients in the amoxicillin group and fewer than 40% in the roxithromycin group reported that they had abandoned daily activities. At day 10, this percentage had fallen to less than 20% in both groups and to less than 10% in both groups at day 28. Differences between the amoxicillin and roxithromycin groups were not significant.
Furthermore, the patients’ diaries revealed information about the time of impaired daily activities. The percentage of patients with impaired daily activities gradually decreased in both treatment groups from approximately 75% at baseline to 30% at day 10 and 20% at day 28.
FIGURE 2
TIME TO RESOLUTION OF SYMPTOMS AS DESCRIBED IN PATIENTS’ DIARIES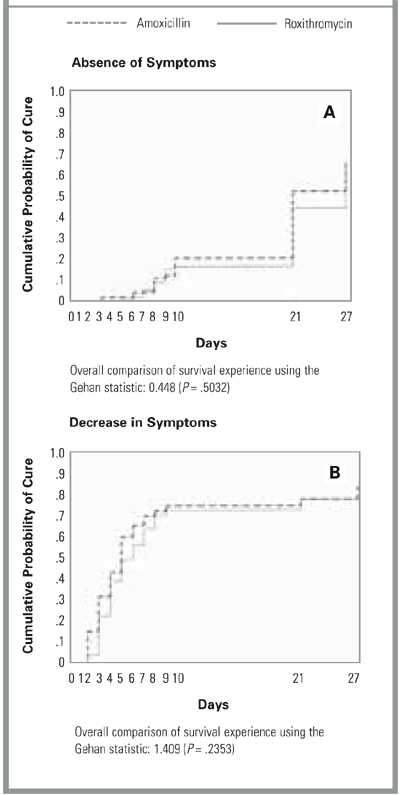
Subgroup analyses
The above analyses were repeated for a group of patients aged less than 65 years and a group aged 65 years and older. The trend in cure rates was the same. No differences were found between these age groups regarding the percentage of patients with satisfactory clinical response. Furthermore, the same analyses were performed for each of the clinical diagnoses made by the PCPs at baseline (ie, pneumonia, acute bronchitis, exacerbation of asthma or COPD, and unclassified LRTI). Overall, no significant differences were found between the amoxicillin and roxithromycin groups.
Bacteriologic evaluation
Pathogens were identified in 91 patients (46%). Viruses were most frequent, followed by H (Para) influenzae, S pneumoniae, and Moraxella catarrhalis (Table 4). Bacteriologic cure was achieved in 21 of the 23 patients (91%) in the amoxicillin group and in 23 of the 27 patients (85%) in the roxithromycin group (NS, Fisher’s exact test). In 9 patients of the amoxicillin group and 8 patients of the roxithromycin group, only the sample obtained after 10 days showed the growth of a predominant bacterial pathogen (superinfection).
TABLE 4
RESPIRATORY TRACT PATHOGENS ISOLATED
| Microorganism | No. (%) |
|---|---|
| Typical Bacterial Pathogens | |
| Haemophilus (Para) influenzae | 34 (17) |
| Streptococcus pneumoniae | 12 (6) |
| Moraxella catarrhalis | 6 (3) |
| Other* | 5 (3) |
| Atypical Pathogens | |
| Mycoplasma pneumoniae | 2 (1) |
| Legionella pneumophila | 1 (0.5) |
| Viruses | |
| Influenza A | 29 (16) |
| Influenza B | 7 (4) |
| Parainfluenzae 1, 2, 3 | 7 (4) |
| Adenovirus | 5 (3) |
| Respiratory syncytial virus | 5 (3) |
| No organism (number of patients) | 122 (49) |
| * Enterobacteriaceae (n = 2), Staphylococcus aureus (n = 1), Streptococcus viridans (n = 1), Neisseria meningitidis (n = 1). | |
Safety and compliance
Thirty possible or probable adverse events were reported in 19 of 99 patients (19%) treated with amoxicillin: diarrhea (13), stomach ache (3), headache (3), and 11 other side effects, including nausea, vomiting, and rash, once each. In the roxithromycin group, 24 events were reported in 16 patients (16%): nausea (5), diarrhea (4), vomiting (4), rash (2), headache (2), and 7 others, including pruritus ani, dizziness, and mild bradycardia, once each.
Compliance with the medication regimen was high. Data from electronic monitoring were available for 160 patients (78 in the amoxicillin group, 82 in the roxithromycin group). The overall compliance rate for patients in both groups (ie, the number of doses taken divided by the number of doses prescribed) was 98%. In the amoxicillin group, the numbers of patients with less than 90% compliance in taking the tablets and capsules were 7 and 4, respectively. In the roxithromycin group, compliance in taking the tablets was at least 90% in all patients but compliance in taking the capsules was less than 90% in 6 patients.
Discussion
This community-based study shows that amoxicillin and roxithromycin are equally effective in the treatment of LRTI in the Netherlands. Clinical cure rates after 10 days of antibiotic treatment were approximately 90% in both study groups, although complete absence of symptoms was achieved in only a minority of cases. After 28 days of follow-up, cure rates remained high. The amoxicillin group had a significantly higher cure rate than the roxithromycin group as evidenced by the decrease in symptoms. However, this significant difference in favor of the amoxicillin group did not alter the PCPs’ overall conclusion after complete follow-up: that 90% of patients who received either drug had been effectively treated. Patients’ diary entries agreed with that impression.
The time to resolution of symptoms, the cumulative cure rate per day, and the influence of the illness on daily activities were not significantly different between patients treated with amoxicillin versus those given roxithromycin. Adverse events were mild and were divided evenly over both groups with the exception of diarrhea, which occurred more often in those taking amoxicillin.
In our study, complete absence of symptoms and signs after 28 days, as assessed by both physicians and patients, was achieved in only approximately half the patients. Complete remission of LRTI often takes more than 4 weeks.
Although LRTI is often managed in primary care, diagnostic and therapeutic decisions are usually based on the experiences of hospital-based specialists and on the results of trials conducted in hospital settings. Generalizing these results to primary care is of limited value, since disease in patients recruited for these studies is often at a later stage and more serious. In our trial, patients were recruited, diagnosed, and treated by PCPs in their natural setting, maintaining regular care as much as possible.
Nevertheless, generalization of our findings to everyday care may not be valid. To explore the degree of selection in our recruited patients, we compared the actual numbers of cases of LRTI in 3 practices (with a total of 9 PCPs and a total population of 13,269) with the numbers included in the present trial during 1 year of the inclusion period. Of the 463 presumably eligible patients, only 43 (9%) were actually included. This proportion is similar to that in a recent study of randomized controlled trials in primary care in which less than 10% of the eligible population were recruited for the trial.31 Included patients did not differ from other eligible patients with regard to age, clinical diagnosis, severity of illness, and need for antibiotic treatment (according to the PCPs).
Clinical studies, mostly in inpatient settings, on community-acquired pneumonia have identified causative pathogens in 50% to 69% of patients.14-17,21,23,32,33 Outpatient studies of acute bronchitis and LRTI have generally reported considerably lower percentages (16% to 44%).19,20,34-36 In our study, pathogens that presumably caused LRTI were found in 46% of patients.
Because atypical pathogens were the presumptive causative agent in only 3 cases (2 M pneumoniae, 1 L pneumophila), the potential advantage of macrolide antibiotics over amoxicillin is minimal. Furthermore, bacterial resistance to macrolide antibiotics is believed to be considerable.37,38 In Finland, bacterial resistance to erythromycin has been shown to rise quickly after an increase in the consumption of macrolide antibiotics.39 In contrast to alarming reports in the literature,14,17,22,40,41 the low incidence of M pneumoniae and L pneumophila found in the current study supports the conservative approach (ie, amoxicillin or doxycycline) to treating community-acquired LRTI in the Netherlands.
M pneumoniae occurs at high rates in 4-year to 5-year cycles.42 This timing implies that the frequency of M pneumoniae might be higher if the same study were performed 1 year later. Because most M pneumoniae infections are self-limiting and clinical cure rates of macrolide antibiotics compared with those of placebo are the same,43,44 however, this epidemiologic observation does not change the conclusions of the present study.
Compliance with medication was reliably measured and quantified by Medical Event Monitoring Systems. For both ethical and practical reasons, patients were informed about the monitoring mechanism. Their knowledge about the monitoring may have slightly increased compliance as compared with daily practice, although this assumption has not been confirmed in other studies.45,46 Furthermore, compliance with antibiotic regimens is known to be greater than compliance with chronic medication regimens.47,48
Conclusions
General practitioners frequently diagnose LRTI in general or pneumonia and acute bronchitis in particular, including infectious episodes in patients with asthma or COPD. In many cases, treatment with antibiotics follows. The results of our randomized controlled trial did not confirm the potentially greater value of roxithromycin, which is often recommended as the drug of choice for empirical treatment of community-acquired pneumonia, over amoxicillin. Because amoxicillin was as effective as roxithromycin, it remains a reliable first-choice antibiotic in the treatment of community-acquired LRTI.
Acknowledgments
The authors wish to thank the patients, general practitioners, and physicians’ assistants who participated in this study. They also thank Hans Verloop, director of the Vandra paper factory, Meer-Hoogstraten, Belgium, for donating cardboard boxes and Alexander Thissen, Josephine Asberg, and Ramon Ottenheijm for their assistance with the logistics of the study. The study was supported by a grant from the Research Institute for Extramural and Transmural Health Care, Maastricht.
1. Bartlett JG, Mundy LM. Community-acquired pneumonia. N Engl J Med 1995;333:1618-24.
2. Melbye H, Straume B, Aasebo U, Dale K. Diagnosis of pneumonia in adults in general practice. Relative importance of typical symptoms and abnormal chest signs evaluated against a radiographic reference standard. Scand J Prim Health Care. 1992;10:226-33.
3. Melbye H, Straume B, Aasebo U, Brox J. The diagnosis of adult pneumonia in general practice. The diagnostic value of history, physical examination and some blood tests. Scand J Prim Health Care. 1988;6:111-7.
4. Wipf JE, Lipsky BA, Hirschmann JV, et al. Diagnosing pneumonia by physical examination—relevant or relic? Arch Intern Med. 1999;159:1082-7.
5. Zaat JOM, Stalman WAB, Assendelft WJJ. Groaning, moaning and percussion. A systematic review on the diagnostic value of history and physical examination in patient with a suspicion of pneumonia. Huisarts Wet. 1998;41:461-9.
6. Metlay JP, Kapoor WN, Fine MJ. Does this patient have community-acquired pneumonia? Diagnosing pneumonia by history and physical examination. JAMA 1997;278:1440-5.
7. Kuyvenhoven MM, Verheij TJ, de Melker RA, van der Velden J. Antimicrobial agents in lower respiratory tract infections in Dutch general practice. Br J Gen Pract 2000;50:133-4.
8. Macfarlane J, Lewis SA, Macfarlane R, Holmes W. Contemporary use of antibiotics in 1089 adults presenting with acute lower respiratory tract illness in general practice in the UK: implications for developing management guidelines. Respir Med 1997;91:427-34.
9. Oeffinger KC, Snell LM, Foster BM, Panico KG, Archer RK. Treatment of acute bronchitis in adults. A national survey of family physicians. J Fam Pract. 1998;46:469-75.
10. Ortqvist A. Antibiotic treatment of community-acquired pneumonia in clinical practice: a European perspective. J Antimicrob Chemother 1995;35:205-12.
11. Janknegt R, Wijnands WJ, Stobberingh EE. Antibiotic policies in Dutch hospitals for the treatment of pneumonia. J Antimicrob Chemother 1994;34:431-42.
12. van der Werf GT, Smith RJA, Stewart RE, Meyboom-de Jong B. Spiegel op de huisarts: over registratie van ziekte, medicatie en verwijzingen in de geautimatiseerde huisartsenpraktijk. Groningen, the Netherlands: Disciplinegroep Huisartsgeneeskunde, University of Groningen; 1998: 1-181.
13. Stokx LJ, Foets M. Het voorschrijven van geneesmiddelen in de huisartspraktijk. Deel II [Prescribing drugs in general practice]. Utrecht: NIVEL; 1994.
14. Marrie TJ, Peeling RW, Fine MJ, Singer DE, Coley CM, Kapoor WN. Ambulatory patients with community-acquired pneumonia: the frequency of atypical agents and clinical course. Am J Med 1996;101:508-15.
15. Berntsson E, Lagergard T, Strannegard O, Trollfors B. Etiology of community-acquired pneumonia in out-patients. Eur J Clin Microbiol 1986;5:446-7.
16. Bohte R, van Furth R, van den Broek PJ. Aetiology of community-acquired pneumonia: a prospective study among adults requiring admission to hospital. Thorax 1995;50:543-7.
17. Fang GD, Fine M, Orloff J, et al. New and emerging etiologies for community-acquired pneumonia with implications for therapy. A prospective multicenter study of 359 cases. Medicine (Baltimore). 1990;69:307-16.
18. Woodhead MA, Macfarlane JT, McCracken JS, Rose DH, Finch RG. Prospective study of the aetiology and outcome of pneumonia in the community. Lancet 1987;1:671-4.
19. Jonsson JS, Sigurdsson JA, Kristinsson KG, Guthnadottir M, Magnusson S. Acute bronchitis in adults. How close do we come to its aetiology in general practice? Scand J Prim Health Care. 1997;15:156-60.
20. Macfarlane JT, Colville A, Guion A, Macfarlane RM, Rose DH. Prospective study of aetiology and outcome of adult lower-respiratory-tract infections in the community. Lancet 1993;341:511-4.
21. Niederman MS, Bass JB, Jr, Campbell GD, et al. Guidelines for the initial management of adults with community-acquired pneumonia: diagnosis, assessment of severity, and initial antimicrobial therapy. merican Thoracic Society. Medical Section of the American Lung Association. Am Rev Respir Dis. 1993;148:1418-26.
22. Mandell LA, Niederman M. Antimicrobial treatment of community acquired pneumonia in adults: a conference report. Can J Infect Dis 1993;4:25-8.
23. Marrie TJ. Community acquired pneumonia. Clin Infect Dis 1994;18:501-15.
24. Poirier R. Comparative study of clarithromycin and roxithromycin in the treatment of community-acquired pneumonia. J Antimicrob Chemother 1991;27:109-16.
25. Tilyard MW, Dovey SM. A randomized double-blind controlled trial of roxithromycin and cefaclor in the treatment of acute lower respiratory tract infections in general practice. Diagn Microbiol Infect Dis 1992;15:S97-101.
26. Zeluff BJ, Lowe P, Koornhof HJ, Gentry LO. Evaluation of roxithromycin (RU-965) versus cephradine in pneumococcal pneumonia. Eur J Clin Microbiol Infect Dis. 1988;7:69-71.
27. Schonwald S, Barsic B, Klinar I, Gunjaca M. Three-day azithromycin compared with ten-day roxithromycin treatment of atypical pneumonia. Scand J Infect Dis 1994;26:706-10.
28. Young RA, Gonzalez JP, Sorkin EM. Roxithromycin. A review of its antibacterial activity, pharmacokinetic properties and clinical efficacy. Drugs. 1989;37:8-41.
29. de Neeling AJ, Pelt van W, Hendrix MGR, et al. Antibiotica resistentie in Nederland. Deel III: Gram-positieve bacteriën. Infect Bull. 1997;8:211-5.
30. Cramer JA, Mattson RH, Prevey ML, Scheyer RD, Ouellette VL. How often is medication taken as prescribed? A novel assessment technique. JAMA 1989;261:3273-7.
31. Wilson S, Delaney BC, Roalfe A, et al. Randomized controlled trials in primary care: case study. BMJ 2000;321:24-7.
32. Ortqvist A, Hedlund J, Grillner L, et al. Aetiology, outcome and prognostic factors in community-acquired pneumonia requiring hospitalization. Eur Respir J 1990;3:1105-13.
33. Ortqvist A, Valtonen M, Cars O, Wahl M, Saikku P, Jean C. Oral empiric treatment of community-acquired pneumonia. A multicenter, double-blind, randomized study comparing sparfloxacin with roxithromycin. The Scandinavian Sparfloxacin Study Group. Chest. 1996;110:1499-506.
34. Boldy DA, Skidmore SJ, Ayres JG. Acute bronchitis in the community: clinical features, infective factors, changes in pulmonary function and bronchial reactivity to histamine. Respir Med 1990;84:377-85.
35. Trigg CJ, Wilks M, Herdman MJ, Clague JE, Tabaqchali S, Davies RJ. A double-blind comparison of the effects of cefaclor and amoxycillin on respiratory tract and oropharyngeal flora and clinical response in acute exacerbations of bronchitis. Respir Med 1991;85:301-8.
36. Karalus NC, Garrett JE, Lang SD, et al. Roxithromycin 150 mg bid versus amoxicillin 500 mg/clavulanic acid 125 mg tid for the treatment of lower respiratory tract infections in general practice. Infection 1995;23:S15-20.
37. Swartz MN. Use of antimicrobial agents and drug resistance. N Engl J Med 1997;337:491-2.
38. de Neeling AJ. Antibioticagebruik en het optreden van resistentie. National Institute of Public Health and the Environment/Volksgezondheid Toekomst Verkenning 1997;B3:793-800.
39. Seppala H, Klaukka T, Vuopio-Varkila J, et al. The effect of changes in the consumption of macrolide antibiotics on erythromycin resistance in group A streptococci in Finland. Finnish Study Group for Antimicrobial Resistance. N Engl J Med. 1997;337:441-6.
40. Wood MJ. More macrolides. BMJ 1991;303:594-5.
41. Wort SJ, Rogers TR. Community acquired pneumonia in elderly people. Current British guidelines need revision. BMJ. 1998;316:1690.-
42. Bartlett JB. Management of respiratory tract infections. Baltimore, Md: Williams & Wilkins; 1997: 121.
43. King DE, Williams WC, Bishop L, Shechter A. Effectiveness of erythromycin in the treatment of acute bronchitis. J Fam Pract 1996;42:601-5.
44. Lode H, Garau J, Grassi C, et al. Treatment of community-acquired pneumonia: a randomized comparison of sparfloxacin, amoxycillin-clavulanic acid and erythromycin. Eur Respir J 1995;8:1999-2007.
45. Urquhart J. Partial compliance in cardiovascular disease: risk implications. Br J Clin Pract 1994;suppl:2-12.
46. Cramer JA, Ouelette VL, Mattson RH. Effect of microelectronic observation on compliance. Epilepsia 1990;31:617-8.
47. Favre O, Delacretaz E, Badan M, Glauser M, Waeber B. Relationship between the prescriber’s instructions and compliance with antibiotherapy in outpatients treated for an acute infectious disease. J Clin Pharmacol 1997;37:175-8.
48. Urquhart J. Role of patient compliance in clinical pharmacokinetics. A review of recent research. Clin Pharmacokinet. 1994;27:202-15.
OBJECTIVE: To assess the efficacy of roxithromycin relative to amoxicillin.
STUDY DESIGN: We conducted a double-blind randomized controlled trial of oral 500 mg amoxicillin 3 times per day vs oral 300 mg roxithromycin once a day for 10 days.
POPULATION: We included 196 adults who had presented to a general practitioner with lower respiratory tract infection (LRTI) and, in the physician’s opinion, needed antibiotic treatment.
OUTCOMES MEASURED: We measured clinical response after 10 and 28 days, defined in 4 ways: (1) decrease in LRTI symptoms; (2) complete absence of symptoms; (3) decrease in signs; and (4) complete absence of signs. Self-reported response included the decrease in symptoms and the time until resumption of impaired or abandoned daily activities on days 1 through 10, 21, and 27.
RESULTS: Clinical cure rates after the completion of antibiotic treatment (10 days) were not significantly different for the 2 groups. After 28 days, the roxithromycin group showed no increase in cure rate as evidenced by the decrease in symptoms, indicating a significantly lower cure rate. However, this difference did not alter physicians’ overall conclusion after complete follow-up that 90% of patients, regardless of age, had been effectively treated with either amoxicillin or roxithromycin.
CONCLUSIONS: The surplus value of roxithromycin was not confirmed. Amoxicillin remains a reliable first-choice antibiotic in the treatment of LRTI in general practice.
- Amoxicillin and roxithromycin are equally effective in the treatment of patients presenting with lower respiratory tract infections and needing antibiotic treatment.
- Most patients remain symptomatic after 10 days of treatment with either drug.
- The low incidence of atypical pathogens (Mycoplasma pneumoniae, Legionella pneumophila, and Chlamydia pneumoniae) in the Netherlands minimizes the potentially greater surplus value of macrolide antibiotics over amoxicillin.
Acute community-acquired lower respiratory tract infections (LRTIs) in adults include acute bronchitis, pneumonia, and infectious episodes in patients with asthma or chronic obstructive pulmonary disease (COPD). In acute bronchitis and exacerbations of COPD, the value of antibiotic therapy is doubtful; in pneumonia, however, it is widely accepted. Because distinguishing between these disease entities on clinical grounds alone is often impossible, deciding which patients would benefit from antibiotic treatment remains difficult.1-6In the Netherlands, as in the United States and Great Britain, antibiotics are prescribed for patients with acute bronchitis approximately 80% of the time.7-9
If a primary care physician (PCP) decides to treat LRTI with antibiotics, amoxicillin is the drug of first choice in the Netherlands.10-13 However, amoxicillin is not effective in infections caused by atypical organisms such as Mycoplasma pneumoniae, Chlamydia pneumoniae, and Legionella pneumophila, which are responsible for 1% to 50% of cases of LRTI.14-20 Roxithromycin and the newer macrolide antibiotics are recommended as drugs of choice for the empirical treatment of community-acquired pneumonia in low-risk patients in the United States and Canada21-23 because those drugs cover both typical and atypical pathogens. Amoxicillin has long proved to be a reliable drug and one to which the resistance of common respiratory tract pathogens (Streptococcus pneumoniae and Haemophilus influenzae) in the Netherlands is low.24-29
Community-based studies that evaluate treatment for LRTI are lacking. Also lacking are independent randomized controlled studies comparing amoxicillin with roxithromycin or other new macrolides for LRTI. Our double-blind randomized trial attempted to determine whether the preference for amoxicillin in the Netherlands is well founded. In the trial, patients with LRTI who in their PCP’s opinion needed antibiotic treatment were assigned to either amoxicillin or roxithromycin. We then compared the efficacy and safety of both drugs.
Methods
Eligibility criteria and baseline characteristics
Eligible study subjects were patients in the southern part of the Netherlands who presented with signs and symptoms of LRTI that their PCPs believed warranted antibiotic therapy. Table 1 lists the inclusion and exclusion criteria.
Baseline data (at day 1) were obtained to evaluate the comparability of prognostic factors between the intervention groups. The PCP performed an extensive medical history and physical examination. In addition, a sputum sample, oral washing, and nasopharyngeal swab were taken for bacteriologic examination. Venous blood samples were taken for blood chemistry, hematology, and serology (initial titers of the viral pathogens M pneumoniae and L pneumophila).
TABLE 1
CHECKLIST FOR PATIENT ELIGIBILITY
| Inclusion Criteria | Exclusion Criteria |
|---|---|
| A: Age 18 years or older |
|
| AND | |
| B: New* or increasing cough | |
| AND | |
| C: At least 1 of the following: | |
| 1) Shortness of breath | |
| 2) Wheezing | |
| 3) Chest pain | |
| 4) Auscultation abnormalities | |
| AND | |
| D: At least 1 of the following: | |
| 1) Fever (≥ 38°C) | |
| 2) Perspiring | |
| 3) Headache | |
| 4) Myalgia | |
| AND | |
| E: Diagnosis of LRTI according to PCP and | |
| F: Antibiotics required (in PCP’s opinion) | |
| * Onset within the previous 29 days. | |
| LRTI denotes lower respiratory tract infection; PCP, primary care physician. | |
Interventions
Once the samples had been collected, patients were randomly assigned to oral treatment with either 500 mg amoxicillin 3 times daily for 10 days or 300 mg roxithromycin once daily for 10 days. A computer program using random permuted blocks of 6 prepared a randomization list for each participating center. Batches of drug packages, each provided with a unique trial code, had been sent in advance to the participating general practices. A double-dummy technique achieved blinding of patients, treating physicians, and investigators to the assigned medication. This was necessary because amoxicillin and roxithromycin have different dosing schedules (3 times a day versus once daily) and are not identical in appearance (capsule versus tablet). All capsules and tablets had identical appearance and taste. All patients received both forms of their assigned medication. Compliance with medication regimens was measured by Medical Event Monitoring Systems (MEMS), an electronic recording system that compiles the dosing history of ambulatory patients taking oral medication.30
Chest X-Rays
Every patient underwent chest x-ray. The radiographs were reassessed for the presence or absence of infiltrate by a blinded independent senior radiologist. If the first and second radiologist disagreed, a third senior radiologist made a final assessment.
Follow-up
Follow-up consultations similar to the examination on day 1 took place on days 10 and 28. During treatment (days 1 through 10) and on days 21 and 27, follow-up was supplemented by a short diary in which patients recorded their symptoms and the times at which they resumed daily activities that they had abandoned or that had been impaired.
Outcomes measured
Efficacy was assessed by comparing the groups’ clinical response on day 10 (the primary outcome measure) and day 28 and their bacteriologic response on day 10. Satisfactory clinical response was defined in 4 ways: (1) decrease in symptoms of LRTI; (2) absence of symptoms of LRTI; (3) decrease in signs of LRTI; and (4) absence of signs of LRTI. All other outcomes were regarded as unsatisfactory responses.
Self-reported symptoms and time to resolution were compared between the 2 groups on days 1 through 10, 21, and 27. The percentage of patients who had abandoned daily activities or whose participation in daily activities had been impaired by illness was followed over time. Bacteriologic cure was defined as the absence of growth of a predominant bacterial pathogen (cultured at baseline) in a sputum sample taken on day 10.
We recorded patients’ compliance rates, frequency of adverse events, and acquired bacterial resistance. Compliance was defined as the number of doses taken divided by the number of doses prescribed.
Statistical analyses
The efficacy of amoxicillin and roxithromycin was evaluated using an intention-to-treat analysis. Differences were tested using a 2-sided chi-square test ( α= 0.05). Multiple logistic regression analysis was performed to analyze the effect of differences in baseline characteristics between the randomized groups. Differences in symptoms, time to resolution of symptoms, and time to resumption of abandoned and impaired daily activities were tested in life table analyses using the Gehan test. All statistical analyses were performed with Statistical Package for the Social Sciences software, version 8.0.
Results
Patient population
From January 1998 to April 1999, 25 PCPs from 15 practices recruited 196 patients aged 18 years to 89 years. Of these patients, 99 received amoxicillin and 97 received roxithromycin (Figure 1). The 2 groups’ demographic data, signs and symptoms, comorbidities, identified pathogens, and radiographic abnormalities were similar (Table 2). Multiple logistic regression analysis showed that none of the covariables altered the effects of the study medication.
TABLE 2
FINDINGS ON PRESENTATION
| Finding | Amoxicillin Group No. (%) | Roxithromycin Group No. (%) |
|---|---|---|
| Number of Patients | 99 (51) | 97 (49) |
| Demographic Data | ||
| Ratio of men to women | 46/53 | 53/44 |
| Mean age in years (SD) | 55 (15) | 50 (16) |
| Symptoms | ||
| Recent cough in number of days | ||
| 1–7 | 34 (36) | 41 (43) |
| 8–14 | 31 (33) | 25 (26) |
| 15–28 | 22 (23) | 23 (24) |
| No recent cough | 8 (8) | 6 (6) |
| Productive cough | 77 (78) | 84 (88) |
| Dyspnea | 78 (79) | 76 (79) |
| Wheezing | 68 (69) | 61 (64) |
| Risk Factors | ||
| Cigarette smoking | 36 (36) | 29 (31) |
| Comorbidity | ||
| None | 55 (56) | 48 (52) |
| Asthma | 19 (19) | 20 (22) |
| COPD | 17 (17) | 11 (12) |
| Heart failure | 3 (3) | 4 (4) |
| Diabetes mellitus | 2 (2) | 3 (3) |
| Other | 23 (24) | 21 (23) |
| Asthma medication prescribed at start of study | 16 (16) | 13 (14) |
| Signs | ||
| Auscultation abnormalities | 93 (94) | 87 (91) |
| Body temperature 38.0°C | 25 (26) | 22 (24) |
| Infection | ||
| Mild/moderate | 91 (93) | 89 (93) |
| Severe | 7 (7) | 7 (7) |
| Laboratory Tests | ||
| CRP, median (range) | 23 (2-228) | 26 (2-312) |
| ESR, median (range) | 21 (1-104) | 19 (1-121) |
| Leukocytes, median (range) | 8.3 (3.9-19.7) | 8.4 (4.3-15.4) |
| Patients with pathogens | 45 (45) | 46 (47) |
| Chest X-Ray | ||
| Infiltrate on chest x-ray | 14 (14) | 13 (14) |
| NOTE: Values are numbers (percentages) unless otherwise stated. Percentages are based on number of patients for each variable. | ||
| COPD denotes chronic obstructive pulmonary disease; CRP, C-reactive protein; ESR, erythrocyte sedimentation rate; SD, standard deviation. | ||
FIGURE 1
DISTRIBUTION OF PATIENTS FOR EFFICACY AND SAFETY ANALYSES
Clinical cure
Early Follow-Up. The rate of clinical cure, defined as the decrease in symptoms and signs at 10 days after randomization, was high and not significantly different between both groups. Using the stricter definition of clinical cure as the complete absence of symptoms and signs led to the same conclusion. Absolute cure rates using this strict definition were low (Table 3).
Physicians discontinued treatment with the study medication in 2 cases (1 amoxicillin and 1 roxithromycin) because of unsatisfactory clinical response. Both patients recovered rapidly after alternative antibiotic treatment. In one case, the patient discontinued amoxicillin after 8 days because of rash and urticaria and recovered quickly without further treatment.
Late Follow-Up. According to the physicians’ final assessments, the rate of clinical cure at 28 days was not significantly different between the 2 groups, although the percentage of patients who showed a decrease in symptoms was significantly higher in the amoxicillin group than in the roxithromycin group (Table 3). Again, cure rates were much lower when the strict definition of cure was used. Eleven patients in the amoxicillin group and 8 in the roxithromycin group were not clinically cured after 28 days. Of these patients, 10 (5 in each group) recovered shortly thereafter or did not consult their physician again for persisting symptoms of LRTI. Nine patients (6 in the amoxicillin group, 3 in the roxithromycin group) with exacerbation of COPD slowly returned to their baseline clinical situation. Four patients (3 in the amoxicillin group, 1 in the roxithromycin group) were found to have concomitant pulmonary cancer. Curative bilobectomy was performed in one of the patients. The others received palliative treatment.
TABLE 3
CLINICAL CURE RATE AT EARLY (10-DAY) AND LATE (28-DAY) FOLLOW-UP
| Characteristic | Amoxicillin No. (%) | Roxithromycin No. (%) | Relative Risk* (CI) |
|---|---|---|---|
| Decrease in Symptoms and Signs | |||
| Day 10 | |||
| Symptoms | 84/96 (88) | 90/95 (95) | 2.38 (0.87-6.48) |
| Signs (physical examination) | 85/98 (87) | 89/95 (94) | 2.10 (0.83-5.30) |
| Day 28 | |||
| Symptoms | 91/95 (96) | 79/93 (85) | 0.28 (0.10-0.82)† |
| Signs (physical examination) | 90/96 (94) | 87/94 (93) | 0.74 (0.29-2.41) |
| Absence of Symptoms and Signs | |||
| Day 10 | |||
| Symptoms | 18/96 (19) | 22/95 (23) | 2.38 (0.87-6.48) |
| Signs (physical examination) | 68/98 (69) | 76/95 (80) | 1.53 (0.93-2.53) |
| Day 28 | |||
| Symptoms | 59/95 (62) | 50/93 (54) | 0.82 (0.58-1.15) |
| Signs (physical examination) | 82/96 (85) | 80/94 (85) | 0.98 (0.49-1.94) |
| Fever (≥38°C) gone, day 10 | 21/25 (84) | 16/22 (73) | 1.37 (0.25-7.41) |
| Cure, final conclusion by physician, day 28 | 84/95 (88) | 86/94 (91) | 1.36 (0.57-3.23) |
| NOTE: Percentages are based on number of patients for each variable. | |||
| *Risk of no cure with amoxicillin vs roxithromycin. | |||
| †P < .05. | |||
Self-reported response over time
The time before resolution of symptoms according to the patients’ diaries was similar for patients treated with amoxicillin and those treated with roxithromycin (Figures 2A and 2B). The percentage of patients who had abandoned daily activities was followed over time. At baseline, more than half of the patients in the amoxicillin group and fewer than 40% in the roxithromycin group reported that they had abandoned daily activities. At day 10, this percentage had fallen to less than 20% in both groups and to less than 10% in both groups at day 28. Differences between the amoxicillin and roxithromycin groups were not significant.
Furthermore, the patients’ diaries revealed information about the time of impaired daily activities. The percentage of patients with impaired daily activities gradually decreased in both treatment groups from approximately 75% at baseline to 30% at day 10 and 20% at day 28.
FIGURE 2
TIME TO RESOLUTION OF SYMPTOMS AS DESCRIBED IN PATIENTS’ DIARIES
Subgroup analyses
The above analyses were repeated for a group of patients aged less than 65 years and a group aged 65 years and older. The trend in cure rates was the same. No differences were found between these age groups regarding the percentage of patients with satisfactory clinical response. Furthermore, the same analyses were performed for each of the clinical diagnoses made by the PCPs at baseline (ie, pneumonia, acute bronchitis, exacerbation of asthma or COPD, and unclassified LRTI). Overall, no significant differences were found between the amoxicillin and roxithromycin groups.
Bacteriologic evaluation
Pathogens were identified in 91 patients (46%). Viruses were most frequent, followed by H (Para) influenzae, S pneumoniae, and Moraxella catarrhalis (Table 4). Bacteriologic cure was achieved in 21 of the 23 patients (91%) in the amoxicillin group and in 23 of the 27 patients (85%) in the roxithromycin group (NS, Fisher’s exact test). In 9 patients of the amoxicillin group and 8 patients of the roxithromycin group, only the sample obtained after 10 days showed the growth of a predominant bacterial pathogen (superinfection).
TABLE 4
RESPIRATORY TRACT PATHOGENS ISOLATED
| Microorganism | No. (%) |
|---|---|
| Typical Bacterial Pathogens | |
| Haemophilus (Para) influenzae | 34 (17) |
| Streptococcus pneumoniae | 12 (6) |
| Moraxella catarrhalis | 6 (3) |
| Other* | 5 (3) |
| Atypical Pathogens | |
| Mycoplasma pneumoniae | 2 (1) |
| Legionella pneumophila | 1 (0.5) |
| Viruses | |
| Influenza A | 29 (16) |
| Influenza B | 7 (4) |
| Parainfluenzae 1, 2, 3 | 7 (4) |
| Adenovirus | 5 (3) |
| Respiratory syncytial virus | 5 (3) |
| No organism (number of patients) | 122 (49) |
| * Enterobacteriaceae (n = 2), Staphylococcus aureus (n = 1), Streptococcus viridans (n = 1), Neisseria meningitidis (n = 1). | |
Safety and compliance
Thirty possible or probable adverse events were reported in 19 of 99 patients (19%) treated with amoxicillin: diarrhea (13), stomach ache (3), headache (3), and 11 other side effects, including nausea, vomiting, and rash, once each. In the roxithromycin group, 24 events were reported in 16 patients (16%): nausea (5), diarrhea (4), vomiting (4), rash (2), headache (2), and 7 others, including pruritus ani, dizziness, and mild bradycardia, once each.
Compliance with the medication regimen was high. Data from electronic monitoring were available for 160 patients (78 in the amoxicillin group, 82 in the roxithromycin group). The overall compliance rate for patients in both groups (ie, the number of doses taken divided by the number of doses prescribed) was 98%. In the amoxicillin group, the numbers of patients with less than 90% compliance in taking the tablets and capsules were 7 and 4, respectively. In the roxithromycin group, compliance in taking the tablets was at least 90% in all patients but compliance in taking the capsules was less than 90% in 6 patients.
Discussion
This community-based study shows that amoxicillin and roxithromycin are equally effective in the treatment of LRTI in the Netherlands. Clinical cure rates after 10 days of antibiotic treatment were approximately 90% in both study groups, although complete absence of symptoms was achieved in only a minority of cases. After 28 days of follow-up, cure rates remained high. The amoxicillin group had a significantly higher cure rate than the roxithromycin group as evidenced by the decrease in symptoms. However, this significant difference in favor of the amoxicillin group did not alter the PCPs’ overall conclusion after complete follow-up: that 90% of patients who received either drug had been effectively treated. Patients’ diary entries agreed with that impression.
The time to resolution of symptoms, the cumulative cure rate per day, and the influence of the illness on daily activities were not significantly different between patients treated with amoxicillin versus those given roxithromycin. Adverse events were mild and were divided evenly over both groups with the exception of diarrhea, which occurred more often in those taking amoxicillin.
In our study, complete absence of symptoms and signs after 28 days, as assessed by both physicians and patients, was achieved in only approximately half the patients. Complete remission of LRTI often takes more than 4 weeks.
Although LRTI is often managed in primary care, diagnostic and therapeutic decisions are usually based on the experiences of hospital-based specialists and on the results of trials conducted in hospital settings. Generalizing these results to primary care is of limited value, since disease in patients recruited for these studies is often at a later stage and more serious. In our trial, patients were recruited, diagnosed, and treated by PCPs in their natural setting, maintaining regular care as much as possible.
Nevertheless, generalization of our findings to everyday care may not be valid. To explore the degree of selection in our recruited patients, we compared the actual numbers of cases of LRTI in 3 practices (with a total of 9 PCPs and a total population of 13,269) with the numbers included in the present trial during 1 year of the inclusion period. Of the 463 presumably eligible patients, only 43 (9%) were actually included. This proportion is similar to that in a recent study of randomized controlled trials in primary care in which less than 10% of the eligible population were recruited for the trial.31 Included patients did not differ from other eligible patients with regard to age, clinical diagnosis, severity of illness, and need for antibiotic treatment (according to the PCPs).
Clinical studies, mostly in inpatient settings, on community-acquired pneumonia have identified causative pathogens in 50% to 69% of patients.14-17,21,23,32,33 Outpatient studies of acute bronchitis and LRTI have generally reported considerably lower percentages (16% to 44%).19,20,34-36 In our study, pathogens that presumably caused LRTI were found in 46% of patients.
Because atypical pathogens were the presumptive causative agent in only 3 cases (2 M pneumoniae, 1 L pneumophila), the potential advantage of macrolide antibiotics over amoxicillin is minimal. Furthermore, bacterial resistance to macrolide antibiotics is believed to be considerable.37,38 In Finland, bacterial resistance to erythromycin has been shown to rise quickly after an increase in the consumption of macrolide antibiotics.39 In contrast to alarming reports in the literature,14,17,22,40,41 the low incidence of M pneumoniae and L pneumophila found in the current study supports the conservative approach (ie, amoxicillin or doxycycline) to treating community-acquired LRTI in the Netherlands.
M pneumoniae occurs at high rates in 4-year to 5-year cycles.42 This timing implies that the frequency of M pneumoniae might be higher if the same study were performed 1 year later. Because most M pneumoniae infections are self-limiting and clinical cure rates of macrolide antibiotics compared with those of placebo are the same,43,44 however, this epidemiologic observation does not change the conclusions of the present study.
Compliance with medication was reliably measured and quantified by Medical Event Monitoring Systems. For both ethical and practical reasons, patients were informed about the monitoring mechanism. Their knowledge about the monitoring may have slightly increased compliance as compared with daily practice, although this assumption has not been confirmed in other studies.45,46 Furthermore, compliance with antibiotic regimens is known to be greater than compliance with chronic medication regimens.47,48
Conclusions
General practitioners frequently diagnose LRTI in general or pneumonia and acute bronchitis in particular, including infectious episodes in patients with asthma or COPD. In many cases, treatment with antibiotics follows. The results of our randomized controlled trial did not confirm the potentially greater value of roxithromycin, which is often recommended as the drug of choice for empirical treatment of community-acquired pneumonia, over amoxicillin. Because amoxicillin was as effective as roxithromycin, it remains a reliable first-choice antibiotic in the treatment of community-acquired LRTI.
Acknowledgments
The authors wish to thank the patients, general practitioners, and physicians’ assistants who participated in this study. They also thank Hans Verloop, director of the Vandra paper factory, Meer-Hoogstraten, Belgium, for donating cardboard boxes and Alexander Thissen, Josephine Asberg, and Ramon Ottenheijm for their assistance with the logistics of the study. The study was supported by a grant from the Research Institute for Extramural and Transmural Health Care, Maastricht.
1. Bartlett JG, Mundy LM. Community-acquired pneumonia. N Engl J Med 1995;333:1618-24.
2. Melbye H, Straume B, Aasebo U, Dale K. Diagnosis of pneumonia in adults in general practice. Relative importance of typical symptoms and abnormal chest signs evaluated against a radiographic reference standard. Scand J Prim Health Care. 1992;10:226-33.
3. Melbye H, Straume B, Aasebo U, Brox J. The diagnosis of adult pneumonia in general practice. The diagnostic value of history, physical examination and some blood tests. Scand J Prim Health Care. 1988;6:111-7.
4. Wipf JE, Lipsky BA, Hirschmann JV, et al. Diagnosing pneumonia by physical examination—relevant or relic? Arch Intern Med. 1999;159:1082-7.
5. Zaat JOM, Stalman WAB, Assendelft WJJ. Groaning, moaning and percussion. A systematic review on the diagnostic value of history and physical examination in patient with a suspicion of pneumonia. Huisarts Wet. 1998;41:461-9.
6. Metlay JP, Kapoor WN, Fine MJ. Does this patient have community-acquired pneumonia? Diagnosing pneumonia by history and physical examination. JAMA 1997;278:1440-5.
7. Kuyvenhoven MM, Verheij TJ, de Melker RA, van der Velden J. Antimicrobial agents in lower respiratory tract infections in Dutch general practice. Br J Gen Pract 2000;50:133-4.
8. Macfarlane J, Lewis SA, Macfarlane R, Holmes W. Contemporary use of antibiotics in 1089 adults presenting with acute lower respiratory tract illness in general practice in the UK: implications for developing management guidelines. Respir Med 1997;91:427-34.
9. Oeffinger KC, Snell LM, Foster BM, Panico KG, Archer RK. Treatment of acute bronchitis in adults. A national survey of family physicians. J Fam Pract. 1998;46:469-75.
10. Ortqvist A. Antibiotic treatment of community-acquired pneumonia in clinical practice: a European perspective. J Antimicrob Chemother 1995;35:205-12.
11. Janknegt R, Wijnands WJ, Stobberingh EE. Antibiotic policies in Dutch hospitals for the treatment of pneumonia. J Antimicrob Chemother 1994;34:431-42.
12. van der Werf GT, Smith RJA, Stewart RE, Meyboom-de Jong B. Spiegel op de huisarts: over registratie van ziekte, medicatie en verwijzingen in de geautimatiseerde huisartsenpraktijk. Groningen, the Netherlands: Disciplinegroep Huisartsgeneeskunde, University of Groningen; 1998: 1-181.
13. Stokx LJ, Foets M. Het voorschrijven van geneesmiddelen in de huisartspraktijk. Deel II [Prescribing drugs in general practice]. Utrecht: NIVEL; 1994.
14. Marrie TJ, Peeling RW, Fine MJ, Singer DE, Coley CM, Kapoor WN. Ambulatory patients with community-acquired pneumonia: the frequency of atypical agents and clinical course. Am J Med 1996;101:508-15.
15. Berntsson E, Lagergard T, Strannegard O, Trollfors B. Etiology of community-acquired pneumonia in out-patients. Eur J Clin Microbiol 1986;5:446-7.
16. Bohte R, van Furth R, van den Broek PJ. Aetiology of community-acquired pneumonia: a prospective study among adults requiring admission to hospital. Thorax 1995;50:543-7.
17. Fang GD, Fine M, Orloff J, et al. New and emerging etiologies for community-acquired pneumonia with implications for therapy. A prospective multicenter study of 359 cases. Medicine (Baltimore). 1990;69:307-16.
18. Woodhead MA, Macfarlane JT, McCracken JS, Rose DH, Finch RG. Prospective study of the aetiology and outcome of pneumonia in the community. Lancet 1987;1:671-4.
19. Jonsson JS, Sigurdsson JA, Kristinsson KG, Guthnadottir M, Magnusson S. Acute bronchitis in adults. How close do we come to its aetiology in general practice? Scand J Prim Health Care. 1997;15:156-60.
20. Macfarlane JT, Colville A, Guion A, Macfarlane RM, Rose DH. Prospective study of aetiology and outcome of adult lower-respiratory-tract infections in the community. Lancet 1993;341:511-4.
21. Niederman MS, Bass JB, Jr, Campbell GD, et al. Guidelines for the initial management of adults with community-acquired pneumonia: diagnosis, assessment of severity, and initial antimicrobial therapy. merican Thoracic Society. Medical Section of the American Lung Association. Am Rev Respir Dis. 1993;148:1418-26.
22. Mandell LA, Niederman M. Antimicrobial treatment of community acquired pneumonia in adults: a conference report. Can J Infect Dis 1993;4:25-8.
23. Marrie TJ. Community acquired pneumonia. Clin Infect Dis 1994;18:501-15.
24. Poirier R. Comparative study of clarithromycin and roxithromycin in the treatment of community-acquired pneumonia. J Antimicrob Chemother 1991;27:109-16.
25. Tilyard MW, Dovey SM. A randomized double-blind controlled trial of roxithromycin and cefaclor in the treatment of acute lower respiratory tract infections in general practice. Diagn Microbiol Infect Dis 1992;15:S97-101.
26. Zeluff BJ, Lowe P, Koornhof HJ, Gentry LO. Evaluation of roxithromycin (RU-965) versus cephradine in pneumococcal pneumonia. Eur J Clin Microbiol Infect Dis. 1988;7:69-71.
27. Schonwald S, Barsic B, Klinar I, Gunjaca M. Three-day azithromycin compared with ten-day roxithromycin treatment of atypical pneumonia. Scand J Infect Dis 1994;26:706-10.
28. Young RA, Gonzalez JP, Sorkin EM. Roxithromycin. A review of its antibacterial activity, pharmacokinetic properties and clinical efficacy. Drugs. 1989;37:8-41.
29. de Neeling AJ, Pelt van W, Hendrix MGR, et al. Antibiotica resistentie in Nederland. Deel III: Gram-positieve bacteriën. Infect Bull. 1997;8:211-5.
30. Cramer JA, Mattson RH, Prevey ML, Scheyer RD, Ouellette VL. How often is medication taken as prescribed? A novel assessment technique. JAMA 1989;261:3273-7.
31. Wilson S, Delaney BC, Roalfe A, et al. Randomized controlled trials in primary care: case study. BMJ 2000;321:24-7.
32. Ortqvist A, Hedlund J, Grillner L, et al. Aetiology, outcome and prognostic factors in community-acquired pneumonia requiring hospitalization. Eur Respir J 1990;3:1105-13.
33. Ortqvist A, Valtonen M, Cars O, Wahl M, Saikku P, Jean C. Oral empiric treatment of community-acquired pneumonia. A multicenter, double-blind, randomized study comparing sparfloxacin with roxithromycin. The Scandinavian Sparfloxacin Study Group. Chest. 1996;110:1499-506.
34. Boldy DA, Skidmore SJ, Ayres JG. Acute bronchitis in the community: clinical features, infective factors, changes in pulmonary function and bronchial reactivity to histamine. Respir Med 1990;84:377-85.
35. Trigg CJ, Wilks M, Herdman MJ, Clague JE, Tabaqchali S, Davies RJ. A double-blind comparison of the effects of cefaclor and amoxycillin on respiratory tract and oropharyngeal flora and clinical response in acute exacerbations of bronchitis. Respir Med 1991;85:301-8.
36. Karalus NC, Garrett JE, Lang SD, et al. Roxithromycin 150 mg bid versus amoxicillin 500 mg/clavulanic acid 125 mg tid for the treatment of lower respiratory tract infections in general practice. Infection 1995;23:S15-20.
37. Swartz MN. Use of antimicrobial agents and drug resistance. N Engl J Med 1997;337:491-2.
38. de Neeling AJ. Antibioticagebruik en het optreden van resistentie. National Institute of Public Health and the Environment/Volksgezondheid Toekomst Verkenning 1997;B3:793-800.
39. Seppala H, Klaukka T, Vuopio-Varkila J, et al. The effect of changes in the consumption of macrolide antibiotics on erythromycin resistance in group A streptococci in Finland. Finnish Study Group for Antimicrobial Resistance. N Engl J Med. 1997;337:441-6.
40. Wood MJ. More macrolides. BMJ 1991;303:594-5.
41. Wort SJ, Rogers TR. Community acquired pneumonia in elderly people. Current British guidelines need revision. BMJ. 1998;316:1690.-
42. Bartlett JB. Management of respiratory tract infections. Baltimore, Md: Williams & Wilkins; 1997: 121.
43. King DE, Williams WC, Bishop L, Shechter A. Effectiveness of erythromycin in the treatment of acute bronchitis. J Fam Pract 1996;42:601-5.
44. Lode H, Garau J, Grassi C, et al. Treatment of community-acquired pneumonia: a randomized comparison of sparfloxacin, amoxycillin-clavulanic acid and erythromycin. Eur Respir J 1995;8:1999-2007.
45. Urquhart J. Partial compliance in cardiovascular disease: risk implications. Br J Clin Pract 1994;suppl:2-12.
46. Cramer JA, Ouelette VL, Mattson RH. Effect of microelectronic observation on compliance. Epilepsia 1990;31:617-8.
47. Favre O, Delacretaz E, Badan M, Glauser M, Waeber B. Relationship between the prescriber’s instructions and compliance with antibiotherapy in outpatients treated for an acute infectious disease. J Clin Pharmacol 1997;37:175-8.
48. Urquhart J. Role of patient compliance in clinical pharmacokinetics. A review of recent research. Clin Pharmacokinet. 1994;27:202-15.
Do Delayed Prescriptions Reduce the Use of Antibiotics for the Common Cold?
OBJECTIVE: To test the use of a delayed prescription compared with instructions to take antibiotics immediately in patients presenting to family physicians with upper respiratory tract infections (common colds).
STUDY DESIGN: Randomized controlled single-blind study.
POPULATION: Subjects were 129 patients presenting with the common cold who requested antibiotics or whose physicians thought they wanted them. All patients were in a family practice in Auckland, New Zealand, consisting of 15 physicians (9 male, 6 female) who had completed medical school between 1973 and 1992.
OUTCOMES MEASURED: Outcomes were antibiotic use (taking at least 1 dose of the antibiotic), symptom scores, and responses to the satisfaction questions asked at the end of the study.
RESULTS: Patients in the delayed-prescription group were less likely to use antibiotics (48%, 95% CI, 35%-60%) than were those instructed to take antibiotics immediately (89%, 95% CI, 76%-94%). Daily body temperature was higher in the immediate-prescription group. The lack of difference in the symptom score between the 2 groups suggests that there is no danger in delaying antibiotic prescriptions for the common cold.
CONCLUSIONS: Delayed prescriptions are a safe and effective means of reducing antibiotic consumption in patients with the common cold. Clarification of patient expectations for antibiotics may result in a lower prescription rate. When the patient demands a prescription, delaying its delivery has the potential to provide gentle education.
- Delaying the prescription of antibiotics reduces antibiotic intake in patients who insist on taking antibiotics for the common cold.
- Giving a delayed prescription and asking the patient to return to the office to fill it may reduce antibiotic consumption further.
Antibiotics continue to be commonly used to treat the common cold1-3 despite longstanding doubts about their efficacy4,5 or ability to prevent complications.6 Upper respiratory tract infection (URTI) is the most common reason for a new consultation in family practice and the second most common reason for the prescribing of an antibiotic.7 Reported prescription rates for antibiotics for treating the common cold range from 17% to 60% in the United Kingdom and United States and 78% in New Zealand.1,8 Ineffective but widespread use of antibiotics is not only a poor use of health care funds but also a cause of morbidity (from adverse effects) and the development of resistant strains of bacteria.8-10
A promising technique to reduce antibiotic use is the delayed prescription. The only published randomized controlled trials of delayed prescription use examined its effect for the treatment of sore throat, acute childhood otitis media, and cough.11-13 In the sore throat study, antibiotics were used by 99% of a group given antibiotics, by 13% of a group not offered any, and 31% of a group given a prescription to be taken after 3 days if symptoms persisted. The authors of the otitis media study noted a 66% reduction of antibiotic use in the delayed-prescription group, who had more symptoms, signs, and sleepless nights than the “take-now” group. In the study with acute cough, the use of antibiotics was reduced by 55% in the group with delayed prescriptions. Our study, undertaken in winter 2000, tested the use of a delayed prescription versus instructions to take antibiotics immediately in patients presenting to general practitioners with URTIs.
Methods
The 15 family physicians (FPs) who recruited patients for this study were selected primarily from a group who had reported in a previous study that they frequently gave delayed prescriptions to patients.14 Ethical approval was given by the Auckland Ethics Committee.
Inclusion and exclusion criteria
Patients of any age were eligible if they presented to their FP with a new case of the common cold and either the FP thought the patient wanted antibiotics or the patient stated that desire. For young children, the parents indicated whether or not they wanted antibiotics. FPs were provided with the diagnostic criteria for URTI from the International Classification of Health Problems in Primary Care (ICHPPC-2), which defines an URTI as including the presence of acute inflammation of the nasal or pharyngeal mucosa in the absence of other specifically defined respiratory infection.15
Patients were excluded if they had suspected streptococcal tonsillitis, sinusitis, bronchitis, or pneumonia. Also excluded were patients with lower respiratory signs, those who needed an x-ray, those with a past history of rheumatic fever, and those who had experienced a serious illness or any antibiotic treatment in the previous 2 weeks. Throat cultures were not required. Eligible patients were invited to participate and signed an informed consent form. Ideally, the offer to join the study was to be made to consecutive patients, but this did not occur in all practices.
Interventions
The intervention group was given a prescription for antibiotics with instructions to fill it after 3 days if symptoms failed to improve. The control group received a prescription with instructions to start taking the antibiotic medication immediately. General practitioners prescribed any antibiotic that they considered most appropriate. In both groups, patients were advised to return to see their doctor if symptoms worsened.
Data collection
At recruitment, the patient’s temperature was taken and the list of symptoms was recorded in duplicate. The patient was asked to take his or her temperature daily with a digital thermometer (Assess Diagnostics Medical Industries Australia Pty. Ltd., 148-152 Regent St., Redfern NSW 2016, Australia) that was provided. Patients were given symptom checklists to complete daily for 10 days after the visit. Symptoms listed were dry cough, night cough, sneezing, sore throat, pain on inspiration, pain when coughing, hoarse voice, headache, staying home from work or unable to do normal daily tasks, unwell, diarrhea, vomiting, and nausea without vomiting. Patients were instructed to record whether they had a runny nose with clear secretions (“clear runny nose”), stuffy (blocked) nose, or runny nose with dark secretions (“colored runny nose”). Patients further checked off whether they had clear sputum only in the morning, colored sputum in the morning, clear sputum all day, or colored sputum all day.
A point was allocated for each symptom. The maximum possible score was 15.16 A study assistant telephoned all participants on day 3, day 7, and day 10 to ask about their temperature and symptoms. At the end of the study, the research assistant asked participants about their level of satisfaction with the consultation, using the questions and scoring system devised by Little et al.11 Although no data were collected about revisit rates, data were collected about the patient’s intention to visit a physician for the next cold.
Outcomes and analysis
The outcomes were antibiotic use, symptom scores, and the responses to satisfaction-related questions asked at the end of the study. Outcomes of intervention and control groups were compared on an intention-to-treat basis.17 Because of the repeated measures, the temperatures and summary scores of symptoms were determined with the general linear mixed model that uses Statistical Analysis System (SAS, Cary, N.C.), version 8, for Windows. Chi-square determinations and the Mantel-Haenszel odds ratio were performed for discrete variables using Statistical Package for the Social Sciences (SPSS), version 10, for Windows. When the final data point for continuous variables was missing, the last recorded value was analyzed as the current value. For discrete values, worst-case and best-case scenarios were performed. The sample size of 212 patients was based on a reduction from 60% of antibiotics consumed immediately to 40% in the delayed-prescription group (alpha 0.05, beta 0.2).
Allocation and masking
The unit of randomization was the patient. N.K., who was not a recruiter, generated the allocation schedule with Excel 97. Letters containing instructions for the intervention strategy pertaining to each patient or allocating the patient to the control group were placed in opaque envelopes and sealed. The study number was written on the outside of the envelope according to the randomization schedule. The envelopes were then given to the research assistant, who placed them in a large brown envelope with the consent forms and information sheets for recruiting family physicians. The recruiters opened each envelope immediately after recruitment of each patient.
Patients were told only that they would be given 1 of 2 sets of instruction about taking antibiotics for their colds. Participants read an information sheet and then completed a consent form. Thus, patients were blind to what the other group would take. The research assistant asked the participants not to tell her which instructions they had been given for taking antibiotics. If both types of blinding had been followed correctly, this study could be described as double blinded. However, because we cannot confirm the effectiveness of blinding the research assistant, we prefer to call this study single blinded. One copy of the allocation schedule was kept in the office of N.K.; another was kept by the departmental secretary.
Results
The Figure shows the trial profile summarizing participant flow. The baseline characteristics of the patients in both groups were similar (Table 1).
Patients in the delayed prescription group were less likely to use antibiotics (48%, 95% CI, 35%-60%) than those in the “take antibiotics now” group (89%, 95% CI, 76%-94%). The odds ratio for not using antibiotics was 0.12 (95% CI, 0.05 to 0.29) using intention-to-treat analysis. By antibiotic use, we mean that the patients consumed at least 1 dose of the antibiotic medication.
Table 2 shows the outcomes for temperature and symptom score using an intention-to-treat model. The general linear model for repeated measures found average temperature significantly higher (by 0.2°C) in the immediate antibiotic use group (P = .039) and no significant difference for the symptom score (P = .29). Reanalyzing with only collected data (without intention to treat) found no significant differences from the intention-to-treat analysis. The power to detect a difference in symptom score of 30% is 80% for an alpha of 0.05, assuming that the study gives measures of variation of the symptom score that are close to the real values. There were no significant adverse effects from taking antibiotics or not. Patients’ beliefs and intentions were not affected by the interventions (Table 3).
TABLE 1
BASELINE CHARACTERISTICS AND SYMPTOMS OF THE 2 GROUPS
| Immediate Prescription | Delayed Prescription | |
|---|---|---|
| Characteristics | ||
| Number of patients | 62 | 67 |
| Male / female | 22 / 40 | 26 / 41 |
| Mean age (SD) | 27.9 years (3.1) | 23.6 years (2.7) |
| Cigarettes per day | 1.26 (0.47) | 1.17 (0.54) |
| Mean temperature (SD) | 36.9 (0.08) | 36.7 (0.08) |
| Days of illness before doctor’s visit | 4.5 (0.5) | 5.0 (0.7) |
| Total symptom score (SD) | 5.1 (0.28) | 5.4 (0.22) |
| Symptoms | ||
| Dry cough | 31 | 35 |
| Productive cough | ||
| Cough with clear sputum in morning | 8 | 5 |
| Cough with clear sputum all day | 6 | 7 |
| Cough with colored sputum in morning | 8 | 7 |
| Cough with colored sputum all day | 10 | 16 |
| Nasal symptoms | ||
| Clear rhinitis | 27 | 22 |
| Blocked or stuff nose | 21 | 26 |
| Colored runny nose | 12 | 15 |
| Night cough | 29 | 37 |
| Sneezing | 31 | 26 |
| Sore throat | 38 | 31 |
| Pain in chest on breathing in | 6 | 7 |
| Pain on coughing | 17 | 13 |
| Hoarse voice | 28 | 26 |
| Headache | 26 | 28 |
| Unwell* | 44* | 56* |
| Limitation of activities | 25 | 23 |
| Nausea | 7 | 6 |
| Vomiting | 5 | 6 |
| Diarrhea | 6 | 4 |
| * Pearson chi-square 9.134, 1 degree of freedom, P = .0025, 2 sided. | ||
| The number of patients recruited per family physician ranged from 1 to 40. | ||
| SD denotes standard deviation. | ||
TABLE 2
OUTCOMES AT BASELINE AND ON DAYS 3, 7, AND 10
| Immediate Prescription | Delayed Prescription | |
|---|---|---|
| Temperature (C)* | ||
| Baseline | 36.9 (0.1) | 36.7 (0.1) |
| Day 3 | 36.4 (0.1) | 36.2 (0.1) |
| Day 7 | 36.4 (0.1) | 36.1 (0.1) |
| Day 10 | 36.3 (0.1) | 36.1 (0.1) |
| Symptom Score (1 point for each of 15 symptoms in Table 1)* | ||
| Baseline | 5.1 (0.3) | 5.4 (0.2) |
| Day 3 | 2.9 (0.2) | 3.6 (0.3) |
| Day 7 | 1.8 (0.2) | 2.0 (0.3) |
| Day 10 | 1.4 (0.2) | 1.5 (0.2) |
| *The general linear model for repeated measures found the significantly higher temperature of 0.2°C in the immediate-use antibiotic versus that in the delayed-use group (P = .039) and no significant difference for the symptom score (P = .29). | ||
TABLE 3
SATISFACTION, ATTITUDES, AND BELIEFS
| Immediate Prescription | Delayed Prescription | P | |
|---|---|---|---|
| Satisfaction with the consultation; ie, score (1+2) / (1+2+3+4) | 58 / 62 (94%) | 64 / 67 (96%) | .71 * |
| Doctors dealt with worries | 58 / 62 (94%) | 64 / 67 (96%) | .71 * |
| Likely to see doctors for next common cold | 40 / 62 (65%) | 49 / 67 (73%) | .343 † |
| Antibiotics are effective | 47 / 62 (76%) | 51 / 67 (76%) | 1.0 † |
| Importance of seeing doctor to have time off from work or school | 19 / 62 (31%) | 13 / 54 (19%) | .16 † |
| Importance of seeing doctor to explain illness to friends and family | 6 / 62 (10%) | 7 / 60 (12%) | 1.00 † |
| * Fisher’s exact test. | |||
| † Chi-square test. | |||
| 1= very satisfied; 2 = moderately satisfied; 3 = slightly satisfied; 4 = not at all satisfied. For this table, groups responding 1 and 2 have been combined and groups responding 3 and 4 have been combined. | |||
FIGURE
PROGRESS OF PATIENTS THROUGH THE TRIAL
Discussion
We believe that this is the first published randomized controlled trial of delayed prescriptions for antibiotics for the common cold. Asking patients to wait for 3 days before taking their medication reduced consumption of antibiotics from 89% to 48% (P = .0001). The 41% reduction is smaller than that found in the study by Little and colleagues11 of 1% in the take-now group and 69% in the delayed-prescription group. Patients in the UK study returned to the office in 3 days to pick up their prescription, whereas the New Zealand group received the prescription with instructions to wait 3 days before filling it. If the third day had occurred on a weekend, the patients would have had to seek assistance from an after-hours clinic, thereby incurring a direct patient charge.
Our study assessed only the effect of delayed prescriptions, whereas the study by Little and colleagues tested the combined effect of a delayed prescription and the barrier of having to return to the clinic to obtain the prescription. Furthermore, our approach may be more acceptable to a wider group of doctors and patients, although at the expense of a higher consumption rate.
The external validity (generalizability) of this study is difficult to assess. As with the study by Little and colleagues,11 the FPs had different rates of recruitment. One investigator in the current study (B.A.) kept a list of all patients who presented to him with symptoms of the common cold. Of the 44 who were potentially eligible, 4 refused to be part of the study and 10 had other medical problems (eg, heart transplant, previous lung removal) that would have made inclusion potentially hazardous. Thus, 88% of those who had a common cold and were eligible may have participated in the study.
We do not know how many patients were excluded or refused to participate; the recruiting physicians did not supply this information as requested. There was no systematic difference in symptom scores for patients of the different recruiting doctors. As with the study by Little and colleagues, the doctors found themselves too busy to enroll patients. Such problems are always an issue in general practice research.18 Little and colleagues checked the internal validity of their telephone information; therefore, we did not repeat this. In an earlier study,14 the recruiting family physicians’ preference for using delayed prescriptions may have made them more supportive of the delayed prescription than of the immediate prescription. This issue cannot be resolved, since we needed doctors who would prescribe either a delayed prescription or an immediate prescription in order to recruit enough patients.
The strength of this study lies in the blinded nature of the intervention delivery to the patient, the analysis by intention to treat, and the study’s originality. Our intervention had no impact on patients’ satisfaction, concerns, or the likelihood of seeing a doctor for next illness (Table 3). In contrast, Little11 found that antibiotic use predicted future consultations for sore throat and the belief that antibiotics were effective for sore throat.11,19 The differences may relate to the different patient symptoms and geographical differences (common cold in New Zealand versus sore throat in the UK) or the fact that all patients in our study left with a prescription. Another possible reason is that the patients knew they were participating in a study, whereas in the Little study, the instructions were more vague.11
Doctors often misinterpret patient expectations. Improving communications between patient and doctor may be central to reducing patients’ demand for antibiotics. Britten makes the claim that “all the misunderstandings were associated with lack of patients’ participation in the consultation in terms of voicing of expectations and preferences or the voicing of responses to doctors’ decisions and actions.”20 The need for delayed prescriptions had been highlighted as a solution. We know that the common cold presents no great diagnostic dilemma but can produce enormous treatment dilemmas.21 Barry believes that by changing doctors’ views and helping patients to explain what they want from the office visit may lead to changes in treatment patterns.22 We concur with Little that unless patients are very ill, general practitioners should consider exploring their concerns, explaining the natural history of their illness, and avoiding or delaying prescribing antibiotics.11
We were pleased to see a reduction of antibiotics consumed (89% to 48%). However, 48% still represents a high proportion of patients who consumed antibiotics for an illness that is most unlikely to respond to those drugs. More placebo-controlled randomized trials of antibiotics for respiratory tract infections in the primary care setting are needed. We suggest that FPs clarify patients’ expectation for antibiotics and not prescribe them unless the patient insists. For patients who expect to take antibiotics and cannot be persuaded otherwise, a delayed prescription may be the first step in educating them that these medicines are not routinely required.
Conclusions
Delayed prescriptions are a safe and effective means of reducing antibiotic use in patients with the common cold who want antibiotics. The additional barrier of asking the patient to pick up the prescription from the office if symptoms persist after 3 days may reduce antibiotic use even further. When the patient demands a prescription, delaying its delivery has the potential to provide gentle education that antibiotics are an unnecessary treatment.
Acknowledgments
The authors acknowledge the support of the Health Research Council for funding the study, Tania Milne for data collection, and Alistair Stewart for statistical advice. The authors further thank the participating family physicians and patients for their contribution.
1. McGregor A, Dovey S, Tilyard M. Antibiotic use in upper respiratory tract infections in New Zealand. Fam Pract 1995;12:166-70.
2. Mainous AG, Hueston WJ, Clark JR. Antibiotics and upper respiratory infections: Do some folks think there is a cure for the common cold? J Fam Pract 1996;42:357-61.
3. Ochoa C, Eiros JM, Inglada L, Vallano A, Guerra L. Assessment of antibiotic prescription in acute respiratory infections in adults. The Spanish study group on antibiotic treatment. J Infect Dis 2000;41:73-80.
4. Spector SL. The common cold: current therapy and natural history. J Allergy Clin Immunol 1995;95:1133-8.
5. Arroll B, Kenealy T. Antibiotics for the common cold (Cochrane Review). The Cochrane Library, issue 4, 2000. Oxford, England: Update Software.
6. Gadomski AM. Potential interventions for preventing pneumonia among young children: lack of effect of antibiotic treatment for upper respiratory infections. Pediatr Infect Dis J 1993;12:115-20.
7. McAvoy B, Davis P, Raymont A, Gribben B. The Waikato Medical Care Survey. N Z Med J 1994;107:387-433.
8. Carrie AC, Zhanel CG. Antibacterial use in community practice: assessing quantity, indications and appropriateness and relationship to the development of resistant bacteria. Drugs 1999;57:871-81.
9. Arason VA, Kristinsson KG, Sigurdsson JA, Stefansdottir G, Molstad S, Gudmundsson S. Do antimicrobials increase the carriage rate of penicillin resistant pneumococci in children? Cross-sectional prevalence study. BMJ 1996;313:387-91.
10. Verkatesum P, Innes JA. Antibiotic resistance in common acute respiratory pathogens. Thorax 1995;50:481-3.
11. Little P, Williamson I, Warner G, Gould C, Gantley M, Kinmouth AL. Open randomised trial of prescribing strategies in managing sore throat. BMJ 1997;314:722-7.
12. Little P, Gould C, Williamson I, Moore M, Warner G, Dunleavey J. Pragmatic randomised controlled trial of two prescribing strategies for childhood acute otitis media. BMJ 2001;322:336-42.
13. Dowell J, Pitkethly M, Bain J, Martin S. A randomised controlled trial as a strategy for managing uncomplicated respiratory tract infection in primary care. Br J Gen Pract 2001;51:200-5.
14. Arroll B, Goodyear-Smith F. General practitioners management of URTIs: when are antibiotics prescribed? N Z Med J 2000;113:493-6.
15. International Classification of Health Problems in Primary Care (ICHPPC-2). International classification of primary care. Oxford, England: Oxford University Press; 1998.
16. Kaiser L, Lew D, Hirschel B, et al. Effects of antibiotic treatment in the subset of common cold patients who have bacteria in nasopharyngeal secretions. Lancet 1996;347:1507-10.
17. Hollis S, Campbell F. What is meant by intention to treat analysis? Survey of published randomised controlled trials. BMJ 1999;319:670-4.
18. McAvoy BR, Kaner EF. General practice postal surveys: a questionnaire too far? BMJ 1996;313:732-3.
19. Little P, Gould C, Williamson I, Warner G, Gantley M, Kinmouth AL. Reattendance and complications in a randomised trial of prescribing strategies for sore throat: the medicalising effect of prescribing antibiotics. BMJ 1997;315:350-2.
20. Britten N, Stevenson FA, Barry CA, Barber N, Bradley CP. Misunderstandings in prescribing decisions in general practice. BMJ 2000;320:484-8.
21. Butler CC, Rollnick S, Pill R, Maggs-Rapport F, Stott N. Understanding the culture of prescribing: qualitative study of general practitioners and patients’ perceptions of antibiotics for sore throats. BMJ 1998;317:637-42.
22. Barry CA, Bradley CP, Britten N, Stevenson FA, Barber N. Patients’ unvoiced agendas in general practice consultations: qualitative study. BMJ 2000;320:1246-50.
OBJECTIVE: To test the use of a delayed prescription compared with instructions to take antibiotics immediately in patients presenting to family physicians with upper respiratory tract infections (common colds).
STUDY DESIGN: Randomized controlled single-blind study.
POPULATION: Subjects were 129 patients presenting with the common cold who requested antibiotics or whose physicians thought they wanted them. All patients were in a family practice in Auckland, New Zealand, consisting of 15 physicians (9 male, 6 female) who had completed medical school between 1973 and 1992.
OUTCOMES MEASURED: Outcomes were antibiotic use (taking at least 1 dose of the antibiotic), symptom scores, and responses to the satisfaction questions asked at the end of the study.
RESULTS: Patients in the delayed-prescription group were less likely to use antibiotics (48%, 95% CI, 35%-60%) than were those instructed to take antibiotics immediately (89%, 95% CI, 76%-94%). Daily body temperature was higher in the immediate-prescription group. The lack of difference in the symptom score between the 2 groups suggests that there is no danger in delaying antibiotic prescriptions for the common cold.
CONCLUSIONS: Delayed prescriptions are a safe and effective means of reducing antibiotic consumption in patients with the common cold. Clarification of patient expectations for antibiotics may result in a lower prescription rate. When the patient demands a prescription, delaying its delivery has the potential to provide gentle education.
- Delaying the prescription of antibiotics reduces antibiotic intake in patients who insist on taking antibiotics for the common cold.
- Giving a delayed prescription and asking the patient to return to the office to fill it may reduce antibiotic consumption further.
Antibiotics continue to be commonly used to treat the common cold1-3 despite longstanding doubts about their efficacy4,5 or ability to prevent complications.6 Upper respiratory tract infection (URTI) is the most common reason for a new consultation in family practice and the second most common reason for the prescribing of an antibiotic.7 Reported prescription rates for antibiotics for treating the common cold range from 17% to 60% in the United Kingdom and United States and 78% in New Zealand.1,8 Ineffective but widespread use of antibiotics is not only a poor use of health care funds but also a cause of morbidity (from adverse effects) and the development of resistant strains of bacteria.8-10
A promising technique to reduce antibiotic use is the delayed prescription. The only published randomized controlled trials of delayed prescription use examined its effect for the treatment of sore throat, acute childhood otitis media, and cough.11-13 In the sore throat study, antibiotics were used by 99% of a group given antibiotics, by 13% of a group not offered any, and 31% of a group given a prescription to be taken after 3 days if symptoms persisted. The authors of the otitis media study noted a 66% reduction of antibiotic use in the delayed-prescription group, who had more symptoms, signs, and sleepless nights than the “take-now” group. In the study with acute cough, the use of antibiotics was reduced by 55% in the group with delayed prescriptions. Our study, undertaken in winter 2000, tested the use of a delayed prescription versus instructions to take antibiotics immediately in patients presenting to general practitioners with URTIs.
Methods
The 15 family physicians (FPs) who recruited patients for this study were selected primarily from a group who had reported in a previous study that they frequently gave delayed prescriptions to patients.14 Ethical approval was given by the Auckland Ethics Committee.
Inclusion and exclusion criteria
Patients of any age were eligible if they presented to their FP with a new case of the common cold and either the FP thought the patient wanted antibiotics or the patient stated that desire. For young children, the parents indicated whether or not they wanted antibiotics. FPs were provided with the diagnostic criteria for URTI from the International Classification of Health Problems in Primary Care (ICHPPC-2), which defines an URTI as including the presence of acute inflammation of the nasal or pharyngeal mucosa in the absence of other specifically defined respiratory infection.15
Patients were excluded if they had suspected streptococcal tonsillitis, sinusitis, bronchitis, or pneumonia. Also excluded were patients with lower respiratory signs, those who needed an x-ray, those with a past history of rheumatic fever, and those who had experienced a serious illness or any antibiotic treatment in the previous 2 weeks. Throat cultures were not required. Eligible patients were invited to participate and signed an informed consent form. Ideally, the offer to join the study was to be made to consecutive patients, but this did not occur in all practices.
Interventions
The intervention group was given a prescription for antibiotics with instructions to fill it after 3 days if symptoms failed to improve. The control group received a prescription with instructions to start taking the antibiotic medication immediately. General practitioners prescribed any antibiotic that they considered most appropriate. In both groups, patients were advised to return to see their doctor if symptoms worsened.
Data collection
At recruitment, the patient’s temperature was taken and the list of symptoms was recorded in duplicate. The patient was asked to take his or her temperature daily with a digital thermometer (Assess Diagnostics Medical Industries Australia Pty. Ltd., 148-152 Regent St., Redfern NSW 2016, Australia) that was provided. Patients were given symptom checklists to complete daily for 10 days after the visit. Symptoms listed were dry cough, night cough, sneezing, sore throat, pain on inspiration, pain when coughing, hoarse voice, headache, staying home from work or unable to do normal daily tasks, unwell, diarrhea, vomiting, and nausea without vomiting. Patients were instructed to record whether they had a runny nose with clear secretions (“clear runny nose”), stuffy (blocked) nose, or runny nose with dark secretions (“colored runny nose”). Patients further checked off whether they had clear sputum only in the morning, colored sputum in the morning, clear sputum all day, or colored sputum all day.
A point was allocated for each symptom. The maximum possible score was 15.16 A study assistant telephoned all participants on day 3, day 7, and day 10 to ask about their temperature and symptoms. At the end of the study, the research assistant asked participants about their level of satisfaction with the consultation, using the questions and scoring system devised by Little et al.11 Although no data were collected about revisit rates, data were collected about the patient’s intention to visit a physician for the next cold.
Outcomes and analysis
The outcomes were antibiotic use, symptom scores, and the responses to satisfaction-related questions asked at the end of the study. Outcomes of intervention and control groups were compared on an intention-to-treat basis.17 Because of the repeated measures, the temperatures and summary scores of symptoms were determined with the general linear mixed model that uses Statistical Analysis System (SAS, Cary, N.C.), version 8, for Windows. Chi-square determinations and the Mantel-Haenszel odds ratio were performed for discrete variables using Statistical Package for the Social Sciences (SPSS), version 10, for Windows. When the final data point for continuous variables was missing, the last recorded value was analyzed as the current value. For discrete values, worst-case and best-case scenarios were performed. The sample size of 212 patients was based on a reduction from 60% of antibiotics consumed immediately to 40% in the delayed-prescription group (alpha 0.05, beta 0.2).
Allocation and masking
The unit of randomization was the patient. N.K., who was not a recruiter, generated the allocation schedule with Excel 97. Letters containing instructions for the intervention strategy pertaining to each patient or allocating the patient to the control group were placed in opaque envelopes and sealed. The study number was written on the outside of the envelope according to the randomization schedule. The envelopes were then given to the research assistant, who placed them in a large brown envelope with the consent forms and information sheets for recruiting family physicians. The recruiters opened each envelope immediately after recruitment of each patient.
Patients were told only that they would be given 1 of 2 sets of instruction about taking antibiotics for their colds. Participants read an information sheet and then completed a consent form. Thus, patients were blind to what the other group would take. The research assistant asked the participants not to tell her which instructions they had been given for taking antibiotics. If both types of blinding had been followed correctly, this study could be described as double blinded. However, because we cannot confirm the effectiveness of blinding the research assistant, we prefer to call this study single blinded. One copy of the allocation schedule was kept in the office of N.K.; another was kept by the departmental secretary.
Results
The Figure shows the trial profile summarizing participant flow. The baseline characteristics of the patients in both groups were similar (Table 1).
Patients in the delayed prescription group were less likely to use antibiotics (48%, 95% CI, 35%-60%) than those in the “take antibiotics now” group (89%, 95% CI, 76%-94%). The odds ratio for not using antibiotics was 0.12 (95% CI, 0.05 to 0.29) using intention-to-treat analysis. By antibiotic use, we mean that the patients consumed at least 1 dose of the antibiotic medication.
Table 2 shows the outcomes for temperature and symptom score using an intention-to-treat model. The general linear model for repeated measures found average temperature significantly higher (by 0.2°C) in the immediate antibiotic use group (P = .039) and no significant difference for the symptom score (P = .29). Reanalyzing with only collected data (without intention to treat) found no significant differences from the intention-to-treat analysis. The power to detect a difference in symptom score of 30% is 80% for an alpha of 0.05, assuming that the study gives measures of variation of the symptom score that are close to the real values. There were no significant adverse effects from taking antibiotics or not. Patients’ beliefs and intentions were not affected by the interventions (Table 3).
TABLE 1
BASELINE CHARACTERISTICS AND SYMPTOMS OF THE 2 GROUPS
| Immediate Prescription | Delayed Prescription | |
|---|---|---|
| Characteristics | ||
| Number of patients | 62 | 67 |
| Male / female | 22 / 40 | 26 / 41 |
| Mean age (SD) | 27.9 years (3.1) | 23.6 years (2.7) |
| Cigarettes per day | 1.26 (0.47) | 1.17 (0.54) |
| Mean temperature (SD) | 36.9 (0.08) | 36.7 (0.08) |
| Days of illness before doctor’s visit | 4.5 (0.5) | 5.0 (0.7) |
| Total symptom score (SD) | 5.1 (0.28) | 5.4 (0.22) |
| Symptoms | ||
| Dry cough | 31 | 35 |
| Productive cough | ||
| Cough with clear sputum in morning | 8 | 5 |
| Cough with clear sputum all day | 6 | 7 |
| Cough with colored sputum in morning | 8 | 7 |
| Cough with colored sputum all day | 10 | 16 |
| Nasal symptoms | ||
| Clear rhinitis | 27 | 22 |
| Blocked or stuff nose | 21 | 26 |
| Colored runny nose | 12 | 15 |
| Night cough | 29 | 37 |
| Sneezing | 31 | 26 |
| Sore throat | 38 | 31 |
| Pain in chest on breathing in | 6 | 7 |
| Pain on coughing | 17 | 13 |
| Hoarse voice | 28 | 26 |
| Headache | 26 | 28 |
| Unwell* | 44* | 56* |
| Limitation of activities | 25 | 23 |
| Nausea | 7 | 6 |
| Vomiting | 5 | 6 |
| Diarrhea | 6 | 4 |
| * Pearson chi-square 9.134, 1 degree of freedom, P = .0025, 2 sided. | ||
| The number of patients recruited per family physician ranged from 1 to 40. | ||
| SD denotes standard deviation. | ||
TABLE 2
OUTCOMES AT BASELINE AND ON DAYS 3, 7, AND 10
| Immediate Prescription | Delayed Prescription | |
|---|---|---|
| Temperature (C)* | ||
| Baseline | 36.9 (0.1) | 36.7 (0.1) |
| Day 3 | 36.4 (0.1) | 36.2 (0.1) |
| Day 7 | 36.4 (0.1) | 36.1 (0.1) |
| Day 10 | 36.3 (0.1) | 36.1 (0.1) |
| Symptom Score (1 point for each of 15 symptoms in Table 1)* | ||
| Baseline | 5.1 (0.3) | 5.4 (0.2) |
| Day 3 | 2.9 (0.2) | 3.6 (0.3) |
| Day 7 | 1.8 (0.2) | 2.0 (0.3) |
| Day 10 | 1.4 (0.2) | 1.5 (0.2) |
| *The general linear model for repeated measures found the significantly higher temperature of 0.2°C in the immediate-use antibiotic versus that in the delayed-use group (P = .039) and no significant difference for the symptom score (P = .29). | ||
TABLE 3
SATISFACTION, ATTITUDES, AND BELIEFS
| Immediate Prescription | Delayed Prescription | P | |
|---|---|---|---|
| Satisfaction with the consultation; ie, score (1+2) / (1+2+3+4) | 58 / 62 (94%) | 64 / 67 (96%) | .71 * |
| Doctors dealt with worries | 58 / 62 (94%) | 64 / 67 (96%) | .71 * |
| Likely to see doctors for next common cold | 40 / 62 (65%) | 49 / 67 (73%) | .343 † |
| Antibiotics are effective | 47 / 62 (76%) | 51 / 67 (76%) | 1.0 † |
| Importance of seeing doctor to have time off from work or school | 19 / 62 (31%) | 13 / 54 (19%) | .16 † |
| Importance of seeing doctor to explain illness to friends and family | 6 / 62 (10%) | 7 / 60 (12%) | 1.00 † |
| * Fisher’s exact test. | |||
| † Chi-square test. | |||
| 1= very satisfied; 2 = moderately satisfied; 3 = slightly satisfied; 4 = not at all satisfied. For this table, groups responding 1 and 2 have been combined and groups responding 3 and 4 have been combined. | |||
FIGURE
PROGRESS OF PATIENTS THROUGH THE TRIAL
Discussion
We believe that this is the first published randomized controlled trial of delayed prescriptions for antibiotics for the common cold. Asking patients to wait for 3 days before taking their medication reduced consumption of antibiotics from 89% to 48% (P = .0001). The 41% reduction is smaller than that found in the study by Little and colleagues11 of 1% in the take-now group and 69% in the delayed-prescription group. Patients in the UK study returned to the office in 3 days to pick up their prescription, whereas the New Zealand group received the prescription with instructions to wait 3 days before filling it. If the third day had occurred on a weekend, the patients would have had to seek assistance from an after-hours clinic, thereby incurring a direct patient charge.
Our study assessed only the effect of delayed prescriptions, whereas the study by Little and colleagues tested the combined effect of a delayed prescription and the barrier of having to return to the clinic to obtain the prescription. Furthermore, our approach may be more acceptable to a wider group of doctors and patients, although at the expense of a higher consumption rate.
The external validity (generalizability) of this study is difficult to assess. As with the study by Little and colleagues,11 the FPs had different rates of recruitment. One investigator in the current study (B.A.) kept a list of all patients who presented to him with symptoms of the common cold. Of the 44 who were potentially eligible, 4 refused to be part of the study and 10 had other medical problems (eg, heart transplant, previous lung removal) that would have made inclusion potentially hazardous. Thus, 88% of those who had a common cold and were eligible may have participated in the study.
We do not know how many patients were excluded or refused to participate; the recruiting physicians did not supply this information as requested. There was no systematic difference in symptom scores for patients of the different recruiting doctors. As with the study by Little and colleagues, the doctors found themselves too busy to enroll patients. Such problems are always an issue in general practice research.18 Little and colleagues checked the internal validity of their telephone information; therefore, we did not repeat this. In an earlier study,14 the recruiting family physicians’ preference for using delayed prescriptions may have made them more supportive of the delayed prescription than of the immediate prescription. This issue cannot be resolved, since we needed doctors who would prescribe either a delayed prescription or an immediate prescription in order to recruit enough patients.
The strength of this study lies in the blinded nature of the intervention delivery to the patient, the analysis by intention to treat, and the study’s originality. Our intervention had no impact on patients’ satisfaction, concerns, or the likelihood of seeing a doctor for next illness (Table 3). In contrast, Little11 found that antibiotic use predicted future consultations for sore throat and the belief that antibiotics were effective for sore throat.11,19 The differences may relate to the different patient symptoms and geographical differences (common cold in New Zealand versus sore throat in the UK) or the fact that all patients in our study left with a prescription. Another possible reason is that the patients knew they were participating in a study, whereas in the Little study, the instructions were more vague.11
Doctors often misinterpret patient expectations. Improving communications between patient and doctor may be central to reducing patients’ demand for antibiotics. Britten makes the claim that “all the misunderstandings were associated with lack of patients’ participation in the consultation in terms of voicing of expectations and preferences or the voicing of responses to doctors’ decisions and actions.”20 The need for delayed prescriptions had been highlighted as a solution. We know that the common cold presents no great diagnostic dilemma but can produce enormous treatment dilemmas.21 Barry believes that by changing doctors’ views and helping patients to explain what they want from the office visit may lead to changes in treatment patterns.22 We concur with Little that unless patients are very ill, general practitioners should consider exploring their concerns, explaining the natural history of their illness, and avoiding or delaying prescribing antibiotics.11
We were pleased to see a reduction of antibiotics consumed (89% to 48%). However, 48% still represents a high proportion of patients who consumed antibiotics for an illness that is most unlikely to respond to those drugs. More placebo-controlled randomized trials of antibiotics for respiratory tract infections in the primary care setting are needed. We suggest that FPs clarify patients’ expectation for antibiotics and not prescribe them unless the patient insists. For patients who expect to take antibiotics and cannot be persuaded otherwise, a delayed prescription may be the first step in educating them that these medicines are not routinely required.
Conclusions
Delayed prescriptions are a safe and effective means of reducing antibiotic use in patients with the common cold who want antibiotics. The additional barrier of asking the patient to pick up the prescription from the office if symptoms persist after 3 days may reduce antibiotic use even further. When the patient demands a prescription, delaying its delivery has the potential to provide gentle education that antibiotics are an unnecessary treatment.
Acknowledgments
The authors acknowledge the support of the Health Research Council for funding the study, Tania Milne for data collection, and Alistair Stewart for statistical advice. The authors further thank the participating family physicians and patients for their contribution.
1. McGregor A, Dovey S, Tilyard M. Antibiotic use in upper respiratory tract infections in New Zealand. Fam Pract 1995;12:166-70.
2. Mainous AG, Hueston WJ, Clark JR. Antibiotics and upper respiratory infections: Do some folks think there is a cure for the common cold? J Fam Pract 1996;42:357-61.
3. Ochoa C, Eiros JM, Inglada L, Vallano A, Guerra L. Assessment of antibiotic prescription in acute respiratory infections in adults. The Spanish study group on antibiotic treatment. J Infect Dis 2000;41:73-80.
4. Spector SL. The common cold: current therapy and natural history. J Allergy Clin Immunol 1995;95:1133-8.
5. Arroll B, Kenealy T. Antibiotics for the common cold (Cochrane Review). The Cochrane Library, issue 4, 2000. Oxford, England: Update Software.
6. Gadomski AM. Potential interventions for preventing pneumonia among young children: lack of effect of antibiotic treatment for upper respiratory infections. Pediatr Infect Dis J 1993;12:115-20.
7. McAvoy B, Davis P, Raymont A, Gribben B. The Waikato Medical Care Survey. N Z Med J 1994;107:387-433.
8. Carrie AC, Zhanel CG. Antibacterial use in community practice: assessing quantity, indications and appropriateness and relationship to the development of resistant bacteria. Drugs 1999;57:871-81.
9. Arason VA, Kristinsson KG, Sigurdsson JA, Stefansdottir G, Molstad S, Gudmundsson S. Do antimicrobials increase the carriage rate of penicillin resistant pneumococci in children? Cross-sectional prevalence study. BMJ 1996;313:387-91.
10. Verkatesum P, Innes JA. Antibiotic resistance in common acute respiratory pathogens. Thorax 1995;50:481-3.
11. Little P, Williamson I, Warner G, Gould C, Gantley M, Kinmouth AL. Open randomised trial of prescribing strategies in managing sore throat. BMJ 1997;314:722-7.
12. Little P, Gould C, Williamson I, Moore M, Warner G, Dunleavey J. Pragmatic randomised controlled trial of two prescribing strategies for childhood acute otitis media. BMJ 2001;322:336-42.
13. Dowell J, Pitkethly M, Bain J, Martin S. A randomised controlled trial as a strategy for managing uncomplicated respiratory tract infection in primary care. Br J Gen Pract 2001;51:200-5.
14. Arroll B, Goodyear-Smith F. General practitioners management of URTIs: when are antibiotics prescribed? N Z Med J 2000;113:493-6.
15. International Classification of Health Problems in Primary Care (ICHPPC-2). International classification of primary care. Oxford, England: Oxford University Press; 1998.
16. Kaiser L, Lew D, Hirschel B, et al. Effects of antibiotic treatment in the subset of common cold patients who have bacteria in nasopharyngeal secretions. Lancet 1996;347:1507-10.
17. Hollis S, Campbell F. What is meant by intention to treat analysis? Survey of published randomised controlled trials. BMJ 1999;319:670-4.
18. McAvoy BR, Kaner EF. General practice postal surveys: a questionnaire too far? BMJ 1996;313:732-3.
19. Little P, Gould C, Williamson I, Warner G, Gantley M, Kinmouth AL. Reattendance and complications in a randomised trial of prescribing strategies for sore throat: the medicalising effect of prescribing antibiotics. BMJ 1997;315:350-2.
20. Britten N, Stevenson FA, Barry CA, Barber N, Bradley CP. Misunderstandings in prescribing decisions in general practice. BMJ 2000;320:484-8.
21. Butler CC, Rollnick S, Pill R, Maggs-Rapport F, Stott N. Understanding the culture of prescribing: qualitative study of general practitioners and patients’ perceptions of antibiotics for sore throats. BMJ 1998;317:637-42.
22. Barry CA, Bradley CP, Britten N, Stevenson FA, Barber N. Patients’ unvoiced agendas in general practice consultations: qualitative study. BMJ 2000;320:1246-50.
Oat Ingestion Reduces Systolic and Diastolic Blood Pressure in Patients with Mild or Borderline Hypertension: A Pilot Trial
OBJECTIVES: We assessed the short-term antihypertensive effects of soluble fiber-rich whole oat cereals when added to a standard American diet. In addition, multiple assessments of insulin sensitivity were conducted.
STUDY DESIGN: This was a randomized, controlled, parallel-group pilot study designed to compare an oat cereal group (standardized to 5.52 g/day beta-glucan) to a low-fiber cereal control group (less than 1.0 g/day total fiber) over 6 weeks.
POPULATION: A total of 18 hypertensive and hyperinsulinemic ( ≥10 μU/mL) men and women completed the trial.
OUTCOMES MEASURED: Primary study outcomes were changes in systolic blood pressure (SBP) and diastolic blood pressure (DBP). Secondary outcomes included blood lipid, fasting glucose, and insulin levels and side effects related to elevated blood pressure and increased dietary fiber intake.
RESULTS: The oat cereal group experienced a 7.5 mm Hg reduction in SBP (P < .01) and a 5.5 mm Hg reduction in DBP (P < .02), while there was virtually no change in either SBP or DBP in the control group. In the oat cereal group, a trend was observed for a lower total insulin response to a glucose load, suggesting improved insulin sensitivity. However, this could not be confirmed using estimates from the Bergman Minimal Model, perhaps because of our small sample size. As expected and reported in previous trials, the oats group experienced a significant reduction in both total cholesterol (9%) and low-density lipoprotein cholesterol (14%).
CONCLUSIONS: The addition of oat cereals to the normal diet of persons with hypertension significantly reduces both systolic and diastolic blood pressure. Soluble fiber-rich whole oats may be an effective dietary therapy in the prevention and adjunct treatment of hypertension.
Interest is growing in the use of nonpharmacologic methods for the prevention and management of hypertension. Specifically, the effect of dietary fiber on the incidence and treatment of hypertension has been explored. Epidemiologic studies show that the amount of dietary fiber ingested is inversely related to the incidence of hypertension as well as to systolic blood pressure (SBP) and diastolic blood pressure (DBP) in both hypertensive and normotensive patients.1–5 The results obtained from clinical trials, however, are inconsistent; some report modest blood pressure reductions after increased fiber intake,6–12 while others fail to demonstrate any effect of dietary fiber on blood pressure.13–16 Some animal trials17,18 and human trials19,20 have shown a consistent lowering of blood pressure upon consumption of larger amounts of soluble fiber, suggesting that the antihypertensive effects of fiber may be caused by the soluble fraction and that these effects may be contingent upon the intake of a sufficiently large quantity.
Hypertension often occurs in association with obesity, impaired glucose tolerance, and dyslipidemia. Hyperinsulinemia and insulin resistance are thought to be key pathogenic links among these disturbances.21–23 Studies show that soluble fiber from oats reduces both postprandial blood glucose and insulin levels.24–27 Therefore, we conducted the following pilot trial to investigate the antihypertensive and insulin-modifying effects of oat cereal supplementation in a population of mild and borderline hyperinsulinemic and hypertensive men and women.
Methods
Study protocol
The study participants in this 6-week, randomized, parallel-group, active-controlled pilot trial were recruited by means of local community screenings and mass media advertising. The study protocol was reviewed and approved by the University of Minnesota Institutional Review Board. All participants provided informed consent before official enrollment in the study. One hundred nine men and women aged 20 to 70 were screened for eligibility with a physical exam, medical history, and chemistry and lipid profile (see Table 1 for exclusion criteria). Only generally healthy, untreated hypertensives with average SBP of 130 to 160 mm Hg and DBP of 85 to 100 mm Hg and with at least 1 reading greater than 140/90 as well as moderately elevated levels of fasting insulin (≥10μU/mL) were considered for enrollment. Participants were determined to be eligible only after 2 sets of hypertensive (SBP > 130, DBP > 85) baseline blood pressure readings had been taken 7 days apart and only if all inclusion criteria were fulfilled.
Ultimately, 22 men and women were randomized to either an oat cereal treatment group (standardized to 5.52 g/day beta-glucan) or a low fiber cereal control group (<1 g/day total fiber). Four of these individuals (1 in the treatment and 3 in the control group) discontinued participation because of time constraints. Eighteen healthy, nonsmoking men and women aged 27 to 59 years (44 ± 18; mean, SD) completed the trial. Cereal treatments were isocaloric. Participants were instructed to consume all their cereal (treatment, 137 g; control, 146 g) daily for the next 6 weeks but were allowed to prepare and consume the cereal however and whenever they wished.
Cereal compliance was determined by participant self-report in a daily cereal calendar. In addition, dietary intake was reviewed both at baseline and at the end of the 6-week intervention, using 3-day food records. Side effect data were gathered from participants at baseline and the end of the intervention. Side effects were assessed via a questionnaire consisting of 21 items relating to potential side effects from increased fiber intake (eg, loose stools, flatulence) or hypertension (eg, headaches, dizziness). Participants reported the frequency at which they experienced these side effects on a scale ranging from “never” to “very frequently” (event occurring once or more per day). Each response was assigned a numerical value. Prestudy and post study averages were used in analyses.
Blood Pressure, Plasma Lipid Concentrations, Glucose Metabolism, and Insulin Sensitivity
Blood pressure was measured weekly for each participant for the duration of the study. Each participant reported to the Hypertension and Cholesterol Research Clinic located at the University of Minnesota Medical School at approximately the same time for each blood pressure reading. All readings were obtained in the morning after participants had rested quietly, seated, for at least 5 minutes in an examination room. An examiner who was blinded to the treatment groups took readings on the right arm using a mercury column sphygmomanometer (Korotkoff phase V for DBP). Standard cuff size was used unless upper arm circumference exceeded 31 cm, in which case the examiner used a large cuff with 15 x 35-cm bladders. Measurements were repeated 4 times in 2-minute intervals. The mean of the last 3 readings was calculated and used in analyses.
To determine plasma lipid concentrations (total, high-density lipoprotein [HDL], and low-density lipoprotein [LDL] cholesterol and triglycerides), pretreatment and posttreatment blood samples were drawn. A 75-g, 3-hour oral glucose-tolerance test (OGTT) was administered before and after treatment to assess participants’ glucose tolerance and insulin response. Whole blood sampling occurred at -30, 0, 30, 60, 90, 120, 150, and 180 minutes. A measure of insulin sensitivity was assessed within 48 hours after the OGTT by means of the modified frequently sampled intravenous glucose tolerance test (FSIGT).28 The glucose and insulin data derived from this test were used to calculate the insulin sensitivity index (SI) employing the minimal-model method developed by Bergman.29
Statistical methods
Reported results are expressed in terms of means ± SD or means SE. Student’s t test for independent samples was used to compare the 2 treatment groups at baseline and to compare mean change scores between the 2 groups. Additionally, area-under-the-curve analyses were performed to compare OGTT insulin curves. All analyses were performed on data from an intent-to-treat population, which included all randomized participants. Statistical tests were 2 sided, performed at the 5% level of significance, and conducted with Statistical Analysis System software (SAS Institute, Cary, N.C.).
Results
No statistically significant differences in baseline characteristics occurred between the groups, although this comparison is limited by the small sample size Table 2. LDL cholesterol and total cholesterol levels and blood pressure were somewhat higher in the treatment group. The blood pressure measurements in the treatment group resulted in an average SBP of 143 ± 3.7 mm Hg before intervention and 135 ± 2.6 mm Hg after intervention (an average of the last 2 study visits, P < .01) Table 3. No significant change in SBP was observed in the control group. A significant difference between the treatment and control groups was observed for the change in SBP (P < .02). DBP dropped from 93 ± 1.9 mm Hg to 87 ± 2.2 mm Hg after the oat fiber intervention (P = .02), with no significant change in the control group (P = .94). A borderline significant trend was noted for the change scores of DBP between groups (P = .055).
Changes in fasting insulin, insulin sensitivity (SI), and insulin curves derived from the oral glucose tolerance tests were assessed. Fasting insulin values Table 3 were taken from the OGTT (preglucose infusion values). Neither the control group (P = 1.00) nor the treatment group (P = .753) showed a significant change in fasting insulin levels. The Bergman minimal model method was used to estimate insulin sensitivity and showed no significant change in either group. Area-under-the-curve analysis of the insulin data derived from the OGTTs before and after treatment with oat cereal (Figure 1 and Figure 2) suggested a trend toward significance in terms of less insulin required to clear a glucose load (top of graphs, P = .093), with no significant changes in the control group (bottom).
Total cholesterol concentrations dropped 16.2 ± 6.3 mg/dL in the oat cereal group (P = .030), with a slight (nonsignificant) increase in the control group (P = .48). Additionally, a comparison of the changes in total cholesterol between the 2 groups revealed a significant mean difference of 21.1 ± 9.1 mg/dL (P = .035). LDL cholesterol was also reduced significantly after the oat cereal intervention by 15.8 ± 5.9 mg/dL (P = .025). The nonsignificant increase in LDL cholesterol in the control group (P = .231) combined with the significant reduction in the treatment group resulted in a significant difference between the groups after intervention (P < .015). Neither group experienced significant changes in HDL cholesterol or triglyceride concentrations.
An analysis of the side effect data showed no significant difference in the occurrence of side effects between groups. There was an overall decrease in the frequency of dietary fiber-related and hypertension-related side effects in both groups, with a more substantial reduction occurring in the oat cereal group (P = .11). Total body weight did not change significantly in either group. Additionally, both groups were very compliant (approximately 90%) in terms of cereal consumption Table 3.
Discussion
The results of this pilot study suggest that the inclusion of oats into the standard American diet of people with borderline or mild hypertension may reduce both SBP and DBP. In persons consuming 5.52 g/day of beta-glucan soluble fiber from oat cereal for 6 weeks, we found a statistically and clinically significant decrease in both SBP and DBP (7.5 mm Hg and 5.5 mm Hg, respectively) and a trend toward improved OGTT-determined insulin sensitivity. These findings warrant a large-scale clinical trial to explore further the relationship between whole-grain oat consumption and blood pressure, especially considering the limitations of this pilot study.
As with all small-scale trials, this one lacked sufficient power to detect true changes in both primary and secondary outcome variables. It is possible that regression to the mean explains at least part of the treatment effect, since participants in the oats group began the study with higher SBP, DBP, and LDL cholesterol levels than controls. In addition, it is possible that the reported blood pressure changes could have been caused by “other” undetected dietary change made by members of the oats group. Future trials will need to collect and analyze dietary data carefully; feeding trials should be considered. Such dietary analyses may indicate that certain micronutrients partially explain the hypotensive effects of whole-grain oat consumption. The DASH trial and others have consistently demonstrated that diets rich in certain micronutrients can reduce blood pressure.30,31
Soluble fiber-rich oat cereals may affect blood pressure by modulating changes in insulin metabolism. The mechanism of action is thought to involve the slowed absorption of macronutrients from the gut, resulting in a flattening of the postprandial glycemic curve.29 These lower postprandial blood glucose levels elicit a lower insulin response to accommodate its clearance from the plasma. This process may lead to improved insulin sensitivity if the lower circulating insulin levels lead eventually to upregulation of the insulin receptors in peripheral tissues. A recent animal trial demonstrated that soluble fiber feeding improved insulin sensitivity by increasing skeletal muscle plasma membrane GLUT-4 content.32 Findings in this pilot suggest that over time, oat ingestion may reduce the amount of insulin needed to clear a glucose load. However, the study was underpowered to detect significant differences in more sensitive measures of insulin resistance. The causal mechanistic relationship among whole grain oat consumption, blood pressure, and insulin resistance might be best studied using a long-term feeding study design.
Alternate mechanisms, such as attenuation in endothelial function, may have affected blood pressure responses in this study.33 Drugs specific to endothelial cell receptors mediating vasodilation are known to lower blood pressure.34 Moreover, plasma cholesterol reductions are associated with improvements in endothelium-mediated vasodilation.35,36 In addition, preliminary evidence in animals supports a direct relationship between changes in plasma cholesterol concentrations and blood pressure.37 In the present study, plasma cholesterol levels were significantly reduced in participants who ingested whole grain oat-based cereals compared to a more refined grain wheat, corn, and rice control. Thus, it is possible that the blood pressure reduction observed in the subjects consuming oats resulted in part from improved endothelial function due to a drop in plasma cholesterol. Additional research is needed to fully investigate this pathway.
From a practical standpoint, improvements in SBP and DBP such as those observed in this study would be a useful contribution to the clinical management of hypertension. The cereal feeding intervention was well tolerated. Participants were very compliant for the 6-week treatment period. Substantial improvements in blood lipids could serve as an added incentive for patients to maintain long-term compliance with feeding recommendations.18,19 Since treatment of hypertension is a lifelong process for most patients, future studies would need to assess the effectiveness of oat cereals to maintain blood pressure benefits over a longer time. Such studies may need to consider dietary options such as soluble fiber-rich fruits in addition to cereal consumption in efforts to deliver the desired quantity of soluble fiber. Future trials will have to investigate the antihypertensive effect of whole oats in other populations, such as people with diabetes, and to study not only surrogate endpoints such as blood pressure but also patient-oriented outcomes such as mortality and morbidity.
1. He J, Klag M, Whelton P, et al. Oats and buckwheat intakes and cardiovascular disease risk factors in an ethnic minority of China. Am J Clin Nutr 1995;61:366-72.
2. Lichtenstein M, Burr M, Fehily A, Yarnell J. Heart rate, employment status, and prevalent ischemic heart disease confound relation between cereal fibre intake and blood pressure. J Epidemiol Community Health 1986;40:330-3.
3. Ascherio A, Rimm E, Giovannucci E, et al. A prospective study of nutritional factors and hypertension among US men. Circulation 1992;86:1475-84.
4. Hallfrisch J, Tobin J, Muller D, Andres R. Fiber intake, age, and other coronary risk factors in men of the Baltimore Longitudinal Study (1959-1975). J Gerontol 1988;43:M64-8.
5. Ascherio A, Hennekens C, Willett W, et al. Prospective study of nutritional factors, blood pressure, and hypertension among US women. Hypertension 1996;27:1065-72.
6. Schlamowitz P, Halberg T, Warnoe O, Wilstrup F, Ryttig K. Treatment of mild to moderate hypertension with dietary fiber. Lancet 1987;2:622-3.
7. Eliasson K, Ryttig K, Hylander B, Rossner S. A dietary fiber supplement in the treatment of mild hypertension. A randomized, double-blind, placebo-controlled trial. J Hypertens 1992;10:195-9.
8. Ryttig K, Tellnes G, Haegh L, Boe E, Fagerthun H. A dietary fiber supplement and weight maintenance after weight reduction: a randomized, double-blind, placebo-controlled long-term trial. Int J Obes 1989;13:165-71.
9. Dodson P, Stephenson J, Dodson L, et al. Randomised blind controlled trial of a high fiber, low fat and low sodium dietary regimen in mild essential hypertension. J Hum Hypertens 1989;3:197-202.
10. Little P, Girling G, Hasler A, Trafford A. A controlled trial of a low sodium, low fat, high fibre diet in treated hypertensive patients: effect on antihypertensive drug requirement in clinical practice. J Hum Hypertens 1991;5:175-81.
11. Rossner S, Andersson I, Ryttig K. Effects of a dietary fiber supplement to a weight reduction program on blood pressure. Acta Med Scand 1988;223:353-7.
12. Sandstrom B, Marckmann P, Bindslev N. An eight-month controlled study of a low-fat high-fiber diet: effects on blood lipids and blood pressure in healthy young subjects. Eur J Clin Nutr 1992;46:95-109.
13. Kestin M, Moss R, Clifton P. Comparative effects of three cereal brans on plasma lipids, blood pressure, and glucose metabolism in mildly hypercholesterolemic men. Am J Clin Nutr 1990;52:661-6.
14. Swain J, Rouse I, Curley C, Sacks F. Comparison of the effects of oat bran and low-fiber wheat on serum lipoprotein levels and blood pressure. N Engl J Med 1990;322:147-52.
15. Sciarrone S, Beilin L, Rouse I, Rogers P. A factorial study of salt restriction and a low-fat/high-fibre diet in hypertensive subjects. J Hypertens 1992;10:287-98.
16. Margetts B, Beilin L, Vandongen R, Armstrong B. A randomized controlled trial of the effect of dietary fiber on blood pressure. Clin Sci 1987;72:343-50.
17. el Zein M, Areas J, Knapka J, et al. Influence of oat bran on sucrose-induced blood pressure elevations in SHR. Life Sci 1990;47:1121-8.
18. Gondal J, MacArthy P, Myers A, Preuss H. Effects of dietary sucrose and fibers on blood pressure in hypertensive rats. Clin Nephrol 1996;45:163-8.
19. Krotkiewski M. Effect of guar gum on the arterial blood pressure. Acta Med Scand 1987;222:43-9.
20. Singh R, Rastogi S, Singh N, Ghosh S, Gupta S, Niaz M. Can guava fruit intake decrease blood pressure and blood lipids? J Hum Hypertens 1993;7:33-8.
21. Weidmann P, de Courten M, Bohlen L. Insulin resistance, hyperinsulinemia and hypertension. J Hypertens 1993;11:S27-38.
22. Tuck M. Obesity, the sympathetic nervous system, and essential hypertension. Hypertension 1992;19:I67-77.
23. Sowers J. Insulin resistance, hyperinsulinemia, dyslipidemia, hypertension, and accelerated atherosclerosis. J Clin Pharmacol 1992;32:529-35.
24. Braaten J, Wood P, Scott F, Riedel K, Poste L, Collins M. Oat gum lowers glucose and insulin after an oral glucose load. Am J Clin Nutr 1991;53:1425-30.
25. Braaten J, Scott F, Wood P, et al. High ß-glucan oat bran and oat gum reduce postprandial blood glucose and insulin in subjects with and without type 2 diabetes. Diabet Med 1994;11:312-8.
26. Hallfrisch J, Scholfield D, Behall K. Diets containing soluble oat extracts improve glucose and insulin responses of moderately hypercholesterolemic men and women. Am J Clin Nutr 1995;61:379-84.
27. Fukagawa N, Anderson J, Hageman G, Young V, Minaker K. High-carbohydrate, high-fiber diets increase peripheral insulin sensitivity in healthy young and old adults. Am J Clin Nutr 1990;52:524-8.
28. Welch S, Gebhart S, Bergman R, Phillips L. Minimal model analysis of IVGTT-derived insulin sensitivity in diabetic subjects. J Clin Endocrinol Metab 1990;71:1508-18.
29. Bergman R, Ider Y, Bowden C, Cobelli C. Quantitative estimation of insulin sensitivity. Am J Physiol 1979;236:E667-77.
30. Appel LJ, Moore TJ, Obarzanek E, et al. A clinical trial on the effects of dietary patterns on blood pressure. N Engl J Med 1997;336:1117-24.
31. Appel LJ. The role of diet in the prevention and treatment of hypertension. Curr Atheroscler Rep 2000;2:521-8.
32. Song YJ, Sawamura M, Ikeda K, Igawa S, Yamori Y. Soluble dietary fiber improves insulin sensitivity by increasing muscle GLUT-4 content in stroke-prone spontaneously hypertensive rats. Clin Exp Pharm Physiol 2000;27:41-5.
33. Taddei S, Salvetti A. Pathogenic factors in hypertension. Endothelial Factors. Clin Exp Hypertens 1996;18:323-35.
34. Krum H, Viskoper R, Lacourciere Y, Budde B, Charlon V. The effect of an endothelium-receptor antagonist, Bosentan, on blood pressure in patients with essential hypertension. N Engl J Med 1998;338:784-90.
35. Anderson T, Meredith I, Yeung A. The effect of cholesterol-lowering and antioxidant therapy on endothelium-dependent coronary vasomotion. N Engl J Med 1995;332:488-93.
36. Vogel R, Corretti M, Plotnick G. Changes in flow-mediated brachial artery vasoactivity with lowering of desirable cholesterol levels in healthy middle-aged men. Am J Cardiol 1996;77:37-40.
37. Crago M, West S, Hoeprich K, Michaelis K, McKenzie J. Effects of hyperlipidemia on blood pressure and coronary blood flow in swine. FASEB J 1998;12:A238.-
To submit a letter to the editor on this topic, click here: [email protected].
OBJECTIVES: We assessed the short-term antihypertensive effects of soluble fiber-rich whole oat cereals when added to a standard American diet. In addition, multiple assessments of insulin sensitivity were conducted.
STUDY DESIGN: This was a randomized, controlled, parallel-group pilot study designed to compare an oat cereal group (standardized to 5.52 g/day beta-glucan) to a low-fiber cereal control group (less than 1.0 g/day total fiber) over 6 weeks.
POPULATION: A total of 18 hypertensive and hyperinsulinemic ( ≥10 μU/mL) men and women completed the trial.
OUTCOMES MEASURED: Primary study outcomes were changes in systolic blood pressure (SBP) and diastolic blood pressure (DBP). Secondary outcomes included blood lipid, fasting glucose, and insulin levels and side effects related to elevated blood pressure and increased dietary fiber intake.
RESULTS: The oat cereal group experienced a 7.5 mm Hg reduction in SBP (P < .01) and a 5.5 mm Hg reduction in DBP (P < .02), while there was virtually no change in either SBP or DBP in the control group. In the oat cereal group, a trend was observed for a lower total insulin response to a glucose load, suggesting improved insulin sensitivity. However, this could not be confirmed using estimates from the Bergman Minimal Model, perhaps because of our small sample size. As expected and reported in previous trials, the oats group experienced a significant reduction in both total cholesterol (9%) and low-density lipoprotein cholesterol (14%).
CONCLUSIONS: The addition of oat cereals to the normal diet of persons with hypertension significantly reduces both systolic and diastolic blood pressure. Soluble fiber-rich whole oats may be an effective dietary therapy in the prevention and adjunct treatment of hypertension.
Interest is growing in the use of nonpharmacologic methods for the prevention and management of hypertension. Specifically, the effect of dietary fiber on the incidence and treatment of hypertension has been explored. Epidemiologic studies show that the amount of dietary fiber ingested is inversely related to the incidence of hypertension as well as to systolic blood pressure (SBP) and diastolic blood pressure (DBP) in both hypertensive and normotensive patients.1–5 The results obtained from clinical trials, however, are inconsistent; some report modest blood pressure reductions after increased fiber intake,6–12 while others fail to demonstrate any effect of dietary fiber on blood pressure.13–16 Some animal trials17,18 and human trials19,20 have shown a consistent lowering of blood pressure upon consumption of larger amounts of soluble fiber, suggesting that the antihypertensive effects of fiber may be caused by the soluble fraction and that these effects may be contingent upon the intake of a sufficiently large quantity.
Hypertension often occurs in association with obesity, impaired glucose tolerance, and dyslipidemia. Hyperinsulinemia and insulin resistance are thought to be key pathogenic links among these disturbances.21–23 Studies show that soluble fiber from oats reduces both postprandial blood glucose and insulin levels.24–27 Therefore, we conducted the following pilot trial to investigate the antihypertensive and insulin-modifying effects of oat cereal supplementation in a population of mild and borderline hyperinsulinemic and hypertensive men and women.
Methods
Study protocol
The study participants in this 6-week, randomized, parallel-group, active-controlled pilot trial were recruited by means of local community screenings and mass media advertising. The study protocol was reviewed and approved by the University of Minnesota Institutional Review Board. All participants provided informed consent before official enrollment in the study. One hundred nine men and women aged 20 to 70 were screened for eligibility with a physical exam, medical history, and chemistry and lipid profile (see Table 1 for exclusion criteria). Only generally healthy, untreated hypertensives with average SBP of 130 to 160 mm Hg and DBP of 85 to 100 mm Hg and with at least 1 reading greater than 140/90 as well as moderately elevated levels of fasting insulin (≥10μU/mL) were considered for enrollment. Participants were determined to be eligible only after 2 sets of hypertensive (SBP > 130, DBP > 85) baseline blood pressure readings had been taken 7 days apart and only if all inclusion criteria were fulfilled.
Ultimately, 22 men and women were randomized to either an oat cereal treatment group (standardized to 5.52 g/day beta-glucan) or a low fiber cereal control group (<1 g/day total fiber). Four of these individuals (1 in the treatment and 3 in the control group) discontinued participation because of time constraints. Eighteen healthy, nonsmoking men and women aged 27 to 59 years (44 ± 18; mean, SD) completed the trial. Cereal treatments were isocaloric. Participants were instructed to consume all their cereal (treatment, 137 g; control, 146 g) daily for the next 6 weeks but were allowed to prepare and consume the cereal however and whenever they wished.
Cereal compliance was determined by participant self-report in a daily cereal calendar. In addition, dietary intake was reviewed both at baseline and at the end of the 6-week intervention, using 3-day food records. Side effect data were gathered from participants at baseline and the end of the intervention. Side effects were assessed via a questionnaire consisting of 21 items relating to potential side effects from increased fiber intake (eg, loose stools, flatulence) or hypertension (eg, headaches, dizziness). Participants reported the frequency at which they experienced these side effects on a scale ranging from “never” to “very frequently” (event occurring once or more per day). Each response was assigned a numerical value. Prestudy and post study averages were used in analyses.
Blood Pressure, Plasma Lipid Concentrations, Glucose Metabolism, and Insulin Sensitivity
Blood pressure was measured weekly for each participant for the duration of the study. Each participant reported to the Hypertension and Cholesterol Research Clinic located at the University of Minnesota Medical School at approximately the same time for each blood pressure reading. All readings were obtained in the morning after participants had rested quietly, seated, for at least 5 minutes in an examination room. An examiner who was blinded to the treatment groups took readings on the right arm using a mercury column sphygmomanometer (Korotkoff phase V for DBP). Standard cuff size was used unless upper arm circumference exceeded 31 cm, in which case the examiner used a large cuff with 15 x 35-cm bladders. Measurements were repeated 4 times in 2-minute intervals. The mean of the last 3 readings was calculated and used in analyses.
To determine plasma lipid concentrations (total, high-density lipoprotein [HDL], and low-density lipoprotein [LDL] cholesterol and triglycerides), pretreatment and posttreatment blood samples were drawn. A 75-g, 3-hour oral glucose-tolerance test (OGTT) was administered before and after treatment to assess participants’ glucose tolerance and insulin response. Whole blood sampling occurred at -30, 0, 30, 60, 90, 120, 150, and 180 minutes. A measure of insulin sensitivity was assessed within 48 hours after the OGTT by means of the modified frequently sampled intravenous glucose tolerance test (FSIGT).28 The glucose and insulin data derived from this test were used to calculate the insulin sensitivity index (SI) employing the minimal-model method developed by Bergman.29
Statistical methods
Reported results are expressed in terms of means ± SD or means SE. Student’s t test for independent samples was used to compare the 2 treatment groups at baseline and to compare mean change scores between the 2 groups. Additionally, area-under-the-curve analyses were performed to compare OGTT insulin curves. All analyses were performed on data from an intent-to-treat population, which included all randomized participants. Statistical tests were 2 sided, performed at the 5% level of significance, and conducted with Statistical Analysis System software (SAS Institute, Cary, N.C.).
Results
No statistically significant differences in baseline characteristics occurred between the groups, although this comparison is limited by the small sample size Table 2. LDL cholesterol and total cholesterol levels and blood pressure were somewhat higher in the treatment group. The blood pressure measurements in the treatment group resulted in an average SBP of 143 ± 3.7 mm Hg before intervention and 135 ± 2.6 mm Hg after intervention (an average of the last 2 study visits, P < .01) Table 3. No significant change in SBP was observed in the control group. A significant difference between the treatment and control groups was observed for the change in SBP (P < .02). DBP dropped from 93 ± 1.9 mm Hg to 87 ± 2.2 mm Hg after the oat fiber intervention (P = .02), with no significant change in the control group (P = .94). A borderline significant trend was noted for the change scores of DBP between groups (P = .055).
Changes in fasting insulin, insulin sensitivity (SI), and insulin curves derived from the oral glucose tolerance tests were assessed. Fasting insulin values Table 3 were taken from the OGTT (preglucose infusion values). Neither the control group (P = 1.00) nor the treatment group (P = .753) showed a significant change in fasting insulin levels. The Bergman minimal model method was used to estimate insulin sensitivity and showed no significant change in either group. Area-under-the-curve analysis of the insulin data derived from the OGTTs before and after treatment with oat cereal (Figure 1 and Figure 2) suggested a trend toward significance in terms of less insulin required to clear a glucose load (top of graphs, P = .093), with no significant changes in the control group (bottom).
Total cholesterol concentrations dropped 16.2 ± 6.3 mg/dL in the oat cereal group (P = .030), with a slight (nonsignificant) increase in the control group (P = .48). Additionally, a comparison of the changes in total cholesterol between the 2 groups revealed a significant mean difference of 21.1 ± 9.1 mg/dL (P = .035). LDL cholesterol was also reduced significantly after the oat cereal intervention by 15.8 ± 5.9 mg/dL (P = .025). The nonsignificant increase in LDL cholesterol in the control group (P = .231) combined with the significant reduction in the treatment group resulted in a significant difference between the groups after intervention (P < .015). Neither group experienced significant changes in HDL cholesterol or triglyceride concentrations.
An analysis of the side effect data showed no significant difference in the occurrence of side effects between groups. There was an overall decrease in the frequency of dietary fiber-related and hypertension-related side effects in both groups, with a more substantial reduction occurring in the oat cereal group (P = .11). Total body weight did not change significantly in either group. Additionally, both groups were very compliant (approximately 90%) in terms of cereal consumption Table 3.
Discussion
The results of this pilot study suggest that the inclusion of oats into the standard American diet of people with borderline or mild hypertension may reduce both SBP and DBP. In persons consuming 5.52 g/day of beta-glucan soluble fiber from oat cereal for 6 weeks, we found a statistically and clinically significant decrease in both SBP and DBP (7.5 mm Hg and 5.5 mm Hg, respectively) and a trend toward improved OGTT-determined insulin sensitivity. These findings warrant a large-scale clinical trial to explore further the relationship between whole-grain oat consumption and blood pressure, especially considering the limitations of this pilot study.
As with all small-scale trials, this one lacked sufficient power to detect true changes in both primary and secondary outcome variables. It is possible that regression to the mean explains at least part of the treatment effect, since participants in the oats group began the study with higher SBP, DBP, and LDL cholesterol levels than controls. In addition, it is possible that the reported blood pressure changes could have been caused by “other” undetected dietary change made by members of the oats group. Future trials will need to collect and analyze dietary data carefully; feeding trials should be considered. Such dietary analyses may indicate that certain micronutrients partially explain the hypotensive effects of whole-grain oat consumption. The DASH trial and others have consistently demonstrated that diets rich in certain micronutrients can reduce blood pressure.30,31
Soluble fiber-rich oat cereals may affect blood pressure by modulating changes in insulin metabolism. The mechanism of action is thought to involve the slowed absorption of macronutrients from the gut, resulting in a flattening of the postprandial glycemic curve.29 These lower postprandial blood glucose levels elicit a lower insulin response to accommodate its clearance from the plasma. This process may lead to improved insulin sensitivity if the lower circulating insulin levels lead eventually to upregulation of the insulin receptors in peripheral tissues. A recent animal trial demonstrated that soluble fiber feeding improved insulin sensitivity by increasing skeletal muscle plasma membrane GLUT-4 content.32 Findings in this pilot suggest that over time, oat ingestion may reduce the amount of insulin needed to clear a glucose load. However, the study was underpowered to detect significant differences in more sensitive measures of insulin resistance. The causal mechanistic relationship among whole grain oat consumption, blood pressure, and insulin resistance might be best studied using a long-term feeding study design.
Alternate mechanisms, such as attenuation in endothelial function, may have affected blood pressure responses in this study.33 Drugs specific to endothelial cell receptors mediating vasodilation are known to lower blood pressure.34 Moreover, plasma cholesterol reductions are associated with improvements in endothelium-mediated vasodilation.35,36 In addition, preliminary evidence in animals supports a direct relationship between changes in plasma cholesterol concentrations and blood pressure.37 In the present study, plasma cholesterol levels were significantly reduced in participants who ingested whole grain oat-based cereals compared to a more refined grain wheat, corn, and rice control. Thus, it is possible that the blood pressure reduction observed in the subjects consuming oats resulted in part from improved endothelial function due to a drop in plasma cholesterol. Additional research is needed to fully investigate this pathway.
From a practical standpoint, improvements in SBP and DBP such as those observed in this study would be a useful contribution to the clinical management of hypertension. The cereal feeding intervention was well tolerated. Participants were very compliant for the 6-week treatment period. Substantial improvements in blood lipids could serve as an added incentive for patients to maintain long-term compliance with feeding recommendations.18,19 Since treatment of hypertension is a lifelong process for most patients, future studies would need to assess the effectiveness of oat cereals to maintain blood pressure benefits over a longer time. Such studies may need to consider dietary options such as soluble fiber-rich fruits in addition to cereal consumption in efforts to deliver the desired quantity of soluble fiber. Future trials will have to investigate the antihypertensive effect of whole oats in other populations, such as people with diabetes, and to study not only surrogate endpoints such as blood pressure but also patient-oriented outcomes such as mortality and morbidity.
1. He J, Klag M, Whelton P, et al. Oats and buckwheat intakes and cardiovascular disease risk factors in an ethnic minority of China. Am J Clin Nutr 1995;61:366-72.
2. Lichtenstein M, Burr M, Fehily A, Yarnell J. Heart rate, employment status, and prevalent ischemic heart disease confound relation between cereal fibre intake and blood pressure. J Epidemiol Community Health 1986;40:330-3.
3. Ascherio A, Rimm E, Giovannucci E, et al. A prospective study of nutritional factors and hypertension among US men. Circulation 1992;86:1475-84.
4. Hallfrisch J, Tobin J, Muller D, Andres R. Fiber intake, age, and other coronary risk factors in men of the Baltimore Longitudinal Study (1959-1975). J Gerontol 1988;43:M64-8.
5. Ascherio A, Hennekens C, Willett W, et al. Prospective study of nutritional factors, blood pressure, and hypertension among US women. Hypertension 1996;27:1065-72.
6. Schlamowitz P, Halberg T, Warnoe O, Wilstrup F, Ryttig K. Treatment of mild to moderate hypertension with dietary fiber. Lancet 1987;2:622-3.
7. Eliasson K, Ryttig K, Hylander B, Rossner S. A dietary fiber supplement in the treatment of mild hypertension. A randomized, double-blind, placebo-controlled trial. J Hypertens 1992;10:195-9.
8. Ryttig K, Tellnes G, Haegh L, Boe E, Fagerthun H. A dietary fiber supplement and weight maintenance after weight reduction: a randomized, double-blind, placebo-controlled long-term trial. Int J Obes 1989;13:165-71.
9. Dodson P, Stephenson J, Dodson L, et al. Randomised blind controlled trial of a high fiber, low fat and low sodium dietary regimen in mild essential hypertension. J Hum Hypertens 1989;3:197-202.
10. Little P, Girling G, Hasler A, Trafford A. A controlled trial of a low sodium, low fat, high fibre diet in treated hypertensive patients: effect on antihypertensive drug requirement in clinical practice. J Hum Hypertens 1991;5:175-81.
11. Rossner S, Andersson I, Ryttig K. Effects of a dietary fiber supplement to a weight reduction program on blood pressure. Acta Med Scand 1988;223:353-7.
12. Sandstrom B, Marckmann P, Bindslev N. An eight-month controlled study of a low-fat high-fiber diet: effects on blood lipids and blood pressure in healthy young subjects. Eur J Clin Nutr 1992;46:95-109.
13. Kestin M, Moss R, Clifton P. Comparative effects of three cereal brans on plasma lipids, blood pressure, and glucose metabolism in mildly hypercholesterolemic men. Am J Clin Nutr 1990;52:661-6.
14. Swain J, Rouse I, Curley C, Sacks F. Comparison of the effects of oat bran and low-fiber wheat on serum lipoprotein levels and blood pressure. N Engl J Med 1990;322:147-52.
15. Sciarrone S, Beilin L, Rouse I, Rogers P. A factorial study of salt restriction and a low-fat/high-fibre diet in hypertensive subjects. J Hypertens 1992;10:287-98.
16. Margetts B, Beilin L, Vandongen R, Armstrong B. A randomized controlled trial of the effect of dietary fiber on blood pressure. Clin Sci 1987;72:343-50.
17. el Zein M, Areas J, Knapka J, et al. Influence of oat bran on sucrose-induced blood pressure elevations in SHR. Life Sci 1990;47:1121-8.
18. Gondal J, MacArthy P, Myers A, Preuss H. Effects of dietary sucrose and fibers on blood pressure in hypertensive rats. Clin Nephrol 1996;45:163-8.
19. Krotkiewski M. Effect of guar gum on the arterial blood pressure. Acta Med Scand 1987;222:43-9.
20. Singh R, Rastogi S, Singh N, Ghosh S, Gupta S, Niaz M. Can guava fruit intake decrease blood pressure and blood lipids? J Hum Hypertens 1993;7:33-8.
21. Weidmann P, de Courten M, Bohlen L. Insulin resistance, hyperinsulinemia and hypertension. J Hypertens 1993;11:S27-38.
22. Tuck M. Obesity, the sympathetic nervous system, and essential hypertension. Hypertension 1992;19:I67-77.
23. Sowers J. Insulin resistance, hyperinsulinemia, dyslipidemia, hypertension, and accelerated atherosclerosis. J Clin Pharmacol 1992;32:529-35.
24. Braaten J, Wood P, Scott F, Riedel K, Poste L, Collins M. Oat gum lowers glucose and insulin after an oral glucose load. Am J Clin Nutr 1991;53:1425-30.
25. Braaten J, Scott F, Wood P, et al. High ß-glucan oat bran and oat gum reduce postprandial blood glucose and insulin in subjects with and without type 2 diabetes. Diabet Med 1994;11:312-8.
26. Hallfrisch J, Scholfield D, Behall K. Diets containing soluble oat extracts improve glucose and insulin responses of moderately hypercholesterolemic men and women. Am J Clin Nutr 1995;61:379-84.
27. Fukagawa N, Anderson J, Hageman G, Young V, Minaker K. High-carbohydrate, high-fiber diets increase peripheral insulin sensitivity in healthy young and old adults. Am J Clin Nutr 1990;52:524-8.
28. Welch S, Gebhart S, Bergman R, Phillips L. Minimal model analysis of IVGTT-derived insulin sensitivity in diabetic subjects. J Clin Endocrinol Metab 1990;71:1508-18.
29. Bergman R, Ider Y, Bowden C, Cobelli C. Quantitative estimation of insulin sensitivity. Am J Physiol 1979;236:E667-77.
30. Appel LJ, Moore TJ, Obarzanek E, et al. A clinical trial on the effects of dietary patterns on blood pressure. N Engl J Med 1997;336:1117-24.
31. Appel LJ. The role of diet in the prevention and treatment of hypertension. Curr Atheroscler Rep 2000;2:521-8.
32. Song YJ, Sawamura M, Ikeda K, Igawa S, Yamori Y. Soluble dietary fiber improves insulin sensitivity by increasing muscle GLUT-4 content in stroke-prone spontaneously hypertensive rats. Clin Exp Pharm Physiol 2000;27:41-5.
33. Taddei S, Salvetti A. Pathogenic factors in hypertension. Endothelial Factors. Clin Exp Hypertens 1996;18:323-35.
34. Krum H, Viskoper R, Lacourciere Y, Budde B, Charlon V. The effect of an endothelium-receptor antagonist, Bosentan, on blood pressure in patients with essential hypertension. N Engl J Med 1998;338:784-90.
35. Anderson T, Meredith I, Yeung A. The effect of cholesterol-lowering and antioxidant therapy on endothelium-dependent coronary vasomotion. N Engl J Med 1995;332:488-93.
36. Vogel R, Corretti M, Plotnick G. Changes in flow-mediated brachial artery vasoactivity with lowering of desirable cholesterol levels in healthy middle-aged men. Am J Cardiol 1996;77:37-40.
37. Crago M, West S, Hoeprich K, Michaelis K, McKenzie J. Effects of hyperlipidemia on blood pressure and coronary blood flow in swine. FASEB J 1998;12:A238.-
To submit a letter to the editor on this topic, click here: [email protected].
Involvement of Family and Community Medicine Professionals in Community Projects
OBJECTIVES: Medical schools are being challenged to continue their excellence in education, research, and patient care while responding to the health needs of the public. The objective of our study was to determine the nature and type of community involvement of professionals in departments of family and community medicine.
STUDY DESIGN: We mailed a 24-item structured survey to a random national sample of family medicine professionals.
POPULATION: Survey recipients included 770 full-time physician and nonphysician active members of the Society of Teachers of Family Medicine.
OUTCOMES MEASURED: Our survey assessed community activities, challenges and incentives to those activities, and desired resources for working in the community.
RESULTS: A total of 446 usable surveys were returned (58% response rate). Ninety-five percent of respondents had participated in a community activity within the previous year. More male respondents precepted medical students or residents and educated faculty on topics regarding community education; more older respondents participated by sitting on community health boards or councils. Insufficient release time and lack of funding were the 2 most frequently cited barriers to community-based activities.
CONCLUSIONS: Most faculty are involved in community-related teaching and service. Reasons for low levels of research and subgroup differences, especially among women and young faculty, merit further research.
For more than 50 years academic medicine has held a privileged position in American society. Medical schools receive significant state and federal support from a variety of sources, including the National Institutes of Health, Public Health Services programs specifically developed to support medical education, the National Science Foundation, Medicare, and Medicaid.1-4 In return, academic medical centers have provided training to medical students and residents and have made significant contributions to medical research and clinical care.1,3 Recently, however, concern has been voiced about whether academic health centers have fulfilled important components of their tacit social contract with the American public, caused in part by changes in medical education financing, trends toward a competition model of health care delivery, and the erosion of trust between health care providers and patients.1,3,5-8
Foreman9 suggested changes to medical school education that would help academic health centers fulfill their reciprocal social obligation to improve the public’s health. His recommendations included integrating behavioral and population-based sciences, providing students with learning experiences in community settings where they have the opportunity to work with committed mentors, and developing a critical mass of community-based faculty who are dedicated to addressing the various needs of underserved communities and providing them with the necessary support to continue their community-based efforts. Some academic health centers, including the University of New Mexico School of Medicine, The Johns Hopkins University School of Medicine, the University of Washington School of Medicine, and the Medical College of Pennsylvania/Hahnemann School of Medicine in Philadelphia have begun to implement some of Foreman’s suggestions to strengthen social responsiveness.3,10-12
Within academic medical centers, departments of family medicine have pioneered placing medical students in community-based settings. Of the 124 medical schools that participated in the annual Liaison Committee on Medical Education survey in 1996, 69% of family practice clerkships had a community-based placement, compared with 40% for internal medicine and 25% for pediatric clerkships.13
Family practice residency programs have also striven to respond to the needs of their surrounding communities. In 1999 the Strategic Planning Working Group of the Academic Family Medicine Organization and the Association of Family Practice Residency Directors developed the following list of competencies for family practice residents to acquire during training: (1) family practice residents should understand Community-Oriented Primary Care (COPC) and the practice of population-based medicine; (2) family practice residencies should model COPC or population-based interventions within their practices; and (3) family practice graduates should be capable of recognizing community health needs, developing interventions, and assessing the outcomes.14 Several family practice residency programs, such as the one at Montefiore Medical Center in New York City have worked to address their communities’ concerns by implementing COPC.15
Less information is available on the involvement in community activities of individual family medicine professionals, which include faculty medical doctors (MDs), nonfaculty MDs, doctors of philosophy (PhDs), and master’s degree-prepared department members. The objective of our study was to determine the nature and type of community involvement of professionals in departments of family medicine. We also assessed community activities, challenges and incentives to those activities, and desired resources for working in the community. Insights into these topics increase our understanding of how personnel in academic health centers are attempting to meet the challenge of responding to the health care needs of their surrounding communities while they maintain a commitment to the traditional missions of education, research, and clinical service.
Methods
A pilot survey was sent to 25 members of the Society of Teachers of Family Medicine (STFM). Minor revisions were made according to respondents’ feedback, resulting in a 24-item, structured survey that we mailed to a national random sample of physician and nonphysician active members of STFM (N = 770). The first section of the questionnaire asked respondents a series of demographic and descriptive questions, including participants’ age, sex, ethnicity, professional effort (full or part time), length of time in their current department, and the year they completed residency or a doctoral degree. Additional information was collected on a variety of topics, including type of community-based involvement, reasons for that involvement, challenges to community-based involvement, and support or resources desired from their departments. A list of community-based activities was provided on the questionnaire, as was one write-in option Table 1. Although all activities were community-oriented, not all activities were conducted in the community.
Surveys were distributed in 2 mailings over a 6-month period with the second mailing going only to nonrespondents. Descriptive statistics consisting of percentages for categorical variables and medians for continuous, non-normally distributed variables were calculated. Univariate analyses were accomplished with the chi-square test or, in the case of non-normally distributed variables (age, years in the department, percentage of professional time spent on community-based activities), with the nonparametric Wilcoxon rank sum test.
Multiple logistic regression was used to examine the relationship between binary outcome variables and multiple explanatory variables. The logistic regression outcomes we considered were the individual types of community involvement, barriers to community involvement, and support desired. The candidate explanatory variables were chosen a priori: age, sex, degree (4 categories: master’s degree [reference group], MD degree, PhD degree, and both MD and PhD degrees), and years in department. Following the structure of the survey, analyses of barriers and desired support were restricted to those who had some type of community-based involvement in the previous year. A backward selection stepwise technique was used to build the models. Explanatory variable effects are shown as odds ratios (ORs) with 95% confidence intervals (CIs). For all analyses we used the Stata 6.0 statistical software package.16
Results
A total of 446 usable surveys were returned (58% response rate). Of these, 3 were blank and therefore unusable. Demographic characteristics indicated that respondents were representative of active STFM membership and national family medicine department faculty as reported by the Association of American Medical Colleges17Table 2.
Ninety-five percent of respondents had participated in a community-based project within the previous 12 months. Projects represented a continuum of involvement with community members. Nevertheless, much of the community-based activity was traditional in nature and included precepting medical students and residents in the community, providing clinical services at community-based sites, and conducting educational presentations in the community Table 1. When we considered only activities actually taking place within the community and excluded education about the community that took place elsewhere (the second, third, and fourth items under the heading “Any Education” in Table 1), 92% of respondents had been involved in a community-based project in the previous 12 months.
Faculty participated in community projects for several reasons, the most prevalent being personal interest or satisfaction (77%). Respondents identified insufficient time as the biggest barrier to involvement in community-based activities and noted sufficient release time as the most important form of support or resources they desired from their departments Table 3. Respondents’ academic institutions were most likely to serve urban communities (60%), followed by suburban (33%), small town (20%), and rural (16%) communities.
The association between types of community involvement and respondents’ sex, age, and professional degree was examined with logistic regression analysis. Even when controlling for degree, more men than women reported educating faculty on topics regarding community-based education and how to precept medical students or residents in community sites (OR = 2.01; 95% CI, 1.20 - 3.37; P = .008) and providing clinical care at community-based sites (OR = 1.73; 95% CI, 1.14 - 2.61; P = .009). The longer a respondent had been a member of a department, the more likely he or she was to report having served as a board, committee, or council member of a community health organization, even after controlling for age (for each 5-year interval spent in their department: OR = 1.23; 95% CI, 1.03 - 1.47; P = .023). Not surprisingly, MDs were 5.27 times more likely to report that they had precepted medical students or residents at community-based sites (95% CI, 1.29 - 21.46; P = .02) and provided medical care at community-based sites (OR = 5.35; 95% CI, 1.08 - 26.47; P = .04) than non-MD respondents. MD and PhD respondents, however, were less likely than those without such degrees to work with community members to develop and implement a research project to meet a community-identified health concern (PhDs: OR = 0.17; 95% CI, 0.04-0.84; P = .03; MDs: OR = 0.28; 95% CI, 0.07-1.09; P = .07).
We also analyzed the type of community served to determine its effect on participation in community activities. Institutions serving rural communities were more likely to have designed a community health curriculum (51% vs 36%; P = .023 by Fisher’s exact test) and to have evaluated a community-based project or program (32% vs 18%; P = .010 by Fisher’s exact test). Those serving a small town were also more likely to have evaluated a community-based project or program (30% versus 18%; P = .026 by Fisher’s exact test). Those serving urban communities were more likely to have taught students to work in a community site (58% vs 48%; P = .052 by Fisher’s exact test), to have designed a community health curriculum (43% vs 31%; P = .010 by Fisher’s exact test), and to have educated faculty on community-based education (27% vs 17%; P = .021 by Fisher’s exact test). Neither community served nor community activity, however, is mutually exclusive.
Some of the barriers to community-based activities and desired support for such work were also associated with respondents’ sex, age, and number of years in the current department. Women were 2.41 times more likely than men to report a lack of technical assistance as a barrier to community-based projects (95% CI, 1.41-4.13; P = .001). However, women were only 1.56 times (95% CI, 0.99-2.46; P = .054) more likely than men to desire technical support from their department. Men were 1.57 times (95% CI, 0.99-2.48; P = .054) more likely than women to desire help in forming relationships with the community. Increased age was associated with a decreased desire for sufficient release or protected time for community-based work. For each decade increase in age, there was a 28% reduction in the perceived need for sufficient release or protected time (OR = 0.72; 95% CI, 0.55-0.95; P = .02). Similarly, respondents who had been in their departments longer were less likely to report a need for faculty development regarding community-based activities (OR = 0.95 for each year [a 5% reduction for each additional year]; 95% CI, 0.91-0.99; P = .009).
Discussion
Advocates of community health have challenged academic institutions to more and better involvement in teaching and researching community health and providing service in the community. However, there are almost no data describing the status quo. Our study of 446 health providers who demographically mirror current STFM members and family medicine department faculty establishes a baseline of current activities. The findings support some of our beliefs, call others into question, and raise a number of specific areas for further study.
First, our results indicate that significant numbers of family medicine personnel are participating in a variety of community-based activities. Ninety-five percent of those responding reported having participated in a community education, service, or research project in the past year; 92% performed those activities in the community itself. The activities included precepting medical students and residents, providing clinical services at community-based sites, and making educational presentations in the community. Although this finding does not obviate the need for more and better services, it does suggest that faculty are fulfilling their responsibilities in this area. Less than half of our respondents participated in research, however, a finding that merits further investigation.
Second, this group of physicians and other family and community medicine personnel reported personal interest and satisfaction as the primary motivation (77%)for participating in community projects. This finding supports attempts to motivate community involvement as a personally rewarding experience. Other motivating factors were health of the community and importance to medical student and resident education.
Predictably, the most commonly perceived barrier to community service project participation was a lack of time. More release time was the most desired form of department support for surmounting that barrier. However, we found no data about release time and service. Bland and Schmitz18 have suggested that dedicating 40% of effort to research is necessary for adequate research productivity. If community service is a mission of a medical school, it seems that protecting time for community service projects would also be necessary. Further research is needed to ascertain whether schools offer faculty protected time for community service and, if so, how much is necessary or optimal.
Participation patterns, perceived barriers, and desired resources varied by age, sex, educational background, and academic rank. These factors are often interrelated and individual effects are difficult to segregate. Greater experience and time with an organization may be associated with higher status (rank), which in turn may lead to greater access to monetary and other resources, more protected time, and greater ability to allocate one’s own time. There are still more male family physicians than female, and more men have higher faculty rank. These factors may affect our findings that men were significantly more often involved in teaching other faculty about community-based education and providing care at a community or school clinic.
Among respondents who desired technical assistance, women were nearly twice as likely as men to report lack of technical assistance as a barrier (61% versus 34%) but desired technical assistance only slightly more often than men. Men reported desiring help in forming relationships with community members more often than women did; the difference approached, but did not achieve, significance. The findings are intriguing, but speculation about their implications would be based on stereotypes. Certainly further investigation is desirable.
Controlling for age, the longer the respondents had been members of their departments, the more often they participated on community health boards, committees, and organizations. Respondents who have been in their departments longer may be better established in their careers and in the community, resulting in more frequent invitations to these activities. Other explanations could include changes accompanying life stages, such as concern for assisting younger generations.
Length of employment in a particular department correlated with less reported need for faculty development around community-based activities. Since we did not attempt to ascertain respondents’ levels of expertise, we cannot interpret this finding. However, it cannot be assumed that long experience and lack of reported need necessarily reflect a high skill level.
Older respondents were less likely to desire release or supported time for their community activities. The perceived need for more time diminished by 28% with each decade of life. It may be that they have already garnered sufficient support and protected time in their institutions.
That MDs were significantly more likely than non-MDs to have precepted students and residents at community sites reflects the requirements of medical education accrediting bodies. The reason for the prevalence of research by respondents with master’s degrees and not those with terminal degrees is not known, although we surmise that at least some may have been hired specifically to conduct research. More study of the role of this small subset of respondents is warranted.
We did not examine differences in practice environments and their effect on community-based activities. University-, military-, and community-based practices have different goals, incentives, and disincentives, as do managed care and fee-for-service organizations. Furthermore, the traditional patterns of these organizations may be changing in response to interest in performance measures.19 This is another important area for investigation.
Limitations
This is a descriptive, not a definitive, study. The 58% response rate to the survey may limit the generalizability of our findings. Individuals who are involved or interested in community projects may have been more likely to return the survey, resulting in an overestimation of involvement in community-based activities. Although we do not have demographic or community involvement information about nonrespondents, our sample is demographically similar to active STFM membership and national family medicine department faculty. We provided examples of community-based activities; however, individual interpretations of what constitutes such an activity may differ. Using exploratory analyses increased the likelihood that a significant result would occur by chance. Thus, marginally significant results require further study, and those with P values between .01 and .05 should be considered hypothesis generating.
Conclusions
This descriptive study helps establish a baseline for better understanding academic physicians’ current participation in community-based activities. Although the scope of this study is narrow, it suggests that most academic faculty are providing community service and education and are deriving satisfaction from doing so.
Our results also raise a number of questions for further study. Is there enough appropriate research being done within communities to address its health needs? Should women and younger faculty receive additional support in establishing community-based activities, and if so, what kind? If women perceive technical barriers more often, why do they not report a desire for technical assistance more often? Is the difference between men and women in ease of forming community partnerships meaningful? The answers to these questions will provide a richer understanding of the ability of an academic health center to respond to the health care needs of their surrounding communities.
1. Colloton JW. Academic medicine’s changing covenant with society. Acad Med 1989;64:55-60.
2. Peabody JW. Measuring the social responsiveness of medical schools: setting the standards. Acad Med 1999;74:S59-68.
3. Schroeder SA, Zone JS, Showstack JA. Academic medicine as a public trust. JAMA 1989;262:803-12.
4. McCurdy L, Goode LD, Inui TS, et al. Fulfilling the social contract between medical schools and the public. Acad Med 1997;72:1063-70.
5. Pellegrino ED. Academic health centers and society: an ethical reflection. Acad Med 1999;74:S21-6.
6. Cohen JJ. Missions of a medical school: a North American perspective. Acad Med 1999;74:S27-30.
7. White KL, Connelly JE. The medical school’s mission and the population’s health. Ann Intern Med 1991;115:968-72.
8. Blumenthal D, Campbell EG, Weissman JS. The social missions of academic health centers. N Engl J Med 1997;337:1550-3.
9. Foreman S. Social responsibility and the academic medical center: building community-based systems for the nation’s health. Acad Med 1994;69:97-102.
10. Kaufman A. Measuring social responsiveness of medical schools: a case study from New Mexico. Acad Med 1999;74:S69-74.
11. Rubenstein HL, Franklin ED, Zarro VJ. Opportunities and challenges in educating community-responsive physicians. Am J Prev Med 1997;13:104-8.
12. Showstack J, Fein O, Ford D, et al. Health of the public: the academic response. JAMA 1992;275:2497-502.
13. Seifer SD. Recent and emerging trends in undergraduate medical education: curricular responses to a rapidly changing health care system. West J Med 1998;168:400-11.
14. Longlett SK. Community-oriented primary care: historical perspective. J Am Board Fam Pract 2001;14:54-63.
15. Strelnick AH. Integrating community oriented primary care into training and practice: a view from the Bronx. Fam Med 1986;18:205-9.
16. StataCorp 1999. Stata Statistical Software: Release 6.0 College Station, Tex: Stat Corporation.
17. Robinson L. ed. AAMC data book: statistical information related to medical schools and teaching hospitals. Washington, DC: Association of American Medical Colleges; 2000.
18. Bland CJ, Schmitz CC. Characteristics of the successful researcher and implications for faculty development. J Med Ed 1986;61:22-31.
19. Rhyne R. Bogue R. Kukulka G. Fulmer H. eds. Community-oriented primary care: health care for the 21st century. Washington, DC: American Public Health Association; 1998.
To submit a letter to the editor on this topic, click here: [email protected].
OBJECTIVES: Medical schools are being challenged to continue their excellence in education, research, and patient care while responding to the health needs of the public. The objective of our study was to determine the nature and type of community involvement of professionals in departments of family and community medicine.
STUDY DESIGN: We mailed a 24-item structured survey to a random national sample of family medicine professionals.
POPULATION: Survey recipients included 770 full-time physician and nonphysician active members of the Society of Teachers of Family Medicine.
OUTCOMES MEASURED: Our survey assessed community activities, challenges and incentives to those activities, and desired resources for working in the community.
RESULTS: A total of 446 usable surveys were returned (58% response rate). Ninety-five percent of respondents had participated in a community activity within the previous year. More male respondents precepted medical students or residents and educated faculty on topics regarding community education; more older respondents participated by sitting on community health boards or councils. Insufficient release time and lack of funding were the 2 most frequently cited barriers to community-based activities.
CONCLUSIONS: Most faculty are involved in community-related teaching and service. Reasons for low levels of research and subgroup differences, especially among women and young faculty, merit further research.
For more than 50 years academic medicine has held a privileged position in American society. Medical schools receive significant state and federal support from a variety of sources, including the National Institutes of Health, Public Health Services programs specifically developed to support medical education, the National Science Foundation, Medicare, and Medicaid.1-4 In return, academic medical centers have provided training to medical students and residents and have made significant contributions to medical research and clinical care.1,3 Recently, however, concern has been voiced about whether academic health centers have fulfilled important components of their tacit social contract with the American public, caused in part by changes in medical education financing, trends toward a competition model of health care delivery, and the erosion of trust between health care providers and patients.1,3,5-8
Foreman9 suggested changes to medical school education that would help academic health centers fulfill their reciprocal social obligation to improve the public’s health. His recommendations included integrating behavioral and population-based sciences, providing students with learning experiences in community settings where they have the opportunity to work with committed mentors, and developing a critical mass of community-based faculty who are dedicated to addressing the various needs of underserved communities and providing them with the necessary support to continue their community-based efforts. Some academic health centers, including the University of New Mexico School of Medicine, The Johns Hopkins University School of Medicine, the University of Washington School of Medicine, and the Medical College of Pennsylvania/Hahnemann School of Medicine in Philadelphia have begun to implement some of Foreman’s suggestions to strengthen social responsiveness.3,10-12
Within academic medical centers, departments of family medicine have pioneered placing medical students in community-based settings. Of the 124 medical schools that participated in the annual Liaison Committee on Medical Education survey in 1996, 69% of family practice clerkships had a community-based placement, compared with 40% for internal medicine and 25% for pediatric clerkships.13
Family practice residency programs have also striven to respond to the needs of their surrounding communities. In 1999 the Strategic Planning Working Group of the Academic Family Medicine Organization and the Association of Family Practice Residency Directors developed the following list of competencies for family practice residents to acquire during training: (1) family practice residents should understand Community-Oriented Primary Care (COPC) and the practice of population-based medicine; (2) family practice residencies should model COPC or population-based interventions within their practices; and (3) family practice graduates should be capable of recognizing community health needs, developing interventions, and assessing the outcomes.14 Several family practice residency programs, such as the one at Montefiore Medical Center in New York City have worked to address their communities’ concerns by implementing COPC.15
Less information is available on the involvement in community activities of individual family medicine professionals, which include faculty medical doctors (MDs), nonfaculty MDs, doctors of philosophy (PhDs), and master’s degree-prepared department members. The objective of our study was to determine the nature and type of community involvement of professionals in departments of family medicine. We also assessed community activities, challenges and incentives to those activities, and desired resources for working in the community. Insights into these topics increase our understanding of how personnel in academic health centers are attempting to meet the challenge of responding to the health care needs of their surrounding communities while they maintain a commitment to the traditional missions of education, research, and clinical service.
Methods
A pilot survey was sent to 25 members of the Society of Teachers of Family Medicine (STFM). Minor revisions were made according to respondents’ feedback, resulting in a 24-item, structured survey that we mailed to a national random sample of physician and nonphysician active members of STFM (N = 770). The first section of the questionnaire asked respondents a series of demographic and descriptive questions, including participants’ age, sex, ethnicity, professional effort (full or part time), length of time in their current department, and the year they completed residency or a doctoral degree. Additional information was collected on a variety of topics, including type of community-based involvement, reasons for that involvement, challenges to community-based involvement, and support or resources desired from their departments. A list of community-based activities was provided on the questionnaire, as was one write-in option Table 1. Although all activities were community-oriented, not all activities were conducted in the community.
Surveys were distributed in 2 mailings over a 6-month period with the second mailing going only to nonrespondents. Descriptive statistics consisting of percentages for categorical variables and medians for continuous, non-normally distributed variables were calculated. Univariate analyses were accomplished with the chi-square test or, in the case of non-normally distributed variables (age, years in the department, percentage of professional time spent on community-based activities), with the nonparametric Wilcoxon rank sum test.
Multiple logistic regression was used to examine the relationship between binary outcome variables and multiple explanatory variables. The logistic regression outcomes we considered were the individual types of community involvement, barriers to community involvement, and support desired. The candidate explanatory variables were chosen a priori: age, sex, degree (4 categories: master’s degree [reference group], MD degree, PhD degree, and both MD and PhD degrees), and years in department. Following the structure of the survey, analyses of barriers and desired support were restricted to those who had some type of community-based involvement in the previous year. A backward selection stepwise technique was used to build the models. Explanatory variable effects are shown as odds ratios (ORs) with 95% confidence intervals (CIs). For all analyses we used the Stata 6.0 statistical software package.16
Results
A total of 446 usable surveys were returned (58% response rate). Of these, 3 were blank and therefore unusable. Demographic characteristics indicated that respondents were representative of active STFM membership and national family medicine department faculty as reported by the Association of American Medical Colleges17Table 2.
Ninety-five percent of respondents had participated in a community-based project within the previous 12 months. Projects represented a continuum of involvement with community members. Nevertheless, much of the community-based activity was traditional in nature and included precepting medical students and residents in the community, providing clinical services at community-based sites, and conducting educational presentations in the community Table 1. When we considered only activities actually taking place within the community and excluded education about the community that took place elsewhere (the second, third, and fourth items under the heading “Any Education” in Table 1), 92% of respondents had been involved in a community-based project in the previous 12 months.
Faculty participated in community projects for several reasons, the most prevalent being personal interest or satisfaction (77%). Respondents identified insufficient time as the biggest barrier to involvement in community-based activities and noted sufficient release time as the most important form of support or resources they desired from their departments Table 3. Respondents’ academic institutions were most likely to serve urban communities (60%), followed by suburban (33%), small town (20%), and rural (16%) communities.
The association between types of community involvement and respondents’ sex, age, and professional degree was examined with logistic regression analysis. Even when controlling for degree, more men than women reported educating faculty on topics regarding community-based education and how to precept medical students or residents in community sites (OR = 2.01; 95% CI, 1.20 - 3.37; P = .008) and providing clinical care at community-based sites (OR = 1.73; 95% CI, 1.14 - 2.61; P = .009). The longer a respondent had been a member of a department, the more likely he or she was to report having served as a board, committee, or council member of a community health organization, even after controlling for age (for each 5-year interval spent in their department: OR = 1.23; 95% CI, 1.03 - 1.47; P = .023). Not surprisingly, MDs were 5.27 times more likely to report that they had precepted medical students or residents at community-based sites (95% CI, 1.29 - 21.46; P = .02) and provided medical care at community-based sites (OR = 5.35; 95% CI, 1.08 - 26.47; P = .04) than non-MD respondents. MD and PhD respondents, however, were less likely than those without such degrees to work with community members to develop and implement a research project to meet a community-identified health concern (PhDs: OR = 0.17; 95% CI, 0.04-0.84; P = .03; MDs: OR = 0.28; 95% CI, 0.07-1.09; P = .07).
We also analyzed the type of community served to determine its effect on participation in community activities. Institutions serving rural communities were more likely to have designed a community health curriculum (51% vs 36%; P = .023 by Fisher’s exact test) and to have evaluated a community-based project or program (32% vs 18%; P = .010 by Fisher’s exact test). Those serving a small town were also more likely to have evaluated a community-based project or program (30% versus 18%; P = .026 by Fisher’s exact test). Those serving urban communities were more likely to have taught students to work in a community site (58% vs 48%; P = .052 by Fisher’s exact test), to have designed a community health curriculum (43% vs 31%; P = .010 by Fisher’s exact test), and to have educated faculty on community-based education (27% vs 17%; P = .021 by Fisher’s exact test). Neither community served nor community activity, however, is mutually exclusive.
Some of the barriers to community-based activities and desired support for such work were also associated with respondents’ sex, age, and number of years in the current department. Women were 2.41 times more likely than men to report a lack of technical assistance as a barrier to community-based projects (95% CI, 1.41-4.13; P = .001). However, women were only 1.56 times (95% CI, 0.99-2.46; P = .054) more likely than men to desire technical support from their department. Men were 1.57 times (95% CI, 0.99-2.48; P = .054) more likely than women to desire help in forming relationships with the community. Increased age was associated with a decreased desire for sufficient release or protected time for community-based work. For each decade increase in age, there was a 28% reduction in the perceived need for sufficient release or protected time (OR = 0.72; 95% CI, 0.55-0.95; P = .02). Similarly, respondents who had been in their departments longer were less likely to report a need for faculty development regarding community-based activities (OR = 0.95 for each year [a 5% reduction for each additional year]; 95% CI, 0.91-0.99; P = .009).
Discussion
Advocates of community health have challenged academic institutions to more and better involvement in teaching and researching community health and providing service in the community. However, there are almost no data describing the status quo. Our study of 446 health providers who demographically mirror current STFM members and family medicine department faculty establishes a baseline of current activities. The findings support some of our beliefs, call others into question, and raise a number of specific areas for further study.
First, our results indicate that significant numbers of family medicine personnel are participating in a variety of community-based activities. Ninety-five percent of those responding reported having participated in a community education, service, or research project in the past year; 92% performed those activities in the community itself. The activities included precepting medical students and residents, providing clinical services at community-based sites, and making educational presentations in the community. Although this finding does not obviate the need for more and better services, it does suggest that faculty are fulfilling their responsibilities in this area. Less than half of our respondents participated in research, however, a finding that merits further investigation.
Second, this group of physicians and other family and community medicine personnel reported personal interest and satisfaction as the primary motivation (77%)for participating in community projects. This finding supports attempts to motivate community involvement as a personally rewarding experience. Other motivating factors were health of the community and importance to medical student and resident education.
Predictably, the most commonly perceived barrier to community service project participation was a lack of time. More release time was the most desired form of department support for surmounting that barrier. However, we found no data about release time and service. Bland and Schmitz18 have suggested that dedicating 40% of effort to research is necessary for adequate research productivity. If community service is a mission of a medical school, it seems that protecting time for community service projects would also be necessary. Further research is needed to ascertain whether schools offer faculty protected time for community service and, if so, how much is necessary or optimal.
Participation patterns, perceived barriers, and desired resources varied by age, sex, educational background, and academic rank. These factors are often interrelated and individual effects are difficult to segregate. Greater experience and time with an organization may be associated with higher status (rank), which in turn may lead to greater access to monetary and other resources, more protected time, and greater ability to allocate one’s own time. There are still more male family physicians than female, and more men have higher faculty rank. These factors may affect our findings that men were significantly more often involved in teaching other faculty about community-based education and providing care at a community or school clinic.
Among respondents who desired technical assistance, women were nearly twice as likely as men to report lack of technical assistance as a barrier (61% versus 34%) but desired technical assistance only slightly more often than men. Men reported desiring help in forming relationships with community members more often than women did; the difference approached, but did not achieve, significance. The findings are intriguing, but speculation about their implications would be based on stereotypes. Certainly further investigation is desirable.
Controlling for age, the longer the respondents had been members of their departments, the more often they participated on community health boards, committees, and organizations. Respondents who have been in their departments longer may be better established in their careers and in the community, resulting in more frequent invitations to these activities. Other explanations could include changes accompanying life stages, such as concern for assisting younger generations.
Length of employment in a particular department correlated with less reported need for faculty development around community-based activities. Since we did not attempt to ascertain respondents’ levels of expertise, we cannot interpret this finding. However, it cannot be assumed that long experience and lack of reported need necessarily reflect a high skill level.
Older respondents were less likely to desire release or supported time for their community activities. The perceived need for more time diminished by 28% with each decade of life. It may be that they have already garnered sufficient support and protected time in their institutions.
That MDs were significantly more likely than non-MDs to have precepted students and residents at community sites reflects the requirements of medical education accrediting bodies. The reason for the prevalence of research by respondents with master’s degrees and not those with terminal degrees is not known, although we surmise that at least some may have been hired specifically to conduct research. More study of the role of this small subset of respondents is warranted.
We did not examine differences in practice environments and their effect on community-based activities. University-, military-, and community-based practices have different goals, incentives, and disincentives, as do managed care and fee-for-service organizations. Furthermore, the traditional patterns of these organizations may be changing in response to interest in performance measures.19 This is another important area for investigation.
Limitations
This is a descriptive, not a definitive, study. The 58% response rate to the survey may limit the generalizability of our findings. Individuals who are involved or interested in community projects may have been more likely to return the survey, resulting in an overestimation of involvement in community-based activities. Although we do not have demographic or community involvement information about nonrespondents, our sample is demographically similar to active STFM membership and national family medicine department faculty. We provided examples of community-based activities; however, individual interpretations of what constitutes such an activity may differ. Using exploratory analyses increased the likelihood that a significant result would occur by chance. Thus, marginally significant results require further study, and those with P values between .01 and .05 should be considered hypothesis generating.
Conclusions
This descriptive study helps establish a baseline for better understanding academic physicians’ current participation in community-based activities. Although the scope of this study is narrow, it suggests that most academic faculty are providing community service and education and are deriving satisfaction from doing so.
Our results also raise a number of questions for further study. Is there enough appropriate research being done within communities to address its health needs? Should women and younger faculty receive additional support in establishing community-based activities, and if so, what kind? If women perceive technical barriers more often, why do they not report a desire for technical assistance more often? Is the difference between men and women in ease of forming community partnerships meaningful? The answers to these questions will provide a richer understanding of the ability of an academic health center to respond to the health care needs of their surrounding communities.
1. Colloton JW. Academic medicine’s changing covenant with society. Acad Med 1989;64:55-60.
2. Peabody JW. Measuring the social responsiveness of medical schools: setting the standards. Acad Med 1999;74:S59-68.
3. Schroeder SA, Zone JS, Showstack JA. Academic medicine as a public trust. JAMA 1989;262:803-12.
4. McCurdy L, Goode LD, Inui TS, et al. Fulfilling the social contract between medical schools and the public. Acad Med 1997;72:1063-70.
5. Pellegrino ED. Academic health centers and society: an ethical reflection. Acad Med 1999;74:S21-6.
6. Cohen JJ. Missions of a medical school: a North American perspective. Acad Med 1999;74:S27-30.
7. White KL, Connelly JE. The medical school’s mission and the population’s health. Ann Intern Med 1991;115:968-72.
8. Blumenthal D, Campbell EG, Weissman JS. The social missions of academic health centers. N Engl J Med 1997;337:1550-3.
9. Foreman S. Social responsibility and the academic medical center: building community-based systems for the nation’s health. Acad Med 1994;69:97-102.
10. Kaufman A. Measuring social responsiveness of medical schools: a case study from New Mexico. Acad Med 1999;74:S69-74.
11. Rubenstein HL, Franklin ED, Zarro VJ. Opportunities and challenges in educating community-responsive physicians. Am J Prev Med 1997;13:104-8.
12. Showstack J, Fein O, Ford D, et al. Health of the public: the academic response. JAMA 1992;275:2497-502.
13. Seifer SD. Recent and emerging trends in undergraduate medical education: curricular responses to a rapidly changing health care system. West J Med 1998;168:400-11.
14. Longlett SK. Community-oriented primary care: historical perspective. J Am Board Fam Pract 2001;14:54-63.
15. Strelnick AH. Integrating community oriented primary care into training and practice: a view from the Bronx. Fam Med 1986;18:205-9.
16. StataCorp 1999. Stata Statistical Software: Release 6.0 College Station, Tex: Stat Corporation.
17. Robinson L. ed. AAMC data book: statistical information related to medical schools and teaching hospitals. Washington, DC: Association of American Medical Colleges; 2000.
18. Bland CJ, Schmitz CC. Characteristics of the successful researcher and implications for faculty development. J Med Ed 1986;61:22-31.
19. Rhyne R. Bogue R. Kukulka G. Fulmer H. eds. Community-oriented primary care: health care for the 21st century. Washington, DC: American Public Health Association; 1998.
To submit a letter to the editor on this topic, click here: [email protected].
Weekly Versus Daily Dosing of Atorvastatin
Twenty-four consecutive patients of a single family physician who had achieved NCEP-II goal levels of low-density lipoprotein cholesterol (LDL-C) on a daily atorvastatin dose of 10 mg for at least 6 months were invited to switch to 20 mg weekly. Mean LDL levels for the 22 patients who completed the trial had been reduced by 43% from baseline on 10 mg daily (P < .05) and were reduced by 22% from baseline on the seventh day following the last weekly dose of 20 mg (P < .05). Total cholesterol to high-density lipoprotein cholesterol (TC/HDL-C) ratios were reduced by 31% and 17%, respectively (both P < .05) and triglycerides by 20% and 10% (both P < .05).
Atorvastatin is a potent antihyperlipidemic but is quite expensive, costing up to $700 for a 1-year supply of 10-mg tablets in retail pharmacies. Weekly dosing has the potential to lower costs and increase convenience while maintaining a similar effect on lipids. The active metabolites have a serum half-life of 11 to 57 hours,1-4 acting on a target that responds slowly to intervention. Furthermore, atorvastatin demonstrates prolonged inhibition of HMG-CoA reductase compared with other statins, presumably because of longer residence of the drug or its metabolites in the liver.5 Two abstracts of meeting presentations have reported efficacy for alternate-day dosing on small patient samples,1,2 but no reported attempts have been made to test longer dosing intervals. The purpose of this pilot study was to investigate the effect of weekly dosing of atorvastatin on patients who were currently well controlled on daily doses of the drug.
Methods
Selection of patients
Twenty-four consecutive patients presenting for routine follow-up in a private clinical practice whose LDL-C levels exceeded National Cholesterol Education Program (NCEP-II) guidelines6 on 2 occasions and who had successfully met their goals on 10 mg atorvastatin daily were offered a 12-week trial of 20 mg atorvastatin weekly. All 24 patients gave written informed consent, although one changed his mind and never altered his dosing and another experienced headaches after taking the first 20-mg dose and reverted to a regimen of 10 mg daily.
Study protocol
Study participants were instructed verbally and in writing to make no special efforts to change their lifestyle as a result of their involvement. The potential skewing effect of such efforts on research was explained. If they were already intending to alter their diet or exercise levels, this was acceptable. They were to take atorvastatin at the usual time of day on a day of the week that seemed most convenient. If they forgot a dose, it was to be taken the next day. Compliance with weekly dosing was assessed at each contact by explicit questioning. Fasting chemical and lipid profiles were available on patients’ charts; for purpose of analysis, the last profile before initiation of any statin therapy was used as the pretreatment baseline and the last profile on 10 mg atorvastatin daily as the treatment baseline. Profiles were repeated with the patient fasting on the seventh day after the last 20-mg dose before that dose was repeated.
Statistical analysis
The data were analyzed with repeated measures ANOVA followed by a Student–Newman–Kuels post hoc test to determine differences between specific treatments. Differences with a 2-tailed P value of less than .05 were considered statistically significant.
Results
Baseline characteristics
Table 1 presents the baseline characteristics of participants. The average age was 54 years (range 42 to 72 years). There were 12 men and 10 women. Thirteen subjects had comorbid conditions (9 hypertension, 4 type 2 diabetes, 1 hepatitis C, 2 coronary artery disease, and 2 tobacco use).
TABLE 1
BASELINE CHARACTERISTICS OF STUDY PARTICIPANTS
| Characteristic | Number |
|---|---|
| Male / female | 12 / 10 |
| Comorbidity | |
| Hypertension | 9 |
| Type 2 diabetes mellitus | 4 |
| Hepatitis C | 1 |
| Coronary artery disease | 2 |
| Smoking | 2 |
| Mean age in years (range) | 54 (42–72) |
Cholesterol reduction
Results for LDL-C, HDL-C, triglycerides, TC, TC/HDL-C ratio, and aspartate aminotransferase (AST) are summarized in Table 2. LDL levels fell 43% and 22%, respectively, on daily and weekly dosing; HDL-C levels were essentially unchanged; triglycerides fell 20% and 10%; TC, 33% and 16%; TC/HDL-C, 31% and 17%; and AST, 0% and 21%.
TABLE 2
RESPONSE OF LIPID PARAMETERS TO DAILY AND WEEKLY DOSING WITH ATORVASTATIN
| Pretreatment | 10 mg Daily | 20 mg Weekly | |
|---|---|---|---|
| LDL-C mg/dL | 178 | 101 *† | 138 * |
| HDL-C mg/dL | 46 | 46 | 48 |
| Triglycerides mg/dL | 174 | 139 * | 157 * |
| Total cholesterol mg/dL | 259 | 175 *† | 218 * |
| Total cholesterol/HDL-C ratio | 5.8 | 4.0 *† | 4.8 * |
| AST U/L | 28 | 28 | 22 |
| * P < .05 vs pretreatment. | |||
| † P < .05 vs 20 mg weekly. | |||
| Conversion factors: | |||
| LDL-C, HDL-C, TC: (mg/dL) x (.026) = SI mmol/L | |||
| Triglycerides: (mg/dL) x (.011) = SI mmol/L | |||
| AST denotes aspartate aminotransferase; HDL-C, high-density lipoprotein cholesterol; LDL-C, low-density lipoprotein cholesterol; SI, Système Internationale. | |||
Adverse reactions
The only reported adverse reaction from doubling the dose of atorvastatin was headache in the patient who dropped out for that reason. No attempt was made to repeat the higher dose to see if this reaction was replicable. No subjects reported myalgias. The mean AST actually dropped on weekly dosing. One patient who had hepatitis C and was in clinical remission experienced a fall in pretreatment AST on daily dosing and a further reduction on weekly dosing.
Discussion
With pharmaceutical costs leading medical inflation, a current challenge for clinicians is to alter the cost-benefit ratio of prescriptions to the advantage of patients. Weekly dosing, as has recently been approved for alendronate sodium (Fosamax) and fluoxetine hydrochloride (Prozac), is one approach to this problem. In this preliminary study, weekly dosing of 20 mg atorvastatin resulted in a 22% reduction of LDL-C, measured on the seventh day after dosing. This regimen represents an approximately 80% reduction in yearly cost compared with that of a regimen of 10 mg daily.
Since this study did not investigate the pattern of LDL-C reduction in the interval between doses, further research is needed to delineate the area under the curve and the impact on clinical outcomes before conclusions may be drawn regarding the effectiveness of weekly dosing.
Acknowledgment
The author wishes to acknowledge the assistance of William Harris, PhD, in editing and statistical analysis.
1. Jafari M, et al. Efficacy of alternate day dosing with atorvastatin. ACCP annual meeting abstracts; 1999.
2. Matalka M, Ravnan M, Deedwania P. Is alternate day dosing of atorvastatin effective in managing patients with hyperlipidemia? JAAC abstracts; February 2001.
3. Cilla DD, Jr, Whitfield LR, Gibson DM, Sedman AJ, Posvar EL. Multiple-dose pharmacokinetics, pharmacodynamics, and safety of atorvastatin, an inhibitor of HMG-CoA reductase, in healthy subjects. Clin Pharmacol Ther 1996;60:687-95.
4. Posvar EL, Radulovic LL, Cilla DD, Jr, Whitfield LR, Sedman AJ. Tolerance and pharmacokinetics of single-dose atorvastatin, a potent inhibitor or HMG-CoA reductase, in healthy subjects. J Clin Pharmacol 1996;36:729-31.
5. Naoumova RP, Dunn S, Rallidis L, et al. Prolonged inhibition of cholesterol synthesis explains the efficacy of atorvastatin. J Lipid Res 1997;38:1496-500.
6. Executive summary of the third report of the National Cholesterol Education Program (NCEP) expert panel on detection, evaluation, and treatment of high blood cholesterol in adults (Adult Treatment Panel III). JAMA 2001;285:2486-97.
Twenty-four consecutive patients of a single family physician who had achieved NCEP-II goal levels of low-density lipoprotein cholesterol (LDL-C) on a daily atorvastatin dose of 10 mg for at least 6 months were invited to switch to 20 mg weekly. Mean LDL levels for the 22 patients who completed the trial had been reduced by 43% from baseline on 10 mg daily (P < .05) and were reduced by 22% from baseline on the seventh day following the last weekly dose of 20 mg (P < .05). Total cholesterol to high-density lipoprotein cholesterol (TC/HDL-C) ratios were reduced by 31% and 17%, respectively (both P < .05) and triglycerides by 20% and 10% (both P < .05).
Atorvastatin is a potent antihyperlipidemic but is quite expensive, costing up to $700 for a 1-year supply of 10-mg tablets in retail pharmacies. Weekly dosing has the potential to lower costs and increase convenience while maintaining a similar effect on lipids. The active metabolites have a serum half-life of 11 to 57 hours,1-4 acting on a target that responds slowly to intervention. Furthermore, atorvastatin demonstrates prolonged inhibition of HMG-CoA reductase compared with other statins, presumably because of longer residence of the drug or its metabolites in the liver.5 Two abstracts of meeting presentations have reported efficacy for alternate-day dosing on small patient samples,1,2 but no reported attempts have been made to test longer dosing intervals. The purpose of this pilot study was to investigate the effect of weekly dosing of atorvastatin on patients who were currently well controlled on daily doses of the drug.
Methods
Selection of patients
Twenty-four consecutive patients presenting for routine follow-up in a private clinical practice whose LDL-C levels exceeded National Cholesterol Education Program (NCEP-II) guidelines6 on 2 occasions and who had successfully met their goals on 10 mg atorvastatin daily were offered a 12-week trial of 20 mg atorvastatin weekly. All 24 patients gave written informed consent, although one changed his mind and never altered his dosing and another experienced headaches after taking the first 20-mg dose and reverted to a regimen of 10 mg daily.
Study protocol
Study participants were instructed verbally and in writing to make no special efforts to change their lifestyle as a result of their involvement. The potential skewing effect of such efforts on research was explained. If they were already intending to alter their diet or exercise levels, this was acceptable. They were to take atorvastatin at the usual time of day on a day of the week that seemed most convenient. If they forgot a dose, it was to be taken the next day. Compliance with weekly dosing was assessed at each contact by explicit questioning. Fasting chemical and lipid profiles were available on patients’ charts; for purpose of analysis, the last profile before initiation of any statin therapy was used as the pretreatment baseline and the last profile on 10 mg atorvastatin daily as the treatment baseline. Profiles were repeated with the patient fasting on the seventh day after the last 20-mg dose before that dose was repeated.
Statistical analysis
The data were analyzed with repeated measures ANOVA followed by a Student–Newman–Kuels post hoc test to determine differences between specific treatments. Differences with a 2-tailed P value of less than .05 were considered statistically significant.
Results
Baseline characteristics
Table 1 presents the baseline characteristics of participants. The average age was 54 years (range 42 to 72 years). There were 12 men and 10 women. Thirteen subjects had comorbid conditions (9 hypertension, 4 type 2 diabetes, 1 hepatitis C, 2 coronary artery disease, and 2 tobacco use).
TABLE 1
BASELINE CHARACTERISTICS OF STUDY PARTICIPANTS
| Characteristic | Number |
|---|---|
| Male / female | 12 / 10 |
| Comorbidity | |
| Hypertension | 9 |
| Type 2 diabetes mellitus | 4 |
| Hepatitis C | 1 |
| Coronary artery disease | 2 |
| Smoking | 2 |
| Mean age in years (range) | 54 (42–72) |
Cholesterol reduction
Results for LDL-C, HDL-C, triglycerides, TC, TC/HDL-C ratio, and aspartate aminotransferase (AST) are summarized in Table 2. LDL levels fell 43% and 22%, respectively, on daily and weekly dosing; HDL-C levels were essentially unchanged; triglycerides fell 20% and 10%; TC, 33% and 16%; TC/HDL-C, 31% and 17%; and AST, 0% and 21%.
TABLE 2
RESPONSE OF LIPID PARAMETERS TO DAILY AND WEEKLY DOSING WITH ATORVASTATIN
| Pretreatment | 10 mg Daily | 20 mg Weekly | |
|---|---|---|---|
| LDL-C mg/dL | 178 | 101 *† | 138 * |
| HDL-C mg/dL | 46 | 46 | 48 |
| Triglycerides mg/dL | 174 | 139 * | 157 * |
| Total cholesterol mg/dL | 259 | 175 *† | 218 * |
| Total cholesterol/HDL-C ratio | 5.8 | 4.0 *† | 4.8 * |
| AST U/L | 28 | 28 | 22 |
| * P < .05 vs pretreatment. | |||
| † P < .05 vs 20 mg weekly. | |||
| Conversion factors: | |||
| LDL-C, HDL-C, TC: (mg/dL) x (.026) = SI mmol/L | |||
| Triglycerides: (mg/dL) x (.011) = SI mmol/L | |||
| AST denotes aspartate aminotransferase; HDL-C, high-density lipoprotein cholesterol; LDL-C, low-density lipoprotein cholesterol; SI, Système Internationale. | |||
Adverse reactions
The only reported adverse reaction from doubling the dose of atorvastatin was headache in the patient who dropped out for that reason. No attempt was made to repeat the higher dose to see if this reaction was replicable. No subjects reported myalgias. The mean AST actually dropped on weekly dosing. One patient who had hepatitis C and was in clinical remission experienced a fall in pretreatment AST on daily dosing and a further reduction on weekly dosing.
Discussion
With pharmaceutical costs leading medical inflation, a current challenge for clinicians is to alter the cost-benefit ratio of prescriptions to the advantage of patients. Weekly dosing, as has recently been approved for alendronate sodium (Fosamax) and fluoxetine hydrochloride (Prozac), is one approach to this problem. In this preliminary study, weekly dosing of 20 mg atorvastatin resulted in a 22% reduction of LDL-C, measured on the seventh day after dosing. This regimen represents an approximately 80% reduction in yearly cost compared with that of a regimen of 10 mg daily.
Since this study did not investigate the pattern of LDL-C reduction in the interval between doses, further research is needed to delineate the area under the curve and the impact on clinical outcomes before conclusions may be drawn regarding the effectiveness of weekly dosing.
Acknowledgment
The author wishes to acknowledge the assistance of William Harris, PhD, in editing and statistical analysis.
1. Jafari M, et al. Efficacy of alternate day dosing with atorvastatin. ACCP annual meeting abstracts; 1999.
2. Matalka M, Ravnan M, Deedwania P. Is alternate day dosing of atorvastatin effective in managing patients with hyperlipidemia? JAAC abstracts; February 2001.
3. Cilla DD, Jr, Whitfield LR, Gibson DM, Sedman AJ, Posvar EL. Multiple-dose pharmacokinetics, pharmacodynamics, and safety of atorvastatin, an inhibitor of HMG-CoA reductase, in healthy subjects. Clin Pharmacol Ther 1996;60:687-95.
4. Posvar EL, Radulovic LL, Cilla DD, Jr, Whitfield LR, Sedman AJ. Tolerance and pharmacokinetics of single-dose atorvastatin, a potent inhibitor or HMG-CoA reductase, in healthy subjects. J Clin Pharmacol 1996;36:729-31.
5. Naoumova RP, Dunn S, Rallidis L, et al. Prolonged inhibition of cholesterol synthesis explains the efficacy of atorvastatin. J Lipid Res 1997;38:1496-500.
6. Executive summary of the third report of the National Cholesterol Education Program (NCEP) expert panel on detection, evaluation, and treatment of high blood cholesterol in adults (Adult Treatment Panel III). JAMA 2001;285:2486-97.
How Common Is Hip Pain Among Older Adults?
OBJECTIVE: To determine the incidence of self-reported significant hip pain using a nationally representative sample of older adults in the United States.
STUDY DESIGN: Subjects were interviewed to determine their leisure time physical activity levels and whether they experienced severe hip pain. Sampling weights were calculated to account for unequal selection probabilities. The impact of race, age, and physical activity status was examined as influential factors affecting hip pain.
POPULATION: We interviewed 6596 adults aged 60 years and older as part of the third National Health and Nutrition Examination Survey (NHANES III).
OUTCOME MEASURED: We measured the prevalence of hip pain.
RESULTS: A total of 14.3% of participants aged 60 years and older reported significant hip pain on most days over the past 6 weeks. Men reported hip pain less frequently than women. Age did not influence self-reported hip pain in men. The lowest prevalence of hip pain was found in women aged 60 to 70 years. Sixteen percent of non-Hispanic white women reported hip pain, compared with 14.8% of black women and 19.3% of Mexican American women. Among non-Hispanic white men, 12.4% reported hip pain, a proportion no different from that of their black and Mexican American male counterparts. Among older US adults, 18.4% of those who had not participated in leisure time physical activity during the previous month reported severe hip pain; 12.6% of those who did engage in physical activity reported hip pain.
CONCLUSIONS: Self-reported hip pain has increased since NHANES I (1971-1975). Further studies are needed to identify individuals at highest risk for severe hip pain and to identify optimal treatment of hip pain.
- Self-reported hip pain has increased in older adults since surveys conducted from 1971 to 1975.
- A total of 14.3% of older adults report significant hip pain; men report hip pain less frequently than women.
- Sex, age, and race are important determinants of hip pain in older adults.
According to a report by the National Arthritis Data Workgroup based on data from the first National Health and Nutrition Examination Survey (NHANES I), the prevalence of symptomatic hip osteoarthritis (OA) is 0.7% in both adult women and men; 0.5% have moderate or severe symptoms.1 The incidence of symptomatic hip OA was higher in women than in men, and increased with age in both sexes until age 80 years, with a slight decline beyond that age.2 In a study of patients in a health maintenance organization, the incidence of symptomatic hip OA in elderly women was 239 per 100,000 person-years at ages 60 to 69 years, 583 per 100,000 person-years at ages 70 to 79 years, and 441 per 100,000 person-years for women older than 80 years. The corresponding rates for elderly men per 100,000 person-years were 158, 445, and 264, respectively.
In contrast, the prevalence of radiographic hip OA is 3.1%; risk factors for the development of radiographic changes appear different in women and men.3 As has been demonstrated in the knee, radiographic hip OA is more prevalent than symptomatic disease. Only 61% of older individuals with confirmed radiologic hip OA reported pain at the hip, while 11% without radiologic changes of OA had significant hip pain, presumably of nonarticular etiology. Factors that affect patients’ reporting of symptoms of hip pain, both from OA and from nonarticular sources, have not yet been fully elucidated.
We are not aware of any current nationally representative reports on the sex-specific and race-specific prevalence of hip pain in older adults. Therefore, the purpose of our investigation was to examine the age-specific prevalence of hip pain using a current nationally representative sample of older US adults. We will also describe the prevalence of self-reported hip pain among older adults from 2 of the largest minority groups in the United States: non-Hispanic blacks and Mexican Americans.
Methods
Sample design
The Third National Health and Nutrition Examination Survey (NHANES III) was conducted by the Centers for Disease Control and Prevention, National Center for Health Statistics. The plan and operation of NHANES III have been described elsewhere.5,6 Briefly, the survey was designed to produce a nationally representative sample of the civilian noninstitutionalized US population. One of the main goals of this survey was to estimate the national prevalence of selected health conditions and risk factors.
The NHANES III represents a 6-year study that was conducted from 1988 through 1994 consisting of 2 phases lasting 3 years each: phase I, 1988 through 1992, and phase II, 1991 through 1994. The survey was designed so that each phase was a nationally representative sample. Information presented in this report reflect data from phases I and II combined. The NHANES III oversampled Mexican Americans, non-Hispanic blacks, and older adults to ensure weighted, reliable estimates from these groups.
Each interview was conducted in the participant’s home. In addition, a detailed clinical examination was conducted in a mobile examination center. For the purposes of this investigation, we examined the data from the 6596 adults 60 years and older. The interviewing staff consisted of experienced persons, many of Hispanic origin or fluent in both English and Spanish. All staff members attended annual training sessions to ensure maintenance of effective interviewing skills.
Information on self-reported race and ethnicity was used to classify persons as non-Hispanic white, non-Hispanic blacks, or Mexican American (persons of Mexican origin living in the United States). Age was defined as the age, in years, at the time of the household interview, which preceded the medical examination by 2 to 3 weeks.
Hip pain
Participating adults 60 years and older were asked to report “whether they had experienced significant hip pain on most days over the preceding 6 weeks.”
Physical activity assessment
Trained interviewers used a questionnaire to obtain information on leisure time physical activity (LTPA) during the previous month. The questionnaire was adapted from the 1985 National Health Interview Survey (NHIS), which was used to establish baseline estimates for several Healthy People 2000 physical activity objectives. Participants were asked to specify the frequency of participation in LTPA during the previous month for the following activities: jogging or running, riding a bicycle outdoors or an indoor stationary bicycle, swimming, aerobic dancing, other dancing, calisthenics or floor exercises, gardening or yard work, and weight lifting. Four open-ended questions assessed information on physical activities not previously listed. Participants who responded negatively to all LTPA questions, including the 4 open-ended questions, were classified as persons who participate in no LTPA.
Statistical analysis
Statistical analyses were carried out using the SAS7 and WesVar PC8 software packages. For each survey, sampling weights were calculated that took into account the unequal selection probabilities resulting from the cluster design and from planned oversampling of certain subgroups. All analyses have incorporated sampling weights.
Results
Overall, 14.3% (95% CI, 13.1-15.5) of older US adults reported significant hip pain on most days over the previous 6 weeks. The age-specific and sex-specific prevalence estimates of US adults reporting severe hip pain on most days are shown in Figure 1 Men reported hip pain less frequently (11.9.1%; 95% CI, 10.2-13.7) than women (16.2%; 95% CI, 14.5-17.8). Reports of hip pain are similar in men aged 60 to 70 years, 70 to 80 years, or older than 80 years. The lowest prevalence of hip pain was reported by women aged 60 to 70 years.
The race-specific prevalence of severe hip pain on most days during the previous 6 weeks is shown in Figure 2. Among non-Hispanic white adults aged 60 years and older, 12.4% of men (95% CI, 10.2-14.1) and 16.0% of women (95% CI, 14.0-17.9) reported hip pain. In contrast, 14.8% (95% CI, 11.7-17.9) of non-Hispanic black women reported hip pain, as did 19.3% (95% CI, 14.9-23.7) of Mexican American women. Reports of hip pain among non-Hispanic black men and Mexican American men were similar to those of their non-Hispanic white male counterparts.
Among adults aged 60 years or older, 18.4% (95% CI, 16.5-20.7) of those who participated in no leisure time physical activity reported severe hip pain, while 12.6% (95% CI, 11.7-14.1) of those who did participate in some activity reported such pain.
FIGURE 1
PREVALENCE OF SIGNIFICANT HIP PAIN ON MOST DAYS IN OLDER ADULTS, STRATIFIED BY AGE AND SEX
FIGURE 2
PREVALENCE OF SIGNIFICANT HIP PAIN ON MOST DAYS IN OLDER ADULTS, STRATIFIED BY RACE AND SEX
Discussion
This study offers a current report of the prevalence estimates of significant hip pain among US adults aged 60 years or older. We found that hip pain affects a higher number of older Americans than would be expected from previous studies. For instance, data from NHANES I demonstrated that from 1971 through 1975, 0.7% of patients reported hip pain secondary to OA.1 NHANES I, however, did not include any subjects older than 74 years. Our study found that 14.3% of US adults aged 60 years or older report hip pain on most days of previous 6 weeks, but we cannot yet determine the etiology of this pain.
There are 2 possible explanations of this apparent increase in hip pain between the time of NHANES I and that of NHANES III. First, the source of most hip pain in the elderly may be nonarticular in nature. Once radiographic data become available for NHANES III, this possibility can be further analyzed. A second explanation may be that the incidence of hip OA is increasing over time. This explanation is plausible, considering both the aging of the population in the United States and the increasing rates of obesity and sedentary lifestyle. Here, too, radiographic data will be useful.
We recently reported that sex, age, and race have a strong impact on knee pain.9 In our current study, we found that these are also important determinants of hip pain, but the findings were less striking than with knee pain. Men reported hip pain less often than women (11.9% versus 16.2%, respectively), but men aged 60 to 69 years were as likely to report hip pain as the men 80 years and older. There was no difference between the women in the 70- to 79-year group and those 80 years and older, but the women in both groups reported pain more often than did those aged 60 to 69 years. These findings are similar to those of Frankel and colleagues,10 who found that hip pain in a United Kingdom population was higher for women (overall prevalence 173 per 1000) than for men (overall prevalence 107 per 1000) at every age group; for both sexes it increased with age. This result is surprising, given that the prevalence of radiographic OA of the hip is more common in men than women aged 55 to 74 years, and in both sexes the prevalence of radiographic OA increases with age.1 The effects of sex and age on nonarticular hip pain (eg, bursitis) may partially explain the discrepancy. Additionally, there may be a reporting bias because women are more likely to report pain at any joint than are men.11 In one report, women had a higher rate of elective total hip replacement, but men tended to be younger at the time of surgery.12
We found no previous reports of the effect of race on the reporting of hip pain. In our study, Mexican American women were more likely to report hip pain (19.3%) than were non-Hispanic black (14.8%) or non-Hispanic white (15.9%) women. Race did not significantly affect reports of hip pain in men. In addition, people who report no leisure time activity were more likely to report hip pain. A sedentary lifestyle is more common among non-Hispanic blacks and Mexican Americans than among whites13-15 and may partially explain some of the difference in reporting by racial groups.
We acknowledge the limitations of self-report and the cross-sectional nature of this study. Given the cross-sectional nature of this study, we cannot determine the direction of causality; however, it is of concern that significant hip pain may contribute to a more sedentary lifestyle (and its attendant risks). As such, significant hip pain deserves a thorough investigation.
Conclusions
Our study reports on the most current nationally representative data that provide estimates of the prevalence of hip pain in older adults in the United States. Future studies are needed to further identify those at highest risk for hip pain and resultant debility and to determine optimal treatment of hip pain, particularly in Mexican American women.
Acknowledgments
Dr Andersen’s work is supported by Grant No. 97214-G from The John A. Hartford Foundation and by Grant No. DK 53907 from the National Institute of Digestive, Diabetes, and Kidney Diseases.
1. Lawrence RC, Hochberg MC, Kelsey JL, et al. Estimates of the prevalence of selected arthritic and musculoskeletal diseases in the United States. J Rheumatol 1989;16:427-41.
2. Oliveria SA, Felson DT, Reed JI, Cirillo PA, Walker AM. Incidence of symptomatic hand, hip, and knee osteoarthritis among patients in a health maintenance organization. Arthritis Rheum 1995;38:1134-141.
3. Tepper S, Hochberg MC. Factors associated with hip osteoarthritis: data from the First National Health and Nutrition Examination Survey (NHANES I). Am J Epidemiol 1993;137:1081-8.
4. Lawrence JS, Bremner JM, Bier F. Osteoarthrosis. Ann Rheum Dis 1966;25:1-24.
5. National Center for Health Statistics. Plan and operation of the Third National Health and Nutrition Examination Survey, 1988-94. Hyattsville, Md: US Department of Health and Human Services, Public Health Service, Centers for Disease Control and Prevention, National Center for Health Statistics; 1994.
6. Ezzati TM, Massey JT, Waksberg J, Chu A, Maurer KR. Sample design: Third National Health and Nutrition Examination Survey. Vital Health Stat 1992;2:1-35.
7. SAS Institute Inc. SASå/STAT User’s Guide, Version 6. Cary, NC: SAS Institute; 1989.
8. Brick JM, Broene P, James P, Severynse J. A user’s guide to WesVar PC. Rockville, Md: Westat Inc.; 1997.
9. Andersen RE, Crespo CJ, Ling SM, Bathon JM, Bartlett SJ. Prevalence of significant knee pain among older Americans: results from the Third National Health and Nutrition Examination Survey. J Am Geriatr Soc 1999;1435-8.
10. Frankel S, Eachus J, Pearson N, et al. Population requirement for primary hip-replacement surgery: a cross sectional study. Lancet 1999;353:1304-9.
11. Ling SM, Bathon JM. Osteoarthritis in older adults. J Am Geriatr Soc 1998;46:216-25.
12. Madhok R, Lewallen DG, Wallrichs SL, Ilstrup DM, Kurland RL, Melton LJ. Trends in the utilization of primary total hip arthroplasty, 1969 through 1990: a population-based study in Olmsted County, Minnesota. Mayo Clin Proc 1993;68:11-18.
13. Crespo CJ, Keteyian SJ, Heath GW, Sempos CT. Leisure-time physical activity among US adults: results from the third National Health and Nutrition Examination Survey. Arch Intern Med 1996;156:93-8.
14. US Department of Health and Human Services. Physical activity and health: a report of the surgeon general. Atlanta, Ga: US Department of Health and Human Services, Centers for Disease Control and Prevention, National Center for Chronic Disease Prevention and Health Promotion; 1996.
15. Crespo CJ, Keteyian SJ, Snelling A, Smit E, Andersen RE. Prevalence of no leisure time physical activity in persons with chronic disease. Clin Exerc Physiol 2000;1:68-73.
OBJECTIVE: To determine the incidence of self-reported significant hip pain using a nationally representative sample of older adults in the United States.
STUDY DESIGN: Subjects were interviewed to determine their leisure time physical activity levels and whether they experienced severe hip pain. Sampling weights were calculated to account for unequal selection probabilities. The impact of race, age, and physical activity status was examined as influential factors affecting hip pain.
POPULATION: We interviewed 6596 adults aged 60 years and older as part of the third National Health and Nutrition Examination Survey (NHANES III).
OUTCOME MEASURED: We measured the prevalence of hip pain.
RESULTS: A total of 14.3% of participants aged 60 years and older reported significant hip pain on most days over the past 6 weeks. Men reported hip pain less frequently than women. Age did not influence self-reported hip pain in men. The lowest prevalence of hip pain was found in women aged 60 to 70 years. Sixteen percent of non-Hispanic white women reported hip pain, compared with 14.8% of black women and 19.3% of Mexican American women. Among non-Hispanic white men, 12.4% reported hip pain, a proportion no different from that of their black and Mexican American male counterparts. Among older US adults, 18.4% of those who had not participated in leisure time physical activity during the previous month reported severe hip pain; 12.6% of those who did engage in physical activity reported hip pain.
CONCLUSIONS: Self-reported hip pain has increased since NHANES I (1971-1975). Further studies are needed to identify individuals at highest risk for severe hip pain and to identify optimal treatment of hip pain.
- Self-reported hip pain has increased in older adults since surveys conducted from 1971 to 1975.
- A total of 14.3% of older adults report significant hip pain; men report hip pain less frequently than women.
- Sex, age, and race are important determinants of hip pain in older adults.
According to a report by the National Arthritis Data Workgroup based on data from the first National Health and Nutrition Examination Survey (NHANES I), the prevalence of symptomatic hip osteoarthritis (OA) is 0.7% in both adult women and men; 0.5% have moderate or severe symptoms.1 The incidence of symptomatic hip OA was higher in women than in men, and increased with age in both sexes until age 80 years, with a slight decline beyond that age.2 In a study of patients in a health maintenance organization, the incidence of symptomatic hip OA in elderly women was 239 per 100,000 person-years at ages 60 to 69 years, 583 per 100,000 person-years at ages 70 to 79 years, and 441 per 100,000 person-years for women older than 80 years. The corresponding rates for elderly men per 100,000 person-years were 158, 445, and 264, respectively.
In contrast, the prevalence of radiographic hip OA is 3.1%; risk factors for the development of radiographic changes appear different in women and men.3 As has been demonstrated in the knee, radiographic hip OA is more prevalent than symptomatic disease. Only 61% of older individuals with confirmed radiologic hip OA reported pain at the hip, while 11% without radiologic changes of OA had significant hip pain, presumably of nonarticular etiology. Factors that affect patients’ reporting of symptoms of hip pain, both from OA and from nonarticular sources, have not yet been fully elucidated.
We are not aware of any current nationally representative reports on the sex-specific and race-specific prevalence of hip pain in older adults. Therefore, the purpose of our investigation was to examine the age-specific prevalence of hip pain using a current nationally representative sample of older US adults. We will also describe the prevalence of self-reported hip pain among older adults from 2 of the largest minority groups in the United States: non-Hispanic blacks and Mexican Americans.
Methods
Sample design
The Third National Health and Nutrition Examination Survey (NHANES III) was conducted by the Centers for Disease Control and Prevention, National Center for Health Statistics. The plan and operation of NHANES III have been described elsewhere.5,6 Briefly, the survey was designed to produce a nationally representative sample of the civilian noninstitutionalized US population. One of the main goals of this survey was to estimate the national prevalence of selected health conditions and risk factors.
The NHANES III represents a 6-year study that was conducted from 1988 through 1994 consisting of 2 phases lasting 3 years each: phase I, 1988 through 1992, and phase II, 1991 through 1994. The survey was designed so that each phase was a nationally representative sample. Information presented in this report reflect data from phases I and II combined. The NHANES III oversampled Mexican Americans, non-Hispanic blacks, and older adults to ensure weighted, reliable estimates from these groups.
Each interview was conducted in the participant’s home. In addition, a detailed clinical examination was conducted in a mobile examination center. For the purposes of this investigation, we examined the data from the 6596 adults 60 years and older. The interviewing staff consisted of experienced persons, many of Hispanic origin or fluent in both English and Spanish. All staff members attended annual training sessions to ensure maintenance of effective interviewing skills.
Information on self-reported race and ethnicity was used to classify persons as non-Hispanic white, non-Hispanic blacks, or Mexican American (persons of Mexican origin living in the United States). Age was defined as the age, in years, at the time of the household interview, which preceded the medical examination by 2 to 3 weeks.
Hip pain
Participating adults 60 years and older were asked to report “whether they had experienced significant hip pain on most days over the preceding 6 weeks.”
Physical activity assessment
Trained interviewers used a questionnaire to obtain information on leisure time physical activity (LTPA) during the previous month. The questionnaire was adapted from the 1985 National Health Interview Survey (NHIS), which was used to establish baseline estimates for several Healthy People 2000 physical activity objectives. Participants were asked to specify the frequency of participation in LTPA during the previous month for the following activities: jogging or running, riding a bicycle outdoors or an indoor stationary bicycle, swimming, aerobic dancing, other dancing, calisthenics or floor exercises, gardening or yard work, and weight lifting. Four open-ended questions assessed information on physical activities not previously listed. Participants who responded negatively to all LTPA questions, including the 4 open-ended questions, were classified as persons who participate in no LTPA.
Statistical analysis
Statistical analyses were carried out using the SAS7 and WesVar PC8 software packages. For each survey, sampling weights were calculated that took into account the unequal selection probabilities resulting from the cluster design and from planned oversampling of certain subgroups. All analyses have incorporated sampling weights.
Results
Overall, 14.3% (95% CI, 13.1-15.5) of older US adults reported significant hip pain on most days over the previous 6 weeks. The age-specific and sex-specific prevalence estimates of US adults reporting severe hip pain on most days are shown in Figure 1 Men reported hip pain less frequently (11.9.1%; 95% CI, 10.2-13.7) than women (16.2%; 95% CI, 14.5-17.8). Reports of hip pain are similar in men aged 60 to 70 years, 70 to 80 years, or older than 80 years. The lowest prevalence of hip pain was reported by women aged 60 to 70 years.
The race-specific prevalence of severe hip pain on most days during the previous 6 weeks is shown in Figure 2. Among non-Hispanic white adults aged 60 years and older, 12.4% of men (95% CI, 10.2-14.1) and 16.0% of women (95% CI, 14.0-17.9) reported hip pain. In contrast, 14.8% (95% CI, 11.7-17.9) of non-Hispanic black women reported hip pain, as did 19.3% (95% CI, 14.9-23.7) of Mexican American women. Reports of hip pain among non-Hispanic black men and Mexican American men were similar to those of their non-Hispanic white male counterparts.
Among adults aged 60 years or older, 18.4% (95% CI, 16.5-20.7) of those who participated in no leisure time physical activity reported severe hip pain, while 12.6% (95% CI, 11.7-14.1) of those who did participate in some activity reported such pain.
FIGURE 1
PREVALENCE OF SIGNIFICANT HIP PAIN ON MOST DAYS IN OLDER ADULTS, STRATIFIED BY AGE AND SEX
FIGURE 2
PREVALENCE OF SIGNIFICANT HIP PAIN ON MOST DAYS IN OLDER ADULTS, STRATIFIED BY RACE AND SEX
Discussion
This study offers a current report of the prevalence estimates of significant hip pain among US adults aged 60 years or older. We found that hip pain affects a higher number of older Americans than would be expected from previous studies. For instance, data from NHANES I demonstrated that from 1971 through 1975, 0.7% of patients reported hip pain secondary to OA.1 NHANES I, however, did not include any subjects older than 74 years. Our study found that 14.3% of US adults aged 60 years or older report hip pain on most days of previous 6 weeks, but we cannot yet determine the etiology of this pain.
There are 2 possible explanations of this apparent increase in hip pain between the time of NHANES I and that of NHANES III. First, the source of most hip pain in the elderly may be nonarticular in nature. Once radiographic data become available for NHANES III, this possibility can be further analyzed. A second explanation may be that the incidence of hip OA is increasing over time. This explanation is plausible, considering both the aging of the population in the United States and the increasing rates of obesity and sedentary lifestyle. Here, too, radiographic data will be useful.
We recently reported that sex, age, and race have a strong impact on knee pain.9 In our current study, we found that these are also important determinants of hip pain, but the findings were less striking than with knee pain. Men reported hip pain less often than women (11.9% versus 16.2%, respectively), but men aged 60 to 69 years were as likely to report hip pain as the men 80 years and older. There was no difference between the women in the 70- to 79-year group and those 80 years and older, but the women in both groups reported pain more often than did those aged 60 to 69 years. These findings are similar to those of Frankel and colleagues,10 who found that hip pain in a United Kingdom population was higher for women (overall prevalence 173 per 1000) than for men (overall prevalence 107 per 1000) at every age group; for both sexes it increased with age. This result is surprising, given that the prevalence of radiographic OA of the hip is more common in men than women aged 55 to 74 years, and in both sexes the prevalence of radiographic OA increases with age.1 The effects of sex and age on nonarticular hip pain (eg, bursitis) may partially explain the discrepancy. Additionally, there may be a reporting bias because women are more likely to report pain at any joint than are men.11 In one report, women had a higher rate of elective total hip replacement, but men tended to be younger at the time of surgery.12
We found no previous reports of the effect of race on the reporting of hip pain. In our study, Mexican American women were more likely to report hip pain (19.3%) than were non-Hispanic black (14.8%) or non-Hispanic white (15.9%) women. Race did not significantly affect reports of hip pain in men. In addition, people who report no leisure time activity were more likely to report hip pain. A sedentary lifestyle is more common among non-Hispanic blacks and Mexican Americans than among whites13-15 and may partially explain some of the difference in reporting by racial groups.
We acknowledge the limitations of self-report and the cross-sectional nature of this study. Given the cross-sectional nature of this study, we cannot determine the direction of causality; however, it is of concern that significant hip pain may contribute to a more sedentary lifestyle (and its attendant risks). As such, significant hip pain deserves a thorough investigation.
Conclusions
Our study reports on the most current nationally representative data that provide estimates of the prevalence of hip pain in older adults in the United States. Future studies are needed to further identify those at highest risk for hip pain and resultant debility and to determine optimal treatment of hip pain, particularly in Mexican American women.
Acknowledgments
Dr Andersen’s work is supported by Grant No. 97214-G from The John A. Hartford Foundation and by Grant No. DK 53907 from the National Institute of Digestive, Diabetes, and Kidney Diseases.
1. Lawrence RC, Hochberg MC, Kelsey JL, et al. Estimates of the prevalence of selected arthritic and musculoskeletal diseases in the United States. J Rheumatol 1989;16:427-41.
2. Oliveria SA, Felson DT, Reed JI, Cirillo PA, Walker AM. Incidence of symptomatic hand, hip, and knee osteoarthritis among patients in a health maintenance organization. Arthritis Rheum 1995;38:1134-141.
3. Tepper S, Hochberg MC. Factors associated with hip osteoarthritis: data from the First National Health and Nutrition Examination Survey (NHANES I). Am J Epidemiol 1993;137:1081-8.
4. Lawrence JS, Bremner JM, Bier F. Osteoarthrosis. Ann Rheum Dis 1966;25:1-24.
5. National Center for Health Statistics. Plan and operation of the Third National Health and Nutrition Examination Survey, 1988-94. Hyattsville, Md: US Department of Health and Human Services, Public Health Service, Centers for Disease Control and Prevention, National Center for Health Statistics; 1994.
6. Ezzati TM, Massey JT, Waksberg J, Chu A, Maurer KR. Sample design: Third National Health and Nutrition Examination Survey. Vital Health Stat 1992;2:1-35.
7. SAS Institute Inc. SASå/STAT User’s Guide, Version 6. Cary, NC: SAS Institute; 1989.
8. Brick JM, Broene P, James P, Severynse J. A user’s guide to WesVar PC. Rockville, Md: Westat Inc.; 1997.
9. Andersen RE, Crespo CJ, Ling SM, Bathon JM, Bartlett SJ. Prevalence of significant knee pain among older Americans: results from the Third National Health and Nutrition Examination Survey. J Am Geriatr Soc 1999;1435-8.
10. Frankel S, Eachus J, Pearson N, et al. Population requirement for primary hip-replacement surgery: a cross sectional study. Lancet 1999;353:1304-9.
11. Ling SM, Bathon JM. Osteoarthritis in older adults. J Am Geriatr Soc 1998;46:216-25.
12. Madhok R, Lewallen DG, Wallrichs SL, Ilstrup DM, Kurland RL, Melton LJ. Trends in the utilization of primary total hip arthroplasty, 1969 through 1990: a population-based study in Olmsted County, Minnesota. Mayo Clin Proc 1993;68:11-18.
13. Crespo CJ, Keteyian SJ, Heath GW, Sempos CT. Leisure-time physical activity among US adults: results from the third National Health and Nutrition Examination Survey. Arch Intern Med 1996;156:93-8.
14. US Department of Health and Human Services. Physical activity and health: a report of the surgeon general. Atlanta, Ga: US Department of Health and Human Services, Centers for Disease Control and Prevention, National Center for Chronic Disease Prevention and Health Promotion; 1996.
15. Crespo CJ, Keteyian SJ, Snelling A, Smit E, Andersen RE. Prevalence of no leisure time physical activity in persons with chronic disease. Clin Exerc Physiol 2000;1:68-73.
Does Amoxicillin Improve Outcomes in Patients with Purulent Rhinorrhea?
OBJECTIVE: To compare the efficacy of amoxicillin vs placebo in patients with an acute upper respiratory tract infection and purulent rhinorrhea.
STUDY DESIGN: Double-blind randomized placebo-controlled trial.
POPULATION: The 416 patients included from 69 family practices were 12 years or older, presenting with acute upper respiratory complaints, and having a history of purulent rhinorrhea and no signs of complications of sinusitis.
OUTCOMES MEASURED: Therapy success (disappearance of symptoms that most greatly affected the patient’s health) at day 10 and duration of general illness, pain, and purulent rhinorrhea.
RESULTS: Therapy was successful in 35% of patients with amoxicillin and in 29% of patients with placebo (relative risk [RR] 1.14, 95% confidence interval [CI], 0.92-1.42). There was no effect on duration of general illness or pain. Duration of purulent rhinorrhea was shortened by amoxicillin (9 days vs 14 for clearing of purulent rhinorrhea in 75% of patients; P = .007). Diarrhea was more frequent with amoxicillin (29% vs 19%, RR 1.28, 95% CI, 1.05-1.57). No complications were reported. One patient (0.5%) receiving amoxicillin and 7 (3.4%) receiving placebo discontinued trial therapy because of exacerbation of symptoms (RR 0.25, 95% CI 0.04-1.56, P = .07). All 8 patients recovered with antibiotic therapy.
CONCLUSIONS: Amoxicillin has a beneficial effect on purulent rhinorrhea caused by an acute infection of the nose or sinuses but not on general recovery. The practical implication is that all such patients, whatever the suspected diagnosis, can be safely treated with symptomatic therapy and instructed to return if symptoms worsen.
- In patients with an acute upper respiratory tract infection that includes purulent rhinorrhea, treatment with amoxicillin has no effect on general recovery and increases the frequency of diarrhea.
- In most patients, symptoms of acute respiratory tract infection last for more than 10 days.
- Treatment without antibiotics and with appropriate follow-up is safe.
- Patients with purulent rhinorrhea caused by an acute infection of the nose or sinuses can initially be treated with symptomatic therapy, whatever the suspected diagnosis, and instructed to return if symptoms worsen.
Infections of the nasal passages are very common1 and among the most frequent reasons for the prescription of antibiotics.2,3 Such infections comprise diagnoses that include upper respiratory tract infection (URTI), rhinitis, rhinopharyngitis, and rhinosinusitis, which are very difficult to distinguish because of the lack of specific clinical features or simple office-based diagnostic tests.4-7 These diagnostic difficulties probably explain why it remains unclear whether and when antibiotics should be used for such patients in clinical practice.
Although evidence shows that a small minority of patients benefit from antibiotic therapy, these patients are extremely difficult to recognize or identify. Three meta-analyses8-10 on the effect of antibiotics in rhinosinusitis and 5 of 6 recent trials investigating the effect of antibiotics in rhinosinusitis,11-13 rhinitis, 14 and bacterial rhinopharyngitis15 almost exclusively studied patients with a diagnosis established by laboratory or imaging investigation. As a result, implementing the findings is difficult in daily practice, where radiologic or laboratory tests are not obtained for most patients with respiratory infections. Only 1 of the 6 trials16 included patients with a set of clinical symptoms indicating rhinosinusitis. Because inclusion criteria were rather stringent, however, findings are applicable only to a small group of patients.
The purpose of this trial was to investigate the benefits of antibiotic therapy in a larger group of patients with nose or sinus infections, thereby making the results more widely applicable. Accordingly, we conducted a randomized, double-blind, placebo-controlled trial comparing the effect of amoxicillin with that of placebo in family practice patients with an acute upper respiratory tract infection and presenting with purulent rhinorrhea. Purulent rhinorrhea was chosen as the minimal criterion because it is the symptom most consistently associated with rhinosinusitis in diagnostic studies5,17-21 and because its presence often leads family physicians (FPs) to prescribe antibiotics.23-26 The trial was designed as a pragmatic effectiveness trial. Patient inclusion and evaluation were defined on a purely clinical basis to maximize relevance for routine daily practice.
Methods
Study population
Between October 1998 and December 1999, 69 FPs in Flanders, Belgium, agreed to enroll patients meeting the following inclusion criteria: age 12 years or older, presenting with a respiratory tract infection, and having purulent rhinorrhea. Exclusion criteria were allergy to penicillin or ampicillin; having received antibiotic therapy within the previous week; complaints lasting for more than 30 days; abnormality on clinical chest examination; complications of sinusitis (facial edema or cellulitis; orbital, visual, meningeal, or cerebral signs)27; pregnancy or lactation; comorbidity that might impair immune competence; and inability to follow the protocol because of language or mental problems. The Ethics Committee of the Ghent University Hospital (GUH) approved the study. All patients (or their guardians, for those younger than 16 years of age) gave written informed consent.
Treatment assignment and masking
In this double-blind trial, patients were assigned via a computer-generated random number list to receive 500 mg amoxicillin 3 times a day or placebo for 10 days. The trial medication was supplied in numbered uniform cardboard boxes, each containing 30 capsules of the same size, color, and shape for active and placebo treatment. The randomization list, kept at the pharmacy of GUH, was accessible to the participating FPs only in case of a serious adverse event.
To assess the effectiveness of masking, patients and their FPs guessed the treatment group at 10-day follow-up. Data were encoded and entered without knowledge of treatment allocation. Compliance was assessed by counting leftover medication. All patients were allowed to use xylometazoline 1% nose drops and paracetamol or ibuprofen to alleviate symptoms; these data were registered.
Assessment of potential recruitment bias caused by exclusion
First, we compared the characteristics of patients enrolled by high-recruiting FPs (at least 14 patients recruited) with those of patients from low recruiters (at most 5 patients recruited). Second, we asked all participating FPs to complete a short questionnaire over a 6-week period on all patients eligible for the trial but not included in it (sex, age, body temperature, severity of nasal discharge and pain, reason for non-recruitment). Third, to estimate the proportion of sinusitis cases among included patients, all patients were invited for an optional radiologic examination of the maxillary sinuses (single Waters view).28 Radiographs were taken in the nearest radiology unit, collected centrally, and evaluated by a radiologist of the GUH who specialized in the ear, nose, and throat.
Baseline measurements
Randomized patients completed an extensive questionnaire and were physically examined by their FP. To evaluate the symptoms, we used the 20 items of the sinonasal outcome test (SNOT-20)29,30 supplemented by 3 questions about pain. Symptoms were scored on a 6-category (0-5) Likert scale. Patients were also asked to indicate which of their symptoms (no more than 5) were most troublesome.
Follow-up
During 10 days of treatment, all patients recorded their daily drug intake (trial medication and symptomatic medication); their general feeling of illness; the presence of nasal discharge, pain, and cough; body temperature; the occurrence of presumed adverse drug effects; and absence from work or school. On day 10 they underwent a second physical examination and completed the symptom questionnaire again. In case of insufficient recovery, the FP was then at liberty to prescribe an open antibiotic course (we recommended amoxicillin clavulanate) without revealing the previous treatment phase. Patients who had recovered on day 10 did not have to return on day 15. Any patient with poor recovery on day 10 was asked, regardless of open antibiotic treatment, to continue writing in the diary and to come back on day 15 if complaints were still present.
The 2 primary endpoints were the therapy success rate on day 10 and the duration of general illness, pain, and purulent rhinorrhea as recorded in the diary. Treatment was considered successful when all symptoms that the patient had included in the list of “most important item affecting my health” scored 0 (absent) or 1 (very mildly present) after 10 days of treatment. Secondary endpoints were the mean change in severity score between day 1 and 10 on the various symptoms, incidence of unfavorable evolution, incidence of side effects, intake of analgesics, and duration of sick leave. The number of patients needed to demonstrate a difference in the therapy success rate of 15% at day 10 (α = 0.05, β = 0.20) was 168 per treatment group.31 This determination assumed a success rate of 50% in the placebo group.11,12
Statistics
Data were analyzed with SPSS-7. Differences in proportions are presented as relative risks with 95% confidence intervals and tested by chi-square test. The duration of symptoms is presented by Kaplan-Meier survival plots. Differences in duration are tested by the log rank test. Other continuous variables are tested by Student’s t test or the nonparametric Mann-Whitney U test.
Results
Participant flow and follow-up
Of 416 patients enrolled in the study, 8 were excluded after randomization. Of the 408 patients remaining, 202 received amoxicillin and 206 placebo; 34 patients (8%) withdrew from the trial. Their personal characteristics and clinical conditions at inclusion were not different from those of patients with follow-up. Figure 1 lists reasons for exclusion or withdrawal. The treatment code was broken once for a suspected allergic reaction and once because of an exacerbation of symptoms. In accordance with the intention-to-treat principle, all enrolled patients were included in the analyses in the groups to which they were originally randomized. Patients who had withdrawn because of side effects were also included in the analysis of side effects.
Complete or partial follow-up data were obtained for 374 patients (90%) after 10 days (mean 10.3 days, standard deviation 1.44): 334 patients completed the questionnaire, 348 returned the diary, and 338 underwent a physical examination. In 265 (71%) patients, data (questionnaire, diary, and physical examination) were complete; in 109 (29%), data at day 10 were partly missing. The two treatment groups were very similar in terms of sex, age, duration of preinclusion complaints, and frequency of various physical signs and symptoms (Table 1).*
TABLE 1
BASELINE CHARACTERISTICS
| General (placebo = 205, amoxicillin = 204) | Placebo | Amoxicillin |
|---|---|---|
| Mean age (SD) | 39 (15) | 37 (14) |
| Mean days of complaint before contact (SD | 7.2 (5.5) | 7.6 (5.4) |
| Women (%) | 54 | 55 |
| Mean Score on SNOT-20 (placebo = 196, amoxicillin = 192) | 40.8 (SD 15.9) | 38.4 (SD 16.1) |
| History (placebo = 196, amoxicillin = 192) | ||
| Generally ill to very ill (%) | 46 | 53 |
| Unilateral facial pain (%) | 56 | 53 |
| Pain on bending forward (%) | 70 | 66 |
| Pain in upper teeth or when chewing (%) | 44 | 41 |
| Examination (placebo = 209, amoxicillin = 207) | ||
| Sinus tenderness (%) | 61 | 67 |
| Pain on bending forward (%) | 60 | 60 |
| Postnasal discharge on throat inspection (%) | 55 | 50 |
| Purulent rhinorrhea on rhinoscopy (%) | 47 | 40 |
| Body temperature > 37°C (%) | 38 | 41 |
| SD denotes standard deviation; SNOT, Sino-Nasal Outcome Test. | ||
FIGURE 1
PATIENTS’ PROGRESS THROUGH THE TRIAL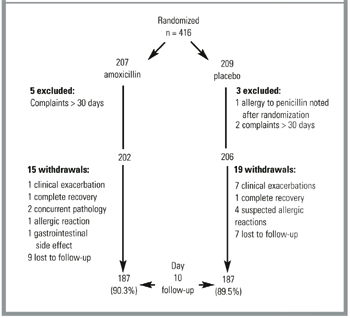
Primary Outcomes
Of the 374 patients with follow-up data on day 10, 334 completed the symptom questionnaire twice. Treatment was successful—defined as a score of 0 (absent) or 1 (very mildly present) for all symptoms that had been included as “the most important item affecting my health”—in 35% of patients in the amoxicillin group (59/170) and 29% in the placebo group (47/164) (Table 2). Relative risk of success was 1.14 (95% CI, 0.92-1.42, P = .24): more patients were cured in the amoxicillin group, but this difference was not statistically significant.
In 82 (19.7%) of the 416 randomized patients (37 amoxicillin, 45 placebo), data on this main outcome are missing. In 40 of these 82 patients, follow-up data are available from the diary (n = 38) or physical examination (n = 2). According to these data, in 13/17 of the amoxicillin group and 11/23 of the placebo group the outcome was favorable: in the diary, the patient reports feeling “well” again at day 10 or sooner, or on physical examination, all signs of respiratory infection have cleared). Eight patients withdrew for clinical exacerbation and 2 patients after full recovery. Adding the 50 patients with a known course of illness to those in the treatment and result groups does not alter the overall result (RR 1.20, 95% CI, 0.98-1.47, P = .08). Furthermore, when considering the 24 nonexcluded patients (13 amoxicillin, 11 placebo) with total lack of follow-up in their allocated treatment group, first as treatment failures (RR 1.18, 95% CI, 0.97-1.44, P = .11) and then as successes (1.20, 95% CI, 0.99-1.46, P = .07), the result also remains the same. Regarding the success rate from the complete diary data (n = 348) and the results of physical examinations (n = 338) (Table 3), we find no significant difference between treatment groups.
Duration of purulent rhinorrhea was significantly shorter in the amoxicillin group than in the placebo group (75% of patients were free of purulent rhinorrhea after 9 days versus after 14 days in the placebo group, log rank P = .007). There is no difference between treatment groups in the duration of general illness or pain (Figure 2).
TABLE 2
MAIN OUTCOME: RATE OF TREATMENT SUCCESS AT 10-DAY FOLLOW-UP
| Outcome Measure | N* | Number with Successful Therapy (%) | Relative Risk of Success (95% CI) | p | |
|---|---|---|---|---|---|
| Amoxicillin | Placebo | ||||
| Survey† | 334 | 59/170 (35) | 47/164 (28) | 1.14 (0.92-1.42) | .24 |
| Diary ‡ | 348 | 92/174 (52) | 97/174 (55) | 0.94 (0.77-1.16) | .59 |
| Physical signs § | 338 | 97/170 (57) | 86/168 (51) | 1.13 (0.91-1.40) | .28 |
| All ║ | 384 | 73/189 (39) | 59/195 (30) | 1.2 (0.98-1.47) | .08 |
| Sensitivity analysis¶ | |||||
| Best case | 408 | 86/202 | 70/206 | 1.2 (0.99-1.46) | .07 |
| Worst case | 408 | 73/202 | 59/206 | 1.18 (0.97-1.44) | .11 |
| * Data on at least one of these outcome measures were obtained in 374 patients (90% of the total population). | |||||
| † All symptoms indicated by the patients at inclusion as “most important item affecting my health” score 0 (absent) or 1 (very mildly present) on day 10. | |||||
| ‡ Patient states in diary that he or she feels generally “well” again on day 10 or sooner. | |||||
| § All physical signs have disappeared at day 10 (pain on bending, sinus tenderness, postnasal drip, purulent rhinorrhea on rhinoscopy, elevated body temperature). | |||||
| ║Incorporating all available information from the questionnaire, diary, physical examination, and dropouts. | |||||
| Patients without data are considered, respectively, as treatment success (best case) or treatment failures (worst case). | |||||
TABLE 3
MEAN SYMPTOM CHANGE BETWEEN BASELINE AND 10-DAY FOLLOW-UP
| Mean Score Reduction | |||
|---|---|---|---|
| Symptom | Amoxicillin n = 170 | Placebo n = 164 | P * |
| Unilateral facial pain | 1 | 1.1 | .56 |
| Pain on bending forward | 1.21 | 1.32 | .55 |
| Pain in upper teeth or when chewing | 0.7 | 0.93 | .17 |
| Need to blow nose | 1.73 | 1.70 | .85 |
| Sneezing | 1.13 | 1.05 | .63 |
| Runny nose | 1.47 | 1.55 | .33 |
| Cough | 1.0 | 1.11 | .46 |
| Thick nasal discharge | 2.2 | 1.5 | < .0001 |
| Postnasal discharge | 1.29 | 1.09 | .26 |
| Ear fullness | 1.13 | 1.31 | .32 |
| Dizziness | 0.95 | 0.87 | .63 |
| Ear pain | 0.64 | 0.77 | .36 |
| Facial pain or pressure | 1.54 | 1.61 | .69 |
| Difficulty falling asleep | 1.14 | 1.26 | .54 |
| Wake up at night | 1.39 | 1.44 | .79 |
| Lack of a good night’s sleep | 1.24 | 1.44 | .28 |
| Wake up tired | 1.34 | 1.65 | .09 |
| Fatigue | 1.46 | 1.61 | .38 |
| Reduced productivity | 1.45 | 1.63 | .29 |
| Reduced concentration | 1.24 | 1.46 | .19 |
| Frustrated, restless, irritable | 0.87 | 1.41 | .91 |
| Sad | 0.38 | 0.52 | .18 |
| Embarrassed | 0.36 | 0.76 | .36 |
| * Student’s t test. | |||
FIGURE 2
DURATION OF ILLNESS, PAIN, AND PURULENT RHINORRHEA BETWEEN TREATMENT GROUPS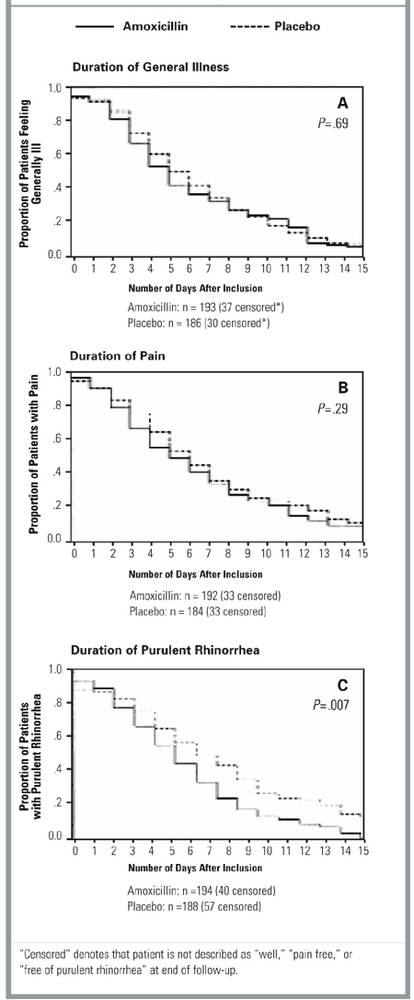
Secondary outcomes
The mean score reduction on the symptom “thick nasal discharge” between day 1 and day 10 is significantly larger in the amoxicillin group than in the placebo group (2.2 vs 1.5, Student’s t test: P <.0001) (Table 3). There is no significant difference in change for any other symptom. Seven patients in the placebo group (3.4%) withdrew before day 10 because of exacerbation of symptoms versus 1 patient (0.5%) in the amoxicillin group (RR 0.25, 95% CI, 0.04-1.56, P = .07). All 8 patients recovered after starting open antibiotic therapy and had no complications or referrals.
The chance of receiving open antibiotic treatment at day 10 follow-up (n = 34: 19 placebo, 15 amoxicillin) or of having to return because of persistent complaints at day 15 (n = 73: 41 placebo, 32 amoxicillin) was not significantly different between the treatment groups (chi-squared test: P = .46 and P = .26, respectively). Diarrhea was more frequent in the amoxicillin group (29% vs. 19%, RR 1.28, CI 1.05-1.57, P = .02). There was no difference in incidence of skin rash, abdominal pain, or vomiting. Absence from work or school was comparable in both treatment groups (RR 0.95, 95% CI, 0.86-1.05, P = .34). Patients in the amoxicillin group took an analgesic an average of 5 times, mainly in the first days of treatment, compared with 4 for the placebo group (Mann-Whitney U test, P = .24).
Other results
The lack of correlation between the estimated and actual treatment demonstrates that masking was maintained. Compliance was good in both groups: 89% of patients in the amoxicillin group and 91% of those in the placebo group took at least 25 of 30 capsules.
Patients from low recruiters were not significantly different from patients enrolled by high recruiters. Included patients had slightly more complaints of pain (58% vs 50%, RR 1.20, CI 1.02-1.42, P = .03) than the 332 eligible but excluded patients registered during the 6-week period. The most frequent reasons for exclusion were the presence of an exclusion criterion (22%), the patient’s refusal to participate (16%), the patient’s request for antibiotic therapy (14%), and lack of time by the FP (10%). Of the 292 patients who agreed to undergo a radiologic examination, about two thirds had abnormalities of the maxillary sinuses.
Discussion
This study produced 3 important findings. First, we found that patients consulting their FP for acute URTI with purulent rhinorrhea do not experience any important benefit from amoxicillin therapy. With treatment, the purulent rhinorrhea disappears more quickly, but this seems to be of little importance in relation to a general recovery. Moreover, amoxicillin therapy increases the risk of diarrhea. We further found that with or without amoxicillin, complaints last long: after 10 days, two thirds of patients still had complaints and about half of the patients still felt ill. The natural course to recovery takes a long time and is not influenced by taking amoxicillin. Finally, we observed that failure to prescribe antibiotics is safe. The placebo group had no complications. A small number of exacerbations occurred, but these responded swiftly to a course of amoxicillin-clavulanate.
To our knowledge, this is the first time that the effect of an antibiotic in adult patients presenting with acute purulent rhinorrhea (but with an otherwise unspecified diagnosis) has been investigated in a randomized, placebo-controlled trial. This trial is in line with a number of other family practice-based pragmatic trials in which patients were included on the basis of respiratory symptoms instead of by diagnosis16,32-37 and in which the emphasis was on practical relevance rather than on diagnostic accuracy.
Since 1995, 6 randomized clinical trials of high methodologic quality11-16 have studied the efficacy of antibiotics in general practice patients suffering from various acute infections of the nasal passages and usually presenting with purulent rhinorrhea. In 3 of these trials, no beneficial effect of antibiotics was found. Study populations consisted, respectively, of patients with a set of clinical symptoms (including purulent rhinorrhea) indicating rhinosinusitis16; patients with clinical suspicion of rhinosinusitis plus sinus abnormalities on conventional radiology11; and patients with clinical suspicion of sinusitis but without the radiologic signs.14 In the 3 other trials, treatment was (more or less) effective. Included were patients with clinical suspicion of sinusitis and abnormalities on CT scan,12 patients with unilateral facial pain and elevated C-reactive protein levels or erythrocyte sedimentation rate,13 and patients with rhinopharyngitis and positive bacteriologic cultures of nasopharyngeal secretions.15 These trials show that antibiotics are efficacious in some patients. In our trial, which probably included a mix of all these populations, we also found more patients in the amoxicillin group to be symptom free after 10 days. Despite a fairly large sample size, however, this difference was too small (less than 15%) to be statistically significant.
In this trial, as in daily practice, we did not know the precise diagnosis of included patients. Moreover, despite our frequent requests, participating FPs included only a minority of eligible patients. Concern might arise that only patients with mild disease were studied. We made 3 efforts to verify that the population was truly representative. First, we determined that the personal characteristics and severity of symptoms of patients of low-recruiting FPs (who tend to include patients with worse symptoms38) were no different from those of patients included by high recruiters. Second, an analysis of questionnaires from all eligible but excluded patients over a 6-week period showed that included and excluded patients were very much alike. The analysis also showed that in only 3% of patients did the FP consider the subject too ill to be included. Third, the results obtained on plain radiography of the maxillary sinuses were in line with the imaging results of other family practice populations with clinical suspicion of rhinosinusitis.11,19-21
With regard to the methodology, we wish to clarify certain choices. Amoxicillin was selected because it is recommended as the first-line drug for rhinosinusitis in several practice guidelines39-41 and the sensitivity of respiratory pathogens to it was sufficient in our geographic area at the start of the trial.42* To evaluate symptoms, we chose the 20 items of the SNOT-20 questionnaire (Table 1), an abbreviated version of the RSOM-31,29 a disease-specific quality-of-life test for sinusitis. These 20 items include not only all classic rhinosinusitis symptoms but also a number of more subjective symptoms, such as sleep disturbances and reduced productivity, which may also severely inconvenience patients. Any beneficial effect of amoxicillin on these symptoms would be just as important as an effect on the classic sinusitis symptoms.
Outcome measures were mainly self-assessed by patients, since in this kind of pathology, for which subjective inconvenience is often greater than objective signs might indicate, the patient is in our view the best and only judge of symptom improvement. The main outcome measure, disappearance of perceived worst symptoms, was designed to take into account the heterogeneity of clinical presentations.
Conclusions
Patients with an acute upper respiratory tract infection with purulent rhinorrhea (and without signs of complications of sinusitis) represent a large, clearly defined, clinically recognizable group. Our results show that amoxicillin provides no clinically important benefits for this population. The implication for practice is that whatever diagnosis is suspected, all these patients can safely be treated with symptomatic therapy only. Patients should, however, be informed that whichever treatment is chosen, symptoms can last for a long time. In the rare event that symptoms worsen, they should consult their FP for antibiotic therapy. If patients are clearly distressed by the purulent rhinorrhea itself, this trial suggests reasons for considering the use of amoxicillin, but potential patient benefits still probably do not outweigh the disadvantages.
* For an expanded version of this table, see Table W1.
ACKNOWLEDGMENTS
The authors wish to thank all participating family physicians and patients and Erna Eeckhout, Adrienne Dubron, Anselme Derese, MD, PhD, and John Marshall for their invaluable help.
1. Okkes IM, Oskam SK, Lamberts H. Van klacht naar diagnose. Episodegegevens uit de huisartspraktijk. Coutinho, Bussum, Nl; 1998.
2. De Maeseneer J. Het voorschrijven van antibiotica bij luchtwegproblemen. Een explorerend onderzoek. Huisarts Wet 1990;33:223-6.
3. De Melker RA, Kuyvenhove MM. Management of upper respiratory tract infection in Dutch general practice. Br J Gen Pract 1991;41:504-7.
4. van Buchem L, Peeters M, Beaumont J, Knottnerus JA. Acute maxillary sinusitis in general practice: the relation between clinical picture and objective findings. Eur J Gen Pract 1995;1:155-60.
5. Hansen JC, Schmidt H, Rosborg J, Lund E. Predicting acute maxillary sinusitis in a general practice population. BMJ 1995;311:233-6.
6. Stalman W, Van Essen GA, Gubbels JW, De Melker RA. Difficulties in diagnosing acute sinusitis in a Dutch group practice. Relative value of history, radiography and ultrasound. Eur J Gen Pract 1997;3:12-5.
7. Hueston WJ, Mainous AG, Dacus EN, Hopper JE. Does acute bronchitis really exist? A reconceptualization of acute viral respiratory infections. J Fam Pract 2000;49:401-6.
8. Ferranti de SD, Ioannidis JPA, Lau J, Anninger WV, Barza M. Are amoxicillin and folate inhibitors as effective as other antibiotics for acute sinusitis? A meta-analysis. BMJ 1998;317:632-7.
9. Williams JW, Jr, Aguilar C, Makela M, et al. Antibiotic therapy for acute sinusitis: a systematic literature review. In: Douglas R, Bridges-Webb C, Glasziou P, Lozano J, Steinhoff M, Wang E, eds. Acute respiratory infections module of the Cochrane Database of Systematic Reviews. The Cochrane Library. Oxford, England: Updated Software; 1997.
10. Zucker DR, Balk E, Engels E, Barza M, Lau J. Agency for Health Care Policy and Research Publication No. 99-E016. Evidence report/technology assessment number 9. Diagnosis and treatment of acute bacterial rhinosinusitis. Available at www.ahrq.gov/clinic/sinussum.htm.
11. van Buchem FL, Knottnerus JA, Scrhrijnemaekers VJJ, Peeters MF. Primary-care-based randomised placebo-controlled trial of antibiotic treatment in acute maxillary sinusitis. Lancet 1997;349:683-7.
12. Lindbaek M, Hjortdahl P, Johnsen UL-H. Randomised, double blind, placebo controlled trial of penicillin V and amoxycillin in treatment of acute sinus infections in adults. BMJ 1996;313:325-9.
13. Hansen JG, Schmidt H, Grinsted P. Randomised, double blind, placebo controlled trial of penicillin V in the treatment of acute maxillary sinusitis in adults in general practice. Scand J Prim Health Care 2000;18:44-7.
14. Haye R, Lingaas E, Hoivik HO, Odegard T. Azithromycin versus placebo in acute infectious rhinitis with clinical symptoms but without radiological signs of maxillary sinusitis. Eur J Clin Microbiol Infect Dis 1998;17:309-12.
15. Kaiser L, Lew D, Hirschel B, et al. Effects of antibiotic treatment in the subset of common-cold patients who have bacteria in nasopharyngeal secretions. Lancet 1996;347:1507-10.
16. Stalman W, van Essen GA, van der Graaf Y, de Melker RA. The end of antibiotic treatment in adults with acute sinusitis-like complaints in general practice? A placebo-controlled double-blind randomized doxycycline trial. Br J Gen Pract 1997;47:794-9.
17. Axelsson A, Runze U. Symptoms and signs af acute maxillary sinusitis. ORL J Otorhinolaryngol Relat Spec 1976;38:298-308.
18. Berg O, Carenfelt C. Analysis of symptoms and clinical signs in the maxillary sinus empyema. Acta Otolaryngol (Stockholm) 1988;105:343-9.
19. Lindbaek M, Hjortdahl HR, Johnsen UL-H. Use of symptoms, signs and bloodtests to diagnose acute sinus infections in primary care: comparison with computed tomography. Fam Med 1996;28:181-6.
20. Van Duyn NP, Brouwer HJ, Lamberts H. Use of symptoms and signs to diagnose maxillary sinusitis in general practice: comparison with ultrasonography. BMJ 1992;305:684-7.
21. Williams JW, Simel DL, Leroy R, Samsa GP. Clinical evaluation for sinusitis. Making the diagnosis by history and physical examination. Ann Int Med 1992;117:705-10.
22. Axelsson A, Runze U. Comparison of subjective and radiological findings during the course of acute maxillary sinusitis. Ann Otol Rhinol Laryngol 1983;92:75-7.
23. Gonzales R, Barrett PH, Steiner JF. The relation between purulent manifestations and antibiotic treatment of upper respiratory tract infections. J Gen Intern Med 1999;14:151-6.
24. Little DR, Mann BL, Sherk DW. Factors influencing the clinical diagnosis of sinusitis. J Fam Pract 1998;46:147-52.
25. Mainous AG, Hueston WJ, Eberlein C. Colour of respiratory discharge and antibiotic use. Lancet 1997;350:1077.-
26. De Sutter AI, De Meyere MJ, De Maeseneer JM, Peersman WP. Antibiotic prescribing in acute infections of the nose or sinuses: a matter of personal habit? Fam Pract 2001;18:209-13.
27. Gray WC, Blanchard CL. Sinusitis and its complications. Am Fam Physician 1987;35:232-43.
28. Williams JW, Roberts L, Distell B, Simel DL. Diagnosing sinusitis by X-ray: is a single Waters view adequate? J Gen Intern Med 1992;7:481-5.
29. Piccirillo JF, Edwards D, Haiduk A, et al. Psychometric and clinimetric validity of the 31-item rhinosinusitis outcome measure (RSOM-31). Am J Rhinol 1995;9:297-306.
30. Bhattacharyya T, Piccirillo J, Wippold FJ, II. Relationships between patient-based descriptions of sinusitis and paranasal sinus computed tomographic findings. Arch Otolaryngol Head Neck Surg 1997;123:1189-92.
31. Altman DG. Practical statistics for medical research. London, England: Chapman & Hall; 1991;455-60.
32. De Meyere M. Acute keelpijn in de eerste lijn. [dissertatie]. 1990 Rijksuniversiteit Gent, Faculteit Geneeskunde.
33. Verheij TJM, Hermans J, Mulder JD. Effects of doxycycline in patients with acute cough and purulent sputum: a double blind placebo controlled trial. Br J Gen Pract 1994;44:400-4.
34. Burke P, Bain J, Robinson D, Dunleavy J. Acute red ear in children: controlled trial of non-antibiotic treatment in general practice. BMJ 1991;303:558-62.
35. Damoiseaux RAMJ, Balen van FAM, Hoes AW, Melker de RA. Primary care based randomised, double blind trial of amoxicillin versus placebo for acute otitis media in children aged under 2 years. BMJ 2000;320:350-4.
36. Little P, Could C, Williamson I, Moore M, Warner G, Dunleavy J. Pragmatic randomised controlled trial of two prescribing strategies for childhood acute otitis media. BMJ 2001;322:336-42.
37. Little P, Williamson I, Warner G, Gould C, Gantley M, Kinmonth AL. Open randomised trial of prescribing strategies in managing sore throat. BMJ 1997;314:722-7.
38. Wilson S, Delaney BC, Roalfe A, et al. Randomised controlled trials in primary care: case study. BMJ 2000;321:24-7.
39. De Bock GH, Van Duijn NP, Dagnelie CF, et al. NHG-Standaard Sinusitis. Huisarts Wet 1993;36:255-7.
40. Low DE, Desrosiers M, McSherry J, et al. A practical guide for the diagnosis and treatment of acute sinusitis. CMAJ 1997;156(suppl 6):S1-14.
41. Snow V, Mottur-Pilson C, Hickner JM. Principle of appropriate antibiotic use for acute sinusitis in adults. Ann Intern Med 2001;134:495-7.
42. Pierard D, De Meyer A, Vanzeebroeck A, Lauwers S. In vitro evaluatie van de gevoeligheid van 205 recente klinische isolaten van streptococcus pneumoniae voor minocycline en andere antibiotica. Tijdschr Geneesk 1996;52:281-5.
OBJECTIVE: To compare the efficacy of amoxicillin vs placebo in patients with an acute upper respiratory tract infection and purulent rhinorrhea.
STUDY DESIGN: Double-blind randomized placebo-controlled trial.
POPULATION: The 416 patients included from 69 family practices were 12 years or older, presenting with acute upper respiratory complaints, and having a history of purulent rhinorrhea and no signs of complications of sinusitis.
OUTCOMES MEASURED: Therapy success (disappearance of symptoms that most greatly affected the patient’s health) at day 10 and duration of general illness, pain, and purulent rhinorrhea.
RESULTS: Therapy was successful in 35% of patients with amoxicillin and in 29% of patients with placebo (relative risk [RR] 1.14, 95% confidence interval [CI], 0.92-1.42). There was no effect on duration of general illness or pain. Duration of purulent rhinorrhea was shortened by amoxicillin (9 days vs 14 for clearing of purulent rhinorrhea in 75% of patients; P = .007). Diarrhea was more frequent with amoxicillin (29% vs 19%, RR 1.28, 95% CI, 1.05-1.57). No complications were reported. One patient (0.5%) receiving amoxicillin and 7 (3.4%) receiving placebo discontinued trial therapy because of exacerbation of symptoms (RR 0.25, 95% CI 0.04-1.56, P = .07). All 8 patients recovered with antibiotic therapy.
CONCLUSIONS: Amoxicillin has a beneficial effect on purulent rhinorrhea caused by an acute infection of the nose or sinuses but not on general recovery. The practical implication is that all such patients, whatever the suspected diagnosis, can be safely treated with symptomatic therapy and instructed to return if symptoms worsen.
- In patients with an acute upper respiratory tract infection that includes purulent rhinorrhea, treatment with amoxicillin has no effect on general recovery and increases the frequency of diarrhea.
- In most patients, symptoms of acute respiratory tract infection last for more than 10 days.
- Treatment without antibiotics and with appropriate follow-up is safe.
- Patients with purulent rhinorrhea caused by an acute infection of the nose or sinuses can initially be treated with symptomatic therapy, whatever the suspected diagnosis, and instructed to return if symptoms worsen.
Infections of the nasal passages are very common1 and among the most frequent reasons for the prescription of antibiotics.2,3 Such infections comprise diagnoses that include upper respiratory tract infection (URTI), rhinitis, rhinopharyngitis, and rhinosinusitis, which are very difficult to distinguish because of the lack of specific clinical features or simple office-based diagnostic tests.4-7 These diagnostic difficulties probably explain why it remains unclear whether and when antibiotics should be used for such patients in clinical practice.
Although evidence shows that a small minority of patients benefit from antibiotic therapy, these patients are extremely difficult to recognize or identify. Three meta-analyses8-10 on the effect of antibiotics in rhinosinusitis and 5 of 6 recent trials investigating the effect of antibiotics in rhinosinusitis,11-13 rhinitis, 14 and bacterial rhinopharyngitis15 almost exclusively studied patients with a diagnosis established by laboratory or imaging investigation. As a result, implementing the findings is difficult in daily practice, where radiologic or laboratory tests are not obtained for most patients with respiratory infections. Only 1 of the 6 trials16 included patients with a set of clinical symptoms indicating rhinosinusitis. Because inclusion criteria were rather stringent, however, findings are applicable only to a small group of patients.
The purpose of this trial was to investigate the benefits of antibiotic therapy in a larger group of patients with nose or sinus infections, thereby making the results more widely applicable. Accordingly, we conducted a randomized, double-blind, placebo-controlled trial comparing the effect of amoxicillin with that of placebo in family practice patients with an acute upper respiratory tract infection and presenting with purulent rhinorrhea. Purulent rhinorrhea was chosen as the minimal criterion because it is the symptom most consistently associated with rhinosinusitis in diagnostic studies5,17-21 and because its presence often leads family physicians (FPs) to prescribe antibiotics.23-26 The trial was designed as a pragmatic effectiveness trial. Patient inclusion and evaluation were defined on a purely clinical basis to maximize relevance for routine daily practice.
Methods
Study population
Between October 1998 and December 1999, 69 FPs in Flanders, Belgium, agreed to enroll patients meeting the following inclusion criteria: age 12 years or older, presenting with a respiratory tract infection, and having purulent rhinorrhea. Exclusion criteria were allergy to penicillin or ampicillin; having received antibiotic therapy within the previous week; complaints lasting for more than 30 days; abnormality on clinical chest examination; complications of sinusitis (facial edema or cellulitis; orbital, visual, meningeal, or cerebral signs)27; pregnancy or lactation; comorbidity that might impair immune competence; and inability to follow the protocol because of language or mental problems. The Ethics Committee of the Ghent University Hospital (GUH) approved the study. All patients (or their guardians, for those younger than 16 years of age) gave written informed consent.
Treatment assignment and masking
In this double-blind trial, patients were assigned via a computer-generated random number list to receive 500 mg amoxicillin 3 times a day or placebo for 10 days. The trial medication was supplied in numbered uniform cardboard boxes, each containing 30 capsules of the same size, color, and shape for active and placebo treatment. The randomization list, kept at the pharmacy of GUH, was accessible to the participating FPs only in case of a serious adverse event.
To assess the effectiveness of masking, patients and their FPs guessed the treatment group at 10-day follow-up. Data were encoded and entered without knowledge of treatment allocation. Compliance was assessed by counting leftover medication. All patients were allowed to use xylometazoline 1% nose drops and paracetamol or ibuprofen to alleviate symptoms; these data were registered.
Assessment of potential recruitment bias caused by exclusion
First, we compared the characteristics of patients enrolled by high-recruiting FPs (at least 14 patients recruited) with those of patients from low recruiters (at most 5 patients recruited). Second, we asked all participating FPs to complete a short questionnaire over a 6-week period on all patients eligible for the trial but not included in it (sex, age, body temperature, severity of nasal discharge and pain, reason for non-recruitment). Third, to estimate the proportion of sinusitis cases among included patients, all patients were invited for an optional radiologic examination of the maxillary sinuses (single Waters view).28 Radiographs were taken in the nearest radiology unit, collected centrally, and evaluated by a radiologist of the GUH who specialized in the ear, nose, and throat.
Baseline measurements
Randomized patients completed an extensive questionnaire and were physically examined by their FP. To evaluate the symptoms, we used the 20 items of the sinonasal outcome test (SNOT-20)29,30 supplemented by 3 questions about pain. Symptoms were scored on a 6-category (0-5) Likert scale. Patients were also asked to indicate which of their symptoms (no more than 5) were most troublesome.
Follow-up
During 10 days of treatment, all patients recorded their daily drug intake (trial medication and symptomatic medication); their general feeling of illness; the presence of nasal discharge, pain, and cough; body temperature; the occurrence of presumed adverse drug effects; and absence from work or school. On day 10 they underwent a second physical examination and completed the symptom questionnaire again. In case of insufficient recovery, the FP was then at liberty to prescribe an open antibiotic course (we recommended amoxicillin clavulanate) without revealing the previous treatment phase. Patients who had recovered on day 10 did not have to return on day 15. Any patient with poor recovery on day 10 was asked, regardless of open antibiotic treatment, to continue writing in the diary and to come back on day 15 if complaints were still present.
The 2 primary endpoints were the therapy success rate on day 10 and the duration of general illness, pain, and purulent rhinorrhea as recorded in the diary. Treatment was considered successful when all symptoms that the patient had included in the list of “most important item affecting my health” scored 0 (absent) or 1 (very mildly present) after 10 days of treatment. Secondary endpoints were the mean change in severity score between day 1 and 10 on the various symptoms, incidence of unfavorable evolution, incidence of side effects, intake of analgesics, and duration of sick leave. The number of patients needed to demonstrate a difference in the therapy success rate of 15% at day 10 (α = 0.05, β = 0.20) was 168 per treatment group.31 This determination assumed a success rate of 50% in the placebo group.11,12
Statistics
Data were analyzed with SPSS-7. Differences in proportions are presented as relative risks with 95% confidence intervals and tested by chi-square test. The duration of symptoms is presented by Kaplan-Meier survival plots. Differences in duration are tested by the log rank test. Other continuous variables are tested by Student’s t test or the nonparametric Mann-Whitney U test.
Results
Participant flow and follow-up
Of 416 patients enrolled in the study, 8 were excluded after randomization. Of the 408 patients remaining, 202 received amoxicillin and 206 placebo; 34 patients (8%) withdrew from the trial. Their personal characteristics and clinical conditions at inclusion were not different from those of patients with follow-up. Figure 1 lists reasons for exclusion or withdrawal. The treatment code was broken once for a suspected allergic reaction and once because of an exacerbation of symptoms. In accordance with the intention-to-treat principle, all enrolled patients were included in the analyses in the groups to which they were originally randomized. Patients who had withdrawn because of side effects were also included in the analysis of side effects.
Complete or partial follow-up data were obtained for 374 patients (90%) after 10 days (mean 10.3 days, standard deviation 1.44): 334 patients completed the questionnaire, 348 returned the diary, and 338 underwent a physical examination. In 265 (71%) patients, data (questionnaire, diary, and physical examination) were complete; in 109 (29%), data at day 10 were partly missing. The two treatment groups were very similar in terms of sex, age, duration of preinclusion complaints, and frequency of various physical signs and symptoms (Table 1).*
TABLE 1
BASELINE CHARACTERISTICS
| General (placebo = 205, amoxicillin = 204) | Placebo | Amoxicillin |
|---|---|---|
| Mean age (SD) | 39 (15) | 37 (14) |
| Mean days of complaint before contact (SD | 7.2 (5.5) | 7.6 (5.4) |
| Women (%) | 54 | 55 |
| Mean Score on SNOT-20 (placebo = 196, amoxicillin = 192) | 40.8 (SD 15.9) | 38.4 (SD 16.1) |
| History (placebo = 196, amoxicillin = 192) | ||
| Generally ill to very ill (%) | 46 | 53 |
| Unilateral facial pain (%) | 56 | 53 |
| Pain on bending forward (%) | 70 | 66 |
| Pain in upper teeth or when chewing (%) | 44 | 41 |
| Examination (placebo = 209, amoxicillin = 207) | ||
| Sinus tenderness (%) | 61 | 67 |
| Pain on bending forward (%) | 60 | 60 |
| Postnasal discharge on throat inspection (%) | 55 | 50 |
| Purulent rhinorrhea on rhinoscopy (%) | 47 | 40 |
| Body temperature > 37°C (%) | 38 | 41 |
| SD denotes standard deviation; SNOT, Sino-Nasal Outcome Test. | ||
FIGURE 1
PATIENTS’ PROGRESS THROUGH THE TRIAL
Primary Outcomes
Of the 374 patients with follow-up data on day 10, 334 completed the symptom questionnaire twice. Treatment was successful—defined as a score of 0 (absent) or 1 (very mildly present) for all symptoms that had been included as “the most important item affecting my health”—in 35% of patients in the amoxicillin group (59/170) and 29% in the placebo group (47/164) (Table 2). Relative risk of success was 1.14 (95% CI, 0.92-1.42, P = .24): more patients were cured in the amoxicillin group, but this difference was not statistically significant.
In 82 (19.7%) of the 416 randomized patients (37 amoxicillin, 45 placebo), data on this main outcome are missing. In 40 of these 82 patients, follow-up data are available from the diary (n = 38) or physical examination (n = 2). According to these data, in 13/17 of the amoxicillin group and 11/23 of the placebo group the outcome was favorable: in the diary, the patient reports feeling “well” again at day 10 or sooner, or on physical examination, all signs of respiratory infection have cleared). Eight patients withdrew for clinical exacerbation and 2 patients after full recovery. Adding the 50 patients with a known course of illness to those in the treatment and result groups does not alter the overall result (RR 1.20, 95% CI, 0.98-1.47, P = .08). Furthermore, when considering the 24 nonexcluded patients (13 amoxicillin, 11 placebo) with total lack of follow-up in their allocated treatment group, first as treatment failures (RR 1.18, 95% CI, 0.97-1.44, P = .11) and then as successes (1.20, 95% CI, 0.99-1.46, P = .07), the result also remains the same. Regarding the success rate from the complete diary data (n = 348) and the results of physical examinations (n = 338) (Table 3), we find no significant difference between treatment groups.
Duration of purulent rhinorrhea was significantly shorter in the amoxicillin group than in the placebo group (75% of patients were free of purulent rhinorrhea after 9 days versus after 14 days in the placebo group, log rank P = .007). There is no difference between treatment groups in the duration of general illness or pain (Figure 2).
TABLE 2
MAIN OUTCOME: RATE OF TREATMENT SUCCESS AT 10-DAY FOLLOW-UP
| Outcome Measure | N* | Number with Successful Therapy (%) | Relative Risk of Success (95% CI) | p | |
|---|---|---|---|---|---|
| Amoxicillin | Placebo | ||||
| Survey† | 334 | 59/170 (35) | 47/164 (28) | 1.14 (0.92-1.42) | .24 |
| Diary ‡ | 348 | 92/174 (52) | 97/174 (55) | 0.94 (0.77-1.16) | .59 |
| Physical signs § | 338 | 97/170 (57) | 86/168 (51) | 1.13 (0.91-1.40) | .28 |
| All ║ | 384 | 73/189 (39) | 59/195 (30) | 1.2 (0.98-1.47) | .08 |
| Sensitivity analysis¶ | |||||
| Best case | 408 | 86/202 | 70/206 | 1.2 (0.99-1.46) | .07 |
| Worst case | 408 | 73/202 | 59/206 | 1.18 (0.97-1.44) | .11 |
| * Data on at least one of these outcome measures were obtained in 374 patients (90% of the total population). | |||||
| † All symptoms indicated by the patients at inclusion as “most important item affecting my health” score 0 (absent) or 1 (very mildly present) on day 10. | |||||
| ‡ Patient states in diary that he or she feels generally “well” again on day 10 or sooner. | |||||
| § All physical signs have disappeared at day 10 (pain on bending, sinus tenderness, postnasal drip, purulent rhinorrhea on rhinoscopy, elevated body temperature). | |||||
| ║Incorporating all available information from the questionnaire, diary, physical examination, and dropouts. | |||||
| Patients without data are considered, respectively, as treatment success (best case) or treatment failures (worst case). | |||||
TABLE 3
MEAN SYMPTOM CHANGE BETWEEN BASELINE AND 10-DAY FOLLOW-UP
| Mean Score Reduction | |||
|---|---|---|---|
| Symptom | Amoxicillin n = 170 | Placebo n = 164 | P * |
| Unilateral facial pain | 1 | 1.1 | .56 |
| Pain on bending forward | 1.21 | 1.32 | .55 |
| Pain in upper teeth or when chewing | 0.7 | 0.93 | .17 |
| Need to blow nose | 1.73 | 1.70 | .85 |
| Sneezing | 1.13 | 1.05 | .63 |
| Runny nose | 1.47 | 1.55 | .33 |
| Cough | 1.0 | 1.11 | .46 |
| Thick nasal discharge | 2.2 | 1.5 | < .0001 |
| Postnasal discharge | 1.29 | 1.09 | .26 |
| Ear fullness | 1.13 | 1.31 | .32 |
| Dizziness | 0.95 | 0.87 | .63 |
| Ear pain | 0.64 | 0.77 | .36 |
| Facial pain or pressure | 1.54 | 1.61 | .69 |
| Difficulty falling asleep | 1.14 | 1.26 | .54 |
| Wake up at night | 1.39 | 1.44 | .79 |
| Lack of a good night’s sleep | 1.24 | 1.44 | .28 |
| Wake up tired | 1.34 | 1.65 | .09 |
| Fatigue | 1.46 | 1.61 | .38 |
| Reduced productivity | 1.45 | 1.63 | .29 |
| Reduced concentration | 1.24 | 1.46 | .19 |
| Frustrated, restless, irritable | 0.87 | 1.41 | .91 |
| Sad | 0.38 | 0.52 | .18 |
| Embarrassed | 0.36 | 0.76 | .36 |
| * Student’s t test. | |||
FIGURE 2
DURATION OF ILLNESS, PAIN, AND PURULENT RHINORRHEA BETWEEN TREATMENT GROUPS
Secondary outcomes
The mean score reduction on the symptom “thick nasal discharge” between day 1 and day 10 is significantly larger in the amoxicillin group than in the placebo group (2.2 vs 1.5, Student’s t test: P <.0001) (Table 3). There is no significant difference in change for any other symptom. Seven patients in the placebo group (3.4%) withdrew before day 10 because of exacerbation of symptoms versus 1 patient (0.5%) in the amoxicillin group (RR 0.25, 95% CI, 0.04-1.56, P = .07). All 8 patients recovered after starting open antibiotic therapy and had no complications or referrals.
The chance of receiving open antibiotic treatment at day 10 follow-up (n = 34: 19 placebo, 15 amoxicillin) or of having to return because of persistent complaints at day 15 (n = 73: 41 placebo, 32 amoxicillin) was not significantly different between the treatment groups (chi-squared test: P = .46 and P = .26, respectively). Diarrhea was more frequent in the amoxicillin group (29% vs. 19%, RR 1.28, CI 1.05-1.57, P = .02). There was no difference in incidence of skin rash, abdominal pain, or vomiting. Absence from work or school was comparable in both treatment groups (RR 0.95, 95% CI, 0.86-1.05, P = .34). Patients in the amoxicillin group took an analgesic an average of 5 times, mainly in the first days of treatment, compared with 4 for the placebo group (Mann-Whitney U test, P = .24).
Other results
The lack of correlation between the estimated and actual treatment demonstrates that masking was maintained. Compliance was good in both groups: 89% of patients in the amoxicillin group and 91% of those in the placebo group took at least 25 of 30 capsules.
Patients from low recruiters were not significantly different from patients enrolled by high recruiters. Included patients had slightly more complaints of pain (58% vs 50%, RR 1.20, CI 1.02-1.42, P = .03) than the 332 eligible but excluded patients registered during the 6-week period. The most frequent reasons for exclusion were the presence of an exclusion criterion (22%), the patient’s refusal to participate (16%), the patient’s request for antibiotic therapy (14%), and lack of time by the FP (10%). Of the 292 patients who agreed to undergo a radiologic examination, about two thirds had abnormalities of the maxillary sinuses.
Discussion
This study produced 3 important findings. First, we found that patients consulting their FP for acute URTI with purulent rhinorrhea do not experience any important benefit from amoxicillin therapy. With treatment, the purulent rhinorrhea disappears more quickly, but this seems to be of little importance in relation to a general recovery. Moreover, amoxicillin therapy increases the risk of diarrhea. We further found that with or without amoxicillin, complaints last long: after 10 days, two thirds of patients still had complaints and about half of the patients still felt ill. The natural course to recovery takes a long time and is not influenced by taking amoxicillin. Finally, we observed that failure to prescribe antibiotics is safe. The placebo group had no complications. A small number of exacerbations occurred, but these responded swiftly to a course of amoxicillin-clavulanate.
To our knowledge, this is the first time that the effect of an antibiotic in adult patients presenting with acute purulent rhinorrhea (but with an otherwise unspecified diagnosis) has been investigated in a randomized, placebo-controlled trial. This trial is in line with a number of other family practice-based pragmatic trials in which patients were included on the basis of respiratory symptoms instead of by diagnosis16,32-37 and in which the emphasis was on practical relevance rather than on diagnostic accuracy.
Since 1995, 6 randomized clinical trials of high methodologic quality11-16 have studied the efficacy of antibiotics in general practice patients suffering from various acute infections of the nasal passages and usually presenting with purulent rhinorrhea. In 3 of these trials, no beneficial effect of antibiotics was found. Study populations consisted, respectively, of patients with a set of clinical symptoms (including purulent rhinorrhea) indicating rhinosinusitis16; patients with clinical suspicion of rhinosinusitis plus sinus abnormalities on conventional radiology11; and patients with clinical suspicion of sinusitis but without the radiologic signs.14 In the 3 other trials, treatment was (more or less) effective. Included were patients with clinical suspicion of sinusitis and abnormalities on CT scan,12 patients with unilateral facial pain and elevated C-reactive protein levels or erythrocyte sedimentation rate,13 and patients with rhinopharyngitis and positive bacteriologic cultures of nasopharyngeal secretions.15 These trials show that antibiotics are efficacious in some patients. In our trial, which probably included a mix of all these populations, we also found more patients in the amoxicillin group to be symptom free after 10 days. Despite a fairly large sample size, however, this difference was too small (less than 15%) to be statistically significant.
In this trial, as in daily practice, we did not know the precise diagnosis of included patients. Moreover, despite our frequent requests, participating FPs included only a minority of eligible patients. Concern might arise that only patients with mild disease were studied. We made 3 efforts to verify that the population was truly representative. First, we determined that the personal characteristics and severity of symptoms of patients of low-recruiting FPs (who tend to include patients with worse symptoms38) were no different from those of patients included by high recruiters. Second, an analysis of questionnaires from all eligible but excluded patients over a 6-week period showed that included and excluded patients were very much alike. The analysis also showed that in only 3% of patients did the FP consider the subject too ill to be included. Third, the results obtained on plain radiography of the maxillary sinuses were in line with the imaging results of other family practice populations with clinical suspicion of rhinosinusitis.11,19-21
With regard to the methodology, we wish to clarify certain choices. Amoxicillin was selected because it is recommended as the first-line drug for rhinosinusitis in several practice guidelines39-41 and the sensitivity of respiratory pathogens to it was sufficient in our geographic area at the start of the trial.42* To evaluate symptoms, we chose the 20 items of the SNOT-20 questionnaire (Table 1), an abbreviated version of the RSOM-31,29 a disease-specific quality-of-life test for sinusitis. These 20 items include not only all classic rhinosinusitis symptoms but also a number of more subjective symptoms, such as sleep disturbances and reduced productivity, which may also severely inconvenience patients. Any beneficial effect of amoxicillin on these symptoms would be just as important as an effect on the classic sinusitis symptoms.
Outcome measures were mainly self-assessed by patients, since in this kind of pathology, for which subjective inconvenience is often greater than objective signs might indicate, the patient is in our view the best and only judge of symptom improvement. The main outcome measure, disappearance of perceived worst symptoms, was designed to take into account the heterogeneity of clinical presentations.
Conclusions
Patients with an acute upper respiratory tract infection with purulent rhinorrhea (and without signs of complications of sinusitis) represent a large, clearly defined, clinically recognizable group. Our results show that amoxicillin provides no clinically important benefits for this population. The implication for practice is that whatever diagnosis is suspected, all these patients can safely be treated with symptomatic therapy only. Patients should, however, be informed that whichever treatment is chosen, symptoms can last for a long time. In the rare event that symptoms worsen, they should consult their FP for antibiotic therapy. If patients are clearly distressed by the purulent rhinorrhea itself, this trial suggests reasons for considering the use of amoxicillin, but potential patient benefits still probably do not outweigh the disadvantages.
* For an expanded version of this table, see Table W1.
ACKNOWLEDGMENTS
The authors wish to thank all participating family physicians and patients and Erna Eeckhout, Adrienne Dubron, Anselme Derese, MD, PhD, and John Marshall for their invaluable help.
1. Okkes IM, Oskam SK, Lamberts H. Van klacht naar diagnose. Episodegegevens uit de huisartspraktijk. Coutinho, Bussum, Nl; 1998.
2. De Maeseneer J. Het voorschrijven van antibiotica bij luchtwegproblemen. Een explorerend onderzoek. Huisarts Wet 1990;33:223-6.
3. De Melker RA, Kuyvenhove MM. Management of upper respiratory tract infection in Dutch general practice. Br J Gen Pract 1991;41:504-7.
4. van Buchem L, Peeters M, Beaumont J, Knottnerus JA. Acute maxillary sinusitis in general practice: the relation between clinical picture and objective findings. Eur J Gen Pract 1995;1:155-60.
5. Hansen JC, Schmidt H, Rosborg J, Lund E. Predicting acute maxillary sinusitis in a general practice population. BMJ 1995;311:233-6.
6. Stalman W, Van Essen GA, Gubbels JW, De Melker RA. Difficulties in diagnosing acute sinusitis in a Dutch group practice. Relative value of history, radiography and ultrasound. Eur J Gen Pract 1997;3:12-5.
7. Hueston WJ, Mainous AG, Dacus EN, Hopper JE. Does acute bronchitis really exist? A reconceptualization of acute viral respiratory infections. J Fam Pract 2000;49:401-6.
8. Ferranti de SD, Ioannidis JPA, Lau J, Anninger WV, Barza M. Are amoxicillin and folate inhibitors as effective as other antibiotics for acute sinusitis? A meta-analysis. BMJ 1998;317:632-7.
9. Williams JW, Jr, Aguilar C, Makela M, et al. Antibiotic therapy for acute sinusitis: a systematic literature review. In: Douglas R, Bridges-Webb C, Glasziou P, Lozano J, Steinhoff M, Wang E, eds. Acute respiratory infections module of the Cochrane Database of Systematic Reviews. The Cochrane Library. Oxford, England: Updated Software; 1997.
10. Zucker DR, Balk E, Engels E, Barza M, Lau J. Agency for Health Care Policy and Research Publication No. 99-E016. Evidence report/technology assessment number 9. Diagnosis and treatment of acute bacterial rhinosinusitis. Available at www.ahrq.gov/clinic/sinussum.htm.
11. van Buchem FL, Knottnerus JA, Scrhrijnemaekers VJJ, Peeters MF. Primary-care-based randomised placebo-controlled trial of antibiotic treatment in acute maxillary sinusitis. Lancet 1997;349:683-7.
12. Lindbaek M, Hjortdahl P, Johnsen UL-H. Randomised, double blind, placebo controlled trial of penicillin V and amoxycillin in treatment of acute sinus infections in adults. BMJ 1996;313:325-9.
13. Hansen JG, Schmidt H, Grinsted P. Randomised, double blind, placebo controlled trial of penicillin V in the treatment of acute maxillary sinusitis in adults in general practice. Scand J Prim Health Care 2000;18:44-7.
14. Haye R, Lingaas E, Hoivik HO, Odegard T. Azithromycin versus placebo in acute infectious rhinitis with clinical symptoms but without radiological signs of maxillary sinusitis. Eur J Clin Microbiol Infect Dis 1998;17:309-12.
15. Kaiser L, Lew D, Hirschel B, et al. Effects of antibiotic treatment in the subset of common-cold patients who have bacteria in nasopharyngeal secretions. Lancet 1996;347:1507-10.
16. Stalman W, van Essen GA, van der Graaf Y, de Melker RA. The end of antibiotic treatment in adults with acute sinusitis-like complaints in general practice? A placebo-controlled double-blind randomized doxycycline trial. Br J Gen Pract 1997;47:794-9.
17. Axelsson A, Runze U. Symptoms and signs af acute maxillary sinusitis. ORL J Otorhinolaryngol Relat Spec 1976;38:298-308.
18. Berg O, Carenfelt C. Analysis of symptoms and clinical signs in the maxillary sinus empyema. Acta Otolaryngol (Stockholm) 1988;105:343-9.
19. Lindbaek M, Hjortdahl HR, Johnsen UL-H. Use of symptoms, signs and bloodtests to diagnose acute sinus infections in primary care: comparison with computed tomography. Fam Med 1996;28:181-6.
20. Van Duyn NP, Brouwer HJ, Lamberts H. Use of symptoms and signs to diagnose maxillary sinusitis in general practice: comparison with ultrasonography. BMJ 1992;305:684-7.
21. Williams JW, Simel DL, Leroy R, Samsa GP. Clinical evaluation for sinusitis. Making the diagnosis by history and physical examination. Ann Int Med 1992;117:705-10.
22. Axelsson A, Runze U. Comparison of subjective and radiological findings during the course of acute maxillary sinusitis. Ann Otol Rhinol Laryngol 1983;92:75-7.
23. Gonzales R, Barrett PH, Steiner JF. The relation between purulent manifestations and antibiotic treatment of upper respiratory tract infections. J Gen Intern Med 1999;14:151-6.
24. Little DR, Mann BL, Sherk DW. Factors influencing the clinical diagnosis of sinusitis. J Fam Pract 1998;46:147-52.
25. Mainous AG, Hueston WJ, Eberlein C. Colour of respiratory discharge and antibiotic use. Lancet 1997;350:1077.-
26. De Sutter AI, De Meyere MJ, De Maeseneer JM, Peersman WP. Antibiotic prescribing in acute infections of the nose or sinuses: a matter of personal habit? Fam Pract 2001;18:209-13.
27. Gray WC, Blanchard CL. Sinusitis and its complications. Am Fam Physician 1987;35:232-43.
28. Williams JW, Roberts L, Distell B, Simel DL. Diagnosing sinusitis by X-ray: is a single Waters view adequate? J Gen Intern Med 1992;7:481-5.
29. Piccirillo JF, Edwards D, Haiduk A, et al. Psychometric and clinimetric validity of the 31-item rhinosinusitis outcome measure (RSOM-31). Am J Rhinol 1995;9:297-306.
30. Bhattacharyya T, Piccirillo J, Wippold FJ, II. Relationships between patient-based descriptions of sinusitis and paranasal sinus computed tomographic findings. Arch Otolaryngol Head Neck Surg 1997;123:1189-92.
31. Altman DG. Practical statistics for medical research. London, England: Chapman & Hall; 1991;455-60.
32. De Meyere M. Acute keelpijn in de eerste lijn. [dissertatie]. 1990 Rijksuniversiteit Gent, Faculteit Geneeskunde.
33. Verheij TJM, Hermans J, Mulder JD. Effects of doxycycline in patients with acute cough and purulent sputum: a double blind placebo controlled trial. Br J Gen Pract 1994;44:400-4.
34. Burke P, Bain J, Robinson D, Dunleavy J. Acute red ear in children: controlled trial of non-antibiotic treatment in general practice. BMJ 1991;303:558-62.
35. Damoiseaux RAMJ, Balen van FAM, Hoes AW, Melker de RA. Primary care based randomised, double blind trial of amoxicillin versus placebo for acute otitis media in children aged under 2 years. BMJ 2000;320:350-4.
36. Little P, Could C, Williamson I, Moore M, Warner G, Dunleavy J. Pragmatic randomised controlled trial of two prescribing strategies for childhood acute otitis media. BMJ 2001;322:336-42.
37. Little P, Williamson I, Warner G, Gould C, Gantley M, Kinmonth AL. Open randomised trial of prescribing strategies in managing sore throat. BMJ 1997;314:722-7.
38. Wilson S, Delaney BC, Roalfe A, et al. Randomised controlled trials in primary care: case study. BMJ 2000;321:24-7.
39. De Bock GH, Van Duijn NP, Dagnelie CF, et al. NHG-Standaard Sinusitis. Huisarts Wet 1993;36:255-7.
40. Low DE, Desrosiers M, McSherry J, et al. A practical guide for the diagnosis and treatment of acute sinusitis. CMAJ 1997;156(suppl 6):S1-14.
41. Snow V, Mottur-Pilson C, Hickner JM. Principle of appropriate antibiotic use for acute sinusitis in adults. Ann Intern Med 2001;134:495-7.
42. Pierard D, De Meyer A, Vanzeebroeck A, Lauwers S. In vitro evaluatie van de gevoeligheid van 205 recente klinische isolaten van streptococcus pneumoniae voor minocycline en andere antibiotica. Tijdschr Geneesk 1996;52:281-5.
How Do Primary Care Physicians Use Long-Term Acid Suppressant Drugs?
OBJECTIVES: A considerable proportion of the medication budget of Dutch general practitioners is spent on prescribed long-term acid suppressant drugs. We investigated the magnitude of long-term prescription of acid suppressant drugs in general practice and the frequency and means of confirming the primary working diagnosis.
STUDY DESIGN: We used a retrospective descriptive study of 24 general practices in the Amsterdam region.
POPULATION: We identified those receiving long-term acid suppressant therapy (12 or more weeks/year) from a total of 46,813 patients by extracting data from pharmacy databases.
OUTCOMES MEASURED: We measured the amount and duration of prescriptions for each medication, indications for prescription, and investigations performed by general practitioners.
RESULTS: Of the 46,813 patients, 922 (2%) received long-term acid suppressant therapy. The duration of prescription varied from 12 weeks in 8% of patients to > 52 weeks in 23% of patients (mean = 33 weeks). In 25% of patients, no investigations were performed; 75% of patients underwent endoscopy or ingested a barium meal. The predominant diagnoses in investigated patients were ulcer disease (39%), gastroesophageal reflux disease (49%), and functional dyspepsia (gastritis, normal aspect; 18%). Helicobacter pylori status was available in 29% of patients with ulcer disease. Eradication therapy was reported in 44% of these patients.
CONCLUSIONS: Among patients of physicians in general practice in the Amsterdam region, 2% used long-term acid suppressants. Patients with ulcer disease may stop taking acid suppressants after apparent successful H pylori eradication. Tapering strategies must be developed for patients with mild reflux disease or functional dyspepsia.
- In Dutch general practice, 2% of patients take long-term acid suppressant drugs.
- One third of patients taking long-term acid suppressant drugs have peptic ulcer disease and may not need medication as soon as Helicobacter pylori has been eradicated.
- One fourth of patients taking long-term acid suppressant drugs have never undergone endoscopy or barium study.
- Because patients often do not tolerate sudden cessation of chronic acid suppressant drug use, tapering strategies must be developed.
The average Dutch general practice includes approximately 2350 patients. Of these, 2 to 3 per week, on average, visit their general practitioner (GP) with a complaint of dyspepsia.1 According to the guidelines of the Dutch College of General Practitioners, the treatment of dyspepsia is directed toward symptom relief, usually on an empirical basis, except for patients with symptoms such as sudden weight loss or hematemesis that suggest cancer; these are referred for endoscopy.2 Medication is prescribed in a stepwise fashion from less potent antacids and prokinetics to the more potent H2-blockers and proton pump inhibitors. During our study, long-term treatment with acid suppressant drugs (ASDs) was indicated only for relapsing ulcers or ulcerlike complaints, relapsing esophagitis, and relapsing gastroesophageal refluxlike symptoms.2
ASDs are responsible for a disproportionate share of the medication budget of Dutch GPs because of their high cost, their high frequency of prescription, and their use on a long-term basis.3 We therefore wondered whether the indication for prescribing an ASD was always appropriate. The aim of our study was to describe how commonly ASDs are prescribed and to describe the initial working diagnosis, the diagnostic tests performed to confirm the working hypothesis, and the final diagnosis for each patient.
Methods
Patients
We retrospectively collected data from 24 general practices in Amsterdam from September 1994 to August 1995 on patients taking long-term ASDs (12 or more weeks during the previous year). ASDs included antacids, mucosa-protective agents, prokinetics, H2-blockers, and proton pump inhibitors.4
Patients were identified from a medication database obtained from all cooperating pharmacists that included patient demographics; type, dose, and duration of medications; and use of possible risk-bearing comedications (aspirin, nonsteroidal anti-inflammatory drugs, or prednisone for more than 6 weeks during the study year). In this way we were able to identify almost all patients from the participating general practices who received long-term treatment with ASDs.
Confirmation of gastrointestinal diagnosis
In the Netherlands, a GP receives all available medical information on his patients (ie, letters from specialists, results from any examinations performed) and stores this information in the patient’s medical history file. When a patient switches to another GP, the entire medical history is sent to this new physician. Our principal investigator used these medical history files to determine the diagnosis and reason for the ASD prescription and the diagnostic tests (including Helicobacter pylori investigations) that were ordered to confirm the working diagnosis. Gastroscopy or barium meal radiography at any time during a patient’s life was considered the investigation for confirmation of the diagnosis. If the prescription started after this investigation or as a consequence of it, the investigation was considered the reason for initiating the current long-term treatment. Verification and completion of the obtained data took place in a face-to-face evaluation between the principal investigator and the GP, ensuring the completeness and reliability of the data.
Analysis and statistics
Patients were categorized into group I (investigations to confirm a working diagnosis were performed) and group NI (no investigations were performed). Three subgroups were identified within group I. We included all patients with a duodenal, gastric, or unspecified ulcer in group I-ULCER; group I-GERD included all patients with symptomatic or erosive gastroesophageal reflux disease (GERD); and group I-FUNCTIONAL included patients with only gastritis or with no imaging abnormalities. Patients with an ulcer and esophagitis were placed in group I-ULCER for their patient characteristics and medication prescription and in both groups I-ULCER and I-GERD for their medication indication, diagnostic tests, and eradication of H pylori.
Data were analyzed with the use of Statistical Package for the Social Sciences software (version 7.5.3). The chi-square test was used for comparison of proportions. Significance was set at = .05 (two sided).
Results
General characteristics and medication prescription
Of 46,813 patients listed with the 24 general practices, 988 (2.1%) were identified as long-term users of ASDs. Of these 988 patients, 66 were excluded because of ASD use for gastric or esophageal cancer, nongastric-related indications such as renal failure, or discontinuation of visits to the GP (patient moved or was a temporary visitor). The demographic and prescription characteristics of the remaining 922 patients are presented in Table 1. All patients had used H2-blockers and proton pump inhibitors for 12 weeks or more during the previous year.
Group I-ULCER consisted of 271 ulcer patients; group I-GERD, of 294 patients with reflux disease; and group I-FUNCTIONAL, of 127 patients with functional dyspepsia. Group NI consisted of 230 patients who did not undergo any confirmatory diagnostic testing (no endoscopy or barium study). Among the long-term users, treatment was more frequently prescribed for women than men (55% vs 45%, respectively; P < .05). Women were more likely not to undergo any diagnostic investigation (28% vs 21%, P < .05). If investigated, however, women were less likely than men have an ulcer (30% vs 50%, P < .05) and more likely to have functional dyspepsia (25% vs 11%, P < .05).
Overall, ranitidine was the drug most commonly prescribed. The mean duration of prescription was 33 weeks in the year of study, with a high of 38 weeks in group I-GERD. Almost one fourth of all patients (23%) had been using these drugs for more than 1 year. In more than half of all patients (53%), the medication was prescribed for 1 episode; in the other 47%, medication was prescribed for 2 or more episodes (ie, intermittent prescription). During the study period, 154 patients (17%) had used potential risk-bearing comedication for more than 6 weeks, including 48 with ulcer.
TABLE 1
CHARACTERISTICS AND PRESCRIPTIONS IN 922 PATIENTS (%) WITH LONG-TERM ACID SUPPRESSANT DRUG PRESCRIPTION IN 24 GENERAL PRACTICES IN THE REGION OF AMSTERDAM, THE NETHERLANDS
| DIAGNOSIS AFTER INVESTIGATION | |||||
|---|---|---|---|---|---|
| Characteristics | Total (N=922) | I-ULCER (n = 271) | I-GERD (n = 294) | I-FUNCTIONAL (n = 127) | NI: Stomach Complaints Without Investigation (n = 230) |
| Patients | |||||
| Female | 511 (55) | 41% | 57% | 72% | 62% |
| 15–44 years | 169 (18) | 11% | 17% | 25% | 25% |
| Mean age, years | 61 | 63 | 63 | 57 | 59 |
| Medication, No. | |||||
| Ranitidine | 442 (48) | 141 (52) | 115 (39) | 70 (55) | 116 (50) |
| Cimetidine | 236 (26) | 82 (30) | 48 (16) | 39 (31) | 67 (29) |
| Omeprazole | 241 (26) | 63 (23) | 130 (44) | 22 (17) | 26 (11) |
| Famotidine | 43 (5) | 16 (6) | 15 (5) | 4 (3) | 8 (3) |
| Lansoprazole | 13 (1) | 3 (1) | 5 (2) | 5 (4) | 0 (0) |
| Prescription Time | |||||
| 12–19 weeks | 231 (25) | 67 (25) | 44 (15) | 44 (35) | 76 (33) |
| 20–29 weeks | 184 (20) | 56 (21) | 46 (16) | 27 (21) | 55 (24) |
| 30–39 weeks | 148 (16) | 40 (15) | 50 (17) | 22 (17) | 36 (16) |
| 40–51 weeks | 143 (16) | 44 (16) | 60 (20) | 15 (12) | 24 (10) |
| >52 weeks | 216 (23) | 64 (24) | 94 (32) | 19 (15) | 39 (17) |
| Mean, weeks | 33 | 34 | 38 | 29 | 29 |
| No. of Episodes of Prescription | |||||
| 1 | 485 (53) | 144 (53) | 179 (61) | 51 (40) | 111 (48) |
| 2 | 271 (29) | 78 (29) | 81 (28) | 48 (38) | 64 (28) |
| > 2 | 166 (18) | 49 (18) | 34 (12) | 28 (22) | 55 (24) |
| Group I-ULCER includes all patients with a duodenal, -gastric, or nonspecified ulcer; group I-GERD includes all patients with symptomatic or erosive gastroesophageal reflux disease; group I-FUNCTIONAL includes patients with gastritis or with normal aspect on endoscopy or barium meal. | |||||
| *Total equals more than 100% because of different types of medication per patient; rarely prescribed medications are not mentioned. | |||||
Confirmation of working diagnosis
In 692 of the 922 (75%) patients a diagnostic test was performed to confirm the primary working diagnosis. In 519 (75%), a gastroscopy was performed and in 138 (20%) a barium meal radiograph was taken. In 35 patients, the specific form of investigation was unclear.
The specific diagnoses of the subgroups are shown in Table 2. In patients with ulcer, use of NSAIDs or prednisone was mentioned as the cause of the ulcer in 26 of 271 (9.6%) patients. Barrett’s esophagus was diagnosed in 29 of 342 (8.4%) patients in group I-GERD. In approximately 50% of the total number of patients, the investigation had been performed more than 5 years previously. Each patient had been treated accordingly during the subsequent years.
H pylori status was evaluated in 147 of the 692 patients (21%). In most of these cases the correspondence between the hospital staff and the GP did not mention current H pylori status. In addition, it remained unknown whether eradication therapy was administered with or without successful eradication of the microorganism (Table 3).
No investigations were performed in 230 of the 922 patients (25%). “Nonspecific stomach com-plaints” was the most common indication for ASDs in this group (Table 2).
TABLE 2
INDICATIONS FOR LONG-TERM (≥ 12 WEEKS) PRESCRIPTION OF LONG-TERM ACID SUPPRESSANT DRUGS
| No. (%) | |
|---|---|
| Final Diagnosis | 692 (75) |
| I-ULCER* | 271 (29) |
| Duodenal ulcer | 196 (21) |
| Duodenal and gastric ulcer | 17 (2) |
| Gastric ulcer | 43 (5) |
| Nonspecified ulcer | 15 (2) |
| I-GERD | 342 (37) |
| Esophagitis and ulcer* | 48 (5) |
| Esophagitis | 116 (13) |
| Esophagitis and hiatal hernia | 101 (11) |
| Symptomatic (hiatal hernia) | 77 (8) |
| I-FUNCTIONAL | 127 (14) |
| NI: Stomach Complaints | |
| Not Investigated | 230 (25) |
| Preventive | 45 (5) |
| Nonspecific stomach complaints | 146 (16) |
| Refluxlike complaints | 27 (3) |
| Ulcerlike complaints | 6 (1) |
| Motilitylike complaints | 6 (1) |
| Group I-ULCER includes all patients with a duodenal, gastric, or nonspecified ulcer; group I-GERD includes all patients with symptomatic or erosive gastroesophageal reflux disease; group I-FUNCTIONAL includes patients with only gastritis or with no imaging abnormalities. No investigations were performed on patients in group NI. | |
| *Total equals more than 100% because 48 patients with esophagitis and ulcer disease are included in both I-ULCER and I-GERD. | |
TABLE 3
H PYLORI DIAGNOSTICS AND ERADICATION THERAPY PRESCRIPTIONS IN 692 INVESTIGATED PATIENTS*
| Final Diagnoses After Investigation† | H pylori Diagnostics Ordered, No. (%) | H pylori Eradication Therapy Prescribed, No.(%) |
|---|---|---|
| I-ULCER (n = 271) | 78 (29) | 34 (13) |
| I-GERD (n = 342) | 34 (10) | 7 (2) |
| I-FUNCTIONAL (n = 127) | 35 (28) | 7 (6) |
| * The current H pylori status, prescription, and success of eradication therapy often remained unknown. Group I-ULCER includes all patients with a duodenal, gastric, or nonspecified ulcer; group I-GERD includes all patients with symptomatic or erosive gastroesophageal reflux disease; group I-FUNCTIONAL includes patients with only gastritis or with no imaging abnormalities. | ||
| † Forty-eight patients with gastroesophageal reflux disease and ulcer disease were included in both I-ULCER and I-GERD. | ||
Discussion
During our 1-year study, 2% of patients used an ASD for more than 3 months, and 0.8% for more than 6 months. Data from other studies, although not entirely comparable with ours, give an impression of the magnitude of long-term ASD prescription in other countries. In London, 0.8% of the general practice population used an ASD for more than 6 months continuously, a situation comparable with our results.5 One third of these patients had a history of ulcer disease. In Dundee, 4.4% of patients in 6 gen-eral practices were authorized to receive maintenance therapy.6 Many had a history of confirmed ulcer disease (27%), esophagitis (23%), or both (6%). Investigations in 23% of all patients revealed gastritis, duodenitis, hiatal hernia, or no pathology.
ASDs were used continuously for more than 1 year by almost one fourth of patients for whom they were prescribed; prolongation of the prescription was usually based on diagnostic tests performed years before. According to the guidelines that were in use during the course of this study, the indication for maintenance ASD was justified for most patients.2
Almost one third of all patients had a history of ulcer and continued to take an ASD (only 48 had concomitant GERD). For most of them, the ASD was probably prescribed as a preventive treatment. H pylori diagnostics were performed in a minority of patients. The major change in the most recent version of the guidelines of the Dutch College of General Practitioners (1996) is the role of H pylori infection. Patients with duodenal ulcer (active or inactive) not caused by NSAID use should be treated with H pylori eradication therapy.7 In principle, long-term ASD use is not necessary after successful eradication of H pylori, since the ulcer is not likely to relapse.8,9 However, a few patients with severe concomitant symptoms of functional dyspepsia or reflux disease may require therapy despite successful H pylori eradication.9,10 It is the GP’s task to identify patients with a history of ulcer disease and to eradicate H pylori. The clinician can easily identify patients with a history of ulcer disease with the help of computerized prescription data and the patient’s history file. However, implementation of these systems remains an important issue. Many such patients are invisible to the GP because they are treated with repeated prescriptions and without further consultation and therefore are not treated for H pylori.
The current Dutch guidelines do not advise testing for H pylori in patients with GERD or functional dyspepsia; this approach, therefore, is still not common in the Netherlands. Not advising to test is consistent with guidelines developed with a primary care perspective but differs in fundamental ways from guidelines formulated by specialists.11,12 The role of H pylori in esophagitis and reflux disease is not clear.13 Whether successful eradication of H pylori leads to exacerbation of esophagitis because of the absence of acid buffering by H pylori–derived urease production has been debated.14 In our study, one third of the patients suffered from GERD, which is easy to control, but not to cure; patients often experience a relapse after tapering of ASDs. Intermittent treatment with ASDs and the use of antacids as an escape medication may be an effective approach for managing patients with uncomplicated GERD and reducing the use of ASDs.15,16
There is little difference in the pattern of ASD prescribing for patients with ulcer, GERD, or functional dyspepsia. This similarity is particularly interesting because most studies of patients with functional dyspepsia have shown no benefit with the use of ASDs or with the eradication of H pylori.17-22 In these patients it may be sensible to taper the use of ASDs gradually, supported by antacid use; to explore the level of psychosocial distress; and to advise on lifestyle improvement.23 Long-term medication was prescribed as a preventive measure for the remaining 25% of all long-term users and to patients not given an endoscopy or barium study. The guidelines advise further investigation after several empirical treatments and again before a long-term ASD is prescribed.
One notable finding was that the patient’s sex appeared to influence whether investigations were ordered. The fact that ulcer disease is overall less often diagnosed in women might explain why the GPs did not perform further diagnostic investigations in women. Anxiety for endoscopy in men or women is another reason for not having a confirmed working diagnosis. A small number of anxious patients who have underlying ulcer disease might benefit from a test-and-treat approach to H pylori infection. However, serology cannot differentiate between either present or past H pylori infection and between ulcer or nonulcer disease.
Patients often experience a fast relapse of symptoms after discontinuation of therapy that may be related to rebound acid hypersecretion.24-26 It is possible that the prescription pattern of physicians in a subset of dyspeptic patients, especially in those with acid-related dyspepsia, leads to dependence on long-term therapy.
Conclusions
The use of ASDs, especially proton-pump inhibitors, is becoming increasingly common. In general practice in the Amsterdam region, 2% of patients used long-term ASDs. Patients with ulcer disease may stop taking ASDs after apparently successful H pylori eradication. Other patients require additional proof of underlying disease and H pylori status to determine the subsequent treatment approach. Tapering strategies in patients with mild reflux disease or functional dyspepsia need to be developed. Research is also needed in the general practice setting to develop strategies for tapering ASDs in chronic dyspeptic patients.
1. Lamberts H, Brouwer HJ, Mohrs J. Reason for encounter-, episode-and process-oriented standard output from Transition Project. Department of General Practice/Family Medicine. University of Amsterdam; 1991.
2. Numans ME, de Wit NJ, Geerdes RHM, et al. NHG-Standaard Maagklachten. Huisarts en Wetenschap 1993;36:375-9.
3. Omzet top 10 geneesmiddelen 1994. Data en Feiten Selectie, Stichting Farmaceutische Kengetallen, Den Haag; 1995.
4. Centrale Medische Pharmaceutische Commissie van de Ziekenfondsraad. Farmacotherapeutisch Kompas; 1995.
5. Ryder SD, O’Reilly S, Miller RJ, et al. Long-term acid suppressing treatment in general practice. BMJ 1994;308:827-30.
6. Goudie BM, McKenzie PE, Cipriano J, et al. Repeat prescribing of ulcer healing drugs in general practice—prevalence and underlying diagnosis. Aliment Pharmacol Ther 1996;10:147-50.
7. Numans ME, de Wit NJ, Geerdes RHM, et al. NHG-Standaard Maagklachten. Huisarts en Wetenschap 1996;39:565-77.
8. Van der Hulst RWM, Rauws EAJ, Köycu B, et al. Prevention of ulcer recurrence after eradication of H pylori infection: a prospective long-term follow-up study. Gastroenterology 1997;113:1082-6.
9. Hurenkamp GJB, Grundmeijer HGLM, van der Ende A, Tytgat GNJ, Assendelft WJJ, van der Hulst RWM. Arrest of chronic acid suppressant drug use after successful Helicobacter pylori eradication in patients with peptic ulcer disease: a six-month follow-up study. Aliment Pharmacol Ther 2001;15:1047-54.
10. Boyd EJ. The prevalence of esophagitis in patients with duodenal ulcer or ulcer-like dyspepsia. Am J Gastroenterol 1996;91:1539-43.
11. Meineche-Schmidt V, Rubin G, de Wit NJ. Helicobacter pylori infection: a comparative review of existing managment guidelines. Fam Pract 2000;17(suppl 2):S2-S5.
12. American Gastroenterological Association. Medical Position Statement: Evaluation of dyspepsia. Gastroenterology 1998;114:579-81.
13. Labenz J, Malfertheiner P. Helicobacter pylori in gastroesophageal reflux disease: causal agent, independent or protective factor? Gut 1997;41:277-80.
14. Labenz J, Tillenburg B, Peitz U, et al. Helicobacter pylori augments the pH-increasing effect of omeprazole in patients with duodenal ulcer. Gastroenterology 1996;110:725-32.
15. Bardhan KD, Müller-Lissner S, Bigard MA, et al. Symptomatic gastroesophageal reflux disease: double-blind controlled study of intermittent treatment with omeprazole or ranitidine. BMJ 1999;318:502-7.
16. Talley NJ, Lauritsen K, Tunturi-hihnala H, et al. Esomeprazole 20 mg maintains symptom control in endoscopy-negative gastroesophageal reflux disease: a controlled trial of “on-demand” therapy for 6 months. Aliment Pharmacol Ther 2001;15:347-54.
17. Talley NJ. A critique of therapeutic trials in Helicobacter pylori–postive functional dyspepsia. Gastroenterology 1994;106:1174-83.
18. Veldhuizen SJO, Cleary C, Talley NJ, et al. Drug treatment of functional dyspepsia: a systematic analysis of trial methodology with recommendations for design of future trials. Am J Gastroenterol 1996;4:660-73.
19. Laheij RJF, Jansen JBMJ, van de Lisdonk EH, et al. Review article: symptom improvement through eradication of H pylori in patients with non-ulcer dyspepsia. Aliment Pharmacol Ther 1996;10:843-50.
20. Blum AL, Talley NJ, O’Morain C, et al. Lack of effect of treating Helicobacter pylori infection in patients with nonulcer dyspepsia. N Engl J Med 1998;339:1875-81.
21. McColl K, Murray L, El-Omar E, et al. Symptomatic benefit from eradicating Helicobacter pylori infection in patients with nonulcer dyspepsia. N Engl J Med 1998;339:1869-74.
22. Talley NJ, Jansssens J, Lauritsen K, et al. Eradication of H pylori in functional dyspepsia: randomised double blind placebo controlled trial with 12 months’ follow up. BMJ 1999;318:833-7.
23. Quartero AO, Post MWM, Numans ME, et al. What makes the dyspeptic patient feel ill? A cross-sectional survey of functional health status, H pylori infection, and psychological distress in dyspeptic patients in general practice. Gut 1999;45:15-9.
24. El-Omar E, Banerjee S, Wirz BN, Penman I, Ardill JES, McColl KEL. Marked rebound acid hypersecretion after treatment with ranitidine. Am J Gastroenterology 1996;91:355-9.
25. Fullarton GM, McLauchlan G, McDonald A, Crean GP, McColl KEL. Rebound nocturnal hypersecretion after four weeks of treatment with an H2-receptor antagonist. Gut 1998;42:159-65.
26. Gillen D, Wirz AA, Ardill JE, McColl KE. Rebound acid hypersecretion after omeprazole and its relation to on-treatment acid suppression and Helicobacter pylori status. Gastroenterology 1999;116:239-47.
OBJECTIVES: A considerable proportion of the medication budget of Dutch general practitioners is spent on prescribed long-term acid suppressant drugs. We investigated the magnitude of long-term prescription of acid suppressant drugs in general practice and the frequency and means of confirming the primary working diagnosis.
STUDY DESIGN: We used a retrospective descriptive study of 24 general practices in the Amsterdam region.
POPULATION: We identified those receiving long-term acid suppressant therapy (12 or more weeks/year) from a total of 46,813 patients by extracting data from pharmacy databases.
OUTCOMES MEASURED: We measured the amount and duration of prescriptions for each medication, indications for prescription, and investigations performed by general practitioners.
RESULTS: Of the 46,813 patients, 922 (2%) received long-term acid suppressant therapy. The duration of prescription varied from 12 weeks in 8% of patients to > 52 weeks in 23% of patients (mean = 33 weeks). In 25% of patients, no investigations were performed; 75% of patients underwent endoscopy or ingested a barium meal. The predominant diagnoses in investigated patients were ulcer disease (39%), gastroesophageal reflux disease (49%), and functional dyspepsia (gastritis, normal aspect; 18%). Helicobacter pylori status was available in 29% of patients with ulcer disease. Eradication therapy was reported in 44% of these patients.
CONCLUSIONS: Among patients of physicians in general practice in the Amsterdam region, 2% used long-term acid suppressants. Patients with ulcer disease may stop taking acid suppressants after apparent successful H pylori eradication. Tapering strategies must be developed for patients with mild reflux disease or functional dyspepsia.
- In Dutch general practice, 2% of patients take long-term acid suppressant drugs.
- One third of patients taking long-term acid suppressant drugs have peptic ulcer disease and may not need medication as soon as Helicobacter pylori has been eradicated.
- One fourth of patients taking long-term acid suppressant drugs have never undergone endoscopy or barium study.
- Because patients often do not tolerate sudden cessation of chronic acid suppressant drug use, tapering strategies must be developed.
The average Dutch general practice includes approximately 2350 patients. Of these, 2 to 3 per week, on average, visit their general practitioner (GP) with a complaint of dyspepsia.1 According to the guidelines of the Dutch College of General Practitioners, the treatment of dyspepsia is directed toward symptom relief, usually on an empirical basis, except for patients with symptoms such as sudden weight loss or hematemesis that suggest cancer; these are referred for endoscopy.2 Medication is prescribed in a stepwise fashion from less potent antacids and prokinetics to the more potent H2-blockers and proton pump inhibitors. During our study, long-term treatment with acid suppressant drugs (ASDs) was indicated only for relapsing ulcers or ulcerlike complaints, relapsing esophagitis, and relapsing gastroesophageal refluxlike symptoms.2
ASDs are responsible for a disproportionate share of the medication budget of Dutch GPs because of their high cost, their high frequency of prescription, and their use on a long-term basis.3 We therefore wondered whether the indication for prescribing an ASD was always appropriate. The aim of our study was to describe how commonly ASDs are prescribed and to describe the initial working diagnosis, the diagnostic tests performed to confirm the working hypothesis, and the final diagnosis for each patient.
Methods
Patients
We retrospectively collected data from 24 general practices in Amsterdam from September 1994 to August 1995 on patients taking long-term ASDs (12 or more weeks during the previous year). ASDs included antacids, mucosa-protective agents, prokinetics, H2-blockers, and proton pump inhibitors.4
Patients were identified from a medication database obtained from all cooperating pharmacists that included patient demographics; type, dose, and duration of medications; and use of possible risk-bearing comedications (aspirin, nonsteroidal anti-inflammatory drugs, or prednisone for more than 6 weeks during the study year). In this way we were able to identify almost all patients from the participating general practices who received long-term treatment with ASDs.
Confirmation of gastrointestinal diagnosis
In the Netherlands, a GP receives all available medical information on his patients (ie, letters from specialists, results from any examinations performed) and stores this information in the patient’s medical history file. When a patient switches to another GP, the entire medical history is sent to this new physician. Our principal investigator used these medical history files to determine the diagnosis and reason for the ASD prescription and the diagnostic tests (including Helicobacter pylori investigations) that were ordered to confirm the working diagnosis. Gastroscopy or barium meal radiography at any time during a patient’s life was considered the investigation for confirmation of the diagnosis. If the prescription started after this investigation or as a consequence of it, the investigation was considered the reason for initiating the current long-term treatment. Verification and completion of the obtained data took place in a face-to-face evaluation between the principal investigator and the GP, ensuring the completeness and reliability of the data.
Analysis and statistics
Patients were categorized into group I (investigations to confirm a working diagnosis were performed) and group NI (no investigations were performed). Three subgroups were identified within group I. We included all patients with a duodenal, gastric, or unspecified ulcer in group I-ULCER; group I-GERD included all patients with symptomatic or erosive gastroesophageal reflux disease (GERD); and group I-FUNCTIONAL included patients with only gastritis or with no imaging abnormalities. Patients with an ulcer and esophagitis were placed in group I-ULCER for their patient characteristics and medication prescription and in both groups I-ULCER and I-GERD for their medication indication, diagnostic tests, and eradication of H pylori.
Data were analyzed with the use of Statistical Package for the Social Sciences software (version 7.5.3). The chi-square test was used for comparison of proportions. Significance was set at = .05 (two sided).
Results
General characteristics and medication prescription
Of 46,813 patients listed with the 24 general practices, 988 (2.1%) were identified as long-term users of ASDs. Of these 988 patients, 66 were excluded because of ASD use for gastric or esophageal cancer, nongastric-related indications such as renal failure, or discontinuation of visits to the GP (patient moved or was a temporary visitor). The demographic and prescription characteristics of the remaining 922 patients are presented in Table 1. All patients had used H2-blockers and proton pump inhibitors for 12 weeks or more during the previous year.
Group I-ULCER consisted of 271 ulcer patients; group I-GERD, of 294 patients with reflux disease; and group I-FUNCTIONAL, of 127 patients with functional dyspepsia. Group NI consisted of 230 patients who did not undergo any confirmatory diagnostic testing (no endoscopy or barium study). Among the long-term users, treatment was more frequently prescribed for women than men (55% vs 45%, respectively; P < .05). Women were more likely not to undergo any diagnostic investigation (28% vs 21%, P < .05). If investigated, however, women were less likely than men have an ulcer (30% vs 50%, P < .05) and more likely to have functional dyspepsia (25% vs 11%, P < .05).
Overall, ranitidine was the drug most commonly prescribed. The mean duration of prescription was 33 weeks in the year of study, with a high of 38 weeks in group I-GERD. Almost one fourth of all patients (23%) had been using these drugs for more than 1 year. In more than half of all patients (53%), the medication was prescribed for 1 episode; in the other 47%, medication was prescribed for 2 or more episodes (ie, intermittent prescription). During the study period, 154 patients (17%) had used potential risk-bearing comedication for more than 6 weeks, including 48 with ulcer.
TABLE 1
CHARACTERISTICS AND PRESCRIPTIONS IN 922 PATIENTS (%) WITH LONG-TERM ACID SUPPRESSANT DRUG PRESCRIPTION IN 24 GENERAL PRACTICES IN THE REGION OF AMSTERDAM, THE NETHERLANDS
| DIAGNOSIS AFTER INVESTIGATION | |||||
|---|---|---|---|---|---|
| Characteristics | Total (N=922) | I-ULCER (n = 271) | I-GERD (n = 294) | I-FUNCTIONAL (n = 127) | NI: Stomach Complaints Without Investigation (n = 230) |
| Patients | |||||
| Female | 511 (55) | 41% | 57% | 72% | 62% |
| 15–44 years | 169 (18) | 11% | 17% | 25% | 25% |
| Mean age, years | 61 | 63 | 63 | 57 | 59 |
| Medication, No. | |||||
| Ranitidine | 442 (48) | 141 (52) | 115 (39) | 70 (55) | 116 (50) |
| Cimetidine | 236 (26) | 82 (30) | 48 (16) | 39 (31) | 67 (29) |
| Omeprazole | 241 (26) | 63 (23) | 130 (44) | 22 (17) | 26 (11) |
| Famotidine | 43 (5) | 16 (6) | 15 (5) | 4 (3) | 8 (3) |
| Lansoprazole | 13 (1) | 3 (1) | 5 (2) | 5 (4) | 0 (0) |
| Prescription Time | |||||
| 12–19 weeks | 231 (25) | 67 (25) | 44 (15) | 44 (35) | 76 (33) |
| 20–29 weeks | 184 (20) | 56 (21) | 46 (16) | 27 (21) | 55 (24) |
| 30–39 weeks | 148 (16) | 40 (15) | 50 (17) | 22 (17) | 36 (16) |
| 40–51 weeks | 143 (16) | 44 (16) | 60 (20) | 15 (12) | 24 (10) |
| >52 weeks | 216 (23) | 64 (24) | 94 (32) | 19 (15) | 39 (17) |
| Mean, weeks | 33 | 34 | 38 | 29 | 29 |
| No. of Episodes of Prescription | |||||
| 1 | 485 (53) | 144 (53) | 179 (61) | 51 (40) | 111 (48) |
| 2 | 271 (29) | 78 (29) | 81 (28) | 48 (38) | 64 (28) |
| > 2 | 166 (18) | 49 (18) | 34 (12) | 28 (22) | 55 (24) |
| Group I-ULCER includes all patients with a duodenal, -gastric, or nonspecified ulcer; group I-GERD includes all patients with symptomatic or erosive gastroesophageal reflux disease; group I-FUNCTIONAL includes patients with gastritis or with normal aspect on endoscopy or barium meal. | |||||
| *Total equals more than 100% because of different types of medication per patient; rarely prescribed medications are not mentioned. | |||||
Confirmation of working diagnosis
In 692 of the 922 (75%) patients a diagnostic test was performed to confirm the primary working diagnosis. In 519 (75%), a gastroscopy was performed and in 138 (20%) a barium meal radiograph was taken. In 35 patients, the specific form of investigation was unclear.
The specific diagnoses of the subgroups are shown in Table 2. In patients with ulcer, use of NSAIDs or prednisone was mentioned as the cause of the ulcer in 26 of 271 (9.6%) patients. Barrett’s esophagus was diagnosed in 29 of 342 (8.4%) patients in group I-GERD. In approximately 50% of the total number of patients, the investigation had been performed more than 5 years previously. Each patient had been treated accordingly during the subsequent years.
H pylori status was evaluated in 147 of the 692 patients (21%). In most of these cases the correspondence between the hospital staff and the GP did not mention current H pylori status. In addition, it remained unknown whether eradication therapy was administered with or without successful eradication of the microorganism (Table 3).
No investigations were performed in 230 of the 922 patients (25%). “Nonspecific stomach com-plaints” was the most common indication for ASDs in this group (Table 2).
TABLE 2
INDICATIONS FOR LONG-TERM (≥ 12 WEEKS) PRESCRIPTION OF LONG-TERM ACID SUPPRESSANT DRUGS
| No. (%) | |
|---|---|
| Final Diagnosis | 692 (75) |
| I-ULCER* | 271 (29) |
| Duodenal ulcer | 196 (21) |
| Duodenal and gastric ulcer | 17 (2) |
| Gastric ulcer | 43 (5) |
| Nonspecified ulcer | 15 (2) |
| I-GERD | 342 (37) |
| Esophagitis and ulcer* | 48 (5) |
| Esophagitis | 116 (13) |
| Esophagitis and hiatal hernia | 101 (11) |
| Symptomatic (hiatal hernia) | 77 (8) |
| I-FUNCTIONAL | 127 (14) |
| NI: Stomach Complaints | |
| Not Investigated | 230 (25) |
| Preventive | 45 (5) |
| Nonspecific stomach complaints | 146 (16) |
| Refluxlike complaints | 27 (3) |
| Ulcerlike complaints | 6 (1) |
| Motilitylike complaints | 6 (1) |
| Group I-ULCER includes all patients with a duodenal, gastric, or nonspecified ulcer; group I-GERD includes all patients with symptomatic or erosive gastroesophageal reflux disease; group I-FUNCTIONAL includes patients with only gastritis or with no imaging abnormalities. No investigations were performed on patients in group NI. | |
| *Total equals more than 100% because 48 patients with esophagitis and ulcer disease are included in both I-ULCER and I-GERD. | |
TABLE 3
H PYLORI DIAGNOSTICS AND ERADICATION THERAPY PRESCRIPTIONS IN 692 INVESTIGATED PATIENTS*
| Final Diagnoses After Investigation† | H pylori Diagnostics Ordered, No. (%) | H pylori Eradication Therapy Prescribed, No.(%) |
|---|---|---|
| I-ULCER (n = 271) | 78 (29) | 34 (13) |
| I-GERD (n = 342) | 34 (10) | 7 (2) |
| I-FUNCTIONAL (n = 127) | 35 (28) | 7 (6) |
| * The current H pylori status, prescription, and success of eradication therapy often remained unknown. Group I-ULCER includes all patients with a duodenal, gastric, or nonspecified ulcer; group I-GERD includes all patients with symptomatic or erosive gastroesophageal reflux disease; group I-FUNCTIONAL includes patients with only gastritis or with no imaging abnormalities. | ||
| † Forty-eight patients with gastroesophageal reflux disease and ulcer disease were included in both I-ULCER and I-GERD. | ||
Discussion
During our 1-year study, 2% of patients used an ASD for more than 3 months, and 0.8% for more than 6 months. Data from other studies, although not entirely comparable with ours, give an impression of the magnitude of long-term ASD prescription in other countries. In London, 0.8% of the general practice population used an ASD for more than 6 months continuously, a situation comparable with our results.5 One third of these patients had a history of ulcer disease. In Dundee, 4.4% of patients in 6 gen-eral practices were authorized to receive maintenance therapy.6 Many had a history of confirmed ulcer disease (27%), esophagitis (23%), or both (6%). Investigations in 23% of all patients revealed gastritis, duodenitis, hiatal hernia, or no pathology.
ASDs were used continuously for more than 1 year by almost one fourth of patients for whom they were prescribed; prolongation of the prescription was usually based on diagnostic tests performed years before. According to the guidelines that were in use during the course of this study, the indication for maintenance ASD was justified for most patients.2
Almost one third of all patients had a history of ulcer and continued to take an ASD (only 48 had concomitant GERD). For most of them, the ASD was probably prescribed as a preventive treatment. H pylori diagnostics were performed in a minority of patients. The major change in the most recent version of the guidelines of the Dutch College of General Practitioners (1996) is the role of H pylori infection. Patients with duodenal ulcer (active or inactive) not caused by NSAID use should be treated with H pylori eradication therapy.7 In principle, long-term ASD use is not necessary after successful eradication of H pylori, since the ulcer is not likely to relapse.8,9 However, a few patients with severe concomitant symptoms of functional dyspepsia or reflux disease may require therapy despite successful H pylori eradication.9,10 It is the GP’s task to identify patients with a history of ulcer disease and to eradicate H pylori. The clinician can easily identify patients with a history of ulcer disease with the help of computerized prescription data and the patient’s history file. However, implementation of these systems remains an important issue. Many such patients are invisible to the GP because they are treated with repeated prescriptions and without further consultation and therefore are not treated for H pylori.
The current Dutch guidelines do not advise testing for H pylori in patients with GERD or functional dyspepsia; this approach, therefore, is still not common in the Netherlands. Not advising to test is consistent with guidelines developed with a primary care perspective but differs in fundamental ways from guidelines formulated by specialists.11,12 The role of H pylori in esophagitis and reflux disease is not clear.13 Whether successful eradication of H pylori leads to exacerbation of esophagitis because of the absence of acid buffering by H pylori–derived urease production has been debated.14 In our study, one third of the patients suffered from GERD, which is easy to control, but not to cure; patients often experience a relapse after tapering of ASDs. Intermittent treatment with ASDs and the use of antacids as an escape medication may be an effective approach for managing patients with uncomplicated GERD and reducing the use of ASDs.15,16
There is little difference in the pattern of ASD prescribing for patients with ulcer, GERD, or functional dyspepsia. This similarity is particularly interesting because most studies of patients with functional dyspepsia have shown no benefit with the use of ASDs or with the eradication of H pylori.17-22 In these patients it may be sensible to taper the use of ASDs gradually, supported by antacid use; to explore the level of psychosocial distress; and to advise on lifestyle improvement.23 Long-term medication was prescribed as a preventive measure for the remaining 25% of all long-term users and to patients not given an endoscopy or barium study. The guidelines advise further investigation after several empirical treatments and again before a long-term ASD is prescribed.
One notable finding was that the patient’s sex appeared to influence whether investigations were ordered. The fact that ulcer disease is overall less often diagnosed in women might explain why the GPs did not perform further diagnostic investigations in women. Anxiety for endoscopy in men or women is another reason for not having a confirmed working diagnosis. A small number of anxious patients who have underlying ulcer disease might benefit from a test-and-treat approach to H pylori infection. However, serology cannot differentiate between either present or past H pylori infection and between ulcer or nonulcer disease.
Patients often experience a fast relapse of symptoms after discontinuation of therapy that may be related to rebound acid hypersecretion.24-26 It is possible that the prescription pattern of physicians in a subset of dyspeptic patients, especially in those with acid-related dyspepsia, leads to dependence on long-term therapy.
Conclusions
The use of ASDs, especially proton-pump inhibitors, is becoming increasingly common. In general practice in the Amsterdam region, 2% of patients used long-term ASDs. Patients with ulcer disease may stop taking ASDs after apparently successful H pylori eradication. Other patients require additional proof of underlying disease and H pylori status to determine the subsequent treatment approach. Tapering strategies in patients with mild reflux disease or functional dyspepsia need to be developed. Research is also needed in the general practice setting to develop strategies for tapering ASDs in chronic dyspeptic patients.
1. Lamberts H, Brouwer HJ, Mohrs J. Reason for encounter-, episode-and process-oriented standard output from Transition Project. Department of General Practice/Family Medicine. University of Amsterdam; 1991.
2. Numans ME, de Wit NJ, Geerdes RHM, et al. NHG-Standaard Maagklachten. Huisarts en Wetenschap 1993;36:375-9.
3. Omzet top 10 geneesmiddelen 1994. Data en Feiten Selectie, Stichting Farmaceutische Kengetallen, Den Haag; 1995.
4. Centrale Medische Pharmaceutische Commissie van de Ziekenfondsraad. Farmacotherapeutisch Kompas; 1995.
5. Ryder SD, O’Reilly S, Miller RJ, et al. Long-term acid suppressing treatment in general practice. BMJ 1994;308:827-30.
6. Goudie BM, McKenzie PE, Cipriano J, et al. Repeat prescribing of ulcer healing drugs in general practice—prevalence and underlying diagnosis. Aliment Pharmacol Ther 1996;10:147-50.
7. Numans ME, de Wit NJ, Geerdes RHM, et al. NHG-Standaard Maagklachten. Huisarts en Wetenschap 1996;39:565-77.
8. Van der Hulst RWM, Rauws EAJ, Köycu B, et al. Prevention of ulcer recurrence after eradication of H pylori infection: a prospective long-term follow-up study. Gastroenterology 1997;113:1082-6.
9. Hurenkamp GJB, Grundmeijer HGLM, van der Ende A, Tytgat GNJ, Assendelft WJJ, van der Hulst RWM. Arrest of chronic acid suppressant drug use after successful Helicobacter pylori eradication in patients with peptic ulcer disease: a six-month follow-up study. Aliment Pharmacol Ther 2001;15:1047-54.
10. Boyd EJ. The prevalence of esophagitis in patients with duodenal ulcer or ulcer-like dyspepsia. Am J Gastroenterol 1996;91:1539-43.
11. Meineche-Schmidt V, Rubin G, de Wit NJ. Helicobacter pylori infection: a comparative review of existing managment guidelines. Fam Pract 2000;17(suppl 2):S2-S5.
12. American Gastroenterological Association. Medical Position Statement: Evaluation of dyspepsia. Gastroenterology 1998;114:579-81.
13. Labenz J, Malfertheiner P. Helicobacter pylori in gastroesophageal reflux disease: causal agent, independent or protective factor? Gut 1997;41:277-80.
14. Labenz J, Tillenburg B, Peitz U, et al. Helicobacter pylori augments the pH-increasing effect of omeprazole in patients with duodenal ulcer. Gastroenterology 1996;110:725-32.
15. Bardhan KD, Müller-Lissner S, Bigard MA, et al. Symptomatic gastroesophageal reflux disease: double-blind controlled study of intermittent treatment with omeprazole or ranitidine. BMJ 1999;318:502-7.
16. Talley NJ, Lauritsen K, Tunturi-hihnala H, et al. Esomeprazole 20 mg maintains symptom control in endoscopy-negative gastroesophageal reflux disease: a controlled trial of “on-demand” therapy for 6 months. Aliment Pharmacol Ther 2001;15:347-54.
17. Talley NJ. A critique of therapeutic trials in Helicobacter pylori–postive functional dyspepsia. Gastroenterology 1994;106:1174-83.
18. Veldhuizen SJO, Cleary C, Talley NJ, et al. Drug treatment of functional dyspepsia: a systematic analysis of trial methodology with recommendations for design of future trials. Am J Gastroenterol 1996;4:660-73.
19. Laheij RJF, Jansen JBMJ, van de Lisdonk EH, et al. Review article: symptom improvement through eradication of H pylori in patients with non-ulcer dyspepsia. Aliment Pharmacol Ther 1996;10:843-50.
20. Blum AL, Talley NJ, O’Morain C, et al. Lack of effect of treating Helicobacter pylori infection in patients with nonulcer dyspepsia. N Engl J Med 1998;339:1875-81.
21. McColl K, Murray L, El-Omar E, et al. Symptomatic benefit from eradicating Helicobacter pylori infection in patients with nonulcer dyspepsia. N Engl J Med 1998;339:1869-74.
22. Talley NJ, Jansssens J, Lauritsen K, et al. Eradication of H pylori in functional dyspepsia: randomised double blind placebo controlled trial with 12 months’ follow up. BMJ 1999;318:833-7.
23. Quartero AO, Post MWM, Numans ME, et al. What makes the dyspeptic patient feel ill? A cross-sectional survey of functional health status, H pylori infection, and psychological distress in dyspeptic patients in general practice. Gut 1999;45:15-9.
24. El-Omar E, Banerjee S, Wirz BN, Penman I, Ardill JES, McColl KEL. Marked rebound acid hypersecretion after treatment with ranitidine. Am J Gastroenterology 1996;91:355-9.
25. Fullarton GM, McLauchlan G, McDonald A, Crean GP, McColl KEL. Rebound nocturnal hypersecretion after four weeks of treatment with an H2-receptor antagonist. Gut 1998;42:159-65.
26. Gillen D, Wirz AA, Ardill JE, McColl KE. Rebound acid hypersecretion after omeprazole and its relation to on-treatment acid suppression and Helicobacter pylori status. Gastroenterology 1999;116:239-47.
Does the Patient’s Sex Influence Cardiovascular Outcome After Acute Myocardial Infarction?
OBJECTIVES: To determine whether outcome differences based on the patient’s sex occur after myocardial infarction (MI) at a large private hospital.
STUDY DESIGN: We conducted a large cohort study.
POPULATION: Inclusion required hospital admission between January 1, 1998, and June 30, 1999, and a diagnosis of acute MI or subendocardial infarction. The number of patients included in the study was 1669. Data were collected at discharge on age, sex, race, health insurance, hypercholesterolemia, diabetes, smoking, hypertension, and the extent of coronary artery disease.
OUTCOMES MEASURED: The 8 outcomes analyzed were angiogram, angioplasty, stent placement, coronary artery bypass grafting (CABG), mortality, time in the intensive care unit, total length of stay, and combined catheterization procedures.
RESULTS: After adjusting for 7 confounding variables, we found no significant differences between men and women for mortality, ICU time, total hospital time, stent placement, angiogram, angioplasty, or combined catheterization procedures. Men had significantly more CABG (relative risk [RR] 1.96, P < .01). Among patients who underwent CABG (N = 204), men had significantly more 3-vessel coronary disease (RR 1.44, P < .01) and left main coronary artery disease greater than 50% (RR 1.58, P < .01). Once we had controlled for the extent of coronary artery disease, we found no difference between the sexes for CABG.
CONCLUSIONS: During hospitalization after an MI, most cardiovascular outcomes and process measures are the same for men and women. The greater frequency of CABG in men than in women is explained by men’s greater frequency of 3-vessel and advanced left-main coronary disease.
- Unadjusted data reveal that in patients hospitalized for acute myocardial infarction, women experience higher mortality rates and undergo fewer procedures, particularly coronary artery bypass grafting, than men.
- Controlling for several comorbidities and the extent of coronary artery disease eliminates differences between the sexes in this context.
Recent studies have shown that women aged less than 75 years have a significantly higher rate of in-hospital mortality than men after acute myocardial infarction (MI).1-3 A cohort study involving more than 384,000 patients admitted to the hospital for MI found that women aged 74 years or less had a higher mortality rate than men. The mortality rate in women aged less than 50 years was twice as high as that of men in the same age group.2 The difference in mortality after an acute MI disappears at age 75 years.1,2,4
Although women are as likely as men to have a positive stress electrocardiogram or stress thallium test after an acute MI, women are referred less often for additional noninvasive testing or cardiac catherization.5 In a study of more than 12,000 patients with acute coronary syndromes, fewer women than men underwent cardiac catheterization.3 In hypothetical case studies, physicians shown videotapes of actors playing patients and given hypothetical case studies were less likely to say they would refer the women for catheterization than the men. Black women were referred least.6
Men are also more likely than women to receive angioplasty or coronary artery bypass grafting (CABG) after acute MI.2 Women undergoing CABG have significantly more comorbidities and less favorable patient characteristics preoperatively than do men.7 While women and men undergoing CABG have the same type and extent of symptoms overall, women are more likely to have preserved ventricular function and less likely to possess multivessel disease than are men.3,7,8
The purpose of this study was to determine whether sex-related outcome differences existed after being treated for an MI at a large private hospital. We also evaluated how significantly any difference in the extent of coronary artery disease between the sexes would confound the rate of CABG performed after an acute MI.
Methods
Study design and population
This is a hospitalization cohort study using data obtained from the Acute Myocardial Infarction Registry database at TriHealth hospitals in Cincinnati, Ohio. The TriHealth hospital system consists of 3 private hospitals in the greater Cincinnati area. Inclusion criteria for entering the cohort included admission to a TriHealth hospital during an 18-month period between January 1, 1998, and June 30, 1999, and a discharge diagnosis of acute MI or subendocardial infarction. Exclusion criteria included transfer to another local hospital for some of the patient’s health care or more than 1 hospitalization for an MI during the cohort time period. Double admissions and transferred patients were rare (N = 7). Individuals were included in the cohort only during their hospitalization for the acute MI. Patients exited the cohort at discharge.
Data collection
Data were collected at hospital discharge on age, sex, race, insurance status, and various comorbidities, including smoking, hypercholesterolemia, diabetes, hypertension, and the extent of coronary artery disease. The 8 outcomes available for analysis included hospital mortality, time in the intensive-care unit, total length of stay, angiogram, angioplasty, stent placement, CABG, and the 3 catheterization procedures combined. For patients who underwent CABG, data were collected on the number of bypassed vessels and the presence of advanced left main coronary disease. Data on demographics, disposition, and length of stay were obtained by means of the hospital registry system. The comorbidity and cardiovascular data collection sheet was typically filled out at discharge, usually by the cardiologist and occasionally by a primary care physician. The presence or absence of comorbidities was determined by the physician who provided the patient data. Each comorbidity was listed on the data sheet with a “yes or no” option.
Analysis
Univariate analysis using chi-square and t-tests were performed that compared sex with mortality, with each procedure, and with each comorbidity. The relationship between the patient’s sex and each of the 8 outcomes of interest (adjusted for age, race, insurance smoking, hypertension, diabetes, and hypercholesterolemia) was investigated by logistic regression analysis for dichotomous variables and survival analysis for time to event variables. The significance of each analysis was set at P = .01, based on the Bonferonni adjustment9 for multiple comparisons and an overall P = .05. Analysis was performed using STATA (STATA Corporation, College Station, Tex.) and SAS (SAS Institute, Cary, N.C.) statistical software. We estimated that a sample of 1600 patients was needed to detect an absolute difference of 6% in the presence or absence of an intervention between men and women (two-tailed alpha = .05, beta = 0.20).
Results
A total of 1669 patients (631 women, 1038 men) were available for our analysis. Baseline characteristics by sex are displayed in Table 1. Men were significantly younger, less likely to be African American, less likely to be Medicaid insured, more likely to smoke, and less likely to have diabetes mellitus (P < .05) than women. In the univariate analysis (Table 2), women had significantly higher rates of hospital mortality (P < .01) and diabetes (P < .01) and a longer mean length of stay in the hospital (P = .01). Men had significantly higher rates of stent placement (P < .01) and CABG (P < .01).
We found no significant difference between men and women for hospital mortality, time in the ICU, total time in the hospital, stent placement, angiogram, angioplasty, or the 3 catheterization procedures combined in the multivariate analysis (Table 3). Men had significantly more CABG (relative risk [RR] 1.96, 95% confidence interval [CI] 1.41-2.76) than women.
In a separate analysis of patients who underwent CABG (n = 211), men had significantly more 3-vessel coronary disease and advanced left anterior descending artery disease (LAD >50%) than women (Table 4). There was no difference between men and women undergoing CABG for either single-vessel or double-vessel coronary artery disease. The extent of coronary artery disease was only known for patients who were catheterized (N = 1204). Again comparing sex regarding the risk of CABG, but additionally controlling for the extent of coronary artery disease (LAD >50% and 3-vessel CAD), now reveals no significant increase associated with male sex (RR 1.30, 95% CI 0.82-2.08).
TABLE 1
CHARACTERISTICS OF THE STUDY POPULATION
| Men (N = 1038) | Women (N = 631) | P Value | |
|---|---|---|---|
| Age | 62.2 + 13.3 | 68.7 + 13.8 | < .05 |
| Race | < .05 | ||
| White | 789 (76%) | 482 (76%) | |
| Black | 62 (6%) | 67 (11%) | |
| Asian | 3 (0%) | 1 (0%) | |
| Other | 184 (18%) | 82 (13%) | |
| Insurance | < .05 | ||
| Medicaid | 14 (1%) | 25 4%) | |
| Comorbidities | |||
| Hypercholesterolemia | 224 (22%) | 108 (17%) | NS |
| Hypertension | 444 (43%) | 293 (46%) | NS |
| Smoking | 411 (40%) | 184 (29%) | < .01 |
| Diabetes | 267 (26%) | 209 (33%) | < .01 |
TABLE 2
UNADJUSTED OUTCOMES BY SEX
| Men (n = 1038) | Women (n = 631) | P Value | |
|---|---|---|---|
| Hospital mortality | 76 (7%) | 70 (11%) | < .01 |
| Mean time in ICU | 2.1 days | 1.9 days | NS |
| Mean length of stay | 5.9 days | 6.6 days | < .01 |
| Angiogram | 241 (23%) | 139 (22%) | NS |
| Angioplasty | 67 (6%) | 38 (6%) | NS |
| Stent placement | 346 (33%) | 162 (26%) | < .01 |
| CABG | 157 (15%) | 54 (9%) | < .01 |
| 3 catheterization procedures (angiogram, angioplasty, stent) | 654 (63%) | 339 (54%) | < .01 |
| CABG denotes coronary artery bypass grafting; ICU, intensive-care unit. | |||
TABLE 3
ADJUSTED RELATIVE RISK FOR CARDIOVASCULAR OUTCOME
| Outcome | Relative Risk* |
|---|---|
| Hospital mortality | 0.86 (0.6-1.23) |
| Time in ICU | 0.95 (0.85-1.05) |
| Angiogram | 1.02 (0.80-1.31) |
| Angioplasty | 0.90 (0.59-1.39) |
| Stent placement | 1.04 (0.82-1.32) |
| Coronary artery bypass graft | 1.96 (1.41-2.76)† |
| Angiogram, angioplasty, or stent | 1.04 (0.82-1.28) |
| * Men compared with women (ie, men who underwent coronary artery bypass grafting were more likely to have more extensive disease). | |
| † P < 0.05. | |
| ICU denotes intensive-care unit. | |
TABLE 4
EXTENT OF CORONARY ARTERY DISEASE IN PATIENTS UNDERGOING CABG, BY PATIENT’S SEX (N = 211)
| Extent of Disease | Relative Risk(95% CI)* |
|---|---|
| Single vessel | 0.79 (0.29-1.19) |
| Two vessel | 0.86 (0.45-1.21) |
| More than 2 vessels | 1.44 (1.10-1.88) † |
| Left anterior descending artery > 50% | 1.58 (1.14-2.04) † |
| * Men compared with women (ie, men who underwent CABG were more likely to have extensive disease than were women who underwent CABG). | |
| † P < .05. | |
| CABG denotes coronary artery bypass grafting. | |
Discussion
In our study, men had significantly higher rates of bypass surgery and all procedures combined, as has been found in previous studies.10-12 Age was the greatest confounder for the mortality outcome. Mortality rates were significantly higher in women with all confounding variables in the logistic model except age. The close similarity between the mortality outcome in this study and the findings of Vaccarino et al1 may be explained by the considerably smaller sample size of the current investigation. Alternatively, this similarity may reflect greater recognition of sex disparities and changing practice patterns since those studies were published.
The increased adjusted risk of bypass surgery and of all procedures is explained in part by the anatomic differences in coronary artery disease as found in our study and in others.3,14 Men undergoing CABG had significantly more 3-vessel and advanced left main disease than women. In our data, controlling for the extent of coronary artery disease eliminated any sex bias. We are limited, however, by not having data on all men and women who had an acute MI and by knowing only the coronary anatomy of those undergoing coronary catheterization. Future research should address this question. Because the prevalence of diabetes is higher in women, they may have more generalized coronary artery disease that is less amenable to bypass surgery and angioplasty, as was the case in the GUSTO IIb trial.3
Other factors may still play a role in the observed differences between the sexes. Women may be more likely to have surgery on an outpatient basis after discharge from the hospital. Our study did not investigate this possibility. Women may need more time to decide whether they want to undergo surgery, thereby delaying a procedure. Another possibility is that the age of women who are having an MI is greater than that of men having an MI; women may therefore refuse surgery more often than men because of their age. The research has not examined whether women tend to refuse or delay these procedures more often than men. Further research should be done in this area, including outpatient procedures, women’s views on surgery, and other potential barriers to surgery.
The current study has several limitations. For example, data regarding congestive heart failure (CHF) was not available for inclusion in the analysis. Previous studies found that CHF was more common in women than in men. In addition, comorbidities were analyzed as dichotomous variables. Data on the severity of preexisting conditions could not be assessed. The study lacks any data on the severity of illness during hospitalization. The sample size was smaller than that of some previous work in this area. Finally, we lacked data on the number of vessels involved for all patients in the study. Therefore, it is possible that women had an equal risk of 3-vessel and left main coronary disease, but were not referred for CABG.
Conclusions
After being admitted for an acute MI, men and women had no significant difference in mortality, time spent in the ICU, total time in the hospital, frequency of stent placement, angiograms, or angioplasty. Men, however, had a significantly higher rate of CABG. Among those undergoing bypass surgery, men had significantly more advanced left-main coronary disease and 3-vessel disease than women. Controlling for the extent of coronary artery disease eliminated any bias for sex in the number of CABGs performed.
1. Vaccarino V, Horwitz RI, Meehan TP, Petrillo MK, Radford MJ, Krumholz HM. Sex differences in mortality after myocardial infarction. Arch Intern Med 1998;158:2054-62.
2. Vaccarino V, Parsons L, Every NR, Barron HV, Krumholz HM. Sex-based differences in early mortality after myocardial infarction. N Engl J Med 1999;341:217-25.
3. Hochman JS, Tamis JE, Thompson TD, et al. Sex, clinical presentation, and outcome in patients with acute coronary syndromes. N Engl J Med 1999;341:226-32.
4. Maynard C, Litwin P, Martin J, Weaver D. Treatment and outcome of acute myocardial infarction in women 75 years of age or older: findings from the Myocardial Infarction Triage and Intervention Registry. Cardiol Elderly 1993;1:121-5.
5. Bearden D, Allman R, McDonald R, et al. Age, race, and gender variation in the utilization of coronary artery bypass surgery and angioplasty in SHEP: Systemic Hypertension in the Elderly Program. J Am Geriatr Soc 1994;42:1143-9.
6. Schulman KA, Berlin JA, Harless W, et al. The effect of race and sex on physicians’ recommendations for cardiac catheterization. N Engl J Med 1999;340:618-26.
7. Hannan EL, Bernard HR, Kilburn HC, Jr, O’Donnell JF. Gender differences in mortality rates for coronary artery bypass surgery. Am Heart J 1992;123:866-72.
8. King KB, Clark PC, Hicks GL, Jr. Patterns of referral and recovery in women and men undergoing coronary artery bypass grafting. Am J Cardiol 1992;69:179-82.
9. Miller RG, Jr. Simultaneous statistical inference. New York: Springer-Verlag; 1981.
10. Adams J, Jamieson M, Rawles J, Trent R, Jennings K. Women and myocardial infarction: ageism rather than sexism. Br Heart J 1995;73:87-91.
11. Dittrich H, Gilpin E, Nicod P, et al. Acute myocardial infarction in women: influence of gender on mortality and prognostic variables. Am J Cardiol 1988;62:1-7.
12. Kudenchuk P, Maynard C, Martin J, Wirkus M, Weaver W. Comparison of presentation, treatment, and outcome of acute myocardial infarction in men and women (the Myocardial Infarction Triage and Intervention Registry). Am J Cardiol 1996;78:9-14.
13. Hochman J, McCabe C, Stone P, et al. Outcomes and profile of women and men presenting with acute coronary syndromes: a report from TIMI IIIB. J Am Coll Cardiol 1997;30:141-8.
14. Krumholz H, Douglas P, Lauer M, Pasternak R. Selection of patients for coronary angiography and coronary revascularization early after myocardial infarction: Is there evidence for a gender bias? Ann Intern Med 1992;116:785-90.
OBJECTIVES: To determine whether outcome differences based on the patient’s sex occur after myocardial infarction (MI) at a large private hospital.
STUDY DESIGN: We conducted a large cohort study.
POPULATION: Inclusion required hospital admission between January 1, 1998, and June 30, 1999, and a diagnosis of acute MI or subendocardial infarction. The number of patients included in the study was 1669. Data were collected at discharge on age, sex, race, health insurance, hypercholesterolemia, diabetes, smoking, hypertension, and the extent of coronary artery disease.
OUTCOMES MEASURED: The 8 outcomes analyzed were angiogram, angioplasty, stent placement, coronary artery bypass grafting (CABG), mortality, time in the intensive care unit, total length of stay, and combined catheterization procedures.
RESULTS: After adjusting for 7 confounding variables, we found no significant differences between men and women for mortality, ICU time, total hospital time, stent placement, angiogram, angioplasty, or combined catheterization procedures. Men had significantly more CABG (relative risk [RR] 1.96, P < .01). Among patients who underwent CABG (N = 204), men had significantly more 3-vessel coronary disease (RR 1.44, P < .01) and left main coronary artery disease greater than 50% (RR 1.58, P < .01). Once we had controlled for the extent of coronary artery disease, we found no difference between the sexes for CABG.
CONCLUSIONS: During hospitalization after an MI, most cardiovascular outcomes and process measures are the same for men and women. The greater frequency of CABG in men than in women is explained by men’s greater frequency of 3-vessel and advanced left-main coronary disease.
- Unadjusted data reveal that in patients hospitalized for acute myocardial infarction, women experience higher mortality rates and undergo fewer procedures, particularly coronary artery bypass grafting, than men.
- Controlling for several comorbidities and the extent of coronary artery disease eliminates differences between the sexes in this context.
Recent studies have shown that women aged less than 75 years have a significantly higher rate of in-hospital mortality than men after acute myocardial infarction (MI).1-3 A cohort study involving more than 384,000 patients admitted to the hospital for MI found that women aged 74 years or less had a higher mortality rate than men. The mortality rate in women aged less than 50 years was twice as high as that of men in the same age group.2 The difference in mortality after an acute MI disappears at age 75 years.1,2,4
Although women are as likely as men to have a positive stress electrocardiogram or stress thallium test after an acute MI, women are referred less often for additional noninvasive testing or cardiac catherization.5 In a study of more than 12,000 patients with acute coronary syndromes, fewer women than men underwent cardiac catheterization.3 In hypothetical case studies, physicians shown videotapes of actors playing patients and given hypothetical case studies were less likely to say they would refer the women for catheterization than the men. Black women were referred least.6
Men are also more likely than women to receive angioplasty or coronary artery bypass grafting (CABG) after acute MI.2 Women undergoing CABG have significantly more comorbidities and less favorable patient characteristics preoperatively than do men.7 While women and men undergoing CABG have the same type and extent of symptoms overall, women are more likely to have preserved ventricular function and less likely to possess multivessel disease than are men.3,7,8
The purpose of this study was to determine whether sex-related outcome differences existed after being treated for an MI at a large private hospital. We also evaluated how significantly any difference in the extent of coronary artery disease between the sexes would confound the rate of CABG performed after an acute MI.
Methods
Study design and population
This is a hospitalization cohort study using data obtained from the Acute Myocardial Infarction Registry database at TriHealth hospitals in Cincinnati, Ohio. The TriHealth hospital system consists of 3 private hospitals in the greater Cincinnati area. Inclusion criteria for entering the cohort included admission to a TriHealth hospital during an 18-month period between January 1, 1998, and June 30, 1999, and a discharge diagnosis of acute MI or subendocardial infarction. Exclusion criteria included transfer to another local hospital for some of the patient’s health care or more than 1 hospitalization for an MI during the cohort time period. Double admissions and transferred patients were rare (N = 7). Individuals were included in the cohort only during their hospitalization for the acute MI. Patients exited the cohort at discharge.
Data collection
Data were collected at hospital discharge on age, sex, race, insurance status, and various comorbidities, including smoking, hypercholesterolemia, diabetes, hypertension, and the extent of coronary artery disease. The 8 outcomes available for analysis included hospital mortality, time in the intensive-care unit, total length of stay, angiogram, angioplasty, stent placement, CABG, and the 3 catheterization procedures combined. For patients who underwent CABG, data were collected on the number of bypassed vessels and the presence of advanced left main coronary disease. Data on demographics, disposition, and length of stay were obtained by means of the hospital registry system. The comorbidity and cardiovascular data collection sheet was typically filled out at discharge, usually by the cardiologist and occasionally by a primary care physician. The presence or absence of comorbidities was determined by the physician who provided the patient data. Each comorbidity was listed on the data sheet with a “yes or no” option.
Analysis
Univariate analysis using chi-square and t-tests were performed that compared sex with mortality, with each procedure, and with each comorbidity. The relationship between the patient’s sex and each of the 8 outcomes of interest (adjusted for age, race, insurance smoking, hypertension, diabetes, and hypercholesterolemia) was investigated by logistic regression analysis for dichotomous variables and survival analysis for time to event variables. The significance of each analysis was set at P = .01, based on the Bonferonni adjustment9 for multiple comparisons and an overall P = .05. Analysis was performed using STATA (STATA Corporation, College Station, Tex.) and SAS (SAS Institute, Cary, N.C.) statistical software. We estimated that a sample of 1600 patients was needed to detect an absolute difference of 6% in the presence or absence of an intervention between men and women (two-tailed alpha = .05, beta = 0.20).
Results
A total of 1669 patients (631 women, 1038 men) were available for our analysis. Baseline characteristics by sex are displayed in Table 1. Men were significantly younger, less likely to be African American, less likely to be Medicaid insured, more likely to smoke, and less likely to have diabetes mellitus (P < .05) than women. In the univariate analysis (Table 2), women had significantly higher rates of hospital mortality (P < .01) and diabetes (P < .01) and a longer mean length of stay in the hospital (P = .01). Men had significantly higher rates of stent placement (P < .01) and CABG (P < .01).
We found no significant difference between men and women for hospital mortality, time in the ICU, total time in the hospital, stent placement, angiogram, angioplasty, or the 3 catheterization procedures combined in the multivariate analysis (Table 3). Men had significantly more CABG (relative risk [RR] 1.96, 95% confidence interval [CI] 1.41-2.76) than women.
In a separate analysis of patients who underwent CABG (n = 211), men had significantly more 3-vessel coronary disease and advanced left anterior descending artery disease (LAD >50%) than women (Table 4). There was no difference between men and women undergoing CABG for either single-vessel or double-vessel coronary artery disease. The extent of coronary artery disease was only known for patients who were catheterized (N = 1204). Again comparing sex regarding the risk of CABG, but additionally controlling for the extent of coronary artery disease (LAD >50% and 3-vessel CAD), now reveals no significant increase associated with male sex (RR 1.30, 95% CI 0.82-2.08).
TABLE 1
CHARACTERISTICS OF THE STUDY POPULATION
| Men (N = 1038) | Women (N = 631) | P Value | |
|---|---|---|---|
| Age | 62.2 + 13.3 | 68.7 + 13.8 | < .05 |
| Race | < .05 | ||
| White | 789 (76%) | 482 (76%) | |
| Black | 62 (6%) | 67 (11%) | |
| Asian | 3 (0%) | 1 (0%) | |
| Other | 184 (18%) | 82 (13%) | |
| Insurance | < .05 | ||
| Medicaid | 14 (1%) | 25 4%) | |
| Comorbidities | |||
| Hypercholesterolemia | 224 (22%) | 108 (17%) | NS |
| Hypertension | 444 (43%) | 293 (46%) | NS |
| Smoking | 411 (40%) | 184 (29%) | < .01 |
| Diabetes | 267 (26%) | 209 (33%) | < .01 |
TABLE 2
UNADJUSTED OUTCOMES BY SEX
| Men (n = 1038) | Women (n = 631) | P Value | |
|---|---|---|---|
| Hospital mortality | 76 (7%) | 70 (11%) | < .01 |
| Mean time in ICU | 2.1 days | 1.9 days | NS |
| Mean length of stay | 5.9 days | 6.6 days | < .01 |
| Angiogram | 241 (23%) | 139 (22%) | NS |
| Angioplasty | 67 (6%) | 38 (6%) | NS |
| Stent placement | 346 (33%) | 162 (26%) | < .01 |
| CABG | 157 (15%) | 54 (9%) | < .01 |
| 3 catheterization procedures (angiogram, angioplasty, stent) | 654 (63%) | 339 (54%) | < .01 |
| CABG denotes coronary artery bypass grafting; ICU, intensive-care unit. | |||
TABLE 3
ADJUSTED RELATIVE RISK FOR CARDIOVASCULAR OUTCOME
| Outcome | Relative Risk* |
|---|---|
| Hospital mortality | 0.86 (0.6-1.23) |
| Time in ICU | 0.95 (0.85-1.05) |
| Angiogram | 1.02 (0.80-1.31) |
| Angioplasty | 0.90 (0.59-1.39) |
| Stent placement | 1.04 (0.82-1.32) |
| Coronary artery bypass graft | 1.96 (1.41-2.76)† |
| Angiogram, angioplasty, or stent | 1.04 (0.82-1.28) |
| * Men compared with women (ie, men who underwent coronary artery bypass grafting were more likely to have more extensive disease). | |
| † P < 0.05. | |
| ICU denotes intensive-care unit. | |
TABLE 4
EXTENT OF CORONARY ARTERY DISEASE IN PATIENTS UNDERGOING CABG, BY PATIENT’S SEX (N = 211)
| Extent of Disease | Relative Risk(95% CI)* |
|---|---|
| Single vessel | 0.79 (0.29-1.19) |
| Two vessel | 0.86 (0.45-1.21) |
| More than 2 vessels | 1.44 (1.10-1.88) † |
| Left anterior descending artery > 50% | 1.58 (1.14-2.04) † |
| * Men compared with women (ie, men who underwent CABG were more likely to have extensive disease than were women who underwent CABG). | |
| † P < .05. | |
| CABG denotes coronary artery bypass grafting. | |
Discussion
In our study, men had significantly higher rates of bypass surgery and all procedures combined, as has been found in previous studies.10-12 Age was the greatest confounder for the mortality outcome. Mortality rates were significantly higher in women with all confounding variables in the logistic model except age. The close similarity between the mortality outcome in this study and the findings of Vaccarino et al1 may be explained by the considerably smaller sample size of the current investigation. Alternatively, this similarity may reflect greater recognition of sex disparities and changing practice patterns since those studies were published.
The increased adjusted risk of bypass surgery and of all procedures is explained in part by the anatomic differences in coronary artery disease as found in our study and in others.3,14 Men undergoing CABG had significantly more 3-vessel and advanced left main disease than women. In our data, controlling for the extent of coronary artery disease eliminated any sex bias. We are limited, however, by not having data on all men and women who had an acute MI and by knowing only the coronary anatomy of those undergoing coronary catheterization. Future research should address this question. Because the prevalence of diabetes is higher in women, they may have more generalized coronary artery disease that is less amenable to bypass surgery and angioplasty, as was the case in the GUSTO IIb trial.3
Other factors may still play a role in the observed differences between the sexes. Women may be more likely to have surgery on an outpatient basis after discharge from the hospital. Our study did not investigate this possibility. Women may need more time to decide whether they want to undergo surgery, thereby delaying a procedure. Another possibility is that the age of women who are having an MI is greater than that of men having an MI; women may therefore refuse surgery more often than men because of their age. The research has not examined whether women tend to refuse or delay these procedures more often than men. Further research should be done in this area, including outpatient procedures, women’s views on surgery, and other potential barriers to surgery.
The current study has several limitations. For example, data regarding congestive heart failure (CHF) was not available for inclusion in the analysis. Previous studies found that CHF was more common in women than in men. In addition, comorbidities were analyzed as dichotomous variables. Data on the severity of preexisting conditions could not be assessed. The study lacks any data on the severity of illness during hospitalization. The sample size was smaller than that of some previous work in this area. Finally, we lacked data on the number of vessels involved for all patients in the study. Therefore, it is possible that women had an equal risk of 3-vessel and left main coronary disease, but were not referred for CABG.
Conclusions
After being admitted for an acute MI, men and women had no significant difference in mortality, time spent in the ICU, total time in the hospital, frequency of stent placement, angiograms, or angioplasty. Men, however, had a significantly higher rate of CABG. Among those undergoing bypass surgery, men had significantly more advanced left-main coronary disease and 3-vessel disease than women. Controlling for the extent of coronary artery disease eliminated any bias for sex in the number of CABGs performed.
1. Vaccarino V, Horwitz RI, Meehan TP, Petrillo MK, Radford MJ, Krumholz HM. Sex differences in mortality after myocardial infarction. Arch Intern Med 1998;158:2054-62.
2. Vaccarino V, Parsons L, Every NR, Barron HV, Krumholz HM. Sex-based differences in early mortality after myocardial infarction. N Engl J Med 1999;341:217-25.
3. Hochman JS, Tamis JE, Thompson TD, et al. Sex, clinical presentation, and outcome in patients with acute coronary syndromes. N Engl J Med 1999;341:226-32.
4. Maynard C, Litwin P, Martin J, Weaver D. Treatment and outcome of acute myocardial infarction in women 75 years of age or older: findings from the Myocardial Infarction Triage and Intervention Registry. Cardiol Elderly 1993;1:121-5.
5. Bearden D, Allman R, McDonald R, et al. Age, race, and gender variation in the utilization of coronary artery bypass surgery and angioplasty in SHEP: Systemic Hypertension in the Elderly Program. J Am Geriatr Soc 1994;42:1143-9.
6. Schulman KA, Berlin JA, Harless W, et al. The effect of race and sex on physicians’ recommendations for cardiac catheterization. N Engl J Med 1999;340:618-26.
7. Hannan EL, Bernard HR, Kilburn HC, Jr, O’Donnell JF. Gender differences in mortality rates for coronary artery bypass surgery. Am Heart J 1992;123:866-72.
8. King KB, Clark PC, Hicks GL, Jr. Patterns of referral and recovery in women and men undergoing coronary artery bypass grafting. Am J Cardiol 1992;69:179-82.
9. Miller RG, Jr. Simultaneous statistical inference. New York: Springer-Verlag; 1981.
10. Adams J, Jamieson M, Rawles J, Trent R, Jennings K. Women and myocardial infarction: ageism rather than sexism. Br Heart J 1995;73:87-91.
11. Dittrich H, Gilpin E, Nicod P, et al. Acute myocardial infarction in women: influence of gender on mortality and prognostic variables. Am J Cardiol 1988;62:1-7.
12. Kudenchuk P, Maynard C, Martin J, Wirkus M, Weaver W. Comparison of presentation, treatment, and outcome of acute myocardial infarction in men and women (the Myocardial Infarction Triage and Intervention Registry). Am J Cardiol 1996;78:9-14.
13. Hochman J, McCabe C, Stone P, et al. Outcomes and profile of women and men presenting with acute coronary syndromes: a report from TIMI IIIB. J Am Coll Cardiol 1997;30:141-8.
14. Krumholz H, Douglas P, Lauer M, Pasternak R. Selection of patients for coronary angiography and coronary revascularization early after myocardial infarction: Is there evidence for a gender bias? Ann Intern Med 1992;116:785-90.
Does Career Dissatisfaction Affect the Ability of Family Physicians to Deliver High-Quality Patient Care?
OBJECTIVES: A usual source of care is associated with better health outcomes. Dissatisfaction among family physicians and general practitioners (FP/GPs) may compromise the accessibility of a usual source of care and the quality of services. We examined the association between FP/GP dissatisfaction and an inability to deliver high-quality care.
STUDY DESIGN: We performed a secondary data analysis of the Community Tracking Study (CTS) Physician Survey (1996–1997).
POPULATION: The study included a nationally representative sample of more than 12,000 non-federal physicians practicing direct patient care in the United States.
OUTCOMES MEASURED: We measured associations of career dissatisfaction with physicians’ perceptions of their ability to provide high-quality care as defined by 6 survey items. Multivariate analyses controlled for the effects of personal, professional, and practice characteristics.
RESULTS: Among FP/GPs in 1996–1997, more than 17% were dissatisfied. Age was the most significant personal factor associated with dissatisfaction; 25.1% of those aged 55 to 64 years reported dissatisfaction compared with only 10.1% of those younger than 35 years. Other personal or professional characteristics significantly associated with FP/GP dissatisfaction included osteopathic training, graduation from a foreign medical school, full practice ownership, and an income of less than $100,000. Physicians dissatisfied with their careers were much more likely to report difficulties in caring for patients, strongly disagreeing (vs strongly agreeing, odds ratio [OR] 1.0) that they had enough clinical freedom (OR 7.89; 95% confidence interval [CI], 4.86-12.83); continuous patient relationships (OR 7.11; 95% CI, 4.90-10.33); no financial penalties for clinical decisions (OR 4.44; 95% CI, 3.13-6.31); adequate time with patients (OR 4.42; 95% CI, 2.84-6.87); ability to provide quality care (OR 4.26; 95% CI, 2.88-6.31); and sufficient communication with specialists (OR 3.57; CI, 2.20-5.80).
CONCLUSIONS: An inability to care for patients is significantly associated with career dissatisfaction. This relationship has implications for the achievement of policy objectives related to access, having a usual source of care, and quality.
- The proportion of family physicians and general practitioners (FP/GPs) dissatisfied with their overall medical careers (17.3%) was similar to that of specialists (18.0%), less than that of general internists (20.6%), and greater than that of general pediatricians (12.6%).
- Only 1 in 10 FP/GPs aged younger than 35 years were dissatisfied with their medical careers; 1 in 4 of those aged 55 to 64 years were dissatisfied.
- More than half of FP/GPs who strongly disagreed with the statement “I have the freedom to make clinical decisions that meet my patients’ needs” were dissatisfied with their medical careers.
Primary care is the foundation of the American health care system. The delivery of high-quality primary care contributes to improved health outcomes.1,2 Patients perceive primary care as an integral aspect of the health care system and appreciate the role of primary care providers in coordinating quality care.3 In addition to coordination of care, continuity with the same health care provider is highly valued by patients.4 Family physicians and general practitioners (FP/GPs) play a crucial role in providing coordinated and continuous primary health care. Of Americans reporting an individual provider as their usual source of care in 1996, 62% named a family physician or a general practitioner (compared with 16% naming an internist and 15% naming a pediatrician).5
A potential threat to the continued reliance on this vital FP/GP workforce is physician dissatisfaction. Physician dissatisfaction affects patient satisfaction6-8 and dissatisfied physicians can adversely influence patient behavior (eg, adherence to medical treatment),9 leading to a reduction in quality of care. A decrease in satisfaction among physicians can also affect access to care, since it can lead to physician attrition and higher turnover, which in turn can lead to disruption of care and inaccessibility of providers. The cost to hire a new physician is estimated to be $240,000 to $265,000.10
Dissatisfaction among today’s FP/GPs also has the potential to contribute to future shortages. The extent to which physicians voice dissatisfaction can dissuade medical school graduates from choosing careers in primary care.11 Some concerns are already being raised about a decrease in the number of new doctors seeking residencies in family practice for the fourth consecutive year. Information from the National Resident Matching Program indicates that only 11.2% of US seniors matched in family practice in 2001, compared with 13.6% in 2000.12 If this downward trend continues, it will exacerbate the problems of access to a usual source of care, especially in areas where the loss of FP/GPs will result in a drastic increase in the number of health professional shortage areas. In 1995, if FP/GPs had been removed from the 2298 US counties considered to have adequate numbers of primary care physicians, 1332 of these urban and rural counties would have been designated as shortage areas. In comparison, the simultaneous removal of internists, pediatricians, and obstetricians from these same counties would have created only 176 whole-county shortage areas.13
Most studies reporting physician dissatisfaction have identified high levels of physician concern over a perceived loss of autonomy.14-17 Additionally, physicians are dissatisfied about the potential adverse effects on patient care resulting from system barriers, including restricted access for patients, increased administrative burdens for providers, and the lack of a comprehensive approach to provision of services.14-22 These studies, however, have generally been limited to a specific geographic region14-20 or a specialty group other than FP/GPs.21,22 In addition, other physician dissatisfaction reports have contained only narrow analyses of how specific factors, such as income, financial incentives, or autonomy, influence satisfaction levels.23-26
To our knowledge, the possible relationship of physician dissatisfaction with the inability to care for patients has been examined only in limited studies (eg, those that compare capitated and noncapitated care).27 Moreover, few studies have systematically reviewed predictors of dissatisfaction among FP/GPs. In this paper, we report findings related to these important issues using data from a recent national survey in which more than 12,000 primary care physicians and specialists commented on their current experiences as medical professionals in the US health care system. We hypothesized that FP/GPs who identify difficulties in providing quality care to patients also report higher levels of dissatisfaction. We also expected that physician dissatisfaction would relate to access to care, particularly for very needy populations whose care is government regulated. Therefore, we ascertained the extent to which dissatisfied FP/GPs who stay in the workforce are less likely to serve the poor and the elderly by accepting new Medicaid and Medicare patients when compared with their satisfied counterparts.
Methods
Data source
Data for this study were from the Community Tracking Study (CTS) Physician Survey (1996–1997).28 This survey, sponsored by the Robert Wood Johnson Foundation, was part of a major project by the Center for Studying Health System Change, a Washington, DC–based organization affiliated with Mathematica Policy Research, Inc. Information for the survey was collected from a nationally representative sample of nonfederal physicians performing direct patient care.
The sample frame of physicians was obtained from master files of the American Medical Association and the American Osteopathic Association. The sample included office-based and hospital-based physicians who spend at least 20 hours per week in direct patient care in the continental United States. Residents and fellows were excluded, as were physicians in certain specialties such as radiology, anesthesiology, and pathology. The survey followed a complex design of 60 sites supplemented by a small, independently drawn national sample.28,29 Telephone interviews were conducted with 12,291 physicians from August 1996 to August 1997 with a 65% response rate.30,31 The rate of nonresponse to individual survey items was very low, typically less than 3%. Primary care physicians were oversampled. The 3166 FP/GPs accounted for 44.3% of primary care doctors surveyed and 25.8% of the total sample.
Study variables
Dependent Variable: Career Satisfaction. The dependent variable for most analyses was medical career dissatisfaction. Respondents were asked, “Thinking very generally about your overall career in medicine, would you say that you are currently very satisfied, somewhat satisfied, somewhat dissatisfied, very dissatisfied, or neither satisfied or dissatisfied?” For comparative analysis, those reporting “neither satisfied or dissatisfied” were eliminated and the 4 remaining responses were collapsed into 2 categories. Physicians who reported feeling very satisfied or somewhat satisfied were classified as “satisfied”; those who reported feeling somewhat dissatisfied or very dissatisfied were classified as “dissatisfied.”
Independent Variables. The explanatory variables of primary interest were indicators to assess physicians’ perceptions of their ability to provide high-quality medical care. This determination was measured by 6 survey questions with 5-point response categories that ranged from “strongly agree” to “strongly disagree.” Table 1 presents the measures of quality of care. Physician dissatisfaction was also potentially influenced by other factors assessed in the survey. Analyses were statistically controlled for the personal, professional, and practice characteristics that appear in Table 2 to examine the relationship of physicians’ dissatisfaction with the perception of their ability to provide high-quality care.
TABLE 1
PATIENT CARE CHARACTERISTICS ASSOCIATED WITH FP/GP DISSATISFACTION (N = 3166)
| Statement | Multivariate Odds Ratio (95% CI) |
|---|---|
| The level of communication I have with specialists about the patients I refer to them is sufficient to ensure the delivery of high-quality care. (n = 3102) | 1.0 |
| Agree strongly | 1.25 (1.01-1.55) |
| Agree somewhat | 1.15 (0.48-2.74) |
| Neither agree nor disagree | 2.37 (1.67-3.37) |
| Disagree somewhat | 3.57 (2.20-5.80) |
| Disagree strongly | |
| It is possible to maintain the kind of continuing relationships with patients over time that promote the delivery of high-quality care. (n = 3082) | 1.0 |
| Agree strongly | 1.89 (1.39-2.58) |
| Agree somewhat | 3.17 (1.38-7.29) |
| Neither agree nor disagree | 4.90 (3.71-6.46) |
| Disagree somewhat | 7.11 (4.90-10.33) |
| Disagree strongly | |
| I can make clinical decisions in the best interests of my patients without the possibility of reducing my income. (n = 3074) | 1.0 |
| Agree strongly | 1.23 (0.92-1.65) |
| Agree somewhat | 1.51 (0.89-2.58) |
| Neither agree nor disagree | 2.61 (1.91-3.56) |
| Disagree somewhat | 4.44 (3.13-6.31) |
| Disagree strongly | |
| I have adequate time to spend with my patients during typical office/patient visits. (n = 310) | 1.0 |
| Agree strongly | 0.81 (0.58-1.14) |
| Agree somewhat | 1.15 (0.58-2.30) |
| Neither agree nor disagree | 1.39 (1.02-1.88) |
| Disagree somewhat | 4.42 (2.84-6.87) |
| Disagree strongly | |
| I have the freedom to make clinical decisions that meet my patients’ needs. (n = 3100) | 1.0 |
| Agree strongly | 1.55 (1.25-1.93) |
| Agree somewhat | 3.25 (1.50-7.02) |
| Neither agree nor disagree | 3.73 (2.84-4.89) |
| Disagree somewhat | 7.89 (4.86-12.83) |
| Disagree strongly | |
| It is possible to provide high-quality care to all my patients. (n = 3099) | 1.0 |
| Agree strongly | 1.20 (0.94-1.52) |
| Agree somewhat | 0.98 (0.37-2.61) |
| Neither agree nor disagree | 2.70 (1.88-3.89) |
| Disagree somewhat | 4.26 (2.88-6.31) |
| Disagree strongly | |
| NOTE: A higher odds ratio indicates that this response is more strongly associated with physician dissatisfaction. Ns vary because not all physicians answered every item on the survey. | |
| FP/GP denotes family physician/general practitioner. | |
Analytical strategy
Two sets of logistic regression were performed. In the first, adjusted odds ratios were derived to measure the association of personal, professional, and practice characteristics with dissatisfaction (Table 2). Next, the relationship of dissatisfaction with each of the indicators of quality of care was assessed with 6 separate multivariate logistic regression procedures (Table 1). The adjusted odds ratios in Table 1 are the products of that analysis and represent the association of perceived ability to deliver quality of care after controlling for the effects of personal, professional, and practice variables. SUDAAN software, version 7.5.3 (Research Triangle Institute, Research Triangle Park, NC), was used to conduct statistical tests and make national estimates with variance adjustment for the complex survey sample design and physician nonresponse.
TABLE 2
PERSONAL, PROFESSIONAL, AND PRACTICE-RELATED FACTORS ASSOCIATED WITH FP/GP DISSATISFACTION (N = 3166)
| PERSONAL/PROFESSIONAL CHARACTERISTICS | Multivariate Odds Ratio (95% CI) |
|---|---|
| Age in years (n = 2965) | |
| <35 | 1.0 |
| 35–44 | 1.43 (0.94-2.16) |
| 45–54 | 1.89 (1.20-2.98) |
| 55–64 | 2.46 (1.56-3.88) |
| 64 | 2.30 (1.40-3.80) |
| Sex (n = 3106) | |
| Women | 1.0 |
| Men | 1.28 (0.92-1.78) |
| Type of medical training (n = 3106) | |
| Allopathic | 1.0 |
| Osteopathic | 1.74 (1.34-2.25) |
| Graduate of foreign medical school (n = 3106) | |
| Puerto Rico | 1.0 |
| Other | 1.33 (1.03-1.73) |
| Board certification (n = 3063) | |
| Board certified | 1.0 |
| Board eligible | 1.15 (0.82-1.63) |
| Neither | 0.93 (0.69-1.25) |
| Net income in 1995 ($) (n = 3103) | |
| 0–49,000 | 2.31 (1.29-4.14) |
| 50,000–99,999 | 1.83 (1.20-2.79) |
| 100,000–149,999 | 1.45 (0.98-2.14) |
| 150,000–199,999 | 1.41 (0.91-2.16) |
| 200,000–249,999 | 1.0 |
| 250,000–299,999 | 1.82 (0.98-3.38) |
| 300,000 + | 1.93 (0.98-3.81) |
| PRACTICE CHARACTERISTICS | |
| Practice type (n = 3106) | |
| 1 or 2 physicians | 1.19 (0.74-1.93) |
| 3+ physicians | 1.14 (0.70-1.85) |
| HMO | 1.35 (0.82-2.22) |
| Medical school | 1.01 (0.52-1.93) |
| Hospital based | 1.0 |
| Other | 1.16 (0.74-1.83) |
| Community size (n = 3106) | |
| Large metropolitan area (>200,000) | 1.42 (0.81-2.49) |
| Small metropolitan area (< 200,000) | 1.0 |
| Nonmetropolitan area | 1.07 (0.55-2.08) |
| Ownership (n = 3106) | |
| Full owners | 1.57 (1.11-2.21) |
| Part owners | 1.0 |
| Not an owner | 1.01 (0.72-1.43) |
| Percentage of patients for whom you serve as gatekeeper (n = 3106) | |
| 0 | 2.20(1.44-3.37) |
| 1–9 | 1.59 (1.06-2.40) |
| 10–19 | 1.0 |
| 20–29 | 1.47 (0.98-2.20) |
| 30–59 | 1.83 (1.29-2.60) |
| 60–89 | 2.31 (1.62-3.28) |
| 90–100 | 2.29 (1.44-3.64) |
| NOTE: Ns vary because not all physicians answered every item on the survey. | |
| FP/GP denotes family physician/general practitioner; HMO, health maintenance organization. | |
Results
Nearly 18% of physicians report being dissatisfied with a career in medicine. The rate of dissatisfaction among FP/GPs is similar to that for all physicians, specialists, and primary care physicians as a group. However, there is some variability among primary care specialties, with internists reporting more dissatisfaction (chi-square = 14.8, P < .01) and pediatricians (chi-square = 25.9, P < .01) reporting less dissatisfaction than FP/GPs (Table 3).
TABLE 3
EXTENT OF PHYSICIAN DISSATISFACTION
| Type of Physician | Satisfied or Very Satisfied n (%)* | Dissatisfied or Very Dissatisfied n (%)* | Neither Satisfied nor Dissatisfied n (%)* |
|---|---|---|---|
| Total physicians | 10,093 (80.7) | 2198 (17.7) | 212 (1.6) |
| Specialists | 4316 (80.5) | 953 (18.0) | 87 (1.6) |
| Total primary care | 5777 (81.0) | 1245 (17.4) | 125 (1.6) |
| FP/GPs | 2537 (81.9) | 569 (17.3) | 60 (1.7) |
| Pediatricians | 1403 (86.2) | 206 (12.6) | 17 (1.3) |
| Internists | 1837 (77.5) | 470 (20.6) | 48 (1.9) |
| *Unweighted number of survey respondents and weighted percent of US FP/GPs. | |||
| FP/GPs denotes family physicians/general practitioners. | |||
Factors associated with FP/GP dissatisfaction
Many characteristics were associated with the dissatisfaction reported by 17.6% of FP/GPs. The associated characteristics are included in 3 domains. The first 2 domains, personal/professional and practice characteristics, reveal significant factors associated with dissatisfaction (Table 2). The data in the third domain, patient care characteristics, represent results after we had statistically controlled for all factors in the first 2 (Table 1).
Personal/Professional Characteristics. A higher level of dissatisfaction was related to being older; only 10.1% of physicians younger than 35 years of age reported dissatisfaction versus 25.1% of physicians aged 55 to 64 years (odds ratio [OR] 2.46; 95% confidence interval [CI], 1.56-3.88). FP/GPs more likely to be dissatisfied were those who had osteopathic training and those who had been graduated from foreign medical schools. Levels of dissatisfaction were also higher among FP/GPs earning less than $100,000 per year.
Practice Characteristics. Physicians who fully owned their practice were more likely to express dissatisfaction with their careers than were physicians who either shared ownership or did not own their practice (OR 1.57; 95% CI, 1.11-2.21). The pattern of dissatisfaction related to gatekeeping (ie, providing permission for their patients to seek specialty care) was similar to that related to income. FP/GPs serving as gatekeepers for less than 10% or more than 30% of their patients were the most dissatisfied.
Patient Care Characteristics. After we had controlled for the effects of personal, professional, and practice characteristics, we found that FP/GP career dissatisfaction was, without exception, consistently and strongly associated with a perceived inability to provide high-quality care as assessed by physician responses to each of 6 statements (Table 1). Dissatisfied physicians were much more likely to “disagree strongly” than. to “agree strongly” with the statements about clinical freedom (OR 7.89; 95% CI, 4.86-12.83), continuity of care (OR 7.11; 95% CI, 4.90-10.33), clinical decisions free of financial penalties (OR 4.44; 95% CI, 3.13-6.31), adequacy of time with patients (OR 4.42; 95% CI, 2.84-6.87), ability to provide high-quality care (OR 4.26; 95% CI, 2.88-6.31) and sufficient communication with specialists (OR 3.57; 95% CI, 2.20-5.80). The most notable differences found between dissatisfied and satisfied FP/GPs were related to a lack of clinical freedom and difficulty maintaining continuing relationships with patients.
Physician dissatisfaction influences medicare and medicaid care
Dissatisfaction correlates with the percentage of physicians who are willing to care for Medicare and Medicaid patients. A lower percentage of dissatisfied FP/GPs are accepting all new Medicaid patients than are their satisfied counterparts (34.6% vs 43.4%; P < .01); and a higher percentage of dissatisfied FP/GPs are taking no new Medicaid patients (33.5% vs 23.7%; P < .01). Similarly, a higher percentage of dissatisfied FP/GPs are accepting no new Medicare patients (11.3% vs 8.6%; P = .04) (Table 4).
TABLE 4
RELATIONSHIP OF FP/GP DISSATISFACTION TO ACCESS FOR MEDICAID AND MEDICARE PATIENTS
| Characteristic | Satisfied FP/GPs (N = 2537) n (%)* | Dissatisfied FP/GPs (N = 569) n (%)* | P Value |
|---|---|---|---|
| Taking all new Medicaid patients | 1024 (43.4) | 198 (34.6) | <.01 |
| Taking no new Medicaid patients | 665 (23.7) | 198 (33.5) | <.01 |
| Taking all new Medicare patients | 1519 (61.5) | 325 (57.9) | 0.13 |
| Taking no new Medicare patients | 227 (8.6) | 70 (11.3) | 0.04 |
| *Unweighted number of survey respondents and weighted percent of US FP/GPs. | |||
| FP/GPs denotes family physicians/general practitioners. | |||
Discussion
A substantial proportion of family physicians, approximately 1 in 5, were dissatisfied with their careers in 1996–1997. Associated characteristics of the dissatisfied group were older age, osteopathic training, and graduation from a foreign medical school. Neither type nor location of practice was a factor, although being a full owner of the practice was associated with greater dissatisfaction. Physicians earning less than $100,000 per year and FP/GPs for whom less than 10% or more than 30% of patients were in gatekeeping arrangements were more dissatisfied.
The strongest factors associated with dissatisfaction, however, were not personal or practice characteristics but the perceptions of family physicians about their ability to take good care of their patients. After we had controlled for personal and practice characteristics, dissatisfaction was much more likely when the family physicians felt they did not have (1) the freedom to make clinical decisions that met their patients’ needs, (2) a sufficient level of communication with specialists, (3) enough time with their patients, (4) the ability to provide high-quality patient care, (5) the freedom to make clinical decisions without financial conflicts of interest, or (6) the ability to maintain continuing relationships with their patients. More than half of FP/GPs who strongly disagreed with the statement “I have the freedom to make clinical decisions that meet my patients’ needs” were dissatisfied with their medical career.
These findings are consistent with previous findings concerning physician autonomy and the widespread backlash against constraints associated with managed care and gatekeeping. The findings draw attention from financial considerations toward clinical decision making as a critical factor in physicians’ career satisfaction. Understanding the basis of physician dissatisfaction is important because of the adverse effects of such dissatisfaction. It is difficult to imagine patients preferring to see a dissatisfied physician or to envision a visit with a dissatisfied FP/GP as superior to one with a satisfied physician. In addition, this analysis specifically demonstrates that dissatisfaction among family physicians can negatively affect groups of patients by impeding access to care for Medicaid and Medicare patients. Perhaps the key implication of these findings is the need for serious efforts to revise practice arrangements so that FP/GPs can make the best possible decisions for their patients.
Limitations
There are important limitations to our analysis. The CTS Physician Survey is cross-sectional. While we do not know whether these physicians are more or less satisfied than they were in the past, recent evidence from surveys of primary care physicians in Massachusetts suggests that dissatisfaction has increased since 1986.17 As in all surveys, responses are subject to reporting error and response bias not accounted for by statistical adjustments. Our findings are associations between variables and do not establish causal relationships.
Conclusions
The finding that family physician dissatisfaction, after study results are controlled for personal and practice variables, is associated most strongly with a perceived inability to care for patients raises significant concerns. Dissatisfaction among a large proportion of family physicians threatens the well-being of patients. Given the extent to which the US health care system relies on family physicians, understanding why these physicians are dissatisfied and responding to these problems are important. This cross-sectional snapshot of dissatisfaction among family physicians suggests that patients would benefit from strategies that support rather than disrupt their ongoing relationships with family physicians and that permit their family physician to spend enough time with them to make decisions that are not constrained by financial or other conflicts of interest.
1. Safran DG, Taira DA, Rogers WH, Kosinski M, Ware JE, Tarlov AR. Linking primary care performance to outcomes of care. J Fam Pract 1998;47:213-20.
2. Donaldson MS, Yordy KD, Lohr KN, Vanselow NA, eds. Primary care: America’s health in a new era. Washington DC: National Academy Press; 1996.
3. Grumbach K, Selby JV, Damberg C, et al. Resolving the gatekeeper conundrum: what patients value in primary care and referrals to specialists. JAMA 1999;282:261-6.
4. Mainous AG, Baker R, Love MM, Gray DP, Gill JM. Continuity of care and trust in one’s physician: evidence from primary care in the United States and the United Kingdom. Fam Med 2001;33:22-7.
5. Robert Graham Center for Policy Studies in Family Practice and Primary Care. The importance of having a usual source of health care. Am Fam Physician 2000;62:477.-
6. Haas JS, Cook EF, Puopolo AL, Burstin HR, Cleary PD, Brennan TA. Is the professional satisfaction of general internists associated with patient satisfaction? J Gen Intern Med 2000;15:122-8.
7. Patricelli RE. Providing universal and affordable health care to the American people. In: Providing universal and affordable health care. Washington DC: Institute of Medicine; 1989.
8. Linn LS, Yager J, Cope D, Leake B. Health status, job satisfaction, job stress, and life satisfaction among academic and clinical faculty. JAMA 1985;254:2775-82.
9. DiMatteo MR, Sherbourne CD, Hays RD, et al. Physicians’ characteristics influence patients’ adherence to medical treatment: results from the medical outcomes study. Health Psychol 1993;12:93-102.
10. Buchbinder SB, Wilson M, Melick CF, Powe NR. Estimates of costs of primary care physician turnover. Am J Managed Care 1999;5:1431-8.
11. Lewis CE, Prout DM, Chalmers EP. How satisfying is the practice of internal medicine? A national survey. Ann Intern Med 1991;114:1-5.
12. FP Report. Worrisome trend continues: specialty, primary care lose ground in 2001 match. FP Report 2001; 4:7.
13. Robert Graham Center for Policy Studies in Family Practice and Primary Care. The United States relies on family physicians unlike any other specialty. Am Fam Physician 2001;63:1669.-
14. Conte SJ, Imershein AW, Magill MK. Rural community and physician perspectives on resource factors affecting physician retention. J Rural Health 1992;8:185-96.
15. Donelan K, Blendon RJ, Lundberg GD, et al. The new medical marketplace: physicians’ views. Health Affairs 1997;16:139-48.
16. Schulz R, Scheckler WE, Moberg DP, Johnson PR. Changing nature of physician satisfaction with health maintenance organization and fee-for-service practices. J Fam Pract 1997;45:321-30.
17. Murray A, Montgomery JE, Chang H, Rogers WH, Inui T, Safran DG. Doctor discontent: a comparison of physician satisfaction in different delivery system settings, 1986 and 1997. J Gen Intern Med 2001;16:451-9.
18. Skolnik NS, Smith DR, Diamond J. Professional satisfaction and dissatisfaction of family physicians. J Fam Pract 1993;37:257-63.
19. Pathman DE, Williams ES, Konrad TR. Rural physician satisfaction: its sources and relationship to retention. J Rural Health 1996;12:366-77.
20. Kerr EA, Mittman BS, Hays RD, Zemencuk JK, Pitts J, Brook RH. Associations between primary care physician satisfaction and self-reported aspects of utilization management. Health Serv Res 2000;35(1 pt 2):333-49.
21. Petrozzi MC, Rosman HS, Nerenz DR, Young MJ. Clinical activities and satisfaction of general internists, cardiologists, and ophthalmologists. J Gen Intern Med 1992;7:363-7.
22. Kitai E, Kushnir T, Herz M, Melamed S, Vigiser D, Granek M. Correlation of work structure and job satisfaction among Israeli family physicians. Israeli Med J 1999;1:236-40.
23. Hueston WJ. Family physicians’ satisfaction with practice. Arch Fam Med 1998;7:242-7.
24. Hadley J, Mitchell JM, Sulmasy DP, Bloche MG. Perceived financial incentives, HMO market penetration, and physicians’ practice style and satisfaction. Health Serv Res 1999;34:307-21.
25. Bates AS, Harris LE, Tierney WM, Wolinsky FD. Dimensions and correlates of physician work satisfaction in a midwestern city. Med Care 1998;36:610-7.
26. Grumbach K, Osmond D, Vranizan K, Jaffe D, Bindman AB. Primary care physicians’ experience of financial incentives in managed-care systems. N Engl J Med 1998;339:1516-21.
27. Kerr EA, Hays RD, Mittman BS, Siu AL, Leake B, Brook RH. Primary care physicians’ satisfaction with quality of care in California capitated medical groups. JAMA 1997;278:308-12.
28. Kemper P, Blumenthal D, Corrigan JM, et al. The design of the Community Tracking Study: a longitudinal study of health system change and its effects on people. Inquiry 1996;33:195-206.
29. Metcalf CE, Kemper P, Kohn LT, Pickreign JD. Site definition and sample design for the Community Tracking Study (technical publication no.1). Washington, DC: Center for Studying Health System Change; 1996.
30. Keil L, Chattopadhyay M, Potter F, Reed MC. Community Tracking Study Physician Survey round 1 survey methodology report (Technical Publication No.9). Washington, DC: Center for Studying Health System Change; 1998.
31. Reschovsky JD, Edson D, Sewall A, et al. Community Tracking Study physician survey public use file: user’s guide, round 1, release 1. Technical publication no 10. Washington, DC: Center for Studying Health System Change; 1998.
OBJECTIVES: A usual source of care is associated with better health outcomes. Dissatisfaction among family physicians and general practitioners (FP/GPs) may compromise the accessibility of a usual source of care and the quality of services. We examined the association between FP/GP dissatisfaction and an inability to deliver high-quality care.
STUDY DESIGN: We performed a secondary data analysis of the Community Tracking Study (CTS) Physician Survey (1996–1997).
POPULATION: The study included a nationally representative sample of more than 12,000 non-federal physicians practicing direct patient care in the United States.
OUTCOMES MEASURED: We measured associations of career dissatisfaction with physicians’ perceptions of their ability to provide high-quality care as defined by 6 survey items. Multivariate analyses controlled for the effects of personal, professional, and practice characteristics.
RESULTS: Among FP/GPs in 1996–1997, more than 17% were dissatisfied. Age was the most significant personal factor associated with dissatisfaction; 25.1% of those aged 55 to 64 years reported dissatisfaction compared with only 10.1% of those younger than 35 years. Other personal or professional characteristics significantly associated with FP/GP dissatisfaction included osteopathic training, graduation from a foreign medical school, full practice ownership, and an income of less than $100,000. Physicians dissatisfied with their careers were much more likely to report difficulties in caring for patients, strongly disagreeing (vs strongly agreeing, odds ratio [OR] 1.0) that they had enough clinical freedom (OR 7.89; 95% confidence interval [CI], 4.86-12.83); continuous patient relationships (OR 7.11; 95% CI, 4.90-10.33); no financial penalties for clinical decisions (OR 4.44; 95% CI, 3.13-6.31); adequate time with patients (OR 4.42; 95% CI, 2.84-6.87); ability to provide quality care (OR 4.26; 95% CI, 2.88-6.31); and sufficient communication with specialists (OR 3.57; CI, 2.20-5.80).
CONCLUSIONS: An inability to care for patients is significantly associated with career dissatisfaction. This relationship has implications for the achievement of policy objectives related to access, having a usual source of care, and quality.
- The proportion of family physicians and general practitioners (FP/GPs) dissatisfied with their overall medical careers (17.3%) was similar to that of specialists (18.0%), less than that of general internists (20.6%), and greater than that of general pediatricians (12.6%).
- Only 1 in 10 FP/GPs aged younger than 35 years were dissatisfied with their medical careers; 1 in 4 of those aged 55 to 64 years were dissatisfied.
- More than half of FP/GPs who strongly disagreed with the statement “I have the freedom to make clinical decisions that meet my patients’ needs” were dissatisfied with their medical careers.
Primary care is the foundation of the American health care system. The delivery of high-quality primary care contributes to improved health outcomes.1,2 Patients perceive primary care as an integral aspect of the health care system and appreciate the role of primary care providers in coordinating quality care.3 In addition to coordination of care, continuity with the same health care provider is highly valued by patients.4 Family physicians and general practitioners (FP/GPs) play a crucial role in providing coordinated and continuous primary health care. Of Americans reporting an individual provider as their usual source of care in 1996, 62% named a family physician or a general practitioner (compared with 16% naming an internist and 15% naming a pediatrician).5
A potential threat to the continued reliance on this vital FP/GP workforce is physician dissatisfaction. Physician dissatisfaction affects patient satisfaction6-8 and dissatisfied physicians can adversely influence patient behavior (eg, adherence to medical treatment),9 leading to a reduction in quality of care. A decrease in satisfaction among physicians can also affect access to care, since it can lead to physician attrition and higher turnover, which in turn can lead to disruption of care and inaccessibility of providers. The cost to hire a new physician is estimated to be $240,000 to $265,000.10
Dissatisfaction among today’s FP/GPs also has the potential to contribute to future shortages. The extent to which physicians voice dissatisfaction can dissuade medical school graduates from choosing careers in primary care.11 Some concerns are already being raised about a decrease in the number of new doctors seeking residencies in family practice for the fourth consecutive year. Information from the National Resident Matching Program indicates that only 11.2% of US seniors matched in family practice in 2001, compared with 13.6% in 2000.12 If this downward trend continues, it will exacerbate the problems of access to a usual source of care, especially in areas where the loss of FP/GPs will result in a drastic increase in the number of health professional shortage areas. In 1995, if FP/GPs had been removed from the 2298 US counties considered to have adequate numbers of primary care physicians, 1332 of these urban and rural counties would have been designated as shortage areas. In comparison, the simultaneous removal of internists, pediatricians, and obstetricians from these same counties would have created only 176 whole-county shortage areas.13
Most studies reporting physician dissatisfaction have identified high levels of physician concern over a perceived loss of autonomy.14-17 Additionally, physicians are dissatisfied about the potential adverse effects on patient care resulting from system barriers, including restricted access for patients, increased administrative burdens for providers, and the lack of a comprehensive approach to provision of services.14-22 These studies, however, have generally been limited to a specific geographic region14-20 or a specialty group other than FP/GPs.21,22 In addition, other physician dissatisfaction reports have contained only narrow analyses of how specific factors, such as income, financial incentives, or autonomy, influence satisfaction levels.23-26
To our knowledge, the possible relationship of physician dissatisfaction with the inability to care for patients has been examined only in limited studies (eg, those that compare capitated and noncapitated care).27 Moreover, few studies have systematically reviewed predictors of dissatisfaction among FP/GPs. In this paper, we report findings related to these important issues using data from a recent national survey in which more than 12,000 primary care physicians and specialists commented on their current experiences as medical professionals in the US health care system. We hypothesized that FP/GPs who identify difficulties in providing quality care to patients also report higher levels of dissatisfaction. We also expected that physician dissatisfaction would relate to access to care, particularly for very needy populations whose care is government regulated. Therefore, we ascertained the extent to which dissatisfied FP/GPs who stay in the workforce are less likely to serve the poor and the elderly by accepting new Medicaid and Medicare patients when compared with their satisfied counterparts.
Methods
Data source
Data for this study were from the Community Tracking Study (CTS) Physician Survey (1996–1997).28 This survey, sponsored by the Robert Wood Johnson Foundation, was part of a major project by the Center for Studying Health System Change, a Washington, DC–based organization affiliated with Mathematica Policy Research, Inc. Information for the survey was collected from a nationally representative sample of nonfederal physicians performing direct patient care.
The sample frame of physicians was obtained from master files of the American Medical Association and the American Osteopathic Association. The sample included office-based and hospital-based physicians who spend at least 20 hours per week in direct patient care in the continental United States. Residents and fellows were excluded, as were physicians in certain specialties such as radiology, anesthesiology, and pathology. The survey followed a complex design of 60 sites supplemented by a small, independently drawn national sample.28,29 Telephone interviews were conducted with 12,291 physicians from August 1996 to August 1997 with a 65% response rate.30,31 The rate of nonresponse to individual survey items was very low, typically less than 3%. Primary care physicians were oversampled. The 3166 FP/GPs accounted for 44.3% of primary care doctors surveyed and 25.8% of the total sample.
Study variables
Dependent Variable: Career Satisfaction. The dependent variable for most analyses was medical career dissatisfaction. Respondents were asked, “Thinking very generally about your overall career in medicine, would you say that you are currently very satisfied, somewhat satisfied, somewhat dissatisfied, very dissatisfied, or neither satisfied or dissatisfied?” For comparative analysis, those reporting “neither satisfied or dissatisfied” were eliminated and the 4 remaining responses were collapsed into 2 categories. Physicians who reported feeling very satisfied or somewhat satisfied were classified as “satisfied”; those who reported feeling somewhat dissatisfied or very dissatisfied were classified as “dissatisfied.”
Independent Variables. The explanatory variables of primary interest were indicators to assess physicians’ perceptions of their ability to provide high-quality medical care. This determination was measured by 6 survey questions with 5-point response categories that ranged from “strongly agree” to “strongly disagree.” Table 1 presents the measures of quality of care. Physician dissatisfaction was also potentially influenced by other factors assessed in the survey. Analyses were statistically controlled for the personal, professional, and practice characteristics that appear in Table 2 to examine the relationship of physicians’ dissatisfaction with the perception of their ability to provide high-quality care.
TABLE 1
PATIENT CARE CHARACTERISTICS ASSOCIATED WITH FP/GP DISSATISFACTION (N = 3166)
| Statement | Multivariate Odds Ratio (95% CI) |
|---|---|
| The level of communication I have with specialists about the patients I refer to them is sufficient to ensure the delivery of high-quality care. (n = 3102) | 1.0 |
| Agree strongly | 1.25 (1.01-1.55) |
| Agree somewhat | 1.15 (0.48-2.74) |
| Neither agree nor disagree | 2.37 (1.67-3.37) |
| Disagree somewhat | 3.57 (2.20-5.80) |
| Disagree strongly | |
| It is possible to maintain the kind of continuing relationships with patients over time that promote the delivery of high-quality care. (n = 3082) | 1.0 |
| Agree strongly | 1.89 (1.39-2.58) |
| Agree somewhat | 3.17 (1.38-7.29) |
| Neither agree nor disagree | 4.90 (3.71-6.46) |
| Disagree somewhat | 7.11 (4.90-10.33) |
| Disagree strongly | |
| I can make clinical decisions in the best interests of my patients without the possibility of reducing my income. (n = 3074) | 1.0 |
| Agree strongly | 1.23 (0.92-1.65) |
| Agree somewhat | 1.51 (0.89-2.58) |
| Neither agree nor disagree | 2.61 (1.91-3.56) |
| Disagree somewhat | 4.44 (3.13-6.31) |
| Disagree strongly | |
| I have adequate time to spend with my patients during typical office/patient visits. (n = 310) | 1.0 |
| Agree strongly | 0.81 (0.58-1.14) |
| Agree somewhat | 1.15 (0.58-2.30) |
| Neither agree nor disagree | 1.39 (1.02-1.88) |
| Disagree somewhat | 4.42 (2.84-6.87) |
| Disagree strongly | |
| I have the freedom to make clinical decisions that meet my patients’ needs. (n = 3100) | 1.0 |
| Agree strongly | 1.55 (1.25-1.93) |
| Agree somewhat | 3.25 (1.50-7.02) |
| Neither agree nor disagree | 3.73 (2.84-4.89) |
| Disagree somewhat | 7.89 (4.86-12.83) |
| Disagree strongly | |
| It is possible to provide high-quality care to all my patients. (n = 3099) | 1.0 |
| Agree strongly | 1.20 (0.94-1.52) |
| Agree somewhat | 0.98 (0.37-2.61) |
| Neither agree nor disagree | 2.70 (1.88-3.89) |
| Disagree somewhat | 4.26 (2.88-6.31) |
| Disagree strongly | |
| NOTE: A higher odds ratio indicates that this response is more strongly associated with physician dissatisfaction. Ns vary because not all physicians answered every item on the survey. | |
| FP/GP denotes family physician/general practitioner. | |
Analytical strategy
Two sets of logistic regression were performed. In the first, adjusted odds ratios were derived to measure the association of personal, professional, and practice characteristics with dissatisfaction (Table 2). Next, the relationship of dissatisfaction with each of the indicators of quality of care was assessed with 6 separate multivariate logistic regression procedures (Table 1). The adjusted odds ratios in Table 1 are the products of that analysis and represent the association of perceived ability to deliver quality of care after controlling for the effects of personal, professional, and practice variables. SUDAAN software, version 7.5.3 (Research Triangle Institute, Research Triangle Park, NC), was used to conduct statistical tests and make national estimates with variance adjustment for the complex survey sample design and physician nonresponse.
TABLE 2
PERSONAL, PROFESSIONAL, AND PRACTICE-RELATED FACTORS ASSOCIATED WITH FP/GP DISSATISFACTION (N = 3166)
| PERSONAL/PROFESSIONAL CHARACTERISTICS | Multivariate Odds Ratio (95% CI) |
|---|---|
| Age in years (n = 2965) | |
| <35 | 1.0 |
| 35–44 | 1.43 (0.94-2.16) |
| 45–54 | 1.89 (1.20-2.98) |
| 55–64 | 2.46 (1.56-3.88) |
| 64 | 2.30 (1.40-3.80) |
| Sex (n = 3106) | |
| Women | 1.0 |
| Men | 1.28 (0.92-1.78) |
| Type of medical training (n = 3106) | |
| Allopathic | 1.0 |
| Osteopathic | 1.74 (1.34-2.25) |
| Graduate of foreign medical school (n = 3106) | |
| Puerto Rico | 1.0 |
| Other | 1.33 (1.03-1.73) |
| Board certification (n = 3063) | |
| Board certified | 1.0 |
| Board eligible | 1.15 (0.82-1.63) |
| Neither | 0.93 (0.69-1.25) |
| Net income in 1995 ($) (n = 3103) | |
| 0–49,000 | 2.31 (1.29-4.14) |
| 50,000–99,999 | 1.83 (1.20-2.79) |
| 100,000–149,999 | 1.45 (0.98-2.14) |
| 150,000–199,999 | 1.41 (0.91-2.16) |
| 200,000–249,999 | 1.0 |
| 250,000–299,999 | 1.82 (0.98-3.38) |
| 300,000 + | 1.93 (0.98-3.81) |
| PRACTICE CHARACTERISTICS | |
| Practice type (n = 3106) | |
| 1 or 2 physicians | 1.19 (0.74-1.93) |
| 3+ physicians | 1.14 (0.70-1.85) |
| HMO | 1.35 (0.82-2.22) |
| Medical school | 1.01 (0.52-1.93) |
| Hospital based | 1.0 |
| Other | 1.16 (0.74-1.83) |
| Community size (n = 3106) | |
| Large metropolitan area (>200,000) | 1.42 (0.81-2.49) |
| Small metropolitan area (< 200,000) | 1.0 |
| Nonmetropolitan area | 1.07 (0.55-2.08) |
| Ownership (n = 3106) | |
| Full owners | 1.57 (1.11-2.21) |
| Part owners | 1.0 |
| Not an owner | 1.01 (0.72-1.43) |
| Percentage of patients for whom you serve as gatekeeper (n = 3106) | |
| 0 | 2.20(1.44-3.37) |
| 1–9 | 1.59 (1.06-2.40) |
| 10–19 | 1.0 |
| 20–29 | 1.47 (0.98-2.20) |
| 30–59 | 1.83 (1.29-2.60) |
| 60–89 | 2.31 (1.62-3.28) |
| 90–100 | 2.29 (1.44-3.64) |
| NOTE: Ns vary because not all physicians answered every item on the survey. | |
| FP/GP denotes family physician/general practitioner; HMO, health maintenance organization. | |
Results
Nearly 18% of physicians report being dissatisfied with a career in medicine. The rate of dissatisfaction among FP/GPs is similar to that for all physicians, specialists, and primary care physicians as a group. However, there is some variability among primary care specialties, with internists reporting more dissatisfaction (chi-square = 14.8, P < .01) and pediatricians (chi-square = 25.9, P < .01) reporting less dissatisfaction than FP/GPs (Table 3).
TABLE 3
EXTENT OF PHYSICIAN DISSATISFACTION
| Type of Physician | Satisfied or Very Satisfied n (%)* | Dissatisfied or Very Dissatisfied n (%)* | Neither Satisfied nor Dissatisfied n (%)* |
|---|---|---|---|
| Total physicians | 10,093 (80.7) | 2198 (17.7) | 212 (1.6) |
| Specialists | 4316 (80.5) | 953 (18.0) | 87 (1.6) |
| Total primary care | 5777 (81.0) | 1245 (17.4) | 125 (1.6) |
| FP/GPs | 2537 (81.9) | 569 (17.3) | 60 (1.7) |
| Pediatricians | 1403 (86.2) | 206 (12.6) | 17 (1.3) |
| Internists | 1837 (77.5) | 470 (20.6) | 48 (1.9) |
| *Unweighted number of survey respondents and weighted percent of US FP/GPs. | |||
| FP/GPs denotes family physicians/general practitioners. | |||
Factors associated with FP/GP dissatisfaction
Many characteristics were associated with the dissatisfaction reported by 17.6% of FP/GPs. The associated characteristics are included in 3 domains. The first 2 domains, personal/professional and practice characteristics, reveal significant factors associated with dissatisfaction (Table 2). The data in the third domain, patient care characteristics, represent results after we had statistically controlled for all factors in the first 2 (Table 1).
Personal/Professional Characteristics. A higher level of dissatisfaction was related to being older; only 10.1% of physicians younger than 35 years of age reported dissatisfaction versus 25.1% of physicians aged 55 to 64 years (odds ratio [OR] 2.46; 95% confidence interval [CI], 1.56-3.88). FP/GPs more likely to be dissatisfied were those who had osteopathic training and those who had been graduated from foreign medical schools. Levels of dissatisfaction were also higher among FP/GPs earning less than $100,000 per year.
Practice Characteristics. Physicians who fully owned their practice were more likely to express dissatisfaction with their careers than were physicians who either shared ownership or did not own their practice (OR 1.57; 95% CI, 1.11-2.21). The pattern of dissatisfaction related to gatekeeping (ie, providing permission for their patients to seek specialty care) was similar to that related to income. FP/GPs serving as gatekeepers for less than 10% or more than 30% of their patients were the most dissatisfied.
Patient Care Characteristics. After we had controlled for the effects of personal, professional, and practice characteristics, we found that FP/GP career dissatisfaction was, without exception, consistently and strongly associated with a perceived inability to provide high-quality care as assessed by physician responses to each of 6 statements (Table 1). Dissatisfied physicians were much more likely to “disagree strongly” than. to “agree strongly” with the statements about clinical freedom (OR 7.89; 95% CI, 4.86-12.83), continuity of care (OR 7.11; 95% CI, 4.90-10.33), clinical decisions free of financial penalties (OR 4.44; 95% CI, 3.13-6.31), adequacy of time with patients (OR 4.42; 95% CI, 2.84-6.87), ability to provide high-quality care (OR 4.26; 95% CI, 2.88-6.31) and sufficient communication with specialists (OR 3.57; 95% CI, 2.20-5.80). The most notable differences found between dissatisfied and satisfied FP/GPs were related to a lack of clinical freedom and difficulty maintaining continuing relationships with patients.
Physician dissatisfaction influences medicare and medicaid care
Dissatisfaction correlates with the percentage of physicians who are willing to care for Medicare and Medicaid patients. A lower percentage of dissatisfied FP/GPs are accepting all new Medicaid patients than are their satisfied counterparts (34.6% vs 43.4%; P < .01); and a higher percentage of dissatisfied FP/GPs are taking no new Medicaid patients (33.5% vs 23.7%; P < .01). Similarly, a higher percentage of dissatisfied FP/GPs are accepting no new Medicare patients (11.3% vs 8.6%; P = .04) (Table 4).
TABLE 4
RELATIONSHIP OF FP/GP DISSATISFACTION TO ACCESS FOR MEDICAID AND MEDICARE PATIENTS
| Characteristic | Satisfied FP/GPs (N = 2537) n (%)* | Dissatisfied FP/GPs (N = 569) n (%)* | P Value |
|---|---|---|---|
| Taking all new Medicaid patients | 1024 (43.4) | 198 (34.6) | <.01 |
| Taking no new Medicaid patients | 665 (23.7) | 198 (33.5) | <.01 |
| Taking all new Medicare patients | 1519 (61.5) | 325 (57.9) | 0.13 |
| Taking no new Medicare patients | 227 (8.6) | 70 (11.3) | 0.04 |
| *Unweighted number of survey respondents and weighted percent of US FP/GPs. | |||
| FP/GPs denotes family physicians/general practitioners. | |||
Discussion
A substantial proportion of family physicians, approximately 1 in 5, were dissatisfied with their careers in 1996–1997. Associated characteristics of the dissatisfied group were older age, osteopathic training, and graduation from a foreign medical school. Neither type nor location of practice was a factor, although being a full owner of the practice was associated with greater dissatisfaction. Physicians earning less than $100,000 per year and FP/GPs for whom less than 10% or more than 30% of patients were in gatekeeping arrangements were more dissatisfied.
The strongest factors associated with dissatisfaction, however, were not personal or practice characteristics but the perceptions of family physicians about their ability to take good care of their patients. After we had controlled for personal and practice characteristics, dissatisfaction was much more likely when the family physicians felt they did not have (1) the freedom to make clinical decisions that met their patients’ needs, (2) a sufficient level of communication with specialists, (3) enough time with their patients, (4) the ability to provide high-quality patient care, (5) the freedom to make clinical decisions without financial conflicts of interest, or (6) the ability to maintain continuing relationships with their patients. More than half of FP/GPs who strongly disagreed with the statement “I have the freedom to make clinical decisions that meet my patients’ needs” were dissatisfied with their medical career.
These findings are consistent with previous findings concerning physician autonomy and the widespread backlash against constraints associated with managed care and gatekeeping. The findings draw attention from financial considerations toward clinical decision making as a critical factor in physicians’ career satisfaction. Understanding the basis of physician dissatisfaction is important because of the adverse effects of such dissatisfaction. It is difficult to imagine patients preferring to see a dissatisfied physician or to envision a visit with a dissatisfied FP/GP as superior to one with a satisfied physician. In addition, this analysis specifically demonstrates that dissatisfaction among family physicians can negatively affect groups of patients by impeding access to care for Medicaid and Medicare patients. Perhaps the key implication of these findings is the need for serious efforts to revise practice arrangements so that FP/GPs can make the best possible decisions for their patients.
Limitations
There are important limitations to our analysis. The CTS Physician Survey is cross-sectional. While we do not know whether these physicians are more or less satisfied than they were in the past, recent evidence from surveys of primary care physicians in Massachusetts suggests that dissatisfaction has increased since 1986.17 As in all surveys, responses are subject to reporting error and response bias not accounted for by statistical adjustments. Our findings are associations between variables and do not establish causal relationships.
Conclusions
The finding that family physician dissatisfaction, after study results are controlled for personal and practice variables, is associated most strongly with a perceived inability to care for patients raises significant concerns. Dissatisfaction among a large proportion of family physicians threatens the well-being of patients. Given the extent to which the US health care system relies on family physicians, understanding why these physicians are dissatisfied and responding to these problems are important. This cross-sectional snapshot of dissatisfaction among family physicians suggests that patients would benefit from strategies that support rather than disrupt their ongoing relationships with family physicians and that permit their family physician to spend enough time with them to make decisions that are not constrained by financial or other conflicts of interest.
1. Safran DG, Taira DA, Rogers WH, Kosinski M, Ware JE, Tarlov AR. Linking primary care performance to outcomes of care. J Fam Pract 1998;47:213-20.
2. Donaldson MS, Yordy KD, Lohr KN, Vanselow NA, eds. Primary care: America’s health in a new era. Washington DC: National Academy Press; 1996.
3. Grumbach K, Selby JV, Damberg C, et al. Resolving the gatekeeper conundrum: what patients value in primary care and referrals to specialists. JAMA 1999;282:261-6.
4. Mainous AG, Baker R, Love MM, Gray DP, Gill JM. Continuity of care and trust in one’s physician: evidence from primary care in the United States and the United Kingdom. Fam Med 2001;33:22-7.
5. Robert Graham Center for Policy Studies in Family Practice and Primary Care. The importance of having a usual source of health care. Am Fam Physician 2000;62:477.-
6. Haas JS, Cook EF, Puopolo AL, Burstin HR, Cleary PD, Brennan TA. Is the professional satisfaction of general internists associated with patient satisfaction? J Gen Intern Med 2000;15:122-8.
7. Patricelli RE. Providing universal and affordable health care to the American people. In: Providing universal and affordable health care. Washington DC: Institute of Medicine; 1989.
8. Linn LS, Yager J, Cope D, Leake B. Health status, job satisfaction, job stress, and life satisfaction among academic and clinical faculty. JAMA 1985;254:2775-82.
9. DiMatteo MR, Sherbourne CD, Hays RD, et al. Physicians’ characteristics influence patients’ adherence to medical treatment: results from the medical outcomes study. Health Psychol 1993;12:93-102.
10. Buchbinder SB, Wilson M, Melick CF, Powe NR. Estimates of costs of primary care physician turnover. Am J Managed Care 1999;5:1431-8.
11. Lewis CE, Prout DM, Chalmers EP. How satisfying is the practice of internal medicine? A national survey. Ann Intern Med 1991;114:1-5.
12. FP Report. Worrisome trend continues: specialty, primary care lose ground in 2001 match. FP Report 2001; 4:7.
13. Robert Graham Center for Policy Studies in Family Practice and Primary Care. The United States relies on family physicians unlike any other specialty. Am Fam Physician 2001;63:1669.-
14. Conte SJ, Imershein AW, Magill MK. Rural community and physician perspectives on resource factors affecting physician retention. J Rural Health 1992;8:185-96.
15. Donelan K, Blendon RJ, Lundberg GD, et al. The new medical marketplace: physicians’ views. Health Affairs 1997;16:139-48.
16. Schulz R, Scheckler WE, Moberg DP, Johnson PR. Changing nature of physician satisfaction with health maintenance organization and fee-for-service practices. J Fam Pract 1997;45:321-30.
17. Murray A, Montgomery JE, Chang H, Rogers WH, Inui T, Safran DG. Doctor discontent: a comparison of physician satisfaction in different delivery system settings, 1986 and 1997. J Gen Intern Med 2001;16:451-9.
18. Skolnik NS, Smith DR, Diamond J. Professional satisfaction and dissatisfaction of family physicians. J Fam Pract 1993;37:257-63.
19. Pathman DE, Williams ES, Konrad TR. Rural physician satisfaction: its sources and relationship to retention. J Rural Health 1996;12:366-77.
20. Kerr EA, Mittman BS, Hays RD, Zemencuk JK, Pitts J, Brook RH. Associations between primary care physician satisfaction and self-reported aspects of utilization management. Health Serv Res 2000;35(1 pt 2):333-49.
21. Petrozzi MC, Rosman HS, Nerenz DR, Young MJ. Clinical activities and satisfaction of general internists, cardiologists, and ophthalmologists. J Gen Intern Med 1992;7:363-7.
22. Kitai E, Kushnir T, Herz M, Melamed S, Vigiser D, Granek M. Correlation of work structure and job satisfaction among Israeli family physicians. Israeli Med J 1999;1:236-40.
23. Hueston WJ. Family physicians’ satisfaction with practice. Arch Fam Med 1998;7:242-7.
24. Hadley J, Mitchell JM, Sulmasy DP, Bloche MG. Perceived financial incentives, HMO market penetration, and physicians’ practice style and satisfaction. Health Serv Res 1999;34:307-21.
25. Bates AS, Harris LE, Tierney WM, Wolinsky FD. Dimensions and correlates of physician work satisfaction in a midwestern city. Med Care 1998;36:610-7.
26. Grumbach K, Osmond D, Vranizan K, Jaffe D, Bindman AB. Primary care physicians’ experience of financial incentives in managed-care systems. N Engl J Med 1998;339:1516-21.
27. Kerr EA, Hays RD, Mittman BS, Siu AL, Leake B, Brook RH. Primary care physicians’ satisfaction with quality of care in California capitated medical groups. JAMA 1997;278:308-12.
28. Kemper P, Blumenthal D, Corrigan JM, et al. The design of the Community Tracking Study: a longitudinal study of health system change and its effects on people. Inquiry 1996;33:195-206.
29. Metcalf CE, Kemper P, Kohn LT, Pickreign JD. Site definition and sample design for the Community Tracking Study (technical publication no.1). Washington, DC: Center for Studying Health System Change; 1996.
30. Keil L, Chattopadhyay M, Potter F, Reed MC. Community Tracking Study Physician Survey round 1 survey methodology report (Technical Publication No.9). Washington, DC: Center for Studying Health System Change; 1998.
31. Reschovsky JD, Edson D, Sewall A, et al. Community Tracking Study physician survey public use file: user’s guide, round 1, release 1. Technical publication no 10. Washington, DC: Center for Studying Health System Change; 1998.