User login
Prevalence and Management of Veterans with Advanced Solid Tumors Harboring NTRK Gene Rearrangements
Background
Oncogenic fusions within Neurotrophic Tyrosine Receptor Kinase (NTRK) 1, 2, or 3 drive constitutive hyperproliferative activity of (TRK) A, B, and C, respectively. Two TRK inhibitors have been approved for patients with advanced solid tumors bearing oncogenic fusions in NTRK1-3. We sought to describe the prevalence of NTRK fusions and rearrangements and to evaluate treatment outcomes among veterans treated with TRK inhibitors.
Methods
Patients with NTRK1-3 gene fusions or rearrangements were identified from the VA National Precision Oncology Program (NPOP) database. Separately, patients with orders for larotrectinib or entrectinib were identified from the Corporate Data Warehouse (CDW) and associated patient demographics and vital status were obtained. The prevalence of NTRK1-3 gene fusions and rearrangements was computed for all patients who had testing within NPOP. For patients who received either larotrectinib or entrectinib, duration of drug use, tumor response, reasons for drug discontinuation and toxicities were abstracted from medical records. For patients not treated with either drug, medical records were used to identify the reason for no drug use.
Results
Among 14,515 samples sequenced through NPOP (11,714 tissue DNA ,176 tissue DNA/RNA and 2625 liquid biopsy DNA tests), 14 (0.096%) had NTRK1-3 gene fusions or rearrangements (6 canonical fusions, 2 non-canonical fusions and 6 non-fusion gene rearrangements). Two patients tested outside of NPOP had canonical fusions. Among the 16 patients, 5 had prostate, 4 lung, 2 thyroid, 2 sarcoma, 1 bladder, 1 gastric, and 1 colorectal cancer. Twelve patients had metastatic disease, and 4 had early-stage disease. Eight patients were prescribed a TRK inhibitor (larotrectinib 5, entrectinib 3). Median duration of treatment was 59 (29 – 88) days. No responses were observed in the 7 evaluable patients. One patient developed neurotoxicity requiring temporary cessation of larotrectinib, and one patient treated with entrectinib developed volume overload requiring hospitalization leading to drug discontinuation.
Conclusion
Among veterans tested in NPOP, oncogenic NTRK fusions and rearrangements are very uncommon, and no patient had a response to treatment with a TRK inhibitor. Reconsideration of NTRK1-3 testing methodology and recommendations is warranted.
Factors Associated with Survival and Epidemiology of Gastrointestinal Neuroendocrine Tumors in the US Department of Veteran Affairs
Introduction
Rectal carcinoid tumors are rare but the second most common carcinoid in the gastrointestinal tract. They are usually found incidentally during endoscopic or rectal examination. They do not often produce carcinoid syndrome like manifestations although they may manifest as rectal bleeding. Rectal carcinoid patients also have a higher morbidity for other cancers such as stomach, small intestine, or secondary lung cancer.
Methods
We retrospectively explored factors associated with survival in Veterans with rectal carcinoid tumors over a ten-year period from 2007-2017 using the National Veterans Affairs Cancer Cube Registry using specific histological ICD-03 coding. We identified 1110 cases of rectal carcinoid. Chi-squared tests were used for statistical analysis.
Results
Regarding age distribution in our cohort, there were 2.61% of patients ages 40-50 group, 14.0% in the 50-60 age group, 41.5% in the 60-70 age group, and 40.7% above ages 70. There was a higher proportion of rectal cancer in stage 1 compared to other stages (86.3%). The majority of diagnoses occur after age 50 (89.8%). A higher proportion of rectal carcinoid was identified in the 60-70 years category compared to <60 and >70 years old. In the general VA population, there are 80.2% White and 12.8% Black patients. We found a higher proportion of rectal carcinoid in Black patients (47.8%) over White patients (42.8%, p=0.02), which differs significantly from the racial makeup of the VA population (12.8% Black vs 80.3% White). Looking at survival time based on diagnosis, it is notable that 82.7% of individuals survive longer than 5 years when the diagnosis is made in ages 50-60 when compared to 68.7% when the diagnosis is made between ages 60-70 (p<0.001).
Conclusions
Our data is consistent with the SEER data in that the incidence and prevalence of rectal carcinoid are higher in Black patients compared to White patients. Further analysis into reasons for this racial disparity may prove beneficial to our understanding of this malignancy in the Veteran population. Further research is needed to determine whether diagnosis at a younger age offers a survival advantage in rectal carcinoid.
Methods of Identifying Real World mCRPC Patients from the Veterans Health Administration System
Purpose
Prostate cancer is the fifth leading cause of death in the United States. Genomic testing is essential to guide treatment decisions in patients with metastatic castration resistant prostate cancer (mCRPC), the most advanced stage of prostate cancer. However, identifying mCRPC patients from administrative data is challenging and hinders researchers’ ability to assess testing among these patients. This study aims to develop algorithms using structured data and unstructured data with Natural language processing (NLP) methods to identify veterans by disease stage and hormone sensitivity, and to assess patient characteristics as well as receipt of tumor NGS testing.
Methods
We used biopsy, pathology, and diagnosis codes, to identify veterans with newly diagnosed PC within the Veterans Health Administration (VA) from January 1, 2017 to December 31, 2020. We developed and deployed: 1. A structured algorithm that used medication and Prostate-Specific Antigen (PSA) data to assess hormone sensitivity. 2. NLP tools to extract disease stage and hormone sensitivity from clinical notes. We report descriptive statistics on patient demographics, clinical characteristics, disease status, androgen deprivation therapy (ADT), and receipt of tumor NGS testing.
Results
There were 42,485 veterans with newly diagnosed prostate cancer between 2017-2020. This represented ~0.18% of veterans served in the VA and consisted of Whites (57%), Blacks (33%), and others (10%). During the study period, 3,113 (7.3%) patients had documentation of assessment for intraductal carcinoma, 5,160 (12.1%) had ADT treatment, 1,481 (3.5%) had CRPC, and 3,246 (7.6%) had metastatic disease. Among the 42,485 veterans, 422 received tumor NGS testing within VA, and 300 of them had metastatic disease. NLP tool and structured data algorithm collectively showed that 38% of the 422 tumor NGS testing recipients had mCRPC. Among all newly diagnosed PC patients, White patients had highest rates of tumor-based testing (2.3%), then Native Hawaiians (1.7%), Asians and Blacks (1.2% each), compared to Native Americans (0.4%).
Implications
NLP tools alongside structured data algorithms successfully identified variables required to measure access to tumor NGS testing. Efforts to validate and apply this method is ongoing to assess receipt of precision prostate cancer care in VA.
Diagnosis of Prostate Cancer and Prostate-specific Antigen Level on Initial Prostate Biopsy: Does Race Matter?
Objective
To determine whether Black Veterans are at higher risk for prostate cancer diagnosis on their first prostate biopsy compared to non-Hispanic White (White) Veterans.
Background
Prostate-specific antigen (PSA) testing is widely used to screen for prostate cancer. Although men of African ancestry display an increased incidence of prostate cancer and more aggressive disease, specific PSA thresholds for biopsy referral have yet to be proposed for this population.
Methods
We used the VHA’s electronic medical record data to collect Veterans’ demographic and clinical characteristics including self-identified race/ethnicity, age, date of first prostate biopsy, PSA results, and prostate cancer diagnosis. Veterans’ ZIP code of residence was used to determine urban/rural status, income, and education. We estimated multivariable logistic regression models to predict the likelihood of prostate cancer diagnosis on the first biopsy using race, baseline PSA, age at first PSA test, age at initial biopsy, smoking status, use of statins, and socioeconomic factors as predictors. We calculated adjusted predicted probabilities of cancer detection on the first prostate biopsy from the logistic models at different PSA levels.
Results
We identified 246,056 White and 71,653 Black Veterans who underwent their first prostate biopsy through February 28, 2020 and who had no previous prostate cancer diagnosis or treatment prior to that biopsy. Black Veterans appeared to receive their first PSA test four years earlier and undergo their first prostate biopsy two years earlier than their White counterparts (median age of 57 vs. 61 and 63 vs. 65, respectively). After controlling for selected covariates, we found that Black Veterans were 52% more likely to be diagnosed with prostate cancer on their first prostate biopsy compared to White Veterans (OR 1.52, 95% CI 1.49-1.55). Our model indicated that a Black Veteran with a PSA of 4.0 ng/ml has an equivalent risk of prostate cancer detection as a White Veteran with a PSA of 9.7 ng/ml.
Implications
Our findings suggested that developing a risk-based PSA threshold for referral to prostate biopsy may lead to earlier diagnosis of clinically significant prostate cancer in a population of Veterans known to have an increased incidence and risk of aggressive disease.
Racial Disparities in Treatment and Survival for Early-Stage Non-Small Cell Lung Cancer: Is Equal Access Health Care System the Answer?
Background
Survival for early-stage non-small cell lung cancer (NSCLC) has dramatically improved with advancement in surgical and radiation techniques over last two decades but there exists a disparity for African Americans (AA) having worse overall survival (OS) in recent studies on the general US population. We studied this racial disparity in Veteran population.
Methods
Data for 2589 AA and 14184 Caucasian Veterans diagnosed with early-stage (I, II) NSCLC between 2011-2017 was obtained from the Cancer Cube Registry (VACCR). IRB approval was obtained.
Results
The distribution of newly diagnosed cases of Stage I (73.92% AA vs 74.71% Caucasians) and Stage II (26.07% vs 25.29%) between the two races was comparable (p = .41). More Caucasians were diagnosed above the age of 60 compared to AA (92.22% vs 84.51%, p < .05). More AA were diagnosed with adenocarcinoma at diagnosis (56.01% vs 45.88% Caucasians, p < .05) for both Stage I and II disease. For the limited number of Veterans with reported performance status (PS), similar proportion of patients had a good PS defined as ECOG 0-2 among the two races (93.70% AA vs 93.97% Caucasians, p = .73). There was no statistically significant difference between 5-year OS for AA and Caucasians (69.81% vs 70.78%, p = .33) for both Stage I and II NSCLC. Both groups had similar rate of receipt of surgery as first line treatment or in combination with other treatments (58.90% AA vs 59.07% Caucasians, p = .90). Similarly, the rate of receiving radiation therapy was comparable between AA and Caucasians (42.4% vs 42.3%, p = .96). Although both races showed improved 5-year OS after surgery, there was no statistical difference in survival benefit between AA and Caucasians (69.8% vs 70.8%, p = .33).
Conclusion
In contrast to the studies assessing general US population trends, there was no racial disparity for 5-year OS in early-stage NSCLC for the Veteran population. This points to the inequities in access to treatment and preventive healthcare services as a possible contributing cause to the increased mortality in AA in general US population and a more equitable healthcare delivery within the VHA system.
Survival Analysis of Untreated Early-Stage Non-Small Cell Lung Cancer (NSCLC) in a Veteran Population
Introduction
Veterans with early-stage NSCLC who do not receive any form of treatment have been shown to have a worse overall survival compared to those who receive treatment. Factors that may influence the decision to administer treatment including age, performance status (PS), comorbidities, and racial disparity have not been assessed on a national level in recent years.
Methods
Data for 31,966 veterans diagnosed with early-stage (0, I) NSCLC between 2003-2017 was obtained from the Cancer cube registry (VACCR). IRB approval was obtained.
Results
Patients were divided into treatment (26,833/31,966, 83.16%) and no-treatment group (3096/31966, 9.68%). Of the no-treatment group, 3004 patients were stage I and 92 were stage 0 whereas in the treatment group, the distribution was 26,584 and 249 respectively. Gender, race, and histology distribution were comparable between the two. Patients with poor PS (defined as ECOG III and IV) received less treatment with any modality compared to those with good PS (ECOG I and II) (15.07% in no treatment group vs 4.03% in treatment group, p<0.05). The treatment group had a better 5-year overall survival (OS) as compared to no-treatment group (43.1% vs 14.7%, p<0.05). Regardless of treatment, patients above the age of 60 (41% vs 13.4%, p<0.05) and those with poor PS (19.6% vs 5.8%, p<0.05) had worse 5-year survival, with the effect being greater in the treatment group. Adenocarcinoma had a better 5-year survival compared to squamous cell carcinoma (SCC) in both groups (49.56% vs 39.1% p<0.05). There was no clinically significant OS difference in terms of race (Caucasian or African American) or tumor location (upper, middle, or lower lobe) in between the two groups. Our study was limited by lack of patient- level data including smoking status or reason why no treatment was given.
Conclusion
Patients with early-stage NSCLC who receive no treatment based on poor PS have a worse overall survival compared to the patients that receive treatment. Further investigation is required to assess what other criteria are used to decide treatment eligibility and whether these patients would be candidates for immunotherapy or targeted therapy in the future.
Atopic Dermatitis Oral Therapies: What Are Patients Learning on YouTube?
To the Editor:
Oral immunosuppressive therapies are prescribed for moderate to severe atopic dermatitis. Patients often consult YouTube to make informed decisions about these therapies. In the United States, most health-related online searches are initiated through a search engine, which frequently leads to social media sites such as YouTube. Recent studies have examined the reasons why users turn to the Internet for health-related information, indicating that users typically seek specific information regarding health concerns.1,2 Furthermore, social media platforms such as YouTube are a popular means of sharing health information with the public.3-5 Currently, YouTube has more than 1 billion registered users, and 30 million health-related videos are watched each day.6 Almost one-third of US consumers use YouTube, Facebook, and Twitter to obtain medical information.7 YouTube is a versatile tool because of its video-discovery mechanisms such as a keyword-based search engine, video-recommendation system, highlight feature for videos on home pages, and the capacity to embed YouTube videos on various web pages.8 Searchers use videos that are short, fast paced, emotion evoking, from credible sources, recently uploaded, and relevant to the searcher for aiding in health decisions.9 Furthermore, studies have demonstrated YouTube’s capacity to support a change in attitude and increase users’ knowledge. In fact, YouTube had higher impact on recall, attitudes, and behaviors when compared with written materials on other social media platforms, such as Facebook and Twitter.9 We conducted a cross-sectional study to examine the quality of YouTube videos on oral therapies for atopic dermatitis, such as cyclosporine, methotrexate, azathioprine, and mycophenolate mofetil.
On April 23, 2020, we performed 8 searches using a private browser with default filters on YouTube (Figure). Injectables were not included in the analysis, as the YouTube experience on dupilumab previously has been investigated.10 The top 40 videos from each search were screened by 3 researchers. Duplicates, non–English-language videos, and videos that did not discuss atopic dermatitis or oral therapies were excluded, resulting in 73 videos included in this analysis. Testimonials generated by patients made up 39 of 73 (53.4%) videos. Health care professionals created 23 of 73 (31.5%) videos, and educators with financial interest created 11 of 73 (15.1%) videos. The dates of production for the videos spanned from 2008 to 2020.
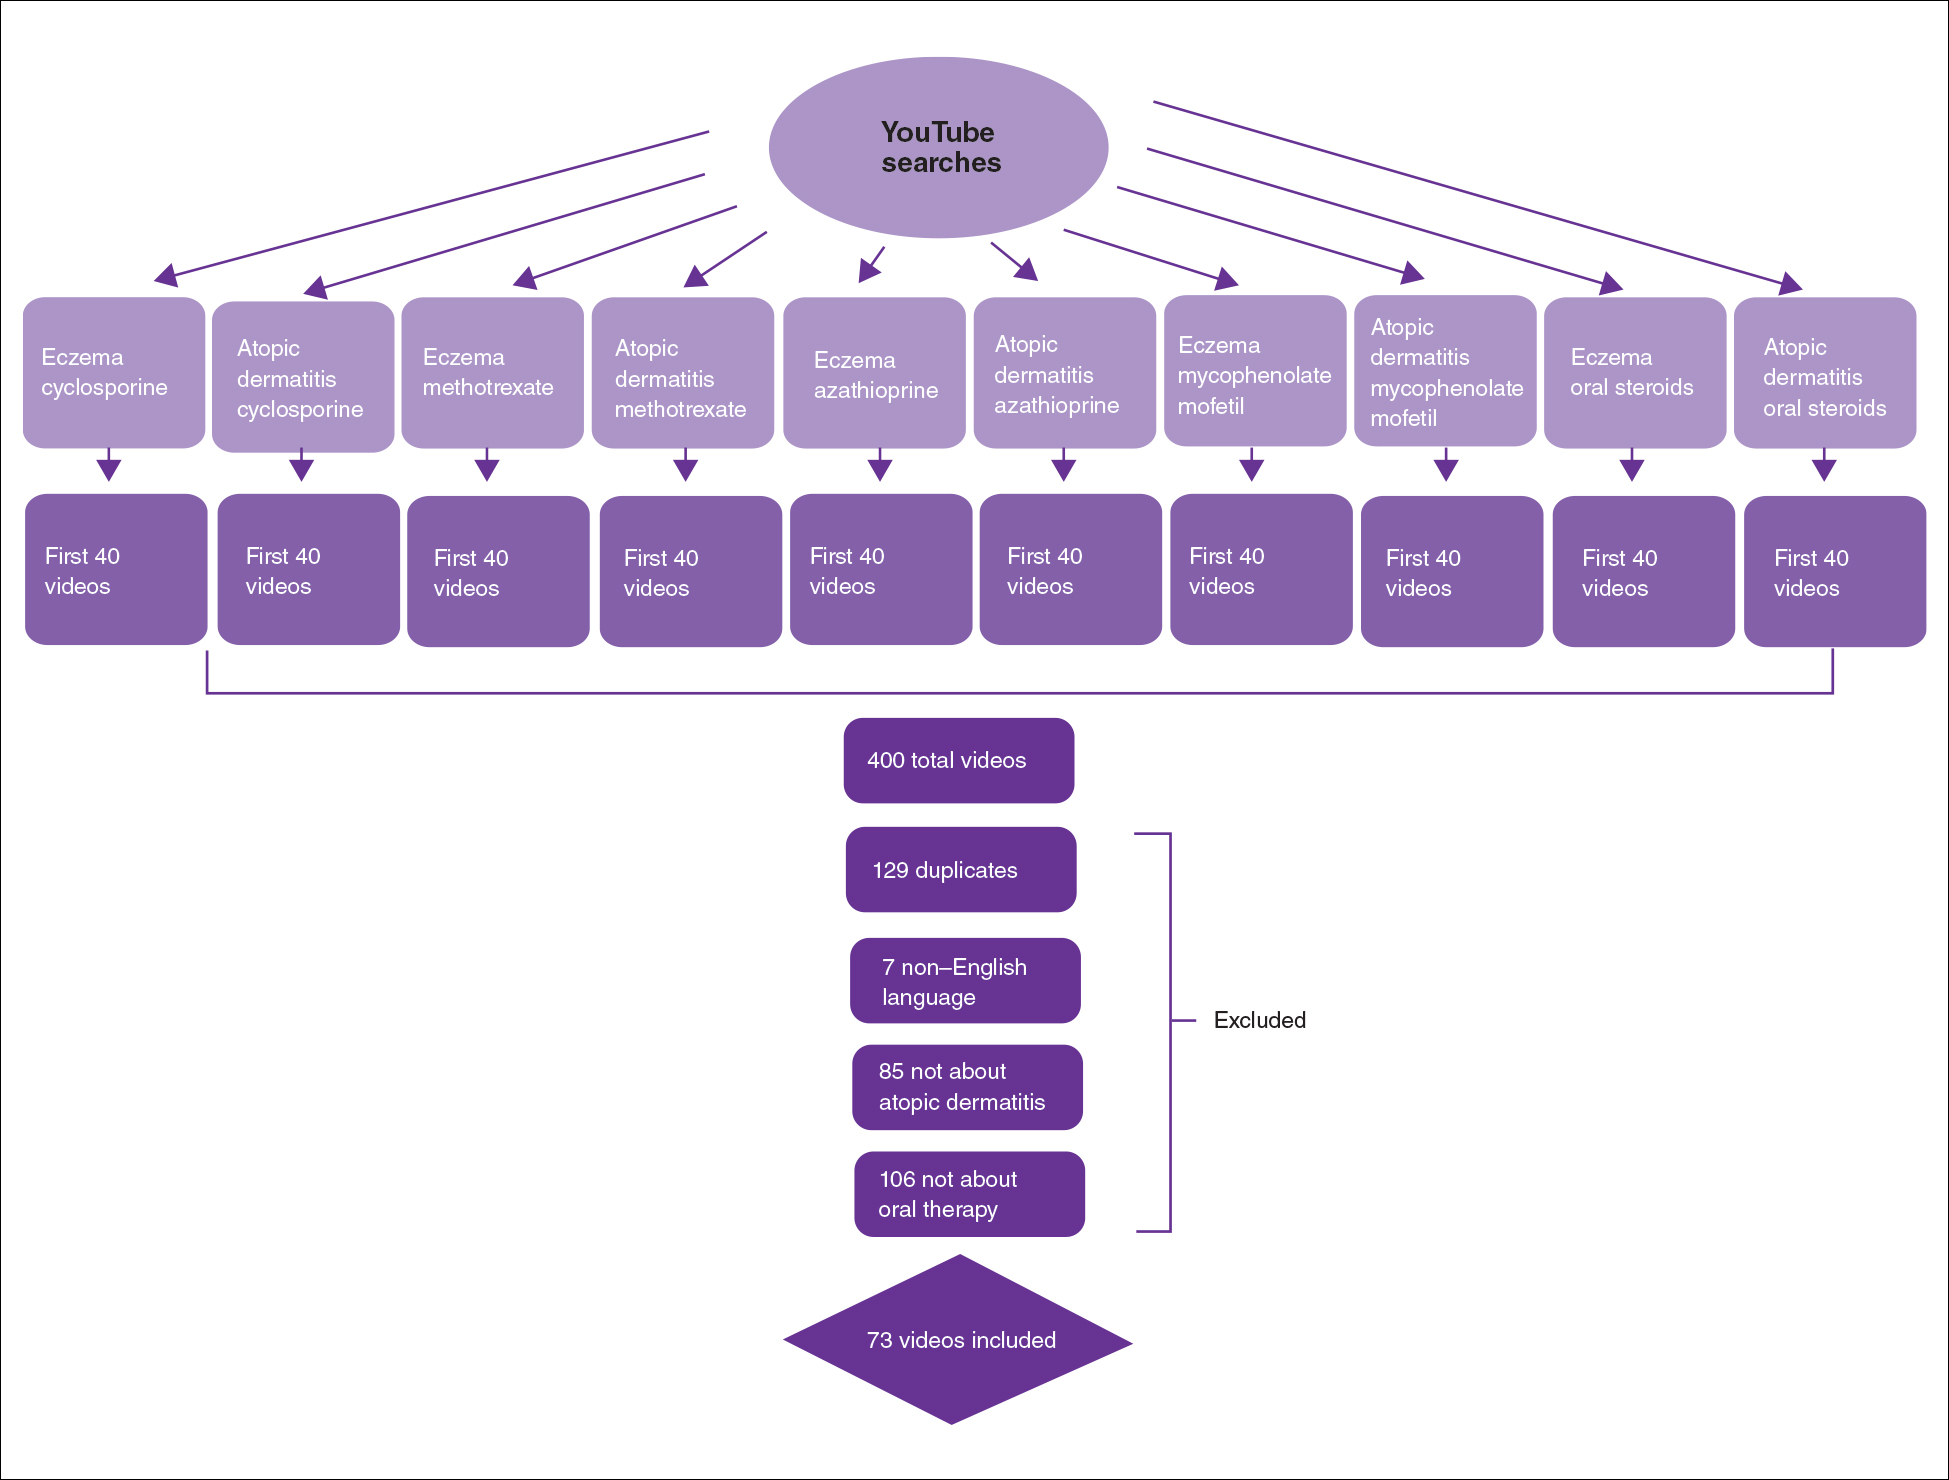
The major topics addressed in the videos were symptomatic changes (63 [68.8% of all topics discussed]), adverse effects (52 [67.5%]), and quality-of-life changes (37 [48.1%]). Of the videos included, the majority (42/73 [57.5%]) contained a neutral tone about the medication, citing advantages and disadvantages with therapy, while 22 of 73 (30.1%) had an encouraging tone, and 9 of 73 (12.3%) had a discouraging tone. Regarding videos with positive tones, there were 17 videos on cyclosporine, 9 on azathioprine, 7 on methotrexate, 4 on oral steroids, and 2 on mycophenolate mofetil. Regarding videos with negative tones, there were 4 on cyclosporine, 3 on azathioprine, 2 on methotrexate, and 2 on mycophenolate mofetil.
Of the videos made with financial interest, the majority (28/34 [77.8%]) were more suitable for informing health care providers rather than patients, containing jargon as well as complex information on clinical trials, dosing, and mechanisms of action. From the videos discussing clinical recommendations, there were 9 of 73 (12.3%) Grade A recommendations (eg, citing evidence-based information and clinical trials) and 64 of 73 (87.7%) Grade B recommendations (eg, anecdotal information on patient experience). Thirty-seven of 73 (50.7%) videos were evidence based, and 36 of 73 (49.3%) were non–evidence based. Six videos were patient-oriented news broadcasts.
Patient-generated testimonials had the most views (mean, 9238.4) and highest interaction ratio (the sum of likes, dislikes, and comments divided by the number of views)(mean, 0.027), while health care provider–generated videos had fewer views (mean, 9218.7) and a lower interaction ratio (mean, 0.011). Financial-based videos had 4233.4 views on average, with an average interaction ratio of 0.014. Based on these results, biased, patient-generated content comprised greater than 50% of YouTube videos about oral therapies for atopic dermatitis and was quite likely to be engaged with by users. Thus, these patient testimonials have great potential to affect decision-making.
The high number of patient-generated videos about oral therapies was consistent with prior studies of YouTube videos about therapies for numerous conditions.11-13 Dermatologists should consider utilizing YouTube for providing evidence-based, patient-oriented information about novel therapeutics. They may consider collaborating with patients to assist with their creation of YouTube videos and directing patients to credible resources by the American Academy of Dermatology and Canadian Dermatology Association for decision-making.
Importantly, this analysis is limited by its lack of quality-assessment tools for video-based resources such as JAMA score and DISCERN score.14,15 However, these metrics have limited ability to evaluate audiovisual elements, indicating the need for novel tools to score their validity.
- Fox S, Duggan M. Health online 2013. January 15, 2013. Accessed August 15, 2021. https://www.pewresearch.org/internet/2013/01/15/health-online-2013/
- Ní Ríordáin R, McCreary C. Dental patients’ use of the Internet. Br Dent J. 2009;207:583-586, 575.
- Fergie G, Hilton S, Hunt K. Young adults’ experiences of seeking online information about diabetes and mental health in the age of social media. Health Expect. 2016;19:1324-1335.
- Antheunis ML, Tates K, Nieboer TE. Patients’ and health professionals’ use of social media in health care: motives, barriers and expectations. Patient Educ Couns. 2013;92:426-431.
- McGregor F, Somner JE, Bourne RR, et al. Social media use by patients with glaucoma: what can we learn? Ophthalmic Physiol Opt. 2014;34:46-52.
- YouTube Statistics—15 Amazing Stats for 2015. Published April 30, 2015. Accessed August 27, 2021. YouTube.com/watch?v=9ZLBSPzY7GQ
- Health Research Institute. Social media “likes” healthcare: from marketing to social business. April 2012. Accessed August 15, 2021. https://www.pwc.com/us/en/health-industries/health-research-institute/publications/pdf/health-care-social-media-report.pdf
- Zhou R, Khemmarat S, Gao L, et al. How YouTube videos are discovered and its impact on videos views. Multimed Tools Appl. 2016;75:6035-6058.
- Haslam K, Doucette H, Hachey S, et al. YouTube videos as health decision aids for the public: an integrative review. Can J Dent Hyg. 2019;53:53-66.
- Pithadia D, Reynolds K, Lee E, et al. Dupilumab for atopic dermatitis: what are patients learning on YouTube [published online ahead of print April 16,2020]? J Dermatolog Treat. doi: 10.1080/09546634.2020.1755418
- Tolu S, Yurdakul OV, Basaran B, et al. English-language videos on YouTube as a source of information on self-administer subcutaneous anti-tumour necrosis factor agent injections. Rheumatol Int. 2018;38:1285-1292.
- Reynolds KA, Pithadia DJ, Lee EB, et al. A cross-sectional study of YouTube videos about psoriasis biologics. Int J Dermatol. 2019;58:E61-E62.
- Kocyigit BF, Akaltun MS. Does YouTube provide high quality information? assessment of secukinumab videos. Rheumatol Int. 2019;39:1263-1268.
- Qi J, Trang T, Doong J, et al. Misinformation is prevalent in psoriasis-related YouTube videos. Dermatol Online J. 2016;22:13030/qt7qc9z2m5
- Gokcen HB, Gumussuyu G. A quality analysis of disc herniation videos on YouTube. World Neurosurg. 2019;124:E799-E804.
To the Editor:
Oral immunosuppressive therapies are prescribed for moderate to severe atopic dermatitis. Patients often consult YouTube to make informed decisions about these therapies. In the United States, most health-related online searches are initiated through a search engine, which frequently leads to social media sites such as YouTube. Recent studies have examined the reasons why users turn to the Internet for health-related information, indicating that users typically seek specific information regarding health concerns.1,2 Furthermore, social media platforms such as YouTube are a popular means of sharing health information with the public.3-5 Currently, YouTube has more than 1 billion registered users, and 30 million health-related videos are watched each day.6 Almost one-third of US consumers use YouTube, Facebook, and Twitter to obtain medical information.7 YouTube is a versatile tool because of its video-discovery mechanisms such as a keyword-based search engine, video-recommendation system, highlight feature for videos on home pages, and the capacity to embed YouTube videos on various web pages.8 Searchers use videos that are short, fast paced, emotion evoking, from credible sources, recently uploaded, and relevant to the searcher for aiding in health decisions.9 Furthermore, studies have demonstrated YouTube’s capacity to support a change in attitude and increase users’ knowledge. In fact, YouTube had higher impact on recall, attitudes, and behaviors when compared with written materials on other social media platforms, such as Facebook and Twitter.9 We conducted a cross-sectional study to examine the quality of YouTube videos on oral therapies for atopic dermatitis, such as cyclosporine, methotrexate, azathioprine, and mycophenolate mofetil.
On April 23, 2020, we performed 8 searches using a private browser with default filters on YouTube (Figure). Injectables were not included in the analysis, as the YouTube experience on dupilumab previously has been investigated.10 The top 40 videos from each search were screened by 3 researchers. Duplicates, non–English-language videos, and videos that did not discuss atopic dermatitis or oral therapies were excluded, resulting in 73 videos included in this analysis. Testimonials generated by patients made up 39 of 73 (53.4%) videos. Health care professionals created 23 of 73 (31.5%) videos, and educators with financial interest created 11 of 73 (15.1%) videos. The dates of production for the videos spanned from 2008 to 2020.
The major topics addressed in the videos were symptomatic changes (63 [68.8% of all topics discussed]), adverse effects (52 [67.5%]), and quality-of-life changes (37 [48.1%]). Of the videos included, the majority (42/73 [57.5%]) contained a neutral tone about the medication, citing advantages and disadvantages with therapy, while 22 of 73 (30.1%) had an encouraging tone, and 9 of 73 (12.3%) had a discouraging tone. Regarding videos with positive tones, there were 17 videos on cyclosporine, 9 on azathioprine, 7 on methotrexate, 4 on oral steroids, and 2 on mycophenolate mofetil. Regarding videos with negative tones, there were 4 on cyclosporine, 3 on azathioprine, 2 on methotrexate, and 2 on mycophenolate mofetil.
Of the videos made with financial interest, the majority (28/34 [77.8%]) were more suitable for informing health care providers rather than patients, containing jargon as well as complex information on clinical trials, dosing, and mechanisms of action. From the videos discussing clinical recommendations, there were 9 of 73 (12.3%) Grade A recommendations (eg, citing evidence-based information and clinical trials) and 64 of 73 (87.7%) Grade B recommendations (eg, anecdotal information on patient experience). Thirty-seven of 73 (50.7%) videos were evidence based, and 36 of 73 (49.3%) were non–evidence based. Six videos were patient-oriented news broadcasts.
Patient-generated testimonials had the most views (mean, 9238.4) and highest interaction ratio (the sum of likes, dislikes, and comments divided by the number of views)(mean, 0.027), while health care provider–generated videos had fewer views (mean, 9218.7) and a lower interaction ratio (mean, 0.011). Financial-based videos had 4233.4 views on average, with an average interaction ratio of 0.014. Based on these results, biased, patient-generated content comprised greater than 50% of YouTube videos about oral therapies for atopic dermatitis and was quite likely to be engaged with by users. Thus, these patient testimonials have great potential to affect decision-making.
The high number of patient-generated videos about oral therapies was consistent with prior studies of YouTube videos about therapies for numerous conditions.11-13 Dermatologists should consider utilizing YouTube for providing evidence-based, patient-oriented information about novel therapeutics. They may consider collaborating with patients to assist with their creation of YouTube videos and directing patients to credible resources by the American Academy of Dermatology and Canadian Dermatology Association for decision-making.
Importantly, this analysis is limited by its lack of quality-assessment tools for video-based resources such as JAMA score and DISCERN score.14,15 However, these metrics have limited ability to evaluate audiovisual elements, indicating the need for novel tools to score their validity.
- Fox S, Duggan M. Health online 2013. January 15, 2013. Accessed August 15, 2021. https://www.pewresearch.org/internet/2013/01/15/health-online-2013/
- Ní Ríordáin R, McCreary C. Dental patients’ use of the Internet. Br Dent J. 2009;207:583-586, 575.
- Fergie G, Hilton S, Hunt K. Young adults’ experiences of seeking online information about diabetes and mental health in the age of social media. Health Expect. 2016;19:1324-1335.
- Antheunis ML, Tates K, Nieboer TE. Patients’ and health professionals’ use of social media in health care: motives, barriers and expectations. Patient Educ Couns. 2013;92:426-431.
- McGregor F, Somner JE, Bourne RR, et al. Social media use by patients with glaucoma: what can we learn? Ophthalmic Physiol Opt. 2014;34:46-52.
- YouTube Statistics—15 Amazing Stats for 2015. Published April 30, 2015. Accessed August 27, 2021. YouTube.com/watch?v=9ZLBSPzY7GQ
- Health Research Institute. Social media “likes” healthcare: from marketing to social business. April 2012. Accessed August 15, 2021. https://www.pwc.com/us/en/health-industries/health-research-institute/publications/pdf/health-care-social-media-report.pdf
- Zhou R, Khemmarat S, Gao L, et al. How YouTube videos are discovered and its impact on videos views. Multimed Tools Appl. 2016;75:6035-6058.
- Haslam K, Doucette H, Hachey S, et al. YouTube videos as health decision aids for the public: an integrative review. Can J Dent Hyg. 2019;53:53-66.
- Pithadia D, Reynolds K, Lee E, et al. Dupilumab for atopic dermatitis: what are patients learning on YouTube [published online ahead of print April 16,2020]? J Dermatolog Treat. doi: 10.1080/09546634.2020.1755418
- Tolu S, Yurdakul OV, Basaran B, et al. English-language videos on YouTube as a source of information on self-administer subcutaneous anti-tumour necrosis factor agent injections. Rheumatol Int. 2018;38:1285-1292.
- Reynolds KA, Pithadia DJ, Lee EB, et al. A cross-sectional study of YouTube videos about psoriasis biologics. Int J Dermatol. 2019;58:E61-E62.
- Kocyigit BF, Akaltun MS. Does YouTube provide high quality information? assessment of secukinumab videos. Rheumatol Int. 2019;39:1263-1268.
- Qi J, Trang T, Doong J, et al. Misinformation is prevalent in psoriasis-related YouTube videos. Dermatol Online J. 2016;22:13030/qt7qc9z2m5
- Gokcen HB, Gumussuyu G. A quality analysis of disc herniation videos on YouTube. World Neurosurg. 2019;124:E799-E804.
Practice Points
- Patient-based YouTube videos comprised the majority of videos on oral therapies for atopic dermatitis, with the greatest views and interaction ratio.
- Most YouTube videos on this topic contained a neutral tone and Grade B recommendations, thus meriting production of more evidence-based videos in collaboration with patients on the YouTube platform.
Atopic Dermatitis Topical Therapies: Study of YouTube Videos as a Source of Patient Information
To the Editor:
Atopic dermatitis (eczema) affects approximately 20% of children worldwide.1 In atopic dermatitis management, patient education is crucial for optimal outcomes.2 The COVID-19 pandemic has impacted patient-physician interactions. To ensure safety of patients and physicians, visits may have been canceled, postponed, or conducted virtually, leaving less time for discussion and questions.3 As a consequence, patients may seek information about atopic dermatitis from alternative sources, including YouTube videos. We performed a cross-sectional study to analyze YouTube videos about topical treatments for atopic dermatitis.
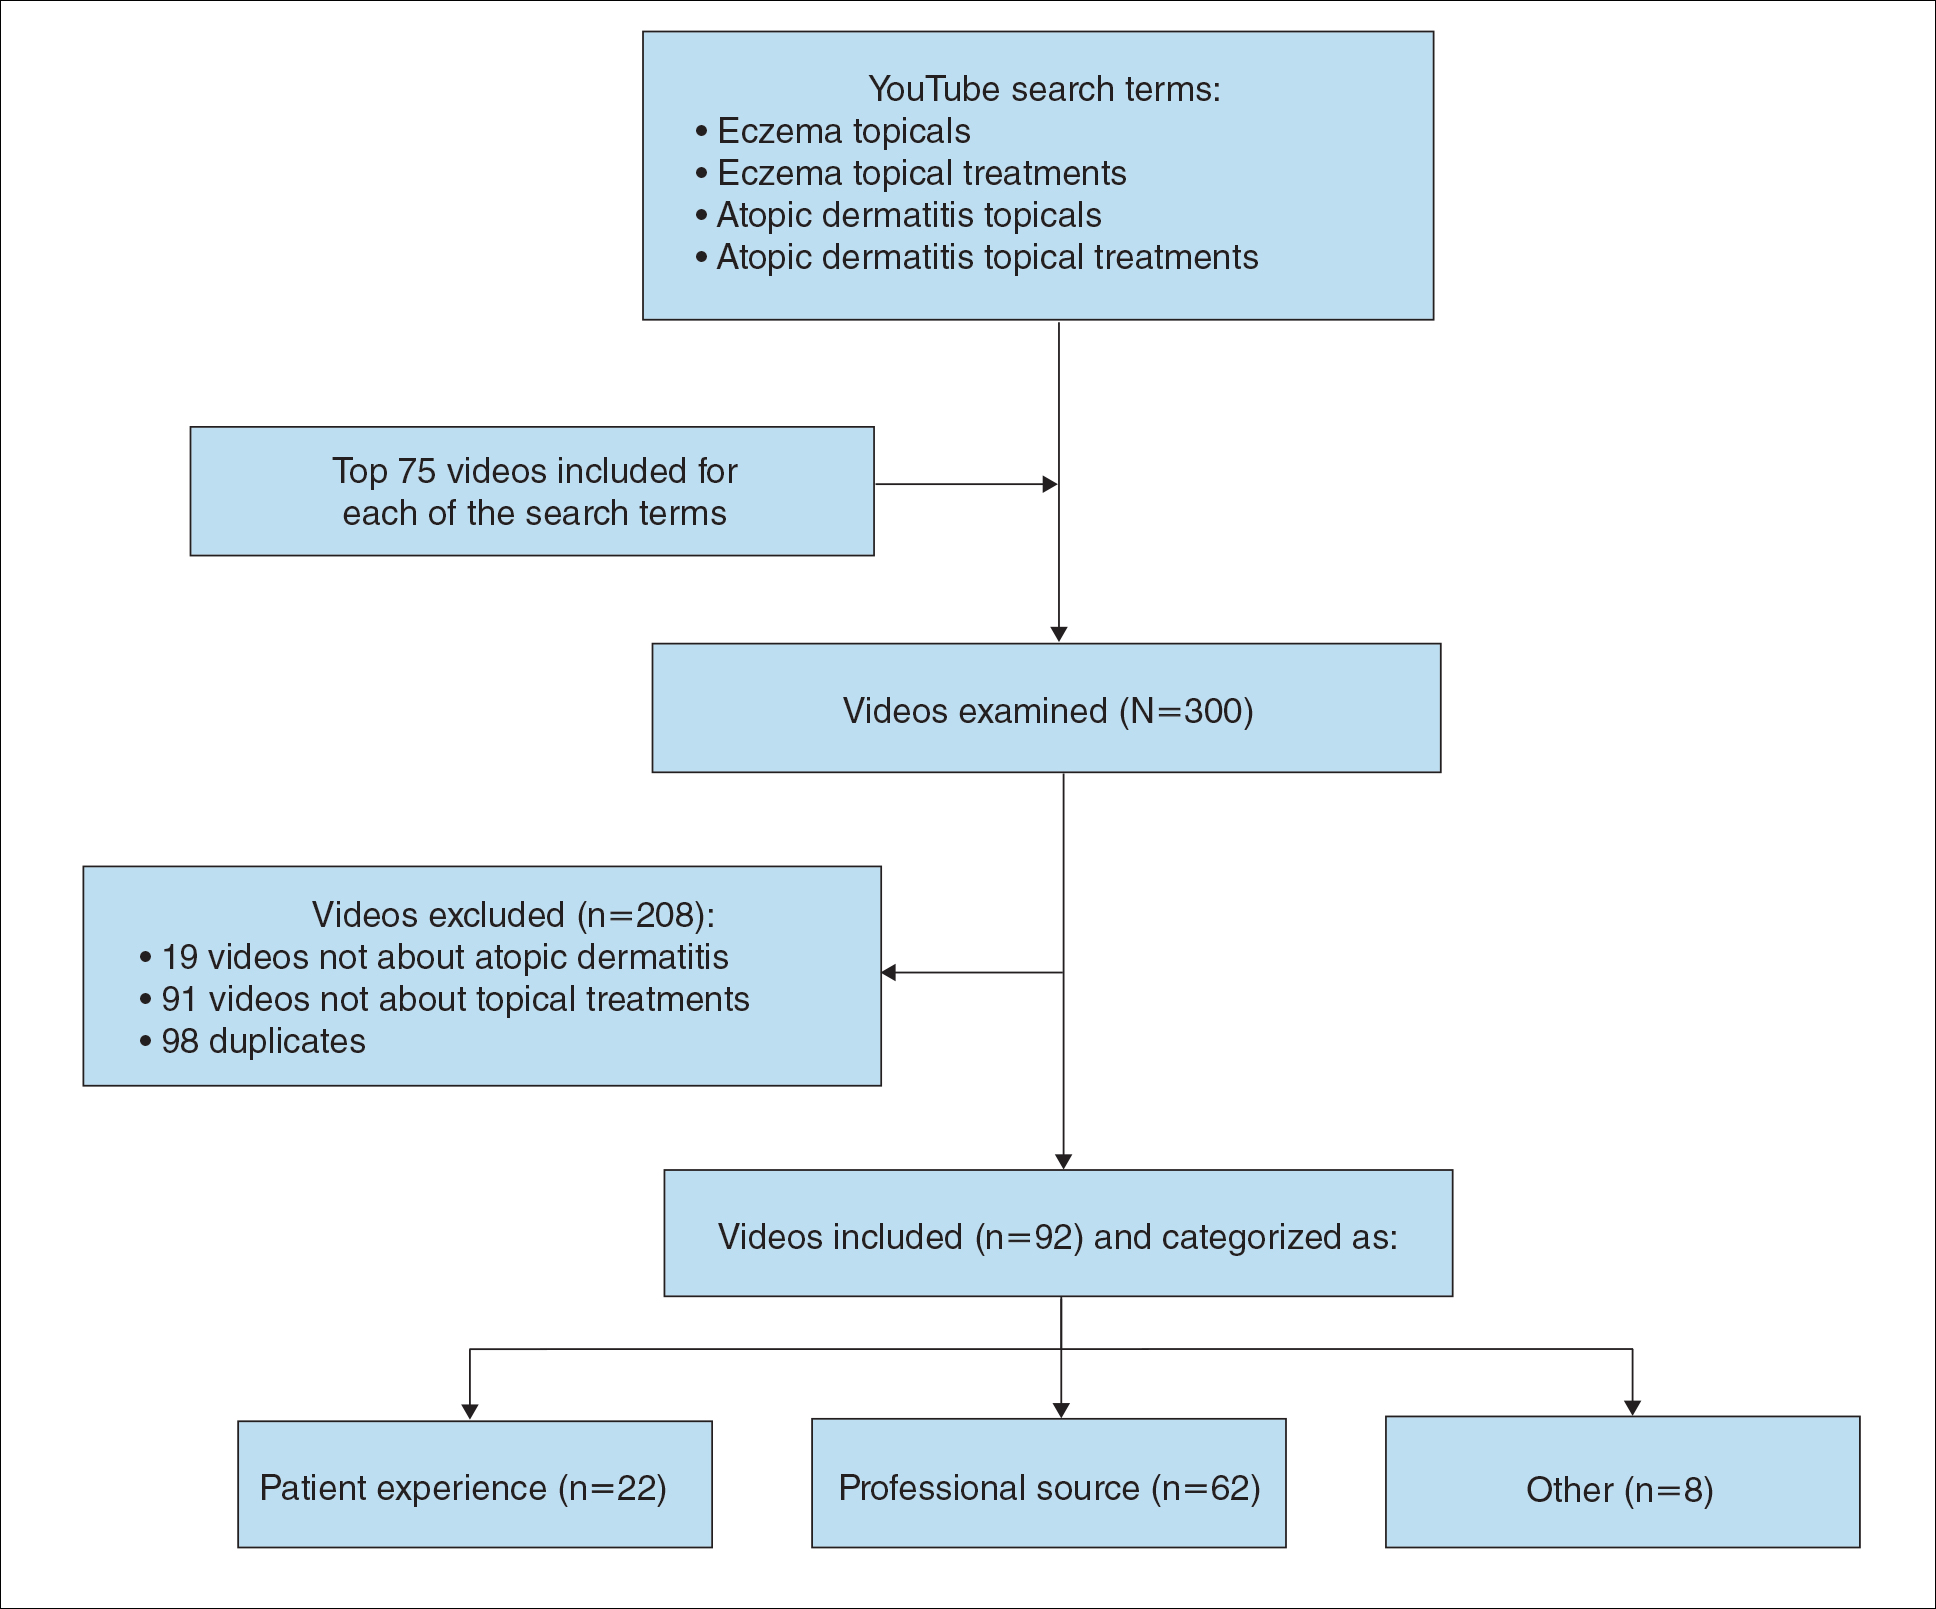
During the week of July 16, 2020, we performed 4 private browser YouTube searches with default filters using the following terms: eczema topicals, eczema topical treatments, atopic dermatitis topicals, and atopic dermatitis topical treatments. For video selection, we defined topical treatments as topical corticosteroids, topical calcineurin inhibitors, crisaborole, emollients, wet wraps, and any prospective treatment topically administered. For each of the 4 searches, 2 researchers (A.M. and A.T.) independently examined the top 75 videos, yielding a total of 300 videos. Of them, 98 videos were duplicates, 19 videos were not about atopic dermatitis, and 91 videos were not about topical treatments, leaving a total of 92 videos for analysis (Figure 1).
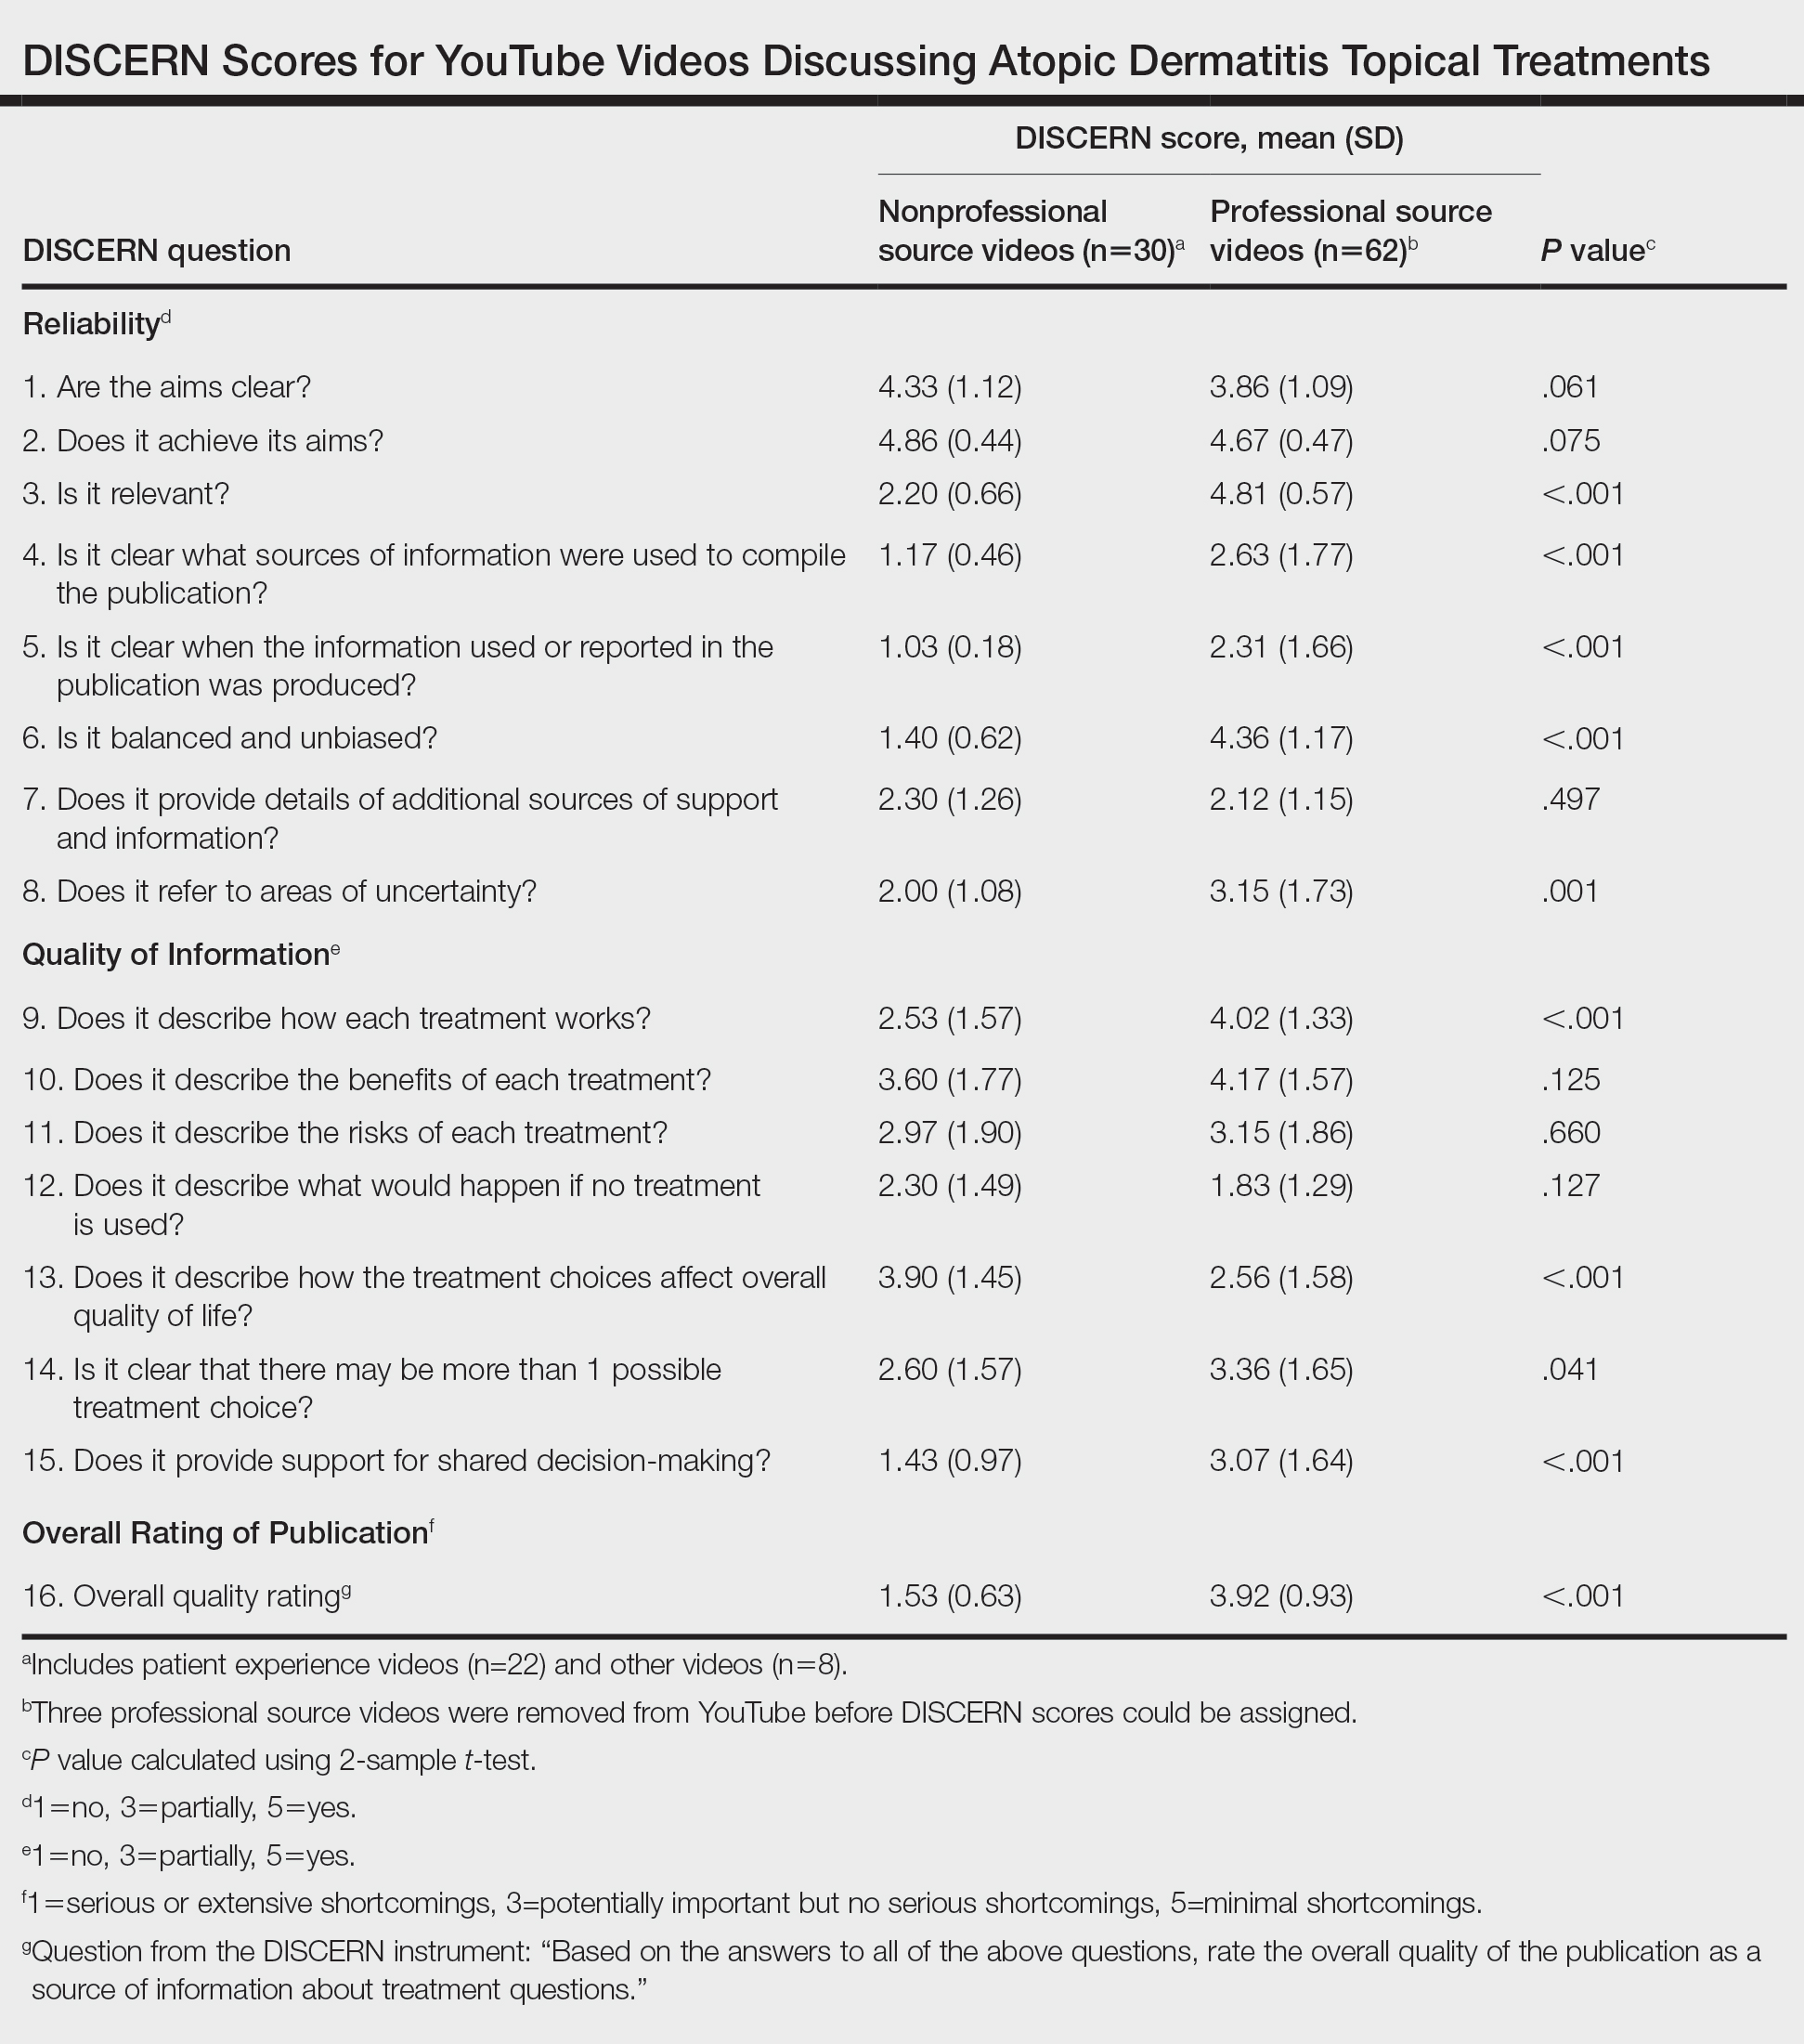
For the 92 included videos, the length; upload year; number of views, likes, dislikes, and comments; interaction ratio (IR)(the sum of likes, dislikes, and comments divided by the number of views); and video content were determined. The videos were placed into mutually exclusive categories as follows: (1) patient experience, defined as a video about patient perspective; (2) professional source, defined as a video featuring a physician, physician extender, pharmacist, or scientist, or produced by a formal organization; or (3) other. The DISCERN Instrument was used for grading the reliability and quality of the 92 included videos. This instrument consists of 16 questions with the responses rated on a scale of 1 to 5.4 For analysis of DISCERN scores, patient experience and other videos were grouped together as nonprofessional source videos. A 2-sample t-test was used to compare DISCERN scores between professional source and nonprofessional source videos.
Most videos were uploaded in 2017 (n=19), 2018 (n=23), and 2019 (n=25), but 20 were uploaded in 2012-2016 and 5 were uploaded in 2020. The 92 videos had a mean length of 8 minutes and 35 seconds (range, 30 seconds to 62 minutes and 23 seconds).
Patient experience videos accounted for 23.9% (n=22) of videos. These videos discussed topical steroid withdrawal (TSW)(n=16), instructions for making emollients (n=2), and treatment successes (n=4). Professional source videos represented 67.4% (n=62) of videos. Of them, 40.3% (n=25) were physician oriented, defined as having extensive medical terminology or qualifying for continuing medical education credit. Three (4.8%) of the professional source videos were sponsored by a drug company. Other constituted the remaining 8.7% (n=8) of videos. Patient experience videos had more views (median views [interquartile range], 6865 [10,307]) and higher engagement (median IR [interquartile range], 0.038 [0.022]) than professional source videos (views: median views [interquartile range], 1052.5 [10,610.5]; engagement: median IR [interquartile range], 0.006 [0.008]).
Although less popular, professional source videos had a significantly higher DISCERN overall quality rating score (question 16) compared to those categorized as nonprofessional source (3.92 vs 1.53; P<.001). In contrast, nonprofessional source videos scored significantly higher on the quality-of-life question (question 13) compared to professional source videos (3.90 vs 2.56; P<.001)(eTable). (Three professional source videos were removed from YouTube before DISCERN scores could be assigned.)
Notably, 20.7% (n=19) of the 92 videos discussed TSW, and most of them were patient experiences (n=16). Other categories included topical steroids excluding TSW (n=11), steroid phobia (n=2), topical calcineurin inhibitors (n=2), crisaborole (n=6), news broadcast (n=7), wet wraps (n=5), product advertisement (n=7), and research (n=11)(Figure 2). Interestingly, there were no videos focusing on the calcineurin inhibitor black box warning.

Similar to prior studies, our results indicate preference for patient-generated videos over videos produced by or including a professional source.5 Additionally, only 3 of 19 videos about TSW were from a professional source, increasing the potential for patient misconceptions about topical corticosteroids. Future studies should examine the educational impact of patient-generated videos as well as features that make the patient experience videos more desirable for viewing.
- Mueller SM, Hongler VNS, Jungo P, et al. Fiction, falsehoods, and few facts: cross-sectional study on the content-related quality of atopic eczema-related videos on YouTube. J Med Internet Res. 2020;22:e15599. doi:10.2196/15599
- Torres T, Ferreira EO, Gonçalo M, et al. Update on atopic dermatitis. Acta Med Port. 2019;32:606-613. doi:10.20344/amp.11963
- Vogler SA, Lightner AL. Rethinking how we care for our patients in a time of social distancing during the COVID-19 pandemic. Br J Surg. 2020;107:937-939. doi:10.1002/bjs.11636
- The DISCERN Instrument. discern online. Accessed January 22, 2021. http://www.discern.org.uk/discern_instrument.php
- Pithadia DJ, Reynolds KA, Lee EB, et al. Dupilumab for atopic dermatitis: what are patients learning on YouTube? [published online April 16, 2020]. J Dermatolog Treat. doi:10.1080/09546634.2020.1755418
To the Editor:
Atopic dermatitis (eczema) affects approximately 20% of children worldwide.1 In atopic dermatitis management, patient education is crucial for optimal outcomes.2 The COVID-19 pandemic has impacted patient-physician interactions. To ensure safety of patients and physicians, visits may have been canceled, postponed, or conducted virtually, leaving less time for discussion and questions.3 As a consequence, patients may seek information about atopic dermatitis from alternative sources, including YouTube videos. We performed a cross-sectional study to analyze YouTube videos about topical treatments for atopic dermatitis.
During the week of July 16, 2020, we performed 4 private browser YouTube searches with default filters using the following terms: eczema topicals, eczema topical treatments, atopic dermatitis topicals, and atopic dermatitis topical treatments. For video selection, we defined topical treatments as topical corticosteroids, topical calcineurin inhibitors, crisaborole, emollients, wet wraps, and any prospective treatment topically administered. For each of the 4 searches, 2 researchers (A.M. and A.T.) independently examined the top 75 videos, yielding a total of 300 videos. Of them, 98 videos were duplicates, 19 videos were not about atopic dermatitis, and 91 videos were not about topical treatments, leaving a total of 92 videos for analysis (Figure 1).
For the 92 included videos, the length; upload year; number of views, likes, dislikes, and comments; interaction ratio (IR)(the sum of likes, dislikes, and comments divided by the number of views); and video content were determined. The videos were placed into mutually exclusive categories as follows: (1) patient experience, defined as a video about patient perspective; (2) professional source, defined as a video featuring a physician, physician extender, pharmacist, or scientist, or produced by a formal organization; or (3) other. The DISCERN Instrument was used for grading the reliability and quality of the 92 included videos. This instrument consists of 16 questions with the responses rated on a scale of 1 to 5.4 For analysis of DISCERN scores, patient experience and other videos were grouped together as nonprofessional source videos. A 2-sample t-test was used to compare DISCERN scores between professional source and nonprofessional source videos.
Most videos were uploaded in 2017 (n=19), 2018 (n=23), and 2019 (n=25), but 20 were uploaded in 2012-2016 and 5 were uploaded in 2020. The 92 videos had a mean length of 8 minutes and 35 seconds (range, 30 seconds to 62 minutes and 23 seconds).
Patient experience videos accounted for 23.9% (n=22) of videos. These videos discussed topical steroid withdrawal (TSW)(n=16), instructions for making emollients (n=2), and treatment successes (n=4). Professional source videos represented 67.4% (n=62) of videos. Of them, 40.3% (n=25) were physician oriented, defined as having extensive medical terminology or qualifying for continuing medical education credit. Three (4.8%) of the professional source videos were sponsored by a drug company. Other constituted the remaining 8.7% (n=8) of videos. Patient experience videos had more views (median views [interquartile range], 6865 [10,307]) and higher engagement (median IR [interquartile range], 0.038 [0.022]) than professional source videos (views: median views [interquartile range], 1052.5 [10,610.5]; engagement: median IR [interquartile range], 0.006 [0.008]).
Although less popular, professional source videos had a significantly higher DISCERN overall quality rating score (question 16) compared to those categorized as nonprofessional source (3.92 vs 1.53; P<.001). In contrast, nonprofessional source videos scored significantly higher on the quality-of-life question (question 13) compared to professional source videos (3.90 vs 2.56; P<.001)(eTable). (Three professional source videos were removed from YouTube before DISCERN scores could be assigned.)
Notably, 20.7% (n=19) of the 92 videos discussed TSW, and most of them were patient experiences (n=16). Other categories included topical steroids excluding TSW (n=11), steroid phobia (n=2), topical calcineurin inhibitors (n=2), crisaborole (n=6), news broadcast (n=7), wet wraps (n=5), product advertisement (n=7), and research (n=11)(Figure 2). Interestingly, there were no videos focusing on the calcineurin inhibitor black box warning.
Similar to prior studies, our results indicate preference for patient-generated videos over videos produced by or including a professional source.5 Additionally, only 3 of 19 videos about TSW were from a professional source, increasing the potential for patient misconceptions about topical corticosteroids. Future studies should examine the educational impact of patient-generated videos as well as features that make the patient experience videos more desirable for viewing.
- Mueller SM, Hongler VNS, Jungo P, et al. Fiction, falsehoods, and few facts: cross-sectional study on the content-related quality of atopic eczema-related videos on YouTube. J Med Internet Res. 2020;22:e15599. doi:10.2196/15599
- Torres T, Ferreira EO, Gonçalo M, et al. Update on atopic dermatitis. Acta Med Port. 2019;32:606-613. doi:10.20344/amp.11963
- Vogler SA, Lightner AL. Rethinking how we care for our patients in a time of social distancing during the COVID-19 pandemic. Br J Surg. 2020;107:937-939. doi:10.1002/bjs.11636
- The DISCERN Instrument. discern online. Accessed January 22, 2021. http://www.discern.org.uk/discern_instrument.php
- Pithadia DJ, Reynolds KA, Lee EB, et al. Dupilumab for atopic dermatitis: what are patients learning on YouTube? [published online April 16, 2020]. J Dermatolog Treat. doi:10.1080/09546634.2020.1755418
Practice Points
- YouTube is a readily accessible resource for educating patients about topical treatments for atopic dermatitis.
- Although professional source videos comprised a larger percentage of the videos included within our study, patient experience videos had a higher number of views and engagement.
- Twenty-one percent (19/92) of the videos examined in our study discussed topical steroid withdrawal, and the majority of them were patient experience videos.
Antiviral Therapy Improves Hepatocellular Cancer Survival
Hepatocellular cancer (HCC) is the most common type of hepatic cancers, accounting for 65% of all hepatic cancers.1 Among all cancers, HCC is one of the fastest growing causes of death in the United States, and the rate of new HCC cases are on the rise over several decades.2 There are many risk factors leading to HCC, including alcohol use, obesity, and smoking. Infection with hepatitis C virus (HCV) poses a significant risk.1
The pathogenesis of HCV-induced carcinogenesis is mediated by a unique host-induced immunologic response. Viral replication induces production of inflammatory factors, such as tumor necrosis factor (TNF-α), interferon (IFN), and oxidative stress on hepatocytes, resulting in cell injury, death, and regeneration. Repetitive cycles of cellular death and regeneration induce fibrosis, which may lead to cirrhosis.3 Hence, early treatment of HCV infection and achieving sustained virologic response (SVR) may lead to decreased incidence and mortality associated with HCC.
Treatment of HCV infection has become more effective with the development of direct-acting antivirals (DAAs) leading to SVR in > 90% of patients compared with 40 to 50% with IFN-based treatment.4,5 DAAs have been proved safe and highly effective in eradicating HCV infection even in patients with advanced liver disease with decompensated cirrhosis.6 Although achieving SVR indicates a complete cure from chronic HCV infection, several studies have shown subsequent risk of developing HCC persists even after successful HCV treatment.7-9 Some studies show that using DAAs to achieve SVR in patients with HCV infection leads to a decreased relative risk of HCC development compared with patients who do not receive treatment.10-12 But data on HCC risk following DAA-induced SVR vs IFN-induced SVR are somewhat conflicting.
Much of the information regarding the association between SVR and HCC has been gleaned from large data banks without accounting for individual patient characteristics that can be obtained through full chart review. Due to small sample sizes in many chart review studies, the impact that SVR from DAA therapy has on the progression and severity of HCC is not entirely clear. The aim of our study is to evaluate the effect of HCV treatment and SVR status on overall survival (OS) in patients with HCC. Second, we aim to compare survival benefits, if any exist, among the 2 major HCV treatment modalities (IFN vs DAA).
Methods
We performed a retrospective review of patients at Memphis Veterans Affairs Medical Center (VAMC) in Tennessee to determine whether treatment for HCV infection in general, and achieving SVR in particular, makes a difference in progression, recurrence, or OS among patients with HCV infection who develop HCC. We identified 111 patients with a diagnosis of both HCV and new or recurrent HCC lesions from November 2008 to March 2019 (Table 1). We divided these patients based on their HCV treatment status, SVR status, and treatment types (IFN vs DAA).
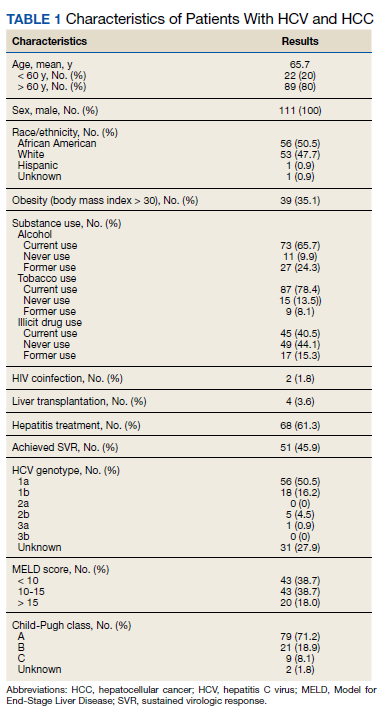
The inclusion criteria were patients aged > 18 years treated at the Memphis VAMC who have HCV infection and developed HCC. Exclusion criteria were patients who developed HCC from other causes such as alcoholic steatohepatitis, hepatitis B virus infection, hemochromatosis, patients without HCV infection, and patients who were not established at the Memphis VAMC. This protocol was approved by the Memphis VAMC Institutional Review Board.
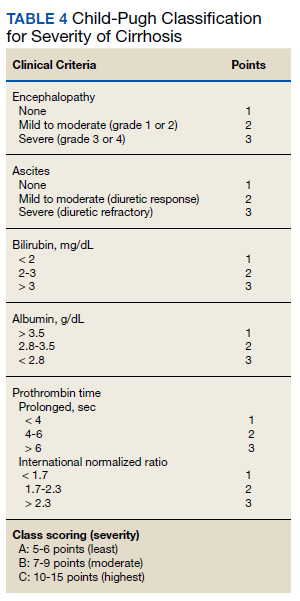
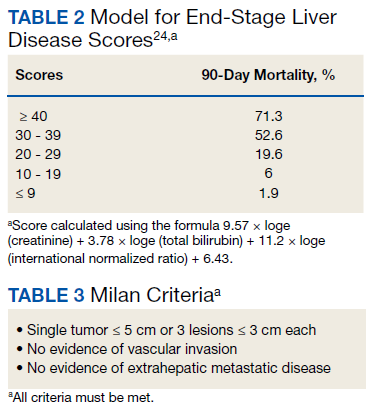
HCC diagnosis was determined using International Classification of Diseases codes (9th revision: 155 and 155.2; 10th revision: CD 22 and 22.9). We also used records of multidisciplinary gastrointestinal malignancy tumor conferences to identify patient who had been diagnosed and treated for HCV infection. We identified patients who were treated with DAA vs IFN as well as patients who had achieved SVR (classified as having negative HCV RNA tests at the end of DAA treatment). We were unable to evaluate Barcelona Clinic Liver Cancer staging since this required documented performance status that was not available in many patient records. We selected cases consistent with both treatment for HCV infection and subsequent development of HCC. Patient data included age; OS time; HIV status HCV genotype; time and status of progression to HCC; type and duration of treatment; and alcohol, tobacco, and drug use. Disease status was measured using the Model for End-Stage Liver Disease (MELD) score (Table 2), Milan criteria (Table 3), and Child-Pugh score (Table 4).
Statistical Analysis
OS was measured from the date of HCC diagnosis to the date of death or last follow-up. Progression-free survival (PFS) was defined from the date of HCC treatment initiation to the date of first HCC recurrence. We compared survival data for the SVR and non-SVR subgroups, the HCV treatment vs non-HCV treatment subgroups, and the IFN therapy vs DAA therapy subgroups, using the Kaplan-Meier method. The differences between subgroups were assessed using a log-rank test. Multivariate analysis using Cox proportional hazards regression model was used to identify factors that had significant impact on OS. Those factors included age; race; alcohol, tobacco, and illicit drug use; SVR status; HCV treatment status; IFN-based regimen vs DAA; MELD, and Child-Pugh scores. The results were expressed as hazard ratios (HRs) and 95% CI. Calculations were made using Statistical Analysis SAS and IBM SPSS software.
Results
The study included 111 patients. The mean age was 65.7 years; all were male and half of were Black patients. The gender imbalance was due to the predominantly male patient population at Memphis VAMC. Among 111 patients with HCV infection and HCC, 68 patients were treated for HCV infection and had significantly improved OS and PFS compared with the nontreatment group. The median 5-year OS was 44.6 months (95% CI, 966-3202) in the treated HCV infection group compared with 15.1 months in the untreated HCV infection group with a Wilcoxon P = .0005 (Figure 1). Similarly, patients treated for HCV infection had a significantly better 5-year PFS of 15.3 months (95% CI, 294-726) compared with the nontreatment group 9.5 months (95% CI, 205-405) with a Wilcoxon P = .04 (Figure 2).
Among 68 patients treated for HCV infection, 51 achieved SVR, and 34 achieved SVR after the diagnosis of HCC. Patients who achieved SVR had an improved 5-year OS when compared with patients who did not achieve SVR (median 65.8 months [95% CI, 1222-NA] vs 15.7 months [95% CI, 242-853], Wilcoxon P < .001) (Figure 3). Similarly, patients with SVR had improved 5-year PFS when compared with the non-SVR group (median 20.5 months [95% CI, 431-914] vs 8.9 months [95% CI, 191-340], Wilcoxon P = .007 (Figure 4). Achievement of SVR after HCC diagnosis suggests a significantly improved OS (HR 0.37) compared with achievement prior to HCC diagnosis (HR, 0.65; 95% CI, 0.23-1.82, P = .41)
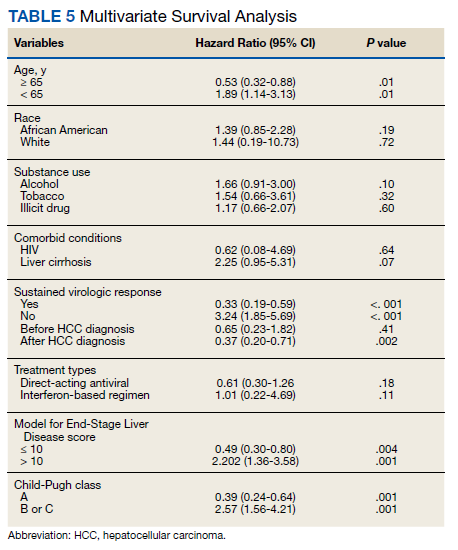
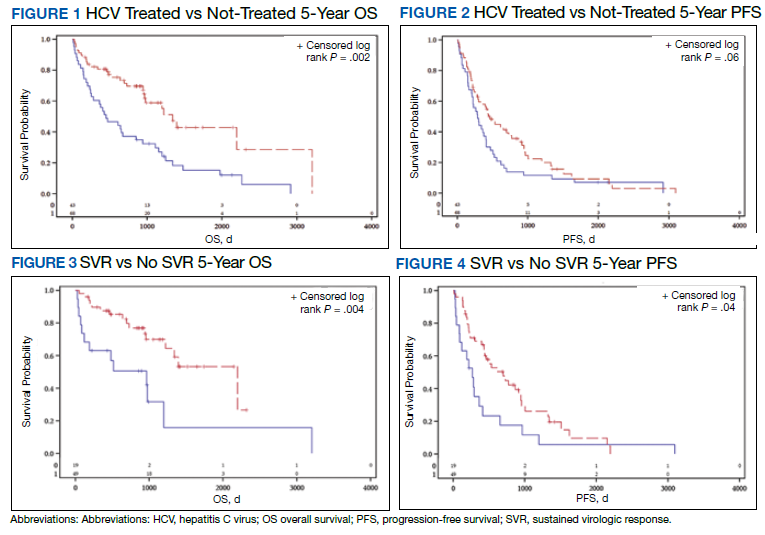
Multivariate Cox regression was used to determine factors with significant survival impact. Advanced age at diagnosis (aged ≥ 65 years) (HR, 0.53; 95% CI, 0.320-0.880; P = .01), SVR status (HR, 0.33; 95% CI, 0.190-0.587; P < .001), achieving SVR after HCC diagnosis (HR, 0.37; 95% CI, 0.20-0.71; P = .002), low MELD score (< 10) (HR, 0.49; 95% CI, 0.30-0.80; P = .004) and low Child-Pugh score (class A) (HR, 0.39; 95% CI, 0.24-0.64; P = .001) have a significant positive impact on OS. Survival was not significantly influenced by race, tobacco, drug use, HIV or cirrhosis status, or HCV treatment type. In addition, higher Child-Pugh class (B or C), higher MELD score (> 10), and younger age at diagnosis (< 65 years) have a negative impact on survival outcome (Table 5).
Discussion
The survival benefit of HCV eradication and achieving SVR status has been well established in patients with HCC.13 In a retrospective cohort study of 250 patients with HCV infection who had received curative treatment for HCC, multivariate analysis demonstrated that achieving SVR is an independent predictor of OS.14 The 3-year and 5-year OS rates were 97% and 94% for the SVR group, and 91% and 60% for the non‐SVR group, respectively (P < .001). Similarly, according to Sou and colleagues, of 122 patients with HCV-related HCC, patients with SVR had longer OS than patients with no SVR (P = .04).15 One of the hypotheses that could explain the survival benefit in patients who achieved SVR is the effect of achieving SVR in reducing persistent liver inflammation and associated liver mortality, and therefore lowering risks of complication in patients with HCC.16 In our study, multivariate analysis shows that achieving SVR is associated with significant improved OS (HR, 0.33). In contrast, patients with HCC who have not achieved SVR are associated with worse survival (HR, 3.24). This finding supports early treatment of HCV to obtain SVR in HCV-related patients with HCC, even after development of HCC.
Among 68 patients treated for HCV infection, 45 patients were treated after HCC diagnosis, and 34 patients achieved SVR after HCC diagnosis. The average time between HCV infection treatment after HCC diagnosis was 6 months. Our data suggested that achievement of SVR after HCC diagnosis suggests an improved OS (HR, 0.37) compared with achievement prior to HCC diagnosis (HR, 0.65; 95% CI,0.23-1.82; P = .41). This lack of statistical significance is likely due to small sample size of patients achieving SVR prior to HCC diagnosis. Our results are consistent with the findings regarding the efficacy and timing of DAA treatment in patients with active HCC. According to Singal and colleagues, achieving SVR after DAA therapy may result in improved liver function and facilitate additional HCC-directed therapy, which potentially improves survival.17-19
Nagaoki and colleagues found that there was no significant difference in OS in patients with HCC between the DAA and IFN groups. According to the study, the 3-year and 5-year OS rates were 96% and 96% for DAA patients and 93% and 73% for IFN patients, respectively (P = .16).14 This finding is consistent with the results of our study. HCV treatment type (IFN vs DAA) was not found to be associated with either OS or PFS time, regardless of time period.
A higher MELD score (> 10) and a higher Child-Pugh class (B or C) score are associated with worse survival outcome regardless of SVR status. While patients with a low MELD score (≤ 10) have a better survival rate (HR 0.49), a higher MELD score has a significantly higher HR and therefore worse survival outcomes (HR, 2.20). Similarly, patients with Child-Pugh A (HR, 0.39) have a better survival outcome compared with those patients with Child-Pugh class B or C (HR, 2.57). This finding is consistent with results of multiple studies indicating that advanced liver disease, as measured by a high MELD score and Child-Pugh class score, can be used to predict the survival outcome in patients with HCV-related HCC.20-22
Unlike other studies that look at a single prognostic variable, our study evaluated prognostic impacts of multiple variables (age, SVR status, the order of SVR in relation to HCC development, HCV treatment type, MELD score and Child-Pugh class) in patients with HCC. The study included patients treated for HCV after development of HCC along with other multiple variables leading to OS benefit. It is one of the only studies in the United States that compared 5-year OS and PFS among patients with HCC treated for HCV and achieved SVR. The studies by Nagaoki and colleagues and Sou and colleagues were conducted in Japan, and some of their subset analyses were univariate. Among our study population of veterans, 50% were African American patients, suggesting that they may have similar OS benefit when compared to White patients with HCC and HCV treatment.
Limitations
Our findings were limited in that our study population is too small to conduct further subset analysis that would allow statistical significance of those subsets, such as the suggested benefit of SVR in patients who presented with HCC after antiviral therapy. Another limitation is the all-male population, likely a result of the older veteran population at the Memphis VAMC. The mean age at diagnosis was 65 years, which is slightly higher than the general population. Compared to the SEER database, HCC is most frequently diagnosed among people aged 55 to 64 years.23 The age difference was likely due to our aging veteran population.
Further studies are needed to determine the significance of SVR on HCC recurrence and treatment. Immunotherapy is now first-line treatment for patients with local advanced HCC. All the immunotherapy studies excluded patients with active HCV infection. Hence, we need more data on HCV treatment timing among patients scheduled to start treatment with immunotherapy.
Conclusions
In a population of older veterans, treatment of HCV infection leads to OS benefit among patients with HCC. In addition, patients with HCV infection who achieve SVR have an OS benefit over patients unable to achieve SVR. The type of treatment, DAA vs IFN-based regimen, did not show significant survival benefit.
1. Ghouri YA, Mian I, Rowe JH. Review of hepatocellular carcinoma: epidemiology, etiology, and carcinogenesis. J Carcinog. 2017;16:1. Published 2017 May 29. doi:10.4103/jcar.JCar_9_16
2. Bray F, Ferlay J, Soerjomataram I, Siegel RL, Torre LA, Jemal A. Global cancer statistics 2018: GLOBOCAN estimates of incidence and mortality worldwide for 36 cancers in 185 countries. CA Cancer J Clin. 2018;68(6):394-424. doi:10.3322/caac.21492
3. Farazi PA, DePinho RA. Hepatocellular carcinoma pathogenesis: from genes to environment. Nat Rev Cancer. 2006;6(9):674-687. doi:10.1038/nrc1934
4. Falade-Nwulia O, Suarez-Cuervo C, Nelson DR, Fried MW, Segal JB, Sulkowski MS. Oral direct-acting agent therapy for hepatitis c virus infection: a systematic review. Ann Intern Med. 2017;166(9):637-648. doi:10.7326/M16-2575
5. Kouris G, Hydery T, Greenwood BC, et al. Effectiveness of Ledipasvir/Sofosbuvir and predictors of treatment failure in members with hepatitis C genotype 1 infection: a retrospective cohort study in a medicaid population. J Manag Care Spec Pharm. 2018;24(7):591-597. doi:10.18553/jmcp.2018.24.7.591
6. Jacobson IM, Lawitz E, Kwo PY, et al. Safety and efficacy of elbasvir/grazoprevir in patients with hepatitis c virus infection and compensated cirrhosis: an integrated analysis. Gastroenterology. 2017;152(6):1372-1382.e2. doi:10.1053/j.gastro.2017.01.050
7. Nahon P, Layese R, Bourcier V, et al. Incidence of hepatocellular carcinoma after direct antiviral therapy for HCV in patients with cirrhosis included in surveillance programs. Gastroenterology. 2018;155(5):1436-1450.e6. doi:10.1053/j.gastro.2018.07.01510.
8. Innes H, Barclay ST, Hayes PC, et al. The risk of hepatocellular carcinoma in cirrhotic patients with hepatitis C and sustained viral response: role of the treatment regimen. J Hepatol. 2018;68(4):646-654. doi:10.1016/j.jhep.2017.10.033
9. Romano A, Angeli P, Piovesan S, et al. Newly diagnosed hepatocellular carcinoma in patients with advanced hepatitis C treated with DAAs: a prospective population study. J Hepatol. 2018;69(2):345-352. doi:10.1016/j.jhep.2018.03.009
10. Kanwal F, Kramer J, Asch SM, Chayanupatkul M, Cao Y, El-Serag HB. Risk of hepatocellular cancer in HCV patients treated with direct-acting antiviral agents. Gastroenterology. 2017;153(4):996-1005.e1. doi:10.1053/j.gastro.2017.06.0122
11. Singh S, Nautiyal A, Loke YK. Oral direct-acting antivirals and the incidence or recurrence of hepatocellular carcinoma: a systematic review and meta-analysis. Frontline Gastroenterol. 2018;9(4):262-270. doi:10.1136/flgastro-2018-101017
12. Kuftinec G, Loehfelm T, Corwin M, et al. De novo hepatocellular carcinoma occurrence in hepatitis C cirrhotics treated with direct-acting antiviral agents. Hepat Oncol. 2018;5(1):HEP06. Published 2018 Jul 25. doi:10.2217/hep-2018-00033
13. Morgan RL, Baack B, Smith BD, Yartel A, Pitasi M, Falck-Ytter Y. Eradication of hepatitis C virus infection and the development of hepatocellular carcinoma: a meta-analysis of observational studies. Ann Intern Med. 2013;158(5 Pt 1):329-337. doi:10.7326/0003-4819-158-5-201303050-00005
14. Nagaoki Y, Imamura M, Nishida Y, et al. The impact of interferon-free direct-acting antivirals on clinical outcome after curative treatment for hepatitis C virus-associated hepatocellular carcinoma: comparison with interferon-based therapy. J Med Virol. 2019;91(4):650-658. doi:10.1002/jmv.25352
15. Sou FM, Wu CK, Chang KC, et al. Clinical characteristics and prognosis of HCC occurrence after antiviral therapy for HCV patients between sustained and non-sustained responders. J Formos Med Assoc. 2019;118(1 Pt 3):504-513. doi:10.1016/j.jfma.2018.10.017
16. Roche B, Coilly A, Duclos-Vallee JC, Samuel D. The impact of treatment of hepatitis C with DAAs on the occurrence of HCC. Liver Int. 2018;38(suppl 1):139-145. doi:10.1111/liv.13659
17. Singal AG, Lim JK, Kanwal F. AGA clinical practice update on interaction between oral direct-acting antivirals for chronic hepatitis C infection and hepatocellular carcinoma: expert review. Gastroenterology. 2019;156(8):2149-2157. doi:10.1053/j.gastro.2019.02.046
18. Toyoda H, Kumada T, Hayashi K, et al. Characteristics and prognosis of hepatocellular carcinoma detected in sustained responders to interferon therapy for chronic hepatitis C. Cancer Detect Prev. 2003;27(6):498-502. doi:10.1016/j.cdp.2003.09.00719. Okamura Y, Sugiura T, Ito T, et al. The achievement of a sustained virological response either before or after hepatectomy improves the prognosis of patients with primary hepatitis C virus-related hepatocellular carcinoma. Ann Surg Oncol. 2019; 26(13):4566-4575. doi:10.1245/s10434-019-07911-w
20. Wray CJ, Harvin JA, Silberfein EJ, Ko TC, Kao LS. Pilot prognostic model of extremely poor survival among high-risk hepatocellular carcinoma patients. Cancer. 2012;118(24):6118-6125. doi:10.1002/cncr.27649
21. Kim JH, Kim JH, Choi JH, et al. Value of the model for end-stage liver disease for predicting survival in hepatocellular carcinoma patients treated with transarterial chemoembolization. Scand J Gastroenterol. 2009;44(3):346-357. doi:10.1080/00365520802530838
22. Vogeler M, Mohr I, Pfeiffenberger J, et al. Applicability of scoring systems predicting outcome of transarterial chemoembolization for hepatocellular carcinoma. J Cancer Res Clin Oncol. 2020;146(4):1033-1050. doi:10.1007/s00432-020-03135-8
23. National Institutes of Health, Surveillance, Epidemiology, and End Results. Cancer stat facts: cancer of the liver and intrahepatic bile duct. Accessed July 15, 2021. https://seer.cancer.gov/statfacts/html/livibd.html
24. Singal AK, Kamath PS. Model for End-stage Liver Disease. J Clin Exp Hepatol. 2013;3(1):50-60. doi:10.1016/j.jceh.2012.11.002
Hepatocellular cancer (HCC) is the most common type of hepatic cancers, accounting for 65% of all hepatic cancers.1 Among all cancers, HCC is one of the fastest growing causes of death in the United States, and the rate of new HCC cases are on the rise over several decades.2 There are many risk factors leading to HCC, including alcohol use, obesity, and smoking. Infection with hepatitis C virus (HCV) poses a significant risk.1
The pathogenesis of HCV-induced carcinogenesis is mediated by a unique host-induced immunologic response. Viral replication induces production of inflammatory factors, such as tumor necrosis factor (TNF-α), interferon (IFN), and oxidative stress on hepatocytes, resulting in cell injury, death, and regeneration. Repetitive cycles of cellular death and regeneration induce fibrosis, which may lead to cirrhosis.3 Hence, early treatment of HCV infection and achieving sustained virologic response (SVR) may lead to decreased incidence and mortality associated with HCC.
Treatment of HCV infection has become more effective with the development of direct-acting antivirals (DAAs) leading to SVR in > 90% of patients compared with 40 to 50% with IFN-based treatment.4,5 DAAs have been proved safe and highly effective in eradicating HCV infection even in patients with advanced liver disease with decompensated cirrhosis.6 Although achieving SVR indicates a complete cure from chronic HCV infection, several studies have shown subsequent risk of developing HCC persists even after successful HCV treatment.7-9 Some studies show that using DAAs to achieve SVR in patients with HCV infection leads to a decreased relative risk of HCC development compared with patients who do not receive treatment.10-12 But data on HCC risk following DAA-induced SVR vs IFN-induced SVR are somewhat conflicting.
Much of the information regarding the association between SVR and HCC has been gleaned from large data banks without accounting for individual patient characteristics that can be obtained through full chart review. Due to small sample sizes in many chart review studies, the impact that SVR from DAA therapy has on the progression and severity of HCC is not entirely clear. The aim of our study is to evaluate the effect of HCV treatment and SVR status on overall survival (OS) in patients with HCC. Second, we aim to compare survival benefits, if any exist, among the 2 major HCV treatment modalities (IFN vs DAA).
Methods
We performed a retrospective review of patients at Memphis Veterans Affairs Medical Center (VAMC) in Tennessee to determine whether treatment for HCV infection in general, and achieving SVR in particular, makes a difference in progression, recurrence, or OS among patients with HCV infection who develop HCC. We identified 111 patients with a diagnosis of both HCV and new or recurrent HCC lesions from November 2008 to March 2019 (Table 1). We divided these patients based on their HCV treatment status, SVR status, and treatment types (IFN vs DAA).
The inclusion criteria were patients aged > 18 years treated at the Memphis VAMC who have HCV infection and developed HCC. Exclusion criteria were patients who developed HCC from other causes such as alcoholic steatohepatitis, hepatitis B virus infection, hemochromatosis, patients without HCV infection, and patients who were not established at the Memphis VAMC. This protocol was approved by the Memphis VAMC Institutional Review Board.
HCC diagnosis was determined using International Classification of Diseases codes (9th revision: 155 and 155.2; 10th revision: CD 22 and 22.9). We also used records of multidisciplinary gastrointestinal malignancy tumor conferences to identify patient who had been diagnosed and treated for HCV infection. We identified patients who were treated with DAA vs IFN as well as patients who had achieved SVR (classified as having negative HCV RNA tests at the end of DAA treatment). We were unable to evaluate Barcelona Clinic Liver Cancer staging since this required documented performance status that was not available in many patient records. We selected cases consistent with both treatment for HCV infection and subsequent development of HCC. Patient data included age; OS time; HIV status HCV genotype; time and status of progression to HCC; type and duration of treatment; and alcohol, tobacco, and drug use. Disease status was measured using the Model for End-Stage Liver Disease (MELD) score (Table 2), Milan criteria (Table 3), and Child-Pugh score (Table 4).
Statistical Analysis
OS was measured from the date of HCC diagnosis to the date of death or last follow-up. Progression-free survival (PFS) was defined from the date of HCC treatment initiation to the date of first HCC recurrence. We compared survival data for the SVR and non-SVR subgroups, the HCV treatment vs non-HCV treatment subgroups, and the IFN therapy vs DAA therapy subgroups, using the Kaplan-Meier method. The differences between subgroups were assessed using a log-rank test. Multivariate analysis using Cox proportional hazards regression model was used to identify factors that had significant impact on OS. Those factors included age; race; alcohol, tobacco, and illicit drug use; SVR status; HCV treatment status; IFN-based regimen vs DAA; MELD, and Child-Pugh scores. The results were expressed as hazard ratios (HRs) and 95% CI. Calculations were made using Statistical Analysis SAS and IBM SPSS software.
Results
The study included 111 patients. The mean age was 65.7 years; all were male and half of were Black patients. The gender imbalance was due to the predominantly male patient population at Memphis VAMC. Among 111 patients with HCV infection and HCC, 68 patients were treated for HCV infection and had significantly improved OS and PFS compared with the nontreatment group. The median 5-year OS was 44.6 months (95% CI, 966-3202) in the treated HCV infection group compared with 15.1 months in the untreated HCV infection group with a Wilcoxon P = .0005 (Figure 1). Similarly, patients treated for HCV infection had a significantly better 5-year PFS of 15.3 months (95% CI, 294-726) compared with the nontreatment group 9.5 months (95% CI, 205-405) with a Wilcoxon P = .04 (Figure 2).
Among 68 patients treated for HCV infection, 51 achieved SVR, and 34 achieved SVR after the diagnosis of HCC. Patients who achieved SVR had an improved 5-year OS when compared with patients who did not achieve SVR (median 65.8 months [95% CI, 1222-NA] vs 15.7 months [95% CI, 242-853], Wilcoxon P < .001) (Figure 3). Similarly, patients with SVR had improved 5-year PFS when compared with the non-SVR group (median 20.5 months [95% CI, 431-914] vs 8.9 months [95% CI, 191-340], Wilcoxon P = .007 (Figure 4). Achievement of SVR after HCC diagnosis suggests a significantly improved OS (HR 0.37) compared with achievement prior to HCC diagnosis (HR, 0.65; 95% CI, 0.23-1.82, P = .41)
Multivariate Cox regression was used to determine factors with significant survival impact. Advanced age at diagnosis (aged ≥ 65 years) (HR, 0.53; 95% CI, 0.320-0.880; P = .01), SVR status (HR, 0.33; 95% CI, 0.190-0.587; P < .001), achieving SVR after HCC diagnosis (HR, 0.37; 95% CI, 0.20-0.71; P = .002), low MELD score (< 10) (HR, 0.49; 95% CI, 0.30-0.80; P = .004) and low Child-Pugh score (class A) (HR, 0.39; 95% CI, 0.24-0.64; P = .001) have a significant positive impact on OS. Survival was not significantly influenced by race, tobacco, drug use, HIV or cirrhosis status, or HCV treatment type. In addition, higher Child-Pugh class (B or C), higher MELD score (> 10), and younger age at diagnosis (< 65 years) have a negative impact on survival outcome (Table 5).
Discussion
The survival benefit of HCV eradication and achieving SVR status has been well established in patients with HCC.13 In a retrospective cohort study of 250 patients with HCV infection who had received curative treatment for HCC, multivariate analysis demonstrated that achieving SVR is an independent predictor of OS.14 The 3-year and 5-year OS rates were 97% and 94% for the SVR group, and 91% and 60% for the non‐SVR group, respectively (P < .001). Similarly, according to Sou and colleagues, of 122 patients with HCV-related HCC, patients with SVR had longer OS than patients with no SVR (P = .04).15 One of the hypotheses that could explain the survival benefit in patients who achieved SVR is the effect of achieving SVR in reducing persistent liver inflammation and associated liver mortality, and therefore lowering risks of complication in patients with HCC.16 In our study, multivariate analysis shows that achieving SVR is associated with significant improved OS (HR, 0.33). In contrast, patients with HCC who have not achieved SVR are associated with worse survival (HR, 3.24). This finding supports early treatment of HCV to obtain SVR in HCV-related patients with HCC, even after development of HCC.
Among 68 patients treated for HCV infection, 45 patients were treated after HCC diagnosis, and 34 patients achieved SVR after HCC diagnosis. The average time between HCV infection treatment after HCC diagnosis was 6 months. Our data suggested that achievement of SVR after HCC diagnosis suggests an improved OS (HR, 0.37) compared with achievement prior to HCC diagnosis (HR, 0.65; 95% CI,0.23-1.82; P = .41). This lack of statistical significance is likely due to small sample size of patients achieving SVR prior to HCC diagnosis. Our results are consistent with the findings regarding the efficacy and timing of DAA treatment in patients with active HCC. According to Singal and colleagues, achieving SVR after DAA therapy may result in improved liver function and facilitate additional HCC-directed therapy, which potentially improves survival.17-19
Nagaoki and colleagues found that there was no significant difference in OS in patients with HCC between the DAA and IFN groups. According to the study, the 3-year and 5-year OS rates were 96% and 96% for DAA patients and 93% and 73% for IFN patients, respectively (P = .16).14 This finding is consistent with the results of our study. HCV treatment type (IFN vs DAA) was not found to be associated with either OS or PFS time, regardless of time period.
A higher MELD score (> 10) and a higher Child-Pugh class (B or C) score are associated with worse survival outcome regardless of SVR status. While patients with a low MELD score (≤ 10) have a better survival rate (HR 0.49), a higher MELD score has a significantly higher HR and therefore worse survival outcomes (HR, 2.20). Similarly, patients with Child-Pugh A (HR, 0.39) have a better survival outcome compared with those patients with Child-Pugh class B or C (HR, 2.57). This finding is consistent with results of multiple studies indicating that advanced liver disease, as measured by a high MELD score and Child-Pugh class score, can be used to predict the survival outcome in patients with HCV-related HCC.20-22
Unlike other studies that look at a single prognostic variable, our study evaluated prognostic impacts of multiple variables (age, SVR status, the order of SVR in relation to HCC development, HCV treatment type, MELD score and Child-Pugh class) in patients with HCC. The study included patients treated for HCV after development of HCC along with other multiple variables leading to OS benefit. It is one of the only studies in the United States that compared 5-year OS and PFS among patients with HCC treated for HCV and achieved SVR. The studies by Nagaoki and colleagues and Sou and colleagues were conducted in Japan, and some of their subset analyses were univariate. Among our study population of veterans, 50% were African American patients, suggesting that they may have similar OS benefit when compared to White patients with HCC and HCV treatment.
Limitations
Our findings were limited in that our study population is too small to conduct further subset analysis that would allow statistical significance of those subsets, such as the suggested benefit of SVR in patients who presented with HCC after antiviral therapy. Another limitation is the all-male population, likely a result of the older veteran population at the Memphis VAMC. The mean age at diagnosis was 65 years, which is slightly higher than the general population. Compared to the SEER database, HCC is most frequently diagnosed among people aged 55 to 64 years.23 The age difference was likely due to our aging veteran population.
Further studies are needed to determine the significance of SVR on HCC recurrence and treatment. Immunotherapy is now first-line treatment for patients with local advanced HCC. All the immunotherapy studies excluded patients with active HCV infection. Hence, we need more data on HCV treatment timing among patients scheduled to start treatment with immunotherapy.
Conclusions
In a population of older veterans, treatment of HCV infection leads to OS benefit among patients with HCC. In addition, patients with HCV infection who achieve SVR have an OS benefit over patients unable to achieve SVR. The type of treatment, DAA vs IFN-based regimen, did not show significant survival benefit.
1. Ghouri YA, Mian I, Rowe JH. Review of hepatocellular carcinoma: epidemiology, etiology, and carcinogenesis. J Carcinog. 2017;16:1. Published 2017 May 29. doi:10.4103/jcar.JCar_9_16
2. Bray F, Ferlay J, Soerjomataram I, Siegel RL, Torre LA, Jemal A. Global cancer statistics 2018: GLOBOCAN estimates of incidence and mortality worldwide for 36 cancers in 185 countries. CA Cancer J Clin. 2018;68(6):394-424. doi:10.3322/caac.21492
3. Farazi PA, DePinho RA. Hepatocellular carcinoma pathogenesis: from genes to environment. Nat Rev Cancer. 2006;6(9):674-687. doi:10.1038/nrc1934
4. Falade-Nwulia O, Suarez-Cuervo C, Nelson DR, Fried MW, Segal JB, Sulkowski MS. Oral direct-acting agent therapy for hepatitis c virus infection: a systematic review. Ann Intern Med. 2017;166(9):637-648. doi:10.7326/M16-2575
5. Kouris G, Hydery T, Greenwood BC, et al. Effectiveness of Ledipasvir/Sofosbuvir and predictors of treatment failure in members with hepatitis C genotype 1 infection: a retrospective cohort study in a medicaid population. J Manag Care Spec Pharm. 2018;24(7):591-597. doi:10.18553/jmcp.2018.24.7.591
6. Jacobson IM, Lawitz E, Kwo PY, et al. Safety and efficacy of elbasvir/grazoprevir in patients with hepatitis c virus infection and compensated cirrhosis: an integrated analysis. Gastroenterology. 2017;152(6):1372-1382.e2. doi:10.1053/j.gastro.2017.01.050
7. Nahon P, Layese R, Bourcier V, et al. Incidence of hepatocellular carcinoma after direct antiviral therapy for HCV in patients with cirrhosis included in surveillance programs. Gastroenterology. 2018;155(5):1436-1450.e6. doi:10.1053/j.gastro.2018.07.01510.
8. Innes H, Barclay ST, Hayes PC, et al. The risk of hepatocellular carcinoma in cirrhotic patients with hepatitis C and sustained viral response: role of the treatment regimen. J Hepatol. 2018;68(4):646-654. doi:10.1016/j.jhep.2017.10.033
9. Romano A, Angeli P, Piovesan S, et al. Newly diagnosed hepatocellular carcinoma in patients with advanced hepatitis C treated with DAAs: a prospective population study. J Hepatol. 2018;69(2):345-352. doi:10.1016/j.jhep.2018.03.009
10. Kanwal F, Kramer J, Asch SM, Chayanupatkul M, Cao Y, El-Serag HB. Risk of hepatocellular cancer in HCV patients treated with direct-acting antiviral agents. Gastroenterology. 2017;153(4):996-1005.e1. doi:10.1053/j.gastro.2017.06.0122
11. Singh S, Nautiyal A, Loke YK. Oral direct-acting antivirals and the incidence or recurrence of hepatocellular carcinoma: a systematic review and meta-analysis. Frontline Gastroenterol. 2018;9(4):262-270. doi:10.1136/flgastro-2018-101017
12. Kuftinec G, Loehfelm T, Corwin M, et al. De novo hepatocellular carcinoma occurrence in hepatitis C cirrhotics treated with direct-acting antiviral agents. Hepat Oncol. 2018;5(1):HEP06. Published 2018 Jul 25. doi:10.2217/hep-2018-00033
13. Morgan RL, Baack B, Smith BD, Yartel A, Pitasi M, Falck-Ytter Y. Eradication of hepatitis C virus infection and the development of hepatocellular carcinoma: a meta-analysis of observational studies. Ann Intern Med. 2013;158(5 Pt 1):329-337. doi:10.7326/0003-4819-158-5-201303050-00005
14. Nagaoki Y, Imamura M, Nishida Y, et al. The impact of interferon-free direct-acting antivirals on clinical outcome after curative treatment for hepatitis C virus-associated hepatocellular carcinoma: comparison with interferon-based therapy. J Med Virol. 2019;91(4):650-658. doi:10.1002/jmv.25352
15. Sou FM, Wu CK, Chang KC, et al. Clinical characteristics and prognosis of HCC occurrence after antiviral therapy for HCV patients between sustained and non-sustained responders. J Formos Med Assoc. 2019;118(1 Pt 3):504-513. doi:10.1016/j.jfma.2018.10.017
16. Roche B, Coilly A, Duclos-Vallee JC, Samuel D. The impact of treatment of hepatitis C with DAAs on the occurrence of HCC. Liver Int. 2018;38(suppl 1):139-145. doi:10.1111/liv.13659
17. Singal AG, Lim JK, Kanwal F. AGA clinical practice update on interaction between oral direct-acting antivirals for chronic hepatitis C infection and hepatocellular carcinoma: expert review. Gastroenterology. 2019;156(8):2149-2157. doi:10.1053/j.gastro.2019.02.046
18. Toyoda H, Kumada T, Hayashi K, et al. Characteristics and prognosis of hepatocellular carcinoma detected in sustained responders to interferon therapy for chronic hepatitis C. Cancer Detect Prev. 2003;27(6):498-502. doi:10.1016/j.cdp.2003.09.00719. Okamura Y, Sugiura T, Ito T, et al. The achievement of a sustained virological response either before or after hepatectomy improves the prognosis of patients with primary hepatitis C virus-related hepatocellular carcinoma. Ann Surg Oncol. 2019; 26(13):4566-4575. doi:10.1245/s10434-019-07911-w
20. Wray CJ, Harvin JA, Silberfein EJ, Ko TC, Kao LS. Pilot prognostic model of extremely poor survival among high-risk hepatocellular carcinoma patients. Cancer. 2012;118(24):6118-6125. doi:10.1002/cncr.27649
21. Kim JH, Kim JH, Choi JH, et al. Value of the model for end-stage liver disease for predicting survival in hepatocellular carcinoma patients treated with transarterial chemoembolization. Scand J Gastroenterol. 2009;44(3):346-357. doi:10.1080/00365520802530838
22. Vogeler M, Mohr I, Pfeiffenberger J, et al. Applicability of scoring systems predicting outcome of transarterial chemoembolization for hepatocellular carcinoma. J Cancer Res Clin Oncol. 2020;146(4):1033-1050. doi:10.1007/s00432-020-03135-8
23. National Institutes of Health, Surveillance, Epidemiology, and End Results. Cancer stat facts: cancer of the liver and intrahepatic bile duct. Accessed July 15, 2021. https://seer.cancer.gov/statfacts/html/livibd.html
24. Singal AK, Kamath PS. Model for End-stage Liver Disease. J Clin Exp Hepatol. 2013;3(1):50-60. doi:10.1016/j.jceh.2012.11.002
Use and Toxicity of Checkpoint Inhibitors for Solid Tumor Treatment in a Veteran Population
Due to the high cost of newer chemotherapy agents, institutions search for strategies to minimize drug cost and drug waste. Programmed death-1 (PD-1) inhibitors, nivolumab and pembrolizumab, are commonly used in the treatment of solid tumors; however, the agents cost thousands of dollars per dose. Nivolumab and pembrolizumab were initially approved using weight-based dosing, but package labeling for both agents now includes fixed dosing.1,2 A combination of these 2 dosing strategies could be used by institutions depending on individual patient’s weight to maximize cost savings, minimize drug waste, and maintain safety and efficacy of PD-1 inhibitors. Irrespective of dosing strategy, the development of immune-related adverse events (IrAEs) has been demonstrated with PD-1 inhibitors as a result of the mechanism of action.
PD-1 expression suppresses T cell activity to prevent the development of autoimmunity; however, this is also a mechanism in which tumor cells can evade the host immune system.3-5 Binding of PD-1 and programmed death-ligand 1 (PD-L1) suppresses T cell activity, whereas the inhibition of PD-1 and PD-L1 results in T cell activation.4,5 Increased T cell activity elicits the anticancer effect, but also contributes to the development of IrAEs.4,5 Hypothyroidism is one of the most common IrAEs, with a reported incidence of 9% with nivolumab therapy and 8.5% with pembrolizumab.1,2
Data from the US Department of Veterans Affairs (VA) medical centers is stored in the centralized Corporate Data Warehouse (CDW). VA researchers can obtain approval to use CDW data, which allows for large scale retrospective review of veterans who have received care at VA medical centers (VAMCs). This study aimed to describe the PD-1 inhibitor dosing used within VAMCs and identify actual and potential cost savings. Due to the frequency of immunemediated hypothyroidism and objective data that can be obtained from CDW reports, the study estimated the incidence of immune-mediated hypothyroidism within the veteran population as a safety outcome.
Background
The US Food and Drug Administration (FDA) initially approved dosing for IV nivolumab at 3 mg/kg of patient body weight every 2 weeks and for IV pembrolizumab 2 mg/kg of patient body weight every 3 weeks.1,2 Subsequent pharmacokinetic studies found that these agents have similar exposure and efficacy with fixed doses of nivolumab 240 mg IV every 2 weeks and pembrolizumab 200 mg IV every 3 weeks; in 2016, FDA labeling shifted from weight-based dosing to fixed dosing for most solid tumor indications.6-9 Depending on patient weight, a combination of weightbased and fixed dosing could be used by institutions to maximize cost-savings opportunities, minimize drug waste, and maintain clinical efficacy with PD-1 inhibitors. For example, a patient initiating nivolumab who weighs 80 kg would receive 240 mg for both weight-based (3 mg/kg x 80 kg = 240 mg) and fixed dosing; therefore, no cost-savings opportunities would be available. However, for a patient who weighs ≤ 73.3 kg, it would be more costeffective to use weight-based dosing vs the fixed dose. Since nivolumab is available in 40- mg, 100-mg, and 240-mg vials with similar unit prices, a combination of vial sizes could be used to minimize drug waste. Alternatively, for a patient who weighs ≥ 86.7 kg, it would be more cost-effective to administer the fixed, 240 mg dose when compared with the weightbased dose. Pembrolizumab is available only in a 100-mg vial; therefore, weight-based dosing may result in drug waste.
IrAEs can be seen with PD-1 inhibitors due to increased T cell activity, which is independent of dosing strategy and can affect any organ system. However, immune-mediated hypothyroidism has been commonly seen with PD-1 inhibitors. For patients with immunemediated hypothyroidism, levothyroxine can be considered for asymptomatic patients with thyroid- stimulating hormone (TSH) > 10 uIU/mL with normal thyroxine (T4), or patients with clinical primary hypothyroidism (TSH > 10 uIU/mL with low free T4 and clinical symptoms). Additionally, since hypothyroidism usually follows immunotherapy induced thyrotoxicosis, thyroid function tests should be monitored and levothyroxine initiated if TSH is > 10 uIU/mL for these patients.10,11
Hypothyroidism also can be graded according to the National Cancer Institute (NCI) Common Terminology Criteria for Adverse Events. Hypothyroidism is considered grade 1 when hypothyroidism is demonstrated through clinical or diagnostic observations only and the patient is asymptomatic and no intervention needed. Grade 2 occurs when the patient is symptomatic and limits instrumental activities of daily living (ADLs), prompting thyroid replacement therapy. In grade 3, patients experience severe symptoms that restrict self-care ADLs, and hospitalization is indicated. Grade 4 has life-threatening consequences, and urgent intervention is indicated. Grade 5 results in the death of the patient.12
Electronic health records (EHRs) of veterans who receive care at a VAMC are stored in CDW and available through the VA Informatics and Computing Infrastructure (VINCI), which provides access to data while ensuring veterans’ privacy and data security. This feature of the VA EHR allows for analysis of data across the VA health care system, and larger data sets can be used for retrospective chart reviews.
Using reports from CDW, the primary objective of this study was to describe the dosing strategy used for PD-1 inhibitors, and the primary safety outcome was to determine the incidence of immune-mediated hypothyroidism. The secondary objective was to estimate potential cost-savings opportunities using a combination of PD-1 inhibitor dosing strategies.
Methods
This was a retrospective study including data stored in CDW. The study was approved by the Durham VA Health Care System Institutional Review Board and VINCI/Data Access request tracker. Data were limited to nivolumab and pembrolizumab because they received earlier FDA approval, had multiple solid tumor indications, and 2 FDA-approved dosing strategies. The incidence of IrAEs was limited to hypothyroidism, which could be objectively verified with laboratory monitoring of thyroid function tests, including TSH, free or total T4, and triiodothyronine (T3), all of which were available in CDW data. Additionally, most patients with hypothyroidism initiate treatment with levothyroxine. Prescription refill history could also be retrieved using CDW reports.
Hypothyroidism was defined as T4 below lower limit of normal (LLN), TSH above upper limit of normal (ULN), or any increase in levothyroxine dosage. Patients were excluded if they received PD-1 inhibitor for an indication other than solid tumor treatment, such as hematologic malignancy, or if dosing did not follow weight-based or fixed-dosing strategies, such as nivolumab 1 mg/kg when used in combination with ipilimumab, or pembrolizumab 10 mg/kg. The primary endpoint was the percentage of orders for each dosing strategy, and the primary safety outcome was the incidence of immune-mediated hypothyroidism. Secondary endpoints included estimated cost savings and cost-savings opportunities through nivolumab dose rounding and incidence of levothyroxine initiation or dose change. Descriptive statistics were used for the primary and secondary endpoints.
A report in CDW identified patients who received a dose of nivolumab or pembrolizumab between January 1, 2015 and July 1, 2017 at any VAMC. The CDW report obtained weight at time of PD-1 inhibitor therapy initiation, dose of PD-1 inhibitor given, administration date of PD-1 inhibitor, and VA site. Depending on PD-1 inhibitor administered, weight in kg was multiplied by 3 mg/kg or 2 mg/kg to obtain patient’s anticipated weight-based nivolumab and pembrolizumab dose, respectively. The calculated weight-based dose, fixed dose, and administered dose were compared to infer dosing strategy used at the time of ordering. If the patient’s weight-based dose was within 10% of the fixed dose, the order was categorized as converging because the doses were too similar to determine which dosing strategy was intended.
After determination of dosing strategy, the nivolumab orders were evaluated for actual vs missed cost savings. The cost-savings evaluation included only nivolumab orders because nivolumab is available in a 40-mg, 100-mg, and 240-mg vials and, therefore, has more potential for dose-rounding opportunities with minimal drug waste compared with pembrolizumab, which is available only in a 100-mg vial. Actual cost savings included patients who weighed ≤ 73.3 kg and received nivolumab dose based on 3 mg/kg or patients who weighed ≥ 86.7 kg and received nivolumab 240 mg (fixed dose). Missed cost savings comprised patients who weighed ≤ 73.3 kg who received 240 mg nivolumab or patients who weighed ≥ 86.7 kg and received a nivolumab dose > 240 mg. The cost difference between the dose given and theoretical cost-effective dose was calculated to determine actual and potential cost savings. Converging orders were not included in the cost-savings analysis as the intended nivolumab dose could not be determined. An additional cost analysis of nivolumab orders prescribed between September 1, 2016 and July 1, 2017 was also performed because nivolumab fixed dosing was FDA-approved for most solid tumor indications in September 2016.
To determine the incidence of immunemediated hypothyroidism for patients who received a dose of a PD-1 inhibitor at a VAMC, a CDW report with thyroid function laboratory values (TSH, T4, or T3), including reference range values based on specific VA site, and levothyroxine prescriptions issued during PD-1 inhibitor therapy was obtained. A patient was considered to have experienced immune-mediated hypothyroidism if the patient’s laboratory values demonstrated T4 below the LLN, TSH above the ULN, or if the medication fill history demonstrated levothyroxine initiation or a levothyroxine dose increase.
Results
The CDW report identified 32,769 total PD-1 inhibitor orders. There were 3982 orders that did not meet inclusion criteria or inadequate data were obtained with CDW report and were excluded (Figure). The remaining 28,787 PD-1 inhibitor orders were evaluated for actual or missed cost savings. The distribution of dosing strategies can be found in Table 1.
Nivolumab accounted for 81.5% of all PD-1 inhibitor orders. Using the most cost-effective nivolumab dosing, the actual cost savings was estimated to be $8,514,300 with potential additional $5,591,250 of missed cost-savings opportunities. There were 8013 nivolumab orders written between September 1, 2016 and July 1, 2017. Cost-effective dosing was used in 4687 of these orders, which accounted for a cost savings of $5,198,570. The remaining 3326 orders had a missed cost-savings opportunity, which accounted for an additional $2,907,180 potential cost savings (Table 2).
PD-1 inhibitors were used for the treatment of 3249 unique patients. Based on abnormal thyroid function tests and levothyroxine initiation or dose increase, it is estimated that 514 (15.8%) patients experienced hypothyroidism during PD-1 inhibitor therapy. However, prior to PD-1 inhibitor therapy, 274 patients were receiving levothyroxine, suggesting baseline thyroid dysfunction. Of these patients, 152 (55.5%) patients maintained the same levothyroxine dose during PD-1 inhibitor therapy, but 91 (33.2%) required a levothyroxine dose increase. There were 187 patients who initiated levothyroxine during PD-1 inhibitor therapy (Table 3).
Discussion
Changes in FDA-approved dosing for PD-1 inhibitors allowed a combination of dosing strategies. Depending on patient weight, a weight-based or fixed-dosing strategy can be used to reduce drug cost while maintaining equivalent efficacy. This study evaluated use of dose rounding for PD-1 inhibitors within the VA health care system to identify actual and potential cost savings. To our knowledge, this is the first study to demonstrate cost savings through use of a combination of PD-1 inhibitor dosing strategies. Using CDW, researchers were able to review PD-1 dosing from all VAMCs and include a larger number of orders in a single retrospective study.
Nivolumab was the primary agent used within VAMCs. Depending on the indication, pembrolizumab requires PD-1 expression testing prior to its use in several solid tumor indications. Consequently, additional testing and patient eligibility is needed prior to use. Both PD-1 inhibitors were primarily dosed based on patient weight since this was the first FDAapproved dosing strategy. Nivolumab had more orders categorized as converging, which may be due to the therapeutic weight-based dose of 3 mg/kg for nivolumab vs 2 mg/kg for pembrolizumab. The calculated weight-based dose of nivolumab for an 80-kg patient is 240 mg, which also is the fixed dose. A 80-kg patient on pembrolizumab at 2 mg/kg would receive a 160-mg dose, whereas the fixed dose of pembrolizumab is 200 mg. Pembrolizumab is available only in a 100-mg vial, which limits opportunities for dose rounding without drug waste and could explain the higher amount of pembrolizumab orders in the fixed-dose category.
In this review of PD-1 inhibitor orders over approximately a 2.5-year study period, we identified $8,514,300 estimated cost savings with $5,591,250 estimated missed cost savings. When looking at orders administered after FDA approval for nivolumab-fixed dosing in September 2016, there was substantial cost savings of $5,198,570 with the potential for an additional $2,907,180 missed cost savings. Due to lower drug acquisition costs within the VA health care system, there may be higher cost-savings opportunities within other health care systems.
Through review of abnormal thyroid laboratory values and levothyroxine initiation or dose changes, this study estimated the incidence of hypothyroidism in patients receiving PD-1 inhibitor therapy at the VA. The incidence of primary hypothyroidism identified in this study was slightly higher at 15.8% compared with the 8.5 to 9.0% incidence reported from clinical trials.1,2 There are several reasons why the incidence of hypothyroidism appeared higher in this study. Abnormal laboratory values were not assessed for the degree of deviation from the reference range; any TSH above the ULN, T4 below the LLN, or levothyroxine dose increase was included as thyroid dysfunction in this review. There is also the potential for endogenous age-related thyroid fluctuation, and the development of hypothyroidism may not have been related to PD-1 inhibitor therapy. Within this patient population, 8.4% were receiving levothyroxine prior to PD-1 inhibitor initiation indicating baseline thyroid dysfunction, and it is unclear whether levothyroxine dose increases were due to PD-1 inhibitor or endogenous fluctuation.
Limitations
There are several limitations to acknowledge. The dosing strategy and apparent dose rounding was determined by investigator inference and may not accurately represent the intended dosing strategy. This study did not address efficacy of PD-1 inhibitor and dosing strategy; however, clinical trials have demonstrated equivalent efficacy to generate the change in FDA-approved dosing. Additionally, FDA approval for nivolumab fixed dosing was indication specific. Starting in September 2016, many solid tumor indications had fixed dosing approved, but this approval was not necessarily all encompassing.
While the use of CDW allowed for a greater number of PD-1 inhibitor orders to be included in retrospective review, there also were limitations of the CDW report. The patient weight was limited to weight at time of therapy initiation. Due to the potential for weight changes, nivolumab dosing may have seemed inappropriate to investigators, and thereby excluded. Based on data available from CDW reports, hypothyroidism could not be graded according to NCI Common Terminology Criteria for Adverse Events, and the incidence of clinically significant hypothyroidism could not be determined.
Conclusions
With increasing drug acquisition costs, particularly among antineoplastic agents, health care systems frequently seek out cost-savings opportunities. Using a combination of weightbased and fixed-dosing strategies for PD-1 inhibitors can be a mechanism to achieve costsavings. Through the identification of the dosing strategy used for PD-1 inhibitors, we were able to identify and report instances for potential cost-savings opportunities among veterans treated within VA health care system. Use of CDW allows for data from all VAMCs to be evaluated in a single retrospective chart review, which allows for the inclusion of a larger sample size. This study identified a substantial cost savings for nivolumab through a combination of weight-based and fixed-dosing strategies. Due to the novel mechanism of action, ongoing realworld evaluation of adverse events and IrAEs is warranted.
Dosing strategies with nivolumab and pembrolizumab continue to evolve. In March 2018, nivolumab 480 mg IV every 4 weeks was FDA approved and in April 2020, pembrolizumab 400 mg IV every 6 weeks was FDA approved.13,14 While the drug costs will remain the same, extended interval dosing strategies have cost avoidance such as fewer clinic appointments, resulting in decreased staffing costs and decreased patient travel. Additional studies will be needed to evaluate the cost and safety of the recently approved dosing strategies
1. OPDIVO (nivolumab) injection, for intravenous infusion. Package Insert. Princeton, NJ: Bristol-Myers Squibb Company; 2014.
2. Keytruda (pembrolizumab) injection, for intravenous infusion. Package Insert. Whitehouse Station, NJ: Merck & Co, Inc; 2016
3. Pardoll DM. The blockade of immune checkpoints in cancer immunotherapy. Nat Rev Cancer. 2012;12(4):252-264. doi:10.1038/nrc3239
4. Yao H, Wang H, Li C, Fang J-Y, Xu J. Cancer cellintrinsic PD-1 and implications in combinatorial immunotherapy. Front Immunol. 2018;9:1774. doi:10.3389/fimmu.2018.01774
5. Wang Y, Wang H, Yao H, Li C, Fang J-Y, Xu J. Regulation of PD-L1: emerging routes for targeting tumor immune evasion. Front Pharmacol. 2018;9:536. doi:10.3389/fphar.2018.00536
6. Patnaik A, Kang SP, Rasco D, et al. Phase I study of pembrolizumab (MK-3475; anti-PD-1 monocolonal antibody) in patients with advanced solid tumors. Clin Cancer Res. 2015;21(19):4286-4293. doi:10.1158/1078-0432.CCR-14-2607
7. Zhao X, Suryawanshi S, Hruska M, et al. Assessment of nivolumab benefit-risk profile of a 240-mg flat dose relative to a 3-mg/kg dosing regimen in patients with advanced tumors. Ann Oncol. 2017;28(8):2002-2008. doi:10.1093/annonc/mdx235
8. Freshwater T, Kondic A, Ahamadi M, et al. Evaluation of dosing strategy for pembrolizumab for oncology indications. J Immunother Cancer. 2017;5:43. doi:10.1186/s40425-017-0242-5
9. US Food and Drug Administration. Modification of the dosage regimen for nivolumab. Updated September 15, 2016. Accessed July 8, 2021. https://www.fda.gov/drugs /resources-information-approved-drugs/modification -dosage-regimen-nivolumab
10. Brahmer JR, Lacchetti C, Schneider BJ, et al. Management of immune-related adverse events in patients treated with immune checkpoint inhibitor therapy: American Society of Clinical Oncology Clinical Practice Guideline. J Clin Oncol. 2018;36(17):1714-1768. doi:10.1200/JCO.2017.77.6385
11. National Comprehensive Cancer Network. Clinical Practice Guidelines in Oncology: Management of immunotherapy- related toxicities. version 3.2021. Updated May 14, 2021. Accessed July 8,2021.https://www.nccn.org/professionals/physician_gls/pdf/immunotherapy.pdf
12. National Institutes of Health, National Cancer Institute. Common terminology criteria for adverse events (CTCAE) version 5.0. Updated November 17, 2017. Accessed July 8, 2021. https://ctep.cancer.gov /protocoldevelopment/electronic_applications/docs /CTCAE_v5_Quick_Reference_8.5x11.pdf
13. Zhao X, Ivaturi V, Gopalakrishnan M, Shen J, et al. A model-based exposure-response (E-R) assessment of a nivolumab (NIVO) 4-weekly dosing schedule across multiple tumor types. Abstract presented at: American Association of Cancer Research Annual Meeting 2017; April 1-5, 2017; Washington, DC. doi:10.1158/1538-7445.AM2017-CT101
14. US Food and Drug Administration approves new dosing regimen for pembrolizumab. Updated April 29, 2020. Accessed July 8, 2021. https://www.fda.gov/drugs/drug -approvals-and-databases/fda-approves-new-dosing -regimen-pembrolizumab
Due to the high cost of newer chemotherapy agents, institutions search for strategies to minimize drug cost and drug waste. Programmed death-1 (PD-1) inhibitors, nivolumab and pembrolizumab, are commonly used in the treatment of solid tumors; however, the agents cost thousands of dollars per dose. Nivolumab and pembrolizumab were initially approved using weight-based dosing, but package labeling for both agents now includes fixed dosing.1,2 A combination of these 2 dosing strategies could be used by institutions depending on individual patient’s weight to maximize cost savings, minimize drug waste, and maintain safety and efficacy of PD-1 inhibitors. Irrespective of dosing strategy, the development of immune-related adverse events (IrAEs) has been demonstrated with PD-1 inhibitors as a result of the mechanism of action.
PD-1 expression suppresses T cell activity to prevent the development of autoimmunity; however, this is also a mechanism in which tumor cells can evade the host immune system.3-5 Binding of PD-1 and programmed death-ligand 1 (PD-L1) suppresses T cell activity, whereas the inhibition of PD-1 and PD-L1 results in T cell activation.4,5 Increased T cell activity elicits the anticancer effect, but also contributes to the development of IrAEs.4,5 Hypothyroidism is one of the most common IrAEs, with a reported incidence of 9% with nivolumab therapy and 8.5% with pembrolizumab.1,2
Data from the US Department of Veterans Affairs (VA) medical centers is stored in the centralized Corporate Data Warehouse (CDW). VA researchers can obtain approval to use CDW data, which allows for large scale retrospective review of veterans who have received care at VA medical centers (VAMCs). This study aimed to describe the PD-1 inhibitor dosing used within VAMCs and identify actual and potential cost savings. Due to the frequency of immunemediated hypothyroidism and objective data that can be obtained from CDW reports, the study estimated the incidence of immune-mediated hypothyroidism within the veteran population as a safety outcome.
Background
The US Food and Drug Administration (FDA) initially approved dosing for IV nivolumab at 3 mg/kg of patient body weight every 2 weeks and for IV pembrolizumab 2 mg/kg of patient body weight every 3 weeks.1,2 Subsequent pharmacokinetic studies found that these agents have similar exposure and efficacy with fixed doses of nivolumab 240 mg IV every 2 weeks and pembrolizumab 200 mg IV every 3 weeks; in 2016, FDA labeling shifted from weight-based dosing to fixed dosing for most solid tumor indications.6-9 Depending on patient weight, a combination of weightbased and fixed dosing could be used by institutions to maximize cost-savings opportunities, minimize drug waste, and maintain clinical efficacy with PD-1 inhibitors. For example, a patient initiating nivolumab who weighs 80 kg would receive 240 mg for both weight-based (3 mg/kg x 80 kg = 240 mg) and fixed dosing; therefore, no cost-savings opportunities would be available. However, for a patient who weighs ≤ 73.3 kg, it would be more costeffective to use weight-based dosing vs the fixed dose. Since nivolumab is available in 40- mg, 100-mg, and 240-mg vials with similar unit prices, a combination of vial sizes could be used to minimize drug waste. Alternatively, for a patient who weighs ≥ 86.7 kg, it would be more cost-effective to administer the fixed, 240 mg dose when compared with the weightbased dose. Pembrolizumab is available only in a 100-mg vial; therefore, weight-based dosing may result in drug waste.
IrAEs can be seen with PD-1 inhibitors due to increased T cell activity, which is independent of dosing strategy and can affect any organ system. However, immune-mediated hypothyroidism has been commonly seen with PD-1 inhibitors. For patients with immunemediated hypothyroidism, levothyroxine can be considered for asymptomatic patients with thyroid- stimulating hormone (TSH) > 10 uIU/mL with normal thyroxine (T4), or patients with clinical primary hypothyroidism (TSH > 10 uIU/mL with low free T4 and clinical symptoms). Additionally, since hypothyroidism usually follows immunotherapy induced thyrotoxicosis, thyroid function tests should be monitored and levothyroxine initiated if TSH is > 10 uIU/mL for these patients.10,11
Hypothyroidism also can be graded according to the National Cancer Institute (NCI) Common Terminology Criteria for Adverse Events. Hypothyroidism is considered grade 1 when hypothyroidism is demonstrated through clinical or diagnostic observations only and the patient is asymptomatic and no intervention needed. Grade 2 occurs when the patient is symptomatic and limits instrumental activities of daily living (ADLs), prompting thyroid replacement therapy. In grade 3, patients experience severe symptoms that restrict self-care ADLs, and hospitalization is indicated. Grade 4 has life-threatening consequences, and urgent intervention is indicated. Grade 5 results in the death of the patient.12
Electronic health records (EHRs) of veterans who receive care at a VAMC are stored in CDW and available through the VA Informatics and Computing Infrastructure (VINCI), which provides access to data while ensuring veterans’ privacy and data security. This feature of the VA EHR allows for analysis of data across the VA health care system, and larger data sets can be used for retrospective chart reviews.
Using reports from CDW, the primary objective of this study was to describe the dosing strategy used for PD-1 inhibitors, and the primary safety outcome was to determine the incidence of immune-mediated hypothyroidism. The secondary objective was to estimate potential cost-savings opportunities using a combination of PD-1 inhibitor dosing strategies.
Methods
This was a retrospective study including data stored in CDW. The study was approved by the Durham VA Health Care System Institutional Review Board and VINCI/Data Access request tracker. Data were limited to nivolumab and pembrolizumab because they received earlier FDA approval, had multiple solid tumor indications, and 2 FDA-approved dosing strategies. The incidence of IrAEs was limited to hypothyroidism, which could be objectively verified with laboratory monitoring of thyroid function tests, including TSH, free or total T4, and triiodothyronine (T3), all of which were available in CDW data. Additionally, most patients with hypothyroidism initiate treatment with levothyroxine. Prescription refill history could also be retrieved using CDW reports.
Hypothyroidism was defined as T4 below lower limit of normal (LLN), TSH above upper limit of normal (ULN), or any increase in levothyroxine dosage. Patients were excluded if they received PD-1 inhibitor for an indication other than solid tumor treatment, such as hematologic malignancy, or if dosing did not follow weight-based or fixed-dosing strategies, such as nivolumab 1 mg/kg when used in combination with ipilimumab, or pembrolizumab 10 mg/kg. The primary endpoint was the percentage of orders for each dosing strategy, and the primary safety outcome was the incidence of immune-mediated hypothyroidism. Secondary endpoints included estimated cost savings and cost-savings opportunities through nivolumab dose rounding and incidence of levothyroxine initiation or dose change. Descriptive statistics were used for the primary and secondary endpoints.
A report in CDW identified patients who received a dose of nivolumab or pembrolizumab between January 1, 2015 and July 1, 2017 at any VAMC. The CDW report obtained weight at time of PD-1 inhibitor therapy initiation, dose of PD-1 inhibitor given, administration date of PD-1 inhibitor, and VA site. Depending on PD-1 inhibitor administered, weight in kg was multiplied by 3 mg/kg or 2 mg/kg to obtain patient’s anticipated weight-based nivolumab and pembrolizumab dose, respectively. The calculated weight-based dose, fixed dose, and administered dose were compared to infer dosing strategy used at the time of ordering. If the patient’s weight-based dose was within 10% of the fixed dose, the order was categorized as converging because the doses were too similar to determine which dosing strategy was intended.
After determination of dosing strategy, the nivolumab orders were evaluated for actual vs missed cost savings. The cost-savings evaluation included only nivolumab orders because nivolumab is available in a 40-mg, 100-mg, and 240-mg vials and, therefore, has more potential for dose-rounding opportunities with minimal drug waste compared with pembrolizumab, which is available only in a 100-mg vial. Actual cost savings included patients who weighed ≤ 73.3 kg and received nivolumab dose based on 3 mg/kg or patients who weighed ≥ 86.7 kg and received nivolumab 240 mg (fixed dose). Missed cost savings comprised patients who weighed ≤ 73.3 kg who received 240 mg nivolumab or patients who weighed ≥ 86.7 kg and received a nivolumab dose > 240 mg. The cost difference between the dose given and theoretical cost-effective dose was calculated to determine actual and potential cost savings. Converging orders were not included in the cost-savings analysis as the intended nivolumab dose could not be determined. An additional cost analysis of nivolumab orders prescribed between September 1, 2016 and July 1, 2017 was also performed because nivolumab fixed dosing was FDA-approved for most solid tumor indications in September 2016.
To determine the incidence of immunemediated hypothyroidism for patients who received a dose of a PD-1 inhibitor at a VAMC, a CDW report with thyroid function laboratory values (TSH, T4, or T3), including reference range values based on specific VA site, and levothyroxine prescriptions issued during PD-1 inhibitor therapy was obtained. A patient was considered to have experienced immune-mediated hypothyroidism if the patient’s laboratory values demonstrated T4 below the LLN, TSH above the ULN, or if the medication fill history demonstrated levothyroxine initiation or a levothyroxine dose increase.
Results
The CDW report identified 32,769 total PD-1 inhibitor orders. There were 3982 orders that did not meet inclusion criteria or inadequate data were obtained with CDW report and were excluded (Figure). The remaining 28,787 PD-1 inhibitor orders were evaluated for actual or missed cost savings. The distribution of dosing strategies can be found in Table 1.
Nivolumab accounted for 81.5% of all PD-1 inhibitor orders. Using the most cost-effective nivolumab dosing, the actual cost savings was estimated to be $8,514,300 with potential additional $5,591,250 of missed cost-savings opportunities. There were 8013 nivolumab orders written between September 1, 2016 and July 1, 2017. Cost-effective dosing was used in 4687 of these orders, which accounted for a cost savings of $5,198,570. The remaining 3326 orders had a missed cost-savings opportunity, which accounted for an additional $2,907,180 potential cost savings (Table 2).
PD-1 inhibitors were used for the treatment of 3249 unique patients. Based on abnormal thyroid function tests and levothyroxine initiation or dose increase, it is estimated that 514 (15.8%) patients experienced hypothyroidism during PD-1 inhibitor therapy. However, prior to PD-1 inhibitor therapy, 274 patients were receiving levothyroxine, suggesting baseline thyroid dysfunction. Of these patients, 152 (55.5%) patients maintained the same levothyroxine dose during PD-1 inhibitor therapy, but 91 (33.2%) required a levothyroxine dose increase. There were 187 patients who initiated levothyroxine during PD-1 inhibitor therapy (Table 3).
Discussion
Changes in FDA-approved dosing for PD-1 inhibitors allowed a combination of dosing strategies. Depending on patient weight, a weight-based or fixed-dosing strategy can be used to reduce drug cost while maintaining equivalent efficacy. This study evaluated use of dose rounding for PD-1 inhibitors within the VA health care system to identify actual and potential cost savings. To our knowledge, this is the first study to demonstrate cost savings through use of a combination of PD-1 inhibitor dosing strategies. Using CDW, researchers were able to review PD-1 dosing from all VAMCs and include a larger number of orders in a single retrospective study.
Nivolumab was the primary agent used within VAMCs. Depending on the indication, pembrolizumab requires PD-1 expression testing prior to its use in several solid tumor indications. Consequently, additional testing and patient eligibility is needed prior to use. Both PD-1 inhibitors were primarily dosed based on patient weight since this was the first FDAapproved dosing strategy. Nivolumab had more orders categorized as converging, which may be due to the therapeutic weight-based dose of 3 mg/kg for nivolumab vs 2 mg/kg for pembrolizumab. The calculated weight-based dose of nivolumab for an 80-kg patient is 240 mg, which also is the fixed dose. A 80-kg patient on pembrolizumab at 2 mg/kg would receive a 160-mg dose, whereas the fixed dose of pembrolizumab is 200 mg. Pembrolizumab is available only in a 100-mg vial, which limits opportunities for dose rounding without drug waste and could explain the higher amount of pembrolizumab orders in the fixed-dose category.
In this review of PD-1 inhibitor orders over approximately a 2.5-year study period, we identified $8,514,300 estimated cost savings with $5,591,250 estimated missed cost savings. When looking at orders administered after FDA approval for nivolumab-fixed dosing in September 2016, there was substantial cost savings of $5,198,570 with the potential for an additional $2,907,180 missed cost savings. Due to lower drug acquisition costs within the VA health care system, there may be higher cost-savings opportunities within other health care systems.
Through review of abnormal thyroid laboratory values and levothyroxine initiation or dose changes, this study estimated the incidence of hypothyroidism in patients receiving PD-1 inhibitor therapy at the VA. The incidence of primary hypothyroidism identified in this study was slightly higher at 15.8% compared with the 8.5 to 9.0% incidence reported from clinical trials.1,2 There are several reasons why the incidence of hypothyroidism appeared higher in this study. Abnormal laboratory values were not assessed for the degree of deviation from the reference range; any TSH above the ULN, T4 below the LLN, or levothyroxine dose increase was included as thyroid dysfunction in this review. There is also the potential for endogenous age-related thyroid fluctuation, and the development of hypothyroidism may not have been related to PD-1 inhibitor therapy. Within this patient population, 8.4% were receiving levothyroxine prior to PD-1 inhibitor initiation indicating baseline thyroid dysfunction, and it is unclear whether levothyroxine dose increases were due to PD-1 inhibitor or endogenous fluctuation.
Limitations
There are several limitations to acknowledge. The dosing strategy and apparent dose rounding was determined by investigator inference and may not accurately represent the intended dosing strategy. This study did not address efficacy of PD-1 inhibitor and dosing strategy; however, clinical trials have demonstrated equivalent efficacy to generate the change in FDA-approved dosing. Additionally, FDA approval for nivolumab fixed dosing was indication specific. Starting in September 2016, many solid tumor indications had fixed dosing approved, but this approval was not necessarily all encompassing.
While the use of CDW allowed for a greater number of PD-1 inhibitor orders to be included in retrospective review, there also were limitations of the CDW report. The patient weight was limited to weight at time of therapy initiation. Due to the potential for weight changes, nivolumab dosing may have seemed inappropriate to investigators, and thereby excluded. Based on data available from CDW reports, hypothyroidism could not be graded according to NCI Common Terminology Criteria for Adverse Events, and the incidence of clinically significant hypothyroidism could not be determined.
Conclusions
With increasing drug acquisition costs, particularly among antineoplastic agents, health care systems frequently seek out cost-savings opportunities. Using a combination of weightbased and fixed-dosing strategies for PD-1 inhibitors can be a mechanism to achieve costsavings. Through the identification of the dosing strategy used for PD-1 inhibitors, we were able to identify and report instances for potential cost-savings opportunities among veterans treated within VA health care system. Use of CDW allows for data from all VAMCs to be evaluated in a single retrospective chart review, which allows for the inclusion of a larger sample size. This study identified a substantial cost savings for nivolumab through a combination of weight-based and fixed-dosing strategies. Due to the novel mechanism of action, ongoing realworld evaluation of adverse events and IrAEs is warranted.
Dosing strategies with nivolumab and pembrolizumab continue to evolve. In March 2018, nivolumab 480 mg IV every 4 weeks was FDA approved and in April 2020, pembrolizumab 400 mg IV every 6 weeks was FDA approved.13,14 While the drug costs will remain the same, extended interval dosing strategies have cost avoidance such as fewer clinic appointments, resulting in decreased staffing costs and decreased patient travel. Additional studies will be needed to evaluate the cost and safety of the recently approved dosing strategies
1. OPDIVO (nivolumab) injection, for intravenous infusion. Package Insert. Princeton, NJ: Bristol-Myers Squibb Company; 2014.
2. Keytruda (pembrolizumab) injection, for intravenous infusion. Package Insert. Whitehouse Station, NJ: Merck & Co, Inc; 2016
3. Pardoll DM. The blockade of immune checkpoints in cancer immunotherapy. Nat Rev Cancer. 2012;12(4):252-264. doi:10.1038/nrc3239
4. Yao H, Wang H, Li C, Fang J-Y, Xu J. Cancer cellintrinsic PD-1 and implications in combinatorial immunotherapy. Front Immunol. 2018;9:1774. doi:10.3389/fimmu.2018.01774
5. Wang Y, Wang H, Yao H, Li C, Fang J-Y, Xu J. Regulation of PD-L1: emerging routes for targeting tumor immune evasion. Front Pharmacol. 2018;9:536. doi:10.3389/fphar.2018.00536
6. Patnaik A, Kang SP, Rasco D, et al. Phase I study of pembrolizumab (MK-3475; anti-PD-1 monocolonal antibody) in patients with advanced solid tumors. Clin Cancer Res. 2015;21(19):4286-4293. doi:10.1158/1078-0432.CCR-14-2607
7. Zhao X, Suryawanshi S, Hruska M, et al. Assessment of nivolumab benefit-risk profile of a 240-mg flat dose relative to a 3-mg/kg dosing regimen in patients with advanced tumors. Ann Oncol. 2017;28(8):2002-2008. doi:10.1093/annonc/mdx235
8. Freshwater T, Kondic A, Ahamadi M, et al. Evaluation of dosing strategy for pembrolizumab for oncology indications. J Immunother Cancer. 2017;5:43. doi:10.1186/s40425-017-0242-5
9. US Food and Drug Administration. Modification of the dosage regimen for nivolumab. Updated September 15, 2016. Accessed July 8, 2021. https://www.fda.gov/drugs /resources-information-approved-drugs/modification -dosage-regimen-nivolumab
10. Brahmer JR, Lacchetti C, Schneider BJ, et al. Management of immune-related adverse events in patients treated with immune checkpoint inhibitor therapy: American Society of Clinical Oncology Clinical Practice Guideline. J Clin Oncol. 2018;36(17):1714-1768. doi:10.1200/JCO.2017.77.6385
11. National Comprehensive Cancer Network. Clinical Practice Guidelines in Oncology: Management of immunotherapy- related toxicities. version 3.2021. Updated May 14, 2021. Accessed July 8,2021.https://www.nccn.org/professionals/physician_gls/pdf/immunotherapy.pdf
12. National Institutes of Health, National Cancer Institute. Common terminology criteria for adverse events (CTCAE) version 5.0. Updated November 17, 2017. Accessed July 8, 2021. https://ctep.cancer.gov /protocoldevelopment/electronic_applications/docs /CTCAE_v5_Quick_Reference_8.5x11.pdf
13. Zhao X, Ivaturi V, Gopalakrishnan M, Shen J, et al. A model-based exposure-response (E-R) assessment of a nivolumab (NIVO) 4-weekly dosing schedule across multiple tumor types. Abstract presented at: American Association of Cancer Research Annual Meeting 2017; April 1-5, 2017; Washington, DC. doi:10.1158/1538-7445.AM2017-CT101
14. US Food and Drug Administration approves new dosing regimen for pembrolizumab. Updated April 29, 2020. Accessed July 8, 2021. https://www.fda.gov/drugs/drug -approvals-and-databases/fda-approves-new-dosing -regimen-pembrolizumab