User login
Two-Year Experience of 14 French Pigtail Catheters Placed by Procedure-Focused Hospitalists
Over the last 15 years, studies have demonstrated the efficacy of small-bore chest tubes (SBCTs), or pigtail catheters (PCs, most commonly ≤14 French), in treating pneumothorax (PTX),1-5 traumatic hemothorax (THTX), hemopneumothorax (HPTX),6,7 parapneumonic effusions (PPEs),8,9 pleural infections,10 and symptomatic malignant pleural effusions.11 A randomized, controlled trial also showed that PC placement resulted in better pain scores, compared with large-bore chest tubes (LBCTs), for traumatic PTX.5 The British Thoracic Society does state that LBCTs may be needed for PTXs with very large air leaks, especially postoperatively. Further, LBCTs may be indicated if small-bore drainage fails, but otherwise they recommend PCs as first-line therapy for PTX, free flowing pleural effusions, and pleural infections.12
BEDSIDE PROCEDURE SERVICE DEVELOPMENT
The Medical College of Wisconsin (MCW) provides hospitalist services to
BPS Pigtail Catheter Training
CT surgery initially trained the BPS director in PC placement using the Seldinger technique in 2015. The director’s training period with CT surgery included direct observation by CT surgery providers for 5 PC placements. Prior to placing PCs, the director had performed approximately 400 ultrasound-guided thoracenteses. The BPS director then independently trained the remaining BPS and has placed or supervised over half of the service’s 124 PCs. Initial credentialing for each BPS physician requires 5 PC placements and 20 thoracenteses under direct supervision of credentialed BPS members. Credentialing is maintained by BPS physicians completing 3 PCs and 15 thoracenteses per year.
Newly credentialed providers are capable of independently placing most PCs. However, the requirements for credentialing are minimal and newly credentialed physicians still encounter PC placements with challenging factors not addressed in their training, such as anterior approach, small effusions, atypical effusion location, mild to moderate coagulopathy, recent therapeutic anticoagulation, and large body habitus. To address these challenges, the BPS has instituted an “on call” system. This system is typically staffed by the BPS director or associate director, already attending on a separate medical service. When needed, the “on call” physician will supervise the newer BPS members to ensure safety while the less experienced physician places the PC. Although rare, if an “on call” member is not available, then it is the practice of the BPS to recommend IR for PC placement.
BPS Operation
Daily BPS operation consists of one attending hospitalist, two internal medicine residents, and a third-year medical student. PCs are placed primarily (95%) by the attending on service under ultrasound guidance using the Seldinger technique with lidocaine for anesthetic. For all PC consults, the attending BPS physician reviews the indication prior to placement. If not a direct consult from surgical services, most PC consults are appropriate referrals to the service after the primary medicine service has consulted CT-surgery or p ulmonary consult teams. After review, the primary role of the BPS is assessing safety of PC placement, including whether the patient can tolerate PC placement without procedural sedation. The BPS’s additional standards for safe PC placement are listed in Table 1.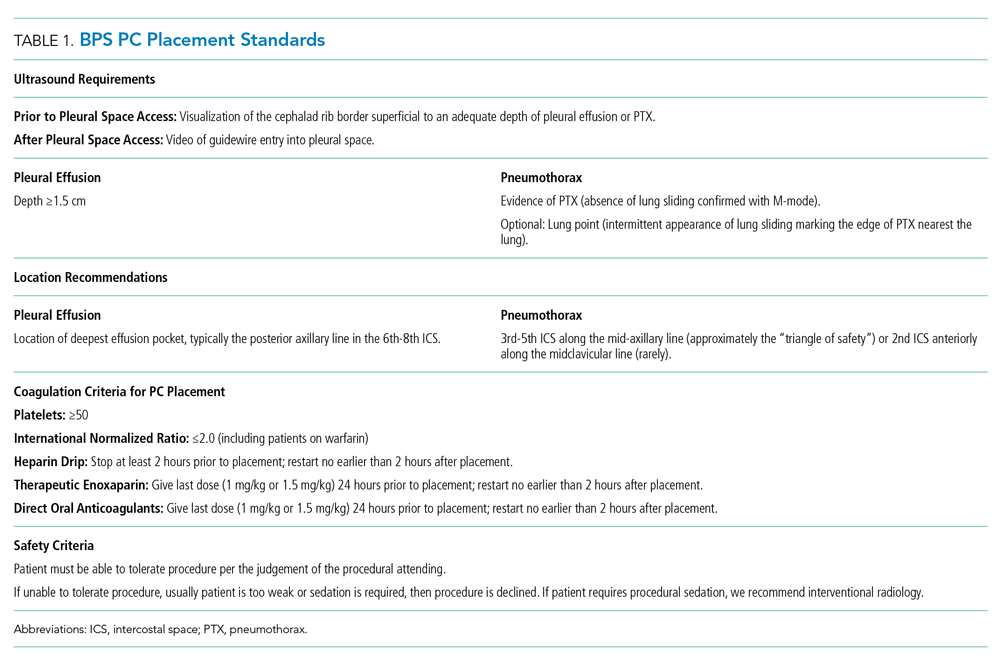
Additionally, it is not routine practice of the BPS to recommend PC placement when consulted for a thoracentesis. The exception to this rule is patients whose PPE sonographic imaging demonstrates loculation or septations. This is consistent with the latest review on pleural disease.13 In addition, the institution’s CT surgery services prefer to initially treat septated PPEs with PCs and fibrinolytic therapy rather than immediate video-assisted thoracoscopic surgery (VATS).
The BPS operates a partnership with CT surgery in which, after successful PC placement, CT surgery manages the PC immediately and until removal including the negative pressure applied and need for fibrinolytic therapy. CT surgery also determines if secondary therapy, commonly second PC or VATS, is required. After PC placement, a portable chest x-ray (CXR) is taken and then BPS follows the patient in person the following day to note any insertion-related complications (IRCs).
In this paper, data on the consults to the BPS for PC placement over a 2-year period are presented. Primary outcomes included numbers of and indications for PCs consulted—attempted or not attempted—consulting services, IRCs, unsuccessful attempts (UAs), and adverse outcomes (AOs). PC duration, fluid drainage, need for fibrinolytic therapy, or need for secondary therapy were not measured because these decisions were managed by the CT surgery service.
PATIENTS AND METHODS
Institutional review board approval of this retrospective study was granted by MCW/Froedtert Hospital Institutional Review Board #5 on January 14, 2019 (MCW IRB #PRO00033496). Adult patients hospitalized at Froedtert Hospital whose primary team determined they would clinically benefit from a PC and consulted the BPS service for placement were included. There were no exclusion criteria.
The authors conducted a retrospective review of two secure BPS databases. The first database is a record of all procedure consults, while the second database contains information about all attempted PCs. Initial review of the BPS’s consult database found 142 PC consults. Consults were classified as “declined” or “attempted.”
RESULTS
Over a 2-year period, the BPS was consulted to place 142 PCs. After resolution of the 3 discrepancies, total consults remained 142, PC attempts totaled 124 (87.3%), and declined consults totaled 18 (12.7%).
The 18 declined consults were not performed for reasons relating to procedural safety. These included 15 (83.3%) for insufficient fluid depth, 1 (5.6%) poor window for PTX, and 1 (5.6%) patient unstable per BPS attending judgement. One (5.6%) final consult had a previous drain in same hemithorax that resumed functioning.
The manual chart review of procedures performed 48 hours after declined PC consults found only 3 of 17 (17.6%) patients received a PC within the subsequent 48 hours. The 18th patient was unable to be followed in our electronic medical record because his medical record number was recorded incorrectly.
The remaining 124 consults were deemed safe for PC placement. Indications for PC placement varied; the most common indications were complicated effusion (36.3%), large or recurrent effusions (21.8%), PTX (17%), and hemothorax (HTX; 17%). The most common teams who consulted the BPS for PC were medicine/hospitalists (42.7%) and CT surgery (40.3%).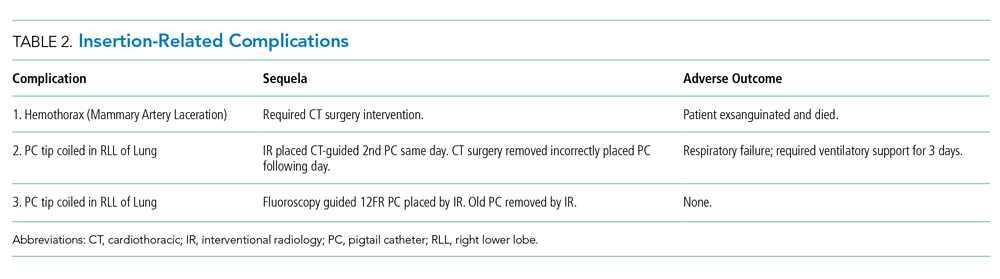
Three UAs were charted in the database, but on review it was determined that only 2 (1.6%) qualified as UAs (Table 3). A PC was attempted with the UA patient No. 3 for a loculated apical PTX. It is clear in the procedure note that the pleural space was accessed, air was appropriately drained, and a PC was advanced safely into the pleural space; however, the PC then stopped draining air. CXR interpretation also noted “pneumothorax described on prior exam is less evident.” Because the pleural space was accessed safely and had a partially therapeutic response, we do not count this PC placement as a UA. The PC may count as “failed,” but determination of a “failure rate” is not the intent of this paper. This point is further discussed in the Discussion section.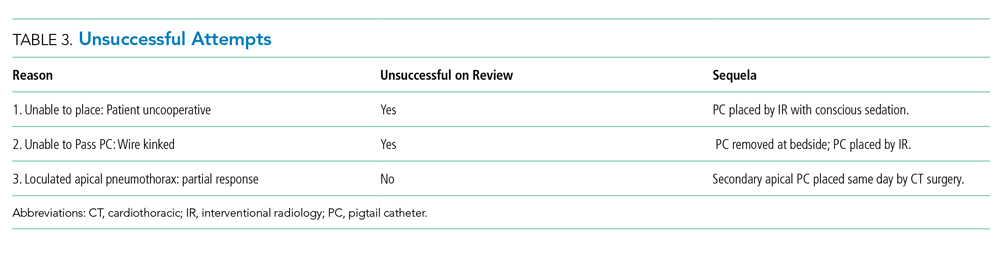
In addition, chart review demonstrated that UA patient No. 3 required intubation within the 24-hour period after our PC attempt, which is an AO. Approximately 10 hours after our PC was placed and removed, CT surgery placed a second PC, and 3 hours after their PC placement, the patient was intubated with subsequent bronchoscopy. The patient was extubated after only 17 hours. This sequence of events suggests mucus plugging as a more likely cause for respiratory failure than our PC attempt, but we have included it as an AO given the time frame.
Overall, the AO rate was low. Out of 124 attempted PC placements only 3 (2.4%) had an AO, and as noted above, it is believed that 2 of these patients had an AO caused by other medical problems rather than by PC placement.
DISCUSSION
To our knowledge, this is the first report of the experience of procedure-focused hospitalists with PC placement in a partnership with CT surgery. We believe that, at high volume, tertiary care centers similar to Froedtert Hospital, internal medicine–trained, procedure-focused hospitalists can serve as adjuncts to surgery, pulmonary, and IR services in the placement of PCs in hospitalized patients that do not require procedural sedation.
Given the development of this service and the nature of its shared operations with CT surgery, we do not believe that the BPS has an appropriate comparison in the literature; however, the IRCs are similar to previous papers describing PC placement.5-7,14 Notably, the IRC and AO rates were low, both 2.4%, which indicates safe placement of PCs. Kulvatunyou et al and Bauman et al reported on PC placement from a surgical perspective and reported IRC rates of 4%-10%.5-7,14 These higher IRC rates likely have a few reasons. First, Kulvatunyou et al and Bauman et al did not use ultrasound guidance. Use of ultrasound guidance may have significantly lowered their IRC rate. Second, the definition of IRC used by Kulvatunyou et al and Bauman et al included dislodgements, but we do not believe this to be an IRC. Dislodgements can happen for several reasons, frequently a result of patient movement or forgetfulness, not because of improper placement. Third, the PCs with this BPS are placed primarily by attending physicians. Resident roles on our BPS in PC placement are primarily as assistants, whereas Kulvatunyou et al and Bauman et al note that both attendings and residents, under attending supervision, placed PCs; however, it is not clear what percentage of PCs were placed by attendings or residents in their studies. Finally, this BPS’s IRCs are self-reported, so they could be perceived as falsely low, but given the small number of physicians involved in the group and its standardized follow-up, we do not suspect this is truly contributing to the low rates.
Other complication rates regarding the use of wire-guided SBCTs and PCs range from 0% to 42%15-20; however, several differences including tube size, physician training, and PC indication make these studies imperfect comparisons. The most notable difference in our opinion is the variable definition, or lack of definition, of a complication. One study did not define their complications,19 while other studies list subjective measures like pain,16,20 cough,16 bleeding, 16,20 and hematomas4,15 as complications. We believe that the lack of consensus definition for PC complication or IRC contributes to the large range of complication rates in the literature. This problem is likely not unique to PC placement, but is instead true across all bedside procedures. In a shared-practice model between hospitalists and CT surgeons, we believe the definition of IRC in this paper is adequate in capturing most complications. The only complication we are currently unable to track well is infection. We consider other items discussed previously, such as pain, cough (often from lung re-expansion), minor bleeding, and even small hematomas, to be a part of the procedure and not a complication.
Finally, regarding the IRCs and associated death, this was a tragic event. Complications for all of the BPS’s procedures are infrequent (0.35% over the same time period) and reviewed between the BPS director and the attending who performed the procedure; in addition, given this mortality, the case was reviewed immediately in detail with our CT surgery colleagues. On review, it was easy to determine that the operator had found a clear lung tip and sonographic signs of PTX; however, CXR review did demonstrate a medial placement of the PC. This was judged to be a poor placement location (even with imaging demonstrating PTX in that area) given the well-known “triangle of safety” defined by the British Thoracic Society.12
After review, the primary emphasis for PC placement was safe location. The BPS now strives to place PCs for PTX only in the “triangle of safety.” The BPS believe that most PTXs can be addressed with this placement. In the rare case of a PTX requiring an anterior approach, only the BPS director currently places apical PCs for PTX while on service or “on call.” He discusses the placement with pulmonary and CT surgery directly to determine that the PC is of absolute necessity.
Given the focus on appropriate location, no formal changes were made to the procedural imaging practice described in Table 1. We realize that vascular imaging would seem necessary after this patient’s mammary artery laceration; however, safe location, in addition to the BPS’s current image requirements, is believed to minimize this risk. We feel the imaging criteria align with recommendation No. 5 of the Society of Hospital Medicine’s Position Statement for Ultrasound Guidance for Adult Thoracentesis.21 Some BPS members use vascular ultrasound imaging to confirm absence of vascularity, but it is not required and occasionally not possible, such as in the occasional case of PTX with subcutaneous emphysema.
The UA rate is low without a natural comparator in the literature. It is important to clarify the difference between the UAs and the frequently mentioned “failure rate” (FR) in Kulvatunyou et al and Bauman et al6,7,14 We classify UAs as the inability, for any reason, to access the pleural space and insert a PC. At this stage, these UAs appear to reflect the service’s new experience with PC placement and inability to provide procedural sedation. Kulvatunyou et al and Bauman et al’s FR is defined as an initial PC successfully placed into the pleural space that then required a second PC or intervention (frequently VATS) to resolve the PTX or retained HTX.
We believe calculating the failure rate will be helpful in demonstrating the value of our BPS and our shared-practice model. We look forward to publishing this and other future research, including determination of the cost and time saved by the BPS for PCs and other procedures.
Limitations of this study include its retrospective nature, results from a single center’s experience, and lack of a comparison group.
Our institution feels that there is great benefit in having a BPS operated by procedure-focused hospitalists. It would also be important to determine if our model can be replicated by another institution.
Acknowledgments
The authors thank CT surgery for helping to develop this shared-practice model and to both CT surgery and IR physicians here at the Medical College of Wisconsin and Froedtert Hospital who assist us with both IRCs and UAs of pigtail catheters.
The authors also thank Dr. Ricardo Franco-Sadud for his oversight and thoughtful improvements to the paper.
1. Chang SH, Kang YN, Chiu HY, Chiu YH. A Systematic Review and Meta-Analysis Comparing Pigtail Catheter and Chest Tube as the Initial Treatment for Pneumothorax. Chest. 2018;153(5):1201-1212. https://doi.org/10.1016/j.chest.2018.01.048.
2. Voisin F, Sohier L, Rochas Y, et al. Ambulatory management of large spontaneous pneumothorax with pigtail catheters. Ann Emerg Med. 2014;64(3):222-228. https://doi.org/10.1016/j.annemergmed.2013.12.017.
3. Lin YC, Tu CY, Liang SJ, et al. Pigtail catheter for the management of pneumothorax in mechanically ventilated patients. Am J Emerg Med. 2010;28(4):466-471. https://doi.org/10.1016/j.ajem.2009.01.033.
4. Tsai WK, Chen W, Lee JC, et al. Pigtail catheters vs large-bore chest tubes for management of secondary spontaneous pneumothoraces in adults. Am J Emerg Med. 2006;24(7):795-800. https://doi.org/10.1016/j.ajem.2006.04.006.
5. Kulvatunyou N, Erickson L, Vijayasekaran A, et al. Randomized clinical trial of pigtail catheter versus chest tube in injured patients with uncomplicated traumatic pneumothorax. Br J Surg. 2014;101(2):17-22. https://doi.org/10.1002/bjs.9377.
6. Kulvatunyou N, Joseph B, Friese RS, et al. 14 French pigtail catheters placed by surgeons to drain blood on trauma patients: is 14-Fr too small? J Trauma Acute Care Surg. 2012;73(6):1423-1427. https://doi.org/10.1097/TA.0b013e318271c1c7.
7. Bauman ZM, Kulvatunyou N, Joseph B, et al. A Prospective Study of 7-Year Experience Using Percutaneous 14-French Pigtail Catheters for Traumatic Hemothorax/Hemopneumothorax at a Level-1 Trauma Center: Size Still Does Not Matter. World J Surg. 2018;42(1):107-113. https://doi.org/10.1007/s00268-017-4168-3.
8. Fysh ET, Smith NA, Lee YC. Optimal chest drain size: the rise of the small-bore pleural catheter. Semin Respir Crit Care Med. 2010;31(6):760-768. https://doi.org/10.1055/s-0030-1269836.
9. Ozkan OS, Ozmen MN, Akhan O. Percutaneous management of parapneumonic effusions. Eur J Radiol. 2005;55(3):311-320. https://doi.org/10.1016/j.ejrad.2005.03.004.
10. Rahman NM, Maskell NA, Davies CW, et al. The relationship between chest tube size and clinical outcome in pleural infection. Chest. 2010;137(3):536-543. https://doi.org/10.1378/chest.09-1044.
11. Saffran L, Ost DE, Fein AM, Schiff MJ. Outpatient pleurodesis of malignant pleural effusions using a small-bore pigtail catheter. Chest. 2000;118(2):417-421. https://doi.org/10.1378/chest.118.2.417.
12. Havelock T, Teoh R, Laws D, Gleeson F, Group BPDG. Pleural procedures and thoracic ultrasound: British Thoracic Society Pleural Disease Guideline 2010. Thorax. 2010;65 Suppl 2:ii61-76. https://doi.org/10.1136/thx.2010.137026.
13. Feller-Kopman D, Light R. Pleural disease. N Engl J Med. 2018;378(8):740-751. https://doi.org/10.1056/NEJMra1403503.
14. Kulvatunyou N, Vijayasekaran A, Hansen A, et al. Two-year experience of using pigtail catheters to treat traumatic pneumothorax: A changing trend. J Trauma. 2011;71(5):1104-1107; discussion 1107. https://doi.org/10.1097/TA.0b013e31822dd130.
15. Cantin L, Chartrand-Lefebvre C, Lepanto L, et al. Chest tube drainage under radiological guidance for pleural effusion and pneumothorax in a tertiary care university teaching hospital: Review of 51 cases. Can Respir J. 2005;12(1):29-33. https://doi.org/10.1155/2005/498709.
16. Horsley A, Jones L, White J, Henry M. Efficacy and complications of small-bore, wire-guided chest drains. Chest. 2006;130(6):1857-1863. https://doi.org/10.1378/chest.130.6.1857.
17. Merriam MA, Cronan JJ, Dorfman GS, Lambiase RE, Haas RA. Radiographically guided percutaneous catheter drainage of pleural fluid collections. Am J Roentgenol. 1988;151(6):1113-1116. https://doi.org/10.2214/ajr.151.6.1113.
18. Petel D, Li P, Emil S. Percutaneous pigtail catheter versus tube thoracostomy for pediatric empyema: A comparison of outcomes. Surgery. 2013;154(4):655-660; discussion 660-651. https://doi.org/10.1016/j.surg.2013.04.032.
19. Gammie JS, Banks MC, Fuhrman CR, et al. The pigtail catheter for pleural drainage: a less invasive alternative to tube thoracostomy. JSLS. 1999;3(1):57-61.
20. Davies HE, Merchant S, McGown A. A study of the complications of small bore ‘Seldinger’ intercostal chest drains. Respirology. 2008;13(4):603-607. https://doi.org/10.1111/j.1440-1843.2008.01296.x.
21. Dancel R, Schnobrich D, Puri N, et al. Recommendations on the Use of Ultrasound Guidance for Adult Thoracentesis: A Position Statement of the Society of Hospital Medicine. J Hosp Med. 2018;13(2):126-135. https://doi.org/10.12788/jhm.2940.
Over the last 15 years, studies have demonstrated the efficacy of small-bore chest tubes (SBCTs), or pigtail catheters (PCs, most commonly ≤14 French), in treating pneumothorax (PTX),1-5 traumatic hemothorax (THTX), hemopneumothorax (HPTX),6,7 parapneumonic effusions (PPEs),8,9 pleural infections,10 and symptomatic malignant pleural effusions.11 A randomized, controlled trial also showed that PC placement resulted in better pain scores, compared with large-bore chest tubes (LBCTs), for traumatic PTX.5 The British Thoracic Society does state that LBCTs may be needed for PTXs with very large air leaks, especially postoperatively. Further, LBCTs may be indicated if small-bore drainage fails, but otherwise they recommend PCs as first-line therapy for PTX, free flowing pleural effusions, and pleural infections.12
BEDSIDE PROCEDURE SERVICE DEVELOPMENT
The Medical College of Wisconsin (MCW) provides hospitalist services to
BPS Pigtail Catheter Training
CT surgery initially trained the BPS director in PC placement using the Seldinger technique in 2015. The director’s training period with CT surgery included direct observation by CT surgery providers for 5 PC placements. Prior to placing PCs, the director had performed approximately 400 ultrasound-guided thoracenteses. The BPS director then independently trained the remaining BPS and has placed or supervised over half of the service’s 124 PCs. Initial credentialing for each BPS physician requires 5 PC placements and 20 thoracenteses under direct supervision of credentialed BPS members. Credentialing is maintained by BPS physicians completing 3 PCs and 15 thoracenteses per year.
Newly credentialed providers are capable of independently placing most PCs. However, the requirements for credentialing are minimal and newly credentialed physicians still encounter PC placements with challenging factors not addressed in their training, such as anterior approach, small effusions, atypical effusion location, mild to moderate coagulopathy, recent therapeutic anticoagulation, and large body habitus. To address these challenges, the BPS has instituted an “on call” system. This system is typically staffed by the BPS director or associate director, already attending on a separate medical service. When needed, the “on call” physician will supervise the newer BPS members to ensure safety while the less experienced physician places the PC. Although rare, if an “on call” member is not available, then it is the practice of the BPS to recommend IR for PC placement.
BPS Operation
Daily BPS operation consists of one attending hospitalist, two internal medicine residents, and a third-year medical student. PCs are placed primarily (95%) by the attending on service under ultrasound guidance using the Seldinger technique with lidocaine for anesthetic. For all PC consults, the attending BPS physician reviews the indication prior to placement. If not a direct consult from surgical services, most PC consults are appropriate referrals to the service after the primary medicine service has consulted CT-surgery or p ulmonary consult teams. After review, the primary role of the BPS is assessing safety of PC placement, including whether the patient can tolerate PC placement without procedural sedation. The BPS’s additional standards for safe PC placement are listed in Table 1.
Additionally, it is not routine practice of the BPS to recommend PC placement when consulted for a thoracentesis. The exception to this rule is patients whose PPE sonographic imaging demonstrates loculation or septations. This is consistent with the latest review on pleural disease.13 In addition, the institution’s CT surgery services prefer to initially treat septated PPEs with PCs and fibrinolytic therapy rather than immediate video-assisted thoracoscopic surgery (VATS).
The BPS operates a partnership with CT surgery in which, after successful PC placement, CT surgery manages the PC immediately and until removal including the negative pressure applied and need for fibrinolytic therapy. CT surgery also determines if secondary therapy, commonly second PC or VATS, is required. After PC placement, a portable chest x-ray (CXR) is taken and then BPS follows the patient in person the following day to note any insertion-related complications (IRCs).
In this paper, data on the consults to the BPS for PC placement over a 2-year period are presented. Primary outcomes included numbers of and indications for PCs consulted—attempted or not attempted—consulting services, IRCs, unsuccessful attempts (UAs), and adverse outcomes (AOs). PC duration, fluid drainage, need for fibrinolytic therapy, or need for secondary therapy were not measured because these decisions were managed by the CT surgery service.
PATIENTS AND METHODS
Institutional review board approval of this retrospective study was granted by MCW/Froedtert Hospital Institutional Review Board #5 on January 14, 2019 (MCW IRB #PRO00033496). Adult patients hospitalized at Froedtert Hospital whose primary team determined they would clinically benefit from a PC and consulted the BPS service for placement were included. There were no exclusion criteria.
The authors conducted a retrospective review of two secure BPS databases. The first database is a record of all procedure consults, while the second database contains information about all attempted PCs. Initial review of the BPS’s consult database found 142 PC consults. Consults were classified as “declined” or “attempted.”
RESULTS
Over a 2-year period, the BPS was consulted to place 142 PCs. After resolution of the 3 discrepancies, total consults remained 142, PC attempts totaled 124 (87.3%), and declined consults totaled 18 (12.7%).
The 18 declined consults were not performed for reasons relating to procedural safety. These included 15 (83.3%) for insufficient fluid depth, 1 (5.6%) poor window for PTX, and 1 (5.6%) patient unstable per BPS attending judgement. One (5.6%) final consult had a previous drain in same hemithorax that resumed functioning.
The manual chart review of procedures performed 48 hours after declined PC consults found only 3 of 17 (17.6%) patients received a PC within the subsequent 48 hours. The 18th patient was unable to be followed in our electronic medical record because his medical record number was recorded incorrectly.
The remaining 124 consults were deemed safe for PC placement. Indications for PC placement varied; the most common indications were complicated effusion (36.3%), large or recurrent effusions (21.8%), PTX (17%), and hemothorax (HTX; 17%). The most common teams who consulted the BPS for PC were medicine/hospitalists (42.7%) and CT surgery (40.3%).
Three UAs were charted in the database, but on review it was determined that only 2 (1.6%) qualified as UAs (Table 3). A PC was attempted with the UA patient No. 3 for a loculated apical PTX. It is clear in the procedure note that the pleural space was accessed, air was appropriately drained, and a PC was advanced safely into the pleural space; however, the PC then stopped draining air. CXR interpretation also noted “pneumothorax described on prior exam is less evident.” Because the pleural space was accessed safely and had a partially therapeutic response, we do not count this PC placement as a UA. The PC may count as “failed,” but determination of a “failure rate” is not the intent of this paper. This point is further discussed in the Discussion section.
In addition, chart review demonstrated that UA patient No. 3 required intubation within the 24-hour period after our PC attempt, which is an AO. Approximately 10 hours after our PC was placed and removed, CT surgery placed a second PC, and 3 hours after their PC placement, the patient was intubated with subsequent bronchoscopy. The patient was extubated after only 17 hours. This sequence of events suggests mucus plugging as a more likely cause for respiratory failure than our PC attempt, but we have included it as an AO given the time frame.
Overall, the AO rate was low. Out of 124 attempted PC placements only 3 (2.4%) had an AO, and as noted above, it is believed that 2 of these patients had an AO caused by other medical problems rather than by PC placement.
DISCUSSION
To our knowledge, this is the first report of the experience of procedure-focused hospitalists with PC placement in a partnership with CT surgery. We believe that, at high volume, tertiary care centers similar to Froedtert Hospital, internal medicine–trained, procedure-focused hospitalists can serve as adjuncts to surgery, pulmonary, and IR services in the placement of PCs in hospitalized patients that do not require procedural sedation.
Given the development of this service and the nature of its shared operations with CT surgery, we do not believe that the BPS has an appropriate comparison in the literature; however, the IRCs are similar to previous papers describing PC placement.5-7,14 Notably, the IRC and AO rates were low, both 2.4%, which indicates safe placement of PCs. Kulvatunyou et al and Bauman et al reported on PC placement from a surgical perspective and reported IRC rates of 4%-10%.5-7,14 These higher IRC rates likely have a few reasons. First, Kulvatunyou et al and Bauman et al did not use ultrasound guidance. Use of ultrasound guidance may have significantly lowered their IRC rate. Second, the definition of IRC used by Kulvatunyou et al and Bauman et al included dislodgements, but we do not believe this to be an IRC. Dislodgements can happen for several reasons, frequently a result of patient movement or forgetfulness, not because of improper placement. Third, the PCs with this BPS are placed primarily by attending physicians. Resident roles on our BPS in PC placement are primarily as assistants, whereas Kulvatunyou et al and Bauman et al note that both attendings and residents, under attending supervision, placed PCs; however, it is not clear what percentage of PCs were placed by attendings or residents in their studies. Finally, this BPS’s IRCs are self-reported, so they could be perceived as falsely low, but given the small number of physicians involved in the group and its standardized follow-up, we do not suspect this is truly contributing to the low rates.
Other complication rates regarding the use of wire-guided SBCTs and PCs range from 0% to 42%15-20; however, several differences including tube size, physician training, and PC indication make these studies imperfect comparisons. The most notable difference in our opinion is the variable definition, or lack of definition, of a complication. One study did not define their complications,19 while other studies list subjective measures like pain,16,20 cough,16 bleeding, 16,20 and hematomas4,15 as complications. We believe that the lack of consensus definition for PC complication or IRC contributes to the large range of complication rates in the literature. This problem is likely not unique to PC placement, but is instead true across all bedside procedures. In a shared-practice model between hospitalists and CT surgeons, we believe the definition of IRC in this paper is adequate in capturing most complications. The only complication we are currently unable to track well is infection. We consider other items discussed previously, such as pain, cough (often from lung re-expansion), minor bleeding, and even small hematomas, to be a part of the procedure and not a complication.
Finally, regarding the IRCs and associated death, this was a tragic event. Complications for all of the BPS’s procedures are infrequent (0.35% over the same time period) and reviewed between the BPS director and the attending who performed the procedure; in addition, given this mortality, the case was reviewed immediately in detail with our CT surgery colleagues. On review, it was easy to determine that the operator had found a clear lung tip and sonographic signs of PTX; however, CXR review did demonstrate a medial placement of the PC. This was judged to be a poor placement location (even with imaging demonstrating PTX in that area) given the well-known “triangle of safety” defined by the British Thoracic Society.12
After review, the primary emphasis for PC placement was safe location. The BPS now strives to place PCs for PTX only in the “triangle of safety.” The BPS believe that most PTXs can be addressed with this placement. In the rare case of a PTX requiring an anterior approach, only the BPS director currently places apical PCs for PTX while on service or “on call.” He discusses the placement with pulmonary and CT surgery directly to determine that the PC is of absolute necessity.
Given the focus on appropriate location, no formal changes were made to the procedural imaging practice described in Table 1. We realize that vascular imaging would seem necessary after this patient’s mammary artery laceration; however, safe location, in addition to the BPS’s current image requirements, is believed to minimize this risk. We feel the imaging criteria align with recommendation No. 5 of the Society of Hospital Medicine’s Position Statement for Ultrasound Guidance for Adult Thoracentesis.21 Some BPS members use vascular ultrasound imaging to confirm absence of vascularity, but it is not required and occasionally not possible, such as in the occasional case of PTX with subcutaneous emphysema.
The UA rate is low without a natural comparator in the literature. It is important to clarify the difference between the UAs and the frequently mentioned “failure rate” (FR) in Kulvatunyou et al and Bauman et al6,7,14 We classify UAs as the inability, for any reason, to access the pleural space and insert a PC. At this stage, these UAs appear to reflect the service’s new experience with PC placement and inability to provide procedural sedation. Kulvatunyou et al and Bauman et al’s FR is defined as an initial PC successfully placed into the pleural space that then required a second PC or intervention (frequently VATS) to resolve the PTX or retained HTX.
We believe calculating the failure rate will be helpful in demonstrating the value of our BPS and our shared-practice model. We look forward to publishing this and other future research, including determination of the cost and time saved by the BPS for PCs and other procedures.
Limitations of this study include its retrospective nature, results from a single center’s experience, and lack of a comparison group.
Our institution feels that there is great benefit in having a BPS operated by procedure-focused hospitalists. It would also be important to determine if our model can be replicated by another institution.
Acknowledgments
The authors thank CT surgery for helping to develop this shared-practice model and to both CT surgery and IR physicians here at the Medical College of Wisconsin and Froedtert Hospital who assist us with both IRCs and UAs of pigtail catheters.
The authors also thank Dr. Ricardo Franco-Sadud for his oversight and thoughtful improvements to the paper.
1. Chang SH, Kang YN, Chiu HY, Chiu YH. A Systematic Review and Meta-Analysis Comparing Pigtail Catheter and Chest Tube as the Initial Treatment for Pneumothorax. Chest. 2018;153(5):1201-1212. https://doi.org/10.1016/j.chest.2018.01.048.
2. Voisin F, Sohier L, Rochas Y, et al. Ambulatory management of large spontaneous pneumothorax with pigtail catheters. Ann Emerg Med. 2014;64(3):222-228. https://doi.org/10.1016/j.annemergmed.2013.12.017.
3. Lin YC, Tu CY, Liang SJ, et al. Pigtail catheter for the management of pneumothorax in mechanically ventilated patients. Am J Emerg Med. 2010;28(4):466-471. https://doi.org/10.1016/j.ajem.2009.01.033.
4. Tsai WK, Chen W, Lee JC, et al. Pigtail catheters vs large-bore chest tubes for management of secondary spontaneous pneumothoraces in adults. Am J Emerg Med. 2006;24(7):795-800. https://doi.org/10.1016/j.ajem.2006.04.006.
5. Kulvatunyou N, Erickson L, Vijayasekaran A, et al. Randomized clinical trial of pigtail catheter versus chest tube in injured patients with uncomplicated traumatic pneumothorax. Br J Surg. 2014;101(2):17-22. https://doi.org/10.1002/bjs.9377.
6. Kulvatunyou N, Joseph B, Friese RS, et al. 14 French pigtail catheters placed by surgeons to drain blood on trauma patients: is 14-Fr too small? J Trauma Acute Care Surg. 2012;73(6):1423-1427. https://doi.org/10.1097/TA.0b013e318271c1c7.
7. Bauman ZM, Kulvatunyou N, Joseph B, et al. A Prospective Study of 7-Year Experience Using Percutaneous 14-French Pigtail Catheters for Traumatic Hemothorax/Hemopneumothorax at a Level-1 Trauma Center: Size Still Does Not Matter. World J Surg. 2018;42(1):107-113. https://doi.org/10.1007/s00268-017-4168-3.
8. Fysh ET, Smith NA, Lee YC. Optimal chest drain size: the rise of the small-bore pleural catheter. Semin Respir Crit Care Med. 2010;31(6):760-768. https://doi.org/10.1055/s-0030-1269836.
9. Ozkan OS, Ozmen MN, Akhan O. Percutaneous management of parapneumonic effusions. Eur J Radiol. 2005;55(3):311-320. https://doi.org/10.1016/j.ejrad.2005.03.004.
10. Rahman NM, Maskell NA, Davies CW, et al. The relationship between chest tube size and clinical outcome in pleural infection. Chest. 2010;137(3):536-543. https://doi.org/10.1378/chest.09-1044.
11. Saffran L, Ost DE, Fein AM, Schiff MJ. Outpatient pleurodesis of malignant pleural effusions using a small-bore pigtail catheter. Chest. 2000;118(2):417-421. https://doi.org/10.1378/chest.118.2.417.
12. Havelock T, Teoh R, Laws D, Gleeson F, Group BPDG. Pleural procedures and thoracic ultrasound: British Thoracic Society Pleural Disease Guideline 2010. Thorax. 2010;65 Suppl 2:ii61-76. https://doi.org/10.1136/thx.2010.137026.
13. Feller-Kopman D, Light R. Pleural disease. N Engl J Med. 2018;378(8):740-751. https://doi.org/10.1056/NEJMra1403503.
14. Kulvatunyou N, Vijayasekaran A, Hansen A, et al. Two-year experience of using pigtail catheters to treat traumatic pneumothorax: A changing trend. J Trauma. 2011;71(5):1104-1107; discussion 1107. https://doi.org/10.1097/TA.0b013e31822dd130.
15. Cantin L, Chartrand-Lefebvre C, Lepanto L, et al. Chest tube drainage under radiological guidance for pleural effusion and pneumothorax in a tertiary care university teaching hospital: Review of 51 cases. Can Respir J. 2005;12(1):29-33. https://doi.org/10.1155/2005/498709.
16. Horsley A, Jones L, White J, Henry M. Efficacy and complications of small-bore, wire-guided chest drains. Chest. 2006;130(6):1857-1863. https://doi.org/10.1378/chest.130.6.1857.
17. Merriam MA, Cronan JJ, Dorfman GS, Lambiase RE, Haas RA. Radiographically guided percutaneous catheter drainage of pleural fluid collections. Am J Roentgenol. 1988;151(6):1113-1116. https://doi.org/10.2214/ajr.151.6.1113.
18. Petel D, Li P, Emil S. Percutaneous pigtail catheter versus tube thoracostomy for pediatric empyema: A comparison of outcomes. Surgery. 2013;154(4):655-660; discussion 660-651. https://doi.org/10.1016/j.surg.2013.04.032.
19. Gammie JS, Banks MC, Fuhrman CR, et al. The pigtail catheter for pleural drainage: a less invasive alternative to tube thoracostomy. JSLS. 1999;3(1):57-61.
20. Davies HE, Merchant S, McGown A. A study of the complications of small bore ‘Seldinger’ intercostal chest drains. Respirology. 2008;13(4):603-607. https://doi.org/10.1111/j.1440-1843.2008.01296.x.
21. Dancel R, Schnobrich D, Puri N, et al. Recommendations on the Use of Ultrasound Guidance for Adult Thoracentesis: A Position Statement of the Society of Hospital Medicine. J Hosp Med. 2018;13(2):126-135. https://doi.org/10.12788/jhm.2940.
© 2020 Society of Hospital Medicine
A Qualitative Study of Increased Pediatric Reutilization After a Postdischarge Home Nurse Visit
Readmission rates are used as metrics for care quality and reimbursement, with penalties applied to hospitals with higher than expected rates1 and up to 30% of pediatric readmissions deemed potentially preventable.2 There is a paucity of information on how to prevent pediatric readmissions,3 yet pediatric hospitals are tasked with implementing interventions for readmission reduction.
The Hospital to Home Outcomes (H2O) trial was a 2-arm, randomized controlled trial in which patients discharged from hospital medicine and neuroscience services at a single institution were randomized to receive a single home visit from a registered nurse (RN) within 96 hours of discharge.4 RNs completed a structured nurse visit designed specifically for the trial. Lists of “red flags” or warning signs associated with common diagnoses were provided to assist RNs in standardizing education about when to seek additional care. The hypothesis was that the postdischarge visits would result in lower reutilization rates (unplanned readmissions, emergency department [ED] visits, and urgent care visits).5
Unexpectedly, children randomized to receive the postdischarge nurse visit had higher rates of 30-day unplanned healthcare reutilization, with children randomly assigned to the intervention demonstrating higher odds of 30-day healthcare use (OR 1.33; 95% CI 1.003-1.76).4 We sought to understand perspectives on these unanticipated findings by obtaining input from relevant stakeholders. There were 2 goals for the qualitative analysis: first, to understand possible explanations of the increased reutilization finding; second, to elicit suggestions for improving the nurse visit intervention.
METHODS
We selected an in-depth qualitative approach, using interviews and focus groups to explore underlying explanations for the increase in 30-day unplanned healthcare reutilization among those randomized to receive the postdischarge nurse visit during the H2O trial.4 Input was sought from 4 stakeholder groups—parents, primary care physicians (PCPs), hospital medicine physicians, and home care RNs—in an effort to triangulate data sources and elicit rich and diverse opinions. Approval was obtained from the Institutional Review Board prior to conducting the study.
Recruitment
Parents
Because we conducted interviews approximately 1 year after the trial’s conclusion, we purposefully selected families who were enrolled in the latter portion of the H2O trial in order to enhance recall. Beginning with the last families in the study, we sequentially contacted families in reverse order. We contacted 10 families in each of 4 categories (intervention/reutilization, intervention/no reutilization, control/reutilization, control/no reutilization). A total of 3 attempts were made by telephone to contact each family. Participants received a grocery store gift card for participating in the study.
Primary Care Physicians
We conducted focus groups with a purposive sample of physicians recruited from 2 community practices and 1 hospital-owned practice.
Hospital Medicine Physicians
We conducted focus groups with a purposive sample of physicians from our Division of Hospital Medicine. There was a varying level of knowledge of the original trial; however, none of the participants were collaborators in the trial.
Home Care RNs
We conducted focus groups with a subset of RNs who were involved with trial visits. All RNs were members of the pediatric home care division associated with the hospital with specific training in caring for patients at home.
Data Collection
The study team designed question guides for each stakeholder group (Appendix 1). While questions were tailored for specific stakeholders, all guides included the following topics: benefits and challenges of nurse visits, suggestions for improving the intervention in future trials, and reactions to the trial results (once presented to participants). Only the results of the intention-to-treat (ITT) analysis were shared with stakeholders because ITT is considered the gold standard for trial analysis and allows easy understanding of the results.
A single investigator (A.L.) conducted parental interviews by telephone. Focus groups for PCPs, hospital medicine physicians, and RN groups were held at practice locations in private conference rooms and were conducted by trained moderators (S.N.S., A.L., and H.T.C.). Moderators probed responses to the open-ended questions to delve deeply into issues. The question guides were modified in an iterative fashion to include new concepts raised during interviews or focus groups. All interviews and focus groups were recorded and transcribed verbatim with all identifiable information redacted.
Data Analysis
During multiple cycles of inductive thematic analysis,6 we examined, discussed, interpreted, and organized responses to the open-ended questions,6,7 analyzing each stakeholder group separately. First, transcripts were shared with and reviewed by the entire multidisciplinary team (12 members) which included hospital medicine physicians, PCPs, home care nursing leaders, a nurse scientist, a parent representative, research coordinators, and a qualitative research methodologist. Second, team members convened to discuss overall concepts and ideas and created the preliminary coding frameworks. Third, a smaller subgroup (research coordinator [A.L]., hospital medicine physician [S.R.], parent representative [M.M.], and qualitative research methodologist [S.N.S.]), refined the unique coding framework for each stakeholder group and then independently applied codes to participant comments. This subgroup met regularly to reach consensus about the assigned codes and to further refine the codebooks. The codes were organized into major and minor themes based on recurring patterns in the data and the salience or emphasis given by participants. The subgroup’s work was reviewed and discussed on an ongoing basis by the entire multidisciplinary team. Triangulation of the data was achieved in multiple ways. The preliminary results were shared in several forums, and feedback was solicited and incorporated. Two of 4 members of the subgroup analytic team were not part of the trial planning or data collection, providing a potentially broader perspective. All coding decisions were maintained in an electronic database, and an audit trail was created to document codebook revisions.
RESULTS
A total of 33 parents participated in the interviews (intervention/readmit [8], intervention/no readmit [8], control/readmit [8], and control/no readmit [9]). Although we selected families from all 4 categories, we were not able to explore qualitative differences between these groups because of the relatively low numbers of participants. Parent data was very limited as interviews were brief and “control” parents had not received the intervention. Three focus groups were held with PCPs (7 participants in total), 2 focus groups were held with hospital medicine physicians (12 participants), and 2 focus groups were held with RNs (10 participants).
Goal 1: Explanation of Reutilization Rates
During interviews and focus groups, the results of the H2O trial were discussed, and stakeholders were asked to comment on potential explanations of the findings. 4 major themes and 5 minor themes emerged from analysis of the transcripts (summarized in Table 1).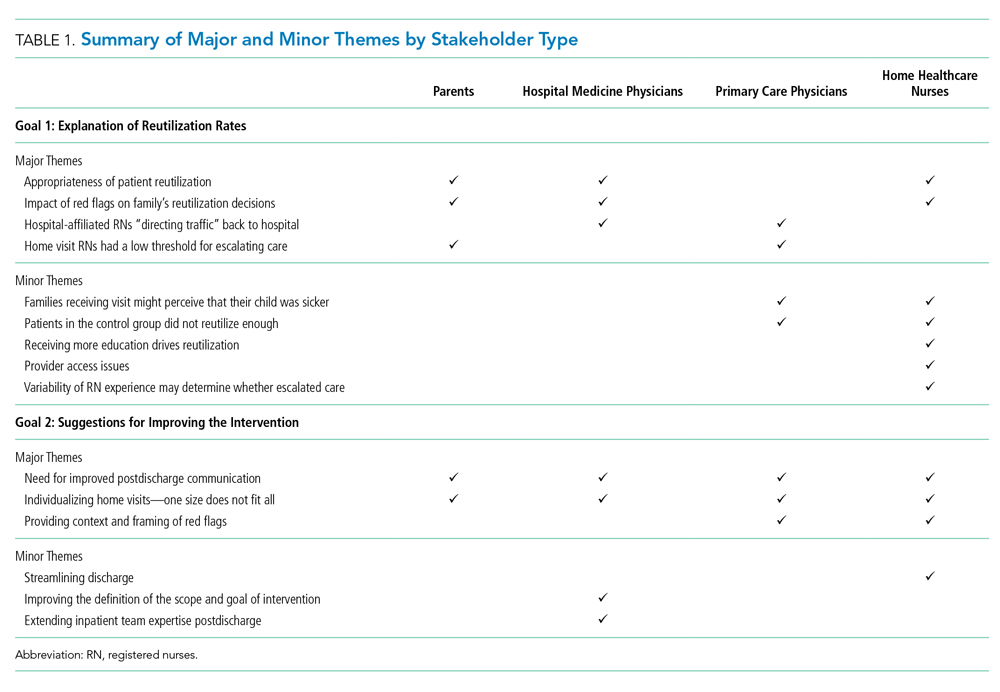
Theme 1: Appropriateness of Patient Reutilization
Hospital medicine physicians and home care RNs questioned whether the reutilization events were clinically indicated. RNs wondered whether children who reutilized the ED were also readmitted to the hospital; many perceived that if the child was ill enough to be readmitted, then the ED revisit was warranted (Table 2). Parents commented on parental decision-making and changes in clinical status of the child leading to reutilization (Table 2).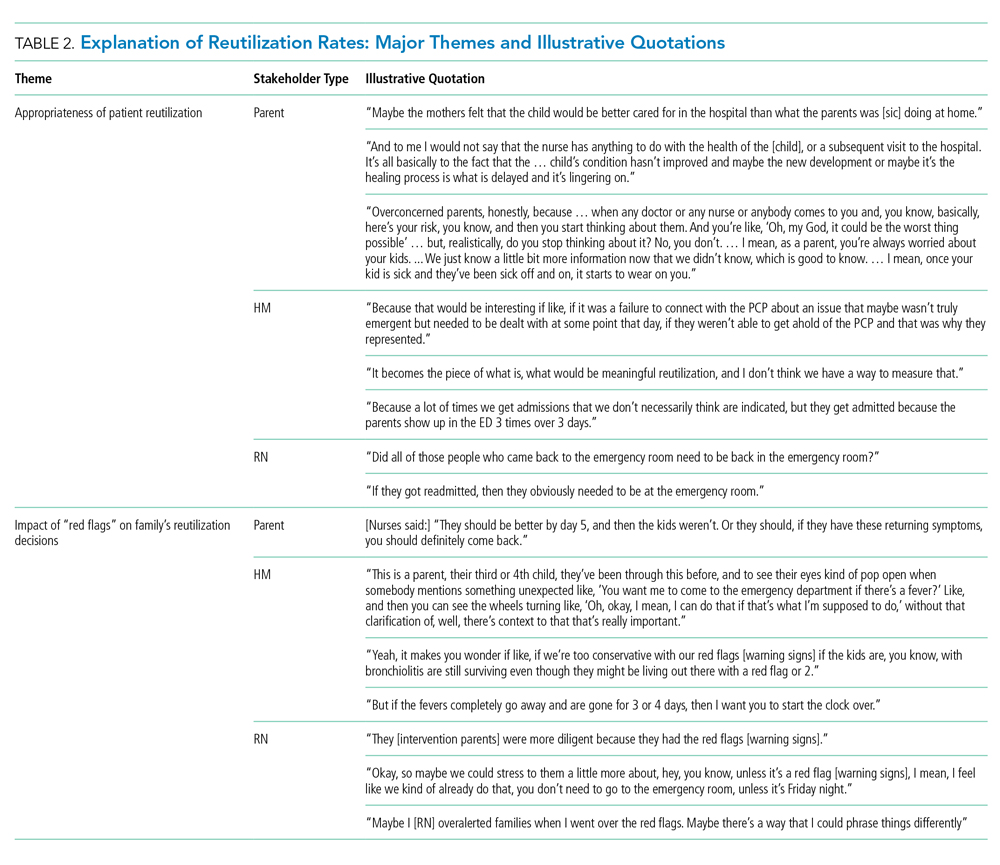
Theme 2: Impact of Red Flags/Warning Sign Instructions on Family’s Reutilization Decisions
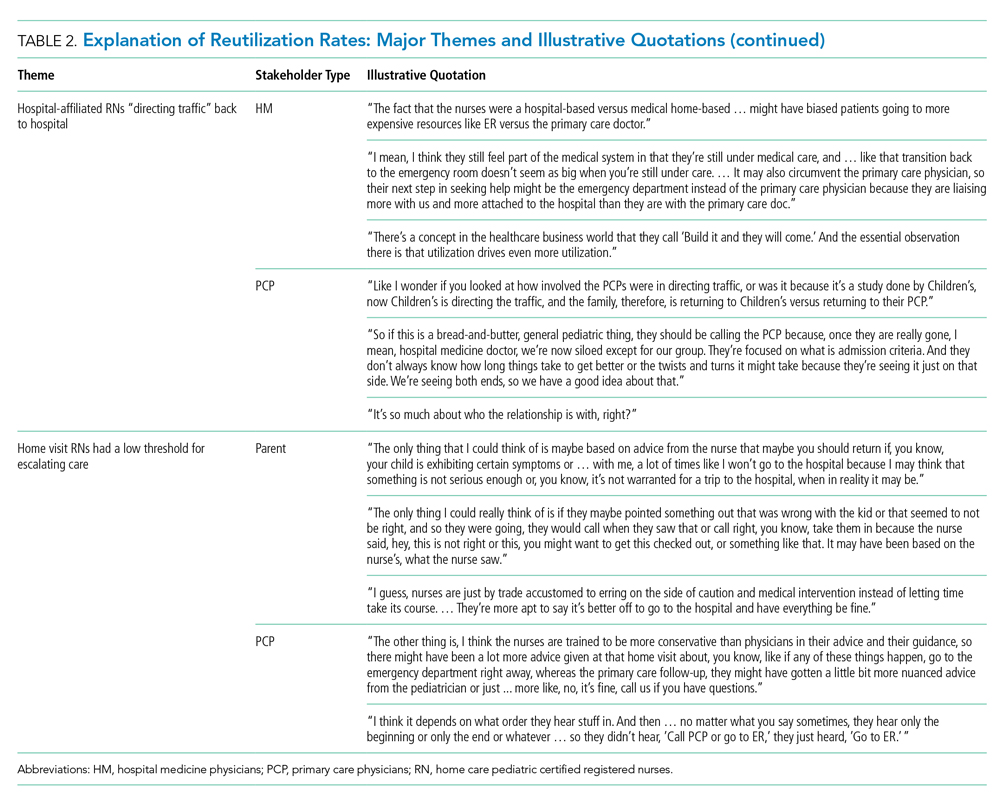
Theme 3: Hospital-Affiliated RNs “Directing Traffic” Back to Hospital
Both physician groups were concerned that, because the study was conducted by hospital-employed nurses, families might have been more likely to reaccess care at the hospital. Thus, the connection with the hospital was strengthened in the H2O model, potentially at the expense of the connection with PCPs. Physicians hypothesized that families might “still feel part of the medical system,” so families would return to the hospital if there was a problem. PCPs emphasized that there may have been straightforward situations that could have been handled appropriately in the outpatient office (Table 2).
Theme 4: Home Visit RNs Had a Low Threshold for Escalating Care
Parents and PCPs hypothesized that RNs are more conservative and, therefore, would have had a low threshold to refer back to the hospital if there were concerns in the home. One parent commented: “I guess, nurses are just by trade accustomed to erring on the side of caution and medical intervention instead of letting time take its course. … They’re more apt to say it’s better off to go to the hospital and have everything be fine” (Table 2).
Minor Themes
Participants also explained reutilization in ways that coalesced into 5 minor themes: (1) families receiving a visit might perceive that their child was sicker; (2) patients in the control group did not reutilize enough; (3) receiving more education on a child’s illness drives reutilization; (4) provider access issues; and (5) variability of RN experience may determine whether escalated care. Supportive quotations found in Appendix 2.
We directly asked parents if they would want a nurse home visit in the future after discussing the results of the study. Almost all of the parents in the intervention group and most of the parents in the control group were in favor of receiving a visit, even knowing that patients who had received a visit were more likely to reutilize care.
Goal 2: Suggestions for Improving Intervention Design
Three major themes and 3 minor themes were related to improving the design of the intervention (Table 1).
Theme 1: Need for Improved Postdischarge Communication
All stakeholder groups highlighted postdischarge communication as an area that could be improved. Parents were frustrated with regard to attempts to connect with inpatient physicians after discharge. PCPs suggested developing pathways for the RN to connect with the primary care office as opposed to the hospital. Hospital medicine physicians discussed a lack of consensus regarding patient ownership following discharge and were uncertain about what types of postdischarge symptoms PCPs would be comfortable managing. RNs described specific situations when they had difficulty contacting a physician to escalate care (Table 3).
Theme 2: Individualizing Home Visits—One Size Does Not Fit All
All stakeholder groups also encouraged “individualization” of home visits according to patient and family characteristics, diagnosis, and both timing and severity of illness. PCPs recommended visits only for certain diagnoses. Hospital medicine physicians voiced similar sentiments as the PCPs and added that worrisome family dynamics during a hospitalization, such as a lack of engagement with the medical team, might also warrant a visit. RNs suggested visits for those families with more concerns, for example, those with young children or children recovering from an acute respiratory illness (Table 3).
Theme 3: Providing Context for and Framing of Red Flags
Physicians and nurses suggested providing more context to “red flag” instructions and education. RNs emphasized that some families seemed to benefit from the opportunity to discuss their postdischarge concerns with a medical professional. Others appreciated concrete written instructions that spelled out how to respond in certain situations (Table 3).
Minor Themes
Three minor themes were revealed regarding intervention design improvement (Table 1): (1) streamlining the discharge process; (2) improving the definition of the scope and goal of intervention; and (3) extending inpatient team expertise post discharge. Supportive quotations can be found in Appendix 3.
DISCUSSION
When stakeholders were asked about why postdischarge RN visits led to increased postdischarge urgent healthcare visits, they questioned the appropriateness of the reutilization events, wondered about the lack of context for the warning signs that nurses provided families as part of the intervention, worried that families were encouraged to return to the hospital because of the ties of the trial to the hospital, and suggested that RNs had a low threshold to refer patients back to the hospital. When asked about how to design an improved nurse visit to better support families, stakeholders emphasized improving communication, individualizing the visit, and providing context around the red-flag discussion, enabling more nuanced instructions about how to respond to specific events.
A synthesis of themes suggests that potential drivers for increased utilization rates may lie in the design and goals of the initial project. The intervention was designed to support families and enhance education after discharge, with components derived from pretrial focus groups with families after a hospital discharge.8 The intervention was not designed to divert patients from the ED nor did it enhance access to the PCP. A second trial of the intervention adapted to a phone call also failed to decrease reutilization rates.9 Both physician stakeholder groups perceived that the intervention directed traffic back to the hospital because of the intervention design. Coupled with the perception that the red flags may have changed a family’s threshold for seeking care and/or that an RN may be more apt to refer back to care, this failure to push utilization to the primary care office may explain the unexpected trial results. Despite the stakeholders’ perception of enhanced connection back to the hospital as a result of the nurse visit, in analysis of visit referral patterns, a referral was made directly back to the ED in only 4 of the 651 trial visits (Tubbs-Cooley H, Riddle SR, Gold JM, et al.; under review. Pediatric clinical and social concerns identified by home visit nurses in the immediate postdischarge period 2020).
Both H2O trials demonstrated improved recall of red flags by parents who received the intervention, which may be important given the stakeholders’ perspectives that the red flags may not have been contextualized well enough. Yet neither trial demonstrated any differences in postdischarge coping or time to return to normal routine. In interviews with parents, despite the clearly stated results of increased reutilization, intervention parents endorsed a desire for a home visit in the future, raising the possibility that our outcome measures did not capture parents’ priorities adequately.
When asked to recommend design improvements of the intervention, 2 major themes (improvement in communication and individualization of visits) were discussed by all stakeholder groups, providing actionable information to modify or create new interventions. Focus groups with clinicians suggested that communication challenges may have influenced reutilization likelihood during the postdischarge period. RNs expressed uncertainty about who to call with problems or questions at the time of a home visit. This was compounded by difficulty reaching physicians. Both hospital medicine physicians and PCPs identified system challenges including questions of patient ownership, variable PCP practice communication preferences, and difficulty in identifying a partnered staff member (on either end of the inpatient-outpatient continuum) who was familiar with a specific patient. While the communication issues raised may reflect difficulties in our local healthcare system, there is broad evidence of postdischarge communication challenges. In adults, postdischarge communication failures between home health staff and physicians are associated with an increased risk of readmission.10 The real or perceived lack of communication between inpatient and outpatient providers can add to parental confusion post discharge.11 Although there have been efforts to improve the reliability of communication across this gulf,12,13 it is not clear whether changes to discharge communication could help to avoid pediatric reutilization events.14
The theme of individualization of the home nurse visit is consistent with evidence regarding the impact of focusing the intervention on patients with specific diagnoses or demographics. In adults, reduced reutilization associated with postdischarge home nurse visits has been described in specific populations such as patients with heart failure and chronic obstructive pulmonary disease.15 Impact of home nurse visits on patients within diagnosis-specific populations with certain demographics (such as advanced age) has also been described.16 In the pediatric population, readmission rates vary widely by diagnosis.17 A systematic review of interventions to reduce pediatric readmissions found increased impact of discharge interventions in specific populations (asthma, oncology, and NICU).3
Next steps may lie in interventions in targeted populations that function as part of a care continuum bridging the patient from the inpatient to the outpatient setting. A home nurse visit as part of this discharge structure may prove to have more impact on reducing reutilization. One population which accounts for a large proportion of readmissions and where there has been recent focus on discharge transition of care has been children with medical complexity.18 This group was largely excluded from the H2O trial. Postdischarge home nurse visits in this population have been found to be feasible and address many questions and problems, but the effect on readmission is less clear.19 Family priorities and preferences related to preparation for discharge, including family engagement, respect for discharge readiness, and goal of returning to normal routines, may be areas on which to focus with future interventions in this population.20 In summary, although widespread postdischarge interventions (home nurse visit4 and nurse telephone call9) have not been found to be effective, targeting interventions to specific populations by diagnosis or demographic factors may prove to be more effective in reducing pediatric reutilization.
There were several strengths to this study. This qualitative approach allowed us to elucidate potential explanations for the H2O trial results from multiple perspectives. The multidisciplinary composition of our analytic team and the use of an iterative process sparked diverse contributions in a dynamic, ongoing discussion and interpretation of our data.
This study should be considered in the context of several limitations. For families and RNs, there was a time lag between participation in the trial and participation in the qualitative study call or focus group which could lead to difficulty recalling details. Only families who received the intervention could give opinions on their experience of the nurse visit, while families in the control group were asked to hypothesize. Focus groups with hospital medicine physicians and PCPs were purposive samples, and complete demographic information of participants was not collected.
CONCLUSION
Key stakeholders reflecting on a postdischarge RN visit trial suggested multiple potential explanations for the unexpected increase in reutilization in children randomized to the intervention. Certain participants questioned whether all reutilization events were appropriate or necessary. Others expressed concerns that the H2O intervention lacked context and directed children back to the hospital instead of the PCP. Parents, PCPs, hospital medicine physicians, and RNs all suggested that future transition-focused interventions should enhance postdischarge communication, strengthen connection to the PCP, and be more effectively tailored to the needs of the individual patient and family.
Acknowledgments
Collaborators: H2O Trial Study Group: Joanne Bachus, BSN, RN, Department of Patient Services, Cincinnati Children’s Hospital Medical Center, Cincinnati, Ohio; Monica L Borell, BSN, RN, Department of Patient Services, Cincinnati Children’s Hospital Medical Center, Cincinnati, Ohio; Lenisa V Chang, MA, PhD; Patricia Crawford, RN, Department of Patient Services, Cincinnati Children’s Hospital Medical Center, Cincinnati, Ohio; Sarah A Ferris, BA, Division of Hospital Medicine, Cincinnati Children’s Hospital Medical Center, Cincinnati, Ohio; Judy A Heilman BSN, RN, Department of Patient Services, Cincinnati Children’s Hospital Medical Center, Cincinnati, Ohio; Jane C Khoury, PhD, Division of Biostatistics and Epidemiology, Cincinnati Children’s Hospital Medical Center, Cincinnati, Ohio; Karen Lawley, BSN, RN, Department of Patient Services, Cincinnati Children’s Hospital Medical Center, Cincinnati, Ohio; Lynne O’Donnell, BSN, RN, Department of Patient Services, Cincinnati Children’s Hospital Medical Center, Cincinnati, Ohio; Hadley S Sauers-Ford, MPH, Department of Pediatrics, UC Davis Health, Sacramento, California; Anita N Shah, DO, MPH, Division of Hospital Medicine, Cincinnati Children’s Hospital Medical Center, Cincinnati, Ohio; Lauren G Solan, MD, Med, University of Rochester, Rochester, New York; Heidi J Sucharew, PhD, Division of Biostatistics and Epidemiology, Cincinnati Children’s Hospital Medical Center, Cincinnati, Ohio; Karen P Sullivan, BSN, RN, Department of Patient Services, Cincinnati Children’s Hospital Medical Center, Cincinnati, Ohio; Christine M White, MD, MAT, Division of Hospital Medicine, Cincinnati Children’s Hospital Medical Center, Cincinnati, Ohio.
1. Auger KA, Simon TD, Cooperberg D, et al. Summary of STARNet: seamless transitions and (re)admissions network. Pediatrics. 2015;135(1):164-175. https://doi.org/10.1542/peds.2014-1887.
2. Toomey SL, Peltz A, Loren S, et al. Potentially preventable 30-day hospital readmissions at a Children’s Hospital. Pediatrics. 2016;138(2). https://doi.org/10.1542/peds.2015-4182.
3. Auger KA, Kenyon CC, Feudtner C, Davis MM. Pediatric hospital discharge interventions to reduce subsequent utilization: a systematic review. J Hosp Med. 2014;9(4):251-260. https://doi.org/10.1002/jhm.2134.
4. Auger KA, Simmons JM, Tubbs-Cooley HL, et al. Postdischarge nurse home visits and reuse: the Hospital to Home Outcomes (H2O) trial. Pediatrics. 2018;142(1). https://doi.org/10.1542/peds.2017-3919.
5. Tubbs-Cooley HL, Pickler RH, Simmons JM, et al. Testing a post-discharge nurse-led transitional home visit in acute care pediatrics: the Hospital-To-Home Outcomes (H2O) study protocol. J Adv Nurs. 2016;72(4):915-925. https://doi.org/10.1111/jan.12882.
6. Guest G. Collecting Qualitative Data: A Field Manual for Applied Research. Thousand Oaks, CA: SAGE Publications, Inc.; 2013.
7. Patton M. Qualitative Research and Evaluation Methods. 4th ed. Thousand Oaks, CA: SAGE Publications, Inc.; 2014.
8. Solan LG, Beck AF, Brunswick SA, et al. The family perspective on Hospital to Home Transitions: a qualitative study. Pediatrics. 2015;136(6):e1539-e1549. https://doi.org/10.1542/peds.2015-2098.
9. Auger KA, Shah SS, Tubbs-Cooley HL, et al. Effects of a 1-time nurse-led telephone call after pediatric discharge: the H2O II randomized clinical trial. JAMA Pediatr. 2018;172(9):e181482. https://doi.org/10.1001/jamapediatrics.2018.1482.
10. Pesko MF, Gerber LM, Peng TR, Press MJ. Home health care: nurse-physician communication, patient severity, and hospital readmission. Health Serv Res. 2018;53(2):1008-1024. https://doi.org/10.1111/1475-6773.12667.
11. Solan LG, Beck AF, Shardo SA, et al. Caregiver perspectives on communication during hospitalization at an academic pediatric institution: a qualitative study. J Hosp Med. 2018;13(5):304-311. https://doi.org/10.12788/jhm.2919.
12. Zackoff MW, Graham C, Warrick D, et al. Increasing PCP and hospital medicine physician verbal communication during hospital admissions. Hosp Pediatr. 2018;8(4):220-226. https://doi.org/10.1542/hpeds.2017-0119.
13. Mussman GM, Vossmeyer MT, Brady PW, et al. Improving the reliability of verbal communication between primary care physicians and pediatric hospitalists at hospital discharge. J Hosp Med. 2015;10(9):574-580. https://doi.org/10.1002/jhm.2392.
14. Coller RJ, Klitzner TS, Saenz AA, et al. Discharge handoff communication and pediatric readmissions. J Hosp Med. 2017;12(1):29-35. https://doi.org/10.1002/jhm.2670.
15. Yang F, Xiong ZF, Yang C, et al. Continuity of care to prevent readmissions for patients with chronic obstructive pulmonary disease: a systematic review and meta-analysis. COPD. 2017;14(2):251-261. https://doi.org/10.1080/15412555.2016.1256384.
16. Finlayson K, Chang AM, Courtney MD, et al. Transitional care interventions reduce unplanned hospital readmissions in high-risk older adults. BMC Health Serv Res. 2018;18(1):956. https://doi.org/10.1186/s12913-018-3771-9.
17. Berry JG, Toomey SL, Zaslavsky AM, et al. Pediatric readmission prevalence and variability across hospitals. JAMA. 2013;309(4):372-380. https://doi.org/10.1001/jama.2012.188351.
18. Coller RJ, Nelson BB, Sklansky DJ, et al. Preventing hospitalizations in children with medical complexity: a systematic review. Pediatrics. 2014;134(6):e1628-e1647. https://doi.org/10.1542/peds.2014-1956.
19. Wells S, O’Neill M, Rogers J, et al. Nursing-led home visits post-hospitalization for children with medical complexity. J Pediatr Nurs. 2017;34:10-16. https://doi.org/10.1016/j.pedn.2017.03.003.
20. Leyenaar JK, O’Brien ER, Leslie LK, Lindenauer PK, Mangione-Smith RM. Families’ priorities regarding hospital-to-home transitions for children with medical complexity. Pediatrics. 2017;139(1). https://doi.org/10.1542/peds.2016-1581.
Readmission rates are used as metrics for care quality and reimbursement, with penalties applied to hospitals with higher than expected rates1 and up to 30% of pediatric readmissions deemed potentially preventable.2 There is a paucity of information on how to prevent pediatric readmissions,3 yet pediatric hospitals are tasked with implementing interventions for readmission reduction.
The Hospital to Home Outcomes (H2O) trial was a 2-arm, randomized controlled trial in which patients discharged from hospital medicine and neuroscience services at a single institution were randomized to receive a single home visit from a registered nurse (RN) within 96 hours of discharge.4 RNs completed a structured nurse visit designed specifically for the trial. Lists of “red flags” or warning signs associated with common diagnoses were provided to assist RNs in standardizing education about when to seek additional care. The hypothesis was that the postdischarge visits would result in lower reutilization rates (unplanned readmissions, emergency department [ED] visits, and urgent care visits).5
Unexpectedly, children randomized to receive the postdischarge nurse visit had higher rates of 30-day unplanned healthcare reutilization, with children randomly assigned to the intervention demonstrating higher odds of 30-day healthcare use (OR 1.33; 95% CI 1.003-1.76).4 We sought to understand perspectives on these unanticipated findings by obtaining input from relevant stakeholders. There were 2 goals for the qualitative analysis: first, to understand possible explanations of the increased reutilization finding; second, to elicit suggestions for improving the nurse visit intervention.
METHODS
We selected an in-depth qualitative approach, using interviews and focus groups to explore underlying explanations for the increase in 30-day unplanned healthcare reutilization among those randomized to receive the postdischarge nurse visit during the H2O trial.4 Input was sought from 4 stakeholder groups—parents, primary care physicians (PCPs), hospital medicine physicians, and home care RNs—in an effort to triangulate data sources and elicit rich and diverse opinions. Approval was obtained from the Institutional Review Board prior to conducting the study.
Recruitment
Parents
Because we conducted interviews approximately 1 year after the trial’s conclusion, we purposefully selected families who were enrolled in the latter portion of the H2O trial in order to enhance recall. Beginning with the last families in the study, we sequentially contacted families in reverse order. We contacted 10 families in each of 4 categories (intervention/reutilization, intervention/no reutilization, control/reutilization, control/no reutilization). A total of 3 attempts were made by telephone to contact each family. Participants received a grocery store gift card for participating in the study.
Primary Care Physicians
We conducted focus groups with a purposive sample of physicians recruited from 2 community practices and 1 hospital-owned practice.
Hospital Medicine Physicians
We conducted focus groups with a purposive sample of physicians from our Division of Hospital Medicine. There was a varying level of knowledge of the original trial; however, none of the participants were collaborators in the trial.
Home Care RNs
We conducted focus groups with a subset of RNs who were involved with trial visits. All RNs were members of the pediatric home care division associated with the hospital with specific training in caring for patients at home.
Data Collection
The study team designed question guides for each stakeholder group (Appendix 1). While questions were tailored for specific stakeholders, all guides included the following topics: benefits and challenges of nurse visits, suggestions for improving the intervention in future trials, and reactions to the trial results (once presented to participants). Only the results of the intention-to-treat (ITT) analysis were shared with stakeholders because ITT is considered the gold standard for trial analysis and allows easy understanding of the results.
A single investigator (A.L.) conducted parental interviews by telephone. Focus groups for PCPs, hospital medicine physicians, and RN groups were held at practice locations in private conference rooms and were conducted by trained moderators (S.N.S., A.L., and H.T.C.). Moderators probed responses to the open-ended questions to delve deeply into issues. The question guides were modified in an iterative fashion to include new concepts raised during interviews or focus groups. All interviews and focus groups were recorded and transcribed verbatim with all identifiable information redacted.
Data Analysis
During multiple cycles of inductive thematic analysis,6 we examined, discussed, interpreted, and organized responses to the open-ended questions,6,7 analyzing each stakeholder group separately. First, transcripts were shared with and reviewed by the entire multidisciplinary team (12 members) which included hospital medicine physicians, PCPs, home care nursing leaders, a nurse scientist, a parent representative, research coordinators, and a qualitative research methodologist. Second, team members convened to discuss overall concepts and ideas and created the preliminary coding frameworks. Third, a smaller subgroup (research coordinator [A.L]., hospital medicine physician [S.R.], parent representative [M.M.], and qualitative research methodologist [S.N.S.]), refined the unique coding framework for each stakeholder group and then independently applied codes to participant comments. This subgroup met regularly to reach consensus about the assigned codes and to further refine the codebooks. The codes were organized into major and minor themes based on recurring patterns in the data and the salience or emphasis given by participants. The subgroup’s work was reviewed and discussed on an ongoing basis by the entire multidisciplinary team. Triangulation of the data was achieved in multiple ways. The preliminary results were shared in several forums, and feedback was solicited and incorporated. Two of 4 members of the subgroup analytic team were not part of the trial planning or data collection, providing a potentially broader perspective. All coding decisions were maintained in an electronic database, and an audit trail was created to document codebook revisions.
RESULTS
A total of 33 parents participated in the interviews (intervention/readmit [8], intervention/no readmit [8], control/readmit [8], and control/no readmit [9]). Although we selected families from all 4 categories, we were not able to explore qualitative differences between these groups because of the relatively low numbers of participants. Parent data was very limited as interviews were brief and “control” parents had not received the intervention. Three focus groups were held with PCPs (7 participants in total), 2 focus groups were held with hospital medicine physicians (12 participants), and 2 focus groups were held with RNs (10 participants).
Goal 1: Explanation of Reutilization Rates
During interviews and focus groups, the results of the H2O trial were discussed, and stakeholders were asked to comment on potential explanations of the findings. 4 major themes and 5 minor themes emerged from analysis of the transcripts (summarized in Table 1).
Theme 1: Appropriateness of Patient Reutilization
Hospital medicine physicians and home care RNs questioned whether the reutilization events were clinically indicated. RNs wondered whether children who reutilized the ED were also readmitted to the hospital; many perceived that if the child was ill enough to be readmitted, then the ED revisit was warranted (Table 2). Parents commented on parental decision-making and changes in clinical status of the child leading to reutilization (Table 2).
Theme 2: Impact of Red Flags/Warning Sign Instructions on Family’s Reutilization Decisions
Theme 3: Hospital-Affiliated RNs “Directing Traffic” Back to Hospital
Both physician groups were concerned that, because the study was conducted by hospital-employed nurses, families might have been more likely to reaccess care at the hospital. Thus, the connection with the hospital was strengthened in the H2O model, potentially at the expense of the connection with PCPs. Physicians hypothesized that families might “still feel part of the medical system,” so families would return to the hospital if there was a problem. PCPs emphasized that there may have been straightforward situations that could have been handled appropriately in the outpatient office (Table 2).
Theme 4: Home Visit RNs Had a Low Threshold for Escalating Care
Parents and PCPs hypothesized that RNs are more conservative and, therefore, would have had a low threshold to refer back to the hospital if there were concerns in the home. One parent commented: “I guess, nurses are just by trade accustomed to erring on the side of caution and medical intervention instead of letting time take its course. … They’re more apt to say it’s better off to go to the hospital and have everything be fine” (Table 2).
Minor Themes
Participants also explained reutilization in ways that coalesced into 5 minor themes: (1) families receiving a visit might perceive that their child was sicker; (2) patients in the control group did not reutilize enough; (3) receiving more education on a child’s illness drives reutilization; (4) provider access issues; and (5) variability of RN experience may determine whether escalated care. Supportive quotations found in Appendix 2.
We directly asked parents if they would want a nurse home visit in the future after discussing the results of the study. Almost all of the parents in the intervention group and most of the parents in the control group were in favor of receiving a visit, even knowing that patients who had received a visit were more likely to reutilize care.
Goal 2: Suggestions for Improving Intervention Design
Three major themes and 3 minor themes were related to improving the design of the intervention (Table 1).
Theme 1: Need for Improved Postdischarge Communication
All stakeholder groups highlighted postdischarge communication as an area that could be improved. Parents were frustrated with regard to attempts to connect with inpatient physicians after discharge. PCPs suggested developing pathways for the RN to connect with the primary care office as opposed to the hospital. Hospital medicine physicians discussed a lack of consensus regarding patient ownership following discharge and were uncertain about what types of postdischarge symptoms PCPs would be comfortable managing. RNs described specific situations when they had difficulty contacting a physician to escalate care (Table 3).
Theme 2: Individualizing Home Visits—One Size Does Not Fit All
All stakeholder groups also encouraged “individualization” of home visits according to patient and family characteristics, diagnosis, and both timing and severity of illness. PCPs recommended visits only for certain diagnoses. Hospital medicine physicians voiced similar sentiments as the PCPs and added that worrisome family dynamics during a hospitalization, such as a lack of engagement with the medical team, might also warrant a visit. RNs suggested visits for those families with more concerns, for example, those with young children or children recovering from an acute respiratory illness (Table 3).
Theme 3: Providing Context for and Framing of Red Flags
Physicians and nurses suggested providing more context to “red flag” instructions and education. RNs emphasized that some families seemed to benefit from the opportunity to discuss their postdischarge concerns with a medical professional. Others appreciated concrete written instructions that spelled out how to respond in certain situations (Table 3).
Minor Themes
Three minor themes were revealed regarding intervention design improvement (Table 1): (1) streamlining the discharge process; (2) improving the definition of the scope and goal of intervention; and (3) extending inpatient team expertise post discharge. Supportive quotations can be found in Appendix 3.
DISCUSSION
When stakeholders were asked about why postdischarge RN visits led to increased postdischarge urgent healthcare visits, they questioned the appropriateness of the reutilization events, wondered about the lack of context for the warning signs that nurses provided families as part of the intervention, worried that families were encouraged to return to the hospital because of the ties of the trial to the hospital, and suggested that RNs had a low threshold to refer patients back to the hospital. When asked about how to design an improved nurse visit to better support families, stakeholders emphasized improving communication, individualizing the visit, and providing context around the red-flag discussion, enabling more nuanced instructions about how to respond to specific events.
A synthesis of themes suggests that potential drivers for increased utilization rates may lie in the design and goals of the initial project. The intervention was designed to support families and enhance education after discharge, with components derived from pretrial focus groups with families after a hospital discharge.8 The intervention was not designed to divert patients from the ED nor did it enhance access to the PCP. A second trial of the intervention adapted to a phone call also failed to decrease reutilization rates.9 Both physician stakeholder groups perceived that the intervention directed traffic back to the hospital because of the intervention design. Coupled with the perception that the red flags may have changed a family’s threshold for seeking care and/or that an RN may be more apt to refer back to care, this failure to push utilization to the primary care office may explain the unexpected trial results. Despite the stakeholders’ perception of enhanced connection back to the hospital as a result of the nurse visit, in analysis of visit referral patterns, a referral was made directly back to the ED in only 4 of the 651 trial visits (Tubbs-Cooley H, Riddle SR, Gold JM, et al.; under review. Pediatric clinical and social concerns identified by home visit nurses in the immediate postdischarge period 2020).
Both H2O trials demonstrated improved recall of red flags by parents who received the intervention, which may be important given the stakeholders’ perspectives that the red flags may not have been contextualized well enough. Yet neither trial demonstrated any differences in postdischarge coping or time to return to normal routine. In interviews with parents, despite the clearly stated results of increased reutilization, intervention parents endorsed a desire for a home visit in the future, raising the possibility that our outcome measures did not capture parents’ priorities adequately.
When asked to recommend design improvements of the intervention, 2 major themes (improvement in communication and individualization of visits) were discussed by all stakeholder groups, providing actionable information to modify or create new interventions. Focus groups with clinicians suggested that communication challenges may have influenced reutilization likelihood during the postdischarge period. RNs expressed uncertainty about who to call with problems or questions at the time of a home visit. This was compounded by difficulty reaching physicians. Both hospital medicine physicians and PCPs identified system challenges including questions of patient ownership, variable PCP practice communication preferences, and difficulty in identifying a partnered staff member (on either end of the inpatient-outpatient continuum) who was familiar with a specific patient. While the communication issues raised may reflect difficulties in our local healthcare system, there is broad evidence of postdischarge communication challenges. In adults, postdischarge communication failures between home health staff and physicians are associated with an increased risk of readmission.10 The real or perceived lack of communication between inpatient and outpatient providers can add to parental confusion post discharge.11 Although there have been efforts to improve the reliability of communication across this gulf,12,13 it is not clear whether changes to discharge communication could help to avoid pediatric reutilization events.14
The theme of individualization of the home nurse visit is consistent with evidence regarding the impact of focusing the intervention on patients with specific diagnoses or demographics. In adults, reduced reutilization associated with postdischarge home nurse visits has been described in specific populations such as patients with heart failure and chronic obstructive pulmonary disease.15 Impact of home nurse visits on patients within diagnosis-specific populations with certain demographics (such as advanced age) has also been described.16 In the pediatric population, readmission rates vary widely by diagnosis.17 A systematic review of interventions to reduce pediatric readmissions found increased impact of discharge interventions in specific populations (asthma, oncology, and NICU).3
Next steps may lie in interventions in targeted populations that function as part of a care continuum bridging the patient from the inpatient to the outpatient setting. A home nurse visit as part of this discharge structure may prove to have more impact on reducing reutilization. One population which accounts for a large proportion of readmissions and where there has been recent focus on discharge transition of care has been children with medical complexity.18 This group was largely excluded from the H2O trial. Postdischarge home nurse visits in this population have been found to be feasible and address many questions and problems, but the effect on readmission is less clear.19 Family priorities and preferences related to preparation for discharge, including family engagement, respect for discharge readiness, and goal of returning to normal routines, may be areas on which to focus with future interventions in this population.20 In summary, although widespread postdischarge interventions (home nurse visit4 and nurse telephone call9) have not been found to be effective, targeting interventions to specific populations by diagnosis or demographic factors may prove to be more effective in reducing pediatric reutilization.
There were several strengths to this study. This qualitative approach allowed us to elucidate potential explanations for the H2O trial results from multiple perspectives. The multidisciplinary composition of our analytic team and the use of an iterative process sparked diverse contributions in a dynamic, ongoing discussion and interpretation of our data.
This study should be considered in the context of several limitations. For families and RNs, there was a time lag between participation in the trial and participation in the qualitative study call or focus group which could lead to difficulty recalling details. Only families who received the intervention could give opinions on their experience of the nurse visit, while families in the control group were asked to hypothesize. Focus groups with hospital medicine physicians and PCPs were purposive samples, and complete demographic information of participants was not collected.
CONCLUSION
Key stakeholders reflecting on a postdischarge RN visit trial suggested multiple potential explanations for the unexpected increase in reutilization in children randomized to the intervention. Certain participants questioned whether all reutilization events were appropriate or necessary. Others expressed concerns that the H2O intervention lacked context and directed children back to the hospital instead of the PCP. Parents, PCPs, hospital medicine physicians, and RNs all suggested that future transition-focused interventions should enhance postdischarge communication, strengthen connection to the PCP, and be more effectively tailored to the needs of the individual patient and family.
Acknowledgments
Collaborators: H2O Trial Study Group: Joanne Bachus, BSN, RN, Department of Patient Services, Cincinnati Children’s Hospital Medical Center, Cincinnati, Ohio; Monica L Borell, BSN, RN, Department of Patient Services, Cincinnati Children’s Hospital Medical Center, Cincinnati, Ohio; Lenisa V Chang, MA, PhD; Patricia Crawford, RN, Department of Patient Services, Cincinnati Children’s Hospital Medical Center, Cincinnati, Ohio; Sarah A Ferris, BA, Division of Hospital Medicine, Cincinnati Children’s Hospital Medical Center, Cincinnati, Ohio; Judy A Heilman BSN, RN, Department of Patient Services, Cincinnati Children’s Hospital Medical Center, Cincinnati, Ohio; Jane C Khoury, PhD, Division of Biostatistics and Epidemiology, Cincinnati Children’s Hospital Medical Center, Cincinnati, Ohio; Karen Lawley, BSN, RN, Department of Patient Services, Cincinnati Children’s Hospital Medical Center, Cincinnati, Ohio; Lynne O’Donnell, BSN, RN, Department of Patient Services, Cincinnati Children’s Hospital Medical Center, Cincinnati, Ohio; Hadley S Sauers-Ford, MPH, Department of Pediatrics, UC Davis Health, Sacramento, California; Anita N Shah, DO, MPH, Division of Hospital Medicine, Cincinnati Children’s Hospital Medical Center, Cincinnati, Ohio; Lauren G Solan, MD, Med, University of Rochester, Rochester, New York; Heidi J Sucharew, PhD, Division of Biostatistics and Epidemiology, Cincinnati Children’s Hospital Medical Center, Cincinnati, Ohio; Karen P Sullivan, BSN, RN, Department of Patient Services, Cincinnati Children’s Hospital Medical Center, Cincinnati, Ohio; Christine M White, MD, MAT, Division of Hospital Medicine, Cincinnati Children’s Hospital Medical Center, Cincinnati, Ohio.
1. Auger KA, Simon TD, Cooperberg D, et al. Summary of STARNet: seamless transitions and (re)admissions network. Pediatrics. 2015;135(1):164-175. https://doi.org/10.1542/peds.2014-1887.
2. Toomey SL, Peltz A, Loren S, et al. Potentially preventable 30-day hospital readmissions at a Children’s Hospital. Pediatrics. 2016;138(2). https://doi.org/10.1542/peds.2015-4182.
3. Auger KA, Kenyon CC, Feudtner C, Davis MM. Pediatric hospital discharge interventions to reduce subsequent utilization: a systematic review. J Hosp Med. 2014;9(4):251-260. https://doi.org/10.1002/jhm.2134.
4. Auger KA, Simmons JM, Tubbs-Cooley HL, et al. Postdischarge nurse home visits and reuse: the Hospital to Home Outcomes (H2O) trial. Pediatrics. 2018;142(1). https://doi.org/10.1542/peds.2017-3919.
5. Tubbs-Cooley HL, Pickler RH, Simmons JM, et al. Testing a post-discharge nurse-led transitional home visit in acute care pediatrics: the Hospital-To-Home Outcomes (H2O) study protocol. J Adv Nurs. 2016;72(4):915-925. https://doi.org/10.1111/jan.12882.
6. Guest G. Collecting Qualitative Data: A Field Manual for Applied Research. Thousand Oaks, CA: SAGE Publications, Inc.; 2013.
7. Patton M. Qualitative Research and Evaluation Methods. 4th ed. Thousand Oaks, CA: SAGE Publications, Inc.; 2014.
8. Solan LG, Beck AF, Brunswick SA, et al. The family perspective on Hospital to Home Transitions: a qualitative study. Pediatrics. 2015;136(6):e1539-e1549. https://doi.org/10.1542/peds.2015-2098.
9. Auger KA, Shah SS, Tubbs-Cooley HL, et al. Effects of a 1-time nurse-led telephone call after pediatric discharge: the H2O II randomized clinical trial. JAMA Pediatr. 2018;172(9):e181482. https://doi.org/10.1001/jamapediatrics.2018.1482.
10. Pesko MF, Gerber LM, Peng TR, Press MJ. Home health care: nurse-physician communication, patient severity, and hospital readmission. Health Serv Res. 2018;53(2):1008-1024. https://doi.org/10.1111/1475-6773.12667.
11. Solan LG, Beck AF, Shardo SA, et al. Caregiver perspectives on communication during hospitalization at an academic pediatric institution: a qualitative study. J Hosp Med. 2018;13(5):304-311. https://doi.org/10.12788/jhm.2919.
12. Zackoff MW, Graham C, Warrick D, et al. Increasing PCP and hospital medicine physician verbal communication during hospital admissions. Hosp Pediatr. 2018;8(4):220-226. https://doi.org/10.1542/hpeds.2017-0119.
13. Mussman GM, Vossmeyer MT, Brady PW, et al. Improving the reliability of verbal communication between primary care physicians and pediatric hospitalists at hospital discharge. J Hosp Med. 2015;10(9):574-580. https://doi.org/10.1002/jhm.2392.
14. Coller RJ, Klitzner TS, Saenz AA, et al. Discharge handoff communication and pediatric readmissions. J Hosp Med. 2017;12(1):29-35. https://doi.org/10.1002/jhm.2670.
15. Yang F, Xiong ZF, Yang C, et al. Continuity of care to prevent readmissions for patients with chronic obstructive pulmonary disease: a systematic review and meta-analysis. COPD. 2017;14(2):251-261. https://doi.org/10.1080/15412555.2016.1256384.
16. Finlayson K, Chang AM, Courtney MD, et al. Transitional care interventions reduce unplanned hospital readmissions in high-risk older adults. BMC Health Serv Res. 2018;18(1):956. https://doi.org/10.1186/s12913-018-3771-9.
17. Berry JG, Toomey SL, Zaslavsky AM, et al. Pediatric readmission prevalence and variability across hospitals. JAMA. 2013;309(4):372-380. https://doi.org/10.1001/jama.2012.188351.
18. Coller RJ, Nelson BB, Sklansky DJ, et al. Preventing hospitalizations in children with medical complexity: a systematic review. Pediatrics. 2014;134(6):e1628-e1647. https://doi.org/10.1542/peds.2014-1956.
19. Wells S, O’Neill M, Rogers J, et al. Nursing-led home visits post-hospitalization for children with medical complexity. J Pediatr Nurs. 2017;34:10-16. https://doi.org/10.1016/j.pedn.2017.03.003.
20. Leyenaar JK, O’Brien ER, Leslie LK, Lindenauer PK, Mangione-Smith RM. Families’ priorities regarding hospital-to-home transitions for children with medical complexity. Pediatrics. 2017;139(1). https://doi.org/10.1542/peds.2016-1581.
© 2020 Society of Hospital Medicine
Refractive Outcomes for Cataract Surgery With Toric Intraocular Lenses at a Veterans Affairs Medical Center
Cataract surgery is one of the most common ambulatory procedures performed in the US.1-3 With the aging of the US population, the number of Americans with cataracts is projected to increase from 24.4 million in 2010 to 38.7 million in 2030.4
Approximately 20% of all cataract patients have preoperative astigmatism of > 1.5 diopters (D), underscoring the importance of training residents in the placement of toric intraocular lenses (IOLs).5 However, the implantation of toric IOLs is more challenging than monofocal IOLs, requiring precise surgical alignment of the IOL.6 Successful toric IOL implantation also requires accurate calculation of the IOL cylinder power and target axis of alignment. It is unclear which toric IOL calculation formula offers the most accurate refractive predictions, and practitioners have designed strategies to apply different formulae depending on the biometric dimensions of the target eye.7-9
Previous studies of resident-performed cataract surgery using toric IOLs6,10-13 and studies that compare the performance of the Barrett and Holladay toric formulae have been limited by their small sample sizes (< 107 eyes).7,14-16 Moreover, none of the studies that evaluate the comparative effectiveness of these biometric formulae were conducted at a teaching hospital.7,14-16
Given the added complexity of toric IOL placement and variable surgical experience of residents as ophthalmologists-in-training, it is important to assess outcomes in teaching hospitals.13 The primary aims of this study were to assess the visual and refractive outcomes of cataract surgery using toric IOLs in a US Department of Veterans Affairs (VA) teaching hospital and to compare the relative accuracy of the Holladay 2 or Barrett toric biometric formulae in predicting postoperative refraction outcomes.
Methods
The Providence VA Medical Center (PVAMC) Institutional Review Board approved this study. This retrospective chart review included patients with cataract and corneal astigmatism who underwent cataract surgery using Acrysof toric IOLs, model SN6AT (Alcon) at the PVAMC teaching hospital between November 2013 and May 2018.
Only 1 eye was included from each study subject to avoid compounding of data with the use of bilateral eyes.17 In addition, bilateral cataract surgery was only performed on some patients at the PVAMC, so including both eyes from eligible patients would disproportionately weigh those patients’ outcomes. If both eyes had cataract surgery and their postoperative visual acuities were unequal, we chose the eye with the better postoperative visual acuity since refraction accuracy decreases with worsening best-corrected visual acuity (BCVA). If both eyes had cataract surgery and the postoperative visual acuity was the same, the first operated eye was chosen.17,18
Exclusion criteria included worse than 20/40 BCVA, posterior capsular rupture, sulcus IOL, history of corneal disease, history of refractive surgery (laser-assisted in situ keratomileusis [LASIK]/photorefractive keratectomy [PRK]), axial length not measurable by the Lenstar optical biometer (Haag-Streit USA), or no postoperative refraction within 3 weeks to 4 months.19,20
Patient age, race/ethnicity, gender, preoperative refraction, preoperative BCVA, postoperative refraction, postoperative BCVA, and IOL power were recorded from patient charts (Table 1). Preoperative and postoperative refractive values were converted to spherical equivalents. The preoperative biometry and most of the postoperative refractions were performed by experienced technicians certified by the Joint Commission on Allied Health Personnel in Ophthalmology. The main outcomes for the assessment of surgeries included the postoperative BCVA, postoperative spherical equivalent refraction, and postoperative residual refractive astigmatism.
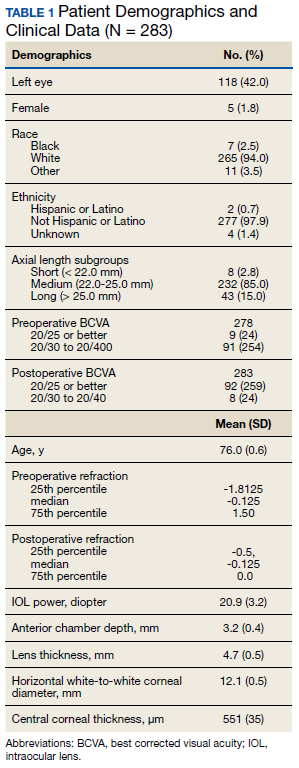
Axial length (AL), preoperative anterior chamber depth (ACD), preoperative flat corneal front power (K1), preoperative steep corneal front power (K2), lens thickness, horizontal white-to-white (WTW) corneal diameter, and central corneal thickness (CCT) were recorded from the Lenstar biometric device. Predicted postoperative refractions for the Holladay 2 formula were calculated using Holladay IOL Consultant software (Holladay Consulting). Predicted postoperative refractions for the Barrett toric IOL formula were calculated using the online Barrett toric formula calculator.21 Since previous studies have shown that both the Holladay and Barrett formulae account for posterior corneal astigmatism, a comparison of refractive outcomes in eyes with against-the-rule astigmatism vs with-the-rule astigmatism was not performed.14 An estimated standardized value for surgically-induced astigmatism was entered into both formulae; 0.3 diopter (D) was chosen based on previously published averages.22-24
A formula’s prediction error is defined as the predicted postoperative refraction minus the actual postoperative refraction. The mean absolute prediction error (MAE), defined as the mean of the absolute values of the prediction errors, and the median absolute prediction error (MedAE), defined as the median of the absolute values of the prediction errors, were used to assess the overall accuracy of each formula. Also, the percentages of eyes with postoperative refraction within ≥ 0.25 D, ≥ 0.50 D, and ≥ 1.0 D were calculated for both formulae. Two-tailed t tests were performed to compare the MAE between the formulae. Subgroup analyses were performed for short eyes (AL < 22 mm), medium length eyes (AL = 22-25 mm), and long eyes (AL > 25 mm). Statistical analysis was performed using STATA 11 (STATA Corp). The preoperative corneal astigmatism and postoperative refractive astigmatism of all the cases were compared in double-angle plots to assess how well the toric IOL neutralized the corneal astigmatism.
Results
Of 325 charts reviewed during the study period, 34 patients were excluded due to lack of postoperative refraction within the designated follow-up period, 5 for worse than 20/40 postoperative BCVA (4 had preexisting ocular disease), 2 for complications, and 1 for missing data. We included 283 eyes from 283 patients in the final study. Resident ophthalmologists were the primary surgeons in 87.6% (248/283) of the cases.
The median postoperative BCVA was 20/20, and 92% of patients had a postoperative BCVA of 20/25 or better. The prediction outcomes of the toric SN6AT IOLs are shown in Table 2. The Barrett toric formula had a lower MAE than the Holladay 2 formula, but this difference was not statistically significant. The Barrett toric formula also predicted a higher percentage of eyes with postoperative refraction within ≥ 0.25 D (53.2%), ≥ 0.5 D (77.3%), and ≥ 1.0 D (96.1%). For both formulae, > 95% of eyes had prediction errors that fell within 1.0 D.
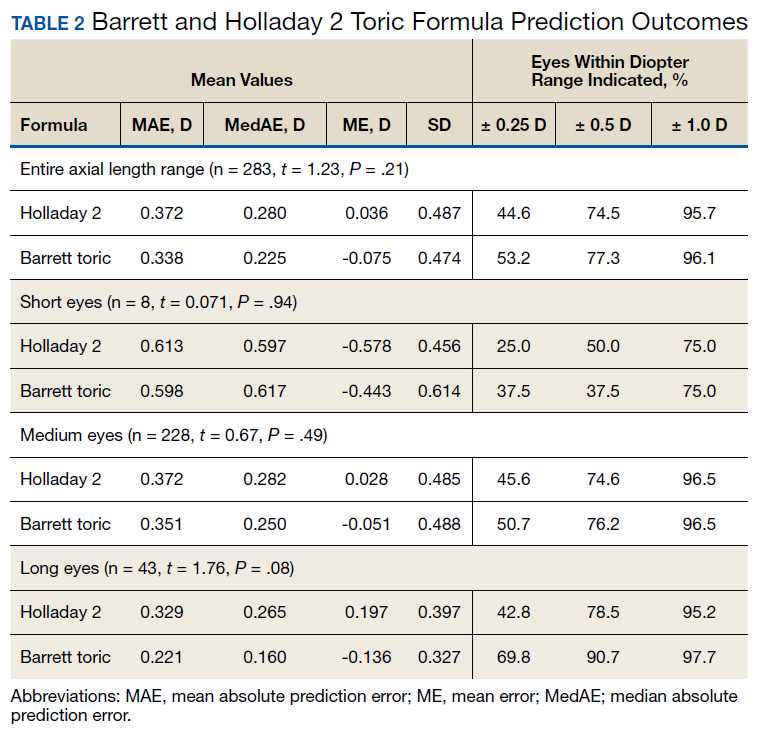
While the Barrett formula demonstrated a lower MAE in all 3 AL groups, no statistically significant differences were found between the Barrett and Holladay formulae (P = .94, P = .49, and P = .08 for short, medium, and long eyes, respectively). Both formulae produced the lowest MAE in the long AL group: Barrett had a MAE of 0.221 D and Holladay 2 had one of 0.329 D. The Barrett formula produced its highest percentage of eyes with prediction errors falling within 0.25 D and 0.5 D in the long AL group. In comparison, both formulae had the highest MAEs in the short AL group (Barrett toric, 0.598 D; Holladay 2, 0.613 D) and produced the lowest percentage of eyes with prediction errors falling within ≥ 0.25 D and ≥ 0.5 D in the short AL group.
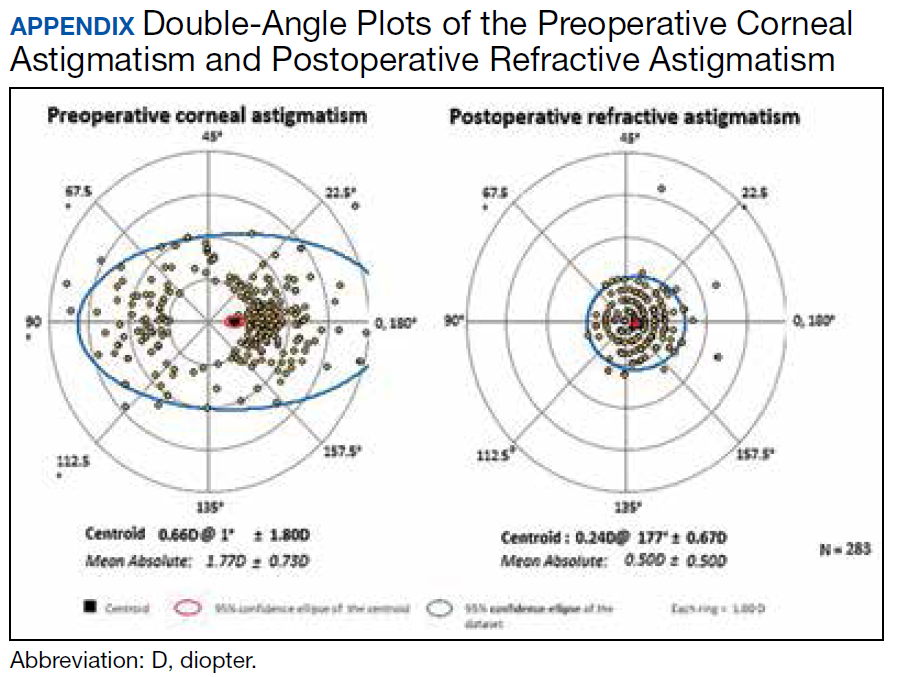
A cumulative histogram of the preoperative corneal and postoperative refractive astigmatism magnitude is shown in Figure 1. The same data are presented as double-angle plots in the Appendix, which shows that the centroid values for preoperative corneal astigmatism were greatlyreduced when compared with the postoperative refractive astigmatism (mean absolute value of 1.77 D ≥ 0.73 D to 0.5 D ≥ 0.50 D).
Preoperative corneal astigmatism and postoperative refractive astigmatism were compared since preoperative refractive astigmatism has noncorneal contributions, including lenticular astigmatism, and there is minimal expected change between preoperative and postoperative corneal astigmatism.14 For comparison, double-angle plots of postoperative refractive astigmatism prediction errors for the Holladay and Barrett formulae are shown in Figure 2.
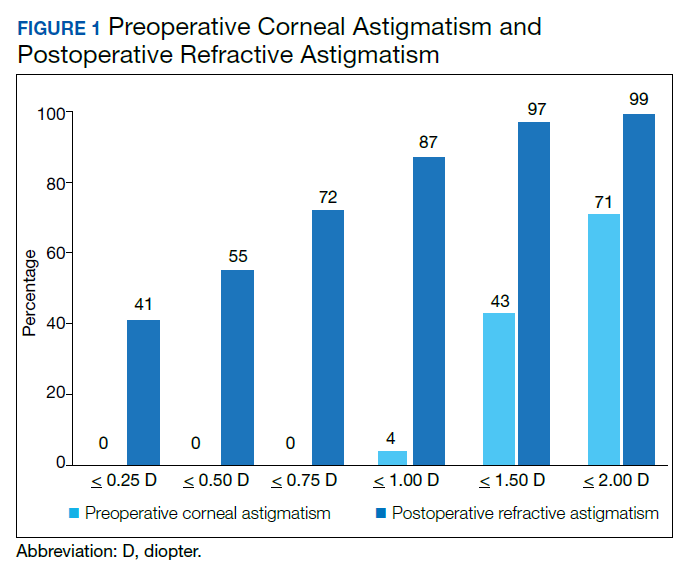
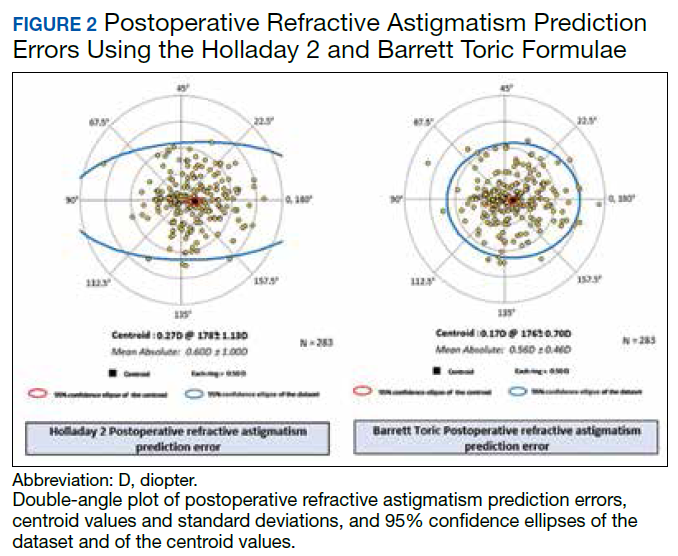
Discussion
To our knowledge, this is the largest study of resident-performed cataract surgery using toric IOLs, the largest study that compared the performance of the Barrett toric and Holladay 2 formulae, and the first that compared these formulae in a teaching hospital setting. This study found no significant difference in the predictive accuracy of the Barrett and Holladay 2 biometric formulae for cataract surgery using toric IOLs. In addition, our refractive outcomes were consistent with the results of previous toric IOL outcome studies conducted in teaching and nonteaching hospital settings.6,10-13
In 4 previous studies that compared the MAE of the Barrett and Holladay formulae for toric IOLs, the Barrett formula produced a lower MAE than the Holladay 2 formula.7,14-16 However, this difference was significant in only 2 of the studies, which had sample sizes of only 68 and 107 eyes.14,16 Furthermore, the Barrett toric formula produced the lower MAE for the entire AL range, though this was not statistically significant at our sample size. In addition, both formulae produced the lowest MAE in the long AL group and the highest MAE in the short AL group. The unique anatomy and high IOL power needed in short eyes may explain the challenges in attaining accurate IOL power predictions in this AL group.19,25
Limitations
The sample size of this study may have prevented us from detecting statistically significant differences in the performance of the Barrett and Holladay formulae. However, our findings are consistent with studies that compare the accuracy of these formulae in teaching and nonteaching hospital settings. Second, the study was conducted at a VA hospital, and a high proportion of patients were male; thus, our findings may not be generalizable to patients who receive cataract surgery with toric IOLs in other settings.
Conclusions
In a single VA teaching hospital, the Barrett and Holladay 2 biometric formulae provide similar refractive predictions for cataract surgery using toric IOLs. Larger studies would be necessary to detect smaller differences in the relative performance of the biometric formulae.
1. Schein OD, Cassard SD, Tielsch JM, Gower EW. Cataract surgery among Medicare beneficiaries. Ophthalmic Epidemiol. 2012;19(5):257-264.
2. Congdon N, O’Colmain B, Klaver CC, et al. Causes and prevalence of visual impairment among adults in the United States. Arch Ophthalmol. 2004;122(4):477-485.
3. Congdon N, Vingerling JR, Klein BE, et al. Prevalence of cataract and pseudophakia/aphakia among adults in the United States. Arch Ophthalmol. 2004;122(4):487-494.
4. National Eye Institute. Cataract tables: cataract defined. https://www.nei.nih.gov/learn-about-eye-health/resources-for-health-educators/eye-health-data-and-statistics/cataract-data-and-statistics/cataract-tables. Updated February 7, 2020. Accessed February 10, 2020.
5. Ostri C, Falck L, Boberg-Ans G, Kessel L. The need for toric intra-ocular lens implantation in public ophthalmology departments. Acta Ophthalmol. 2015;93(5):e396-e397.
6. Sundy M, McKnight D, Eck C, Rieger F 3rd. Visual acuity outcomes of toric lens implantation in patients undergoing cataract surgery at a residency training program. Mo Med. 2016;113(1):40-43.
7. Ferreira TB, Ribeiro P, Ribeiro FJ, O’Neill JG. Comparison of methodologies using estimated or measured values of total corneal astigmatism for toric intraocular lens power calculation. J Refract Surg. 2017;33(12):794-800.
8. Reitblat O, Levy A, Kleinmann G, Abulafia A, Assia EI. Effect of posterior corneal astigmatism on power calculation and alignment of toric intraocular lenses: comparison of methodologies. J Cataract Refract Surg. 2016;42(2):217-225.
9. Aristodemou P, Knox Cartwright NE, Sparrow JM, Johnston RL. Formula choice: Hoffer Q, Holladay 1, or SRK/T and refractive outcomes in 8108 eyes after cataract surgery with biometry by partial coherence interferometry. J Cataract Refract Surg. 2011;37(1):63-71.
10. Moreira HR, Hatch KM, Greenberg PB. Benchmarking outcomes in resident-performed cataract surgery with toric intraocular lenses [published correction appears in: Clin Experiment Ophthalmol. 2013;41(8):819]. Clin Exp Ophthalmol. 2013;41(6):624-626.
11. Retzlaff JA, Sanders DR, Kraff MC. Development of the SRK/T intraocular lens implant power calculation formula [published correction appears in: J Cataract Refract Surg. 1990;16(4):528]. J Cataract Refract Surg. 1990;16(3):333-340.
12. Roensch MA, Charton JW, Blomquist PH, Aggarwal NK, McCulley JP. Resident experience with toric and multifocal intraocular lenses in a public county hospital system. J Cataract Refract Surg. 2012;38(5):793-798.
13. Pouyeh B, Galor A, Junk AK, et al. Surgical and refractive outcomes of cataract surgery with toric intraocular lens implantation at a resident-teaching institution. J Cataract Refract Surg. 2011;37(9):1623-1628.
14. Ferreira TB, Ribeiro P, Ribeiro FJ, O’Neill JG. Comparison of astigmatic prediction errors associated with new calculation methods for toric intraocular lenses. J Cataract Refract Surg. 2017;43(3):340-347.
15. Abulafia A, Hill WE, Franchina M, Barrett GD. Comparison of methods to predict residual astigmatism after intraocular lens implantation. J Refract Surg. 2015;31(10):699-707.
16. Abulafia A, Barrett GD, Kleinmann G, et al. Prediction of refractive outcomes with toric intraocular lens implantation. J Cataract Refract Surg. 2015;41(5):936-944.
17. Wang Q, Jiang W, Lin T, Wu X, Lin H, Chen W. Meta-analysis of accuracy of intraocular lens power calculation formulas in short eyes. Clin Exp Ophthalmol. 2018;46(4):356-363.
18. Melles RB, Holladay JT, Chang WJ. Accuracy of intraocular lens calculation formulas. Ophthalmology. 2018;125(2):169-178.
19. Hoffer KJ. The Hoffer Q formula: a comparison of theoretic and regression formulas. J Cataract Refract Surg. 1993;19(6):700-712.
20. Cooke DL, Cooke TL. Comparison of 9 intraocular lens power calculation formulas. J Cataract Refract Surg. 2016;42(8):1157-1164.
21. American Society of Cataract and Refractive Surgery. Barrett toric calculator. www.ascrs.org/barrett-toric-calculator. Accessed February 5, 2020.
22. Holladay JT, Pettit G. Improving toric intraocular lens calculations using total surgically induced astigmatism for a 2.5 mm temporal incision. J Cataract Refract Surg. 2019;45(3):272-283.
23. Canovas C, Alarcon A, Rosén R, et al. New algorithm for toric intraocular lens power calculation considering the posterior corneal astigmatism. J Cataract Refract Surg. 2018;44(2):168-174.
24. Visser N, Berendschot TT, Bauer NJ, Nuijts RM. Vector analysis of corneal and refractive astigmatism changes following toric pseudophakic and toric phakic IOL implantation. Invest Ophthalmol Vis Sci. 2012;53(4):1865-1873.
25. Narváez J, Zimmerman G, Stulting RD, Chang DH. Accuracy of intraocular lens power prediction using the Hoffer Q, Holladay 1, Holladay 2, and SRK/T formulas. J Cataract Refract Surg. 2006;32(12):2050-2053.
Cataract surgery is one of the most common ambulatory procedures performed in the US.1-3 With the aging of the US population, the number of Americans with cataracts is projected to increase from 24.4 million in 2010 to 38.7 million in 2030.4
Approximately 20% of all cataract patients have preoperative astigmatism of > 1.5 diopters (D), underscoring the importance of training residents in the placement of toric intraocular lenses (IOLs).5 However, the implantation of toric IOLs is more challenging than monofocal IOLs, requiring precise surgical alignment of the IOL.6 Successful toric IOL implantation also requires accurate calculation of the IOL cylinder power and target axis of alignment. It is unclear which toric IOL calculation formula offers the most accurate refractive predictions, and practitioners have designed strategies to apply different formulae depending on the biometric dimensions of the target eye.7-9
Previous studies of resident-performed cataract surgery using toric IOLs6,10-13 and studies that compare the performance of the Barrett and Holladay toric formulae have been limited by their small sample sizes (< 107 eyes).7,14-16 Moreover, none of the studies that evaluate the comparative effectiveness of these biometric formulae were conducted at a teaching hospital.7,14-16
Given the added complexity of toric IOL placement and variable surgical experience of residents as ophthalmologists-in-training, it is important to assess outcomes in teaching hospitals.13 The primary aims of this study were to assess the visual and refractive outcomes of cataract surgery using toric IOLs in a US Department of Veterans Affairs (VA) teaching hospital and to compare the relative accuracy of the Holladay 2 or Barrett toric biometric formulae in predicting postoperative refraction outcomes.
Methods
The Providence VA Medical Center (PVAMC) Institutional Review Board approved this study. This retrospective chart review included patients with cataract and corneal astigmatism who underwent cataract surgery using Acrysof toric IOLs, model SN6AT (Alcon) at the PVAMC teaching hospital between November 2013 and May 2018.
Only 1 eye was included from each study subject to avoid compounding of data with the use of bilateral eyes.17 In addition, bilateral cataract surgery was only performed on some patients at the PVAMC, so including both eyes from eligible patients would disproportionately weigh those patients’ outcomes. If both eyes had cataract surgery and their postoperative visual acuities were unequal, we chose the eye with the better postoperative visual acuity since refraction accuracy decreases with worsening best-corrected visual acuity (BCVA). If both eyes had cataract surgery and the postoperative visual acuity was the same, the first operated eye was chosen.17,18
Exclusion criteria included worse than 20/40 BCVA, posterior capsular rupture, sulcus IOL, history of corneal disease, history of refractive surgery (laser-assisted in situ keratomileusis [LASIK]/photorefractive keratectomy [PRK]), axial length not measurable by the Lenstar optical biometer (Haag-Streit USA), or no postoperative refraction within 3 weeks to 4 months.19,20
Patient age, race/ethnicity, gender, preoperative refraction, preoperative BCVA, postoperative refraction, postoperative BCVA, and IOL power were recorded from patient charts (Table 1). Preoperative and postoperative refractive values were converted to spherical equivalents. The preoperative biometry and most of the postoperative refractions were performed by experienced technicians certified by the Joint Commission on Allied Health Personnel in Ophthalmology. The main outcomes for the assessment of surgeries included the postoperative BCVA, postoperative spherical equivalent refraction, and postoperative residual refractive astigmatism.
Axial length (AL), preoperative anterior chamber depth (ACD), preoperative flat corneal front power (K1), preoperative steep corneal front power (K2), lens thickness, horizontal white-to-white (WTW) corneal diameter, and central corneal thickness (CCT) were recorded from the Lenstar biometric device. Predicted postoperative refractions for the Holladay 2 formula were calculated using Holladay IOL Consultant software (Holladay Consulting). Predicted postoperative refractions for the Barrett toric IOL formula were calculated using the online Barrett toric formula calculator.21 Since previous studies have shown that both the Holladay and Barrett formulae account for posterior corneal astigmatism, a comparison of refractive outcomes in eyes with against-the-rule astigmatism vs with-the-rule astigmatism was not performed.14 An estimated standardized value for surgically-induced astigmatism was entered into both formulae; 0.3 diopter (D) was chosen based on previously published averages.22-24
A formula’s prediction error is defined as the predicted postoperative refraction minus the actual postoperative refraction. The mean absolute prediction error (MAE), defined as the mean of the absolute values of the prediction errors, and the median absolute prediction error (MedAE), defined as the median of the absolute values of the prediction errors, were used to assess the overall accuracy of each formula. Also, the percentages of eyes with postoperative refraction within ≥ 0.25 D, ≥ 0.50 D, and ≥ 1.0 D were calculated for both formulae. Two-tailed t tests were performed to compare the MAE between the formulae. Subgroup analyses were performed for short eyes (AL < 22 mm), medium length eyes (AL = 22-25 mm), and long eyes (AL > 25 mm). Statistical analysis was performed using STATA 11 (STATA Corp). The preoperative corneal astigmatism and postoperative refractive astigmatism of all the cases were compared in double-angle plots to assess how well the toric IOL neutralized the corneal astigmatism.
Results
Of 325 charts reviewed during the study period, 34 patients were excluded due to lack of postoperative refraction within the designated follow-up period, 5 for worse than 20/40 postoperative BCVA (4 had preexisting ocular disease), 2 for complications, and 1 for missing data. We included 283 eyes from 283 patients in the final study. Resident ophthalmologists were the primary surgeons in 87.6% (248/283) of the cases.
The median postoperative BCVA was 20/20, and 92% of patients had a postoperative BCVA of 20/25 or better. The prediction outcomes of the toric SN6AT IOLs are shown in Table 2. The Barrett toric formula had a lower MAE than the Holladay 2 formula, but this difference was not statistically significant. The Barrett toric formula also predicted a higher percentage of eyes with postoperative refraction within ≥ 0.25 D (53.2%), ≥ 0.5 D (77.3%), and ≥ 1.0 D (96.1%). For both formulae, > 95% of eyes had prediction errors that fell within 1.0 D.
While the Barrett formula demonstrated a lower MAE in all 3 AL groups, no statistically significant differences were found between the Barrett and Holladay formulae (P = .94, P = .49, and P = .08 for short, medium, and long eyes, respectively). Both formulae produced the lowest MAE in the long AL group: Barrett had a MAE of 0.221 D and Holladay 2 had one of 0.329 D. The Barrett formula produced its highest percentage of eyes with prediction errors falling within 0.25 D and 0.5 D in the long AL group. In comparison, both formulae had the highest MAEs in the short AL group (Barrett toric, 0.598 D; Holladay 2, 0.613 D) and produced the lowest percentage of eyes with prediction errors falling within ≥ 0.25 D and ≥ 0.5 D in the short AL group.
A cumulative histogram of the preoperative corneal and postoperative refractive astigmatism magnitude is shown in Figure 1. The same data are presented as double-angle plots in the Appendix, which shows that the centroid values for preoperative corneal astigmatism were greatlyreduced when compared with the postoperative refractive astigmatism (mean absolute value of 1.77 D ≥ 0.73 D to 0.5 D ≥ 0.50 D).
Preoperative corneal astigmatism and postoperative refractive astigmatism were compared since preoperative refractive astigmatism has noncorneal contributions, including lenticular astigmatism, and there is minimal expected change between preoperative and postoperative corneal astigmatism.14 For comparison, double-angle plots of postoperative refractive astigmatism prediction errors for the Holladay and Barrett formulae are shown in Figure 2.
Discussion
To our knowledge, this is the largest study of resident-performed cataract surgery using toric IOLs, the largest study that compared the performance of the Barrett toric and Holladay 2 formulae, and the first that compared these formulae in a teaching hospital setting. This study found no significant difference in the predictive accuracy of the Barrett and Holladay 2 biometric formulae for cataract surgery using toric IOLs. In addition, our refractive outcomes were consistent with the results of previous toric IOL outcome studies conducted in teaching and nonteaching hospital settings.6,10-13
In 4 previous studies that compared the MAE of the Barrett and Holladay formulae for toric IOLs, the Barrett formula produced a lower MAE than the Holladay 2 formula.7,14-16 However, this difference was significant in only 2 of the studies, which had sample sizes of only 68 and 107 eyes.14,16 Furthermore, the Barrett toric formula produced the lower MAE for the entire AL range, though this was not statistically significant at our sample size. In addition, both formulae produced the lowest MAE in the long AL group and the highest MAE in the short AL group. The unique anatomy and high IOL power needed in short eyes may explain the challenges in attaining accurate IOL power predictions in this AL group.19,25
Limitations
The sample size of this study may have prevented us from detecting statistically significant differences in the performance of the Barrett and Holladay formulae. However, our findings are consistent with studies that compare the accuracy of these formulae in teaching and nonteaching hospital settings. Second, the study was conducted at a VA hospital, and a high proportion of patients were male; thus, our findings may not be generalizable to patients who receive cataract surgery with toric IOLs in other settings.
Conclusions
In a single VA teaching hospital, the Barrett and Holladay 2 biometric formulae provide similar refractive predictions for cataract surgery using toric IOLs. Larger studies would be necessary to detect smaller differences in the relative performance of the biometric formulae.
1. Schein OD, Cassard SD, Tielsch JM, Gower EW. Cataract surgery among Medicare beneficiaries. Ophthalmic Epidemiol. 2012;19(5):257-264.
2. Congdon N, O’Colmain B, Klaver CC, et al. Causes and prevalence of visual impairment among adults in the United States. Arch Ophthalmol. 2004;122(4):477-485.
3. Congdon N, Vingerling JR, Klein BE, et al. Prevalence of cataract and pseudophakia/aphakia among adults in the United States. Arch Ophthalmol. 2004;122(4):487-494.
4. National Eye Institute. Cataract tables: cataract defined. https://www.nei.nih.gov/learn-about-eye-health/resources-for-health-educators/eye-health-data-and-statistics/cataract-data-and-statistics/cataract-tables. Updated February 7, 2020. Accessed February 10, 2020.
5. Ostri C, Falck L, Boberg-Ans G, Kessel L. The need for toric intra-ocular lens implantation in public ophthalmology departments. Acta Ophthalmol. 2015;93(5):e396-e397.
6. Sundy M, McKnight D, Eck C, Rieger F 3rd. Visual acuity outcomes of toric lens implantation in patients undergoing cataract surgery at a residency training program. Mo Med. 2016;113(1):40-43.
7. Ferreira TB, Ribeiro P, Ribeiro FJ, O’Neill JG. Comparison of methodologies using estimated or measured values of total corneal astigmatism for toric intraocular lens power calculation. J Refract Surg. 2017;33(12):794-800.
8. Reitblat O, Levy A, Kleinmann G, Abulafia A, Assia EI. Effect of posterior corneal astigmatism on power calculation and alignment of toric intraocular lenses: comparison of methodologies. J Cataract Refract Surg. 2016;42(2):217-225.
9. Aristodemou P, Knox Cartwright NE, Sparrow JM, Johnston RL. Formula choice: Hoffer Q, Holladay 1, or SRK/T and refractive outcomes in 8108 eyes after cataract surgery with biometry by partial coherence interferometry. J Cataract Refract Surg. 2011;37(1):63-71.
10. Moreira HR, Hatch KM, Greenberg PB. Benchmarking outcomes in resident-performed cataract surgery with toric intraocular lenses [published correction appears in: Clin Experiment Ophthalmol. 2013;41(8):819]. Clin Exp Ophthalmol. 2013;41(6):624-626.
11. Retzlaff JA, Sanders DR, Kraff MC. Development of the SRK/T intraocular lens implant power calculation formula [published correction appears in: J Cataract Refract Surg. 1990;16(4):528]. J Cataract Refract Surg. 1990;16(3):333-340.
12. Roensch MA, Charton JW, Blomquist PH, Aggarwal NK, McCulley JP. Resident experience with toric and multifocal intraocular lenses in a public county hospital system. J Cataract Refract Surg. 2012;38(5):793-798.
13. Pouyeh B, Galor A, Junk AK, et al. Surgical and refractive outcomes of cataract surgery with toric intraocular lens implantation at a resident-teaching institution. J Cataract Refract Surg. 2011;37(9):1623-1628.
14. Ferreira TB, Ribeiro P, Ribeiro FJ, O’Neill JG. Comparison of astigmatic prediction errors associated with new calculation methods for toric intraocular lenses. J Cataract Refract Surg. 2017;43(3):340-347.
15. Abulafia A, Hill WE, Franchina M, Barrett GD. Comparison of methods to predict residual astigmatism after intraocular lens implantation. J Refract Surg. 2015;31(10):699-707.
16. Abulafia A, Barrett GD, Kleinmann G, et al. Prediction of refractive outcomes with toric intraocular lens implantation. J Cataract Refract Surg. 2015;41(5):936-944.
17. Wang Q, Jiang W, Lin T, Wu X, Lin H, Chen W. Meta-analysis of accuracy of intraocular lens power calculation formulas in short eyes. Clin Exp Ophthalmol. 2018;46(4):356-363.
18. Melles RB, Holladay JT, Chang WJ. Accuracy of intraocular lens calculation formulas. Ophthalmology. 2018;125(2):169-178.
19. Hoffer KJ. The Hoffer Q formula: a comparison of theoretic and regression formulas. J Cataract Refract Surg. 1993;19(6):700-712.
20. Cooke DL, Cooke TL. Comparison of 9 intraocular lens power calculation formulas. J Cataract Refract Surg. 2016;42(8):1157-1164.
21. American Society of Cataract and Refractive Surgery. Barrett toric calculator. www.ascrs.org/barrett-toric-calculator. Accessed February 5, 2020.
22. Holladay JT, Pettit G. Improving toric intraocular lens calculations using total surgically induced astigmatism for a 2.5 mm temporal incision. J Cataract Refract Surg. 2019;45(3):272-283.
23. Canovas C, Alarcon A, Rosén R, et al. New algorithm for toric intraocular lens power calculation considering the posterior corneal astigmatism. J Cataract Refract Surg. 2018;44(2):168-174.
24. Visser N, Berendschot TT, Bauer NJ, Nuijts RM. Vector analysis of corneal and refractive astigmatism changes following toric pseudophakic and toric phakic IOL implantation. Invest Ophthalmol Vis Sci. 2012;53(4):1865-1873.
25. Narváez J, Zimmerman G, Stulting RD, Chang DH. Accuracy of intraocular lens power prediction using the Hoffer Q, Holladay 1, Holladay 2, and SRK/T formulas. J Cataract Refract Surg. 2006;32(12):2050-2053.
Demographic Profile and Service-Connection Trends of Posttraumatic Stress Disorder and Traumatic Brain Injury in US Veterans Pre- and Post-9/11
The nature of combat and associated injuries in Operation Iraqi Freedom (OIF), Operation Enduring Freedom (OEF), Operation New Dawn (OND), and Afghanistan War is different from previous conflicts. Multiple protracted deployments with infrequent breaks after September 11, 2001 (9/11) have further compounded the problem.
Posttraumatic stress disorder (PTSD) and traumatic brain injury (TBI) are the signature wounds of recent wars, with a higher incidence among the veterans of OEF and OIF compared with those from previous conflicts.1,2 More than 2.7 million who served in Iraq and Afghanistan suffer from PTSD.3,4 Symptoms of PTSD may appear within the first 3 months after exposure to a traumatic event or after many months and, in some cases, after a delay of many years and continue for life.5 Although delayed onset of PTSD in the absence of prior symptoms is rare,6,7 its incidence rises with increasing frequency of exposure to traumatic events8,9 and over time.10
According to the Brain Injury Association of America, TBI is “an alteration in brain function, or other evidence of brain pathology, caused by an external force.”8 TBI is often associated with increased risk of PTSD, depression, and posttraumatic headache,11-13 which may lead to broader cognitive, somatic, neurobiological, and psychosocial dysfunctions.14-17 According to Veterans Health Administration (VHA) data, 201,435 veterans from all eras enrolled with the US Department of Veterans Affairs (VA) have a diagnosis associated with TBI and 56,695 OEF/OIF veterans have been evaluated for a TBI-related condition.2 According to the Defense and Veterans Brain Injury Center (DVBIC), > 361,000 veterans have been diagnosed with TBI, with a peak of 32,000 cases in 2011.1,18 Moreover, the reported incidence and prevalence of PTSD and TBI among US veterans are not consistent. The incidence of PTSD has been estimated at 15% to 20% in recent wars3,19 compared with 10% to 30% in previous wars.3,19,20
When PTSD or TBI is deemed “related” to military service, the veteran may receive a service-connected disability rating ranging from 0% (no life-interfering symptoms due to injury) to 100% (totally disabling injury). The percentage of service connection associated with an injury is a quantifiable measure of the debilitating effect of injury on the individual. A significant majority (94%) of those who seek mental health services and treatment at VHA clinics apply for PTSD-related disability benefits.21 The estimated cost related to PTSD/TBI service-connected pensions is $20.28 billion per year and approximately $514 billion over 50 years.22 The cost of VA and Social Security disability payments combined with health care costs and treatment of PTSD is estimated to exceed $1 trillion over the next 30 years.22
The National Vietnam Veterans Readjustment Study (NVVRS) provided valuable information on prevalence rates of PTSD and other postwar psychological problems.23 Meanwhile, there have been no recent large-scale studies to compare the demographics of veterans diagnosed with PTSD and TBI who served prior to and after 9/11. A better understanding of demographic changes is considered essential for designing and tailoring therapeutic interventions to manage the rising cost.22
The present study focused on identifying changing trends in the demographics of veterans who served prior to and after 9/11 and who received a VA inpatient or outpatient diagnosis of PTSD and/or TBI. Specifically, this study addressed the changes in demographics of veterans with PTSD, TBI, or PTSD+TBI seen at the VHA clinics between December 1,1998 and May 31, 2014 (before and after September 11, 2001) for diagnosis, treatment and health care policy issues.
Methods
This study was approved by the Kansas City VA Medical Center Institutional Review Board. VHA data from the Corporate Data Warehouse (CDW) and the National Patient Care Database were extracted using the VA Informatics and Computing Infrastructure (VINCI) workspace. CDW uses a unique identifier to identify veterans across treatment episodes at more than 1,400 VHA centers organized under 21 Veterans Integrated Service Networks (VISNs). These sources of VA data are widely used for retrospective longitudinal studies.
Study Population
The study population consisted of 1,339,937 veterans with a VA inpatient/outpatient diagnosis of PTSD or TBI using International Statistical Classification of Diseases and Related Health Problems, Ninth Revision (ICD-9) codes between December 1, 1998 and May 31, 2014. Demographic (gender classification, race, ethnicity, marital status, age at date of data extraction, and date of death if indicated), service-connection disability rating, and geographic distribution within VISN data on each veteran were then extracted.
Veterans in the cohort were assigned to 1 of 4 US military services period groups. The pre-9/11 group included veterans who entered and left the military prior to September 11, 2001. This group mostly included veterans from World War II, Korean War, Vietnam War, and the first Gulf War (1990-1991). The post-9/11 group included veterans who first entered military services after September 11, 2001. The overlap group included veterans who entered military services prior to 9/11, remained in service and left after September 11, 2001. The reentered group included veterans who entered and left service prior to September 11, 2001, and then reentered military service after September 11, 2001 (Figure 1). Using ICD-9 codes, veterans also were placed into the following categories: PTSD alone (ICD-9 309.81 only), TBI alone (ICD-9 850.0-859.9, V15.52), and PTSD+TBI (any combination of ICD-9 codes from the other categories).
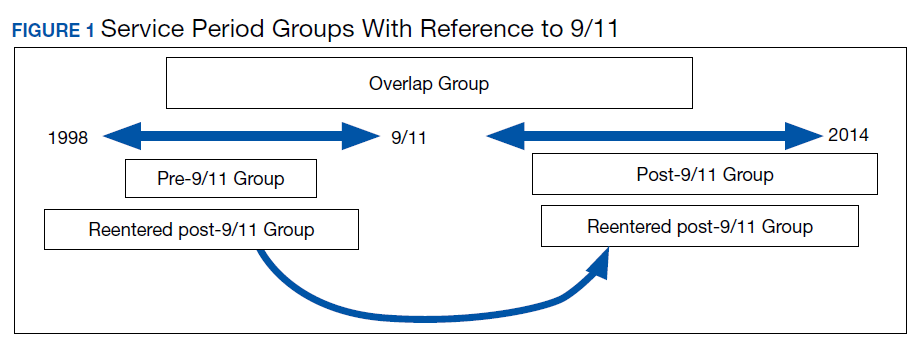
Statistical Analysis
Descriptive statistics were applied using proportions and means. Relationships between variables were examined using χ2 tests, t tests, analysis of variance, and nonparametric tests. All hypotheses were 2-sided at 95% CI. Results are presented as absolute numbers.
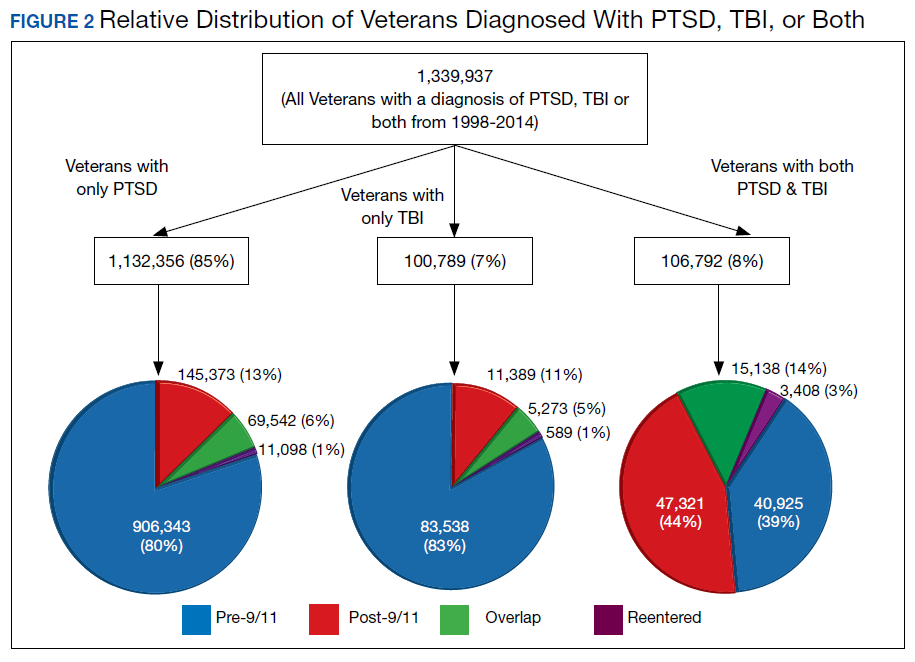
Results
PTSD only (n = 1,132,356, 85%) was the predominant diagnosis category followed by PTSD+TBI (n = 106,792, 8%) and TBI only (n = 100,789, 7%) (Figure 2). Most of the veterans in the study served pre-9/11 (77%), followed by post-9/11 (15%); 7% were in the overlap group, and 1% in the reentered group (Table 1). It is notable that the proportion of veterans diagnosed with PTSD decreased from pre-9/11 (88%) to post-9/11 (71%), overlap (77%), and reentered (74%) service periods. Increases were noted in those with PTSD+TBI diagnosis category from pre-9/11 (4%) to post-9/11 (23%), overlap (17%), and reentered (22%) service periods (Figure 3). In general, the relative distribution of diagnostic categories in all the service periods showed a similar trend, with the majority of veterans diagnosed with PTSD only. Across all service periods, significantly smaller proportions of veterans were diagnosed with TBI only (P < .001).
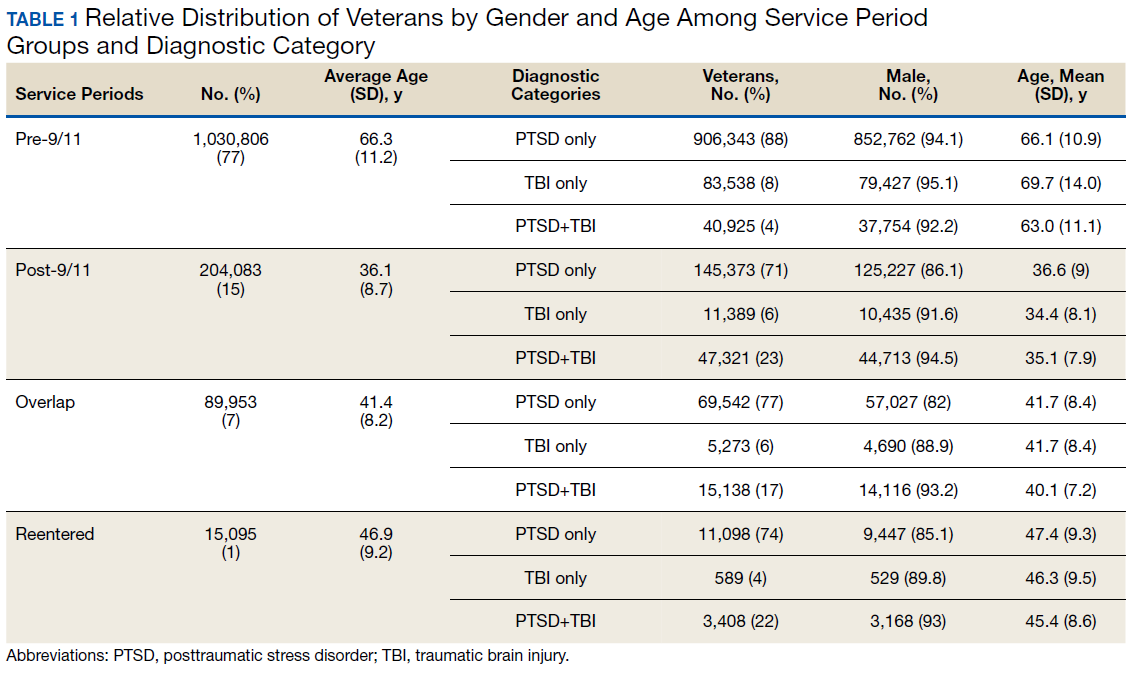
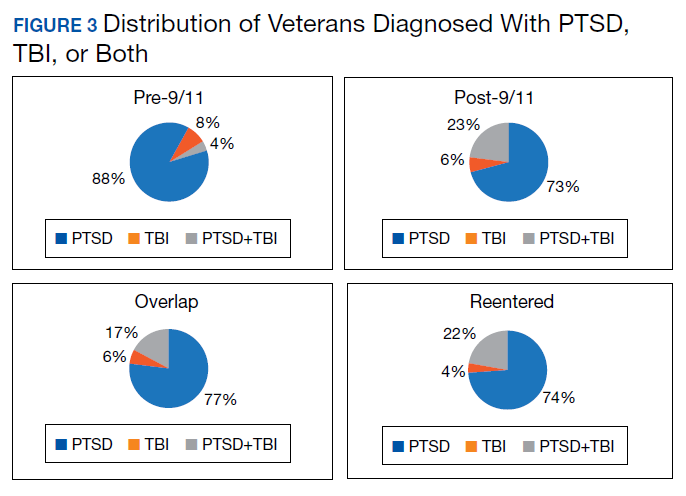
Distribution by Gender and Age
The cohort was 92% male (n = 1,239,295), but there was a marked increase in the percentage of nonmale veterans in post-9/11 groups. Study population ages ranged from 18 to 99 years based on date of birth to the date data were obtained; or date of birth to date of death, for those who were reported deceased at the time the data were obtained. The average (SD) ages for veterans in the pre-9/11 group were significantly older (66.3 [11.2] years) compared with the ages of veterans in the post-9/11 group (36.1 [8.7] years), the overlap group (41.4 [8.2] years), and the reentered group (46.9 [9.2] years), respectively.
Distribution by Race and Marital Status
The cohort identified as 65.7% white and 18.2% African American with much smaller percentages of Asians, American Indian/Alaska Natives (AI/AN) and Native Hawaiian/Pacific Islanders (Table 2). The relative proportion of AI/AN and Native Hawaiian/Pacific Islanders remained constant across all groups, whereas the number of Asians diagnosed with PTSD, TBI, or PTSD+TBI increased in the post-9/11 group. The number of African Americans diagnosed with PTSD, TBI, or both markedly increased in the overlap and reentered groups when compared with the pre-9/11 group, yet it went down in the post-9/11/group.
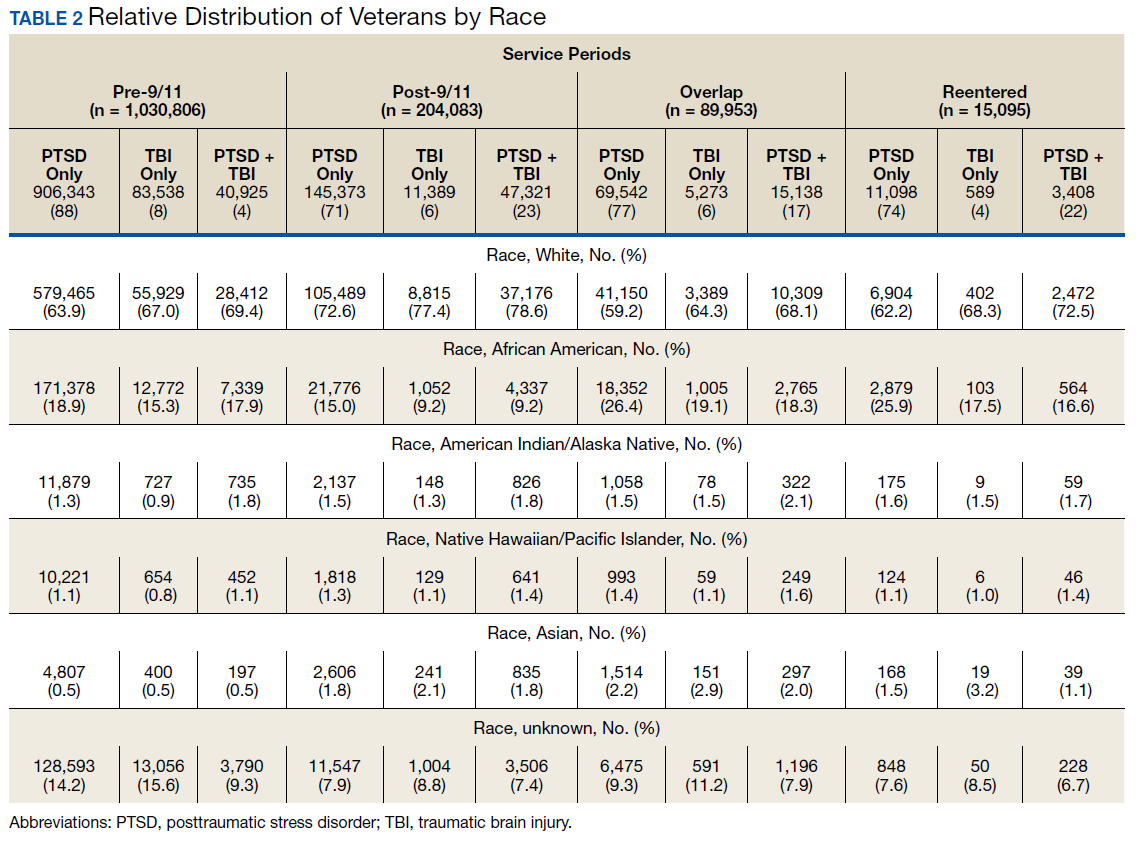
Half the cohort identified themselves as married (n = 675,145) (Table 3). A slightly larger proportion of those diagnosed with PTSD alone were married (51.7%), compared with those diagnosed with TBI only (40.3%), or PTSD+TBI (45.8%). Veterans in the post-9/11 group were less likely to identify as married (45.2%) compared with the pre-9/11 (51.2%), overlap (52.6%), or reentered (53.2%) groups. Divorce rates among pre-9/11 group, overlap group, and reentered group were higher compared with that of the post-9/11 group in all diagnosis categories.
Geographic Distribution
Veterans diagnosed with PTSD, TBI, or both were not evenly distributed across the VISNs VISNs 7, 8, 10, and 22 treated the most veterans, whereas VISN 9 and 15 treated the fewest. Taken together, the top 3 VISNs accounted for 27% to 28% of the total while lowest 3 accounted for 8% to 9% of the total cohort.
Service-Connected Disability
Of 1,339,937 veterans in the cohort, 1,067,691 had a service-connected disability rating for PTSD and/or TBI. Most were diagnosed with PTSD (n = 923,523, 86.5%) followed by both PTSD+TBI (n = 94,051, 8.8%). Three-quarters of the veterans with a service-connected disability were in the pre-9/11 group. Nearly 80% of veterans with a service-connected disability rating had a rating of > 50%. The average (SD) age of veterans with PTSD+TBI and a > 50% service-connected disability was 66.3 (11.2) years in the pre-9/11 group compared with 36.1 (8.7) years in the post-9/11 group.
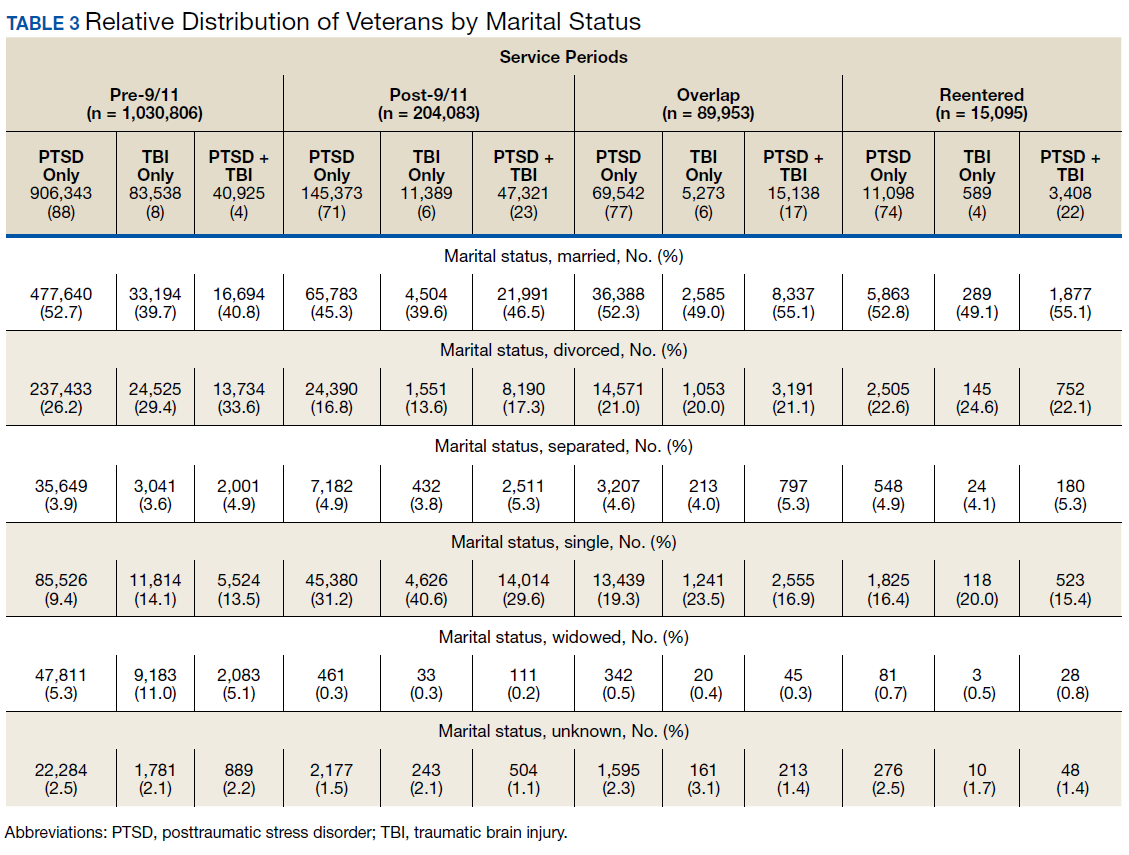
Discussion
The demographic profile of veterans diagnosed with PTSD+TBI has changed across the service periods covered in this study. Compared with pre-9/11 veterans, the post-9/11 cohort: (1) higher percentage were diagnosed with PTSD+TBI; (2) higher proportion were nonmale veterans; (3) included more young veterans with > 50% service-connected disability; (4) were more racially diverse; and (5) were less likely to be married and divorced and more likely to be self-identified as single. Additionally, data revealed that veterans tended to locate more to some geographic regions than to others.
The nature of the warfare has changed remarkably over the past few decades. Gunshot wounds accounted for 65% of all injuries in World War I, 35% during Vietnam War, and 16% to 23% in the First Gulf War.24 In post-9/11 military conflicts, 81% of injuries were explosion related.24,25 Although improvements in personal protective gear and battlefield trauma care led to increased survival, several factors may have contributed to increased reporting of TBI, which peaked in 2011 at 32,000 cases.24-26
Increases in PTSD Diagnosis
Increasing media awareness, mandatory battlefield concussion screening programs instituted by the US Department of Defense (DoD), and stressful conditions that exacerbate mild TBI (mTBI) may have all contributed to the increase in numbers of veterans seeking evaluations and being diagnosed with PTSD and/or TBI in the post-9/11 groups. Additionally, the 2007 National Defense Authorization Act requested the Secretary of Defense to develop a comprehensive, systematic approach for the identification, treatment, disposition, and documentation of TBI in combat and peacetime. By a conservative estimate, significant numbers of veterans will continue to be seen for mTBI at about 20,000 new cases per year.25-27
More frequent diagnosis of mTBI may have contributed to the increase in veterans diagnosed with PTSD+TBI in the post-9/11 groups. A recent study found that almost 44% of US Army infantry soldiers in Iraq did not lose consciousness but reported symptoms consistent with TBI.14 Compared with veterans of previous wars, veterans of the post-9/11 conflicts (OIF, OED, and OND) have experienced multiple, protracted deployments with infrequent breaks that can have a cumulative effect on the development of PTSD.8-10
The findings from the NVVRS study led to creation of specialized PTSD programs in the late 1980s. Since then, there has been an explosion of knowledge and awareness about PTSD, TBI, and the associated service-connected disability ratings and benefits, leading to an increased number of veterans seeking care for PTSD. For example, media coverage of the 50th anniversary of the D-day celebrations resulted in a surge of World War II veterans seeking treatment for PTSD and a surge of Vietnam veterans sought treatment for PTSD during the wars in Iraq and Afghanistan.28 An increased number of veterans reporting PTSD symptoms prompted the DoD to increase screening for PTSD, and to encourage service members to seek treatment when appropriate.
The VA has instituted training programs for clinicians and psychologists to screen and provide care for PTSD. Beginning in 2007, the VA implemented mandatory TBI screening for all veterans who served in combat operations and separated from active-duty service after September 11, 2001. The 4-question screen identifies veterans who are at increased risk of TBI and who experience symptoms that may be related to specific event(s).29 A positive screen does not diagnose TBI but rather indicates a need for further evaluation, which may or may not be responsible for inflated reporting of TBI. Renewed research also has led providers to recognize and study PTSD resulting from noncombat trauma and moral injury. The possibility of delayed onset also drives up the number of veterans diagnosed with PTSD.5-7
Prevalence
A wide variability exists in the reported prevalence of PTSD among US war veterans with estimates ranging from 15% to 20% of veterans from recent conflicts3,20 and 10% to 30% of veterans from previous wars.3,19 These rates are higher than estimates from allied forces from other countries.19 Meta-analyses suggest that the prevalence of PTSD is 2% to 15% among Vietnam War veterans, 1% to 13% among first (pre-9/11) Gulf War veterans, 4% to 17% among OEF/OIF/OND veterans; these veterans have a lifetime prevalence of 6% to 31%.3,11,19,30-38 The prevalence of PTSD is 2 to 4 times higher among the US veterans19,39 when compared with that of civilians.40,41 According to one study, concomitant PTSD and TBI appears to be much higher in US war veterans (4%-17%) compared with United Kingdom Iraq War veterans (3%-6%).19
This study’s finding of an increase in nonmale soldiers with PTSD and/or TBI was not surprising. There is a paucity of data on the effect of war zone exposure on women veterans. Recently, women have been more actively involved in combat roles with 41,000 women deployed to a combat zone. Results of this study indicate a 2- to 3-fold increase in veterans identifying themselves as nonmale in post-9/11 groups with a higher proportion diagnosed with either PTSD alone or PTSD and TBI. Women are at a higher risk for PTSD than are men due in part to exposure to abuse/trauma prior to deployment, experience of higher rates of discrimination, and/or sexual assault.31-33 One study involving First Gulf War female veterans reported higher precombat psychiatric histories as well as higher rates of physical and sexual abuse when compared with that of men.31
In this study, the average age of veterans adjudicated and compensated for PTSD and/or TBI pre-9/11, was 66 years compared with 36 years for post-9/11 veterans. Sixty-six percent of veterans from the post-9/11 group had ≥ 50% service-connected disability at age 36 years; 75% of veterans from the overlap group had ≥ 50% service-connected disability at age 41 years; and 76% veterans from the reentered group had ≥ 50% service-connected disability at age 46 years. Younger age at diagnosis and higher rates of disability not only pose unique challenges for veterans and family members, but also suggest implications for career prospects, family earnings, loss of productivity, and disease-adjusted life years. Also noted in the results, this younger cohort has a higher percentage of single/unmarried veterans, suggesting familial support systems may be more parental than spousal. Treatment for this younger cohort will likely need to focus on early and sustained rehabilitation that can be integrated with career plans.
For treatment to be effective, there must be evidence for veterans enrolling, remaining, and reporting benefits from the treatment. Limited research has shown currently advocated evidence-based therapies to have low enrollment rates, high drop-out rates, and mixed outcomes.42
Results showing a gradual increase in the proportion of nonwhite, non-African American veterans diagnosed with PTSD alone, TBI alone, or both, likely reflect the changing demographic profile of the US as well as the Army. However, the reason that more African Americans were diagnosed with PTSD and/or TBI in the overlap and reentered groups when compared with the pre-9/11 group could not be ascertained. It is possible that more veterans identified themselves as African Americans as evident from a decrease in the number of veterans in the unknown category post-9/11 when compared with the pre-9/11 group. In 2016, the American Community Survey showed that Hispanic and African American veterans were more likely to use VA health care and other benefits than were any other racial group.40 Improved screening for PTSD and TBI diagnoses, increased awareness, and education about the availability of VA services and benefits may have contributed to the increased use of VA benefits in these groups.
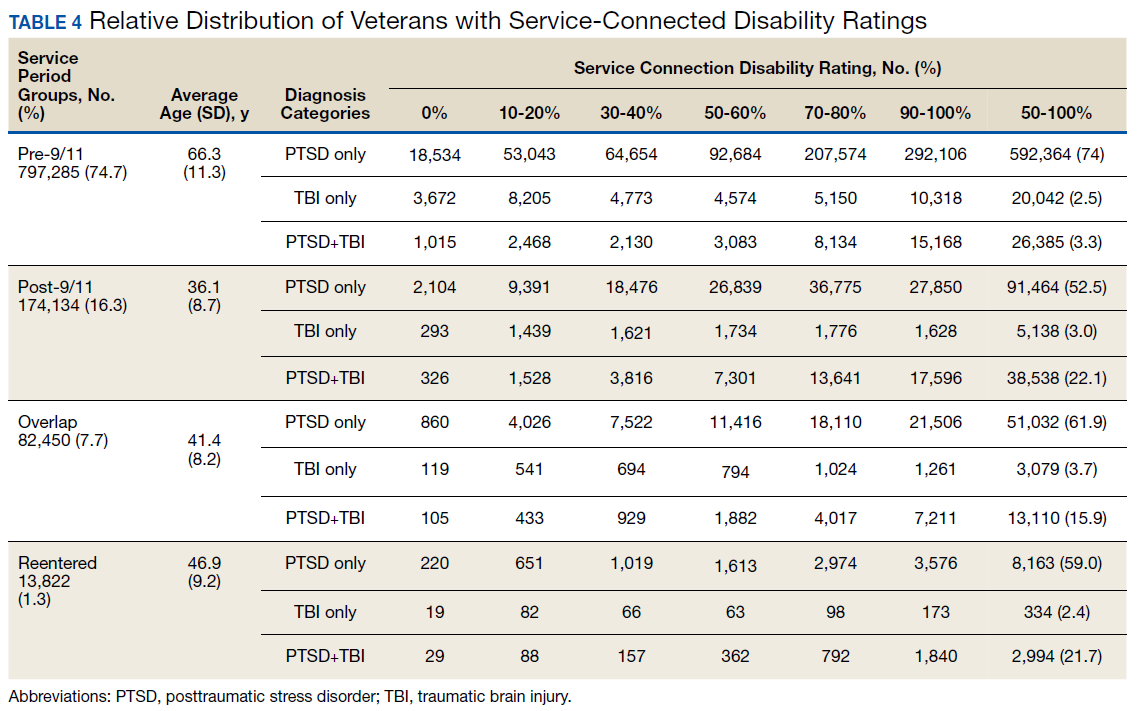
Data from this study are concordant with data from the National Center for Veterans Analysis and Statistics reporting on the younger age of diagnosis and higher rates of initial service-connected disability in veterans with PTSD and PTSD+TBI.43 One study analyzing records from 1999 to 2004 showed that the number of PTSD cases grew by 79.5%, resulting in 148.7% increase in benefits payment from $1.7 billion to $4.3 billion per year.44 In contrast, the compensation cost for all other disability categories increased by only 41.7% over this period. This study also revealed that while veterans with PTSD represented only 8.7% of compensation recipients, they received 20.5% of all compensation payments, driven in large part by an increase in > 50% service-connected disability ratings.44
Thus, from financial as well as treatment points of view, the change in the demographic profile of the veteran must be considered when developing PTSD treatment strategies. While treatment in the past focused solely on addressing trauma-associated psychiatric issues, TBI and PTSD association will likely shift the focus to concurrent psychiatric and physical symptomology. Similarly, PTSD/TBI treatment modalities must consider that the profile of post-9/11 service members includes more women, younger age, and a greater racial diversity. For instance, younger age for a disabled veteran brings additional challenges, including reliance on parental or buddy support systems vs a spousal support system, integrating career with treatment, selecting geographic locations that can support both career and treatment, sustaining rehabilitation over time. The treatment needs of a 35-year-old soldier with PTSD and/or TBI, whether male or female, Asian or African American are likely to be very different from the treatment needs of a 65-year-old white male. Newer treatment approaches will have to address the needs of all soldiers.
Limitations
Our study may underestimate the actual PTSD and/or TBI disease burden because of the social stigma associated with diagnosis, military culture, limitations in data collection.45-50 In addition, in this retrospective database cohort study, we considered and tried to minimize the impact of any of the usual potential limitations, including (1) accuracy of data quality and linkage; (2) identifying cohort appropriately (study groups); (3) defining endpoints clearly to avoid misclassifications; and (4) incorporating all important confounders. We identified veterans utilizing medical services at VA hospitals during a defined period and diagnosed with PTSD and TBI using ICD-9 codes and divided in 4 well-defined groups. In addition, another limitation of our study is to not accurately capture the veterans who have alternative health coverage and may choose not to enroll and/or participate in VA health care. In addition, some service members leaving war zones may not disclose or downplay the mental health symptoms to avoid any delay in their return home.
Conclusions
This study highlights the changing profile of the soldier diagnosed with PTSD and/or TBI who served pre-9/11 compared with that of those who served post-9/11. Treatment modalities must address the changes in warfare and demographics of US service members. Future treatment will need to focus more on concurrent PTSD/TBI therapies, the needs of younger soldiers, the needs of women injured in combat, and the needs of a more racially and ethnically diverse population. Severe injuries at a younger age will require early detection and rehabilitation for return to optimum functioning over a lifetime. The current study underscores a need for identifying the gaps in ongoing programs and services, developing alternatives, and implementing improved systems of care. More studies are needed to identify the cost implications and the effectiveness of current therapies for PTSD and/or TBI.
Acknowledgments
This study was supported by VA Medical Center and Midwest BioMedical Research Foundation (MBRF), Kansas City, Missouri. The manuscript received support, in part, from NIH-RO1 DK107490. These agencies did not participate in the design/conduct of the study or, in the interpretation of the data.
1. Bagalman E. Traumatic brain injury among veterans. http://www.ncsl.org/documents/statefed/health/TBI_Vets2013.pdf. Published January 4, 2013. Accessed February 3, 2020.
2. Veterans Health Administration, Support Service Center. Workload files fiscal year 2008-fiscal year 2012. [Source not verified.]
3. Tanielian T, Jaycox LH, eds. Invisible Wounds of War: Psychological and Cognitive Injuries, Their Consequences, and Services to Assist Recovery. Santa Monica, CA: RAND Corporation; 2008.
4. Bagalman E. Health care for veterans: traumatic brain injury. https://fas.org/sgp/crs/misc/R40941.pdf. Published March 9, 2015. Accessed February 4, 2020.
5. Ikin JF, Sim MR, McKenzie DP, et al. Anxiety, post-traumatic stress disorder and depression in Korean War veterans 50 years after the war. Br J Psychiatry. 2007;190(6):475-483.
6. Andrews B, Brewin CR, Philpott R, Stewart L. Delayed-onset posttraumatic stress disorder: a systematic review of the evidence. Am J Psychiatry. 2007;164(9):1319-1326.
7. Frueh BC, Grubaugh AL, Yeager DE, Magruder KM. Delayed-onset post-traumatic stress disorder among war veterans in primary care clinics. Br J Psychiatry. 2009;194(6):515-520.
8. McAllister TW. Neurobiological consequences of traumatic brain injury. Dialogues Clin Neurosci. 2011;13(3):287-300.
9. Schlenger WE, Kulka RA, Fairbank JA, et al. The prevalence of posttraumatic stress disorder in the Vietnam generation: a multimethod, multisource assessment of psychiatric disorder. J Trauma Stress. 1992;5(3):333-363.
10. Friedman MJ, Resick PA, Bryant RA, Strain J, Horowitz M, Spiegel D. Classification of trauma and stressor-related disorders in DSM-5. Depress Anxiety. 2011;28(9):737-749.
11. Lew HL, Otis JD, Tun C, Kerns RD, Clark ME, Cifu DX. Prevalence of chronic pain, posttraumatic stress disorder, and persistent postconcussive symptoms in OIF/OEF veterans: polytrauma clinical triad. J Rehabil Res Dev. 2009;46(6):697-702.
12. Carlson K, Kehle S, Meis L, et al. The Assessment and Treatment of Individuals with History of Traumatic Brain Injury and Post-Traumatic Stress Disorder: A Systematic Review of the Evidence. Washington, DC: US Department of Veterans Affairs; 2009.
13. Gironda RJ, Clark ME, Ruff RL, et al. Traumatic brain injury, polytrauma, and pain: challenges and treatment strategies for the polytrauma rehabilitation. Rehabil Psychol. 2009;54(3):247-258.
14. Hoge CW, McGurk D, Thomas JL, Cox AL, Engel CC, Castro CA. Mild traumatic brain injury in U.S. soldiers returning from Iraq. N Engl J Med. 2008;358(5):453-463.
15. Bazarian JJ, Cernak I, Noble-Haeusslein L, Potolicchio S, Temkin N. Long-term neurologic outcomes after traumatic brain injury. J Head Trauma Rehabil. 2009;24(6):439-451.
16. Peskind ER, Brody D, Cernak I, McKee A, Ruff RL. Military- and sports-related mild traumatic brain injury: clinical presentation, management, and long-term consequences. J Clin Psychiatry. 2013;74(2):180-188.
17. Riggio S. Traumatic brain injury and its neurobehavioral sequelae. Neurol Clin. 2011;29(1):35-47, vii.
18. Helmick KM, Spells CA, Malik SZ, Davies CA, Marion DW, Hinds SR. Traumatic brain injury in the US military: epidemiology and key clinical and research programs. Brain Imaging Behav. 2015;9(3):358-366.
19. Richardson LK, Frueh BC, Acierno R. Prevalence estimates of combat-related post-traumatic stress disorder: critical review. Aust N Z J Psychiatry. 2010;44(1):4-19.
20. Thompson WW, Gottesman II, Zalewski C. Reconciling disparate prevalence rates of PTSD in large samples of US male Vietnam veterans and their controls. BMC Psychiatry. 2006;6:19.
21. Frueh BC, Elhai JD, Gold PB, et al Disability compensation seeking among veterans evaluated for posttraumatic stress disorder. Psychiatr Serv. 2003;54(1):84-91.
22. Thakur H, Oni O, Singh V, et al. Increases in the service connection disability and treatment costs associated with posttraumatic stress disorder and/or traumatic brain injury in United States veterans pre- and post-9/11: the strong need for a novel therapeutic approach. Epidemiology (Sunnyvale). 2018;8(4):353.
23. Schlenger WE, Kulka RA, Fairbank JA, et al. The prevalence of post-traumatic stress disorder in the Vietnam generation: a multimethod, multisource assessment of psychiatric disorder. J Trauma Stress. 1992;5(3):333-363.
24. Belmont PJ, Schoenfeld AJ, Goodman G. Epidemiology of combat wounds in Operation Iraqi Freedom and Operation Enduring Freedom: orthopaedic burden of disease. J Surg Orthop Adv. 2010;19(1):2-7.
25. Owens BD, Kragh JG Jr, Wenke JC, Macaitis J, Wade CE, Holcomb JB. Combat wounds in Operation Iraqi Freedom and Operation Enduring Freedom. J Trauma. 2008;64(2):295-299.
26. Defense Health Agency, Defense and Veterans Brain Injury Center. DOD worldwide numbers for TBI since 2000. https://dvbic.dcoe.mil/dod-worldwide-numbers-tbi. Updated February 14, 2020. Accessed February 14, 2020.
27. Armed Forces Health Surveillance Center. Deployment-related conditions of special surveillance interest, U.S. armed forces, by month and service, January 2003-December 2012 (data as of 22 January 2013). MSMR. 2013;20(1):16-19.
28. Harvey JH, Stein SK, Scott PK. Fifty years of grief: accounts and reported psychological reactions of Normandy invasion veterans. J Narrative Life History. 1995;5(4):321-332.
29. US Department of Veterans Affairs. Polytrauma/TBI system of care. https://www.polytrauma.va.gov/system-of-care/index.asp. Updated June 3, 2015. Accessed February 4, 2020.
30. Wolfe J, Erickson DJ, Sharkansky EJ, King DW, King LA. Course and predictors of posttraumatic stress disorder among Gulf War veterans: a prospective analysis. J Consult Clin Psychol. 1999;67(4):520-528.
31. Breslau N, Davis GC, Peterson EL, Schultz L. Psychiatric sequelae of posttraumatic stress disorder in women. Arch Gen Psychiatry. 1997;54(1):81-87.
32. Kessler RC, Sonnega A, Bromet E, Hughes M, Nelson CB. Posttraumatic stress disorder in the National Comorbidity Survey. Arch Gen Psychiatry. 1995;52(12):1048-1060.
33. Wolfe J, Kimerling R. Gender issues in the assessment of posttraumatic stress disorder. In: Wilson J, Keane TM, eds. Assessing Psychological Trauma and PTSD. New York: Guilford; 2004:192-238.
34. Engel CC Jr, Engel AL, Campbell SJ, McFall ME, Russo J, Katon W. Posttraumatic stress disorder symptoms and precombat sexual and physical abuse in Desert Storm veterans. J Nerv Ment Dis. 1993;181(11):683-688.
35. US Department of Veterans Affairs, National Center for Veterans Analysis and Statistics. Profile of veterans: 2016 data from the American Community Survey. https://www.va.gov/vetdata/docs/SpecialReports/Profile_of_Veterans_2016.pdf. Published February 2018. Accessed February 4, 2020.
36. US Department of Commerce Economics and Statistics Administration, US Census Bureau, Geography Division. 2010 population distribution in the United States and Puerto Rico. https://www2.census.gov/geo/maps/dc10_thematic/2010_Nighttime_PopDist/2010_Nighttime_PopDist_Page_Map.pdf. Accessed February 4, 2020.
37. Cifu DX, Taylor BC, Carne WF, et al. Traumatic brain injury, posttraumatic stress disorder, and pain diagnoses in OIF/OEF/OND veterans. J Rehabil Res Dev. 2013;50(9):1169-1176.
38. Dohrenwend BP, Turner JB, Turse NA, Adams BG, Koenen KC, Marshall R. The psychological risks of Vietnam for U.S. veterans: a revisit with new data and methods. Science. 2006;313(5789):979-982.
39. Magruder KM, Frueh BC, Knapp RG, et al. Prevalence of posttraumatic stress disorder in Veterans Affairs primary care clinics. Gen Hosp Psychiatry. 2005;27(3):169-179.
40. Norris FH. Epidemiology of trauma: frequency and impact of different potentially traumatic events on different demographic groups. J Consult Clin Psychol. 1992;60(3):409-418.
41. Resnick HS, Kilpatrick DG, Dansky BS, Saunders BE, Best CL. Prevalence of civilian trauma and posttraumatic stress disorder in a representative national sample of women. J Consult Clin Psychol. 1993;61(6):984-991.
42. Najavits LM. The problem of dropout from “gold standard” PTSD therapies. F1000Prime Rep. 2015;7:43.
43. US Department of Veterans Affairs, National Center for Veterans Analysis and Statistics. Trends in veterans with a service-connected disability: 1985 to 2014. https://www.va.gov/vetdata/docs/QuickFacts/SCD_trends_FINAL_2014.PDF. Published June 2015. Accessed February 4, 2020.
44. US Department of Veterans Affairs, Office of Inspector General. Review of state variances in VA disability compensation payments. Report 05-00765-137. https://www.va.gov/oig/52/reports/2005/VAOIG-05-00765-137.pdf. Published May 19, 2015. Accessed February 4, 2020.
45. McNally RJ. Progress and controversy in the study of posttraumatic stress disorder. Annu Rev Psychol. 2003;54:229-252.
46. Freeman T, Powell M, Kimbrell T. Measuring symptom exaggeration in veterans with chronic posttraumatic stress disorder. Psychiatry Res. 2008;158(3):374-380.
47. Frueh BC, Elhai JD, Grubaugh AL, et al. Documented combat exposure of US veterans seeking treatment for combat-related post-traumatic stress disorder. Br J Psychiatry. 2005;186(6):467-475.
48. Frueh BC, Hamner MB, Cahill SP, Gold PB, Hamlin KL. Apparent symptom overreporting in combat veterans evaluated for PTSD. Clin Psychol Rev. 2000;20(7):853-885.
49. Sparr L, Pankratz LD. Factitious posttraumatic stress disorder. Am J Psychiatry. 1983;140(8):1016-1019.
50. Baggaley M. ‘Military Munchausen’s’: assessment of factitious claims of military service in psychiatric patients. Psychiatr Bull. 1998;22(3):153-154.
The nature of combat and associated injuries in Operation Iraqi Freedom (OIF), Operation Enduring Freedom (OEF), Operation New Dawn (OND), and Afghanistan War is different from previous conflicts. Multiple protracted deployments with infrequent breaks after September 11, 2001 (9/11) have further compounded the problem.
Posttraumatic stress disorder (PTSD) and traumatic brain injury (TBI) are the signature wounds of recent wars, with a higher incidence among the veterans of OEF and OIF compared with those from previous conflicts.1,2 More than 2.7 million who served in Iraq and Afghanistan suffer from PTSD.3,4 Symptoms of PTSD may appear within the first 3 months after exposure to a traumatic event or after many months and, in some cases, after a delay of many years and continue for life.5 Although delayed onset of PTSD in the absence of prior symptoms is rare,6,7 its incidence rises with increasing frequency of exposure to traumatic events8,9 and over time.10
According to the Brain Injury Association of America, TBI is “an alteration in brain function, or other evidence of brain pathology, caused by an external force.”8 TBI is often associated with increased risk of PTSD, depression, and posttraumatic headache,11-13 which may lead to broader cognitive, somatic, neurobiological, and psychosocial dysfunctions.14-17 According to Veterans Health Administration (VHA) data, 201,435 veterans from all eras enrolled with the US Department of Veterans Affairs (VA) have a diagnosis associated with TBI and 56,695 OEF/OIF veterans have been evaluated for a TBI-related condition.2 According to the Defense and Veterans Brain Injury Center (DVBIC), > 361,000 veterans have been diagnosed with TBI, with a peak of 32,000 cases in 2011.1,18 Moreover, the reported incidence and prevalence of PTSD and TBI among US veterans are not consistent. The incidence of PTSD has been estimated at 15% to 20% in recent wars3,19 compared with 10% to 30% in previous wars.3,19,20
When PTSD or TBI is deemed “related” to military service, the veteran may receive a service-connected disability rating ranging from 0% (no life-interfering symptoms due to injury) to 100% (totally disabling injury). The percentage of service connection associated with an injury is a quantifiable measure of the debilitating effect of injury on the individual. A significant majority (94%) of those who seek mental health services and treatment at VHA clinics apply for PTSD-related disability benefits.21 The estimated cost related to PTSD/TBI service-connected pensions is $20.28 billion per year and approximately $514 billion over 50 years.22 The cost of VA and Social Security disability payments combined with health care costs and treatment of PTSD is estimated to exceed $1 trillion over the next 30 years.22
The National Vietnam Veterans Readjustment Study (NVVRS) provided valuable information on prevalence rates of PTSD and other postwar psychological problems.23 Meanwhile, there have been no recent large-scale studies to compare the demographics of veterans diagnosed with PTSD and TBI who served prior to and after 9/11. A better understanding of demographic changes is considered essential for designing and tailoring therapeutic interventions to manage the rising cost.22
The present study focused on identifying changing trends in the demographics of veterans who served prior to and after 9/11 and who received a VA inpatient or outpatient diagnosis of PTSD and/or TBI. Specifically, this study addressed the changes in demographics of veterans with PTSD, TBI, or PTSD+TBI seen at the VHA clinics between December 1,1998 and May 31, 2014 (before and after September 11, 2001) for diagnosis, treatment and health care policy issues.
Methods
This study was approved by the Kansas City VA Medical Center Institutional Review Board. VHA data from the Corporate Data Warehouse (CDW) and the National Patient Care Database were extracted using the VA Informatics and Computing Infrastructure (VINCI) workspace. CDW uses a unique identifier to identify veterans across treatment episodes at more than 1,400 VHA centers organized under 21 Veterans Integrated Service Networks (VISNs). These sources of VA data are widely used for retrospective longitudinal studies.
Study Population
The study population consisted of 1,339,937 veterans with a VA inpatient/outpatient diagnosis of PTSD or TBI using International Statistical Classification of Diseases and Related Health Problems, Ninth Revision (ICD-9) codes between December 1, 1998 and May 31, 2014. Demographic (gender classification, race, ethnicity, marital status, age at date of data extraction, and date of death if indicated), service-connection disability rating, and geographic distribution within VISN data on each veteran were then extracted.
Veterans in the cohort were assigned to 1 of 4 US military services period groups. The pre-9/11 group included veterans who entered and left the military prior to September 11, 2001. This group mostly included veterans from World War II, Korean War, Vietnam War, and the first Gulf War (1990-1991). The post-9/11 group included veterans who first entered military services after September 11, 2001. The overlap group included veterans who entered military services prior to 9/11, remained in service and left after September 11, 2001. The reentered group included veterans who entered and left service prior to September 11, 2001, and then reentered military service after September 11, 2001 (Figure 1). Using ICD-9 codes, veterans also were placed into the following categories: PTSD alone (ICD-9 309.81 only), TBI alone (ICD-9 850.0-859.9, V15.52), and PTSD+TBI (any combination of ICD-9 codes from the other categories).
Statistical Analysis
Descriptive statistics were applied using proportions and means. Relationships between variables were examined using χ2 tests, t tests, analysis of variance, and nonparametric tests. All hypotheses were 2-sided at 95% CI. Results are presented as absolute numbers.
Results
PTSD only (n = 1,132,356, 85%) was the predominant diagnosis category followed by PTSD+TBI (n = 106,792, 8%) and TBI only (n = 100,789, 7%) (Figure 2). Most of the veterans in the study served pre-9/11 (77%), followed by post-9/11 (15%); 7% were in the overlap group, and 1% in the reentered group (Table 1). It is notable that the proportion of veterans diagnosed with PTSD decreased from pre-9/11 (88%) to post-9/11 (71%), overlap (77%), and reentered (74%) service periods. Increases were noted in those with PTSD+TBI diagnosis category from pre-9/11 (4%) to post-9/11 (23%), overlap (17%), and reentered (22%) service periods (Figure 3). In general, the relative distribution of diagnostic categories in all the service periods showed a similar trend, with the majority of veterans diagnosed with PTSD only. Across all service periods, significantly smaller proportions of veterans were diagnosed with TBI only (P < .001).
Distribution by Gender and Age
The cohort was 92% male (n = 1,239,295), but there was a marked increase in the percentage of nonmale veterans in post-9/11 groups. Study population ages ranged from 18 to 99 years based on date of birth to the date data were obtained; or date of birth to date of death, for those who were reported deceased at the time the data were obtained. The average (SD) ages for veterans in the pre-9/11 group were significantly older (66.3 [11.2] years) compared with the ages of veterans in the post-9/11 group (36.1 [8.7] years), the overlap group (41.4 [8.2] years), and the reentered group (46.9 [9.2] years), respectively.
Distribution by Race and Marital Status
The cohort identified as 65.7% white and 18.2% African American with much smaller percentages of Asians, American Indian/Alaska Natives (AI/AN) and Native Hawaiian/Pacific Islanders (Table 2). The relative proportion of AI/AN and Native Hawaiian/Pacific Islanders remained constant across all groups, whereas the number of Asians diagnosed with PTSD, TBI, or PTSD+TBI increased in the post-9/11 group. The number of African Americans diagnosed with PTSD, TBI, or both markedly increased in the overlap and reentered groups when compared with the pre-9/11 group, yet it went down in the post-9/11/group.
Half the cohort identified themselves as married (n = 675,145) (Table 3). A slightly larger proportion of those diagnosed with PTSD alone were married (51.7%), compared with those diagnosed with TBI only (40.3%), or PTSD+TBI (45.8%). Veterans in the post-9/11 group were less likely to identify as married (45.2%) compared with the pre-9/11 (51.2%), overlap (52.6%), or reentered (53.2%) groups. Divorce rates among pre-9/11 group, overlap group, and reentered group were higher compared with that of the post-9/11 group in all diagnosis categories.
Geographic Distribution
Veterans diagnosed with PTSD, TBI, or both were not evenly distributed across the VISNs VISNs 7, 8, 10, and 22 treated the most veterans, whereas VISN 9 and 15 treated the fewest. Taken together, the top 3 VISNs accounted for 27% to 28% of the total while lowest 3 accounted for 8% to 9% of the total cohort.
Service-Connected Disability
Of 1,339,937 veterans in the cohort, 1,067,691 had a service-connected disability rating for PTSD and/or TBI. Most were diagnosed with PTSD (n = 923,523, 86.5%) followed by both PTSD+TBI (n = 94,051, 8.8%). Three-quarters of the veterans with a service-connected disability were in the pre-9/11 group. Nearly 80% of veterans with a service-connected disability rating had a rating of > 50%. The average (SD) age of veterans with PTSD+TBI and a > 50% service-connected disability was 66.3 (11.2) years in the pre-9/11 group compared with 36.1 (8.7) years in the post-9/11 group.
Discussion
The demographic profile of veterans diagnosed with PTSD+TBI has changed across the service periods covered in this study. Compared with pre-9/11 veterans, the post-9/11 cohort: (1) higher percentage were diagnosed with PTSD+TBI; (2) higher proportion were nonmale veterans; (3) included more young veterans with > 50% service-connected disability; (4) were more racially diverse; and (5) were less likely to be married and divorced and more likely to be self-identified as single. Additionally, data revealed that veterans tended to locate more to some geographic regions than to others.
The nature of the warfare has changed remarkably over the past few decades. Gunshot wounds accounted for 65% of all injuries in World War I, 35% during Vietnam War, and 16% to 23% in the First Gulf War.24 In post-9/11 military conflicts, 81% of injuries were explosion related.24,25 Although improvements in personal protective gear and battlefield trauma care led to increased survival, several factors may have contributed to increased reporting of TBI, which peaked in 2011 at 32,000 cases.24-26
Increases in PTSD Diagnosis
Increasing media awareness, mandatory battlefield concussion screening programs instituted by the US Department of Defense (DoD), and stressful conditions that exacerbate mild TBI (mTBI) may have all contributed to the increase in numbers of veterans seeking evaluations and being diagnosed with PTSD and/or TBI in the post-9/11 groups. Additionally, the 2007 National Defense Authorization Act requested the Secretary of Defense to develop a comprehensive, systematic approach for the identification, treatment, disposition, and documentation of TBI in combat and peacetime. By a conservative estimate, significant numbers of veterans will continue to be seen for mTBI at about 20,000 new cases per year.25-27
More frequent diagnosis of mTBI may have contributed to the increase in veterans diagnosed with PTSD+TBI in the post-9/11 groups. A recent study found that almost 44% of US Army infantry soldiers in Iraq did not lose consciousness but reported symptoms consistent with TBI.14 Compared with veterans of previous wars, veterans of the post-9/11 conflicts (OIF, OED, and OND) have experienced multiple, protracted deployments with infrequent breaks that can have a cumulative effect on the development of PTSD.8-10
The findings from the NVVRS study led to creation of specialized PTSD programs in the late 1980s. Since then, there has been an explosion of knowledge and awareness about PTSD, TBI, and the associated service-connected disability ratings and benefits, leading to an increased number of veterans seeking care for PTSD. For example, media coverage of the 50th anniversary of the D-day celebrations resulted in a surge of World War II veterans seeking treatment for PTSD and a surge of Vietnam veterans sought treatment for PTSD during the wars in Iraq and Afghanistan.28 An increased number of veterans reporting PTSD symptoms prompted the DoD to increase screening for PTSD, and to encourage service members to seek treatment when appropriate.
The VA has instituted training programs for clinicians and psychologists to screen and provide care for PTSD. Beginning in 2007, the VA implemented mandatory TBI screening for all veterans who served in combat operations and separated from active-duty service after September 11, 2001. The 4-question screen identifies veterans who are at increased risk of TBI and who experience symptoms that may be related to specific event(s).29 A positive screen does not diagnose TBI but rather indicates a need for further evaluation, which may or may not be responsible for inflated reporting of TBI. Renewed research also has led providers to recognize and study PTSD resulting from noncombat trauma and moral injury. The possibility of delayed onset also drives up the number of veterans diagnosed with PTSD.5-7
Prevalence
A wide variability exists in the reported prevalence of PTSD among US war veterans with estimates ranging from 15% to 20% of veterans from recent conflicts3,20 and 10% to 30% of veterans from previous wars.3,19 These rates are higher than estimates from allied forces from other countries.19 Meta-analyses suggest that the prevalence of PTSD is 2% to 15% among Vietnam War veterans, 1% to 13% among first (pre-9/11) Gulf War veterans, 4% to 17% among OEF/OIF/OND veterans; these veterans have a lifetime prevalence of 6% to 31%.3,11,19,30-38 The prevalence of PTSD is 2 to 4 times higher among the US veterans19,39 when compared with that of civilians.40,41 According to one study, concomitant PTSD and TBI appears to be much higher in US war veterans (4%-17%) compared with United Kingdom Iraq War veterans (3%-6%).19
This study’s finding of an increase in nonmale soldiers with PTSD and/or TBI was not surprising. There is a paucity of data on the effect of war zone exposure on women veterans. Recently, women have been more actively involved in combat roles with 41,000 women deployed to a combat zone. Results of this study indicate a 2- to 3-fold increase in veterans identifying themselves as nonmale in post-9/11 groups with a higher proportion diagnosed with either PTSD alone or PTSD and TBI. Women are at a higher risk for PTSD than are men due in part to exposure to abuse/trauma prior to deployment, experience of higher rates of discrimination, and/or sexual assault.31-33 One study involving First Gulf War female veterans reported higher precombat psychiatric histories as well as higher rates of physical and sexual abuse when compared with that of men.31
In this study, the average age of veterans adjudicated and compensated for PTSD and/or TBI pre-9/11, was 66 years compared with 36 years for post-9/11 veterans. Sixty-six percent of veterans from the post-9/11 group had ≥ 50% service-connected disability at age 36 years; 75% of veterans from the overlap group had ≥ 50% service-connected disability at age 41 years; and 76% veterans from the reentered group had ≥ 50% service-connected disability at age 46 years. Younger age at diagnosis and higher rates of disability not only pose unique challenges for veterans and family members, but also suggest implications for career prospects, family earnings, loss of productivity, and disease-adjusted life years. Also noted in the results, this younger cohort has a higher percentage of single/unmarried veterans, suggesting familial support systems may be more parental than spousal. Treatment for this younger cohort will likely need to focus on early and sustained rehabilitation that can be integrated with career plans.
For treatment to be effective, there must be evidence for veterans enrolling, remaining, and reporting benefits from the treatment. Limited research has shown currently advocated evidence-based therapies to have low enrollment rates, high drop-out rates, and mixed outcomes.42
Results showing a gradual increase in the proportion of nonwhite, non-African American veterans diagnosed with PTSD alone, TBI alone, or both, likely reflect the changing demographic profile of the US as well as the Army. However, the reason that more African Americans were diagnosed with PTSD and/or TBI in the overlap and reentered groups when compared with the pre-9/11 group could not be ascertained. It is possible that more veterans identified themselves as African Americans as evident from a decrease in the number of veterans in the unknown category post-9/11 when compared with the pre-9/11 group. In 2016, the American Community Survey showed that Hispanic and African American veterans were more likely to use VA health care and other benefits than were any other racial group.40 Improved screening for PTSD and TBI diagnoses, increased awareness, and education about the availability of VA services and benefits may have contributed to the increased use of VA benefits in these groups.
Data from this study are concordant with data from the National Center for Veterans Analysis and Statistics reporting on the younger age of diagnosis and higher rates of initial service-connected disability in veterans with PTSD and PTSD+TBI.43 One study analyzing records from 1999 to 2004 showed that the number of PTSD cases grew by 79.5%, resulting in 148.7% increase in benefits payment from $1.7 billion to $4.3 billion per year.44 In contrast, the compensation cost for all other disability categories increased by only 41.7% over this period. This study also revealed that while veterans with PTSD represented only 8.7% of compensation recipients, they received 20.5% of all compensation payments, driven in large part by an increase in > 50% service-connected disability ratings.44
Thus, from financial as well as treatment points of view, the change in the demographic profile of the veteran must be considered when developing PTSD treatment strategies. While treatment in the past focused solely on addressing trauma-associated psychiatric issues, TBI and PTSD association will likely shift the focus to concurrent psychiatric and physical symptomology. Similarly, PTSD/TBI treatment modalities must consider that the profile of post-9/11 service members includes more women, younger age, and a greater racial diversity. For instance, younger age for a disabled veteran brings additional challenges, including reliance on parental or buddy support systems vs a spousal support system, integrating career with treatment, selecting geographic locations that can support both career and treatment, sustaining rehabilitation over time. The treatment needs of a 35-year-old soldier with PTSD and/or TBI, whether male or female, Asian or African American are likely to be very different from the treatment needs of a 65-year-old white male. Newer treatment approaches will have to address the needs of all soldiers.
Limitations
Our study may underestimate the actual PTSD and/or TBI disease burden because of the social stigma associated with diagnosis, military culture, limitations in data collection.45-50 In addition, in this retrospective database cohort study, we considered and tried to minimize the impact of any of the usual potential limitations, including (1) accuracy of data quality and linkage; (2) identifying cohort appropriately (study groups); (3) defining endpoints clearly to avoid misclassifications; and (4) incorporating all important confounders. We identified veterans utilizing medical services at VA hospitals during a defined period and diagnosed with PTSD and TBI using ICD-9 codes and divided in 4 well-defined groups. In addition, another limitation of our study is to not accurately capture the veterans who have alternative health coverage and may choose not to enroll and/or participate in VA health care. In addition, some service members leaving war zones may not disclose or downplay the mental health symptoms to avoid any delay in their return home.
Conclusions
This study highlights the changing profile of the soldier diagnosed with PTSD and/or TBI who served pre-9/11 compared with that of those who served post-9/11. Treatment modalities must address the changes in warfare and demographics of US service members. Future treatment will need to focus more on concurrent PTSD/TBI therapies, the needs of younger soldiers, the needs of women injured in combat, and the needs of a more racially and ethnically diverse population. Severe injuries at a younger age will require early detection and rehabilitation for return to optimum functioning over a lifetime. The current study underscores a need for identifying the gaps in ongoing programs and services, developing alternatives, and implementing improved systems of care. More studies are needed to identify the cost implications and the effectiveness of current therapies for PTSD and/or TBI.
Acknowledgments
This study was supported by VA Medical Center and Midwest BioMedical Research Foundation (MBRF), Kansas City, Missouri. The manuscript received support, in part, from NIH-RO1 DK107490. These agencies did not participate in the design/conduct of the study or, in the interpretation of the data.
1. Bagalman E. Traumatic brain injury among veterans. http://www.ncsl.org/documents/statefed/health/TBI_Vets2013.pdf. Published January 4, 2013. Accessed February 3, 2020.
2. Veterans Health Administration, Support Service Center. Workload files fiscal year 2008-fiscal year 2012. [Source not verified.]
3. Tanielian T, Jaycox LH, eds. Invisible Wounds of War: Psychological and Cognitive Injuries, Their Consequences, and Services to Assist Recovery. Santa Monica, CA: RAND Corporation; 2008.
4. Bagalman E. Health care for veterans: traumatic brain injury. https://fas.org/sgp/crs/misc/R40941.pdf. Published March 9, 2015. Accessed February 4, 2020.
5. Ikin JF, Sim MR, McKenzie DP, et al. Anxiety, post-traumatic stress disorder and depression in Korean War veterans 50 years after the war. Br J Psychiatry. 2007;190(6):475-483.
6. Andrews B, Brewin CR, Philpott R, Stewart L. Delayed-onset posttraumatic stress disorder: a systematic review of the evidence. Am J Psychiatry. 2007;164(9):1319-1326.
7. Frueh BC, Grubaugh AL, Yeager DE, Magruder KM. Delayed-onset post-traumatic stress disorder among war veterans in primary care clinics. Br J Psychiatry. 2009;194(6):515-520.
8. McAllister TW. Neurobiological consequences of traumatic brain injury. Dialogues Clin Neurosci. 2011;13(3):287-300.
9. Schlenger WE, Kulka RA, Fairbank JA, et al. The prevalence of posttraumatic stress disorder in the Vietnam generation: a multimethod, multisource assessment of psychiatric disorder. J Trauma Stress. 1992;5(3):333-363.
10. Friedman MJ, Resick PA, Bryant RA, Strain J, Horowitz M, Spiegel D. Classification of trauma and stressor-related disorders in DSM-5. Depress Anxiety. 2011;28(9):737-749.
11. Lew HL, Otis JD, Tun C, Kerns RD, Clark ME, Cifu DX. Prevalence of chronic pain, posttraumatic stress disorder, and persistent postconcussive symptoms in OIF/OEF veterans: polytrauma clinical triad. J Rehabil Res Dev. 2009;46(6):697-702.
12. Carlson K, Kehle S, Meis L, et al. The Assessment and Treatment of Individuals with History of Traumatic Brain Injury and Post-Traumatic Stress Disorder: A Systematic Review of the Evidence. Washington, DC: US Department of Veterans Affairs; 2009.
13. Gironda RJ, Clark ME, Ruff RL, et al. Traumatic brain injury, polytrauma, and pain: challenges and treatment strategies for the polytrauma rehabilitation. Rehabil Psychol. 2009;54(3):247-258.
14. Hoge CW, McGurk D, Thomas JL, Cox AL, Engel CC, Castro CA. Mild traumatic brain injury in U.S. soldiers returning from Iraq. N Engl J Med. 2008;358(5):453-463.
15. Bazarian JJ, Cernak I, Noble-Haeusslein L, Potolicchio S, Temkin N. Long-term neurologic outcomes after traumatic brain injury. J Head Trauma Rehabil. 2009;24(6):439-451.
16. Peskind ER, Brody D, Cernak I, McKee A, Ruff RL. Military- and sports-related mild traumatic brain injury: clinical presentation, management, and long-term consequences. J Clin Psychiatry. 2013;74(2):180-188.
17. Riggio S. Traumatic brain injury and its neurobehavioral sequelae. Neurol Clin. 2011;29(1):35-47, vii.
18. Helmick KM, Spells CA, Malik SZ, Davies CA, Marion DW, Hinds SR. Traumatic brain injury in the US military: epidemiology and key clinical and research programs. Brain Imaging Behav. 2015;9(3):358-366.
19. Richardson LK, Frueh BC, Acierno R. Prevalence estimates of combat-related post-traumatic stress disorder: critical review. Aust N Z J Psychiatry. 2010;44(1):4-19.
20. Thompson WW, Gottesman II, Zalewski C. Reconciling disparate prevalence rates of PTSD in large samples of US male Vietnam veterans and their controls. BMC Psychiatry. 2006;6:19.
21. Frueh BC, Elhai JD, Gold PB, et al Disability compensation seeking among veterans evaluated for posttraumatic stress disorder. Psychiatr Serv. 2003;54(1):84-91.
22. Thakur H, Oni O, Singh V, et al. Increases in the service connection disability and treatment costs associated with posttraumatic stress disorder and/or traumatic brain injury in United States veterans pre- and post-9/11: the strong need for a novel therapeutic approach. Epidemiology (Sunnyvale). 2018;8(4):353.
23. Schlenger WE, Kulka RA, Fairbank JA, et al. The prevalence of post-traumatic stress disorder in the Vietnam generation: a multimethod, multisource assessment of psychiatric disorder. J Trauma Stress. 1992;5(3):333-363.
24. Belmont PJ, Schoenfeld AJ, Goodman G. Epidemiology of combat wounds in Operation Iraqi Freedom and Operation Enduring Freedom: orthopaedic burden of disease. J Surg Orthop Adv. 2010;19(1):2-7.
25. Owens BD, Kragh JG Jr, Wenke JC, Macaitis J, Wade CE, Holcomb JB. Combat wounds in Operation Iraqi Freedom and Operation Enduring Freedom. J Trauma. 2008;64(2):295-299.
26. Defense Health Agency, Defense and Veterans Brain Injury Center. DOD worldwide numbers for TBI since 2000. https://dvbic.dcoe.mil/dod-worldwide-numbers-tbi. Updated February 14, 2020. Accessed February 14, 2020.
27. Armed Forces Health Surveillance Center. Deployment-related conditions of special surveillance interest, U.S. armed forces, by month and service, January 2003-December 2012 (data as of 22 January 2013). MSMR. 2013;20(1):16-19.
28. Harvey JH, Stein SK, Scott PK. Fifty years of grief: accounts and reported psychological reactions of Normandy invasion veterans. J Narrative Life History. 1995;5(4):321-332.
29. US Department of Veterans Affairs. Polytrauma/TBI system of care. https://www.polytrauma.va.gov/system-of-care/index.asp. Updated June 3, 2015. Accessed February 4, 2020.
30. Wolfe J, Erickson DJ, Sharkansky EJ, King DW, King LA. Course and predictors of posttraumatic stress disorder among Gulf War veterans: a prospective analysis. J Consult Clin Psychol. 1999;67(4):520-528.
31. Breslau N, Davis GC, Peterson EL, Schultz L. Psychiatric sequelae of posttraumatic stress disorder in women. Arch Gen Psychiatry. 1997;54(1):81-87.
32. Kessler RC, Sonnega A, Bromet E, Hughes M, Nelson CB. Posttraumatic stress disorder in the National Comorbidity Survey. Arch Gen Psychiatry. 1995;52(12):1048-1060.
33. Wolfe J, Kimerling R. Gender issues in the assessment of posttraumatic stress disorder. In: Wilson J, Keane TM, eds. Assessing Psychological Trauma and PTSD. New York: Guilford; 2004:192-238.
34. Engel CC Jr, Engel AL, Campbell SJ, McFall ME, Russo J, Katon W. Posttraumatic stress disorder symptoms and precombat sexual and physical abuse in Desert Storm veterans. J Nerv Ment Dis. 1993;181(11):683-688.
35. US Department of Veterans Affairs, National Center for Veterans Analysis and Statistics. Profile of veterans: 2016 data from the American Community Survey. https://www.va.gov/vetdata/docs/SpecialReports/Profile_of_Veterans_2016.pdf. Published February 2018. Accessed February 4, 2020.
36. US Department of Commerce Economics and Statistics Administration, US Census Bureau, Geography Division. 2010 population distribution in the United States and Puerto Rico. https://www2.census.gov/geo/maps/dc10_thematic/2010_Nighttime_PopDist/2010_Nighttime_PopDist_Page_Map.pdf. Accessed February 4, 2020.
37. Cifu DX, Taylor BC, Carne WF, et al. Traumatic brain injury, posttraumatic stress disorder, and pain diagnoses in OIF/OEF/OND veterans. J Rehabil Res Dev. 2013;50(9):1169-1176.
38. Dohrenwend BP, Turner JB, Turse NA, Adams BG, Koenen KC, Marshall R. The psychological risks of Vietnam for U.S. veterans: a revisit with new data and methods. Science. 2006;313(5789):979-982.
39. Magruder KM, Frueh BC, Knapp RG, et al. Prevalence of posttraumatic stress disorder in Veterans Affairs primary care clinics. Gen Hosp Psychiatry. 2005;27(3):169-179.
40. Norris FH. Epidemiology of trauma: frequency and impact of different potentially traumatic events on different demographic groups. J Consult Clin Psychol. 1992;60(3):409-418.
41. Resnick HS, Kilpatrick DG, Dansky BS, Saunders BE, Best CL. Prevalence of civilian trauma and posttraumatic stress disorder in a representative national sample of women. J Consult Clin Psychol. 1993;61(6):984-991.
42. Najavits LM. The problem of dropout from “gold standard” PTSD therapies. F1000Prime Rep. 2015;7:43.
43. US Department of Veterans Affairs, National Center for Veterans Analysis and Statistics. Trends in veterans with a service-connected disability: 1985 to 2014. https://www.va.gov/vetdata/docs/QuickFacts/SCD_trends_FINAL_2014.PDF. Published June 2015. Accessed February 4, 2020.
44. US Department of Veterans Affairs, Office of Inspector General. Review of state variances in VA disability compensation payments. Report 05-00765-137. https://www.va.gov/oig/52/reports/2005/VAOIG-05-00765-137.pdf. Published May 19, 2015. Accessed February 4, 2020.
45. McNally RJ. Progress and controversy in the study of posttraumatic stress disorder. Annu Rev Psychol. 2003;54:229-252.
46. Freeman T, Powell M, Kimbrell T. Measuring symptom exaggeration in veterans with chronic posttraumatic stress disorder. Psychiatry Res. 2008;158(3):374-380.
47. Frueh BC, Elhai JD, Grubaugh AL, et al. Documented combat exposure of US veterans seeking treatment for combat-related post-traumatic stress disorder. Br J Psychiatry. 2005;186(6):467-475.
48. Frueh BC, Hamner MB, Cahill SP, Gold PB, Hamlin KL. Apparent symptom overreporting in combat veterans evaluated for PTSD. Clin Psychol Rev. 2000;20(7):853-885.
49. Sparr L, Pankratz LD. Factitious posttraumatic stress disorder. Am J Psychiatry. 1983;140(8):1016-1019.
50. Baggaley M. ‘Military Munchausen’s’: assessment of factitious claims of military service in psychiatric patients. Psychiatr Bull. 1998;22(3):153-154.
Remote Temperature Monitoring of the Diabetic Foot: From Research to Practice
Diabetic foot ulcers (DFUs) are devastating, common, and costly. This burden is borne disproportionately by veterans who have high prevalence of type 2 diabetes mellitus (T2DM) and other precipitating risk factors.1 The mortality of veterans following a DFU is sobering, and ulceration is recognized as a significant marker of disease severity.
A 2017 study by Brennan and colleagues reported a 19% mortality rate within 1 year, and only 29% survive past 5 years.2 DFUs are often complicated by peripheral arterial disease (PAD) and diabetic immune dysfunction, contributing to chronic wounds and infection.3,4 About 60% of all foot ulcers become infected, and > 20% of patients with a diabetic foot infection require amputation.5,6
A 2010 retrospective study reports that > 3,400 veterans have a diabetes-related lower extremity amputation annually, vastly surpassing the rate of amputation secondary to trauma in the Veterans Health Administration (VHA).7,8 The inpatient costs for each amputation exceeded $60,000 in fiscal year 2010, and these amputation-related costs represent only 1 component of the total expense to the VHA attributable to diabetic foot complications.7 A recent systematic review by Chan and colleagues estimated mean annual costs in the year following a foot ulcer to be $44,200 to the public payer.9 This implies that direct expenditures for treatment of DFUs within the VHA exceeds $3 billion annually.
Diabetic Foot Ulcer Prevention
Given the dramatic impact of diabetic foot complications to the veteran and the US health care system, the VHA has long recognized the importance of preventive care for those at risk. In 2017 US Department of Veterans Affairs (VA) and Department of Defense issued a clinical practice guideline for the management of T2DM that recommended prophylactic foot care for early identification of any deformity or skin breakdown.10 The guidelines note that a “person who has had a foot ulcer is at lifelong risk of further ulceration,” reflecting the high rate of recurrence among all patients, including veterans. Multiple studies suggest that as many as 40% of patients experience recidivism in the first year after healing from a wound.11-16
The VA is well equipped to deliver quality preventive care because of its innovative and long-standing PAVE (Prevention of Amputations for Veterans Everywhere) program.17 PAVE provides screening, education, appropriate footwear, and stratified care guidelines for veterans at risk for diabetes-related foot complications (Table 1). The practices encouraged by PAVE are evidence-based and synergistic with the objectives of the VA’s patient aligned care team (PACT) delivery approach.18 The granular data collected through PAVE are used to guide best practices and provide benchmarks for diabetic foot outcomes.
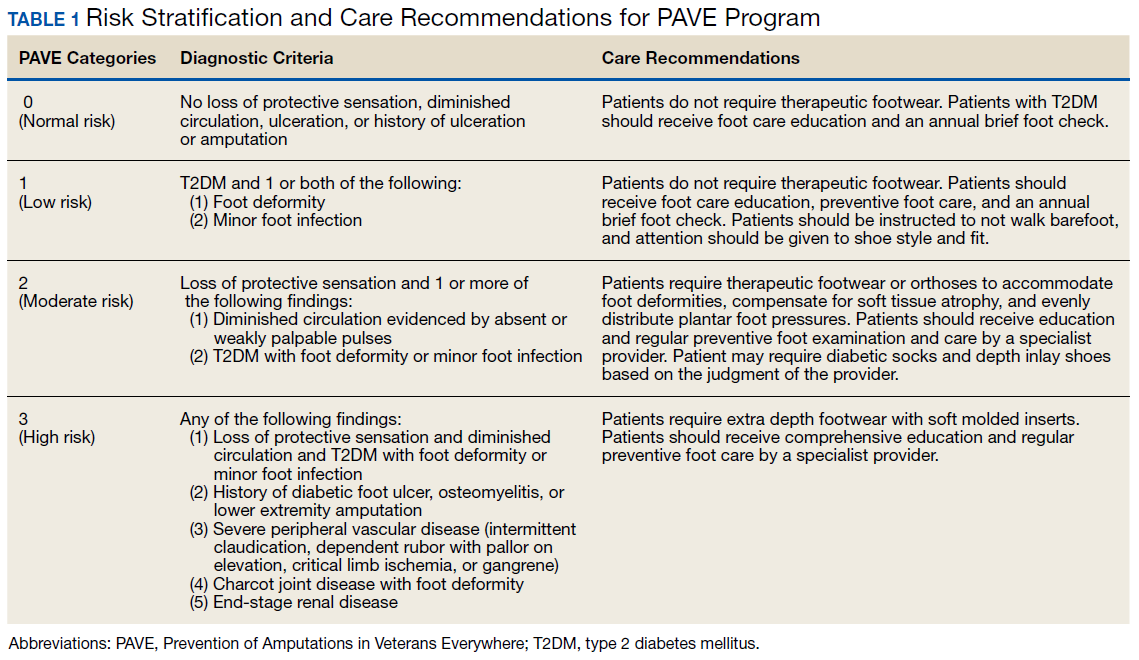
Unfortunately, despite PAVE guidelines requiring annual specialist foot care for at-risk veterans, a 2013 report by the VA Office of the Inspector General (OIG) found that one-third of all patients had no documentation of this minimal requirement of preventive foot care.19 Although the VA has worked to address this issue, the data hint at the missed opportunities for prevention of complications and the challenges of ensuring that a large at-risk veteran population has systematic and routine screening with access to specialist foot care.
Given the large proportion of veterans at high risk of chronic wound formation and the challenges of ensuring that this cohort receives good preventive foot care, expanding telemedicine has been suggested. Telemedicine solutions have the potential to reduce the impact of chronic wounds on overburdened clinic resources, schedules, and local and federal budgets.20 Interestingly, the only preventive practice for the diabetic foot that has been proven effective through multiple randomized controlled trials and national and international clinical guidance documents is once-daily foot temperature monitoring.21-26 Daily monitoring has the potential to reduce the burden of DFUs to veterans, improve veteran access to needed preventive care, and reduce costs incurred by the VHA treating diabetic foot complications. Yet despite a recent national guidance document detailing its appropriate use in PAVE 3 veterans, it remains underutilized.27
The purpose of this review is to: (1) discuss the evidence supporting once-daily remote temperature monitoring (RTM), a telemedicine approach critical to improving both veteran access to care and diabetic foot outcomes; (2) summarize a 2017 study that presented an advanced clinical understanding of RTM use among veterans; (3) provide previously unpublished data from this study comparing high-risk VA and non-VA cohorts, highlighting the opportunity for additional focus on foot ulcer prevention within the VA; and (4) report on recent VA utilization of a RTM technology based on this research, emphasizing lessons learned and best practices.
Remote Temperature Monitoring
The objective of daily foot temperature monitoring is to identify impending inflammatory foot conditions, such as DFUs, infection, and acute Charcot neuroarthropathy episodes. The patient and care team then act to resolve the cause of detected inflammation before clinical presentation (prevention) and begin treatment earlier than would otherwise be possible to avoid expensive complications, such as infection (early detection). Preventive therapies are low risk to the patient and inexpensive.
RTM is recommended by multiple clinical practice guidelines, including those of the International Working Group on the Diabetic Foot, the American College of Foot and Ankle Surgeons, and the Wound Healing Society.24-26 Its use is supported by evidence from 3 National Institutes of Health-funded and well-designed randomized controlled trials, 1 of which was additionally supported by a VA Health Services Research and Development Service Merit Award.21-23,28 Conducted between 2004 and 2007, these studies demonstrated the potential to reduce foot ulcer incidence by as much as 85% using a dermal thermometer to identify inflammation and prompt decreased ambulation. Investigators established a clinical monitoring protocol comparing the temperatures between 6 matched locations on the left and right feet. Persistent differences in contralateral temperatures exceeding 2.2°C (4.0°F) were used as a marker for elevated risk and to initiate preventive care. Based on the encouraging results from these studies, a 2017 effectiveness review prepared for the Agency for Healthcare Research and Quality concluded that “home monitoring of foot skin temperature is effective for reducing foot ulcer incidence and recurrence.”29
Accuracy of RTM
A 2017 longitudinal study (NCT02647346) has provided novel data to advance understanding of RTM for the prediction and prevention of DFUs.30 This study was the first to systematically analyze the accuracy of RTM over different monitoring thresholds. The results enable practitioners to deliver risk-stratified preventive care. Policy makers can use the data from this study to weigh the cost and benefits of RTM for population health.
The multicenter trials had 129 participants from 4 VA health care systems: VA Long Beach Healthcare System in California, Miami VA Healthcare System in Florida, Phoenix VA Healthcare System in Arizona, and VA West Los Angeles Healthcare System in California. Each participant was followed for 34 weeks under standard preventive foot care and was instructed to step on a telemedicine SmartMat (Podimetrics, Inc) RTM mat for 20 seconds daily. Participants and investigators were blinded to the temperature data so that the accuracy of temperature monitoring could be assessed. All participants had a history of T2DM and healed DFU. Principal exclusion criteria included unhealed plantar wound, history of proximal lower extremity amputation (ie, above ankle), active Charcot foot disease, and comorbidities that could potentially inhibit an inflammatory response, such as end-stage renal disease, active malignancy, and immunosuppressive diseases.
The investigators reported that RTM with the study mat detected 97% of nonacute plantar DFUs using the most commonly studied threshold (sustained 2.2°C temperature difference). The lead time averaged 37 days before clinical identification of the wound under standard care. Although the false-positive rate of 57% was high, corresponding to approximately 3.0 notifications per patient per year on average in the research setting, it is important to note that this study only considered the prediction of plantar DFUs. Thus, detection of foot inflammation secondary to other conditions, such as preulcerative lesion, dorsal wound, Charcot neuroarthropathy, or foot infection, were reported as a false positive per the study’s definitions. Further, Crisologo and Lavery noted in a translational medicine summary of this research, because the intervention is noninvasive and minimally impactful to the patient and the health care system, “the potential to arrest re-ulceration is worth the perceived inconvenience to the patient.”31
Secondary outcomes related to adherence and ease of use were encouraging. Eighty-eight percent of participants reported that the mat was “very easy to use,” the highest possible score, and 98% were able to set up the mat for home use without difficulty. At the end of the 34-week study, more than 74% of participants remained engaged in routine use of the mat under a per-protocol assessment of adherence. These results are especially impressive given the documented poor adherence of at-risk patients to routine use of therapeutic footwear, which has been reported to be as low as 15%.32
New Research
The data collected during this study has led to new research and advancements in RTM. A recent publication by Gordon and colleagues investigated whether RTM is less accurate in cohorts with perceived challenges.33 They include patients with recently healed wounds and those with a history of partial foot amputation. There was no difference in the accuracy or lead time for either cohort relative to the entire cohort, suggesting that RTM is appropriate for monitoring patients with recently healed DFUs or partial foot amputations.
In another recent study, the data were used to derive a novel approach to monitor a single at-risk foot.34 The practice of RTM has traditionally required comparing temperatures between contralaterally matched plantar locations on the feet, thus limiting its use in patients with a history of major lower extremity amputation and patients being treated for a wound, which may be bandaged or in an off-loading cast or boot. Because the risk factors for DFUs exist in both limbs, these patients are at high risk for developing complications to the contralateral foot and may benefit from preventive once-daily foot temperature monitoring. The investigators empirically derived a novel monitoring approach for patients without a contralateral control. This approach was found to predict 91% of impending plantar DFUs on average 41 days before clinical presentation with a false positive rate of 54%.
Additional Focus on Prevention
Table 2 shows previously unpublished data from a subgroup analysis between veteran and nonveteran participants in the study.25 These descriptive statistics reinforce some widely held assumptions regarding the high-risk veteran population and challenge others. For example, compared with the nonveteran participants, the veteran cohort unsurprisingly had a larger ratio of male participants (P < .01), had a higher rate of cigarette use (P < .01), and was more likely to live alone (although not at a statistically significant level). Veterans in the study had body mass index, rates of alcohol use, frequency of exercise, and glucose control comparable to that of nonveterans.
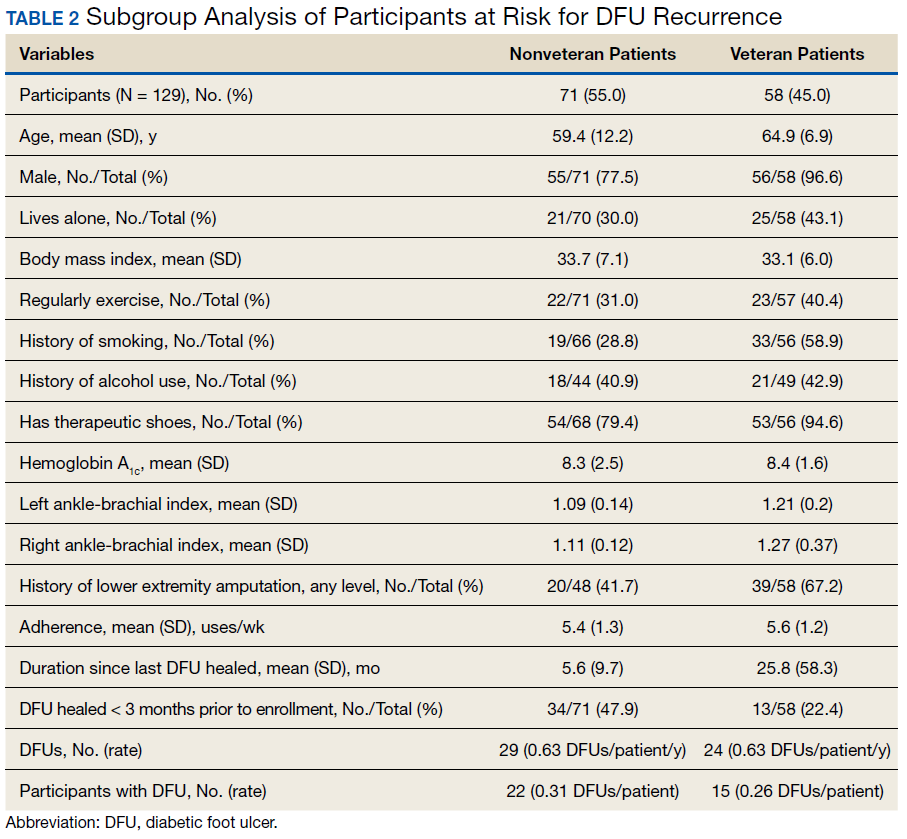
The potential impact of the PAVE program is clear in several of these comparisons. Although as few as 15% of patients use therapeutic shoes routinely, PAVE ensures that the majority of veterans receive them. Nearly 95% of veterans have therapeutic shoes compared with about 80% of nonveteran participants (P < .05). Veterans also had higher ankle-brachial index results (P < .05), although on average both cohorts were within normal clinical parameters. Veterans had a significantly longer duration since healing from the most recent wound, and fewer veteran participants had a wound that healed in the 3 months prior to the study. Despite this, during the study veterans had annualized DFU incidence equal to that of nonveterans. Furthermore, veterans also had significantly higher rates of amputation prior to participation. That these critical outcomes for veterans are no better than those observed in other care environments despite PAVE suggests that approaches recommended via PAVE alone are insufficient to significantly arrest DFU recurrence, and even more focus on prevention in the VA may be warranted.
From Research to Practice
Since the publication of the 2017 study, the VHA has been at the vanguard of translating the evidence and research underlying RTM into clinical practice. A clinical guidance document governing appropriate use of RTM with the study mat was recently published by the VA Prosthetic and Sensory Aids Service in collaboration with the National Podiatry Program office.27 This guidance document recommends once-daily RTM for at-risk veterans designated PAVE level 3. It defines roles and responsibilities required for the successful implementation of a RTM program with the study device. The document additionally presents various clinical monitoring protocols for veterans, although the protocol and thresholds used are at the discretion of the prescribing clinician and should reflect the risk profile of the veteran in question.
A staged response to inflammation has proven popular, whereby an initial high-sensitivity threshold is chosen for monitoring. The initial response is telephone outreach by a designee supplied by the clinic or device manufacturer, typically a trained registered nurse, to the veteran to collect subjective history and instruct off-loading and reduced ambulation, with a target of 50% baseline reduction in step count. Should the inflammation persist despite off-loading, an examination may be necessary to identify and resolve its cause. For recalcitrant inflammation, more targeted pressure off-loading of the affected area may be accomplished with custom orthotics, accommodative insoles, removable cast walkers, and total contact casting. After 2 to 4 weeks without signs of inflammation, the cause is deemed to have been resolved and lowered the acute risk for developing further diabetic foot complications.
More than 600 veterans have been monitored for > 1,000 patient-years—13 VA medical centers are practicing RTM with the study mat as of this writing. The monitoring program has been integrated into many veteran daily routines as evidenced by > 70% retaining full engagement after having been monitored for > 1 year. The total number of alerts/patient-years across these veterans has been 1.4, significantly lower than the 3.0 alerts/patient-year observed in the study. This is potentially due to successful interventions in response to detected inflammation, resolving inflammation, and avoiding unnecessary alerts occurring in the research setting, which did not employ interventions that resolved inflammation episodes. In the past 6 months, 68% of all inflammation detected resolved via off-loading alone without requiring further clinical intervention. In the cases that required an examination, 76% of patients reported clinically meaningful preventive care (eg, preulcerative callus was debrided, a subungual hemorrhage was treated, a foot ulcer was identified).
Organizational Best Practices
Several best practices have been cultivated related to initiating a RTM program at a new site, for promoting the success of a RTM program, and provisioning excellent preventive care to support the RTM program. Although we advise adhering to the recommendations in the VA guidance document,27 the authors have observed several additional organizational best practices that are not explicitly addressed.
Partnering with PACT. Collaboration between PAVE and PACT has the potential not only to improve outcomes for patients at risk for diabetic foot complications, but also can help identify appropriate high-risk veteran candidates for preventive care with RTM who may not be followed for routine care from a specialty provider, such as a podiatrist, as highlighted by the 2013 OIG report.
Prescreening eligible patients. Several programs have used PAVE data or appointment schedules to identify and target high-risk veterans proactively. This approach has several benefits. It simplifies clinical coordination and streamlines workflow for patient identification and onboarding. It also allows those veterans at highest risk to receive needed and recommended preventive care at their next scheduled appointment. Finally, if PAVE data are used to identify eligible patients, it has the added benefit of ensuring a baseline level of telemedicine preventive foot care for veterans who have become lost to follow-up and have not been seen recently for a routine foot examination.
Implementing foot monitoring during wound treatment. Recent research has expanded the reach of once-daily RTM with the mat to patients being treated for a wound to only 1 foot. This practice has 2 benefits: The patient is able to establish a preventive routine before healing, an important advantage because research strongly suggests that recurrence is most likely in the first months after healing. Second, 48% of patients with a history of DFUs will develop new wounds to the contralateral foot because risk factors, such as neuropathy and peripheral arterial disease, exist in both limbs.35 Furthermore, ongoing treatment for a wound to 1 foot may result in gait deviation and elevated pressure to the sound foot, additionally predisposing the veteran to complications, resulting in a high rate of wounds occurring to the unwounded foot during treatment (0.2 DFU/DFU-year).34 Thus, there is potential benefit in monitoring the sound foot while undergoing treatment for a wound; further, the patient will have immediate access to the device for prevention of recurrence once the wound has resolved.
Utilizing foot monitoring as an extension of telemedicine. Many VA facilities have large geographic catchment areas, making routine follow-up difficult for veterans living in rural areas. RTM serves as an extension of the patient’s daily self-examination and the clinician’s ability to monitor patients with objective information daily. The veterans using the system become more invested and feel as though they are taking an active role in their health care.
Investing in ongoing medical education. Multidisciplinary education sessions reviewing supporting clinical data and resultant clinical practice guidelines raise awareness for those providers and trainees unaware of preventive best practices for the diabetic foot, including those related to foot RTM. These sessions also are helpful for those familiar with foot temperature monitoring or who are responsible for administration of an ongoing program to remain current with contemporary best practices and to discuss improvements for patient care. Familiarity also can help address clinical inertia when benefits and evidence are clearly communicated with health care providers (HCPs).
Clinical Best Practices
Treating preulcerative lesions urgently and aggressively. Callus and other preulcerative lesions often cause progressive tissue damage and poor outcomes. When identified, these lesions should be promptly treated to ensure best outcomes.24
Recognizing the limits of patient self-examinations. Comorbidities such as visual impairment and reduced joint mobility often preclude patients from completing rigorous self-examinations of the foot, which is especially critical while collecting subjective history from the patient during triage of inflammation. A caregiver or spouse can help inspect the foot during outreach and provide additional context.36
Interpreting a benign foot on examination. Because RTM has been demonstrated to detect inflammation preceding a foot ulcer as many as 5 weeks before presentation to the clinic, some veterans may have few signs or symptoms of acute risk during examination. Often, the damage is to subcutaneous tissue resulting from repetitive microtrauma. Research suggests that clinical examination in these cases is often unreliable for identifying the earliest signs of risk, such as palpation to identify subtle temperature changes secondary to inflammation.37 If a patient has refractory inflammation requiring examination and presents with an otherwise unremarkable foot, it is an opportunity to evaluate whether the patient’s shoewear remains appropriate or has worn out, to communicate the veteran’s ongoing elevated risk, and to educate on the importance of diligence in daily foot self-examinations, daily use of the foot temperature monitoring, and continued off-loading until the inflammation resolves.
Communicating the distinction between healing and remission. Although healing is the goal of wound care, patients should be educated that the underlying disease remains after epithelialization. In some cases, tissue deep to the skin has not completed remodeling, and the patient is at acute risk of recurrence. Remission is a powerful metaphor that better describes the patient’s ongoing risk to encourage continued healthy routines and diligent self-care.38Considering the entirety of both feet for recurrence. Critical risk factors for diabetic foot complications, such as peripheral neuropathy and PAD, exist in both limbs, and patients with a history of wounds often develop new complications to different ipsilateral locations, or in as many as 48% of cases, to the contralateral foot.35 For best outcomes, detected inflammation should be treated aggressively independent of whether the location coincides with an area of previous concern.
Encouraging adherence, routine, and empowerment. Advanced diabetes mellitus and neuropathy may impact a patient’s executive function, and multiple studies have reported that patients at risk for inflammatory foot diseases exhibit fatalism toward their foot care and outcomes.39-41 Consistent education, encouragement, empowerment, and establishment of positive routines are needed to ensure high adherence with all preventive care regimens, including RTM.
Case Presentations
The following case series illustrates many of these clinical best practices and characterizes the potential benefits of RTM to veterans within the VA.
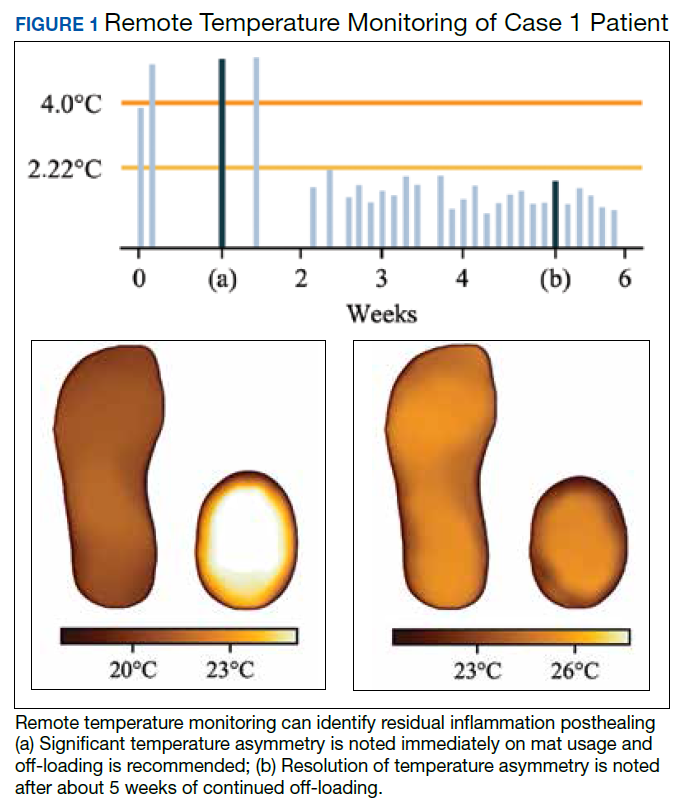
Case 1: Prevention After Healing
A veteran underwent a Chopart amputation and was recommended to use the mat after healing was perceived. Immediately on use of the study mat, the patient was found to have inflammation to the surgical incision (Figure 1). Clinical staff was alerted to the findings, and the patient was instructed to limit further walking and continue off-loading in his removable cast walker, per protocol. The inflammation of the operative foot quickly reduced, and the patient continued healing successfully, potentially avoiding incisional dehiscence and possible postoperative infection.
This case illustrates that patients’ wounds or surgical incisions may not be completely healed on epithelialization. In the immediate phase after closure, HCPs should consider additional protection to avoid complications. This case demonstrates that RTM can provide objective data to help guide care in that critical period.
Case 2: Identifying Preulcerative Lesions
An 88-year-old veteran had a chronic callus under the second metatarsal head. In addition to routine foot care and therapeutic shoes, he was followed with once-daily RTM. Inflammation was noted, and the veteran was seen in the podiatry clinic where debridement of the callus was performed. The difference in temperatures between feet detected by thermography prior to the clinic visits rapidly resolved after callus debridement, indicating that the underlying inflammation had subsided. RTM was used by the clinical staff to determine the appropriate time interval between clinic visits to avoid callus breakdown and subsequent ulceration.
Case 3: Extending the Clinic Into the Home
An 80-year-old veteran with T2DM and neuropathy was deemed a high-risk patient due to recurrent ulcerations to the left great toe. He was issued a RTM mat and was adherent with routine use. After nearly a year without hot-spot development, inflammation was noted (Figure 2).
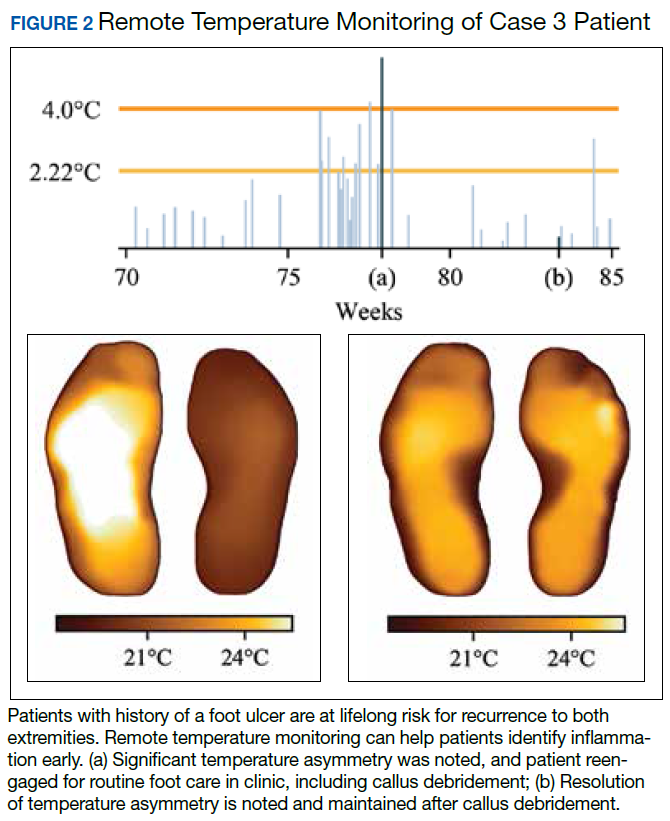
Unfortunately, the patient had missed several routine foot care visits and likely that was the reason for the noted inflammation. The patient was called and became reengaged in regular visits for routine foot care. On debridement of his callus, a superficial, noninfected ulceration was discovered. Had remote monitoring not detected the inflammation and impending ulceration, the patient likely would not have been seen in the regular clinic and may have developed a wound infection, potentially resulting in a worse and more costly outcome.
Paradigm Shift to Prevention
Given the exceedingly high burden of diabetic foot complications in the VA, a paradigm shift is needed among HCPs from a culture of treatment to one of prevention. Bus and colleagues reported that in Europe, for every euro spent on ulcer prevention, 10 are spent on ulcer healing, and for every randomized clinical trial conducted on prevention, 10 are conducted on treatment.42-44 Hicks and colleagues showed that the cost of curative care for DFUs is 5 to 30 times greater than the cost of preventive care.45 For RTM in high-risk cohorts (ie, PAVE level 3), the number-needed-to-treat for DFU prevention may be as low as 6, assuming that a 70% reduction in incidence is possible, consistent with previous research. In the year following a DFU, costs exceed $44,000.9 Thus, it seems natural that future direction in diabetic foot care should emphasize prevention strategies.
Foot ulcers that become infected often lead to hospitalization and result in an increased burden to an already overburdened VA health care system. Research suggests that about two-thirds of all diabetic foot costs are attributable to inpatient management.46 The impact of diabetic foot complications on hospital resource utilization is staggering. A 2017 study by Skrepnik analyzed the risk of hospitalization for various diseases.47 The investigators found that the inpatient admission odds ratio (OR) for congestive heart failure was 2.6, surpassed only by DFUs (OR, 3.4) and diabetic foot infection (OR, 6.7). A 2019 point-prevalence study found that > 10% of hospital admissions have a foot-related condition as the primary or secondary reason, and the majority of these are due to foot diseases, such as ulcers, infections, and Charcot neuroarthropathy.48
It is therefore incumbent on VA HCPs to avert wound recurrence in the interest of avoiding veteran hospitalizations and for administrators to encourage and incentivize best practices for managing the diabetic foot, with an emphasis on prevention therapies. In evaluating the financial impact of prevention with foot RTM, administrators should consider that the cost benefit is likely to be realized across the medical center, with budgets related to inpatient management likely to receive the largest returns.
Prevention has the potential to rein in costs as well as reduce strain on the hospital and clinic by preventing outcomes that require frequent visits for treatment or hospitalization. Wound treatment is very burdensome to the clinic; patients require frequent (in many cases, weekly) examinations, and chronic wounds often require hospitalization, necessitating rounding and additional coordination in care. Thus, preventing wounds or reducing their severity at presentation substantially reduces burden on the clinic, even after accounting for the modest clinical resources needed to administer preventative care. For example, a brief examination may be necessary if the inflammation detected by the study mat is secondary to a callus that must be debrided. However, if the patient was not seen until the callus had progressed to a wound, weekly follow-up and substantial clinical and budgetary resources may be required to heal the wound. Preventive care allows for substantially better patient outcomes, and the minimal time invested prevents the clinical burden of extensive wound treatment.
The success of preventive efforts relies on multidisciplinary management of this high-risk patient cohort. Often, it is the responsibility of the primary care provider to follow diabetic foot clinical reminders and appropriately refer to specialty care. Successful, open communication between PACT, PAVE, and the Podiatry Service has been shown to reduce poor outcomes, including lower extremity amputations. Traditionally, the model of preventive care has included podiatrist-driven interventions, including integrated routine foot care and comprehensive diabetic foot education. Collaboration between routine evaluation and prompt referral of at-risk patients for specialist foot care, therapeutic footwear recommendations, daily self-foot examinations, and in-home temperature monitoring are critically effective when performed consistently.
When trying to translate research science to effective clinical practice for preventing lower extremity complication, there are several important concepts. First, given the frequency of examination for patients being treated for a wound, provision of good preventive care, such as RTM, can reduce overall burden to resource-constrained clinics and improve access for patients needing to be seen. Additionally, preventive efforts extend clinical practice into the home and may reduce the need for in-clinic examinations and routine follow-up visits. Finally, there may be a sense of trust established between the clinician and patient with a positive record of adherence with preventive practices. This may translate into more productive communication and less frequent routine visits to better accommodate urgent visits and ensure podiatric care is accessible to veterans.
Conclusions
There is a significant opportunity to shift diabetic foot care from treatment to prevention, improving veteran outcomes and reducing resource utilization. RTM is an evidence-based and recommended but underused telemedicine solution that can catalyze this needed paradigm shift. The VA has been at the forefront of preventive foot care through the PAVE program and more recently through research and clinical application of RTM for veterans. However, as the data presented suggest, more can be done to improve veteran outcomes. More widespread adoption of evidence-based preventive technologies for the diabetic foot, such as RTM, has the potential to dramatically improve the quality of and access to care and reduce costs and burden on resource-constrained clinics.
1. Liu Y, Sayam S, Shao X, et al. Prevalence of and trends in diabetes among veterans, United States, 2005-2014. Prev Chronic Dis. 2017;14:E135.
2. Brennan MB, Hess TM, Bartle B, et al. Diabetic foot ulcer severity predicts mortality among veterans with type 2 diabetes. J Diabetes Complications. 2017;31(3):556-561.
3. Prompers L, Schaper N, Apelqvist J, et al. Prediction of outcome in individuals with diabetic foot ulcers: focus on the differences between individuals with and without peripheral arterial disease. The EURODIALE Study. Diabetologia. 2008;51(5):747-755.
4. Geerlings SE, Hoepelman AIM. Immune dysfunction in patients with diabetes mellitus (DM). FEMS Immunol Med Microbiol. 1999;26(3-4):259-265.
5. Prompers L, Huijberts M, Apelqvist J, et al. High prevalence of ischaemia, infection and serious comorbidity in patients with diabetic foot disease in Europe. Baseline results from the Eurodiale study. Diabetologia. 2007;50(1):18-25.
6. Glover JL, Weingarten MS, Buchbinder DS, Poucher RL, Deitrick GA 3rd, Fylling CP. A 4-year outcome-based retrospective study of wound healing and limb salvage in patients with chronic wounds. Adv Wound Care. 1997;10(1):33-38.
7. Franklin H, Rajan M, Tseng C-L, Pogach L, Sinha A. Cost of lower-limb amputation in U.S. veterans with diabetes using health services data in fiscal years 2004 and 2010. J Rehabil Res Dev. 2014;51(8):1325-1330.
8. Melcer T, Sechriest VF, Walker J, Galarneau M. A comparison of health outcomes for combat amputee and limb salvage patients injured in Iraq and Afghanistan wars. J Trauma Acute Care Surg. 2013;75(2)(suppl 2):S247-S254.
9. Chan B, Cadarette S, Wodchis W, Wong J, Mittmann N, Krahn M. Cost-of-illness studies in chronic ulcers: a systematic review. J Wound Care. 2017;26(suppl 4):S4-S14.
10. US Department of Veterans Affairs. VA/DoD clinical practice guideline for the management of type 2 diabetes mellitus in Primary Care. Version 5.0. https://www.healthquality.va.gov/guidelines/CD/diabetes/VADoDDMCPGFinal508.pdf. Published April 2017. Accessed January 31, 2020.
11. Morbach S, Furchert H, Gröblinghoff U, et al. Long-term prognosis of diabetic foot patients and their limbs: amputation and death over the course of a decade. Diabetes Care. 2012;35(10):2021-2027.
12. Apelqvist J, Larsson J, Agardh CD. Long-term prognosis for diabetic patients with foot ulcers. J Intern Med. 1993;233(6):485-491.
13. Pound N, Chipchase S, Treece K, Game F, Jeffcoate W. Ulcer-free survival following management of foot ulcers in diabetes. Diabet Med. 2005;22(10):1306-1309.
14. Dubský M, Jirkovská A, Bem R, et al. Risk factors for recurrence of diabetic foot ulcers: prospective follow-up analysis in the Eurodiale subgroup. Int Wound J. 2013;10(5):555-561.
15. Ulbrecht JS, Hurley T, Mauger DT, Cavanagh PR. Prevention of recurrent foot ulcers with plantar pressure-based in-shoe orthoses: the CareFUL prevention multicenter randomized controlled trial. Diabetes Care. 2014;37(7):1982-1989.
16. Waaijman R, de Haart M, Arts MLJ, et al. Risk factors for plantar foot ulcer recurrence in neuropathic diabetic patients. Diabetes Care. 2014;37(6):1697-1705.
17. US Department of Veterans Affairs, Veterans Health Administration. VHA Directive 1410: Prevention of Amputations in Veterans Everywhere (PAVE) Program. https://www.va.gov/vhapublications/ViewPublication.asp?pub_ID=5364. Published March 31, 2017. Accessed February 10, 2020.
18. Robbins JM, Wrobel JS, Kirsh S, Pogach L. Characteristics of high-functioning collaborations between primary care and podiatry in VHA patient aligned care teams. Fed Pract. 2016;33(8):32-36.
19. US Department of Veterans Affairs. Office of Inspector General. Healthcare inspection: foot care for patients with diabetes and additional risk factors for amputation. https://www.va.gov/oig/pubs/VAOIG-11-00711-74.pdf. Published January 17, 2013. Accessed February 3, 2020.
20. Kehle SM, Greer N, Rutks I, Wilt T. Interventions to improve veterans’ access to care: a systematic review of the literature. J Gen Intern Med. 2011;26(suppl 2):689-696.
21. Lavery LA, Higgins KR, Lanctot DR, et al. Home monitoring of foot skin temperatures to prevent ulceration. Diabetes Care. 2004;27(11):2642-2647.
22. Lavery LA, Higgins KR, Lanctot DR, et al. Preventing diabetic foot ulcer recurrence in high-risk patients: use of temperature monitoring as a self-assessment tool. Diabetes Care. 2007;30(1):14-20.
23. Armstrong DG, Holtz-Neiderer K, Wendel C, Mohler MJ, Kimbriel HR, Lavery LA. Skin temperature monitoring reduces the risk for diabetic foot ulceration in high-risk patients. Am J Med. 2007;120(12):1042-1046.
24. Bakker K, Apelqvist J, Lipsky BA, Van Netten JJ; International Working Group on the Diabetic Foot. The 2015 IWGDF guidance documents on prevention and management of foot problems in diabetes: development of an evidence-based global consensus. Diabetes Metab Res Rev. 2016;32 (suppl 1):2-6.
25. Frykberg RG, Zgonis T, Armstrong DG, et al; American College of Foot Ankle Surgeons. Diabetic foot disorders: a clinical practice guideline (2006 revision). J Foot Ankle Surg. 2006;45(suppl 5):S1-S66.
26. Lavery LA, Davis KE, Berriman SJ, et al. WHS guidelines update: diabetic foot ulcer treatment guidelines. Wound Repair Regen. 2016;24(1):112-126.
27. US Department of Veterans Affairs, VA National Prosthetics and Sensory Aids Service and National Podiatry Program Office. Podimetrics – TMD temperature monitoring devices. [Source not verified.]
28. Arad Y, Fonseca V, Peters A, Vinik A. Beyond the monofilament for the insensate diabetic foot: a systematic review of randomized trials to prevent the occurrence of plantar foot ulcers in patients with diabetes. Diabetes Care. 2011;34(4):1041-1046.
29. Dy SM, Bennett WL, Sharma R, et al. Preventing Complications and Treating Symptoms of Diabetic Peripheral Neuropathy. Rockville, MD: Agency for Healthcare Research and Quality US; 2017.
30. Frykberg RG, Gordon IL, Reyzelman AM, et al. Feasibility and efficacy of a SmartMat technology to predict development of diabetic plantar ulcers. Diabetes Care. 2017;40(7):973-980.
31. Crisologo PA, Lavery LA. Remote home monitoring to identify and prevent diabetic foot ulceration. Ann Transl Med. 2017;5(21):430.
32. Armstrong DG, Abu-Rumman PL, Nixon BP, Boulton AJ. Continuous activity monitoring in persons at high risk for diabetes-related lower-extremity amputation. J Am Podiatr Med Assoc. 2001;91(9):451-455.
33. Gordon IL, Rothenberg GM, Lepow BD, et al. Accuracy of a foot temperature monitoring mat for predicting diabetic foot ulcers in patients with recent wounds or partial foot amputation. Diabetes Res Clin Pract. 2020. [Online ahead of print.]
34. Lavery LA, Petersen BJ, Linders DR, Bloom JD, Rothenberg GM, Armstrong DG. Unilateral remote temperature monitoring to predict future ulceration for the diabetic foot in remission. BMJ Open Diabetes Res Care. 2019;7(1):e000696.
35. Petersen BJ, Rothenberg GM, Lakhani PJ, et al. Ulcer metastasis? Anatomical locations of recurrence for patients in diabetic foot remission. J Foot Ankle Res. 2020;13:1.
36. Killeen AL, Brock KM, Dancho JF, Walters JL. Remote temperature monitoring in patients with visual impairment due to diabetes mellitus, a proposed improvement to curren standard of care for prevention of diabetic foot ulcers. J Diabetes Sci Technol. 2020;14(1):37-45.
37. Murff RT, Armstrong DG, Lanctot D, Lavery LA, Athanasiou KA. How effective is manual palpation in detecting subtle temperature differences? Clin Podiatr Med Surg. 1998;15(1):151-154.
38. Armstrong DG, Boulton AJM, Bus SA. Diabetic foot ulcers and their recurrence. N Engl J Med. 2017;376(24):2367-2375.
39. Natovich R, Kushnir T, Harman-Boehm I, et al. Cognitive dysfunction: part and parcel of the diabetic foot. Diabetes Care. 2016;39(7):1202-1207.
40. Zhong A, Li G, Wang D, Sun Y, Zou X, Li B. The risks and external effects of diabetic foot ulcer on diabetic patients: a hospital-based survey in Wuhan area, China. Wound Repair Regen. 2017;25(5):858-863.
41. Vileikyte L. Diabetic foot ulcers: a quality of life issue. Diabetes Metab Res Rev. 2001;17(4):246-249.
42. Van Acker K, Oleen-Burkey M, De Decker L, et al. Cost and resource utilization for prevention and treatment of foot lesions in a diabetic foot clinic in Belgium. Diabetes Res Clin Pract. 2000;50(2):87-95.
43. Kerr M, Rayman G, Jeffcoate WJ. Cost of diabetic foot disease to the National Health Service in England. Diabetes Med. 2014;31(12):1498-1504.
44. Bus SA, van Netten JJ. A shift in priority in diabetic foot care and research: 75% of foot ulcers are preventable. Diabetes Metab Res Rev. 2016;32(suppl 1):195-200.
45. Hicks CW, Selvarajah S, Mathioudakis N, et al. Burden of infected diabetic foot ulcers on hospital admissions and costs. Ann Vasc Surg. 2016;33:149-158.
46. Rice JB, Desai U, Cummings AKG, Birnbaum HG, Skornicki M, Parsons NB. Burden of diabetic foot ulcers for Medicare and private insurers. Diabetes Care. 2014;37(3):651-658.
47. Skrepnek GH, Mills JL Sr, Lavery LA, Armstrong DG. Health care service and outcomes among an estimated 6.7 million ambulatory care diabetic foot cases in the U.S. Diabetes Care. 2017;40(7):936-942.
48. Lazzarini PA, Hurn SE, Kuys SS, et al. Direct inpatient burden caused by foot-related conditions: a multisite point-prevalence study. BMJ Open. 2016;6(6):e010811.
Diabetic foot ulcers (DFUs) are devastating, common, and costly. This burden is borne disproportionately by veterans who have high prevalence of type 2 diabetes mellitus (T2DM) and other precipitating risk factors.1 The mortality of veterans following a DFU is sobering, and ulceration is recognized as a significant marker of disease severity.
A 2017 study by Brennan and colleagues reported a 19% mortality rate within 1 year, and only 29% survive past 5 years.2 DFUs are often complicated by peripheral arterial disease (PAD) and diabetic immune dysfunction, contributing to chronic wounds and infection.3,4 About 60% of all foot ulcers become infected, and > 20% of patients with a diabetic foot infection require amputation.5,6
A 2010 retrospective study reports that > 3,400 veterans have a diabetes-related lower extremity amputation annually, vastly surpassing the rate of amputation secondary to trauma in the Veterans Health Administration (VHA).7,8 The inpatient costs for each amputation exceeded $60,000 in fiscal year 2010, and these amputation-related costs represent only 1 component of the total expense to the VHA attributable to diabetic foot complications.7 A recent systematic review by Chan and colleagues estimated mean annual costs in the year following a foot ulcer to be $44,200 to the public payer.9 This implies that direct expenditures for treatment of DFUs within the VHA exceeds $3 billion annually.
Diabetic Foot Ulcer Prevention
Given the dramatic impact of diabetic foot complications to the veteran and the US health care system, the VHA has long recognized the importance of preventive care for those at risk. In 2017 US Department of Veterans Affairs (VA) and Department of Defense issued a clinical practice guideline for the management of T2DM that recommended prophylactic foot care for early identification of any deformity or skin breakdown.10 The guidelines note that a “person who has had a foot ulcer is at lifelong risk of further ulceration,” reflecting the high rate of recurrence among all patients, including veterans. Multiple studies suggest that as many as 40% of patients experience recidivism in the first year after healing from a wound.11-16
The VA is well equipped to deliver quality preventive care because of its innovative and long-standing PAVE (Prevention of Amputations for Veterans Everywhere) program.17 PAVE provides screening, education, appropriate footwear, and stratified care guidelines for veterans at risk for diabetes-related foot complications (Table 1). The practices encouraged by PAVE are evidence-based and synergistic with the objectives of the VA’s patient aligned care team (PACT) delivery approach.18 The granular data collected through PAVE are used to guide best practices and provide benchmarks for diabetic foot outcomes.
Unfortunately, despite PAVE guidelines requiring annual specialist foot care for at-risk veterans, a 2013 report by the VA Office of the Inspector General (OIG) found that one-third of all patients had no documentation of this minimal requirement of preventive foot care.19 Although the VA has worked to address this issue, the data hint at the missed opportunities for prevention of complications and the challenges of ensuring that a large at-risk veteran population has systematic and routine screening with access to specialist foot care.
Given the large proportion of veterans at high risk of chronic wound formation and the challenges of ensuring that this cohort receives good preventive foot care, expanding telemedicine has been suggested. Telemedicine solutions have the potential to reduce the impact of chronic wounds on overburdened clinic resources, schedules, and local and federal budgets.20 Interestingly, the only preventive practice for the diabetic foot that has been proven effective through multiple randomized controlled trials and national and international clinical guidance documents is once-daily foot temperature monitoring.21-26 Daily monitoring has the potential to reduce the burden of DFUs to veterans, improve veteran access to needed preventive care, and reduce costs incurred by the VHA treating diabetic foot complications. Yet despite a recent national guidance document detailing its appropriate use in PAVE 3 veterans, it remains underutilized.27
The purpose of this review is to: (1) discuss the evidence supporting once-daily remote temperature monitoring (RTM), a telemedicine approach critical to improving both veteran access to care and diabetic foot outcomes; (2) summarize a 2017 study that presented an advanced clinical understanding of RTM use among veterans; (3) provide previously unpublished data from this study comparing high-risk VA and non-VA cohorts, highlighting the opportunity for additional focus on foot ulcer prevention within the VA; and (4) report on recent VA utilization of a RTM technology based on this research, emphasizing lessons learned and best practices.
Remote Temperature Monitoring
The objective of daily foot temperature monitoring is to identify impending inflammatory foot conditions, such as DFUs, infection, and acute Charcot neuroarthropathy episodes. The patient and care team then act to resolve the cause of detected inflammation before clinical presentation (prevention) and begin treatment earlier than would otherwise be possible to avoid expensive complications, such as infection (early detection). Preventive therapies are low risk to the patient and inexpensive.
RTM is recommended by multiple clinical practice guidelines, including those of the International Working Group on the Diabetic Foot, the American College of Foot and Ankle Surgeons, and the Wound Healing Society.24-26 Its use is supported by evidence from 3 National Institutes of Health-funded and well-designed randomized controlled trials, 1 of which was additionally supported by a VA Health Services Research and Development Service Merit Award.21-23,28 Conducted between 2004 and 2007, these studies demonstrated the potential to reduce foot ulcer incidence by as much as 85% using a dermal thermometer to identify inflammation and prompt decreased ambulation. Investigators established a clinical monitoring protocol comparing the temperatures between 6 matched locations on the left and right feet. Persistent differences in contralateral temperatures exceeding 2.2°C (4.0°F) were used as a marker for elevated risk and to initiate preventive care. Based on the encouraging results from these studies, a 2017 effectiveness review prepared for the Agency for Healthcare Research and Quality concluded that “home monitoring of foot skin temperature is effective for reducing foot ulcer incidence and recurrence.”29
Accuracy of RTM
A 2017 longitudinal study (NCT02647346) has provided novel data to advance understanding of RTM for the prediction and prevention of DFUs.30 This study was the first to systematically analyze the accuracy of RTM over different monitoring thresholds. The results enable practitioners to deliver risk-stratified preventive care. Policy makers can use the data from this study to weigh the cost and benefits of RTM for population health.
The multicenter trials had 129 participants from 4 VA health care systems: VA Long Beach Healthcare System in California, Miami VA Healthcare System in Florida, Phoenix VA Healthcare System in Arizona, and VA West Los Angeles Healthcare System in California. Each participant was followed for 34 weeks under standard preventive foot care and was instructed to step on a telemedicine SmartMat (Podimetrics, Inc) RTM mat for 20 seconds daily. Participants and investigators were blinded to the temperature data so that the accuracy of temperature monitoring could be assessed. All participants had a history of T2DM and healed DFU. Principal exclusion criteria included unhealed plantar wound, history of proximal lower extremity amputation (ie, above ankle), active Charcot foot disease, and comorbidities that could potentially inhibit an inflammatory response, such as end-stage renal disease, active malignancy, and immunosuppressive diseases.
The investigators reported that RTM with the study mat detected 97% of nonacute plantar DFUs using the most commonly studied threshold (sustained 2.2°C temperature difference). The lead time averaged 37 days before clinical identification of the wound under standard care. Although the false-positive rate of 57% was high, corresponding to approximately 3.0 notifications per patient per year on average in the research setting, it is important to note that this study only considered the prediction of plantar DFUs. Thus, detection of foot inflammation secondary to other conditions, such as preulcerative lesion, dorsal wound, Charcot neuroarthropathy, or foot infection, were reported as a false positive per the study’s definitions. Further, Crisologo and Lavery noted in a translational medicine summary of this research, because the intervention is noninvasive and minimally impactful to the patient and the health care system, “the potential to arrest re-ulceration is worth the perceived inconvenience to the patient.”31
Secondary outcomes related to adherence and ease of use were encouraging. Eighty-eight percent of participants reported that the mat was “very easy to use,” the highest possible score, and 98% were able to set up the mat for home use without difficulty. At the end of the 34-week study, more than 74% of participants remained engaged in routine use of the mat under a per-protocol assessment of adherence. These results are especially impressive given the documented poor adherence of at-risk patients to routine use of therapeutic footwear, which has been reported to be as low as 15%.32
New Research
The data collected during this study has led to new research and advancements in RTM. A recent publication by Gordon and colleagues investigated whether RTM is less accurate in cohorts with perceived challenges.33 They include patients with recently healed wounds and those with a history of partial foot amputation. There was no difference in the accuracy or lead time for either cohort relative to the entire cohort, suggesting that RTM is appropriate for monitoring patients with recently healed DFUs or partial foot amputations.
In another recent study, the data were used to derive a novel approach to monitor a single at-risk foot.34 The practice of RTM has traditionally required comparing temperatures between contralaterally matched plantar locations on the feet, thus limiting its use in patients with a history of major lower extremity amputation and patients being treated for a wound, which may be bandaged or in an off-loading cast or boot. Because the risk factors for DFUs exist in both limbs, these patients are at high risk for developing complications to the contralateral foot and may benefit from preventive once-daily foot temperature monitoring. The investigators empirically derived a novel monitoring approach for patients without a contralateral control. This approach was found to predict 91% of impending plantar DFUs on average 41 days before clinical presentation with a false positive rate of 54%.
Additional Focus on Prevention
Table 2 shows previously unpublished data from a subgroup analysis between veteran and nonveteran participants in the study.25 These descriptive statistics reinforce some widely held assumptions regarding the high-risk veteran population and challenge others. For example, compared with the nonveteran participants, the veteran cohort unsurprisingly had a larger ratio of male participants (P < .01), had a higher rate of cigarette use (P < .01), and was more likely to live alone (although not at a statistically significant level). Veterans in the study had body mass index, rates of alcohol use, frequency of exercise, and glucose control comparable to that of nonveterans.
The potential impact of the PAVE program is clear in several of these comparisons. Although as few as 15% of patients use therapeutic shoes routinely, PAVE ensures that the majority of veterans receive them. Nearly 95% of veterans have therapeutic shoes compared with about 80% of nonveteran participants (P < .05). Veterans also had higher ankle-brachial index results (P < .05), although on average both cohorts were within normal clinical parameters. Veterans had a significantly longer duration since healing from the most recent wound, and fewer veteran participants had a wound that healed in the 3 months prior to the study. Despite this, during the study veterans had annualized DFU incidence equal to that of nonveterans. Furthermore, veterans also had significantly higher rates of amputation prior to participation. That these critical outcomes for veterans are no better than those observed in other care environments despite PAVE suggests that approaches recommended via PAVE alone are insufficient to significantly arrest DFU recurrence, and even more focus on prevention in the VA may be warranted.
From Research to Practice
Since the publication of the 2017 study, the VHA has been at the vanguard of translating the evidence and research underlying RTM into clinical practice. A clinical guidance document governing appropriate use of RTM with the study mat was recently published by the VA Prosthetic and Sensory Aids Service in collaboration with the National Podiatry Program office.27 This guidance document recommends once-daily RTM for at-risk veterans designated PAVE level 3. It defines roles and responsibilities required for the successful implementation of a RTM program with the study device. The document additionally presents various clinical monitoring protocols for veterans, although the protocol and thresholds used are at the discretion of the prescribing clinician and should reflect the risk profile of the veteran in question.
A staged response to inflammation has proven popular, whereby an initial high-sensitivity threshold is chosen for monitoring. The initial response is telephone outreach by a designee supplied by the clinic or device manufacturer, typically a trained registered nurse, to the veteran to collect subjective history and instruct off-loading and reduced ambulation, with a target of 50% baseline reduction in step count. Should the inflammation persist despite off-loading, an examination may be necessary to identify and resolve its cause. For recalcitrant inflammation, more targeted pressure off-loading of the affected area may be accomplished with custom orthotics, accommodative insoles, removable cast walkers, and total contact casting. After 2 to 4 weeks without signs of inflammation, the cause is deemed to have been resolved and lowered the acute risk for developing further diabetic foot complications.
More than 600 veterans have been monitored for > 1,000 patient-years—13 VA medical centers are practicing RTM with the study mat as of this writing. The monitoring program has been integrated into many veteran daily routines as evidenced by > 70% retaining full engagement after having been monitored for > 1 year. The total number of alerts/patient-years across these veterans has been 1.4, significantly lower than the 3.0 alerts/patient-year observed in the study. This is potentially due to successful interventions in response to detected inflammation, resolving inflammation, and avoiding unnecessary alerts occurring in the research setting, which did not employ interventions that resolved inflammation episodes. In the past 6 months, 68% of all inflammation detected resolved via off-loading alone without requiring further clinical intervention. In the cases that required an examination, 76% of patients reported clinically meaningful preventive care (eg, preulcerative callus was debrided, a subungual hemorrhage was treated, a foot ulcer was identified).
Organizational Best Practices
Several best practices have been cultivated related to initiating a RTM program at a new site, for promoting the success of a RTM program, and provisioning excellent preventive care to support the RTM program. Although we advise adhering to the recommendations in the VA guidance document,27 the authors have observed several additional organizational best practices that are not explicitly addressed.
Partnering with PACT. Collaboration between PAVE and PACT has the potential not only to improve outcomes for patients at risk for diabetic foot complications, but also can help identify appropriate high-risk veteran candidates for preventive care with RTM who may not be followed for routine care from a specialty provider, such as a podiatrist, as highlighted by the 2013 OIG report.
Prescreening eligible patients. Several programs have used PAVE data or appointment schedules to identify and target high-risk veterans proactively. This approach has several benefits. It simplifies clinical coordination and streamlines workflow for patient identification and onboarding. It also allows those veterans at highest risk to receive needed and recommended preventive care at their next scheduled appointment. Finally, if PAVE data are used to identify eligible patients, it has the added benefit of ensuring a baseline level of telemedicine preventive foot care for veterans who have become lost to follow-up and have not been seen recently for a routine foot examination.
Implementing foot monitoring during wound treatment. Recent research has expanded the reach of once-daily RTM with the mat to patients being treated for a wound to only 1 foot. This practice has 2 benefits: The patient is able to establish a preventive routine before healing, an important advantage because research strongly suggests that recurrence is most likely in the first months after healing. Second, 48% of patients with a history of DFUs will develop new wounds to the contralateral foot because risk factors, such as neuropathy and peripheral arterial disease, exist in both limbs.35 Furthermore, ongoing treatment for a wound to 1 foot may result in gait deviation and elevated pressure to the sound foot, additionally predisposing the veteran to complications, resulting in a high rate of wounds occurring to the unwounded foot during treatment (0.2 DFU/DFU-year).34 Thus, there is potential benefit in monitoring the sound foot while undergoing treatment for a wound; further, the patient will have immediate access to the device for prevention of recurrence once the wound has resolved.
Utilizing foot monitoring as an extension of telemedicine. Many VA facilities have large geographic catchment areas, making routine follow-up difficult for veterans living in rural areas. RTM serves as an extension of the patient’s daily self-examination and the clinician’s ability to monitor patients with objective information daily. The veterans using the system become more invested and feel as though they are taking an active role in their health care.
Investing in ongoing medical education. Multidisciplinary education sessions reviewing supporting clinical data and resultant clinical practice guidelines raise awareness for those providers and trainees unaware of preventive best practices for the diabetic foot, including those related to foot RTM. These sessions also are helpful for those familiar with foot temperature monitoring or who are responsible for administration of an ongoing program to remain current with contemporary best practices and to discuss improvements for patient care. Familiarity also can help address clinical inertia when benefits and evidence are clearly communicated with health care providers (HCPs).
Clinical Best Practices
Treating preulcerative lesions urgently and aggressively. Callus and other preulcerative lesions often cause progressive tissue damage and poor outcomes. When identified, these lesions should be promptly treated to ensure best outcomes.24
Recognizing the limits of patient self-examinations. Comorbidities such as visual impairment and reduced joint mobility often preclude patients from completing rigorous self-examinations of the foot, which is especially critical while collecting subjective history from the patient during triage of inflammation. A caregiver or spouse can help inspect the foot during outreach and provide additional context.36
Interpreting a benign foot on examination. Because RTM has been demonstrated to detect inflammation preceding a foot ulcer as many as 5 weeks before presentation to the clinic, some veterans may have few signs or symptoms of acute risk during examination. Often, the damage is to subcutaneous tissue resulting from repetitive microtrauma. Research suggests that clinical examination in these cases is often unreliable for identifying the earliest signs of risk, such as palpation to identify subtle temperature changes secondary to inflammation.37 If a patient has refractory inflammation requiring examination and presents with an otherwise unremarkable foot, it is an opportunity to evaluate whether the patient’s shoewear remains appropriate or has worn out, to communicate the veteran’s ongoing elevated risk, and to educate on the importance of diligence in daily foot self-examinations, daily use of the foot temperature monitoring, and continued off-loading until the inflammation resolves.
Communicating the distinction between healing and remission. Although healing is the goal of wound care, patients should be educated that the underlying disease remains after epithelialization. In some cases, tissue deep to the skin has not completed remodeling, and the patient is at acute risk of recurrence. Remission is a powerful metaphor that better describes the patient’s ongoing risk to encourage continued healthy routines and diligent self-care.38Considering the entirety of both feet for recurrence. Critical risk factors for diabetic foot complications, such as peripheral neuropathy and PAD, exist in both limbs, and patients with a history of wounds often develop new complications to different ipsilateral locations, or in as many as 48% of cases, to the contralateral foot.35 For best outcomes, detected inflammation should be treated aggressively independent of whether the location coincides with an area of previous concern.
Encouraging adherence, routine, and empowerment. Advanced diabetes mellitus and neuropathy may impact a patient’s executive function, and multiple studies have reported that patients at risk for inflammatory foot diseases exhibit fatalism toward their foot care and outcomes.39-41 Consistent education, encouragement, empowerment, and establishment of positive routines are needed to ensure high adherence with all preventive care regimens, including RTM.
Case Presentations
The following case series illustrates many of these clinical best practices and characterizes the potential benefits of RTM to veterans within the VA.
Case 1: Prevention After Healing
A veteran underwent a Chopart amputation and was recommended to use the mat after healing was perceived. Immediately on use of the study mat, the patient was found to have inflammation to the surgical incision (Figure 1). Clinical staff was alerted to the findings, and the patient was instructed to limit further walking and continue off-loading in his removable cast walker, per protocol. The inflammation of the operative foot quickly reduced, and the patient continued healing successfully, potentially avoiding incisional dehiscence and possible postoperative infection.
This case illustrates that patients’ wounds or surgical incisions may not be completely healed on epithelialization. In the immediate phase after closure, HCPs should consider additional protection to avoid complications. This case demonstrates that RTM can provide objective data to help guide care in that critical period.
Case 2: Identifying Preulcerative Lesions
An 88-year-old veteran had a chronic callus under the second metatarsal head. In addition to routine foot care and therapeutic shoes, he was followed with once-daily RTM. Inflammation was noted, and the veteran was seen in the podiatry clinic where debridement of the callus was performed. The difference in temperatures between feet detected by thermography prior to the clinic visits rapidly resolved after callus debridement, indicating that the underlying inflammation had subsided. RTM was used by the clinical staff to determine the appropriate time interval between clinic visits to avoid callus breakdown and subsequent ulceration.
Case 3: Extending the Clinic Into the Home
An 80-year-old veteran with T2DM and neuropathy was deemed a high-risk patient due to recurrent ulcerations to the left great toe. He was issued a RTM mat and was adherent with routine use. After nearly a year without hot-spot development, inflammation was noted (Figure 2).
Unfortunately, the patient had missed several routine foot care visits and likely that was the reason for the noted inflammation. The patient was called and became reengaged in regular visits for routine foot care. On debridement of his callus, a superficial, noninfected ulceration was discovered. Had remote monitoring not detected the inflammation and impending ulceration, the patient likely would not have been seen in the regular clinic and may have developed a wound infection, potentially resulting in a worse and more costly outcome.
Paradigm Shift to Prevention
Given the exceedingly high burden of diabetic foot complications in the VA, a paradigm shift is needed among HCPs from a culture of treatment to one of prevention. Bus and colleagues reported that in Europe, for every euro spent on ulcer prevention, 10 are spent on ulcer healing, and for every randomized clinical trial conducted on prevention, 10 are conducted on treatment.42-44 Hicks and colleagues showed that the cost of curative care for DFUs is 5 to 30 times greater than the cost of preventive care.45 For RTM in high-risk cohorts (ie, PAVE level 3), the number-needed-to-treat for DFU prevention may be as low as 6, assuming that a 70% reduction in incidence is possible, consistent with previous research. In the year following a DFU, costs exceed $44,000.9 Thus, it seems natural that future direction in diabetic foot care should emphasize prevention strategies.
Foot ulcers that become infected often lead to hospitalization and result in an increased burden to an already overburdened VA health care system. Research suggests that about two-thirds of all diabetic foot costs are attributable to inpatient management.46 The impact of diabetic foot complications on hospital resource utilization is staggering. A 2017 study by Skrepnik analyzed the risk of hospitalization for various diseases.47 The investigators found that the inpatient admission odds ratio (OR) for congestive heart failure was 2.6, surpassed only by DFUs (OR, 3.4) and diabetic foot infection (OR, 6.7). A 2019 point-prevalence study found that > 10% of hospital admissions have a foot-related condition as the primary or secondary reason, and the majority of these are due to foot diseases, such as ulcers, infections, and Charcot neuroarthropathy.48
It is therefore incumbent on VA HCPs to avert wound recurrence in the interest of avoiding veteran hospitalizations and for administrators to encourage and incentivize best practices for managing the diabetic foot, with an emphasis on prevention therapies. In evaluating the financial impact of prevention with foot RTM, administrators should consider that the cost benefit is likely to be realized across the medical center, with budgets related to inpatient management likely to receive the largest returns.
Prevention has the potential to rein in costs as well as reduce strain on the hospital and clinic by preventing outcomes that require frequent visits for treatment or hospitalization. Wound treatment is very burdensome to the clinic; patients require frequent (in many cases, weekly) examinations, and chronic wounds often require hospitalization, necessitating rounding and additional coordination in care. Thus, preventing wounds or reducing their severity at presentation substantially reduces burden on the clinic, even after accounting for the modest clinical resources needed to administer preventative care. For example, a brief examination may be necessary if the inflammation detected by the study mat is secondary to a callus that must be debrided. However, if the patient was not seen until the callus had progressed to a wound, weekly follow-up and substantial clinical and budgetary resources may be required to heal the wound. Preventive care allows for substantially better patient outcomes, and the minimal time invested prevents the clinical burden of extensive wound treatment.
The success of preventive efforts relies on multidisciplinary management of this high-risk patient cohort. Often, it is the responsibility of the primary care provider to follow diabetic foot clinical reminders and appropriately refer to specialty care. Successful, open communication between PACT, PAVE, and the Podiatry Service has been shown to reduce poor outcomes, including lower extremity amputations. Traditionally, the model of preventive care has included podiatrist-driven interventions, including integrated routine foot care and comprehensive diabetic foot education. Collaboration between routine evaluation and prompt referral of at-risk patients for specialist foot care, therapeutic footwear recommendations, daily self-foot examinations, and in-home temperature monitoring are critically effective when performed consistently.
When trying to translate research science to effective clinical practice for preventing lower extremity complication, there are several important concepts. First, given the frequency of examination for patients being treated for a wound, provision of good preventive care, such as RTM, can reduce overall burden to resource-constrained clinics and improve access for patients needing to be seen. Additionally, preventive efforts extend clinical practice into the home and may reduce the need for in-clinic examinations and routine follow-up visits. Finally, there may be a sense of trust established between the clinician and patient with a positive record of adherence with preventive practices. This may translate into more productive communication and less frequent routine visits to better accommodate urgent visits and ensure podiatric care is accessible to veterans.
Conclusions
There is a significant opportunity to shift diabetic foot care from treatment to prevention, improving veteran outcomes and reducing resource utilization. RTM is an evidence-based and recommended but underused telemedicine solution that can catalyze this needed paradigm shift. The VA has been at the forefront of preventive foot care through the PAVE program and more recently through research and clinical application of RTM for veterans. However, as the data presented suggest, more can be done to improve veteran outcomes. More widespread adoption of evidence-based preventive technologies for the diabetic foot, such as RTM, has the potential to dramatically improve the quality of and access to care and reduce costs and burden on resource-constrained clinics.
1. Liu Y, Sayam S, Shao X, et al. Prevalence of and trends in diabetes among veterans, United States, 2005-2014. Prev Chronic Dis. 2017;14:E135.
2. Brennan MB, Hess TM, Bartle B, et al. Diabetic foot ulcer severity predicts mortality among veterans with type 2 diabetes. J Diabetes Complications. 2017;31(3):556-561.
3. Prompers L, Schaper N, Apelqvist J, et al. Prediction of outcome in individuals with diabetic foot ulcers: focus on the differences between individuals with and without peripheral arterial disease. The EURODIALE Study. Diabetologia. 2008;51(5):747-755.
4. Geerlings SE, Hoepelman AIM. Immune dysfunction in patients with diabetes mellitus (DM). FEMS Immunol Med Microbiol. 1999;26(3-4):259-265.
5. Prompers L, Huijberts M, Apelqvist J, et al. High prevalence of ischaemia, infection and serious comorbidity in patients with diabetic foot disease in Europe. Baseline results from the Eurodiale study. Diabetologia. 2007;50(1):18-25.
6. Glover JL, Weingarten MS, Buchbinder DS, Poucher RL, Deitrick GA 3rd, Fylling CP. A 4-year outcome-based retrospective study of wound healing and limb salvage in patients with chronic wounds. Adv Wound Care. 1997;10(1):33-38.
7. Franklin H, Rajan M, Tseng C-L, Pogach L, Sinha A. Cost of lower-limb amputation in U.S. veterans with diabetes using health services data in fiscal years 2004 and 2010. J Rehabil Res Dev. 2014;51(8):1325-1330.
8. Melcer T, Sechriest VF, Walker J, Galarneau M. A comparison of health outcomes for combat amputee and limb salvage patients injured in Iraq and Afghanistan wars. J Trauma Acute Care Surg. 2013;75(2)(suppl 2):S247-S254.
9. Chan B, Cadarette S, Wodchis W, Wong J, Mittmann N, Krahn M. Cost-of-illness studies in chronic ulcers: a systematic review. J Wound Care. 2017;26(suppl 4):S4-S14.
10. US Department of Veterans Affairs. VA/DoD clinical practice guideline for the management of type 2 diabetes mellitus in Primary Care. Version 5.0. https://www.healthquality.va.gov/guidelines/CD/diabetes/VADoDDMCPGFinal508.pdf. Published April 2017. Accessed January 31, 2020.
11. Morbach S, Furchert H, Gröblinghoff U, et al. Long-term prognosis of diabetic foot patients and their limbs: amputation and death over the course of a decade. Diabetes Care. 2012;35(10):2021-2027.
12. Apelqvist J, Larsson J, Agardh CD. Long-term prognosis for diabetic patients with foot ulcers. J Intern Med. 1993;233(6):485-491.
13. Pound N, Chipchase S, Treece K, Game F, Jeffcoate W. Ulcer-free survival following management of foot ulcers in diabetes. Diabet Med. 2005;22(10):1306-1309.
14. Dubský M, Jirkovská A, Bem R, et al. Risk factors for recurrence of diabetic foot ulcers: prospective follow-up analysis in the Eurodiale subgroup. Int Wound J. 2013;10(5):555-561.
15. Ulbrecht JS, Hurley T, Mauger DT, Cavanagh PR. Prevention of recurrent foot ulcers with plantar pressure-based in-shoe orthoses: the CareFUL prevention multicenter randomized controlled trial. Diabetes Care. 2014;37(7):1982-1989.
16. Waaijman R, de Haart M, Arts MLJ, et al. Risk factors for plantar foot ulcer recurrence in neuropathic diabetic patients. Diabetes Care. 2014;37(6):1697-1705.
17. US Department of Veterans Affairs, Veterans Health Administration. VHA Directive 1410: Prevention of Amputations in Veterans Everywhere (PAVE) Program. https://www.va.gov/vhapublications/ViewPublication.asp?pub_ID=5364. Published March 31, 2017. Accessed February 10, 2020.
18. Robbins JM, Wrobel JS, Kirsh S, Pogach L. Characteristics of high-functioning collaborations between primary care and podiatry in VHA patient aligned care teams. Fed Pract. 2016;33(8):32-36.
19. US Department of Veterans Affairs. Office of Inspector General. Healthcare inspection: foot care for patients with diabetes and additional risk factors for amputation. https://www.va.gov/oig/pubs/VAOIG-11-00711-74.pdf. Published January 17, 2013. Accessed February 3, 2020.
20. Kehle SM, Greer N, Rutks I, Wilt T. Interventions to improve veterans’ access to care: a systematic review of the literature. J Gen Intern Med. 2011;26(suppl 2):689-696.
21. Lavery LA, Higgins KR, Lanctot DR, et al. Home monitoring of foot skin temperatures to prevent ulceration. Diabetes Care. 2004;27(11):2642-2647.
22. Lavery LA, Higgins KR, Lanctot DR, et al. Preventing diabetic foot ulcer recurrence in high-risk patients: use of temperature monitoring as a self-assessment tool. Diabetes Care. 2007;30(1):14-20.
23. Armstrong DG, Holtz-Neiderer K, Wendel C, Mohler MJ, Kimbriel HR, Lavery LA. Skin temperature monitoring reduces the risk for diabetic foot ulceration in high-risk patients. Am J Med. 2007;120(12):1042-1046.
24. Bakker K, Apelqvist J, Lipsky BA, Van Netten JJ; International Working Group on the Diabetic Foot. The 2015 IWGDF guidance documents on prevention and management of foot problems in diabetes: development of an evidence-based global consensus. Diabetes Metab Res Rev. 2016;32 (suppl 1):2-6.
25. Frykberg RG, Zgonis T, Armstrong DG, et al; American College of Foot Ankle Surgeons. Diabetic foot disorders: a clinical practice guideline (2006 revision). J Foot Ankle Surg. 2006;45(suppl 5):S1-S66.
26. Lavery LA, Davis KE, Berriman SJ, et al. WHS guidelines update: diabetic foot ulcer treatment guidelines. Wound Repair Regen. 2016;24(1):112-126.
27. US Department of Veterans Affairs, VA National Prosthetics and Sensory Aids Service and National Podiatry Program Office. Podimetrics – TMD temperature monitoring devices. [Source not verified.]
28. Arad Y, Fonseca V, Peters A, Vinik A. Beyond the monofilament for the insensate diabetic foot: a systematic review of randomized trials to prevent the occurrence of plantar foot ulcers in patients with diabetes. Diabetes Care. 2011;34(4):1041-1046.
29. Dy SM, Bennett WL, Sharma R, et al. Preventing Complications and Treating Symptoms of Diabetic Peripheral Neuropathy. Rockville, MD: Agency for Healthcare Research and Quality US; 2017.
30. Frykberg RG, Gordon IL, Reyzelman AM, et al. Feasibility and efficacy of a SmartMat technology to predict development of diabetic plantar ulcers. Diabetes Care. 2017;40(7):973-980.
31. Crisologo PA, Lavery LA. Remote home monitoring to identify and prevent diabetic foot ulceration. Ann Transl Med. 2017;5(21):430.
32. Armstrong DG, Abu-Rumman PL, Nixon BP, Boulton AJ. Continuous activity monitoring in persons at high risk for diabetes-related lower-extremity amputation. J Am Podiatr Med Assoc. 2001;91(9):451-455.
33. Gordon IL, Rothenberg GM, Lepow BD, et al. Accuracy of a foot temperature monitoring mat for predicting diabetic foot ulcers in patients with recent wounds or partial foot amputation. Diabetes Res Clin Pract. 2020. [Online ahead of print.]
34. Lavery LA, Petersen BJ, Linders DR, Bloom JD, Rothenberg GM, Armstrong DG. Unilateral remote temperature monitoring to predict future ulceration for the diabetic foot in remission. BMJ Open Diabetes Res Care. 2019;7(1):e000696.
35. Petersen BJ, Rothenberg GM, Lakhani PJ, et al. Ulcer metastasis? Anatomical locations of recurrence for patients in diabetic foot remission. J Foot Ankle Res. 2020;13:1.
36. Killeen AL, Brock KM, Dancho JF, Walters JL. Remote temperature monitoring in patients with visual impairment due to diabetes mellitus, a proposed improvement to curren standard of care for prevention of diabetic foot ulcers. J Diabetes Sci Technol. 2020;14(1):37-45.
37. Murff RT, Armstrong DG, Lanctot D, Lavery LA, Athanasiou KA. How effective is manual palpation in detecting subtle temperature differences? Clin Podiatr Med Surg. 1998;15(1):151-154.
38. Armstrong DG, Boulton AJM, Bus SA. Diabetic foot ulcers and their recurrence. N Engl J Med. 2017;376(24):2367-2375.
39. Natovich R, Kushnir T, Harman-Boehm I, et al. Cognitive dysfunction: part and parcel of the diabetic foot. Diabetes Care. 2016;39(7):1202-1207.
40. Zhong A, Li G, Wang D, Sun Y, Zou X, Li B. The risks and external effects of diabetic foot ulcer on diabetic patients: a hospital-based survey in Wuhan area, China. Wound Repair Regen. 2017;25(5):858-863.
41. Vileikyte L. Diabetic foot ulcers: a quality of life issue. Diabetes Metab Res Rev. 2001;17(4):246-249.
42. Van Acker K, Oleen-Burkey M, De Decker L, et al. Cost and resource utilization for prevention and treatment of foot lesions in a diabetic foot clinic in Belgium. Diabetes Res Clin Pract. 2000;50(2):87-95.
43. Kerr M, Rayman G, Jeffcoate WJ. Cost of diabetic foot disease to the National Health Service in England. Diabetes Med. 2014;31(12):1498-1504.
44. Bus SA, van Netten JJ. A shift in priority in diabetic foot care and research: 75% of foot ulcers are preventable. Diabetes Metab Res Rev. 2016;32(suppl 1):195-200.
45. Hicks CW, Selvarajah S, Mathioudakis N, et al. Burden of infected diabetic foot ulcers on hospital admissions and costs. Ann Vasc Surg. 2016;33:149-158.
46. Rice JB, Desai U, Cummings AKG, Birnbaum HG, Skornicki M, Parsons NB. Burden of diabetic foot ulcers for Medicare and private insurers. Diabetes Care. 2014;37(3):651-658.
47. Skrepnek GH, Mills JL Sr, Lavery LA, Armstrong DG. Health care service and outcomes among an estimated 6.7 million ambulatory care diabetic foot cases in the U.S. Diabetes Care. 2017;40(7):936-942.
48. Lazzarini PA, Hurn SE, Kuys SS, et al. Direct inpatient burden caused by foot-related conditions: a multisite point-prevalence study. BMJ Open. 2016;6(6):e010811.
Evaluating the Impact and Educational Value of YouTube Videos on Nail Biopsy Procedures
To the Editor:
Nail biopsy is an important surgical procedure for diagnosis of nail pathology. YouTube has become a potential instrument for physicians and patients to learn about medical procedures.1,2 However, the sources, content, and quality of the information available have not been fully studied or characterized. Our objective was to analyze the efficiency of information and quality of YouTube videos on nail biopsies. We hypothesized that the quality of patient education and physician training videos would be unrepresentative on YouTube.
The term nail biopsy was searched on January 29, 2019, and filtered by relevance and rating using the default YouTube algorithm. Data were collected from the top 40 hits for the search term and filter coupling. All videos were viewed and sorted for nail biopsy procedures, and then those videos were categorized as being produced by a physician or other health care provider. The US medical board status of each physician videographer was determined using the American Board of Medical Specialties database.3 DISCERN criteria for assessing consumer health care information4 were used to interpret the videos by researchers (S.I. and S.R.L.) in this study.
From the queried search term collection, only 10 videos (1,023,423 combined views) were analyzed in this study (eTable). Although the other resulting videos were tagged as nail biopsy, they were excluded due to irrelevant content (eg, patient blogs, PowerPoints, nail avulsions). The mean age of the videos was 4 years (range, 4 days to 11 years), with a mean video length of 3.30 minutes (range, 49 seconds to 9.03 minutes). Four of 10 videos were performed for longitudinal melanonychia, and 5 of 10 videos were performed for melanonychia, clinically consistent with subungual hematoma. Dermatologists, plastic surgeons, and podiatrists produced the majority of the nail biopsy videos. The overall mean DISCERN rating was 1.60/5.00 (range, 1–3), meaning that the quality of content on nail biopsies was poor. This low DISCERN score signifies poor consumer health information. Video 2 (published in 2015) received a DISCERN score of 2 and received almost 1 million views, which is likely because the specific channel has a well-established subscriber pool (4.9 million subscribers). The highest DISCERN score of 3, demonstrating a tangential shave biopsy, was given to video 4 (published in 2010) and only received about 17,400 views (56 subscribers). Additionally, many videos lacked important information about the procedure. For instance, only 3 of 10 videos demonstrated the anesthetic technique and only 5 videos showed repair methods.
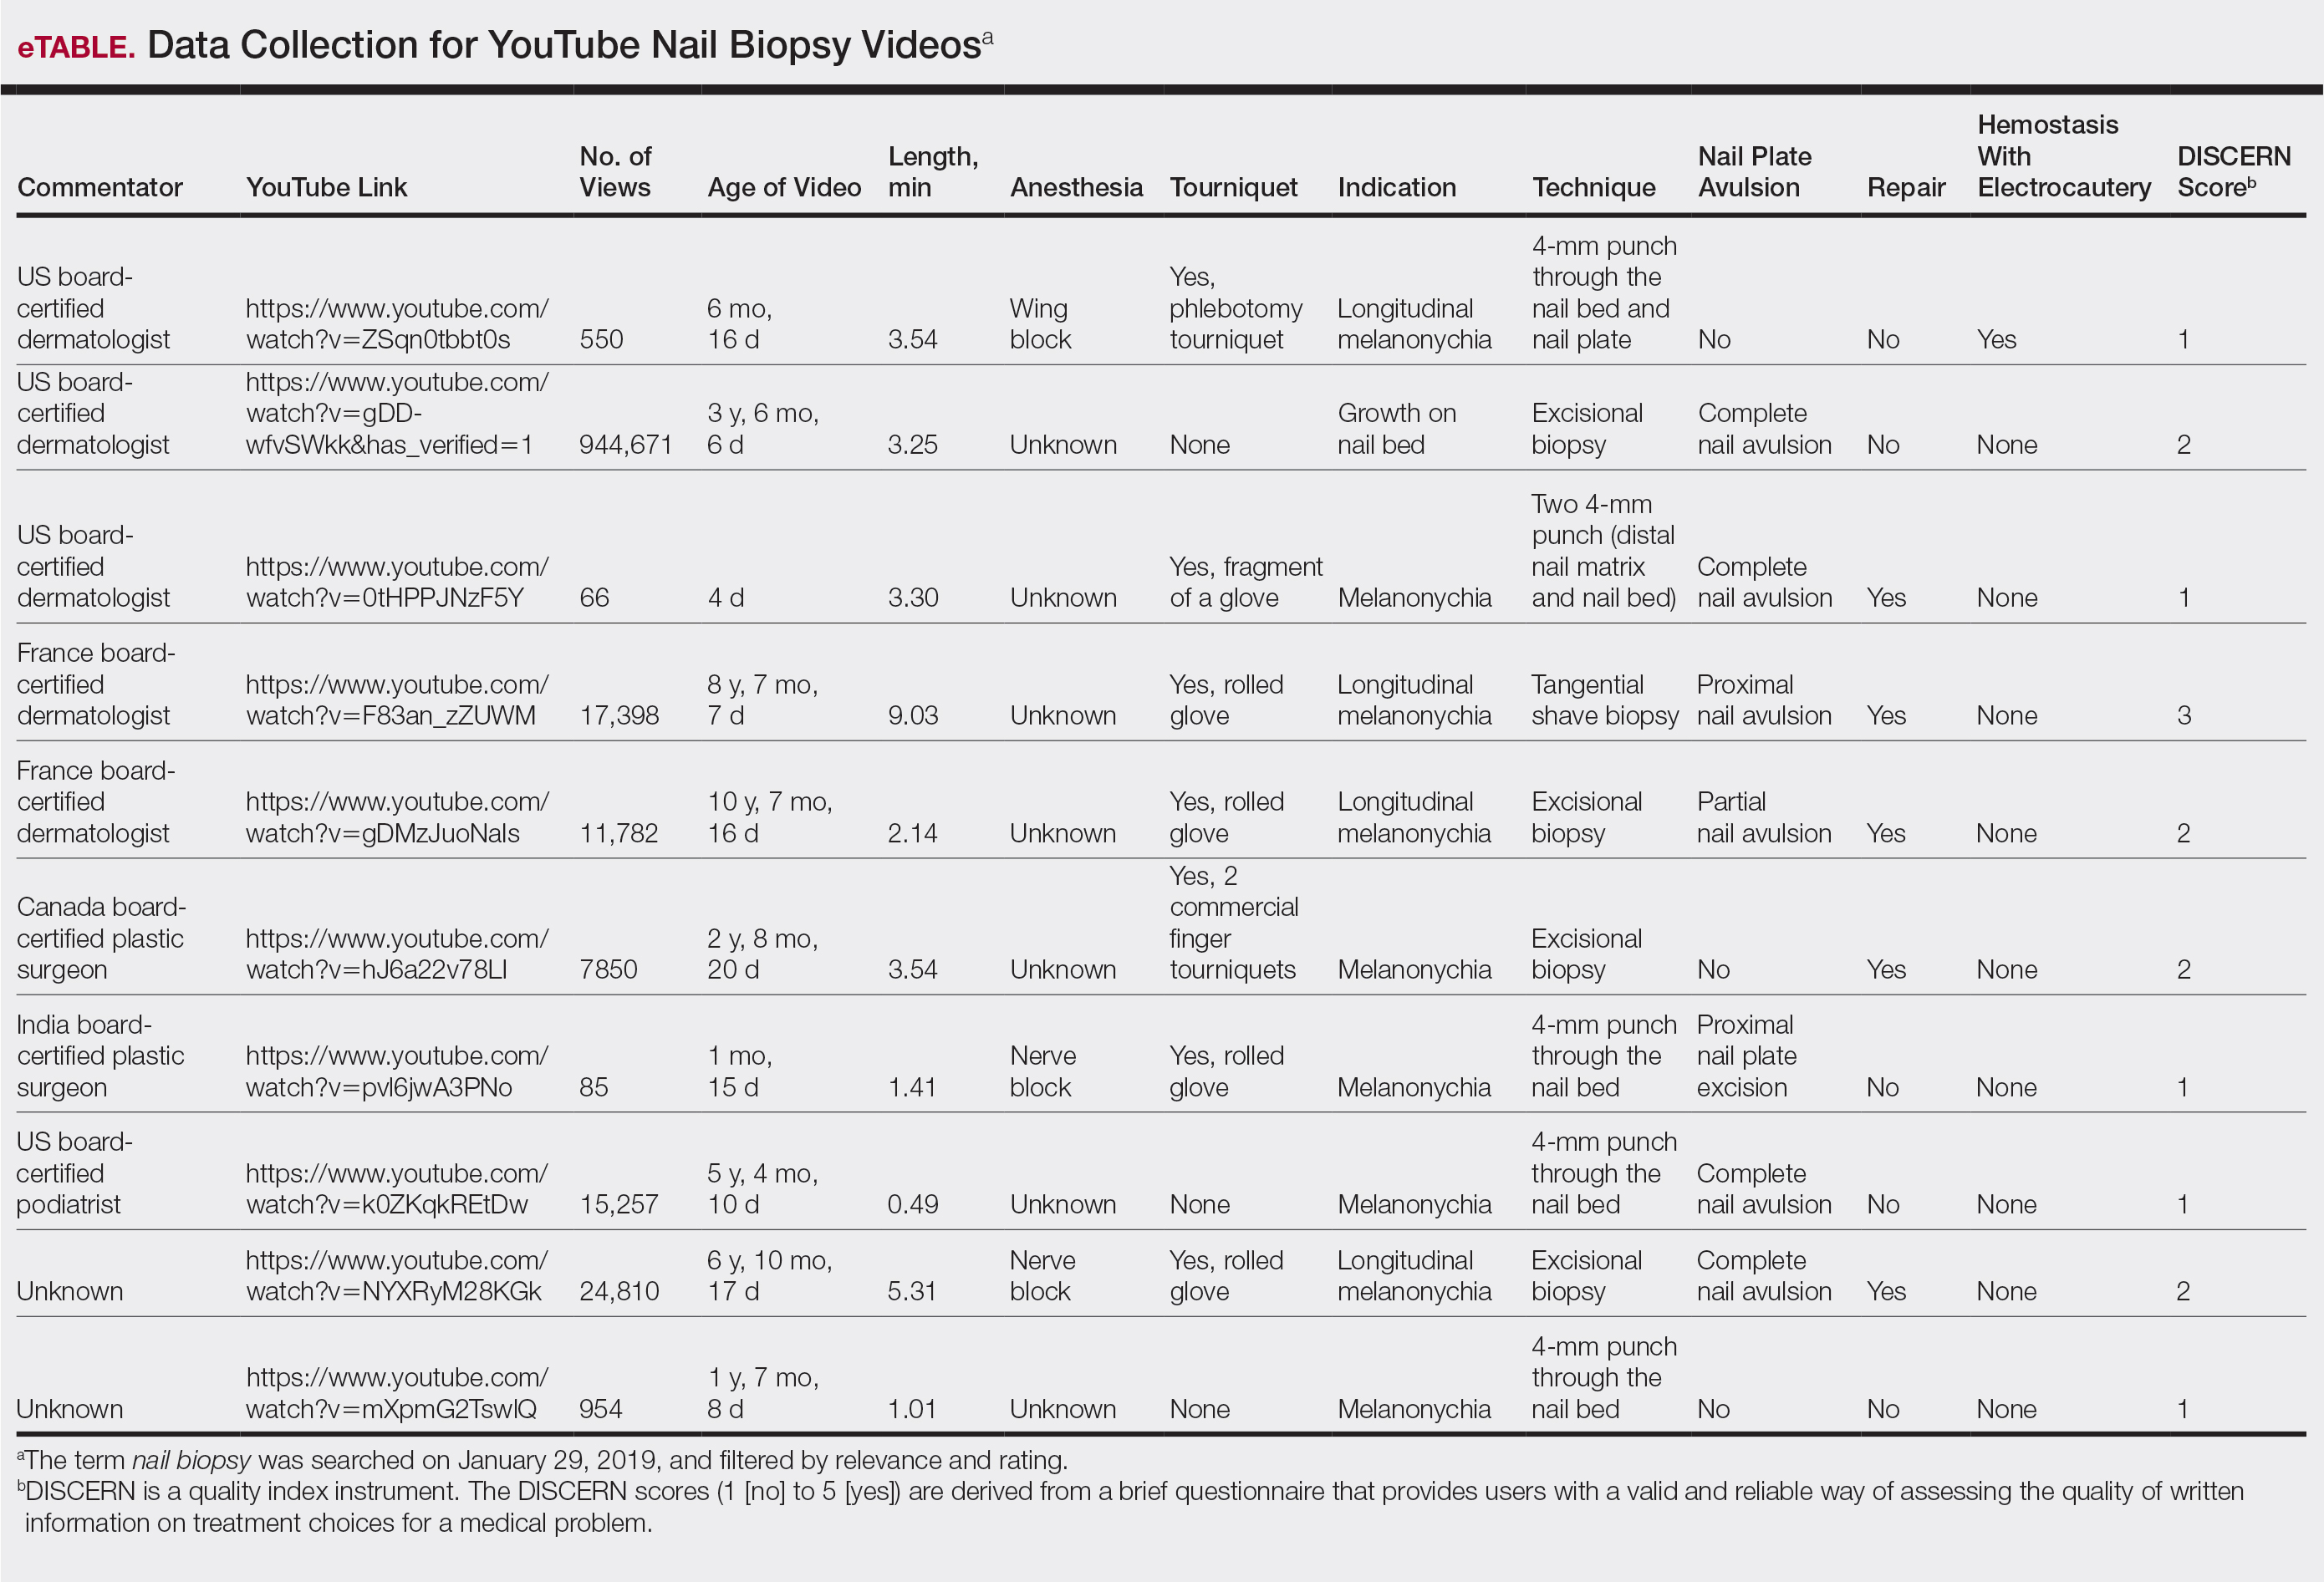
YouTube is an electronic learning source for general information; however, the content and quality of information on nail biopsy is not updated, reliable, or abundant. Patients undergoing nail biopsies are unlikely to find reliable and comprehensible information on YouTube; thus, there is a strong need for patient education in this area. In addition, physicians who did not learn to perform a nail biopsy during training are unlikely to learn this procedure from YouTube. Therefore, there is an unmet need for an outlet that will provide updated reliable content on nail biopsies geared toward both patients and physicians.
- Kwok TM, Singla AA, Phang K, et al. YouTube as a source of patient information for varicose vein treatment options. J Vasc Surg Venous Lymphat Disord. 2017;5:238-243.
- Ward B, Ward M, Nicheporuck A, et al. Assessment of YouTube as an informative resource on facial plastic surgery procedures. JAMA Facial Plastic Surgery. 2019;21:75-76.
- American Board of Medical Specialties. Certification Matters. https://www.certificationmatters.org. Accessed February 7, 2020.
- The DISCERN Instrument. DISCERN Online. http://www.discern.org.uk/discern_instrument.php. Published October 1999. Accessed February 7, 2020.
To the Editor:
Nail biopsy is an important surgical procedure for diagnosis of nail pathology. YouTube has become a potential instrument for physicians and patients to learn about medical procedures.1,2 However, the sources, content, and quality of the information available have not been fully studied or characterized. Our objective was to analyze the efficiency of information and quality of YouTube videos on nail biopsies. We hypothesized that the quality of patient education and physician training videos would be unrepresentative on YouTube.
The term nail biopsy was searched on January 29, 2019, and filtered by relevance and rating using the default YouTube algorithm. Data were collected from the top 40 hits for the search term and filter coupling. All videos were viewed and sorted for nail biopsy procedures, and then those videos were categorized as being produced by a physician or other health care provider. The US medical board status of each physician videographer was determined using the American Board of Medical Specialties database.3 DISCERN criteria for assessing consumer health care information4 were used to interpret the videos by researchers (S.I. and S.R.L.) in this study.
From the queried search term collection, only 10 videos (1,023,423 combined views) were analyzed in this study (eTable). Although the other resulting videos were tagged as nail biopsy, they were excluded due to irrelevant content (eg, patient blogs, PowerPoints, nail avulsions). The mean age of the videos was 4 years (range, 4 days to 11 years), with a mean video length of 3.30 minutes (range, 49 seconds to 9.03 minutes). Four of 10 videos were performed for longitudinal melanonychia, and 5 of 10 videos were performed for melanonychia, clinically consistent with subungual hematoma. Dermatologists, plastic surgeons, and podiatrists produced the majority of the nail biopsy videos. The overall mean DISCERN rating was 1.60/5.00 (range, 1–3), meaning that the quality of content on nail biopsies was poor. This low DISCERN score signifies poor consumer health information. Video 2 (published in 2015) received a DISCERN score of 2 and received almost 1 million views, which is likely because the specific channel has a well-established subscriber pool (4.9 million subscribers). The highest DISCERN score of 3, demonstrating a tangential shave biopsy, was given to video 4 (published in 2010) and only received about 17,400 views (56 subscribers). Additionally, many videos lacked important information about the procedure. For instance, only 3 of 10 videos demonstrated the anesthetic technique and only 5 videos showed repair methods.
YouTube is an electronic learning source for general information; however, the content and quality of information on nail biopsy is not updated, reliable, or abundant. Patients undergoing nail biopsies are unlikely to find reliable and comprehensible information on YouTube; thus, there is a strong need for patient education in this area. In addition, physicians who did not learn to perform a nail biopsy during training are unlikely to learn this procedure from YouTube. Therefore, there is an unmet need for an outlet that will provide updated reliable content on nail biopsies geared toward both patients and physicians.
- Kwok TM, Singla AA, Phang K, et al. YouTube as a source of patient information for varicose vein treatment options. J Vasc Surg Venous Lymphat Disord. 2017;5:238-243.
- Ward B, Ward M, Nicheporuck A, et al. Assessment of YouTube as an informative resource on facial plastic surgery procedures. JAMA Facial Plastic Surgery. 2019;21:75-76.
- American Board of Medical Specialties. Certification Matters. https://www.certificationmatters.org. Accessed February 7, 2020.
- The DISCERN Instrument. DISCERN Online. http://www.discern.org.uk/discern_instrument.php. Published October 1999. Accessed February 7, 2020.
Practice Points
- A nail biopsy is sometimes necessary for histopathologic confirmation of a clinical diagnosis.
- YouTube has become a potential educational platform for physicians and patients to learn about nail biopsy procedures.
- Physicians and patients interested in learning more about nail biopsies are unlikely to find reliable and comprehensible information on YouTube; therefore, there is a need for updated reliable video content on nail biopsies geared toward both physicians and patients.

Efficacy, Safety, and Tolerability of Halobetasol Propionate 0.01%–Tazarotene 0.045% Lotion for Moderate to Severe Plaque Psoriasis in the Hispanic Population: Post Hoc Analysis
Psoriasis is a common chronic inflammatory disease affecting a diverse patient population, yet epidemiological and clinical data related to psoriasis in patients with skin of color are sparse. The Hispanic ethnic group includes a broad range of skin types and cultures. Prevalence of psoriasis in a Hispanic population has been reported as lower than in a white population1; however, these data may be influenced by the finding that Hispanic patients are less likely to see a dermatologist when they have skin problems.2 In addition, socioeconomic disparities and cultural variations among racial/ethnic groups may contribute to differences in access to care and thresholds for seeking care,3 leading to a tendency for more severe disease in skin of color and Hispanic ethnic groups.4,5 Greater impairments in health-related quality of life have been reported in patients with skin of color and Hispanic racial/ethnic groups compared to white patients, independent of psoriasis severity.4,6 Postinflammatory pigment alteration at the sites of resolving lesions, a common clinical feature in skin of color, may contribute to the impact of psoriasis on quality of life in patients with skin of color. Psoriasis in darker skin types also can present diagnostic challenges due to overlapping features with other papulosquamous disorders and less conspicuous erythema.7
We present a post hoc analysis of the treatment of moderate to severe psoriasis with a novel fixed-combination halobetasol propionate (HP) 0.01%–tazarotene (TAZ) 0.045% lotion in a Hispanic patient population. Historically, clinical trials for psoriasis have enrolled low proportions of Hispanic patients and other patients with skin of color; in this analysis, the Hispanic population (115/418) represented 28% of the total study population and provided valuable insights.
Methods
Study Design
Two phase 3 randomized controlled trials were conducted to demonstrate the efficacy and safety of HP/TAZ lotion. Patients with a clinical diagnosis of moderate or severe localized psoriasis (N=418) were randomized to receive HP/TAZ lotion or vehicle (2:1 ratio) once daily for 8 weeks with a 4-week posttreatment follow-up.8,9 A post hoc analysis was conducted on data of the self-identified Hispanic population.
Assessments
Efficacy assessments included treatment success (at least a 2-grade improvement from baseline in the investigator global assessment [IGA] and a score of clear or almost clear) and impact on individual signs of psoriasis (at least a 2-grade improvement in erythema, plaque elevation, and scaling) at the target lesion. In addition, reduction in body surface area (BSA) was recorded, and an IGA×BSA score was calculated by multiplying IGA by BSA at each timepoint for each individual patient. A clinically meaningful improvement in disease severity (percentage of patients achieving a 75% reduction in IGA×BSA [IGA×BSA-75]) also was calculated.
Information on reported and observed adverse events (AEs) was obtained at each visit. The safety population included 112 participants (76 in the HP/TAZ group and 36 in the vehicle group).
Statistical Analysis
The statistical and analytical plan is detailed elsewhere9 and relevant to this post hoc analysis. No statistical analysis was carried out to compare data in the Hispanic population with either the overall study population or the non-Hispanic population.
Results
Overall, 115 Hispanic patients (27.5%) were enrolled (eFigure). Patients had a mean (standard deviation [SD]) age of 46.7 (13.12) years, and more than two-thirds were male (n=80, 69.6%).
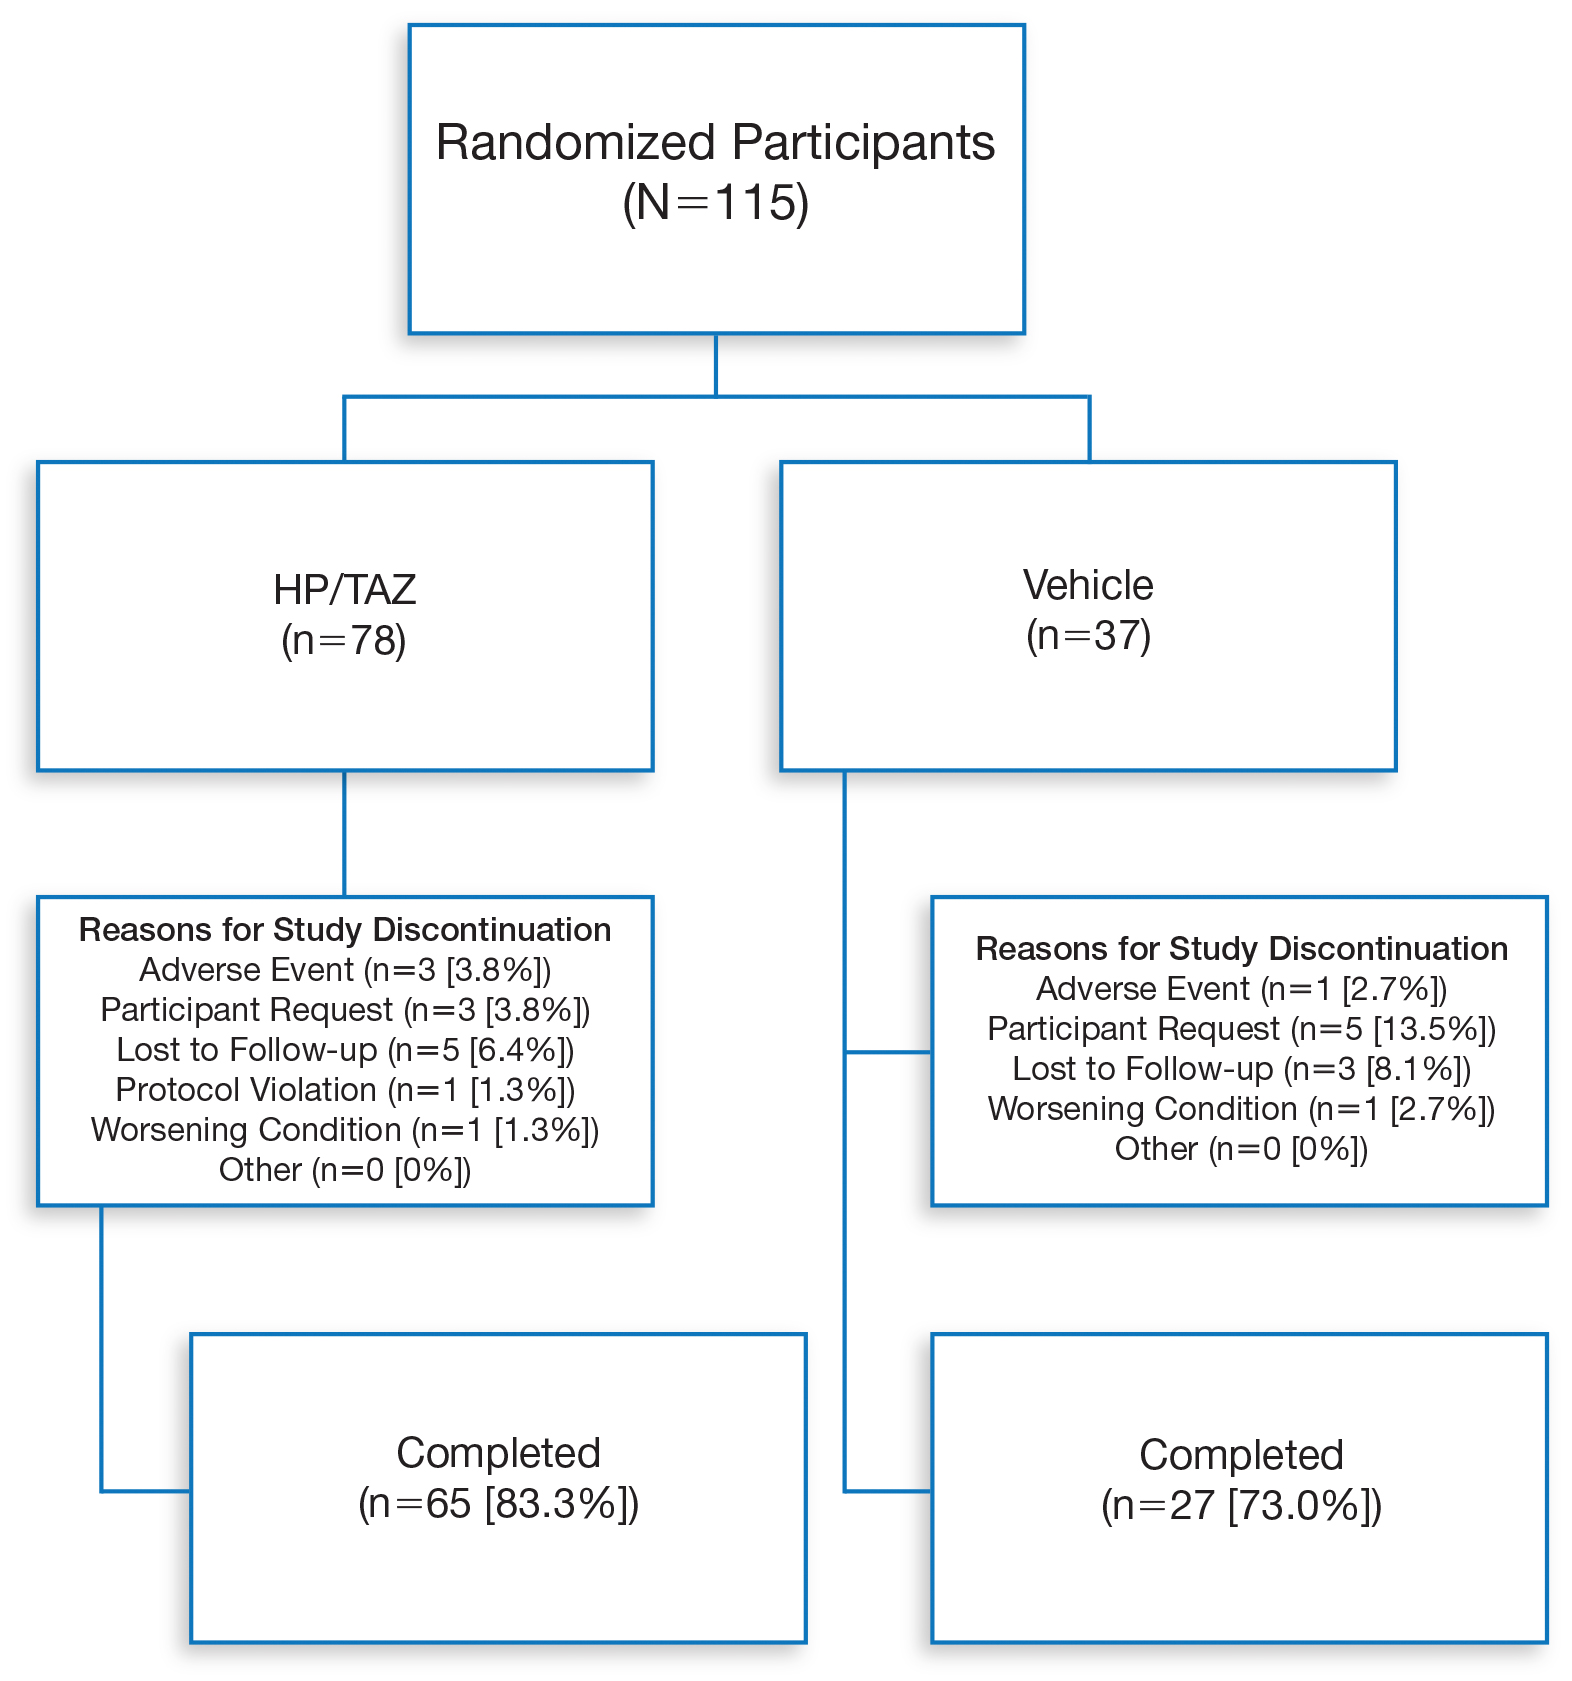
Overall completion rates (80.0%) for Hispanic patients were similar to those in the overall study population, though there were more discontinuations in the vehicle group. The main reasons for treatment discontinuation among Hispanic patients were participant request (n=8, 7.0%), lost to follow-up (n=8, 7.0%), and AEs (n=4, 3.5%). Hispanic patients in this study had more severe disease—18.3% (n=21) had an IGA score of 4 compared to 13.5% (n=41) of non-Hispanic patients—and more severe erythema (19.1% vs 9.6%), plaque elevation (20.0% vs 10.2%), and scaling (15.7% vs 12.9%) compared to the non-Hispanic populations (Table).
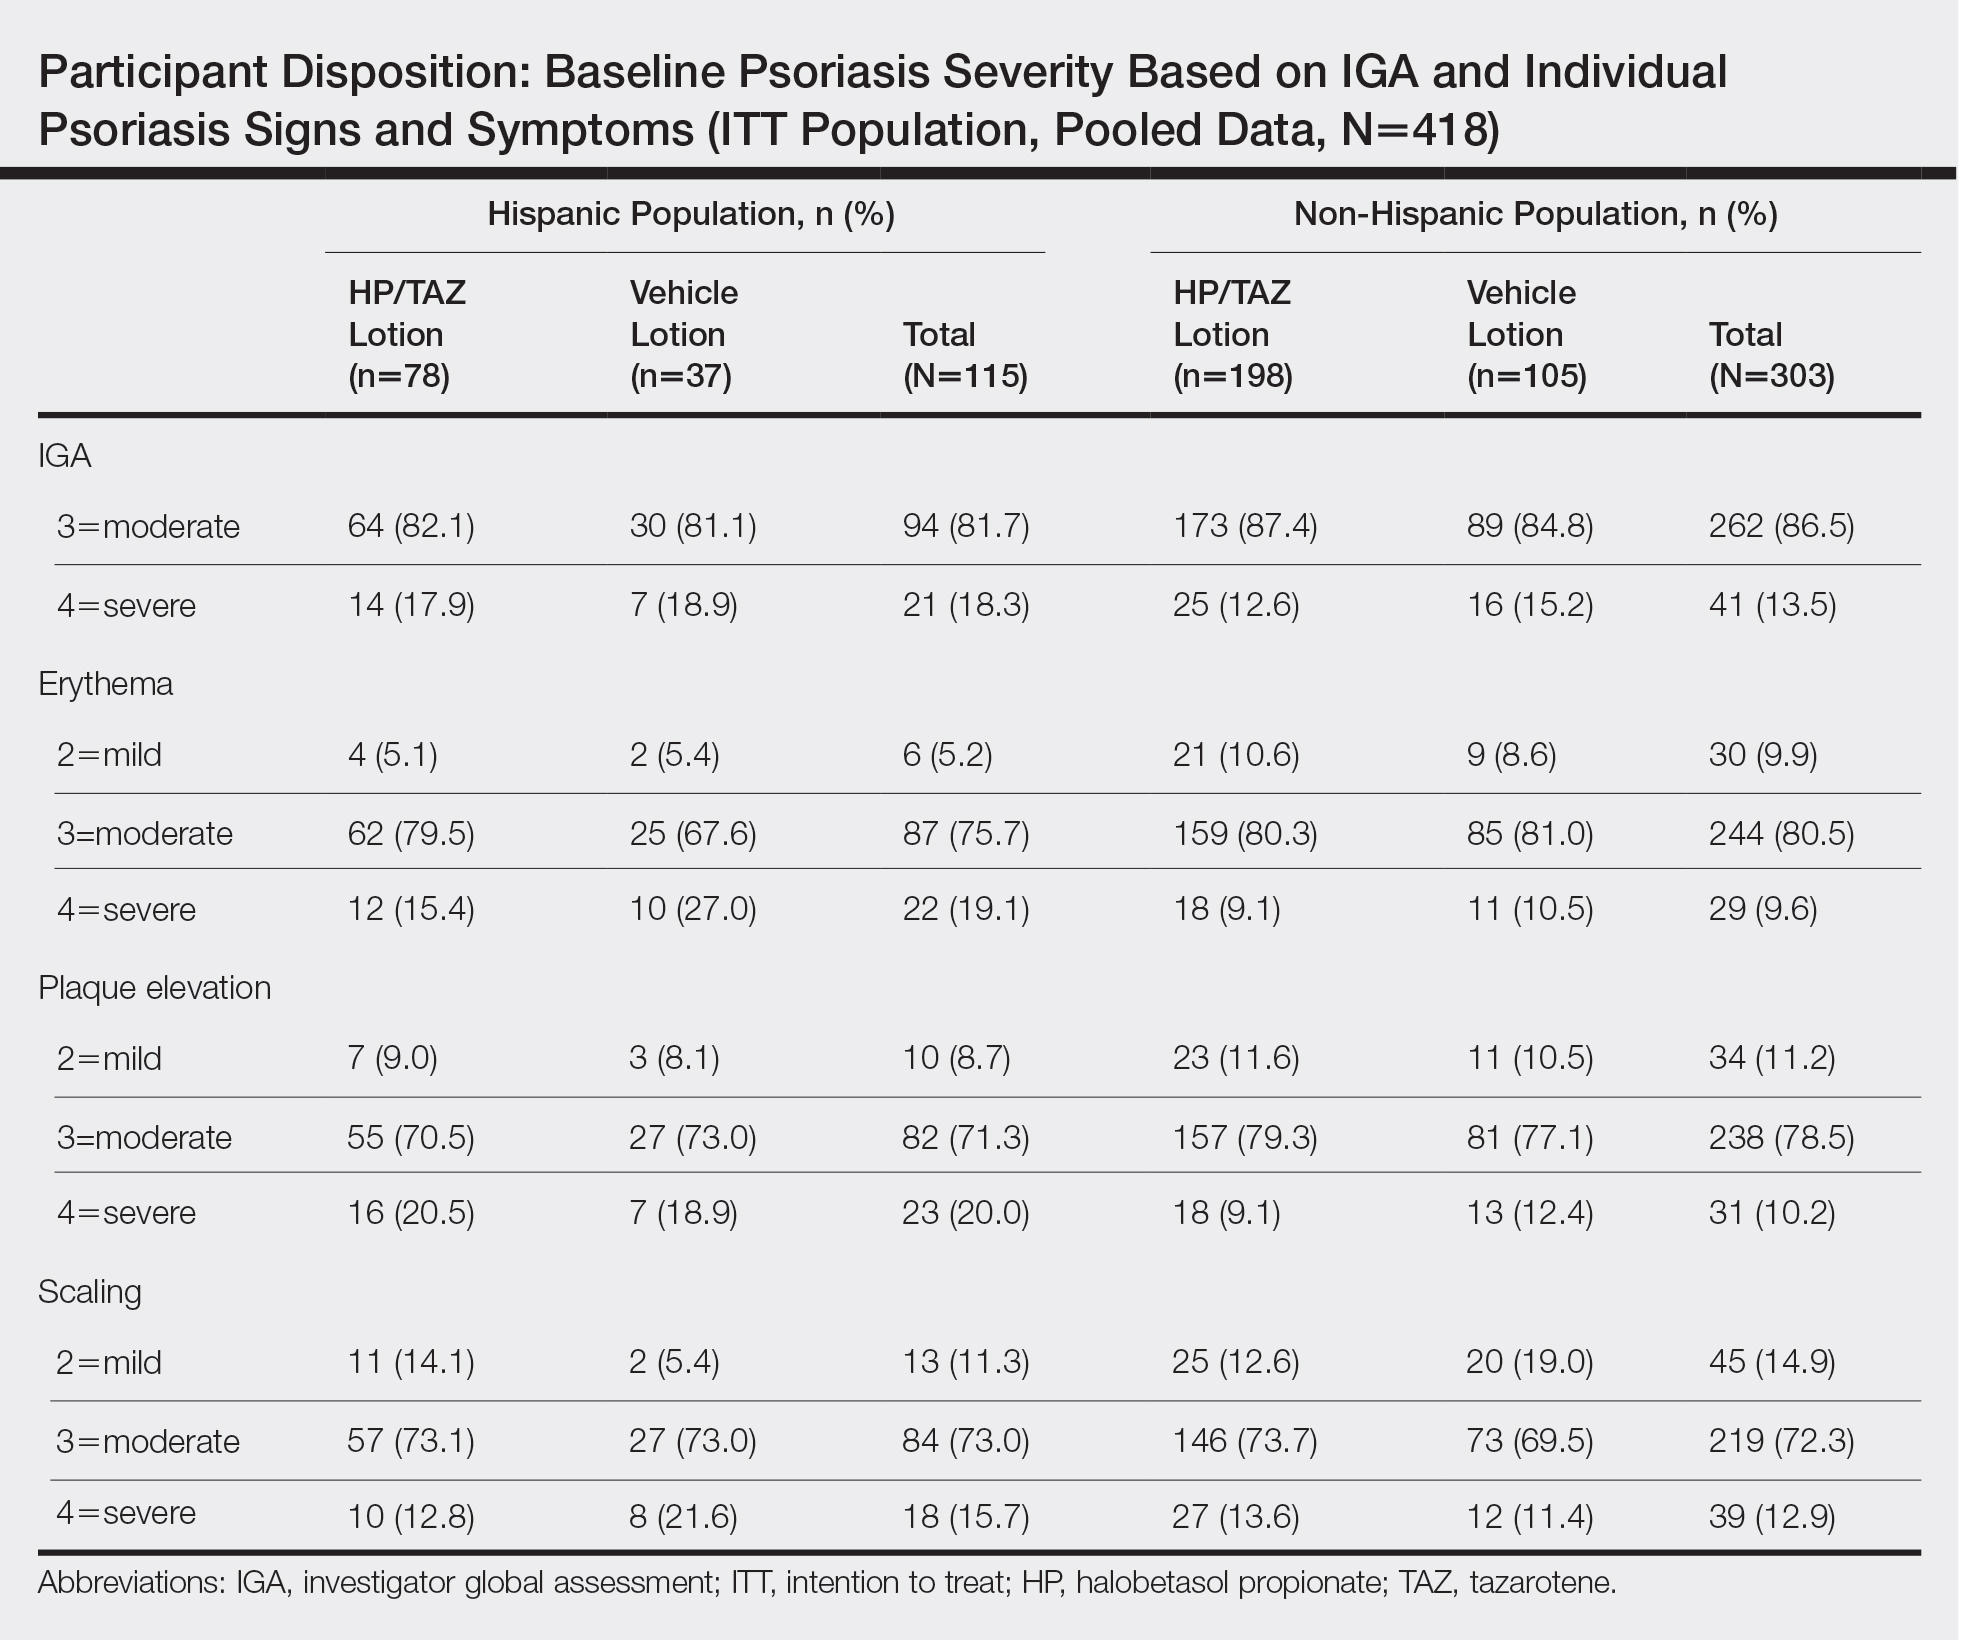
Efficacy of HP/TAZ lotion in Hispanic patients was similar to the overall study populations,9 though maintenance of effect posttreatment appeared to be better. The incidence of treatment-related AEs also was lower.
Halobetasol propionate 0.01%–TAZ 0.045% lotion demonstrated statistically significant superiority based on treatment success compared to vehicle as early as week 4 (P=.034). By week 8, 39.3% of participants treated with HP/TAZ lotion achieved treatment success compared to 9.3% of participants in the vehicle group (P=.002)(Figure 1). Treatment success was maintained over the 4-week posttreatment period, whereby 40.5% of the HP/TAZ-treated participants were treatment successes at week 12 compared to only 4.1% of participants in the vehicle group (P<.001).
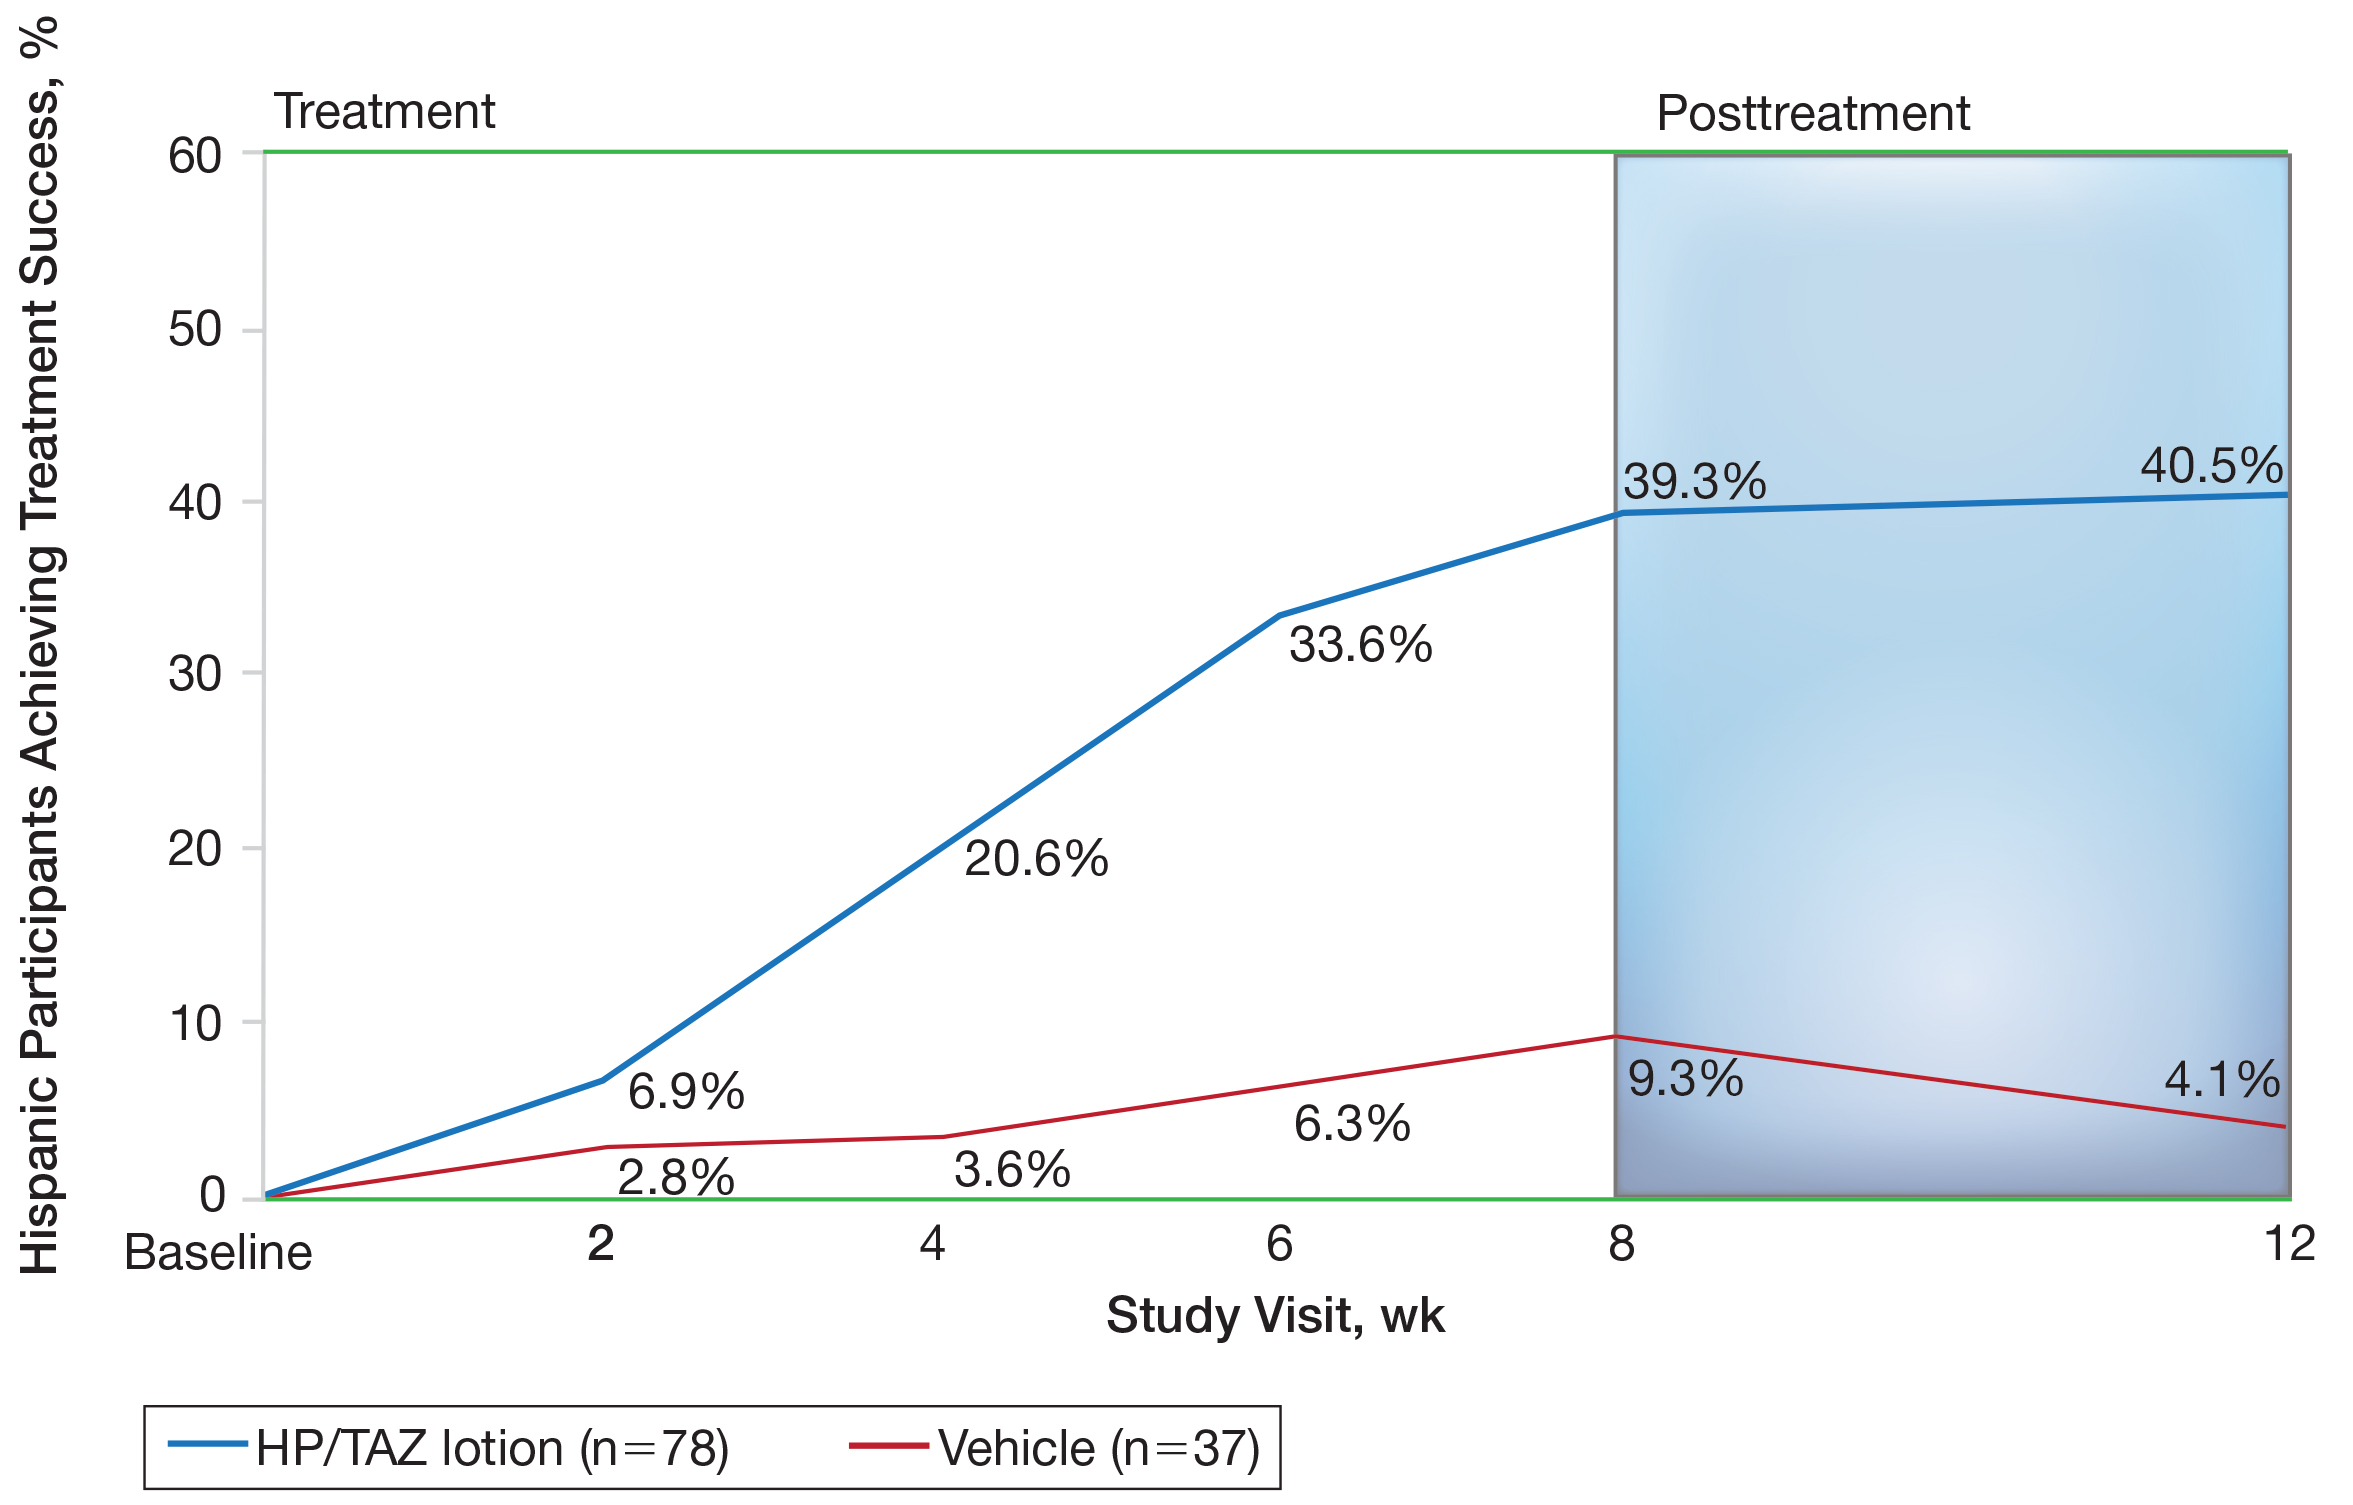
Improvements in psoriasis signs and symptoms at the target lesion were statistically significant compared to vehicle from week 2 (plaque elevation, P=.018) or week 4 (erythema, P=.004; scaling, P<.001)(Figure 2). By week 8, 46.8%, 58.1%, and 63.2% of participants showed at least a 2-grade improvement from baseline and were therefore treatment successes for erythema, plaque elevation, and scaling, respectively (all statistically significant [P<.001] compared to vehicle). The number of participants who achieved at least a 2-grade improvement in erythema with HP/TAZ lotion increased posttreatment from 46.8% to 53.0%.
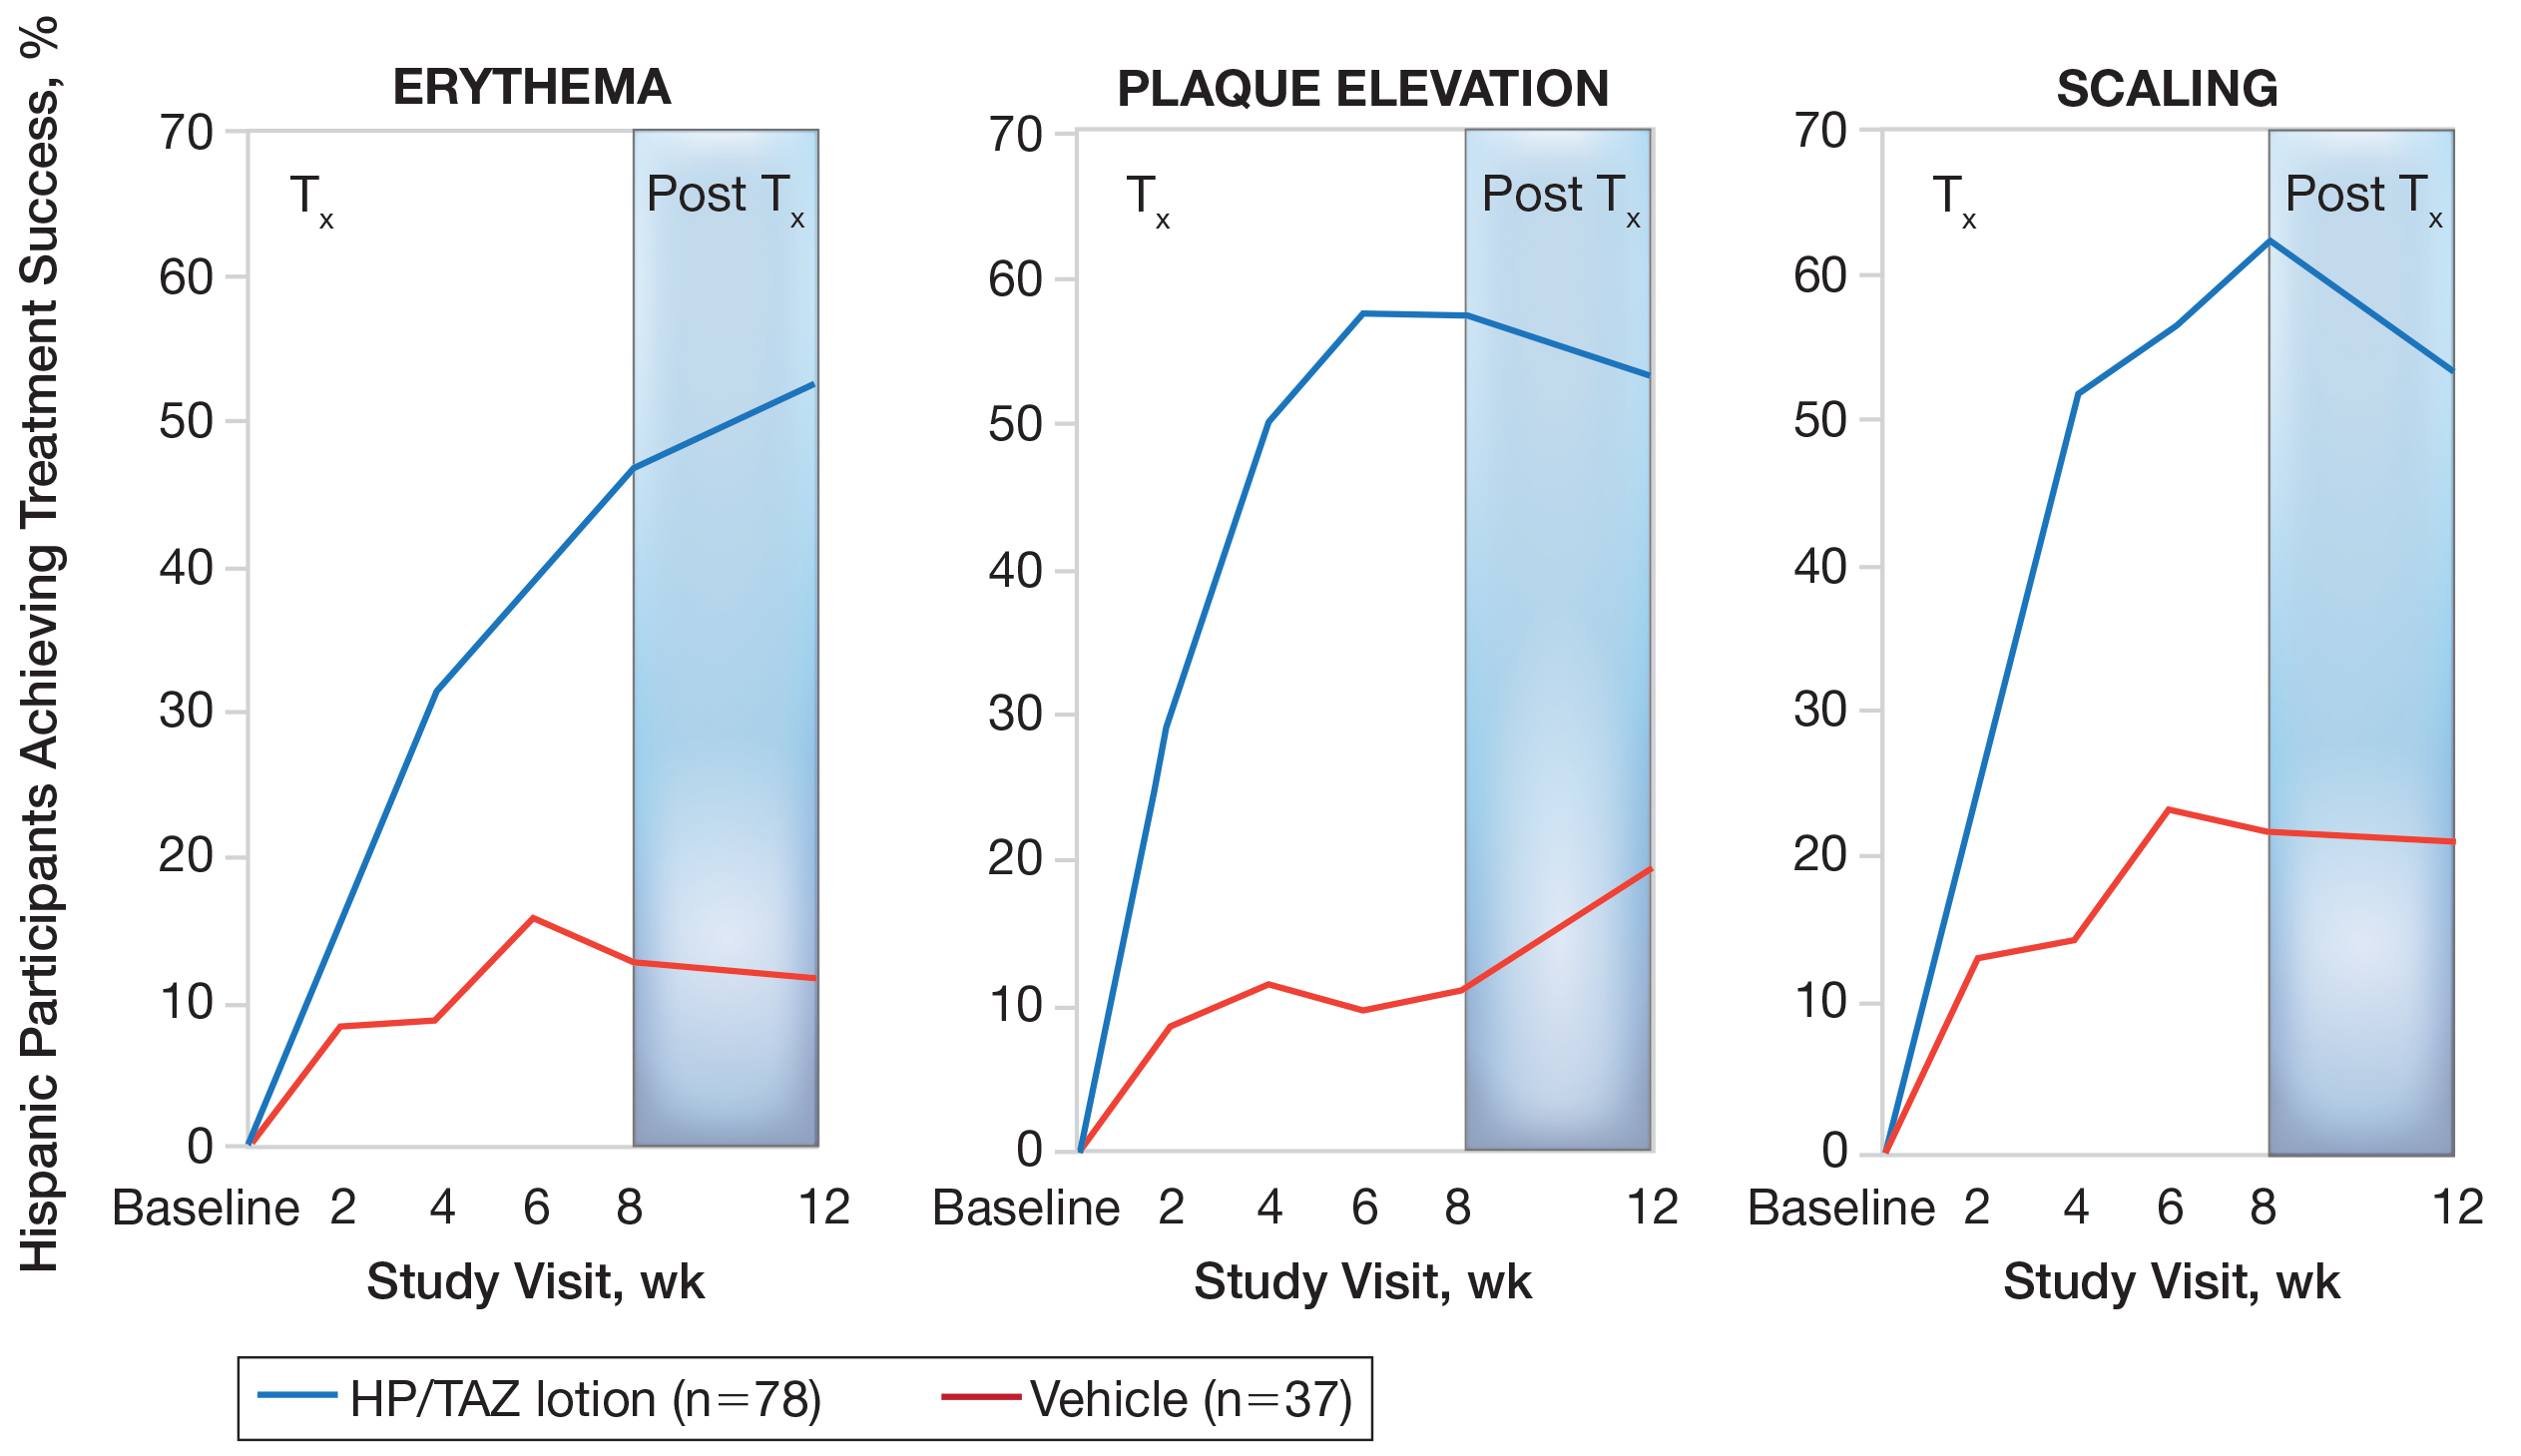
Mean (SD) baseline BSA was 6.2 (3.07), and the mean (SD) size of the target lesion was 36.3 (21.85) cm2. Overall, BSA also was significantly reduced in participants treated with HP/TAZ lotion compared to vehicle. At week 8, the mean percentage change from baseline was —40.7% compared to an increase (+10.1%) in the vehicle group (P=.002)(Figure 3). Improvements in BSA were maintained posttreatment, whereas in the vehicle group, mean (SD) BSA had increased to 6.1 (4.64).
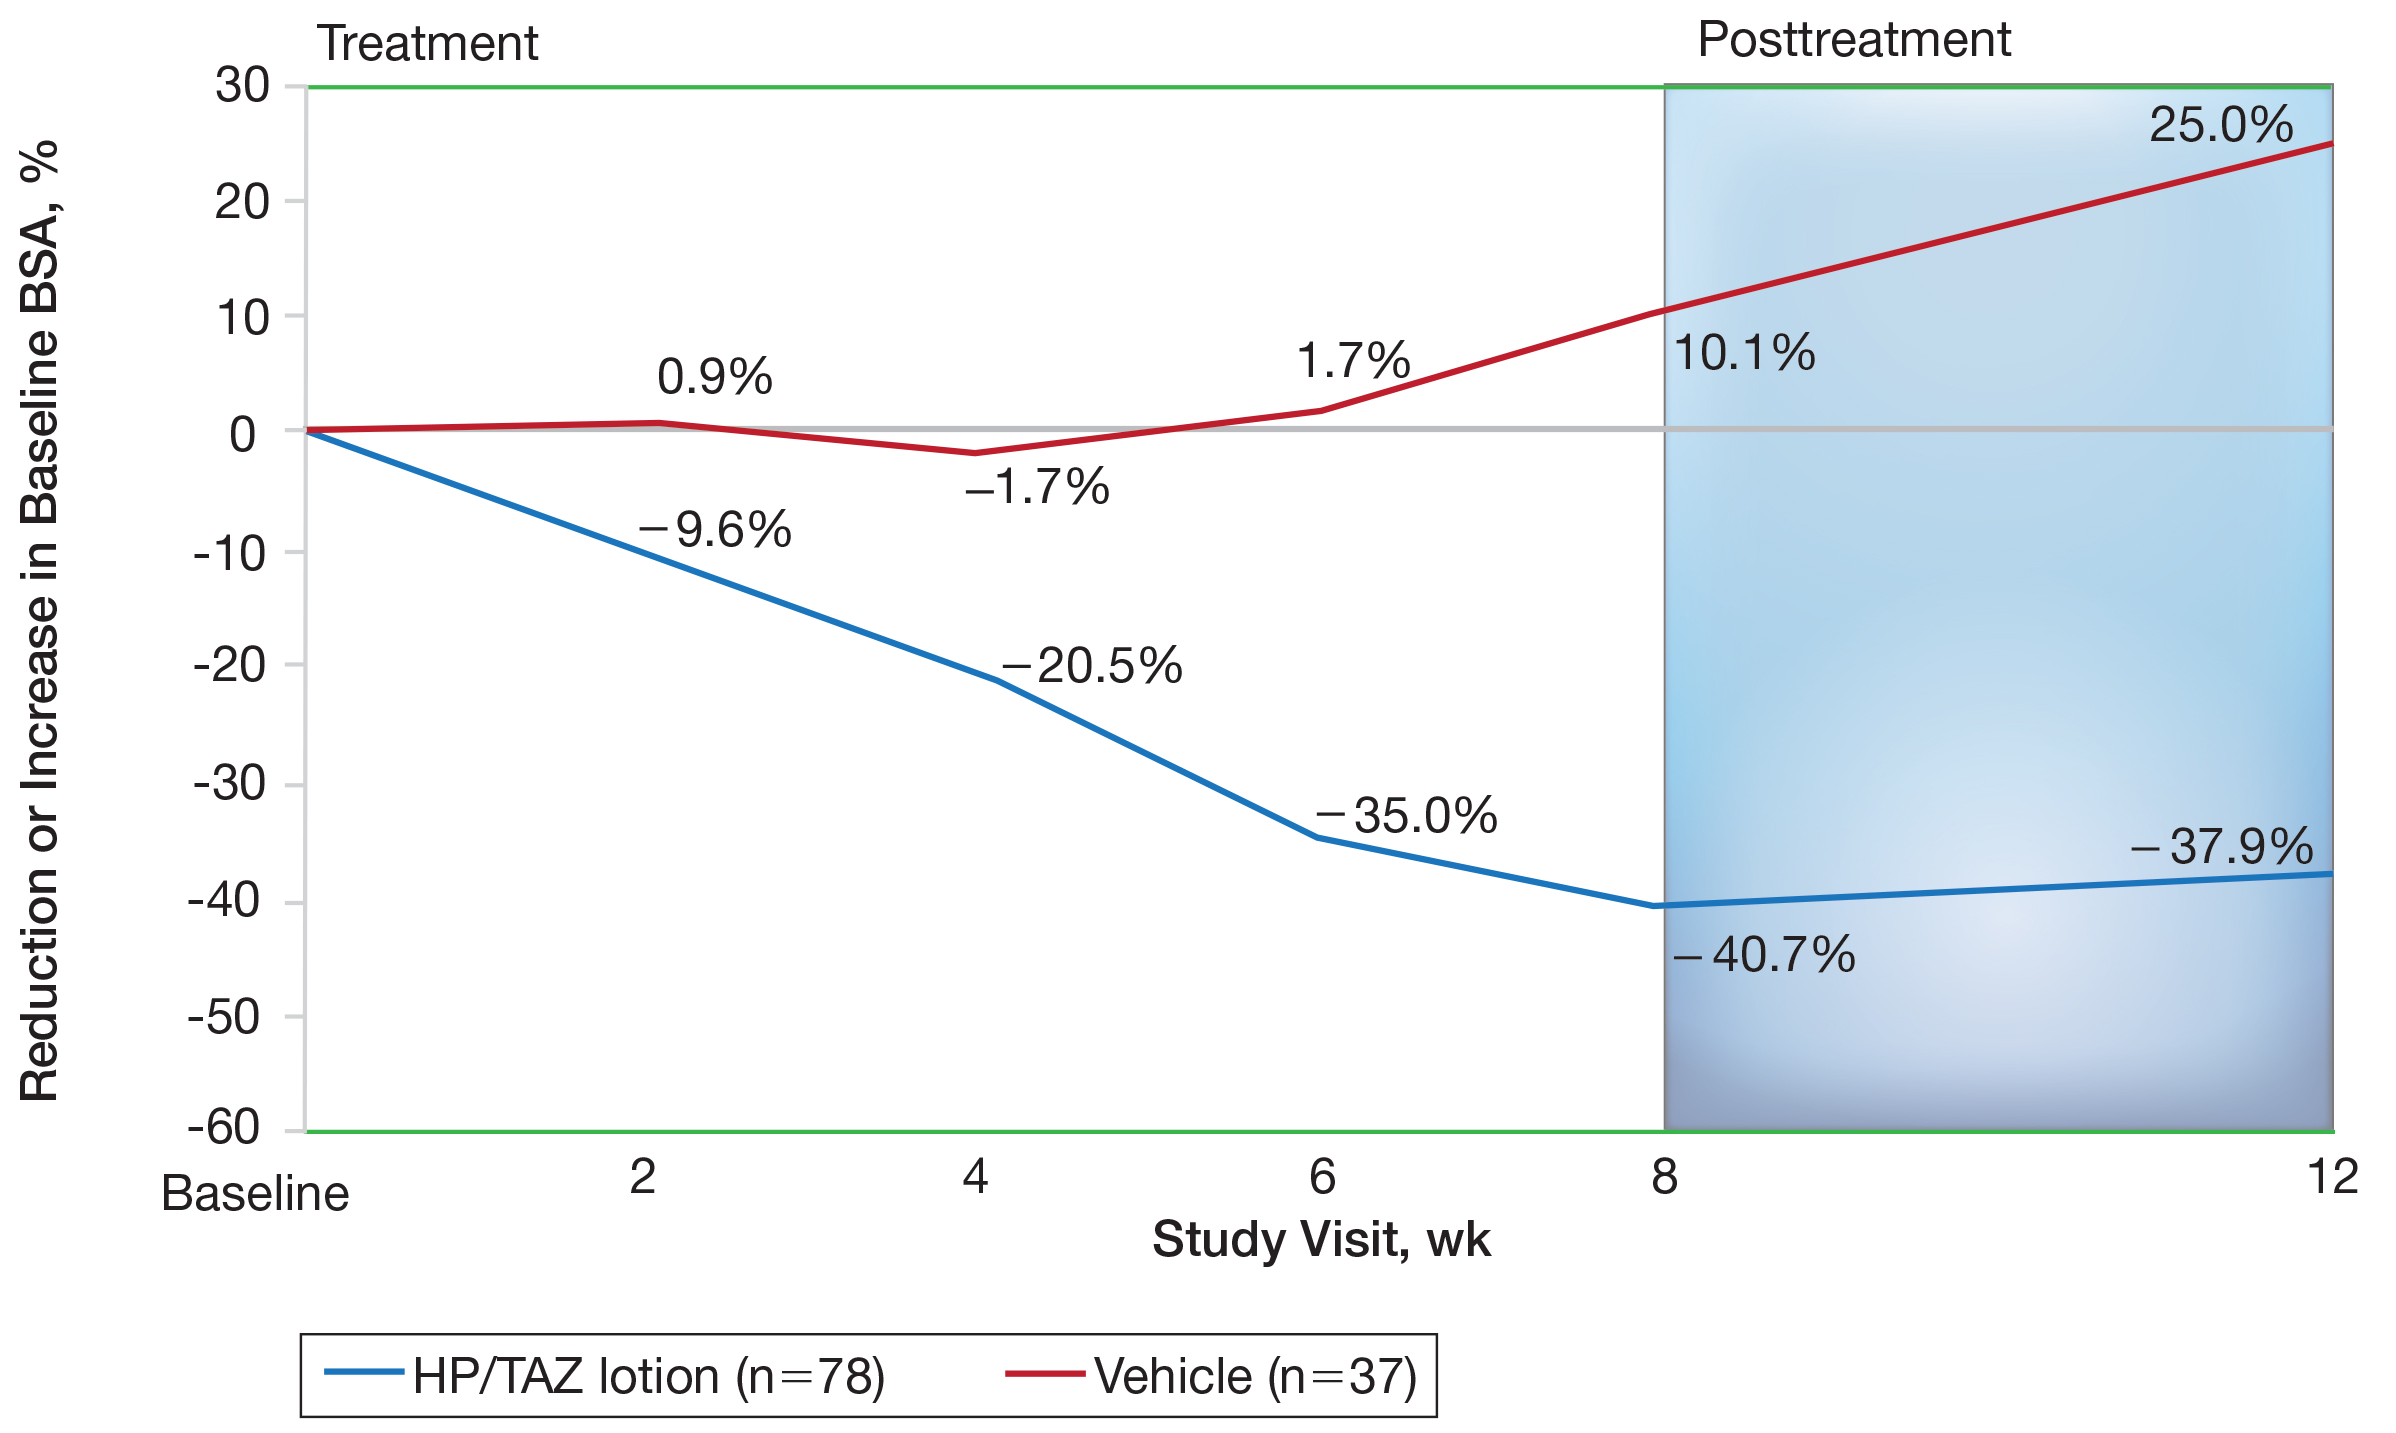
Halobetasol propionate 0.01%–TAZ 0.045% lotion achieved a 50.5% reduction from baseline IGA×BSA by week 8 compared to an 8.5% increase with vehicle (P<.001)(Figure 4). Differences in treatment groups were significant from week 2 (P=.016). Efficacy was maintained posttreatment, with a 50.6% reduction from baseline IGA×BSA at week 12 compared to an increase of 13.6% in the vehicle group (P<.001). Again, although results were similar to the overall study population at week 8 (50.5% vs 51.9%), maintenance of effect was better posttreatment (50.6% vs 46.6%).10
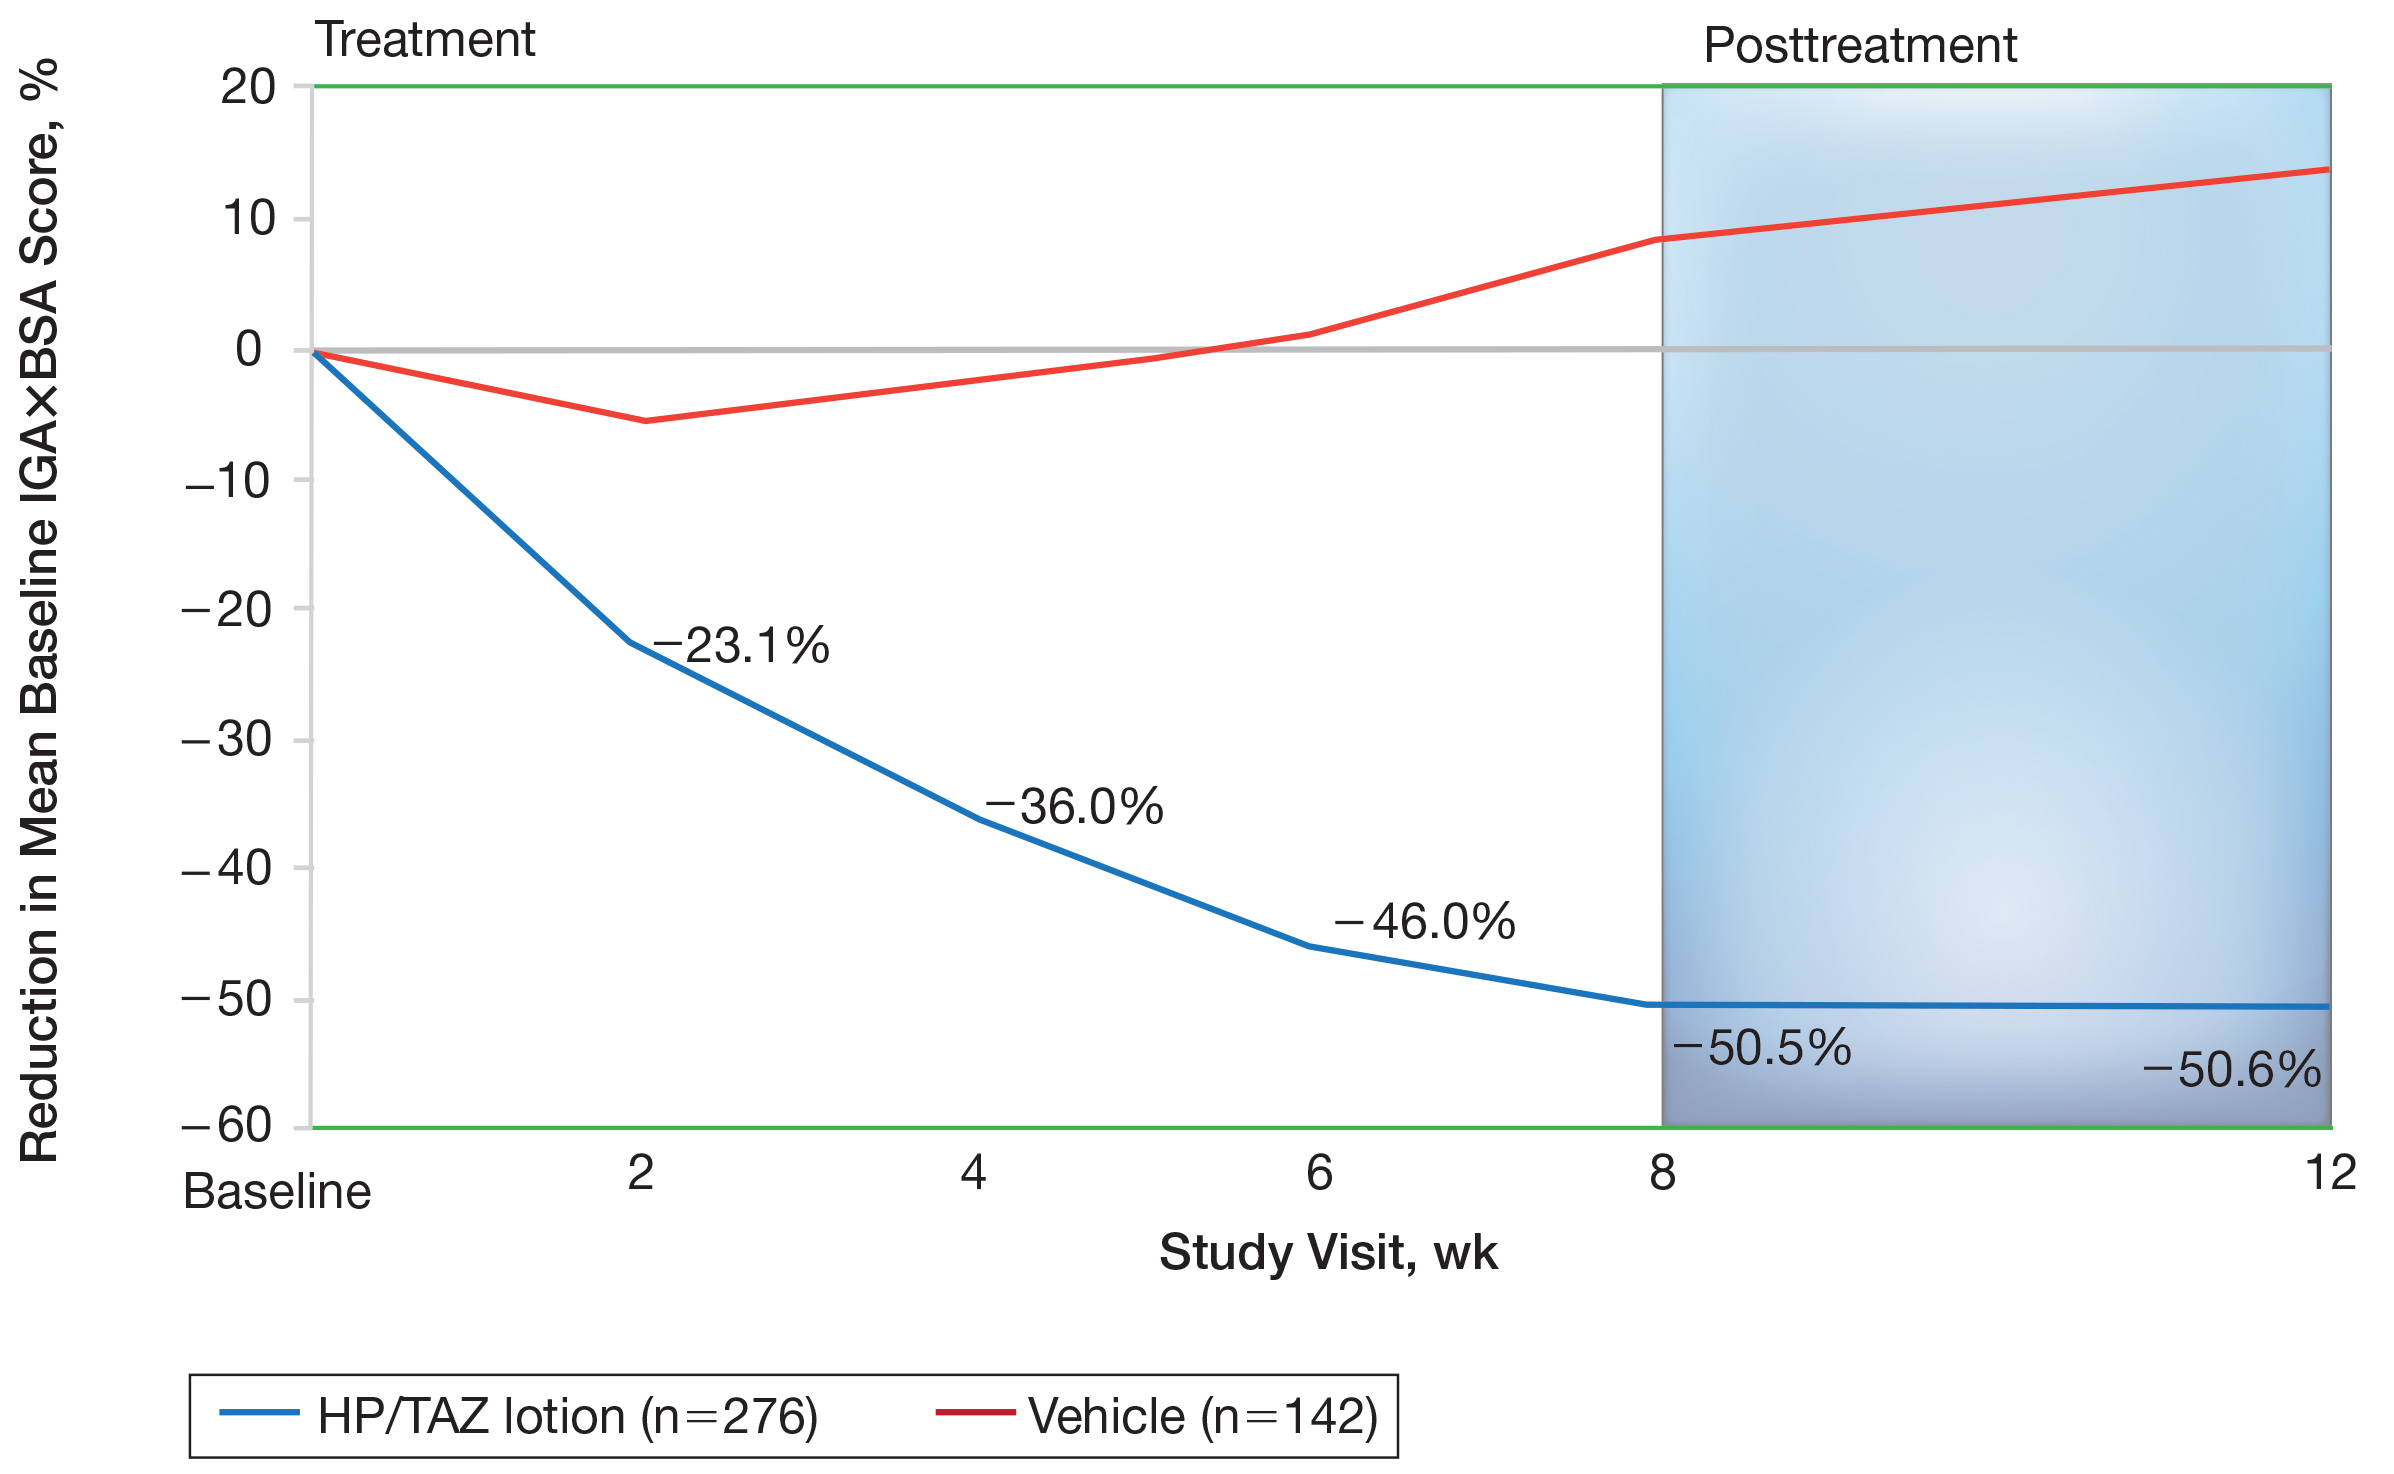
A clinically meaningful effect (IGA×BSA-75) was achieved in 39.7% of Hispanic participants treated with HP/TAZ lotion compared to 8.1% of participants treated with vehicle (P<.001) at week 8. The benefits were significantly different from week 4 and more participants maintained a clinically meaningful effect posttreatment (43.1% vs 7.1%, P<.001)(Figure 5).
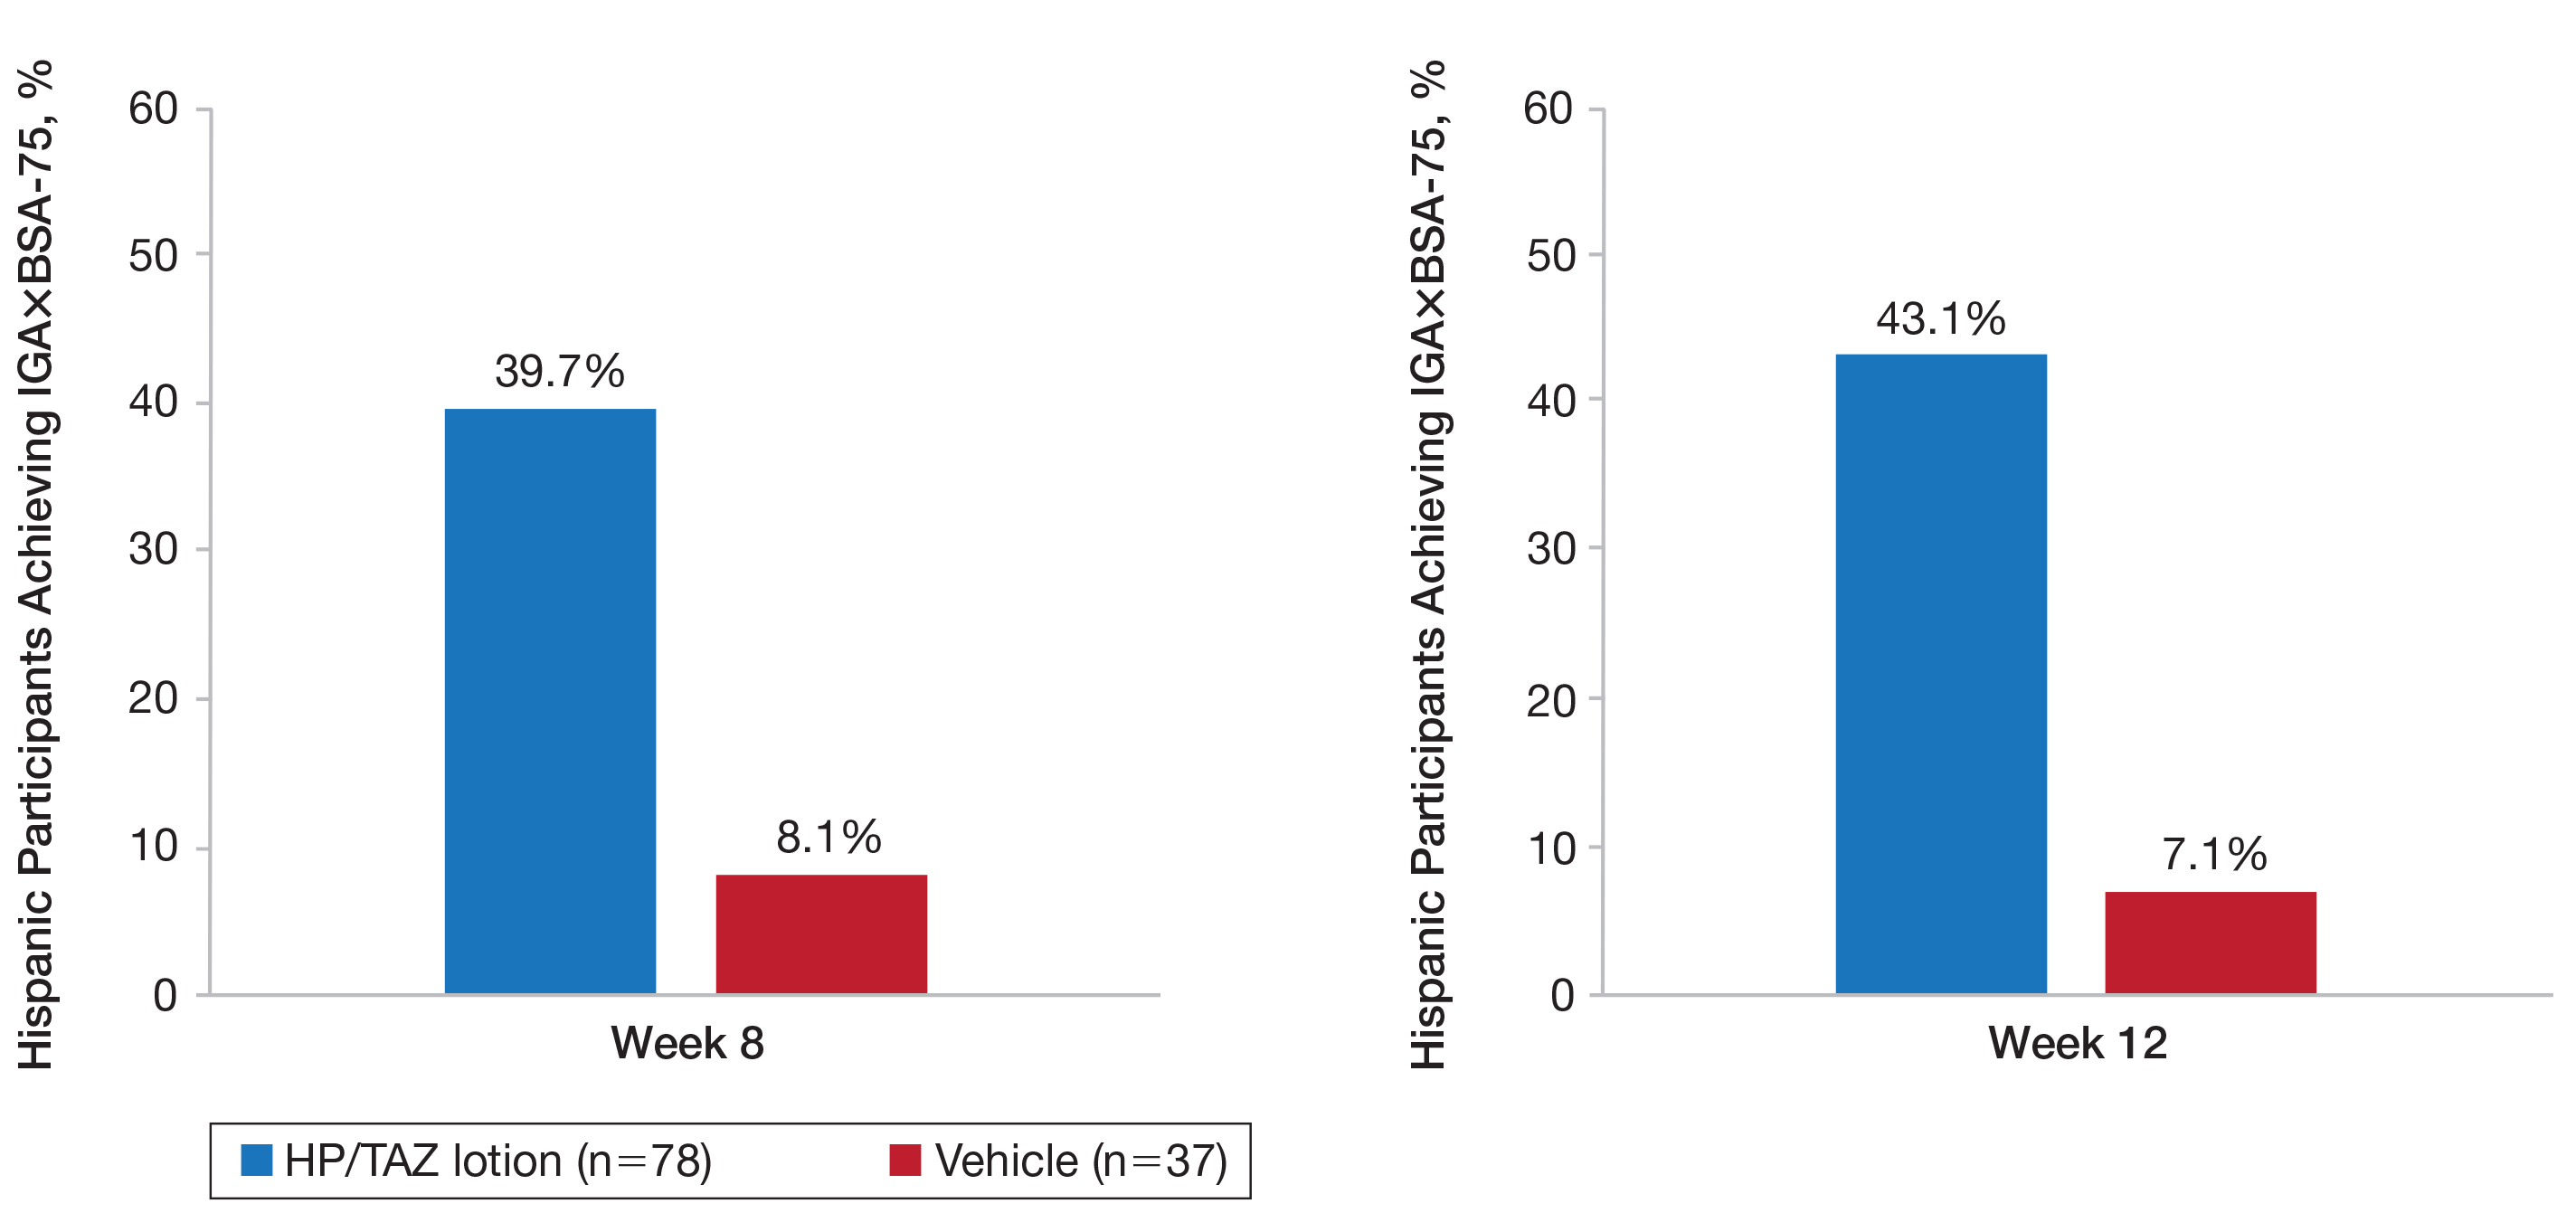
For Hispanic participants overall, 34 participants reported AEs: 26 (34.2%) treated with HP/TAZ lotion and 8 (22.2%) treated with vehicle (eTable). There was 1 (1.3%) serious AE in the HP/TAZ group. Most of the AEs were mild or moderate, with approximately half being related to study treatment. The most common treatment-related AEs in Hispanic participants treated with HP/TAZ lotion were contact dermatitis (n=3, 3.9%) and skin atrophy (n=3, 3.9%) compared to contact dermatitis (n=14, 7.2%) and application-site pain (n=7, 3.6%) in the non-Hispanic population. Pruritus was the most common AE in Hispanic participants treated with vehicle.
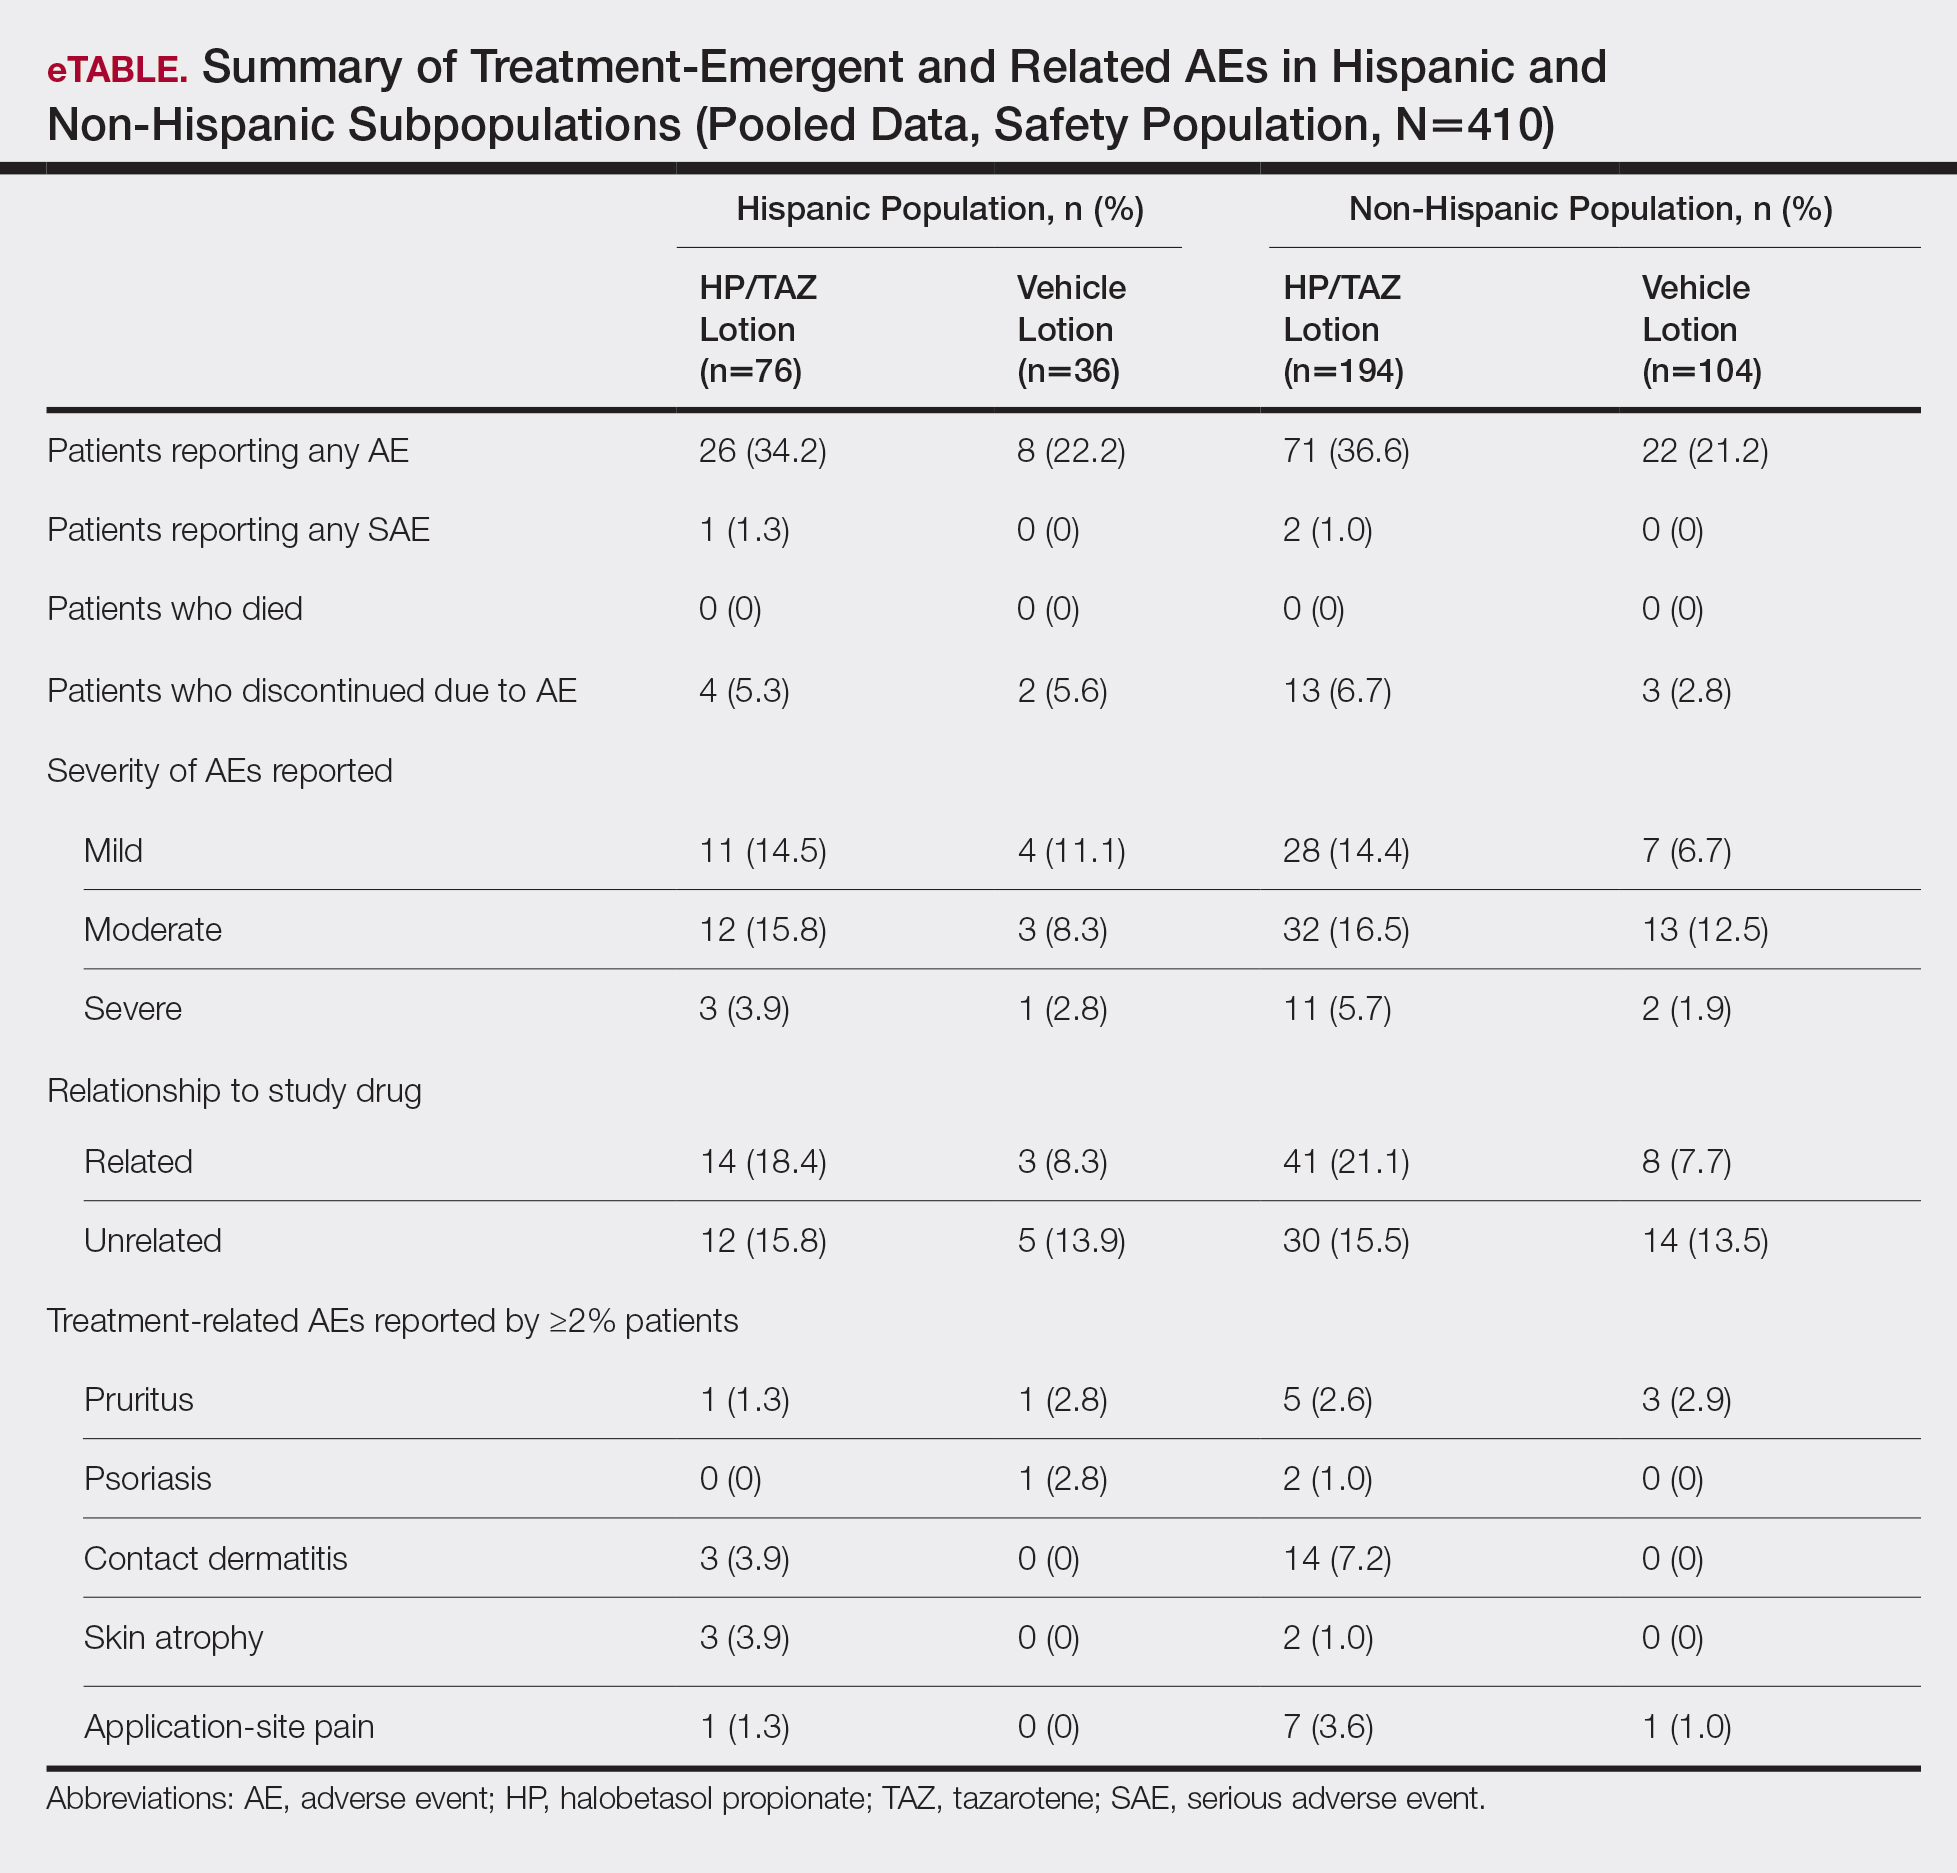
Comment
The large number of Hispanic patients in the 2 phase 3 trials8,9 allowed for this valuable subgroup analysis on the topical treatment of Hispanic patients with plaque psoriasis. Validation of observed differences in maintenance of effect and tolerability warrant further study. Prior clinical studies in psoriasis have tended to enroll a small proportion of Hispanic patients without any post hoc analysis. For example, in a pooled analysis of 4 phase 3 trials with secukinumab, Hispanic patients accounted for only 16% of the overall population.11 In our analysis, the Hispanic cohort represented 28% of the overall study population of 2 phase 3 studies investigating the efficacy, safety, and tolerability of HP/TAZ lotion in patients with moderate to severe psoriasis.8,9 In addition, proportionately more Hispanic patients had severe disease (IGA of 4) or severe signs and symptoms of psoriasis (erythema, plaque elevation, and scaling) than the non-Hispanic population. This finding supports other studies that have suggested Hispanic patients with psoriasis tend to have more severe disease but also may reflect thresholds for seeking care.3-5
Halobetasol propionate 0.01%–TAZ 0.045% lotion was significantly more effective than vehicle for all efficacy assessments. In general, efficacy results with HP/TAZ lotion were similar to those reported in the overall phase 3 study populations over the 8-week treatment period. The only noticeable difference was in the posttreatment period. In the overall study population, efficacy was maintained over the 4-week posttreatment period in the HP/TAZ group. In the Hispanic subpopulation, there appeared to be continued improvement in the number of participants achieving treatment success (IGA and erythema), clinically meaningful success, and further reductions in BSA. Although there is a paucity of studies evaluating psoriasis therapies in Hispanic populations, data on etanercept and secukinumab have been published.6,11
Onset of effect also is an important aspect of treatment. In patients with skin of color, including patients of Hispanic ethnicity and higher Fitzpatrick skin phototypes, early clearance of lesions may help limit the severity and duration of postinflammatory pigment alteration. Improvements in IGA×BSA scores were significant compared to vehicle from week 2 (P=.016), and a clinically meaningful improvement with HP/TAZ lotion (IGA×BSA-75) was seen by week 4 (P=.024).
Halobetasol propionate 0.01%–TAZ 0.045% lotion was well tolerated, both in the 2 phase 3 studies and in the post hoc analysis of the Hispanic subpopulation. The incidence of skin atrophy (n=3, 3.9%) was more common vs the non-Hispanic population (n=2, 1.0%). Other common AEs—contact dermatitis, pruritus, and application-site pain—were more common in the non-Hispanic population.
A limitation of our analysis was that it was a post hoc analysis of the Hispanic participants. The phase 3 studies were not designed to specifically study the impact of treatment on ethnicity/race, though the number of Hispanic participants enrolled in the 2 studies was relatively high. The absence of Fitzpatrick skin phototypes in this data set is another limitation of this study.
Conclusion
Halobetasol propionate 0.01%–TAZ 0.045% lotion was associated with significant, rapid, and sustained reductions in disease severity in a Hispanic population with moderate to severe psoriasis that continued to show improvement posttreatment with good tolerability and safety.
Acknowledgments
We thank Brian Bulley, MSc (Konic Limited, United Kingdom), for assistance with the preparation of the manuscript. Ortho Dermatologics funded Konic’s activities pertaining to this manuscript.
- Rachakonda TD, Schupp CW, Armstrong AW. Psoriasis prevalence among adults in the United States. J Am Acad Dermatol. 2014;70:512-516.
- Davis SA, Narahari S, Feldman SR, et al. Top dermatologic conditions in patients of color: an analysis of nationally representative data. J Drugs Dermatol. 2012;11:466-473.
- Setta-Kaffetzi N, Navarini AA, Patel VM, et al. Rare pathogenic variants in IL36RN underlie a spectrum of psoriasis-associated pustular phenotypes. J Invest Dermatol. 2013;133:1366-1369.
- Yan D, Afifi L, Jeon C, et al. A cross-sectional study of the distribution of psoriasis subtypes in different ethno-racial groups. Dermatol Online J. 2018;24. pii:13030/qt5z21q4k2.
- Abrouk M, Lee K, Brodsky M, et al. Ethnicity affects the presenting severity of psoriasis. J Am Acad Dermatol. 2017;77:180-182.
- Shah SK, Arthur A, Yang YC, et al. A retrospective study to investigate racial and ethnic variations in the treatment of psoriasis with etanercept. J Drugs Dermatol. 2011;10:866-872.
- Alexis AF, Blackcloud P. Psoriasis in skin of color: epidemiology, genetics, clinical presentation, and treatment nuances. J Clin Aesthet Dermatol. 2014;7:16-24.
- Gold LS, Lebwohl MG, Sugarman JL, et al. Safety and efficacy of a fixed combination of halobetasol and tazarotene in the treatment of moderate-to-severe plaque psoriasis: results of 2 phase 3 randomized controlled trials. J Am Acad Dermatol. 2018;79:287-293.
- Sugarman JL, Weiss J, Tanghetti EA, et al. Safety and efficacy of a fixed combination halobetasol and tazarotene lotion in the treatment of moderate-to-severe plaque psoriasis: a pooled analysis of two phase 3 studies. J Drugs Dermatol. 2018;17:855-861.
- Blauvelt A, Green LJ, Lebwohl MG, et al. Efficacy of a once-daily fixed combination halobetasol (0.01%) and tazarotene (0.045%) lotion in the treatment of localized moderate-to-severe plaque psoriasis. J Drugs Dermatol. 2019;18:297-299.
- Adsit S, Zaldivar ER, Sofen H, et al. Secukinumab is efficacious and safe in Hispanic patients with moderate-to-severe plaque psoriasis: pooled analysis of four phase 3 trials. Adv Ther. 2017;34:1327-1339.
Psoriasis is a common chronic inflammatory disease affecting a diverse patient population, yet epidemiological and clinical data related to psoriasis in patients with skin of color are sparse. The Hispanic ethnic group includes a broad range of skin types and cultures. Prevalence of psoriasis in a Hispanic population has been reported as lower than in a white population1; however, these data may be influenced by the finding that Hispanic patients are less likely to see a dermatologist when they have skin problems.2 In addition, socioeconomic disparities and cultural variations among racial/ethnic groups may contribute to differences in access to care and thresholds for seeking care,3 leading to a tendency for more severe disease in skin of color and Hispanic ethnic groups.4,5 Greater impairments in health-related quality of life have been reported in patients with skin of color and Hispanic racial/ethnic groups compared to white patients, independent of psoriasis severity.4,6 Postinflammatory pigment alteration at the sites of resolving lesions, a common clinical feature in skin of color, may contribute to the impact of psoriasis on quality of life in patients with skin of color. Psoriasis in darker skin types also can present diagnostic challenges due to overlapping features with other papulosquamous disorders and less conspicuous erythema.7
We present a post hoc analysis of the treatment of moderate to severe psoriasis with a novel fixed-combination halobetasol propionate (HP) 0.01%–tazarotene (TAZ) 0.045% lotion in a Hispanic patient population. Historically, clinical trials for psoriasis have enrolled low proportions of Hispanic patients and other patients with skin of color; in this analysis, the Hispanic population (115/418) represented 28% of the total study population and provided valuable insights.
Methods
Study Design
Two phase 3 randomized controlled trials were conducted to demonstrate the efficacy and safety of HP/TAZ lotion. Patients with a clinical diagnosis of moderate or severe localized psoriasis (N=418) were randomized to receive HP/TAZ lotion or vehicle (2:1 ratio) once daily for 8 weeks with a 4-week posttreatment follow-up.8,9 A post hoc analysis was conducted on data of the self-identified Hispanic population.
Assessments
Efficacy assessments included treatment success (at least a 2-grade improvement from baseline in the investigator global assessment [IGA] and a score of clear or almost clear) and impact on individual signs of psoriasis (at least a 2-grade improvement in erythema, plaque elevation, and scaling) at the target lesion. In addition, reduction in body surface area (BSA) was recorded, and an IGA×BSA score was calculated by multiplying IGA by BSA at each timepoint for each individual patient. A clinically meaningful improvement in disease severity (percentage of patients achieving a 75% reduction in IGA×BSA [IGA×BSA-75]) also was calculated.
Information on reported and observed adverse events (AEs) was obtained at each visit. The safety population included 112 participants (76 in the HP/TAZ group and 36 in the vehicle group).
Statistical Analysis
The statistical and analytical plan is detailed elsewhere9 and relevant to this post hoc analysis. No statistical analysis was carried out to compare data in the Hispanic population with either the overall study population or the non-Hispanic population.
Results
Overall, 115 Hispanic patients (27.5%) were enrolled (eFigure). Patients had a mean (standard deviation [SD]) age of 46.7 (13.12) years, and more than two-thirds were male (n=80, 69.6%).
Overall completion rates (80.0%) for Hispanic patients were similar to those in the overall study population, though there were more discontinuations in the vehicle group. The main reasons for treatment discontinuation among Hispanic patients were participant request (n=8, 7.0%), lost to follow-up (n=8, 7.0%), and AEs (n=4, 3.5%). Hispanic patients in this study had more severe disease—18.3% (n=21) had an IGA score of 4 compared to 13.5% (n=41) of non-Hispanic patients—and more severe erythema (19.1% vs 9.6%), plaque elevation (20.0% vs 10.2%), and scaling (15.7% vs 12.9%) compared to the non-Hispanic populations (Table).
Efficacy of HP/TAZ lotion in Hispanic patients was similar to the overall study populations,9 though maintenance of effect posttreatment appeared to be better. The incidence of treatment-related AEs also was lower.
Halobetasol propionate 0.01%–TAZ 0.045% lotion demonstrated statistically significant superiority based on treatment success compared to vehicle as early as week 4 (P=.034). By week 8, 39.3% of participants treated with HP/TAZ lotion achieved treatment success compared to 9.3% of participants in the vehicle group (P=.002)(Figure 1). Treatment success was maintained over the 4-week posttreatment period, whereby 40.5% of the HP/TAZ-treated participants were treatment successes at week 12 compared to only 4.1% of participants in the vehicle group (P<.001).
Improvements in psoriasis signs and symptoms at the target lesion were statistically significant compared to vehicle from week 2 (plaque elevation, P=.018) or week 4 (erythema, P=.004; scaling, P<.001)(Figure 2). By week 8, 46.8%, 58.1%, and 63.2% of participants showed at least a 2-grade improvement from baseline and were therefore treatment successes for erythema, plaque elevation, and scaling, respectively (all statistically significant [P<.001] compared to vehicle). The number of participants who achieved at least a 2-grade improvement in erythema with HP/TAZ lotion increased posttreatment from 46.8% to 53.0%.
Mean (SD) baseline BSA was 6.2 (3.07), and the mean (SD) size of the target lesion was 36.3 (21.85) cm2. Overall, BSA also was significantly reduced in participants treated with HP/TAZ lotion compared to vehicle. At week 8, the mean percentage change from baseline was —40.7% compared to an increase (+10.1%) in the vehicle group (P=.002)(Figure 3). Improvements in BSA were maintained posttreatment, whereas in the vehicle group, mean (SD) BSA had increased to 6.1 (4.64).
Halobetasol propionate 0.01%–TAZ 0.045% lotion achieved a 50.5% reduction from baseline IGA×BSA by week 8 compared to an 8.5% increase with vehicle (P<.001)(Figure 4). Differences in treatment groups were significant from week 2 (P=.016). Efficacy was maintained posttreatment, with a 50.6% reduction from baseline IGA×BSA at week 12 compared to an increase of 13.6% in the vehicle group (P<.001). Again, although results were similar to the overall study population at week 8 (50.5% vs 51.9%), maintenance of effect was better posttreatment (50.6% vs 46.6%).10
A clinically meaningful effect (IGA×BSA-75) was achieved in 39.7% of Hispanic participants treated with HP/TAZ lotion compared to 8.1% of participants treated with vehicle (P<.001) at week 8. The benefits were significantly different from week 4 and more participants maintained a clinically meaningful effect posttreatment (43.1% vs 7.1%, P<.001)(Figure 5).
For Hispanic participants overall, 34 participants reported AEs: 26 (34.2%) treated with HP/TAZ lotion and 8 (22.2%) treated with vehicle (eTable). There was 1 (1.3%) serious AE in the HP/TAZ group. Most of the AEs were mild or moderate, with approximately half being related to study treatment. The most common treatment-related AEs in Hispanic participants treated with HP/TAZ lotion were contact dermatitis (n=3, 3.9%) and skin atrophy (n=3, 3.9%) compared to contact dermatitis (n=14, 7.2%) and application-site pain (n=7, 3.6%) in the non-Hispanic population. Pruritus was the most common AE in Hispanic participants treated with vehicle.
Comment
The large number of Hispanic patients in the 2 phase 3 trials8,9 allowed for this valuable subgroup analysis on the topical treatment of Hispanic patients with plaque psoriasis. Validation of observed differences in maintenance of effect and tolerability warrant further study. Prior clinical studies in psoriasis have tended to enroll a small proportion of Hispanic patients without any post hoc analysis. For example, in a pooled analysis of 4 phase 3 trials with secukinumab, Hispanic patients accounted for only 16% of the overall population.11 In our analysis, the Hispanic cohort represented 28% of the overall study population of 2 phase 3 studies investigating the efficacy, safety, and tolerability of HP/TAZ lotion in patients with moderate to severe psoriasis.8,9 In addition, proportionately more Hispanic patients had severe disease (IGA of 4) or severe signs and symptoms of psoriasis (erythema, plaque elevation, and scaling) than the non-Hispanic population. This finding supports other studies that have suggested Hispanic patients with psoriasis tend to have more severe disease but also may reflect thresholds for seeking care.3-5
Halobetasol propionate 0.01%–TAZ 0.045% lotion was significantly more effective than vehicle for all efficacy assessments. In general, efficacy results with HP/TAZ lotion were similar to those reported in the overall phase 3 study populations over the 8-week treatment period. The only noticeable difference was in the posttreatment period. In the overall study population, efficacy was maintained over the 4-week posttreatment period in the HP/TAZ group. In the Hispanic subpopulation, there appeared to be continued improvement in the number of participants achieving treatment success (IGA and erythema), clinically meaningful success, and further reductions in BSA. Although there is a paucity of studies evaluating psoriasis therapies in Hispanic populations, data on etanercept and secukinumab have been published.6,11
Onset of effect also is an important aspect of treatment. In patients with skin of color, including patients of Hispanic ethnicity and higher Fitzpatrick skin phototypes, early clearance of lesions may help limit the severity and duration of postinflammatory pigment alteration. Improvements in IGA×BSA scores were significant compared to vehicle from week 2 (P=.016), and a clinically meaningful improvement with HP/TAZ lotion (IGA×BSA-75) was seen by week 4 (P=.024).
Halobetasol propionate 0.01%–TAZ 0.045% lotion was well tolerated, both in the 2 phase 3 studies and in the post hoc analysis of the Hispanic subpopulation. The incidence of skin atrophy (n=3, 3.9%) was more common vs the non-Hispanic population (n=2, 1.0%). Other common AEs—contact dermatitis, pruritus, and application-site pain—were more common in the non-Hispanic population.
A limitation of our analysis was that it was a post hoc analysis of the Hispanic participants. The phase 3 studies were not designed to specifically study the impact of treatment on ethnicity/race, though the number of Hispanic participants enrolled in the 2 studies was relatively high. The absence of Fitzpatrick skin phototypes in this data set is another limitation of this study.
Conclusion
Halobetasol propionate 0.01%–TAZ 0.045% lotion was associated with significant, rapid, and sustained reductions in disease severity in a Hispanic population with moderate to severe psoriasis that continued to show improvement posttreatment with good tolerability and safety.
Acknowledgments
We thank Brian Bulley, MSc (Konic Limited, United Kingdom), for assistance with the preparation of the manuscript. Ortho Dermatologics funded Konic’s activities pertaining to this manuscript.
- Rachakonda TD, Schupp CW, Armstrong AW. Psoriasis prevalence among adults in the United States. J Am Acad Dermatol. 2014;70:512-516.
- Davis SA, Narahari S, Feldman SR, et al. Top dermatologic conditions in patients of color: an analysis of nationally representative data. J Drugs Dermatol. 2012;11:466-473.
- Setta-Kaffetzi N, Navarini AA, Patel VM, et al. Rare pathogenic variants in IL36RN underlie a spectrum of psoriasis-associated pustular phenotypes. J Invest Dermatol. 2013;133:1366-1369.
- Yan D, Afifi L, Jeon C, et al. A cross-sectional study of the distribution of psoriasis subtypes in different ethno-racial groups. Dermatol Online J. 2018;24. pii:13030/qt5z21q4k2.
- Abrouk M, Lee K, Brodsky M, et al. Ethnicity affects the presenting severity of psoriasis. J Am Acad Dermatol. 2017;77:180-182.
- Shah SK, Arthur A, Yang YC, et al. A retrospective study to investigate racial and ethnic variations in the treatment of psoriasis with etanercept. J Drugs Dermatol. 2011;10:866-872.
- Alexis AF, Blackcloud P. Psoriasis in skin of color: epidemiology, genetics, clinical presentation, and treatment nuances. J Clin Aesthet Dermatol. 2014;7:16-24.
- Gold LS, Lebwohl MG, Sugarman JL, et al. Safety and efficacy of a fixed combination of halobetasol and tazarotene in the treatment of moderate-to-severe plaque psoriasis: results of 2 phase 3 randomized controlled trials. J Am Acad Dermatol. 2018;79:287-293.
- Sugarman JL, Weiss J, Tanghetti EA, et al. Safety and efficacy of a fixed combination halobetasol and tazarotene lotion in the treatment of moderate-to-severe plaque psoriasis: a pooled analysis of two phase 3 studies. J Drugs Dermatol. 2018;17:855-861.
- Blauvelt A, Green LJ, Lebwohl MG, et al. Efficacy of a once-daily fixed combination halobetasol (0.01%) and tazarotene (0.045%) lotion in the treatment of localized moderate-to-severe plaque psoriasis. J Drugs Dermatol. 2019;18:297-299.
- Adsit S, Zaldivar ER, Sofen H, et al. Secukinumab is efficacious and safe in Hispanic patients with moderate-to-severe plaque psoriasis: pooled analysis of four phase 3 trials. Adv Ther. 2017;34:1327-1339.
Practice Points
- Although psoriasis is a common inflammatory disease, data in the Hispanic population are sparse and disease may be more severe.
- A recent clinical investigation with halobetasol propionate 0.01%–tazarotene 0.045% lotion included a number of Hispanic patients, affording an ideal opportunity to provide important data on this population.
- This fixed-combination therapy was associated with significant, rapid, and sustained reductions in disease severity in a Hispanic population with moderate to severe psoriasis that continued to show improvement posttreatment with good tolerability and safety.
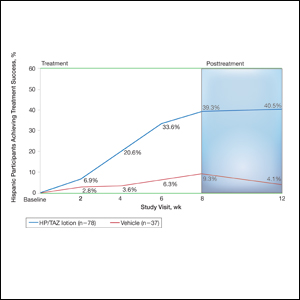
Blistering Disease During the Treatment of Chronic Hepatitis C With Ledipasvir/Sofosbuvir (FULL)
Porphyria cutanea tarda (PCT) is the most common type of porphyria. The accumulation of porphyrin in various organ systems results from a deficiency of uroporphyrinogen decarboxylase (UROD).1-3 Chronic hepatitis C virus (HCV) causes a hepatic decrease in hepcidin production, resulting in increased iron absorption. Iron loading and increased oxidative stress in the liver leads to nonporphyrin inhibition of UROD production and to oxidation of porphyrinogens to porphyrins.4 This in turn leads to accumulation of uroporphyrins and carboxylated metabolites that can be detected in urine.4
Signs of PCT include blisters, vesicles, and possibly milia developing on sun-exposed areas of the skin, such as the face, forearms, and dorsal hands.4 Case reports have demonstrated a resolution of PCT in patients with chronic HCV with treatment with direct-acting antivirals (DAAs), such as ledipasvir/sofosbuvir.1,3 However, here we present 2 cases of patients who developed blistering diseases during treatment of chronic HCV with ledipasvir/sofosbuvir. Neither demonstrated complete resolution of symptoms during the treatment regimen.
Cases
Patient 1
A 63-year-old white male with a history of chronic HCV (genotype 1a), bipolar disorder, hyperlipidemia, tobacco dependence, and cirrhosis (F4 by elastography) presented with minimally to moderately painful blisters on his bilateral dorsal hands that had developed around weeks 8 to 9 of treatment with ledipasvir/sofosbuvir. The patient reported that no new blisters had appeared following completion of 12 weeks of treatment and that his current blisters were in various stages of healing. He reported alcohol use of 1 to 2 twelve-ounce beers daily and no history of dioxin exposure. His medications included doxepin, hydralazine, hydrochlorothiazide, quetiapine, folic acid, and thiamine. His hepatitis C viral load was 440,000 IU/mL prior to treatment. Tests for hepatitis B surface antigen and HIV antibodies were negative. His iron level was 135 µg/dL, total iron-binding capacity (TIBC) was 323 µg/dL, and ferritin was 299.0 ng/mL. His HFE
A physical examination on presentation revealed erosions with overlying hemorrhagic crusts on the bilateral dorsal hands (Figure). 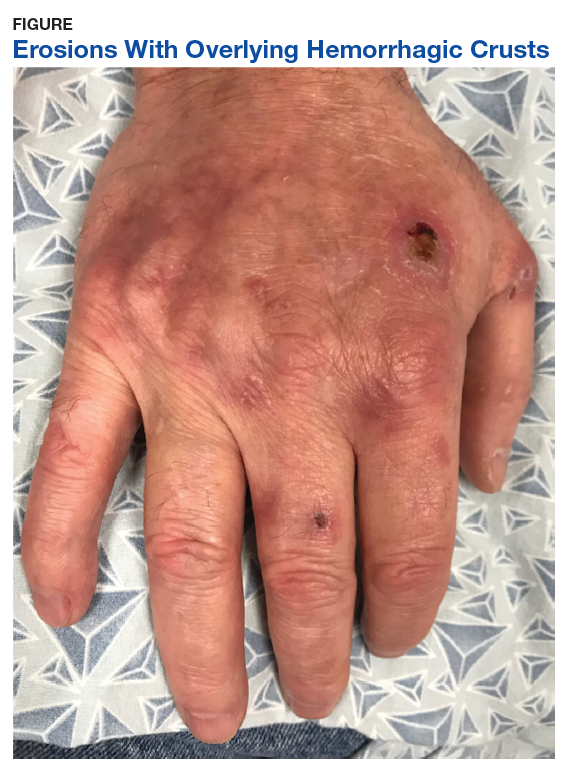
At the 4-month follow-up, the patient reported no new blister formations. A physical examination revealed well-healed scars and several clustered milia on bilateral dorsal hands with no active vesicles or bullae noted.
Patient 2
An African American male aged 63 years presented with a 1-month history of moderately painful blisters on his bilateral dorsal hands during treatment of chronic HCV (genotype 1a) with ledipasvir/sofosbuvir. His medical history included gout, tobacco and alcohol addiction, osteoarthritis, and hepatic fibrosis (F3 by elastography). The patient’s medications included allopurinol, lisinopril, and hydrochlorothiazide. He reported no history of dioxin exposure. On the day of presentation, he was on week 9 of the 12-week treatment ledipasvir/sofosbuvir regimen. Laboratory results included an initial HCV viral load of 1,618,605 IU/mL. Tests for hepatitis B surface antigen and HIV antibodies were negative. His iron was 191 µg/dL, TIBC 388 µg/dL, and ferritin 459.0 ng/mL. After 4 weeks of treatment, the patient’s hepatitis C viral load was undetectable.
A physical examination revealed several resolving erosions to his bilateral dorsal hands, some of which had overlying crusting along with one small hemorrhagic vesicle on the right dorsal hand. A punch biopsy of the hemorrhagic vesicle was performed and demonstrated a cell-poor subepidermal blister with festooning of the dermal papilla. A direct immunofluorescence study showed immunoglobulin (Ig) G fluorescence along the dermal-epidermal junction and within vessel walls in the superficial dermis. Weak IgM and C3 fluorescence also was noted within vessel walls in the superficial dermis. All of the patient findings and history were consistent with PCT, although pseudo-PCT also was a consideration. A 24-hour urine sample yielded negative results for porphobilinogen. Urine porphyrin test results were not available, leading to a presumptive histological diagnosis of PCT.
The patient completed 11 of the prescribed 12 weeks of ledipasvir/sofosbuvir. The blisters resolved shortly thereafter.
Discussion
PCT has a well-established association with chronic HCV infection.4 We present 2 cases of a blistering disease clinically and histologically compatible with PCT that developed in patients only after initiation of treatment for chronic HCV with ledipasvir/sofosbuvir. One case was confirmed as PCT on the basis of compatible histopathologic findings and a urine porphyrin assay that showed elevated levels of uroporphyrins and carboxylated metabolites. The second case was clinically and histologically suggestive of PCT but not confirmed by urine porphyrin testing. In both patients, after 8 to 9 weeks of a 12-week course of antiviral therapy, the blistering lesions were noted but appeared to be resolving, and no new lesions were noted after discontinuation of therapy. It appeared that the antiviral treatment temporally triggered the initiation of the blistering skin disease, and as the chronic HCV infection cleared after treatment, the blistering lesions also began to resolve.
Mechanistically, it is known that the virally-induced hepatic damage leads to inhibition of uroporphyrinogen decarboxylase, and the subsequent oxidation of porphyrinogens to porphyrins. Cofactors such as HIV infection also may contribute to development of PCT.5
De novo PCT has been documented during therapy using interferon and ribavirin.6 The hemolytic anemia and increased hepatic iron were implicated as potential etiologies.6 Patients with HCV and PCT treated with the newer direct-acting antiviral therapies have been described to have experienced improvement in PCT symptoms.3
Although there were rare reports of deterioration in renal and liver function,7 reactivation of HBV infection,8 and Stevens-Johnson syndrome9 with antiviral therapy, these complications were not observed in these patients. Both patients also had successful resolution of HCV infection, and by completion of the antiviral therapy, the blistering also resolved.
Conclusion
PCT is an extrahepatic manifestation of HCV infection. Health care providers should be aware of the association of chronic HCV infection with PCT. The findings of PCT should not result in the delay or discontinuation of antiviral therapy.
1. Combalia A, To-Figueras J, Laguno M, Martinez-Rebollar M, Aguilera P. Direct-acting antivirals for hepatitis C virus induce a rapid clinical and biochemical remission of porphyria cutanea tarda. Br J Dermatol. 2017;177(5):e183-e184.
2. Younossi Z, Park H, Henry L, Adeyemi A, Stepanova M. Extrahepatic manifestations of hepatitis C: a meta-analysis of prevalence, quality of life, and economic burden. Gastroenterology. 2016;150(7):1599-1608.
3. Tong Y, Song YK, Tyring S. Resolution of porphyria cutanea tarda in patients with hepatitis C following ledipasvir/sofosbuvir combination therapy. JAMA Dermatol. 2016;152(12):1393-1395.
4. Ryan Caballes F, Sendi H, Bonkovsky H. Hepatitis C, porphyria cutanea tarda and liver iron: an update. Liver Int. 2012;32(6):880-893.
5. Quansah R, Cooper CJ, Said S, Bizet J, Paez D, Hernandez GT. Hepatitis C- and HIV-induced porphyria cutanea tarda. Am J Case Rep. 2014;15:35-40.
6. Azim J, McCurdy H, Moseley RH. Porphyria cutanea tarda as a complication of therapy for chronic hepatitis C. World J Gastroenterol. 2008;14(38):5913-5915.
7. Ahmed M. Harvoni-induced deterioration of renal and liver function. Adv Res Gastroentero Hepatol. 2017;2(3):555588.
8. De Monte A, Courion J, Anty R, et al. Direct-acting antiviral treatment in adults infected with hepatitis C virus: reactivation of hepatitis B virus coinfection as a further challenge. J Clin Virol. 2016;78:27-30.
9. Verma N, Singh S, Sawatkar G, Singh V. Sofosbuvir induced Steven Johnson Syndrome in a patient with hepatitis C virus-related cirrhosis. Hepatol Commun. 2017;2(1):16-20.
Porphyria cutanea tarda (PCT) is the most common type of porphyria. The accumulation of porphyrin in various organ systems results from a deficiency of uroporphyrinogen decarboxylase (UROD).1-3 Chronic hepatitis C virus (HCV) causes a hepatic decrease in hepcidin production, resulting in increased iron absorption. Iron loading and increased oxidative stress in the liver leads to nonporphyrin inhibition of UROD production and to oxidation of porphyrinogens to porphyrins.4 This in turn leads to accumulation of uroporphyrins and carboxylated metabolites that can be detected in urine.4
Signs of PCT include blisters, vesicles, and possibly milia developing on sun-exposed areas of the skin, such as the face, forearms, and dorsal hands.4 Case reports have demonstrated a resolution of PCT in patients with chronic HCV with treatment with direct-acting antivirals (DAAs), such as ledipasvir/sofosbuvir.1,3 However, here we present 2 cases of patients who developed blistering diseases during treatment of chronic HCV with ledipasvir/sofosbuvir. Neither demonstrated complete resolution of symptoms during the treatment regimen.
Cases
Patient 1
A 63-year-old white male with a history of chronic HCV (genotype 1a), bipolar disorder, hyperlipidemia, tobacco dependence, and cirrhosis (F4 by elastography) presented with minimally to moderately painful blisters on his bilateral dorsal hands that had developed around weeks 8 to 9 of treatment with ledipasvir/sofosbuvir. The patient reported that no new blisters had appeared following completion of 12 weeks of treatment and that his current blisters were in various stages of healing. He reported alcohol use of 1 to 2 twelve-ounce beers daily and no history of dioxin exposure. His medications included doxepin, hydralazine, hydrochlorothiazide, quetiapine, folic acid, and thiamine. His hepatitis C viral load was 440,000 IU/mL prior to treatment. Tests for hepatitis B surface antigen and HIV antibodies were negative. His iron level was 135 µg/dL, total iron-binding capacity (TIBC) was 323 µg/dL, and ferritin was 299.0 ng/mL. His HFE
A physical examination on presentation revealed erosions with overlying hemorrhagic crusts on the bilateral dorsal hands (Figure).
At the 4-month follow-up, the patient reported no new blister formations. A physical examination revealed well-healed scars and several clustered milia on bilateral dorsal hands with no active vesicles or bullae noted.
Patient 2
An African American male aged 63 years presented with a 1-month history of moderately painful blisters on his bilateral dorsal hands during treatment of chronic HCV (genotype 1a) with ledipasvir/sofosbuvir. His medical history included gout, tobacco and alcohol addiction, osteoarthritis, and hepatic fibrosis (F3 by elastography). The patient’s medications included allopurinol, lisinopril, and hydrochlorothiazide. He reported no history of dioxin exposure. On the day of presentation, he was on week 9 of the 12-week treatment ledipasvir/sofosbuvir regimen. Laboratory results included an initial HCV viral load of 1,618,605 IU/mL. Tests for hepatitis B surface antigen and HIV antibodies were negative. His iron was 191 µg/dL, TIBC 388 µg/dL, and ferritin 459.0 ng/mL. After 4 weeks of treatment, the patient’s hepatitis C viral load was undetectable.
A physical examination revealed several resolving erosions to his bilateral dorsal hands, some of which had overlying crusting along with one small hemorrhagic vesicle on the right dorsal hand. A punch biopsy of the hemorrhagic vesicle was performed and demonstrated a cell-poor subepidermal blister with festooning of the dermal papilla. A direct immunofluorescence study showed immunoglobulin (Ig) G fluorescence along the dermal-epidermal junction and within vessel walls in the superficial dermis. Weak IgM and C3 fluorescence also was noted within vessel walls in the superficial dermis. All of the patient findings and history were consistent with PCT, although pseudo-PCT also was a consideration. A 24-hour urine sample yielded negative results for porphobilinogen. Urine porphyrin test results were not available, leading to a presumptive histological diagnosis of PCT.
The patient completed 11 of the prescribed 12 weeks of ledipasvir/sofosbuvir. The blisters resolved shortly thereafter.
Discussion
PCT has a well-established association with chronic HCV infection.4 We present 2 cases of a blistering disease clinically and histologically compatible with PCT that developed in patients only after initiation of treatment for chronic HCV with ledipasvir/sofosbuvir. One case was confirmed as PCT on the basis of compatible histopathologic findings and a urine porphyrin assay that showed elevated levels of uroporphyrins and carboxylated metabolites. The second case was clinically and histologically suggestive of PCT but not confirmed by urine porphyrin testing. In both patients, after 8 to 9 weeks of a 12-week course of antiviral therapy, the blistering lesions were noted but appeared to be resolving, and no new lesions were noted after discontinuation of therapy. It appeared that the antiviral treatment temporally triggered the initiation of the blistering skin disease, and as the chronic HCV infection cleared after treatment, the blistering lesions also began to resolve.
Mechanistically, it is known that the virally-induced hepatic damage leads to inhibition of uroporphyrinogen decarboxylase, and the subsequent oxidation of porphyrinogens to porphyrins. Cofactors such as HIV infection also may contribute to development of PCT.5
De novo PCT has been documented during therapy using interferon and ribavirin.6 The hemolytic anemia and increased hepatic iron were implicated as potential etiologies.6 Patients with HCV and PCT treated with the newer direct-acting antiviral therapies have been described to have experienced improvement in PCT symptoms.3
Although there were rare reports of deterioration in renal and liver function,7 reactivation of HBV infection,8 and Stevens-Johnson syndrome9 with antiviral therapy, these complications were not observed in these patients. Both patients also had successful resolution of HCV infection, and by completion of the antiviral therapy, the blistering also resolved.
Conclusion
PCT is an extrahepatic manifestation of HCV infection. Health care providers should be aware of the association of chronic HCV infection with PCT. The findings of PCT should not result in the delay or discontinuation of antiviral therapy.
1. Combalia A, To-Figueras J, Laguno M, Martinez-Rebollar M, Aguilera P. Direct-acting antivirals for hepatitis C virus induce a rapid clinical and biochemical remission of porphyria cutanea tarda. Br J Dermatol. 2017;177(5):e183-e184.
2. Younossi Z, Park H, Henry L, Adeyemi A, Stepanova M. Extrahepatic manifestations of hepatitis C: a meta-analysis of prevalence, quality of life, and economic burden. Gastroenterology. 2016;150(7):1599-1608.
3. Tong Y, Song YK, Tyring S. Resolution of porphyria cutanea tarda in patients with hepatitis C following ledipasvir/sofosbuvir combination therapy. JAMA Dermatol. 2016;152(12):1393-1395.
4. Ryan Caballes F, Sendi H, Bonkovsky H. Hepatitis C, porphyria cutanea tarda and liver iron: an update. Liver Int. 2012;32(6):880-893.
5. Quansah R, Cooper CJ, Said S, Bizet J, Paez D, Hernandez GT. Hepatitis C- and HIV-induced porphyria cutanea tarda. Am J Case Rep. 2014;15:35-40.
6. Azim J, McCurdy H, Moseley RH. Porphyria cutanea tarda as a complication of therapy for chronic hepatitis C. World J Gastroenterol. 2008;14(38):5913-5915.
7. Ahmed M. Harvoni-induced deterioration of renal and liver function. Adv Res Gastroentero Hepatol. 2017;2(3):555588.
8. De Monte A, Courion J, Anty R, et al. Direct-acting antiviral treatment in adults infected with hepatitis C virus: reactivation of hepatitis B virus coinfection as a further challenge. J Clin Virol. 2016;78:27-30.
9. Verma N, Singh S, Sawatkar G, Singh V. Sofosbuvir induced Steven Johnson Syndrome in a patient with hepatitis C virus-related cirrhosis. Hepatol Commun. 2017;2(1):16-20.
Contrasting qSOFA and SIRS Criteria for Early Sepsis Identification in a Veteran Population (FULL)
Sepsis is a major public health concern: 10% of patients with sepsis die, and mortality quadruples with progression to septic shock.1 Systemic inflammatory response syndrome (SIRS) criteria, originally published in 1992, are commonly used to detect sepsis, but as early as 2001, these criteria were recognized as lacking specificity.2 Nonetheless, the use of SIRS criteria has persisted in practice. Sepsis was redefined in Sepsis-3 (2016) to guide earlier and more appropriate identification and treatment, which has been shown to greatly improve patient outcomes.1,3 Key recommendations in Sepsis 3 included eliminating SIRS criteria, defining organ dysfunction by the Sequential Organ Failure Assessment (SOFA) score, and introducing the quick SOFA (qSOFA) score.1
The qSOFA combines 3 clinical variables to provide a rapid, simple bedside score that measures the likelihood of poor outcomes, such as admission to an intensive care unit (ICU) or mortality in adults with suspected infection.1,3 The qSOFA score is intended to aid healthcare professionals in more timely stratification of those patients who need escalated care to prevent deterioration.1 The assessment also has been explored as a screening tool for sepsis in clinical practice; however, limited data exists concerning the comparative utility of qSOFA and SIRS in this capacity, and study results are inconsistent.4-6
The most important attribute of a screening tool is high sensitivity, but high specificity also is desired. The qSOFA could supplant SIRS as a screening tool for sepsis if it maintained similarly high sensitivity but achieved superior specificity. Therefore, our primary objective for this study was to determine the effectiveness of qSOFA as a screening assessment for sepsis in the setting of a general inpatient medicine service by contrasting the sensitivity and specificity of qSOFA with SIRS in predicting sepsis, using a retrospective chart review design.
Methods
Administrative data from the Department of Veterans Affairs (VA) Corporate Data Warehouse were accessed via the VA Informatics and Computing Infrastructure (VINCI) and used to identify VA inpatient admissions and obtain the laboratory and vital sign data necessary to calculate SIRS, qSOFA, and SOFA scores. The data were supplemented by manual review of VA health records to obtain information that was not readily available in administrative records, including septic shock outcomes and laboratory and vital sign data obtained in the ICU. This study was approved by the institutional review board at the University of Iowa and the research and development committee at the Iowa City VA Medical Center (ICVAMC).
Patients
The study population included veterans admitted to the nonsurgical medicine unit at ICVAMC between August 1, 2014 and August 1, 2016 who were transferred to an ICU after admission; direct ICU admissions were not included as the qSOFA has been shown in studies to be more beneficial and offer better predictive validity outside the ICU. Excluding these direct admissions prevented any potential skewing of the data. To control for possible selection bias, veterans also were excluded if they transferred from another facility, were admitted under observation status, or if they had been admitted within the prior 30 days. These patients may have been more critically ill than those who presented directly to our facility and any prior treatment could affect the clinical status of the patient and assessment for sepsis at the time of presentation to the VA. Veterans were further required to have evidence of suspected infection based on manual review of the health record, which was determined by receipt of an antibiotic relevant to the empiric treatment of sepsis within 48 hours of admission.
Sepsis and Septic Shock Assessment Tools
As outlined in the Sepsis-3 guidelines, sepsis was defined as suspected or confirmed infection with an acute change in the SOFA score of ≥ 2 points, which is assumed to be 0 in those not known to have preexisting dysfunction.1 The SOFA score includes variables from the respiratory, coagulation, hepatic, cardiovascular, renal, and central nervous systems.1 Septic shock was defined as vasopressor administration and a serum lactic acid level > 2 mmol/L occurring up to 24 hours apart and within 3 days of the first antibiotic dose administered.
The SIRS assessment includes 4 clinical variables (temperature, heart rate, respiratory rate, and white blood cell count) while qSOFA is comprised of 3 variables (respiratory rate, systolic blood pressure, and altered mental status).1 With both assessments, a score ≥ 2 is considered positive, which indicates increased risk for sepsis in patients with suspected infection.1 In keeping with existing studies, qSOFA and SIRS assessments were scored using maximum values found within 48 hours before and 24 hours after the first administered antibiotic dose.3
Outcomes
The primary outcome variable was the presence of sepsis in adults with evidence of infection within 48 hours of admission. Secondary outcome measures included 30-day mortality and septic shock.
Performance between the SIRS and qSOFA assessments was contrasted using sensitivity, specificity, and positive and negative predictive value measurements. Associations of qSOFA and SIRS with septic shock and 30-day mortality were evaluated using a 2-tailed Fisher’s exact test with a threshold of α = 0.05 to determine statistical significance.
Results
The study sample of 481 veterans had a mean age of 67.4 years, 94% were male, and 91.1% were white (Table 1). 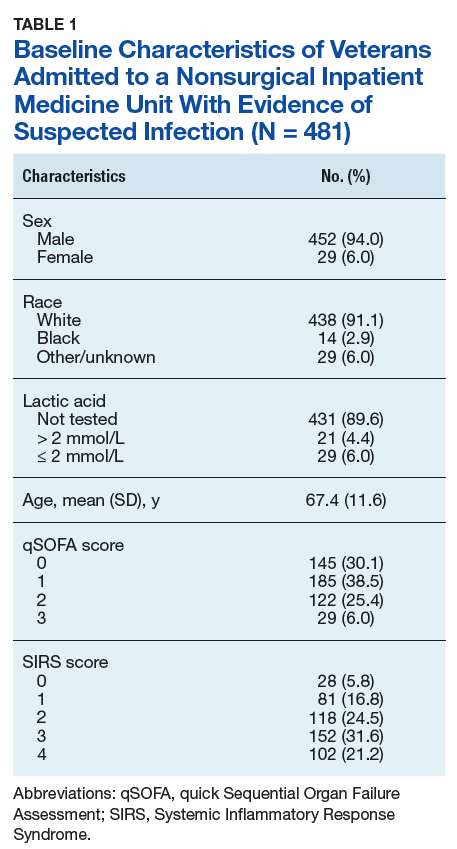
Scores for qSOFA, but not SIRS, were significantly associated with septic shock (Fisher’s exact test; qSOFA: P = .009; SIRS: P = .58) (Table 3). 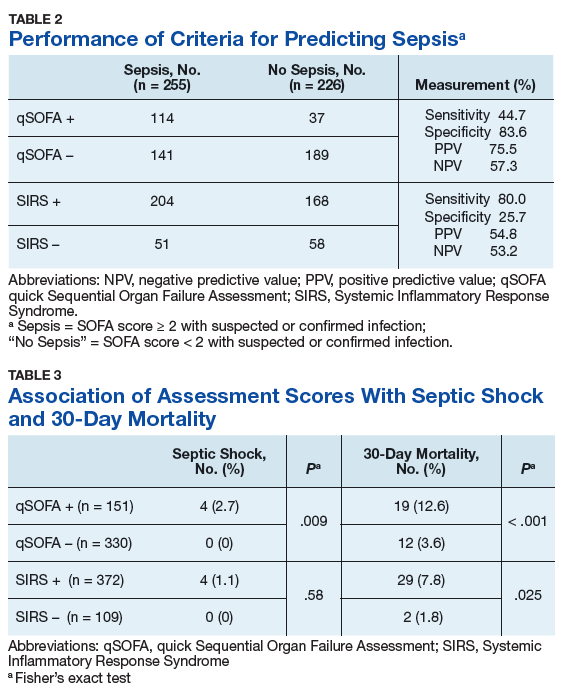
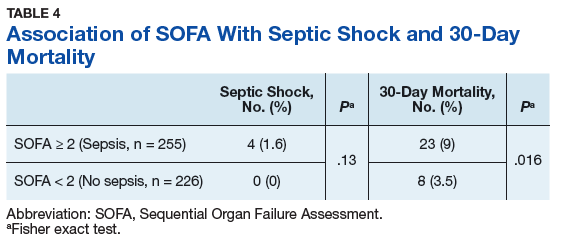
Discussion
High sensitivity is critical for a sepsis screening tool. To be clinically useful, it has been suggested that biomarkers predicting poor outcomes for sepsis should have a sensitivity of > 80%.4 Although qSOFA demonstrated greater specificity than SIRS in our study (83.6% vs 25.7%), qSOFA showed lower sensitivity (44.7% vs 80.0%), which resulted in a greater potential for false negatives; 55.3% of those with sepsis would go undetected. Therefore, our study does not support qSOFA as a better screening assessment than SIRS for sepsis in the veteran population.
Most studies concur with our findings of low sensitivity and high specificity of qSOFA. In a systematic review and meta-analysis, Serafim and colleagues identified 10 studies published after Sepsis-3 that reported sensitivity or specificity of qSOFA and SIRS for sepsis diagnosis.5 Seven of the 10 studies reported sensitivities and favored SIRS in the diagnosis of sepsis (Relative risk: 1.32; 95% CI: 0.40-2.24; P < .0001; I2 = 100%). The authors noted that substantial heterogeneity among studies, including differences in study design, sample size, and criteria for determination of infection, was an important limitation. In addition, most studies that contrast qSOFA and SIRS center on prognostic value in predicting mortality, rather than as a screening test for a diagnosis of sepsis.
We concluded SIRS was more sensitive and thus superior to qSOFA when used as a screening tool for sepsis but conceded that more prospective and homogenous investigations were necessary. To our knowledge, only 1 published study has deviated from this conclusion and reported comparable sensitivity between SIRS (92%) and qSOFA (90%).6 Our study adds to existing literature as it is the first conducted in a veteran population. Additionally, we performed our investigation in a general medicine population with methods similar to existing literature, including the key study validating clinical criteria for sepsis by Seymour and colleagues.3
Limitations
This study is not without limitations, including potential misclassification of cases if essential data points were not available during data collection via health record review or the data points were not representative of a true change from baseline (eg, the Glasgow Coma Scale score for altered mental status in the qSOFA or the SOFA score for organ dysfunction). Generalizability of the results also may be limited due to our retrospective, single-center design and characteristics typical of a veteran population (eg, older, white males). Additionally, many veterans were excluded from the study if they transferred from another facility. These veterans may have been more critically ill than those who presented directly to our facility, which possibly introduced selection bias.
Conclusion
Our findings do not support use of the qSOFA as a suitable replacement for SIRS as a sepsis screening tool among patients with suspected infection in the general medicine inpatient setting. The clinical concern with SIRS is that unfavorable specificity leads to unnecessary antibiotic exposure among patients who are falsely positive. While qSOFA has demonstrated higher specificity, its use would cause many sepsis cases to go undetected due to the technique’s low sensitivity. Frequent false negative qSOFA results could thus serve to impede, rather than enhance, early recognition and intervention for sepsis.
The ideal sepsis screening tool is rapid and possesses high sensitivity and specificity to promptly identify and manage sepsis and avert unfavorable outcomes such as septic shock and death. While the SIRS criteria do not satisfy these ideal features, its measurement characteristics are more suitable for the application of sepsis screening than the qSOFA and should thus remain the standard tool in this setting. Future prospectively designed studies with more uniform methodologies are necessary to ascertain the most effective approach to identify sepsis for which novel screening approaches with more clinically suitable measurement properties are greatly needed.
Acknowledgements
This research was supported by the Iowa City VA Health Care System, Department of Pharmacy Services. Additional support was provided by the Health Services Research and Development Service, Department of Veterans Affairs.
1. Singer M, Deutchman CS, Seymour CW, et al. The Third International Consensus Definitions for Sepsis and Septic Shock (Sepsis-3). JAMA. 2016;315(8):801-810.
2. Levy MM, Fink MP, Marshall JC, et al; SCCM/ESICM/ACCP/ATS/SIS. 2001 SCCM/ESICM/ACCP/ATS/SIS International Sepsis Definitions Conference. Crit Care Med. 2003;31(4):1250-1256.
3. Seymour CW, Liu VX, Iwashyna TJ, et al. Assessment of clinical criteria for sepsis: for the Third International Consensus Definitions for Sepsis and Septic Shock (Sepsis-3). JAMA. 2016;315(8):762-774.
4. Giamorellos-Bourboulis EJ, Tsaganos T, Tsangaris I, et al; Hellenic Sepsis Study Group. Validation of the new Sepsis-3 definitions: proposal for improvement of early risk identification. Clin Microbiol Infect. 2016;23(2):104-109.
5. Serafim R, Gomes JA, Salluh J, Póvoa P. A Comparison of the Quick-SOFA and Systemic Inflammatory Response Syndrome criteria for the diagnosis of sepsis and prediction of mortality: a systematic review and meta-analysis. Chest. 2018;153(3):646-655.
6. Forward E, Konecny P, Burston J, Adhikari S, Doolan H, Jensen T. Predictive validity of qSOFA criteria for sepsis in non-ICU patients. Intensive Care Med. 2017;43(6):945-946.
Sepsis is a major public health concern: 10% of patients with sepsis die, and mortality quadruples with progression to septic shock.1 Systemic inflammatory response syndrome (SIRS) criteria, originally published in 1992, are commonly used to detect sepsis, but as early as 2001, these criteria were recognized as lacking specificity.2 Nonetheless, the use of SIRS criteria has persisted in practice. Sepsis was redefined in Sepsis-3 (2016) to guide earlier and more appropriate identification and treatment, which has been shown to greatly improve patient outcomes.1,3 Key recommendations in Sepsis 3 included eliminating SIRS criteria, defining organ dysfunction by the Sequential Organ Failure Assessment (SOFA) score, and introducing the quick SOFA (qSOFA) score.1
The qSOFA combines 3 clinical variables to provide a rapid, simple bedside score that measures the likelihood of poor outcomes, such as admission to an intensive care unit (ICU) or mortality in adults with suspected infection.1,3 The qSOFA score is intended to aid healthcare professionals in more timely stratification of those patients who need escalated care to prevent deterioration.1 The assessment also has been explored as a screening tool for sepsis in clinical practice; however, limited data exists concerning the comparative utility of qSOFA and SIRS in this capacity, and study results are inconsistent.4-6
The most important attribute of a screening tool is high sensitivity, but high specificity also is desired. The qSOFA could supplant SIRS as a screening tool for sepsis if it maintained similarly high sensitivity but achieved superior specificity. Therefore, our primary objective for this study was to determine the effectiveness of qSOFA as a screening assessment for sepsis in the setting of a general inpatient medicine service by contrasting the sensitivity and specificity of qSOFA with SIRS in predicting sepsis, using a retrospective chart review design.
Methods
Administrative data from the Department of Veterans Affairs (VA) Corporate Data Warehouse were accessed via the VA Informatics and Computing Infrastructure (VINCI) and used to identify VA inpatient admissions and obtain the laboratory and vital sign data necessary to calculate SIRS, qSOFA, and SOFA scores. The data were supplemented by manual review of VA health records to obtain information that was not readily available in administrative records, including septic shock outcomes and laboratory and vital sign data obtained in the ICU. This study was approved by the institutional review board at the University of Iowa and the research and development committee at the Iowa City VA Medical Center (ICVAMC).
Patients
The study population included veterans admitted to the nonsurgical medicine unit at ICVAMC between August 1, 2014 and August 1, 2016 who were transferred to an ICU after admission; direct ICU admissions were not included as the qSOFA has been shown in studies to be more beneficial and offer better predictive validity outside the ICU. Excluding these direct admissions prevented any potential skewing of the data. To control for possible selection bias, veterans also were excluded if they transferred from another facility, were admitted under observation status, or if they had been admitted within the prior 30 days. These patients may have been more critically ill than those who presented directly to our facility and any prior treatment could affect the clinical status of the patient and assessment for sepsis at the time of presentation to the VA. Veterans were further required to have evidence of suspected infection based on manual review of the health record, which was determined by receipt of an antibiotic relevant to the empiric treatment of sepsis within 48 hours of admission.
Sepsis and Septic Shock Assessment Tools
As outlined in the Sepsis-3 guidelines, sepsis was defined as suspected or confirmed infection with an acute change in the SOFA score of ≥ 2 points, which is assumed to be 0 in those not known to have preexisting dysfunction.1 The SOFA score includes variables from the respiratory, coagulation, hepatic, cardiovascular, renal, and central nervous systems.1 Septic shock was defined as vasopressor administration and a serum lactic acid level > 2 mmol/L occurring up to 24 hours apart and within 3 days of the first antibiotic dose administered.
The SIRS assessment includes 4 clinical variables (temperature, heart rate, respiratory rate, and white blood cell count) while qSOFA is comprised of 3 variables (respiratory rate, systolic blood pressure, and altered mental status).1 With both assessments, a score ≥ 2 is considered positive, which indicates increased risk for sepsis in patients with suspected infection.1 In keeping with existing studies, qSOFA and SIRS assessments were scored using maximum values found within 48 hours before and 24 hours after the first administered antibiotic dose.3
Outcomes
The primary outcome variable was the presence of sepsis in adults with evidence of infection within 48 hours of admission. Secondary outcome measures included 30-day mortality and septic shock.
Performance between the SIRS and qSOFA assessments was contrasted using sensitivity, specificity, and positive and negative predictive value measurements. Associations of qSOFA and SIRS with septic shock and 30-day mortality were evaluated using a 2-tailed Fisher’s exact test with a threshold of α = 0.05 to determine statistical significance.
Results
The study sample of 481 veterans had a mean age of 67.4 years, 94% were male, and 91.1% were white (Table 1).
Scores for qSOFA, but not SIRS, were significantly associated with septic shock (Fisher’s exact test; qSOFA: P = .009; SIRS: P = .58) (Table 3).
Discussion
High sensitivity is critical for a sepsis screening tool. To be clinically useful, it has been suggested that biomarkers predicting poor outcomes for sepsis should have a sensitivity of > 80%.4 Although qSOFA demonstrated greater specificity than SIRS in our study (83.6% vs 25.7%), qSOFA showed lower sensitivity (44.7% vs 80.0%), which resulted in a greater potential for false negatives; 55.3% of those with sepsis would go undetected. Therefore, our study does not support qSOFA as a better screening assessment than SIRS for sepsis in the veteran population.
Most studies concur with our findings of low sensitivity and high specificity of qSOFA. In a systematic review and meta-analysis, Serafim and colleagues identified 10 studies published after Sepsis-3 that reported sensitivity or specificity of qSOFA and SIRS for sepsis diagnosis.5 Seven of the 10 studies reported sensitivities and favored SIRS in the diagnosis of sepsis (Relative risk: 1.32; 95% CI: 0.40-2.24; P < .0001; I2 = 100%). The authors noted that substantial heterogeneity among studies, including differences in study design, sample size, and criteria for determination of infection, was an important limitation. In addition, most studies that contrast qSOFA and SIRS center on prognostic value in predicting mortality, rather than as a screening test for a diagnosis of sepsis.
We concluded SIRS was more sensitive and thus superior to qSOFA when used as a screening tool for sepsis but conceded that more prospective and homogenous investigations were necessary. To our knowledge, only 1 published study has deviated from this conclusion and reported comparable sensitivity between SIRS (92%) and qSOFA (90%).6 Our study adds to existing literature as it is the first conducted in a veteran population. Additionally, we performed our investigation in a general medicine population with methods similar to existing literature, including the key study validating clinical criteria for sepsis by Seymour and colleagues.3
Limitations
This study is not without limitations, including potential misclassification of cases if essential data points were not available during data collection via health record review or the data points were not representative of a true change from baseline (eg, the Glasgow Coma Scale score for altered mental status in the qSOFA or the SOFA score for organ dysfunction). Generalizability of the results also may be limited due to our retrospective, single-center design and characteristics typical of a veteran population (eg, older, white males). Additionally, many veterans were excluded from the study if they transferred from another facility. These veterans may have been more critically ill than those who presented directly to our facility, which possibly introduced selection bias.
Conclusion
Our findings do not support use of the qSOFA as a suitable replacement for SIRS as a sepsis screening tool among patients with suspected infection in the general medicine inpatient setting. The clinical concern with SIRS is that unfavorable specificity leads to unnecessary antibiotic exposure among patients who are falsely positive. While qSOFA has demonstrated higher specificity, its use would cause many sepsis cases to go undetected due to the technique’s low sensitivity. Frequent false negative qSOFA results could thus serve to impede, rather than enhance, early recognition and intervention for sepsis.
The ideal sepsis screening tool is rapid and possesses high sensitivity and specificity to promptly identify and manage sepsis and avert unfavorable outcomes such as septic shock and death. While the SIRS criteria do not satisfy these ideal features, its measurement characteristics are more suitable for the application of sepsis screening than the qSOFA and should thus remain the standard tool in this setting. Future prospectively designed studies with more uniform methodologies are necessary to ascertain the most effective approach to identify sepsis for which novel screening approaches with more clinically suitable measurement properties are greatly needed.
Acknowledgements
This research was supported by the Iowa City VA Health Care System, Department of Pharmacy Services. Additional support was provided by the Health Services Research and Development Service, Department of Veterans Affairs.
1. Singer M, Deutchman CS, Seymour CW, et al. The Third International Consensus Definitions for Sepsis and Septic Shock (Sepsis-3). JAMA. 2016;315(8):801-810.
2. Levy MM, Fink MP, Marshall JC, et al; SCCM/ESICM/ACCP/ATS/SIS. 2001 SCCM/ESICM/ACCP/ATS/SIS International Sepsis Definitions Conference. Crit Care Med. 2003;31(4):1250-1256.
3. Seymour CW, Liu VX, Iwashyna TJ, et al. Assessment of clinical criteria for sepsis: for the Third International Consensus Definitions for Sepsis and Septic Shock (Sepsis-3). JAMA. 2016;315(8):762-774.
4. Giamorellos-Bourboulis EJ, Tsaganos T, Tsangaris I, et al; Hellenic Sepsis Study Group. Validation of the new Sepsis-3 definitions: proposal for improvement of early risk identification. Clin Microbiol Infect. 2016;23(2):104-109.
5. Serafim R, Gomes JA, Salluh J, Póvoa P. A Comparison of the Quick-SOFA and Systemic Inflammatory Response Syndrome criteria for the diagnosis of sepsis and prediction of mortality: a systematic review and meta-analysis. Chest. 2018;153(3):646-655.
6. Forward E, Konecny P, Burston J, Adhikari S, Doolan H, Jensen T. Predictive validity of qSOFA criteria for sepsis in non-ICU patients. Intensive Care Med. 2017;43(6):945-946.