User login
Outcomes Comparison of the Veterans’ Choice Program With the Veterans Affairs Healthcare System for Hepatitis C Treatment
Population studies show high prevalence of chronic hepatitis C virus (HCV) infection among veterans, especially Vietnam War era veterans.1,2 The development of safe and efficacious direct-acting antiviral (DAA) medications to treat HCV infection made the majority of those infected eligible for treatment. However, the large number of veterans needing DAA treatment stressed the resources of the US Department of Veterans Affairs (VA) health care system. This occurred while Congress was focused on reducing wait times for veterans receiving care at the VA.
Congress passed the Veterans Access, Choice, and Accountability Act (Choice) on August 7, 2014, leading to the creation of the Veterans Choice Program. Legislators felt there were inappropriate delays in care at the VA, and the Choice program was meant to address this problem and provide an “apples-to-apples comparison [of the VA] with non-VA hospitals.”3
Congress acknowledged the importance of curing HCV in the veteran population and allocated $1.5 billion for fiscal year (FY) 2016 for DAAs. The VA Central Office (VACO) carefully monitored these resources. The first policy memorandum from VACO for HCV care, issued on May 21, 2015, recommended that the sickest patients who will benefit from the treatment “receive priority over those who are less ill.”4,5 Those who met criteria for advanced liver disease were prioritized for treatment at the VA, while those who did not meet criteria were given the option of receiving treatment through Choice, or waiting for a change in policy.6 Over time, revisions to the guidelines relaxed the criteria for VA treatment eligibility, and on February 24, 2016, all restrictions on HCV treatment at the VA were lifted.7,8
The aim of this study was to provide a comparison of VA and non-VA care, specifically to determine whether care provided through Choice was timelier and more cost effective than care provided by the VA, and whether there was a quality difference. The high prevalence among veterans, well-established standards of care, and finite treatment course with clear indicators of success and failure makes HCV treatment an ideal disease with which to make this comparison.
Methods
We retrospectively analyzed the VA electronic health records of all veterans seen in the VA Loma Linda Healthcare System (VALLHCS) Hepatology clinic for chronic HCV infection during FY 2016 who were referred to Choice for HCV treatment. One hundred veterans met these criteria, encompassing the Choice population; 71 were seen at least once by a non-VA (Choice) health care provider (HCP) and 61 completed a treatment regimen through Choice. Treatment completion was defined as cessation of medication after the planned duration of therapy, or early termination of medication without resumption by that HCP. The Choice population was matched to an equal number of veterans who received HCV treatment from VALLHCS HCPs.
Data collected included age, gender, HCV genotype, determinants of liver fibrosis, and treatment success (defined as sustained virologic response at 12 weeks after the last dose of medication [SVR12]). Determinants of liver fibrosis included documented cirrhosis or complications of cirrhosis, Fibrosis-4 score (Fib-4), and platelet count.
Treatment failures were categorized as nonresponse (defined as detectable HCV viral load at the end of treatment), relapse (defined as an undetectable HCV viral load at the end of treatment with a subsequent positive test), and early termination (defined as a failure to complete the planned treatment regimen). Documented patient nonadherence, medical comorbidities that affected the treatment protocol, mental health diagnoses, and active social issues (defined as active or history of heavy alcohol use, active or history of illicit drug use, lack of social support, and homelessness) were noted.
Timeliness of delivery of care was measured in days. For the VA group, the wait time was defined as the date the consult for HCV treatment was placed to the date of the initial appointment with the HCV treatment provider. For the Choice group, the wait time was defined as the date the referral to the Choice program was made to the date of the initial appointment with the Choice HCP. Treatment regimens were evaluated for appropriateness based on guidelines from VACO and the American Association for the Study of Liver Diseases.9-11
Tests performed by Choice providers were evaluated for whether they were relevant to HCV care and whether similar data already were available from VALLHCS. Tests that were not indicated were identified as unnecessary costs incurred by the Choice program, as were tests that had to be repeated at the VA because of a lack of documentation from the Choice provider. All medications given inappropriately were considered added costs. Medicare reimbursement rates for the most applicable Current Procedural Terminology (CPT) code and VA national contract pricing for medications were used for calculations. This study was approved by the VALLHCS institutional review board.
Statistical Analysis
IBM (Armonk, NY) Statistical Package for Social Sciences software was used to evaluate for differences in Fib-4, platelet count, prevalence of cirrhosis, prevalence of medical comorbidities, prevalence of mental health comorbidities, prevalence of the social issues defined in the Methods section, time from referral to time of appointment date, and SVR12 rate between the VA and Choice groups.
Exclusions
There were 15 veterans in the VA group who had a wait time of > 100 days. Of these, 5 (33%) were initially Choice referrals, but due to negative interactions with the Choice provider, the veterans returned to VALLHCS for care. Two of the 15 (13%) did not keep appointments and were lost to follow up. Six of the 15 (40%) had medical comorbidities that required more immediate attention, so HCV treatment initiation was deliberately moved back. The final 2 veterans scheduled their appointments unusually far apart, artificially increasing their wait time. Given that these were unique situations and some of the veterans received care from both Choice and VA providers, a decision was made to exclude these individuals from the study.
It has been shown that platelet count correlates with degree of liver fibrosis, a concept that is the basis for the Fib-4 scoring system.12 Studies have shown that platelet count is a survival predictor in those with cirrhosis, and thrombocytopenia is a negative predictor of HCV treatment success using peginterferon and ribavirin.13,14 Therefore, the VA memorandum automatically assigned the sickest individuals to the VA for HCV treatment. The goal of this study was to compare the impact of factors other than stage of fibrosis on HCV treatment success, which is why the 12 veterans with platelet count < 100,000 in the VA group were excluded. There were no veterans with platelet count < 100,000 in the Choice group.
When comparing SVR12 rates between the VA and Choice groups, every veteran treated at VALLHCS in FY 2016 was included, increasing the number in the VA group from 100 to 320 and therefore the power of this comparison.
Results
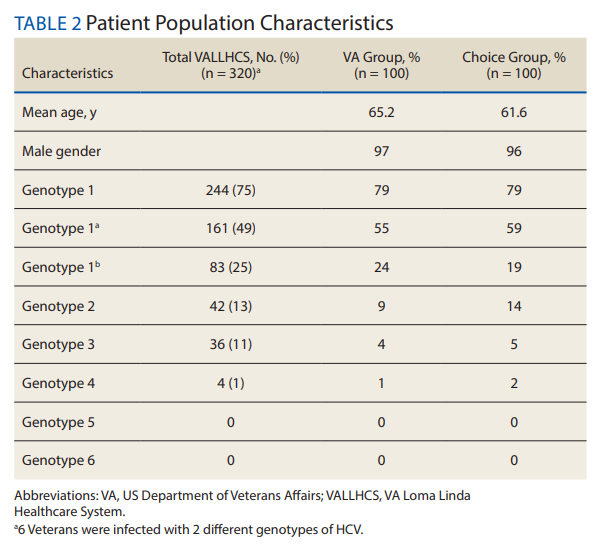
A summary of the statistical analysis can be found in Table 1. The genotype distribution was consistent with epidemiological studies, including those specific to veterans.15,16 There were statistically significant differences (P < .001) in mean Fib-4 and mean platelet count. The VA group had a higher Fib-4 and lower platelet count. Seventy-four percent of the VA population was defined as cirrhotic, while only 3% of the Choice population met similar criteria (P < .001). The VA and Choice groups were similar in terms of age, gender, and genotype distribution (Table 2).
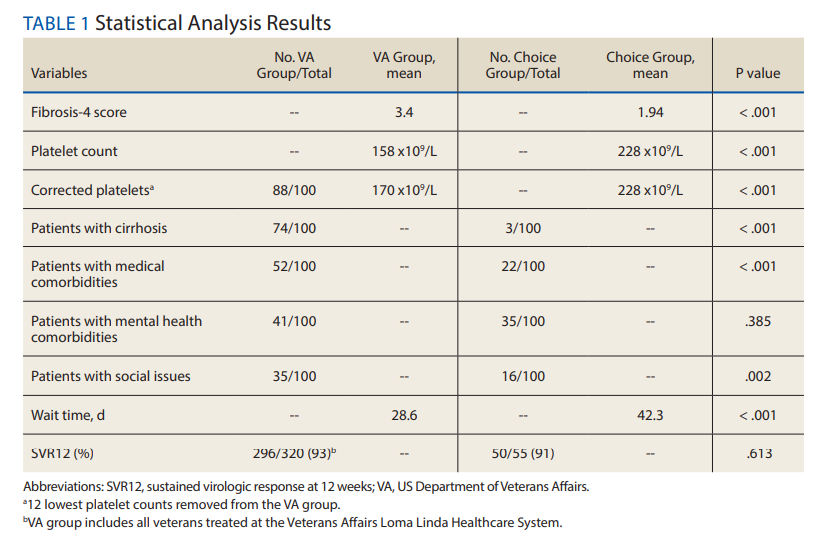
The VA group was found to have a higher prevalence of comorbidities that affected HCV treatment. These conditions included but were not limited to: chronic kidney disease that precluded the use of certain medications, any condition that required medication with a known interaction with DAAs (ie, proton pump inhibitors, statins, and amiodarone), and cirrhosis if it impacted the treatment regimen. The difference in the prevalence of mental health comorbidities was not significant (P = .39), but there was a higher prevalence of social issues among the VA group (P = .002).
The mean wait time from referral to appointment was 28.6 days for the VA group and 42.3 days for the Choice group (P < .001), indicating that a Choice referral took longer to complete than a referral within the VA for HCV treatment. Thirty of the 71 (42%) veterans seen by a Choice provider accrued extraneous cost, with a mean additional cost of $8,561.40 per veteran. In the Choice group, 61 veterans completed a treatment regimen with the Choice HCP. Fifty-five veterans completed treatment and had available SVR12 data (6 were lost to follow up without SVR12 testing) and 50 (91%) had confirmed SVR12. The charts of the 5 treatment failures were reviewed to discern the cause for failure. Two cases involved early termination of therapy, 3 involved relapse and 2 failed to comply with medication instructions. There was 1 case of the Choice HCP not addressing simultaneous use of ledipasvir and a proton pump inhibitor, potentially causing an interaction, and 1 case where both the VA and Choice providers failed to recognize indicators of cirrhosis, which impacted the regimen used.
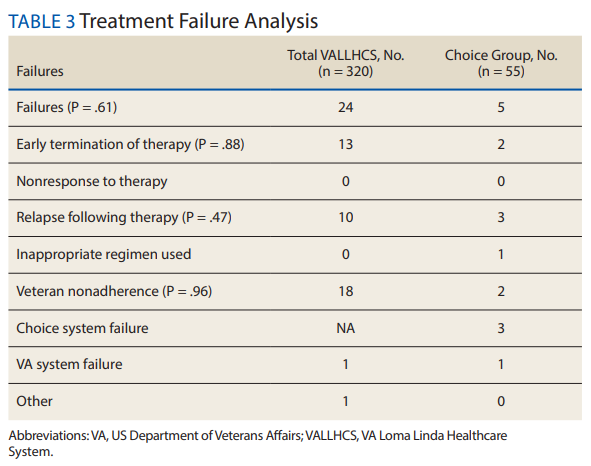
In the VALLHCS group, records of 320 veterans who completed treatment and had SVR12 testing were reviewed. While the Choice memorandum was active, veterans selected to be treated at VALLHCS had advanced liver fibrosis or cirrhosis, medical and mental health comorbidities that increased the risk of treatment complications or were considered to have difficulty adhering to the medication regimen. For this group, 296 (93%) had confirmed SVR12. Eighteen of the 24 (75%) treatment failures were complicated by nonadherence, including all 13 cases of early termination. One patient died from complications of decompensated cirrhosis before completing treatment, and 1 did not receive HCV medications during a hospital admission due to poor coordination of care between the VA inpatient and outpatient pharmacy services, leading to multiple missed doses.
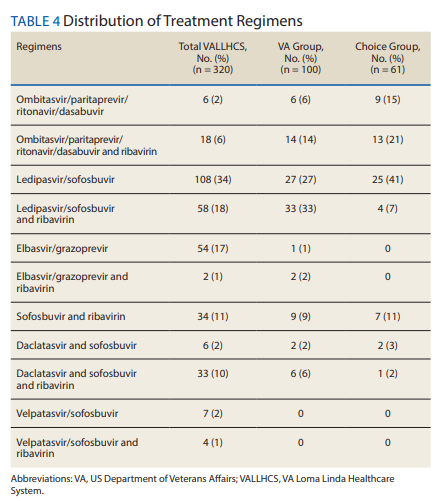
The difference in SVR12 rates (ie, treatment failure rates), between the VA and Choice groups was not statistically significant (P = .61). None of the specific reasons for treatment failure had a statistically significant difference between groups. A treatment failure analysis is shown in Table 3, and Table 4 indicates the breakdown of treatment regimens.
Discussion
The Veterans Health Administration (VHA) is the largest integrated health care system in the US, consisting of 152 medical centers and > 1,700 sites of care. The VA has the potential to meet the health care needs of 21.6 million veterans. About 9 million veterans are enrolled in the VA system and 5.9 million received health care through VHA.17 However, every medical service cannot realistically be made available at every facility, and some veterans have difficulty gaining access to VHA care; distance and wait times have been well-publicized issues that need further exploration.18,19 The Choice program is an attempt to meet gaps in VA coverage using non-VA HCPs.
HCV infection is a specific diagnosis with national treatment guidelines and well-studied treatments; it can be cured, with an evidence-based definition of cure. The VACO policy memorandum to refer less sick veterans to Choice while treating sicker veterans at the VA provided the opportunity to directly compare the quality of the 2 programs. The SVR12 rates of VALLHCS and Choice providers were comparable to the national average at the time, and while the difference in SVR12 rate was not significant, VALLHCS treated a significantly higher number of patients with cirrhosis because of the referral criteria.20
The significant difference in medical comorbidities between the VA and Choice groups was not surprising, partly because of the referral criteria. Cirrhosis can impact the treatment regimen, especially in regard to use of ribavirin. Since the presence of mental health comorbidities did not affect selection into the Choice group, it makes sense that there was no significant difference in prevalence between the groups.
VACO allowed veterans with HCV treatment plans that VA HCPs felt were too complicated for the Choice program to be treated by VHA HCPs.9 VALLHCS exercised this right for veterans at risk for nonadherence, because in HCV treatment, nonadherence leads to treatment failure and development of drug resistant virus strains. Therefore, veterans who would have difficulty traveling to VALLHCS to pick up medications, those who lacked means of communication (such as those who were homeless), and those who had active substance abuse were treated at the VA, where closer monitoring and immediate access to a wide range of services was possible. Studies have confirmed the impact of these types of issues on HCV treatment adherence and success.21 This explains the higher prevalence of social issues in the VA group.
For an internal referral for HCV treatment at VALLHCS, the hepatology provider submits a consult request to the HCV treatment provider, who works in the same office, making direct communication simple. The main administrative limiting factor to minimizing wait times is the number of HCPs, which is dependent on hiring allowances.
When a veteran is referred to Choice, the VA provider places a consult for non-VA care, which the VA Office of Community Care processes by compiling relevant documents and sending the package to Triwest Healthcare Alliance, a private insurance processor contracted with the VA. Triwest selects the Choice provider, often without any input from the VA, and arranges the veteran’s initial appointment.22 Geographic distance to the veteran’s address is the main selection criteria for Triwest. Documents sent between the Choice and VA HCPs go through the Office of Community Care and Triwest. This significantly increases the potential for delays and failed communication. Triwest had a comprehensive list of providers deemed to be qualified to treat HCV within the geographic catchment of VALLHCS. This list was reviewed, and all veterans referred to Choice had HCPs near their home address; therefore, availability of Choice HCPs was not an issue.
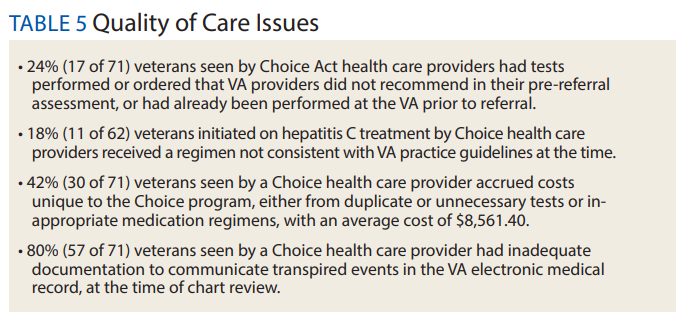
The VA can provide guidance on management of the veteran in the form of bundle packages containing a list of services for which the Choice provider is authorized to provide, and ones the Choice provider is not authorized to provide. Some Choice HCPs ordered tests that were not authorized for HCV treatment such as esophagogastroduodenoscopy, colonoscopy, and liver biopsy. In all, 17 of 71 (24%) veterans seen by Choice HCPs had tests performed or ordered that VA HCPs would not have obtained for the purpose of HCV treatment (Table 5).
In order to prevent veterans from receiving unnecessary tests, a VALLHCS hepatologist asked to be notified by VA administrators overseeing Choice referrals whenever a secondary authorization request (SAR) was submitted by a Choice HCP. This strategy is not standard VA practice, therefore at many VA sites these requested tests would have been performed by the Choice HCP, which is why SARs were factored into cost analysis.
SVR12 test results that were drawn too early and had to be repeated at VALLHCS were a cost unique to the Choice program. Duplicate tests, particularly imaging studies and blood work, were extraneous costs. The largest extraneous costs were treatment regimens prescribed by Choice HCPs that did not follow standard of care and required VA provider intervention. Thirty of the 71 (42%) veterans seen by a Choice provider accrued a mean $8,561.40 in extra costs. As a result, the Choice program cost VHA $250,000 more to provide care for 30 veterans (enough to pay for a physician’s annual salary).
Some inappropriate treatment regimens were the result of Choice HCP error, such as 1 case in which a veteran was inadvertently switched from ledipasvir/sofosbuvir to ombitasvir/paritaprevir/ritonavir/dasabuvir after week 4. The veteran had to start therapy over but still achieved SVR12. Other cases saw veterans receive regimens for which they had clear contraindications, such as creatinine clearance < 30 mL/min/1.73m2 for sofosbuvir or a positive resistance panel for specific medications. Eleven of 62 (18%) veterans who were started on HCV treatment by a Choice HCP received a regimen not consistent with VA guidelines—an alarming result.
Follow up for veterans referred to Choice was extremely labor intensive, and assessment of personnel requirements in a Choice-based VA system must take this into consideration. The Choice HCP has no obligation to communicate with the VA HCP. At the time of chart review, 57 of 71 (80%) Choice veterans had inadequate documentation to make a confident assessment of the treatment outcome. Multiple calls to the offices of the Choice HCP were needed to acquire records, and veterans had to be tracked down for additional tests. Veterans often would complete treatment and stop following up with the Choice provider before SVR12 confirmation. The VA hepatology provider reviewing Choice referrals served as clinician, case manager, and clerk in order to get veterans to an appropriate end point in their hepatitis C treatment, with mostly unmeasured hours of work.
Limitations
The study population size was limited by the number of veterans able to complete treatment through Choice. The parameters in the VACO policy memos automatically selected the VA and Choice groups but made them clinically distinct populations. New treatment medications were released during the study period, which impacted management strategy. Occasionally, VA and non-VA HCPs preferred different treatment regimens, leading to variation in the distribution of regimens used despite similar genotype distribution (Tables 2 and 4). In addition, a retrospective study is at risk for recall bias. A prospective study randomizing veterans to the Choice and VA groups is an important future endeavor. Comparing veteran satisfaction for Choice and VA services is also crucial.
Conclusions
This study demonstrates that the VA was able to provide more cost-effective and more timely care for HCV treatment to a relatively sicker population with no reduction in treatment success when compared with non-VA HCPs through the Choice program. While the Choice program can help veterans receive services they may otherwise not have access to and reduce travel time, the current system introduces inefficiencies that delay care and decrease cost-effectiveness. The Choice HCP selection process is based on proximity rather than quality, which may place the veteran at risk for receiving substandard care. Large-scale quality of care studies that compare efficiency measures, clinical outcomes, patient demographics, travel distance, cost efficacy and patient satisfaction for veterans receiving similar services at a VA facility and through Choice should be performed to ensure that veterans receive the best care available.
1. Denniston MM, Jiles RB, Drobeniuc J, et al. Chronic hepatitis C virus infection in the United States, National Health and Nutrition Examination Survey 2003 to 2010. Ann Intern Med. 2014;160(5):293-300.
2. Dominitz JA, Boyko EJ, Koepsell TD, et al. Elevated prevalence of hepatitis C infection in users of United States veterans medical centers. Hepatology. 2005;41(1):88-96.
3. Veterans Access, Choice, and Accountability Act of 2014. 42 USC §1395 (2014).
4. Tuchschmidt J. Attachment C: Provision of hepatitis C treatment. US Department of Veterans Affairs Central Office Memorandum from the Principal Deputy Under Secretary for Health. http://vaww.hepatitis.va.gov/education/choice-provision-hcv-treatment.asp. Published May 21, 2015. [Nonpublic site.]
5. Tuchschmidt J. Attachment A: Provision of hepatitis C (HCV) treatment through the Choice program. US Department of Veterans Affairs Central Office Memorandum from the Principal Deputy Under Secretary for Health. http://vaww.hepatitis.va.gov/pdf/choice-attachment-a-FY16.pdf. Published May 21, 2015. [Nonpublic site.]
6. Tuchschmidt J. Attachment B: Initiation of hepatitis C virus (HCV) treatment: protocol for prioritization. US Department of Veterans Affairs Central Office Memorandum from the Principal Deputy Under Secretary for Health. http://vaww.hepatitis.va.gov/pdf/provision-HCV-treatment-attachment-b.pdf. Published May 21, 2015. [Nonpublic site.]
7. Murphy, JP. Hepatitis C virus funding and prioritization status. US Department of Veterans Affairs Central Office Memorandum from the Assistant Deputy Under Secretary for Health for Clinical Operations. http://vaww.hepatitis.va.gov/education/choice-memo-hcv-funding-and-prioritization-status-01272016.asp. Published January 27, 2016. [Nonpublic site.]
8. Lynch TJ, McCarthy MF. Hepatitis C virus funding and prioritization status update. US Department of Veterans Affairs Central Office Memorandum from the Assistant Deputy Under Secretary for Health for Clinical Operations and Acting Assistant Deputy Under Secretary for Health for Patient Care Services. http://vaww.hepatitis.va.gov/education/choice-funding-update-feb-2016.asp. Published February 24, 2016. [Nonpublic site.]
9. Morgan TR, Yee H; US Department of Veterans Affairs National Hepatitis C Resource Center Program and the National Viral Hepatitis Program in the Office of Patient Care Services. Chronic hepatitis C virus (HCV) infection: treatment considerations. http://vaww.hepatitis.va.gov/pdf/treatment-considerations-2016-03-28.pdf. Published March 28, 2016. [Nonpublic site.]
10. American Association for the Study of Liver Diseases; Infectious Diseases Society of America. Initial treatment box. http://hcvguidelines.org/full-report/initial-treatment-box-summary-recommendations-patients-who-are-initiating-therapy-hcv. Updated November 6, 2019. Accessed September 27, 2016
11. AASLD/IDSA HCV Guidance Panel. Hepatitis C guidance: AASLD-IDSA recommendations for testing, managing, and treating adults infected with hepatitis C virus. Hepatology. 2015;62(3): 932-954.
12. Sterling RK, Lissen E, Clumeck N, et al. Development of a simple noninvasive index to predict significant fibrosis in patients with HIV/HCV coinfection. Hepatology. 2006; 43(6):1317-1325.
13. Realdi G, Fattovich G, Hadziyannis S, et al. Survival and prognostic factors in 366 patients with compensated cirrhosis type B: a multicenter study. The Investigators of the European Concerted Action on Viral Hepatitis (EUROHEP). J Hepatol. 1994;21(4):656-666.
14. Kanda T, Kato K, Tsubota A, et al. Platelet count and sustained virological response in hepatitis C treatment. World J Hepatol. 2013;5(4):182-188.
15. Manos MM, Shvachko VA, Murphy RC, Arduino JM, Shire NJ. Distribution of hepatitis C virus genotypes in a diverse US integrated health care population. J Med Virol. 2012;84(11):1744-1750.
16. Cheung RC. Epidemiology of hepatitis C virus infection in American veterans. Am J Gastroenterol. 2000;95(3):740-747.
17. Bagalman E. The number of Veterans that use VA health care services: a fact sheet. Congressional Research Service Report R43579. https://fas.org/sgp/crs/misc/R43579.pdf. Published June 3, 2014. Accessed November 25, 2019.
18. US General Accounting Office. Report to the Ranking Minority Member, Subcommittee on Compensation, Pension, Insurance, and Memorial Affairs, Committee on Veterans’ Affairs, US House of Representatives. How distance from VA facilities affects veterans’ use of VA services. https://www.gao.gov/assets/230/221992.pdf. Published December 1995. Accessed November 25, 2019.
19. Bronstein S, Griffin D. A fatal wait: Veterans languish and die on a VA hospital’s secret list. http://www.cnn.com/2014/04/23/health/veterans-dying-health-care-delays/index.html. Published April 23, 2014. Accessed November 25, 2019.
20. Ioannou GN, Beste LA, Chang MF, et al. Effectiveness of sofosbuvir, ledipasvir/sofosbuvir, or paritaprevir/ritonavir/ombitasvir and dasabuvir regimens for treatment of patients with hepatitis C in the Veterans Affairs national health care system. Gastroenterology. 2016;151(3):457-471.
21. Malespin MH, Harris C, Kanar O, et al. Barriers to treatment of chronic hepatitis C with direct acting antivirals in an urban clinic. Ann Hepatol. 2019;18(2):304–309.
22. Tuchschmidt J. Attachment D: Hepatitis C virus (HCV) fact sheet for Veterans Choice Program for both VA and Choice providers. US Department of Veterans Affairs Central Office Memorandum from the Deputy Under Secretary for Health for Policy and Services and the Acting Deputy Undersecretary for Health for Operations and Management. http://vaww.hepatitis.va.gov/educatiochoice-provision-HCV-treatment-additional.asp. [Nonpublic site.]
Population studies show high prevalence of chronic hepatitis C virus (HCV) infection among veterans, especially Vietnam War era veterans.1,2 The development of safe and efficacious direct-acting antiviral (DAA) medications to treat HCV infection made the majority of those infected eligible for treatment. However, the large number of veterans needing DAA treatment stressed the resources of the US Department of Veterans Affairs (VA) health care system. This occurred while Congress was focused on reducing wait times for veterans receiving care at the VA.
Congress passed the Veterans Access, Choice, and Accountability Act (Choice) on August 7, 2014, leading to the creation of the Veterans Choice Program. Legislators felt there were inappropriate delays in care at the VA, and the Choice program was meant to address this problem and provide an “apples-to-apples comparison [of the VA] with non-VA hospitals.”3
Congress acknowledged the importance of curing HCV in the veteran population and allocated $1.5 billion for fiscal year (FY) 2016 for DAAs. The VA Central Office (VACO) carefully monitored these resources. The first policy memorandum from VACO for HCV care, issued on May 21, 2015, recommended that the sickest patients who will benefit from the treatment “receive priority over those who are less ill.”4,5 Those who met criteria for advanced liver disease were prioritized for treatment at the VA, while those who did not meet criteria were given the option of receiving treatment through Choice, or waiting for a change in policy.6 Over time, revisions to the guidelines relaxed the criteria for VA treatment eligibility, and on February 24, 2016, all restrictions on HCV treatment at the VA were lifted.7,8
The aim of this study was to provide a comparison of VA and non-VA care, specifically to determine whether care provided through Choice was timelier and more cost effective than care provided by the VA, and whether there was a quality difference. The high prevalence among veterans, well-established standards of care, and finite treatment course with clear indicators of success and failure makes HCV treatment an ideal disease with which to make this comparison.
Methods
We retrospectively analyzed the VA electronic health records of all veterans seen in the VA Loma Linda Healthcare System (VALLHCS) Hepatology clinic for chronic HCV infection during FY 2016 who were referred to Choice for HCV treatment. One hundred veterans met these criteria, encompassing the Choice population; 71 were seen at least once by a non-VA (Choice) health care provider (HCP) and 61 completed a treatment regimen through Choice. Treatment completion was defined as cessation of medication after the planned duration of therapy, or early termination of medication without resumption by that HCP. The Choice population was matched to an equal number of veterans who received HCV treatment from VALLHCS HCPs.
Data collected included age, gender, HCV genotype, determinants of liver fibrosis, and treatment success (defined as sustained virologic response at 12 weeks after the last dose of medication [SVR12]). Determinants of liver fibrosis included documented cirrhosis or complications of cirrhosis, Fibrosis-4 score (Fib-4), and platelet count.
Treatment failures were categorized as nonresponse (defined as detectable HCV viral load at the end of treatment), relapse (defined as an undetectable HCV viral load at the end of treatment with a subsequent positive test), and early termination (defined as a failure to complete the planned treatment regimen). Documented patient nonadherence, medical comorbidities that affected the treatment protocol, mental health diagnoses, and active social issues (defined as active or history of heavy alcohol use, active or history of illicit drug use, lack of social support, and homelessness) were noted.
Timeliness of delivery of care was measured in days. For the VA group, the wait time was defined as the date the consult for HCV treatment was placed to the date of the initial appointment with the HCV treatment provider. For the Choice group, the wait time was defined as the date the referral to the Choice program was made to the date of the initial appointment with the Choice HCP. Treatment regimens were evaluated for appropriateness based on guidelines from VACO and the American Association for the Study of Liver Diseases.9-11
Tests performed by Choice providers were evaluated for whether they were relevant to HCV care and whether similar data already were available from VALLHCS. Tests that were not indicated were identified as unnecessary costs incurred by the Choice program, as were tests that had to be repeated at the VA because of a lack of documentation from the Choice provider. All medications given inappropriately were considered added costs. Medicare reimbursement rates for the most applicable Current Procedural Terminology (CPT) code and VA national contract pricing for medications were used for calculations. This study was approved by the VALLHCS institutional review board.
Statistical Analysis
IBM (Armonk, NY) Statistical Package for Social Sciences software was used to evaluate for differences in Fib-4, platelet count, prevalence of cirrhosis, prevalence of medical comorbidities, prevalence of mental health comorbidities, prevalence of the social issues defined in the Methods section, time from referral to time of appointment date, and SVR12 rate between the VA and Choice groups.
Exclusions
There were 15 veterans in the VA group who had a wait time of > 100 days. Of these, 5 (33%) were initially Choice referrals, but due to negative interactions with the Choice provider, the veterans returned to VALLHCS for care. Two of the 15 (13%) did not keep appointments and were lost to follow up. Six of the 15 (40%) had medical comorbidities that required more immediate attention, so HCV treatment initiation was deliberately moved back. The final 2 veterans scheduled their appointments unusually far apart, artificially increasing their wait time. Given that these were unique situations and some of the veterans received care from both Choice and VA providers, a decision was made to exclude these individuals from the study.
It has been shown that platelet count correlates with degree of liver fibrosis, a concept that is the basis for the Fib-4 scoring system.12 Studies have shown that platelet count is a survival predictor in those with cirrhosis, and thrombocytopenia is a negative predictor of HCV treatment success using peginterferon and ribavirin.13,14 Therefore, the VA memorandum automatically assigned the sickest individuals to the VA for HCV treatment. The goal of this study was to compare the impact of factors other than stage of fibrosis on HCV treatment success, which is why the 12 veterans with platelet count < 100,000 in the VA group were excluded. There were no veterans with platelet count < 100,000 in the Choice group.
When comparing SVR12 rates between the VA and Choice groups, every veteran treated at VALLHCS in FY 2016 was included, increasing the number in the VA group from 100 to 320 and therefore the power of this comparison.
Results
A summary of the statistical analysis can be found in Table 1. The genotype distribution was consistent with epidemiological studies, including those specific to veterans.15,16 There were statistically significant differences (P < .001) in mean Fib-4 and mean platelet count. The VA group had a higher Fib-4 and lower platelet count. Seventy-four percent of the VA population was defined as cirrhotic, while only 3% of the Choice population met similar criteria (P < .001). The VA and Choice groups were similar in terms of age, gender, and genotype distribution (Table 2).
The VA group was found to have a higher prevalence of comorbidities that affected HCV treatment. These conditions included but were not limited to: chronic kidney disease that precluded the use of certain medications, any condition that required medication with a known interaction with DAAs (ie, proton pump inhibitors, statins, and amiodarone), and cirrhosis if it impacted the treatment regimen. The difference in the prevalence of mental health comorbidities was not significant (P = .39), but there was a higher prevalence of social issues among the VA group (P = .002).
The mean wait time from referral to appointment was 28.6 days for the VA group and 42.3 days for the Choice group (P < .001), indicating that a Choice referral took longer to complete than a referral within the VA for HCV treatment. Thirty of the 71 (42%) veterans seen by a Choice provider accrued extraneous cost, with a mean additional cost of $8,561.40 per veteran. In the Choice group, 61 veterans completed a treatment regimen with the Choice HCP. Fifty-five veterans completed treatment and had available SVR12 data (6 were lost to follow up without SVR12 testing) and 50 (91%) had confirmed SVR12. The charts of the 5 treatment failures were reviewed to discern the cause for failure. Two cases involved early termination of therapy, 3 involved relapse and 2 failed to comply with medication instructions. There was 1 case of the Choice HCP not addressing simultaneous use of ledipasvir and a proton pump inhibitor, potentially causing an interaction, and 1 case where both the VA and Choice providers failed to recognize indicators of cirrhosis, which impacted the regimen used.
In the VALLHCS group, records of 320 veterans who completed treatment and had SVR12 testing were reviewed. While the Choice memorandum was active, veterans selected to be treated at VALLHCS had advanced liver fibrosis or cirrhosis, medical and mental health comorbidities that increased the risk of treatment complications or were considered to have difficulty adhering to the medication regimen. For this group, 296 (93%) had confirmed SVR12. Eighteen of the 24 (75%) treatment failures were complicated by nonadherence, including all 13 cases of early termination. One patient died from complications of decompensated cirrhosis before completing treatment, and 1 did not receive HCV medications during a hospital admission due to poor coordination of care between the VA inpatient and outpatient pharmacy services, leading to multiple missed doses.
The difference in SVR12 rates (ie, treatment failure rates), between the VA and Choice groups was not statistically significant (P = .61). None of the specific reasons for treatment failure had a statistically significant difference between groups. A treatment failure analysis is shown in Table 3, and Table 4 indicates the breakdown of treatment regimens.
Discussion
The Veterans Health Administration (VHA) is the largest integrated health care system in the US, consisting of 152 medical centers and > 1,700 sites of care. The VA has the potential to meet the health care needs of 21.6 million veterans. About 9 million veterans are enrolled in the VA system and 5.9 million received health care through VHA.17 However, every medical service cannot realistically be made available at every facility, and some veterans have difficulty gaining access to VHA care; distance and wait times have been well-publicized issues that need further exploration.18,19 The Choice program is an attempt to meet gaps in VA coverage using non-VA HCPs.
HCV infection is a specific diagnosis with national treatment guidelines and well-studied treatments; it can be cured, with an evidence-based definition of cure. The VACO policy memorandum to refer less sick veterans to Choice while treating sicker veterans at the VA provided the opportunity to directly compare the quality of the 2 programs. The SVR12 rates of VALLHCS and Choice providers were comparable to the national average at the time, and while the difference in SVR12 rate was not significant, VALLHCS treated a significantly higher number of patients with cirrhosis because of the referral criteria.20
The significant difference in medical comorbidities between the VA and Choice groups was not surprising, partly because of the referral criteria. Cirrhosis can impact the treatment regimen, especially in regard to use of ribavirin. Since the presence of mental health comorbidities did not affect selection into the Choice group, it makes sense that there was no significant difference in prevalence between the groups.
VACO allowed veterans with HCV treatment plans that VA HCPs felt were too complicated for the Choice program to be treated by VHA HCPs.9 VALLHCS exercised this right for veterans at risk for nonadherence, because in HCV treatment, nonadherence leads to treatment failure and development of drug resistant virus strains. Therefore, veterans who would have difficulty traveling to VALLHCS to pick up medications, those who lacked means of communication (such as those who were homeless), and those who had active substance abuse were treated at the VA, where closer monitoring and immediate access to a wide range of services was possible. Studies have confirmed the impact of these types of issues on HCV treatment adherence and success.21 This explains the higher prevalence of social issues in the VA group.
For an internal referral for HCV treatment at VALLHCS, the hepatology provider submits a consult request to the HCV treatment provider, who works in the same office, making direct communication simple. The main administrative limiting factor to minimizing wait times is the number of HCPs, which is dependent on hiring allowances.
When a veteran is referred to Choice, the VA provider places a consult for non-VA care, which the VA Office of Community Care processes by compiling relevant documents and sending the package to Triwest Healthcare Alliance, a private insurance processor contracted with the VA. Triwest selects the Choice provider, often without any input from the VA, and arranges the veteran’s initial appointment.22 Geographic distance to the veteran’s address is the main selection criteria for Triwest. Documents sent between the Choice and VA HCPs go through the Office of Community Care and Triwest. This significantly increases the potential for delays and failed communication. Triwest had a comprehensive list of providers deemed to be qualified to treat HCV within the geographic catchment of VALLHCS. This list was reviewed, and all veterans referred to Choice had HCPs near their home address; therefore, availability of Choice HCPs was not an issue.
The VA can provide guidance on management of the veteran in the form of bundle packages containing a list of services for which the Choice provider is authorized to provide, and ones the Choice provider is not authorized to provide. Some Choice HCPs ordered tests that were not authorized for HCV treatment such as esophagogastroduodenoscopy, colonoscopy, and liver biopsy. In all, 17 of 71 (24%) veterans seen by Choice HCPs had tests performed or ordered that VA HCPs would not have obtained for the purpose of HCV treatment (Table 5).
In order to prevent veterans from receiving unnecessary tests, a VALLHCS hepatologist asked to be notified by VA administrators overseeing Choice referrals whenever a secondary authorization request (SAR) was submitted by a Choice HCP. This strategy is not standard VA practice, therefore at many VA sites these requested tests would have been performed by the Choice HCP, which is why SARs were factored into cost analysis.
SVR12 test results that were drawn too early and had to be repeated at VALLHCS were a cost unique to the Choice program. Duplicate tests, particularly imaging studies and blood work, were extraneous costs. The largest extraneous costs were treatment regimens prescribed by Choice HCPs that did not follow standard of care and required VA provider intervention. Thirty of the 71 (42%) veterans seen by a Choice provider accrued a mean $8,561.40 in extra costs. As a result, the Choice program cost VHA $250,000 more to provide care for 30 veterans (enough to pay for a physician’s annual salary).
Some inappropriate treatment regimens were the result of Choice HCP error, such as 1 case in which a veteran was inadvertently switched from ledipasvir/sofosbuvir to ombitasvir/paritaprevir/ritonavir/dasabuvir after week 4. The veteran had to start therapy over but still achieved SVR12. Other cases saw veterans receive regimens for which they had clear contraindications, such as creatinine clearance < 30 mL/min/1.73m2 for sofosbuvir or a positive resistance panel for specific medications. Eleven of 62 (18%) veterans who were started on HCV treatment by a Choice HCP received a regimen not consistent with VA guidelines—an alarming result.
Follow up for veterans referred to Choice was extremely labor intensive, and assessment of personnel requirements in a Choice-based VA system must take this into consideration. The Choice HCP has no obligation to communicate with the VA HCP. At the time of chart review, 57 of 71 (80%) Choice veterans had inadequate documentation to make a confident assessment of the treatment outcome. Multiple calls to the offices of the Choice HCP were needed to acquire records, and veterans had to be tracked down for additional tests. Veterans often would complete treatment and stop following up with the Choice provider before SVR12 confirmation. The VA hepatology provider reviewing Choice referrals served as clinician, case manager, and clerk in order to get veterans to an appropriate end point in their hepatitis C treatment, with mostly unmeasured hours of work.
Limitations
The study population size was limited by the number of veterans able to complete treatment through Choice. The parameters in the VACO policy memos automatically selected the VA and Choice groups but made them clinically distinct populations. New treatment medications were released during the study period, which impacted management strategy. Occasionally, VA and non-VA HCPs preferred different treatment regimens, leading to variation in the distribution of regimens used despite similar genotype distribution (Tables 2 and 4). In addition, a retrospective study is at risk for recall bias. A prospective study randomizing veterans to the Choice and VA groups is an important future endeavor. Comparing veteran satisfaction for Choice and VA services is also crucial.
Conclusions
This study demonstrates that the VA was able to provide more cost-effective and more timely care for HCV treatment to a relatively sicker population with no reduction in treatment success when compared with non-VA HCPs through the Choice program. While the Choice program can help veterans receive services they may otherwise not have access to and reduce travel time, the current system introduces inefficiencies that delay care and decrease cost-effectiveness. The Choice HCP selection process is based on proximity rather than quality, which may place the veteran at risk for receiving substandard care. Large-scale quality of care studies that compare efficiency measures, clinical outcomes, patient demographics, travel distance, cost efficacy and patient satisfaction for veterans receiving similar services at a VA facility and through Choice should be performed to ensure that veterans receive the best care available.
1. Denniston MM, Jiles RB, Drobeniuc J, et al. Chronic hepatitis C virus infection in the United States, National Health and Nutrition Examination Survey 2003 to 2010. Ann Intern Med. 2014;160(5):293-300.
2. Dominitz JA, Boyko EJ, Koepsell TD, et al. Elevated prevalence of hepatitis C infection in users of United States veterans medical centers. Hepatology. 2005;41(1):88-96.
3. Veterans Access, Choice, and Accountability Act of 2014. 42 USC §1395 (2014).
4. Tuchschmidt J. Attachment C: Provision of hepatitis C treatment. US Department of Veterans Affairs Central Office Memorandum from the Principal Deputy Under Secretary for Health. http://vaww.hepatitis.va.gov/education/choice-provision-hcv-treatment.asp. Published May 21, 2015. [Nonpublic site.]
5. Tuchschmidt J. Attachment A: Provision of hepatitis C (HCV) treatment through the Choice program. US Department of Veterans Affairs Central Office Memorandum from the Principal Deputy Under Secretary for Health. http://vaww.hepatitis.va.gov/pdf/choice-attachment-a-FY16.pdf. Published May 21, 2015. [Nonpublic site.]
6. Tuchschmidt J. Attachment B: Initiation of hepatitis C virus (HCV) treatment: protocol for prioritization. US Department of Veterans Affairs Central Office Memorandum from the Principal Deputy Under Secretary for Health. http://vaww.hepatitis.va.gov/pdf/provision-HCV-treatment-attachment-b.pdf. Published May 21, 2015. [Nonpublic site.]
7. Murphy, JP. Hepatitis C virus funding and prioritization status. US Department of Veterans Affairs Central Office Memorandum from the Assistant Deputy Under Secretary for Health for Clinical Operations. http://vaww.hepatitis.va.gov/education/choice-memo-hcv-funding-and-prioritization-status-01272016.asp. Published January 27, 2016. [Nonpublic site.]
8. Lynch TJ, McCarthy MF. Hepatitis C virus funding and prioritization status update. US Department of Veterans Affairs Central Office Memorandum from the Assistant Deputy Under Secretary for Health for Clinical Operations and Acting Assistant Deputy Under Secretary for Health for Patient Care Services. http://vaww.hepatitis.va.gov/education/choice-funding-update-feb-2016.asp. Published February 24, 2016. [Nonpublic site.]
9. Morgan TR, Yee H; US Department of Veterans Affairs National Hepatitis C Resource Center Program and the National Viral Hepatitis Program in the Office of Patient Care Services. Chronic hepatitis C virus (HCV) infection: treatment considerations. http://vaww.hepatitis.va.gov/pdf/treatment-considerations-2016-03-28.pdf. Published March 28, 2016. [Nonpublic site.]
10. American Association for the Study of Liver Diseases; Infectious Diseases Society of America. Initial treatment box. http://hcvguidelines.org/full-report/initial-treatment-box-summary-recommendations-patients-who-are-initiating-therapy-hcv. Updated November 6, 2019. Accessed September 27, 2016
11. AASLD/IDSA HCV Guidance Panel. Hepatitis C guidance: AASLD-IDSA recommendations for testing, managing, and treating adults infected with hepatitis C virus. Hepatology. 2015;62(3): 932-954.
12. Sterling RK, Lissen E, Clumeck N, et al. Development of a simple noninvasive index to predict significant fibrosis in patients with HIV/HCV coinfection. Hepatology. 2006; 43(6):1317-1325.
13. Realdi G, Fattovich G, Hadziyannis S, et al. Survival and prognostic factors in 366 patients with compensated cirrhosis type B: a multicenter study. The Investigators of the European Concerted Action on Viral Hepatitis (EUROHEP). J Hepatol. 1994;21(4):656-666.
14. Kanda T, Kato K, Tsubota A, et al. Platelet count and sustained virological response in hepatitis C treatment. World J Hepatol. 2013;5(4):182-188.
15. Manos MM, Shvachko VA, Murphy RC, Arduino JM, Shire NJ. Distribution of hepatitis C virus genotypes in a diverse US integrated health care population. J Med Virol. 2012;84(11):1744-1750.
16. Cheung RC. Epidemiology of hepatitis C virus infection in American veterans. Am J Gastroenterol. 2000;95(3):740-747.
17. Bagalman E. The number of Veterans that use VA health care services: a fact sheet. Congressional Research Service Report R43579. https://fas.org/sgp/crs/misc/R43579.pdf. Published June 3, 2014. Accessed November 25, 2019.
18. US General Accounting Office. Report to the Ranking Minority Member, Subcommittee on Compensation, Pension, Insurance, and Memorial Affairs, Committee on Veterans’ Affairs, US House of Representatives. How distance from VA facilities affects veterans’ use of VA services. https://www.gao.gov/assets/230/221992.pdf. Published December 1995. Accessed November 25, 2019.
19. Bronstein S, Griffin D. A fatal wait: Veterans languish and die on a VA hospital’s secret list. http://www.cnn.com/2014/04/23/health/veterans-dying-health-care-delays/index.html. Published April 23, 2014. Accessed November 25, 2019.
20. Ioannou GN, Beste LA, Chang MF, et al. Effectiveness of sofosbuvir, ledipasvir/sofosbuvir, or paritaprevir/ritonavir/ombitasvir and dasabuvir regimens for treatment of patients with hepatitis C in the Veterans Affairs national health care system. Gastroenterology. 2016;151(3):457-471.
21. Malespin MH, Harris C, Kanar O, et al. Barriers to treatment of chronic hepatitis C with direct acting antivirals in an urban clinic. Ann Hepatol. 2019;18(2):304–309.
22. Tuchschmidt J. Attachment D: Hepatitis C virus (HCV) fact sheet for Veterans Choice Program for both VA and Choice providers. US Department of Veterans Affairs Central Office Memorandum from the Deputy Under Secretary for Health for Policy and Services and the Acting Deputy Undersecretary for Health for Operations and Management. http://vaww.hepatitis.va.gov/educatiochoice-provision-HCV-treatment-additional.asp. [Nonpublic site.]
Factors Associated with Differential Readmission Diagnoses Following Acute Exacerbations of Chronic Obstructive Pulmonary Disease
Readmissions following hospitalization for exacerbations of chronic obstructive pulmonary disease (COPD) are common and economically burdensome.1 The Affordable Care Act2 outlined the Hospital Readmissions Reduction Program (HRRP),3 which aims to improve the quality of care and reduce the costs for patients with pneumonia, myocardial infarction, congestive heart failure, and COPD.3 With the implementation of the HRRP, readmission reduction has become a key priority of health systems.
Multiple approaches to reduce readmissions are published, with variable degrees of success across respiratory and all-cause rehospitalizations.4 Patient self-management programs are heterogenous with inconsistent utilization reductions.5-7 While some transitional care programs demonstrate benefits,8-10 one notable study of an intensive transitional care and self-management program showed increaseNod acute care utilization without improving health-related quality of life.11-13 Another study of COPD comprehensive care management was stopped prematurely for increased mortality in the intervention group.14 Telehealth monitoring may predict exacerbations,15,16 but inconsistent effects on quality of life and utilization are observed.17,18 Pulmonary rehabilitation improves quality of life but not healthcare utilization.19 Dispensing respiratory medications at hospital discharge shows improved prescription fills and fewer readmissions,20 further reinforced by inhaler training prior to discharge.21 Postdischarge oxygen therapy does not improve health-related quality of life or acute care utilization.22 The fact that these approaches have not reliably succeeded raises the need for further study on the drivers of readmissions in COPD. Previous studies found differences in factors associated with the timing of COPD readmissions and return diagnoses.23,24 While HRRP is Medicare-specific, health systems likely use programs targeting their entire population when planning readmission reduction strategies. Previous analyses were primarily single-center studies25 and Medicare24 or private insurance claims.26
In this analysis, we explore how comorbidity burden27-29 may differentially influence readmissions for recurrent COPD exacerbations versus other diagnoses. Our approach uses a national all-payer sample that covers a diverse geographic area across the United States, providing robust estimates of factors influencing readmission and valuable insights for planning and implementing effective readmission reduction programs. By including data from a period that encompasses the implementation of HRRP, we also provide new information on the factors in the HRRP postimplementation that are not yet available in published literature.
METHODS
Data Source
The Nationwide Readmissions Database (NRD) is a nationally representative, all-payer, 100% sample of community acute care hospital discharges from multiple states.30 We pooled COPD discharge records spanning 2010-2016, excluding those where the patients were not residents of the state in which they were hospitalized to minimize loss to follow-up.
Inclusion/Exclusion Criteria
Selection criteria mirrored the methodology used by the HRRP,31,32 defining an index discharge as a patient ≥40 years of age with a qualifying COPD diagnosis (Appendix Tables 1-2), discharged alive, with at least 30 days elapsed since previous hospitalization. We excluded discharges against medical advice or those from a hospital with fewer than 25 COPD discharges in that calendar year as per HRRP,31,32 as well as those involving lung transplants. In this pooled cross-sectional analysis, record identifiers were not reliably unique across years. We restricted to observations originating February-November because January stays may not have had the requisite HRRP 30-day washout period from last admission and December stays could not be tracked into the subsequent January.
Outcomes
We defined a readmission as subsequent hospitalization for any cause within 30 days of the index discharge, with exemptions defined by the HRRP (Appendix Figure 1).31,32 We segmented the readmission outcome into two parts: those readmitted with diagnoses that met the COPD HRRP criteria versus for any other diagnoses. We also tabulated diagnosis-related groups (DRGs) coded for the readmission observation to capture attributable cause for rehospitalization.
Our main independent variable was the Elixhauser Comorbidity Index score,33 constructed using adaptations of published software,34,35 having previously validated its use for modeling COPD readmissions.36 We involved covariates provided with the database, including sociodemographic variables (eg, age, sex, community characteristics, payer, and median income at patient’s ZIP code) and hospital characteristics (eg, size, ownership, teaching status). We constructed additional covariates to account for in-hospital events by aggregating ICD diagnosis and procedure codes (eg, mechanical ventilation), hospital discharge volume, and proportion of annual within-hospital Medicaid patient days as a surrogate marker for safety-net hospitals. A detailed explanation of database construction and selection criteria is found in the Supplemental Methods Appendix.
Statistical Analysis
We tabulated patient-level descriptive statistics across the three outcomes of interest (ie, not readmitted, readmitted for a stay that would have qualified as COPD-related by HRRP criteria and readmitted for any other diagnosis). Continuous variables were compared using Welch’s t-tests (ie, unequal variance) and categorical variables using Chi-squared tests. At the hospital level, we tabulated the proportions of hospitals within categories in key variables of interest and a sub-population readmission rate for that particular characteristic, compared using Chi-squared tests.
We fit a multilevel multinomial logistic regression with random intercepts at the hospital cluster level, with the tripartite readmission outcome described above with “not readmitted” as the reference group. We included fixed effects for year, Elixhauser score, and patient- and hospital-level covariates as described above. Time to readmission for each group was plotted to assess the time distribution for each outcome. In-hospital mortality during each readmission event was tabulated.
Sensitivity Analyses and Missing Data
We conducted sensitivity analyses to determine whether a lower age cutoff (≥18 years) affects modeling. We also tested the stability of our estimates across each individual year of the pooled analysis. To test the effect of time to differential readmission, we fit a Cox proportional hazards model within the readmitted patient subgroup with Huber-White standard errors clustered at the hospital level to estimate the differential hazard of readmission for COPD versus non-COPD diagnoses across the same variables of interest as a sensitivity analysis. We also tested using a liberal classification of readmission diagnoses by sorting into “respiratory” versus “nonrespiratory” returns, with DRGs 163 through 208 for “respiratory” versus all others, respectively. We tested the agreement between the HRRP ICD-based classification and DRG classification using Cohen’s kappa.
We designated a threshold of 10% missing data to necessitate imputation techniques, determined a priori for our main variables, none of which met this level. Complete case analyses were used for all models. Analyses were performed in Stata version 15.1 (StataCorp, College Station, Texas) with weighted estimates reported using patient-level survey weights for national representativeness.37 The study protocol was reviewed by the institutional review board at the University of California, Los Angeles, and deemed exempt from oversight due to the publicly available, deidentified nature of the data (IRB# 18-001208).
RESULTS
Out of 104,897,595 hospitalizations in the NRD, a final sample of 1,622,983 COPD discharges was identified for our analysis (sample weighted effective population 3,743,164). The overall readmission rate was 17.25%, with 7.69% of patients readmitted for COPD and 9.56% readmitted for other diagnoses. Those with COPD readmissions were significantly younger with a lower proportion of Medicare and a higher proportion of Medicaid as the primary payer compared with those readmitted for all other causes (Table 1). Compared with non-COPD-readmitted patients, COPD-readmitted patients were more frequently discharged home without services and had shorter lengths of stay. Noninvasive ventilation was more common among COPD readmissions while mechanical ventilation and tracheostomy placement were less frequent compared with non-COPD readmissions. Compared with non-COPD-readmitted patients, COPD-readmitted patients had significantly lower mean Elixhauser Comorbidity Index scores (17.8 vs 22.8), rates of congestive heart failure (28.3% vs 38.6%), and renal failure (11.8% vs 21.5%; Appendix Table 3).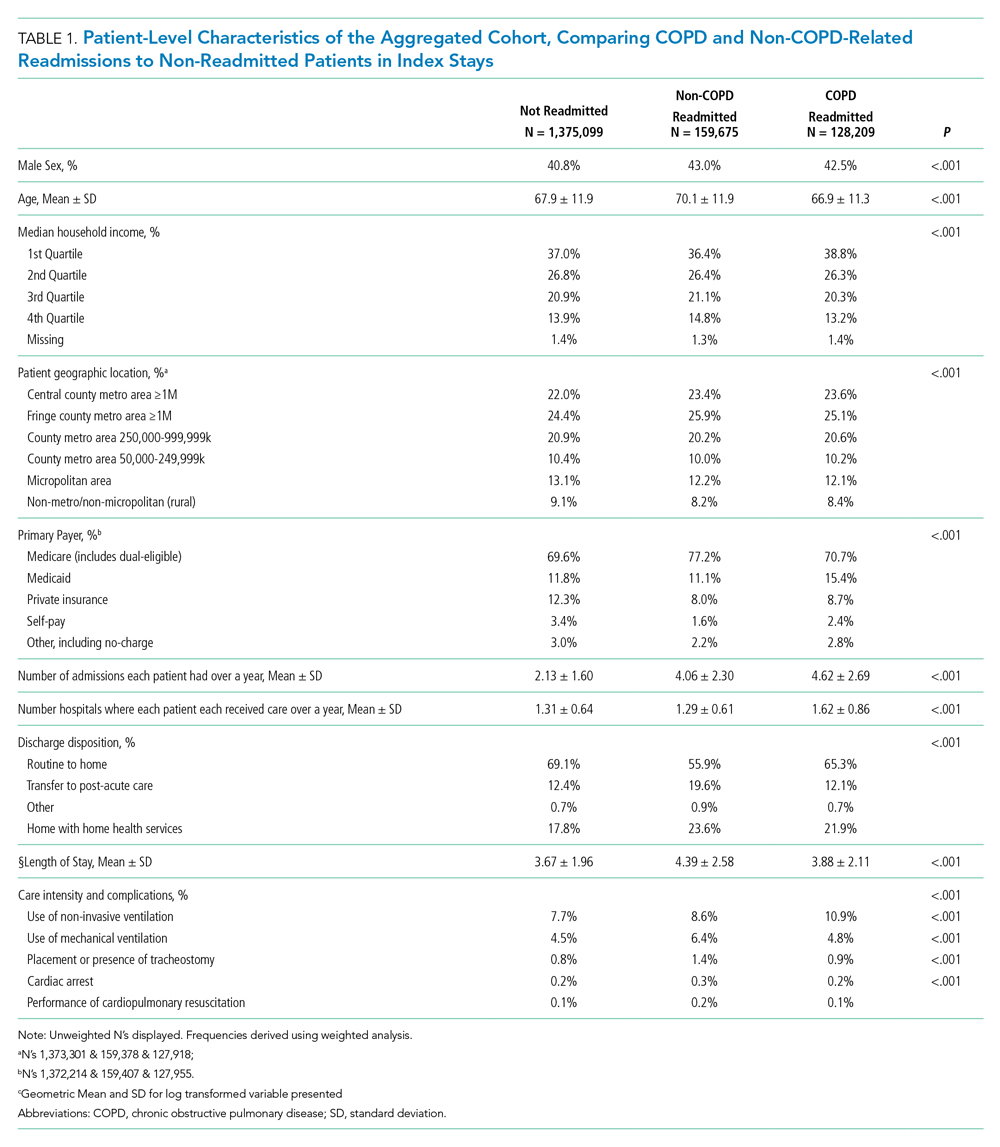
Readmission rates were significantly higher for non-COPD causes than for COPD causes across all hospital types by ownership, teaching status, or size (Table 2). Parallel patterns were observed for non-COPD and COPD readmissions across hospital types, with two key exceptions. Across categories of hospital ownership, for-profit hospitals had the highest rates for non-COPD readmissions, with no differences in hospital control for COPD rehospitalizations. While rates did not vary for non-COPD readmissions by within-hospital Medicaid prevalence, COPD readmission rates significantly increased as Medicaid-paid patient-days increased within hospitals.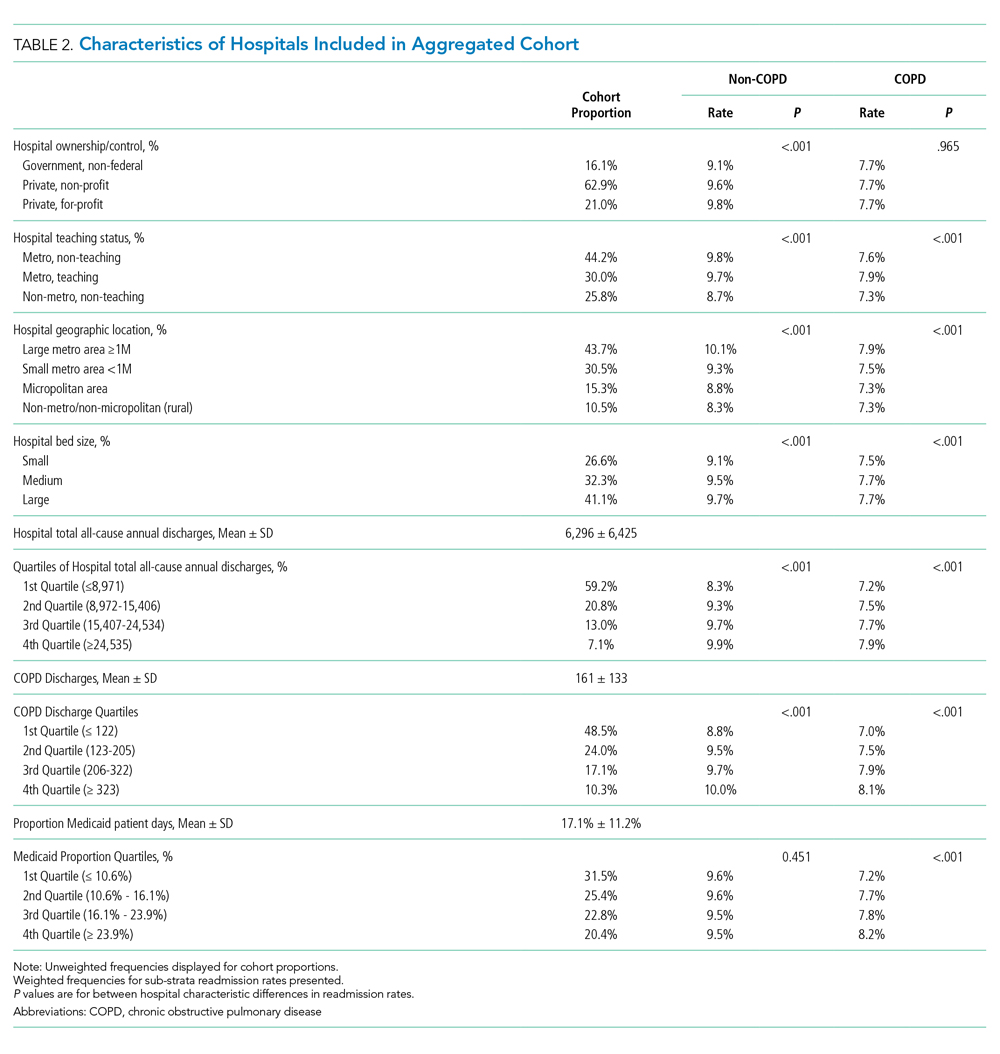
The median time to non-COPD readmission was 13 days, whereas COPD readmission was 14 days. More COPD readmissions occurred in the first 2.4 days after discharge, after which the proportion of non-COPD cases readmitted consistently increased. Observed readmission rates for COPD and other diagnoses trended down over the study period (Figure 1A), as did mortality rates during readmission stays (Figure 1B). Sepsis, heart failure, and respiratory infections were seven of the top 10 ranked DRGs for the non-COPD rehospitalizations (Appendix Table 4). In trend analyses (Appendix Tables 5-8), sepsis and DRGs with major comorbidities increased in proportion each year across the study period, possibly reflecting changes in coding practices.38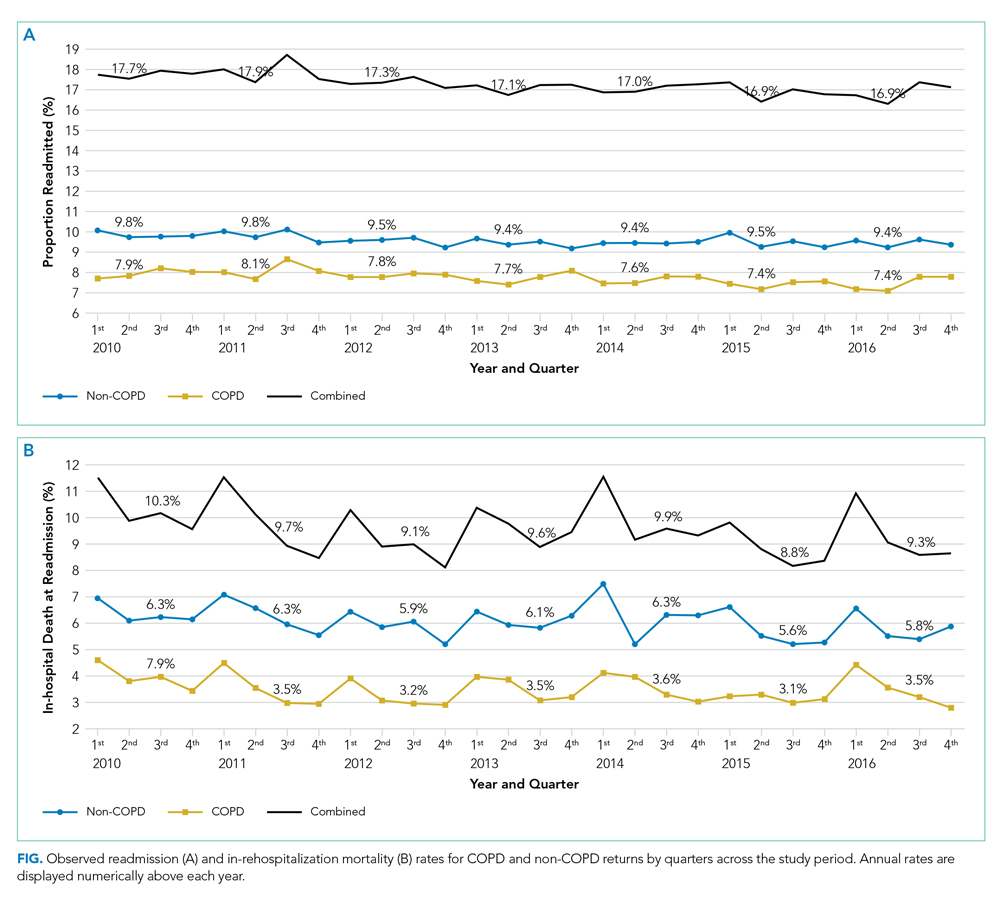
In our adjusted multinomial logistic regression model (Table 3), where the outcomes were not readmitted (reference category) versus readmitted for non-COPD diagnosis or for qualifying COPD diagnosis, the effect size of comorbidity, operationalized by change in the Elixhauser Comorbidity Index, was larger for non-COPD than non-COPD readmissions (odds ratio [OR] 1.19 vs 1.04 per one-half standard deviation of Elixhauser Index, an approximately 7.5 unit change in score). Increases in age were associated with higher non-COPD readmissions (OR 1.06 per 10 years) while actually protective against COPD readmissions (OR 0.89 per 10 years). Compared with Medicare patients, Medicaid patients had higher odds of COPD readmission (OR 1.10 vs 1.03) while the converse was observed in the privately insured (OR 0.65 vs 0.76). Transfers to postacute care facilities, referenced against discharges home, had a larger association with readmissions for non-COPD causes (OR 1.35 vs 1.00), whereas home-health had nearly equal adjusted readmission odds for each outcome (1.31 vs 1.30). Length of stay was associated with 1% greater odds per day for readmission for non-COPD causes than COPD returns. Regarding in-hospital events, odds of COPD readmission were higher for noninvasive ventilation (OR 1.37 vs 0.89) and mechanical ventilation (OR 0.87 vs 0.79, Appendix Table 9), which should be interpreted in the context that analyses were restricted to those discharged alive from their index admission, possibly biasing the true effect estimates due to competing risk of index in-hospital mortality.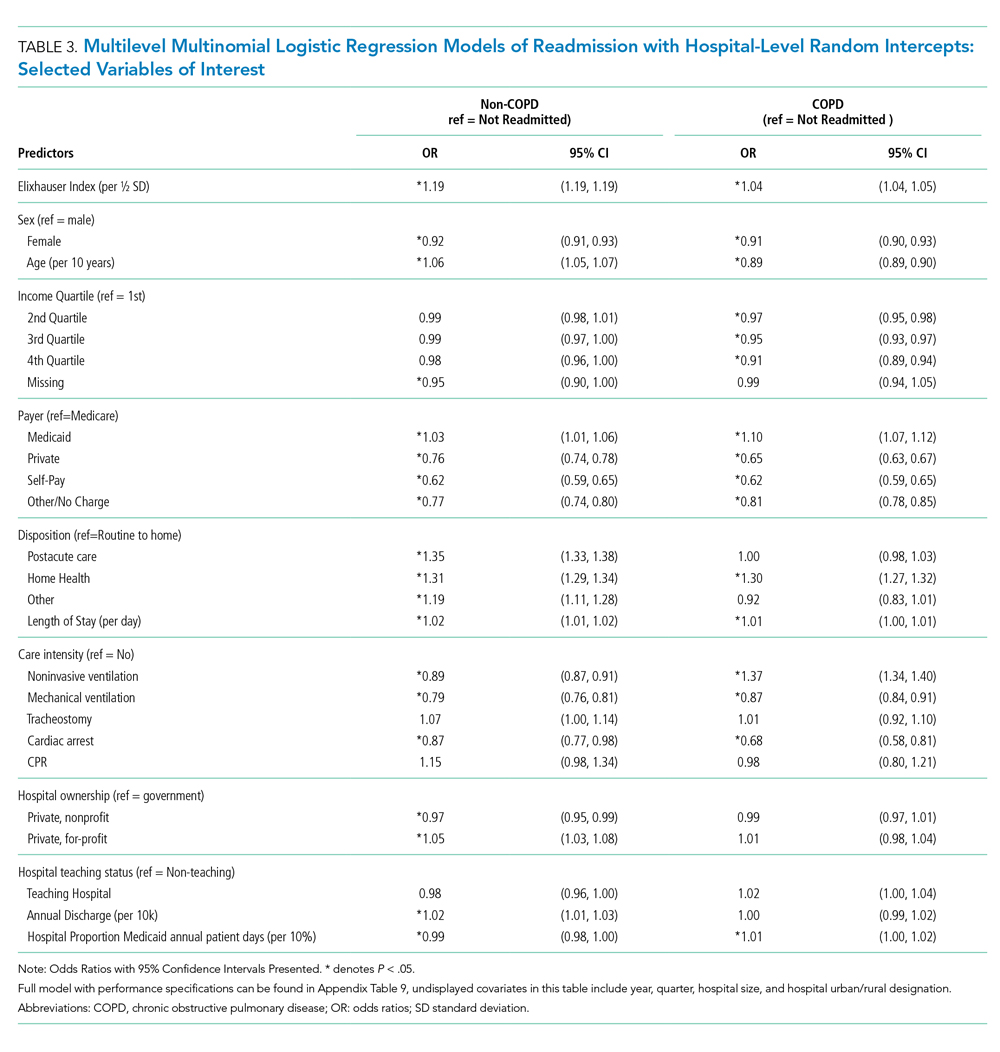
In sensitivity analyses, we found no significant differences between our Cox proportional hazards model (Appendix Table 10) and our multinomial model. When we liberalized readmission outcome definitions to respiratory versus nonrespiratory DRGs, we observed 86% agreement between the HRRP and DRG classification systems (κ = 0.73, P < .001). Among the discordant observations, 13% of non-COPD readmissions under HRRP criteria were reclassified as respiratory by DRG and 1% of COPD readmissions under HRRP reclassified as nonrespiratory. When our multinomial model (Appendix Table 11) was re-fit using the DRG-based outcome, only slight changes in effect size occurred. For the Elixhauser Index, the OR for COPD by HRRP was slightly lower than that for respiratory DRGs (1.04 vs 1.05), parallel with the difference between non-COPD by HRRP and nonrespiratory DRG classification (1.19 vs 1.21, respectively). This result underscores the greater influence of comorbidity on non-COPD than COPD readmissions. Only one sign change was observed in those who underwent tracheostomy (OR 0.91 for “nonrespiratory” DRG vs 1.07 for “non-COPD” by HRRP), likely reflecting the shift of some non-COPD diagnoses into the respiratory categorization based on tracheostomy having its own DRG. We also evaluated the multinomial model without the Elixhauser Index (only covariates) and found minor adjustments to the effect sizes of the covariates, particularly for discharge disposition. However, no sign changes were observed for any of the odds ratios (Appendix Table 12). Readmission odds by the Elixhauser score for each condition were stable across years (Appendix Figure 2 & Appendix Table 13). Finally, including 18-39-year-old patients in the cohort did not substantially change our estimates (Appendix Table 14).
DISCUSSION
In this assessment of readmission odds following hospitalizations for COPD in a nationally representative all-payer sample, we demonstrate that 55% of rehospitalizations following COPD exacerbations are attributable to non-COPD diagnoses and describe the important role of comorbidity on influencing diagnoses at rehospitalization. These findings are consistent with a prior study of Medicare patients by Shah et al.24 and expand upon the results of Jacobs et al. using a pre-HRRP sample of the NRD.23 Our study offers an expanded analysis by including data spanning HRRP implementation, which went into effect for COPD in October 2014.3 Effect estimates were stable across all seven years of our study in sensitivity analyses, demonstrating the robustness of our findings. Our analysis also adds to the existing body of literature by assessing which factors are associated with readmissions related to ongoing COPD versus other diagnoses.
In our study, an increase in aggregated comorbidity by the Elixhauser Index was associated with a significantly higher readmission odds, with over four times the effect size for non-COPD than COPD returns. Comorbidity also moderated the effect of other factors, such as income and discharge disposition. While overall readmission rates declined across the course of the study period, the effect of comorbidity on readmission odds for both groups remained significant in annualized models. We also observed higher rates of nearly every individual Elixhauser component comorbidity in those readmitted for non-COPD causes compared with those readmitted for COPD causes. Taken together, these results underscore the need to account for comorbidities at the individual and composite levels when identifying those at highest risk for readmissions and necessitate a multidisciplinary approach to reduce risk for the multimorbid patient.
In a 2018 report, the American Thoracic Society highlighted the focus of programs on adherence to guidelines and reducing variability in COPD care as a potential pitfall in efforts to reduce COPD readmissions.39 We demonstrate that a majority of patients who are readmitted return for diagnoses other than COPD. This finding further highlights that readmission reduction programs need not only focus on COPD control but on the overall management of the patient’s complex medical comorbidities. HRRP penalties are assessed for all-cause readmissions,31,32 and attention to the entire range of diagnoses leading to return to hospital is important to reduce readmission rates and expenditures. Use of strategies such as multispecialty clinics or integrated practice units may be useful in mitigating risk in multimorbid COPD patients.
Other significant factors that deserve further investigation include the use of postacute care services, including home health and skilled nursing facilities. Both factors were associated with higher likelihood of returning for non-COPD than for COPD-related diagnoses. This finding may be collinear to some degree with comorbidity because complex patients are probably less likely to be discharged home directly. Interestingly, those discharged to a postacute care facility had substantially high odds of readmission for a non-COPD cause. Transitional care programs, including short stays in a nursing home, are often employed to mitigate the risk of adverse outcomes after discharge in sicker patients,40 which may be insufficient based on these data.
We applied the HRRP criteria for coding a COPD-related admission to the readmission diagnoses, which is more stringent than using only a principal diagnosis or DRGs, to maintain the same standard for defining the index and readmission event. In the sensitivity analyses, we did not find significant differences in our estimates of comorbidity’s effect on outcomes using a more liberal DRG classification system.
We also used DRGs to classify the readmission causes in order to use the same grouping logic that a payer would use when determining the cause. When evaluating which DRG patients returned for following a COPD exacerbation, pneumonia or other respiratory infections make up 13.8%, which may represent the evolution of respiratory infections that provoked the original exacerbation. Heart failure comprised 9.1% of the non-COPD causes, with about one-third of our COPD cohort having known comorbid heart failure at the time of index admission, illustrating significant overlap between these two conditions. Heart failure and pneumonia are conditions of interest in the HRRP and would potentially garner their own penalties had sufficient time elapsed since a prior hospitalization. Among other causes in the top 20 return DRGs were esophagitis, gastritis, gastrointestinal bleeding, and psychoses, which may be potentially associated with the use of corticosteroids to treat a COPD exacerbation, as described in other population studies.41,42 Lack of medication regimen data in our analysis precludes further attribution of these causes, but the potential associations are interesting and warrant additional study.
The structure of our data as pooled annual cross sections rather than a true longitudinal cohort limited us to use only 10 months (February to November) of index hospitalizations in order to stay aligned with HRRP policy inclusion criteria. As such, we may have missed some important observations during peak respiratory virus season. As in any administrative data analysis, we are limited to codes in the discharge records, which may not reflect the entire nature of a hospitalization. Administrative data are particularly problematic in identifying true COPD exacerbations, particularly with multiple comorbid cardiopulmonary conditions.43,44 Validating coding algorithms for identifying COPD was beyond the scope of our evaluation, which purposefully used HRRP methodology. Further study thereof would be a useful endeavor, especially with transition to ICD-10, considering that previously published evaluation was limited to ICD-9.44 Despite these limitations, we were left with a robust and representative national cohort, which is an acceptable tradeoff.
CONCLUSION
Our study highlights the importance of understanding comorbidity as a major determinant of readmissions following COPD exacerbations, particularly in distinguishing which patients will return for COPD versus non-COPD-related diagnoses. At the health system level, readmission programs should be designed with the multimorbid patient in mind. Engagement of care teams, facilitating communication, and shared decision making are strategies to mitigate readmission risk in addition to COPD-focused disease management.39 These data highlight the need to use risk prediction tools in assigning resources to reduce readmissions,45 as well as the need to move readmission reduction programs beyond COPD management alone. Developing such systems to prospectively identify which patients are at risk of returning for both COPD and non-COPD reasons may further elucidate readmission mitigation strategies and should be a subject of future prospective study.
Acknowledgments
Data were made available through the Agency for Healthcare Research and Quality’s Healthcare Utilization Project. A full list of partner organizations providing data for the Nationwide Readmission Database can be found at https://www.hcup-us.ahrq.gov/db/hcupdatapartners.jsp.
Prior Presentation
Portions of this work were presented in abstract form at the 2018 American Thoracic Society International Conference (May 2018, San Diego, CA). This manuscript is derived from the doctoral dissertation for the degree of PhD in Health Policy and Management of the corresponding author, conferred in June 2019.
Disclaimer
This article does not necessarily represent the views and policies of the Department of Veterans Affairs or the USPSTF.
1. Press VG, Konetzka RT, White SR. Insights about the economic impact of chronic obstructive pulmonary disease readmissions post implementation of the hospital readmission reduction program. Curr Opin Pulm Med. 2018;24(2):138-146. https://doi.org/10.1097/MCP.0000000000000454.
2. Patient protection and affordable care act, 124. Stat. 1886;10939:119 U.S.C, §3025(q). 2010).
3. Centers for Medicare & Medicaid Services. Readmissions Reduction Program. Updated 30 November 2017. https://www.cms.gov/Medicare/Medicare-Fee-for-Service-Payment/AcuteInpatientPPS/Readmissions-Reduction-Program.html. Published. Accessed February 7, 2018; 2017.
4. Shah T, Press VG, Huisingh-Scheetz M, White SR. COPD readmissions: addressing COPD in the era of Value-Based Health Care. Chest. 2016;150(4):916-926. https://doi.org/10.1016/j.chest.2016.05.002.
5. Gadoury MA, Schwartzman K, Rouleau M, et al. Self-management reduces both short- and long-term hospitalisation in COPD. Eur Respir J. 2005;26(5):853-857. https://doi.org/10.1183/09031936.05.00093204.
6. Zwerink M, Brusse-Keizer M, van der Valk PD, et al. Self management for patients with chronic obstructive pulmonary disease. Cochrane Database Syst Rev. 2014;3(3):CD002990. https://doi.org/10.1002/14651858.CD002990.pub3.
7. Lenferink A, van der Palen J, van der Valk PDLPM, et al. Exacerbation action plans for patients with COPD and comorbidities: a randomised controlled trial. Eur Respir J. 2019;54(5). https://doi.org/10.1183/13993003.02134-2018.
8. Jackson CT, Trygstad TK, DeWalt DA, DuBard CA. Transitional care cut hospital readmissions for North Carolina Medicaid patients with complex chronic conditions. Health Aff (Millwood). 2013;32(8):1407-1415. https://doi.org/10.1377/hlthaff.2013.0047.
9. Verhaegh KJ, MacNeil-Vroomen JL, Eslami S et al. Transitional care interventions prevent hospital readmissions for adults with chronic illnesses. Health Aff (Millwood). 2014;33(9):1531-1539. https://doi.org/10.1377/hlthaff.2014.0160.
10. Ridwan ES, Hadi H, Wu YL, Tsai PS. Effects of transitional care on hospital readmission and mortality rate in subjects With COPD: A systematic review and meta-analysis. Respir Care. 2019;64(9):1146-1156. https://doi.org/10.4187/respcare.06959.
11. Aboumatar H, Naqibuddin M, Chung S, et al. Effect of a program combining transitional care and long-term self-management support on outcomes of hospitalized patients With chronic obstructive pulmonary disease: A randomized clinical trial. JAMA. 2018;320(22):2335-2343. https://doi.org/10.1001/jama.2018.17933.
12. Aboumatar H, Naqibuddin M, Chung S, et al. Effect of a program combining transitional care and long-term self-management support on outcomes of hospitalized patients with chronic obstructive pulmonary disease: a randomized clinical trial. JAMA. 2018;320(22):2335-2343. https://doi.org/10.1001/jama.2018.17933.
13. Aboumatar H, Naqibuddin M, Chung S, et al. Effect of a hospital-initiated program combining transitional care and long-term self-management support on outcomes of patients hospitalized with chronic obstructive pulmonary disease: A randomized clinical trial. JAMA. 2019;322(14):1371-1380. https://doi.org/10.1001/jama.2019.11982.
14. Fan VS, Gaziano JM, Lew R, et al. A comprehensive care management program to prevent chronic obstructive pulmonary disease hospitalizations: a randomized, controlled trial. Ann Intern Med. 2012;156(10):673-683. https://doi.org/10.7326/0003-4819-156-10-201205150-00003.
15. Jensen MH, Cichosz SL, Dinesen B, Hejlesen OK. Moving prediction of exacerbation in chronic obstructive pulmonary disease for patients in telecare. J Telemed Telecare. 2012;18(2):99-103. https://doi.org/10.1258/jtt.2011.110607.
16. Pedone C, Chiurco D, Scarlata S, Incalzi RA. Efficacy of multiparametric telemonitoring on respiratory outcomes in elderly people with COPD: a randomized controlled trial. BMC Health Serv Res. 2013;13:82. https://doi.org/10.1186/1472-6963-13-82.
17. Pinnock H, Hanley J, McCloughan L, et al. Effectiveness of telemonitoring integrated into existing clinical services on hospital admission for exacerbation of chronic obstructive pulmonary disease: researcher blind, multicentre, randomised controlled trial. BMJ. 2013;347:f6070. https://doi.org/10.1136/bmj.f6070.
18. McLean S, Nurmatov U, Liu JL et al. Telehealthcare for chronic obstructive pulmonary disease. Cochrane Database Syst Rev. 2011;7(7):CD007718. https://doi.org/10.1002/14651858.CD007718.pub2.
19. Ko FW, Dai DL, Ngai J, et al. Effect of early pulmonary rehabilitation on health care utilization and health status in patients hospitalized with acute exacerbations of COPD. Respirology. 2011;16(4):617-624. https://doi.org/10.1111/j.1440-1843.2010.01921.x.
20. Blee J, Roux RK, Gautreaux S, Sherer JT, Garey KW. Dispensing inhalers to patients with chronic obstructive pulmonary disease on hospital discharge: effects on prescription filling and readmission. Am J Health Syst Pharm. 2015;72(14):1204-1208. https://doi.org/10.2146/ajhp140621.
21. Press VG, Arora VM, Trela KC, et al. Effectiveness of interventions to teach metered-dose and Diskus inhaler techniques. A randomized trial. Ann Am Thor Soc. 2016;13(6):816-824. https://doi.org/10.1513/AnnalsATS.201509-603OC.
22. Eaton T, Fergusson W, Kolbe J, Lewis CA, West T. Short-burst oxygen therapy for COPD patients: a 6-month randomised, controlled study. Eur Respir J. 2006;27(4):697-704. https://doi.org/10.1183/09031936.06.00098805.
23. Jacobs DM, Noyes K, Zhao J, et al. Early hospital readmissions after an acute exacerbation of chronic obstructive pulmonary disease in the Nationwide Readmissions Database. Ann Am Thor Soc. 2018;15(7):837-845. https://doi.org/10.1513/AnnalsATS.201712-913OC.
24. Shah T, Churpek MM, Coca Perraillon M, Konetzka RT. Understanding why patients with COPD get readmitted: a large national study to delineate the Medicare population for the readmissions penalty expansion. Chest. 2015;147(5):1219-1226. https://doi.org/10.1378/chest.14-2181.
25. Glaser JB, El-Haddad H. Exploring novel Medicare readmission risk variables in chronic obstructive pulmonary disease patients at high risk of readmission within 30 days of hospital discharge. Ann Am Thor Soc. 2015;12(9):1288-1293. https://doi.org/10.1513/AnnalsATS.201504-228OC.
26. Sharif R, Parekh TM, Pierson KS, Kuo YF, Sharma G. Predictors of early readmission among patients 40 to 64 years of age hospitalized for chronic obstructive pulmonary disease. Ann Am Thor Soc. 2014;11(5):685-694. https://doi.org/10.1513/AnnalsATS.201310-358OC.
27. Global Initiative for Chronic Obstructive Lung Disease. Global strategy for the prevention, diagnosis, and management of COPD. https://goldcopd.org/wp-content/uploads/2018/11/GOLD-2019-v1.7-FINAL-14Nov2018-WMS.pdf. Published; 2019.
28. Spece LJ, Epler EM, Donovan LM, et al. Role of comorbidities in treatment and outcomes after chronic obstructive pulmonary disease exacerbations. Ann Am Thor Soc. 2018;15(9):1033-1038. https://doi.org/10.1513/AnnalsATS.201804-255OC.
29. Westney G, Foreman MG, Xu J et al. Impact of comorbidities Among Medicaid enrollees With chronic obstructive pulmonary disease, United States, 2009. Prev Chronic Dis. 2017;14:E31. https://doi.org/10.5888/pcd14.160333.
30. HCUP Nationwide Readmissions Database (NRD). https://www.hcup-us.ahrq.gov/nrdoverview.jsp; 2010-2016. Agency for Healthcare Research and Quality. Accessed September 1, 2018.
31. Yale New Haven Health Services Corporation/Center for Outcomes Research & Evaluation. 2016 Condition-Specific Measures Updates and Specifications Report Hospital-Level 30-Day Risk-Standardized Readmission Measures. Baltimore, MD: Centers for Medicare & Medicaid Services; 2016. Available from: https://www.qualitynet.org/files/5d0d3ac7764be766b0104a88?filename=2016_Rdmsn_Msr_Resources.zip. Accessed August 29, 2018.
32. Yale New Haven Health Services Corporation/Center for Outcomes Research & Evaluation. 2017 Condition-Specific Measures Updates and Specifications Report Hospital-Level 30-Day Risk-Standardized Readmission Measures. Baltimore, MD: Centers for Medicare & Medicaid Services; 2016. Available from: https://www.cms.gov/Medicare/Quality-Initiatives-Patient-Assessment-Instruments/HospitalQualityInits/Downloads/AMI-HF-PN-COPD-and-Stroke-Readmission-Updates.zip. Accessed November 7, 2018.
33. Moore BJ, White S, Washington R, Coenen N, Elixhauser A. Identifying increased risk of readmission and in-hospital mortality using hospital administrative data: the AHRQ Elixhauser comorbidity index. Med Care. 2017;55(7):698-705. https://doi.org/10.1097/MLR.0000000000000735.
34. Stagg V. Elixhauser. Stata Module to Calculate Elixhauser Index of Comorbidity [computer program]. Boston: College Department of Economics: Statistical Software Components; 2015.
35. Agency for Healthcare Research and Quality. Healthcare Cost and Utilization Project. HCUP Elixhauser comorbidity software. www.hcup-us.ahrq.gov/toolssoftware/comorbidity/comorbidity.jsp. Accessed March 1, 2019.
36. Buhr RG, Jackson NJ, Kominski GF, et al. Comorbidity and thirty-day hospital readmission odds in chronic obstructive pulmonary disease: a comparison of the Charlson and Elixhauser comorbidity indices. BMC Health Serv Res. 2019;19(1):701. https://doi.org/10.1186/s12913-019-4549-4.
37. Healthcare Cost and Utilization Project. Introduction to the HCUP Nationwide Readmissions Database (NRD). https://www.hcup-us.ahrq.gov/db/nation/nrd/Introduction_NRD_2010-2016.jsp. Published. Updated August 2018. Accessed October 15, 2018.
38. Steinwald B, Dummit LA. Hospital case-mix change: sicker patients or DRG creep? Health Aff (Millwood). 1989;8(2):35-47. https://doi.org/10.1377/hlthaff.8.2.35.
39. Press VG, Au DH, Bourbeau J, et al. Reducing chronic obstructive pulmonary disease hospital readmissions. An Official American Thoracic Society Workshop Report. Ann Am Thorac Soc. An Official American Thoracic Society Workshop Report. 2019;16(2):161-170. https://doi.org/10.1513/AnnalsATS.201811-755WS.
40. McHugh JP, Foster A, Mor V, et al. Reducing hospital readmissions Through preferred networks of skilled nursing facilities. Health Aff (Millwood). 2017;36(9):1591-1598. https://doi.org/10.1377/hlthaff.2017.0211.
41. Huang KW, Kuan YC, Chi NF et al. Chronic obstructive pulmonary disease is associated with increased recurrent peptic ulcer bleeding risk. Eur J Intern Med. 2017;37:75-82. https://doi.org/10.1016/j.ejim.2016.09.020.
42. Judd LL, Schettler PJ, Brown ES, et al. Adverse consequences of glucocorticoid medication: psychological, cognitive, and behavioral effects. Am J Psychiatry. 2014;171(10):1045-1051. https://doi.org/10.1176/appi.ajp.2014.13091264.
43. Stein BD, Bautista A, Schumock GT, et al. The validity of International Classification of Diseases, ninth Revision, Clinical Modification diagnosis codes for identifying patients hospitalized for COPD exacerbations. Chest. 2012;141(1):87-93. https://doi.org/10.1378/chest.11-0024.
44. Prieto-Centurion V, Rolle AJ, Au DH et al.Multicenter study comparing case definitions used to identify patients with chronic obstructive pulmonary disease. Am J Respir Crit Care Med. 2014;190(9):989-995. https://doi.org/10.1164/rccm.201406-1166OC.
45. Press VG. Is it time to move on from identifying risk factors for 30-day chronic obstructive pulmonary disease readmission? A call for risk prediction tools. Ann Am Thor Soc. 2018;15(7):801-803. https://doi.org/10.1513/AnnalsATS.201804-246ED.
Readmissions following hospitalization for exacerbations of chronic obstructive pulmonary disease (COPD) are common and economically burdensome.1 The Affordable Care Act2 outlined the Hospital Readmissions Reduction Program (HRRP),3 which aims to improve the quality of care and reduce the costs for patients with pneumonia, myocardial infarction, congestive heart failure, and COPD.3 With the implementation of the HRRP, readmission reduction has become a key priority of health systems.
Multiple approaches to reduce readmissions are published, with variable degrees of success across respiratory and all-cause rehospitalizations.4 Patient self-management programs are heterogenous with inconsistent utilization reductions.5-7 While some transitional care programs demonstrate benefits,8-10 one notable study of an intensive transitional care and self-management program showed increaseNod acute care utilization without improving health-related quality of life.11-13 Another study of COPD comprehensive care management was stopped prematurely for increased mortality in the intervention group.14 Telehealth monitoring may predict exacerbations,15,16 but inconsistent effects on quality of life and utilization are observed.17,18 Pulmonary rehabilitation improves quality of life but not healthcare utilization.19 Dispensing respiratory medications at hospital discharge shows improved prescription fills and fewer readmissions,20 further reinforced by inhaler training prior to discharge.21 Postdischarge oxygen therapy does not improve health-related quality of life or acute care utilization.22 The fact that these approaches have not reliably succeeded raises the need for further study on the drivers of readmissions in COPD. Previous studies found differences in factors associated with the timing of COPD readmissions and return diagnoses.23,24 While HRRP is Medicare-specific, health systems likely use programs targeting their entire population when planning readmission reduction strategies. Previous analyses were primarily single-center studies25 and Medicare24 or private insurance claims.26
In this analysis, we explore how comorbidity burden27-29 may differentially influence readmissions for recurrent COPD exacerbations versus other diagnoses. Our approach uses a national all-payer sample that covers a diverse geographic area across the United States, providing robust estimates of factors influencing readmission and valuable insights for planning and implementing effective readmission reduction programs. By including data from a period that encompasses the implementation of HRRP, we also provide new information on the factors in the HRRP postimplementation that are not yet available in published literature.
METHODS
Data Source
The Nationwide Readmissions Database (NRD) is a nationally representative, all-payer, 100% sample of community acute care hospital discharges from multiple states.30 We pooled COPD discharge records spanning 2010-2016, excluding those where the patients were not residents of the state in which they were hospitalized to minimize loss to follow-up.
Inclusion/Exclusion Criteria
Selection criteria mirrored the methodology used by the HRRP,31,32 defining an index discharge as a patient ≥40 years of age with a qualifying COPD diagnosis (Appendix Tables 1-2), discharged alive, with at least 30 days elapsed since previous hospitalization. We excluded discharges against medical advice or those from a hospital with fewer than 25 COPD discharges in that calendar year as per HRRP,31,32 as well as those involving lung transplants. In this pooled cross-sectional analysis, record identifiers were not reliably unique across years. We restricted to observations originating February-November because January stays may not have had the requisite HRRP 30-day washout period from last admission and December stays could not be tracked into the subsequent January.
Outcomes
We defined a readmission as subsequent hospitalization for any cause within 30 days of the index discharge, with exemptions defined by the HRRP (Appendix Figure 1).31,32 We segmented the readmission outcome into two parts: those readmitted with diagnoses that met the COPD HRRP criteria versus for any other diagnoses. We also tabulated diagnosis-related groups (DRGs) coded for the readmission observation to capture attributable cause for rehospitalization.
Our main independent variable was the Elixhauser Comorbidity Index score,33 constructed using adaptations of published software,34,35 having previously validated its use for modeling COPD readmissions.36 We involved covariates provided with the database, including sociodemographic variables (eg, age, sex, community characteristics, payer, and median income at patient’s ZIP code) and hospital characteristics (eg, size, ownership, teaching status). We constructed additional covariates to account for in-hospital events by aggregating ICD diagnosis and procedure codes (eg, mechanical ventilation), hospital discharge volume, and proportion of annual within-hospital Medicaid patient days as a surrogate marker for safety-net hospitals. A detailed explanation of database construction and selection criteria is found in the Supplemental Methods Appendix.
Statistical Analysis
We tabulated patient-level descriptive statistics across the three outcomes of interest (ie, not readmitted, readmitted for a stay that would have qualified as COPD-related by HRRP criteria and readmitted for any other diagnosis). Continuous variables were compared using Welch’s t-tests (ie, unequal variance) and categorical variables using Chi-squared tests. At the hospital level, we tabulated the proportions of hospitals within categories in key variables of interest and a sub-population readmission rate for that particular characteristic, compared using Chi-squared tests.
We fit a multilevel multinomial logistic regression with random intercepts at the hospital cluster level, with the tripartite readmission outcome described above with “not readmitted” as the reference group. We included fixed effects for year, Elixhauser score, and patient- and hospital-level covariates as described above. Time to readmission for each group was plotted to assess the time distribution for each outcome. In-hospital mortality during each readmission event was tabulated.
Sensitivity Analyses and Missing Data
We conducted sensitivity analyses to determine whether a lower age cutoff (≥18 years) affects modeling. We also tested the stability of our estimates across each individual year of the pooled analysis. To test the effect of time to differential readmission, we fit a Cox proportional hazards model within the readmitted patient subgroup with Huber-White standard errors clustered at the hospital level to estimate the differential hazard of readmission for COPD versus non-COPD diagnoses across the same variables of interest as a sensitivity analysis. We also tested using a liberal classification of readmission diagnoses by sorting into “respiratory” versus “nonrespiratory” returns, with DRGs 163 through 208 for “respiratory” versus all others, respectively. We tested the agreement between the HRRP ICD-based classification and DRG classification using Cohen’s kappa.
We designated a threshold of 10% missing data to necessitate imputation techniques, determined a priori for our main variables, none of which met this level. Complete case analyses were used for all models. Analyses were performed in Stata version 15.1 (StataCorp, College Station, Texas) with weighted estimates reported using patient-level survey weights for national representativeness.37 The study protocol was reviewed by the institutional review board at the University of California, Los Angeles, and deemed exempt from oversight due to the publicly available, deidentified nature of the data (IRB# 18-001208).
RESULTS
Out of 104,897,595 hospitalizations in the NRD, a final sample of 1,622,983 COPD discharges was identified for our analysis (sample weighted effective population 3,743,164). The overall readmission rate was 17.25%, with 7.69% of patients readmitted for COPD and 9.56% readmitted for other diagnoses. Those with COPD readmissions were significantly younger with a lower proportion of Medicare and a higher proportion of Medicaid as the primary payer compared with those readmitted for all other causes (Table 1). Compared with non-COPD-readmitted patients, COPD-readmitted patients were more frequently discharged home without services and had shorter lengths of stay. Noninvasive ventilation was more common among COPD readmissions while mechanical ventilation and tracheostomy placement were less frequent compared with non-COPD readmissions. Compared with non-COPD-readmitted patients, COPD-readmitted patients had significantly lower mean Elixhauser Comorbidity Index scores (17.8 vs 22.8), rates of congestive heart failure (28.3% vs 38.6%), and renal failure (11.8% vs 21.5%; Appendix Table 3).
Readmission rates were significantly higher for non-COPD causes than for COPD causes across all hospital types by ownership, teaching status, or size (Table 2). Parallel patterns were observed for non-COPD and COPD readmissions across hospital types, with two key exceptions. Across categories of hospital ownership, for-profit hospitals had the highest rates for non-COPD readmissions, with no differences in hospital control for COPD rehospitalizations. While rates did not vary for non-COPD readmissions by within-hospital Medicaid prevalence, COPD readmission rates significantly increased as Medicaid-paid patient-days increased within hospitals.
The median time to non-COPD readmission was 13 days, whereas COPD readmission was 14 days. More COPD readmissions occurred in the first 2.4 days after discharge, after which the proportion of non-COPD cases readmitted consistently increased. Observed readmission rates for COPD and other diagnoses trended down over the study period (Figure 1A), as did mortality rates during readmission stays (Figure 1B). Sepsis, heart failure, and respiratory infections were seven of the top 10 ranked DRGs for the non-COPD rehospitalizations (Appendix Table 4). In trend analyses (Appendix Tables 5-8), sepsis and DRGs with major comorbidities increased in proportion each year across the study period, possibly reflecting changes in coding practices.38
In our adjusted multinomial logistic regression model (Table 3), where the outcomes were not readmitted (reference category) versus readmitted for non-COPD diagnosis or for qualifying COPD diagnosis, the effect size of comorbidity, operationalized by change in the Elixhauser Comorbidity Index, was larger for non-COPD than non-COPD readmissions (odds ratio [OR] 1.19 vs 1.04 per one-half standard deviation of Elixhauser Index, an approximately 7.5 unit change in score). Increases in age were associated with higher non-COPD readmissions (OR 1.06 per 10 years) while actually protective against COPD readmissions (OR 0.89 per 10 years). Compared with Medicare patients, Medicaid patients had higher odds of COPD readmission (OR 1.10 vs 1.03) while the converse was observed in the privately insured (OR 0.65 vs 0.76). Transfers to postacute care facilities, referenced against discharges home, had a larger association with readmissions for non-COPD causes (OR 1.35 vs 1.00), whereas home-health had nearly equal adjusted readmission odds for each outcome (1.31 vs 1.30). Length of stay was associated with 1% greater odds per day for readmission for non-COPD causes than COPD returns. Regarding in-hospital events, odds of COPD readmission were higher for noninvasive ventilation (OR 1.37 vs 0.89) and mechanical ventilation (OR 0.87 vs 0.79, Appendix Table 9), which should be interpreted in the context that analyses were restricted to those discharged alive from their index admission, possibly biasing the true effect estimates due to competing risk of index in-hospital mortality.
In sensitivity analyses, we found no significant differences between our Cox proportional hazards model (Appendix Table 10) and our multinomial model. When we liberalized readmission outcome definitions to respiratory versus nonrespiratory DRGs, we observed 86% agreement between the HRRP and DRG classification systems (κ = 0.73, P < .001). Among the discordant observations, 13% of non-COPD readmissions under HRRP criteria were reclassified as respiratory by DRG and 1% of COPD readmissions under HRRP reclassified as nonrespiratory. When our multinomial model (Appendix Table 11) was re-fit using the DRG-based outcome, only slight changes in effect size occurred. For the Elixhauser Index, the OR for COPD by HRRP was slightly lower than that for respiratory DRGs (1.04 vs 1.05), parallel with the difference between non-COPD by HRRP and nonrespiratory DRG classification (1.19 vs 1.21, respectively). This result underscores the greater influence of comorbidity on non-COPD than COPD readmissions. Only one sign change was observed in those who underwent tracheostomy (OR 0.91 for “nonrespiratory” DRG vs 1.07 for “non-COPD” by HRRP), likely reflecting the shift of some non-COPD diagnoses into the respiratory categorization based on tracheostomy having its own DRG. We also evaluated the multinomial model without the Elixhauser Index (only covariates) and found minor adjustments to the effect sizes of the covariates, particularly for discharge disposition. However, no sign changes were observed for any of the odds ratios (Appendix Table 12). Readmission odds by the Elixhauser score for each condition were stable across years (Appendix Figure 2 & Appendix Table 13). Finally, including 18-39-year-old patients in the cohort did not substantially change our estimates (Appendix Table 14).
DISCUSSION
In this assessment of readmission odds following hospitalizations for COPD in a nationally representative all-payer sample, we demonstrate that 55% of rehospitalizations following COPD exacerbations are attributable to non-COPD diagnoses and describe the important role of comorbidity on influencing diagnoses at rehospitalization. These findings are consistent with a prior study of Medicare patients by Shah et al.24 and expand upon the results of Jacobs et al. using a pre-HRRP sample of the NRD.23 Our study offers an expanded analysis by including data spanning HRRP implementation, which went into effect for COPD in October 2014.3 Effect estimates were stable across all seven years of our study in sensitivity analyses, demonstrating the robustness of our findings. Our analysis also adds to the existing body of literature by assessing which factors are associated with readmissions related to ongoing COPD versus other diagnoses.
In our study, an increase in aggregated comorbidity by the Elixhauser Index was associated with a significantly higher readmission odds, with over four times the effect size for non-COPD than COPD returns. Comorbidity also moderated the effect of other factors, such as income and discharge disposition. While overall readmission rates declined across the course of the study period, the effect of comorbidity on readmission odds for both groups remained significant in annualized models. We also observed higher rates of nearly every individual Elixhauser component comorbidity in those readmitted for non-COPD causes compared with those readmitted for COPD causes. Taken together, these results underscore the need to account for comorbidities at the individual and composite levels when identifying those at highest risk for readmissions and necessitate a multidisciplinary approach to reduce risk for the multimorbid patient.
In a 2018 report, the American Thoracic Society highlighted the focus of programs on adherence to guidelines and reducing variability in COPD care as a potential pitfall in efforts to reduce COPD readmissions.39 We demonstrate that a majority of patients who are readmitted return for diagnoses other than COPD. This finding further highlights that readmission reduction programs need not only focus on COPD control but on the overall management of the patient’s complex medical comorbidities. HRRP penalties are assessed for all-cause readmissions,31,32 and attention to the entire range of diagnoses leading to return to hospital is important to reduce readmission rates and expenditures. Use of strategies such as multispecialty clinics or integrated practice units may be useful in mitigating risk in multimorbid COPD patients.
Other significant factors that deserve further investigation include the use of postacute care services, including home health and skilled nursing facilities. Both factors were associated with higher likelihood of returning for non-COPD than for COPD-related diagnoses. This finding may be collinear to some degree with comorbidity because complex patients are probably less likely to be discharged home directly. Interestingly, those discharged to a postacute care facility had substantially high odds of readmission for a non-COPD cause. Transitional care programs, including short stays in a nursing home, are often employed to mitigate the risk of adverse outcomes after discharge in sicker patients,40 which may be insufficient based on these data.
We applied the HRRP criteria for coding a COPD-related admission to the readmission diagnoses, which is more stringent than using only a principal diagnosis or DRGs, to maintain the same standard for defining the index and readmission event. In the sensitivity analyses, we did not find significant differences in our estimates of comorbidity’s effect on outcomes using a more liberal DRG classification system.
We also used DRGs to classify the readmission causes in order to use the same grouping logic that a payer would use when determining the cause. When evaluating which DRG patients returned for following a COPD exacerbation, pneumonia or other respiratory infections make up 13.8%, which may represent the evolution of respiratory infections that provoked the original exacerbation. Heart failure comprised 9.1% of the non-COPD causes, with about one-third of our COPD cohort having known comorbid heart failure at the time of index admission, illustrating significant overlap between these two conditions. Heart failure and pneumonia are conditions of interest in the HRRP and would potentially garner their own penalties had sufficient time elapsed since a prior hospitalization. Among other causes in the top 20 return DRGs were esophagitis, gastritis, gastrointestinal bleeding, and psychoses, which may be potentially associated with the use of corticosteroids to treat a COPD exacerbation, as described in other population studies.41,42 Lack of medication regimen data in our analysis precludes further attribution of these causes, but the potential associations are interesting and warrant additional study.
The structure of our data as pooled annual cross sections rather than a true longitudinal cohort limited us to use only 10 months (February to November) of index hospitalizations in order to stay aligned with HRRP policy inclusion criteria. As such, we may have missed some important observations during peak respiratory virus season. As in any administrative data analysis, we are limited to codes in the discharge records, which may not reflect the entire nature of a hospitalization. Administrative data are particularly problematic in identifying true COPD exacerbations, particularly with multiple comorbid cardiopulmonary conditions.43,44 Validating coding algorithms for identifying COPD was beyond the scope of our evaluation, which purposefully used HRRP methodology. Further study thereof would be a useful endeavor, especially with transition to ICD-10, considering that previously published evaluation was limited to ICD-9.44 Despite these limitations, we were left with a robust and representative national cohort, which is an acceptable tradeoff.
CONCLUSION
Our study highlights the importance of understanding comorbidity as a major determinant of readmissions following COPD exacerbations, particularly in distinguishing which patients will return for COPD versus non-COPD-related diagnoses. At the health system level, readmission programs should be designed with the multimorbid patient in mind. Engagement of care teams, facilitating communication, and shared decision making are strategies to mitigate readmission risk in addition to COPD-focused disease management.39 These data highlight the need to use risk prediction tools in assigning resources to reduce readmissions,45 as well as the need to move readmission reduction programs beyond COPD management alone. Developing such systems to prospectively identify which patients are at risk of returning for both COPD and non-COPD reasons may further elucidate readmission mitigation strategies and should be a subject of future prospective study.
Acknowledgments
Data were made available through the Agency for Healthcare Research and Quality’s Healthcare Utilization Project. A full list of partner organizations providing data for the Nationwide Readmission Database can be found at https://www.hcup-us.ahrq.gov/db/hcupdatapartners.jsp.
Prior Presentation
Portions of this work were presented in abstract form at the 2018 American Thoracic Society International Conference (May 2018, San Diego, CA). This manuscript is derived from the doctoral dissertation for the degree of PhD in Health Policy and Management of the corresponding author, conferred in June 2019.
Disclaimer
This article does not necessarily represent the views and policies of the Department of Veterans Affairs or the USPSTF.
1. Press VG, Konetzka RT, White SR. Insights about the economic impact of chronic obstructive pulmonary disease readmissions post implementation of the hospital readmission reduction program. Curr Opin Pulm Med. 2018;24(2):138-146. https://doi.org/10.1097/MCP.0000000000000454.
2. Patient protection and affordable care act, 124. Stat. 1886;10939:119 U.S.C, §3025(q). 2010).
3. Centers for Medicare & Medicaid Services. Readmissions Reduction Program. Updated 30 November 2017. https://www.cms.gov/Medicare/Medicare-Fee-for-Service-Payment/AcuteInpatientPPS/Readmissions-Reduction-Program.html. Published. Accessed February 7, 2018; 2017.
4. Shah T, Press VG, Huisingh-Scheetz M, White SR. COPD readmissions: addressing COPD in the era of Value-Based Health Care. Chest. 2016;150(4):916-926. https://doi.org/10.1016/j.chest.2016.05.002.
5. Gadoury MA, Schwartzman K, Rouleau M, et al. Self-management reduces both short- and long-term hospitalisation in COPD. Eur Respir J. 2005;26(5):853-857. https://doi.org/10.1183/09031936.05.00093204.
6. Zwerink M, Brusse-Keizer M, van der Valk PD, et al. Self management for patients with chronic obstructive pulmonary disease. Cochrane Database Syst Rev. 2014;3(3):CD002990. https://doi.org/10.1002/14651858.CD002990.pub3.
7. Lenferink A, van der Palen J, van der Valk PDLPM, et al. Exacerbation action plans for patients with COPD and comorbidities: a randomised controlled trial. Eur Respir J. 2019;54(5). https://doi.org/10.1183/13993003.02134-2018.
8. Jackson CT, Trygstad TK, DeWalt DA, DuBard CA. Transitional care cut hospital readmissions for North Carolina Medicaid patients with complex chronic conditions. Health Aff (Millwood). 2013;32(8):1407-1415. https://doi.org/10.1377/hlthaff.2013.0047.
9. Verhaegh KJ, MacNeil-Vroomen JL, Eslami S et al. Transitional care interventions prevent hospital readmissions for adults with chronic illnesses. Health Aff (Millwood). 2014;33(9):1531-1539. https://doi.org/10.1377/hlthaff.2014.0160.
10. Ridwan ES, Hadi H, Wu YL, Tsai PS. Effects of transitional care on hospital readmission and mortality rate in subjects With COPD: A systematic review and meta-analysis. Respir Care. 2019;64(9):1146-1156. https://doi.org/10.4187/respcare.06959.
11. Aboumatar H, Naqibuddin M, Chung S, et al. Effect of a program combining transitional care and long-term self-management support on outcomes of hospitalized patients With chronic obstructive pulmonary disease: A randomized clinical trial. JAMA. 2018;320(22):2335-2343. https://doi.org/10.1001/jama.2018.17933.
12. Aboumatar H, Naqibuddin M, Chung S, et al. Effect of a program combining transitional care and long-term self-management support on outcomes of hospitalized patients with chronic obstructive pulmonary disease: a randomized clinical trial. JAMA. 2018;320(22):2335-2343. https://doi.org/10.1001/jama.2018.17933.
13. Aboumatar H, Naqibuddin M, Chung S, et al. Effect of a hospital-initiated program combining transitional care and long-term self-management support on outcomes of patients hospitalized with chronic obstructive pulmonary disease: A randomized clinical trial. JAMA. 2019;322(14):1371-1380. https://doi.org/10.1001/jama.2019.11982.
14. Fan VS, Gaziano JM, Lew R, et al. A comprehensive care management program to prevent chronic obstructive pulmonary disease hospitalizations: a randomized, controlled trial. Ann Intern Med. 2012;156(10):673-683. https://doi.org/10.7326/0003-4819-156-10-201205150-00003.
15. Jensen MH, Cichosz SL, Dinesen B, Hejlesen OK. Moving prediction of exacerbation in chronic obstructive pulmonary disease for patients in telecare. J Telemed Telecare. 2012;18(2):99-103. https://doi.org/10.1258/jtt.2011.110607.
16. Pedone C, Chiurco D, Scarlata S, Incalzi RA. Efficacy of multiparametric telemonitoring on respiratory outcomes in elderly people with COPD: a randomized controlled trial. BMC Health Serv Res. 2013;13:82. https://doi.org/10.1186/1472-6963-13-82.
17. Pinnock H, Hanley J, McCloughan L, et al. Effectiveness of telemonitoring integrated into existing clinical services on hospital admission for exacerbation of chronic obstructive pulmonary disease: researcher blind, multicentre, randomised controlled trial. BMJ. 2013;347:f6070. https://doi.org/10.1136/bmj.f6070.
18. McLean S, Nurmatov U, Liu JL et al. Telehealthcare for chronic obstructive pulmonary disease. Cochrane Database Syst Rev. 2011;7(7):CD007718. https://doi.org/10.1002/14651858.CD007718.pub2.
19. Ko FW, Dai DL, Ngai J, et al. Effect of early pulmonary rehabilitation on health care utilization and health status in patients hospitalized with acute exacerbations of COPD. Respirology. 2011;16(4):617-624. https://doi.org/10.1111/j.1440-1843.2010.01921.x.
20. Blee J, Roux RK, Gautreaux S, Sherer JT, Garey KW. Dispensing inhalers to patients with chronic obstructive pulmonary disease on hospital discharge: effects on prescription filling and readmission. Am J Health Syst Pharm. 2015;72(14):1204-1208. https://doi.org/10.2146/ajhp140621.
21. Press VG, Arora VM, Trela KC, et al. Effectiveness of interventions to teach metered-dose and Diskus inhaler techniques. A randomized trial. Ann Am Thor Soc. 2016;13(6):816-824. https://doi.org/10.1513/AnnalsATS.201509-603OC.
22. Eaton T, Fergusson W, Kolbe J, Lewis CA, West T. Short-burst oxygen therapy for COPD patients: a 6-month randomised, controlled study. Eur Respir J. 2006;27(4):697-704. https://doi.org/10.1183/09031936.06.00098805.
23. Jacobs DM, Noyes K, Zhao J, et al. Early hospital readmissions after an acute exacerbation of chronic obstructive pulmonary disease in the Nationwide Readmissions Database. Ann Am Thor Soc. 2018;15(7):837-845. https://doi.org/10.1513/AnnalsATS.201712-913OC.
24. Shah T, Churpek MM, Coca Perraillon M, Konetzka RT. Understanding why patients with COPD get readmitted: a large national study to delineate the Medicare population for the readmissions penalty expansion. Chest. 2015;147(5):1219-1226. https://doi.org/10.1378/chest.14-2181.
25. Glaser JB, El-Haddad H. Exploring novel Medicare readmission risk variables in chronic obstructive pulmonary disease patients at high risk of readmission within 30 days of hospital discharge. Ann Am Thor Soc. 2015;12(9):1288-1293. https://doi.org/10.1513/AnnalsATS.201504-228OC.
26. Sharif R, Parekh TM, Pierson KS, Kuo YF, Sharma G. Predictors of early readmission among patients 40 to 64 years of age hospitalized for chronic obstructive pulmonary disease. Ann Am Thor Soc. 2014;11(5):685-694. https://doi.org/10.1513/AnnalsATS.201310-358OC.
27. Global Initiative for Chronic Obstructive Lung Disease. Global strategy for the prevention, diagnosis, and management of COPD. https://goldcopd.org/wp-content/uploads/2018/11/GOLD-2019-v1.7-FINAL-14Nov2018-WMS.pdf. Published; 2019.
28. Spece LJ, Epler EM, Donovan LM, et al. Role of comorbidities in treatment and outcomes after chronic obstructive pulmonary disease exacerbations. Ann Am Thor Soc. 2018;15(9):1033-1038. https://doi.org/10.1513/AnnalsATS.201804-255OC.
29. Westney G, Foreman MG, Xu J et al. Impact of comorbidities Among Medicaid enrollees With chronic obstructive pulmonary disease, United States, 2009. Prev Chronic Dis. 2017;14:E31. https://doi.org/10.5888/pcd14.160333.
30. HCUP Nationwide Readmissions Database (NRD). https://www.hcup-us.ahrq.gov/nrdoverview.jsp; 2010-2016. Agency for Healthcare Research and Quality. Accessed September 1, 2018.
31. Yale New Haven Health Services Corporation/Center for Outcomes Research & Evaluation. 2016 Condition-Specific Measures Updates and Specifications Report Hospital-Level 30-Day Risk-Standardized Readmission Measures. Baltimore, MD: Centers for Medicare & Medicaid Services; 2016. Available from: https://www.qualitynet.org/files/5d0d3ac7764be766b0104a88?filename=2016_Rdmsn_Msr_Resources.zip. Accessed August 29, 2018.
32. Yale New Haven Health Services Corporation/Center for Outcomes Research & Evaluation. 2017 Condition-Specific Measures Updates and Specifications Report Hospital-Level 30-Day Risk-Standardized Readmission Measures. Baltimore, MD: Centers for Medicare & Medicaid Services; 2016. Available from: https://www.cms.gov/Medicare/Quality-Initiatives-Patient-Assessment-Instruments/HospitalQualityInits/Downloads/AMI-HF-PN-COPD-and-Stroke-Readmission-Updates.zip. Accessed November 7, 2018.
33. Moore BJ, White S, Washington R, Coenen N, Elixhauser A. Identifying increased risk of readmission and in-hospital mortality using hospital administrative data: the AHRQ Elixhauser comorbidity index. Med Care. 2017;55(7):698-705. https://doi.org/10.1097/MLR.0000000000000735.
34. Stagg V. Elixhauser. Stata Module to Calculate Elixhauser Index of Comorbidity [computer program]. Boston: College Department of Economics: Statistical Software Components; 2015.
35. Agency for Healthcare Research and Quality. Healthcare Cost and Utilization Project. HCUP Elixhauser comorbidity software. www.hcup-us.ahrq.gov/toolssoftware/comorbidity/comorbidity.jsp. Accessed March 1, 2019.
36. Buhr RG, Jackson NJ, Kominski GF, et al. Comorbidity and thirty-day hospital readmission odds in chronic obstructive pulmonary disease: a comparison of the Charlson and Elixhauser comorbidity indices. BMC Health Serv Res. 2019;19(1):701. https://doi.org/10.1186/s12913-019-4549-4.
37. Healthcare Cost and Utilization Project. Introduction to the HCUP Nationwide Readmissions Database (NRD). https://www.hcup-us.ahrq.gov/db/nation/nrd/Introduction_NRD_2010-2016.jsp. Published. Updated August 2018. Accessed October 15, 2018.
38. Steinwald B, Dummit LA. Hospital case-mix change: sicker patients or DRG creep? Health Aff (Millwood). 1989;8(2):35-47. https://doi.org/10.1377/hlthaff.8.2.35.
39. Press VG, Au DH, Bourbeau J, et al. Reducing chronic obstructive pulmonary disease hospital readmissions. An Official American Thoracic Society Workshop Report. Ann Am Thorac Soc. An Official American Thoracic Society Workshop Report. 2019;16(2):161-170. https://doi.org/10.1513/AnnalsATS.201811-755WS.
40. McHugh JP, Foster A, Mor V, et al. Reducing hospital readmissions Through preferred networks of skilled nursing facilities. Health Aff (Millwood). 2017;36(9):1591-1598. https://doi.org/10.1377/hlthaff.2017.0211.
41. Huang KW, Kuan YC, Chi NF et al. Chronic obstructive pulmonary disease is associated with increased recurrent peptic ulcer bleeding risk. Eur J Intern Med. 2017;37:75-82. https://doi.org/10.1016/j.ejim.2016.09.020.
42. Judd LL, Schettler PJ, Brown ES, et al. Adverse consequences of glucocorticoid medication: psychological, cognitive, and behavioral effects. Am J Psychiatry. 2014;171(10):1045-1051. https://doi.org/10.1176/appi.ajp.2014.13091264.
43. Stein BD, Bautista A, Schumock GT, et al. The validity of International Classification of Diseases, ninth Revision, Clinical Modification diagnosis codes for identifying patients hospitalized for COPD exacerbations. Chest. 2012;141(1):87-93. https://doi.org/10.1378/chest.11-0024.
44. Prieto-Centurion V, Rolle AJ, Au DH et al.Multicenter study comparing case definitions used to identify patients with chronic obstructive pulmonary disease. Am J Respir Crit Care Med. 2014;190(9):989-995. https://doi.org/10.1164/rccm.201406-1166OC.
45. Press VG. Is it time to move on from identifying risk factors for 30-day chronic obstructive pulmonary disease readmission? A call for risk prediction tools. Ann Am Thor Soc. 2018;15(7):801-803. https://doi.org/10.1513/AnnalsATS.201804-246ED.
© 2020 Society of Hospital Medicine
Integrated Fragility Hip Fracture Program: A Model for High Quality Care
Hip fractures are a significant cause of morbidity and mortality among elderly patients. Patients with fragility hip fractures often carry multiple comorbid diagnoses with a significant risk of perioperative complications. After hip fracture, 30-day mortality has been reported as 3.3% to 17.2% with one-year mortality as high as 50%.1
Multidisciplinary care,2-5 surgery within 24 hours (h),6-12 use of regional peripheral nerve blocks,13-16 restrictive blood transfusion strategies,17,18 tranexamic acid (TXA) use,19 pharmacologic deep venous thrombosis (DVT) prophylaxis,20 surgical site infection prevention protocols,21 early mobilization,22 and nutritional optimization23-25 have been individually shown to improve outcomes in hip fracture patients.
Our program sought to define, standardize, and implement evidence-based best practices to improve clinical care and outcomes of patients with hip fractures. We convened a Center for Musculoskeletal Care (CMC) Hip Fracture Oversight Group that included surgeons and advanced practice providers from Orthopedics; physicians from Internal Medicine Hospitalist, Geriatrics, Emergency Medicine, and Anesthesia; and representatives from rehabilitation services, nursing, care management, pharmacy, and performance improvement. With clinical input from all involved services, we developed evidence-based protocols to standardize the care of patients with fragility hip fractures from the time of the patient’s evaluation in the emergency room to discharge and outpatient rehabilitation. The program was operationalized in February 2016.
This project was considered by the Yale University institutional review board (IRB) to be a quality improvement and, therefore, exempted from IRB approval.
MATERIALS AND METHODS
Yale-New Haven Hospital is composed of two main campuses. The York Street Campus (YSC) is the Level 1 Trauma Center. The St. Raphael’s Campus (SRC) houses the CMC nursing units for elective lower extremity arthroplasty and spine procedures. Prior to 2016, patients with hip fractures were cared for equally at both Yale-New Haven Hospital campuses. Patients were admitted to both medical and surgical services with no standardization of hip fracture care processes. Surgeons were assigned based on availability. Frequently, patients were added on to the operating room (OR) schedule and did not undergo surgery until off-hours and after a prolonged waiting period.
Medical comanagement of patients with fragility hip fractures at our institution predated the start of our CMC Integrated Fragility Hip Fracture Program (IFHFP). Comanagement was instituted in 2012 at YSC and in 2014 at SRC but without standardized protocols. The IFHFP began in February 2016 with the centralization of all patients with fragility hip fractures to the SRC at Yale-New Haven Hospital. Emergency medical services directed patients with suspected hip fractures to the designated campus. A dedicated hip fracture OR was allocated daily with a hip fracture surgeon assigned by a shared community and faculty surgeon call schedule. Patients were encouraged but not required to accept care from the on-call hip fracture surgical attending. Anesthesia was notified of the arrival of a patient with a hip fracture in the emergency department, and if the patient consented and qualified, a single-shot femoral nerve block was performed. Patients were screened for nasal staphylococcal colonization and treated with povidone-iodine nasal decolonization, chlorhexidine wash, and antibiotics determined by staphylococcal status and type of surgical procedure planned. Preoperative and postoperative order sets were implemented that dictated the care processes as outlined in Table 1. Surgeons determined the choice of operative intervention as per usual; this included internal fixation and partial or total hip replacement. Detailed medical and surgical protocols are included in Appendix A.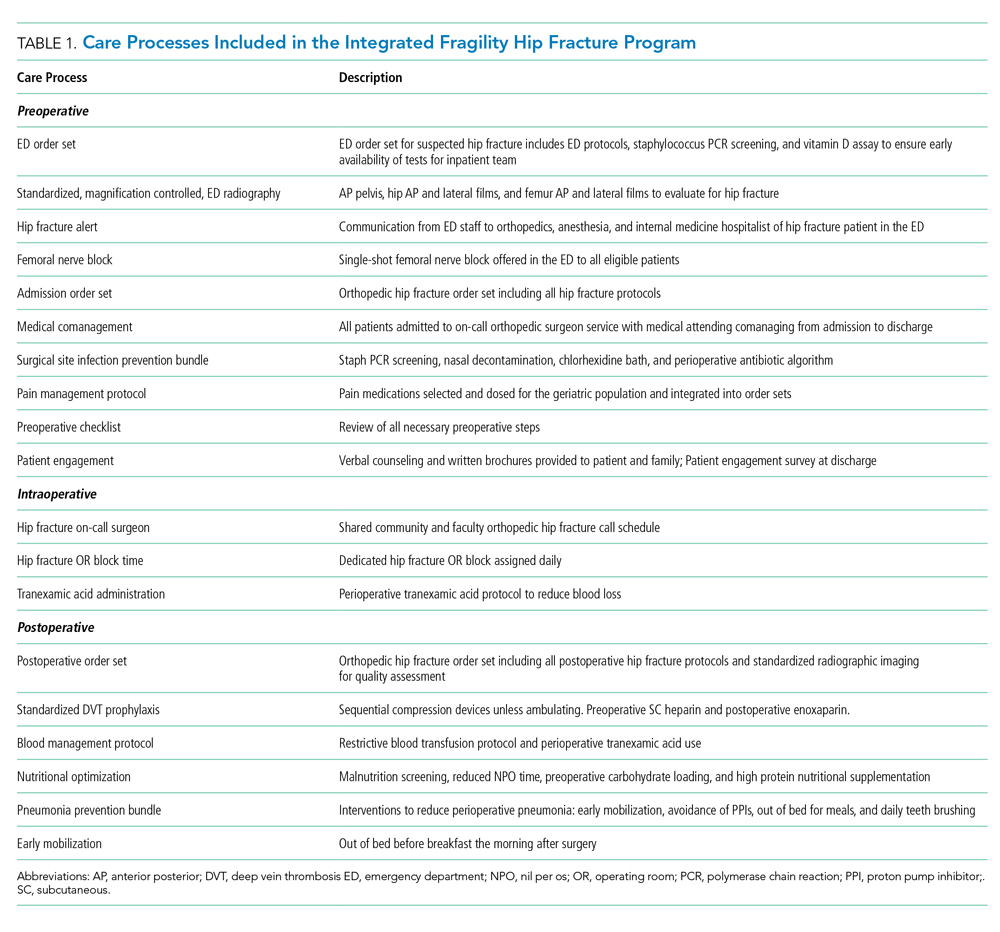
Since the initiation of the IFHFP on February 1, 2016, the program has continued to advance with our experience. We used the year preceding the start of the program as our baseline year (January 1, 2015, through December 31, 2015). The following years, 2016 and 2017, were a transition time during which our protocols were implemented. The intervention year was defined as January 1, 2018, through December 31, 2018. The outcomes during the intervention year were compared with the baseline year. It is important to note that our program has been in continuous evolution, including during the intervention year, with protocols created and refined as we gain experience.
Outcomes include 30-day mortality, transfusions, adverse effects of drugs, venous thromboembolic complications, sepsis, myocardial infarction, mechanical surgical fixation complications, length of stay, 30-day readmission rate, unexpected return to the OR, and time to operative intervention. Definitions of the outcome variables are reviewed in Appendix B.
RESULTS
There were 275 consecutive patients with hip fractures admitted to SRC in the baseline year (January 1, 2015 to December 31, 2015) and 434 patients with hip fractures admitted in the intervention year (January 1, 2018, to December 31, 2018) after consolidation of the program to the single Yale-New Haven Campus and implementation of standardized care processes. Patient demographic data including age, sex, ethnicity, body mass index, and American Society of Anesthesiologists physical status classification were evaluated for the baseline year and intervention year and reported in Table 2. There were no differences in the demographics of patients between baseline and intervention years.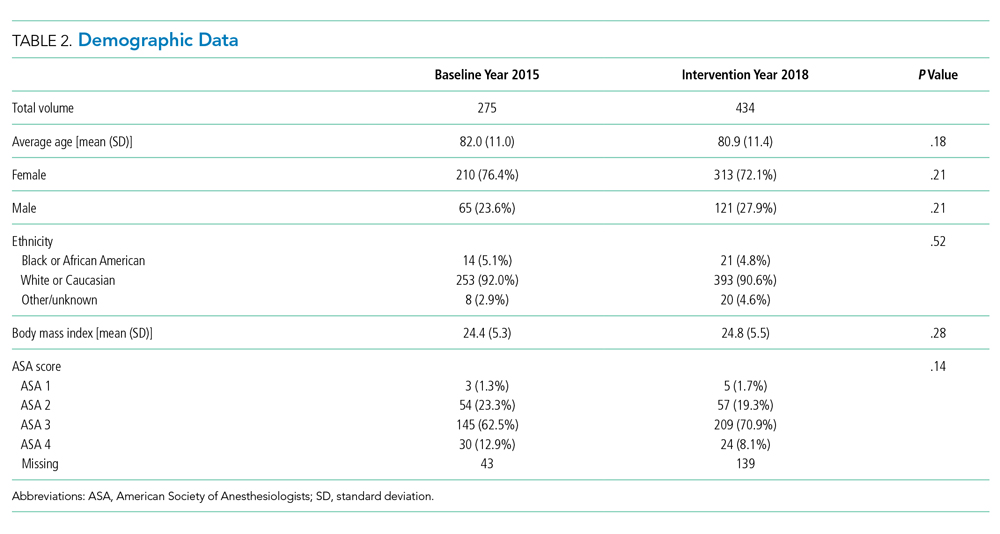
From baseline year to intervention year, 30-day mortality, transfusion, adverse effects of drugs, length of stay, unexpected return to OR, and time to OR were all significantly reduced. Mortality within 30 days decreased from 8.0% to 2.8%. The results are displayed in Table 3. No significant difference was seen in the incidence of venous thromboembolism, sepsis, myocardial infarctions, readmission at 30 days, or mechanical surgical fixation complications.
The Figure shows the 30-day IFHFP mortality rate as reported on a monthly basis starting on January 1 of the baseline year, 2015, and continuing through December 31 of the intervention year, 2018. The process interventions are mapped according to the date of initiation. The median mortality rate (including all data from January 1, 2015, to December 31, 2018) is demonstrated as the dotted line. From May 2018 to December 2018, each monthly mortality rate was recorded below the four-year median, a visual demonstration of the statistical significance seen in our mortality reduction from 8.0% in the baseline year to 2.8% in the intervention year.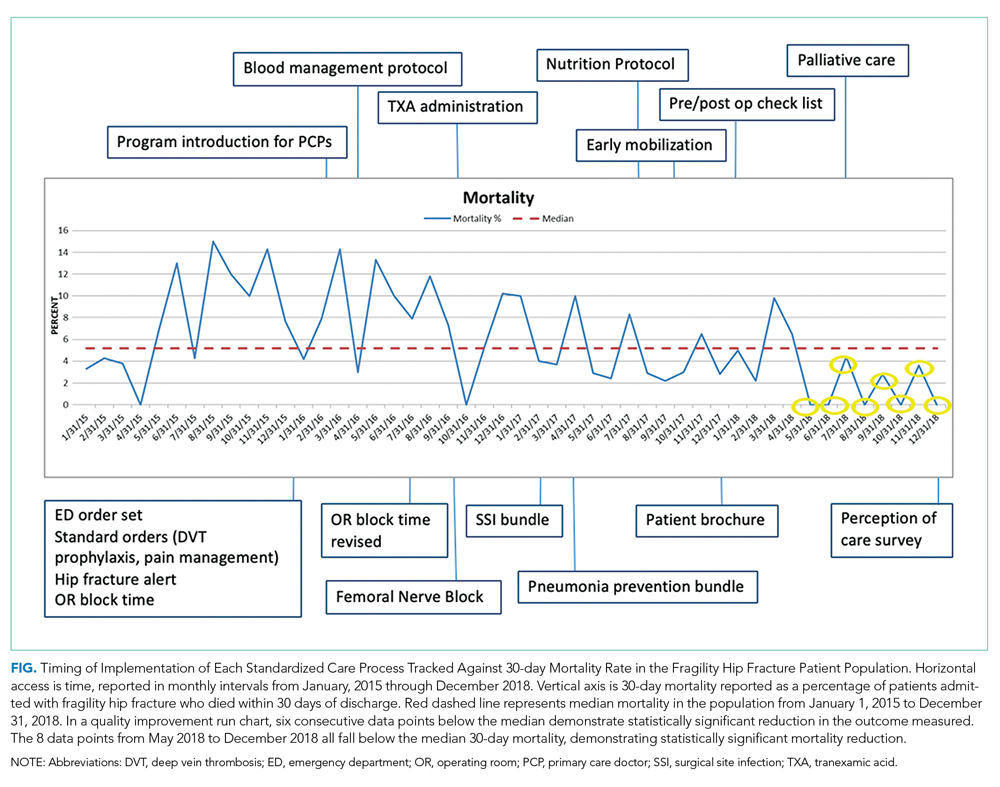
DISCUSSION
Patients with fragility hip fractures are a medically complex and vulnerable population. The goal of the CMC IFHFP was to standardize the care of these high-risk patients in an effort to reduce time to the OR, perioperative medical complications, time spent in the hospital, and ultimately mortality.
The barriers to implementing coordinated, multidisciplinary care are significant. In our case, we had a fragmented care model with fragility hip fracture patients cared for at two campuses, on different nursing units, with both community and faculty surgeons providing operative care, and with no predesignated primary team. We structured our program for equal sharing of call between community and faculty surgeons. However, there was distrust among the physician groups: Primary care physicians were concerned that their referral lines with orthopedic surgical colleagues would be fractured by the new shared call. Surgeons doubted that patients would be distributed equally among community and faculty practices. Hospitalists feared that comanagement would mean surgeons abdicating responsibility for care. Surgeons worried that routine medical involvement would delay surgery and prolong the length of stay with excessive testing. In order to achieve consensus, address concerns, and allay fears, we engaged the primary care and surgeon leadership for their support at the onset of the program and held monthly large group meetings and many smaller sessions to advance objectives. We meticulously tracked data and frequently reported out to the involved groups.
As it is well established that operative intervention on a hip fracture is best completed within 24 h to optimize a patient’s clinical outcomes, critical interventions were the designation of a hip fracture OR starting midday and expectation that surgery be performed the day after admission for medically cleared patients. Surgeons were able to book elective cases or outpatient clinic time in the morning. The morning hours prior to surgery allowed time for any final medical optimization, preoperative nursing care, and family discussions. Most surgeries were then completed by the primary OR staff during standard operating hours. Patients were out of the postanesthesia care unit and settled back on the orthopedic nursing unit in the early evening without a prolonged period of nil per os, bed rest, or sleep interruption.
While our protocol expected surgery the day after admission for medically cleared patients, we used surgery within 24 h as a simple metric to compare baseline with intervention outcomes. With our hip fracture OR block time beginning midday, the majority of our medically cleared hip fracture patients would receive surgical treatment within 24 h of admission. Our data show a significant improvement in timeliness of surgical intervention from 41.8% of patients to the OR within 24 h in 2015 to 55% in 2018. In 2017, we conducted an interval four-month audit involving a detailed chart review of all patients for whom surgery was delayed beyond 24 h from hospital admission. Chart review identified anticoagulation as the primary reason for surgical delay. Of patients who were eligible for surgery (medically stabilized and not therapeutically anticoagulated), 90% underwent surgery within 24 h during this four-month period in 2017. This compares to an overall rate of surgery within 24 h of 57% during the calendar year 2017. We did not perform a subgroup analysis of outcomes in patients with time to OR of 24-36 h. From this study, we are therefore unable to draw any conclusion regarding time to surgery and mortality.
Our dedicated OR hip fracture block time was changed from 7:30
Transfusion rate reduction from 46.6% to 28.1% was achieved primarily by the implementation and strict enforcement of a policy to avoid transfusing asymptomatic patients with hemoglobin >7.0 g/dL. In addition, we recommended TXA using standard perioperative arthroplasty dosing of 1 g intravenously (IV) at the time of incision followed by 1 g IV 3 h later in the postanaesthesia care unit. However, adherence to TXA recommendations was poor. A year-long audit (February 2017 to February 2018) demonstrated that only 29% of patients undergoing hip fracture surgery received the recommended TXA. After the conclusion of the study period of this review, we revised our TXA protocol to include an infusion at the time of admission and subsequent perioperative doses. The expanded TXA protocol (with clear exclusion criteria) has been “hard-wired” into our electronic perioperative order sets. We are tracking TXA compliance on a weekly basis. We anticipate that earlier TXA administration and improved compliance will further reduce transfusion rates.
We reduced the adverse effects of medications with two initiatives: First, dedicated hip fracture order sets with medications selected and dosed specifically for the geriatric population were launched at the onset of the IFHFP in 2016. Second, in coordination with our regional anesthesia team, patients who met criteria underwent a single-shot femoral nerve block upon diagnosis of the hip fracture. Patients reported up to 24 h of nonnarcotic pain relief with the femoral nerve block.
Prior to the introduction of the IFHFP, surgeons determined DVT prophylaxis based on their personal preference. Many of our surgeons were concerned that standardizing DVT prophylaxis to enoxaparin would increase the risk of surgical site bleeding, hematoma, infection, and reoperation. With data tracking and periodic reporting, we were able to reassure our surgeons: We demonstrated a reduction in the rate of patients unexpectedly requiring a return to the OR from 5.1% in 2015 to 0% in 2018.
We did not find a significant difference in mechanical complications due to surgical fixation during the index admission. Most mechanical complications do not present within the index admission and, therefore, would not be identified by this metric. Furthermore, in this phase of the program, we did not seek to change or standardize intraoperative surgical processes outside of surgical site infection prevention measures. Surgical technical quality and variation among surgeons is an area of ongoing evaluation within our program. We have begun a surgical quality review process with an expert review of postoperative radiography, beginning with fixation of nondisplaced femoral neck fractures, feedback to surgeons, and tracking of mechanical complications beyond the index admission. The surgical quality outcomes will be presented in a future manuscript.
Anticoagulation use is common in patients with hip fractures because of the high prevalence of comorbid conditions such as atrial fibrillation and venous thromboembolic disease. Direct oral anticoagulants (DOACs) are now commonly used in place of the vitamin K antagonist, warfarin. Our inability to efficiently reverse the DOACs compounded by surgeon unfamiliarity with these agents led to extreme caution in the timing of OR, with most patients delayed a full 48 h from the last dose of their prescribed DOAC. After recognizing the impact of anticoagulation on the timing of surgery, we convened a multidisciplinary group to determine rational guidelines for the timing of surgery in patients on chronic anticoagulation based on the bleeding risk of the planned operative procedure. These guidelines were instituted in December 2018, so their impact is not reflected in this review.
Our results showing a reduction in length of stay and mortality cannot be explained by any one intervention. We propose that the standardization of all processes and protocols, the establishment of clear expectations among all the medical and nursing personnel, and the shorter time spent waiting for surgery all contributed to the length of stay reduction. Likewise, the decrease in time to OR, reduction in time spent in the hospital, fewer transfusions, adverse effects of medication, and surgical complications requiring a return to the OR have all likely contributed to the significant reduction in mortality. The efforts of the orthopedic nursing team certainly contributed: The CMC nurses led the efforts to standardize surgical site infection bundle care, reduce indwelling bladder catheter use, and together with physical therapy, mobilize patients out of bed for meals postoperatively. The strong focus on teamwork, data tracking, feedback and accountability, and the desire for continued improvement may have been the strongest drivers in this program’s success.
Our results showed a nonsignificant increase in 30-day readmission from 9.1% to 12.5%. One limitation of this study is that we did not track specific readmission diagnoses to better understand trends in diagnoses or indications for hospital readmission. Going forward, we are reviewing readmissions to better understand opportunities to improve our inpatient processes and transitions of care.
This an evolving project. We have expanded our use of TXA in an effort to further reduce transfusion rates. We have adjusted our protocols for patients admitted on DOACs and warfarin to allow more rapid surgical intervention. We have initiated a surgical quality review process in which surgical fixation is reviewed with timely feedback to the operating surgeon. We are working closely with the skilled nursing facilities to extend our rehabilitation and nursing care protocols beyond the acute care setting. We are measuring patient engagement with a brief discharge survey specific to the CMC IFHFP. We continue to seek feedback from our referring primary care physicians to improve communication at times of care transition.
One of the limitations of a quality improvement project such as this one is the inability to identify the effect of each individual intervention. We can conclude that the totality of the multidisciplinary project reduced mortality in our hip fracture population, but we cannot report the relative effect of each process change. Another center seeking to replicate this success cannot determine from this research how to prioritize their resources to achieve a similar outcome.
How we care for the fragility hip fracture patient after hospital discharge is critical and unaddressed in this current study. A limitation of our current program is the lack of consistent postdischarge bone health management—which we are working to address. Also related to postdischarge management, we have partnered with a network of preferred skilled nursing facilities to standardize the care and decrease the length of stay. These data will be published separately.
We understand that our experience at the CMC is unique and specific to our care environment. This is a single site study and may not be generalizable to other centers. Nonetheless, the principles of multidisciplinary care, evidence-based protocol development, technological integration of protocols through order sets, and data tracking with feedback and accountability are the essential elements of our success that can be generalized to other institutions.
CONCLUSIONS
The CMC at Yale School of Medicine and Yale-New Haven Hospital IFHFP provides a model for implementing well-documented evidence-based interventions to standardize the care of patients with fragility hip fractures. The IFHFP yielded reduced mortality, length of stay, blood transfusion utilization, adverse effects of medications, unexpected return to the OR, and time to the OR.
Acknowledgments
The authors thank the work of the Center for Musculoskeletal Care Hip Fracture Oversight Group, program surgeons, and community primary care leaders: Olukemi Akande, MD, Mark Altman, MD, Diren Arsoy, MD, John Aversa, MD, Michael Connair, MD, Leo Cooney, MD, Kenneth Donohue, MD, David Gibson, MD, Gail Haesche, RN, MS, ACM-RN, Carol Just, MSN, NEA-BC, RN, Patricia Kenyon, RN, ACM, Francis Lee MD, Michael Leslie, MD, Michael Lucchini, MD, Christopher Lynch, MD, Rowland Mayor, MD, Tara Messina, PT, Lorraine Novella, RN, Paul Oliver, PA-C, Vivek Parwani, MD, Joseph Quaranta, MD, Lee Rubin, MD, Derek Shia, MD, Jeff Sumner, MD, John Tarutis, Arya Varthi, MD, Anuruddha Walaliyadda, MD, Daniel Wiznia, MD, Shirvinda Wijesekera, MD, Joseph Wu, MD, Brad Yoo, MD, and James Yue, MD.
1. Abrahamsen B, van Staa T, Ariely M, Olson M, Cooper C. Excess mortality following hip fracture: a systematic epidemiologic review. Osteoporos Int. 2009;20(10):1633-1650. https://doi.org/10.1007/s00198-009-0920-3.
2. DellaRocca GJ, Moylan KC, Crist BD, Volgas DA, Stannard JP, Mehr DR. Comanagement of geriatric patients with hip fractures: a retrospective, controlled cohort study. Geriatr Orthop Surg Rehabil. 2013;4(1):10-15. https://doi.org/10.1177/2151458513495238.
3. Wang Y, Tang J, Zhou F, Yang L, Wu J. Comprehensive geriatric care reduces acute perioperative delirium in elderly patients with hip fractures: a meta-analysis. Medicine. 2017; 96(26): e7361. https://doi.org/10.1097/MD.0000000000007361.
4. Liu VX, Rosas E, Hwang J, et al. Enhanced recovery after surgery program implementation in 2 surgical populations in an integrated health care delivery system. JAMA Surg. 2017;152(7):e171032. https://doi.org/10.1001/jamasurg.2017.1032.
5. Taraldsen K, Sletvold O, Thingstad P, et al. Physical behavior and function early after hip fracture surgery in patients receiving geriatric care or orthopedic care—a randomized controlled trial. J Gerontol A Biol Sci Med Sci. 2014;69(3):338-345. https://doi.org/10.1093/gerona/glt097.
6. Grimes JP, Gregory PM, Noveck H, Butler MS, Carson Jl. The effects of time-to-surgery on mortality and morbidity in patients following hip fracture. Am J Med. 2002;112(9):702-709. https://doi.org/10.1016/s0002-9343(02)01119-1.
7. Hamlet WP, Lieberman JR, Freedman EL, Dorey FJ, Fletcher A, Johnson EE. Influence of health status and the timing of surgery on mortality in hip fracture patients. Am J Orthop. 1997;26(9):621-627.
8. Hoenig H, Rubenstein LV, Sloane R, Honer R, Kahn K. What is the role of timing in the surgical and rehabilitative care of community-dwelling older persons with acute hip fracture? Arch Intern Med. 1997;157(5):513-520.
9. Orosz GM, Magaziner J, Hannan El, et al. Association of timing of surgery for hip fracture and patient outcomes. JAMA. 2004;291(14):1738-1743. https://doi.org/10.1001/jama.291.14.1738.
10. Gdalevich M, Cohen D, Yosef D, Tauber C. Morbidity and mortality after hip fracture: the impact of operative delay. Arch Orthop Trauma Surg. 2004:124(5):334-340. https://doi.org/10.1007/s00402-004-0662-9.
11. Doruk H, Mas MR, Yidiz C, Sonmez A, Kýrdemir V. The effect of the timing of hip fracture surgery on the activity of daily living and mortality in elderly. Arch Gerontol Geriatr. 2004;39(2):179-185.https://doi.org/10.1016/j.archger.2004.03.004.
12. Uzoigwe CE, Burnand HG, Cheesman CL, Aghedo DO, Faizi M, Middleton RG. Early and ultra-early surgery in hip fracture patients improves survival. Injury. 2013;44(6):726-729. https://doi.org/10.1016/j.injury.2012.08.025.
13. Guay J, Parker MJ, Griffiths R, Kopp SL. Peripheral nerve blocks for hip fractures. Cochrane Database Syst Rev. 2017;5: CD001159. https://doi.org/10.1002/14651858.CD001159.pub2.
14. Morrison RS, Dickman E, Hwang U, et al. Regional nerve blocks improve pain and functional outcomes in hip fracture: a randomized controlled trial. J Am Geriatr Soc. 2016;64(12):2433-2439. https://doi.org/10.1111/jgs.14386.
15. Beaudoin FL, Haran JP, Liebmann O. A comparison of ultrasound-guided three-in-one femoral nerve block versus parenteral opioids alone for analgesia in emergency deparment patients with hip fractures: a randomized controlled trial. Acad Emerg Med. 2013;20(6):584-591. https://doi.org/10.1111/acem.12154.
16. Dickman E, Pushkar I, Likourezos A, et al. Ultrasound-guided nerve blocks for intracapsular and extracapsular hip fractures. Am J Emerg Med. 2016;34(3):586-589. https://doi.org/10.1016/j.ajem.2015.12.016.
17. Carson JL, Terrin MI, Noveck H, et al. Liberal or restrictive transfusion in high-risk patients after hip surgery. N Engl J Med. 2011;365(26):2453-2462. https://doi.org/10.1056/NEJMoa1012452.
18. Garcia-Alvarez F, Al-Ghanem R, García-Alvarez I, López-Baisson A, Bernal M. Risk factors for postoperative infections in patients with hip fracture treated by means of Thompson arthoplasty. Arch Gerontol Geriatr. 2010; 50(1):51-55. https://doi.org/10.1016/j.archger.2009.01.009.
19. Farrow LS, Smith TO, Ashcroft GP, Myint PK. A systematic review of tranexamic acid in hip fracture surgery. Br J Clin Pharmacol. 2016;82(6):1458-1470. https://doi.org/10.1111/bcp.13079.
20. Falck-Ytter Y, Francis CW, Johanson NA, et al. Prevention of VTE in orthopedic surgery patients: Antithrombotic Therapy and Prevention of Thrombosis, 9th ed: American College of Chest Physicians Evidence Based Clinical Practice Guidelines. Chest. 2012;141(2 Suppl):e278S-e325S. https://doi.org/10.1378/chest.11-2404.
21. Gillespie WJ, Walenkamp G. Antibiotic prophylaxis for surgery for proximal femoral and other closed long bone fractures. Cochrane Database Syst Rev. 2010;(3):CD000244. https://doi.org/10.1002/14651858.CD000244.pub2.
22. Kamel HK, Iqbal MA, Mogallapu R, Maas D, Hoffmann RG. Time to ambulation after hip fracture surgery: relation to hospitalization outcomes. J Gerontol A Biol Sci Med Sci. 2003;58(11):1042-1045. https://doi.org/10.1093/gerona/58.11.m1042.
23. Foster MR, Heppenstall RB, Friedenberg ZB, Hozack WJ. A prospective assessment of nutritional status and complications in patients with fractures of the hip. J Orthop Trauma. 1990;4(1):49-57. https://doi.org/10.1097/00005131-199003000-00009.
24. Bell JJ, Pulle RC, Crouch AM, Kuys SS, Ferrier RL, Whitehouse SL. Impact of malnutrition on 12-month mortality following acute hip fracture. ANZ J Surg. 2016;86(3):157-161. https://doi.org/10.1111/ans.13429.
25. Avenell A, Handoll HH. Nutritional supplementation for hip fracture aftercare in older people. Cochrane Database Syst Rev. 2010;(1):CD001880. https://doi.org/10.1002/14651858.CD001880.pub5.
Hip fractures are a significant cause of morbidity and mortality among elderly patients. Patients with fragility hip fractures often carry multiple comorbid diagnoses with a significant risk of perioperative complications. After hip fracture, 30-day mortality has been reported as 3.3% to 17.2% with one-year mortality as high as 50%.1
Multidisciplinary care,2-5 surgery within 24 hours (h),6-12 use of regional peripheral nerve blocks,13-16 restrictive blood transfusion strategies,17,18 tranexamic acid (TXA) use,19 pharmacologic deep venous thrombosis (DVT) prophylaxis,20 surgical site infection prevention protocols,21 early mobilization,22 and nutritional optimization23-25 have been individually shown to improve outcomes in hip fracture patients.
Our program sought to define, standardize, and implement evidence-based best practices to improve clinical care and outcomes of patients with hip fractures. We convened a Center for Musculoskeletal Care (CMC) Hip Fracture Oversight Group that included surgeons and advanced practice providers from Orthopedics; physicians from Internal Medicine Hospitalist, Geriatrics, Emergency Medicine, and Anesthesia; and representatives from rehabilitation services, nursing, care management, pharmacy, and performance improvement. With clinical input from all involved services, we developed evidence-based protocols to standardize the care of patients with fragility hip fractures from the time of the patient’s evaluation in the emergency room to discharge and outpatient rehabilitation. The program was operationalized in February 2016.
This project was considered by the Yale University institutional review board (IRB) to be a quality improvement and, therefore, exempted from IRB approval.
MATERIALS AND METHODS
Yale-New Haven Hospital is composed of two main campuses. The York Street Campus (YSC) is the Level 1 Trauma Center. The St. Raphael’s Campus (SRC) houses the CMC nursing units for elective lower extremity arthroplasty and spine procedures. Prior to 2016, patients with hip fractures were cared for equally at both Yale-New Haven Hospital campuses. Patients were admitted to both medical and surgical services with no standardization of hip fracture care processes. Surgeons were assigned based on availability. Frequently, patients were added on to the operating room (OR) schedule and did not undergo surgery until off-hours and after a prolonged waiting period.
Medical comanagement of patients with fragility hip fractures at our institution predated the start of our CMC Integrated Fragility Hip Fracture Program (IFHFP). Comanagement was instituted in 2012 at YSC and in 2014 at SRC but without standardized protocols. The IFHFP began in February 2016 with the centralization of all patients with fragility hip fractures to the SRC at Yale-New Haven Hospital. Emergency medical services directed patients with suspected hip fractures to the designated campus. A dedicated hip fracture OR was allocated daily with a hip fracture surgeon assigned by a shared community and faculty surgeon call schedule. Patients were encouraged but not required to accept care from the on-call hip fracture surgical attending. Anesthesia was notified of the arrival of a patient with a hip fracture in the emergency department, and if the patient consented and qualified, a single-shot femoral nerve block was performed. Patients were screened for nasal staphylococcal colonization and treated with povidone-iodine nasal decolonization, chlorhexidine wash, and antibiotics determined by staphylococcal status and type of surgical procedure planned. Preoperative and postoperative order sets were implemented that dictated the care processes as outlined in Table 1. Surgeons determined the choice of operative intervention as per usual; this included internal fixation and partial or total hip replacement. Detailed medical and surgical protocols are included in Appendix A.
Since the initiation of the IFHFP on February 1, 2016, the program has continued to advance with our experience. We used the year preceding the start of the program as our baseline year (January 1, 2015, through December 31, 2015). The following years, 2016 and 2017, were a transition time during which our protocols were implemented. The intervention year was defined as January 1, 2018, through December 31, 2018. The outcomes during the intervention year were compared with the baseline year. It is important to note that our program has been in continuous evolution, including during the intervention year, with protocols created and refined as we gain experience.
Outcomes include 30-day mortality, transfusions, adverse effects of drugs, venous thromboembolic complications, sepsis, myocardial infarction, mechanical surgical fixation complications, length of stay, 30-day readmission rate, unexpected return to the OR, and time to operative intervention. Definitions of the outcome variables are reviewed in Appendix B.
RESULTS
There were 275 consecutive patients with hip fractures admitted to SRC in the baseline year (January 1, 2015 to December 31, 2015) and 434 patients with hip fractures admitted in the intervention year (January 1, 2018, to December 31, 2018) after consolidation of the program to the single Yale-New Haven Campus and implementation of standardized care processes. Patient demographic data including age, sex, ethnicity, body mass index, and American Society of Anesthesiologists physical status classification were evaluated for the baseline year and intervention year and reported in Table 2. There were no differences in the demographics of patients between baseline and intervention years.
From baseline year to intervention year, 30-day mortality, transfusion, adverse effects of drugs, length of stay, unexpected return to OR, and time to OR were all significantly reduced. Mortality within 30 days decreased from 8.0% to 2.8%. The results are displayed in Table 3. No significant difference was seen in the incidence of venous thromboembolism, sepsis, myocardial infarctions, readmission at 30 days, or mechanical surgical fixation complications.
The Figure shows the 30-day IFHFP mortality rate as reported on a monthly basis starting on January 1 of the baseline year, 2015, and continuing through December 31 of the intervention year, 2018. The process interventions are mapped according to the date of initiation. The median mortality rate (including all data from January 1, 2015, to December 31, 2018) is demonstrated as the dotted line. From May 2018 to December 2018, each monthly mortality rate was recorded below the four-year median, a visual demonstration of the statistical significance seen in our mortality reduction from 8.0% in the baseline year to 2.8% in the intervention year.
DISCUSSION
Patients with fragility hip fractures are a medically complex and vulnerable population. The goal of the CMC IFHFP was to standardize the care of these high-risk patients in an effort to reduce time to the OR, perioperative medical complications, time spent in the hospital, and ultimately mortality.
The barriers to implementing coordinated, multidisciplinary care are significant. In our case, we had a fragmented care model with fragility hip fracture patients cared for at two campuses, on different nursing units, with both community and faculty surgeons providing operative care, and with no predesignated primary team. We structured our program for equal sharing of call between community and faculty surgeons. However, there was distrust among the physician groups: Primary care physicians were concerned that their referral lines with orthopedic surgical colleagues would be fractured by the new shared call. Surgeons doubted that patients would be distributed equally among community and faculty practices. Hospitalists feared that comanagement would mean surgeons abdicating responsibility for care. Surgeons worried that routine medical involvement would delay surgery and prolong the length of stay with excessive testing. In order to achieve consensus, address concerns, and allay fears, we engaged the primary care and surgeon leadership for their support at the onset of the program and held monthly large group meetings and many smaller sessions to advance objectives. We meticulously tracked data and frequently reported out to the involved groups.
As it is well established that operative intervention on a hip fracture is best completed within 24 h to optimize a patient’s clinical outcomes, critical interventions were the designation of a hip fracture OR starting midday and expectation that surgery be performed the day after admission for medically cleared patients. Surgeons were able to book elective cases or outpatient clinic time in the morning. The morning hours prior to surgery allowed time for any final medical optimization, preoperative nursing care, and family discussions. Most surgeries were then completed by the primary OR staff during standard operating hours. Patients were out of the postanesthesia care unit and settled back on the orthopedic nursing unit in the early evening without a prolonged period of nil per os, bed rest, or sleep interruption.
While our protocol expected surgery the day after admission for medically cleared patients, we used surgery within 24 h as a simple metric to compare baseline with intervention outcomes. With our hip fracture OR block time beginning midday, the majority of our medically cleared hip fracture patients would receive surgical treatment within 24 h of admission. Our data show a significant improvement in timeliness of surgical intervention from 41.8% of patients to the OR within 24 h in 2015 to 55% in 2018. In 2017, we conducted an interval four-month audit involving a detailed chart review of all patients for whom surgery was delayed beyond 24 h from hospital admission. Chart review identified anticoagulation as the primary reason for surgical delay. Of patients who were eligible for surgery (medically stabilized and not therapeutically anticoagulated), 90% underwent surgery within 24 h during this four-month period in 2017. This compares to an overall rate of surgery within 24 h of 57% during the calendar year 2017. We did not perform a subgroup analysis of outcomes in patients with time to OR of 24-36 h. From this study, we are therefore unable to draw any conclusion regarding time to surgery and mortality.
Our dedicated OR hip fracture block time was changed from 7:30
Transfusion rate reduction from 46.6% to 28.1% was achieved primarily by the implementation and strict enforcement of a policy to avoid transfusing asymptomatic patients with hemoglobin >7.0 g/dL. In addition, we recommended TXA using standard perioperative arthroplasty dosing of 1 g intravenously (IV) at the time of incision followed by 1 g IV 3 h later in the postanaesthesia care unit. However, adherence to TXA recommendations was poor. A year-long audit (February 2017 to February 2018) demonstrated that only 29% of patients undergoing hip fracture surgery received the recommended TXA. After the conclusion of the study period of this review, we revised our TXA protocol to include an infusion at the time of admission and subsequent perioperative doses. The expanded TXA protocol (with clear exclusion criteria) has been “hard-wired” into our electronic perioperative order sets. We are tracking TXA compliance on a weekly basis. We anticipate that earlier TXA administration and improved compliance will further reduce transfusion rates.
We reduced the adverse effects of medications with two initiatives: First, dedicated hip fracture order sets with medications selected and dosed specifically for the geriatric population were launched at the onset of the IFHFP in 2016. Second, in coordination with our regional anesthesia team, patients who met criteria underwent a single-shot femoral nerve block upon diagnosis of the hip fracture. Patients reported up to 24 h of nonnarcotic pain relief with the femoral nerve block.
Prior to the introduction of the IFHFP, surgeons determined DVT prophylaxis based on their personal preference. Many of our surgeons were concerned that standardizing DVT prophylaxis to enoxaparin would increase the risk of surgical site bleeding, hematoma, infection, and reoperation. With data tracking and periodic reporting, we were able to reassure our surgeons: We demonstrated a reduction in the rate of patients unexpectedly requiring a return to the OR from 5.1% in 2015 to 0% in 2018.
We did not find a significant difference in mechanical complications due to surgical fixation during the index admission. Most mechanical complications do not present within the index admission and, therefore, would not be identified by this metric. Furthermore, in this phase of the program, we did not seek to change or standardize intraoperative surgical processes outside of surgical site infection prevention measures. Surgical technical quality and variation among surgeons is an area of ongoing evaluation within our program. We have begun a surgical quality review process with an expert review of postoperative radiography, beginning with fixation of nondisplaced femoral neck fractures, feedback to surgeons, and tracking of mechanical complications beyond the index admission. The surgical quality outcomes will be presented in a future manuscript.
Anticoagulation use is common in patients with hip fractures because of the high prevalence of comorbid conditions such as atrial fibrillation and venous thromboembolic disease. Direct oral anticoagulants (DOACs) are now commonly used in place of the vitamin K antagonist, warfarin. Our inability to efficiently reverse the DOACs compounded by surgeon unfamiliarity with these agents led to extreme caution in the timing of OR, with most patients delayed a full 48 h from the last dose of their prescribed DOAC. After recognizing the impact of anticoagulation on the timing of surgery, we convened a multidisciplinary group to determine rational guidelines for the timing of surgery in patients on chronic anticoagulation based on the bleeding risk of the planned operative procedure. These guidelines were instituted in December 2018, so their impact is not reflected in this review.
Our results showing a reduction in length of stay and mortality cannot be explained by any one intervention. We propose that the standardization of all processes and protocols, the establishment of clear expectations among all the medical and nursing personnel, and the shorter time spent waiting for surgery all contributed to the length of stay reduction. Likewise, the decrease in time to OR, reduction in time spent in the hospital, fewer transfusions, adverse effects of medication, and surgical complications requiring a return to the OR have all likely contributed to the significant reduction in mortality. The efforts of the orthopedic nursing team certainly contributed: The CMC nurses led the efforts to standardize surgical site infection bundle care, reduce indwelling bladder catheter use, and together with physical therapy, mobilize patients out of bed for meals postoperatively. The strong focus on teamwork, data tracking, feedback and accountability, and the desire for continued improvement may have been the strongest drivers in this program’s success.
Our results showed a nonsignificant increase in 30-day readmission from 9.1% to 12.5%. One limitation of this study is that we did not track specific readmission diagnoses to better understand trends in diagnoses or indications for hospital readmission. Going forward, we are reviewing readmissions to better understand opportunities to improve our inpatient processes and transitions of care.
This an evolving project. We have expanded our use of TXA in an effort to further reduce transfusion rates. We have adjusted our protocols for patients admitted on DOACs and warfarin to allow more rapid surgical intervention. We have initiated a surgical quality review process in which surgical fixation is reviewed with timely feedback to the operating surgeon. We are working closely with the skilled nursing facilities to extend our rehabilitation and nursing care protocols beyond the acute care setting. We are measuring patient engagement with a brief discharge survey specific to the CMC IFHFP. We continue to seek feedback from our referring primary care physicians to improve communication at times of care transition.
One of the limitations of a quality improvement project such as this one is the inability to identify the effect of each individual intervention. We can conclude that the totality of the multidisciplinary project reduced mortality in our hip fracture population, but we cannot report the relative effect of each process change. Another center seeking to replicate this success cannot determine from this research how to prioritize their resources to achieve a similar outcome.
How we care for the fragility hip fracture patient after hospital discharge is critical and unaddressed in this current study. A limitation of our current program is the lack of consistent postdischarge bone health management—which we are working to address. Also related to postdischarge management, we have partnered with a network of preferred skilled nursing facilities to standardize the care and decrease the length of stay. These data will be published separately.
We understand that our experience at the CMC is unique and specific to our care environment. This is a single site study and may not be generalizable to other centers. Nonetheless, the principles of multidisciplinary care, evidence-based protocol development, technological integration of protocols through order sets, and data tracking with feedback and accountability are the essential elements of our success that can be generalized to other institutions.
CONCLUSIONS
The CMC at Yale School of Medicine and Yale-New Haven Hospital IFHFP provides a model for implementing well-documented evidence-based interventions to standardize the care of patients with fragility hip fractures. The IFHFP yielded reduced mortality, length of stay, blood transfusion utilization, adverse effects of medications, unexpected return to the OR, and time to the OR.
Acknowledgments
The authors thank the work of the Center for Musculoskeletal Care Hip Fracture Oversight Group, program surgeons, and community primary care leaders: Olukemi Akande, MD, Mark Altman, MD, Diren Arsoy, MD, John Aversa, MD, Michael Connair, MD, Leo Cooney, MD, Kenneth Donohue, MD, David Gibson, MD, Gail Haesche, RN, MS, ACM-RN, Carol Just, MSN, NEA-BC, RN, Patricia Kenyon, RN, ACM, Francis Lee MD, Michael Leslie, MD, Michael Lucchini, MD, Christopher Lynch, MD, Rowland Mayor, MD, Tara Messina, PT, Lorraine Novella, RN, Paul Oliver, PA-C, Vivek Parwani, MD, Joseph Quaranta, MD, Lee Rubin, MD, Derek Shia, MD, Jeff Sumner, MD, John Tarutis, Arya Varthi, MD, Anuruddha Walaliyadda, MD, Daniel Wiznia, MD, Shirvinda Wijesekera, MD, Joseph Wu, MD, Brad Yoo, MD, and James Yue, MD.
1. Abrahamsen B, van Staa T, Ariely M, Olson M, Cooper C. Excess mortality following hip fracture: a systematic epidemiologic review. Osteoporos Int. 2009;20(10):1633-1650. https://doi.org/10.1007/s00198-009-0920-3.
2. DellaRocca GJ, Moylan KC, Crist BD, Volgas DA, Stannard JP, Mehr DR. Comanagement of geriatric patients with hip fractures: a retrospective, controlled cohort study. Geriatr Orthop Surg Rehabil. 2013;4(1):10-15. https://doi.org/10.1177/2151458513495238.
3. Wang Y, Tang J, Zhou F, Yang L, Wu J. Comprehensive geriatric care reduces acute perioperative delirium in elderly patients with hip fractures: a meta-analysis. Medicine. 2017; 96(26): e7361. https://doi.org/10.1097/MD.0000000000007361.
4. Liu VX, Rosas E, Hwang J, et al. Enhanced recovery after surgery program implementation in 2 surgical populations in an integrated health care delivery system. JAMA Surg. 2017;152(7):e171032. https://doi.org/10.1001/jamasurg.2017.1032.
5. Taraldsen K, Sletvold O, Thingstad P, et al. Physical behavior and function early after hip fracture surgery in patients receiving geriatric care or orthopedic care—a randomized controlled trial. J Gerontol A Biol Sci Med Sci. 2014;69(3):338-345. https://doi.org/10.1093/gerona/glt097.
6. Grimes JP, Gregory PM, Noveck H, Butler MS, Carson Jl. The effects of time-to-surgery on mortality and morbidity in patients following hip fracture. Am J Med. 2002;112(9):702-709. https://doi.org/10.1016/s0002-9343(02)01119-1.
7. Hamlet WP, Lieberman JR, Freedman EL, Dorey FJ, Fletcher A, Johnson EE. Influence of health status and the timing of surgery on mortality in hip fracture patients. Am J Orthop. 1997;26(9):621-627.
8. Hoenig H, Rubenstein LV, Sloane R, Honer R, Kahn K. What is the role of timing in the surgical and rehabilitative care of community-dwelling older persons with acute hip fracture? Arch Intern Med. 1997;157(5):513-520.
9. Orosz GM, Magaziner J, Hannan El, et al. Association of timing of surgery for hip fracture and patient outcomes. JAMA. 2004;291(14):1738-1743. https://doi.org/10.1001/jama.291.14.1738.
10. Gdalevich M, Cohen D, Yosef D, Tauber C. Morbidity and mortality after hip fracture: the impact of operative delay. Arch Orthop Trauma Surg. 2004:124(5):334-340. https://doi.org/10.1007/s00402-004-0662-9.
11. Doruk H, Mas MR, Yidiz C, Sonmez A, Kýrdemir V. The effect of the timing of hip fracture surgery on the activity of daily living and mortality in elderly. Arch Gerontol Geriatr. 2004;39(2):179-185.https://doi.org/10.1016/j.archger.2004.03.004.
12. Uzoigwe CE, Burnand HG, Cheesman CL, Aghedo DO, Faizi M, Middleton RG. Early and ultra-early surgery in hip fracture patients improves survival. Injury. 2013;44(6):726-729. https://doi.org/10.1016/j.injury.2012.08.025.
13. Guay J, Parker MJ, Griffiths R, Kopp SL. Peripheral nerve blocks for hip fractures. Cochrane Database Syst Rev. 2017;5: CD001159. https://doi.org/10.1002/14651858.CD001159.pub2.
14. Morrison RS, Dickman E, Hwang U, et al. Regional nerve blocks improve pain and functional outcomes in hip fracture: a randomized controlled trial. J Am Geriatr Soc. 2016;64(12):2433-2439. https://doi.org/10.1111/jgs.14386.
15. Beaudoin FL, Haran JP, Liebmann O. A comparison of ultrasound-guided three-in-one femoral nerve block versus parenteral opioids alone for analgesia in emergency deparment patients with hip fractures: a randomized controlled trial. Acad Emerg Med. 2013;20(6):584-591. https://doi.org/10.1111/acem.12154.
16. Dickman E, Pushkar I, Likourezos A, et al. Ultrasound-guided nerve blocks for intracapsular and extracapsular hip fractures. Am J Emerg Med. 2016;34(3):586-589. https://doi.org/10.1016/j.ajem.2015.12.016.
17. Carson JL, Terrin MI, Noveck H, et al. Liberal or restrictive transfusion in high-risk patients after hip surgery. N Engl J Med. 2011;365(26):2453-2462. https://doi.org/10.1056/NEJMoa1012452.
18. Garcia-Alvarez F, Al-Ghanem R, García-Alvarez I, López-Baisson A, Bernal M. Risk factors for postoperative infections in patients with hip fracture treated by means of Thompson arthoplasty. Arch Gerontol Geriatr. 2010; 50(1):51-55. https://doi.org/10.1016/j.archger.2009.01.009.
19. Farrow LS, Smith TO, Ashcroft GP, Myint PK. A systematic review of tranexamic acid in hip fracture surgery. Br J Clin Pharmacol. 2016;82(6):1458-1470. https://doi.org/10.1111/bcp.13079.
20. Falck-Ytter Y, Francis CW, Johanson NA, et al. Prevention of VTE in orthopedic surgery patients: Antithrombotic Therapy and Prevention of Thrombosis, 9th ed: American College of Chest Physicians Evidence Based Clinical Practice Guidelines. Chest. 2012;141(2 Suppl):e278S-e325S. https://doi.org/10.1378/chest.11-2404.
21. Gillespie WJ, Walenkamp G. Antibiotic prophylaxis for surgery for proximal femoral and other closed long bone fractures. Cochrane Database Syst Rev. 2010;(3):CD000244. https://doi.org/10.1002/14651858.CD000244.pub2.
22. Kamel HK, Iqbal MA, Mogallapu R, Maas D, Hoffmann RG. Time to ambulation after hip fracture surgery: relation to hospitalization outcomes. J Gerontol A Biol Sci Med Sci. 2003;58(11):1042-1045. https://doi.org/10.1093/gerona/58.11.m1042.
23. Foster MR, Heppenstall RB, Friedenberg ZB, Hozack WJ. A prospective assessment of nutritional status and complications in patients with fractures of the hip. J Orthop Trauma. 1990;4(1):49-57. https://doi.org/10.1097/00005131-199003000-00009.
24. Bell JJ, Pulle RC, Crouch AM, Kuys SS, Ferrier RL, Whitehouse SL. Impact of malnutrition on 12-month mortality following acute hip fracture. ANZ J Surg. 2016;86(3):157-161. https://doi.org/10.1111/ans.13429.
25. Avenell A, Handoll HH. Nutritional supplementation for hip fracture aftercare in older people. Cochrane Database Syst Rev. 2010;(1):CD001880. https://doi.org/10.1002/14651858.CD001880.pub5.
© 2020 Society of Hospital Medicine
Social Disadvantage, Access to Care, and Disparities in Physical Functioning Among Children Hospitalized with Respiratory Illness
Examining disparities in health-related quality of life (HRQoL) outcomes in children provides a unique patient-centered perspective on pediatric health services equity.1,2 Prior studies have demonstrated the relationship between minority race, low socioeconomic status, and lower maternal education with poorer HRQoL outcomes in children.3-6 Some studies have also shown a dose-response relationship between social disadvantage markers and poorer child health status.7,8 Furthermore, the associations between social disadvantage and poor access to care,9-11 and between poor access to care and lower HRQoL, are also well established.12-14
Examining HRQoL before and after hospitalization can further our understanding of how disparities in HRQoL may change once children engage with the medical system for an acute illness.15 Children requiring hospitalization constitute a useful population for examination of this question as they represent a group of children with variable social disadvantage markers and access to outpatient care.16 Although interventions to address social determinants of health for patients with social disadvantages have been associated with within-group improvements in HRQoL, none have assessed changes in disparities as an outcome.17 Furthermore, many of these studies were conducted in the outpatient setting,18,19 whereas hospitalization provides an additional point of care to address the social determinants of health for vulnerable families.20 Even for short hospitalizations, the 24/7 nature of hospital care provides the opportunity for frequent interactions with clinicians, nurses, and support staff to clarify illness-related questions, discuss other health concerns and unmet needs, and connect with social services or community resources. These opportunities may be particularly important for families with a higher number of social disadvantage markers and even more beneficial to those with difficulty accessing needed care from their primary medical home.
In this study, we focused on children with common respiratory illnesses (asthma, bronchiolitis, and pneumonia), which constitute the majority of childhood hospitalizations.21 Additionally, we only focused on the child’s physical functioning component of HRQoL because this component is most likely to improve after hospitalization for children with an acute respiratory illness.22 A prior study examining HRQoL before and after hospitalization demonstrated that most children return to and/or surpass their baseline physical functioning by 1 month after hospital discharge.23
Our primary objective was to examine associations between several markers of social disadvantage, access to care, and child physical functioning before and after hospitalization for acute respiratory illness. Second, we aimed to understand if access to care (defined as perceived difficulty/delays getting care) acts as an independent predictor of improvement in physical functioning from baseline to follow-up and/or if it modifies the relationship between social disadvantage and improvement in physical functioning (Appendix Figure).
METHODS
Study Design and Population
This study was nested within a multicenter, prospective cohort study of children who were hospitalized for asthma, bronchiolitis, or pneumonia between July 2014 and June 2016 at one of five children’s hospitals in the Pediatric Research in Inpatient Settings Network.24
We approached families for study participation within 72 hours of admission to the hospital using a standard protocol. Patients and their caregivers were eligible to participate in the study if the patient was 2 weeks to 16 years old and if the primary caregiver’s preferred language for medical communication was either English or Spanish. Patients with chronic medical conditions (except asthma), with moderate to severe developmental delay, with a history of prematurity <32 weeks, or who received care in the intensive care unit were excluded. Patients could only participate in the study once.
The study team set out to enroll an even number of patients across all three conditions. If a patient’s discharge diagnosis differed from their admission diagnosis (eg, from bronchiolitis to pneumonia), discharge diagnosis was used for condition group assignment. If the discharge diagnosis was not one of these three respiratory conditions, we excluded the patient from further analysis.
Data Collection
We collected data using two surveys. The first survey was administered within 72 hours of admission. This survey asked questions related to (1) caregiver-reported markers of social disadvantage, (2) caregiver perceptions of access to care, and (3) caregiver- and patient-reported assessments of physical functioning. The second survey was administered within 2 to 8 weeks after the patient’s discharge and included a second assessment of physical functioning.
Social Disadvantage
Patients were considered to have a marker of social disadvantage if their caregiver reported (1) being of non-White race and/or Hispanic ethnicity, (2) primarily speaking a language other than English at home and not speaking English very well (ie, limited English proficiency), (3) attaining at most a high school or equivalent degree, or (4) having a =/<$30,000 annual household income.
Access to Care
We used the following survey item from the 2009-2010 National Survey of Children with Special Health Care Needs25 to measure caregiver perceptions of access to care: “In the last six months, did you have any difficulties or delays getting care for your child because there were waiting lists, backlogs, or other problems getting an appointment?” We narrowed the original assessment time frame from 12 months to 6 months to provide a more proximal assessment of access in relation to the hospitalization.
Child Physical Functioning
We assessed child physical functioning using the physical functioning domain of the Pediatric Quality of Life Inventory (PedsQL) 4.0 Generic Core Scales and PedsQL Infant Scales, which have been validated for use in the inpatient setting.22 Caregivers completed one of these scales based on their child’s age. Assenting patients 8 to 16 years old completed the self-report PedsQL 4.0 Generic Core Scales instrument. When completing the first PedsQL survey, caregivers and patients reflected on the previous month before their child (or they) became ill to obtain a baseline physical functioning assessment.23 When completing the second PedsQL survey, caregivers and patients reflected on the past 7 days to obtain a follow-up assessment.
All study procedures were approved by the Western Institutional Review Board (IRB) or the participating hospitals’ IRB.
Statistical Analysis
Patients with no missing data for all four social disadvantage markers were categorized based on the number of markers they reported: none, one, two, or three or more markers. We combined patients with three and four social disadvantage markers into one group to maximize power for the analyses. We dichotomized the access to care variable and coded response options as “no difficulty/delays accessing care” if the caregiver chose “Never” and “any difficulty/delays accessing care” if they chose “Sometimes/Usually/Always.”
For each patient–caregiver dyad, PedsQL items were scored using a standard method in which higher scores reflected better functioning.22 A single set of PedsQL scores was used for each patient–caregiver dyad. We used self-reported patient scores if the patient completed the PedsQL instrument; otherwise, we used proxy-reported caregiver scores. Intraclass correlations between child self-report and parent proxy-report demonstrate moderate to good agreement above age 8 years.26 We computed a change in the physical functioning score by subtracting the baseline score from the follow-up score. The minimal clinically important difference (MCID) for the PedsQL instrument is 4.5 points, which we used to identify clinically meaningful differences.13
Analysis of variance models were constructed to test for differences in mean baseline and follow-up PedsQL scores (dependent variable) between the following independent variables: (1) social disadvantage groups and (2) those who reported having any difficulty/delays accessing care compared with those who did not. Only patient–caregiver dyads with both baseline and follow-up assessments were included in these analyses. Mixed-effects linear regression models were constructed to identify clinically meaningful differences in PedsQL scores between groups (MCID =/> 4.5) with adjustment for patient age, gender, respiratory condition, days between surveys, and hospital site as fixed effects. Site-specific random effects were included to account for within-hospital clustering. A similarly adjusted mixed-effects linear regression model was constructed to examine whether having any difficulty/delays accessing care modified the association between social disadvantage and PedsQL change scores (eg, an improvement from baseline to follow-up).
Because 17% of respondents had missing data for at least one social disadvantage marker, sensitivity analyses were conducted using multiple imputation to account for missing social disadvantage markers using chained equations.27 Sensitivity analyses were also conducted to adjust for severity of illness using vital sign data within the first 24 hours, which could only be validly captured on patients with asthma within our dataset. By restricting this latter analysis to patients with asthma, we were able to examine the relationships of interest in a population with chronic disease.
RESULTS
The study sample included 1,860 patients, of which 1,325 had both baseline and follow-up PedsQL data (71%). Descriptive statistics were similar between those who completed the baseline and follow-up surveys (Table 1).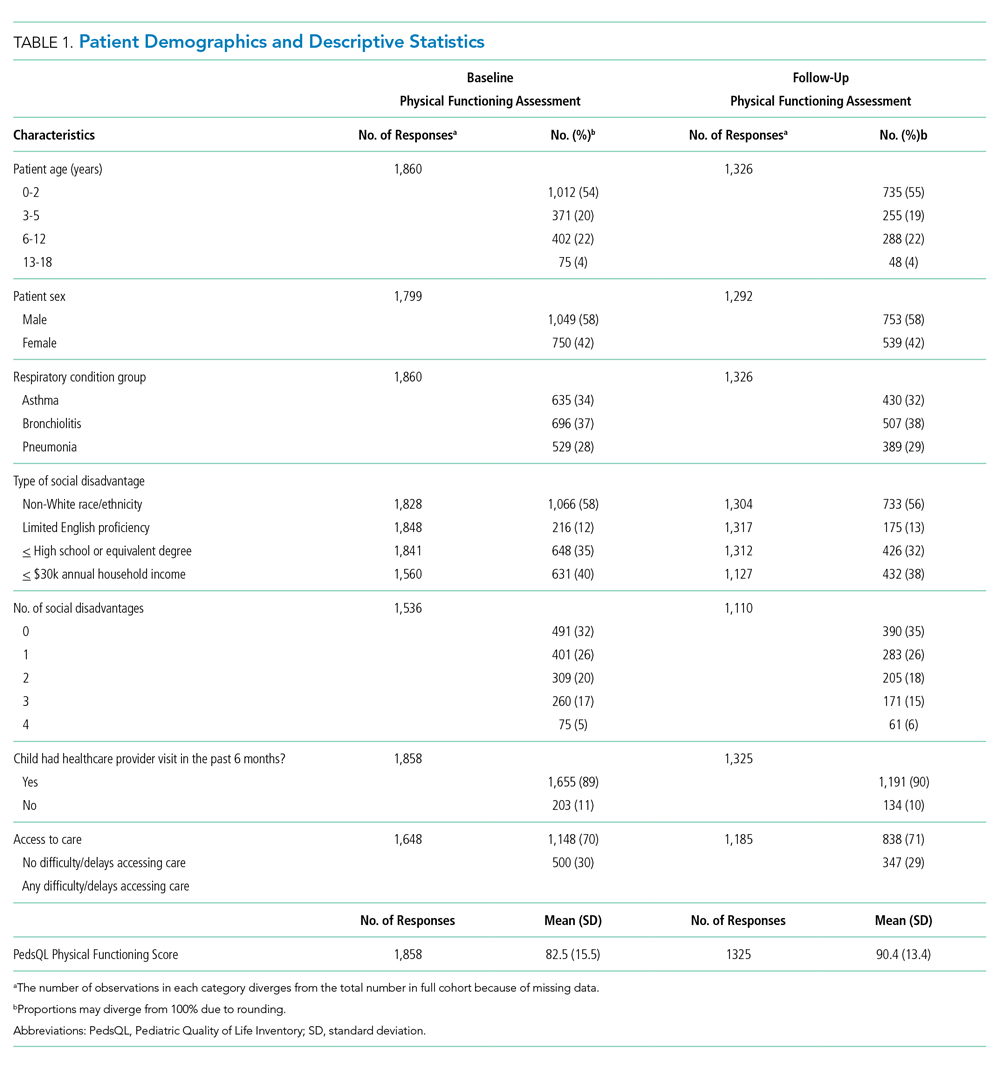
Twenty-two percent of patients had >/=3 social disadvantages and 30% of caregivers reported having any difficulty/delays accessing care. The mean follow-up PedsQL score was higher than the baseline score (90.4 vs 82.5; Table 1).
Social Disadvantage Markers and PedsQL Scores
The number of social disadvantage markers was inversely related to mean baseline PedsQL scores, but there was no difference in mean follow-up PedsQL scores between social disadvantage groups (Table 2). In adjusted analyses, the mean baseline PedsQL score was −6.1 points (95% CI: −8.7, −3.5) lower for patients with >/= 3 social disadvantage markers compared with patients with no social disadvantage markers, which exceeded the scale’s MCID.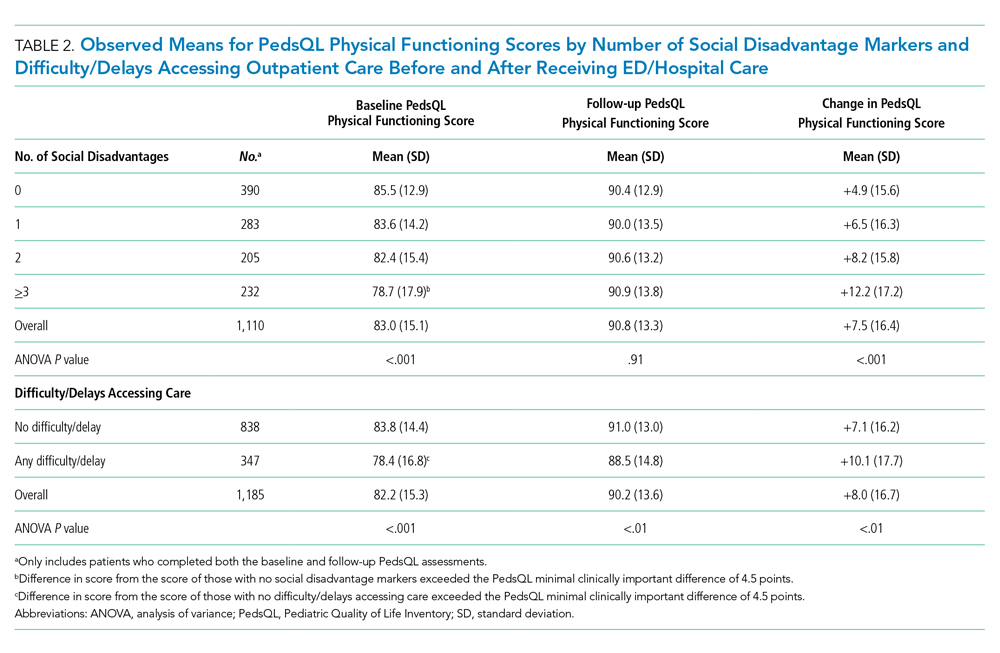
Difficulty/Delays Accessing Care and PedsQL Scores
Having any difficulty/delays accessing care was significantly associated with lower baseline and follow-up PedsQL scores (Table 2). In adjusted analyses, the difference in baseline scores was 5.2 points (95% CI: −7.2, −3.2), which exceedes the scale’s MCID.
Interaction Between Social Disadvantage Markers, Difficulty/Delays Accessing Care, and Change in PedsQL Scores from Baseline to Follow-Up
While having =/>2 social disadvantage markers and difficulty/delays accessing care were each positively associated with changes in PedsQL scores from baseline to follow-up (Table 3), only patients with =/> 3 social disadvantage markers exceeded the PedsQL MCID. In stratified analyses, patients with a combination of social disadvantage makers and difficulties/delays accessing care had lower baseline PedsQL scores and greater change in PedsQL scores from baseline to follow-up compared with those without difficulties/delays accessing care (Figure). However, having any difficulty/delays accessing care did not significantly modify the relationship between social disadvantage and change in PedsQL scores, as none of the interaction terms were significant (Table 3, Model 3).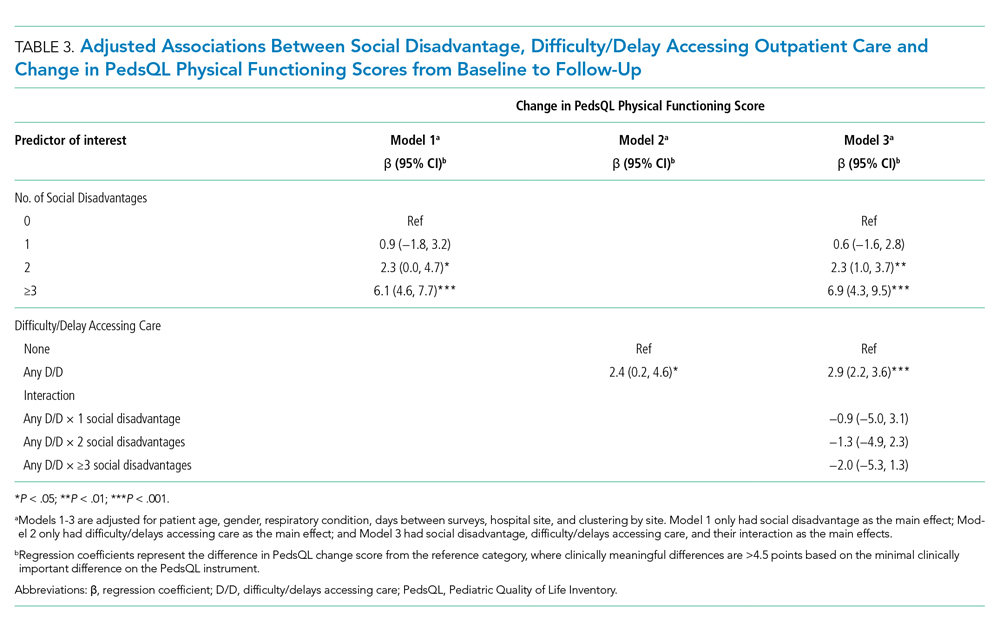
Sensitivity Analysis
Baseline, follow-up, and change in PedsQL scores were similar to our main analysis after performing multiple imputation for missing social disadvantage markers (Supplemental Table 1). Findings were also similar for patients with a diagnosis of asthma only; however, changes in PedsQL scores were greater in magnitude (Appendix Table 2).
DISCUSSION
This study examined the relationship between social disadvantage and child physical functioning before and after hospitalization for acute respiratory illness. Study findings indicated that patients with higher numbers of social disadvantage markers reported lower PedsQL scores before hospitalization; however, differences in PedsQL scores were not apparent after hospitalization. Patients who experienced difficulty/delays accessing care also reported lower PedsQL scores at baseline. This difference was still significant but did not exceed the PedsQL MCID threshold after hospitalization. Difficulty/delays accessing care appeared to be an additional social disadvantage marker; however, it did not modify the relationship between social disadvantage and improvement in physical functioning.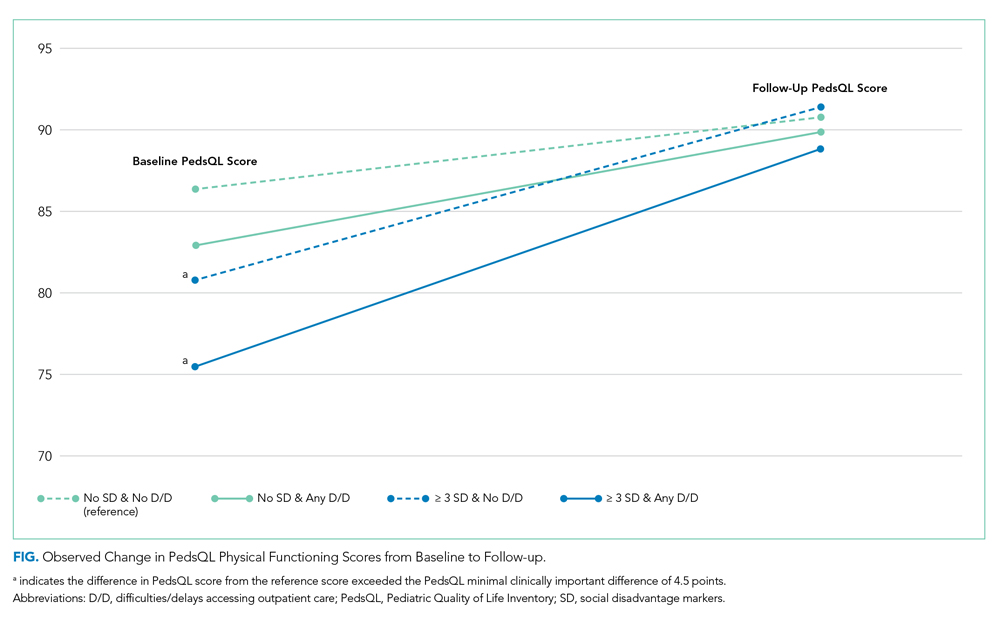
The study findings at baseline are consistent with prior studies demonstrating a negative association between social disadvantage markers and HRQoL and a cumulative effect based on the number of social disadvantages.3,4,7,8 This study adds to the existing literature by examining how this relationship changes after hospitalization. As evidenced by the lack of association between social disadvantage markers and follow-up PedsQL scores, our findings suggest that receipt of inpatient care improved perceptions of physical functioning to a greater extent for patients with more social disadvantage markers (especially patients with =/> 3 social disadvantage markers). There are several potential reasons for these findings.
One possibility is that caregivers and/or patients with more social disadvantage markers are more influenced by context when assessing physical functioning. This could lead to an underestimation of functioning when asked to recall baseline physical functioning at the time of acute illness and overestimation of functioning after recovery from an illness. This possibility is consistent with a form of response bias, extreme response tendencies, in which lower socioeconomic subgroups tend to choose the more extreme response options of a scale.28 In the absence of longitudinal assessments of HRQoL across the care continuum over time, disentangling whether these differences are due to response bias or representative of true changes in physical functioning remains challenging.
Given that disparities in physical functioning at baseline were consistent with prior evidence, another possibility is that hospitalization provided an opportunity to address gaps in access and quality that may have existed for patients with social disadvantage in the community setting. The 24/7 nature of hospital care, usually from a multidisciplinary team of providers, lends itself to opportunities to receive intensive education related to the current illness or to address other health concerns that parents or providers identify during a hospital stay. For example, consistent and repetitive asthma education may be more beneficial to patients and families with more social disadvantage markers. The fact that the association between social disadvantage markers and change in physical functioning scores were greater for patients with asthma supports this reasoning. Hospital care may also provide an opportunity to address other unmet medical needs or psychosocial needs by providing efficient access to subspecialists, social workers, or interpreters. Further research is needed to elucidate whether families received additional services in the hospital setting that were not available to them prior to hospitalization, such as consistent interpreter use, social work engagement, and subspecialty/community referrals. Further studies should also determine whether the provision of equitable medical and social support services is associated with improvements in HRQoL disparities. Additionally, studies should examine whether physical functioning improvements following hospitalization return to baseline levels after a longer period of time and, if so, how we might sustain these reductions in HRQoL disparities. Such studies may identify tangible targets and interventions to reduce disparities in HRQoL for these children.
This study highlights the importance of assessing for difficulty/delays accessing care in addition to social disadvantage markers, as this was also a significant predictor of lower child physical functioning. Differences in PedsQL scores between those who reported any versus no difficulty/delays accessing care were more pronounced at baseline compared with follow-up. A possible reason for these findings is that receiving hospital care may have addressed some access to care issues that were present in the outpatient setting, which resulted in improved perceptions of physical functioning. For example, hospital care may mitigate access to care barriers such as limited after-hours clinic appointments, language barriers, and lack of insurance, thus providing some patients with an alternative pathway to address their health concerns. Alternatively, hospital staff may assist families in scheduling follow-up appointments with the patient’s primary medical home after discharge, which potentially reduced some access to care barriers. The question is whether these disparities will widen once again after a longer follow-up period if families continue facing barriers to accessing needed care in the outpatient setting.
The results of the effect modification analysis demonstrated that the association between social disadvantage and change in PedsQL scores from baseline to follow-up was not significantly different based on a child’s ability to access care. In our stratified analysis, difficulty/delays accessing care added to baseline disparities at each social disadvantage level but did not alter how perceptions of physical functioning change over time. Therefore, physical functioning improvements may rely more heavily on the type of care received within the hospital setting as opposed to accessing care in the first place. However, future studies should examine whether access to high-quality care instead of simply measuring difficulty/delays in accessing care would lead to different results. Access to a comprehensive medical home may be a better measure to assess for effect modification because it measures features beyond access to care, such as continuity, comprehensiveness, communication, and coordination of outpatient care.29-31
If additional studies find evidence that the nature of hospital care, an intensive 24/7 care setting, differentially benefits patients with higher social disadvantage markers (particularly those with =/> 3 markers and chronic illness), this would support the need for systematic screening for social disadvantages or difficulty/delays accessing care in the inpatient setting. Systematic screening could help ensure all patients who may benefit from additional services, such as intensive, culturally tailored education or connections to food, housing, or financial services, will in fact receive them, which may lead to sustained reductions in health disparities.20 Further research into pairing validated screening tools with proven interventions is needed.32
This study has additional limitations aside from those noted above. First, we did not reassess perceived or actual access to care after hospitalization, which may have allowed for analyses to examine access to care as a mediator between social disadvantage and lower child physical functioning. Second, this study included only English- and Spanish-speaking patients and families. Patients with less commonly spoken languages may experience more difficulty accessing or navigating the health system, which may further impact access to care and HRQoL. Third, we had a considerable amount of missing social disadvantage marker data (mainly income); however, our sensitivity analyses did not result in significantly different or clinically meaningful differences in our findings. Insurance status is more feasible to obtain from administrative data and could serve as a proxy for income or as an additional social disadvantage marker in future studies. Finally, we could calculate illness severity only for patients with asthma based on the available data; therefore, we could not adequately control for illness severity across all conditions.
CONCLUSIONS
Social disadvantage was associated with lower child physical functioning before hospitalization, but differences were not apparent after hospitalization for children with acute respiratory illness. Caregiver-perceived difficulty/delays accessing care was found to be an additional predictor of lower physical functioning at baseline but did not significantly alter the association between social disadvantage and improvement in physical functioning over time. Further studies are needed to understand how hospital care may differentially impact child physical functioning for patients with higher social disadvantage makers in order to sustain improvements in HRQoL disparities.
Acknowledgments
The authors thank the following individuals of the Pediatric Respiratory Illness Measurement System (PRIMES) study team for their contributions to this work: Karen M. Wilson, New York, New York; Ricardo A. Quinonez, Houston, Texas; Joyee G. Vachani, Houston, Texas; and Amy Tyler, Aurora, Colorado. We would also like to thank the Pediatric Research in Inpatient Settings Network for facilitating this work.
1. Szilagyi PG, Schor EL. The health of children. Health Serv Res. 1998;33(4 Pt 2):1001-1039.
2. Varni JW, Burwinkle TM, Lane MM. Health-related quality of life measurement in pediatric clinical practice: an appraisal and precept for future research and application. Health Qual Life Outcomes. 2005;3(1):34. https://doi.org/10.1186/1477-7525-3-34.
3. von Rueden U, Gosch A, Rajmil L, Bisegger C, Ravens-Sieberer U. Socioeconomic determinants of health related quality of life in childhood and adolescence: results from a European study. J Epidemiol Community Health. 2006;60(2):130-135. https://doi.org/10.1136/jech.2005.039792.
4. Quittner AL, Schechter MS, Rasouliyan L, Haselkorn T, Pasta DJ, Wagener JS. Impact of socioeconomic status, race, and ethnicity on quality of life in patients with cystic fibrosis in the United States. Chest. 2010;137(3):642-650. https://doi.org/10.1378/chest.09-0345.
5. Flores G, Tomany-Korman SC, Corey CR, Freeman HE, Shapiro MF. Racial and ethnic disparities in medical and dental health, access to care, and use of services in US children. Pediatrics. 2008;121(2):e286-98. https://doi.org/10.1542/peds.2007-1243.
6. Fedele DA, Molzon ES, Eddington AR, Hullmann SE, Mullins LL, Gillaspy SG. Perceived barriers to care in a pediatric medical home: the moderating role of caregiver minority status. Clin Pediatr (Phila). 2014;53(4):351-355. https://doi.org/10.1177/0009922813507994.
7. Larson K, Russ SA, Crall JJ, Halfon N. Influence of multiple social risks on children’s health. Pediatrics. 2008;121(2):337-344. https://doi.org/10.1542/peds.2007-0447.
8. Bauman LJ, Silver EJ, Stein REK. Cumulative social disadvantage and child health. Pediatrics. 2006;117(4):1321-1328. https://doi.org/10.1542/peds.2005-1647.
9. Andrulis DP. Moving beyond the status quo in reducing racial and ethnic disparities in children’s health. Public Health Rep. 2005;120(4):370-377. https://doi.org/10.1177/003335490512000403.
10. Flores G, Lin H. Trends in racial/ethnic disparities in medical and oral health, access to care, and use of services in US children: has anything changed over the years? Int J Equity Health. 2013;12:10. https://doi.org/10.1186/1475-9276-12-10.
11. Seid M, Stevens GD, Varni JW. Parents’ perceptions of pediatric primary care quality: effects of race/ethnicity, language, and access. Health Serv Res. 2003;38(4):1009-1031. https://doi.org/10.1111/1475-6773.00160.
12. Seid M, Varni JW, Cummings L, Schonlau M. The impact of realized access to care on health-related quality of life: a two-year prospective cohort study of children in the California State Children’s Health Insurance Program. J Pediatr. 2006;149(3):354-361. https://doi.org/10.1016/j.jpeds.2006.04.024.
13. Varni JW, Burwinkle TM, Seid M, Skarr D. The PedsQL 4.0 as a pediatric population health measure: feasibility, reliability, and validity. Ambul Pediatr. 2003;3(6):329-341. https://doi.xorg/10.1367/1539-4409(2003)003<0329:tpaapp>2.0.co;2.
14. Simon AE, Chan KS, Forrest CB. Assessment of children’s health-related quality of life in the united states with a multidimensional index. Pediatrics. 2008;121(1):e118-e126. https://doi.org/10.1542/peds.2007-0480.
15. Cheng TL, Emmanuel MA, Levy DJ, Jenkins RR. Child health disparities: what can a clinician do? Pediatrics. 2015;136(5):961-968. https://doi.org/10.1542/peds.2014-4126.
16. Christakis DA, Mell L, Koepsell TD, Zimmerman FJ, Connell FA. Association of lower continuity of care with greater risk of emergency department use and hospitalization in children. Pediatrics. 2001;107(3):524-529. https://doi.org/10.1542/peds.107.3.524.
17. Lion KC, Raphael JL. Partnering health disparities research with quality improvement science in pediatrics. Pediatrics. 2015;135(2):354-361. https://doi.org/10.1542/peds.2014-2982.
18. Williams DR, Costa MV, Odunlami AO, Mohammed SA. Moving upstream: how interventions that address the social determinants of health can improve health and reduce disparities. J Public Health Manag Pract. 2008;14:S8-S17. https://doi.org/10.1097/01.PHH.0000338382.36695.42.
19. Beck AF, Cohen AJ, Colvin JD, et al. Perspectives from the Society for Pediatric Research: interventions targeting social needs in pediatric clinical care. Pediatr Res. 2018;84(1):10-21. https://doi.org/10.1038/s41390-018-0012-1.
20. Shah AN, Simmons J, Beck AF. Adding a vital sign: considering the utility of place-based measures in health care settings. Hosp Pediatr. 2018;8(2):112-114. https://doi.org/10.1542/hpeds.2017-0219.
21. Leyenaar JK, Ralston SL, Shieh M-S, Pekow PS, Mangione-Smith R, Lindenauer PK. Epidemiology of pediatric hospitalizations at general hospitals and freestanding children’s hospitals in the United States. J Hosp Med. 2016;11(11):743-749. https://doi.org/10.1002/jhm.2624.
22. Desai AD, Zhou C, Stanford S, Haaland W, Varni JW, Mangione-Smith RM. Validity and responsiveness of the pediatric quality of life inventory (PedsQL) 4.0 generic core scales in the pediatric inpatient setting. JAMA Pediatr. 2014;168(12):1114-1121. https://doi.org/10.1001/jamapediatrics.2014.1600.
23. Rabbitts JA, Palermo TM, Zhou C, Mangione-Smith R. Pain and health-related quality of life after pediatric inpatient surgery. J Pain. 2015;16(12):1334-1341. https://doi.org/10.1016/j.jpain.2015.09.005.
24. Mangione-Smith R, Zhou C, Williams DJ, et al. Pediatric respiratory illness measurement system (PRIMES) scores and outcomes. Pediatrics. 2019;144(2):e20190242. https://doi.org/10.1542/peds.2019-0242.
25. Child and Adolescent Health Measurement Initiative. National survey of children with special health care needs (NS-CSHCN), 2009-2010. Available at: http://childhealthdata.org/learn/NS-CSHCN/topics_questions. Accessed on September 20, 2018.
26. Varni JW, Limbers CA, Burwinkle TM. How young can children reliably and validly self-report their health-related quality of life?: an analysis of 8,591 children across age subgroups with the PedsQL 4.0 Generic Core Scales. Health Qual Life Outcomes. 2007;5:1. https://doi.org/10.1186/1477-7525-5-1.
27. Buuren S van, Groothuis-Oudshoorn K. Mice: Multivariate imputation by chained equations in R. J Stat Softw. 2011;45(3):1-67. https://doi.org/10.18637/jss.v045.i03.
28. Elliott MN, Haviland AM, Kanouse DE, Hambarsoomian K, Hays RD. Adjusting for subgroup differences in extreme response tendency in ratings of health care: impact on disparity estimates. Heal Serv Res. 2009;44(2 Pt 1):542-561. https://doi.org/10.1111/j.1475-6773.2008.00922.x.
29. Stevens GD, Vane C, Cousineau MR. Association of experiences of medical home quality with health-related quality of life and school engagement among Latino children in low-income families. Health Serv Res. 2011;46(6pt1):1822-1842. https://doi.org/10.1111/j.1475-6773.2011.01292.x.
30. Long WE, Bauchner H, Sege RD, Cabral HJ, Garg A. The value of the medical home for children without special health care needs. Pediatrics. 2012;129(1):87-98. https://doi.org/10.1542/peds.2011-1739.
31. Strickland BB, Jones JR, Ghandour RM, Kogan MD, Newacheck PW. The medical home: health care access and impact for children and youth in the United States. Pediatrics. 2011;127(4):604-611. https://doi.org/10.1542/peds.2009-3555.
32. Sokol R, Austin A, Chandler C, et al. Screening children for social determinants of health: a systematic review. Pediatrics. 2019;144(4):e20191622. https://doi.org/10.1542/peds.2019-1622.
Examining disparities in health-related quality of life (HRQoL) outcomes in children provides a unique patient-centered perspective on pediatric health services equity.1,2 Prior studies have demonstrated the relationship between minority race, low socioeconomic status, and lower maternal education with poorer HRQoL outcomes in children.3-6 Some studies have also shown a dose-response relationship between social disadvantage markers and poorer child health status.7,8 Furthermore, the associations between social disadvantage and poor access to care,9-11 and between poor access to care and lower HRQoL, are also well established.12-14
Examining HRQoL before and after hospitalization can further our understanding of how disparities in HRQoL may change once children engage with the medical system for an acute illness.15 Children requiring hospitalization constitute a useful population for examination of this question as they represent a group of children with variable social disadvantage markers and access to outpatient care.16 Although interventions to address social determinants of health for patients with social disadvantages have been associated with within-group improvements in HRQoL, none have assessed changes in disparities as an outcome.17 Furthermore, many of these studies were conducted in the outpatient setting,18,19 whereas hospitalization provides an additional point of care to address the social determinants of health for vulnerable families.20 Even for short hospitalizations, the 24/7 nature of hospital care provides the opportunity for frequent interactions with clinicians, nurses, and support staff to clarify illness-related questions, discuss other health concerns and unmet needs, and connect with social services or community resources. These opportunities may be particularly important for families with a higher number of social disadvantage markers and even more beneficial to those with difficulty accessing needed care from their primary medical home.
In this study, we focused on children with common respiratory illnesses (asthma, bronchiolitis, and pneumonia), which constitute the majority of childhood hospitalizations.21 Additionally, we only focused on the child’s physical functioning component of HRQoL because this component is most likely to improve after hospitalization for children with an acute respiratory illness.22 A prior study examining HRQoL before and after hospitalization demonstrated that most children return to and/or surpass their baseline physical functioning by 1 month after hospital discharge.23
Our primary objective was to examine associations between several markers of social disadvantage, access to care, and child physical functioning before and after hospitalization for acute respiratory illness. Second, we aimed to understand if access to care (defined as perceived difficulty/delays getting care) acts as an independent predictor of improvement in physical functioning from baseline to follow-up and/or if it modifies the relationship between social disadvantage and improvement in physical functioning (Appendix Figure).
METHODS
Study Design and Population
This study was nested within a multicenter, prospective cohort study of children who were hospitalized for asthma, bronchiolitis, or pneumonia between July 2014 and June 2016 at one of five children’s hospitals in the Pediatric Research in Inpatient Settings Network.24
We approached families for study participation within 72 hours of admission to the hospital using a standard protocol. Patients and their caregivers were eligible to participate in the study if the patient was 2 weeks to 16 years old and if the primary caregiver’s preferred language for medical communication was either English or Spanish. Patients with chronic medical conditions (except asthma), with moderate to severe developmental delay, with a history of prematurity <32 weeks, or who received care in the intensive care unit were excluded. Patients could only participate in the study once.
The study team set out to enroll an even number of patients across all three conditions. If a patient’s discharge diagnosis differed from their admission diagnosis (eg, from bronchiolitis to pneumonia), discharge diagnosis was used for condition group assignment. If the discharge diagnosis was not one of these three respiratory conditions, we excluded the patient from further analysis.
Data Collection
We collected data using two surveys. The first survey was administered within 72 hours of admission. This survey asked questions related to (1) caregiver-reported markers of social disadvantage, (2) caregiver perceptions of access to care, and (3) caregiver- and patient-reported assessments of physical functioning. The second survey was administered within 2 to 8 weeks after the patient’s discharge and included a second assessment of physical functioning.
Social Disadvantage
Patients were considered to have a marker of social disadvantage if their caregiver reported (1) being of non-White race and/or Hispanic ethnicity, (2) primarily speaking a language other than English at home and not speaking English very well (ie, limited English proficiency), (3) attaining at most a high school or equivalent degree, or (4) having a =/<$30,000 annual household income.
Access to Care
We used the following survey item from the 2009-2010 National Survey of Children with Special Health Care Needs25 to measure caregiver perceptions of access to care: “In the last six months, did you have any difficulties or delays getting care for your child because there were waiting lists, backlogs, or other problems getting an appointment?” We narrowed the original assessment time frame from 12 months to 6 months to provide a more proximal assessment of access in relation to the hospitalization.
Child Physical Functioning
We assessed child physical functioning using the physical functioning domain of the Pediatric Quality of Life Inventory (PedsQL) 4.0 Generic Core Scales and PedsQL Infant Scales, which have been validated for use in the inpatient setting.22 Caregivers completed one of these scales based on their child’s age. Assenting patients 8 to 16 years old completed the self-report PedsQL 4.0 Generic Core Scales instrument. When completing the first PedsQL survey, caregivers and patients reflected on the previous month before their child (or they) became ill to obtain a baseline physical functioning assessment.23 When completing the second PedsQL survey, caregivers and patients reflected on the past 7 days to obtain a follow-up assessment.
All study procedures were approved by the Western Institutional Review Board (IRB) or the participating hospitals’ IRB.
Statistical Analysis
Patients with no missing data for all four social disadvantage markers were categorized based on the number of markers they reported: none, one, two, or three or more markers. We combined patients with three and four social disadvantage markers into one group to maximize power for the analyses. We dichotomized the access to care variable and coded response options as “no difficulty/delays accessing care” if the caregiver chose “Never” and “any difficulty/delays accessing care” if they chose “Sometimes/Usually/Always.”
For each patient–caregiver dyad, PedsQL items were scored using a standard method in which higher scores reflected better functioning.22 A single set of PedsQL scores was used for each patient–caregiver dyad. We used self-reported patient scores if the patient completed the PedsQL instrument; otherwise, we used proxy-reported caregiver scores. Intraclass correlations between child self-report and parent proxy-report demonstrate moderate to good agreement above age 8 years.26 We computed a change in the physical functioning score by subtracting the baseline score from the follow-up score. The minimal clinically important difference (MCID) for the PedsQL instrument is 4.5 points, which we used to identify clinically meaningful differences.13
Analysis of variance models were constructed to test for differences in mean baseline and follow-up PedsQL scores (dependent variable) between the following independent variables: (1) social disadvantage groups and (2) those who reported having any difficulty/delays accessing care compared with those who did not. Only patient–caregiver dyads with both baseline and follow-up assessments were included in these analyses. Mixed-effects linear regression models were constructed to identify clinically meaningful differences in PedsQL scores between groups (MCID =/> 4.5) with adjustment for patient age, gender, respiratory condition, days between surveys, and hospital site as fixed effects. Site-specific random effects were included to account for within-hospital clustering. A similarly adjusted mixed-effects linear regression model was constructed to examine whether having any difficulty/delays accessing care modified the association between social disadvantage and PedsQL change scores (eg, an improvement from baseline to follow-up).
Because 17% of respondents had missing data for at least one social disadvantage marker, sensitivity analyses were conducted using multiple imputation to account for missing social disadvantage markers using chained equations.27 Sensitivity analyses were also conducted to adjust for severity of illness using vital sign data within the first 24 hours, which could only be validly captured on patients with asthma within our dataset. By restricting this latter analysis to patients with asthma, we were able to examine the relationships of interest in a population with chronic disease.
RESULTS
The study sample included 1,860 patients, of which 1,325 had both baseline and follow-up PedsQL data (71%). Descriptive statistics were similar between those who completed the baseline and follow-up surveys (Table 1).
Twenty-two percent of patients had >/=3 social disadvantages and 30% of caregivers reported having any difficulty/delays accessing care. The mean follow-up PedsQL score was higher than the baseline score (90.4 vs 82.5; Table 1).
Social Disadvantage Markers and PedsQL Scores
The number of social disadvantage markers was inversely related to mean baseline PedsQL scores, but there was no difference in mean follow-up PedsQL scores between social disadvantage groups (Table 2). In adjusted analyses, the mean baseline PedsQL score was −6.1 points (95% CI: −8.7, −3.5) lower for patients with >/= 3 social disadvantage markers compared with patients with no social disadvantage markers, which exceeded the scale’s MCID.
Difficulty/Delays Accessing Care and PedsQL Scores
Having any difficulty/delays accessing care was significantly associated with lower baseline and follow-up PedsQL scores (Table 2). In adjusted analyses, the difference in baseline scores was 5.2 points (95% CI: −7.2, −3.2), which exceedes the scale’s MCID.
Interaction Between Social Disadvantage Markers, Difficulty/Delays Accessing Care, and Change in PedsQL Scores from Baseline to Follow-Up
While having =/>2 social disadvantage markers and difficulty/delays accessing care were each positively associated with changes in PedsQL scores from baseline to follow-up (Table 3), only patients with =/> 3 social disadvantage markers exceeded the PedsQL MCID. In stratified analyses, patients with a combination of social disadvantage makers and difficulties/delays accessing care had lower baseline PedsQL scores and greater change in PedsQL scores from baseline to follow-up compared with those without difficulties/delays accessing care (Figure). However, having any difficulty/delays accessing care did not significantly modify the relationship between social disadvantage and change in PedsQL scores, as none of the interaction terms were significant (Table 3, Model 3).
Sensitivity Analysis
Baseline, follow-up, and change in PedsQL scores were similar to our main analysis after performing multiple imputation for missing social disadvantage markers (Supplemental Table 1). Findings were also similar for patients with a diagnosis of asthma only; however, changes in PedsQL scores were greater in magnitude (Appendix Table 2).
DISCUSSION
This study examined the relationship between social disadvantage and child physical functioning before and after hospitalization for acute respiratory illness. Study findings indicated that patients with higher numbers of social disadvantage markers reported lower PedsQL scores before hospitalization; however, differences in PedsQL scores were not apparent after hospitalization. Patients who experienced difficulty/delays accessing care also reported lower PedsQL scores at baseline. This difference was still significant but did not exceed the PedsQL MCID threshold after hospitalization. Difficulty/delays accessing care appeared to be an additional social disadvantage marker; however, it did not modify the relationship between social disadvantage and improvement in physical functioning.
The study findings at baseline are consistent with prior studies demonstrating a negative association between social disadvantage markers and HRQoL and a cumulative effect based on the number of social disadvantages.3,4,7,8 This study adds to the existing literature by examining how this relationship changes after hospitalization. As evidenced by the lack of association between social disadvantage markers and follow-up PedsQL scores, our findings suggest that receipt of inpatient care improved perceptions of physical functioning to a greater extent for patients with more social disadvantage markers (especially patients with =/> 3 social disadvantage markers). There are several potential reasons for these findings.
One possibility is that caregivers and/or patients with more social disadvantage markers are more influenced by context when assessing physical functioning. This could lead to an underestimation of functioning when asked to recall baseline physical functioning at the time of acute illness and overestimation of functioning after recovery from an illness. This possibility is consistent with a form of response bias, extreme response tendencies, in which lower socioeconomic subgroups tend to choose the more extreme response options of a scale.28 In the absence of longitudinal assessments of HRQoL across the care continuum over time, disentangling whether these differences are due to response bias or representative of true changes in physical functioning remains challenging.
Given that disparities in physical functioning at baseline were consistent with prior evidence, another possibility is that hospitalization provided an opportunity to address gaps in access and quality that may have existed for patients with social disadvantage in the community setting. The 24/7 nature of hospital care, usually from a multidisciplinary team of providers, lends itself to opportunities to receive intensive education related to the current illness or to address other health concerns that parents or providers identify during a hospital stay. For example, consistent and repetitive asthma education may be more beneficial to patients and families with more social disadvantage markers. The fact that the association between social disadvantage markers and change in physical functioning scores were greater for patients with asthma supports this reasoning. Hospital care may also provide an opportunity to address other unmet medical needs or psychosocial needs by providing efficient access to subspecialists, social workers, or interpreters. Further research is needed to elucidate whether families received additional services in the hospital setting that were not available to them prior to hospitalization, such as consistent interpreter use, social work engagement, and subspecialty/community referrals. Further studies should also determine whether the provision of equitable medical and social support services is associated with improvements in HRQoL disparities. Additionally, studies should examine whether physical functioning improvements following hospitalization return to baseline levels after a longer period of time and, if so, how we might sustain these reductions in HRQoL disparities. Such studies may identify tangible targets and interventions to reduce disparities in HRQoL for these children.
This study highlights the importance of assessing for difficulty/delays accessing care in addition to social disadvantage markers, as this was also a significant predictor of lower child physical functioning. Differences in PedsQL scores between those who reported any versus no difficulty/delays accessing care were more pronounced at baseline compared with follow-up. A possible reason for these findings is that receiving hospital care may have addressed some access to care issues that were present in the outpatient setting, which resulted in improved perceptions of physical functioning. For example, hospital care may mitigate access to care barriers such as limited after-hours clinic appointments, language barriers, and lack of insurance, thus providing some patients with an alternative pathway to address their health concerns. Alternatively, hospital staff may assist families in scheduling follow-up appointments with the patient’s primary medical home after discharge, which potentially reduced some access to care barriers. The question is whether these disparities will widen once again after a longer follow-up period if families continue facing barriers to accessing needed care in the outpatient setting.
The results of the effect modification analysis demonstrated that the association between social disadvantage and change in PedsQL scores from baseline to follow-up was not significantly different based on a child’s ability to access care. In our stratified analysis, difficulty/delays accessing care added to baseline disparities at each social disadvantage level but did not alter how perceptions of physical functioning change over time. Therefore, physical functioning improvements may rely more heavily on the type of care received within the hospital setting as opposed to accessing care in the first place. However, future studies should examine whether access to high-quality care instead of simply measuring difficulty/delays in accessing care would lead to different results. Access to a comprehensive medical home may be a better measure to assess for effect modification because it measures features beyond access to care, such as continuity, comprehensiveness, communication, and coordination of outpatient care.29-31
If additional studies find evidence that the nature of hospital care, an intensive 24/7 care setting, differentially benefits patients with higher social disadvantage markers (particularly those with =/> 3 markers and chronic illness), this would support the need for systematic screening for social disadvantages or difficulty/delays accessing care in the inpatient setting. Systematic screening could help ensure all patients who may benefit from additional services, such as intensive, culturally tailored education or connections to food, housing, or financial services, will in fact receive them, which may lead to sustained reductions in health disparities.20 Further research into pairing validated screening tools with proven interventions is needed.32
This study has additional limitations aside from those noted above. First, we did not reassess perceived or actual access to care after hospitalization, which may have allowed for analyses to examine access to care as a mediator between social disadvantage and lower child physical functioning. Second, this study included only English- and Spanish-speaking patients and families. Patients with less commonly spoken languages may experience more difficulty accessing or navigating the health system, which may further impact access to care and HRQoL. Third, we had a considerable amount of missing social disadvantage marker data (mainly income); however, our sensitivity analyses did not result in significantly different or clinically meaningful differences in our findings. Insurance status is more feasible to obtain from administrative data and could serve as a proxy for income or as an additional social disadvantage marker in future studies. Finally, we could calculate illness severity only for patients with asthma based on the available data; therefore, we could not adequately control for illness severity across all conditions.
CONCLUSIONS
Social disadvantage was associated with lower child physical functioning before hospitalization, but differences were not apparent after hospitalization for children with acute respiratory illness. Caregiver-perceived difficulty/delays accessing care was found to be an additional predictor of lower physical functioning at baseline but did not significantly alter the association between social disadvantage and improvement in physical functioning over time. Further studies are needed to understand how hospital care may differentially impact child physical functioning for patients with higher social disadvantage makers in order to sustain improvements in HRQoL disparities.
Acknowledgments
The authors thank the following individuals of the Pediatric Respiratory Illness Measurement System (PRIMES) study team for their contributions to this work: Karen M. Wilson, New York, New York; Ricardo A. Quinonez, Houston, Texas; Joyee G. Vachani, Houston, Texas; and Amy Tyler, Aurora, Colorado. We would also like to thank the Pediatric Research in Inpatient Settings Network for facilitating this work.
1. Szilagyi PG, Schor EL. The health of children. Health Serv Res. 1998;33(4 Pt 2):1001-1039.
2. Varni JW, Burwinkle TM, Lane MM. Health-related quality of life measurement in pediatric clinical practice: an appraisal and precept for future research and application. Health Qual Life Outcomes. 2005;3(1):34. https://doi.org/10.1186/1477-7525-3-34.
3. von Rueden U, Gosch A, Rajmil L, Bisegger C, Ravens-Sieberer U. Socioeconomic determinants of health related quality of life in childhood and adolescence: results from a European study. J Epidemiol Community Health. 2006;60(2):130-135. https://doi.org/10.1136/jech.2005.039792.
4. Quittner AL, Schechter MS, Rasouliyan L, Haselkorn T, Pasta DJ, Wagener JS. Impact of socioeconomic status, race, and ethnicity on quality of life in patients with cystic fibrosis in the United States. Chest. 2010;137(3):642-650. https://doi.org/10.1378/chest.09-0345.
5. Flores G, Tomany-Korman SC, Corey CR, Freeman HE, Shapiro MF. Racial and ethnic disparities in medical and dental health, access to care, and use of services in US children. Pediatrics. 2008;121(2):e286-98. https://doi.org/10.1542/peds.2007-1243.
6. Fedele DA, Molzon ES, Eddington AR, Hullmann SE, Mullins LL, Gillaspy SG. Perceived barriers to care in a pediatric medical home: the moderating role of caregiver minority status. Clin Pediatr (Phila). 2014;53(4):351-355. https://doi.org/10.1177/0009922813507994.
7. Larson K, Russ SA, Crall JJ, Halfon N. Influence of multiple social risks on children’s health. Pediatrics. 2008;121(2):337-344. https://doi.org/10.1542/peds.2007-0447.
8. Bauman LJ, Silver EJ, Stein REK. Cumulative social disadvantage and child health. Pediatrics. 2006;117(4):1321-1328. https://doi.org/10.1542/peds.2005-1647.
9. Andrulis DP. Moving beyond the status quo in reducing racial and ethnic disparities in children’s health. Public Health Rep. 2005;120(4):370-377. https://doi.org/10.1177/003335490512000403.
10. Flores G, Lin H. Trends in racial/ethnic disparities in medical and oral health, access to care, and use of services in US children: has anything changed over the years? Int J Equity Health. 2013;12:10. https://doi.org/10.1186/1475-9276-12-10.
11. Seid M, Stevens GD, Varni JW. Parents’ perceptions of pediatric primary care quality: effects of race/ethnicity, language, and access. Health Serv Res. 2003;38(4):1009-1031. https://doi.org/10.1111/1475-6773.00160.
12. Seid M, Varni JW, Cummings L, Schonlau M. The impact of realized access to care on health-related quality of life: a two-year prospective cohort study of children in the California State Children’s Health Insurance Program. J Pediatr. 2006;149(3):354-361. https://doi.org/10.1016/j.jpeds.2006.04.024.
13. Varni JW, Burwinkle TM, Seid M, Skarr D. The PedsQL 4.0 as a pediatric population health measure: feasibility, reliability, and validity. Ambul Pediatr. 2003;3(6):329-341. https://doi.xorg/10.1367/1539-4409(2003)003<0329:tpaapp>2.0.co;2.
14. Simon AE, Chan KS, Forrest CB. Assessment of children’s health-related quality of life in the united states with a multidimensional index. Pediatrics. 2008;121(1):e118-e126. https://doi.org/10.1542/peds.2007-0480.
15. Cheng TL, Emmanuel MA, Levy DJ, Jenkins RR. Child health disparities: what can a clinician do? Pediatrics. 2015;136(5):961-968. https://doi.org/10.1542/peds.2014-4126.
16. Christakis DA, Mell L, Koepsell TD, Zimmerman FJ, Connell FA. Association of lower continuity of care with greater risk of emergency department use and hospitalization in children. Pediatrics. 2001;107(3):524-529. https://doi.org/10.1542/peds.107.3.524.
17. Lion KC, Raphael JL. Partnering health disparities research with quality improvement science in pediatrics. Pediatrics. 2015;135(2):354-361. https://doi.org/10.1542/peds.2014-2982.
18. Williams DR, Costa MV, Odunlami AO, Mohammed SA. Moving upstream: how interventions that address the social determinants of health can improve health and reduce disparities. J Public Health Manag Pract. 2008;14:S8-S17. https://doi.org/10.1097/01.PHH.0000338382.36695.42.
19. Beck AF, Cohen AJ, Colvin JD, et al. Perspectives from the Society for Pediatric Research: interventions targeting social needs in pediatric clinical care. Pediatr Res. 2018;84(1):10-21. https://doi.org/10.1038/s41390-018-0012-1.
20. Shah AN, Simmons J, Beck AF. Adding a vital sign: considering the utility of place-based measures in health care settings. Hosp Pediatr. 2018;8(2):112-114. https://doi.org/10.1542/hpeds.2017-0219.
21. Leyenaar JK, Ralston SL, Shieh M-S, Pekow PS, Mangione-Smith R, Lindenauer PK. Epidemiology of pediatric hospitalizations at general hospitals and freestanding children’s hospitals in the United States. J Hosp Med. 2016;11(11):743-749. https://doi.org/10.1002/jhm.2624.
22. Desai AD, Zhou C, Stanford S, Haaland W, Varni JW, Mangione-Smith RM. Validity and responsiveness of the pediatric quality of life inventory (PedsQL) 4.0 generic core scales in the pediatric inpatient setting. JAMA Pediatr. 2014;168(12):1114-1121. https://doi.org/10.1001/jamapediatrics.2014.1600.
23. Rabbitts JA, Palermo TM, Zhou C, Mangione-Smith R. Pain and health-related quality of life after pediatric inpatient surgery. J Pain. 2015;16(12):1334-1341. https://doi.org/10.1016/j.jpain.2015.09.005.
24. Mangione-Smith R, Zhou C, Williams DJ, et al. Pediatric respiratory illness measurement system (PRIMES) scores and outcomes. Pediatrics. 2019;144(2):e20190242. https://doi.org/10.1542/peds.2019-0242.
25. Child and Adolescent Health Measurement Initiative. National survey of children with special health care needs (NS-CSHCN), 2009-2010. Available at: http://childhealthdata.org/learn/NS-CSHCN/topics_questions. Accessed on September 20, 2018.
26. Varni JW, Limbers CA, Burwinkle TM. How young can children reliably and validly self-report their health-related quality of life?: an analysis of 8,591 children across age subgroups with the PedsQL 4.0 Generic Core Scales. Health Qual Life Outcomes. 2007;5:1. https://doi.org/10.1186/1477-7525-5-1.
27. Buuren S van, Groothuis-Oudshoorn K. Mice: Multivariate imputation by chained equations in R. J Stat Softw. 2011;45(3):1-67. https://doi.org/10.18637/jss.v045.i03.
28. Elliott MN, Haviland AM, Kanouse DE, Hambarsoomian K, Hays RD. Adjusting for subgroup differences in extreme response tendency in ratings of health care: impact on disparity estimates. Heal Serv Res. 2009;44(2 Pt 1):542-561. https://doi.org/10.1111/j.1475-6773.2008.00922.x.
29. Stevens GD, Vane C, Cousineau MR. Association of experiences of medical home quality with health-related quality of life and school engagement among Latino children in low-income families. Health Serv Res. 2011;46(6pt1):1822-1842. https://doi.org/10.1111/j.1475-6773.2011.01292.x.
30. Long WE, Bauchner H, Sege RD, Cabral HJ, Garg A. The value of the medical home for children without special health care needs. Pediatrics. 2012;129(1):87-98. https://doi.org/10.1542/peds.2011-1739.
31. Strickland BB, Jones JR, Ghandour RM, Kogan MD, Newacheck PW. The medical home: health care access and impact for children and youth in the United States. Pediatrics. 2011;127(4):604-611. https://doi.org/10.1542/peds.2009-3555.
32. Sokol R, Austin A, Chandler C, et al. Screening children for social determinants of health: a systematic review. Pediatrics. 2019;144(4):e20191622. https://doi.org/10.1542/peds.2019-1622.
© 2020 Society of Hospital Medicine
Patient Preferences for Physician Attire: A Multicenter Study in Japan
The patient-physician relationship is critical for ensuring the delivery of high-quality healthcare. Successful patient-physician relationships arise from shared trust, knowledge, mutual respect, and effective verbal and nonverbal communication. The ways in which patients experience healthcare and their satisfaction with physicians affect a myriad of important health outcomes, such as adherence to treatment and outcomes for conditions such as hypertension and diabetes mellitus.1-5 One method for potentially enhancing patient satisfaction is through understanding how patients wish their physicians to dress6-8 and tailoring attire to match these expectations. In addition to our systematic review,9 a recent large-scale, multicenter study in the United States revealed that most patients perceive physician attire as important, but that preferences for specific types of attire are contextual.9,10 For example, elderly patients preferred physicians in formal attire and white coat, while scrubs with white coat or scrubs alone were preferred for emergency department (ED) physicians and surgeons, respectively. Moreover, regional variation regarding attire preference was also observed in the US, with preferences for more formal attire in the South and less formal in the Midwest.
Geographic variation, regarding patient preferences for physician dress, is perhaps even more relevant internationally. In particular, Japan is considered to have a highly contextualized culture that relies on nonverbal and implicit communication. However, medical professionals have no specific dress code and, thus, don many different kinds of attire. In part, this may be because it is not clear whether or how physician attire impacts patient satisfaction and perceived healthcare quality in Japan.11-13 Although previous studies in Japan have suggested that physician attire has a considerable influence on patient satisfaction, these studies either involved a single department in one hospital or a small number of respondents.14-17 Therefore, we performed a multicenter, cross-sectional study to understand patients’ preferences for physician attire in different clinical settings and in different geographic regions in Japan.
METHODS
Study Population
We conducted a cross-sectional, questionnaire-based study from 2015 to 2017, in four geographically diverse hospitals in Japan. Two of these hospitals, Tokyo Joto Hospital and Juntendo University Hospital, are located in eastern Japan whereas the others, Kurashiki Central Hospital and Akashi Medical Center, are in western Japan.
Questionnaires were printed and randomly distributed by research staff to outpatients in waiting rooms and inpatients in medical wards who were 20 years of age or older. We placed no restriction on ward site or time of questionnaire distribution. Research staff, including physicians, nurses, and medical clerks, were instructed to avoid guiding or influencing participants’ responses. Informed consent was obtained by the staff; only those who provided informed consent participated in the study. Respondents could request assistance with form completion from persons accompanying them if they had difficulties, such as physical, visual, or hearing impairments. All responses were collected anonymously. The study was approved by the ethics committees of all four hospitals.
Questionnaire
We used a modified version of the survey instrument from a prior study.10 The first section of the survey showed photographs of either a male or female physician with 7 unique forms of attire, including casual, casual with white coat, scrubs, scrubs with white coat, formal, formal with white coat, and business suit (Figure 1). Given the Japanese context of this study, the language was translated to Japanese and photographs of physicians of Japanese descent were used. Photographs were taken with attention paid to achieving constant facial expressions on the physicians as well as in other visual cues (eg, lighting, background, pose). The physician’s gender and attire in the first photograph seen by each respondent were randomized to prevent bias in ordering, priming, and anchoring; all other sections of the survey were identical.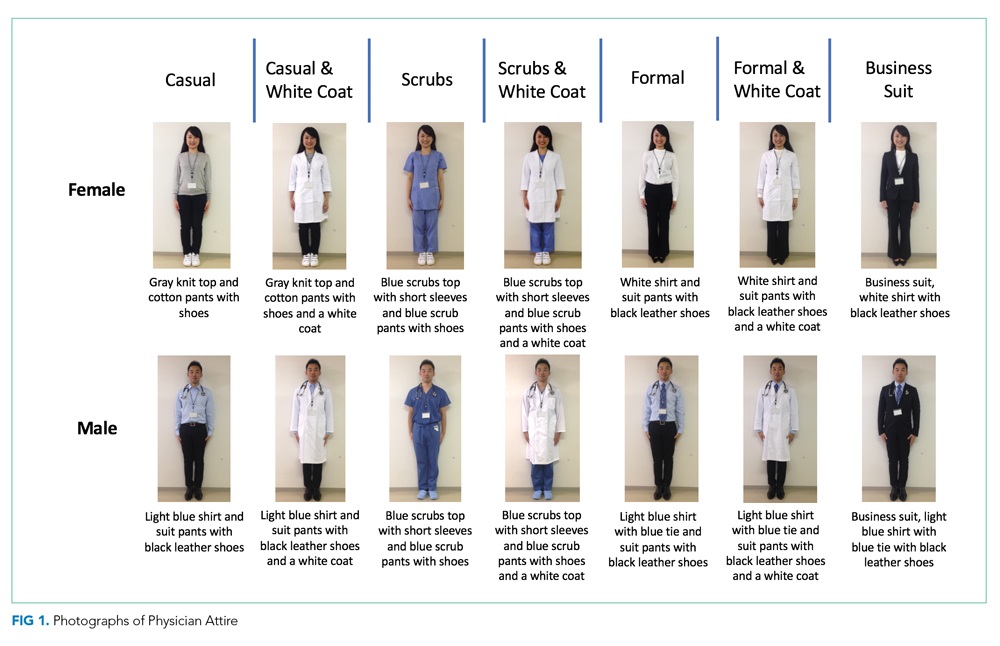
Respondents were first asked to rate the standalone, randomized physician photograph using a 1-10 scale across five domains (ie, how knowledgeable, trustworthy, caring, and approachable the physician appeared and how comfortable the physician’s appearance made the respondent feel), with a score of 10 representing the highest rating. Respondents were subsequently given 7 photographs of the same physician wearing various forms of attire. Questions were asked regarding preference of attire in varied clinical settings (ie, primary care, ED, hospital, surgery, overall preference). To identify the influence of and respondent preferences for physician dress and white coats, a Likert scale ranging from 1 (strongly disagree) to 5 (strongly agree) was employed. The scale was trichotomized into “disagree” (1, 2), “neither agree nor disagree” (3), and “agree” (4, 5) for analysis. Demographic data, including age, gender, education level, nationality (Japanese or non-Japanese), and number of physicians seen in the past year were collected.
Outcomes and Sample Size Calculation
The primary outcome of attire preference was calculated as the mean composite score of the five individual rating domains (ie, knowledgeable, trustworthy, caring, approachable, and comfortable), with the highest score representing the most preferred form of attire. We also assessed variation in preferences for physician attire by respondent characteristics, such as age and gender.
Sample size estimation was based on previous survey methodology.10 The Likert scale range for identifying influence of and respondent preferences for physician dress and white coats was 1-5 (“strongly disagree” to “strongly agree”). The scale range for measuring preferences for the randomized attire photograph was 1-10. An assumption of normality was made regarding responses on the 1-10 scale. An estimated standard deviation of 2.2 was assumed, based on prior findings.10 Based on these assumptions and the inclusion of at least 816 respondents (assuming a two-sided alpha error of 0.05), we expected to have 90% capacity to detect differences for effect sizes of 0.50 on the 1-10 scale.
Statistical Analyses
Paper-based survey data were entered independently and in duplicate by the study team. Respondents were not required to answer all questions; therefore, the denominator for each question varied. Data were reported as mean and standard deviation (SD) or percentages, where appropriate. Differences in the mean composite rating scores were assessed using one-way ANOVA with the Tukey method for pairwise comparisons. Differences in proportions for categorical data were compared using the Z-test. Chi-squared tests were used for bivariate comparisons between respondent age, gender, and level of education and corresponding respondent preferences. All analyses were performed using Stata 14 MP/SE (Stata Corp., College Station, Texas, USA).
RESULTS
Characteristics of Participants
Between December 1, 2015 and October 30, 2017, a total of 2,020 surveys were completed by patients across four academic hospitals in Japan. Of those, 1,960 patients (97.0%) completed the survey in its entirety. Approximately half of the respondents were 65 years of age or older (49%), of female gender (52%), and reported receiving care in the outpatient setting (53%). Regarding use of healthcare, 91% had seen more than one physician in the year preceding the time of survey completion (Table 1).
Ratings of Physician Attire
Compared with all forms of attire depicted in the survey’s first standalone photograph, respondents rated “casual attire with white coat” the highest (Figure 2). The mean composite score for “casual attire with white coat” was 7.1 (standard deviation [SD] = 1.8), and this attire was set as the referent group. Cronbach’s alpha, for the five items included in the composite score, was 0.95. However, “formal attire with white coat” was rated almost as highly as “casual attire with white coat” with an overall mean composite score of 7.0 (SD = 1.6).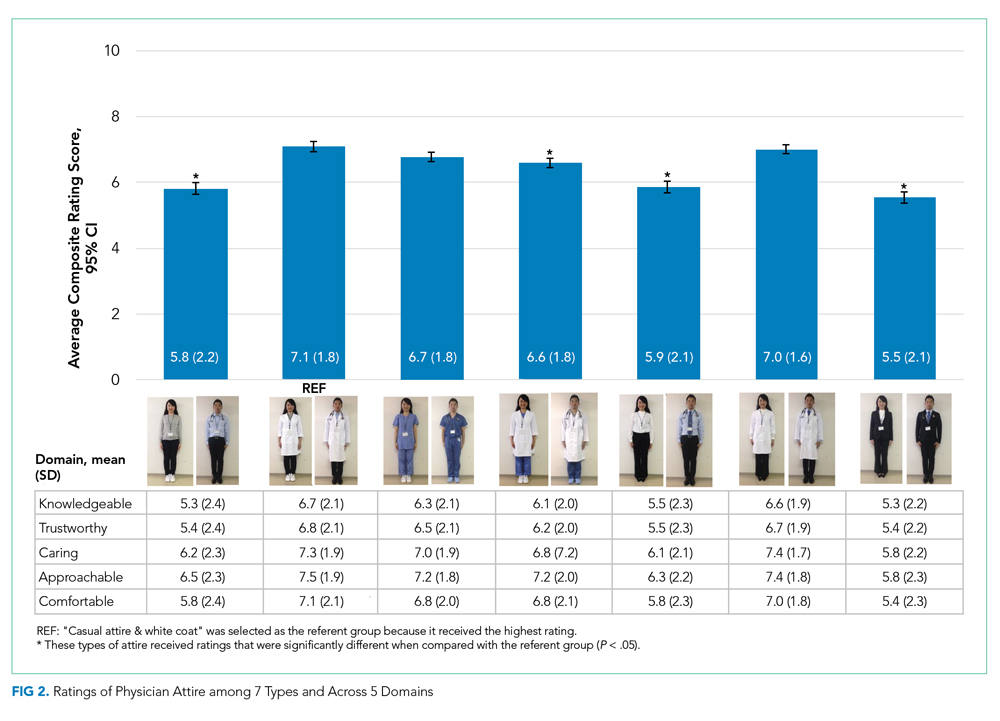
Variation in Preference for Physician Attire by Clinical Setting
Preferences for physician attire varied by clinical care setting. Most respondents preferred “casual attire with white coat” or “formal attire with white coat” in both primary care and hospital settings, with a slight preference for “casual attire with white coat.” In contrast, respondents preferred “scrubs without white coat” in the ED and surgical settings. When asked about their overall preference, respondents reported they felt their physician should wear “formal attire with white coat” (35%) or “casual attire with white coat” (30%; Table 2). When comparing the group of photographs of physicians with white coats to the group without white coats (Figure 1), respondents preferred physicians wearing white coats overall and specifically when providing care in primary care and hospital settings. However, they preferred physicians without white coats when providing care in the ED (P < .001). With respect to surgeons, there was no statistically significant difference between preference for white coats and no white coats. These results were similar for photographs of both male and female physicians.
When asked whether physician dress was important to them and if physician attire influenced their satisfaction with the care received, 61% of participants agreed that physician dress was important, and 47% agreed that physician attire influenced satisfaction (Appendix Table 1). With respect to appropriateness of physicians dressing casually over the weekend in clinical settings, 52% responded that casual wear was inappropriate, while 31% had a neutral opinion.
Participants were asked whether physicians should wear a white coat in different clinical settings. Nearly two-thirds indicated a preference for white coats in the office and hospital (65% and 64%, respectively). Responses regarding whether emergency physicians should wear white coats were nearly equally divided (Agree, 37%; Disagree, 32%; Neither Agree nor Disagree, 31%). However, “scrubs without white coat” was most preferred (56%) when patients were given photographs of various attire and asked, “Which physician would you prefer to see when visiting the ER?” Responses to the question “Physicians should always wear a white coat when seeing patients in any setting” varied equally (Agree, 32%; Disagree, 34%; Neither Agree nor Disagree, 34%).
Variation in Preference for Physician Attire by Respondent Demographics
When comparing respondents by age, those 65 years or older preferred “formal attire with white coat” more so than respondents younger than 65 years (Appendix Table 2). This finding was identified in both primary care (36% vs 31%, P < .001) and hospital settings (37% vs 30%, P < .001). Additionally, physician attire had a greater impact on older respondents’ satisfaction and experience (Appendix Table 3). For example, 67% of respondents 65 years and older agreed that physician attire was important, and 54% agreed that attire influenced satisfaction. Conversely, for respondents younger than 65 years, the proportion agreeing with these statements was lower (56% and 41%, both P < .001). When comparing older and younger respondents, those 65 years and older more often preferred physicians wearing white coats in any setting (39% vs 26%, P < .001) and specifically in their office (68% vs 61%, P = .002), the ED (40% vs 34%, P < .001), and the hospital (69% vs 60%, P < .001).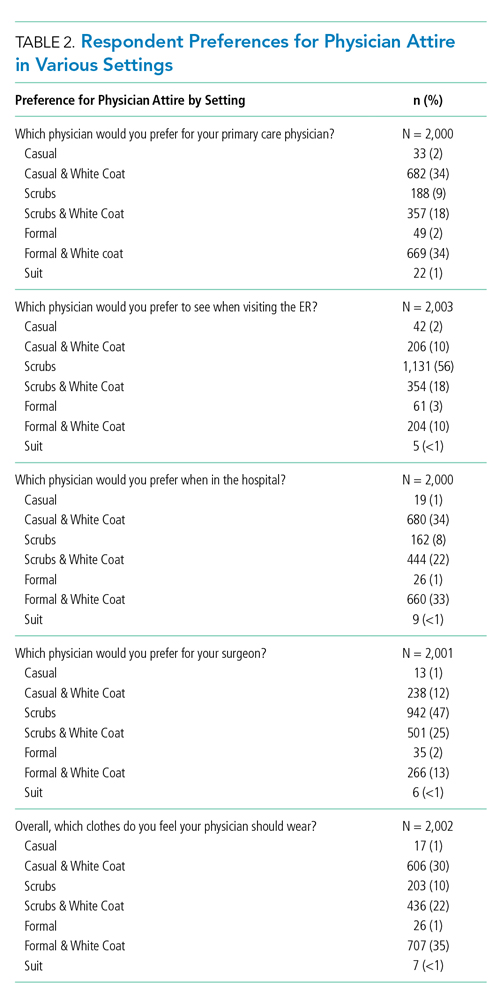
When comparing male and female respondents, male respondents more often stated that physician dress was important to them (men, 64%; women, 58%; P = .002). When comparing responses to the question “Overall, which clothes do you feel a doctor should wear?”, between the eastern and western Japanese hospitals, preferences for physician attire varied.
Variation in Expectations Between Male and Female Physicians
When comparing the ratings of male and female physicians, female physicians were rated higher in how caring (P = .005) and approachable (P < .001) they appeared. However, there were no significant differences in the ratings of the three remaining domains (ie, knowledgeable, trustworthy, and comfortable) or the composite score.
DISCUSSION
Since we employed the same methodology as previous studies conducted in the US10 and Switzerland,18 a notable strength of our approach is that comparisons among these countries can be drawn. For example, physician attire appears to hold greater importance in Japan than in the US and Switzerland. Among Japanese participants, 61% agreed that physician dress is important (US, 53%; Switzerland, 36%), and 47% agreed that physician dress influenced how satisfied they were with their care (US, 36%; Switzerland, 23%).10 This result supports the notion that nonverbal and implicit communications (such as physician dress) may carry more importance among Japanese people.11-13
Regarding preference ratings for type of dress among respondents in Japan, “casual attire with white coat” received the highest mean composite score rating, with “formal attire with white coat” rated second overall. In contrast, US respondents rated “formal attire with white coat” highest and “scrubs with white coat” second.10 Our result runs counter to our expectation in that we expected Japanese respondents to prefer formal attire, since Japan is one of the most formal cultures in the world. One potential explanation for this difference is that the casual style chosen for this study was close to the smart casual style (slightly casual). Most hospitals and clinics in Japan do not allow physicians to wear jeans or polo shirts, which were chosen as the casual attire in the previous US study.
When examining various care settings and physician types, both Japanese and US respondents were more likely to prefer physicians wearing a white coat in the office or hospital.10 However, Japanese participants preferred both “casual attire with white coat” and “formal attire with white coat” equally in primary care or hospital settings. A smaller proportion of US respondents preferred “casual attire with white coat” in primary care (11%) and hospital settings (9%), but more preferred “formal attire with white coat” for primary care (44%) and hospital physicians (39%). In the ED setting, 32% of participants in Japan and 18% in the US disagreed with the idea that physicians should wear a white coat. Among Japanese participants, “scrubs without white coat” was rated highest for emergency physicians (56%) and surgeons (47%), while US preferences were 40% and 42%, respectively.10 One potential explanation is that scrubs-based attire became popular among Japanese ED and surgical contexts as a result of cultural influence and spread from western countries.19, 20
With respect to perceptions regarding physician attire on weekends, 52% of participants considered it inappropriate for a physician to dress casually over the weekend, compared with only 30% in Switzerland and 21% in the US.11,12 Given Japan’s level of formality and the fact that most Japanese physicians continue to work over the weekend,21-23 Japanese patients tend to expect their physicians to dress in more formal attire during these times.
Previous studies in Japan have demonstrated that older patients gave low ratings to scrubs and high ratings to white coat with any attire,15,17 and this was also the case in our study. Perhaps elderly patients reflect conservative values in their preferences of physician dress. Their perceptions may be less influenced by scenes portraying physicians in popular media when compared with the perceptions of younger patients. Though a 2015 systematic review and studies in other countries revealed white coats were preferred regardless of exact dress,9,24-26 they also showed variation in preferences for physician attire. For example, patients in Saudi Arabia preferred white coat and traditional ethnic dress,25 whereas mothers of pediatric patients in Saudi Arabia preferred scrubs for their pediatricians.27 Therefore, it is recommended for internationally mobile physicians to choose their dress depending on a variety of factors including country, context, and patient age group.
Our study has limitations. First, because some physicians presented the surveys to the patients, participants may have responded differently. Second, participants may have identified photographs of the male physician model as their personal healthcare provider (one author, K.K.). To avoid this possible bias, we randomly distributed 14 different versions of physician photographs in the questionnaire. Third, although physician photographs were strictly controlled, the “formal attire and white coat” and “casual attire and white coat” photographs appeared similar, especially given that the white coats were buttoned. Also, the female physician depicted in the photographs did not have the scrub shirt tucked in, while the male physician did. These nuances may have affected participant ratings between groups. Fourth,
In conclusion, patient preferences for physician attire were examined using a multicenter survey with a large sample size and robust survey methodology, thus overcoming weaknesses of previous studies into Japanese attire. Japanese patients perceive that physician attire is important and influences satisfaction with their care, more so than patients in other countries, like the US and Switzerland. Geography, settings of care, and patient age play a role in preferences. As a result, hospitals and health systems may use these findings to inform dress code policy based on patient population and context, recognizing that the appearance of their providers affects the patient-physician relationship. Future research should focus on better understanding the various cultural and societal customs that lead to patient expectations of physician attire.
Acknowledgments
The authors thank Drs. Fumi Takemoto, Masayuki Ueno, Kazuya Sakai, Saori Kinami, and Toshio Naito for their assistance with data collection at their respective sites. Additionally, the authors thank Dr. Yoko Kanamitsu for serving as a model for photographs.
1. Manary MP, Boulding W, Staelin R, Glickman SW. The patient experience and health outcomes. N Engl J Med. 2013;368(3):201-203. https://doi.org/ 10.1056/NEJMp1211775.
2. Boulding W, Glickman SW, Manary MP, Schulman KA, Staelin R. Relationship between patient satisfaction with inpatient care and hospital readmission within 30 days. Am J Manag Care. 2011;17(1):41-48.
3. Barbosa CD, Balp MM, Kulich K, Germain N, Rofail D. A literature review to explore the link between treatment satisfaction and adherence, compliance, and persistence. Patient Prefer Adherence. 2012;6:39-48. https://doi.org/10.2147/PPA.S24752.
4. Jha AK, Orav EJ, Zheng J, Epstein AM. Patients’ perception of hospital care in the United States. N Engl J Med. 2008;359(18):1921-31. https://doi.org/10.1056/NEJMsa080411.
5. O’Malley AS, Forrest CB, Mandelblatt J. Adherence of low-income women to cancer screening recommendations. J Gen Intern Med. 2002;17(2):144-54. https://doi.org/10.1046/j.1525-1497.2002.10431.x.
6. Chung H, Lee H, Chang DS, Kim HS, Park HJ, Chae Y. Doctor’s attire influences perceived empathy in the patient-doctor relationship. Patient Educ Couns. 2012;89(3):387-391. https://doi.org/10.1016/j.pec.2012.02.017.
7. Bianchi MT. Desiderata or dogma: what the evidence reveals about physician attire. J Gen Intern Med. 2008;23(5):641-643. https://doi.org/10.1007/s11606-008-0546-8.
8. Brandt LJ. On the value of an old dress code in the new millennium. Arch Intern Med. 2003;163(11):1277-1281. https://doi.org/10.1001/archinte.163.11.1277.
9. Petrilli CM, Mack M, Petrilli JJ, Hickner A, Saint S, Chopra V. Understanding the role of physician attire on patient perceptions: a systematic review of the literature--targeting attire to improve likelihood of rapport (TAILOR) investigators. BMJ Open. 2015;5(1):e006578. https://doi.org/10.1136/bmjopen-2014-006578.
10. Petrilli CM, Saint S, Jennings JJ, et al. Understanding patient preference for physician attire: a cross-sectional observational study of 10 academic medical centres in the USA. BMJ Open. 2018;8(5):e021239. https://doi.org/10.1136/bmjopen-2017-021239.
11. Rowbury R. The need for more proactive communications. Low trust and changing values mean Japan can no longer fall back on its homogeneity. The Japan Times. 2017, Oct 15;Sect. Opinion. https://www.japantimes.co.jp/opinion/2017/10/15/commentary/japan-commentary/need-proactive-communications/#.Xej7lC3MzUI. Accessed December 5, 2019.
12. Shoji Nishimura ANaST. Communication Style and Cultural Features in High/Low Context Communication Cultures: A Case Study of Finland, Japan and India. Nov 22nd, 2009.
13. Smith RMRSW. The influence of high/low-context culture and power distance on choice of communication media: Students’ media choice to communicate with Professors in Japan and America. Int J Intercultural Relations. 2007;31(4):479-501.
14. Yamada Y, Takahashi O, Ohde S, Deshpande GA, Fukui T. Patients’ preferences for doctors’ attire in Japan. Intern Med. 2010;49(15):1521-1526. https://doi.org/10.2169/internalmedicine.49.3572.
15. Ikusaka M, Kamegai M, Sunaga T, et al. Patients’ attitude toward consultations by a physician without a white coat in Japan. Intern Med. 1999;38(7):533-536. https://doi.org/10.2169/internalmedicine.38.533.
16. Lefor AK, Ohnuma T, Nunomiya S, Yokota S, Makino J, Sanui M. Physician attire in the intensive care unit in Japan influences visitors’ perception of care. J Crit Care. 2018;43:288-293.
17. Kurihara H, Maeno T. Importance of physicians’ attire: factors influencing the impression it makes on patients, a cross-sectional study. Asia Pac Fam Med. 2014;13(1):2. https://doi.org/10.1186/1447-056X-13-2.
18. Zollinger M, Houchens N, Chopra V, et al. Understanding patient preference for physician attire in ambulatory clinics: a cross-sectional observational study. BMJ Open. 2019;9(5):e026009. https://doi.org/10.1136/bmjopen-2018-026009.
19. Chung JE. Medical Dramas and Viewer Perception of Health: Testing Cultivation Effects. Hum Commun Res. 2014;40(3):333-349.
20. Michael Pfau LJM, Kirsten Garrow. The influence of television viewing on public perceptions of physicians. J Broadcast Electron Media. 1995;39(4):441-458.
21. Suzuki S. Exhausting physicians employed in hospitals in Japan assessed by a health questionnaire [in Japanese]. Sangyo Eiseigaku Zasshi. 2017;59(4):107-118. https://doi.org/10.1539/sangyoeisei.
22. Ogawa R, Seo E, Maeno T, Ito M, Sanuki M. The relationship between long working hours and depression among first-year residents in Japan. BMC Med Educ. 2018;18(1):50. https://doi.org/10.1186/s12909-018-1171-9.
23. Saijo Y, Chiba S, Yoshioka E, et al. Effects of work burden, job strain and support on depressive symptoms and burnout among Japanese physicians. Int J Occup Med Environ Health. 2014;27(6):980-992. https://doi.org/10.2478/s13382-014-0324-2.
24. Tiang KW, Razack AH, Ng KL. The ‘auxiliary’ white coat effect in hospitals: perceptions of patients and doctors. Singapore Med J. 2017;58(10):574-575. https://doi.org/10.11622/smedj.2017023.
25. Al Amry KM, Al Farrah M, Ur Rahman S, Abdulmajeed I. Patient perceptions and preferences of physicians’ attire in Saudi primary healthcare setting. J Community Hosp Intern Med Perspect. 2018;8(6):326-330. https://doi.org/10.1080/20009666.2018.1551026.
26. Healy WL. Letter to the editor: editor’s spotlight/take 5: physicians’ attire influences patients’ perceptions in the urban outpatient orthopaedic surgery setting. Clin Orthop Relat Res. 2016;474(11):2545-2546. https://doi.org/10.1007/s11999-016-5049-z.
27. Aldrees T, Alsuhaibani R, Alqaryan S, et al. Physicians’ attire. Parents preferences in a tertiary hospital. Saudi Med J. 2017;38(4):435-439. https://doi.org/10.15537/smj.2017.4.15853.
The patient-physician relationship is critical for ensuring the delivery of high-quality healthcare. Successful patient-physician relationships arise from shared trust, knowledge, mutual respect, and effective verbal and nonverbal communication. The ways in which patients experience healthcare and their satisfaction with physicians affect a myriad of important health outcomes, such as adherence to treatment and outcomes for conditions such as hypertension and diabetes mellitus.1-5 One method for potentially enhancing patient satisfaction is through understanding how patients wish their physicians to dress6-8 and tailoring attire to match these expectations. In addition to our systematic review,9 a recent large-scale, multicenter study in the United States revealed that most patients perceive physician attire as important, but that preferences for specific types of attire are contextual.9,10 For example, elderly patients preferred physicians in formal attire and white coat, while scrubs with white coat or scrubs alone were preferred for emergency department (ED) physicians and surgeons, respectively. Moreover, regional variation regarding attire preference was also observed in the US, with preferences for more formal attire in the South and less formal in the Midwest.
Geographic variation, regarding patient preferences for physician dress, is perhaps even more relevant internationally. In particular, Japan is considered to have a highly contextualized culture that relies on nonverbal and implicit communication. However, medical professionals have no specific dress code and, thus, don many different kinds of attire. In part, this may be because it is not clear whether or how physician attire impacts patient satisfaction and perceived healthcare quality in Japan.11-13 Although previous studies in Japan have suggested that physician attire has a considerable influence on patient satisfaction, these studies either involved a single department in one hospital or a small number of respondents.14-17 Therefore, we performed a multicenter, cross-sectional study to understand patients’ preferences for physician attire in different clinical settings and in different geographic regions in Japan.
METHODS
Study Population
We conducted a cross-sectional, questionnaire-based study from 2015 to 2017, in four geographically diverse hospitals in Japan. Two of these hospitals, Tokyo Joto Hospital and Juntendo University Hospital, are located in eastern Japan whereas the others, Kurashiki Central Hospital and Akashi Medical Center, are in western Japan.
Questionnaires were printed and randomly distributed by research staff to outpatients in waiting rooms and inpatients in medical wards who were 20 years of age or older. We placed no restriction on ward site or time of questionnaire distribution. Research staff, including physicians, nurses, and medical clerks, were instructed to avoid guiding or influencing participants’ responses. Informed consent was obtained by the staff; only those who provided informed consent participated in the study. Respondents could request assistance with form completion from persons accompanying them if they had difficulties, such as physical, visual, or hearing impairments. All responses were collected anonymously. The study was approved by the ethics committees of all four hospitals.
Questionnaire
We used a modified version of the survey instrument from a prior study.10 The first section of the survey showed photographs of either a male or female physician with 7 unique forms of attire, including casual, casual with white coat, scrubs, scrubs with white coat, formal, formal with white coat, and business suit (Figure 1). Given the Japanese context of this study, the language was translated to Japanese and photographs of physicians of Japanese descent were used. Photographs were taken with attention paid to achieving constant facial expressions on the physicians as well as in other visual cues (eg, lighting, background, pose). The physician’s gender and attire in the first photograph seen by each respondent were randomized to prevent bias in ordering, priming, and anchoring; all other sections of the survey were identical.
Respondents were first asked to rate the standalone, randomized physician photograph using a 1-10 scale across five domains (ie, how knowledgeable, trustworthy, caring, and approachable the physician appeared and how comfortable the physician’s appearance made the respondent feel), with a score of 10 representing the highest rating. Respondents were subsequently given 7 photographs of the same physician wearing various forms of attire. Questions were asked regarding preference of attire in varied clinical settings (ie, primary care, ED, hospital, surgery, overall preference). To identify the influence of and respondent preferences for physician dress and white coats, a Likert scale ranging from 1 (strongly disagree) to 5 (strongly agree) was employed. The scale was trichotomized into “disagree” (1, 2), “neither agree nor disagree” (3), and “agree” (4, 5) for analysis. Demographic data, including age, gender, education level, nationality (Japanese or non-Japanese), and number of physicians seen in the past year were collected.
Outcomes and Sample Size Calculation
The primary outcome of attire preference was calculated as the mean composite score of the five individual rating domains (ie, knowledgeable, trustworthy, caring, approachable, and comfortable), with the highest score representing the most preferred form of attire. We also assessed variation in preferences for physician attire by respondent characteristics, such as age and gender.
Sample size estimation was based on previous survey methodology.10 The Likert scale range for identifying influence of and respondent preferences for physician dress and white coats was 1-5 (“strongly disagree” to “strongly agree”). The scale range for measuring preferences for the randomized attire photograph was 1-10. An assumption of normality was made regarding responses on the 1-10 scale. An estimated standard deviation of 2.2 was assumed, based on prior findings.10 Based on these assumptions and the inclusion of at least 816 respondents (assuming a two-sided alpha error of 0.05), we expected to have 90% capacity to detect differences for effect sizes of 0.50 on the 1-10 scale.
Statistical Analyses
Paper-based survey data were entered independently and in duplicate by the study team. Respondents were not required to answer all questions; therefore, the denominator for each question varied. Data were reported as mean and standard deviation (SD) or percentages, where appropriate. Differences in the mean composite rating scores were assessed using one-way ANOVA with the Tukey method for pairwise comparisons. Differences in proportions for categorical data were compared using the Z-test. Chi-squared tests were used for bivariate comparisons between respondent age, gender, and level of education and corresponding respondent preferences. All analyses were performed using Stata 14 MP/SE (Stata Corp., College Station, Texas, USA).
RESULTS
Characteristics of Participants
Between December 1, 2015 and October 30, 2017, a total of 2,020 surveys were completed by patients across four academic hospitals in Japan. Of those, 1,960 patients (97.0%) completed the survey in its entirety. Approximately half of the respondents were 65 years of age or older (49%), of female gender (52%), and reported receiving care in the outpatient setting (53%). Regarding use of healthcare, 91% had seen more than one physician in the year preceding the time of survey completion (Table 1).
Ratings of Physician Attire
Compared with all forms of attire depicted in the survey’s first standalone photograph, respondents rated “casual attire with white coat” the highest (Figure 2). The mean composite score for “casual attire with white coat” was 7.1 (standard deviation [SD] = 1.8), and this attire was set as the referent group. Cronbach’s alpha, for the five items included in the composite score, was 0.95. However, “formal attire with white coat” was rated almost as highly as “casual attire with white coat” with an overall mean composite score of 7.0 (SD = 1.6).
Variation in Preference for Physician Attire by Clinical Setting
Preferences for physician attire varied by clinical care setting. Most respondents preferred “casual attire with white coat” or “formal attire with white coat” in both primary care and hospital settings, with a slight preference for “casual attire with white coat.” In contrast, respondents preferred “scrubs without white coat” in the ED and surgical settings. When asked about their overall preference, respondents reported they felt their physician should wear “formal attire with white coat” (35%) or “casual attire with white coat” (30%; Table 2). When comparing the group of photographs of physicians with white coats to the group without white coats (Figure 1), respondents preferred physicians wearing white coats overall and specifically when providing care in primary care and hospital settings. However, they preferred physicians without white coats when providing care in the ED (P < .001). With respect to surgeons, there was no statistically significant difference between preference for white coats and no white coats. These results were similar for photographs of both male and female physicians.
When asked whether physician dress was important to them and if physician attire influenced their satisfaction with the care received, 61% of participants agreed that physician dress was important, and 47% agreed that physician attire influenced satisfaction (Appendix Table 1). With respect to appropriateness of physicians dressing casually over the weekend in clinical settings, 52% responded that casual wear was inappropriate, while 31% had a neutral opinion.
Participants were asked whether physicians should wear a white coat in different clinical settings. Nearly two-thirds indicated a preference for white coats in the office and hospital (65% and 64%, respectively). Responses regarding whether emergency physicians should wear white coats were nearly equally divided (Agree, 37%; Disagree, 32%; Neither Agree nor Disagree, 31%). However, “scrubs without white coat” was most preferred (56%) when patients were given photographs of various attire and asked, “Which physician would you prefer to see when visiting the ER?” Responses to the question “Physicians should always wear a white coat when seeing patients in any setting” varied equally (Agree, 32%; Disagree, 34%; Neither Agree nor Disagree, 34%).
Variation in Preference for Physician Attire by Respondent Demographics
When comparing respondents by age, those 65 years or older preferred “formal attire with white coat” more so than respondents younger than 65 years (Appendix Table 2). This finding was identified in both primary care (36% vs 31%, P < .001) and hospital settings (37% vs 30%, P < .001). Additionally, physician attire had a greater impact on older respondents’ satisfaction and experience (Appendix Table 3). For example, 67% of respondents 65 years and older agreed that physician attire was important, and 54% agreed that attire influenced satisfaction. Conversely, for respondents younger than 65 years, the proportion agreeing with these statements was lower (56% and 41%, both P < .001). When comparing older and younger respondents, those 65 years and older more often preferred physicians wearing white coats in any setting (39% vs 26%, P < .001) and specifically in their office (68% vs 61%, P = .002), the ED (40% vs 34%, P < .001), and the hospital (69% vs 60%, P < .001).
When comparing male and female respondents, male respondents more often stated that physician dress was important to them (men, 64%; women, 58%; P = .002). When comparing responses to the question “Overall, which clothes do you feel a doctor should wear?”, between the eastern and western Japanese hospitals, preferences for physician attire varied.
Variation in Expectations Between Male and Female Physicians
When comparing the ratings of male and female physicians, female physicians were rated higher in how caring (P = .005) and approachable (P < .001) they appeared. However, there were no significant differences in the ratings of the three remaining domains (ie, knowledgeable, trustworthy, and comfortable) or the composite score.
DISCUSSION
Since we employed the same methodology as previous studies conducted in the US10 and Switzerland,18 a notable strength of our approach is that comparisons among these countries can be drawn. For example, physician attire appears to hold greater importance in Japan than in the US and Switzerland. Among Japanese participants, 61% agreed that physician dress is important (US, 53%; Switzerland, 36%), and 47% agreed that physician dress influenced how satisfied they were with their care (US, 36%; Switzerland, 23%).10 This result supports the notion that nonverbal and implicit communications (such as physician dress) may carry more importance among Japanese people.11-13
Regarding preference ratings for type of dress among respondents in Japan, “casual attire with white coat” received the highest mean composite score rating, with “formal attire with white coat” rated second overall. In contrast, US respondents rated “formal attire with white coat” highest and “scrubs with white coat” second.10 Our result runs counter to our expectation in that we expected Japanese respondents to prefer formal attire, since Japan is one of the most formal cultures in the world. One potential explanation for this difference is that the casual style chosen for this study was close to the smart casual style (slightly casual). Most hospitals and clinics in Japan do not allow physicians to wear jeans or polo shirts, which were chosen as the casual attire in the previous US study.
When examining various care settings and physician types, both Japanese and US respondents were more likely to prefer physicians wearing a white coat in the office or hospital.10 However, Japanese participants preferred both “casual attire with white coat” and “formal attire with white coat” equally in primary care or hospital settings. A smaller proportion of US respondents preferred “casual attire with white coat” in primary care (11%) and hospital settings (9%), but more preferred “formal attire with white coat” for primary care (44%) and hospital physicians (39%). In the ED setting, 32% of participants in Japan and 18% in the US disagreed with the idea that physicians should wear a white coat. Among Japanese participants, “scrubs without white coat” was rated highest for emergency physicians (56%) and surgeons (47%), while US preferences were 40% and 42%, respectively.10 One potential explanation is that scrubs-based attire became popular among Japanese ED and surgical contexts as a result of cultural influence and spread from western countries.19, 20
With respect to perceptions regarding physician attire on weekends, 52% of participants considered it inappropriate for a physician to dress casually over the weekend, compared with only 30% in Switzerland and 21% in the US.11,12 Given Japan’s level of formality and the fact that most Japanese physicians continue to work over the weekend,21-23 Japanese patients tend to expect their physicians to dress in more formal attire during these times.
Previous studies in Japan have demonstrated that older patients gave low ratings to scrubs and high ratings to white coat with any attire,15,17 and this was also the case in our study. Perhaps elderly patients reflect conservative values in their preferences of physician dress. Their perceptions may be less influenced by scenes portraying physicians in popular media when compared with the perceptions of younger patients. Though a 2015 systematic review and studies in other countries revealed white coats were preferred regardless of exact dress,9,24-26 they also showed variation in preferences for physician attire. For example, patients in Saudi Arabia preferred white coat and traditional ethnic dress,25 whereas mothers of pediatric patients in Saudi Arabia preferred scrubs for their pediatricians.27 Therefore, it is recommended for internationally mobile physicians to choose their dress depending on a variety of factors including country, context, and patient age group.
Our study has limitations. First, because some physicians presented the surveys to the patients, participants may have responded differently. Second, participants may have identified photographs of the male physician model as their personal healthcare provider (one author, K.K.). To avoid this possible bias, we randomly distributed 14 different versions of physician photographs in the questionnaire. Third, although physician photographs were strictly controlled, the “formal attire and white coat” and “casual attire and white coat” photographs appeared similar, especially given that the white coats were buttoned. Also, the female physician depicted in the photographs did not have the scrub shirt tucked in, while the male physician did. These nuances may have affected participant ratings between groups. Fourth,
In conclusion, patient preferences for physician attire were examined using a multicenter survey with a large sample size and robust survey methodology, thus overcoming weaknesses of previous studies into Japanese attire. Japanese patients perceive that physician attire is important and influences satisfaction with their care, more so than patients in other countries, like the US and Switzerland. Geography, settings of care, and patient age play a role in preferences. As a result, hospitals and health systems may use these findings to inform dress code policy based on patient population and context, recognizing that the appearance of their providers affects the patient-physician relationship. Future research should focus on better understanding the various cultural and societal customs that lead to patient expectations of physician attire.
Acknowledgments
The authors thank Drs. Fumi Takemoto, Masayuki Ueno, Kazuya Sakai, Saori Kinami, and Toshio Naito for their assistance with data collection at their respective sites. Additionally, the authors thank Dr. Yoko Kanamitsu for serving as a model for photographs.
1. Manary MP, Boulding W, Staelin R, Glickman SW. The patient experience and health outcomes. N Engl J Med. 2013;368(3):201-203. https://doi.org/ 10.1056/NEJMp1211775.
2. Boulding W, Glickman SW, Manary MP, Schulman KA, Staelin R. Relationship between patient satisfaction with inpatient care and hospital readmission within 30 days. Am J Manag Care. 2011;17(1):41-48.
3. Barbosa CD, Balp MM, Kulich K, Germain N, Rofail D. A literature review to explore the link between treatment satisfaction and adherence, compliance, and persistence. Patient Prefer Adherence. 2012;6:39-48. https://doi.org/10.2147/PPA.S24752.
4. Jha AK, Orav EJ, Zheng J, Epstein AM. Patients’ perception of hospital care in the United States. N Engl J Med. 2008;359(18):1921-31. https://doi.org/10.1056/NEJMsa080411.
5. O’Malley AS, Forrest CB, Mandelblatt J. Adherence of low-income women to cancer screening recommendations. J Gen Intern Med. 2002;17(2):144-54. https://doi.org/10.1046/j.1525-1497.2002.10431.x.
6. Chung H, Lee H, Chang DS, Kim HS, Park HJ, Chae Y. Doctor’s attire influences perceived empathy in the patient-doctor relationship. Patient Educ Couns. 2012;89(3):387-391. https://doi.org/10.1016/j.pec.2012.02.017.
7. Bianchi MT. Desiderata or dogma: what the evidence reveals about physician attire. J Gen Intern Med. 2008;23(5):641-643. https://doi.org/10.1007/s11606-008-0546-8.
8. Brandt LJ. On the value of an old dress code in the new millennium. Arch Intern Med. 2003;163(11):1277-1281. https://doi.org/10.1001/archinte.163.11.1277.
9. Petrilli CM, Mack M, Petrilli JJ, Hickner A, Saint S, Chopra V. Understanding the role of physician attire on patient perceptions: a systematic review of the literature--targeting attire to improve likelihood of rapport (TAILOR) investigators. BMJ Open. 2015;5(1):e006578. https://doi.org/10.1136/bmjopen-2014-006578.
10. Petrilli CM, Saint S, Jennings JJ, et al. Understanding patient preference for physician attire: a cross-sectional observational study of 10 academic medical centres in the USA. BMJ Open. 2018;8(5):e021239. https://doi.org/10.1136/bmjopen-2017-021239.
11. Rowbury R. The need for more proactive communications. Low trust and changing values mean Japan can no longer fall back on its homogeneity. The Japan Times. 2017, Oct 15;Sect. Opinion. https://www.japantimes.co.jp/opinion/2017/10/15/commentary/japan-commentary/need-proactive-communications/#.Xej7lC3MzUI. Accessed December 5, 2019.
12. Shoji Nishimura ANaST. Communication Style and Cultural Features in High/Low Context Communication Cultures: A Case Study of Finland, Japan and India. Nov 22nd, 2009.
13. Smith RMRSW. The influence of high/low-context culture and power distance on choice of communication media: Students’ media choice to communicate with Professors in Japan and America. Int J Intercultural Relations. 2007;31(4):479-501.
14. Yamada Y, Takahashi O, Ohde S, Deshpande GA, Fukui T. Patients’ preferences for doctors’ attire in Japan. Intern Med. 2010;49(15):1521-1526. https://doi.org/10.2169/internalmedicine.49.3572.
15. Ikusaka M, Kamegai M, Sunaga T, et al. Patients’ attitude toward consultations by a physician without a white coat in Japan. Intern Med. 1999;38(7):533-536. https://doi.org/10.2169/internalmedicine.38.533.
16. Lefor AK, Ohnuma T, Nunomiya S, Yokota S, Makino J, Sanui M. Physician attire in the intensive care unit in Japan influences visitors’ perception of care. J Crit Care. 2018;43:288-293.
17. Kurihara H, Maeno T. Importance of physicians’ attire: factors influencing the impression it makes on patients, a cross-sectional study. Asia Pac Fam Med. 2014;13(1):2. https://doi.org/10.1186/1447-056X-13-2.
18. Zollinger M, Houchens N, Chopra V, et al. Understanding patient preference for physician attire in ambulatory clinics: a cross-sectional observational study. BMJ Open. 2019;9(5):e026009. https://doi.org/10.1136/bmjopen-2018-026009.
19. Chung JE. Medical Dramas and Viewer Perception of Health: Testing Cultivation Effects. Hum Commun Res. 2014;40(3):333-349.
20. Michael Pfau LJM, Kirsten Garrow. The influence of television viewing on public perceptions of physicians. J Broadcast Electron Media. 1995;39(4):441-458.
21. Suzuki S. Exhausting physicians employed in hospitals in Japan assessed by a health questionnaire [in Japanese]. Sangyo Eiseigaku Zasshi. 2017;59(4):107-118. https://doi.org/10.1539/sangyoeisei.
22. Ogawa R, Seo E, Maeno T, Ito M, Sanuki M. The relationship between long working hours and depression among first-year residents in Japan. BMC Med Educ. 2018;18(1):50. https://doi.org/10.1186/s12909-018-1171-9.
23. Saijo Y, Chiba S, Yoshioka E, et al. Effects of work burden, job strain and support on depressive symptoms and burnout among Japanese physicians. Int J Occup Med Environ Health. 2014;27(6):980-992. https://doi.org/10.2478/s13382-014-0324-2.
24. Tiang KW, Razack AH, Ng KL. The ‘auxiliary’ white coat effect in hospitals: perceptions of patients and doctors. Singapore Med J. 2017;58(10):574-575. https://doi.org/10.11622/smedj.2017023.
25. Al Amry KM, Al Farrah M, Ur Rahman S, Abdulmajeed I. Patient perceptions and preferences of physicians’ attire in Saudi primary healthcare setting. J Community Hosp Intern Med Perspect. 2018;8(6):326-330. https://doi.org/10.1080/20009666.2018.1551026.
26. Healy WL. Letter to the editor: editor’s spotlight/take 5: physicians’ attire influences patients’ perceptions in the urban outpatient orthopaedic surgery setting. Clin Orthop Relat Res. 2016;474(11):2545-2546. https://doi.org/10.1007/s11999-016-5049-z.
27. Aldrees T, Alsuhaibani R, Alqaryan S, et al. Physicians’ attire. Parents preferences in a tertiary hospital. Saudi Med J. 2017;38(4):435-439. https://doi.org/10.15537/smj.2017.4.15853.
© 2020 Society of Hospital Medicine
Portable Ultrasound Device Usage and Learning Outcomes Among Internal Medicine Trainees: A Parallel-Group Randomized Trial
Point-of-care ultrasonography (POCUS) can transform healthcare delivery through its diagnostic and therapeutic expediency.1 POCUS has been shown to bolster diagnostic accuracy, reduce procedural complications, decrease inpatient length of stay, and improve patient satisfaction by encouraging the physician to be present at the bedside.2-8
POCUS has become widespread across a variety of clinical settings as more investigations have demonstrated its positive impact on patient care.1,9-12 This includes the use of POCUS by trainees, who are now utilizing this technology as part of their assessments of patients.13,14 However, trainees may be performing these examinations with minimal oversight, and outside of emergency medicine, there are few guidelines on how to effectively teach POCUS or measure competency.13,14 While POCUS is rapidly becoming a part of inpatient care, teaching physicians may have little experience in ultrasound or the expertise to adequately supervise trainees.14 There is a growing need to study what trainees can learn and how this knowledge is acquired.
Previous investigations have demonstrated that inexperienced users can be taught to use POCUS to identify a variety of pathological states.2,3,15-23 Most of these curricula used a single lecture series as their pedagogical vehicle, and they variably included junior medical trainees. More importantly, the investigations did not explore whether personal access to handheld ultrasound devices (HUDs) improved learning. In theory, improved access to POCUS devices increases opportunities for authentic and deliberate practice, which may be needed to improve trainee skill with POCUS beyond the classroom setting.14
This study aimed to address several ongoing gaps in knowledge related to learning POCUS. First, we hypothesized that personal HUD access would improve trainees’ POCUS-related knowledge and interpretive ability as a result of increased practice opportunities. Second, we hypothesized that trainees who receive personal access to HUDs would be more likely to perform POCUS examinations and feel more confident in their interpretations. Finally, we hypothesized that repeated exposure to POCUS-related lectures would result in greater improvements in knowledge as compared with a single lecture series.
METHODS
Participants and Setting
The 2017 intern class (n = 47) at an academic internal medicine residency program participated in the study. Control data were obtained from the 2016 intern class (historical control; n = 50) and the 2018 intern class (contemporaneous control; n = 52). The Stanford University Institutional Review Board approved this study.
Study Design
The 2017 intern class (n = 47) received POCUS didactics from June 2017 to June 2018. To evaluate if increased access to HUDs improved learning outcomes, the 2017 interns were randomized 1:1 to receive their own personal HUD that could be used for patient care and/or self-directed learning (n = 24) vs no-HUD (n = 23; Figure). Learning outcomes were assessed over the course of 1 year (see “Outcomes” below) and were compared with the 2016 and 2018 controls. The 2016 intern class had completed a year of training but had not received formalized POCUS didactics (historical control), whereas the 2018 intern class was assessed at the beginning of their year (contemporaneous control; Figure). In order to make comparisons based on intern experience, baseline data for the 2017 intern class were compared with the 2018 intern class, whereas end-of-study data for 2017 interns were compared with 2016 interns.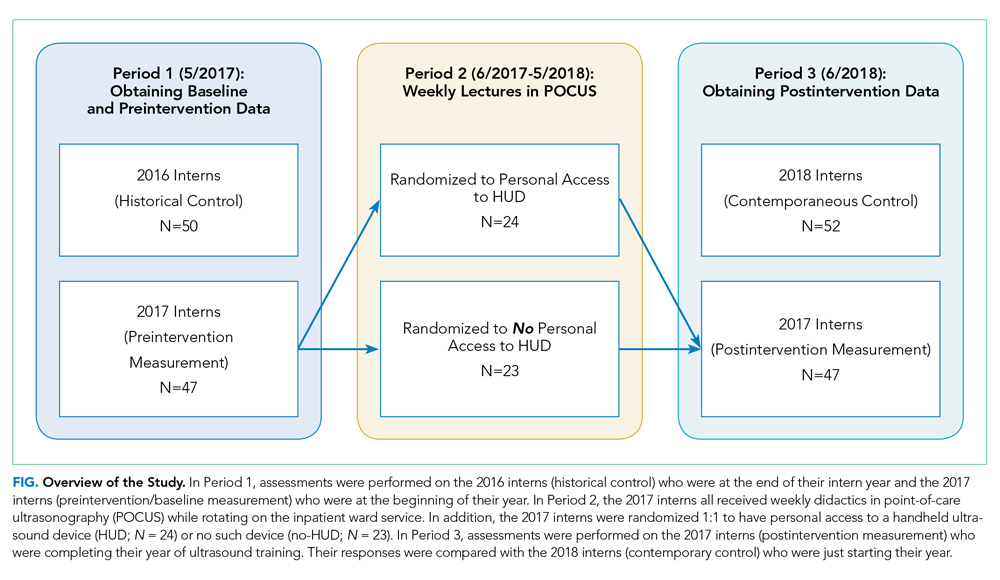
Outcomes
The primary outcome was the difference in assessment scores at the end of the study period between interns randomized to receive a HUD and those who were not. Secondary outcomes included differences in HUD usage rates, lecture attendance, and assessment scores. To assess whether repeated lecture exposure resulted in greater amounts of learning, this study evaluated for assessment score improvements after each lecture block. Finally, trainee attitudes toward POCUS and their confidence in their interpretative ability were measured at the beginning and end of the study period.
Curriculum Implementation
The lectures were administered as once-weekly didactics of 1-hour duration to interns rotating on the inpatient wards rotation. This rotation is 4 weeks long, and each intern will experience the rotation two to four times per year. Each lecture contained two parts: (1) 20-30 minutes of didactics via Microsoft PowerPointTM and (2) 30-40 minutes of supervised practice using HUDs on standardized patients. Four lectures were given each month: (1) introduction to POCUS and ultrasound physics, (2) thoracic/lung ultrasound, (3) echocardiography, and (4) abdominal POCUS. The lectures consisted of contrasting cases of normal/abnormal videos and clinical vignettes. These four lectures were repeated each month as new interns rotated on service. Some interns experienced the same content multiple times, which was intentional in order to assess their rates of learning over time. Lecture contents were based on previously published guidelines and expert consensus for teaching POCUS in internal medicine.13, 24-26 Content from the Accreditation Council for Graduate Medical Education (ACGME) and the American College of Emergency Physicians (ACEP) was also incorporated because these organizations had published relevant guidelines for teaching POCUS.13,26 Further development of the lectures occurred through review of previously described POCUS-relevant curricula.27-32
Handheld Ultrasound Devices
This study used the Philips LumifyTM, a United States Food and Drug Administration–approved device. Interns randomized to HUDs received their own device at the start of the rotation. It was at their discretion to use the device outside of the course. All devices were approved for patient use and were encrypted in compliance with our information security office. For privacy reasons, any saved patient images were not reviewed by the researchers. Interns were encouraged to share their findings with supervising physicians during rounds, but actual oversight was not measured. Interns not randomized to HUDs could access a single community device that was shared among all residents and fellows in the hospital. Interns reported the average number of POCUS examinations performed each week via a survey sent during the last week of the rotation.
Assessment Design and Implementation
Assessments evaluating trainee knowledge were administered before, during, and after the study period (Figure). For the 2017 cohort, assessments were also administered at the start and end of the ward month to track knowledge acquisition. Assessment contents were selected from POCUS guidelines for internal medicine and adaptation of the ACGME and ACEP guidelines.13,24,26 Additional content was obtained from major society POCUS tutorials and deidentified images collected by the study authors.13,24,33 In keeping with previously described methodology, the images were shown for approximately 12 seconds, followed by five additional seconds to allow the learner to answer the question.32 Final assessment contents were determined by the authors using the Delphi method.34 A sample assessment can be found in the Appendix Material.
Surveys
Surveys were administered alongside the assessments to the 2016-2018 intern classes. These surveys assessed trainee attitudes toward POCUS and were based on previously validated assessments.27,28,30 Attitudes were measured using 5-point Likert scales.
Statistical Analysis
For the primary outcome, we performed generalized binomial mixed-effect regressions using the survey periods, randomization group, and the interaction of the two as independent variables after adjusting for attendance and controlling of intra-intern correlations. The bivariate unadjusted analysis was performed to display the distribution of overall correctness on the assessments. Wilcoxon signed rank test was used to determine score significance for dependent score variables (R-Statistical Programming Language, Vienna, Austria).
RESULTS
Baseline Characteristics
There were 149 interns who participated in this study (Figure). Assessment/survey completion rates were as follows: 2016 control: 68.0%; 2017 preintervention: 97.9%; 2017 postintervention: 89.4%; and 2018 control: 100%. The 2017 interns reported similar amounts of prior POCUS exposure in medical school (Table 1).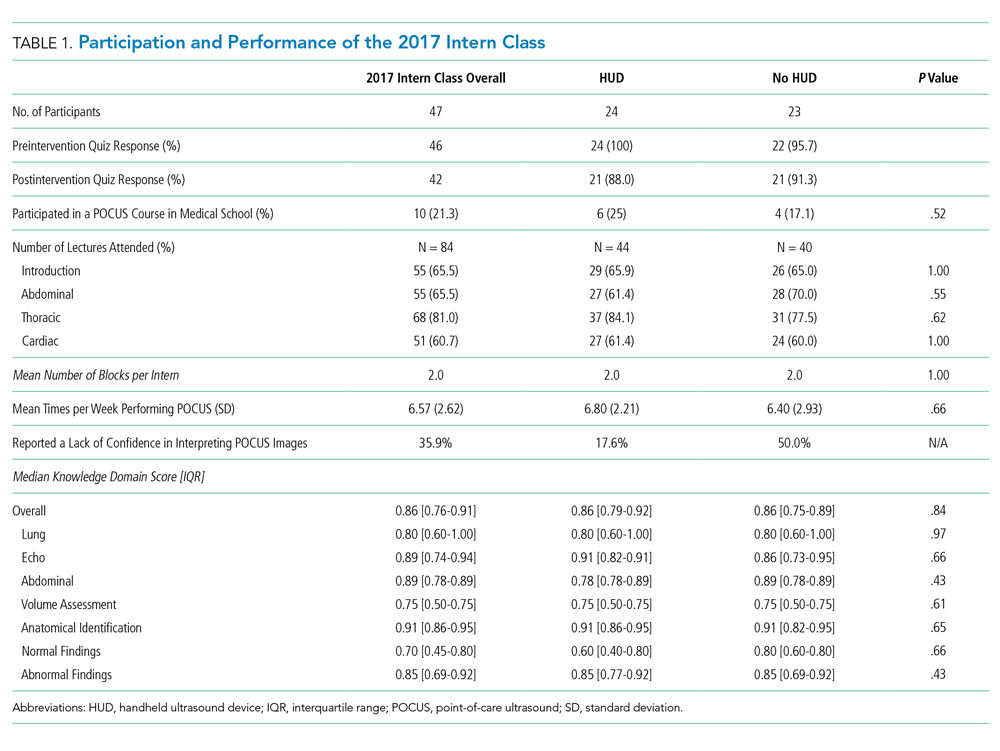
Primary Outcome: Assessment Scores (HUD vs no HUD)
There were no significant differences in assessment scores at the end of the study between interns randomized to personal HUD access vs those to no-HUD access (Table 1). HUD interns reported performing POCUS assessments on patients a mean 6.8 (standard deviation [SD] 2.2) times per week vs 6.4 (SD 2.9) times per week in the no-HUD arm (P = .66). The mean lecture attendance was 75.0% and did not significantly differ between the HUD arms (Table 1).
Secondary Outcomes
Impact of Repeating Lectures
The 2017 interns demonstrated significant increases in preblock vs postblock assessment scores after first-time exposure to the lectures (median preblock score 0.61 [interquartile range (IQR), 0.53-0.70] vs postblock score 0.81 [IQR, 0.72-0.86]; P < .001; Table 2). However, intern performance on the preblock vs postblock assessments after second-time exposure to the curriculum failed to improve (median second preblock score 0.78 [IQR, 0.69-0.83] vs postblock score 0.81 [IQR, 0.64-0.89]; P = .94). Intern performance on individual domains of knowledge for each block is listed in Appendix Table 1.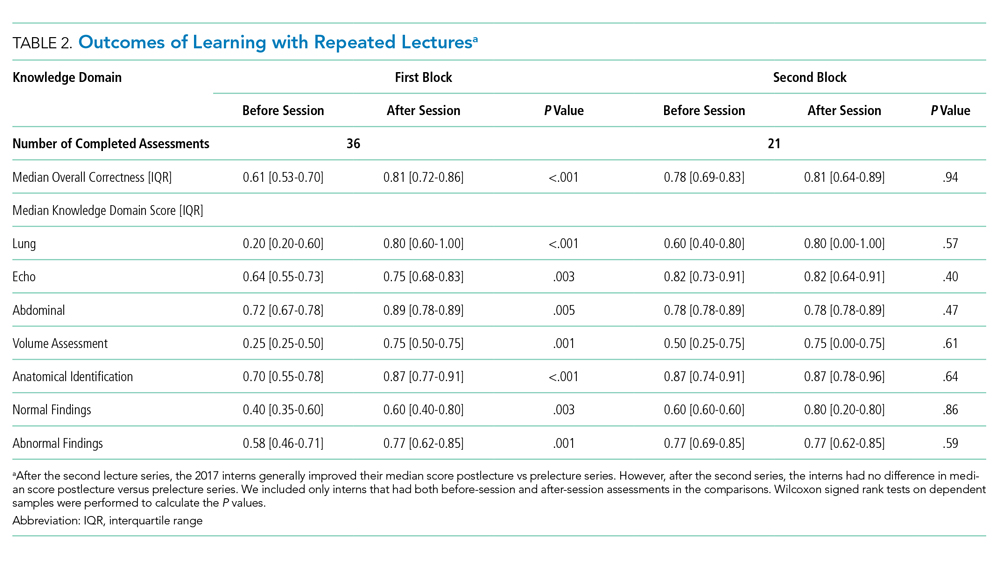
Intervention Performance vs Controls
The 2016 historical control had significantly higher scores compared with the 2017 preintervention group (P < .001; Appendix Table 2). The year-long lecture series resulted in significant increases in median scores for the 2017 group (median preintervention score 0.55 [0.41-0.61] vs median postintervention score 0.84 [0.71-0.90]; P = .006; Appendix Table 1). At the end of the study, the 2017 postintervention scores were significantly higher across multiple knowledge domains compared with the 2016 historical control (Appendix Table 2).
Survey Results
Notably, the 2017 intern class at the end of the intervention did not have significantly different assessment scores for several disease-specific domains, compared with the 2016 control (Appendix Table 2). Nonetheless, the 2017 intern class reported higher levels of confidence in these same domains despite similar scores (Supplementary Figure). The HUD group seldomly cited a lack of confidence in their abilities as a barrier to performing POCUS examinations (17.6%), compared with the no-HUD group (50.0%), despite nearly identical assessment scores between the two groups (Table 1).
DISCUSSION
Previous guidelines have recommended increased HUD access for learners,13,24,35,36 but there have been few investigations that have evaluated the impact of such access on learning POCUS. One previous investigation found that hospitalists who carried HUDs were more likely to identify heart failure on bedside examination.37 In contrast, our study found no improvement in interpretative ability when randomizing interns to carry HUDs for patient care. Notably, interns did not perform more POCUS examinations when given HUDs. We offer several explanations for this finding. First, time-motion studies have demonstrated that internal medicine interns spend less than 15% of their time toward direct patient care.38 It is possible that the demands of being an intern impeded their ability to perform more POCUS examinations on their patients, regardless of HUD access. Alternatively, the interns randomized to no personal access may have used the community device more frequently as a result of the lecture series. Given the cost of HUDs, further studies are needed to assess the degree to which HUD access will improve trainee interpretive ability, especially as more training programs consider the creation of ultrasound curricula.10,11,24,39,40
This study was unique because it followed interns over a year-long course that repeated the same material to assess rates of learning with repeated exposure. Learners improved their scores after the first, but not second, block. Furthermore, the median scores were nearly identical between the first postblock assessment and second preblock assessment (0.81 vs 0.78), suggesting that knowledge was retained between blocks. Together, these findings suggest there may be limitations of traditional lectures that use standardized patient models for practice. Supplementary pedagogies, such as in-the-moment feedback with actual patients, may be needed to promote mastery.14,35
Despite no formal curriculum, the 2016 intern class (historical control) had learned POCUS to some degree based on their higher assessment scores compared with the 2017 intern class during the preintervention period. Such learning may be informal, and yet, trainees may feel confident in making clinical decisions without formalized training, accreditation, or oversight. As suggested by this study, adding regular didactics or giving trainees HUDs may not immediately solve this issue. For assessment items in which the 2017 interns did not significantly differ from the controls, they nonetheless reported higher confidence in their abilities. Similarly, interns randomized to HUDs less frequently cited a lack of confidence in their abilities, despite similar scores to the no-HUD group. Such confidence may be incongruent with their actual knowledge or ability to safely use POCUS. This phenomenon of misplaced confidence is known as the Dunning–Kruger effect, and it may be common with ultrasound learning.41 While confidence can be part of a holistic definition of competency,14 these results raise the concern that trainees may have difficulty assessing their own competency level with POCUS.35
There are several limitations to this study. It was performed at a single institution with limited sample size. It examined only intern physicians because of funding constraints, which limits the generalizability of these findings among medical trainees. Technical ability assessments (including obtaining and interpreting images) were not included. We were unable to track the timing or location of the devices’ usage, and the interns’ self-reported usage rates may be subject to recall bias. To our knowledge, there were no significant lapses in device availability/functionality. Intern physicians in the HUD arm did not receive formal feedback on personally acquired patient images, which may have limited the intervention’s impact.
In conclusion, internal medicine interns who received personal HUDs were not better at recognizing normal/abnormal findings on image assessments, and they did not report performing more POCUS examinations. Since the minority of a trainee’s time is spent toward direct patient care, offering trainees HUDs without substantial guidance may not be enough to promote mastery. Notably, trainees who received HUDs felt more confident in their abilities, despite no objective increase in their actual skill. Finally, interns who received POCUS-related lectures experienced significant benefit upon first exposure to the material, while repeated exposures did not improve performance. Future investigations should stringently track trainee POCUS usage rates with HUDs and assess whether image acquisition ability improves as a result of personal access.
1. Moore CL, Copel JA. Point-of-care ultrasonography. N Engl J Med. 2011;364(8):749-757. https://doi.org/10.1056/NEJMra0909487.
2. Akkaya A, Yesilaras M, Aksay E, Sever M, Atilla OD. The interrater reliability of ultrasound imaging of the inferior vena cava performed by emergency residents. Am J Emerg Med. 2013;31(10):1509-1511. https://doi.org/10.1016/j.ajem.2013.07.006.
3. Razi R, Estrada JR, Doll J, Spencer KT. Bedside hand-carried ultrasound by internal medicine residents versus traditional clinical assessment for the identification of systolic dysfunction in patients admitted with decompensated heart failure. J Am Soc Echocardiogr. 2011;24(12):1319-1324. https://doi.org/10.1016/j.echo.2011.07.013.
4. Dodge KL, Lynch CA, Moore CL, Biroscak BJ, Evans LV. Use of ultrasound guidance improves central venous catheter insertion success rates among junior residents. J Ultrasound Med. 2012;31(10):1519-1526. https://doi.org/10.7863/jum.2012.31.10.1519.
5. Cavanna L, Mordenti P, Bertè R, et al. Ultrasound guidance reduces pneumothorax rate and improves safety of thoracentesis in malignant pleural effusion: Report on 445 consecutive patients with advanced cancer. World J Surg Oncol. 2014;12:139. https://doi.org/10.1186/1477-7819-12-139.
6. Testa A, Francesconi A, Giannuzzi R, Berardi S, Sbraccia P. Economic analysis of bedside ultrasonography (US) implementation in an Internal Medicine department. Intern Emerg Med. 2015;10(8):1015-1024. https://doi.org/10.1007/s11739-015-1320-7.
7. Howard ZD, Noble VE, Marill KA, et al. Bedside ultrasound maximizes patient satisfaction. J Emerg Med. 2014;46(1):46-53. https://doi.org/10.1016/j.jemermed.2013.05.044.
8. Park YH, Jung RB, Lee YG, et al. Does the use of bedside ultrasonography reduce emergency department length of stay for patients with renal colic? A pilot study. Clin Exp Emerg Med. 2016;3(4):197-203. https://doi.org/10.15441/ceem.15.109.
9. Glomb N, D’Amico B, Rus M, Chen C. Point-of-care ultrasound in resource-limited settings. Clin Pediatr Emerg Med. 2015;16(4):256-261. https://doi.org/10.1016/j.cpem.2015.10.001.
10. Bahner DP, Goldman E, Way D, Royall NA, Liu YT. The state of ultrasound education in U.S. medical schools: results of a national survey. Acad Med. 2014;89(12):1681-1686. https://doi.org/10.1097/ACM.0000000000000414.
11. Hall JWW, Holman H, Bornemann P, et al. Point of care ultrasound in family medicine residency programs: A CERA study. Fam Med. 2015;47(9):706-711.
12. Schnobrich DJ, Gladding S, Olson APJ, Duran-Nelson A. Point-of-care ultrasound in internal medicine: A national survey of educational leadership. J Grad Med Educ. 2013;5(3):498-502. https://doi.org/10.4300/JGME-D-12-00215.1.
13. Stolz LA, Stolz U, Fields JM, et al. Emergency medicine resident assessment of the emergency ultrasound milestones and current training recommendations. Acad Emerg Med. 2017;24(3):353-361. https://doi.org/10.1111/acem.13113.
14. Kumar, A., Jensen, T., Kugler, J. Evaluation of trainee competency with point-of-care ultrasonography (POCUS): A conceptual framework and review of existing assessments. J Gen Intern Med. 2019;34(6):1025-1031. https://doi.org/10.1007/s11606-019-04945-4.
15. Levitov A, Frankel HL, Blaivas M, et al. Guidelines for the appropriate use of bedside general and cardiac ultrasonography in the evaluation of critically ill patients—part ii: Cardiac ultrasonography. Crit Care Med. 2016;44(6):1206-1227. https://doi.org/10.1097/CCM.0000000000001847.
16. Kobal SL, Trento L, Baharami S, et al. Comparison of effectiveness of hand-carried ultrasound to bedside cardiovascular physical examination. Am J Cardiol. 2005;96(7):1002-1006. https://doi.org/10.1016/j.amjcard.2005.05.060.
17. Ceriani E, Cogliati C. Update on bedside ultrasound diagnosis of pericardial effusion. Intern Emerg Med. 2016;11(3):477-480. https://doi.org/10.1007/s11739-015-1372-8.
18. Labovitz AJ, Noble VE, Bierig M, et al. Focused cardiac ultrasound in the emergent setting: A consensus statement of the American Society of Echocardiography and American College of Emergency Physicians. J Am Soc Echocardiogr. 2010;23(12):1225-1230. https://doi.org/10.1016/j.echo.2010.10.005.
19. Keil-Ríos D, Terrazas-Solís H, González-Garay A, Sánchez-Ávila JF, García-Juárez I. Pocket ultrasound device as a complement to physical examination for ascites evaluation and guided paracentesis. Intern Emerg Med. 2016;11(3):461-466. https://doi.org/10.1007/s11739-016-1406-x.
20. Riddell J, Case A, Wopat R, et al. Sensitivity of emergency bedside ultrasound to detect hydronephrosis in patients with computed tomography–proven stones. West J Emerg Med. 2014;15(1):96-100. https://doi.org/10.5811/westjem.2013.9.15874.
21. Dalziel PJ, Noble VE. Bedside ultrasound and the assessment of renal colic: A review. Emerg Med J. 2013;30(1):3-8. https://doi.org/10.1136/emermed-2012-201375.
22. Whitson MR, Mayo PH. Ultrasonography in the emergency department. Crit Care. 2016;20(1):227. https://doi.org/10.1186/s13054-016-1399-x.
23. Kumar A, Liu G, Chi J, Kugler J. The role of technology in the bedside encounter. Med Clin North Am. 2018;102(3):443-451. https://doi.org/10.1016/j.mcna.2017.12.006.
24. Ma IWY, Arishenkoff S, Wiseman J, et al. Internal medicine point-of-care ultrasound curriculum: Consensus recommendations from the Canadian Internal Medicine Ultrasound (CIMUS) Group. J Gen Intern Med. 2017;32(9):1052-1057. https://doi.org/10.1007/s11606-017-4071-5.
15. Sabath BF, Singh G. Point-of-care ultrasonography as a training milestone for internal medicine residents: The time is now. J Community Hosp Intern Med Perspect. 2016;6(5):33094. https://doi.org/10.3402/jchimp.v6.33094.
26. American College of Emergency Physicians. Ultrasound guidelines: emergency, point-of-care and clinical ultrasound guidelines in medicine. Ann Emerg Med. 2017;69(5):e27-e54. https://doi.org/10.1016/j.annemergmed.2016.08.457.
27. Ramsingh D, Rinehart J, Kain Z, et al. Impact assessment of perioperative point-of-care ultrasound training on anesthesiology residents. Anesthesiology. 2015;123(3):670-682. https://doi.org/10.1097/ALN.0000000000000776.
28. Keddis MT, Cullen MW, Reed DA, et al. Effectiveness of an ultrasound training module for internal medicine residents. BMC Med Educ. 2011;11:75. https://doi.org/10.1186/1472-6920-11-75.
29. Townsend NT, Kendall J, Barnett C, Robinson T. An effective curriculum for focused assessment diagnostic echocardiography: Establishing the learning curve in surgical residents. J Surg Educ. 2016;73(2):190-196. https://doi.org/10.1016/j.jsurg.2015.10.009.
30. Hoppmann RA, Rao VV, Bell F, et al. The evolution of an integrated ultrasound curriculum (iUSC) for medical students: 9-year experience. Crit Ultrasound J. 2015;7(1):18. https://doi.org/10.1186/s13089-015-0035-3.
31. Skalski JH, Elrashidi M, Reed DA, McDonald FS, Bhagra A. Using standardized patients to teach point-of-care ultrasound–guided physical examination skills to internal medicine residents. J Grad Med Educ. 2015;7(1):95-97. https://doi.org/10.4300/JGME-D-14-00178.1.
32. Chisholm CB, Dodge WR, Balise RR, Williams SR, Gharahbaghian L, Beraud A-S. Focused cardiac ultrasound training: How much is enough? J Emerg Med. 2013;44(4):818-822. https://doi.org/10.1016/j.jemermed.2012.07.092.
33. Schmidt GA, Schraufnagel D. Introduction to ATS seminars: Intensive care ultrasound. Ann Am Thorac Soc. 2013;10(5):538-539. https://doi.org/10.1513/AnnalsATS.201306-203ED.
34. Skaarup SH, Laursen CB, Bjerrum AS, Hilberg O. Objective and structured assessment of lung ultrasound competence. A multispecialty Delphi consensus and construct validity study. Ann Am Thorac Soc. 2017;14(4):555-560. https://doi.org/10.1513/AnnalsATS.201611-894OC.
35. Lucas BP, Tierney DM, Jensen TP, et al. Credentialing of hospitalists in ultrasound-guided bedside procedures: A position statement of the Society of Hospital Medicine. J Hosp Med. 2018;13(2):117-125. https://doi.org/10.12788/jhm.2917.
36. Frankel HL, Kirkpatrick AW, Elbarbary M, et al. Guidelines for the appropriate use of bedside general and cardiac ultrasonography in the evaluation of critically ill patients-part i: General ultrasonography. Crit Care Med. 2015;43(11):2479-2502. https://doi.org/10.1097/CCM.0000000000001216.
37. Martin LD, Howell EE, Ziegelstein RC, et al. Hand-carried ultrasound performed by hospitalists: Does it improve the cardiac physical examination? Am J Med. 2009;122(1):35-41. https://doi.org/10.1016/j.amjmed.2008.07.022.
38. Desai SV, Asch DA, Bellini LM, et al. Education outcomes in a duty-hour flexibility trial in internal medicine. N Engl J Med. 2018;378(16):1494-1508. https://doi.org/10.1056/NEJMoa1800965.
39. Baltarowich OH, Di Salvo DN, Scoutt LM, et al. National ultrasound curriculum for medical students. Ultrasound Q. 2014;30(1):13-19. https://doi.org/10.1097/RUQ.0000000000000066.
40. Beal EW, Sigmond BR, Sage-Silski L, Lahey S, Nguyen V, Bahner DP. Point-of-care ultrasound in general surgery residency training: A proposal for milestones in graduate medical education ultrasound. J Ultrasound Med. 2017;36(12):2577-2584. https://doi.org/10.1002/jum.14298.
41. Kruger J, Dunning D. Unskilled and unaware of it: how difficulties in recognizing one’s own incompetence lead to inflated self-assessments. J Pers Soc Psychol. 1999;77(6):1121-1134. https://doi.org/10.1037//0022-3514.77.6.1121.
Point-of-care ultrasonography (POCUS) can transform healthcare delivery through its diagnostic and therapeutic expediency.1 POCUS has been shown to bolster diagnostic accuracy, reduce procedural complications, decrease inpatient length of stay, and improve patient satisfaction by encouraging the physician to be present at the bedside.2-8
POCUS has become widespread across a variety of clinical settings as more investigations have demonstrated its positive impact on patient care.1,9-12 This includes the use of POCUS by trainees, who are now utilizing this technology as part of their assessments of patients.13,14 However, trainees may be performing these examinations with minimal oversight, and outside of emergency medicine, there are few guidelines on how to effectively teach POCUS or measure competency.13,14 While POCUS is rapidly becoming a part of inpatient care, teaching physicians may have little experience in ultrasound or the expertise to adequately supervise trainees.14 There is a growing need to study what trainees can learn and how this knowledge is acquired.
Previous investigations have demonstrated that inexperienced users can be taught to use POCUS to identify a variety of pathological states.2,3,15-23 Most of these curricula used a single lecture series as their pedagogical vehicle, and they variably included junior medical trainees. More importantly, the investigations did not explore whether personal access to handheld ultrasound devices (HUDs) improved learning. In theory, improved access to POCUS devices increases opportunities for authentic and deliberate practice, which may be needed to improve trainee skill with POCUS beyond the classroom setting.14
This study aimed to address several ongoing gaps in knowledge related to learning POCUS. First, we hypothesized that personal HUD access would improve trainees’ POCUS-related knowledge and interpretive ability as a result of increased practice opportunities. Second, we hypothesized that trainees who receive personal access to HUDs would be more likely to perform POCUS examinations and feel more confident in their interpretations. Finally, we hypothesized that repeated exposure to POCUS-related lectures would result in greater improvements in knowledge as compared with a single lecture series.
METHODS
Participants and Setting
The 2017 intern class (n = 47) at an academic internal medicine residency program participated in the study. Control data were obtained from the 2016 intern class (historical control; n = 50) and the 2018 intern class (contemporaneous control; n = 52). The Stanford University Institutional Review Board approved this study.
Study Design
The 2017 intern class (n = 47) received POCUS didactics from June 2017 to June 2018. To evaluate if increased access to HUDs improved learning outcomes, the 2017 interns were randomized 1:1 to receive their own personal HUD that could be used for patient care and/or self-directed learning (n = 24) vs no-HUD (n = 23; Figure). Learning outcomes were assessed over the course of 1 year (see “Outcomes” below) and were compared with the 2016 and 2018 controls. The 2016 intern class had completed a year of training but had not received formalized POCUS didactics (historical control), whereas the 2018 intern class was assessed at the beginning of their year (contemporaneous control; Figure). In order to make comparisons based on intern experience, baseline data for the 2017 intern class were compared with the 2018 intern class, whereas end-of-study data for 2017 interns were compared with 2016 interns.
Outcomes
The primary outcome was the difference in assessment scores at the end of the study period between interns randomized to receive a HUD and those who were not. Secondary outcomes included differences in HUD usage rates, lecture attendance, and assessment scores. To assess whether repeated lecture exposure resulted in greater amounts of learning, this study evaluated for assessment score improvements after each lecture block. Finally, trainee attitudes toward POCUS and their confidence in their interpretative ability were measured at the beginning and end of the study period.
Curriculum Implementation
The lectures were administered as once-weekly didactics of 1-hour duration to interns rotating on the inpatient wards rotation. This rotation is 4 weeks long, and each intern will experience the rotation two to four times per year. Each lecture contained two parts: (1) 20-30 minutes of didactics via Microsoft PowerPointTM and (2) 30-40 minutes of supervised practice using HUDs on standardized patients. Four lectures were given each month: (1) introduction to POCUS and ultrasound physics, (2) thoracic/lung ultrasound, (3) echocardiography, and (4) abdominal POCUS. The lectures consisted of contrasting cases of normal/abnormal videos and clinical vignettes. These four lectures were repeated each month as new interns rotated on service. Some interns experienced the same content multiple times, which was intentional in order to assess their rates of learning over time. Lecture contents were based on previously published guidelines and expert consensus for teaching POCUS in internal medicine.13, 24-26 Content from the Accreditation Council for Graduate Medical Education (ACGME) and the American College of Emergency Physicians (ACEP) was also incorporated because these organizations had published relevant guidelines for teaching POCUS.13,26 Further development of the lectures occurred through review of previously described POCUS-relevant curricula.27-32
Handheld Ultrasound Devices
This study used the Philips LumifyTM, a United States Food and Drug Administration–approved device. Interns randomized to HUDs received their own device at the start of the rotation. It was at their discretion to use the device outside of the course. All devices were approved for patient use and were encrypted in compliance with our information security office. For privacy reasons, any saved patient images were not reviewed by the researchers. Interns were encouraged to share their findings with supervising physicians during rounds, but actual oversight was not measured. Interns not randomized to HUDs could access a single community device that was shared among all residents and fellows in the hospital. Interns reported the average number of POCUS examinations performed each week via a survey sent during the last week of the rotation.
Assessment Design and Implementation
Assessments evaluating trainee knowledge were administered before, during, and after the study period (Figure). For the 2017 cohort, assessments were also administered at the start and end of the ward month to track knowledge acquisition. Assessment contents were selected from POCUS guidelines for internal medicine and adaptation of the ACGME and ACEP guidelines.13,24,26 Additional content was obtained from major society POCUS tutorials and deidentified images collected by the study authors.13,24,33 In keeping with previously described methodology, the images were shown for approximately 12 seconds, followed by five additional seconds to allow the learner to answer the question.32 Final assessment contents were determined by the authors using the Delphi method.34 A sample assessment can be found in the Appendix Material.
Surveys
Surveys were administered alongside the assessments to the 2016-2018 intern classes. These surveys assessed trainee attitudes toward POCUS and were based on previously validated assessments.27,28,30 Attitudes were measured using 5-point Likert scales.
Statistical Analysis
For the primary outcome, we performed generalized binomial mixed-effect regressions using the survey periods, randomization group, and the interaction of the two as independent variables after adjusting for attendance and controlling of intra-intern correlations. The bivariate unadjusted analysis was performed to display the distribution of overall correctness on the assessments. Wilcoxon signed rank test was used to determine score significance for dependent score variables (R-Statistical Programming Language, Vienna, Austria).
RESULTS
Baseline Characteristics
There were 149 interns who participated in this study (Figure). Assessment/survey completion rates were as follows: 2016 control: 68.0%; 2017 preintervention: 97.9%; 2017 postintervention: 89.4%; and 2018 control: 100%. The 2017 interns reported similar amounts of prior POCUS exposure in medical school (Table 1).
Primary Outcome: Assessment Scores (HUD vs no HUD)
There were no significant differences in assessment scores at the end of the study between interns randomized to personal HUD access vs those to no-HUD access (Table 1). HUD interns reported performing POCUS assessments on patients a mean 6.8 (standard deviation [SD] 2.2) times per week vs 6.4 (SD 2.9) times per week in the no-HUD arm (P = .66). The mean lecture attendance was 75.0% and did not significantly differ between the HUD arms (Table 1).
Secondary Outcomes
Impact of Repeating Lectures
The 2017 interns demonstrated significant increases in preblock vs postblock assessment scores after first-time exposure to the lectures (median preblock score 0.61 [interquartile range (IQR), 0.53-0.70] vs postblock score 0.81 [IQR, 0.72-0.86]; P < .001; Table 2). However, intern performance on the preblock vs postblock assessments after second-time exposure to the curriculum failed to improve (median second preblock score 0.78 [IQR, 0.69-0.83] vs postblock score 0.81 [IQR, 0.64-0.89]; P = .94). Intern performance on individual domains of knowledge for each block is listed in Appendix Table 1.
Intervention Performance vs Controls
The 2016 historical control had significantly higher scores compared with the 2017 preintervention group (P < .001; Appendix Table 2). The year-long lecture series resulted in significant increases in median scores for the 2017 group (median preintervention score 0.55 [0.41-0.61] vs median postintervention score 0.84 [0.71-0.90]; P = .006; Appendix Table 1). At the end of the study, the 2017 postintervention scores were significantly higher across multiple knowledge domains compared with the 2016 historical control (Appendix Table 2).
Survey Results
Notably, the 2017 intern class at the end of the intervention did not have significantly different assessment scores for several disease-specific domains, compared with the 2016 control (Appendix Table 2). Nonetheless, the 2017 intern class reported higher levels of confidence in these same domains despite similar scores (Supplementary Figure). The HUD group seldomly cited a lack of confidence in their abilities as a barrier to performing POCUS examinations (17.6%), compared with the no-HUD group (50.0%), despite nearly identical assessment scores between the two groups (Table 1).
DISCUSSION
Previous guidelines have recommended increased HUD access for learners,13,24,35,36 but there have been few investigations that have evaluated the impact of such access on learning POCUS. One previous investigation found that hospitalists who carried HUDs were more likely to identify heart failure on bedside examination.37 In contrast, our study found no improvement in interpretative ability when randomizing interns to carry HUDs for patient care. Notably, interns did not perform more POCUS examinations when given HUDs. We offer several explanations for this finding. First, time-motion studies have demonstrated that internal medicine interns spend less than 15% of their time toward direct patient care.38 It is possible that the demands of being an intern impeded their ability to perform more POCUS examinations on their patients, regardless of HUD access. Alternatively, the interns randomized to no personal access may have used the community device more frequently as a result of the lecture series. Given the cost of HUDs, further studies are needed to assess the degree to which HUD access will improve trainee interpretive ability, especially as more training programs consider the creation of ultrasound curricula.10,11,24,39,40
This study was unique because it followed interns over a year-long course that repeated the same material to assess rates of learning with repeated exposure. Learners improved their scores after the first, but not second, block. Furthermore, the median scores were nearly identical between the first postblock assessment and second preblock assessment (0.81 vs 0.78), suggesting that knowledge was retained between blocks. Together, these findings suggest there may be limitations of traditional lectures that use standardized patient models for practice. Supplementary pedagogies, such as in-the-moment feedback with actual patients, may be needed to promote mastery.14,35
Despite no formal curriculum, the 2016 intern class (historical control) had learned POCUS to some degree based on their higher assessment scores compared with the 2017 intern class during the preintervention period. Such learning may be informal, and yet, trainees may feel confident in making clinical decisions without formalized training, accreditation, or oversight. As suggested by this study, adding regular didactics or giving trainees HUDs may not immediately solve this issue. For assessment items in which the 2017 interns did not significantly differ from the controls, they nonetheless reported higher confidence in their abilities. Similarly, interns randomized to HUDs less frequently cited a lack of confidence in their abilities, despite similar scores to the no-HUD group. Such confidence may be incongruent with their actual knowledge or ability to safely use POCUS. This phenomenon of misplaced confidence is known as the Dunning–Kruger effect, and it may be common with ultrasound learning.41 While confidence can be part of a holistic definition of competency,14 these results raise the concern that trainees may have difficulty assessing their own competency level with POCUS.35
There are several limitations to this study. It was performed at a single institution with limited sample size. It examined only intern physicians because of funding constraints, which limits the generalizability of these findings among medical trainees. Technical ability assessments (including obtaining and interpreting images) were not included. We were unable to track the timing or location of the devices’ usage, and the interns’ self-reported usage rates may be subject to recall bias. To our knowledge, there were no significant lapses in device availability/functionality. Intern physicians in the HUD arm did not receive formal feedback on personally acquired patient images, which may have limited the intervention’s impact.
In conclusion, internal medicine interns who received personal HUDs were not better at recognizing normal/abnormal findings on image assessments, and they did not report performing more POCUS examinations. Since the minority of a trainee’s time is spent toward direct patient care, offering trainees HUDs without substantial guidance may not be enough to promote mastery. Notably, trainees who received HUDs felt more confident in their abilities, despite no objective increase in their actual skill. Finally, interns who received POCUS-related lectures experienced significant benefit upon first exposure to the material, while repeated exposures did not improve performance. Future investigations should stringently track trainee POCUS usage rates with HUDs and assess whether image acquisition ability improves as a result of personal access.
1. Moore CL, Copel JA. Point-of-care ultrasonography. N Engl J Med. 2011;364(8):749-757. https://doi.org/10.1056/NEJMra0909487.
2. Akkaya A, Yesilaras M, Aksay E, Sever M, Atilla OD. The interrater reliability of ultrasound imaging of the inferior vena cava performed by emergency residents. Am J Emerg Med. 2013;31(10):1509-1511. https://doi.org/10.1016/j.ajem.2013.07.006.
3. Razi R, Estrada JR, Doll J, Spencer KT. Bedside hand-carried ultrasound by internal medicine residents versus traditional clinical assessment for the identification of systolic dysfunction in patients admitted with decompensated heart failure. J Am Soc Echocardiogr. 2011;24(12):1319-1324. https://doi.org/10.1016/j.echo.2011.07.013.
4. Dodge KL, Lynch CA, Moore CL, Biroscak BJ, Evans LV. Use of ultrasound guidance improves central venous catheter insertion success rates among junior residents. J Ultrasound Med. 2012;31(10):1519-1526. https://doi.org/10.7863/jum.2012.31.10.1519.
5. Cavanna L, Mordenti P, Bertè R, et al. Ultrasound guidance reduces pneumothorax rate and improves safety of thoracentesis in malignant pleural effusion: Report on 445 consecutive patients with advanced cancer. World J Surg Oncol. 2014;12:139. https://doi.org/10.1186/1477-7819-12-139.
6. Testa A, Francesconi A, Giannuzzi R, Berardi S, Sbraccia P. Economic analysis of bedside ultrasonography (US) implementation in an Internal Medicine department. Intern Emerg Med. 2015;10(8):1015-1024. https://doi.org/10.1007/s11739-015-1320-7.
7. Howard ZD, Noble VE, Marill KA, et al. Bedside ultrasound maximizes patient satisfaction. J Emerg Med. 2014;46(1):46-53. https://doi.org/10.1016/j.jemermed.2013.05.044.
8. Park YH, Jung RB, Lee YG, et al. Does the use of bedside ultrasonography reduce emergency department length of stay for patients with renal colic? A pilot study. Clin Exp Emerg Med. 2016;3(4):197-203. https://doi.org/10.15441/ceem.15.109.
9. Glomb N, D’Amico B, Rus M, Chen C. Point-of-care ultrasound in resource-limited settings. Clin Pediatr Emerg Med. 2015;16(4):256-261. https://doi.org/10.1016/j.cpem.2015.10.001.
10. Bahner DP, Goldman E, Way D, Royall NA, Liu YT. The state of ultrasound education in U.S. medical schools: results of a national survey. Acad Med. 2014;89(12):1681-1686. https://doi.org/10.1097/ACM.0000000000000414.
11. Hall JWW, Holman H, Bornemann P, et al. Point of care ultrasound in family medicine residency programs: A CERA study. Fam Med. 2015;47(9):706-711.
12. Schnobrich DJ, Gladding S, Olson APJ, Duran-Nelson A. Point-of-care ultrasound in internal medicine: A national survey of educational leadership. J Grad Med Educ. 2013;5(3):498-502. https://doi.org/10.4300/JGME-D-12-00215.1.
13. Stolz LA, Stolz U, Fields JM, et al. Emergency medicine resident assessment of the emergency ultrasound milestones and current training recommendations. Acad Emerg Med. 2017;24(3):353-361. https://doi.org/10.1111/acem.13113.
14. Kumar, A., Jensen, T., Kugler, J. Evaluation of trainee competency with point-of-care ultrasonography (POCUS): A conceptual framework and review of existing assessments. J Gen Intern Med. 2019;34(6):1025-1031. https://doi.org/10.1007/s11606-019-04945-4.
15. Levitov A, Frankel HL, Blaivas M, et al. Guidelines for the appropriate use of bedside general and cardiac ultrasonography in the evaluation of critically ill patients—part ii: Cardiac ultrasonography. Crit Care Med. 2016;44(6):1206-1227. https://doi.org/10.1097/CCM.0000000000001847.
16. Kobal SL, Trento L, Baharami S, et al. Comparison of effectiveness of hand-carried ultrasound to bedside cardiovascular physical examination. Am J Cardiol. 2005;96(7):1002-1006. https://doi.org/10.1016/j.amjcard.2005.05.060.
17. Ceriani E, Cogliati C. Update on bedside ultrasound diagnosis of pericardial effusion. Intern Emerg Med. 2016;11(3):477-480. https://doi.org/10.1007/s11739-015-1372-8.
18. Labovitz AJ, Noble VE, Bierig M, et al. Focused cardiac ultrasound in the emergent setting: A consensus statement of the American Society of Echocardiography and American College of Emergency Physicians. J Am Soc Echocardiogr. 2010;23(12):1225-1230. https://doi.org/10.1016/j.echo.2010.10.005.
19. Keil-Ríos D, Terrazas-Solís H, González-Garay A, Sánchez-Ávila JF, García-Juárez I. Pocket ultrasound device as a complement to physical examination for ascites evaluation and guided paracentesis. Intern Emerg Med. 2016;11(3):461-466. https://doi.org/10.1007/s11739-016-1406-x.
20. Riddell J, Case A, Wopat R, et al. Sensitivity of emergency bedside ultrasound to detect hydronephrosis in patients with computed tomography–proven stones. West J Emerg Med. 2014;15(1):96-100. https://doi.org/10.5811/westjem.2013.9.15874.
21. Dalziel PJ, Noble VE. Bedside ultrasound and the assessment of renal colic: A review. Emerg Med J. 2013;30(1):3-8. https://doi.org/10.1136/emermed-2012-201375.
22. Whitson MR, Mayo PH. Ultrasonography in the emergency department. Crit Care. 2016;20(1):227. https://doi.org/10.1186/s13054-016-1399-x.
23. Kumar A, Liu G, Chi J, Kugler J. The role of technology in the bedside encounter. Med Clin North Am. 2018;102(3):443-451. https://doi.org/10.1016/j.mcna.2017.12.006.
24. Ma IWY, Arishenkoff S, Wiseman J, et al. Internal medicine point-of-care ultrasound curriculum: Consensus recommendations from the Canadian Internal Medicine Ultrasound (CIMUS) Group. J Gen Intern Med. 2017;32(9):1052-1057. https://doi.org/10.1007/s11606-017-4071-5.
15. Sabath BF, Singh G. Point-of-care ultrasonography as a training milestone for internal medicine residents: The time is now. J Community Hosp Intern Med Perspect. 2016;6(5):33094. https://doi.org/10.3402/jchimp.v6.33094.
26. American College of Emergency Physicians. Ultrasound guidelines: emergency, point-of-care and clinical ultrasound guidelines in medicine. Ann Emerg Med. 2017;69(5):e27-e54. https://doi.org/10.1016/j.annemergmed.2016.08.457.
27. Ramsingh D, Rinehart J, Kain Z, et al. Impact assessment of perioperative point-of-care ultrasound training on anesthesiology residents. Anesthesiology. 2015;123(3):670-682. https://doi.org/10.1097/ALN.0000000000000776.
28. Keddis MT, Cullen MW, Reed DA, et al. Effectiveness of an ultrasound training module for internal medicine residents. BMC Med Educ. 2011;11:75. https://doi.org/10.1186/1472-6920-11-75.
29. Townsend NT, Kendall J, Barnett C, Robinson T. An effective curriculum for focused assessment diagnostic echocardiography: Establishing the learning curve in surgical residents. J Surg Educ. 2016;73(2):190-196. https://doi.org/10.1016/j.jsurg.2015.10.009.
30. Hoppmann RA, Rao VV, Bell F, et al. The evolution of an integrated ultrasound curriculum (iUSC) for medical students: 9-year experience. Crit Ultrasound J. 2015;7(1):18. https://doi.org/10.1186/s13089-015-0035-3.
31. Skalski JH, Elrashidi M, Reed DA, McDonald FS, Bhagra A. Using standardized patients to teach point-of-care ultrasound–guided physical examination skills to internal medicine residents. J Grad Med Educ. 2015;7(1):95-97. https://doi.org/10.4300/JGME-D-14-00178.1.
32. Chisholm CB, Dodge WR, Balise RR, Williams SR, Gharahbaghian L, Beraud A-S. Focused cardiac ultrasound training: How much is enough? J Emerg Med. 2013;44(4):818-822. https://doi.org/10.1016/j.jemermed.2012.07.092.
33. Schmidt GA, Schraufnagel D. Introduction to ATS seminars: Intensive care ultrasound. Ann Am Thorac Soc. 2013;10(5):538-539. https://doi.org/10.1513/AnnalsATS.201306-203ED.
34. Skaarup SH, Laursen CB, Bjerrum AS, Hilberg O. Objective and structured assessment of lung ultrasound competence. A multispecialty Delphi consensus and construct validity study. Ann Am Thorac Soc. 2017;14(4):555-560. https://doi.org/10.1513/AnnalsATS.201611-894OC.
35. Lucas BP, Tierney DM, Jensen TP, et al. Credentialing of hospitalists in ultrasound-guided bedside procedures: A position statement of the Society of Hospital Medicine. J Hosp Med. 2018;13(2):117-125. https://doi.org/10.12788/jhm.2917.
36. Frankel HL, Kirkpatrick AW, Elbarbary M, et al. Guidelines for the appropriate use of bedside general and cardiac ultrasonography in the evaluation of critically ill patients-part i: General ultrasonography. Crit Care Med. 2015;43(11):2479-2502. https://doi.org/10.1097/CCM.0000000000001216.
37. Martin LD, Howell EE, Ziegelstein RC, et al. Hand-carried ultrasound performed by hospitalists: Does it improve the cardiac physical examination? Am J Med. 2009;122(1):35-41. https://doi.org/10.1016/j.amjmed.2008.07.022.
38. Desai SV, Asch DA, Bellini LM, et al. Education outcomes in a duty-hour flexibility trial in internal medicine. N Engl J Med. 2018;378(16):1494-1508. https://doi.org/10.1056/NEJMoa1800965.
39. Baltarowich OH, Di Salvo DN, Scoutt LM, et al. National ultrasound curriculum for medical students. Ultrasound Q. 2014;30(1):13-19. https://doi.org/10.1097/RUQ.0000000000000066.
40. Beal EW, Sigmond BR, Sage-Silski L, Lahey S, Nguyen V, Bahner DP. Point-of-care ultrasound in general surgery residency training: A proposal for milestones in graduate medical education ultrasound. J Ultrasound Med. 2017;36(12):2577-2584. https://doi.org/10.1002/jum.14298.
41. Kruger J, Dunning D. Unskilled and unaware of it: how difficulties in recognizing one’s own incompetence lead to inflated self-assessments. J Pers Soc Psychol. 1999;77(6):1121-1134. https://doi.org/10.1037//0022-3514.77.6.1121.
© 2020 Society of Hospital Medicine
Adherence to Topical Treatment Can Improve Treatment-Resistant Moderate Psoriasis
High-potency topical corticosteroids are first-line treatments for psoriasis, but many patients report that they are ineffective or lose effectiveness over time.1-5 The mechanism underlying the lack or loss of activity is not well characterized but may be due to poor adherence to treatment. Adherence to topical treatment is poor in the short run and even worse in the long run.6,7 We evaluated 12 patients with psoriasis resistant to topical corticosteroids to determine if they would respond to topical corticosteroids under conditions designed to promote adherence to treatment.
Methods
This open-label, randomized, single-center clinical study recruited 12 patients with plaque psoriasis that previously failed treatment with topical corticosteroids and other therapies (Table). We stratified disease by body surface area: mild (<3%), moderate (3%–10%), and severe (>10%). Inclusion criteria included adult patients with plaque psoriasis amenable to topical corticosteroid therapy, ability to comply with requirements of the study, and a history of failed topical corticosteroid treatment (Figure). Patients were excluded if they were pregnant, breastfeeding, had conditions that would affect adherence or potentially bias results (eg, dementia, Alzheimer disease), had a history of allergy or sensitivity to corticosteroids, and had a history of drug hypersensitivity.
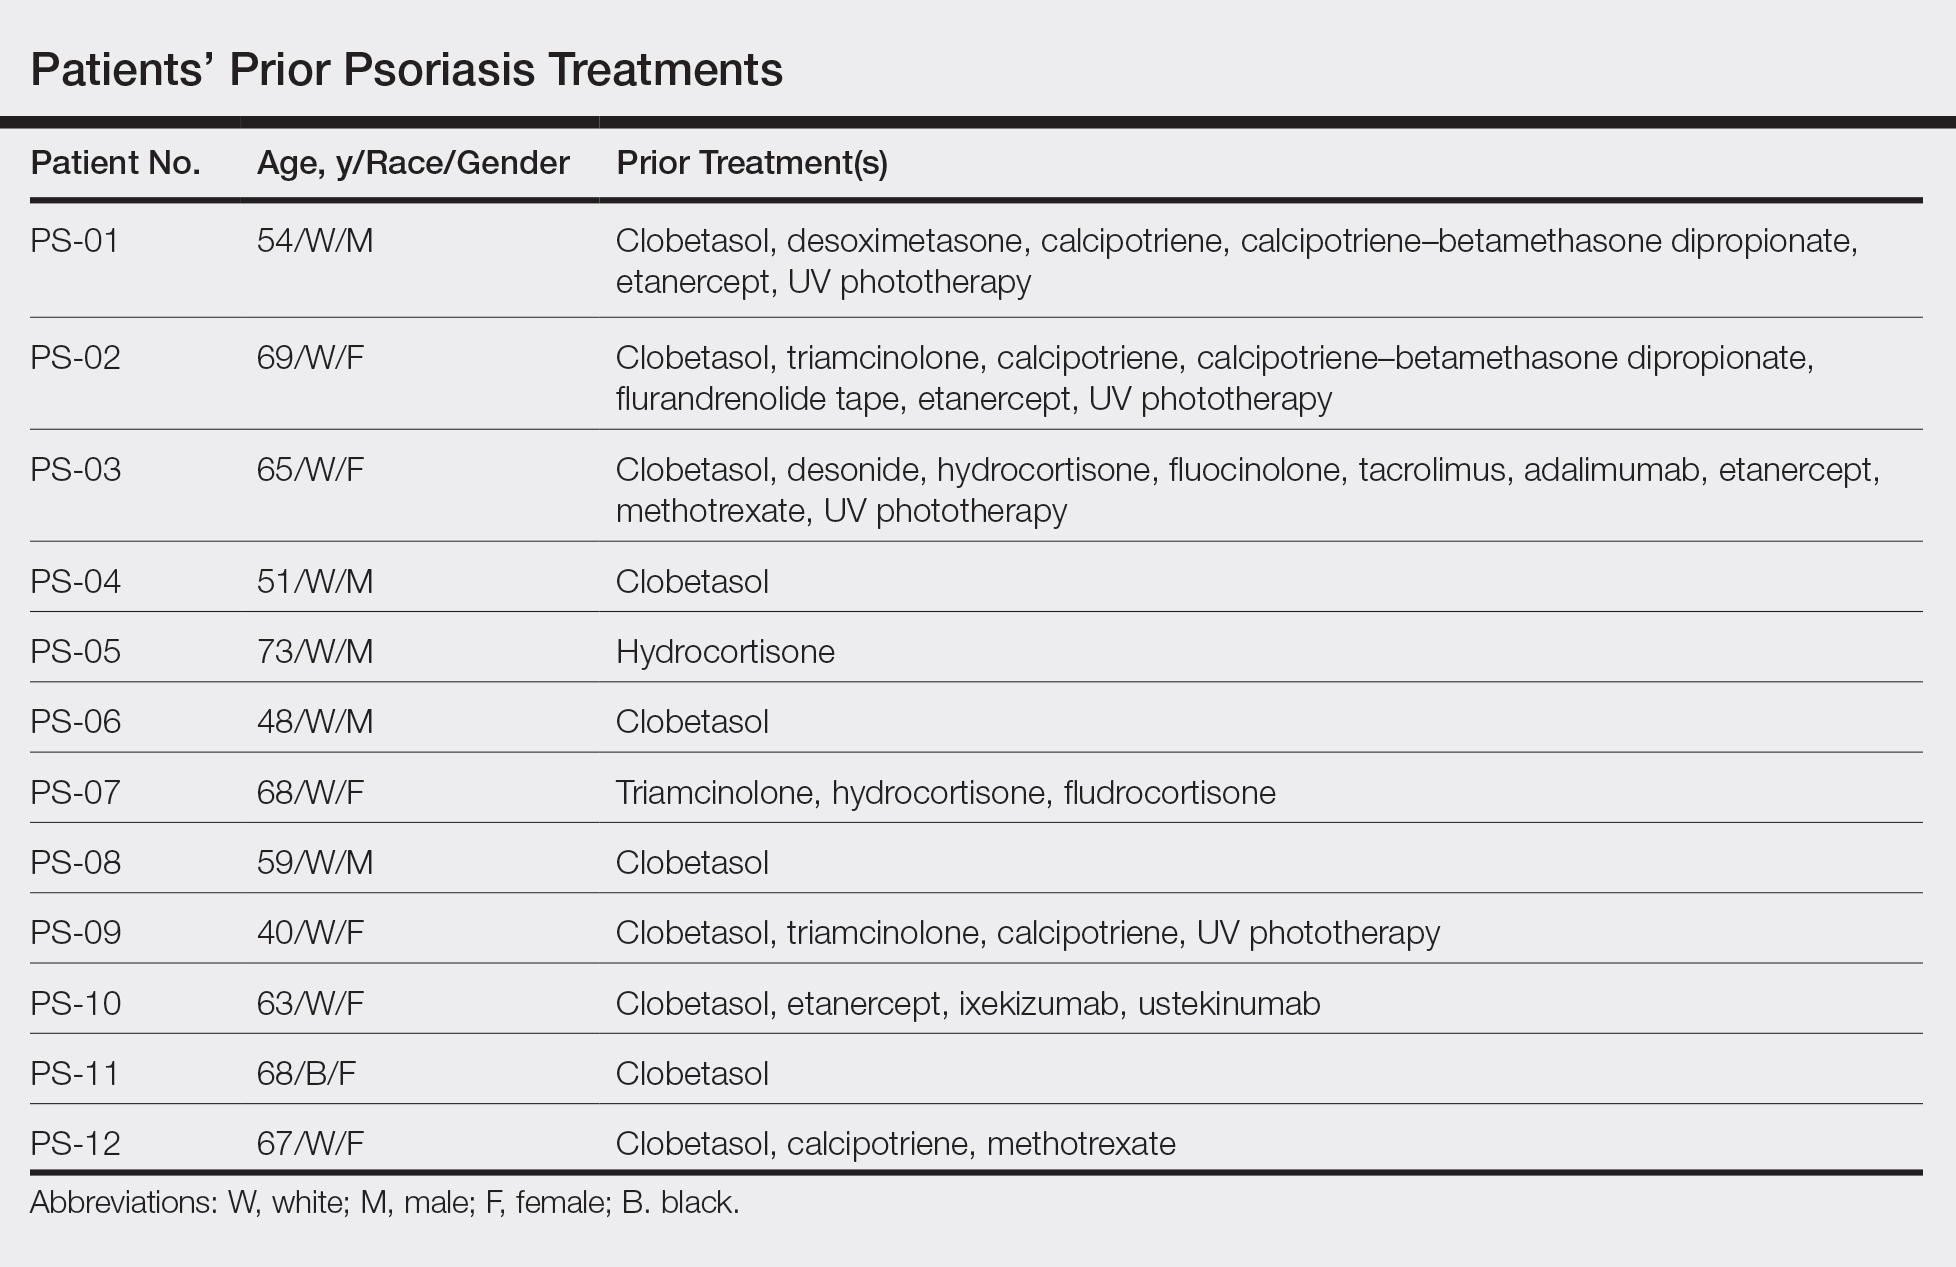
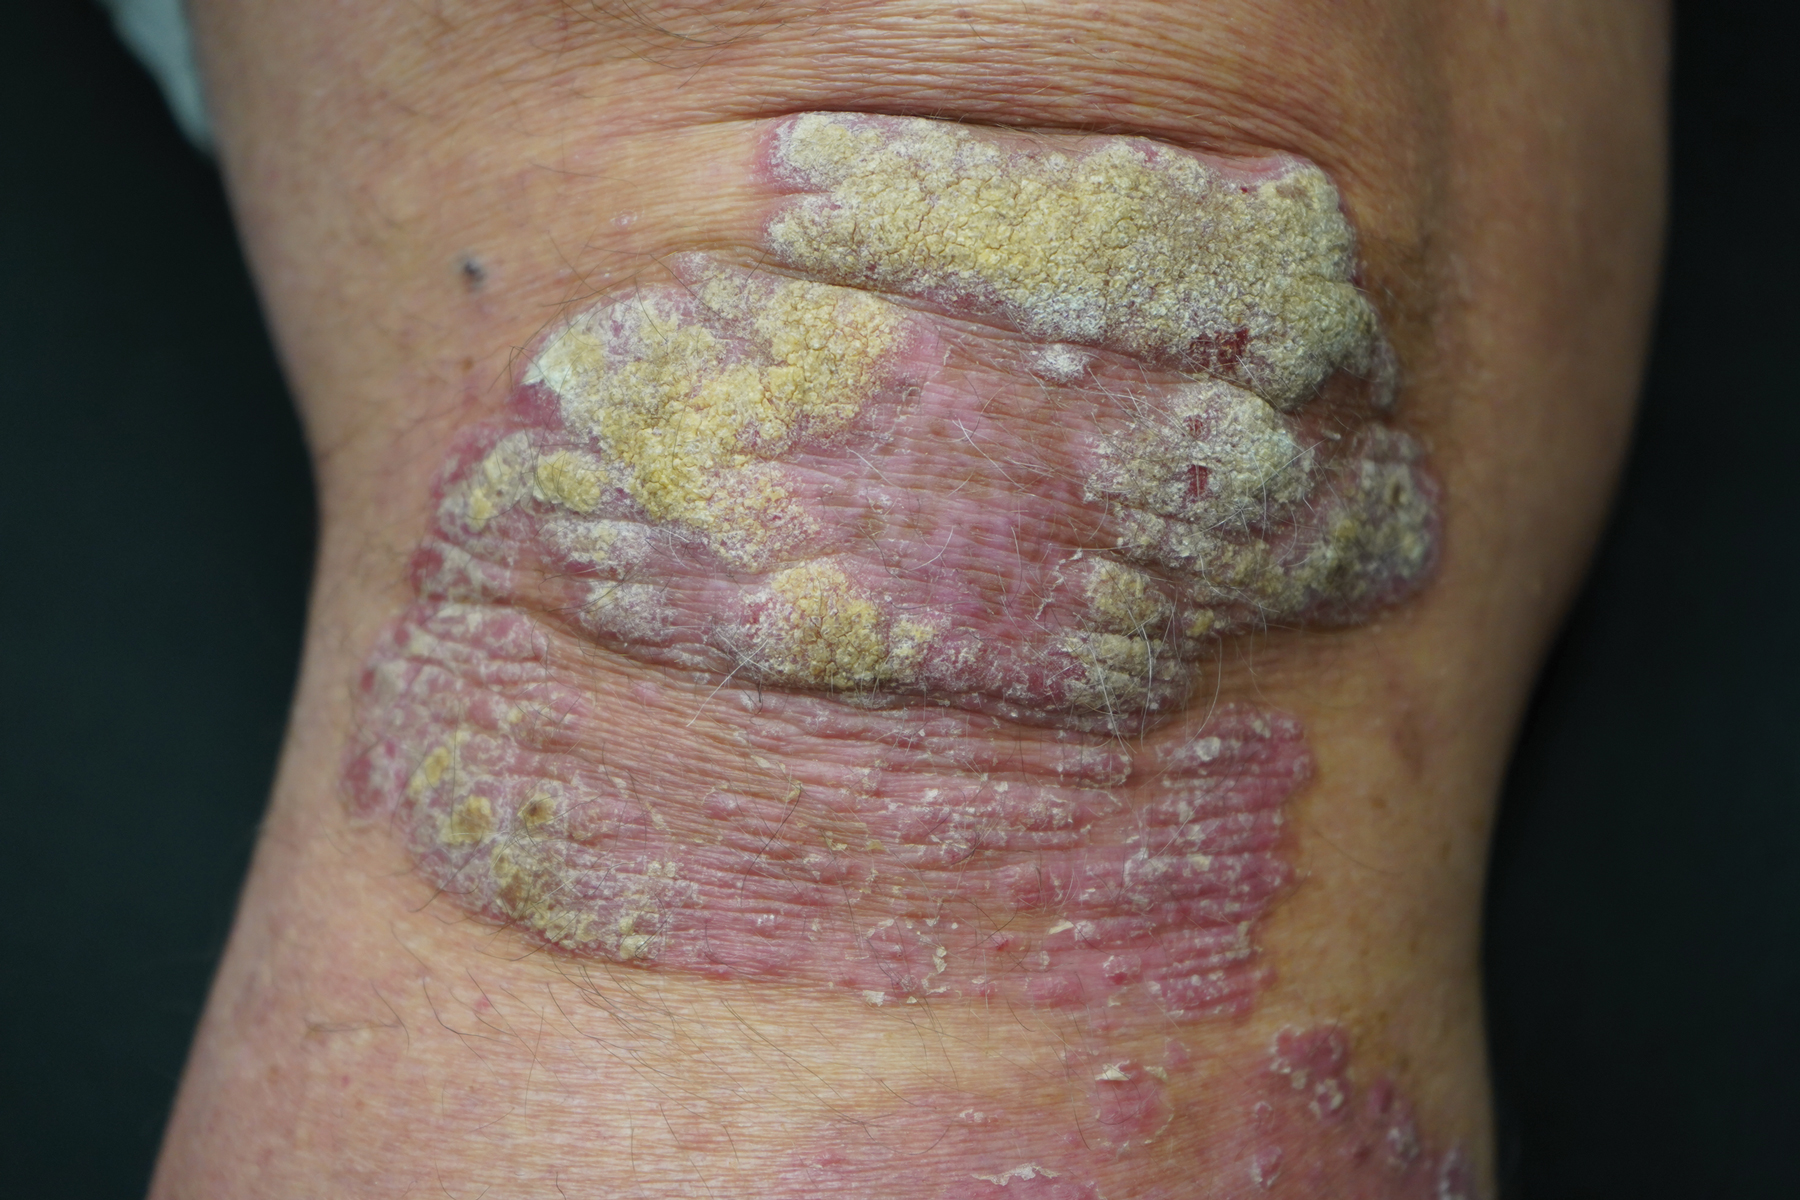
All patients received desoximetasone spray 0.25% twice daily for 14 days. At the baseline visit, 6 patients were randomly selected to also receive a twice-daily reminder telephone call. Study visits occurred frequently—at baseline and on days 3, 7, and 14—to further assure good adherence to the treatment regimen.
During visits, disease severity was scored using the visual analog scale for pruritus, psoriasis area and severity index (PASI), total lesion severity score (TLSS), and investigator global assessment (IGA). Descriptive statistics were used to report the outcomes for each patient.
The study was designed to assess the number of topical treatment–resistant patients who would improve with topical treatment but was not designed or powered to test if the telephone call reminders increased adherence.
Results
All patients completed the study; 10 of 12 patients (83.3%) had previously used topical clobetasol and it failed (Table). At the 2-week end-of-study visit, most patients improved on all measures. Patients who received telephone call reminders improved more than patients who did not. All 12 patients (100%) reported relief of itching; 11 of 12 (91.7%) had an improved PASI; 10 of 12 (83.3%) had an improved TLSS; and 7 of 12 (58.3%) had an improved IGA (eTables 1 and 2).
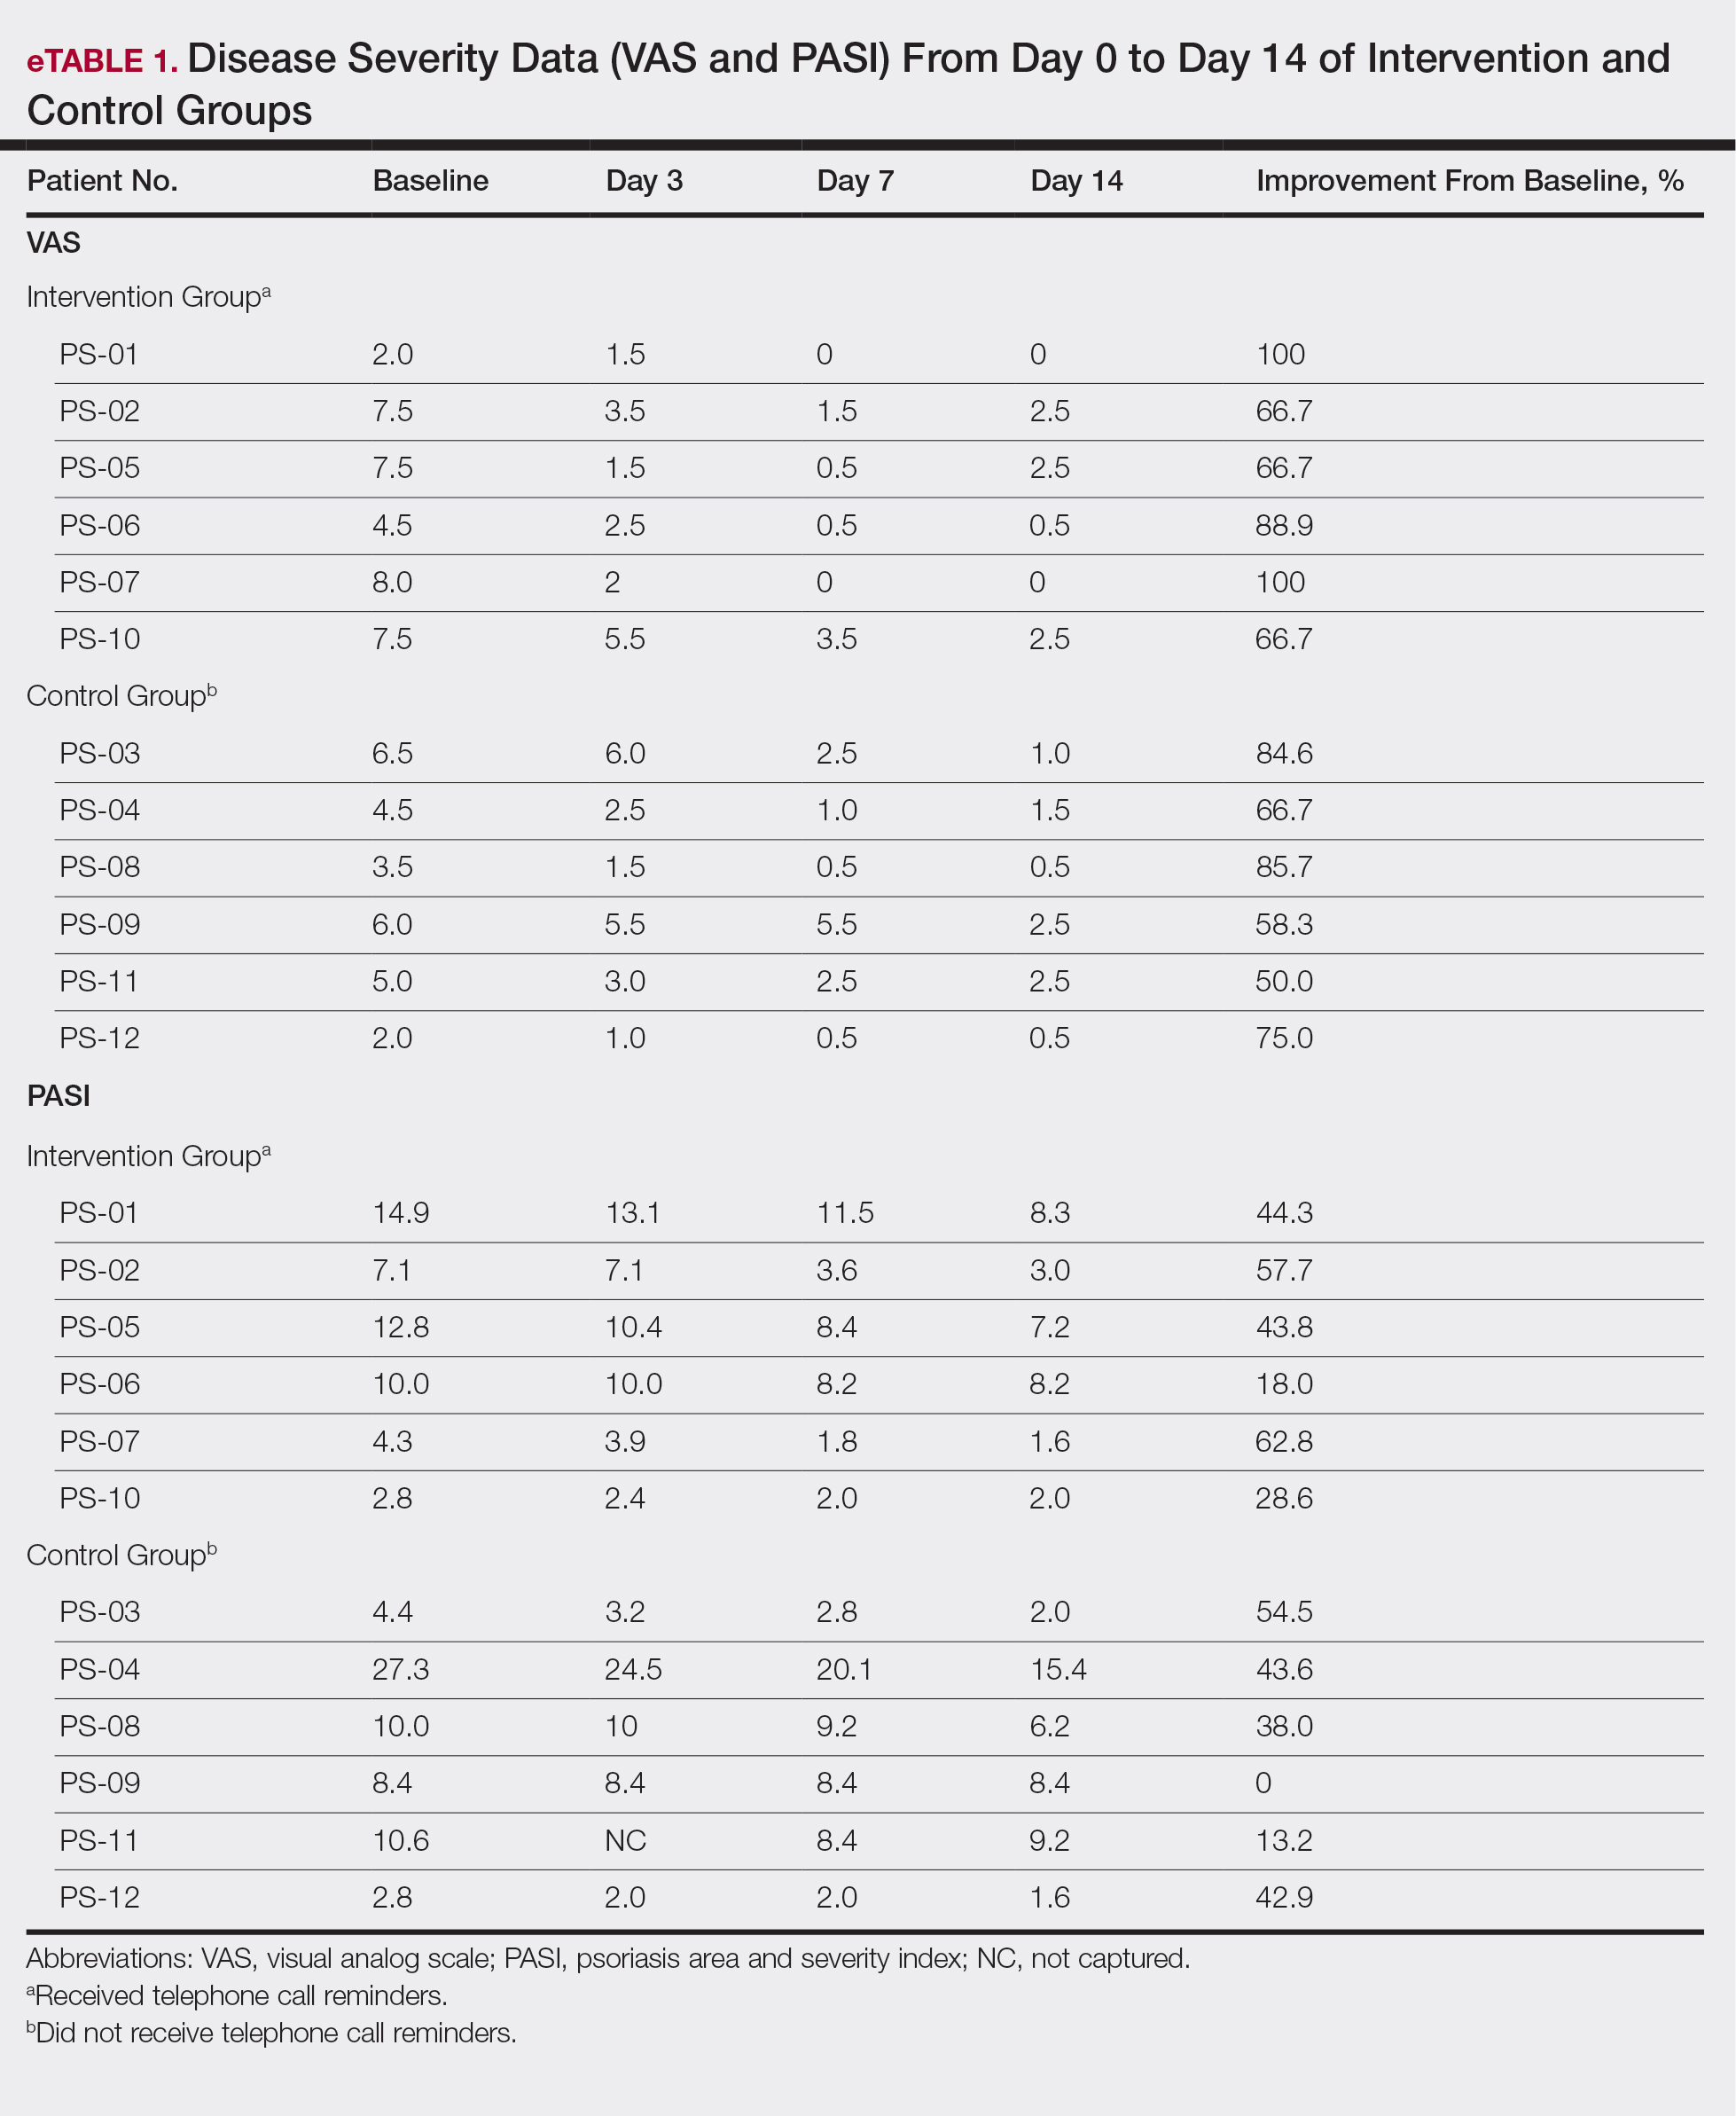
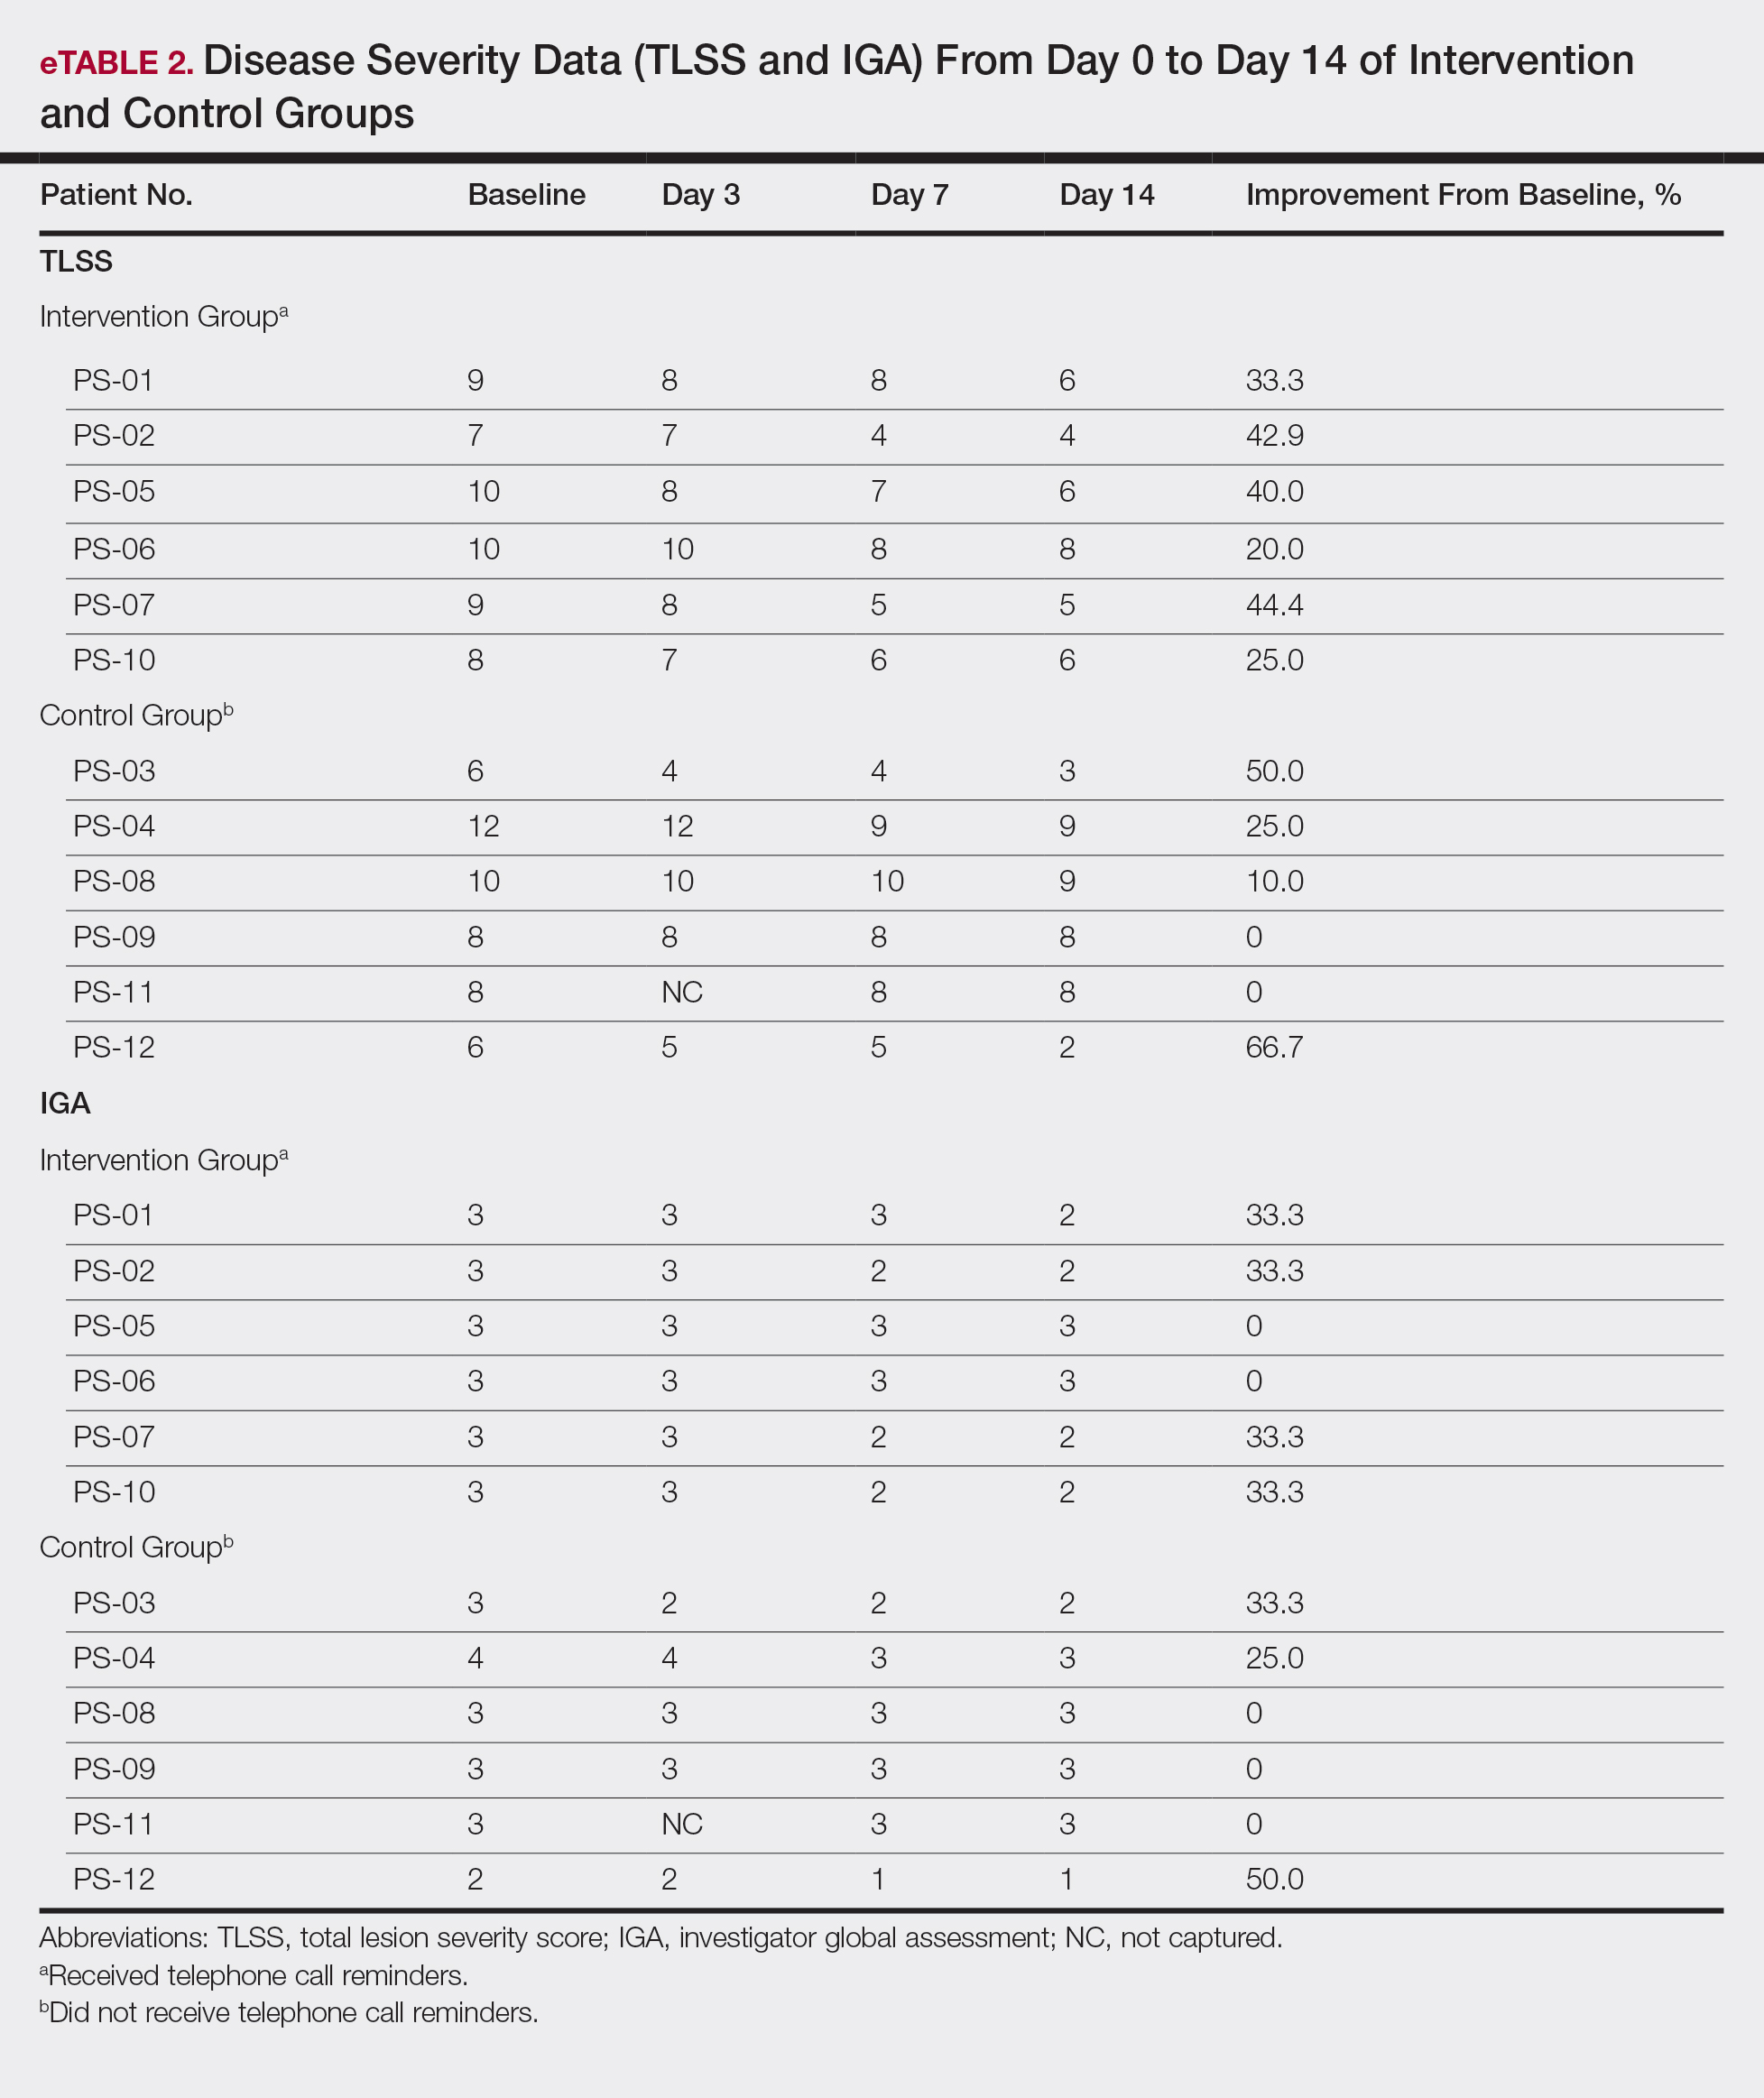
The percentage reduction in pruritus ranged from 66.7% to 100% and 50.0% to 85.7% with and without telephone call reminders, respectively. Improvement in PASI ranged from 18.0% to 62.8% and 0% to 54.5% with and without telephone call reminders, respectively. Improvement in TLSS and IGA was of lower magnitude but showed a similar pattern, with numerically greater improvement in the telephone call reminders group compared to the group that was not called (eTable 2). No patients showed a worse score for pruritus on the visual analog scale, PASI, TLSS, or IGA.
Discussion
Topical corticosteroids are highly effective for psoriasis in clinical trials, with clearance in 2 to 4 weeks in 60% to 80% of patients, a rapidity of response not matched by even the most potent biologic treatments.8,9 However, topical corticosteroids are not always effective in clinical practice. There may be primary inefficacy (they do not work at first) or secondary inefficacy (a previously effective treatment loses efficacy over time).10 Poor adherence can explain both phenomena. Primary adherence occurs when patients fill their prescription; secondary adherence occurs when patients follow the medication recommendations.11 Primary nonadherence is common in patients with psoriasis; in one study, 50% of psoriasis prescriptions were not filled.12 Secondary adherence also is poor and declines over time; electronic monitoring revealed adherence to topical treatments in psoriasis patients decreased from 85% initially to 51% at the end of 8 weeks.7 Given the high efficacy of topical corticosteroids in clinical trials and the poor adherence to topical treatment in patients with psoriasis, we anticipated that psoriasis that is resistant to topical corticosteroids would improve rapidly under conditions designed to promote adherence.
As expected, disease improved in almost every patient in this small cohort when they were given a potent topical corticosteroid, even though they previously reported that their psoriasis was resistant to potent topical corticosteroids. Although this study enrolled only a small cohort, it appears that the majority of patients with limited psoriasis that was reported to be resistant to topical treatment can see a response to topical treatment under conditions designed to encourage good adherence.
We believe that the good outcomes seen in our study were a result of good adherence. Although the desoximetasone spray 0.25% used in this study is a superpotent topical corticosteroid,8 the response to treatment was unlikely due to changing corticosteroid potency because 10 of 12 patients had tried another superpotent topical corticosteroid (clobetasol) and it failed. We chose a spray product for this study rather than an ointment to promote adherence; however, this choice limited the ability to assess adherence directly, as adherence-monitoring devices for spray delivery systems are not readily available.
Our study was limited by the small sample size and brief duration of treatment. However, the effect size is so large (ie, the topical treatment was so effective) that only a small sample size and brief treatment duration were needed to show that a high percentage of patients with psoriasis that had previously failed treatment with topical corticosteroids can in fact respond to this treatment.
We used telephone calls as reminders in 50% of patients to further encourage adherence. The study was not designed or powered to assess the effect of the telephone call reminders, but patients receiving those calls appeared to have slightly greater reduction in disease severity. Nonetheless, twice-daily telephone call reminders are unlikely to be a wanted or practical intervention; other approaches to encourage adherence are needed.
Frequent follow-up visits were incorporated in our study design to maximize adherence. Although it might not be feasible for clinical practices to schedule follow-up visits as often as in our study, other approaches such as virtual visits and electronic interaction might provide a practical alternative. Multifaceted approaches to increasing adherence include encouraging patients to participate in the treatment plan, prescribing therapy consistent with a patient’s preferred vehicle, and extensive patient education.13 If patients do not respond as expected, poor adherence can be considered. Other potential causes of poor outcomes include error in diagnosis; resistance to the prescribed treatment; concomitant infection; irritant exposure; and, in the case of biologics, antidrug antibody formation.14,15
- Feldman SR, Fleischer AB Jr, Cooper JZ. New topical treatments change the pattern of treatment of psoriasis: dermatologists remain the primary providers of this care. Int J Dermatol. 2000;39:41-44.
- Menter A. Topical monotherapy with clobetasol propionate spray 0.05% in the COBRA trial. Cutis. 2007;80(suppl 5):12-19.
- Saleem MD, Negus D, Feldman SR. Topical 0.25% desoximetasone spray efficacy for moderate to severe plaque psoriasis: a randomized clinical trial. J Dermatolog Treat. 2018;29:32-35.
- Mraz S, Leonardi C, Colón LE, et al. Different treatment outcomes with different formulations of clobetasol propionate 0.05% for the treatment of plaque psoriasis. J Dermatolog Treat. 2008;19:354-359.
- Chiricozzi A, Pimpinelli N, Ricceri F, et al. Treatment of psoriasis with topical agents: recommendations from a Tuscany Consensus. Dermatol Ther. 2017;30:e12549.
- Carroll CL, Feldman SR, Camacho FT, et al. Adherence to topical therapy decreases during the course of an 8-week psoriasis clinical trial: commonly used methods of measuring adherence to topical therapy overestimate actual use. J Am Acad Dermatol. 2004;51:212-216.
- Alinia H, Moradi Tuchayi S, Smith JA, et al. Long-term adherence to topical psoriasis treatment can be abysmal: a 1-year randomized intervention study using objective electronic adherence monitoring. Br J Dermatol. 2017;176:759-764.
- Keegan BR. Desoximetasone 0.25% spray for the relief of scaling in adults with plaque psoriasis. J Drugs Dermatol. 2015;14:835-840.
- Beutner K, Chakrabarty A, Lemke S, et al. An intra-individual randomized safety and efficacy comparison of clobetasol propionate 0.05% spray and its vehicle in the treatment of plaque psoriasis. J Drugs Dermatol. 2006;5:357-360.
- Mehta AB, Nadkarni NJ, Patil SP, et al. Topical corticosteroids in dermatology. Indian J Dermatol Venereol Leprol. 2016;82:371-378.
- Blais L, Kettani FZ, Forget A, et al. Assessing adherence to inhaled corticosteroids in asthma patients using an integrated measure based on primary and secondary adherence. Eur J Clin Pharmacol. 2016;73:91-97.
- Storm A, Andersen SE, Benfeldt E, et al. One in 3 prescriptions are never redeemed: primary nonadherence in an outpatient clinic. J Am Acad Dermatol. 2008;59:27-33.
- Zschocke I, Mrowietz U, Karakasili E, et al. Non-adherence and measures to improve adherence in the topical treatment of psoriasis. J Eur Acad Dermatol Venereol. 2014;28(Suppl 2):4-9.
- Mooney E, Rademaker M, Dailey R, et al. Adverse effects of topical corticosteroids in paediatric eczema: Australasian consensus statement. Australas J Dermatol. 2015;56:241-251.
- Varada S, Tintle SJ, Gottlieb AB. Apremilast for the treatment of psoriatic arthritis. Expert Rev Clin Pharmacol. 2014;7:239-250.
High-potency topical corticosteroids are first-line treatments for psoriasis, but many patients report that they are ineffective or lose effectiveness over time.1-5 The mechanism underlying the lack or loss of activity is not well characterized but may be due to poor adherence to treatment. Adherence to topical treatment is poor in the short run and even worse in the long run.6,7 We evaluated 12 patients with psoriasis resistant to topical corticosteroids to determine if they would respond to topical corticosteroids under conditions designed to promote adherence to treatment.
Methods
This open-label, randomized, single-center clinical study recruited 12 patients with plaque psoriasis that previously failed treatment with topical corticosteroids and other therapies (Table). We stratified disease by body surface area: mild (<3%), moderate (3%–10%), and severe (>10%). Inclusion criteria included adult patients with plaque psoriasis amenable to topical corticosteroid therapy, ability to comply with requirements of the study, and a history of failed topical corticosteroid treatment (Figure). Patients were excluded if they were pregnant, breastfeeding, had conditions that would affect adherence or potentially bias results (eg, dementia, Alzheimer disease), had a history of allergy or sensitivity to corticosteroids, and had a history of drug hypersensitivity.
All patients received desoximetasone spray 0.25% twice daily for 14 days. At the baseline visit, 6 patients were randomly selected to also receive a twice-daily reminder telephone call. Study visits occurred frequently—at baseline and on days 3, 7, and 14—to further assure good adherence to the treatment regimen.
During visits, disease severity was scored using the visual analog scale for pruritus, psoriasis area and severity index (PASI), total lesion severity score (TLSS), and investigator global assessment (IGA). Descriptive statistics were used to report the outcomes for each patient.
The study was designed to assess the number of topical treatment–resistant patients who would improve with topical treatment but was not designed or powered to test if the telephone call reminders increased adherence.
Results
All patients completed the study; 10 of 12 patients (83.3%) had previously used topical clobetasol and it failed (Table). At the 2-week end-of-study visit, most patients improved on all measures. Patients who received telephone call reminders improved more than patients who did not. All 12 patients (100%) reported relief of itching; 11 of 12 (91.7%) had an improved PASI; 10 of 12 (83.3%) had an improved TLSS; and 7 of 12 (58.3%) had an improved IGA (eTables 1 and 2).
The percentage reduction in pruritus ranged from 66.7% to 100% and 50.0% to 85.7% with and without telephone call reminders, respectively. Improvement in PASI ranged from 18.0% to 62.8% and 0% to 54.5% with and without telephone call reminders, respectively. Improvement in TLSS and IGA was of lower magnitude but showed a similar pattern, with numerically greater improvement in the telephone call reminders group compared to the group that was not called (eTable 2). No patients showed a worse score for pruritus on the visual analog scale, PASI, TLSS, or IGA.
Discussion
Topical corticosteroids are highly effective for psoriasis in clinical trials, with clearance in 2 to 4 weeks in 60% to 80% of patients, a rapidity of response not matched by even the most potent biologic treatments.8,9 However, topical corticosteroids are not always effective in clinical practice. There may be primary inefficacy (they do not work at first) or secondary inefficacy (a previously effective treatment loses efficacy over time).10 Poor adherence can explain both phenomena. Primary adherence occurs when patients fill their prescription; secondary adherence occurs when patients follow the medication recommendations.11 Primary nonadherence is common in patients with psoriasis; in one study, 50% of psoriasis prescriptions were not filled.12 Secondary adherence also is poor and declines over time; electronic monitoring revealed adherence to topical treatments in psoriasis patients decreased from 85% initially to 51% at the end of 8 weeks.7 Given the high efficacy of topical corticosteroids in clinical trials and the poor adherence to topical treatment in patients with psoriasis, we anticipated that psoriasis that is resistant to topical corticosteroids would improve rapidly under conditions designed to promote adherence.
As expected, disease improved in almost every patient in this small cohort when they were given a potent topical corticosteroid, even though they previously reported that their psoriasis was resistant to potent topical corticosteroids. Although this study enrolled only a small cohort, it appears that the majority of patients with limited psoriasis that was reported to be resistant to topical treatment can see a response to topical treatment under conditions designed to encourage good adherence.
We believe that the good outcomes seen in our study were a result of good adherence. Although the desoximetasone spray 0.25% used in this study is a superpotent topical corticosteroid,8 the response to treatment was unlikely due to changing corticosteroid potency because 10 of 12 patients had tried another superpotent topical corticosteroid (clobetasol) and it failed. We chose a spray product for this study rather than an ointment to promote adherence; however, this choice limited the ability to assess adherence directly, as adherence-monitoring devices for spray delivery systems are not readily available.
Our study was limited by the small sample size and brief duration of treatment. However, the effect size is so large (ie, the topical treatment was so effective) that only a small sample size and brief treatment duration were needed to show that a high percentage of patients with psoriasis that had previously failed treatment with topical corticosteroids can in fact respond to this treatment.
We used telephone calls as reminders in 50% of patients to further encourage adherence. The study was not designed or powered to assess the effect of the telephone call reminders, but patients receiving those calls appeared to have slightly greater reduction in disease severity. Nonetheless, twice-daily telephone call reminders are unlikely to be a wanted or practical intervention; other approaches to encourage adherence are needed.
Frequent follow-up visits were incorporated in our study design to maximize adherence. Although it might not be feasible for clinical practices to schedule follow-up visits as often as in our study, other approaches such as virtual visits and electronic interaction might provide a practical alternative. Multifaceted approaches to increasing adherence include encouraging patients to participate in the treatment plan, prescribing therapy consistent with a patient’s preferred vehicle, and extensive patient education.13 If patients do not respond as expected, poor adherence can be considered. Other potential causes of poor outcomes include error in diagnosis; resistance to the prescribed treatment; concomitant infection; irritant exposure; and, in the case of biologics, antidrug antibody formation.14,15
- Feldman SR, Fleischer AB Jr, Cooper JZ. New topical treatments change the pattern of treatment of psoriasis: dermatologists remain the primary providers of this care. Int J Dermatol. 2000;39:41-44.
- Menter A. Topical monotherapy with clobetasol propionate spray 0.05% in the COBRA trial. Cutis. 2007;80(suppl 5):12-19.
- Saleem MD, Negus D, Feldman SR. Topical 0.25% desoximetasone spray efficacy for moderate to severe plaque psoriasis: a randomized clinical trial. J Dermatolog Treat. 2018;29:32-35.
- Mraz S, Leonardi C, Colón LE, et al. Different treatment outcomes with different formulations of clobetasol propionate 0.05% for the treatment of plaque psoriasis. J Dermatolog Treat. 2008;19:354-359.
- Chiricozzi A, Pimpinelli N, Ricceri F, et al. Treatment of psoriasis with topical agents: recommendations from a Tuscany Consensus. Dermatol Ther. 2017;30:e12549.
- Carroll CL, Feldman SR, Camacho FT, et al. Adherence to topical therapy decreases during the course of an 8-week psoriasis clinical trial: commonly used methods of measuring adherence to topical therapy overestimate actual use. J Am Acad Dermatol. 2004;51:212-216.
- Alinia H, Moradi Tuchayi S, Smith JA, et al. Long-term adherence to topical psoriasis treatment can be abysmal: a 1-year randomized intervention study using objective electronic adherence monitoring. Br J Dermatol. 2017;176:759-764.
- Keegan BR. Desoximetasone 0.25% spray for the relief of scaling in adults with plaque psoriasis. J Drugs Dermatol. 2015;14:835-840.
- Beutner K, Chakrabarty A, Lemke S, et al. An intra-individual randomized safety and efficacy comparison of clobetasol propionate 0.05% spray and its vehicle in the treatment of plaque psoriasis. J Drugs Dermatol. 2006;5:357-360.
- Mehta AB, Nadkarni NJ, Patil SP, et al. Topical corticosteroids in dermatology. Indian J Dermatol Venereol Leprol. 2016;82:371-378.
- Blais L, Kettani FZ, Forget A, et al. Assessing adherence to inhaled corticosteroids in asthma patients using an integrated measure based on primary and secondary adherence. Eur J Clin Pharmacol. 2016;73:91-97.
- Storm A, Andersen SE, Benfeldt E, et al. One in 3 prescriptions are never redeemed: primary nonadherence in an outpatient clinic. J Am Acad Dermatol. 2008;59:27-33.
- Zschocke I, Mrowietz U, Karakasili E, et al. Non-adherence and measures to improve adherence in the topical treatment of psoriasis. J Eur Acad Dermatol Venereol. 2014;28(Suppl 2):4-9.
- Mooney E, Rademaker M, Dailey R, et al. Adverse effects of topical corticosteroids in paediatric eczema: Australasian consensus statement. Australas J Dermatol. 2015;56:241-251.
- Varada S, Tintle SJ, Gottlieb AB. Apremilast for the treatment of psoriatic arthritis. Expert Rev Clin Pharmacol. 2014;7:239-250.
Practice Points
- Most patients with psoriasis are good candidates for topical treatment.
- Topical treatment of psoriasis often is ineffective.
- Topical treatment of psoriasis can be rapidly effective, even in patients who reported disease that was resistant to topical treatment.
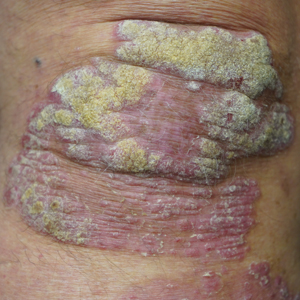
Betamethasone Dipropionate Spray 0.05% Alleviates Troublesome Symptoms of Plaque Psoriasis
Psoriasis affects approximately 2% to 3% of the US population and is characterized by plaques that are red, scaly, and elevated.1 Cutaneous symptoms of the disease are described by patients as itching, burning, and stinging sensations. Large multinational and US surveys have reported pruritus as patients’ most bothersome symptom, with scaling/flaking reported as the second most bothersome.2,3 Reported incidence rates for itching range from 60.4% to 98.3%, with at least half of these patients reporting daily or constant pruritus.2,4-7 Consequent effects on quality of life include impaired sleep,6 difficulty concentrating, lower sex drive, and depression.7 Despite these findings, pruritus is rarely included in the efficacy assessments of psoriasis treatments. In addition, 2 of the most commonly reported but difficult-to-treat locations for plaques are the outside of the elbows (45%) and the knees (32%),1,2,8 areas where the stratum corneum typically is thicker, less hydrated, and less likely to absorb topical products.9-11 Clinical studies have not focused specifically on these areas when assessing treatments.
Topical corticosteroids have been the mainstay of psoriasis therapy for decades because of their anti-inflammatory and antiproliferative properties.7 One large multinational physician survey indicated that 75% of patients are prescribed topical steroids,12 which are important for first-line treatment and are often maintained as adjunctive therapy in combination with other treatments for patients with extensive disease or recalcitrant lesions.13 Topical corticosteroids are ranked into different classes based on their vasoconstrictor assay (VCA), a measure of skin blanching used as a marker for vasoconstriction. Topical agents with VCA ratings of mid-potency or superpotency are generally recommended for initial therapy, with superpotent agents required for the treatment of thick chronic plaques. However, longer durations of use may contribute to systemic absorption and adverse events.13 The vehicle composition is important for corticosteroid delivery and retention at the site of pathology, contributing to the efficacy of the steroid.13,14 Selecting the appropriate steroid and vehicle is important to maximize efficacy and minimize adverse events.
Betamethasone dipropionate (BD) spray 0.05% is an emollient formulation of 0.05% BD that can be sprayed onto psoriatic plaques. The BD spray formulation was designed to penetrate the stratum corneum and be retained within the dermis and epidermis, the site of T-cell activity that drives the psoriatic disease process.14 In 2 phase 3 studies, BD spray demonstrated the ability to reduce the signs of plaque psoriasis with indication of improvement by day 4.15,16 These studies also showed improvement in the local cutaneous symptoms of itching, burning and stinging, and pain. As a mid-potent steroid, BD spray displays less systemic absorption but similar efficacy compared to a superpotent augmented BD (AugBD) lotion in relieving the signs and symptoms of plaque psoriasis.15-17
The objective of the current investigation was to assess the ability of BD spray to relieve itching and to clear plaque psoriasis on the knees and elbows utilizing post hoc analyses of the 2 phase 3 trials. The goal of these analyses was to demonstrate BD spray as effective at relieving the most troublesome signs and symptoms affecting patients with plaque psoriasis.
Methods
Two phase 3 studies were conducted to demonstrate the efficacy and safety of BD spray.15,16 The design of the studies was similar15,16 to allow the data to be pooled for post hoc analyses.
Both were US multicenter, randomized, vehicle-controlled, double-blind, parallel-group studies comparing the safety and efficacy of BD spray 0.05% (Sernivo, Promius Pharma) with its vehicle formulation spray (identical to BD spray, but lacking the active steroid component).15,16 One of the studies also compared BD spray with an AugBD lotion 0.05% (Diprolene,Merck & Co). Adults with moderate plaque psoriasis (investigator global assessment of 3; 10%–20% body surface area) were randomized to apply BD spray, vehicle spray, or AugBD lotion (1 study only) twice daily to all affected areas, excluding the face, scalp, and intertriginous areas for 28 days (BD spray and vehicle) or 14 days (AugBD lotion, per product label).15
Assessments
Two post hoc analyses were conducted on data pooled from the 2 phase 3 trials: (1) incidence of itching, and (2) total sign score (TSS) for lesions located on the knees and elbows.
Itching
Itching was assessed proactively by asking patients if they were experiencing itching (yes/no) at each visit (baseline and days 4, 8, 15, and 29) or had experienced itching since their last visit. As itching could be an adverse event of topical application, application-site pruritus was also recorded.
Total Sign Score
For each patient, a target plaque was selected that was representative of their psoriasis. The plaque was assessed on a 3-point grading scale for each of 3 key signs of plaque psoriasis: erythema, scaling, and plaque elevation (Table 1) at baseline and days 4, 8, 15, and 29. Total sign score was calculated by summing the scores for these 3 signs, resulting in a score ranging from 0 to 9. Treatment success was measured as (1) achieving a score of 0 or 1 (ie, reducing the plaque to clear or slight to mild) for the individual signs of erythema, scaling, and plaque elevation; and (2) achieving a TSS of 0 or 1 for all 3 signs—erythema, scaling, and plaque elevation—for each target lesion. Total sign score was assessed proactively for all patients.15,16 The post hoc analysis reported here examined patients whose target lesion was located on either the knee or the elbow.
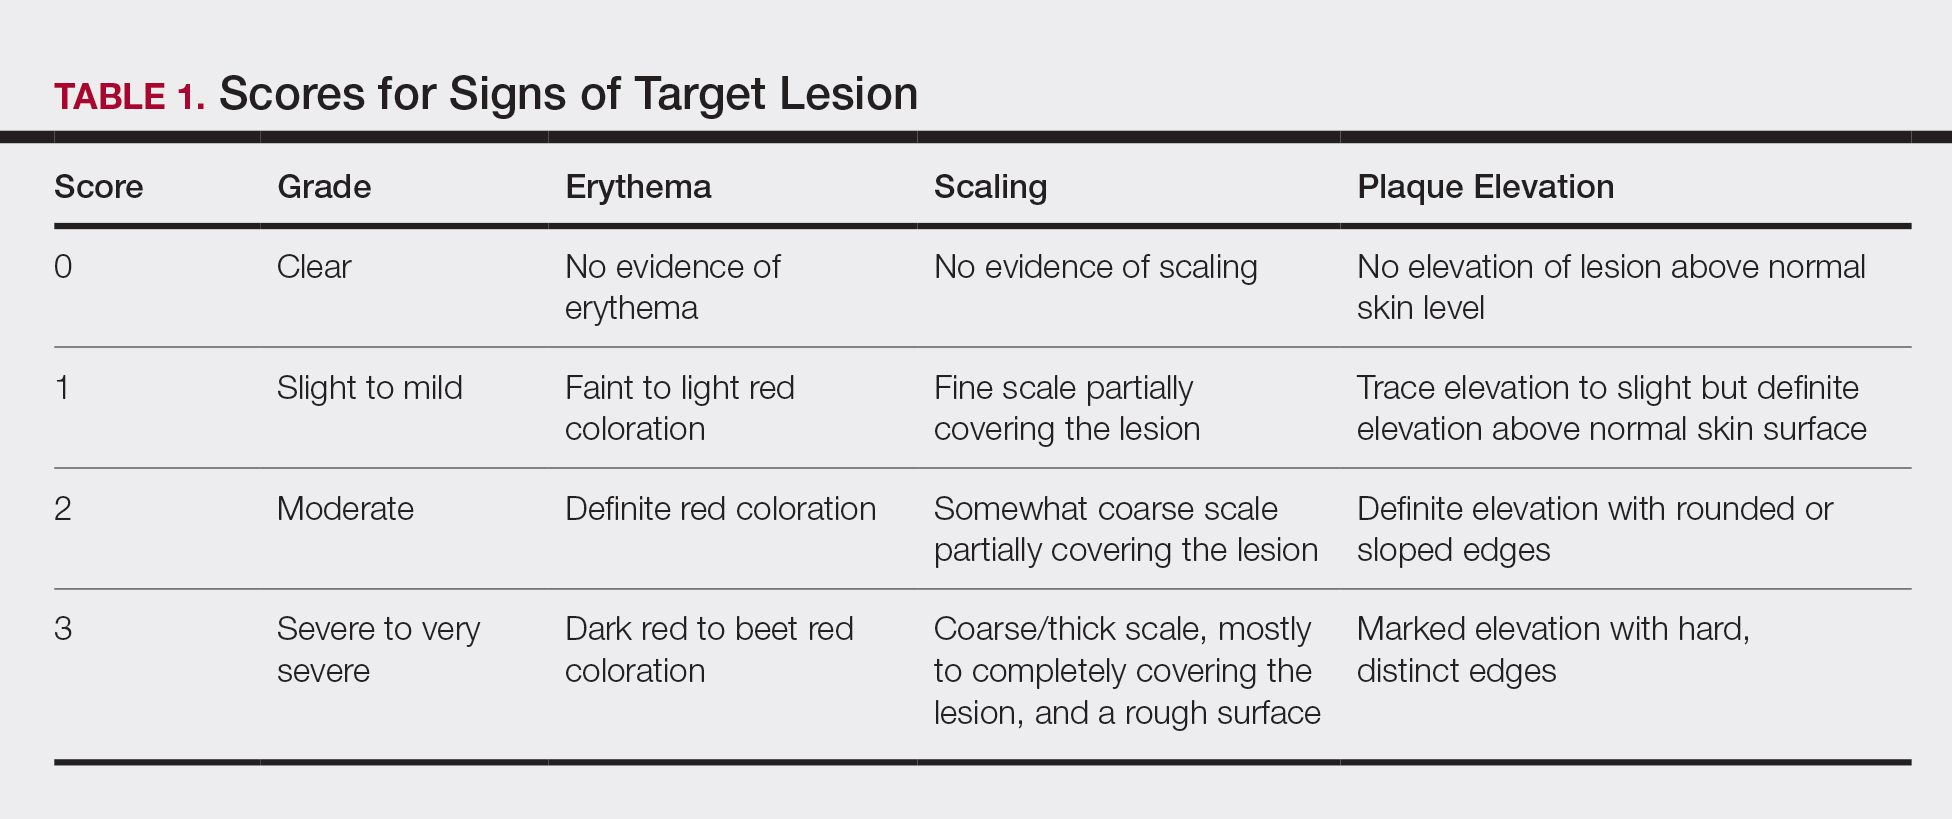
Statistical Analyses
Because both study protocols were identical, data were pooled from the 2 phase 3 trials. All statistical analyses were performed using SAS software (SAS Institute). Two-sided hypothesis testing was conducted for all analyses using a significance level of P=.05. Post hoc analyses used Fisher exact test. No imputations were made for missing data.
Statistical analyses of itching compared the incidence of itching at each assessment time point (baseline and days 4, 8, 15, and 29) between BD spray and vehicle and between BD spray and AugBD lotion. Additional analysis included a statistical test on the incidence of itching in the subgroup of patients who reported itching at baseline.
Statistical analyses for the knees and elbows included only patients with their target lesion located on either the knee or the elbow. Analyses compared BD spray with vehicle and BD spray with AugBD lotion at days 4, 8, 15, and 29. Comparison with AugBD lotion treatment was up to day 14 only, consistent with application time limits in the AugBD lotion product label.18
Results
These analyses included data from the 628 patients enrolled in the 2 phase 3 trials. Patients had similar baseline characteristics across treatment groups (Table 2). Itching was the most common cutaneous symptom at baseline, reported by almost two-thirds (n=392, 62.4%) of patients. Of the 628 patients, 236 (37.6%) had a target lesion located on the elbow or knee selected for assessment. The mean baseline body surface area was 13% to 14% across groups.
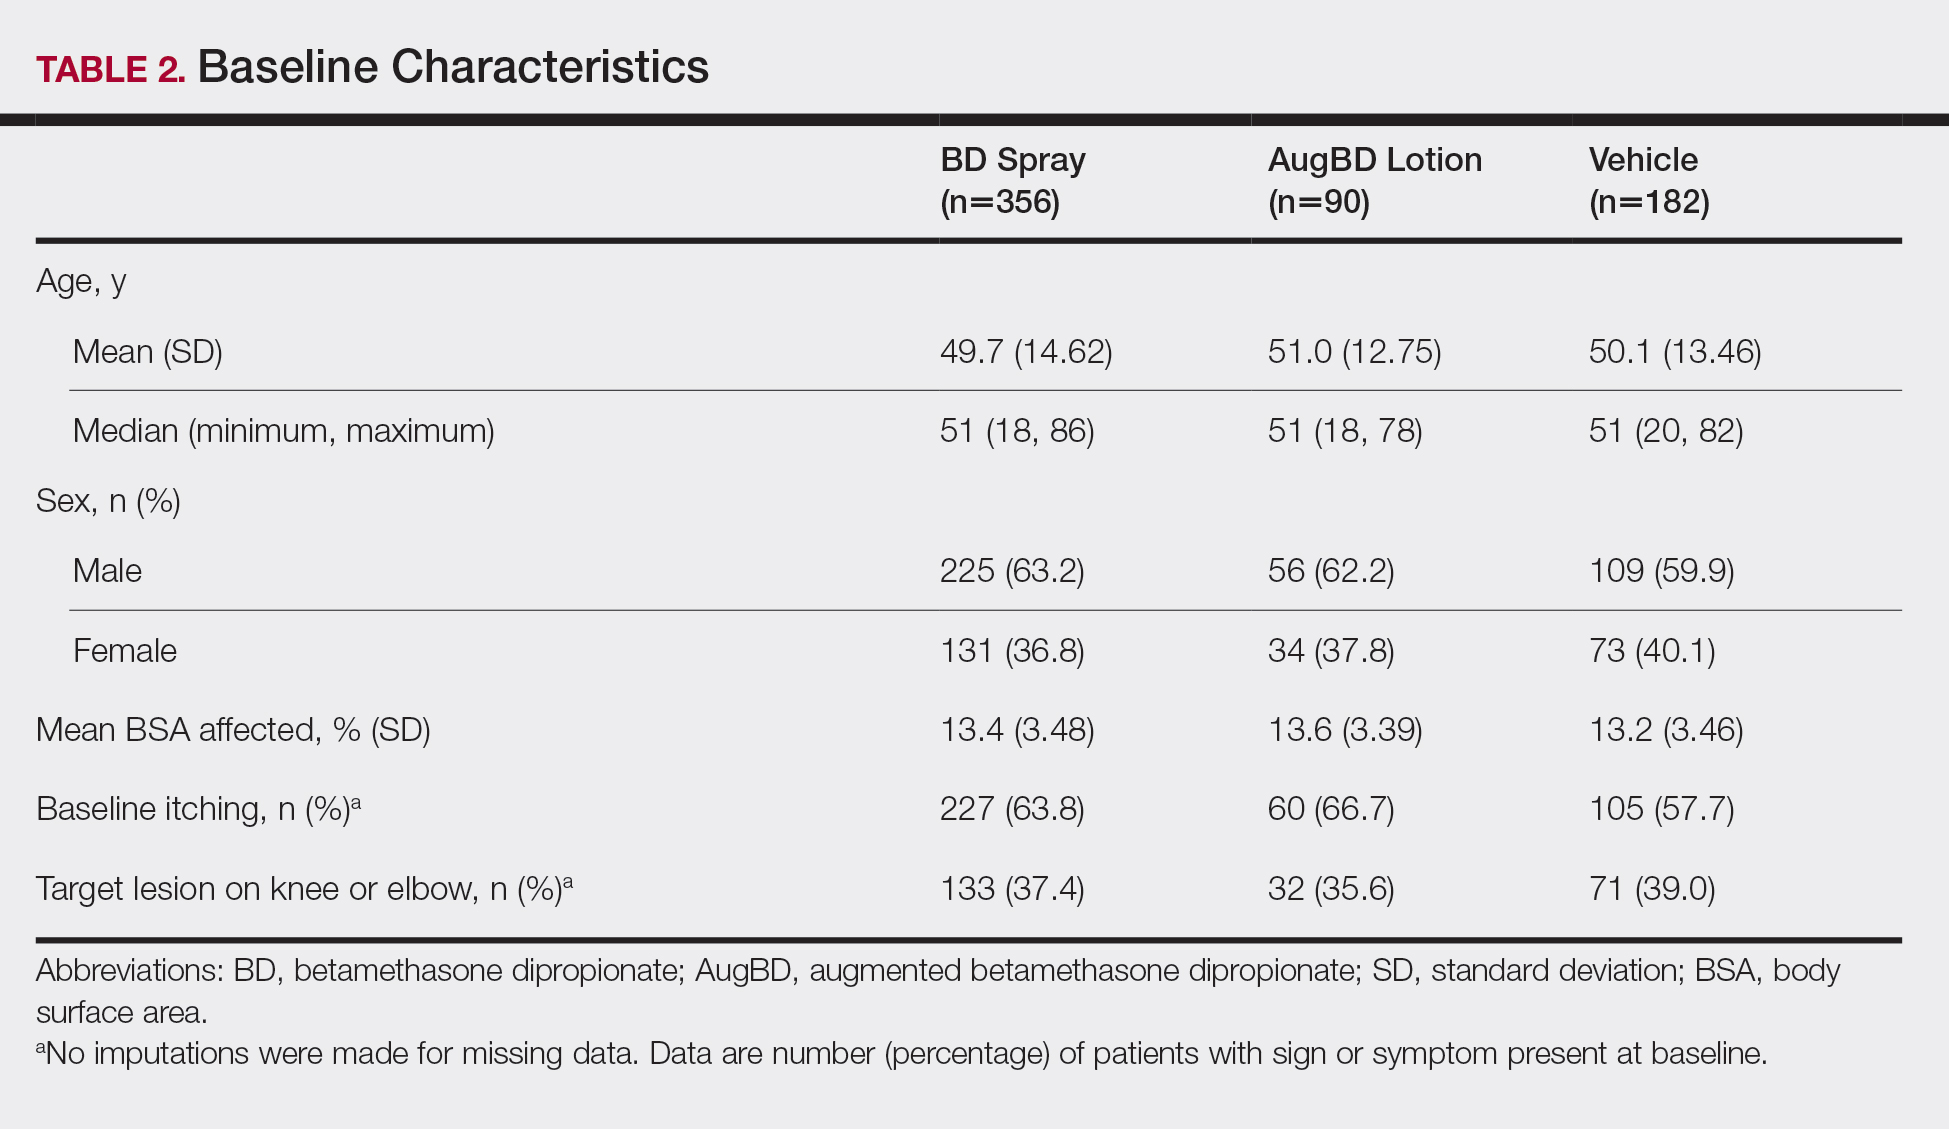
A post hoc analysis was performed on the subgroup of patients who reported itching at baseline (N=392)(eFigure 1). For these patients, almost half were itch free by day 4 across all groups (49.3% BD spray, 48.2% AugBD lotion, and 47.4% vehicle). By the end of treatment, 65.9% of patients using BD spray and 58.3% of patients using vehicle were itch free at day 29, with 56.9% of AugBD lotion patients itch free at day 15.
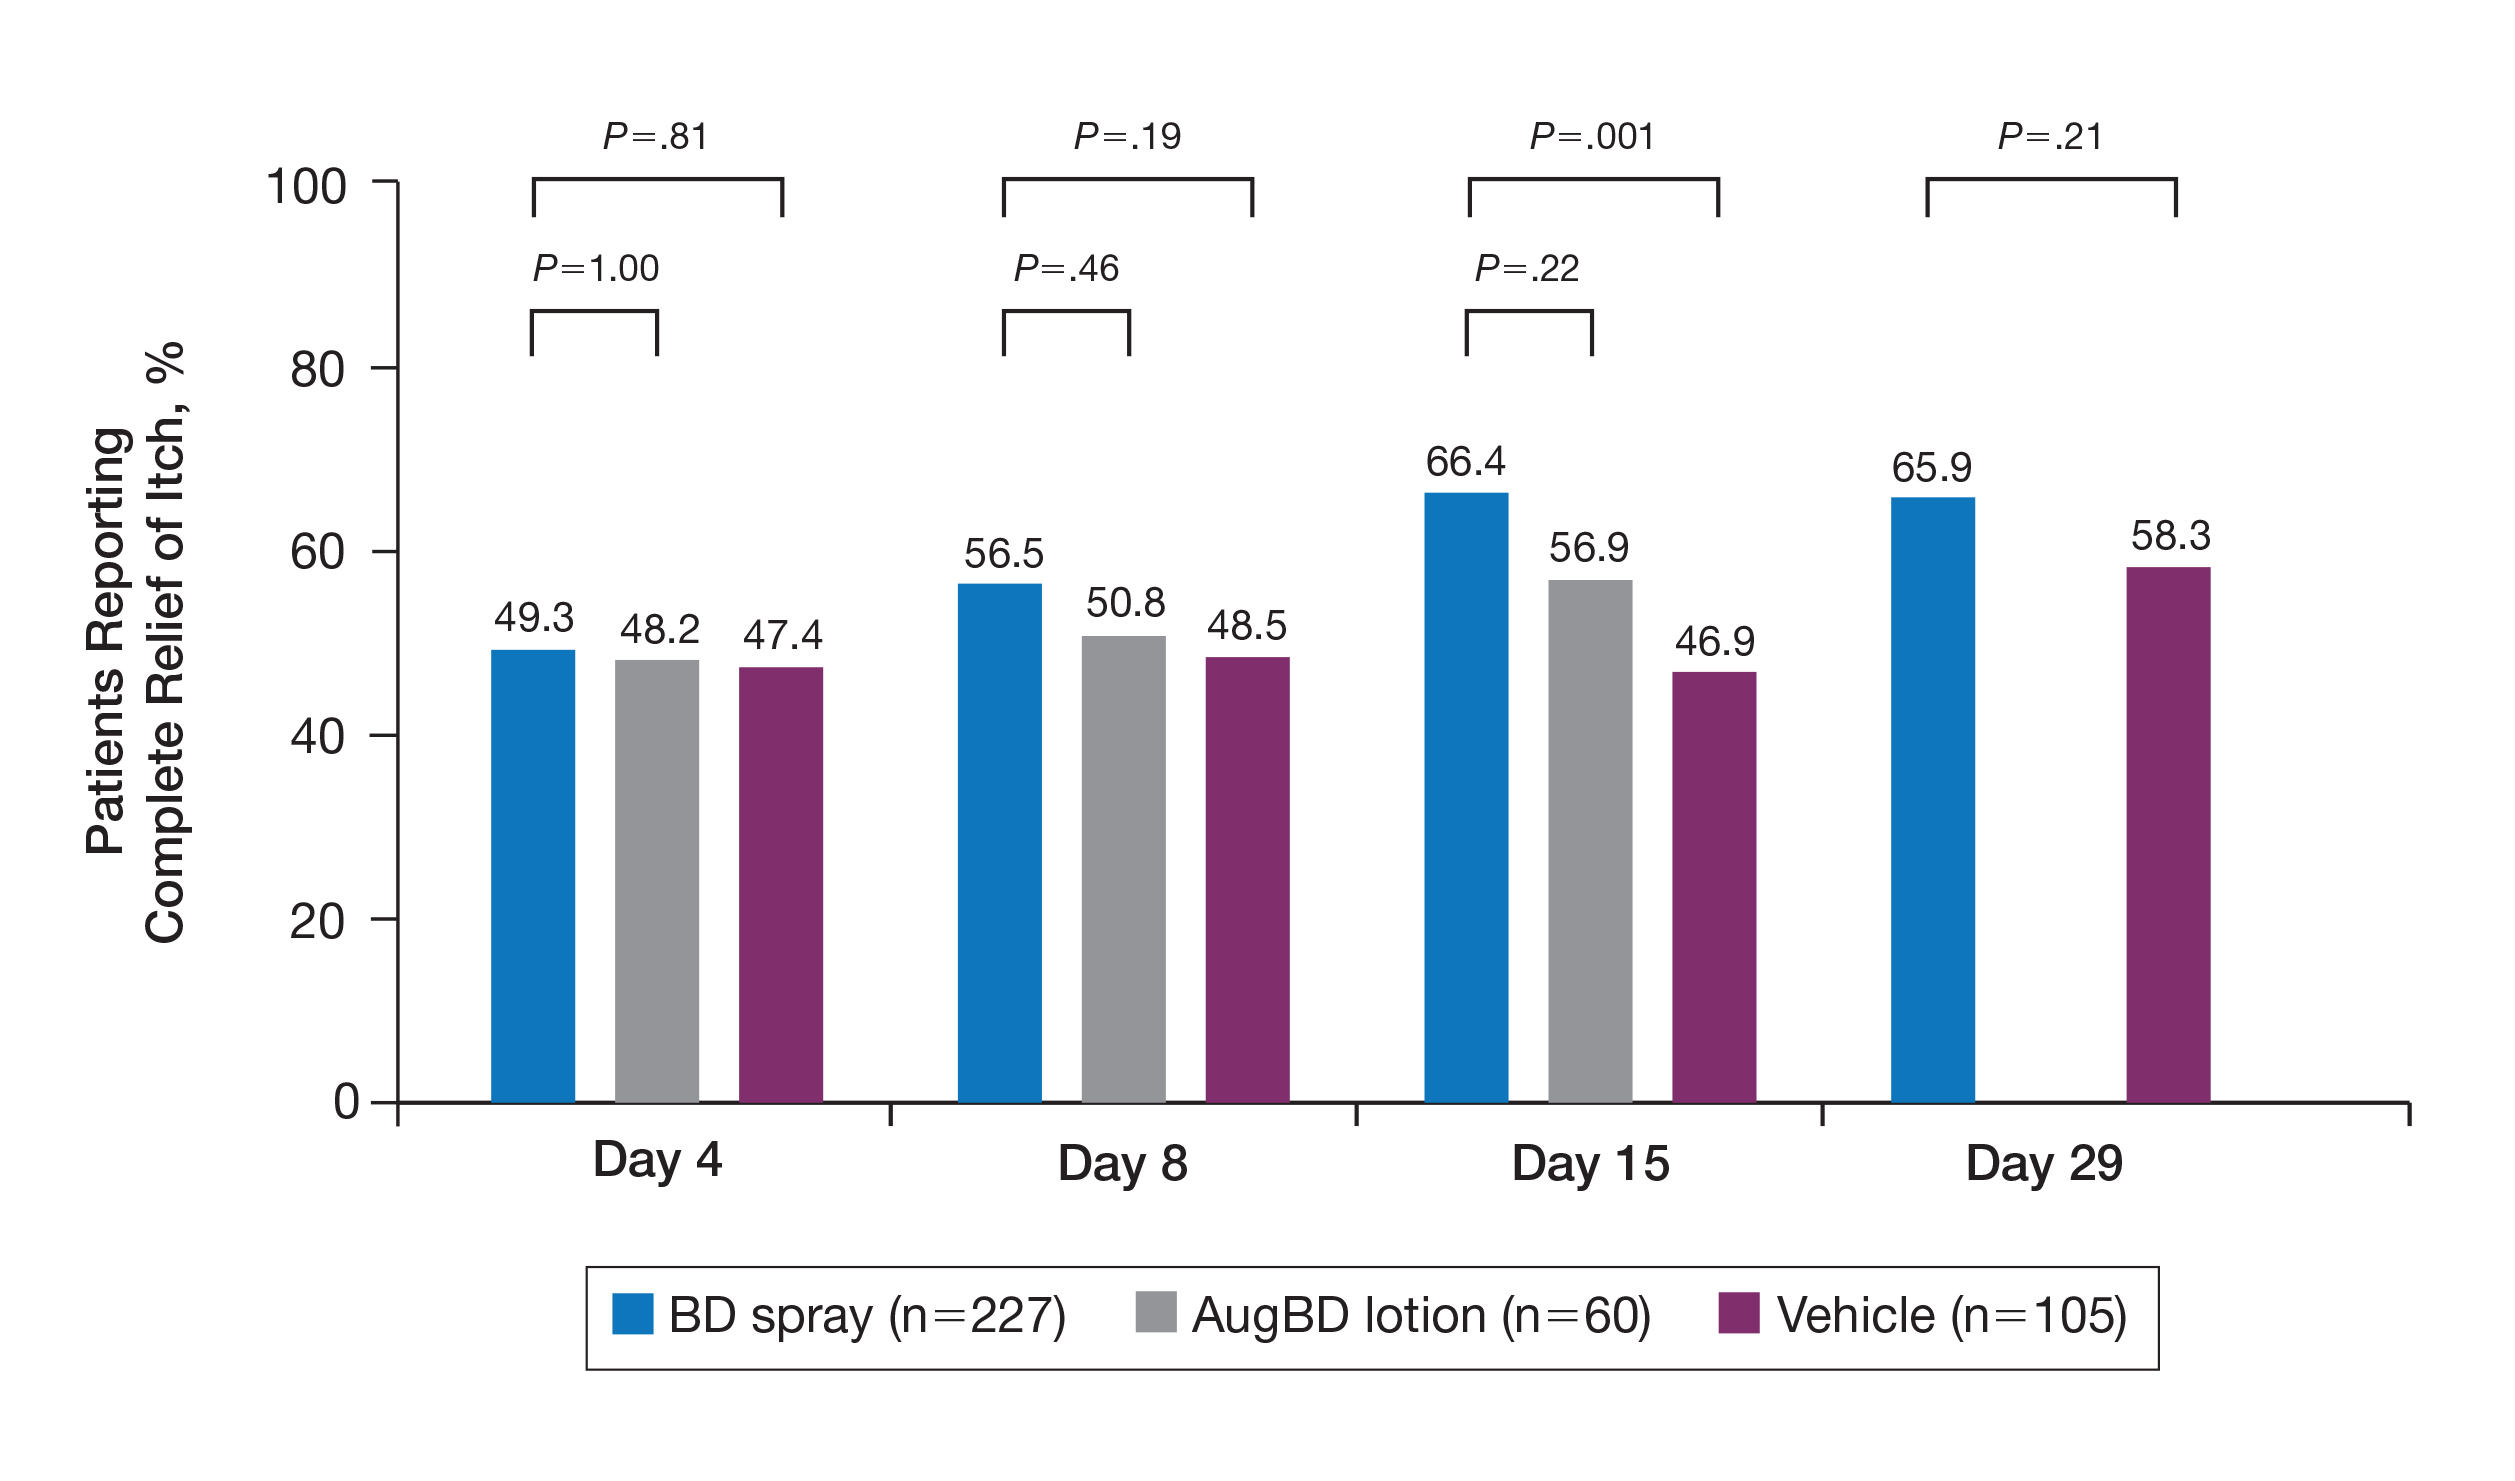
Application-site pruritus recorded as a treatment-emergent adverse event was seen in low numbers and was similar in proportion between the 2 steroid treatments (7.7% BD spray, 6.7% AugBD lotion, and 14.4% vehicle).
Psoriasis Individual Sign Scores for Knee and Elbow Plaques
Target lesions located on the knee or elbow represented 37.6% of all target lesions assessed. Efficacy analysis of the pooled data on knee and elbow lesions revealed that BD spray was similar to AugBD lotion in reducing sign scores to 0 or 1 (Figures 1 and 2).
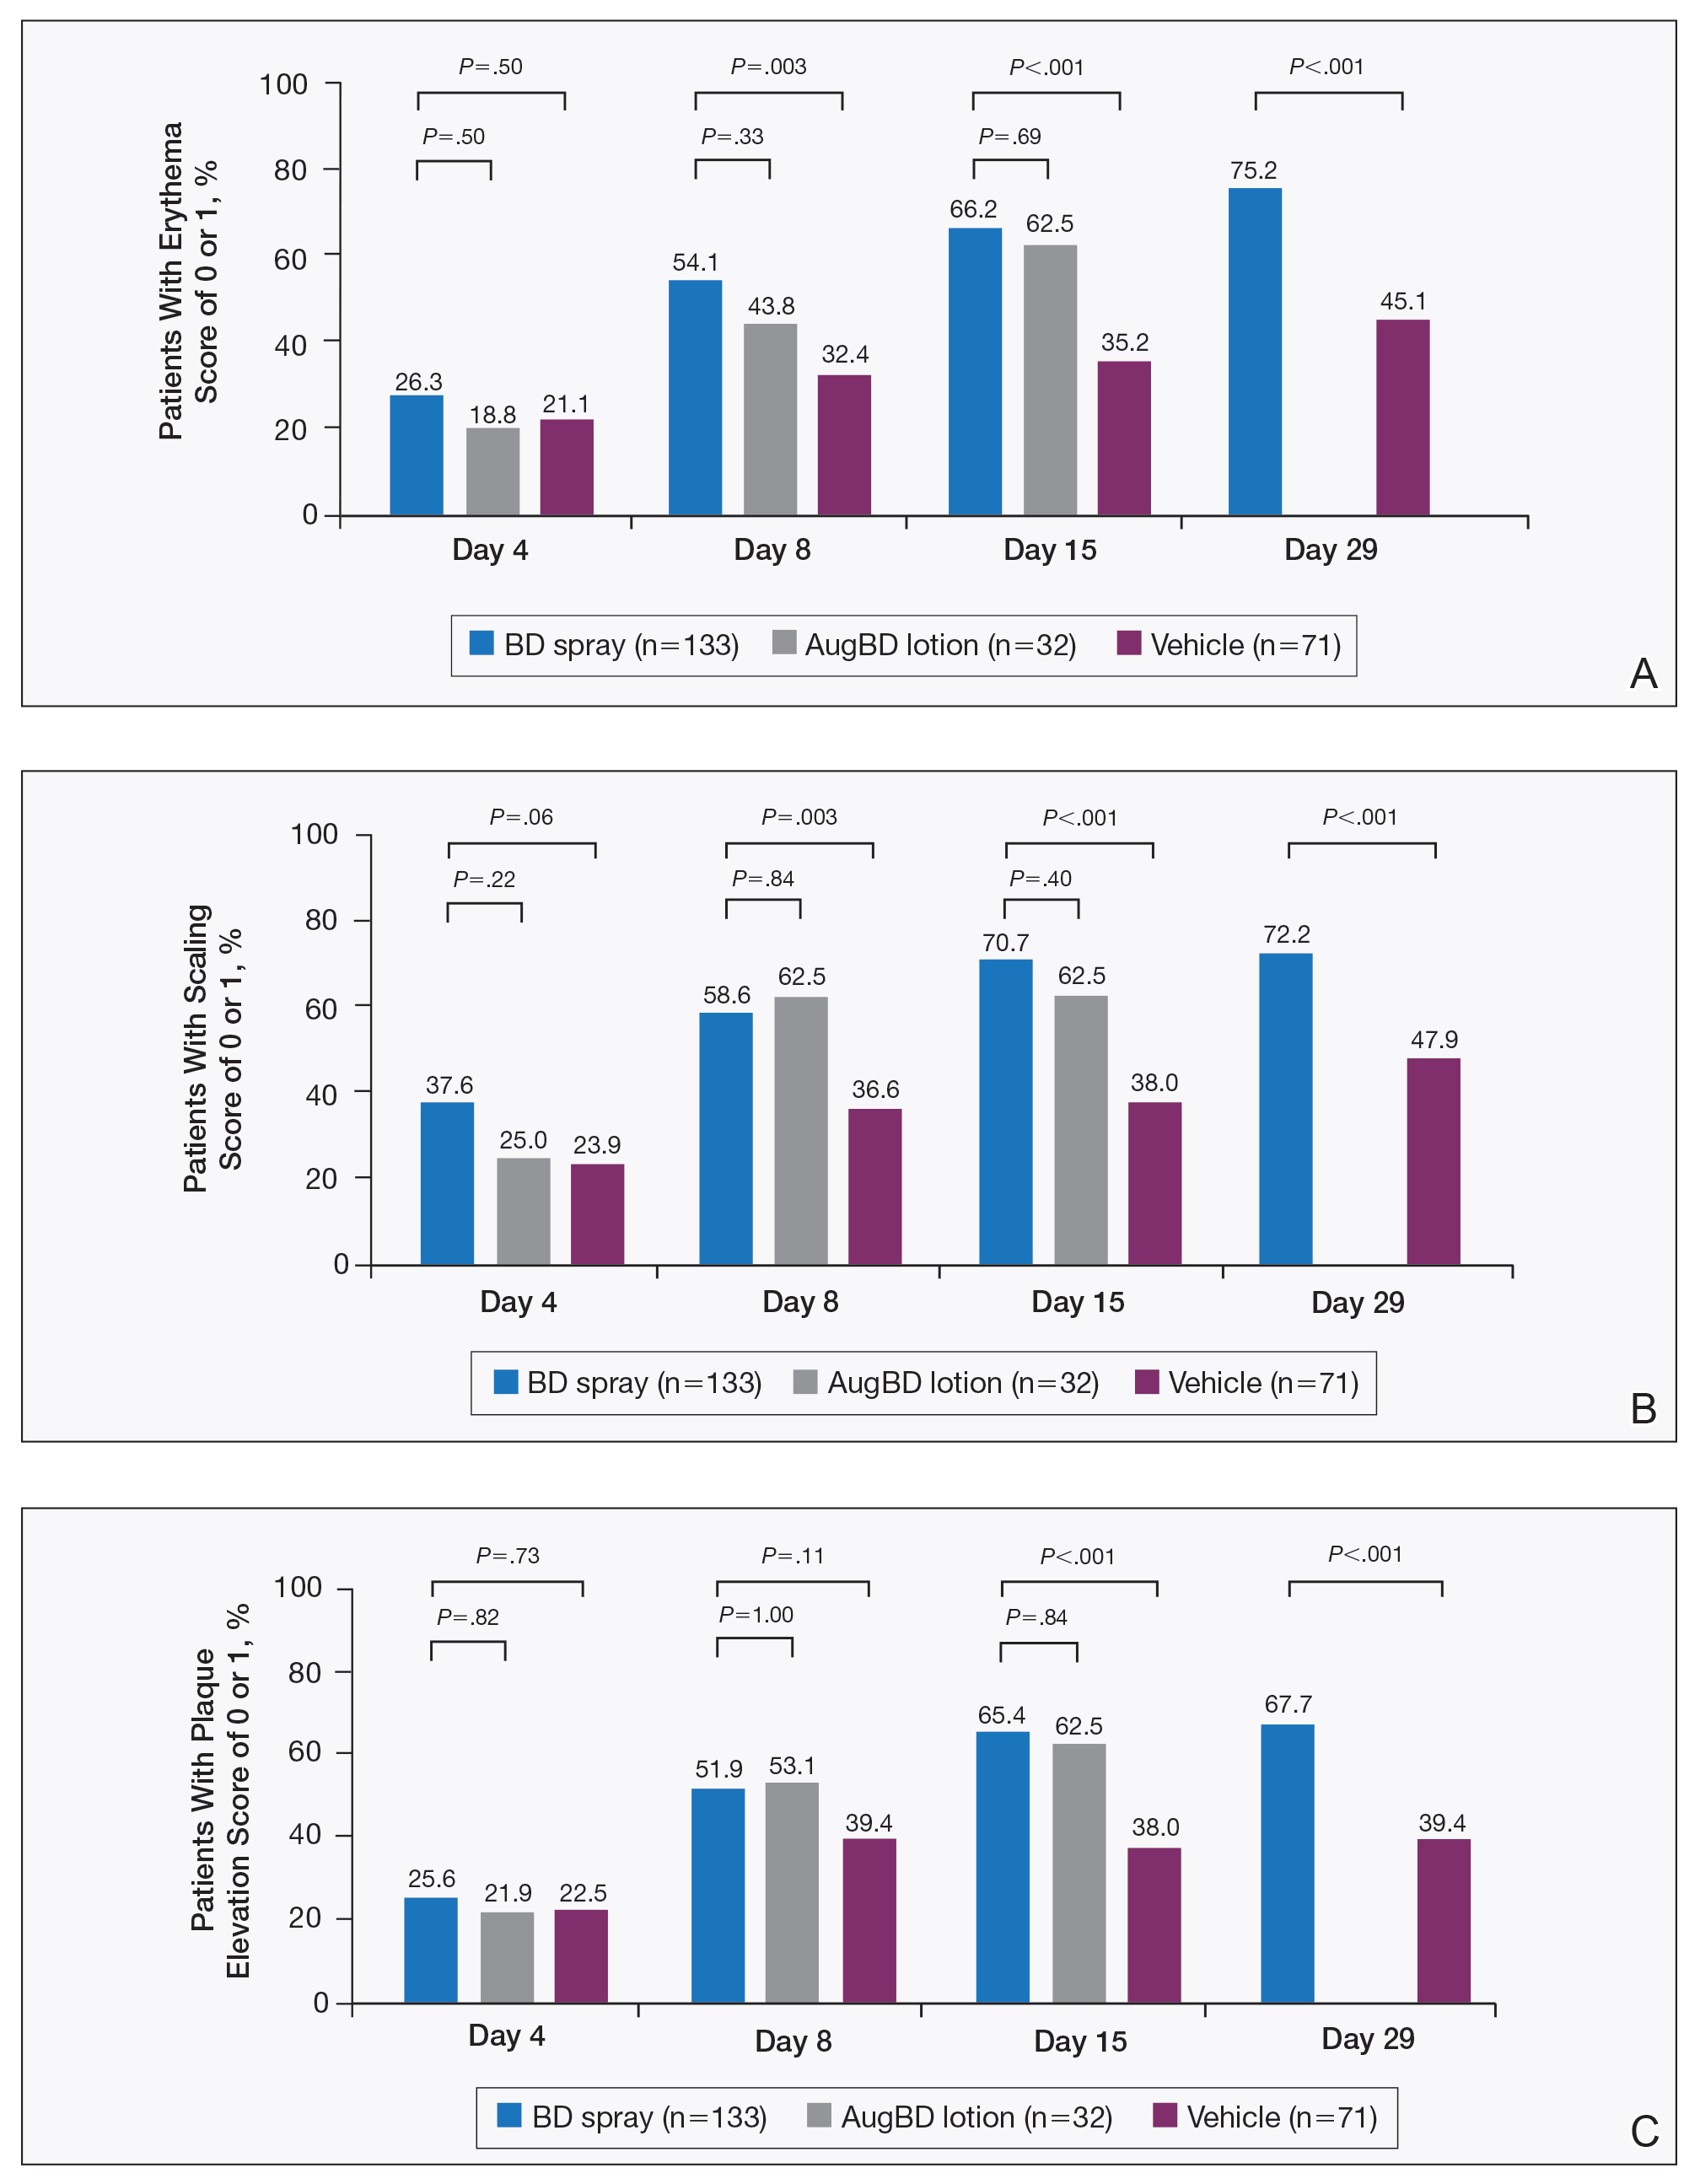
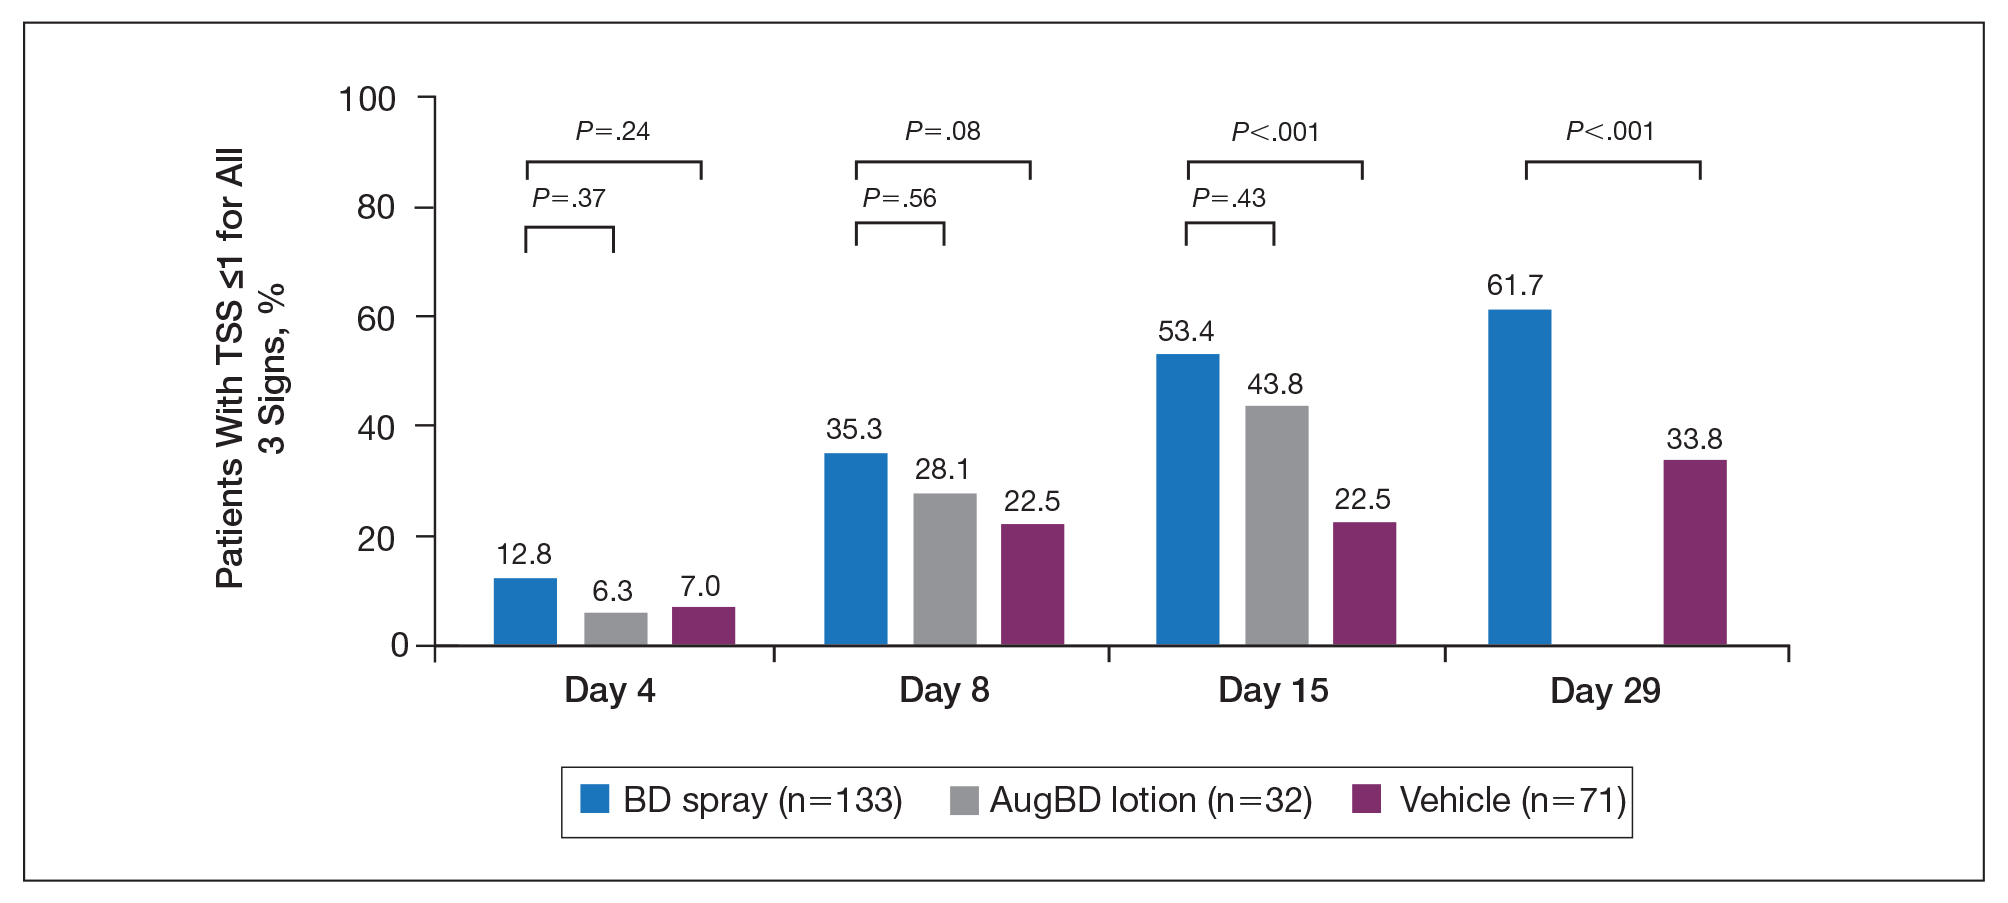
The percentage of patients reporting improvements in erythema, scaling, and plaque elevation scores at day 4
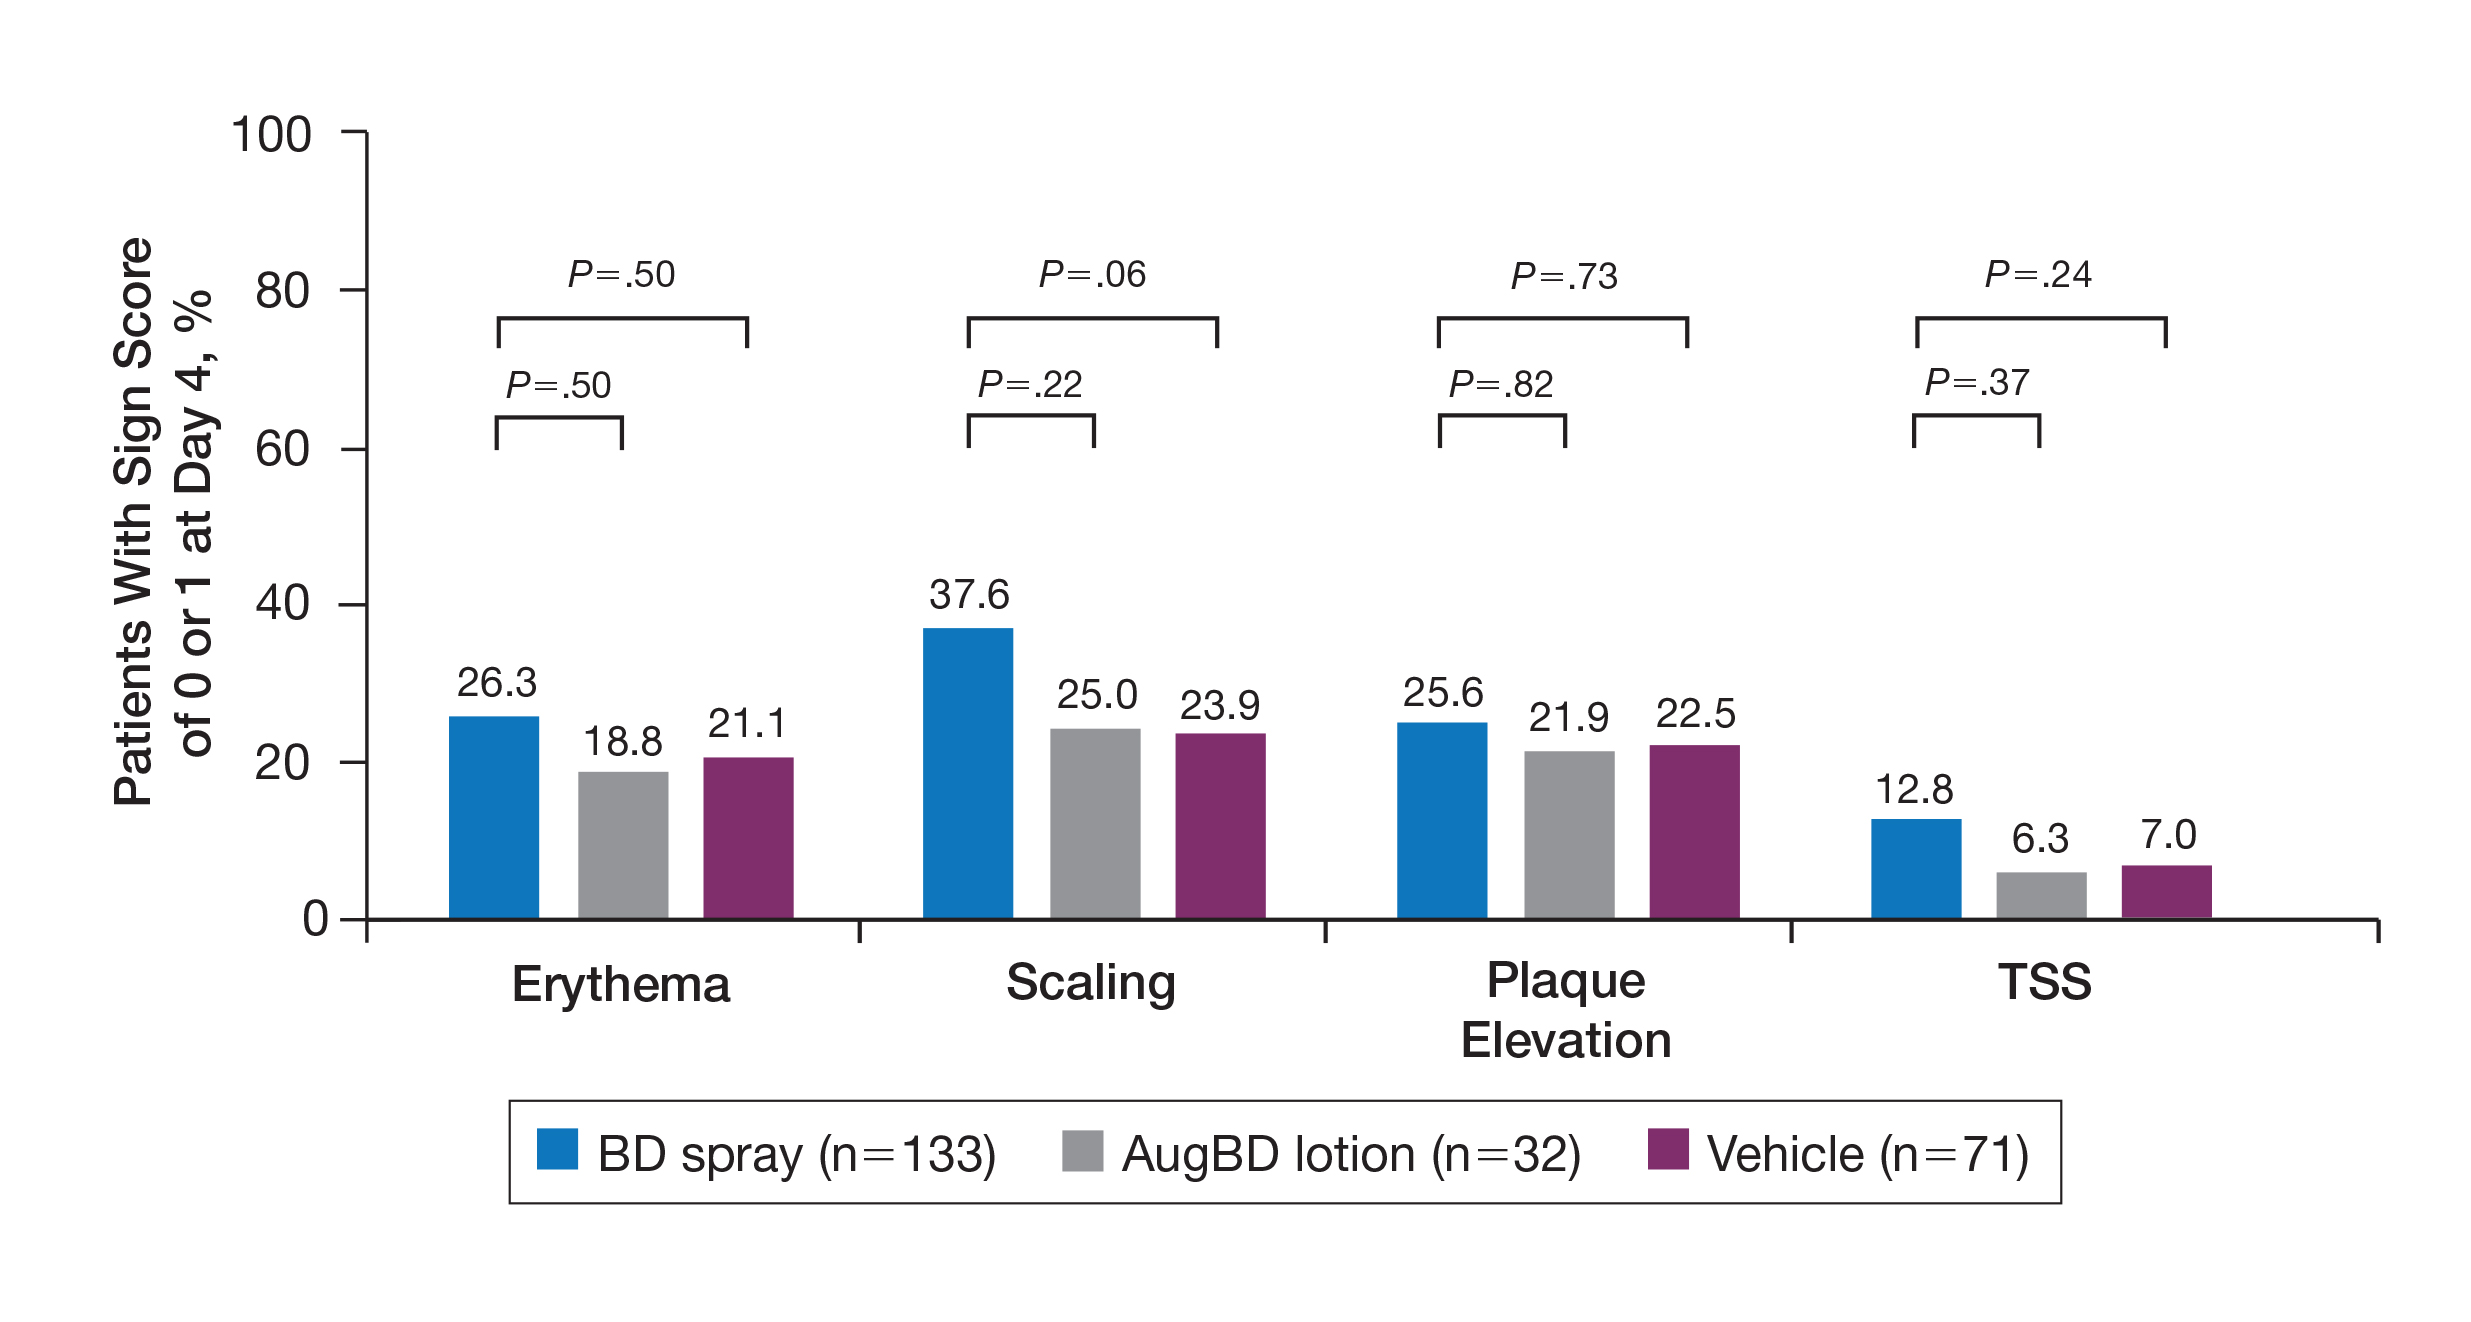
The proportion of patients achieving treatment success (defined as a score of 0 or 1) was comparable for the2 products on day 15 for erythema (66.2% BD spray vs 62.5% AugBD lotion), scaling (70.7% BD spray vs 62.5% AugBD lotion), and plaque elevation (65.4% BD spray vs 62.5% AugBD lotion)(Figure 1). From day 8, BD spray reduced erythema and scaling in significantly more patients than vehicle (P=.003 for both), and BD spray reduced erythema, scaling, and plaque elevation in more patients than vehicle from day 15 (P<.001 for all). No statistically significant difference was found between BD spray and AugBD lotion on erythema, scaling, and plaque elevation scores.
Total Sign Score
Total sign score results showed that the mean percentage of patients achieving a TSS of 0 or 1 for all signs for lesions located on the knees or elbows was numerically higher for BD spray vs AugBD lotion at day 4, but this difference was not statistically significant (Figure 2). Day 15 outcomes for TSS also showed a numerically greater success rate for BD spray, but again this difference was not statistically significant (53.4% BD spray vs 43.8% AugBD lotion). At days 15 and 29, significantly more patients treated with BD spray achieved TSS of 0 or 1 for all 3 signs compared to those treated with vehicle (P<.001). Improvement in TSS with BD spray continued through to day 29 of the study.
Comment
In these post hoc analyses, mid-potency BD spray demonstrated early relief of itching and early efficacy in the treatment of psoriasis plaques on the elbows and knees with minimal systemic absorption and a low rate of adverse events.
Betamethasone dipropionate spray and its vehicle formulation relieved psoriatic itching with similar efficacy to the superpotent AugBD steroid lotion. Notably, relief was rapid, with approximately half of responding patients reporting relief of itching by day 4. The results seen with vehicle suggest that the emollient formulation of BD spray is responsible for hydrating dry skin, contributing to the relief of this cutaneous symptom. Dry skin can exacerbate itching, and emollients are recognized as being able to alleviate itching by hydrating and soothing the skin.7
The second set of post hoc analyses reported here demonstrated that BD spray was efficacious in clearing the signs of psoriatic lesions on the difficult-to-treat areas of the knees and elbows. Efficacy with BD spray was similar to the superpotent steroid AugBD lotion, with no statistical difference between the 2 products at any time point. Betamethasone dipropionate spray was significantly more effective than its vehicle in reducing the signs of erythema and scaling from day 8 and plaque elevation from day 15.
Rapid relief of symptoms is important for patient comfort and to improve treatment adherence. These analyses showed that by day 4, BD spray resulted in numerically higher percentages of patients achieving a score of 0 or 1 for the individual signs of erythema, scaling, and plaque elevation compared to AugBD lotion. Of particular note, 37.6% of patients treated with BD spray had scaling scores of clear or almost clear by day 4 compared to 25.0% of patients treated with AugBD lotion. Scaling has been consistently reported as the second most bothersome symptom experienced by patients2,3 and has been shown to be associated with decreased quality of life and work productivity.19
Betamethasone dipropionate spray has a rationally designed vehicle, with the formulation selected specifically to maximize penetration of the product through the stratum corneum and retention of BD steroid in the epidermis and upper dermis while reducing absorption into the systemic circulation.14 The reduced absorption into the systemic circulation leads to less vasoconstriction; fewer adverse events; and a “medium potent” VCA designation compared to the “superpotent” designation of the AugBD formulation, despite containing the same active ingredient.
These analyses demonstrate that BD spray is effective at addressing 2 symptoms that patients with psoriasis consider most bothersome: itching and scaling. Notably, BD spray was able to achieve these results rapidly, with many patients experiencing improvements in 4 days. In these analyses, mid-potent BD spray demonstrated similar efficacy to AugBD lotion, a superpotent steroid formulation.
This analysis is limited by being post hoc. Although the statistical methodology is valid, the AugBD lotion arm of the analyses was relatively small compared with the BD spray and vehicle arms, as it was only included in 1 of 2 studies pooled.
Conclusion
Mid-potency BD spray effectively improved the symptom of itching and cleared hard-to-treat lesions on knees and elbows with efficacy similar to a superpotent AugBD formulation but with less systemic absorption. Improvements were seen in erythema, scaling, and plaque elevation. Reductions in psoriatic signs were observed as early as day 4, with continued improvement seen throughout the study period. These findings provide evidence that BD spray can rapidly relieve 2 of the most troublesome symptoms affecting patients with psoriasis (itching and scaling), potentially improving quality of life.
Acknowledgments
The authors wish to thank Alix Bennett, PhD, formerly of Promius Pharma, a subsidiary of Dr. Reddy’s Laboratories, Inc (Princeton, New Jersey), and Jodie Macoun, PhD, of CUBE Information (Katonah, New York), for their review and assistance with the preparation of this manuscript. Manuscript preparation was supported by Promius Pharma (Princeton, New Jersey)(DRL #866).
- About psoriasis. National Psoriasis Foundation website. https://www.psoriasis.org/about-psoriasis. Accessed October 1, 2019.
- Lebwohl MG, Bachelez H, Barker J, et al. Patient perspectives in the management of psoriasis: results from the population-based Multinational Assessment of Psoriasis and Psoriatic Arthritis Survey. J Am Acad Dermatol. 2014;70:871-881.e1-30.
- Pariser D, Schenkel B, Carter C, et al; Psoriasis Patient Interview Study Group. A multicenter, non-interventional study to evaluate patient-reported experiences of living with psoriasis. J Dermatolog Treat. 2016;27:19-26.
- Dickison P, Swain G, Peek JJ, et al. Itching for answers: prevalence and severity of pruritus in psoriasis. Australas J Dermatol. 2018;59:206-209.
- Bahali AG, Onsun N, Su O, et al. The relationship between pruritus and clinical variables in patients with psoriasis. An Bras Dermatol. 2017;92:470-473.
- Prignano F, Ricceri F, Pescitelli L, et al. Itch in psoriasis: epidemiology, clinical aspects and treatment options. Clin Cosmet Investig Dermatol. 2009;2:9-13.
- Dawn A, Yosipovitch G. Treating itch in psoriasis. Dermatol Nurs. 2006;18:227-233.
- Queille-Roussel C, Rosen M, Clonier F, et al. Efficacy and safety of calcipotriol plus betamethasone dipropionate aerosol foam compared with betamethasone 17-valerate-medicated plaster for the treatment of psoriasis. Clin Drug Investig. 2017;37:355-361.
- Betesil [package insert]. Lodi, Italy: IBSA Pharmaceutici Italia S.r.I; 2013.
- Cannavò SP, Guarneri F, Giuffrida R, et al. Evaluation of cutaneous surface parameters in psoriatic patients. Skin Res Technol. 2017;23:41-47.
- Egawa M, Arimoto H, Hirao T, et al. Regional difference of water content in human skin studied by diffuse-reflectance near-infrared spectroscopy: consideration of measurement depth. Appl Spectrosc. 2006;60:24-28.
- van de Kerkhof PC, Reich K, Kavanaugh A, et al. Physician perspectives in the management of psoriasis and psoriatic arthritis: results from the population-based Multinational Assessment of Psoriasis and Psoriatic Arthritis survey. J Eur Acad Dermatol Venereol. 2015;29:2002-2010.
- Menter A, Korman NJ, Elmets CA, et al; American Academy of Dermatology. Guidelines of care for the management of psoriasis and psoriatic arthritis. section 3. guidelines of care for the management and treatment of psoriasis with topical therapies. J Am Acad Dermatol. 2009;60:643-659.
- Kircik L, Okumu F, Kandavilli S, et al. Rational vehicle design ensures targeted cutaneous steroid delivery. J Clin Aesthet Dermatol. 2017;10:12-19.
- Fowler JF Jr, Herbert AA, Sugarman J. DFD-01, a novel medium potency betamethasone dipropionate 0.05% emollient spray, demonstrates similar efficacy to augmented betamethasone dipropionate 0.05% lotion for the treatment of moderate plaque psoriasis. J Drugs Dermatol. 2016;15:154-162.
- Stein Gold L, Jackson JM, Knuckles ML, et al. Improvement in extensive moderate plaque psoriasis with a novel emollient spray formulation of betamethasone dipropionate 0.05. J Drugs Dermatol. 2016;15:334-342.
- Sidgiddi S, Pakunlu RI, Allenby K. Efficacy, safety, and potency of betamethasone dipropionate spray 0.05%: a treatment for adults with mild-to-moderate plaque psoriasis. J Clin Aesthet Dermatol. 2018;11:14-22.
- Diprolene Lotion (augmented betamethasone dipropionate 0.05%) [package insert]. Kenilworth, NJ: Schering Corporation; 1999.
- Korman NJ, Zhao Y, Pike J, et al. Increased severity of itching, pain, and scaling in psoriasis patients is associated with increased disease severity, reduced quality of life, and reduced work productivity. Dermatol Online J. 2015;21. pii:13030/qt1x16v3dg.
Psoriasis affects approximately 2% to 3% of the US population and is characterized by plaques that are red, scaly, and elevated.1 Cutaneous symptoms of the disease are described by patients as itching, burning, and stinging sensations. Large multinational and US surveys have reported pruritus as patients’ most bothersome symptom, with scaling/flaking reported as the second most bothersome.2,3 Reported incidence rates for itching range from 60.4% to 98.3%, with at least half of these patients reporting daily or constant pruritus.2,4-7 Consequent effects on quality of life include impaired sleep,6 difficulty concentrating, lower sex drive, and depression.7 Despite these findings, pruritus is rarely included in the efficacy assessments of psoriasis treatments. In addition, 2 of the most commonly reported but difficult-to-treat locations for plaques are the outside of the elbows (45%) and the knees (32%),1,2,8 areas where the stratum corneum typically is thicker, less hydrated, and less likely to absorb topical products.9-11 Clinical studies have not focused specifically on these areas when assessing treatments.
Topical corticosteroids have been the mainstay of psoriasis therapy for decades because of their anti-inflammatory and antiproliferative properties.7 One large multinational physician survey indicated that 75% of patients are prescribed topical steroids,12 which are important for first-line treatment and are often maintained as adjunctive therapy in combination with other treatments for patients with extensive disease or recalcitrant lesions.13 Topical corticosteroids are ranked into different classes based on their vasoconstrictor assay (VCA), a measure of skin blanching used as a marker for vasoconstriction. Topical agents with VCA ratings of mid-potency or superpotency are generally recommended for initial therapy, with superpotent agents required for the treatment of thick chronic plaques. However, longer durations of use may contribute to systemic absorption and adverse events.13 The vehicle composition is important for corticosteroid delivery and retention at the site of pathology, contributing to the efficacy of the steroid.13,14 Selecting the appropriate steroid and vehicle is important to maximize efficacy and minimize adverse events.
Betamethasone dipropionate (BD) spray 0.05% is an emollient formulation of 0.05% BD that can be sprayed onto psoriatic plaques. The BD spray formulation was designed to penetrate the stratum corneum and be retained within the dermis and epidermis, the site of T-cell activity that drives the psoriatic disease process.14 In 2 phase 3 studies, BD spray demonstrated the ability to reduce the signs of plaque psoriasis with indication of improvement by day 4.15,16 These studies also showed improvement in the local cutaneous symptoms of itching, burning and stinging, and pain. As a mid-potent steroid, BD spray displays less systemic absorption but similar efficacy compared to a superpotent augmented BD (AugBD) lotion in relieving the signs and symptoms of plaque psoriasis.15-17
The objective of the current investigation was to assess the ability of BD spray to relieve itching and to clear plaque psoriasis on the knees and elbows utilizing post hoc analyses of the 2 phase 3 trials. The goal of these analyses was to demonstrate BD spray as effective at relieving the most troublesome signs and symptoms affecting patients with plaque psoriasis.
Methods
Two phase 3 studies were conducted to demonstrate the efficacy and safety of BD spray.15,16 The design of the studies was similar15,16 to allow the data to be pooled for post hoc analyses.
Both were US multicenter, randomized, vehicle-controlled, double-blind, parallel-group studies comparing the safety and efficacy of BD spray 0.05% (Sernivo, Promius Pharma) with its vehicle formulation spray (identical to BD spray, but lacking the active steroid component).15,16 One of the studies also compared BD spray with an AugBD lotion 0.05% (Diprolene,Merck & Co). Adults with moderate plaque psoriasis (investigator global assessment of 3; 10%–20% body surface area) were randomized to apply BD spray, vehicle spray, or AugBD lotion (1 study only) twice daily to all affected areas, excluding the face, scalp, and intertriginous areas for 28 days (BD spray and vehicle) or 14 days (AugBD lotion, per product label).15
Assessments
Two post hoc analyses were conducted on data pooled from the 2 phase 3 trials: (1) incidence of itching, and (2) total sign score (TSS) for lesions located on the knees and elbows.
Itching
Itching was assessed proactively by asking patients if they were experiencing itching (yes/no) at each visit (baseline and days 4, 8, 15, and 29) or had experienced itching since their last visit. As itching could be an adverse event of topical application, application-site pruritus was also recorded.
Total Sign Score
For each patient, a target plaque was selected that was representative of their psoriasis. The plaque was assessed on a 3-point grading scale for each of 3 key signs of plaque psoriasis: erythema, scaling, and plaque elevation (Table 1) at baseline and days 4, 8, 15, and 29. Total sign score was calculated by summing the scores for these 3 signs, resulting in a score ranging from 0 to 9. Treatment success was measured as (1) achieving a score of 0 or 1 (ie, reducing the plaque to clear or slight to mild) for the individual signs of erythema, scaling, and plaque elevation; and (2) achieving a TSS of 0 or 1 for all 3 signs—erythema, scaling, and plaque elevation—for each target lesion. Total sign score was assessed proactively for all patients.15,16 The post hoc analysis reported here examined patients whose target lesion was located on either the knee or the elbow.
Statistical Analyses
Because both study protocols were identical, data were pooled from the 2 phase 3 trials. All statistical analyses were performed using SAS software (SAS Institute). Two-sided hypothesis testing was conducted for all analyses using a significance level of P=.05. Post hoc analyses used Fisher exact test. No imputations were made for missing data.
Statistical analyses of itching compared the incidence of itching at each assessment time point (baseline and days 4, 8, 15, and 29) between BD spray and vehicle and between BD spray and AugBD lotion. Additional analysis included a statistical test on the incidence of itching in the subgroup of patients who reported itching at baseline.
Statistical analyses for the knees and elbows included only patients with their target lesion located on either the knee or the elbow. Analyses compared BD spray with vehicle and BD spray with AugBD lotion at days 4, 8, 15, and 29. Comparison with AugBD lotion treatment was up to day 14 only, consistent with application time limits in the AugBD lotion product label.18
Results
These analyses included data from the 628 patients enrolled in the 2 phase 3 trials. Patients had similar baseline characteristics across treatment groups (Table 2). Itching was the most common cutaneous symptom at baseline, reported by almost two-thirds (n=392, 62.4%) of patients. Of the 628 patients, 236 (37.6%) had a target lesion located on the elbow or knee selected for assessment. The mean baseline body surface area was 13% to 14% across groups.
A post hoc analysis was performed on the subgroup of patients who reported itching at baseline (N=392)(eFigure 1). For these patients, almost half were itch free by day 4 across all groups (49.3% BD spray, 48.2% AugBD lotion, and 47.4% vehicle). By the end of treatment, 65.9% of patients using BD spray and 58.3% of patients using vehicle were itch free at day 29, with 56.9% of AugBD lotion patients itch free at day 15.
Application-site pruritus recorded as a treatment-emergent adverse event was seen in low numbers and was similar in proportion between the 2 steroid treatments (7.7% BD spray, 6.7% AugBD lotion, and 14.4% vehicle).
Psoriasis Individual Sign Scores for Knee and Elbow Plaques
Target lesions located on the knee or elbow represented 37.6% of all target lesions assessed. Efficacy analysis of the pooled data on knee and elbow lesions revealed that BD spray was similar to AugBD lotion in reducing sign scores to 0 or 1 (Figures 1 and 2).
The percentage of patients reporting improvements in erythema, scaling, and plaque elevation scores at day 4
The proportion of patients achieving treatment success (defined as a score of 0 or 1) was comparable for the2 products on day 15 for erythema (66.2% BD spray vs 62.5% AugBD lotion), scaling (70.7% BD spray vs 62.5% AugBD lotion), and plaque elevation (65.4% BD spray vs 62.5% AugBD lotion)(Figure 1). From day 8, BD spray reduced erythema and scaling in significantly more patients than vehicle (P=.003 for both), and BD spray reduced erythema, scaling, and plaque elevation in more patients than vehicle from day 15 (P<.001 for all). No statistically significant difference was found between BD spray and AugBD lotion on erythema, scaling, and plaque elevation scores.
Total Sign Score
Total sign score results showed that the mean percentage of patients achieving a TSS of 0 or 1 for all signs for lesions located on the knees or elbows was numerically higher for BD spray vs AugBD lotion at day 4, but this difference was not statistically significant (Figure 2). Day 15 outcomes for TSS also showed a numerically greater success rate for BD spray, but again this difference was not statistically significant (53.4% BD spray vs 43.8% AugBD lotion). At days 15 and 29, significantly more patients treated with BD spray achieved TSS of 0 or 1 for all 3 signs compared to those treated with vehicle (P<.001). Improvement in TSS with BD spray continued through to day 29 of the study.
Comment
In these post hoc analyses, mid-potency BD spray demonstrated early relief of itching and early efficacy in the treatment of psoriasis plaques on the elbows and knees with minimal systemic absorption and a low rate of adverse events.
Betamethasone dipropionate spray and its vehicle formulation relieved psoriatic itching with similar efficacy to the superpotent AugBD steroid lotion. Notably, relief was rapid, with approximately half of responding patients reporting relief of itching by day 4. The results seen with vehicle suggest that the emollient formulation of BD spray is responsible for hydrating dry skin, contributing to the relief of this cutaneous symptom. Dry skin can exacerbate itching, and emollients are recognized as being able to alleviate itching by hydrating and soothing the skin.7
The second set of post hoc analyses reported here demonstrated that BD spray was efficacious in clearing the signs of psoriatic lesions on the difficult-to-treat areas of the knees and elbows. Efficacy with BD spray was similar to the superpotent steroid AugBD lotion, with no statistical difference between the 2 products at any time point. Betamethasone dipropionate spray was significantly more effective than its vehicle in reducing the signs of erythema and scaling from day 8 and plaque elevation from day 15.
Rapid relief of symptoms is important for patient comfort and to improve treatment adherence. These analyses showed that by day 4, BD spray resulted in numerically higher percentages of patients achieving a score of 0 or 1 for the individual signs of erythema, scaling, and plaque elevation compared to AugBD lotion. Of particular note, 37.6% of patients treated with BD spray had scaling scores of clear or almost clear by day 4 compared to 25.0% of patients treated with AugBD lotion. Scaling has been consistently reported as the second most bothersome symptom experienced by patients2,3 and has been shown to be associated with decreased quality of life and work productivity.19
Betamethasone dipropionate spray has a rationally designed vehicle, with the formulation selected specifically to maximize penetration of the product through the stratum corneum and retention of BD steroid in the epidermis and upper dermis while reducing absorption into the systemic circulation.14 The reduced absorption into the systemic circulation leads to less vasoconstriction; fewer adverse events; and a “medium potent” VCA designation compared to the “superpotent” designation of the AugBD formulation, despite containing the same active ingredient.
These analyses demonstrate that BD spray is effective at addressing 2 symptoms that patients with psoriasis consider most bothersome: itching and scaling. Notably, BD spray was able to achieve these results rapidly, with many patients experiencing improvements in 4 days. In these analyses, mid-potent BD spray demonstrated similar efficacy to AugBD lotion, a superpotent steroid formulation.
This analysis is limited by being post hoc. Although the statistical methodology is valid, the AugBD lotion arm of the analyses was relatively small compared with the BD spray and vehicle arms, as it was only included in 1 of 2 studies pooled.
Conclusion
Mid-potency BD spray effectively improved the symptom of itching and cleared hard-to-treat lesions on knees and elbows with efficacy similar to a superpotent AugBD formulation but with less systemic absorption. Improvements were seen in erythema, scaling, and plaque elevation. Reductions in psoriatic signs were observed as early as day 4, with continued improvement seen throughout the study period. These findings provide evidence that BD spray can rapidly relieve 2 of the most troublesome symptoms affecting patients with psoriasis (itching and scaling), potentially improving quality of life.
Acknowledgments
The authors wish to thank Alix Bennett, PhD, formerly of Promius Pharma, a subsidiary of Dr. Reddy’s Laboratories, Inc (Princeton, New Jersey), and Jodie Macoun, PhD, of CUBE Information (Katonah, New York), for their review and assistance with the preparation of this manuscript. Manuscript preparation was supported by Promius Pharma (Princeton, New Jersey)(DRL #866).
- About psoriasis. National Psoriasis Foundation website. https://www.psoriasis.org/about-psoriasis. Accessed October 1, 2019.
- Lebwohl MG, Bachelez H, Barker J, et al. Patient perspectives in the management of psoriasis: results from the population-based Multinational Assessment of Psoriasis and Psoriatic Arthritis Survey. J Am Acad Dermatol. 2014;70:871-881.e1-30.
- Pariser D, Schenkel B, Carter C, et al; Psoriasis Patient Interview Study Group. A multicenter, non-interventional study to evaluate patient-reported experiences of living with psoriasis. J Dermatolog Treat. 2016;27:19-26.
- Dickison P, Swain G, Peek JJ, et al. Itching for answers: prevalence and severity of pruritus in psoriasis. Australas J Dermatol. 2018;59:206-209.
- Bahali AG, Onsun N, Su O, et al. The relationship between pruritus and clinical variables in patients with psoriasis. An Bras Dermatol. 2017;92:470-473.
- Prignano F, Ricceri F, Pescitelli L, et al. Itch in psoriasis: epidemiology, clinical aspects and treatment options. Clin Cosmet Investig Dermatol. 2009;2:9-13.
- Dawn A, Yosipovitch G. Treating itch in psoriasis. Dermatol Nurs. 2006;18:227-233.
- Queille-Roussel C, Rosen M, Clonier F, et al. Efficacy and safety of calcipotriol plus betamethasone dipropionate aerosol foam compared with betamethasone 17-valerate-medicated plaster for the treatment of psoriasis. Clin Drug Investig. 2017;37:355-361.
- Betesil [package insert]. Lodi, Italy: IBSA Pharmaceutici Italia S.r.I; 2013.
- Cannavò SP, Guarneri F, Giuffrida R, et al. Evaluation of cutaneous surface parameters in psoriatic patients. Skin Res Technol. 2017;23:41-47.
- Egawa M, Arimoto H, Hirao T, et al. Regional difference of water content in human skin studied by diffuse-reflectance near-infrared spectroscopy: consideration of measurement depth. Appl Spectrosc. 2006;60:24-28.
- van de Kerkhof PC, Reich K, Kavanaugh A, et al. Physician perspectives in the management of psoriasis and psoriatic arthritis: results from the population-based Multinational Assessment of Psoriasis and Psoriatic Arthritis survey. J Eur Acad Dermatol Venereol. 2015;29:2002-2010.
- Menter A, Korman NJ, Elmets CA, et al; American Academy of Dermatology. Guidelines of care for the management of psoriasis and psoriatic arthritis. section 3. guidelines of care for the management and treatment of psoriasis with topical therapies. J Am Acad Dermatol. 2009;60:643-659.
- Kircik L, Okumu F, Kandavilli S, et al. Rational vehicle design ensures targeted cutaneous steroid delivery. J Clin Aesthet Dermatol. 2017;10:12-19.
- Fowler JF Jr, Herbert AA, Sugarman J. DFD-01, a novel medium potency betamethasone dipropionate 0.05% emollient spray, demonstrates similar efficacy to augmented betamethasone dipropionate 0.05% lotion for the treatment of moderate plaque psoriasis. J Drugs Dermatol. 2016;15:154-162.
- Stein Gold L, Jackson JM, Knuckles ML, et al. Improvement in extensive moderate plaque psoriasis with a novel emollient spray formulation of betamethasone dipropionate 0.05. J Drugs Dermatol. 2016;15:334-342.
- Sidgiddi S, Pakunlu RI, Allenby K. Efficacy, safety, and potency of betamethasone dipropionate spray 0.05%: a treatment for adults with mild-to-moderate plaque psoriasis. J Clin Aesthet Dermatol. 2018;11:14-22.
- Diprolene Lotion (augmented betamethasone dipropionate 0.05%) [package insert]. Kenilworth, NJ: Schering Corporation; 1999.
- Korman NJ, Zhao Y, Pike J, et al. Increased severity of itching, pain, and scaling in psoriasis patients is associated with increased disease severity, reduced quality of life, and reduced work productivity. Dermatol Online J. 2015;21. pii:13030/qt1x16v3dg.
Practice Points
- Pruritus is one of the most bothersome symptoms of psoriasis; plaques located on the knees and elbows remain hard to treat.
- Topical corticosteroids are the initial form of treatment of localized plaque psoriasis.
- The choice of vehicle can change the penetration of the medication, alter the efficacy, and minimize side effects of the drug.
- Betamethasone dipropionate spray 0.05% is a mid-potent corticosteroid that provides fast symptom relief and early efficacy in clearing plaques, similar to a high-potency topical corticosteroid but with less potential for systemic absorption and adverse events.
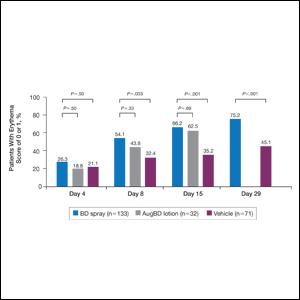
Dermatology Residency Applications: Correlation of Applicant Personal Statement Content With Match Result
The personal statement is a narrative written by an applicant to residency programs to discuss his/her interests. It is one of the few places in the residency application process where applicants can express their personalities.1 Applicants believe the personal statement is an important opportunity to distinguish themselves from others, thus increasing their chances of successful matching, particularly in competitive specialties.1,2
Dermatology is a highly competitive specialty, with 614 medical students applying for 440 total dermatology positions in 2016.3 According to the results of the 2016 National Resident Matching program director survey, 82% (27/33) of dermatology program directors reported that the personal statement was a factor in selecting applicants to interview. Furthermore, dermatology program directors, on average, rated personal statements as more important than the Medical Student Performance Evaluation/Dean’s Letter, US Medical Licensing Examination (USMLE) Step 2 scores, and class ranking/quartile.4
Prior studies have sought to evaluate the impact of personal statements on the application process. A 2014 study of personal statements submitted by dermatology residency applicants found that the prevalence of certain themes differed according to match outcome.5 However, some of the conclusions drawn in this study were not supported by the reported results or were based on low numbers of participants. The purpose of our study was to examine personal statements from applications to a dermatology program at a major academic institution. This study identified common themes in personal statements, allowing for an analysis of their association with successful matching into dermatology.
Methods
All applications to the dermatology residency program at UNC School of Medicine (Chapel Hill, North Carolina) during the 2012 application cycle (N=422) were eligible. All submitted personal statements (N=422) were included with all personal identifiers removed prior to analysis. The investigator (D.S.M.) was blinded to other Electronic Residency Application Service data and match outcome.
The investigator initially reviewed a small, randomly selected subset of 20 personal statements to identify characteristics and common themes. The investigator then analyzed each of the personal statements to quantify the frequency of each theme. All personal statements submitted to the dermatology residency program at UNC School of Medicine were analyzed in this manner. Dermatology match outcomes for each applicant were confirmed later using dermatology program websites.
Differences in the prevalence of common themes between matched and unmatched applicants were calculated. Analysis of variance tests were used to determine if the differences in prevalence were statistically significant (P≤.05).
Results
All 422 submitted personal statements were evaluated, with 308 personal statements from applicants who matched and 114 personal statements from unmatched applicants. The screening of the initial subset of 20 personal statements resulted in a total of 9 content themes. The prevalence of each theme among matched and unmatched applicants is shown in the Table.
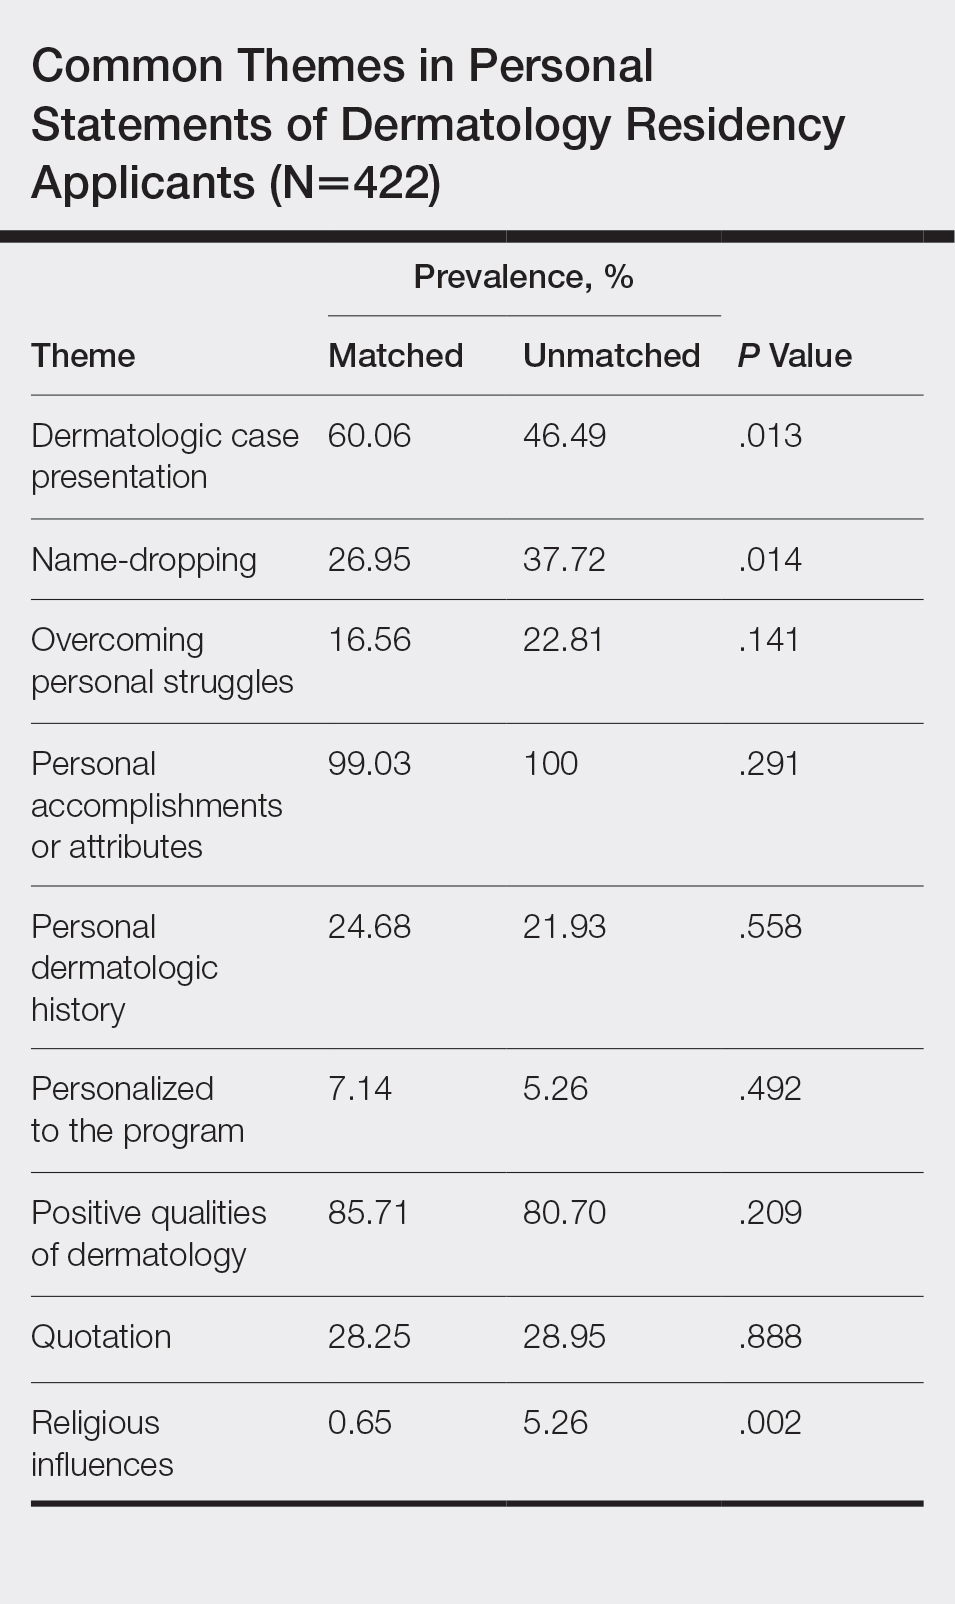
The most common themes among both matched and unmatched groups were personal accomplishments or attributes and positive qualities of dermatology. The prevalence of certain themes varied between matched and unmatched groups. Dermatologic cases were discussed significantly more frequently in the matched group compared to the unmatched group (60.06% vs 46.49%, P=.013). Name-dropping was more prevalent in the unmatched group (37.72%) compared to the matched group (26.95%). This difference in prevalence reached statistical significance (P=.014). Religious influences also were discussed more frequently in the unmatched group (5.26%) vs the matched group (0.65%) with statistical significance (P=.002).
Comment
This study of 422 personal statements submitted to a major academic institution showed that certain themes were common in personal statements among both matched and unmatched applicants. These themes included personal accomplishments/attributes and positive qualities of dermatology. This finding is consistent with prior studies that show common themes in the personal statements of applicants across a wide variety of specialties, including dermatology, anesthesiology, pediatrics, general surgery, internal medicine, and radiology.5-10 Most commonly, applicants feel the need to justify why they chose their particular specialty, with Olazagasti et al5 (N=332) reporting that 70% of submitted dermatology personal statements explained why the applicant chose dermatology.
Certain themes, however, varied in prevalence between matched and unmatched groups in our study. Discussion of dermatologic cases was significantly more prevalent in the matched group compared to the unmatched group (P=.013), possibly because dermatology faculty enjoy hearing about cases and how the applicant responds and interacts with the cases. These data suggest that matched applicants focus more on characteristics specific to the clinical aspects of dermatology.
Conversely, name-dropping was significantly more prevalent in the unmatched group (P=.014). Dermatology is a highly competitive specialty. In 2016, applicants who matched into dermatology had a mean USMLE Step 1 score of 249 with a mean number of 4.7 research experiences and 11.7 abstracts, presentations, or publications, which is higher than the average USMLE Step 1 score of 239 with a mean number of 3.8 research experiences and 8.7 abstracts, presentations, or publications for unmatched applicants.3 It is possible that residency selection committees may view name-dropping negatively if applicants choose to name-drop to strengthen their applications in comparison to more competitive candidates. Religious influences also were significantly more prevalent in the unmatched group (P=.002), but the overall frequency of religious influences was low (approximately 2% of all applicants).
The 422 personal statements examined in our study represent 83.1% of the total pool of applicants to postgraduate year 2 dermatology positions in 2012 (N=508).11 Our data differed somewhat from an analysis of same-year dermatology personal statements of 65% of the national applicant pool.5 Olazagasti et al5 found that themes of a family member in medicine (more in unmatched), a desire to contribute to decreasing literature gap (more in matched), and a desire to better understand dermatologic pathophysiology (more in matched) to be statistically significant (P≤.05 for all). Unfortunately, these themes were found in a small number of applicants, with each being reported in less than 7%.5 Our study included 23% more unmatched candidates and likely better estimated potential significant differences between matched and unmatched applicants.
In the Results section, Olazagasti et al5 reported that matched applicants emphasized the study of cutaneous manifestations of systemic disease significantly more frequently than unmatched applicants. However, the P value in their report did not support this statement (P=.054). In addition, their Conclusion section discussed matched candidates including themes of “why dermatology” and unmatched candidates including a “personal story” as differences between groups. Again, their results did not show any statistical significance to support these recommendations.5 When providing medical student mentorship in a field as competitive as dermatology, faculty must be careful in giving accurate advice that, if at all possible, is supported by objective data rather than personal preference or anecdotes.
Our study was limited in that only personal statements of applicants to a single program in a specific specialty were analyzed. Applicants may have submitted personalized versions of their personal statements to specific schools, which may have biased the themes present in this subset of personal statements. Given these limitations, we are unable to determine if these results are generalizable to all dermatology residency applicants. Further limitation is that the analysis of personal statements is in itself a subjective process.
This study included a larger number of personal statements representing a larger proportion of the total pool of applicants in 2012 than prior studies examining personal statements of dermatology residency applicants. In addition, this study examined the ultimate dermatology match outcome for each applicant during the 2012 application cycle. Future investigations could explore the role of other factors in the residency selection process such as USMLE Step scores, community service, research experiences, and Alpha Omega Alpha Honor Medical Society status.
Conclusion
There are common themes in the personal statements of dermatology residency applicants, including personal accomplishments/attributes and positive qualities of dermatology. In addition, discussion of dermatologic cases was statistically more prevalent in applicants who ultimately matched, whereas name-dropping and religious influences were more prevalent in applicants who did not match. This information may be useful to effectively mentor medical students about the writing process for the personal statement. Further investigation is needed to explore these associations and the role of other aspects of the application in the residency selection process.
- Arbelaez C, Ganguli I. The personal statement for residency application: review and guidance. J Natl Med Assoc. 2011;103:439-442.
- White BA, Sadoski M, Thomas S, et al. Is the evaluation of the personal statement a reliable component of the general surgery residency application? J Surg Educ. 2012;69:340-343.
- Charting Outcomes in the Match for U.S. Allopathic Seniors: Characteristics of US Allopathic Seniors Who Matched to Their Preferred Specialty in the 2016 Main Residency Match. Washington, DC: National Resident Matching Program; September 2016. https://www.nrmp.org/wp-content/uploads/2016/09/Charting-Outcomes-US-Allopathic-Seniors-2016.pdf. Accessed January 21, 2020.
- Results of the 2016 NRMP Program Director Survey. Washington, DC: National Resident Matching Program; June 2016. https://www.nrmp.org/wp-content/uploads/2016/09/NRMP-2016-Program-Director-Survey.pdf. Accessed January 21, 2020.
- Olazagasti J, Gorouhi F, Fazel N. A critical review of personal statements submitted by dermatology residency applicants. Dermatol Res Pract. 2014;2014:934874.
- Max BA, Gelfand B, Brooks MR, et al. Have personal statements become impersonal? an evaluation of personal statements in anesthesiology residency applications. J Clin Anesth. 2010;22:346-351.
- Nield LS, Nease EK, Mitra S, et al. Major themes in the personal statements of pediatric resident applicants. Clin Pediatr (Phila). 2016;55:671-672.
- Ostapenko L, Schonhardt-Bailey C, Sublette JW, et al. Textual analysis of general surgery residency personal statements: topics and gender differences. J Surg Educ. 2018;75:573-581.
- Osman NY, Schonhardt-Bailey C, Walling JL, et al. Textual analysis of internal medicine residency personal statements: themes and gender differences. Med Educ. 2015;49:93-102.
- Smith EA, Weyhing B, Mody Y, et al. A critical analysis of personal statements submitted by radiology residency applicants. Acad Radiol. 2005;12:1024-1028.
- Results and Data: 2012 Main Residency Match. Washington, DC: National Resident Matching Program; April 2012. http://www.nrmp.org/wp-content/uploads/2013/08/resultsanddata20121.pdf. Accessed January 21, 2020.
The personal statement is a narrative written by an applicant to residency programs to discuss his/her interests. It is one of the few places in the residency application process where applicants can express their personalities.1 Applicants believe the personal statement is an important opportunity to distinguish themselves from others, thus increasing their chances of successful matching, particularly in competitive specialties.1,2
Dermatology is a highly competitive specialty, with 614 medical students applying for 440 total dermatology positions in 2016.3 According to the results of the 2016 National Resident Matching program director survey, 82% (27/33) of dermatology program directors reported that the personal statement was a factor in selecting applicants to interview. Furthermore, dermatology program directors, on average, rated personal statements as more important than the Medical Student Performance Evaluation/Dean’s Letter, US Medical Licensing Examination (USMLE) Step 2 scores, and class ranking/quartile.4
Prior studies have sought to evaluate the impact of personal statements on the application process. A 2014 study of personal statements submitted by dermatology residency applicants found that the prevalence of certain themes differed according to match outcome.5 However, some of the conclusions drawn in this study were not supported by the reported results or were based on low numbers of participants. The purpose of our study was to examine personal statements from applications to a dermatology program at a major academic institution. This study identified common themes in personal statements, allowing for an analysis of their association with successful matching into dermatology.
Methods
All applications to the dermatology residency program at UNC School of Medicine (Chapel Hill, North Carolina) during the 2012 application cycle (N=422) were eligible. All submitted personal statements (N=422) were included with all personal identifiers removed prior to analysis. The investigator (D.S.M.) was blinded to other Electronic Residency Application Service data and match outcome.
The investigator initially reviewed a small, randomly selected subset of 20 personal statements to identify characteristics and common themes. The investigator then analyzed each of the personal statements to quantify the frequency of each theme. All personal statements submitted to the dermatology residency program at UNC School of Medicine were analyzed in this manner. Dermatology match outcomes for each applicant were confirmed later using dermatology program websites.
Differences in the prevalence of common themes between matched and unmatched applicants were calculated. Analysis of variance tests were used to determine if the differences in prevalence were statistically significant (P≤.05).
Results
All 422 submitted personal statements were evaluated, with 308 personal statements from applicants who matched and 114 personal statements from unmatched applicants. The screening of the initial subset of 20 personal statements resulted in a total of 9 content themes. The prevalence of each theme among matched and unmatched applicants is shown in the Table.
The most common themes among both matched and unmatched groups were personal accomplishments or attributes and positive qualities of dermatology. The prevalence of certain themes varied between matched and unmatched groups. Dermatologic cases were discussed significantly more frequently in the matched group compared to the unmatched group (60.06% vs 46.49%, P=.013). Name-dropping was more prevalent in the unmatched group (37.72%) compared to the matched group (26.95%). This difference in prevalence reached statistical significance (P=.014). Religious influences also were discussed more frequently in the unmatched group (5.26%) vs the matched group (0.65%) with statistical significance (P=.002).
Comment
This study of 422 personal statements submitted to a major academic institution showed that certain themes were common in personal statements among both matched and unmatched applicants. These themes included personal accomplishments/attributes and positive qualities of dermatology. This finding is consistent with prior studies that show common themes in the personal statements of applicants across a wide variety of specialties, including dermatology, anesthesiology, pediatrics, general surgery, internal medicine, and radiology.5-10 Most commonly, applicants feel the need to justify why they chose their particular specialty, with Olazagasti et al5 (N=332) reporting that 70% of submitted dermatology personal statements explained why the applicant chose dermatology.
Certain themes, however, varied in prevalence between matched and unmatched groups in our study. Discussion of dermatologic cases was significantly more prevalent in the matched group compared to the unmatched group (P=.013), possibly because dermatology faculty enjoy hearing about cases and how the applicant responds and interacts with the cases. These data suggest that matched applicants focus more on characteristics specific to the clinical aspects of dermatology.
Conversely, name-dropping was significantly more prevalent in the unmatched group (P=.014). Dermatology is a highly competitive specialty. In 2016, applicants who matched into dermatology had a mean USMLE Step 1 score of 249 with a mean number of 4.7 research experiences and 11.7 abstracts, presentations, or publications, which is higher than the average USMLE Step 1 score of 239 with a mean number of 3.8 research experiences and 8.7 abstracts, presentations, or publications for unmatched applicants.3 It is possible that residency selection committees may view name-dropping negatively if applicants choose to name-drop to strengthen their applications in comparison to more competitive candidates. Religious influences also were significantly more prevalent in the unmatched group (P=.002), but the overall frequency of religious influences was low (approximately 2% of all applicants).
The 422 personal statements examined in our study represent 83.1% of the total pool of applicants to postgraduate year 2 dermatology positions in 2012 (N=508).11 Our data differed somewhat from an analysis of same-year dermatology personal statements of 65% of the national applicant pool.5 Olazagasti et al5 found that themes of a family member in medicine (more in unmatched), a desire to contribute to decreasing literature gap (more in matched), and a desire to better understand dermatologic pathophysiology (more in matched) to be statistically significant (P≤.05 for all). Unfortunately, these themes were found in a small number of applicants, with each being reported in less than 7%.5 Our study included 23% more unmatched candidates and likely better estimated potential significant differences between matched and unmatched applicants.
In the Results section, Olazagasti et al5 reported that matched applicants emphasized the study of cutaneous manifestations of systemic disease significantly more frequently than unmatched applicants. However, the P value in their report did not support this statement (P=.054). In addition, their Conclusion section discussed matched candidates including themes of “why dermatology” and unmatched candidates including a “personal story” as differences between groups. Again, their results did not show any statistical significance to support these recommendations.5 When providing medical student mentorship in a field as competitive as dermatology, faculty must be careful in giving accurate advice that, if at all possible, is supported by objective data rather than personal preference or anecdotes.
Our study was limited in that only personal statements of applicants to a single program in a specific specialty were analyzed. Applicants may have submitted personalized versions of their personal statements to specific schools, which may have biased the themes present in this subset of personal statements. Given these limitations, we are unable to determine if these results are generalizable to all dermatology residency applicants. Further limitation is that the analysis of personal statements is in itself a subjective process.
This study included a larger number of personal statements representing a larger proportion of the total pool of applicants in 2012 than prior studies examining personal statements of dermatology residency applicants. In addition, this study examined the ultimate dermatology match outcome for each applicant during the 2012 application cycle. Future investigations could explore the role of other factors in the residency selection process such as USMLE Step scores, community service, research experiences, and Alpha Omega Alpha Honor Medical Society status.
Conclusion
There are common themes in the personal statements of dermatology residency applicants, including personal accomplishments/attributes and positive qualities of dermatology. In addition, discussion of dermatologic cases was statistically more prevalent in applicants who ultimately matched, whereas name-dropping and religious influences were more prevalent in applicants who did not match. This information may be useful to effectively mentor medical students about the writing process for the personal statement. Further investigation is needed to explore these associations and the role of other aspects of the application in the residency selection process.
- Arbelaez C, Ganguli I. The personal statement for residency application: review and guidance. J Natl Med Assoc. 2011;103:439-442.
- White BA, Sadoski M, Thomas S, et al. Is the evaluation of the personal statement a reliable component of the general surgery residency application? J Surg Educ. 2012;69:340-343.
- Charting Outcomes in the Match for U.S. Allopathic Seniors: Characteristics of US Allopathic Seniors Who Matched to Their Preferred Specialty in the 2016 Main Residency Match. Washington, DC: National Resident Matching Program; September 2016. https://www.nrmp.org/wp-content/uploads/2016/09/Charting-Outcomes-US-Allopathic-Seniors-2016.pdf. Accessed January 21, 2020.
- Results of the 2016 NRMP Program Director Survey. Washington, DC: National Resident Matching Program; June 2016. https://www.nrmp.org/wp-content/uploads/2016/09/NRMP-2016-Program-Director-Survey.pdf. Accessed January 21, 2020.
- Olazagasti J, Gorouhi F, Fazel N. A critical review of personal statements submitted by dermatology residency applicants. Dermatol Res Pract. 2014;2014:934874.
- Max BA, Gelfand B, Brooks MR, et al. Have personal statements become impersonal? an evaluation of personal statements in anesthesiology residency applications. J Clin Anesth. 2010;22:346-351.
- Nield LS, Nease EK, Mitra S, et al. Major themes in the personal statements of pediatric resident applicants. Clin Pediatr (Phila). 2016;55:671-672.
- Ostapenko L, Schonhardt-Bailey C, Sublette JW, et al. Textual analysis of general surgery residency personal statements: topics and gender differences. J Surg Educ. 2018;75:573-581.
- Osman NY, Schonhardt-Bailey C, Walling JL, et al. Textual analysis of internal medicine residency personal statements: themes and gender differences. Med Educ. 2015;49:93-102.
- Smith EA, Weyhing B, Mody Y, et al. A critical analysis of personal statements submitted by radiology residency applicants. Acad Radiol. 2005;12:1024-1028.
- Results and Data: 2012 Main Residency Match. Washington, DC: National Resident Matching Program; April 2012. http://www.nrmp.org/wp-content/uploads/2013/08/resultsanddata20121.pdf. Accessed January 21, 2020.
Practice Points
- The most common themes discussed in applicant personal statements include personal accomplishments/attributes and positive qualities of dermatology.
- Presentation of dermatologic cases was more prevalent in personal statements of matched applicants.
- Name-dropping was more common among unmatched applicants.

Management of Patients With Treatment-Resistant Metastatic Prostate Cancer (FULL)
Sequencing Therapies
Mark Klein, MD. The last few years, there have been several new trials in prostate cancer for people in a metastatic setting or more advanced local setting, such as the STAMPEDE, LATITUDE, and CHAARTED trials.1-4 In addition, recently a few trials have examined apalutamide and enzalutamide for people who have had PSA (prostate-specific antigen) levels rapidly rising within about 10 months or so. One of the questions that arises is, how do we wrap our heads around sequencing these therapies. Is there a sequence that we should be doing and thinking about upfront and how do the different trials compare?
Julie Graff, MD. It just got more complicated. There was news today (December 20, 2018) that using enzalutamide early on in newly diagnosed metastatic prostate cancer may have positive results. It is not yet approved by the US Food and Drug Administration (FDA), but for patients who present with metastatic prostate cancer, we may have 4 potential treatments. We could have androgen deprivation therapy (ADT) alone, ADT plus docetaxel, enzalutamide, or abiraterone.
When I see patients in this situation, I talk to them about their options, the pros and cons of each option, and try to cover all the trials that look at these combinations. It can be quite a long visit. I talk to the patient about who benefits most, whether it is patients with high-risk factors or high-volume cancers. Also, I talk with the patient about all the adverse effects (AEs), and I look at my patients’ comorbid conditions and come up with a plan.
I encourage any patient who has high-volume or high-risk disease to consider more than just ADT alone. For many patients, I have been using abiraterone plus ADT. I have a wonderful pharmacist. As a medical oncologist, I can’t do it on my own. I need someone to follow patients’ laboratory results and to be available for medication questions and complications.
Elizabeth Hansen, PharmD. With the increasing number of patients on oral antineoplastics, monitoring patients in the outpatient setting has become an increasing priority and one of my major roles as a pharmacist in the clinic at the Chalmers P. Wylie VA Ambulatory Care Center in Columbus, Ohio. This is especially important as some of these treatments require frequent laboratory monitoring, such as abiraterone with liver function tests every 2 weeks for the first 3 months of treatment and monthly thereafter. Without frequent-follow up it’s easy for these patients to get lost in the shuffle.
Abhishek Solanki, MD. You could argue that a fifth option is prostate-directed radiation for patients who have limited metastases based on the STAMPEDE trial, which we’ve started integrating into our practice at the Edward Hines, Jr. Veterans Affairs Hospital in Chicago, Illinois.4
Mark Klein. Do you have a feel for the data and using radiation in oligometastatic (≤ 5 metastatic tumors) disease in prostate cancer and how well that might work?
Abhishek Solanki. The best data we have are from the multi-arm, multistage STAMPEDE trial systemic therapies and local therapy in the setting of high-risk localized disease and metastatic disease.6 The most recent publication looked specifically at the population with newly diagnosed metastatic disease and compared standard ADT (and docetaxel in about 18% of the patients) with or without prostate-directed radiation therapy. There was no survival benefit with radiation in the overall population, but in the subgroup of patients with low metastatic burden, there was an 8% survival benefit at 3 years.
It’s difficult to know what to make of that information because, as we’ve discussed already, there are other systemic therapy options that are being used more and more upfront such as abiraterone. Can you see the same benefit of radiation in that setting? The flip side is that in this study, radiation just targeted the prostate; could survival be improved even more by targeting all sites of disease in patients with oligometastatic disease? These are still open questions in prostate cancer and there are clinical trials attempting to define the clinical benefit of radiation in the metastatic setting for patients with limited metastases.
Mark Klein. How do you select patients for radiation in this particular situation; How do you approach stratification when radiation is started upfront?
Abhishek Solanki. In the STAMPEDE trial, low metastatic burden was defined based on the definition in the CHAARTED trial, which was those patients who did not have ≥ 4 bone metastases with ≥ 1 outside the vertebral bodies or pelvis, and did not have visceral metastases.7 That’s tough, because this definition could be a patient with a solitary bone metastasis but also could include some patients who have involved nodes extending all the way up to the retroperitoneal nodes—that is a fairly heterogeneous population. What we have done at our institution is select patients who have 3 to 5 metastases, administer prostate radiation therapy, and add stereotactic body radiation therapy (SBRT) for the other sites of disease, invoking the oligometastasis approach.
We have been doing this more frequently in the last few months. Typically, we’ll do 3 to 5 fractions of SBRT to metastases. For the primary, if the patient chooses SBRT, we’ll take that approach. If the patient chooses a more standard fractionation, we’ll do 20 treatments, but from a logistic perspective, most patients would rather come in for 5 treatments than 20. We also typically would start these patients on systemic hormonal therapy.
Mark Klein. At that point, are they referred back to medical oncology for surveillance?
Abhishek Solanki. Yes, they are followed by medical oncology and radiation oncology, and typically would continue hormonal therapy.
Mark Klein. Julie, how have you thought about presenting the therapeutic options for those patients who would be either eligible for docetaxel with high-bulk disease or abiraterone? Do you find patients prefer one or the other?
Julie Graff. I try to be very open about all the possibilities, and I present both. I don’t just decide for the patient chemotherapy vs abiraterone, but after we talk about it, most of my patients do opt for the abiraterone. I had a patient referred from the community—we are seeing more and more of this because abiraterone is so expensive—whose ejection fraction was about 38%. I said to that patient, “we could do chemotherapy, but we shouldn’t do abiraterone.” But usually it’s not that clear-cut.
Elizabeth Hansen. There was also an update from the STAMPEDE trial published recently comparing upfront abiraterone and prednisone to docetaxel (18 weeks) in advanced or metastatic prostate cancer. Results from this trial indicated a nearly identical overall survival (OS) (hazard ratio [HR] = 1.16; 95% CI, 0.82-1.65; P = .40). However, the failure-free survival (HR = 0.51; 95% CI, 0.39-0.67; P < .001) and progression-free survival (PFS) (HR= 0.65; 95% CI, 0.0.48-0.88; P = .005) favored abiraterone.8,9 The authors argue that while there was no change in OS, this trial demonstrates an important difference in the pattern of treatment failure.
Julie, do you think there will be any change in the treatment paradigm between docetaxel and abiraterone with this new update?
Julie Graff. I wasn’t that impressed by that study. I do not see it as practice changing, and it makes sense to me that the PFS is different in the 2 arms because we give chemotherapy and take a break vs giving abiraterone indefinitely. For me, there’s not really a shift.
Patients With Rising PSAs
Mark Klein. Let’s discuss the data from the recent studies on enzalutamide and apalutamide for the patients with fast-rising PSAs. In your discussions with other prostate researchers, will this become a standard part of practice or not?
Julie Graff. I was one of the authors on the SPARTAN apalutamide study.10 For a long time, we have had patients without metastatic disease but with a PSA relapse after surgery or radiation; and the PSA levels climb when the cancer becomes resistant to ADT. We haven’t had many options in that setting except to use bicalutamide and some older androgen receptor (AR) antagonists. We used to use estrogen and ketoconazole as well.
But now 2 studies have come out looking at a primary endpoint of metastases-free survival. Patients whose PSA was doubling every 10 months or shorter were randomized to either apalutamide (SPARTAN10) or enzalutamide (PROSPER11), both second-generation AR antagonists. There was a placebo control arm in each of the studies. Both studies found that adding the second-generation AR targeting agent delayed the time to metastatic disease by about 2 years. There is not any signal yet for statistically significant OS benefit, so it is not entirely clear if you could wait for the first metastasis to develop and then give 1 of these treatments and have the same OS benefit.
At the VA Portland Health Care System (VAPORHCS), it took a while to make these drugs available. My fellows were excited to give these drugs right away, but I often counsel patients that we don’t know if the second-generation AR targeting agents will improve survival. They almost certainly will bring down PSAs, which helps with peace of mind, but anything we add to the ADT can cause more AEs.
I have been cautious with second-generation AR antagonists because patients, when they take one of these drugs, are going to be on it for a long time. The FDA has approved those 2 drugs regardless of PSA doubling time, but I would not give it for a PSA doubling time > 10 months. In my practice about a quarter of patients who would qualify for apalutamide or enzalutamide are actually taking one, and the others are monitored closely with computed tomography (CT) and bone scans. When the disease becomes metastatic, then we start those drugs.
Mark Klein. Why 10 months, why not 6 months, a year, or 18 months? Is there reasoning behind that?
Julie Graff. There was a publication by Matthew Smith showing that the PSA doubling time was predictive of the development of metastatic disease and cancer death or prostate cancer death, and that 10 months seemed to be the cutoff between when the prostate cancer was going to become deadly vs not.12 If you actually look at the trial data, I think the PSA doubling time was between 3 and 4 months for the participants, so pretty short.
Adverse Effects
Mark Klein. What are the AEs people are seeing from using apalutamide, enzalutamide, and abiraterone? What are they seeing in their practice vs what is in the studies? When I have had to stop people on abiraterone or drop down the dose, almost always it has been for fatigue. We check liver function tests (LFTs) repeatedly, but I can’t remember ever having to drop down the dose or take it away even for that reason.
Elizabeth Hansen.
Mark Klein. At the Minneapolis VA Health Care System (MVAHCS) when apalutamide first came out, for the PSA rapid doubling, there had already been an abstract presenting the enzalutamide data. We have chosen to recommend enzalutamide as our choice for the people with PSA doubling based on the cost. It’s significantly cheaper for the VA. Between the 2 papers there is very little difference in the efficacy data. I’m wondering what other sites have done with regard to that specific point at their VAs?
Elizabeth Hansen. In Columbus, we prefer to use either abiraterone and enzalutamide because they’re essentially cost neutral. However, this may change with generic abiraterone coming to market. Apalutamide is really cost prohibitive currently.
Julie Graff. I agree.
Patient Education
Mark Klein. At MVAHCS, the navigators handle a lot of upfront education. We have 3 navigators, including Kathleen Nelson who is on this roundtable. She works with patients and provides much of the patient education. How have you handled education for patients?
Kathleen Nelson. For the most part, our pharmacists do the drug-specific education for the oral agents, and the nurse navigators provide more generic education. We did a trial for patients on IV therapies. We learned that patients really don’t report in much detail, but if you call and ask them specific questions, then you can tease out some more detail.
Elizabeth Hansen. It is interesting that every site is different. One of my main roles is oral antineoplastic monitoring, which includes many patients on enzalutamide or abiraterone. At least initially with these patients, I try to follow them closely—abiraterone more so than enzalutamide. I typically call every 2 to 4 weeks, in between clinic visits, to follow up the laboratory tests and manage the AEs. I always try to ask direct and open-ended questions: How often are you checking your blood pressure? What is your current weight? How has your energy level changed since therapy initiation?
The VA telehealth system is amazing. For patients who need to monitor blood pressure regularly, it’s really nice for them to have those numbers come directly back to me in CPRS (Computerized Patient Record System). That has worked wonders for some of our patients to get them through therapy.
Mark Klein. What do you tend to use when the prostate cancer is progressing for a patient? And how do you determine that progression? Some studies will use PSA rise only as a marker for progression. Other studies have not used PSA rise as the only marker for progression and oftentimes require some sort of bone scan criteria or CT imaging criteria for progression.
Julie Graff. We have a limited number of treatment options. Providers typically use enzalutamide or abiraterone as there is a high degree of resistance between the 2. Then there is chemotherapy and then radium, which quite a few people don’t qualify for. We need to be very thoughtful when we change treatments. I look at the 3 factors of biochemical progression or response—PSA, radiographic progression, and clinical progression. If I don’t see 2 out of 3, I typically don’t change treatments. Then after enzalutamide or abiraterone, I wait until there are cancer-related symptoms before I consider chemotherapy and closely monitor my patients.
Imaging Modalities
Abhishek Solanki. Over the last few years the Hines VA Hospital has used fluciclovine positron emission tomography (PET), which is one of the novel imaging modalities for prostate cancer. Really the 2 novel imaging modalities that have gained the most excitement are prostate-specific membrane antigen (PSMA) PET and fluciclovine PET. Fluciclovine PET is based on a synthetic amino acid that’s taken up in multiple tissues, including prostate cancer. It has changed our practice in the localized setting for patients who have developed recurrence after radiation or radical prostatectomy. We have incorporated the scan into our workup of patients with recurrent disease, which can give us some more information at lower PSAs than historically we could get with CT, bone scan, or magnetic resonance imaging.
Our medical oncologists have started using it more and more as well. We are getting a lot of patients who have a negative CT or bone scan but have a positive fluciclovine PET. There are a few different disease settings where that becomes relevant. In patients who develop biochemical recurrence after radiation or salvage radiation after radical, we are finding that a lot of these patients who have no CT or bone scan findings of disease ultimately are found to have a PET-positive lesion. Sometimes it’s difficult to know how best to help patients with PET-only disease. Should you target the disease with an oligometastasis approach or just pursue systemic therapy or surveillance? It is challenging but more and more we are moving toward metastasis-directed therapy. There are multiple randomized trials in progress testing whether metastasis-directed therapy to the PET areas of recurrence can improve outcomes or delay systemic ADT. The STOMP trial randomized surveillance vs SBRT or surgery for patients with oligometastatic disease that showed improvement in biochemical control and ADT-free survival.13 However this was a small trial that tried to identify a signal. More definitive trials are necessary.
The other setting where we have found novel PET imaging to be helpful is in patients who have become castration resistant but don’t have clear metastases on conventional imaging. We’re identifying more patients who have only a few sites of progression, and we’ll pursue metastasis-directed therapy to those areas to try to get more mileage out of the systemic therapy that the patient is currently on and to try to avoid having to switch to the next line with the idea that, potentially, the progression site is just a limited clone that is progressing despite the current systemic therapy.
Mark Klein. I find that to be a very attractive approach. I’m assuming you do that for any systemic therapy where people have maybe 1 or 2 sites and they do not have a big PSA jump. Do you have a number of sites that you’re willing to radiate? And then, when you do that, what radiation fractionation and dosing do you use? Is there any observational data behind that for efficacy?
Abhishek Solanki. It is a patient by patient decision. Some patients, if they have a very rapid pace of progression shortly after starting systemic therapy and metastases have grown in several areas, we think that perhaps this person may benefit less from aggressive local therapy. But if it’s somebody who has been on systemic therapy for a while and has up to 3 sites of disease growth, we consider SBRT for oligoprogressive disease. Typically, we’ll use SBRT, which delivers a high dose of radiation over 3 to 5 treatments. With SBRT you can give a higher biologic dose and use more sophisticated treatment machines and image guidance for treatments to focus the radiation on the tumor area and limit exposure to normal tissue structures.
In prostate cancer to the primary site, we will typically do around 35 to 40 Gy in 5 fractions. For metastases, it depends on the site. If it’s in the lung, typically we will do 3 to 5 treatments, giving approximately 50 to 60 Gy in that course. In the spine, we use lower doses near the spinal cord and the cauda equina, typically about 30 Gy in 3 fractions. In the liver, similar to the lung, we’ll typically do 50-54 Gy in 3-5 fractions. There aren’t a lot of high-level data guiding the optimal dose/fractionation to metastases, but these are the doses we’ll use for various malignancies.
Treatment Options for Patients With Adverse Events
Mark Klein. I was just reviewing the 2004 study that randomized patients to mitoxantrone or docetaxel for up to 10 cycles.14,15 Who are good candidates for docetaxel after they have exhausted abiraterone and enzalutamide? How long do you hold to the 10-cycle rule, or do you go beyond that if they’re doing well? And if they’re not a good candidate, what are some options?
Julie Graff. The best candidates are those who are having a cancer-related AE, particularly pain, because docetaxel only improves survival over mitoxantrone by about 2.5 months. I don’t talk to patients about it as though it is a life extender, but it seems to help control pain—about 70% of patients benefited in terms of pain or some other cancer-related symptom.14
I have a lot of patients who say, “Never will I do chemotherapy.” I refer those patients to hospice, or if they’re appropriate for radium-223, I consider that. I typically give about 6 cycles of chemotherapy and then see how they’re doing. In some patients, the cancer just doesn’t respond to it.
I do tell patients about the papers that you mentioned, the 2 studies of docetaxel vs mitoxantrone where they use about 10 cycles, and some of my patients go all 10.14,15 Sometimes we have to stop because of neuropathy or some other AE. I believe in taking breaks and that you can probably start it later.
Elizabeth Hansen. I agree, our practice is similar. A lot of our patients are not very interested in chemotherapy. You have to take into consideration their ECOG (Eastern Cooperative Oncology Group) status, their goals, and quality of life when talking to them about these medications. And a lot of them tend to choose more of a palliative route. Depending on their AEs and how things are going, we will dose reduce, hold treatment, or give treatment holidays.
Mark Klein. If patients are progressing on docetaxel, what are options that people would use? Radium-223 certainly is available for patients with nonvisceral metastases, as well as cabazitaxel, mitoxantrone, estramustine and other older drugs.
Julie Graff. We have some clinical trials for patients postdocetaxel. We have the TRITON2 and TRITON3 studies open at the VA. (NCT02952534 and NCT02975934, respectively) A lot of patients would get a biopsy, and we’d look for a BRCA 1 or 2 and ATM mutation. For those patients who don’t have those mutations—and maybe 80% of them don’t—we talk about radium-223 for the patients without visceral metastases and bone pain. I have had a fair number of patients go on cabazitaxel, but I have not used mitoxantrone since cabazitaxel came out. It’s not off the table, but it hasn’t shown improvement in survival.
Elizabeth Hansen. One of our challenges, because we’re an ambulatory care center, is that we are unable to give radium-223 in house, and these services have to be sent out to a non-VA facility. It is doable, but it takes more legwork and organization on our part.
Julie Graff. We have not had radium-223, although we’re working to get that online. And we are physically connected to Oregon Health Science University (OHSU), so we send our patients there for radium. It is a pain because the doctors at OHSU don’t have CPRS access. I’m often in the middle of making sure the complete blood counts (CBCs) are sent to OHSU and to get my patients their treatments.
Mark Klein. The Minneapolis VAMC has radium-223 on site, and we have used it for patients whose cancer has progressed while on docetaxel without visceral metastases. Katie, have you had an opportunity to coordinate that care for patients?
Kathleen Nelson. Radium is administered at our facility by one of our nuclear medicine physicians. A complete blood count is checked at least 3 days prior to the infusion date but no sooner than 6 days. Due to the cost of the material, ordering without knowing the patient’s counts are within a safe range to administer is prohibitive. This adds an additional burden of 2 visits (lab with return visit) to the patient. We have treated 12 patients. Four patients stopped treatment prior to completing the 6 planned treatments citing debilitating fatigue and/or nonresolution of symptoms as their reason to stop treatment. One patient died. The 7 remaining patients subjectively reported varying degrees of pain relief.
Elizabeth Hansen. Another thing to mention is the lack of a PSA response from radium-223 as well. Patients are generally very diligent about monitoring their PSA, so this can be a bit distressing.
Mark Klein. Julie, have you noticed a PSA flare with radium-223? I know it has been reported.
Julie Graff. I haven’t. But I put little stock in PSAs in these patients. I spend 20 minutes explaining to patients that the PSA is not helpful in determining whether or not the radium is working. I tell them that the bone marker alkaline phosphatase may decrease. And I think it’s important to note, too, that radium-223 is not a treatment we have on the shelf. We order it from Denver I believe. It is weight based, and it takes 5 days to get.
Clinical Trials
Mark Klein. That leads us into clinical trials. What is the role for precision oncology in prostate cancer right now, specifically looking at particular panels? One would be the DNA repair enzyme-based genes and/or also the AR variants and any other markers.
Elizabeth Hansen. The National Comprehensive Cancer Network came out with a statement recommending germ-line and somatic-mutation testing in all patients with metastatic prostate cancer. This highlights the need to offer patients the availability of clinical trials.
Julie Graff. I agree. We occasionally get to a place in the disease where patients are feeling fine, but we don’t have anything else to offer. The studies by Robinson16 and then Matteo17 showed that (a) these DNA repair defects are present in about a quarter of patients; and (b) that PARP inhibitors can help these patients. At least it has an anticancer effect.
What’s interesting is that we have TRITON2, and TRITON3, which are sponsored by Clovis,for patients with BRCA 1/2 and ATM mutations and using the PARP-inhibitor rucaparib. Based on the data we have available, we thought a quarter of patients would have the mutation in the tumor, but they’re finding that it is more like 10% to 15%. They are screening many patients but not finding it.
I agree that clinical trials are the way to go. I am hopeful that we’ll get more treatments based on molecular markers. The approval for pembrolizumab in any tumor type with microsatellite instability is interesting, but in prostate cancer, I believe that’s about 3%. I haven’t seen anyone qualify for pembrolizumab based on that. Another plug for clinical trials: Let’s learn more and offer our patients potentially beneficial treatments earlier.
Mark Klein. The first interim analysis from the TRITON2 study found about 12% of patients had alterations in BRCA 1/2. But in those that met the RECIST criteria, they were able to have evaluable disease via that standard with about a 44% response rate so far and a 51% PSA response rate. It is promising data, but it’s only 85 patients so far. We’ll know more because the TRITON2 study is of a more pretreated population than the TRITION3 study at this point. Are there any data on precision medicine and radiation in prostate cancer?
Abhishek Solanki. In the prostate cancer setting, there are not a lot of emerging data specifically looking at using precision oncology biomarkers to help guide decisions in radiation therapy. For example, genomic classifiers, like GenomeDx Decipher (Vancouver, BC) and Myriad Genetics Prolaris (Salt Lake City, UT) are increasingly being utilized in patients with localized disease. Decipher can help predict the risk of recurrence after radical prostatectomy. The difficulty is that there are limited data that show that by using these genomic classifiers, one can improve outcomes in patients over traditional clinical characteristics.
There are 2 trials currently ongoing through NRG Oncology that are using Decipher. The GU002 is a trial for patients who had a radical prostatectomy and had a postoperative PSA that never nadired below 0.2. These patients are randomized between salvage radiation with hormone therapy with or without docetaxel. This trial is collecting Decipher results for patients enrolled in the study. The GU006 is a trial for a slightly more favorable group of patients who do nadir but still have biochemical recurrence and relatively low PSAs. This trial randomizes between radiotherapy alone and radiotherapy and 6 months of apalutamide, stratifying patients based on Decipher results, specially differentiating between patients who have a luminal vs basal subtype of prostate cancer. There are data that suggest that patients who have a luminal subtype may benefit more from the combination of radiation and hormone therapy vs patients who have basal subtype.18 However this hasn’t been validated in a prospective setting, and that’s what this trial will hopefully do.
Immunotherapies
Mark Klein. Outside of prostate cancer, there has been a lot of research trying to determine how to improve PD-L1 expression. Where are immunotherapy trials moving? How radiation might play a role in conjunction with immunotherapy.
Julie Graff. Two phase 3 studies did not show statistically improved survival or statistically significant survival improvement on ipilimumab, an immunotherapy agent that targets CTLA4. Some early studies of the PD-1 drugs nivolumab and pembrolizumab did not show much response with monotherapy. Despite the negative phase 3 studies for ipilimumab, we periodically see exceptional responses.
In prostate cancer, enzalutamide is FDA approved. And there’s currently a phase 3 study of the PD-L1 inhibitor atezolizumab plus enzalutamide in patients who have progressed on abiraterone. That trial is fully accrued, bu
I just received a Prostate Cancer Foundation Challenge Award to open a VA-only study looking at fecal microbiota transplant from responders to nonresponders to see how manipulating host factors can increase potential responses to PD-1 inhibition.
Abhishek Solanki. The classic mechanism by which radiation therapy works is direct DNA damage and indirect DNA damage through hydroxyl radicals that leads to cytotoxicity. But preclinical and clinical data suggest that radiation therapy can augment the local and systemic immunotherapy response. The radiation oncologist’s dream is what is called the abscopal effect, which is the idea that when you treat one site of disease with radiation, it can induce a response at other sites that didn’t get radiation therapy through reactivation of the immune system. I like to think of the abscopal effect like bigfoot—it’s elusive. However, it seems that the setting it is most likely to happen in is in combination with immunotherapy.
One of the ways that radiation fails locally is that it can upregulate PD-1 expression, and as a result, you can have progression of the tumor because of local immune suppression. We know that T cells are important for the activity of radiation therapy. If you combine checkpoint inhibition with radiation therapy, you can not only have better local control in the area of the tumor, but perhaps you can release tumor antigens that will then induce a systemic response.
The other potential mechanism by which radiation may work synergistically with immunotherapy is as a debulking agent. There are some data that suggest that the ratio of T-cell reinvigoration to bulk of disease, or the volume of tumor burden, is important. That is, having T-cell reinvigoration may not be sufficient to have a response to immunotherapy in patients with a large burden of disease. By using radiation to debulk disease, perhaps you could help make checkpoint inhibition more effective. Ultimately, in the setting of prostate cancer, there are not a lot of data yet showing meaningful benefits with the combination of immunotherapy and radiotherapy, but there are trials that are ongoing that will educate on potential synergy.
Pharmacy
Julie Graff. Before we end I want to make sure that we applaud the amazing pharmacists and patient care navigation teams in the VA who do such a great job of getting veterans the appropriate treatment expeditiously and keeping them safe. It’s something that is truly unique to the VA. And I want to thank the people on this call who do this every day.
Elizabeth Hansen. Thank you Julie. Compared with working in the community, at the VA I’m honestly amazed by the ease of access to these medications for our patients. Being able to deliver medications sometimes the same day to the patient is just not something that happens in the community. It’s nice to see that our veterans are getting cared for in that manner.
Author disclosures
Dr. Solanki participated in advisory boards for Blue Earth Diagnostics’ fluciclovine PET and was previously paid as a consultant. Dr. Graff is a consultant for Sanofi (docetaxel) and Astellas (enzalutamide), and has received research funding (no personal funding)from Sanofi, Merck (pembrolizumab), Astellas, and Jannsen (abiraterone, apalutamide). The other authors report no actual or potential conflicts of interest with regard to this article.
Disclaimer
The opinions expressed herein are those of the authors and do not necessarily reflect those of Federal Practitioner, Frontline Medical Communications Inc., the US Government, or any of its agencies. This article may discuss unlabeled or investigational use of certain drugs. Please review the complete prescribing information for specific drugs or drug combinations—including indications, contraindications, warnings, and adverse effects—before administering pharmacologic therapy to patients.
1. James ND, de Bono JS, Spears MR, et al; STAMPEDE Investigators. Abiraterone for prostate cancer not previously treated with hormone therapy. N Engl J Med. 2017;377(4):338-351.
2. James ND, Sydes MR, Clarke NW, et al; STAMPEDE Investigators. Addition of docetaxel, zoledronic acid, or both to first-line long-term hormone therapy in prostate cancer (STAMPEDE): survival results from an adaptive, multiarm, multistage, platform randomised controlled trial. Lancet. 2017;387(10024):1163-1177.
3. Fizazi K, Tran N, Fein L, et al; LATITUDE Investigators. Abiraterone plus prednisone in metastatic, castration-sensitive prostate cancer. N Engl J Med. 2017;377(4):352-360.
4. Kyriakopoulos CE, Chen YH, Carducci MA, et al. Chemohormonal therapy in metastatic hormone-sensitive prostate cancer: long-term survival analysis of the randomized Phase III E3805 CHAARTED trial. J Clin Oncol. 2018;36(11):1080-1087.
5. Tosoian JJ, Gorin MA, Ross AE, Pienta KJ, Tran PT, Schaeffer EM. Oligometastatic prostate cancer: definitions, clinical outcomes, and treatment considerations. Nat Rev Urol. 2017;14(1):15-25.
6. Parker CC, James ND, Brawley CD, et al; Systemic Therapy for Advanced or Metastatic Prostate cancer: Evaluation of Drug Efficacy (STAMPEDE) investigators. Radiotherapy to the primary tumour for newly diagnosed, metastatic prostate cancer (STAMPEDE): a randomised controlled phase 3 trial. Lancet. 2018;392(10162):2353-2366.
7. Sweeney CJ, Chen YH, Carducci M, et al. Chemohormonal therapy in metastatic hormone-sensitive prostate cancer. N Engl J Med. 2015;373(8):737-746.
8. Feyerabend S, Saad F, Li T, et al. Survival benefit, disease progression and quality-of-life outcomes of abiraterone acetate plus prednisone versus docetaxel in metastatic hormone-sensitive prostate cancer: a network meta-analysis. Eur J Cancer. 2018;103:78-87.
9. Sydes MR, Spears MR, Mason MD, et al; STAMPEDE Investigators. Adding abiraterone or docetaxel to long-term hormone therapy for prostate cancer: directly randomised data from the STAMPEDE multi-arm, multi-stage platform protocol. Ann Oncol. 2018;29(5):1235-1248.
10. Smith MR, Saad F, Chowdhury S, et al; SPARTAN Investigators. Apalutamide treatment and metastasis-free survival in prostate cancer. N Engl J Med. 2018;378(15):1408-1418.
11. Hussain M, Fizazi K, Saad F, et al. Enzalutamide in men with nonmetastatic, castration-resistant prostate cancer. N Engl J Med. 2018;378(26):2465-2474.
12. Smith MR, Kabbinavar F, Saad F, et al. Natural history of rising serum prostate-specific antigen in men with castrate nonmetastatic prostate cancer. J Clin Oncol. 2005;23(13):2918-2925.
13. Ost P, Reynders D, Decaestecker K, et al. Surveillance or metastasis-directed therapy for oligometastatic prostate cancer recurrence: a prospective, randomized, multicenter phase II trial. J Clin Oncol. 2018;36(5):446-453.
14. Petrylak DP, Tangen CM, Hussain MH, et al. Docetaxel and estramustine compared with mitoxantrone and prednisone for advanced refractory prostate cancer. N Engl J Med. 2004;351(15):1513-1520.
15. Tannock IF, de Wit R, Berry WR, et al; TAX 327 Investigators. Docetaxel plus prednisone or mitoxantrone plus prednisone for advanced prostate cancer. N Engl J Med. 2004;351(15):1502-1512.
16. Robinson D, Van Allen EM, Wu YM, et al. Integrative clinical genomics of advanced prostate cancer. Cell. 2015;161(5):1215-1228.
17. Mateo J, Carreira S, Sandhu S, et al. DNA-repair defects and olaparib in metastatic prostate cancer. N Engl J Med. 2015;373(18):1697-1708.
18. Zhao SG, Chang SL, Erho N, et al. Associations of luminal and basal subtyping of prostate cancer with prognosis and response to androgen deprivation therapy. JAMA Oncol. 2017;3(12):1663-1672.
Sequencing Therapies
Mark Klein, MD. The last few years, there have been several new trials in prostate cancer for people in a metastatic setting or more advanced local setting, such as the STAMPEDE, LATITUDE, and CHAARTED trials.1-4 In addition, recently a few trials have examined apalutamide and enzalutamide for people who have had PSA (prostate-specific antigen) levels rapidly rising within about 10 months or so. One of the questions that arises is, how do we wrap our heads around sequencing these therapies. Is there a sequence that we should be doing and thinking about upfront and how do the different trials compare?
Julie Graff, MD. It just got more complicated. There was news today (December 20, 2018) that using enzalutamide early on in newly diagnosed metastatic prostate cancer may have positive results. It is not yet approved by the US Food and Drug Administration (FDA), but for patients who present with metastatic prostate cancer, we may have 4 potential treatments. We could have androgen deprivation therapy (ADT) alone, ADT plus docetaxel, enzalutamide, or abiraterone.
When I see patients in this situation, I talk to them about their options, the pros and cons of each option, and try to cover all the trials that look at these combinations. It can be quite a long visit. I talk to the patient about who benefits most, whether it is patients with high-risk factors or high-volume cancers. Also, I talk with the patient about all the adverse effects (AEs), and I look at my patients’ comorbid conditions and come up with a plan.
I encourage any patient who has high-volume or high-risk disease to consider more than just ADT alone. For many patients, I have been using abiraterone plus ADT. I have a wonderful pharmacist. As a medical oncologist, I can’t do it on my own. I need someone to follow patients’ laboratory results and to be available for medication questions and complications.
Elizabeth Hansen, PharmD. With the increasing number of patients on oral antineoplastics, monitoring patients in the outpatient setting has become an increasing priority and one of my major roles as a pharmacist in the clinic at the Chalmers P. Wylie VA Ambulatory Care Center in Columbus, Ohio. This is especially important as some of these treatments require frequent laboratory monitoring, such as abiraterone with liver function tests every 2 weeks for the first 3 months of treatment and monthly thereafter. Without frequent-follow up it’s easy for these patients to get lost in the shuffle.
Abhishek Solanki, MD. You could argue that a fifth option is prostate-directed radiation for patients who have limited metastases based on the STAMPEDE trial, which we’ve started integrating into our practice at the Edward Hines, Jr. Veterans Affairs Hospital in Chicago, Illinois.4
Mark Klein. Do you have a feel for the data and using radiation in oligometastatic (≤ 5 metastatic tumors) disease in prostate cancer and how well that might work?
Abhishek Solanki. The best data we have are from the multi-arm, multistage STAMPEDE trial systemic therapies and local therapy in the setting of high-risk localized disease and metastatic disease.6 The most recent publication looked specifically at the population with newly diagnosed metastatic disease and compared standard ADT (and docetaxel in about 18% of the patients) with or without prostate-directed radiation therapy. There was no survival benefit with radiation in the overall population, but in the subgroup of patients with low metastatic burden, there was an 8% survival benefit at 3 years.
It’s difficult to know what to make of that information because, as we’ve discussed already, there are other systemic therapy options that are being used more and more upfront such as abiraterone. Can you see the same benefit of radiation in that setting? The flip side is that in this study, radiation just targeted the prostate; could survival be improved even more by targeting all sites of disease in patients with oligometastatic disease? These are still open questions in prostate cancer and there are clinical trials attempting to define the clinical benefit of radiation in the metastatic setting for patients with limited metastases.
Mark Klein. How do you select patients for radiation in this particular situation; How do you approach stratification when radiation is started upfront?
Abhishek Solanki. In the STAMPEDE trial, low metastatic burden was defined based on the definition in the CHAARTED trial, which was those patients who did not have ≥ 4 bone metastases with ≥ 1 outside the vertebral bodies or pelvis, and did not have visceral metastases.7 That’s tough, because this definition could be a patient with a solitary bone metastasis but also could include some patients who have involved nodes extending all the way up to the retroperitoneal nodes—that is a fairly heterogeneous population. What we have done at our institution is select patients who have 3 to 5 metastases, administer prostate radiation therapy, and add stereotactic body radiation therapy (SBRT) for the other sites of disease, invoking the oligometastasis approach.
We have been doing this more frequently in the last few months. Typically, we’ll do 3 to 5 fractions of SBRT to metastases. For the primary, if the patient chooses SBRT, we’ll take that approach. If the patient chooses a more standard fractionation, we’ll do 20 treatments, but from a logistic perspective, most patients would rather come in for 5 treatments than 20. We also typically would start these patients on systemic hormonal therapy.
Mark Klein. At that point, are they referred back to medical oncology for surveillance?
Abhishek Solanki. Yes, they are followed by medical oncology and radiation oncology, and typically would continue hormonal therapy.
Mark Klein. Julie, how have you thought about presenting the therapeutic options for those patients who would be either eligible for docetaxel with high-bulk disease or abiraterone? Do you find patients prefer one or the other?
Julie Graff. I try to be very open about all the possibilities, and I present both. I don’t just decide for the patient chemotherapy vs abiraterone, but after we talk about it, most of my patients do opt for the abiraterone. I had a patient referred from the community—we are seeing more and more of this because abiraterone is so expensive—whose ejection fraction was about 38%. I said to that patient, “we could do chemotherapy, but we shouldn’t do abiraterone.” But usually it’s not that clear-cut.
Elizabeth Hansen. There was also an update from the STAMPEDE trial published recently comparing upfront abiraterone and prednisone to docetaxel (18 weeks) in advanced or metastatic prostate cancer. Results from this trial indicated a nearly identical overall survival (OS) (hazard ratio [HR] = 1.16; 95% CI, 0.82-1.65; P = .40). However, the failure-free survival (HR = 0.51; 95% CI, 0.39-0.67; P < .001) and progression-free survival (PFS) (HR= 0.65; 95% CI, 0.0.48-0.88; P = .005) favored abiraterone.8,9 The authors argue that while there was no change in OS, this trial demonstrates an important difference in the pattern of treatment failure.
Julie, do you think there will be any change in the treatment paradigm between docetaxel and abiraterone with this new update?
Julie Graff. I wasn’t that impressed by that study. I do not see it as practice changing, and it makes sense to me that the PFS is different in the 2 arms because we give chemotherapy and take a break vs giving abiraterone indefinitely. For me, there’s not really a shift.
Patients With Rising PSAs
Mark Klein. Let’s discuss the data from the recent studies on enzalutamide and apalutamide for the patients with fast-rising PSAs. In your discussions with other prostate researchers, will this become a standard part of practice or not?
Julie Graff. I was one of the authors on the SPARTAN apalutamide study.10 For a long time, we have had patients without metastatic disease but with a PSA relapse after surgery or radiation; and the PSA levels climb when the cancer becomes resistant to ADT. We haven’t had many options in that setting except to use bicalutamide and some older androgen receptor (AR) antagonists. We used to use estrogen and ketoconazole as well.
But now 2 studies have come out looking at a primary endpoint of metastases-free survival. Patients whose PSA was doubling every 10 months or shorter were randomized to either apalutamide (SPARTAN10) or enzalutamide (PROSPER11), both second-generation AR antagonists. There was a placebo control arm in each of the studies. Both studies found that adding the second-generation AR targeting agent delayed the time to metastatic disease by about 2 years. There is not any signal yet for statistically significant OS benefit, so it is not entirely clear if you could wait for the first metastasis to develop and then give 1 of these treatments and have the same OS benefit.
At the VA Portland Health Care System (VAPORHCS), it took a while to make these drugs available. My fellows were excited to give these drugs right away, but I often counsel patients that we don’t know if the second-generation AR targeting agents will improve survival. They almost certainly will bring down PSAs, which helps with peace of mind, but anything we add to the ADT can cause more AEs.
I have been cautious with second-generation AR antagonists because patients, when they take one of these drugs, are going to be on it for a long time. The FDA has approved those 2 drugs regardless of PSA doubling time, but I would not give it for a PSA doubling time > 10 months. In my practice about a quarter of patients who would qualify for apalutamide or enzalutamide are actually taking one, and the others are monitored closely with computed tomography (CT) and bone scans. When the disease becomes metastatic, then we start those drugs.
Mark Klein. Why 10 months, why not 6 months, a year, or 18 months? Is there reasoning behind that?
Julie Graff. There was a publication by Matthew Smith showing that the PSA doubling time was predictive of the development of metastatic disease and cancer death or prostate cancer death, and that 10 months seemed to be the cutoff between when the prostate cancer was going to become deadly vs not.12 If you actually look at the trial data, I think the PSA doubling time was between 3 and 4 months for the participants, so pretty short.
Adverse Effects
Mark Klein. What are the AEs people are seeing from using apalutamide, enzalutamide, and abiraterone? What are they seeing in their practice vs what is in the studies? When I have had to stop people on abiraterone or drop down the dose, almost always it has been for fatigue. We check liver function tests (LFTs) repeatedly, but I can’t remember ever having to drop down the dose or take it away even for that reason.
Elizabeth Hansen.
Mark Klein. At the Minneapolis VA Health Care System (MVAHCS) when apalutamide first came out, for the PSA rapid doubling, there had already been an abstract presenting the enzalutamide data. We have chosen to recommend enzalutamide as our choice for the people with PSA doubling based on the cost. It’s significantly cheaper for the VA. Between the 2 papers there is very little difference in the efficacy data. I’m wondering what other sites have done with regard to that specific point at their VAs?
Elizabeth Hansen. In Columbus, we prefer to use either abiraterone and enzalutamide because they’re essentially cost neutral. However, this may change with generic abiraterone coming to market. Apalutamide is really cost prohibitive currently.
Julie Graff. I agree.
Patient Education
Mark Klein. At MVAHCS, the navigators handle a lot of upfront education. We have 3 navigators, including Kathleen Nelson who is on this roundtable. She works with patients and provides much of the patient education. How have you handled education for patients?
Kathleen Nelson. For the most part, our pharmacists do the drug-specific education for the oral agents, and the nurse navigators provide more generic education. We did a trial for patients on IV therapies. We learned that patients really don’t report in much detail, but if you call and ask them specific questions, then you can tease out some more detail.
Elizabeth Hansen. It is interesting that every site is different. One of my main roles is oral antineoplastic monitoring, which includes many patients on enzalutamide or abiraterone. At least initially with these patients, I try to follow them closely—abiraterone more so than enzalutamide. I typically call every 2 to 4 weeks, in between clinic visits, to follow up the laboratory tests and manage the AEs. I always try to ask direct and open-ended questions: How often are you checking your blood pressure? What is your current weight? How has your energy level changed since therapy initiation?
The VA telehealth system is amazing. For patients who need to monitor blood pressure regularly, it’s really nice for them to have those numbers come directly back to me in CPRS (Computerized Patient Record System). That has worked wonders for some of our patients to get them through therapy.
Mark Klein. What do you tend to use when the prostate cancer is progressing for a patient? And how do you determine that progression? Some studies will use PSA rise only as a marker for progression. Other studies have not used PSA rise as the only marker for progression and oftentimes require some sort of bone scan criteria or CT imaging criteria for progression.
Julie Graff. We have a limited number of treatment options. Providers typically use enzalutamide or abiraterone as there is a high degree of resistance between the 2. Then there is chemotherapy and then radium, which quite a few people don’t qualify for. We need to be very thoughtful when we change treatments. I look at the 3 factors of biochemical progression or response—PSA, radiographic progression, and clinical progression. If I don’t see 2 out of 3, I typically don’t change treatments. Then after enzalutamide or abiraterone, I wait until there are cancer-related symptoms before I consider chemotherapy and closely monitor my patients.
Imaging Modalities
Abhishek Solanki. Over the last few years the Hines VA Hospital has used fluciclovine positron emission tomography (PET), which is one of the novel imaging modalities for prostate cancer. Really the 2 novel imaging modalities that have gained the most excitement are prostate-specific membrane antigen (PSMA) PET and fluciclovine PET. Fluciclovine PET is based on a synthetic amino acid that’s taken up in multiple tissues, including prostate cancer. It has changed our practice in the localized setting for patients who have developed recurrence after radiation or radical prostatectomy. We have incorporated the scan into our workup of patients with recurrent disease, which can give us some more information at lower PSAs than historically we could get with CT, bone scan, or magnetic resonance imaging.
Our medical oncologists have started using it more and more as well. We are getting a lot of patients who have a negative CT or bone scan but have a positive fluciclovine PET. There are a few different disease settings where that becomes relevant. In patients who develop biochemical recurrence after radiation or salvage radiation after radical, we are finding that a lot of these patients who have no CT or bone scan findings of disease ultimately are found to have a PET-positive lesion. Sometimes it’s difficult to know how best to help patients with PET-only disease. Should you target the disease with an oligometastasis approach or just pursue systemic therapy or surveillance? It is challenging but more and more we are moving toward metastasis-directed therapy. There are multiple randomized trials in progress testing whether metastasis-directed therapy to the PET areas of recurrence can improve outcomes or delay systemic ADT. The STOMP trial randomized surveillance vs SBRT or surgery for patients with oligometastatic disease that showed improvement in biochemical control and ADT-free survival.13 However this was a small trial that tried to identify a signal. More definitive trials are necessary.
The other setting where we have found novel PET imaging to be helpful is in patients who have become castration resistant but don’t have clear metastases on conventional imaging. We’re identifying more patients who have only a few sites of progression, and we’ll pursue metastasis-directed therapy to those areas to try to get more mileage out of the systemic therapy that the patient is currently on and to try to avoid having to switch to the next line with the idea that, potentially, the progression site is just a limited clone that is progressing despite the current systemic therapy.
Mark Klein. I find that to be a very attractive approach. I’m assuming you do that for any systemic therapy where people have maybe 1 or 2 sites and they do not have a big PSA jump. Do you have a number of sites that you’re willing to radiate? And then, when you do that, what radiation fractionation and dosing do you use? Is there any observational data behind that for efficacy?
Abhishek Solanki. It is a patient by patient decision. Some patients, if they have a very rapid pace of progression shortly after starting systemic therapy and metastases have grown in several areas, we think that perhaps this person may benefit less from aggressive local therapy. But if it’s somebody who has been on systemic therapy for a while and has up to 3 sites of disease growth, we consider SBRT for oligoprogressive disease. Typically, we’ll use SBRT, which delivers a high dose of radiation over 3 to 5 treatments. With SBRT you can give a higher biologic dose and use more sophisticated treatment machines and image guidance for treatments to focus the radiation on the tumor area and limit exposure to normal tissue structures.
In prostate cancer to the primary site, we will typically do around 35 to 40 Gy in 5 fractions. For metastases, it depends on the site. If it’s in the lung, typically we will do 3 to 5 treatments, giving approximately 50 to 60 Gy in that course. In the spine, we use lower doses near the spinal cord and the cauda equina, typically about 30 Gy in 3 fractions. In the liver, similar to the lung, we’ll typically do 50-54 Gy in 3-5 fractions. There aren’t a lot of high-level data guiding the optimal dose/fractionation to metastases, but these are the doses we’ll use for various malignancies.
Treatment Options for Patients With Adverse Events
Mark Klein. I was just reviewing the 2004 study that randomized patients to mitoxantrone or docetaxel for up to 10 cycles.14,15 Who are good candidates for docetaxel after they have exhausted abiraterone and enzalutamide? How long do you hold to the 10-cycle rule, or do you go beyond that if they’re doing well? And if they’re not a good candidate, what are some options?
Julie Graff. The best candidates are those who are having a cancer-related AE, particularly pain, because docetaxel only improves survival over mitoxantrone by about 2.5 months. I don’t talk to patients about it as though it is a life extender, but it seems to help control pain—about 70% of patients benefited in terms of pain or some other cancer-related symptom.14
I have a lot of patients who say, “Never will I do chemotherapy.” I refer those patients to hospice, or if they’re appropriate for radium-223, I consider that. I typically give about 6 cycles of chemotherapy and then see how they’re doing. In some patients, the cancer just doesn’t respond to it.
I do tell patients about the papers that you mentioned, the 2 studies of docetaxel vs mitoxantrone where they use about 10 cycles, and some of my patients go all 10.14,15 Sometimes we have to stop because of neuropathy or some other AE. I believe in taking breaks and that you can probably start it later.
Elizabeth Hansen. I agree, our practice is similar. A lot of our patients are not very interested in chemotherapy. You have to take into consideration their ECOG (Eastern Cooperative Oncology Group) status, their goals, and quality of life when talking to them about these medications. And a lot of them tend to choose more of a palliative route. Depending on their AEs and how things are going, we will dose reduce, hold treatment, or give treatment holidays.
Mark Klein. If patients are progressing on docetaxel, what are options that people would use? Radium-223 certainly is available for patients with nonvisceral metastases, as well as cabazitaxel, mitoxantrone, estramustine and other older drugs.
Julie Graff. We have some clinical trials for patients postdocetaxel. We have the TRITON2 and TRITON3 studies open at the VA. (NCT02952534 and NCT02975934, respectively) A lot of patients would get a biopsy, and we’d look for a BRCA 1 or 2 and ATM mutation. For those patients who don’t have those mutations—and maybe 80% of them don’t—we talk about radium-223 for the patients without visceral metastases and bone pain. I have had a fair number of patients go on cabazitaxel, but I have not used mitoxantrone since cabazitaxel came out. It’s not off the table, but it hasn’t shown improvement in survival.
Elizabeth Hansen. One of our challenges, because we’re an ambulatory care center, is that we are unable to give radium-223 in house, and these services have to be sent out to a non-VA facility. It is doable, but it takes more legwork and organization on our part.
Julie Graff. We have not had radium-223, although we’re working to get that online. And we are physically connected to Oregon Health Science University (OHSU), so we send our patients there for radium. It is a pain because the doctors at OHSU don’t have CPRS access. I’m often in the middle of making sure the complete blood counts (CBCs) are sent to OHSU and to get my patients their treatments.
Mark Klein. The Minneapolis VAMC has radium-223 on site, and we have used it for patients whose cancer has progressed while on docetaxel without visceral metastases. Katie, have you had an opportunity to coordinate that care for patients?
Kathleen Nelson. Radium is administered at our facility by one of our nuclear medicine physicians. A complete blood count is checked at least 3 days prior to the infusion date but no sooner than 6 days. Due to the cost of the material, ordering without knowing the patient’s counts are within a safe range to administer is prohibitive. This adds an additional burden of 2 visits (lab with return visit) to the patient. We have treated 12 patients. Four patients stopped treatment prior to completing the 6 planned treatments citing debilitating fatigue and/or nonresolution of symptoms as their reason to stop treatment. One patient died. The 7 remaining patients subjectively reported varying degrees of pain relief.
Elizabeth Hansen. Another thing to mention is the lack of a PSA response from radium-223 as well. Patients are generally very diligent about monitoring their PSA, so this can be a bit distressing.
Mark Klein. Julie, have you noticed a PSA flare with radium-223? I know it has been reported.
Julie Graff. I haven’t. But I put little stock in PSAs in these patients. I spend 20 minutes explaining to patients that the PSA is not helpful in determining whether or not the radium is working. I tell them that the bone marker alkaline phosphatase may decrease. And I think it’s important to note, too, that radium-223 is not a treatment we have on the shelf. We order it from Denver I believe. It is weight based, and it takes 5 days to get.
Clinical Trials
Mark Klein. That leads us into clinical trials. What is the role for precision oncology in prostate cancer right now, specifically looking at particular panels? One would be the DNA repair enzyme-based genes and/or also the AR variants and any other markers.
Elizabeth Hansen. The National Comprehensive Cancer Network came out with a statement recommending germ-line and somatic-mutation testing in all patients with metastatic prostate cancer. This highlights the need to offer patients the availability of clinical trials.
Julie Graff. I agree. We occasionally get to a place in the disease where patients are feeling fine, but we don’t have anything else to offer. The studies by Robinson16 and then Matteo17 showed that (a) these DNA repair defects are present in about a quarter of patients; and (b) that PARP inhibitors can help these patients. At least it has an anticancer effect.
What’s interesting is that we have TRITON2, and TRITON3, which are sponsored by Clovis,for patients with BRCA 1/2 and ATM mutations and using the PARP-inhibitor rucaparib. Based on the data we have available, we thought a quarter of patients would have the mutation in the tumor, but they’re finding that it is more like 10% to 15%. They are screening many patients but not finding it.
I agree that clinical trials are the way to go. I am hopeful that we’ll get more treatments based on molecular markers. The approval for pembrolizumab in any tumor type with microsatellite instability is interesting, but in prostate cancer, I believe that’s about 3%. I haven’t seen anyone qualify for pembrolizumab based on that. Another plug for clinical trials: Let’s learn more and offer our patients potentially beneficial treatments earlier.
Mark Klein. The first interim analysis from the TRITON2 study found about 12% of patients had alterations in BRCA 1/2. But in those that met the RECIST criteria, they were able to have evaluable disease via that standard with about a 44% response rate so far and a 51% PSA response rate. It is promising data, but it’s only 85 patients so far. We’ll know more because the TRITON2 study is of a more pretreated population than the TRITION3 study at this point. Are there any data on precision medicine and radiation in prostate cancer?
Abhishek Solanki. In the prostate cancer setting, there are not a lot of emerging data specifically looking at using precision oncology biomarkers to help guide decisions in radiation therapy. For example, genomic classifiers, like GenomeDx Decipher (Vancouver, BC) and Myriad Genetics Prolaris (Salt Lake City, UT) are increasingly being utilized in patients with localized disease. Decipher can help predict the risk of recurrence after radical prostatectomy. The difficulty is that there are limited data that show that by using these genomic classifiers, one can improve outcomes in patients over traditional clinical characteristics.
There are 2 trials currently ongoing through NRG Oncology that are using Decipher. The GU002 is a trial for patients who had a radical prostatectomy and had a postoperative PSA that never nadired below 0.2. These patients are randomized between salvage radiation with hormone therapy with or without docetaxel. This trial is collecting Decipher results for patients enrolled in the study. The GU006 is a trial for a slightly more favorable group of patients who do nadir but still have biochemical recurrence and relatively low PSAs. This trial randomizes between radiotherapy alone and radiotherapy and 6 months of apalutamide, stratifying patients based on Decipher results, specially differentiating between patients who have a luminal vs basal subtype of prostate cancer. There are data that suggest that patients who have a luminal subtype may benefit more from the combination of radiation and hormone therapy vs patients who have basal subtype.18 However this hasn’t been validated in a prospective setting, and that’s what this trial will hopefully do.
Immunotherapies
Mark Klein. Outside of prostate cancer, there has been a lot of research trying to determine how to improve PD-L1 expression. Where are immunotherapy trials moving? How radiation might play a role in conjunction with immunotherapy.
Julie Graff. Two phase 3 studies did not show statistically improved survival or statistically significant survival improvement on ipilimumab, an immunotherapy agent that targets CTLA4. Some early studies of the PD-1 drugs nivolumab and pembrolizumab did not show much response with monotherapy. Despite the negative phase 3 studies for ipilimumab, we periodically see exceptional responses.
In prostate cancer, enzalutamide is FDA approved. And there’s currently a phase 3 study of the PD-L1 inhibitor atezolizumab plus enzalutamide in patients who have progressed on abiraterone. That trial is fully accrued, bu
I just received a Prostate Cancer Foundation Challenge Award to open a VA-only study looking at fecal microbiota transplant from responders to nonresponders to see how manipulating host factors can increase potential responses to PD-1 inhibition.
Abhishek Solanki. The classic mechanism by which radiation therapy works is direct DNA damage and indirect DNA damage through hydroxyl radicals that leads to cytotoxicity. But preclinical and clinical data suggest that radiation therapy can augment the local and systemic immunotherapy response. The radiation oncologist’s dream is what is called the abscopal effect, which is the idea that when you treat one site of disease with radiation, it can induce a response at other sites that didn’t get radiation therapy through reactivation of the immune system. I like to think of the abscopal effect like bigfoot—it’s elusive. However, it seems that the setting it is most likely to happen in is in combination with immunotherapy.
One of the ways that radiation fails locally is that it can upregulate PD-1 expression, and as a result, you can have progression of the tumor because of local immune suppression. We know that T cells are important for the activity of radiation therapy. If you combine checkpoint inhibition with radiation therapy, you can not only have better local control in the area of the tumor, but perhaps you can release tumor antigens that will then induce a systemic response.
The other potential mechanism by which radiation may work synergistically with immunotherapy is as a debulking agent. There are some data that suggest that the ratio of T-cell reinvigoration to bulk of disease, or the volume of tumor burden, is important. That is, having T-cell reinvigoration may not be sufficient to have a response to immunotherapy in patients with a large burden of disease. By using radiation to debulk disease, perhaps you could help make checkpoint inhibition more effective. Ultimately, in the setting of prostate cancer, there are not a lot of data yet showing meaningful benefits with the combination of immunotherapy and radiotherapy, but there are trials that are ongoing that will educate on potential synergy.
Pharmacy
Julie Graff. Before we end I want to make sure that we applaud the amazing pharmacists and patient care navigation teams in the VA who do such a great job of getting veterans the appropriate treatment expeditiously and keeping them safe. It’s something that is truly unique to the VA. And I want to thank the people on this call who do this every day.
Elizabeth Hansen. Thank you Julie. Compared with working in the community, at the VA I’m honestly amazed by the ease of access to these medications for our patients. Being able to deliver medications sometimes the same day to the patient is just not something that happens in the community. It’s nice to see that our veterans are getting cared for in that manner.
Author disclosures
Dr. Solanki participated in advisory boards for Blue Earth Diagnostics’ fluciclovine PET and was previously paid as a consultant. Dr. Graff is a consultant for Sanofi (docetaxel) and Astellas (enzalutamide), and has received research funding (no personal funding)from Sanofi, Merck (pembrolizumab), Astellas, and Jannsen (abiraterone, apalutamide). The other authors report no actual or potential conflicts of interest with regard to this article.
Disclaimer
The opinions expressed herein are those of the authors and do not necessarily reflect those of Federal Practitioner, Frontline Medical Communications Inc., the US Government, or any of its agencies. This article may discuss unlabeled or investigational use of certain drugs. Please review the complete prescribing information for specific drugs or drug combinations—including indications, contraindications, warnings, and adverse effects—before administering pharmacologic therapy to patients.
1. James ND, de Bono JS, Spears MR, et al; STAMPEDE Investigators. Abiraterone for prostate cancer not previously treated with hormone therapy. N Engl J Med. 2017;377(4):338-351.
2. James ND, Sydes MR, Clarke NW, et al; STAMPEDE Investigators. Addition of docetaxel, zoledronic acid, or both to first-line long-term hormone therapy in prostate cancer (STAMPEDE): survival results from an adaptive, multiarm, multistage, platform randomised controlled trial. Lancet. 2017;387(10024):1163-1177.
3. Fizazi K, Tran N, Fein L, et al; LATITUDE Investigators. Abiraterone plus prednisone in metastatic, castration-sensitive prostate cancer. N Engl J Med. 2017;377(4):352-360.
4. Kyriakopoulos CE, Chen YH, Carducci MA, et al. Chemohormonal therapy in metastatic hormone-sensitive prostate cancer: long-term survival analysis of the randomized Phase III E3805 CHAARTED trial. J Clin Oncol. 2018;36(11):1080-1087.
5. Tosoian JJ, Gorin MA, Ross AE, Pienta KJ, Tran PT, Schaeffer EM. Oligometastatic prostate cancer: definitions, clinical outcomes, and treatment considerations. Nat Rev Urol. 2017;14(1):15-25.
6. Parker CC, James ND, Brawley CD, et al; Systemic Therapy for Advanced or Metastatic Prostate cancer: Evaluation of Drug Efficacy (STAMPEDE) investigators. Radiotherapy to the primary tumour for newly diagnosed, metastatic prostate cancer (STAMPEDE): a randomised controlled phase 3 trial. Lancet. 2018;392(10162):2353-2366.
7. Sweeney CJ, Chen YH, Carducci M, et al. Chemohormonal therapy in metastatic hormone-sensitive prostate cancer. N Engl J Med. 2015;373(8):737-746.
8. Feyerabend S, Saad F, Li T, et al. Survival benefit, disease progression and quality-of-life outcomes of abiraterone acetate plus prednisone versus docetaxel in metastatic hormone-sensitive prostate cancer: a network meta-analysis. Eur J Cancer. 2018;103:78-87.
9. Sydes MR, Spears MR, Mason MD, et al; STAMPEDE Investigators. Adding abiraterone or docetaxel to long-term hormone therapy for prostate cancer: directly randomised data from the STAMPEDE multi-arm, multi-stage platform protocol. Ann Oncol. 2018;29(5):1235-1248.
10. Smith MR, Saad F, Chowdhury S, et al; SPARTAN Investigators. Apalutamide treatment and metastasis-free survival in prostate cancer. N Engl J Med. 2018;378(15):1408-1418.
11. Hussain M, Fizazi K, Saad F, et al. Enzalutamide in men with nonmetastatic, castration-resistant prostate cancer. N Engl J Med. 2018;378(26):2465-2474.
12. Smith MR, Kabbinavar F, Saad F, et al. Natural history of rising serum prostate-specific antigen in men with castrate nonmetastatic prostate cancer. J Clin Oncol. 2005;23(13):2918-2925.
13. Ost P, Reynders D, Decaestecker K, et al. Surveillance or metastasis-directed therapy for oligometastatic prostate cancer recurrence: a prospective, randomized, multicenter phase II trial. J Clin Oncol. 2018;36(5):446-453.
14. Petrylak DP, Tangen CM, Hussain MH, et al. Docetaxel and estramustine compared with mitoxantrone and prednisone for advanced refractory prostate cancer. N Engl J Med. 2004;351(15):1513-1520.
15. Tannock IF, de Wit R, Berry WR, et al; TAX 327 Investigators. Docetaxel plus prednisone or mitoxantrone plus prednisone for advanced prostate cancer. N Engl J Med. 2004;351(15):1502-1512.
16. Robinson D, Van Allen EM, Wu YM, et al. Integrative clinical genomics of advanced prostate cancer. Cell. 2015;161(5):1215-1228.
17. Mateo J, Carreira S, Sandhu S, et al. DNA-repair defects and olaparib in metastatic prostate cancer. N Engl J Med. 2015;373(18):1697-1708.
18. Zhao SG, Chang SL, Erho N, et al. Associations of luminal and basal subtyping of prostate cancer with prognosis and response to androgen deprivation therapy. JAMA Oncol. 2017;3(12):1663-1672.