User login
Presentation of a Rare Malignancy: Leiomyosarcoma of the Prostate (FULL)
Prostatic leiomyosarcoma is an aggressive malignancy with a high risk of metastasis and a poor prognosis that poses unique diagnostic and treatment challenges.
Prostatic leiomyosarcoma is a rare tumor.1 This neoplasm is composed of highly aggressive prostatic smooth muscle cells that present with nonspecific signs and symptoms mimicking other forms of prostatic pathology. Of the primary prostatic sarcomas, leiomyosarcoma represents the most common subtype in adults and is found in 38% to 52% of newly diagnosed prostate sarcoma.1,2 The prognosis is poor, and no clear guidelines exist regarding the optimal treatment approach. We report a case of prostate leiomyosarcoma and describe the disease characteristics, diagnostic modalities, and treatment approach regarding these rare malignancies.
Case Presentation
A 72-year-old male presented with 6 months of progressive severe lower urinary tract symptoms (LUTS) secondary to bladder outlet obstruction. The patient was refractory to medical management with combination α-blocker and 5-α-reductase inhibitor therapy and continued to require multiple emergent bladder catheterizations. Workup with urinalysis, blood biochemistry, and prostate specific antigen (PSA) levels were persistently normal. He reported no hematuria, weight loss, or perineal pain. The patient reported no history of tobacco use, exposure to hazardous chemicals, and had no family history of genitourinary cancers. On rectal exam, the prostate was firm and nodular, with induration noted along the right upper lobe of the prostate.
The patient was referred for a urology consultation and subsequently underwent transurethral resection of the prostate (TURP) for suspected severe benign prostatic hypertrophy (BPH). A histopathologic examination demonstrated atypical cytology consistent with high- grade leiomyosarcoma. Immunohistochemical analysis revealed positive staining for vimentin, smooth muscle actin, desmin (partial), cytokeratin, smooth muscle myosin, muscle specific actin, and Ki-67 (50%-60% expression).
Fluorodeoxyglucose positron emission tomography (FDG-PET) scan revealed a 5.7 x 5.9 cm tumor with a maximum standardized uptake value (SUVmax) of 12.6 in the right posterior prostate, without evidence of metastatic disease (Figures 1A and 1B). 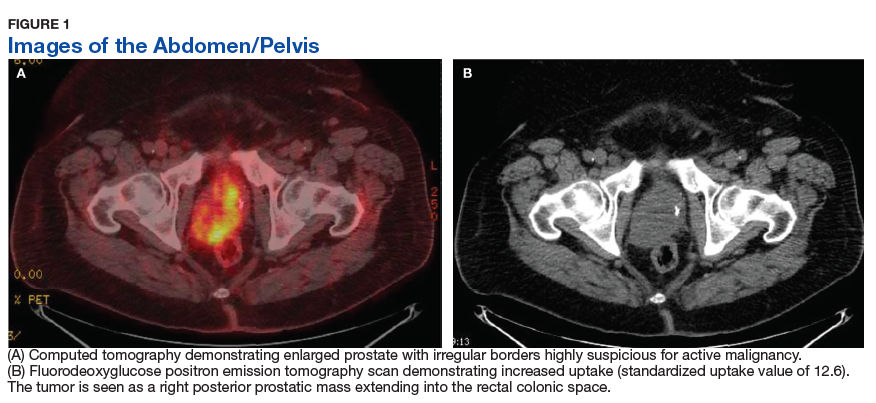
Discussion
Originating from prostatic interstitial cells, prostatic leiomyosarcoma is a rare tumor that accounts for < 0.1% of all primary prostatic malignancies.1 Since its first description in 1950 by Riba and colleagues, < 200 cases have been reported worldwide.2 Among the sarcomas of the prostate, it is the most common tumor, accounting for around 38% to 52% of prostate sarcoma presentations.1,2
Patients typically present between the ages of 41 and 78 years (mean age 61 years).2,3 Signs and symptoms at presentation may vary; however, the most common symptoms are related to lower urinary tract obstruction (89.4% of patients). These symptoms include urinary frequency, urgency, nocturia, and may mimic the presentation of BPH.
Symptoms commonly associated with other malignancies, including constitutional symptoms such as weight loss, tend to occur less frequently or may be absent. Perineal or rectal pain may only be present in 25.6% of patients. Hematuria, burning on ejaculation, and constitutional symptoms are a less common presentation (< 10% of patients).3,4 PSA levels typically do not rise and are found to be within normal limits. The lack of PSA elevation is related to the tumors nonepithelial origin and may contribute to a delay in diagnosis.2,4,5
Diagnosis
Diagnosis may be further eluded as digital rectal exam (DRE) findings tend to reveal nonspecific enlargement of the prostate, resembling that of BPH. DRE may show a hard and firm prostate with nodular induration at the base or over the lobes of the prostate.6 At this stage a urology consultation is useful, as diagnosis is most commonly achieved using transrectal ultrasound (TRUS) with ultrasound-guided needle biopsy or after a TURP procedure.3
Prostate sarcoma is associated with markedly enlarged prostate volume, irregular margins with invasion, or heterogenous hypoechoic lesions on TRUS.7 Transperineal biopsy, computed tomography (CT)-guided biopsy, or suprapubic prostatectomy have been less frequently employed for diagnosis in previously reported cases.8 Specialized imaging modalities, such as CT scan or bone scan, do not show any specific findings with regards to these tumors; their role is limited to evaluation of the local and distant metastasis and for follow-up assessments.9 Transabdominal ultrasound may assess hydronephrosis or enlarged prostate and its relation to nearby structures, although it has not been shown to be helpful in establishing a specific diagnosis.6
Histologically, prostatic leiomyosarcoma is a distinct subtype of prostatic sarcoma. Other subtypes include stromal tumors such as rhabdomyosarcoma, fibrosarcoma, and spindle cell sarcoma.2 The majority of leiomyosarcomas are high-grade lesions demonstrating neoplastic spindle cells with nuclear atypia, multifocal necrosis, and cystic degeneration. Low-grade leiomyosarcomas are very rare.10 Immunohistochemistry is characteristically positive for vimentin, smooth muscle actin, and desmin expression. Cytokeratin may be positive in up to 25% of cases, whereas S-100, CD34, CD117, and PSA are negative.2,3 These histopathological findings help to differentiate leiomyosarcoma from other prostatic tumors.
Tumor size may vary greatly, and measurements have been reported to range from 3 cm to 21 cm, frequently presenting with invasion of local structures.11 Advanced stage disease is commonly found at initial diagnosis and is thought to be due to the lack of early specific symptoms. Metastatic disease at presentation may be found in up to one-third of patients, with the lungs being the most common site of metastasis followed by the liver. Local extent and distant spread of disease may be determined by CT or magnetic resonance imaging (MRI) scans, which provide clear delineation of neoplastic and nonneoplastic tissues. 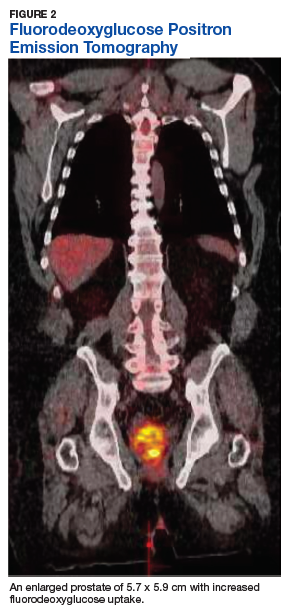
Treatment
Treatment regimens may include a multimodal approach of combination surgery, radiation, and chemotherapy. However, there are currently no standardized guidelines for treatment and the optimal therapy remains unknown.2,3,6 Surgery remains the mainstay of treatment, and patients with surgically resectable tumors are treated with curative intent. Surgeries performed include radical retropubic prostatectomy, radical cystoprostatectomy, suprapubic prostatectomy, and pelvic exenteration.2,5,8,12 These operations may be preceded or followed by radiation therapy and/or chemotherapy depending on extent of disease.
It has been reported that neo-adjuvant chemotherapy and/or radiotherapy can aid in decreasing tumor burden to facilitate a complete resection.2,8,13,14 Patients who are determined to not be candidates for surgery or whom have widespread disease may be offered systemic chemotherapy. Chemotherapy regimens vary, but common regimens include anthracyclines (doxorubicin or epirubicin), alkylating agents (cyclophosphamide, ifosfamide, dacarbazine), and/or vinca alkaloids (vinblastine or vincristine). Patients who do not receive surgical intervention rarely achieve a sustained remission.3,5,8
The long-term prognosis of prostatic leiomyosarcoma is poor due to the aggressive nature of the neoplasm and the high chance of disease recurrence or metastasis. Median survival is estimated at 17 months, and from 50% to 75% of patients die within 2 to 5 years of diagnosis.2,3 Prognosis may be improved in patients with localized disease at diagnosis who are candidates for complete surgical resection with negative margins.13 Adverse prognostic factors include metastatic disease at presentation and the presence of positive surgical margins after surgery.
Overall survival is very poor, and it is estimated that the 1-, 3-, and 5-year survival rates are 68%, 34%, and 26%, respectively.3 However, some studies estimate the 5-year survival to be anywhere from 0 to 60%.8,9 Due to the substantially high risk of death, prostatic leiomyosarcoma may be one of the most aggressive and poorly prognostic malignancies involving the prostate.
Conclusion
Prostatic leiomyosarcoma poses a unique diagnostic challenge, as clinical presentation alone may not always be suggestive of underlying malignancy. This challenge is further exacerbated by its aggressive nature, high risk of metastasis, and difficulties with unclear treatment. Proper history and physical examination, differential diagnosis, and a multidisciplinary approach to patient care are the foundation for early detection and promoting improved survival.
Author disclosures
The authors report no actual or potential conflicts of interest with regard to this article.
Disclaimer
The opinions expressed herein are those of the authors and do not necessarily reflect those of Federal Practitioner, Frontline Medical Communications Inc., the US Government, or any of its agencies. This article may discuss unlabeled or investigational use of certain drugs. Please review the complete prescribing information for specific drugs or drug combinations—including indications, contraindications, warnings, and adverse effects—before administering pharmacologic therapy to patients.
1. Miedler JD, MacLennan GT. Leiomyosarcoma of the prostate. J Urol. 2007;178(2):668.
2. Zazzara M, Divenuto L, Scarcia M, Cardo G, Maselli FP, Ludovico GM. Leiomyosarcoma of prostate: case report and literature review. Urol Case Rep. 2018;17:4-6.
3. Vandoros GP, Manolidis T, Karamouzis MV, et al. Leiomyosarcoma of the prostate: case report and review of 54 previously published cases. Sarcoma. 2008;2008:458709.
4. Talapatra K, Nemade B, Bhutani R, et al. Recurrent episodes of hematuria: a rare presentation of leiomyosarcoma of prostate. J Cancer Res Ther. 2006;2(4):212-214.
5. Cheville JC, Dundore PA, Nascimento AG, et al. Leiomyosarcoma of the prostate. Report of 23 cases. Cancer. 1995;76(8):1422-1427.
6. Venyo AK. A review of the literature on primary leiomyosarcoma of the prostate gland. Adv Urol. 2015;2015:485786.
7. Stilgenbauer R, Benedict M, Bamshad R, Viduetsky A. Sarcoma of the prostate: sonographic findings and pathologic correlation. J Ultrasound Med. 2007;26(12):1789-1793.
8. Sexton WJ, Lance RE, Reyes AO, Pisters PW, Tu SM, Pisters LL. Adult prostate sarcoma: the M.D. Anderson Cancer Center experience. J Urol. 2001;166(2):521-525.
9. Singh JP, Chakraborty D, Bera MK, Pal D. Leiomyosarcoma of prostate: a rare, aggressive tumor. J Cancer Res Ther. 2013;9(4):743-745.
10. Hansel DE, Herawi M, Montgomery E, Epstein JI. Spindle cell lesions of the adult prostate. Mod Pathol. 2007;20(1):148-158.
11. Punt SE, Eary JF, O'Sullivan J, Conrad EU. Fluorodeoxyglucose positron emission tomography in leiomyosarcoma: imaging characteristics. Nucl Med Commun. 2009;30(7):546-549.
12. Dotan ZA, Tal R, Golijanin D, et al. Adult genitourinary sarcoma: the 25-year Memorial Sloan-Kettering experience. J Urol. 2006;176(5):2033-2038.
13. Musser JE, Assel M, Mashni JW, Sjoberg DD, Russo P. Adult prostate sarcoma: the Memorial Sloan Kettering experience. Urology. 2014;84(3):624-628.
14. Janet NL, May AW, Akins RS. Sarcoma of the prostate: a single institutional review. Am J Clin Oncol. 2009;32:27-29
Prostatic leiomyosarcoma is an aggressive malignancy with a high risk of metastasis and a poor prognosis that poses unique diagnostic and treatment challenges.
Prostatic leiomyosarcoma is an aggressive malignancy with a high risk of metastasis and a poor prognosis that poses unique diagnostic and treatment challenges.
Prostatic leiomyosarcoma is a rare tumor.1 This neoplasm is composed of highly aggressive prostatic smooth muscle cells that present with nonspecific signs and symptoms mimicking other forms of prostatic pathology. Of the primary prostatic sarcomas, leiomyosarcoma represents the most common subtype in adults and is found in 38% to 52% of newly diagnosed prostate sarcoma.1,2 The prognosis is poor, and no clear guidelines exist regarding the optimal treatment approach. We report a case of prostate leiomyosarcoma and describe the disease characteristics, diagnostic modalities, and treatment approach regarding these rare malignancies.
Case Presentation
A 72-year-old male presented with 6 months of progressive severe lower urinary tract symptoms (LUTS) secondary to bladder outlet obstruction. The patient was refractory to medical management with combination α-blocker and 5-α-reductase inhibitor therapy and continued to require multiple emergent bladder catheterizations. Workup with urinalysis, blood biochemistry, and prostate specific antigen (PSA) levels were persistently normal. He reported no hematuria, weight loss, or perineal pain. The patient reported no history of tobacco use, exposure to hazardous chemicals, and had no family history of genitourinary cancers. On rectal exam, the prostate was firm and nodular, with induration noted along the right upper lobe of the prostate.
The patient was referred for a urology consultation and subsequently underwent transurethral resection of the prostate (TURP) for suspected severe benign prostatic hypertrophy (BPH). A histopathologic examination demonstrated atypical cytology consistent with high- grade leiomyosarcoma. Immunohistochemical analysis revealed positive staining for vimentin, smooth muscle actin, desmin (partial), cytokeratin, smooth muscle myosin, muscle specific actin, and Ki-67 (50%-60% expression).
Fluorodeoxyglucose positron emission tomography (FDG-PET) scan revealed a 5.7 x 5.9 cm tumor with a maximum standardized uptake value (SUVmax) of 12.6 in the right posterior prostate, without evidence of metastatic disease (Figures 1A and 1B).
Discussion
Originating from prostatic interstitial cells, prostatic leiomyosarcoma is a rare tumor that accounts for < 0.1% of all primary prostatic malignancies.1 Since its first description in 1950 by Riba and colleagues, < 200 cases have been reported worldwide.2 Among the sarcomas of the prostate, it is the most common tumor, accounting for around 38% to 52% of prostate sarcoma presentations.1,2
Patients typically present between the ages of 41 and 78 years (mean age 61 years).2,3 Signs and symptoms at presentation may vary; however, the most common symptoms are related to lower urinary tract obstruction (89.4% of patients). These symptoms include urinary frequency, urgency, nocturia, and may mimic the presentation of BPH.
Symptoms commonly associated with other malignancies, including constitutional symptoms such as weight loss, tend to occur less frequently or may be absent. Perineal or rectal pain may only be present in 25.6% of patients. Hematuria, burning on ejaculation, and constitutional symptoms are a less common presentation (< 10% of patients).3,4 PSA levels typically do not rise and are found to be within normal limits. The lack of PSA elevation is related to the tumors nonepithelial origin and may contribute to a delay in diagnosis.2,4,5
Diagnosis
Diagnosis may be further eluded as digital rectal exam (DRE) findings tend to reveal nonspecific enlargement of the prostate, resembling that of BPH. DRE may show a hard and firm prostate with nodular induration at the base or over the lobes of the prostate.6 At this stage a urology consultation is useful, as diagnosis is most commonly achieved using transrectal ultrasound (TRUS) with ultrasound-guided needle biopsy or after a TURP procedure.3
Prostate sarcoma is associated with markedly enlarged prostate volume, irregular margins with invasion, or heterogenous hypoechoic lesions on TRUS.7 Transperineal biopsy, computed tomography (CT)-guided biopsy, or suprapubic prostatectomy have been less frequently employed for diagnosis in previously reported cases.8 Specialized imaging modalities, such as CT scan or bone scan, do not show any specific findings with regards to these tumors; their role is limited to evaluation of the local and distant metastasis and for follow-up assessments.9 Transabdominal ultrasound may assess hydronephrosis or enlarged prostate and its relation to nearby structures, although it has not been shown to be helpful in establishing a specific diagnosis.6
Histologically, prostatic leiomyosarcoma is a distinct subtype of prostatic sarcoma. Other subtypes include stromal tumors such as rhabdomyosarcoma, fibrosarcoma, and spindle cell sarcoma.2 The majority of leiomyosarcomas are high-grade lesions demonstrating neoplastic spindle cells with nuclear atypia, multifocal necrosis, and cystic degeneration. Low-grade leiomyosarcomas are very rare.10 Immunohistochemistry is characteristically positive for vimentin, smooth muscle actin, and desmin expression. Cytokeratin may be positive in up to 25% of cases, whereas S-100, CD34, CD117, and PSA are negative.2,3 These histopathological findings help to differentiate leiomyosarcoma from other prostatic tumors.
Tumor size may vary greatly, and measurements have been reported to range from 3 cm to 21 cm, frequently presenting with invasion of local structures.11 Advanced stage disease is commonly found at initial diagnosis and is thought to be due to the lack of early specific symptoms. Metastatic disease at presentation may be found in up to one-third of patients, with the lungs being the most common site of metastasis followed by the liver. Local extent and distant spread of disease may be determined by CT or magnetic resonance imaging (MRI) scans, which provide clear delineation of neoplastic and nonneoplastic tissues.
Treatment
Treatment regimens may include a multimodal approach of combination surgery, radiation, and chemotherapy. However, there are currently no standardized guidelines for treatment and the optimal therapy remains unknown.2,3,6 Surgery remains the mainstay of treatment, and patients with surgically resectable tumors are treated with curative intent. Surgeries performed include radical retropubic prostatectomy, radical cystoprostatectomy, suprapubic prostatectomy, and pelvic exenteration.2,5,8,12 These operations may be preceded or followed by radiation therapy and/or chemotherapy depending on extent of disease.
It has been reported that neo-adjuvant chemotherapy and/or radiotherapy can aid in decreasing tumor burden to facilitate a complete resection.2,8,13,14 Patients who are determined to not be candidates for surgery or whom have widespread disease may be offered systemic chemotherapy. Chemotherapy regimens vary, but common regimens include anthracyclines (doxorubicin or epirubicin), alkylating agents (cyclophosphamide, ifosfamide, dacarbazine), and/or vinca alkaloids (vinblastine or vincristine). Patients who do not receive surgical intervention rarely achieve a sustained remission.3,5,8
The long-term prognosis of prostatic leiomyosarcoma is poor due to the aggressive nature of the neoplasm and the high chance of disease recurrence or metastasis. Median survival is estimated at 17 months, and from 50% to 75% of patients die within 2 to 5 years of diagnosis.2,3 Prognosis may be improved in patients with localized disease at diagnosis who are candidates for complete surgical resection with negative margins.13 Adverse prognostic factors include metastatic disease at presentation and the presence of positive surgical margins after surgery.
Overall survival is very poor, and it is estimated that the 1-, 3-, and 5-year survival rates are 68%, 34%, and 26%, respectively.3 However, some studies estimate the 5-year survival to be anywhere from 0 to 60%.8,9 Due to the substantially high risk of death, prostatic leiomyosarcoma may be one of the most aggressive and poorly prognostic malignancies involving the prostate.
Conclusion
Prostatic leiomyosarcoma poses a unique diagnostic challenge, as clinical presentation alone may not always be suggestive of underlying malignancy. This challenge is further exacerbated by its aggressive nature, high risk of metastasis, and difficulties with unclear treatment. Proper history and physical examination, differential diagnosis, and a multidisciplinary approach to patient care are the foundation for early detection and promoting improved survival.
Author disclosures
The authors report no actual or potential conflicts of interest with regard to this article.
Disclaimer
The opinions expressed herein are those of the authors and do not necessarily reflect those of Federal Practitioner, Frontline Medical Communications Inc., the US Government, or any of its agencies. This article may discuss unlabeled or investigational use of certain drugs. Please review the complete prescribing information for specific drugs or drug combinations—including indications, contraindications, warnings, and adverse effects—before administering pharmacologic therapy to patients.
1. Miedler JD, MacLennan GT. Leiomyosarcoma of the prostate. J Urol. 2007;178(2):668.
2. Zazzara M, Divenuto L, Scarcia M, Cardo G, Maselli FP, Ludovico GM. Leiomyosarcoma of prostate: case report and literature review. Urol Case Rep. 2018;17:4-6.
3. Vandoros GP, Manolidis T, Karamouzis MV, et al. Leiomyosarcoma of the prostate: case report and review of 54 previously published cases. Sarcoma. 2008;2008:458709.
4. Talapatra K, Nemade B, Bhutani R, et al. Recurrent episodes of hematuria: a rare presentation of leiomyosarcoma of prostate. J Cancer Res Ther. 2006;2(4):212-214.
5. Cheville JC, Dundore PA, Nascimento AG, et al. Leiomyosarcoma of the prostate. Report of 23 cases. Cancer. 1995;76(8):1422-1427.
6. Venyo AK. A review of the literature on primary leiomyosarcoma of the prostate gland. Adv Urol. 2015;2015:485786.
7. Stilgenbauer R, Benedict M, Bamshad R, Viduetsky A. Sarcoma of the prostate: sonographic findings and pathologic correlation. J Ultrasound Med. 2007;26(12):1789-1793.
8. Sexton WJ, Lance RE, Reyes AO, Pisters PW, Tu SM, Pisters LL. Adult prostate sarcoma: the M.D. Anderson Cancer Center experience. J Urol. 2001;166(2):521-525.
9. Singh JP, Chakraborty D, Bera MK, Pal D. Leiomyosarcoma of prostate: a rare, aggressive tumor. J Cancer Res Ther. 2013;9(4):743-745.
10. Hansel DE, Herawi M, Montgomery E, Epstein JI. Spindle cell lesions of the adult prostate. Mod Pathol. 2007;20(1):148-158.
11. Punt SE, Eary JF, O'Sullivan J, Conrad EU. Fluorodeoxyglucose positron emission tomography in leiomyosarcoma: imaging characteristics. Nucl Med Commun. 2009;30(7):546-549.
12. Dotan ZA, Tal R, Golijanin D, et al. Adult genitourinary sarcoma: the 25-year Memorial Sloan-Kettering experience. J Urol. 2006;176(5):2033-2038.
13. Musser JE, Assel M, Mashni JW, Sjoberg DD, Russo P. Adult prostate sarcoma: the Memorial Sloan Kettering experience. Urology. 2014;84(3):624-628.
14. Janet NL, May AW, Akins RS. Sarcoma of the prostate: a single institutional review. Am J Clin Oncol. 2009;32:27-29
Primary Urethral Carcinoma With Nodal Metastasis (FULL)
The presentation of a fungating penile mass often indicates penile carcinoma, but providers should be aware of urethral carcinoma in the differential diagnosis.
Primary urethral carcinoma (PUC) is a rare but morbid disease, representing < 1% of all urologic malignancies.1 Up to one-third of male patients may present with nodal metastases.2-4 The overall survival (OS) for all male PUC is < 50% at 5 years and is lower still in patients with nodal involvement.4
Although surgical intervention, including radical resection, has been a mainstay in disease management, the presence of high-stage disease may warrant multimodal treatment with chemotherapy, radiation, and surgery. Recent series have described success with neoadjuvant and adjuvant chemoradiation, yet the optimal regimen remains unestablished.5,6 Although nodal disease is commonly encountered with proximal, high-stage tumors, this case exhibits a rare presentation of a distal fungating penile mass with low pathologic stage but rapid progression to nodal disease.
Case Presentation
A male veteran aged 77 years with a history of diabetes mellitus and stroke presented with obstructive urinary symptoms, gross hematuria, and 15-pound weight loss. Examination revealed a distal penile mass with purulent exudate at the meatus but no inguinal lymphadenopathy. Two fragments of this mass detached during office cystoscopy, and pathology revealed high-grade urothelial cell carcinoma (UCC). A magnetic resonance image of the pelvis with and without IV contrast revealed a 2.4-cm tumor in the glans penis with possible extension into the subcutaneous connective tissue of the penis and penile skin, without invasion of the corpora cavernosa/spongiosum or lymphadenopathy (Figure 1). 
Prostatic urethral and random bladder biopsies, bilateral retrograde pyelograms, and selective ureteral washings revealed no abnormalities or signs of disease. Percutaneous biopsy of the inguinal node confirmed metastatic UCC. The patient underwent radical penectomy, creation of a perineal urethrostomy, and suprapubic cystostomy tube placement. Negative margins were confirmed on the urethral stump and corpus spongiosum. Final pathology revealed high-grade UCC with squamous differentiation on hematoxylin and eosin staining, arising from the penile urethra, invading the glans and corpus spongiosum, with no invasion of the corpus cavernosa (Figures 3 and 4).
Immunohistochemical stains were performed and strongly positive for cytokeratin 7 and p63. Final pathologic stage was described as pT2N1, with negative margins, indicating an American Joint Committee on Cancer classification of Stage III disease.7 The patient was referred postoperatively for adjuvant chemoradiation. 

Discussion
The low incidence of PUC, coupled with a high morbidity/mortality rate, creates a difficult scenario in choosing the best oncologic management for this disease. National guidelines stratify treatment algorithms by stage and location of primary tumor, as these were found to be the 2 most important prognostic factors for men.1 The location of the primary tumor is most often in the bulbomembranous urethra, but up to one-third occur in the pendulous urethra.2
A recent review reported that UCC is the most common histologic subtype.4 When considering the differential diagnosis, a distal penile mass may represent a malignant penile lesion, such as squamous cell carcinoma, Buschke-Lowenstein tumor, Kaposi sarcoma, or precancerous lesions. Additional benign and infectious disorders include epidermoid and retention cysts, leukoplakia, balanitis xerotica obliterans, condyloma acuminatum, chancre/chancroid, lymphogranuloma venereum, granuloma inguinale, and tuberculosis. Clinical workup typically includes physical examination, cystourethroscopy and biopsy, chest X-ray, and pelvic/abdominal cross-sectional imaging.9,10 Magnetic resonance imaging of the abdomen and pelvis is ideal in identifying soft tissue structures and extension of tumor.
In male patients with PUC, nodal metastases are commonly seen at initial presentation in up to one-third of patients, while distant metastases may be present in up to 6% at presentation.2-4 When tumors arise from the anterior urethra, the primary lymphatic drainage is first to the inguinal lymph nodes, whereas posterior tumors drain to the pelvic lymph nodes. A multivariate analysis of men with PUC within the Surveillance, Epidemiology, and End Results database demonstrated an OS across all stages to be 46.2% and 29.3% at 5 and 10 years, respectively. Increased likelihood of death was predicted by advanced age, high grade/stage, systemic metastases, non-UCC histology, and the lack of surgery.4
Surgical intervention, including radical resection via penectomy, has been the mainstay in disease management and was first described by Marshall in 1957 for bulbar urethral cancer.11 In 1998, Gheiler and colleagues demonstrated that surgical resection alone yielded excellent outcomes in patients with low-stage disease with 89% of patients disease free at mean 42 months. This was in stark contrast to patients with advanced stage disease (T3 or N+) who exhibited a disease-free survival rate of 42% at the same follow-up interval and benefited from combined chemoradiation and surgical resection.3
In the presence of high-stage disease, multimodal therapy with chemotherapy, radiation, and/or surgery is warranted. A study in 2008 reviewed chemoradiation in which patients with PUC received a 5-week protocol of external beam radiotherapy to the genitals, inguinal/pelvic lymph nodes, plus an additional radiation bolus to the primary tumor.5 In the 18 patients reported, 15 had complete response to therapy, and only 4 patients required salvage surgical resection. The 7-year survival for the cohort was 72% with chemoradiation alone, with about half the population recurring or progressing at 7 years. However, all patients that avoided surgical resection went on to develop urethral strictures that required surgical therapy, 3 of which required complex reconstructive procedures.
To place this survival into context, the 1999 study by Dalbagni and colleagues reported a 5-year OS of 42% when surgical resection alone was performed in 40/46 men with PUC.2 Last, a large retrospective series of 44 patients reported mostly advanced-stage patients with PUC and analyzed patients treated with chemotherapy based on histologic pathology. The results demonstrated a 72% overall response rate to neoadjuvant chemotherapy, with a median OS of 32 months in patients undergoing chemotherapy vs 46 months in patients who underwent subsequent surgery. This study solidified that for patients with PUC involving the lymph nodes; optimal treatment includes neoadjuvant cisplatin-based chemotherapy followed by surgical resection.6
As medicine and oncologic therapies become more individualized, physicians are looking to new immunologic agents for systemic therapy. Immune checkpoint inhibitors were approved by the US Food and Drug Administration for UCC of the bladder in 2016.12 Unfortunately, due to the rarity of PUC and the recent development of immune checkpoint inhibitors, there have been no published reports of these or other immunotherapies in PUC. However, given the histologic similarity and pathogenesis, checkpoint inhibitors may have a future indication in the systemic management of this disease.
Conclusion
This patient’s PUC represents a rare presentation of a distal urethral carcinoma, T2-staged tumor, with rapid progression to nodal metastases. Additionally, the presentation of a fungating penile mass would usually indicate penile carcinoma, but providers should be aware of urethral carcinoma in the differential diagnosis. Notably, the patient was found to have progression to lymph node involvement during a mere 2-month period.
Recent case series have published encouraging results with neoadjuvant chemotherapy or chemoradiation.5,6 However, radical resection in men with T2 to T4 disease is associated with significantly higher cancer-specific survival. Given our concern of a loss to follow-up, we felt that radical resection of the primary tumor and adjuvant chemoradiation represented the patient’s best oncologic outcomes. Therefore, he underwent radical penectomy and creation of a perineal urethrostomy. As of his 6-month follow-up, he showed no evidence of disease, had returned to his preoperative functional status, and was referred for chemoradiation.
Author disclosures
The authors report no actual or potential conflicts of interest with regard to this article.
Disclaimer
The opinions expressed herein are those of the authors and do not necessarily reflect those of Federal Practitioner, Frontline Medical Communications Inc., the US Government, or any of its agencies. This article may discuss unlabeled or investigational use of certain drugs. Please review the complete prescribing information for specific drugs or drug combinations—including indications, contraindications, warnings, and adverse effects—before administering pharmacologic therapy to patients.
1. Swartz MA, Porter MP, Lin DW, Weiss NS. Incidence of primary urethral carcinoma in the United States. Urology. 2006;68(6):1164-1168.
2. Dalbagni G, Zhang ZF, Lacombe L, Herr HW. Male urethral carcinoma: analysis of treatment outcome. Urology. 1999;53(6):1126-1132.
3. Gheiler EL, Tefilli MV, Tiguert R, de Oliveira JG, Pontes JE, Wood DP Jr. Management of primary urethral cancer. Urology. 1998;52(3):487-493.
4. Rabbani F. Prognostic factors in male urethral cancer. Cancer. 2011;117(11):2426-2434.
5. Cohen MS, Triaca V, Billmeyer B, et al. Coordinated chemoradiation therapy with genital preservation for the treatment of primary invasive carcinoma of the male urethra. J Urol. 2008;179(2):536-541; discussion 541.
6. Dayyani F, Pettaway CA, Kamat AM, Munsell MF, Sircar K, Pagliaro LC. Retrospective analysis of survival outcomes and the role of cisplatin-based chemotherapy in patients with urethral carcinomas referred to medical oncologists. Urol Oncol. 2013;31(7):1171-1177.
7. American Joint Committee on Cancer. AJCC cancer staging manual. 8th ed. https://cancerstaging.org/references-tools/deskreferences/Documents/AJCC%20Cancer%20Staging%20Form%20Supplement.pdf. Updated June 5, 2018. Accessed January 22, 2019.
8. Gakis G, Witjes JA, Compérat E, et al. European Association of Urology guidelines on primary urethral carcinoma. https://uroweb.org/wp-content/uploads/EAU-Guidelines-Primary-Urethral-Carcinoma-2016-1.pdf. Updated March 2015. Accessed January 22, 2019
9. National Comprehensive Cancer Network. Bladder Cancer. Version 1.2019. https://www.nccn.org/professionals/physician_gls/pdf/bladder.pdf. Updated December 20, 2018. Accessed January 17, 2019.
10. Dayyani F, Hoffman K, Eifel P, et al. Management of advanced primary urethral carcinomas. BJU Int. 2014;114(1):25-31.
11. Marshall VF. Radical excision of locally extensive carcinoma of the deep male urethra. J Urol. 1957;78(3):252-264.
12. Hsu FS, Su CH, Huang KH. A comprehensive review of US FDA-approved immune checkpoint inhibitors in urothelial carcinoma. J Immunol Res. 2017;2017:6940546.
The presentation of a fungating penile mass often indicates penile carcinoma, but providers should be aware of urethral carcinoma in the differential diagnosis.
The presentation of a fungating penile mass often indicates penile carcinoma, but providers should be aware of urethral carcinoma in the differential diagnosis.
Primary urethral carcinoma (PUC) is a rare but morbid disease, representing < 1% of all urologic malignancies.1 Up to one-third of male patients may present with nodal metastases.2-4 The overall survival (OS) for all male PUC is < 50% at 5 years and is lower still in patients with nodal involvement.4
Although surgical intervention, including radical resection, has been a mainstay in disease management, the presence of high-stage disease may warrant multimodal treatment with chemotherapy, radiation, and surgery. Recent series have described success with neoadjuvant and adjuvant chemoradiation, yet the optimal regimen remains unestablished.5,6 Although nodal disease is commonly encountered with proximal, high-stage tumors, this case exhibits a rare presentation of a distal fungating penile mass with low pathologic stage but rapid progression to nodal disease.
Case Presentation
A male veteran aged 77 years with a history of diabetes mellitus and stroke presented with obstructive urinary symptoms, gross hematuria, and 15-pound weight loss. Examination revealed a distal penile mass with purulent exudate at the meatus but no inguinal lymphadenopathy. Two fragments of this mass detached during office cystoscopy, and pathology revealed high-grade urothelial cell carcinoma (UCC). A magnetic resonance image of the pelvis with and without IV contrast revealed a 2.4-cm tumor in the glans penis with possible extension into the subcutaneous connective tissue of the penis and penile skin, without invasion of the corpora cavernosa/spongiosum or lymphadenopathy (Figure 1).
Prostatic urethral and random bladder biopsies, bilateral retrograde pyelograms, and selective ureteral washings revealed no abnormalities or signs of disease. Percutaneous biopsy of the inguinal node confirmed metastatic UCC. The patient underwent radical penectomy, creation of a perineal urethrostomy, and suprapubic cystostomy tube placement. Negative margins were confirmed on the urethral stump and corpus spongiosum. Final pathology revealed high-grade UCC with squamous differentiation on hematoxylin and eosin staining, arising from the penile urethra, invading the glans and corpus spongiosum, with no invasion of the corpus cavernosa (Figures 3 and 4).
Immunohistochemical stains were performed and strongly positive for cytokeratin 7 and p63. Final pathologic stage was described as pT2N1, with negative margins, indicating an American Joint Committee on Cancer classification of Stage III disease.7 The patient was referred postoperatively for adjuvant chemoradiation.
Discussion
The low incidence of PUC, coupled with a high morbidity/mortality rate, creates a difficult scenario in choosing the best oncologic management for this disease. National guidelines stratify treatment algorithms by stage and location of primary tumor, as these were found to be the 2 most important prognostic factors for men.1 The location of the primary tumor is most often in the bulbomembranous urethra, but up to one-third occur in the pendulous urethra.2
A recent review reported that UCC is the most common histologic subtype.4 When considering the differential diagnosis, a distal penile mass may represent a malignant penile lesion, such as squamous cell carcinoma, Buschke-Lowenstein tumor, Kaposi sarcoma, or precancerous lesions. Additional benign and infectious disorders include epidermoid and retention cysts, leukoplakia, balanitis xerotica obliterans, condyloma acuminatum, chancre/chancroid, lymphogranuloma venereum, granuloma inguinale, and tuberculosis. Clinical workup typically includes physical examination, cystourethroscopy and biopsy, chest X-ray, and pelvic/abdominal cross-sectional imaging.9,10 Magnetic resonance imaging of the abdomen and pelvis is ideal in identifying soft tissue structures and extension of tumor.
In male patients with PUC, nodal metastases are commonly seen at initial presentation in up to one-third of patients, while distant metastases may be present in up to 6% at presentation.2-4 When tumors arise from the anterior urethra, the primary lymphatic drainage is first to the inguinal lymph nodes, whereas posterior tumors drain to the pelvic lymph nodes. A multivariate analysis of men with PUC within the Surveillance, Epidemiology, and End Results database demonstrated an OS across all stages to be 46.2% and 29.3% at 5 and 10 years, respectively. Increased likelihood of death was predicted by advanced age, high grade/stage, systemic metastases, non-UCC histology, and the lack of surgery.4
Surgical intervention, including radical resection via penectomy, has been the mainstay in disease management and was first described by Marshall in 1957 for bulbar urethral cancer.11 In 1998, Gheiler and colleagues demonstrated that surgical resection alone yielded excellent outcomes in patients with low-stage disease with 89% of patients disease free at mean 42 months. This was in stark contrast to patients with advanced stage disease (T3 or N+) who exhibited a disease-free survival rate of 42% at the same follow-up interval and benefited from combined chemoradiation and surgical resection.3
In the presence of high-stage disease, multimodal therapy with chemotherapy, radiation, and/or surgery is warranted. A study in 2008 reviewed chemoradiation in which patients with PUC received a 5-week protocol of external beam radiotherapy to the genitals, inguinal/pelvic lymph nodes, plus an additional radiation bolus to the primary tumor.5 In the 18 patients reported, 15 had complete response to therapy, and only 4 patients required salvage surgical resection. The 7-year survival for the cohort was 72% with chemoradiation alone, with about half the population recurring or progressing at 7 years. However, all patients that avoided surgical resection went on to develop urethral strictures that required surgical therapy, 3 of which required complex reconstructive procedures.
To place this survival into context, the 1999 study by Dalbagni and colleagues reported a 5-year OS of 42% when surgical resection alone was performed in 40/46 men with PUC.2 Last, a large retrospective series of 44 patients reported mostly advanced-stage patients with PUC and analyzed patients treated with chemotherapy based on histologic pathology. The results demonstrated a 72% overall response rate to neoadjuvant chemotherapy, with a median OS of 32 months in patients undergoing chemotherapy vs 46 months in patients who underwent subsequent surgery. This study solidified that for patients with PUC involving the lymph nodes; optimal treatment includes neoadjuvant cisplatin-based chemotherapy followed by surgical resection.6
As medicine and oncologic therapies become more individualized, physicians are looking to new immunologic agents for systemic therapy. Immune checkpoint inhibitors were approved by the US Food and Drug Administration for UCC of the bladder in 2016.12 Unfortunately, due to the rarity of PUC and the recent development of immune checkpoint inhibitors, there have been no published reports of these or other immunotherapies in PUC. However, given the histologic similarity and pathogenesis, checkpoint inhibitors may have a future indication in the systemic management of this disease.
Conclusion
This patient’s PUC represents a rare presentation of a distal urethral carcinoma, T2-staged tumor, with rapid progression to nodal metastases. Additionally, the presentation of a fungating penile mass would usually indicate penile carcinoma, but providers should be aware of urethral carcinoma in the differential diagnosis. Notably, the patient was found to have progression to lymph node involvement during a mere 2-month period.
Recent case series have published encouraging results with neoadjuvant chemotherapy or chemoradiation.5,6 However, radical resection in men with T2 to T4 disease is associated with significantly higher cancer-specific survival. Given our concern of a loss to follow-up, we felt that radical resection of the primary tumor and adjuvant chemoradiation represented the patient’s best oncologic outcomes. Therefore, he underwent radical penectomy and creation of a perineal urethrostomy. As of his 6-month follow-up, he showed no evidence of disease, had returned to his preoperative functional status, and was referred for chemoradiation.
Author disclosures
The authors report no actual or potential conflicts of interest with regard to this article.
Disclaimer
The opinions expressed herein are those of the authors and do not necessarily reflect those of Federal Practitioner, Frontline Medical Communications Inc., the US Government, or any of its agencies. This article may discuss unlabeled or investigational use of certain drugs. Please review the complete prescribing information for specific drugs or drug combinations—including indications, contraindications, warnings, and adverse effects—before administering pharmacologic therapy to patients.
1. Swartz MA, Porter MP, Lin DW, Weiss NS. Incidence of primary urethral carcinoma in the United States. Urology. 2006;68(6):1164-1168.
2. Dalbagni G, Zhang ZF, Lacombe L, Herr HW. Male urethral carcinoma: analysis of treatment outcome. Urology. 1999;53(6):1126-1132.
3. Gheiler EL, Tefilli MV, Tiguert R, de Oliveira JG, Pontes JE, Wood DP Jr. Management of primary urethral cancer. Urology. 1998;52(3):487-493.
4. Rabbani F. Prognostic factors in male urethral cancer. Cancer. 2011;117(11):2426-2434.
5. Cohen MS, Triaca V, Billmeyer B, et al. Coordinated chemoradiation therapy with genital preservation for the treatment of primary invasive carcinoma of the male urethra. J Urol. 2008;179(2):536-541; discussion 541.
6. Dayyani F, Pettaway CA, Kamat AM, Munsell MF, Sircar K, Pagliaro LC. Retrospective analysis of survival outcomes and the role of cisplatin-based chemotherapy in patients with urethral carcinomas referred to medical oncologists. Urol Oncol. 2013;31(7):1171-1177.
7. American Joint Committee on Cancer. AJCC cancer staging manual. 8th ed. https://cancerstaging.org/references-tools/deskreferences/Documents/AJCC%20Cancer%20Staging%20Form%20Supplement.pdf. Updated June 5, 2018. Accessed January 22, 2019.
8. Gakis G, Witjes JA, Compérat E, et al. European Association of Urology guidelines on primary urethral carcinoma. https://uroweb.org/wp-content/uploads/EAU-Guidelines-Primary-Urethral-Carcinoma-2016-1.pdf. Updated March 2015. Accessed January 22, 2019
9. National Comprehensive Cancer Network. Bladder Cancer. Version 1.2019. https://www.nccn.org/professionals/physician_gls/pdf/bladder.pdf. Updated December 20, 2018. Accessed January 17, 2019.
10. Dayyani F, Hoffman K, Eifel P, et al. Management of advanced primary urethral carcinomas. BJU Int. 2014;114(1):25-31.
11. Marshall VF. Radical excision of locally extensive carcinoma of the deep male urethra. J Urol. 1957;78(3):252-264.
12. Hsu FS, Su CH, Huang KH. A comprehensive review of US FDA-approved immune checkpoint inhibitors in urothelial carcinoma. J Immunol Res. 2017;2017:6940546.
Skeletal-Related Events in Patients With Multiple Myeloma and Prostate Cancer Who Receive Standard vs Extended-Interval Bisphosphonate Dosing (FULL)
In patients with multiple myeloma and prostate cancer, extending the bisphosphonatedosing interval may help decrease medication-related morbidity without compromising therapeutic benefit.
Bone pain is one of the most common causes of morbidity in multiple myeloma (MM) and metastatic prostate cancer (CaP). This pain originates with the underlying pathologic processes of the cancer and with downstream skeletal-related events (SREs). SREs—fractures, spinal cord compression, and irradiation or surgery performed in ≥ 1 bone sites—represent a significant health care burden, particularly given the incidence of the underlying malignancies. According to American Cancer Society statistics, CaP is the second most common cancer in American men, and MM the second most common hematologic malignancy, despite its relatively low overall lifetime risk.1,2 Regardless of the underlying malignancy, bisphosphonates are the cornerstone of SRE prevention, though the optimal dosing strategy is the subject of clinical debate.
Although similar in SRE incidence, MM and CaP have distinct pathophysiologic processes in the dysregulation of bone resorption. MM is a hematologic malignancy that increases the risk of SREs by osteoclast up-regulation, primarily through the RANK (receptor activator of nuclear factor α-B) signaling pathway.3 CaP is a solid tumor malignancy that metastasizes to bone. Dysregulation of the bone resorption or formation cycle and net bone loss are a result of endogenous osteoclast up-regulation in response to abnormal bone formation in osteoblastic bone metastases.4 Androgen-deprivation therapy, the cornerstone of CaP treatment, further predisposes CaP patients to osteoporosis and SREs.
Prevention of SREs is pharmacologically driven by bisphosphonates, which have antiresorptive effects on bone through promotion of osteoclast apoptosis.5 Two IV formulations, pamidronate and zoledronic acid (ZA), are US Food and Drug Administration approved for use in bone metastases from MM or solid tumors.6-10 Although generally well tolerated, bisphosphonates can cause osteonecrosis of the jaw (ONJ), an avascular death of bone tissue, particularly with prolonged use.11 With its documented incidence of 5% to 6.7% in bone metastasis, ONJ represents a significant morbidity risk in patients with MM and CaP who are treated with IV bisphosphonates.12
Investigators are exploring bisphosphonate dosing intervals to determine which is most appropriate in mitigating the risk of ONJ. Before 2006, bisphosphonates were consistently dosed once monthly in patients with MM or metastatic bone disease—a standard derived empirically rather than from comparative studies or compelling pharmacodynamic data.13-15 In a 2006 consensus statement, the Mayo Clinic issued an expert opinion recommendation for increasing the bisphosphonate dosing interval to every 3 months in patients with MM.16 The first objective evidence for the clinical applicability of extending the ZA dosing interval was reported by Himelstein and colleagues in 2017.17 The randomized clinical trial found no differences in SRE rates when ZA was dosed every 12 weeks,17 prompting a conditional recommendation for dosing interval extension in the American Society of Clinical Oncology MM treatment guidelines (2018).13 Because of the age and racial demographics of the patients in these studies, many questions remain unanswered.
For the US Department of Veterans Affairs (VA) population, the pharmacokinetic and dynamic differences imposed by age and race limit the applicability of the available data. However, in veterans with MM or CaP, extending the bisphosphonate dosing interval may help decrease medication-related morbidity (eg, ONJ, nephrotoxicity) without compromising therapeutic benefit. To this end at the Memphis VA Medical Center (VAMC), we assessed for differences in SRE rates by comparing outcomes of patients who received ZA in standard- vs extended-interval dosing.
Methods
We retrospectively reviewed the Computerized Patient Record System for veterans with MM or metastatic CaP treated with ZA at the Memphis VAMC. Study inclusion criteria were aged > 18 years and care provided by a Memphis VAMC oncologist between January 2003 and January 2018. The study was approved by the Memphis VAMC’s Institutional Review Board, and procedures were followed in accordance with the ethical standards of its committee on human experimentation.
Using Microsoft SQL 2016 (Redmond, WA), we performed a query to identify patients who were prescribed ZA during the study period. Exclusion criteria were ZA prescribed for an indication other than MM or CaP (ie, osteoporosis) and receipt of ≤ 1 dose of ZA. Once a list was compiled, patients were stratified by ZA dosing interval: standard (mean, every month) or extended (mean, every 3 months). Patients whose ZA dosing interval was changed during treatment were included as independent data points in each group.
Skeletal-related events included fractures, spinal compression, irradiation, and surgery. Fractures and spinal compression were pertinent in the presence of radiographic documentation (eg, X-ray, magnetic resonance imaging scan) during the period the patient received ZA or within 1 dosing interval of the last recorded ZA dose. Irradiation was defined as documented application of radiation therapy to ≥ 1 bone sites for palliation of pain or as an intervention in the setting of spinal compression. Surgery was defined as any procedure performed to correct a fracture or spinal compression. Each SRE was counted as a single occurrence.
Osteonecrosis of the jaw was defined as radiographically documented necrosis of the mandible or associated structures with assessment by a VA dentist. Records from non-VA dental practices were not available for assessment. Documentation of dental assessment before the first dose of ZA and any assessments during treatment were recorded.
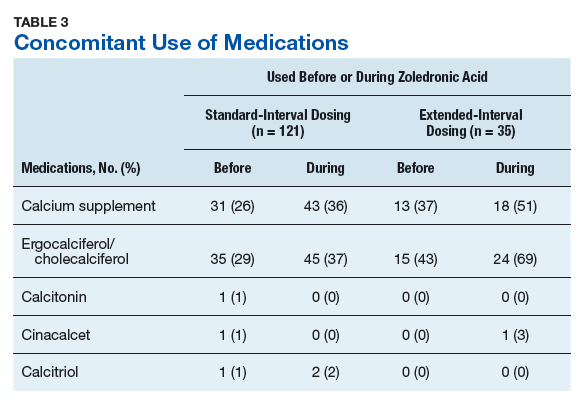
Medication use was assessed before and during ZA treatment. Number of ZA doses and reasons for any discontinuations were documented, as was concomitant use of calcium supplements, vitamin D supplements, calcitriol, paricalcitol, calcitonin, cinacalcet, and pamidronate.
The primary study outcome was observed difference in incidence of SREs between standard- and extended-interval dosing of ZA. Secondary outcomes included difference in incidence of ONJ as well as incidence of SREs and ONJ by disease subtype (MM, CaP).
Descriptive statistics were used to summarize demographic data and assess prespecified outcomes. Differences in rates of SREs and ONJ between dosing interval groups were analyzed with the Pearson χ2 test. The predetermined a priori level of significance was .05.
Results
Of the 300 patients prescribed ZA at the Memphis VAMC, 177 were excluded (96 for indication,78 for receiving only 1 dose of ZA, 3 for not receiving any doses of ZA). The remaining 123 patients were stratified into a standard-interval dosing group (121) and an extended-interval dosing group (35). Of the 123 patients, 33 received both standard- and extended-interval dosing of ZA over the course of the study period and were included discretely in each group for the duration of each dosing strategy. 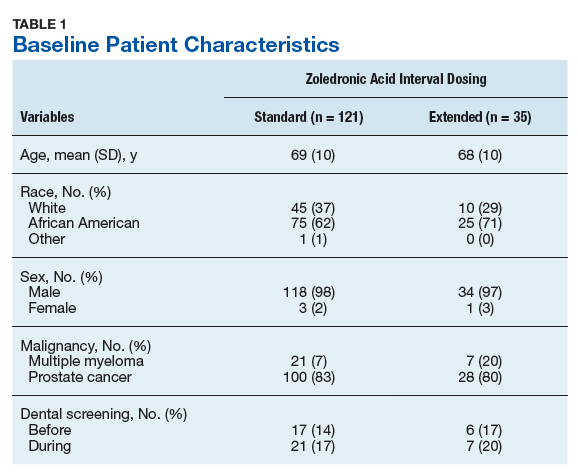
Pre-ZA dental screenings were documented in 14% of standard-interval patients and 17% of extended-interval patients, and during-ZA screenings were documented in 17% of standard-interval patients and 20% of extended-interval patients. Chi-square analysis revealed no significant difference in rates of dental screening before or during use of ZA.
Standard-interval patients received a mean (SD) 11.4 (13.5) doses of ZA (range, 2-124). Extended-interval patients received a mean (SD) of 5.9 (3.18) doses (range, 2-14). All standard-interval patients had discontinued treatment at the time of the study, most commonly because of death or for an unknown reason. Sixty percent of extended-interval patients had discontinued treatment, most commonly because of patient/physician choice or for an unknown reason (Table 2). 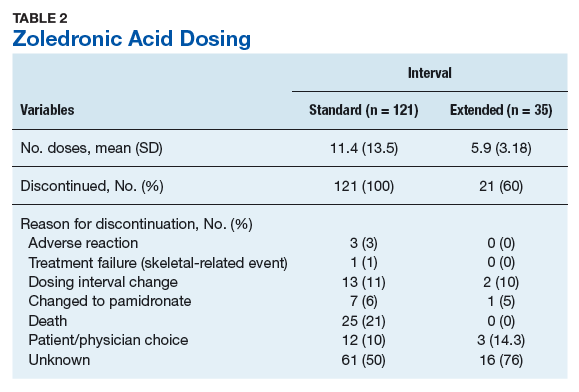
Skeletal-related events were observed in 31% of standard-interval patients and 23% of extended-interval patients. There were no statistically significant differences in SRE rates between groups (P = .374). The most common SRE in both groups was bone irradiation (42% and 60%, respectively), with no statistically significant difference in proportion between groups (Table 4). 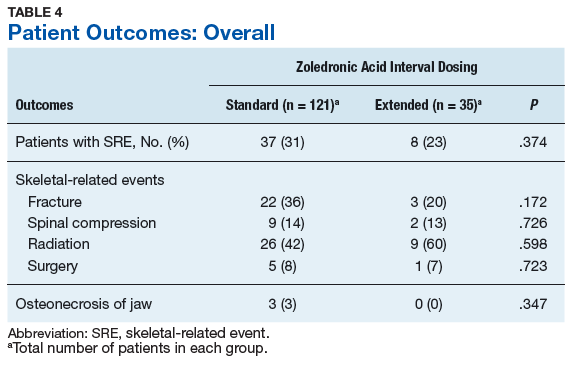
Discussion
This retrospective review of patients with MM and CaP receiving ZA for bone metastasesfound no differences in the rates of SREs when ZA was dosed monthly vs every 3 months. 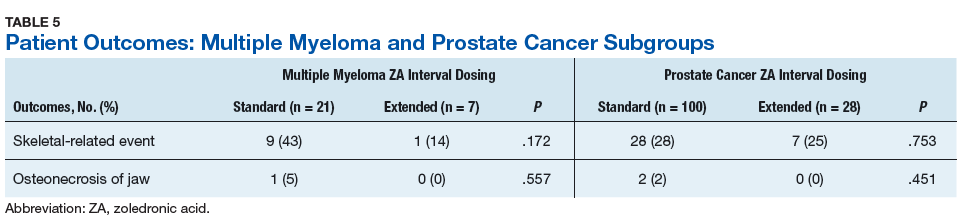
Earlier studies found that ZA can decrease SRE rates, but a major concern is that frequent, prolonged exposure to IV bisphosphonates may increase the risk of ONJ. No significant differences in ONJ rates existed between dosing groups, but all documented cases of ONJ occurred in the standard-interval group, suggesting a trend toward decreased incidence with an extension of the dosing interval.
Limitations
This study had several limitations. Geriatric African American men comprised the majority of the study population, and patients with MM accounted for only 22% of included regimens, limiting external validity. Patient overlap between groups may have confounded the results. The retrospective design precluded the ability to control for confounding variables, such as concomitant medication use and medication adherence, and significant heterogeneity was noted in rates of adherence with ZA infusion schedules regardless of dosing group. Use of medications associated with increased risk of osteoporosis—including corticosteroids and proton pump inhibitors—was not assessed.
Assessment of ONJ incidence was limited by the lack of access to dental records from providers outside the VA. Many patients in this review were not eligible for VA dental benefits because of requirements involving time and service connection, a reimbursement measurement that reflects health conditions “incurred or aggravated during active military service.”18
The results of this study provide further support for extended-interval dosing of ZA as a potential method of increasing patient adherence and decreasing the possibility of adverse drug reactions without compromising therapeutic benefit. Further randomized controlled trials are needed to define the potential decrease in ONJ incidence.
Conclusion
In comparisons of standard- and extended-interval dosing of ZA, there was no difference in the incidence of skeletal-related events in veteran patients with bone metastases from MM or CaP.
Author disclosures
The authors report no actual or potential conflicts of interest with regard to this article.
Disclaimer
The opinions expressed herein are those of the authors and do not necessarily reflect those of Federal Practitioner, Frontline Medical Communications Inc., the US Government, or any of its agencies. This article may discuss unlabeled or investigational use of certain drugs. Please review the complete prescribing information for specific drugs or drug combinations—including indications, contraindications, warnings, and adverse effects—before administering pharmacologic therapy to patients.
1. American Cancer Society. Cancer Facts & Figures 2018. Atlanta, GA: American Cancer Society; 2018.
2. Howlader N, Noone AM, Krapcho M, et al, eds. SEER Cancer Statistics Review (CSR), 1975-2014 [based on November 2016 SEER data submission posted to SEER website April 2017]. Bethesda, MD: National Cancer Institute; 2017. https://seer.cancer.gov/archive/csr/1975_2014/. Accessed January 12, 2019.
3. Roodman GD. Pathogenesis of myeloma bone disease. Leukemia. 2009;23(3):435-441.
4. Sartor O, de Bono JS. Metastatic prostate cancer. N Engl J Med. 2018;378(7):645-657.
5. Drake MT, Clarke BL, Khosla S. Bisphosphonates: mechanism of action and role in clinical practice. Mayo Clin Proc. 2008;83(9):1032-1045.
6. Zometa [package insert]. East Hanover, NJ: Novartis; 2016.
7. Aredia [package insert]. East Hanover, NJ: Novartis; 2011.
8. Berenson JR, Rosen LS, Howell A, et al. Zoledronic acid reduces skeletal-related events in patients with osteolytic metastases: a double-blind, randomized dose-response study [published correction appears in Cancer. 2001;91(10):1956]. Cancer. 2001;91(7):1191-1200.
9. Berenson JR, Lichtenstein A, Porter L, et al. Efficacy of pamidronate in reducing skeletal events in patients with advanced multiple myeloma. Myeloma Aredia Study Group. N Engl J Med. 1996;334(8):488-493.
10. Mhaskar R, Redzepovic J, Wheatley K, et al. Bisphosphonates in multiple myeloma: a network meta-analysis. Cochrane Database Syst Rev. 2012;(5):CD003188.
11. Wu S, Dahut WL, Gulley JL. The use of bisphosphonates in cancer patients. Acta Oncol. 2007;46(5):581-591.
12. Bamias A, Kastritis E, Bamia C, et al. Osteonecrosis of the jaw in cancer after treatment with bisphosphonates: incidence and risk factors. J Clin Oncol. 2005;23(34):8580-8587.
13. Anderson K, Ismaila N, Flynn PJ, et al. Role of bone-modifying agents in multiple myeloma: American Society of Clinical Oncology clinical practice guideline update. J Clin Oncol. 2018;36(8):812-818.
14. National Comprehensive Cancer Network Clinical Practice Guidelines in Oncology (NCCN Guidelines). Multiple Myeloma. Version 2.2019. https://www.nccn.org/professionals/physician_gls/pdf/myeloma.pdf. Accessed January 29, 2019.
15. National Comprehensive Cancer Network Clinical Practice Guidelines in Oncology (NCCN Guidelines). Prostate Cancer. Version 4.2018. https://www.nccn.org/professionals/physician_gls/pdf/prostate.pdf. Accessed January 29, 2019.
16. Lacy MQ, Dispenzieri A, Gertz MA, et al. Mayo Clinic consensus statement for the use of bisphosphonates in multiple myeloma. Mayo Clin Proc. 2006;81(8):1047-1053.
17. Himelstein AL, Foster JC, Khatcheressian JL, et al. Effect of longer-interval vs. standard dosing of zoledronic acid on skeletal events in patients with bone metastases: a randomized clinical trial. JAMA. 2017;317(1):48-58.
18. Office of Public and Intergovernmental Affairs, US Department of Veterans Affairs. Service connected disabilities. In: Federal Benefits for Veterans, Dependents, and Survivors. https://www.va.gov/opa/publications/benefits_book/benefits_chap02.asp. Published April 2015. Accessed May 22, 2018.
In patients with multiple myeloma and prostate cancer, extending the bisphosphonatedosing interval may help decrease medication-related morbidity without compromising therapeutic benefit.
In patients with multiple myeloma and prostate cancer, extending the bisphosphonatedosing interval may help decrease medication-related morbidity without compromising therapeutic benefit.
Bone pain is one of the most common causes of morbidity in multiple myeloma (MM) and metastatic prostate cancer (CaP). This pain originates with the underlying pathologic processes of the cancer and with downstream skeletal-related events (SREs). SREs—fractures, spinal cord compression, and irradiation or surgery performed in ≥ 1 bone sites—represent a significant health care burden, particularly given the incidence of the underlying malignancies. According to American Cancer Society statistics, CaP is the second most common cancer in American men, and MM the second most common hematologic malignancy, despite its relatively low overall lifetime risk.1,2 Regardless of the underlying malignancy, bisphosphonates are the cornerstone of SRE prevention, though the optimal dosing strategy is the subject of clinical debate.
Although similar in SRE incidence, MM and CaP have distinct pathophysiologic processes in the dysregulation of bone resorption. MM is a hematologic malignancy that increases the risk of SREs by osteoclast up-regulation, primarily through the RANK (receptor activator of nuclear factor α-B) signaling pathway.3 CaP is a solid tumor malignancy that metastasizes to bone. Dysregulation of the bone resorption or formation cycle and net bone loss are a result of endogenous osteoclast up-regulation in response to abnormal bone formation in osteoblastic bone metastases.4 Androgen-deprivation therapy, the cornerstone of CaP treatment, further predisposes CaP patients to osteoporosis and SREs.
Prevention of SREs is pharmacologically driven by bisphosphonates, which have antiresorptive effects on bone through promotion of osteoclast apoptosis.5 Two IV formulations, pamidronate and zoledronic acid (ZA), are US Food and Drug Administration approved for use in bone metastases from MM or solid tumors.6-10 Although generally well tolerated, bisphosphonates can cause osteonecrosis of the jaw (ONJ), an avascular death of bone tissue, particularly with prolonged use.11 With its documented incidence of 5% to 6.7% in bone metastasis, ONJ represents a significant morbidity risk in patients with MM and CaP who are treated with IV bisphosphonates.12
Investigators are exploring bisphosphonate dosing intervals to determine which is most appropriate in mitigating the risk of ONJ. Before 2006, bisphosphonates were consistently dosed once monthly in patients with MM or metastatic bone disease—a standard derived empirically rather than from comparative studies or compelling pharmacodynamic data.13-15 In a 2006 consensus statement, the Mayo Clinic issued an expert opinion recommendation for increasing the bisphosphonate dosing interval to every 3 months in patients with MM.16 The first objective evidence for the clinical applicability of extending the ZA dosing interval was reported by Himelstein and colleagues in 2017.17 The randomized clinical trial found no differences in SRE rates when ZA was dosed every 12 weeks,17 prompting a conditional recommendation for dosing interval extension in the American Society of Clinical Oncology MM treatment guidelines (2018).13 Because of the age and racial demographics of the patients in these studies, many questions remain unanswered.
For the US Department of Veterans Affairs (VA) population, the pharmacokinetic and dynamic differences imposed by age and race limit the applicability of the available data. However, in veterans with MM or CaP, extending the bisphosphonate dosing interval may help decrease medication-related morbidity (eg, ONJ, nephrotoxicity) without compromising therapeutic benefit. To this end at the Memphis VA Medical Center (VAMC), we assessed for differences in SRE rates by comparing outcomes of patients who received ZA in standard- vs extended-interval dosing.
Methods
We retrospectively reviewed the Computerized Patient Record System for veterans with MM or metastatic CaP treated with ZA at the Memphis VAMC. Study inclusion criteria were aged > 18 years and care provided by a Memphis VAMC oncologist between January 2003 and January 2018. The study was approved by the Memphis VAMC’s Institutional Review Board, and procedures were followed in accordance with the ethical standards of its committee on human experimentation.
Using Microsoft SQL 2016 (Redmond, WA), we performed a query to identify patients who were prescribed ZA during the study period. Exclusion criteria were ZA prescribed for an indication other than MM or CaP (ie, osteoporosis) and receipt of ≤ 1 dose of ZA. Once a list was compiled, patients were stratified by ZA dosing interval: standard (mean, every month) or extended (mean, every 3 months). Patients whose ZA dosing interval was changed during treatment were included as independent data points in each group.
Skeletal-related events included fractures, spinal compression, irradiation, and surgery. Fractures and spinal compression were pertinent in the presence of radiographic documentation (eg, X-ray, magnetic resonance imaging scan) during the period the patient received ZA or within 1 dosing interval of the last recorded ZA dose. Irradiation was defined as documented application of radiation therapy to ≥ 1 bone sites for palliation of pain or as an intervention in the setting of spinal compression. Surgery was defined as any procedure performed to correct a fracture or spinal compression. Each SRE was counted as a single occurrence.
Osteonecrosis of the jaw was defined as radiographically documented necrosis of the mandible or associated structures with assessment by a VA dentist. Records from non-VA dental practices were not available for assessment. Documentation of dental assessment before the first dose of ZA and any assessments during treatment were recorded.
Medication use was assessed before and during ZA treatment. Number of ZA doses and reasons for any discontinuations were documented, as was concomitant use of calcium supplements, vitamin D supplements, calcitriol, paricalcitol, calcitonin, cinacalcet, and pamidronate.
The primary study outcome was observed difference in incidence of SREs between standard- and extended-interval dosing of ZA. Secondary outcomes included difference in incidence of ONJ as well as incidence of SREs and ONJ by disease subtype (MM, CaP).
Descriptive statistics were used to summarize demographic data and assess prespecified outcomes. Differences in rates of SREs and ONJ between dosing interval groups were analyzed with the Pearson χ2 test. The predetermined a priori level of significance was .05.
Results
Of the 300 patients prescribed ZA at the Memphis VAMC, 177 were excluded (96 for indication,78 for receiving only 1 dose of ZA, 3 for not receiving any doses of ZA). The remaining 123 patients were stratified into a standard-interval dosing group (121) and an extended-interval dosing group (35). Of the 123 patients, 33 received both standard- and extended-interval dosing of ZA over the course of the study period and were included discretely in each group for the duration of each dosing strategy.
Pre-ZA dental screenings were documented in 14% of standard-interval patients and 17% of extended-interval patients, and during-ZA screenings were documented in 17% of standard-interval patients and 20% of extended-interval patients. Chi-square analysis revealed no significant difference in rates of dental screening before or during use of ZA.
Standard-interval patients received a mean (SD) 11.4 (13.5) doses of ZA (range, 2-124). Extended-interval patients received a mean (SD) of 5.9 (3.18) doses (range, 2-14). All standard-interval patients had discontinued treatment at the time of the study, most commonly because of death or for an unknown reason. Sixty percent of extended-interval patients had discontinued treatment, most commonly because of patient/physician choice or for an unknown reason (Table 2).
Skeletal-related events were observed in 31% of standard-interval patients and 23% of extended-interval patients. There were no statistically significant differences in SRE rates between groups (P = .374). The most common SRE in both groups was bone irradiation (42% and 60%, respectively), with no statistically significant difference in proportion between groups (Table 4).
Discussion
This retrospective review of patients with MM and CaP receiving ZA for bone metastasesfound no differences in the rates of SREs when ZA was dosed monthly vs every 3 months.
Earlier studies found that ZA can decrease SRE rates, but a major concern is that frequent, prolonged exposure to IV bisphosphonates may increase the risk of ONJ. No significant differences in ONJ rates existed between dosing groups, but all documented cases of ONJ occurred in the standard-interval group, suggesting a trend toward decreased incidence with an extension of the dosing interval.
Limitations
This study had several limitations. Geriatric African American men comprised the majority of the study population, and patients with MM accounted for only 22% of included regimens, limiting external validity. Patient overlap between groups may have confounded the results. The retrospective design precluded the ability to control for confounding variables, such as concomitant medication use and medication adherence, and significant heterogeneity was noted in rates of adherence with ZA infusion schedules regardless of dosing group. Use of medications associated with increased risk of osteoporosis—including corticosteroids and proton pump inhibitors—was not assessed.
Assessment of ONJ incidence was limited by the lack of access to dental records from providers outside the VA. Many patients in this review were not eligible for VA dental benefits because of requirements involving time and service connection, a reimbursement measurement that reflects health conditions “incurred or aggravated during active military service.”18
The results of this study provide further support for extended-interval dosing of ZA as a potential method of increasing patient adherence and decreasing the possibility of adverse drug reactions without compromising therapeutic benefit. Further randomized controlled trials are needed to define the potential decrease in ONJ incidence.
Conclusion
In comparisons of standard- and extended-interval dosing of ZA, there was no difference in the incidence of skeletal-related events in veteran patients with bone metastases from MM or CaP.
Author disclosures
The authors report no actual or potential conflicts of interest with regard to this article.
Disclaimer
The opinions expressed herein are those of the authors and do not necessarily reflect those of Federal Practitioner, Frontline Medical Communications Inc., the US Government, or any of its agencies. This article may discuss unlabeled or investigational use of certain drugs. Please review the complete prescribing information for specific drugs or drug combinations—including indications, contraindications, warnings, and adverse effects—before administering pharmacologic therapy to patients.
1. American Cancer Society. Cancer Facts & Figures 2018. Atlanta, GA: American Cancer Society; 2018.
2. Howlader N, Noone AM, Krapcho M, et al, eds. SEER Cancer Statistics Review (CSR), 1975-2014 [based on November 2016 SEER data submission posted to SEER website April 2017]. Bethesda, MD: National Cancer Institute; 2017. https://seer.cancer.gov/archive/csr/1975_2014/. Accessed January 12, 2019.
3. Roodman GD. Pathogenesis of myeloma bone disease. Leukemia. 2009;23(3):435-441.
4. Sartor O, de Bono JS. Metastatic prostate cancer. N Engl J Med. 2018;378(7):645-657.
5. Drake MT, Clarke BL, Khosla S. Bisphosphonates: mechanism of action and role in clinical practice. Mayo Clin Proc. 2008;83(9):1032-1045.
6. Zometa [package insert]. East Hanover, NJ: Novartis; 2016.
7. Aredia [package insert]. East Hanover, NJ: Novartis; 2011.
8. Berenson JR, Rosen LS, Howell A, et al. Zoledronic acid reduces skeletal-related events in patients with osteolytic metastases: a double-blind, randomized dose-response study [published correction appears in Cancer. 2001;91(10):1956]. Cancer. 2001;91(7):1191-1200.
9. Berenson JR, Lichtenstein A, Porter L, et al. Efficacy of pamidronate in reducing skeletal events in patients with advanced multiple myeloma. Myeloma Aredia Study Group. N Engl J Med. 1996;334(8):488-493.
10. Mhaskar R, Redzepovic J, Wheatley K, et al. Bisphosphonates in multiple myeloma: a network meta-analysis. Cochrane Database Syst Rev. 2012;(5):CD003188.
11. Wu S, Dahut WL, Gulley JL. The use of bisphosphonates in cancer patients. Acta Oncol. 2007;46(5):581-591.
12. Bamias A, Kastritis E, Bamia C, et al. Osteonecrosis of the jaw in cancer after treatment with bisphosphonates: incidence and risk factors. J Clin Oncol. 2005;23(34):8580-8587.
13. Anderson K, Ismaila N, Flynn PJ, et al. Role of bone-modifying agents in multiple myeloma: American Society of Clinical Oncology clinical practice guideline update. J Clin Oncol. 2018;36(8):812-818.
14. National Comprehensive Cancer Network Clinical Practice Guidelines in Oncology (NCCN Guidelines). Multiple Myeloma. Version 2.2019. https://www.nccn.org/professionals/physician_gls/pdf/myeloma.pdf. Accessed January 29, 2019.
15. National Comprehensive Cancer Network Clinical Practice Guidelines in Oncology (NCCN Guidelines). Prostate Cancer. Version 4.2018. https://www.nccn.org/professionals/physician_gls/pdf/prostate.pdf. Accessed January 29, 2019.
16. Lacy MQ, Dispenzieri A, Gertz MA, et al. Mayo Clinic consensus statement for the use of bisphosphonates in multiple myeloma. Mayo Clin Proc. 2006;81(8):1047-1053.
17. Himelstein AL, Foster JC, Khatcheressian JL, et al. Effect of longer-interval vs. standard dosing of zoledronic acid on skeletal events in patients with bone metastases: a randomized clinical trial. JAMA. 2017;317(1):48-58.
18. Office of Public and Intergovernmental Affairs, US Department of Veterans Affairs. Service connected disabilities. In: Federal Benefits for Veterans, Dependents, and Survivors. https://www.va.gov/opa/publications/benefits_book/benefits_chap02.asp. Published April 2015. Accessed May 22, 2018.
Prostate Cancer Surveillance After Radiation Therapy in a National Delivery System (FULL)
Guideline concordance with PSA surveillance among veterans treated with definitiveradiation therapy was generally high, but opportunities may exist to improve surveillance among select groups.
Guidelines recommend prostate-specific antigen (PSA) surveillance among men treated with definitive radiation therapy (RT) for prostate cancer. Specifically, the National Comprehensive Cancer Network recommends testing every 6 to 12 months for 5 years and annually thereafter (with no specific stopping period specified), while the American Urology Association recommends testing for at least 10 years, with the frequency to be determined by the risk of relapse and patient preferences for monitoring.1,2 Salvage treatments exist for men with localized recurrence identified early through PSA testing, so adherence to follow-up guidelines is important for quality prostate cancer survivorship care.1,2
However, few studies focus on adherence to PSA surveillance following radiation therapy. Posttreatment surveillance among surgical patients is generally high, but sociodemographic disparities exist. Racial and ethnic minorities and unmarried men are less likely to undergo guideline concordant surveillance than is the general population, potentially preventing effective salvage therapy.3,4 A recent Department of Veterans Affairs (VA) study on posttreatment surveillance included radiation therapy patients but did not examine the impact of younger age, concurrent androgen deprivation therapy (ADT), or treatment facility (ie, diagnosed and treated at the same vs different facilities, with the latter including a separate VA facility or the community) on surveillance patterns.5 The latter is particularly relevant given increasing efforts to coordinate care outside the VA delivery system supported by the 2018 VA Maintaining Systems and Strengthening Integrated Outside Networks (MISSION) Act. Furthermore, these patient, treatment, and delivery system factors may each uniquely contribute to whether patients receive guideline-recommended PSA surveillance after prostate cancer treatment.
For these reasons, we conducted a study to better understand determinants of adherence to guideline-recommended PSA surveillance among veterans undergoing definitive radiation therapy with or without concurrent ADT. Our study uniquely included both elderly and nonelderly patients as well as investigated relationships between treatment at or away from the diagnosing facility. Although we found high overall levels of adherence to PSA surveillance, our findings do offer insights into determinants associated with worse adherence and provide opportunities to improve prostate cancer survivorship care after RT.
Methods
This study population included men with biopsy-proven nonmetastatic incident prostate cancer diagnosed between January 2005 and December 2008, with follow-up through 2012, identified using the VA Central Cancer Registry. We included men who underwent definitive RT with or without concurrent ADT injections, determined using the VA pharmacy files. We excluded men with a prior diagnosis of prostate or other malignancy (given the presence of other malignancies might affect life expectancy and surveillance patterns), hospice enrollment within 30 days, diagnosis at autopsy, and those treated with radical prostatectomy. We extracted cancer registry data, including biopsy Gleason score, pretreatment PSA level, clinical tumor stage, and whether RT was delivered at the patient’s diagnosing facility. For the latter, we used data on radiation location coded by the tumor registrar. We also collected demographic information, including age at diagnosis, race, ethnicity, marital status, and ZIP code. We used diagnosis codes to determine Charlson comorbidity scores similar to prior studies.6-8
Primary Outcome
The primary outcome was receipt of guideline concordant annual PSA surveillance in the initial 5 years following RT. We used laboratory files within the VA Corporate Data Warehouse to identify the date and value for each PSA test after RT for the entire cohort. Specifically, we defined the surveillance period as 60 days after initiation of RT through December 31, 2012. We defined guideline concordance as receiving at least 1 PSA test for each 12-month period after RT.
Statistical Analysis
We used descriptive statistics to characterize our cohort of veterans with prostate cancer treated with RT with or without concurrent ADT. To handle missing data, we performed multiple imputation, generating 10 imputations using all baseline clinical and demographic variables, year of diagnosis, and the regional VA network (ie, the Veterans Integrated Services Network [VISN]) for each patient.
Next, we calculated the annual guideline concordance rate for each year of follow-up for each patient, for the overall cohort, as well as by age, race/ethnicity, and concurrent ADT use. We examined bivariable relationships between guideline concordance and baseline demographic, clinical, and delivery system factors, including year of diagnosis and whether patients were treated at the diagnosing facility, using multilevel logistic regression modeling to account for clustering at the patient level.
Analyses were performed using Stata Version 15 (College Station, TX). We considered a 2-sided P value of < .05 as statistically significant. This study was approved by the VA Ann Arbor Health Care System Institution Review Board.
Results
We evaluated annual PSA surveillance for 15,538 men treated with RT with or without concurrent ADT (Table 1). 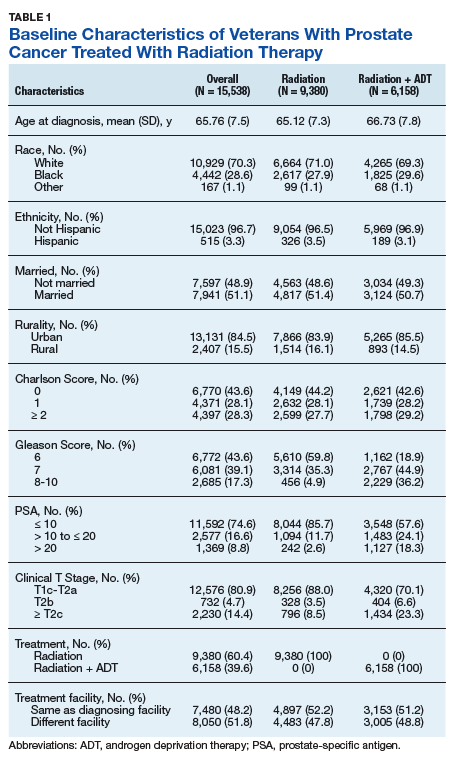
On unadjusted analysis, annual guideline concordance was less common among patients who were at the extremes of age, white, had Gleason 6 disease, PSA ≤ 10 ng/mL, did not receive concurrent ADT, and were treated away from their diagnosing facility (P < .05) (data not shown). We did find slight differences in patient characteristics based on whether patients were treated at their diagnosing facility (Table 2). 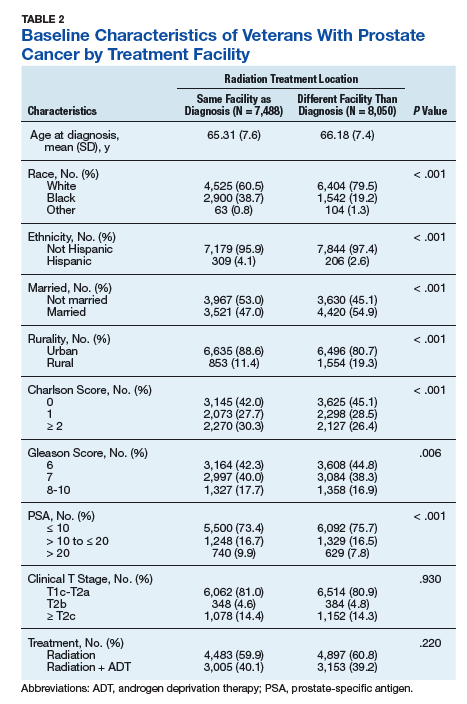
Overall, we found annual guideline concordance was initially very high, though declined slightly over the study period. For example, guideline concordance dropped from 96% in year 1 to 85% in year 5, with an average patient-level guideline concordance of 91% during the study period. We found minimal differences in annual surveillance after RT by race/ethnicity (Figure 1). 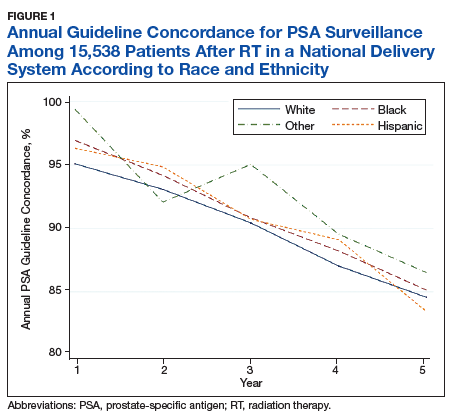
On multilevel multivariable analysis to adjust for clustering at the patient level, we found that race and PSA level were no longer significant predictors of annual surveillance (Table 3). 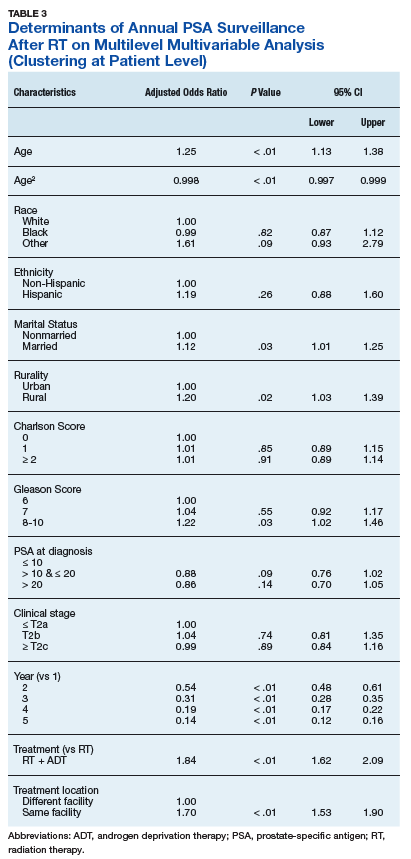
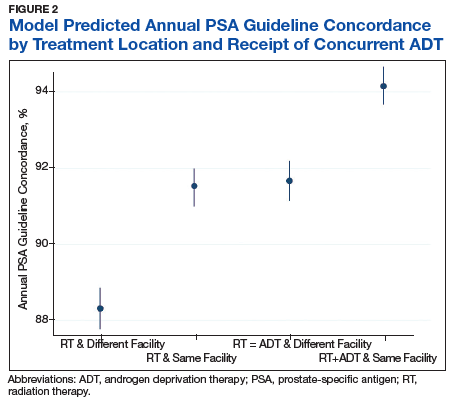
Discussion
We investigated adherence to guideline-recommended annual surveillance PSA testing in a national cohort of veterans treated with definitive RT for prostate cancer. We found guideline concordance was initially high and decreased slightly over time. We also found guideline concordance with PSA surveillance varied based on a number of clinical and delivery system factors, including marital status, rurality, receipt of concurrent ADT, as well as whether the veteran was treated at his diagnosing facility. Taken together, these overall results are promising, however, also point to unique considerations for some patient groups and potentially those treated in the community.
Our finding of lower guideline concordance among nonmarried patients is consistent with prior research, including our study of patients undergoing surgery for prostate cancer.4 Addressing surveillance in this population is important, as they may have less social support than do their married counterparts. We also found surveillance was lower at the extremes of age, which may be appropriate in elderly patients with limited life expectancy but is concerning for younger men with low competing mortality risks.7 Future work should explore whether younger patients experience barriers to care, including employment challenges, as these men are at greatest risk of cancer progression if recurrence goes undetected.
Although rural patients are less likely to undergo definitive prostate cancer treatment, possibly reflecting barriers to care, in our study, surveillance was actually higher among this population than that for urban patients.9 This could reflect the VA’s success in connecting rural patients to appropriate services despite travel distances to maintain quality of cancer care.10 Given annual PSA surveillance is relatively infrequent and not particularly resource intensive, these high surveillance rates might not apply to patients with cancers who need more frequent survivorship care, such as those with head and neck cancer. Future work should examine why surveillance rates among urban patients might be slightly lower, as living in a metropolitan area does not equate to the absence of barriers to survivorship care, especially for veterans who may not be able to take time off from work or have transportation barriers.
We found guideline concordance was higher among patients with higher Gleason scores, which is important given their higher likelihood of failure. However, low- and intermediate-risk patients also are at risk for treatment failure, so annual PSA surveillance should be optimized in this population unless future studies support the safety and feasibility of less frequent surveillance.10-13 Our finding of increased surveillance in patients who receive concurrent ADT may relate to the increased frequency of survivorship care given the need for injections, often every 3 to 6 months. Future studies might examine whether surveillance decreases in this population once they complete their short or long-term ADT, typically given for a maximum of 3 years.
A particularly relevant finding given recent VA policy changes includes lower guideline concordance for patients receiving RT at a different facility than where they were diagnosed. One possible explanation is that a proportion of patients treated outside of their home facilities use Medicare or private insurance and may have surveillance performed outside of the VA, which would not have been captured in our study.14 However, it remains plausible that there are challenges related to coordination and fragmentation of survivorship care for veterans who receive care at separate VA facilities or receive their initial treatment in the community.15 Future studies can help quantify how much this difference is driven by diagnosis and treatment at separate VA sites vs treatment outside of the VA, as different strategies might be necessary to improve surveillance in these 2 populations. Moreover, electronic health record-based tracking has been proposed as a strategy to identify patients who have not received guideline concordant PSA surveillance.14 This strategy may help increase guideline concordance regardless of initial treatment location if VA survivorship care is intended.
Although our study examined receipt of PSA testing, it did not examine whether patients are physically seen back in radiation oncology clinics, or whether their PSAs have been reviewed by radiation oncology providers. Although many surgical patients return to primary care providers for PSA surveillance, surveillance after RT is more complex and likely best managed in the initial years by radiation oncologists. Unlike the postoperative setting in which the definition of PSA failure is straightforward at > 0.2 ng/mL, the definition of treatment failure after RT is more complicated as described below.
For patients who did not receive concurrent ADT, failure is defined as a PSA nadir + 2 ng/mL, which first requires establishing the nadir using the first few postradiation PSA values.15 It becomes even more complex in the setting of ADT as it causes PSA suppression even in the absence of RT due to testosterone suppression.2 At the conclusion of ADT (short term 4-6 months or long term 18-36 months), the PSA may rise as testosterone recovers.15,16 This is not necessarily indicative of treatment failure, as some normal PSA-producing prostatic tissue may remain after treatment. Given these complexities, ongoing survivorship care with radiation oncology is recommended at least in the short term.
Physical visits are a challenge for some patients undergoing prostate cancer surveillance after treatment. Therefore, exploring the safety and feasibility of automated PSA tracking15 and strategies for increasing utilization of telemedicine, including clinical video telehealth appointments that are already used for survivorship and other urologic care in a number of VA clinics, represents opportunities to systematically provide highest quality survivorship care in VA.17,18
Conclusion
Most veterans receive guideline concordant PSA surveillance after RT for prostate cancer. Nonetheless, at the beginning of treatment, providers should screen veterans for risk factors for loss to follow-up (eg, care at a different or non-VA facility), discuss geographic, financial, and other barriers, and plan to leverage existing VA resources (eg, travel support) to continue to achieve high-quality PSA surveillance and survivorship care. Future research should investigate ways to take advantage of the VA’s robust electronic health record system and telemedicine infrastructure to further optimize prostate cancer survivorship care and PSA surveillance particularly among vulnerable patient groups and those treated outside of their diagnosing facility.
Acknowledgments
Funding Sources: VA HSR&D Career Development Award: 2 (CDA 12−171) and NCI R37 R37CA222885 (TAS).
Author disclosures
The authors report no actual or potential conflicts of interest with regard to this article.
Disclaimer
The opinions expressed herein are those of the authors and do not necessarily reflect those of Federal Practitioner, Frontline Medical Communications Inc., the US Government, or any of its agencies.
1. National Comprehensive Cancer Network. NCCN clinical practice guidelines in oncology: prostate cancer v4.2018. https://www.nccn.org/professionals/physician_gls/pdf/prostate.pdf. Updated August 15, 2018. Accessed January 23, 2019.
2. Sanda MG, Chen RC, Crispino T, et al. Clinically localized prostate cancer: AUA/ASTRO/SUO guideline. https://www.auanet.org/guidelines/prostate-cancer-clinically-localized-(2017). Published 2017. Accessed January 22,2019.
3. Zeliadt SB, Penson DF, Albertsen PC, Concato J, Etzioni RD. Race independently predicts prostate specific antigen testing frequency following a prostate carcinoma diagnosis. Cancer. 2003;98(3):496-503.
4. Trantham LC, Nielsen ME, Mobley LR, Wheeler SB, Carpenter WR, Biddle AK. Use of prostate-specific antigen testing as a disease surveillance tool following radical prostatectomy. Cancer. 2013;119(19):3523-3530.
5. Shi Y, Fung KZ, John Boscardin W, et al. Individualizing PSA monitoring among older prostate cancer survivors. J Gen Intern Med. 2018;33(5):602-604.
6. Chapman C, Burns J, Caram M, Zaslavsky A, Tsodikov A, Skolarus TA. Multilevel predictors of surveillance PSA guideline concordance after radical prostatectomy: a national Veterans Affairs study. Paper presented at: Association of VA Hematology/Oncology Annual Meeting;
September 28-30, 2018; Chicago, IL. Abstract 34. https://www.mdedge.com/fedprac/avaho/article/175094/prostate-cancer/multilevel-predictors-surveillance-psa-guideline. Accessed January 22, 2019.
7. Kirk PS, Borza T, Caram MEV, et al. Characterising potential bone scan overuse amongst men treated with radical prostatectomy. BJU Int. 2018. [Epub ahead of print.]
8. Kirk PS, Borza T, Shahinian VB, et al. The implications of baseline bone-health assessment at initiation of androgen-deprivation therapy for prostate cancer. BJU Int. 2018;121(4):558-564.
9. Baldwin LM, Andrilla CH, Porter MP, Rosenblatt RA, Patel S, Doescher MP. Treatment of early-stage prostate cancer among rural and urban patients. Cancer. 2013;119(16):3067-3075.
10. Skolarus TA, Chan S, Shelton JB, et al. Quality of prostate cancer care among rural men in the Veterans Health Administration. Cancer. 2013;119(20):3629-3635.
11. Hamdy FC, Donovan JL, Lane JA, et al; ProtecT Study Group. 10-year outcomes after monitoring, surgery, or radiotherapy for localized prostate cancer. N Engl J Med. 2016;375(15):1415-1424.
12. Michalski JM, Moughan J, Purdy J, et al. Effect of standard vs dose-escalated radiation therapy for patients with intermediate-risk prostate cancer: the NRG Oncology RTOG 0126 randomized clinical trial. JAMA Oncol.2018;4(6):e180039.
13. Chang MG, DeSotto K, Taibi P, Troeschel S. Development of a PSA tracking system for patients with prostate cancer following definitive radiotherapy to enhance rural health. J Clin Oncol. 2016;34(suppl 2):39-39.
14. Skolarus TA, Zhang Y, Hollenbeck BK. Understanding fragmentation of prostate cancer survivorship care: implications for cost and quality. Cancer. 2012;118(11):2837-2845.
15. Roach M, 3rd, Hanks G, Thames H Jr, et al. Defining biochemical failure following radiotherapy with or without hormonal therapy in men with clinically localized prostate cancer: recommendations of the RTOG-ASTRO Phoenix Consensus Conference. Int J Radiat Oncol Biol Phys. 2006;65(4):965-974.
16. Buyyounouski MK, Hanlon AL, Horwitz EM, Uzzo RG, Pollack A. Biochemical failure and the temporal kinetics of prostate-specific antigen after radiation therapy with androgen deprivation. Int J Radiat Oncol Biol Phys. 2005;61(5):1291-1298.
17. Chu S, Boxer R, Madison P, et al. Veterans Affairs telemedicine: bringing urologic care to remote clinics. Urology. 2015;86(2):255-260.
18. Safir IJ, Gabale S, David SA, et al. Implementation of a tele-urology program for outpatient hematuria referrals: initial results and patient satisfaction. Urology. 2016;97:33-39.
Guideline concordance with PSA surveillance among veterans treated with definitiveradiation therapy was generally high, but opportunities may exist to improve surveillance among select groups.
Guideline concordance with PSA surveillance among veterans treated with definitiveradiation therapy was generally high, but opportunities may exist to improve surveillance among select groups.
Guidelines recommend prostate-specific antigen (PSA) surveillance among men treated with definitive radiation therapy (RT) for prostate cancer. Specifically, the National Comprehensive Cancer Network recommends testing every 6 to 12 months for 5 years and annually thereafter (with no specific stopping period specified), while the American Urology Association recommends testing for at least 10 years, with the frequency to be determined by the risk of relapse and patient preferences for monitoring.1,2 Salvage treatments exist for men with localized recurrence identified early through PSA testing, so adherence to follow-up guidelines is important for quality prostate cancer survivorship care.1,2
However, few studies focus on adherence to PSA surveillance following radiation therapy. Posttreatment surveillance among surgical patients is generally high, but sociodemographic disparities exist. Racial and ethnic minorities and unmarried men are less likely to undergo guideline concordant surveillance than is the general population, potentially preventing effective salvage therapy.3,4 A recent Department of Veterans Affairs (VA) study on posttreatment surveillance included radiation therapy patients but did not examine the impact of younger age, concurrent androgen deprivation therapy (ADT), or treatment facility (ie, diagnosed and treated at the same vs different facilities, with the latter including a separate VA facility or the community) on surveillance patterns.5 The latter is particularly relevant given increasing efforts to coordinate care outside the VA delivery system supported by the 2018 VA Maintaining Systems and Strengthening Integrated Outside Networks (MISSION) Act. Furthermore, these patient, treatment, and delivery system factors may each uniquely contribute to whether patients receive guideline-recommended PSA surveillance after prostate cancer treatment.
For these reasons, we conducted a study to better understand determinants of adherence to guideline-recommended PSA surveillance among veterans undergoing definitive radiation therapy with or without concurrent ADT. Our study uniquely included both elderly and nonelderly patients as well as investigated relationships between treatment at or away from the diagnosing facility. Although we found high overall levels of adherence to PSA surveillance, our findings do offer insights into determinants associated with worse adherence and provide opportunities to improve prostate cancer survivorship care after RT.
Methods
This study population included men with biopsy-proven nonmetastatic incident prostate cancer diagnosed between January 2005 and December 2008, with follow-up through 2012, identified using the VA Central Cancer Registry. We included men who underwent definitive RT with or without concurrent ADT injections, determined using the VA pharmacy files. We excluded men with a prior diagnosis of prostate or other malignancy (given the presence of other malignancies might affect life expectancy and surveillance patterns), hospice enrollment within 30 days, diagnosis at autopsy, and those treated with radical prostatectomy. We extracted cancer registry data, including biopsy Gleason score, pretreatment PSA level, clinical tumor stage, and whether RT was delivered at the patient’s diagnosing facility. For the latter, we used data on radiation location coded by the tumor registrar. We also collected demographic information, including age at diagnosis, race, ethnicity, marital status, and ZIP code. We used diagnosis codes to determine Charlson comorbidity scores similar to prior studies.6-8
Primary Outcome
The primary outcome was receipt of guideline concordant annual PSA surveillance in the initial 5 years following RT. We used laboratory files within the VA Corporate Data Warehouse to identify the date and value for each PSA test after RT for the entire cohort. Specifically, we defined the surveillance period as 60 days after initiation of RT through December 31, 2012. We defined guideline concordance as receiving at least 1 PSA test for each 12-month period after RT.
Statistical Analysis
We used descriptive statistics to characterize our cohort of veterans with prostate cancer treated with RT with or without concurrent ADT. To handle missing data, we performed multiple imputation, generating 10 imputations using all baseline clinical and demographic variables, year of diagnosis, and the regional VA network (ie, the Veterans Integrated Services Network [VISN]) for each patient.
Next, we calculated the annual guideline concordance rate for each year of follow-up for each patient, for the overall cohort, as well as by age, race/ethnicity, and concurrent ADT use. We examined bivariable relationships between guideline concordance and baseline demographic, clinical, and delivery system factors, including year of diagnosis and whether patients were treated at the diagnosing facility, using multilevel logistic regression modeling to account for clustering at the patient level.
Analyses were performed using Stata Version 15 (College Station, TX). We considered a 2-sided P value of < .05 as statistically significant. This study was approved by the VA Ann Arbor Health Care System Institution Review Board.
Results
We evaluated annual PSA surveillance for 15,538 men treated with RT with or without concurrent ADT (Table 1).
On unadjusted analysis, annual guideline concordance was less common among patients who were at the extremes of age, white, had Gleason 6 disease, PSA ≤ 10 ng/mL, did not receive concurrent ADT, and were treated away from their diagnosing facility (P < .05) (data not shown). We did find slight differences in patient characteristics based on whether patients were treated at their diagnosing facility (Table 2).
Overall, we found annual guideline concordance was initially very high, though declined slightly over the study period. For example, guideline concordance dropped from 96% in year 1 to 85% in year 5, with an average patient-level guideline concordance of 91% during the study period. We found minimal differences in annual surveillance after RT by race/ethnicity (Figure 1).
On multilevel multivariable analysis to adjust for clustering at the patient level, we found that race and PSA level were no longer significant predictors of annual surveillance (Table 3).
Discussion
We investigated adherence to guideline-recommended annual surveillance PSA testing in a national cohort of veterans treated with definitive RT for prostate cancer. We found guideline concordance was initially high and decreased slightly over time. We also found guideline concordance with PSA surveillance varied based on a number of clinical and delivery system factors, including marital status, rurality, receipt of concurrent ADT, as well as whether the veteran was treated at his diagnosing facility. Taken together, these overall results are promising, however, also point to unique considerations for some patient groups and potentially those treated in the community.
Our finding of lower guideline concordance among nonmarried patients is consistent with prior research, including our study of patients undergoing surgery for prostate cancer.4 Addressing surveillance in this population is important, as they may have less social support than do their married counterparts. We also found surveillance was lower at the extremes of age, which may be appropriate in elderly patients with limited life expectancy but is concerning for younger men with low competing mortality risks.7 Future work should explore whether younger patients experience barriers to care, including employment challenges, as these men are at greatest risk of cancer progression if recurrence goes undetected.
Although rural patients are less likely to undergo definitive prostate cancer treatment, possibly reflecting barriers to care, in our study, surveillance was actually higher among this population than that for urban patients.9 This could reflect the VA’s success in connecting rural patients to appropriate services despite travel distances to maintain quality of cancer care.10 Given annual PSA surveillance is relatively infrequent and not particularly resource intensive, these high surveillance rates might not apply to patients with cancers who need more frequent survivorship care, such as those with head and neck cancer. Future work should examine why surveillance rates among urban patients might be slightly lower, as living in a metropolitan area does not equate to the absence of barriers to survivorship care, especially for veterans who may not be able to take time off from work or have transportation barriers.
We found guideline concordance was higher among patients with higher Gleason scores, which is important given their higher likelihood of failure. However, low- and intermediate-risk patients also are at risk for treatment failure, so annual PSA surveillance should be optimized in this population unless future studies support the safety and feasibility of less frequent surveillance.10-13 Our finding of increased surveillance in patients who receive concurrent ADT may relate to the increased frequency of survivorship care given the need for injections, often every 3 to 6 months. Future studies might examine whether surveillance decreases in this population once they complete their short or long-term ADT, typically given for a maximum of 3 years.
A particularly relevant finding given recent VA policy changes includes lower guideline concordance for patients receiving RT at a different facility than where they were diagnosed. One possible explanation is that a proportion of patients treated outside of their home facilities use Medicare or private insurance and may have surveillance performed outside of the VA, which would not have been captured in our study.14 However, it remains plausible that there are challenges related to coordination and fragmentation of survivorship care for veterans who receive care at separate VA facilities or receive their initial treatment in the community.15 Future studies can help quantify how much this difference is driven by diagnosis and treatment at separate VA sites vs treatment outside of the VA, as different strategies might be necessary to improve surveillance in these 2 populations. Moreover, electronic health record-based tracking has been proposed as a strategy to identify patients who have not received guideline concordant PSA surveillance.14 This strategy may help increase guideline concordance regardless of initial treatment location if VA survivorship care is intended.
Although our study examined receipt of PSA testing, it did not examine whether patients are physically seen back in radiation oncology clinics, or whether their PSAs have been reviewed by radiation oncology providers. Although many surgical patients return to primary care providers for PSA surveillance, surveillance after RT is more complex and likely best managed in the initial years by radiation oncologists. Unlike the postoperative setting in which the definition of PSA failure is straightforward at > 0.2 ng/mL, the definition of treatment failure after RT is more complicated as described below.
For patients who did not receive concurrent ADT, failure is defined as a PSA nadir + 2 ng/mL, which first requires establishing the nadir using the first few postradiation PSA values.15 It becomes even more complex in the setting of ADT as it causes PSA suppression even in the absence of RT due to testosterone suppression.2 At the conclusion of ADT (short term 4-6 months or long term 18-36 months), the PSA may rise as testosterone recovers.15,16 This is not necessarily indicative of treatment failure, as some normal PSA-producing prostatic tissue may remain after treatment. Given these complexities, ongoing survivorship care with radiation oncology is recommended at least in the short term.
Physical visits are a challenge for some patients undergoing prostate cancer surveillance after treatment. Therefore, exploring the safety and feasibility of automated PSA tracking15 and strategies for increasing utilization of telemedicine, including clinical video telehealth appointments that are already used for survivorship and other urologic care in a number of VA clinics, represents opportunities to systematically provide highest quality survivorship care in VA.17,18
Conclusion
Most veterans receive guideline concordant PSA surveillance after RT for prostate cancer. Nonetheless, at the beginning of treatment, providers should screen veterans for risk factors for loss to follow-up (eg, care at a different or non-VA facility), discuss geographic, financial, and other barriers, and plan to leverage existing VA resources (eg, travel support) to continue to achieve high-quality PSA surveillance and survivorship care. Future research should investigate ways to take advantage of the VA’s robust electronic health record system and telemedicine infrastructure to further optimize prostate cancer survivorship care and PSA surveillance particularly among vulnerable patient groups and those treated outside of their diagnosing facility.
Acknowledgments
Funding Sources: VA HSR&D Career Development Award: 2 (CDA 12−171) and NCI R37 R37CA222885 (TAS).
Author disclosures
The authors report no actual or potential conflicts of interest with regard to this article.
Disclaimer
The opinions expressed herein are those of the authors and do not necessarily reflect those of Federal Practitioner, Frontline Medical Communications Inc., the US Government, or any of its agencies.
1. National Comprehensive Cancer Network. NCCN clinical practice guidelines in oncology: prostate cancer v4.2018. https://www.nccn.org/professionals/physician_gls/pdf/prostate.pdf. Updated August 15, 2018. Accessed January 23, 2019.
2. Sanda MG, Chen RC, Crispino T, et al. Clinically localized prostate cancer: AUA/ASTRO/SUO guideline. https://www.auanet.org/guidelines/prostate-cancer-clinically-localized-(2017). Published 2017. Accessed January 22,2019.
3. Zeliadt SB, Penson DF, Albertsen PC, Concato J, Etzioni RD. Race independently predicts prostate specific antigen testing frequency following a prostate carcinoma diagnosis. Cancer. 2003;98(3):496-503.
4. Trantham LC, Nielsen ME, Mobley LR, Wheeler SB, Carpenter WR, Biddle AK. Use of prostate-specific antigen testing as a disease surveillance tool following radical prostatectomy. Cancer. 2013;119(19):3523-3530.
5. Shi Y, Fung KZ, John Boscardin W, et al. Individualizing PSA monitoring among older prostate cancer survivors. J Gen Intern Med. 2018;33(5):602-604.
6. Chapman C, Burns J, Caram M, Zaslavsky A, Tsodikov A, Skolarus TA. Multilevel predictors of surveillance PSA guideline concordance after radical prostatectomy: a national Veterans Affairs study. Paper presented at: Association of VA Hematology/Oncology Annual Meeting;
September 28-30, 2018; Chicago, IL. Abstract 34. https://www.mdedge.com/fedprac/avaho/article/175094/prostate-cancer/multilevel-predictors-surveillance-psa-guideline. Accessed January 22, 2019.
7. Kirk PS, Borza T, Caram MEV, et al. Characterising potential bone scan overuse amongst men treated with radical prostatectomy. BJU Int. 2018. [Epub ahead of print.]
8. Kirk PS, Borza T, Shahinian VB, et al. The implications of baseline bone-health assessment at initiation of androgen-deprivation therapy for prostate cancer. BJU Int. 2018;121(4):558-564.
9. Baldwin LM, Andrilla CH, Porter MP, Rosenblatt RA, Patel S, Doescher MP. Treatment of early-stage prostate cancer among rural and urban patients. Cancer. 2013;119(16):3067-3075.
10. Skolarus TA, Chan S, Shelton JB, et al. Quality of prostate cancer care among rural men in the Veterans Health Administration. Cancer. 2013;119(20):3629-3635.
11. Hamdy FC, Donovan JL, Lane JA, et al; ProtecT Study Group. 10-year outcomes after monitoring, surgery, or radiotherapy for localized prostate cancer. N Engl J Med. 2016;375(15):1415-1424.
12. Michalski JM, Moughan J, Purdy J, et al. Effect of standard vs dose-escalated radiation therapy for patients with intermediate-risk prostate cancer: the NRG Oncology RTOG 0126 randomized clinical trial. JAMA Oncol.2018;4(6):e180039.
13. Chang MG, DeSotto K, Taibi P, Troeschel S. Development of a PSA tracking system for patients with prostate cancer following definitive radiotherapy to enhance rural health. J Clin Oncol. 2016;34(suppl 2):39-39.
14. Skolarus TA, Zhang Y, Hollenbeck BK. Understanding fragmentation of prostate cancer survivorship care: implications for cost and quality. Cancer. 2012;118(11):2837-2845.
15. Roach M, 3rd, Hanks G, Thames H Jr, et al. Defining biochemical failure following radiotherapy with or without hormonal therapy in men with clinically localized prostate cancer: recommendations of the RTOG-ASTRO Phoenix Consensus Conference. Int J Radiat Oncol Biol Phys. 2006;65(4):965-974.
16. Buyyounouski MK, Hanlon AL, Horwitz EM, Uzzo RG, Pollack A. Biochemical failure and the temporal kinetics of prostate-specific antigen after radiation therapy with androgen deprivation. Int J Radiat Oncol Biol Phys. 2005;61(5):1291-1298.
17. Chu S, Boxer R, Madison P, et al. Veterans Affairs telemedicine: bringing urologic care to remote clinics. Urology. 2015;86(2):255-260.
18. Safir IJ, Gabale S, David SA, et al. Implementation of a tele-urology program for outpatient hematuria referrals: initial results and patient satisfaction. Urology. 2016;97:33-39.
Top research findings of 2018-2019 for clinical practice
In Part 1 of this article, published in

1. Han LKM, Aghajani M, Clark SL, et al. Epigenetic aging in major depressive disorder. Am J Psychiatry. 2018;175(8):774-782.
In light of the association of major depressive disorder (MDD) with an increased risk of aging-related diseases, Han et al2 examined whether MDD was associated with higher epigenetic aging in blood as measured by DNA methylation patterns. They also studied whether clinical characteristics of MDD had a further impact on these patterns, and whether the findings replicated in brain tissue. Many differentially methylated regions of our DNA tend to change as we age. Han et al2 used these age-sensitive differentially methylated regions to estimate chronological age, using DNA extracted from various tissues, including blood and brain.
Study design
- As a part of the Netherlands Study of Depression and Anxiety (NESDA), this study included 811 patients with MDD and 319 control participants with no lifetime psychiatric disorders and low depressive symptoms (Inventory of Depressive Symptomatology score <14).
- Diagnosis of MDD and clinical characteristics were assessed by questionnaires and psychiatric interviews. Childhood trauma was assessed using the NEMESIS childhood trauma interview, which included a structured inventory of trauma exposure during childhood.
- DNA methylation age was estimated using all methylation sites in the blood of 811 patients with MDD and 319 control participants. The residuals of the DNA methylation age estimates regressed on chronological age were calculated to indicate epigenetic aging.
- Analyses were adjusted for sociodemographic characteristics, lifestyle, and health status.
- Postmortem brain samples of 74 patients with MDD and 64 control participants were used for replication.
Outcomes
- Significantly higher epigenetic aging was observed in patients with MDD compared with control participants (Cohen’s d = 0.18), which suggests that patients with MDD are biologically older than their corresponding chronological age. There was a significant dose effect with increasing symptom severity in the overall sample.
- In the MDD group, epigenetic aging was positively and significantly associated with childhood trauma.
- The case-control difference was replicated in an independent analysis of postmortem brain samples.
Conclusion
- These findings suggest that patients with MDD and people with a history of childhood trauma may biologically age relatively faster than those without MDD or childhood trauma. These findings may represent a biomarker of aging and might help identify patients who may benefit from early and intensive interventions to reduce the physical comorbidities of MDD.
- This study raises the possibility that MDD may be causally related to epigenetic age acceleration. However, it only points out the associations; there are other possible explanations for this correlation, including the possibility that a shared risk factor accounts for the observed association.
2. Wu YC, Tseng PT, Tu YK, et al. Association of delirium response and safety of pharmacological interventions for the management and prevention of delirium: a network meta-analysis. JAMA Psychiatry. 2019;76(5):526-535.
Delirium is common and often goes underdiagnosed. It is particularly prevalent among hospitalized geriatric patients. Several medications have been suggested to have a role in treating or preventing delirium. However, it remains uncertain which medications provide the best response rate, the lowest rate of delirium occurrence, and the best tolerability. In an attempt to find answers to these questions, Wu et al3 reviewed studies that evaluated the use of various medications used for delirium.
Study design
- Researchers conducted a systematic review and network meta-analysis of randomized controlled trials (RCTs) that investigated various pharmacologic agents used to treat or prevent delirium.
- Fifty-eight RCTs were included in the analyses. Of these, 20 RCTs with a total of 1,435 participants compared the outcomes of treatments of delirium, and 38 RCTs with a total of 8,168 participants examined prevention.
- A network meta-analysis was performed to determine if an agent or combinations of agents were superior to placebo or widely used medications.
Continue to: Outcomes
Outcomes
- Haloperidol plus lorazepam provided the best response rate for treating delirium compared with placebo/control.
- For delirium prevention, patients who received ramelteon, olanzapine, risperidone, or dexmedetomidine had significantly lower delirium occurrence rates than those receiving placebo/control.
- None of the pharmacologic treatments were significantly associated with a higher risk of all-cause mortality compared with placebo/control.
Conclusion
- Haloperidol plus lorazepam might be the best treatment and ramelteon the best preventive medicine for delirium. None of the pharmacologic interventions for treatment or prophylaxis increased all-cause mortality.
- However, network meta-analyses involve extrapolating treatment comparisons that are not made directly. As Blazer8 pointed out, both findings in this study (that haloperidol plus lorazepam is a unique intervention among the treatment trials and ramelteon is a unique intervention for prevention) seemed to be driven by 2 of the 58 studies that Wu et al3 examined.Wu et al3 also cautioned that both of these interventions needed to be further researched for efficacy.
3. Simpson TL, Saxon AJ, Stappenbeck C, et al. Double-blind randomized clinical trial of prazosin for alcohol use disorder. Am J Psychiatry. 2018;175(12):1216-1224.
While some evidence suggests that elevated brain noradrenergic activity is involved in the initiation and maintenance of alcohol use disorder,9 current medications used to treat alcohol use disorder do not target brain noradrenergic pathways. In an RCT, Simpson et al4 tested prazosin, an alpha-1 adrenergic receptor antagonist, for the treatment of alcohol use disorder.
Study design
- In this 12-week double-blind study, 92 participants with alcohol use disorder were randomly assigned to receive prazosin or placebo. Individuals with posttraumatic stress disorder were excluded.
- Prazosin was titrated to a target dosing schedule of 4 mg in the morning, 4 mg in the afternoon, and 8 mg at bedtime by the end of Week 2. The behavioral platform was medical management. Participants provided daily data on their alcohol consumption.
- Generalized linear mixed-effects models were used to examine the impact of prazosin compared with placebo on number of drinks per week, number of drinking days per week, and number of heavy drinking days per week.
Outcomes
- Among the 80 participants who completed the titration period and were included in the primary analyses, prazosin was associated with self-reported fewer heavy drinking days, and fewer drinks per week (Palatino LT Std−8 vs Palatino LT Std−1.5 with placebo). Drinking days per week and craving showed no group differences.
- The rate of drinking and the probability of heavy drinking showed a greater decrease over time for participants receiving prazosin compared with those receiving placebo.
Continue to: Conclusion
Conclusion
- These findings of moderate reductions in heavy drinking days and drinks per week with prazosin suggest that prazosin may be a promising harm-reduction treatment for alcohol use disorder.
4. Meltzer-Brody S, Colquhoun H, Riesenberg R, et al. Brexanolone injection in post-partum depression: two multicentre, double-blind, randomised, placebo-controlled, phase 3 trials. Lancet. 2018;392(10152):1058-1070.
Postpartum depression is among the most common complications of childbirth. It can result in considerable suffering for mothers, children, and families. Gamma-aminobutyric acid (GABA) signaling has previously been reported to be involved in the pathophysiology of postpartum depression. Meltzer-Brody et al5 conducted 2 double-blind, randomized, placebo-controlled, phase 3 trials comparing brexanolone with placebo in women with postpartum depression at 30 clinical research centers and specialized psychiatric units in the United States.
Study design
- Participants were women age 18 to 45, Palatino LT Std≤6 months postpartum at screening, with postpartum depression as indicated by a qualifying 17-item Hamilton Depression Rating Scale (HAM-D) score of ≥26 for Study 1 or 20 to 25 for Study 2.
- Of the 375 women who were screened simultaneously across both studies, 138 were randomly assigned (1:1:1) to receive a single IV injection of brexanolone, 90 μg/kg per hour (BRX90) (n = 45), brexanolone, 60 μg/kg per hour (BRX60) (n = 47), or placebo (n = 46) for 60 hours in Study 1, and 108 were randomly assigned (1:1) to receive BRX90 (n = 54) or placebo (n = 54) for 60 hours in Study 2.
- The primary efficacy endpoint was change in total score on the HAM-D from baseline to 60 hours. Patients were followed until Day 30.
Outcomes
- In Study 1, at 60 hours, the least-squares (LS) mean reduction in HAM-D total score from baseline was 19.5 points (standard error [SE] 1.2) in the BRX60 group and 17.7 points (SE 1.2) in the BRX90 group, compared with 14.0 points (SE 1.1) in the placebo group.
- In Study 2, at 60 hours, the LS mean reduction in HAM-D total score from baseline was 14.6 points (SE 0.8) in the BRX90 group compared with 12.1 points (SE 0.8) for the placebo group.
- In Study 1, one patient in the BRX60 group had 2 serious adverse events (suicidal ideation and intentional overdose attempt during follow-up). In Study 2, one patient in the BRX90 group had 2 serious adverse events (altered state of consciousness and syncope), which were considered treatment-related.
Conclusion
- Administration of brexanolone injection for postpartum depression resulted in significant, clinically meaningful reductions in HAM-D total score at 60 hours compared with placebo, with a rapid onset of action and durable treatment response during the study period. These results suggest that brexanolone injection has the potential to improve treatment options for women with this disorder.
Continue to: #5
5. Tiihonen J, Taipale H, Mehtälä J, et al. Association of antipsychotic polypharmacy vs monotherapy with psychiatric rehospitalization among adults with schizophrenia. JAMA Psychiatry. 2019;76(5):499-507.
In clinical practice, the use of multiple antipsychotic agents for the maintenance treatment of schizophrenia is common but generally not recommended. The effectiveness of antipsychotic polypharmacy in preventing relapse of schizophrenia has not been established, and whether specific antipsychotic combinations are superior to monotherapies for maintenance treatment of schizophrenia is unknown. Tiihonen et al6 investigated the association of specific antipsychotic combinations with psychiatric rehospitalization, which was used as a marker for relapse.
Study design
- This study included 62,250 patients with schizophrenia, treated between January 1, 1996 and December 31, 2015, in a comprehensive, nationwide cohort in Finland. Overall, 31,257 individuals (50.2%) were men, and the median age was 45.6 (interquartile range, 34.6 to 57.9).
- Patients were receiving 29 different antipsychotic monotherapy or polypharmacy regimens.
- Researchers analyzed data from April 24 to June 15, 2018 using psychiatric rehospitalization as a marker for relapse. To minimize selection bias, rehospitalization risks were investigated using within-individual analyses.
- The main outcome was the hazard ratio (HR) for psychiatric rehospitalization during use of polypharmacy vs monotherapy by the same patient.
Outcomes
- Clozapine plus aripiprazole was associated with the lowest risk of psychiatric rehospitalization, with a difference of 14% (HR, .86; CI, .79 to .94) compared with clozapine monotherapy in the analysis that included all polypharmacy periods, and 18% (HR, .82; CI, .75 to .89) in the conservatively defined polypharmacy analysis that excluded periods <90 days.
- Among patients experiencing their first episode of schizophrenia, the differences between clozapine plus aripiprazole vs clozapine monotherapy were greater, with a difference of 22% in the analysis that included all polypharmacy periods, and 23% in the conservatively defined polypharmacy analysis.
- At the aggregate level, any antipsychotic polypharmacy was associated with a 7% to 13% lower risk of psychiatric rehospitalization compared with any monotherapy.
- Clozapine was the only monotherapy among the 10 best treatments.
- Results on all-cause and somatic hospitalization, mortality, and other sensitivity analyses were in line with the primary outcomes.
Conclusion
- This study suggests that certain types of antipsychotic polypharmacy may reduce the risk of rehospitalization in patients with schizophrenia. Current treatment guidelines state that clinicians should prefer antipsychotic monotherapy and avoid polypharmacy. Tiihonen et al6 raise the question whether current treatment guidelines should continue to discourage antipsychotic polypharmacy in the maintenance treatment of schizophrenia.
- Despite the large administrative databases and sophisticated statistical methods used in this study, this approach has important limitations. As Goff10 points out, despite efforts to minimize bias, these results should be considered preliminary until confirmed by RCTs.
6. Stroup TS, Gerhard T, Crystal S, et al. Comparative effectiveness of adjunctive psychotropic medications in patients with schizophrenia. JAMA Psychiatry. 2019;76(5):508-515.
In routine clinical practice, patients with schizophrenia are often treated with combinations of antipsychotics and other psychotropic medications. However, there is little evidence about the comparative effectiveness of these adjunctive treatment strategies. Stroup et al7 investigated the comparative real-world effectiveness of adjunctive psychotropic treatments for patients with schizophrenia.
Continue to: Study design
Study design
- This comparative effectiveness study used US Medicaid data from January 1, 2001, to December 31, 2010. Data analysis was performed from January 1, 2017, to June 30, 2018.
- The study cohort included 81,921 adult outpatients diagnosed with schizophrenia with a mean age of 40.7 (range: 18 to 64), including 37,515 women (45.8%). All patients were stably treated with a single antipsychotic and then started on an adjunctive antidepressant (n = 31,117), benzodiazepine (n = 11,941), mood stabilizer (n = 12,849), or another antipsychotic (n = 26,014).
- Researchers used multinomial logistic regression models to estimate propensity scores to balance covariates across the 4 medication groups. Weighted Cox proportional hazards regression models were used to compare treatment outcomes during 365 days on an intention-to-treat basis.
- The main outcomes and measures included risk of hospitalization for a mental disorder (primary), emergency department (ED) visits for a mental disorder, and all-cause mortality.
Outcomes
- Compared with starting another antipsychotic, initiating use of an antidepressant was associated with a lower risk of psychiatric hospitalization, and initiating use of a benzodiazepine was associated with a higher risk. Initiating use of a mood stabilizer was not significantly different from initiating use of another antipsychotic.
- A similar pattern of associations was observed in psychiatric ED visits for initiating use of an antidepressant, benzodiazepine, or mood stabilizer.
- Initiating use of a mood stabilizer was associated with an increased risk of mortality.
Conclusion
- Compared with the addition of a second antipsychotic, adding an antidepressant was associated with substantially reduced rates of hospitalization, whereas adding a benzodiazepine was associated with a modest increase in the risk of hospitalization. While the addition of a mood stabilizer was not associated with a significant difference in the risk of hospitalization, it was associated with higher mortality.
- Despite the limitations associated with this study, the associations of benzodiazepines and mood stabilizers with poorer outcomes warrant clinical caution and further investigation.
Bottom Line
Significantly higher epigenetic aging has been observed in patients with major depressive disorder. Haloperidol plus lorazepam might be an effective treatment for delirium; and ramelteon may be effective for preventing delirium. Prazosin reduces heavy drinking in patients with alcohol use disorder. A 60-hour infusion of brexanolone can help alleviate postpartum depression. Clozapine plus aripiprazole reduces the risk of rehospitalization among patients with schizophrenia. Adding an antidepressant to an antipsychotic also can reduce the risk of rehospitalization among patients with schizophrenia.
Related Resources
- NEJM Journal Watch. www.jwatch.org.
- F1000 Prime. https://f1000.com/prime/home.
- BMJ Journals Evidence-Based Mental Health. https://ebmh.bmj.com.
Drug Brand Names
Aripiprazole • Abilify
Brexanolone • Zulresso
Clozapine • Clozaril
Dexmedetomidine • Precedex
Haloperidol • Haldol
Lorazepam • Ativan
Olanzapine • Zyprexa
Prazosin • Minipress
Ramelteon • Rozerem
Risperidone • Risperdal
1. Saeed SA, Stanley JB. Top research findings of 2018-2019. First of 2 parts. Current Psychiatry. 2020;19(1):13-18.
2. Han LKM, Aghajani M, Clark SL, et al. Epigenetic aging in major depressive disorder. Am J Psychiatry. 2018;175(8):774-782.
3. Wu YC, Tseng PT, Tu YK, et al. Association of delirium response and safety of pharmacological interventions for the management and prevention of delirium: a network meta-analysis. JAMA Psychiatry. 2019;76(5):526-535.
4. Simpson TL, Saxon AJ, Stappenbeck C, et al. Double-blind randomized clinical trial of prazosin for alcohol use disorder. Am J Psychiatry. 2018;175(12):1216-1224.
5. Meltzer-Brody S, Colquhoun H, Riesenberg R, et al. Brexanolone injection in post-partum depression: two multicentre, double-blind, randomised, placebo-controlled, phase 3 trials. Lancet. 2018;392(10152):1058-1070.
6. Tiihonen J, Taipale H, Mehtälä J, et al. Association of antipsychotic polypharmacy vs monotherapy with psychiatric rehospitalization among adults with schizophrenia. JAMA Psychiatry. 2019;76(5):499-507.
7. Stroup TS, Gerhard T, Crystal S, et al. Comparative effectiveness of adjunctive psychotropic medications in patients with schizophrenia. JAMA Psychiatry. 2019;76(5):508-515.
8. Blazer DG. Pharmacologic intervention for the treatment and prevention of delirium: looking beneath the modeling. JAMA Psychiatry. 2019;76(5):472-473.
9. Koob GF. Brain stress systems in the amygdala and addiction. Brain Res. 2009;1293:61-75.
10. Goff DC. Can adjunctive pharmacotherapy reduce hospitalization in schizophrenia? Insights from administrative databases. JAMA Psychiatry. 2019;76(5):468-469.
In Part 1 of this article, published in
1. Han LKM, Aghajani M, Clark SL, et al. Epigenetic aging in major depressive disorder. Am J Psychiatry. 2018;175(8):774-782.
In light of the association of major depressive disorder (MDD) with an increased risk of aging-related diseases, Han et al2 examined whether MDD was associated with higher epigenetic aging in blood as measured by DNA methylation patterns. They also studied whether clinical characteristics of MDD had a further impact on these patterns, and whether the findings replicated in brain tissue. Many differentially methylated regions of our DNA tend to change as we age. Han et al2 used these age-sensitive differentially methylated regions to estimate chronological age, using DNA extracted from various tissues, including blood and brain.
Study design
- As a part of the Netherlands Study of Depression and Anxiety (NESDA), this study included 811 patients with MDD and 319 control participants with no lifetime psychiatric disorders and low depressive symptoms (Inventory of Depressive Symptomatology score <14).
- Diagnosis of MDD and clinical characteristics were assessed by questionnaires and psychiatric interviews. Childhood trauma was assessed using the NEMESIS childhood trauma interview, which included a structured inventory of trauma exposure during childhood.
- DNA methylation age was estimated using all methylation sites in the blood of 811 patients with MDD and 319 control participants. The residuals of the DNA methylation age estimates regressed on chronological age were calculated to indicate epigenetic aging.
- Analyses were adjusted for sociodemographic characteristics, lifestyle, and health status.
- Postmortem brain samples of 74 patients with MDD and 64 control participants were used for replication.
Outcomes
- Significantly higher epigenetic aging was observed in patients with MDD compared with control participants (Cohen’s d = 0.18), which suggests that patients with MDD are biologically older than their corresponding chronological age. There was a significant dose effect with increasing symptom severity in the overall sample.
- In the MDD group, epigenetic aging was positively and significantly associated with childhood trauma.
- The case-control difference was replicated in an independent analysis of postmortem brain samples.
Conclusion
- These findings suggest that patients with MDD and people with a history of childhood trauma may biologically age relatively faster than those without MDD or childhood trauma. These findings may represent a biomarker of aging and might help identify patients who may benefit from early and intensive interventions to reduce the physical comorbidities of MDD.
- This study raises the possibility that MDD may be causally related to epigenetic age acceleration. However, it only points out the associations; there are other possible explanations for this correlation, including the possibility that a shared risk factor accounts for the observed association.
2. Wu YC, Tseng PT, Tu YK, et al. Association of delirium response and safety of pharmacological interventions for the management and prevention of delirium: a network meta-analysis. JAMA Psychiatry. 2019;76(5):526-535.
Delirium is common and often goes underdiagnosed. It is particularly prevalent among hospitalized geriatric patients. Several medications have been suggested to have a role in treating or preventing delirium. However, it remains uncertain which medications provide the best response rate, the lowest rate of delirium occurrence, and the best tolerability. In an attempt to find answers to these questions, Wu et al3 reviewed studies that evaluated the use of various medications used for delirium.
Study design
- Researchers conducted a systematic review and network meta-analysis of randomized controlled trials (RCTs) that investigated various pharmacologic agents used to treat or prevent delirium.
- Fifty-eight RCTs were included in the analyses. Of these, 20 RCTs with a total of 1,435 participants compared the outcomes of treatments of delirium, and 38 RCTs with a total of 8,168 participants examined prevention.
- A network meta-analysis was performed to determine if an agent or combinations of agents were superior to placebo or widely used medications.
Continue to: Outcomes
Outcomes
- Haloperidol plus lorazepam provided the best response rate for treating delirium compared with placebo/control.
- For delirium prevention, patients who received ramelteon, olanzapine, risperidone, or dexmedetomidine had significantly lower delirium occurrence rates than those receiving placebo/control.
- None of the pharmacologic treatments were significantly associated with a higher risk of all-cause mortality compared with placebo/control.
Conclusion
- Haloperidol plus lorazepam might be the best treatment and ramelteon the best preventive medicine for delirium. None of the pharmacologic interventions for treatment or prophylaxis increased all-cause mortality.
- However, network meta-analyses involve extrapolating treatment comparisons that are not made directly. As Blazer8 pointed out, both findings in this study (that haloperidol plus lorazepam is a unique intervention among the treatment trials and ramelteon is a unique intervention for prevention) seemed to be driven by 2 of the 58 studies that Wu et al3 examined.Wu et al3 also cautioned that both of these interventions needed to be further researched for efficacy.
3. Simpson TL, Saxon AJ, Stappenbeck C, et al. Double-blind randomized clinical trial of prazosin for alcohol use disorder. Am J Psychiatry. 2018;175(12):1216-1224.
While some evidence suggests that elevated brain noradrenergic activity is involved in the initiation and maintenance of alcohol use disorder,9 current medications used to treat alcohol use disorder do not target brain noradrenergic pathways. In an RCT, Simpson et al4 tested prazosin, an alpha-1 adrenergic receptor antagonist, for the treatment of alcohol use disorder.
Study design
- In this 12-week double-blind study, 92 participants with alcohol use disorder were randomly assigned to receive prazosin or placebo. Individuals with posttraumatic stress disorder were excluded.
- Prazosin was titrated to a target dosing schedule of 4 mg in the morning, 4 mg in the afternoon, and 8 mg at bedtime by the end of Week 2. The behavioral platform was medical management. Participants provided daily data on their alcohol consumption.
- Generalized linear mixed-effects models were used to examine the impact of prazosin compared with placebo on number of drinks per week, number of drinking days per week, and number of heavy drinking days per week.
Outcomes
- Among the 80 participants who completed the titration period and were included in the primary analyses, prazosin was associated with self-reported fewer heavy drinking days, and fewer drinks per week (Palatino LT Std−8 vs Palatino LT Std−1.5 with placebo). Drinking days per week and craving showed no group differences.
- The rate of drinking and the probability of heavy drinking showed a greater decrease over time for participants receiving prazosin compared with those receiving placebo.
Continue to: Conclusion
Conclusion
- These findings of moderate reductions in heavy drinking days and drinks per week with prazosin suggest that prazosin may be a promising harm-reduction treatment for alcohol use disorder.
4. Meltzer-Brody S, Colquhoun H, Riesenberg R, et al. Brexanolone injection in post-partum depression: two multicentre, double-blind, randomised, placebo-controlled, phase 3 trials. Lancet. 2018;392(10152):1058-1070.
Postpartum depression is among the most common complications of childbirth. It can result in considerable suffering for mothers, children, and families. Gamma-aminobutyric acid (GABA) signaling has previously been reported to be involved in the pathophysiology of postpartum depression. Meltzer-Brody et al5 conducted 2 double-blind, randomized, placebo-controlled, phase 3 trials comparing brexanolone with placebo in women with postpartum depression at 30 clinical research centers and specialized psychiatric units in the United States.
Study design
- Participants were women age 18 to 45, Palatino LT Std≤6 months postpartum at screening, with postpartum depression as indicated by a qualifying 17-item Hamilton Depression Rating Scale (HAM-D) score of ≥26 for Study 1 or 20 to 25 for Study 2.
- Of the 375 women who were screened simultaneously across both studies, 138 were randomly assigned (1:1:1) to receive a single IV injection of brexanolone, 90 μg/kg per hour (BRX90) (n = 45), brexanolone, 60 μg/kg per hour (BRX60) (n = 47), or placebo (n = 46) for 60 hours in Study 1, and 108 were randomly assigned (1:1) to receive BRX90 (n = 54) or placebo (n = 54) for 60 hours in Study 2.
- The primary efficacy endpoint was change in total score on the HAM-D from baseline to 60 hours. Patients were followed until Day 30.
Outcomes
- In Study 1, at 60 hours, the least-squares (LS) mean reduction in HAM-D total score from baseline was 19.5 points (standard error [SE] 1.2) in the BRX60 group and 17.7 points (SE 1.2) in the BRX90 group, compared with 14.0 points (SE 1.1) in the placebo group.
- In Study 2, at 60 hours, the LS mean reduction in HAM-D total score from baseline was 14.6 points (SE 0.8) in the BRX90 group compared with 12.1 points (SE 0.8) for the placebo group.
- In Study 1, one patient in the BRX60 group had 2 serious adverse events (suicidal ideation and intentional overdose attempt during follow-up). In Study 2, one patient in the BRX90 group had 2 serious adverse events (altered state of consciousness and syncope), which were considered treatment-related.
Conclusion
- Administration of brexanolone injection for postpartum depression resulted in significant, clinically meaningful reductions in HAM-D total score at 60 hours compared with placebo, with a rapid onset of action and durable treatment response during the study period. These results suggest that brexanolone injection has the potential to improve treatment options for women with this disorder.
Continue to: #5
5. Tiihonen J, Taipale H, Mehtälä J, et al. Association of antipsychotic polypharmacy vs monotherapy with psychiatric rehospitalization among adults with schizophrenia. JAMA Psychiatry. 2019;76(5):499-507.
In clinical practice, the use of multiple antipsychotic agents for the maintenance treatment of schizophrenia is common but generally not recommended. The effectiveness of antipsychotic polypharmacy in preventing relapse of schizophrenia has not been established, and whether specific antipsychotic combinations are superior to monotherapies for maintenance treatment of schizophrenia is unknown. Tiihonen et al6 investigated the association of specific antipsychotic combinations with psychiatric rehospitalization, which was used as a marker for relapse.
Study design
- This study included 62,250 patients with schizophrenia, treated between January 1, 1996 and December 31, 2015, in a comprehensive, nationwide cohort in Finland. Overall, 31,257 individuals (50.2%) were men, and the median age was 45.6 (interquartile range, 34.6 to 57.9).
- Patients were receiving 29 different antipsychotic monotherapy or polypharmacy regimens.
- Researchers analyzed data from April 24 to June 15, 2018 using psychiatric rehospitalization as a marker for relapse. To minimize selection bias, rehospitalization risks were investigated using within-individual analyses.
- The main outcome was the hazard ratio (HR) for psychiatric rehospitalization during use of polypharmacy vs monotherapy by the same patient.
Outcomes
- Clozapine plus aripiprazole was associated with the lowest risk of psychiatric rehospitalization, with a difference of 14% (HR, .86; CI, .79 to .94) compared with clozapine monotherapy in the analysis that included all polypharmacy periods, and 18% (HR, .82; CI, .75 to .89) in the conservatively defined polypharmacy analysis that excluded periods <90 days.
- Among patients experiencing their first episode of schizophrenia, the differences between clozapine plus aripiprazole vs clozapine monotherapy were greater, with a difference of 22% in the analysis that included all polypharmacy periods, and 23% in the conservatively defined polypharmacy analysis.
- At the aggregate level, any antipsychotic polypharmacy was associated with a 7% to 13% lower risk of psychiatric rehospitalization compared with any monotherapy.
- Clozapine was the only monotherapy among the 10 best treatments.
- Results on all-cause and somatic hospitalization, mortality, and other sensitivity analyses were in line with the primary outcomes.
Conclusion
- This study suggests that certain types of antipsychotic polypharmacy may reduce the risk of rehospitalization in patients with schizophrenia. Current treatment guidelines state that clinicians should prefer antipsychotic monotherapy and avoid polypharmacy. Tiihonen et al6 raise the question whether current treatment guidelines should continue to discourage antipsychotic polypharmacy in the maintenance treatment of schizophrenia.
- Despite the large administrative databases and sophisticated statistical methods used in this study, this approach has important limitations. As Goff10 points out, despite efforts to minimize bias, these results should be considered preliminary until confirmed by RCTs.
6. Stroup TS, Gerhard T, Crystal S, et al. Comparative effectiveness of adjunctive psychotropic medications in patients with schizophrenia. JAMA Psychiatry. 2019;76(5):508-515.
In routine clinical practice, patients with schizophrenia are often treated with combinations of antipsychotics and other psychotropic medications. However, there is little evidence about the comparative effectiveness of these adjunctive treatment strategies. Stroup et al7 investigated the comparative real-world effectiveness of adjunctive psychotropic treatments for patients with schizophrenia.
Continue to: Study design
Study design
- This comparative effectiveness study used US Medicaid data from January 1, 2001, to December 31, 2010. Data analysis was performed from January 1, 2017, to June 30, 2018.
- The study cohort included 81,921 adult outpatients diagnosed with schizophrenia with a mean age of 40.7 (range: 18 to 64), including 37,515 women (45.8%). All patients were stably treated with a single antipsychotic and then started on an adjunctive antidepressant (n = 31,117), benzodiazepine (n = 11,941), mood stabilizer (n = 12,849), or another antipsychotic (n = 26,014).
- Researchers used multinomial logistic regression models to estimate propensity scores to balance covariates across the 4 medication groups. Weighted Cox proportional hazards regression models were used to compare treatment outcomes during 365 days on an intention-to-treat basis.
- The main outcomes and measures included risk of hospitalization for a mental disorder (primary), emergency department (ED) visits for a mental disorder, and all-cause mortality.
Outcomes
- Compared with starting another antipsychotic, initiating use of an antidepressant was associated with a lower risk of psychiatric hospitalization, and initiating use of a benzodiazepine was associated with a higher risk. Initiating use of a mood stabilizer was not significantly different from initiating use of another antipsychotic.
- A similar pattern of associations was observed in psychiatric ED visits for initiating use of an antidepressant, benzodiazepine, or mood stabilizer.
- Initiating use of a mood stabilizer was associated with an increased risk of mortality.
Conclusion
- Compared with the addition of a second antipsychotic, adding an antidepressant was associated with substantially reduced rates of hospitalization, whereas adding a benzodiazepine was associated with a modest increase in the risk of hospitalization. While the addition of a mood stabilizer was not associated with a significant difference in the risk of hospitalization, it was associated with higher mortality.
- Despite the limitations associated with this study, the associations of benzodiazepines and mood stabilizers with poorer outcomes warrant clinical caution and further investigation.
Bottom Line
Significantly higher epigenetic aging has been observed in patients with major depressive disorder. Haloperidol plus lorazepam might be an effective treatment for delirium; and ramelteon may be effective for preventing delirium. Prazosin reduces heavy drinking in patients with alcohol use disorder. A 60-hour infusion of brexanolone can help alleviate postpartum depression. Clozapine plus aripiprazole reduces the risk of rehospitalization among patients with schizophrenia. Adding an antidepressant to an antipsychotic also can reduce the risk of rehospitalization among patients with schizophrenia.
Related Resources
- NEJM Journal Watch. www.jwatch.org.
- F1000 Prime. https://f1000.com/prime/home.
- BMJ Journals Evidence-Based Mental Health. https://ebmh.bmj.com.
Drug Brand Names
Aripiprazole • Abilify
Brexanolone • Zulresso
Clozapine • Clozaril
Dexmedetomidine • Precedex
Haloperidol • Haldol
Lorazepam • Ativan
Olanzapine • Zyprexa
Prazosin • Minipress
Ramelteon • Rozerem
Risperidone • Risperdal
1. Saeed SA, Stanley JB. Top research findings of 2018-2019. First of 2 parts. Current Psychiatry. 2020;19(1):13-18.
2. Han LKM, Aghajani M, Clark SL, et al. Epigenetic aging in major depressive disorder. Am J Psychiatry. 2018;175(8):774-782.
3. Wu YC, Tseng PT, Tu YK, et al. Association of delirium response and safety of pharmacological interventions for the management and prevention of delirium: a network meta-analysis. JAMA Psychiatry. 2019;76(5):526-535.
4. Simpson TL, Saxon AJ, Stappenbeck C, et al. Double-blind randomized clinical trial of prazosin for alcohol use disorder. Am J Psychiatry. 2018;175(12):1216-1224.
5. Meltzer-Brody S, Colquhoun H, Riesenberg R, et al. Brexanolone injection in post-partum depression: two multicentre, double-blind, randomised, placebo-controlled, phase 3 trials. Lancet. 2018;392(10152):1058-1070.
6. Tiihonen J, Taipale H, Mehtälä J, et al. Association of antipsychotic polypharmacy vs monotherapy with psychiatric rehospitalization among adults with schizophrenia. JAMA Psychiatry. 2019;76(5):499-507.
7. Stroup TS, Gerhard T, Crystal S, et al. Comparative effectiveness of adjunctive psychotropic medications in patients with schizophrenia. JAMA Psychiatry. 2019;76(5):508-515.
8. Blazer DG. Pharmacologic intervention for the treatment and prevention of delirium: looking beneath the modeling. JAMA Psychiatry. 2019;76(5):472-473.
9. Koob GF. Brain stress systems in the amygdala and addiction. Brain Res. 2009;1293:61-75.
10. Goff DC. Can adjunctive pharmacotherapy reduce hospitalization in schizophrenia? Insights from administrative databases. JAMA Psychiatry. 2019;76(5):468-469.

A Comparison of 4 Single-Question Measures of Patient Satisfaction
From Dell Medical School, The University of Texas at Austin, Austin, TX.
Abstract
- Objective: Satisfaction measures often show substantial ceiling effects. This randomized controlled trial tested the null hypothesis that there is no difference in mean overall satisfaction, ceiling and floor effect, and data distribution between 4 different kinds of single-question scales assessing the helpfulness of a visit. We also hypothesized that there is no correlation between scaled satisfaction and psychological status. Finally, we assessed how the satisfaction scores compared with the Net Promoter Scores (NPS).
- Design: Randomized controlled trial.
- Methods: We enrolled 258 adult, English-speaking new and returning patients. Patients were randomly assigned to 1 of 4 different scale types: (1) an 11-point ordinal scale with 5 anchor points; (2) a 5-point Likert scale; (3) a 0-100 visual analogue scale (VAS) electronic slider with 3 anchor points and visible numbers; and (4) a 0-100 VAS with 3 anchor points and no visible numbers. Additionally, patients completed the 2-item Pain Self-Efficacy Questionnaire (PSEQ-2), 5-item Short Health Anxiety Inventory scale (SHAI-5), and Patient-Reported Outcomes Measurement Information System (PROMIS) Depression. We assessed mean and median score, floor and ceiling effect, and skewness and kurtosis for each scale. Spearman correlation tests were used to test correlations between satisfaction and psychological status.
- Results: The nonnumerical 0-100 VAS with 3 anchor points and the 5-point Likert scale had the least ceiling effect (12% and 20%, respectively). The 11-point ordinal scale had skewness and kurtosis closest to a normal distribution (skew = –0.58 and kurtosis = 4.0). Scaled satisfaction scores had a small but significant correlation with PSEQ-2 (r = 0.17; P = 0.006), but not with SHAI-5 (r = –0.12; P = 0.052) or PROMIS Depression (r = –0.12; P = 0.064). NPS were 35, 16, 67, and 20 for the scales, respectively.
- Conclusion: Single-question measures of satisfaction can be adjusted to limit the ceiling effect. Additional research in this area is warranted.
Keywords: patient satisfaction; floor and ceiling effect; skewness and kurtosis; quality improvement.
Patient satisfaction is an important quality metric that is increasingly being measured, reported, and incentivized. A qualitative study identified 7 themes influencing satisfaction among people visiting an orthopedic surgeon’s office: trust, relatedness, expectations, wait time, visit duration, communication, and empathy.1 However, another study found that satisfaction and perceived empathy are not associated with wait time or visit duration, but rather with the quality of the visit.2 Satisfaction measures that incorporate many of these features in relatively long questionnaires are associated with lower response rates3 and overlap with the factors whose influence on satisfaction one would like to study (eg, perceived empathy or communication effectiveness).4 Single- and multiple-question satisfaction scores are prone to a strong right skew, with a substantial ceiling effect.5 Ceiling effect occurs when a considerable proportion (about half) of participants select 1 of the top 2 scores (or the maximum score). An ideal scale would measure satisfaction independent from other factors, would use 1 or just a few questions, and would have little or no ceiling effect.
In this randomized controlled trial, we examined whether there were significant differences in mean and median satisfaction, floor and ceiling effect, and data distribution (by looking at skewness and kurtosis) between 4 different kinds of satisfaction scales asking about the helpfulness of a visit. Additionally, we hypothesized that there is no correlation between scaled satisfaction and psychological status. Finally, we assessed how the satisfaction scores compared to the Net Promoter Scores (NPS). NPS are commonly used in the service industry to measure customer satisfaction; we are using these scores as a measure of patient satisfaction.
Methods
Study Design
All English-speaking new and return patients ages 18 to 89 years visiting an orthopedic surgeon in 1 of 7 clinics located in a large urban area were considered eligible for this study. Enrollment took place intermittently over a 5-month period. We were granted a waiver of written informed consent. Patients indicated their consent by completing the surveys. Patients were randomly assigned to 1 of the 4 questionnaires containing different scale types using an Excel random-number generator. After the visit, patients were asked to complete the survey. All questionnaires were administered on an encrypted tablet via a HIPAA-compliant, secure web-based application for building and managing online surveys and databases (REDCap; Research Electronic Data Capture).6 This study was approved by our Institutional Review Board and is registered on ClinicalTrials.gov (NCT03686735).7
Outcome Measures
Study participants were asked to complete questionnaires regarding demographics (sex, age, race/ethnicity, marital status, level of education, work status, insurance status, comorbidities) and to rate satisfaction with their visit on the scale that was randomly assigned to them: (1) an 11-point Likert scale with 5 anchor points and visible numbers; (2) a 5-point Likert scale with 5 anchor points and no visible numbers; (3) a 0-100 VAS with 3 anchor points and visible numbers; (4) a 0-100 VAS with 3 anchor points and no visible numbers (Figure 1). The 4 scales should not differ in time needed to complete them; however, we did not explicitly measure time to completion. Participants also completed measures of psychological aspects of illness. The 2-item Pain Self-Efficacy Questionnaire (PSEQ-2) was used to measure pain self-efficacy, an effective coping strategy for pain.8 Higher PSEQ-2 scores indicate a higher level of pain self-efficacy. The 5-item Short Health Anxiety Inventory scale (SHAI-5) was also administered; higher scores on this scale indicate a greater degree of health anxiety.9 The Patient-Reported Outcomes Measurement Information System (PROMIS) Depression was used to measure symptoms of depression.10 Finally, the diagnosis was recorded by the surgeon (not in table).

Statistical Analysis
We reported continuous variables using mean, standard deviation (SD), median, and interquartile range (IQR). Categorical data are presented as frequencies and percentages. We calculated floor and ceiling effect and the skewness and kurtosis of every scale. We scaled every scale to 10 and also standardized every scale. We used the Kruskal–Wallis test to compare differences in satisfaction between the scales; Fisher’s exact test to compare differences in floor and ceiling effect; and Spearman correlation tests to test the correlation between scaled satisfaction scores and psychological status.
Ceiling effects are present when patients select the highest value on a scale rather than a value that reflects their actual feelings about a certain topic. Floor effects are present when patients select the lowest value in a similar fashion. These 2 effects indicate that an independent variable no longer influences the dependent variable being tested. Skewness and kurtosis are rough indicators of a normal distribution of values. Skewness (γ1) is an index of the symmetry of a distribution, with symmetric distributions having a skewness of 0. If skewness has a positive value, it suggests relatively many low values, having a long right tail. Negative skewness suggests relatively many high values, having a long left tail. Kurtosis (γ2) is a measure to describe tailedness of a distribution. Kurtosis of a normal distribution is 3. Negative kurtosis represents little peaked distribution, and positive kurtosis represents more peaked distribution.11,12 If skewness is 0 and kurtosis is 3, there is a normal, or Gaussian, distribution.
Finally, we manually calculated the NPS for all scales by subtracting the percentage of detractors (people who scored between 0 and 6) from the percentage of promoters (people who scored 9 or 10).13 NPS are widely used in the service industry to assess customer satisfaction, and scores range between –100 and 100.
An a priori power analysis indicated that in order to find a difference in satisfaction of 0.5 on a 0-10 scale, with an effect size of 80% and alpha set at 0.05, we needed 128 patients (64 per group). Since we wanted to compare 4 satisfaction scales, we doubled this.
Results
Patient Characteristics
All patients invited to participate in this study agreed, and 258 patients with various diagnoses were enrolled. The median age of the cohort was 54 years (IQR, 40-65 years); 114 (44%) were men, and 119 (42%) were new patients (Table 1). The number of patients assigned to scales 1, 2, 3, and 4 were 62 (24%), 70 (27%), 67 (26%), and 59 (23%), respectively.

Difference in Distribution
Looking at the data distribution (Figure 2) and skewness and kurtosis (Table 2) of the scales, we found that none of the scales was normally distributed. 

Difference in Satisfaction Scores
Mean (SD) scaled satisfaction scores (range, 0-10) were 8.3 (1.2) for the 11-point ordinal scale, 8.3 (1.2) for the 5-point Likert scale, 8.9 (1.7) for the 0-100 numerical VAS, and 8.3 (1.3) for the 0-100 nonnumerical VAS (Table 3 and Table 4). 

Difference in Floor and Ceiling Effect
A difference was found in ceiling effect between the different scales (P = 0.025), with the 0-100 numerical VAS showing the highest ceiling effect (34%) and the 0-100 nonnumerical VAS showing the lowest ceiling effect (12%; Table 2). There was no floor effect. A single patient used the lowest score (on the Likert scale).
Correlation Between Satisfaction and Psychological Status
Scaled satisfaction scores had a small but significant correlation with PSEQ-2 (r = 0.17; P = 0.006), but not with SHAI-5 (r = –0.12; P = 0.052) or PROMIS Depression (r = –0.12; P = 0.064; not in table), indicating that patients with more self-efficacy had higher satisfaction ratings.
Net Promoter Scores
NPS were 35 for the 11-point ordinal scale; 16 for the 5-point Likert scale; 67 for the 0-100 numerical VAS; and 20 for the 0-100 nonnumerical VAS.
Discussion
Single-question measures of satisfaction can decrease patient burden and limit overlap with measures of communication effectiveness and perceived empathy. Both long and short questionnaires addressing satisfaction and perceived empathy show substantial ceiling effect. We compared 4 different measures for overall scores, floor and ceiling effect, and skewness and kurtosis, and assessed the correlation between scaled satisfaction and psychological status. We found that scale type influenced the median helpfulness score. As one would expect, scales with less ceiling effect have lower median scores. In other words, if the goal is to collect meaningful information and identify areas for improvement, there must be a willingness to accept lower scores.
Only the nonnumerical VAS was below the threshold of 15% ceiling effect proposed by Terwee et al.14 This scale with 3 anchor points and no visible numbers showed the least ceiling effect (12%) and minimal skew (–1.0), and was closer to kurtosis consistent with a normal distribution (5.0). However, the 11-point ordinal Likert scale with 5 anchor points and visible numbers had the lowest skewness and kurtosis (–0.58 and 4.0). The low ceiling effect observed with the nonnumerical VAS (12%) might be explained by the fact that the scale does not lead patients to a specific description of the helpfulness of their visit, but rather asks patients to use their own judgement in making the rating. The ordinal scale approached the most normal data distribution, and this might be explained by the presence of numbers on the scale. Ratings based on a 0-10 scale are commonly used, and familiarity with the system might have allowed people to pick a number that represents their actual view of the visit helpfulness, rather than picking the highest possible choice (which would have led to a ceiling effect). Study results comparing Likert scales and VAS are conflicting,15 with some preferring Likert scales for their responsiveness16 and ease of use in practice,17 and others preferring VAS for their sensitivity to describe continuous, subjective phenomenon and their high validity and reliability.18 Looking at our nonnumerical VAS, adding numbers to a scale might not help avoid, and may actually increase, the presence of ceiling effect. However, with the ordinal scale with visible numbers, we saw a 21% ceiling effect coupled with low skew and kurtosis (–0.58 and 4.0), which indicate that the distribution of scores is relatively normal. This finding is in line with other study results.19
Our findings demonstrated that feedback concerning self-efficacy, health anxiety, or depression had no or only a small effect on patient satisfaction. Consistent with prior evidence, psychological factors had limited or no correlation with satisfaction.20-24 Given the effect that priming has on patient-reported outcome measures, the effect of psychological factors on satisfaction could be an area of future study.
The NPS varied substantially based on scale structure. Increasing the spread of the scores to limit the ceiling effect will likely reduce promoters and detractors and increase neutrals. NPS systems have been used in the past to measure patient satisfaction with common hand surgery techniques and with community mental health services.25,26 These studies suggest that NPS could be a helpful addition to commonly used clinical measures of satisfaction, after more research has been done to validate it. The evidence showing that NPS are strongly influenced by scale structure suggests that NPS should be used and interpreted with caution.
Several caveats regarding this study should be kept in mind. This study specifically addressed ratings of visit helpfulness. Differently phrased questions might lead to different results. More work is needed to determine the essence of satisfaction with a medical visit.1 In addition, the majority of our patient population was white, employed, and privately insured, limiting generalizability to other populations with different demographics. Finally, all patients were seen by an orthopedic surgeon, and our results might not apply to other populations or clinical settings. However, given the scope of this study, we suspect that the findings can be generalized to specialty care in general and likely all medical contexts.
Conclusion
It is clear from this work that scale design can affect ceiling effect. We plan to test alternative phrasings and structures of single-question measures of satisfaction with a medical visit so that we can better study what factors contribute to satisfaction. It is notable that this approach runs counter to efforts to improve satisfaction scores, because reducing the ceiling effect reduces the mean score and may contribute to worse NPS. Further study is needed to find the optimal measure to assess satisfaction ratings.
Corresponding author: David Ring, MD, PhD, 1701 Trinity Street, Austin, TX, 78712; [email protected].
Financial disclosures: Dr. Ring has or may receive payment or benefits from Skeletal Dynamics; Wright Medical Group; the journal Clinical Orthopaedics and Related Research; and universities, hospitals, and lawyers not related to the submitted work.
1. Waters S, Edmondston SJ, Yates PJ, Gucciardi DF. Identification of factors influencing patient satisfaction with orthopaedic outpatient clinic consultation: A qualitative study. Man Ther. 2016;25:48-55.
2. Kortlever JTP, Ottenhoff JSE, Vagner GA, et al. Visit duration does not correlate with perceived physician empathy. J Bone Joint Surg Am. 2019;101:296-301.
3. Edwards P, Roberts I, Clarke M, et al. Methods to influence response to postal questionnaires. Cochrane Database Syst Rev. 2001(3):CD003227.
4. Salisbury C, Burgess A, Lattimer V, et al. Developing a standard short questionnaire for the assessment of patient satisfaction with out-of-hours primary care. Fam Pract. 2005;22:560-569.
5. Ross CK, Steward CA, Sinacore JM. A comparative study of seven measures of patient satisfaction. Med Care. 1995;33:392-406.
6. Harris PA, Taylor R, Thielke R, et al. Research electronic data capture (REDCap)--a metadata-driven methodology and workflow process for providing translational research informatics support. J Biomed Inform. 2009;42:377-381.
7. Medicine USNLo. ClinicalTrials.gov. Accessed March 18, 2019.
8. Nicholas MK, McGuire BE, Asghari A. A 2-item short form of the Pain Self-efficacy Questionnaire: development and psychometric evaluation of PSEQ-2. J Pain. 2015;16:153-163.
9. Salkovskis PM, Rimes KA, Warwick H, Clark D. The Health Anxiety Inventory: development and validation of scales for the measurement of health anxiety and hypochondriasis. Psychol Med. 2002;32:843-853.
10. Schalet BD, Pilkonis PA, Yu L, et al. Clinical validity of PROMIS depression, anxiety, and anger across diverse clinical samples. J Clin Epidemiol. 2016;73:119-127.
11. Ho AD, Yu CC. Descriptive statistics for modern test score distributions: skewness, kurtosis, discreteness, and ceiling effects. Educ Psychol Meas. 2015;75:365-388.
12. Kim HY. Statistical notes for clinical researchers: assessing normal distribution (2) using skewness and kurtosis. Restor Dent Endod. 2013;38:52-54.
13. NICE Satmetrix. What is net promoter? https://www.netpromoter.com/know/. Accessed March 18, 2019.
14. Terwee CB, Bot SD, de Boer MR, et al. Quality criteria were proposed for measurement properties of health status questionnaires. J Clin Epidemiol. 2007;60:34-42.
15. Hasson D, Arnetz BB. Validation and findings comparing VAS vs. Likert scales for psychosocial measurements. Int Electronic J Health Educ. 2005;8:178-192.
16. Vickers AJ. Comparison of an ordinal and a continuous outcome measure of muscle soreness. Int J Technol Assess Health Care. 1999;15:709-716.
17. Jaeschke R, Singer J, Guyatt GH. A comparison of seven-point and visual analogue scales: data from a randomized trial. Control Clin Trials. 1990;11:43-51.
18. Voutilainen A, Pitkaaho T, Kvist T, Vehvilainen-Julkunen K. How to ask about patient satisfaction? The visual analogue scale is less vulnerable to confounding factors and ceiling effect than a symmetric Likert scale. J Adv Nurs. 2016;72:946-957.
19. Brunelli C, Zecca E, Martini C, et al. Comparison of numerical and verbal rating scales to measure pain exacerbations in patients with chronic cancer pain. Health Qual Life Outcomes. 2010;8:42.
20. Hageman MG, Briet JP, Bossen JK, et al. Do previsit expectations correlate with satisfaction of new patients presenting for evaluation with an orthopaedic surgical practice? Clin Orthop Relat Res. 2015;473:716-721.
21. Keulen MHF, Teunis T, Vagner GA, et al. The effect of the content of patient-reported outcome measures on patient perceived empathy and satisfaction: a randomized controlled trial. J Hand Surg Am. 2018;43:1141.e1-e9.
22. Mellema JJ, O’Connor CM, Overbeek CL, et al. The effect of feedback regarding coping strategies and illness behavior on hand surgery patient satisfaction and communication: a randomized controlled trial. Hand. 2015;10:503-511.
23. Tyser AR, Gaffney CJ, Zhang C, Presson AP. The association of patient satisfaction with pain, anxiety, and self-reported physical function. J Bone Joint Surg Am. 2018;100:1811-1818.
24. Vranceanu AM, Ring D. Factors associated with patient satisfaction. J Hand Surg Am. 2011;36:1504-1508.
25. Stirling P, Jenkins PJ, Clement ND, et al. The Net Promoter Scores with Friends and Family Test after four hand surgery procedures. J Hand Surg Eur. 2019;44:290-295.
26. Wilberforce M, Poll S, Langham H, et al. Measuring the patient experience in community mental health services for older people: A study of the Net Promoter Score using the Friends and Family Test in England. Int J Geriatr Psychiatry. 2019;34:31-37.
From Dell Medical School, The University of Texas at Austin, Austin, TX.
Abstract
- Objective: Satisfaction measures often show substantial ceiling effects. This randomized controlled trial tested the null hypothesis that there is no difference in mean overall satisfaction, ceiling and floor effect, and data distribution between 4 different kinds of single-question scales assessing the helpfulness of a visit. We also hypothesized that there is no correlation between scaled satisfaction and psychological status. Finally, we assessed how the satisfaction scores compared with the Net Promoter Scores (NPS).
- Design: Randomized controlled trial.
- Methods: We enrolled 258 adult, English-speaking new and returning patients. Patients were randomly assigned to 1 of 4 different scale types: (1) an 11-point ordinal scale with 5 anchor points; (2) a 5-point Likert scale; (3) a 0-100 visual analogue scale (VAS) electronic slider with 3 anchor points and visible numbers; and (4) a 0-100 VAS with 3 anchor points and no visible numbers. Additionally, patients completed the 2-item Pain Self-Efficacy Questionnaire (PSEQ-2), 5-item Short Health Anxiety Inventory scale (SHAI-5), and Patient-Reported Outcomes Measurement Information System (PROMIS) Depression. We assessed mean and median score, floor and ceiling effect, and skewness and kurtosis for each scale. Spearman correlation tests were used to test correlations between satisfaction and psychological status.
- Results: The nonnumerical 0-100 VAS with 3 anchor points and the 5-point Likert scale had the least ceiling effect (12% and 20%, respectively). The 11-point ordinal scale had skewness and kurtosis closest to a normal distribution (skew = –0.58 and kurtosis = 4.0). Scaled satisfaction scores had a small but significant correlation with PSEQ-2 (r = 0.17; P = 0.006), but not with SHAI-5 (r = –0.12; P = 0.052) or PROMIS Depression (r = –0.12; P = 0.064). NPS were 35, 16, 67, and 20 for the scales, respectively.
- Conclusion: Single-question measures of satisfaction can be adjusted to limit the ceiling effect. Additional research in this area is warranted.
Keywords: patient satisfaction; floor and ceiling effect; skewness and kurtosis; quality improvement.
Patient satisfaction is an important quality metric that is increasingly being measured, reported, and incentivized. A qualitative study identified 7 themes influencing satisfaction among people visiting an orthopedic surgeon’s office: trust, relatedness, expectations, wait time, visit duration, communication, and empathy.1 However, another study found that satisfaction and perceived empathy are not associated with wait time or visit duration, but rather with the quality of the visit.2 Satisfaction measures that incorporate many of these features in relatively long questionnaires are associated with lower response rates3 and overlap with the factors whose influence on satisfaction one would like to study (eg, perceived empathy or communication effectiveness).4 Single- and multiple-question satisfaction scores are prone to a strong right skew, with a substantial ceiling effect.5 Ceiling effect occurs when a considerable proportion (about half) of participants select 1 of the top 2 scores (or the maximum score). An ideal scale would measure satisfaction independent from other factors, would use 1 or just a few questions, and would have little or no ceiling effect.
In this randomized controlled trial, we examined whether there were significant differences in mean and median satisfaction, floor and ceiling effect, and data distribution (by looking at skewness and kurtosis) between 4 different kinds of satisfaction scales asking about the helpfulness of a visit. Additionally, we hypothesized that there is no correlation between scaled satisfaction and psychological status. Finally, we assessed how the satisfaction scores compared to the Net Promoter Scores (NPS). NPS are commonly used in the service industry to measure customer satisfaction; we are using these scores as a measure of patient satisfaction.
Methods
Study Design
All English-speaking new and return patients ages 18 to 89 years visiting an orthopedic surgeon in 1 of 7 clinics located in a large urban area were considered eligible for this study. Enrollment took place intermittently over a 5-month period. We were granted a waiver of written informed consent. Patients indicated their consent by completing the surveys. Patients were randomly assigned to 1 of the 4 questionnaires containing different scale types using an Excel random-number generator. After the visit, patients were asked to complete the survey. All questionnaires were administered on an encrypted tablet via a HIPAA-compliant, secure web-based application for building and managing online surveys and databases (REDCap; Research Electronic Data Capture).6 This study was approved by our Institutional Review Board and is registered on ClinicalTrials.gov (NCT03686735).7
Outcome Measures
Study participants were asked to complete questionnaires regarding demographics (sex, age, race/ethnicity, marital status, level of education, work status, insurance status, comorbidities) and to rate satisfaction with their visit on the scale that was randomly assigned to them: (1) an 11-point Likert scale with 5 anchor points and visible numbers; (2) a 5-point Likert scale with 5 anchor points and no visible numbers; (3) a 0-100 VAS with 3 anchor points and visible numbers; (4) a 0-100 VAS with 3 anchor points and no visible numbers (Figure 1). The 4 scales should not differ in time needed to complete them; however, we did not explicitly measure time to completion. Participants also completed measures of psychological aspects of illness. The 2-item Pain Self-Efficacy Questionnaire (PSEQ-2) was used to measure pain self-efficacy, an effective coping strategy for pain.8 Higher PSEQ-2 scores indicate a higher level of pain self-efficacy. The 5-item Short Health Anxiety Inventory scale (SHAI-5) was also administered; higher scores on this scale indicate a greater degree of health anxiety.9 The Patient-Reported Outcomes Measurement Information System (PROMIS) Depression was used to measure symptoms of depression.10 Finally, the diagnosis was recorded by the surgeon (not in table).
Statistical Analysis
We reported continuous variables using mean, standard deviation (SD), median, and interquartile range (IQR). Categorical data are presented as frequencies and percentages. We calculated floor and ceiling effect and the skewness and kurtosis of every scale. We scaled every scale to 10 and also standardized every scale. We used the Kruskal–Wallis test to compare differences in satisfaction between the scales; Fisher’s exact test to compare differences in floor and ceiling effect; and Spearman correlation tests to test the correlation between scaled satisfaction scores and psychological status.
Ceiling effects are present when patients select the highest value on a scale rather than a value that reflects their actual feelings about a certain topic. Floor effects are present when patients select the lowest value in a similar fashion. These 2 effects indicate that an independent variable no longer influences the dependent variable being tested. Skewness and kurtosis are rough indicators of a normal distribution of values. Skewness (γ1) is an index of the symmetry of a distribution, with symmetric distributions having a skewness of 0. If skewness has a positive value, it suggests relatively many low values, having a long right tail. Negative skewness suggests relatively many high values, having a long left tail. Kurtosis (γ2) is a measure to describe tailedness of a distribution. Kurtosis of a normal distribution is 3. Negative kurtosis represents little peaked distribution, and positive kurtosis represents more peaked distribution.11,12 If skewness is 0 and kurtosis is 3, there is a normal, or Gaussian, distribution.
Finally, we manually calculated the NPS for all scales by subtracting the percentage of detractors (people who scored between 0 and 6) from the percentage of promoters (people who scored 9 or 10).13 NPS are widely used in the service industry to assess customer satisfaction, and scores range between –100 and 100.
An a priori power analysis indicated that in order to find a difference in satisfaction of 0.5 on a 0-10 scale, with an effect size of 80% and alpha set at 0.05, we needed 128 patients (64 per group). Since we wanted to compare 4 satisfaction scales, we doubled this.
Results
Patient Characteristics
All patients invited to participate in this study agreed, and 258 patients with various diagnoses were enrolled. The median age of the cohort was 54 years (IQR, 40-65 years); 114 (44%) were men, and 119 (42%) were new patients (Table 1). The number of patients assigned to scales 1, 2, 3, and 4 were 62 (24%), 70 (27%), 67 (26%), and 59 (23%), respectively.
Difference in Distribution
Looking at the data distribution (Figure 2) and skewness and kurtosis (Table 2) of the scales, we found that none of the scales was normally distributed.
Difference in Satisfaction Scores
Mean (SD) scaled satisfaction scores (range, 0-10) were 8.3 (1.2) for the 11-point ordinal scale, 8.3 (1.2) for the 5-point Likert scale, 8.9 (1.7) for the 0-100 numerical VAS, and 8.3 (1.3) for the 0-100 nonnumerical VAS (Table 3 and Table 4).
Difference in Floor and Ceiling Effect
A difference was found in ceiling effect between the different scales (P = 0.025), with the 0-100 numerical VAS showing the highest ceiling effect (34%) and the 0-100 nonnumerical VAS showing the lowest ceiling effect (12%; Table 2). There was no floor effect. A single patient used the lowest score (on the Likert scale).
Correlation Between Satisfaction and Psychological Status
Scaled satisfaction scores had a small but significant correlation with PSEQ-2 (r = 0.17; P = 0.006), but not with SHAI-5 (r = –0.12; P = 0.052) or PROMIS Depression (r = –0.12; P = 0.064; not in table), indicating that patients with more self-efficacy had higher satisfaction ratings.
Net Promoter Scores
NPS were 35 for the 11-point ordinal scale; 16 for the 5-point Likert scale; 67 for the 0-100 numerical VAS; and 20 for the 0-100 nonnumerical VAS.
Discussion
Single-question measures of satisfaction can decrease patient burden and limit overlap with measures of communication effectiveness and perceived empathy. Both long and short questionnaires addressing satisfaction and perceived empathy show substantial ceiling effect. We compared 4 different measures for overall scores, floor and ceiling effect, and skewness and kurtosis, and assessed the correlation between scaled satisfaction and psychological status. We found that scale type influenced the median helpfulness score. As one would expect, scales with less ceiling effect have lower median scores. In other words, if the goal is to collect meaningful information and identify areas for improvement, there must be a willingness to accept lower scores.
Only the nonnumerical VAS was below the threshold of 15% ceiling effect proposed by Terwee et al.14 This scale with 3 anchor points and no visible numbers showed the least ceiling effect (12%) and minimal skew (–1.0), and was closer to kurtosis consistent with a normal distribution (5.0). However, the 11-point ordinal Likert scale with 5 anchor points and visible numbers had the lowest skewness and kurtosis (–0.58 and 4.0). The low ceiling effect observed with the nonnumerical VAS (12%) might be explained by the fact that the scale does not lead patients to a specific description of the helpfulness of their visit, but rather asks patients to use their own judgement in making the rating. The ordinal scale approached the most normal data distribution, and this might be explained by the presence of numbers on the scale. Ratings based on a 0-10 scale are commonly used, and familiarity with the system might have allowed people to pick a number that represents their actual view of the visit helpfulness, rather than picking the highest possible choice (which would have led to a ceiling effect). Study results comparing Likert scales and VAS are conflicting,15 with some preferring Likert scales for their responsiveness16 and ease of use in practice,17 and others preferring VAS for their sensitivity to describe continuous, subjective phenomenon and their high validity and reliability.18 Looking at our nonnumerical VAS, adding numbers to a scale might not help avoid, and may actually increase, the presence of ceiling effect. However, with the ordinal scale with visible numbers, we saw a 21% ceiling effect coupled with low skew and kurtosis (–0.58 and 4.0), which indicate that the distribution of scores is relatively normal. This finding is in line with other study results.19
Our findings demonstrated that feedback concerning self-efficacy, health anxiety, or depression had no or only a small effect on patient satisfaction. Consistent with prior evidence, psychological factors had limited or no correlation with satisfaction.20-24 Given the effect that priming has on patient-reported outcome measures, the effect of psychological factors on satisfaction could be an area of future study.
The NPS varied substantially based on scale structure. Increasing the spread of the scores to limit the ceiling effect will likely reduce promoters and detractors and increase neutrals. NPS systems have been used in the past to measure patient satisfaction with common hand surgery techniques and with community mental health services.25,26 These studies suggest that NPS could be a helpful addition to commonly used clinical measures of satisfaction, after more research has been done to validate it. The evidence showing that NPS are strongly influenced by scale structure suggests that NPS should be used and interpreted with caution.
Several caveats regarding this study should be kept in mind. This study specifically addressed ratings of visit helpfulness. Differently phrased questions might lead to different results. More work is needed to determine the essence of satisfaction with a medical visit.1 In addition, the majority of our patient population was white, employed, and privately insured, limiting generalizability to other populations with different demographics. Finally, all patients were seen by an orthopedic surgeon, and our results might not apply to other populations or clinical settings. However, given the scope of this study, we suspect that the findings can be generalized to specialty care in general and likely all medical contexts.
Conclusion
It is clear from this work that scale design can affect ceiling effect. We plan to test alternative phrasings and structures of single-question measures of satisfaction with a medical visit so that we can better study what factors contribute to satisfaction. It is notable that this approach runs counter to efforts to improve satisfaction scores, because reducing the ceiling effect reduces the mean score and may contribute to worse NPS. Further study is needed to find the optimal measure to assess satisfaction ratings.
Corresponding author: David Ring, MD, PhD, 1701 Trinity Street, Austin, TX, 78712; [email protected].
Financial disclosures: Dr. Ring has or may receive payment or benefits from Skeletal Dynamics; Wright Medical Group; the journal Clinical Orthopaedics and Related Research; and universities, hospitals, and lawyers not related to the submitted work.
1. Waters S, Edmondston SJ, Yates PJ, Gucciardi DF. Identification of factors influencing patient satisfaction with orthopaedic outpatient clinic consultation: A qualitative study. Man Ther. 2016;25:48-55.
2. Kortlever JTP, Ottenhoff JSE, Vagner GA, et al. Visit duration does not correlate with perceived physician empathy. J Bone Joint Surg Am. 2019;101:296-301.
3. Edwards P, Roberts I, Clarke M, et al. Methods to influence response to postal questionnaires. Cochrane Database Syst Rev. 2001(3):CD003227.
4. Salisbury C, Burgess A, Lattimer V, et al. Developing a standard short questionnaire for the assessment of patient satisfaction with out-of-hours primary care. Fam Pract. 2005;22:560-569.
5. Ross CK, Steward CA, Sinacore JM. A comparative study of seven measures of patient satisfaction. Med Care. 1995;33:392-406.
6. Harris PA, Taylor R, Thielke R, et al. Research electronic data capture (REDCap)--a metadata-driven methodology and workflow process for providing translational research informatics support. J Biomed Inform. 2009;42:377-381.
7. Medicine USNLo. ClinicalTrials.gov. Accessed March 18, 2019.
8. Nicholas MK, McGuire BE, Asghari A. A 2-item short form of the Pain Self-efficacy Questionnaire: development and psychometric evaluation of PSEQ-2. J Pain. 2015;16:153-163.
9. Salkovskis PM, Rimes KA, Warwick H, Clark D. The Health Anxiety Inventory: development and validation of scales for the measurement of health anxiety and hypochondriasis. Psychol Med. 2002;32:843-853.
10. Schalet BD, Pilkonis PA, Yu L, et al. Clinical validity of PROMIS depression, anxiety, and anger across diverse clinical samples. J Clin Epidemiol. 2016;73:119-127.
11. Ho AD, Yu CC. Descriptive statistics for modern test score distributions: skewness, kurtosis, discreteness, and ceiling effects. Educ Psychol Meas. 2015;75:365-388.
12. Kim HY. Statistical notes for clinical researchers: assessing normal distribution (2) using skewness and kurtosis. Restor Dent Endod. 2013;38:52-54.
13. NICE Satmetrix. What is net promoter? https://www.netpromoter.com/know/. Accessed March 18, 2019.
14. Terwee CB, Bot SD, de Boer MR, et al. Quality criteria were proposed for measurement properties of health status questionnaires. J Clin Epidemiol. 2007;60:34-42.
15. Hasson D, Arnetz BB. Validation and findings comparing VAS vs. Likert scales for psychosocial measurements. Int Electronic J Health Educ. 2005;8:178-192.
16. Vickers AJ. Comparison of an ordinal and a continuous outcome measure of muscle soreness. Int J Technol Assess Health Care. 1999;15:709-716.
17. Jaeschke R, Singer J, Guyatt GH. A comparison of seven-point and visual analogue scales: data from a randomized trial. Control Clin Trials. 1990;11:43-51.
18. Voutilainen A, Pitkaaho T, Kvist T, Vehvilainen-Julkunen K. How to ask about patient satisfaction? The visual analogue scale is less vulnerable to confounding factors and ceiling effect than a symmetric Likert scale. J Adv Nurs. 2016;72:946-957.
19. Brunelli C, Zecca E, Martini C, et al. Comparison of numerical and verbal rating scales to measure pain exacerbations in patients with chronic cancer pain. Health Qual Life Outcomes. 2010;8:42.
20. Hageman MG, Briet JP, Bossen JK, et al. Do previsit expectations correlate with satisfaction of new patients presenting for evaluation with an orthopaedic surgical practice? Clin Orthop Relat Res. 2015;473:716-721.
21. Keulen MHF, Teunis T, Vagner GA, et al. The effect of the content of patient-reported outcome measures on patient perceived empathy and satisfaction: a randomized controlled trial. J Hand Surg Am. 2018;43:1141.e1-e9.
22. Mellema JJ, O’Connor CM, Overbeek CL, et al. The effect of feedback regarding coping strategies and illness behavior on hand surgery patient satisfaction and communication: a randomized controlled trial. Hand. 2015;10:503-511.
23. Tyser AR, Gaffney CJ, Zhang C, Presson AP. The association of patient satisfaction with pain, anxiety, and self-reported physical function. J Bone Joint Surg Am. 2018;100:1811-1818.
24. Vranceanu AM, Ring D. Factors associated with patient satisfaction. J Hand Surg Am. 2011;36:1504-1508.
25. Stirling P, Jenkins PJ, Clement ND, et al. The Net Promoter Scores with Friends and Family Test after four hand surgery procedures. J Hand Surg Eur. 2019;44:290-295.
26. Wilberforce M, Poll S, Langham H, et al. Measuring the patient experience in community mental health services for older people: A study of the Net Promoter Score using the Friends and Family Test in England. Int J Geriatr Psychiatry. 2019;34:31-37.
Developing a Real-Time Prediction Model for Medicine Service 30-Day Readmissions
From Tufts Medical Center, Boston, MA (Dr. Trautwein and Dr. Schwartz contributed equally to this article).
Abstract
- Objective: To examine whether an institution- and service-specific readmission prediction instrument has improved performance compared to universal tools.
- Design: Retrospective cohort study.
- Setting: Academic medical center located in Boston, MA.
- Participants: Adult inpatients admitted to a medicine service.
- Measurements: Patient attributes, inpatient service assignment, and 30-day readmission rate.
- Results: Of 7972 index admissions, 12.6% were readmitted within 30 days. Thirty-day readmissions were associated with number of medications on admission (adjusted odds ratio [OR], 1.34; 95% confidence interval [CI], 1.11-1.61) for ≥ 11 compared with ≤ 5 medications; prior admission or overnight observation (OR, 1.89; 95% CI, 1.61-2.23); and discharge (OR, 2.45; 95% CI, 1.97-3.06) to an acute care facility compared to home without services. The subspecialty services with the highest risk of readmission were bone marrow transplant/hematology (OR, 2.46; 95% CI, 1.78-3.40) and oncology (OR, 2.26; 95% CI, 1.67-3.05), as compared with general medicine/geriatrics. The C statistic for the derivation cohort was 0.67, as compared with a C statistic of 0.63 for the LACE index.
- Conclusion: A hospital service–specific 30-day readmission prediction tool showed incrementally improved performance over the widely used LACE index.
Keywords: rehospitalization; quality of care; predictive model; hospital medicine.
Readmissions are a costly problem in the United States. The readmission rate among Medicare beneficiaries aged 65 years and older was 17.1 per 100 live discharges in 2016.1 Although both the relationship between readmissions and quality of care and the use of readmissions as a quality measure are contested,2 efforts to reduce potentially avoidable rehospitalizations have received widespread attention and readmissions are a focus of reimbursement reform.3-5
The LACE index is a widely used model for readmission risk prediction.6 Derived from a study of hospitalized patients in Ontario, Canada, LACE uses information about length of stay, acuity, comorbidities, and emergency department utilization to estimate readmission risk. Models such as LACE+, LACE-rt, and HOSPITAL have tried to improve on LACE’s performance, but models with strong discriminative ability are lacking.7-9 Institution-specific models exist,10 as do well-organized multicenter studies,7 but their generalizability is limited due to population differences or inclusion of data difficult to extract from patients in real-time, such as data gathered through a socioeconomic questionnaire.
Given hospital-specific differences in operational performance and patient population, we sought to develop a statistical model for 30-day readmission prediction and demonstrate the process that could be utilized by other institutions to identify high-risk patients for intensive case management and discharge planning.
Methods
Study Design
We conducted a retrospective cohort study of all admissions to the medicine service at a 415-bed teaching hospital in Boston, MA, from September 1, 2013, through August 31, 2016. Patients are admitted through the emergency department or directly admitted from hospital-based practices or a statewide network of private practices.
Data Collection
Data were abstracted from electronic medical and billing records from the first (index) admission for each patient during the study period. Thirty-day readmission was defined as an unplanned admission in the 30 days following the index discharge date. We excluded patients readmitted after leaving against medical advice and planned readmissions based on information in discharge summaries.
The study team identified candidate risk factors by referencing related published research and with input from a multidisciplinary task force charged with developing strategies to reduce 30-day readmissions. Task force members included attending and resident physicians, pharmacists, nurses, case managers, and administrators. The task force considered factors that could be extracted from the electronic medical record, including demographics, location of care, and clinical measures such as diagnostic codes, as well as data available in nursing, social work, and case management notes. Decisions regarding potential risk factors were reached within the group based on institutional experience, availability, and quality of data within the electronic record for specific variables, as well as published research on the subject, with the goal of selecting variables that could be easily identified before discharge and used to generate a predictive score for use in discharge planning.
Variables
Variables initially considered for inclusion in univariate analyses included demographic characteristics of age, gender, and a combined race/ethnicity variable, delineated as either non-Hispanic white, non-Hispanic black, Asian/Asian Indian, or Hispanic. Those with race listed as other or missing were set to missing. Primary language was categorized as English versus non-English. We included a number of variables related to the severity of the patient’s medical condition during the index admission, including any stay in an intensive care unit (ICU) and number of medications on admission, divided into 3 groups, 0-5, 6-10, and 11 or more. We also included separate indicators for admissions on warfarin or chronic opioids. Charlson comorbidity score as well as heart failure, diabetes, and chronic obstructive pulmonary disease were included as separate variables, since these specific diagnoses have high comorbidity and risk of readmission.
Because the hospital’s medicine service is divided into subspecialty services, we included the admitting service and discharge unit to assess whether certain teams or units were associated with readmission. Discharge disposition was categorized as home with services (ie, physical therapy and visiting nurse), home without services, skilled nursing facility, acute care facility, or other. We included a variable to assess patient frailty and mobility based on the presence of a physical therapy consult. We incorporated social determinants of health, including insurance coverage (private insurance, Medicare, Medicaid, subsidized, or uninsured); per capita income from the patient’s zip code as a proxy for economic status (divided into quartiles for analysis); and substance abuse and alcohol abuse (based on International Classification of Diseases, 10th revision codes). We considered whether the discharge was on a weekday or weekend, and considered distance to the hospital in relation to Boston, either within route 128 (roughly within 15-20 miles of the medical center), within interstate 495 (roughly within 30-40 miles of the medical center), or beyond this. We considered but were unable to incorporate candidate variables that had inconsistent availability in the electronic medical record, such as the Braden score, level of independence with activities of daily living, nursing-determined fall risk, presence of a social work or nutrition consultation, CAGE questionnaire for alcohol abuse, delirium assessment score, the number of adults living in the home, the number of dependents, and marital status.
Analysis
We created a derivation cohort using admission data from September 1, 2013, through November 30, 2015. We used a backward selection process to include variables in the derivation model. Any variable associated with 30-day readmissions with a P value < 0.10 in univariate analyses was considered as a candidate variable. To be retained in the multivariable model, each variable was required to have a significant association with 30-day readmission at the P < 0.05 level. We used beta coefficients to create a numerical score reflective of probability of readmission.
We then created a validation cohort using admissions data between December 1, 2015, and August 31, 2016. We applied the scoring algorithm from the derivation cohort to the validation cohort and compared the discriminative ability of the 2 models using the area under the receiver operating characteristic (ROC) curve. We also compared the area under the ROC curve of our predictive model to the LACE index using the nonparametric approach of DeLong and colleagues.8,11
Results
The derivation cohort consisted of 7972 index admissions, of which 12.6% were readmitted within 30 days. The patient population was 45% female, 70% white, and 85% English-speaking, with an average age of 61.4 years (standard deviation, 18.1, Table 1). Most patients had either private insurance (43%) or Medicare (41%).
")
Many patients were medically complex: 21% required ICU care, 29% were taking 11 or more medications on admission, and 52% had a Charlson score of 2 or more. In the previous 6 months, 14% had an emergency department visit and 16% had an admission or overnight observation. The rate of drug or alcohol abuse was 13%. The majority of patients were discharged home without services (54%), while 23% were discharged home with services, 13% were discharged to a skilled nursing facility, and 9% were discharged to an acute care facility.
Factors Associated With 30-Day Readmission
Table 2 displays the univariate and multivariate associations with 30-day readmissions in the derivation cohort. Variables significantly associated with readmission in univariate analysis were Charlson comorbidity score, history of diabetes, ICU utilization, previous emergency department visit, inpatient or observation stay within 6 months, number of medications on admission, use of opioids on admission, a diagnosis of diabetes, type of insurance, physical therapy consultation, admitting service, and discharge disposition. Variables not significant in univariate analysis included warfarin use, alcohol/drug abuse, distance from the hospital, and demographic variables (age, sex, race, language, income by zip code).

Variables associated with readmission in the final multivariate analysis model included a Charlson score of 2 or higher (compared to a score of 0; odds ratio [OR], 1.36; 95% confidence interval [CI], 1.11-1.66); any ICU stay (OR, 1.29; 95% CI, 1.08-1.53); number of medications on admission (OR, 1.34; 95% CI, 1.11-1.61) for 11 or more compared with 5 or fewer medications; prior admission or overnight observation (OR, 1.89; 95% CI, 1.61-2.23); and disposition on discharge to an acute care facility (OR, 2.45; 95% CI, 1.96-3.06), skilled nursing facility (OR, 1.53; 95% CI, 1.23-1.89), or home with services (OR, 1.64; 95% CI, 1.38-1.94) compared with home discharge without services. The hospital service from which the patient was discharged was significantly associated with readmission; the subspecialty services with the highest odds ratios were bone marrow transplant/hematology (OR, 2.46; 95% CI, 1.77-3.40) and oncology (OR, 2.26; 95% CI, 1.67-3.05), as compared with general medicine/geriatrics.
Model Derivation and Validation
We utilized the beta coefficients from the multivariate analysis to create a scoring tool to predict the likelihood of 30-day readmission. We rounded each beta coefficient and calculated a readmission score by adding together the rounded beta coefficients of each of the significant variables. Table 3 presents the cumulative percentage of discharges at each score level, as well as the calculated cumulative percentage of potential readmissions. For example, in our population, a score of 6 or greater accounted for 18% of all discharges, but 36% of all 30-day readmissions.

The ROC curves for the derivation model and LACE index are shown in the Figure. The C statistic for the derivation cohort was 0.67, as compared with a C statistic of 0.63 for the calculated LACE index (P < 0.0001). The validation cohort had a C statistic similar to that of the derivation cohort (0.66).

Discussion
We developed a predictive model that can be used during admission to stratify patients for intensive case management and discharge planning. The model included Charlson score, ICU utilization, admission to inpatient services or observation, visits to the ED in the past 6 months, number of medications on admission, hospital service, and discharge disposition. The C statistic of 0.67 is better than that of the LACE predictive model for our population, although both reflect only modest predictive value.
While our model, which was developed and validated at a single institution, may not be generalizable to other institutions, the method of developing a readmission risk prediction model specific to an institution is readily replicable. While standardized tools for predicting readmission risk exist, they do not necessarily account for unique patient populations and medical complexity at individual institutions. We examined patients discharged over 3 years from the medicine services, creating a service-specific model. Our approach could lead to the widespread development of service- and institution-specific models that take into account the risks and resources appropriate to each patient population and setting.
Many of the factors included in our model were indicative of the patients’ medical complexity, with Charlson comorbidity score and the number of discharge medications strongly associated with readmission. In the derivation of the LACE model, many patients were middle-aged and independent in their activities of daily living, and more than 75% had a Charlson comorbidity score of 0.6.6 In our population, by contrast, the majority of patients had a Charlson score of 2 or greater. Health care utilization was a strong positive predictor in both our model and in LACE. The finding that the Charlson comorbidity score was a better predictor than any single chronic illness suggests that medical complexity and comorbidities increase the likelihood of admission more than any 1 chronic condition. Our model incorporates discharge disposition in readmission prediction, another factor associated with medical complexity and frailty.
A surprising finding in our study was the lack of association between social determinants of health, such as alcohol and drug abuse, and readmission risk. We posit several reasons that may account for this finding. First, the population served by the medical center may be too small or homogeneous with respect to social determinants of health to detect a difference in readmission risk. Second, markers available in the electronic medical record to determine social needs may be too crude to distinguish degrees of vulnerability that increase the risk of readmission. We do not discount the importance of social determinants of health as predictors of readmission risk, but we do acknowledge the limitations of the data incorporated in our model.
Predictive models are useful only if they can be incorporated into workflow to identify high-risk patients. Prior to developing and using our model, we used LACE inconsistently because it required length of stay as 1 of the variables. Because the variables in our model are collected and recorded routinely at admission in our electronic medical record, the readmission risk score is calculated and displayed in a daily high-risk patient report. This automated process has afforded a more consistent and reliable approach to readmission risk assessment than previous efforts to assess the LACE index. Case managers use the high-risk patient report to identify patients who require enhanced care coordination and discharge planning. Since the introduction of this predictive model, we have noted a 10% reduction in the hospital’s 30-day readmission rate.
This project was subject to several limitations. Because data on admissions to other facilities were unavailable, we may have underestimated the risk of readmission to other facilities. Our results may not be generalizable to other organizations, although we believe that the methods are readily replicable. The performance of the model and its replication with a validation cohort are strengths of the approach.
Conclusion
We created a hospital service–specific 30-day readmission prediction tool whose performance improved incrementally over the widely used LACE index. This research suggests that readmission prediction is highly context-specific and that organizations would do well to examine the readmission risk factors most pertinent to the populations they serve. We believe that “customized” readmission risk prediction models for particular services in specific hospitals may offer a superior method to identify high-risk patients who may benefit from individualized care planning. Future research is needed to understand how best to capture information about the attributes of vulnerable populations, so that this information can be incorporated into future risk models.
Corresponding author: Karen Freund, MD, Tufts Medical Center, 800 Washington St., Boston, MA 02111; [email protected].
Financial disclosures: None.
Funding for this work was provided by the Commonwealth of Massachusetts, Executive Office of Health and Human Services.
1. Bailey MK, Weiss AJ, Barrett ML, Jiang HJ. Characteristics of 30-day all-cause hospital readmissions, 2010-2016. HCUP Statistical Brief #248. February 2019. Agency for Healthcare Research and Quality. Rockville, MD. www.hcup-us.ahrq.gov/reports/statbriefs/sb248-Hospital-Readmissions-2010-2016.pdf. Accessed December 12, 2019.
2. Esposito ML, Selker HP, Salem DN. Quantity over quality: how the rise in quality measures is not producing quality results. J Gen Intern Med. 2015;30:1204-1207.
3. Jencks SF, Williams MV, Coleman EA. Rehospitalizations among patients in the medicare fee-for-service program. N Engl J Med. 2009;360:1418-1428.
4. Centers for Medicare and Medicaid. Readmissions-reduction-program. https://www.cms.gov/Medicare/Medicare-Fee-for-Service-Payment/AcuteInpatientPPS/Readmissions-Reduction-Program.html. Accessed December 8, 2019.
5. Institute for Healthcare Improvement. Readmissions. Reduce avoidable readmissions. www.ihi.org/Topics/Readmissions/Pages/default.aspx. Accessed December 8, 2019.
6. Van Walraven C, Dhalla IA, Bell C, et al. Derivation and validation of an index to predict early death or unplanned readmission after discharge from hospital to the community. CMAJ. 2010;182:551-557.
7. Kansagara D, Englander H, Salanitro A, et al. Risk prediction models for hospital readmission: a systematic review. JAMA. 2011;306:1688-1698.
8. Robinson R, Hudali T. The HOSPITAL score and LACE index as predictors of 30 day readmission in a retrospective study at a university-affiliated community hospital. Peer J. 2017;5:e3137.
9. El Morr C, Ginsburg L, Nam S, Woollard S. Assessing the performance of a modified LACE index (LACE-rt) to predict unplanned readmission after discharge in a community teaching hospital. Interactive J Med Res. 2017;6:e2.
10. Yu S, Farooq F, Van Esbroeck A, et al. Predicting readmission risk with institution-specific prediction models. Artif Intell Med. 2015;65:89-96.
11. DeLong ER, DeLong DM, Clarke-Pearson DL. Comparing the areas under two or more correlated receiver operating characteristic curves: a nonparametric approach. Biometrics. 1988;4:837-845.
From Tufts Medical Center, Boston, MA (Dr. Trautwein and Dr. Schwartz contributed equally to this article).
Abstract
- Objective: To examine whether an institution- and service-specific readmission prediction instrument has improved performance compared to universal tools.
- Design: Retrospective cohort study.
- Setting: Academic medical center located in Boston, MA.
- Participants: Adult inpatients admitted to a medicine service.
- Measurements: Patient attributes, inpatient service assignment, and 30-day readmission rate.
- Results: Of 7972 index admissions, 12.6% were readmitted within 30 days. Thirty-day readmissions were associated with number of medications on admission (adjusted odds ratio [OR], 1.34; 95% confidence interval [CI], 1.11-1.61) for ≥ 11 compared with ≤ 5 medications; prior admission or overnight observation (OR, 1.89; 95% CI, 1.61-2.23); and discharge (OR, 2.45; 95% CI, 1.97-3.06) to an acute care facility compared to home without services. The subspecialty services with the highest risk of readmission were bone marrow transplant/hematology (OR, 2.46; 95% CI, 1.78-3.40) and oncology (OR, 2.26; 95% CI, 1.67-3.05), as compared with general medicine/geriatrics. The C statistic for the derivation cohort was 0.67, as compared with a C statistic of 0.63 for the LACE index.
- Conclusion: A hospital service–specific 30-day readmission prediction tool showed incrementally improved performance over the widely used LACE index.
Keywords: rehospitalization; quality of care; predictive model; hospital medicine.
Readmissions are a costly problem in the United States. The readmission rate among Medicare beneficiaries aged 65 years and older was 17.1 per 100 live discharges in 2016.1 Although both the relationship between readmissions and quality of care and the use of readmissions as a quality measure are contested,2 efforts to reduce potentially avoidable rehospitalizations have received widespread attention and readmissions are a focus of reimbursement reform.3-5
The LACE index is a widely used model for readmission risk prediction.6 Derived from a study of hospitalized patients in Ontario, Canada, LACE uses information about length of stay, acuity, comorbidities, and emergency department utilization to estimate readmission risk. Models such as LACE+, LACE-rt, and HOSPITAL have tried to improve on LACE’s performance, but models with strong discriminative ability are lacking.7-9 Institution-specific models exist,10 as do well-organized multicenter studies,7 but their generalizability is limited due to population differences or inclusion of data difficult to extract from patients in real-time, such as data gathered through a socioeconomic questionnaire.
Given hospital-specific differences in operational performance and patient population, we sought to develop a statistical model for 30-day readmission prediction and demonstrate the process that could be utilized by other institutions to identify high-risk patients for intensive case management and discharge planning.
Methods
Study Design
We conducted a retrospective cohort study of all admissions to the medicine service at a 415-bed teaching hospital in Boston, MA, from September 1, 2013, through August 31, 2016. Patients are admitted through the emergency department or directly admitted from hospital-based practices or a statewide network of private practices.
Data Collection
Data were abstracted from electronic medical and billing records from the first (index) admission for each patient during the study period. Thirty-day readmission was defined as an unplanned admission in the 30 days following the index discharge date. We excluded patients readmitted after leaving against medical advice and planned readmissions based on information in discharge summaries.
The study team identified candidate risk factors by referencing related published research and with input from a multidisciplinary task force charged with developing strategies to reduce 30-day readmissions. Task force members included attending and resident physicians, pharmacists, nurses, case managers, and administrators. The task force considered factors that could be extracted from the electronic medical record, including demographics, location of care, and clinical measures such as diagnostic codes, as well as data available in nursing, social work, and case management notes. Decisions regarding potential risk factors were reached within the group based on institutional experience, availability, and quality of data within the electronic record for specific variables, as well as published research on the subject, with the goal of selecting variables that could be easily identified before discharge and used to generate a predictive score for use in discharge planning.
Variables
Variables initially considered for inclusion in univariate analyses included demographic characteristics of age, gender, and a combined race/ethnicity variable, delineated as either non-Hispanic white, non-Hispanic black, Asian/Asian Indian, or Hispanic. Those with race listed as other or missing were set to missing. Primary language was categorized as English versus non-English. We included a number of variables related to the severity of the patient’s medical condition during the index admission, including any stay in an intensive care unit (ICU) and number of medications on admission, divided into 3 groups, 0-5, 6-10, and 11 or more. We also included separate indicators for admissions on warfarin or chronic opioids. Charlson comorbidity score as well as heart failure, diabetes, and chronic obstructive pulmonary disease were included as separate variables, since these specific diagnoses have high comorbidity and risk of readmission.
Because the hospital’s medicine service is divided into subspecialty services, we included the admitting service and discharge unit to assess whether certain teams or units were associated with readmission. Discharge disposition was categorized as home with services (ie, physical therapy and visiting nurse), home without services, skilled nursing facility, acute care facility, or other. We included a variable to assess patient frailty and mobility based on the presence of a physical therapy consult. We incorporated social determinants of health, including insurance coverage (private insurance, Medicare, Medicaid, subsidized, or uninsured); per capita income from the patient’s zip code as a proxy for economic status (divided into quartiles for analysis); and substance abuse and alcohol abuse (based on International Classification of Diseases, 10th revision codes). We considered whether the discharge was on a weekday or weekend, and considered distance to the hospital in relation to Boston, either within route 128 (roughly within 15-20 miles of the medical center), within interstate 495 (roughly within 30-40 miles of the medical center), or beyond this. We considered but were unable to incorporate candidate variables that had inconsistent availability in the electronic medical record, such as the Braden score, level of independence with activities of daily living, nursing-determined fall risk, presence of a social work or nutrition consultation, CAGE questionnaire for alcohol abuse, delirium assessment score, the number of adults living in the home, the number of dependents, and marital status.
Analysis
We created a derivation cohort using admission data from September 1, 2013, through November 30, 2015. We used a backward selection process to include variables in the derivation model. Any variable associated with 30-day readmissions with a P value < 0.10 in univariate analyses was considered as a candidate variable. To be retained in the multivariable model, each variable was required to have a significant association with 30-day readmission at the P < 0.05 level. We used beta coefficients to create a numerical score reflective of probability of readmission.
We then created a validation cohort using admissions data between December 1, 2015, and August 31, 2016. We applied the scoring algorithm from the derivation cohort to the validation cohort and compared the discriminative ability of the 2 models using the area under the receiver operating characteristic (ROC) curve. We also compared the area under the ROC curve of our predictive model to the LACE index using the nonparametric approach of DeLong and colleagues.8,11
Results
The derivation cohort consisted of 7972 index admissions, of which 12.6% were readmitted within 30 days. The patient population was 45% female, 70% white, and 85% English-speaking, with an average age of 61.4 years (standard deviation, 18.1, Table 1). Most patients had either private insurance (43%) or Medicare (41%).
Many patients were medically complex: 21% required ICU care, 29% were taking 11 or more medications on admission, and 52% had a Charlson score of 2 or more. In the previous 6 months, 14% had an emergency department visit and 16% had an admission or overnight observation. The rate of drug or alcohol abuse was 13%. The majority of patients were discharged home without services (54%), while 23% were discharged home with services, 13% were discharged to a skilled nursing facility, and 9% were discharged to an acute care facility.
Factors Associated With 30-Day Readmission
Table 2 displays the univariate and multivariate associations with 30-day readmissions in the derivation cohort. Variables significantly associated with readmission in univariate analysis were Charlson comorbidity score, history of diabetes, ICU utilization, previous emergency department visit, inpatient or observation stay within 6 months, number of medications on admission, use of opioids on admission, a diagnosis of diabetes, type of insurance, physical therapy consultation, admitting service, and discharge disposition. Variables not significant in univariate analysis included warfarin use, alcohol/drug abuse, distance from the hospital, and demographic variables (age, sex, race, language, income by zip code).
Variables associated with readmission in the final multivariate analysis model included a Charlson score of 2 or higher (compared to a score of 0; odds ratio [OR], 1.36; 95% confidence interval [CI], 1.11-1.66); any ICU stay (OR, 1.29; 95% CI, 1.08-1.53); number of medications on admission (OR, 1.34; 95% CI, 1.11-1.61) for 11 or more compared with 5 or fewer medications; prior admission or overnight observation (OR, 1.89; 95% CI, 1.61-2.23); and disposition on discharge to an acute care facility (OR, 2.45; 95% CI, 1.96-3.06), skilled nursing facility (OR, 1.53; 95% CI, 1.23-1.89), or home with services (OR, 1.64; 95% CI, 1.38-1.94) compared with home discharge without services. The hospital service from which the patient was discharged was significantly associated with readmission; the subspecialty services with the highest odds ratios were bone marrow transplant/hematology (OR, 2.46; 95% CI, 1.77-3.40) and oncology (OR, 2.26; 95% CI, 1.67-3.05), as compared with general medicine/geriatrics.
Model Derivation and Validation
We utilized the beta coefficients from the multivariate analysis to create a scoring tool to predict the likelihood of 30-day readmission. We rounded each beta coefficient and calculated a readmission score by adding together the rounded beta coefficients of each of the significant variables. Table 3 presents the cumulative percentage of discharges at each score level, as well as the calculated cumulative percentage of potential readmissions. For example, in our population, a score of 6 or greater accounted for 18% of all discharges, but 36% of all 30-day readmissions.
The ROC curves for the derivation model and LACE index are shown in the Figure. The C statistic for the derivation cohort was 0.67, as compared with a C statistic of 0.63 for the calculated LACE index (P < 0.0001). The validation cohort had a C statistic similar to that of the derivation cohort (0.66).
Discussion
We developed a predictive model that can be used during admission to stratify patients for intensive case management and discharge planning. The model included Charlson score, ICU utilization, admission to inpatient services or observation, visits to the ED in the past 6 months, number of medications on admission, hospital service, and discharge disposition. The C statistic of 0.67 is better than that of the LACE predictive model for our population, although both reflect only modest predictive value.
While our model, which was developed and validated at a single institution, may not be generalizable to other institutions, the method of developing a readmission risk prediction model specific to an institution is readily replicable. While standardized tools for predicting readmission risk exist, they do not necessarily account for unique patient populations and medical complexity at individual institutions. We examined patients discharged over 3 years from the medicine services, creating a service-specific model. Our approach could lead to the widespread development of service- and institution-specific models that take into account the risks and resources appropriate to each patient population and setting.
Many of the factors included in our model were indicative of the patients’ medical complexity, with Charlson comorbidity score and the number of discharge medications strongly associated with readmission. In the derivation of the LACE model, many patients were middle-aged and independent in their activities of daily living, and more than 75% had a Charlson comorbidity score of 0.6.6 In our population, by contrast, the majority of patients had a Charlson score of 2 or greater. Health care utilization was a strong positive predictor in both our model and in LACE. The finding that the Charlson comorbidity score was a better predictor than any single chronic illness suggests that medical complexity and comorbidities increase the likelihood of admission more than any 1 chronic condition. Our model incorporates discharge disposition in readmission prediction, another factor associated with medical complexity and frailty.
A surprising finding in our study was the lack of association between social determinants of health, such as alcohol and drug abuse, and readmission risk. We posit several reasons that may account for this finding. First, the population served by the medical center may be too small or homogeneous with respect to social determinants of health to detect a difference in readmission risk. Second, markers available in the electronic medical record to determine social needs may be too crude to distinguish degrees of vulnerability that increase the risk of readmission. We do not discount the importance of social determinants of health as predictors of readmission risk, but we do acknowledge the limitations of the data incorporated in our model.
Predictive models are useful only if they can be incorporated into workflow to identify high-risk patients. Prior to developing and using our model, we used LACE inconsistently because it required length of stay as 1 of the variables. Because the variables in our model are collected and recorded routinely at admission in our electronic medical record, the readmission risk score is calculated and displayed in a daily high-risk patient report. This automated process has afforded a more consistent and reliable approach to readmission risk assessment than previous efforts to assess the LACE index. Case managers use the high-risk patient report to identify patients who require enhanced care coordination and discharge planning. Since the introduction of this predictive model, we have noted a 10% reduction in the hospital’s 30-day readmission rate.
This project was subject to several limitations. Because data on admissions to other facilities were unavailable, we may have underestimated the risk of readmission to other facilities. Our results may not be generalizable to other organizations, although we believe that the methods are readily replicable. The performance of the model and its replication with a validation cohort are strengths of the approach.
Conclusion
We created a hospital service–specific 30-day readmission prediction tool whose performance improved incrementally over the widely used LACE index. This research suggests that readmission prediction is highly context-specific and that organizations would do well to examine the readmission risk factors most pertinent to the populations they serve. We believe that “customized” readmission risk prediction models for particular services in specific hospitals may offer a superior method to identify high-risk patients who may benefit from individualized care planning. Future research is needed to understand how best to capture information about the attributes of vulnerable populations, so that this information can be incorporated into future risk models.
Corresponding author: Karen Freund, MD, Tufts Medical Center, 800 Washington St., Boston, MA 02111; [email protected].
Financial disclosures: None.
Funding for this work was provided by the Commonwealth of Massachusetts, Executive Office of Health and Human Services.
1. Bailey MK, Weiss AJ, Barrett ML, Jiang HJ. Characteristics of 30-day all-cause hospital readmissions, 2010-2016. HCUP Statistical Brief #248. February 2019. Agency for Healthcare Research and Quality. Rockville, MD. www.hcup-us.ahrq.gov/reports/statbriefs/sb248-Hospital-Readmissions-2010-2016.pdf. Accessed December 12, 2019.
2. Esposito ML, Selker HP, Salem DN. Quantity over quality: how the rise in quality measures is not producing quality results. J Gen Intern Med. 2015;30:1204-1207.
3. Jencks SF, Williams MV, Coleman EA. Rehospitalizations among patients in the medicare fee-for-service program. N Engl J Med. 2009;360:1418-1428.
4. Centers for Medicare and Medicaid. Readmissions-reduction-program. https://www.cms.gov/Medicare/Medicare-Fee-for-Service-Payment/AcuteInpatientPPS/Readmissions-Reduction-Program.html. Accessed December 8, 2019.
5. Institute for Healthcare Improvement. Readmissions. Reduce avoidable readmissions. www.ihi.org/Topics/Readmissions/Pages/default.aspx. Accessed December 8, 2019.
6. Van Walraven C, Dhalla IA, Bell C, et al. Derivation and validation of an index to predict early death or unplanned readmission after discharge from hospital to the community. CMAJ. 2010;182:551-557.
7. Kansagara D, Englander H, Salanitro A, et al. Risk prediction models for hospital readmission: a systematic review. JAMA. 2011;306:1688-1698.
8. Robinson R, Hudali T. The HOSPITAL score and LACE index as predictors of 30 day readmission in a retrospective study at a university-affiliated community hospital. Peer J. 2017;5:e3137.
9. El Morr C, Ginsburg L, Nam S, Woollard S. Assessing the performance of a modified LACE index (LACE-rt) to predict unplanned readmission after discharge in a community teaching hospital. Interactive J Med Res. 2017;6:e2.
10. Yu S, Farooq F, Van Esbroeck A, et al. Predicting readmission risk with institution-specific prediction models. Artif Intell Med. 2015;65:89-96.
11. DeLong ER, DeLong DM, Clarke-Pearson DL. Comparing the areas under two or more correlated receiver operating characteristic curves: a nonparametric approach. Biometrics. 1988;4:837-845.
Decreasing Hypoglycemia following Insulin Administration for Inpatient Hyperkalemia
Hyperkalemia (serum potassium ≥5.1 mEq/L), if left untreated, may result in cardiac arrhythmias, severe muscle weakness, or paralysis.1,2 Insulin administration can rapidly correct hyperkalemia by shifting serum potassiufm intracellularly.3 Treatment of hyperkalemia with insulin may lead to hypoglycemia, which, when severe, can cause confusion, seizures, loss of consciousness, and death. The use of regular and short-acting insulins to correct hyperkalemia quickly in hospitalized patients results in the greatest risk of hypoglycemia within three hours of treatment.4 Nonetheless, monitoring blood glucose levels within six hours of postinsulin administration is not a standard part of hyperkalemia treatment guidelines,3 leaving the rates of hypoglycemia in this setting poorly characterized.
Without standardized blood glucose measurement protocols, retrospective studies have reported posttreatment hypoglycemia rates of 8.7%-17.5% among all patients with hyperkalemia,5,6 and 13% among patients with end-stage renal disease.4 These estimates likely underestimate the true hypoglycemia rates as they measure blood glucose sporadically and are often outside the three-hour window of highest risk after insulin administration.
At the University of California, San Francisco Medical Center (UCSFMC), we faced similar issues in measuring the true hypoglycemia rates associated with hyperkalemia treatment. In December 2015, a 12-month retrospective review revealed a 12% hypoglycemia rate among patients treated with insulin for hyperkalemia. This review was limited by the inclusion of only patients treated for hyperkalemia using the standard orderset supplied with the electronic health record system (EHR; EPIC Systems, Verona, Wisconsin) and the absence of specific orders for glucose monitoring. As a result, more than 40% of these inpatients had no documented glucose within six hours of postinsulin administration.
We subsequently designed and implemented an adult inpatient hyperkalemia treatment orderset aimed at reducing iatrogenic hypoglycemia by promoting appropriate insulin use and blood glucose monitoring during the treatment of hyperkalemia. Through rapid improvement cycles, we iteratively revised the orderset to optimally mitigate the risk of hypoglycemia that was associated with insulin use. We describe implementation and outcomes of weight-based insulin dosing,7 automated alerts to identify patients at greatest risk for hypoglycemia, and clinical decision support based on the preinsulin blood glucose level. We report the rates of iatrogenic hypoglycemia after the implementation of these order-set changes.
METHODS
Design Overview
EHR data were extracted from Epic Clarity. We analyzed data following Orderset 1.1 implementation (January 1, 2016-March 19, 2017) when hypoglycemia rates were reliably quantifiable and following orderset revision 1.2 (March 20, 2017-September 30, 2017) to evaluate the impact of the orderset intervention. The data collection was approved by the Institutional Review Board at the University of California, San Francisco.
Additionally, we explored the frequency in which providers ordered insulin through the hyperkalemia orderset for each version of the orderset via two-month baseline reviews. Investigation for Orderset 1.1 was from January 1, 2017 to February 28, 2017 and for Orderset 1.2 was from August 1, 2017 to September 30, 2017. Insulin ordering frequency through the hyperkalemia orderset was defined as ordering insulin through the adult inpatient hyperkalemia orderset versus ordering insulin in and outside of the hyperkalemia orderset.
Last, we measured the nursing point of care testing (POCT) blood glucose measurement compliance with the hyperkalemia orderset. Nursing utilization acceptance of the hyperkalemia orderset was defined as adequate POCT blood glucose levels monitored in comparison to all insulin treatments via the hyperkalemia orderset.
Setting and Participants
We evaluated nonobstetric adult inpatients admitted to UCSF Medical Center between January 2016 and September 2017. All medical and surgical wards and intensive care units were included in the analysis.
Intervention
In June 2012, an EHR developed by Epic Systems was introduced at UCSFMC. In January 2016, we designed a new EHR-based hyperkalemia treatment orderset (Orderset 1.1), which added standard POCT blood glucose checks before and at one, two, four, and six hours after insulin injection (Appendix 1). In March 2017, a newly designed orderset (Orderset 1.2) replaced the previous hyperkalemia treatment orderset (Appendix 2). Orderset 1.2 included three updates. First, providers were now presented the option of ordering insulin as a
CORRECTED FIGURE PER ERRATUM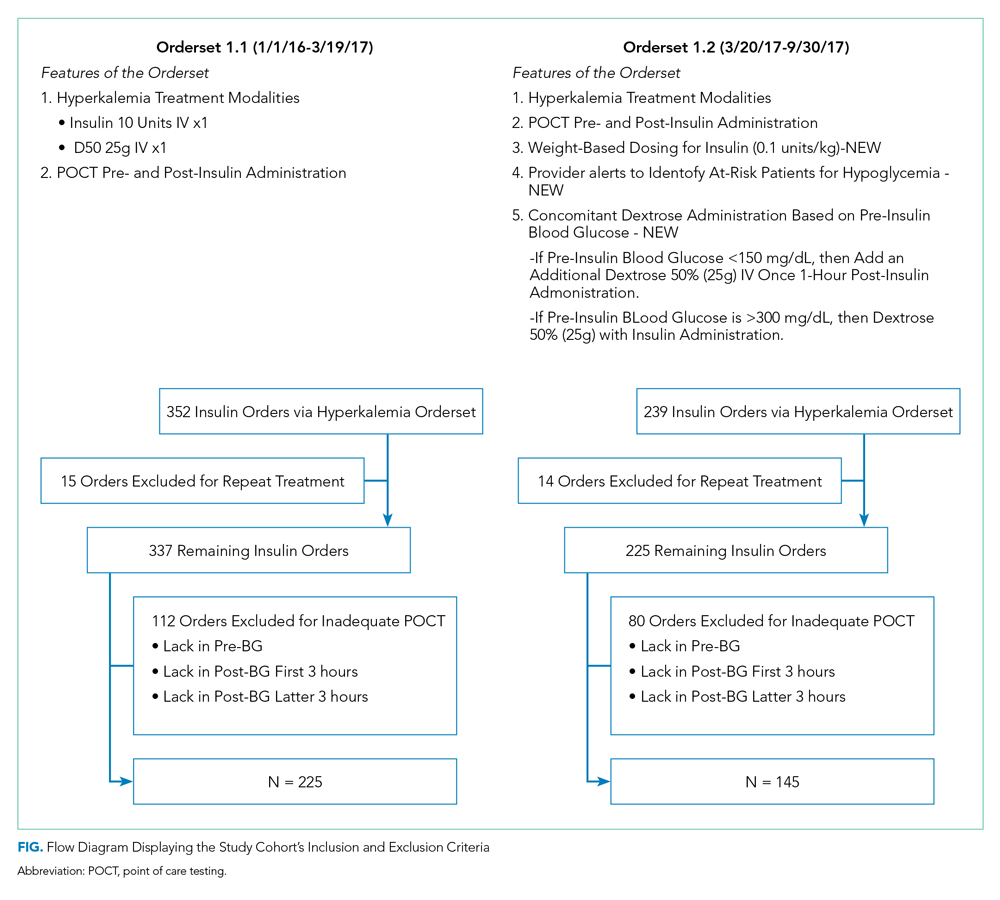
Inclusion and exclusion criteria are shown in the Figure. All patients who had insulin ordered via a hyperkalemia orderset were included in an intention-to-treat analysis. A further analysis was performed for patients for whom orderset compliance was achieved (ie, insulin ordered through the ordersets with adequate blood glucose monitoring). These patients were required to have a POCT blood glucose check preinsulin administration and postinsulin administration as follows: (1) between 30 to 180 minutes (0.5 to three hours) after insulin administration, and (2) between 180 and 360 minutes (three to six hours) after insulin administration. For patients receiving repeated insulin treatments for hyperkalemia within six hours, the first treatment data points were excluded to prevent duplication.
Outcomes
We extracted data on all nonobstetric adult patients admitted to UCSFMC between January 1, 2016 and March 19, 2017 (Orderset 1.1) and between March 20, 2017 and September 30, 2017 (Orderset 1.2).
We measured unique insulin administrations given that each insulin injection poses a risk of iatrogenic hypoglycemia. Hypoglycemia was defined as glucose <70 mg/dL and severe hypoglycemia was defined as glucose <40 mg/dL. Covariates included time and date of insulin administration; blood glucose levels before and at one, two, four, and six hours after insulin injection (if available); sex; weight; dose of insulin given for hyperkalemia treatment; creatinine; known diagnosis of diabetes; concomitant use of albuterol; and concomitant use of corticosteroids. Hyperglycemia was defined as glucose >180 mg/dL. We collected potassium levels pre- and postinsulin treatment. The responsible team’s discipline and the location of the patient (eg, medical/surgical unit, intensive care unit, emergency department) where the insulin orderset was used were recorded.
Statistical Analysis
Statistical analysis for our data included the χ2 test for categorical data and Student t test for continuous data. The bivariate analysis identified potential risk factors and protective factors for hypoglycemia, and logistic regression was used to determine independent predictors of hypoglycemia. Through bivariate analyses, any factor with a P value below .05 was included in the multivariable analyses to investigate a significant contribution to hypoglycemia outcomes. Analyses for hypoglycemia and severe hypoglycemia rates, potassium levels pre- and postinsulin treatment, and hyperglycemia rates were done for both the intention-to-treat group and the group with all criteria met. All analyses were rendered utilizing Stata version 14 (Stata Corp LLC, College Station, Texas).
RESULTS
Baseline patient characteristics, initial insulin dosing, the treatment team, and the location are shown in Table 1. With the implementation of weight-based dosing, a lower dose of insulin was administered with Orderset 1.2 compared with Orderset 1.1.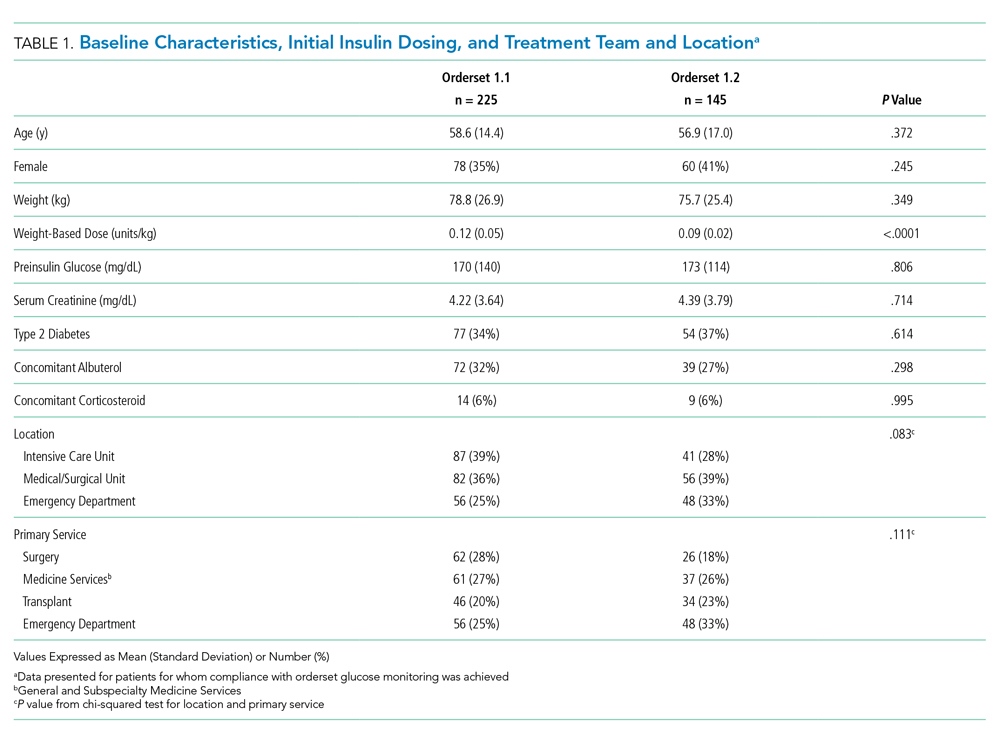
Orderset adherence rates for Orderset 1.1 and 1.2 were as follows: Acute Care Floor 65% (70%), Intensive Care Unit 63% (66%), and Emergency Department 60% (55%). A two-month audit of orderset usage and compliance revealed that 73% (70 of 96) of insulin treatments were ordered through Orderset 1.1, and 77% (71 of 92) of insulin treatments were ordered through Orderset 1.2. The distribution of orderset usage across location and primary service are shown in Table 1.
The patient distribution is shown in the Figure. In the Orderset 1.1 period, there were 352 total insulin treatments utilizing the newly revised UCSFMC adult inpatient hyperkalemia orderset that were used for the intention-to-treat analysis, and there were 225 patients for whom compliance with orderset monitoring was achieved. Notably, 112 treatments were excluded for the lack of adequate blood glucose monitoring. In the Orderset 1.2 period, there were 239 total insulin treatments utilizing the newly revised UCSFMC adult inpatient hyperkalemia orderset that were used for the intention-to-treat analysis, and there were 145 patients for whom compliance with orderset monitoring was achieved. During this phase, 80 treatments were excluded for inadequate blood glucose monitoring.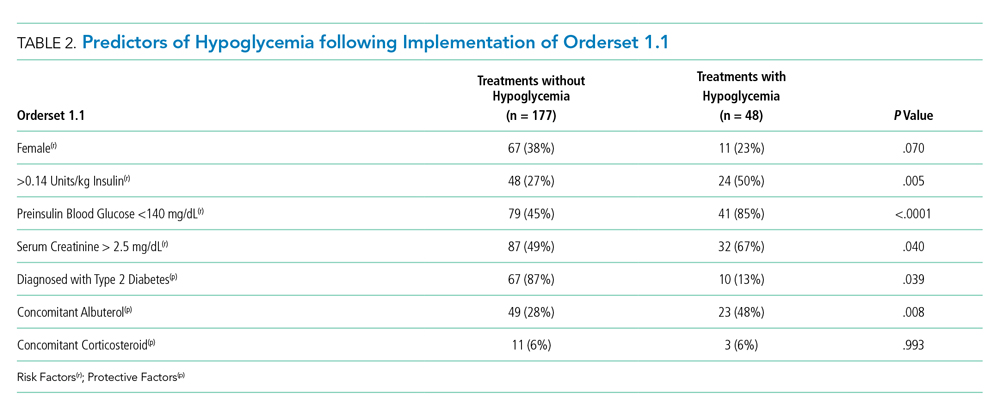
Predictors of hypoglycemia following the implementation of Orderset 1.1 are shown in Table 2, and the logistic regression model of these risks is shown in Appendix Table 1. Female gender, weight-based dosing of insulin exceeding 0.14 units/kg, preinsulin blood glucose less than 140 mg/dL, and serum creatinine greater than 2.5 mg/dl were associated with an increased risk of hypoglycemia. A known diagnosis of Type 2 diabetes, concomitant albuterol within one hour of insulin administration, and corticosteroid administration within two hours of insulin administration were associated with a decreased risk of hypoglycemia.
The rates of hypoglycemia (<70 mg/dl) and severe hypoglycemia (<40 mg/dl) are shown in Table 3. During the Orderset 1.1 period,
During the Orderset 1.2 period, for patients with all criteria met, 14 of 145 (10%) had hypoglycemia, and three of 145 (2%) had severe hypoglycemia. Ten of 14 (72%) of these hypoglycemic events occurred in the first three hours, with the remaining four hypoglycemic events (28%) occurring in the last three hours.
An intention-to-treat analysis for hyperglycemia, defined as glucose >180 mg/dl, revealed that during the Orderset 1.1 period, 80 of 352 (23%) had hyperglycemia before insulin administration, and 38 of 352 (11%) had hyperglycemia after insulin administration. During the Orderset 1.2 period, 52 of 239 (22%) had hyperglycemia before insulin administration, and 15 of 239 (6%) had hyperglycemia after insulin administration. Results can be found in Table 3.
Pre- and posttreatment potassium levels are shown in Table 3. An intention-to-treat analysis for potassium reduction postinsulin administration revealed that during the Orderset 1.1 period, there was an absolute reduction of 0.73 mmol/L, while during the Orderset 1.2 period, there was an absolute reduction of 0.95 mmol/L.
DISCUSSION
Treatment of hyperkalemia with insulin may result in significant iatrogenic hypoglycemia. Prior studies have likely underestimated the incidence of hyperkalemia treatment-associated hypoglycemia as glucose levels are rarely checked within three hours of insulin administration.8 In our study, which was designed to ensure appropriate blood glucose measurement, 21% of insulin treatments for hyperkalemia resulted in hypoglycemia, with 92% of hypoglycemic events occurring within the first three hours.
For the Orderset 1.1 period, patient risk factors identified for iatrogenic hypoglycemia postinsulin administration were female sex, doses of regular insulin greater than 0.14 units/kg, preinsulin blood glucose less than 140 mg/dL, and serum creatinine greater than 2.5 mg/dL. These results are consistent with studies suggesting that preinsulin blood glucose levels less than 140 mg/dL and the standard 10 units of insulin for hyperkalemia treatment may increase the risk of hypoglycemia.4,7,9
To decrease the risk of iatrogenic hypoglycemia, we redesigned our hyperkalemia insulin orderset to address the strongest predictors of hypoglycemia (doses of regular insulin greater than 0.14 units/kg and preinsulin blood glucose less than 140 mg/dL). The main changes were weight-based insulin dosing (based on previously published data)10 and adjustment of glucose administration based on the patient’s glucose levels.11 Following these changes, the rates of both hypoglycemia and severe hypoglycemia were statistically significantly reduced. In addition, of the 14 hypoglycemia events identified after the introduction of Orderset 1.2, five could have been prevented (36%) had the protocol been strictly followed. These five hypoglycemia events occurred later than one-hour postinsulin administration in patients with blood sugars < 150 mg/dL prior to insulin administration. In each of these cases, Orderset 1.2 called for an additional dextrose 50% (50 mL) IV bolus, which likely would have prevented the subsequently recorded hypoglycemia. In other words, our orderset indicated that these patients received an additional bolus of dextrose. However, they did not receive their glucose at the appropriate time, contributing to the hypoglycemia events. The orderset did not include a best practice alert (BPA) to remind providers about the extra dextrose bolus. In the future, we plan to add this BPA.
The hypoglycemia rate identified by Orderset 1.1 was 21% and the hypoglycemia rate identified by the Orderset 1.2 was 10%. The severe hypoglycemia rate identified by Orderset 1.1 was 5% and the severe hypoglycemia rate identified by Orderset 1.2 was 2%. The hypoglycemia and severe hypoglycemia rates significantly decreased after the introduction of Orderset 1.2. To mimic a real-world clinical setting, where monitoring of blood glucose is not always achieved multiple times within a six-hour timeframe of postinsulin treatment for hyperkalemia, we conducted an intention-to-treat analysis. Even when including patients for whom full blood glucose monitoring was not achieved, the introduction of Orderset 1.2 was associated with a significant decrease in the hypoglycemia rate.
To demonstrate whether weight-based dosing of insulin was as effective as a standard dose for hyperkalemia treatment, we compared the impact of Orderset 1.1, which only had the option for single standard doses of insulin, with the impact of Orderset 1.2, which included weight-based dosing options. With the introduction of Orderset 1.2, there was a significant decrease in serum potassium, indicating that weight-based dosing options may not only prevent hypoglycemia but may potentially provide more effective hyperkalemia treatment.
We also compared the rate of hyperglycemia (a glucose >180 mg/dl) pre- and posttreatment (Table 3). Although not statistically significant, the rate of hyperglycemia decreased from 11% to 6%, suggesting a trend toward decreased hyperglycemia with orderset usage.
As orderset usage for hyperkalemia management only occurred approximately 75% of the time, likely, forcing the use of these ordersets would further reduce the incidence of treatment-associated hypoglycemia. To encourage the use of ordersets for hyperkalemia management, our medical center has largely restricted insulin ordering so that it can only be done through ordersets with the proper precautions in place, regardless of the indication. Furthermore, adherence to all the blood glucose monitoring orders embedded in the ordersets remained suboptimal irrespective of managing the service or clinical setting
Finally, development and implementation of these hyperkalemia treatment ordersets required an experienced multidisciplinary team, including pharmacists, nurses, hospitalists, endocrinologists, and EHR system programmers.12,13 We, therefore, encourage interprofessional collaboration for any institutions seeking to establish innovative clinical protocols.
This analysis was limited to the insulin administration meeting our inclusion criteria. Thus, we could not identify a true hypoglycemia rate for treatments that were not followed by adequate blood glucose monitoring postinsulin administration, or for insulin administration ordered outside of the hyperkalemia ordersets.
CONCLUSION
The use of a comprehensive EHR orderset for the treatment of hyperkalemia with predefined times for blood glucose monitoring, weight-based insulin dosing, and prompts to warn providers of an individual patient’s risk for hypoglycemia may significantly reduce the incidence of iatrogenic hypoglycemia.
1. Acker CG, Johnson JP, Palevsky PM, Greenberg A. Hyperkalemia in hospitalized patients: causes, adequacy of treatment, and results of an attempt to improve physician compliance with published therapy guidelines. Arch Intern Med. 1998;158(8):917-924. https://doi.org/10.1001/archinte.158.8.917.
2. Fordjour KN, Walton T, Doran JJ. Management of hyperkalemia in hospitalized patients. Am J Med Sci. 2014;347(2):93-100. https://doi.org/10.1097/MAJ.0b013e318279b105.
3. Part-10-Special-Circumstances-of-Resuscitation.pdf. https://eccguidelines.heart.org/wp-content/themes/eccstaging/dompdf-master/pdffiles/part-10-special-circumstances-of-resuscitation.pdf. Accessed December 16, 2017.
4. Apel J, Reutrakul S, Baldwin D. Hypoglycemia in the treatment of hyperkalemia with insulin in patients with end-stage renal disease. Clin Kidney J. 2014;7(3):248-250. https://doi.org/10.1093/ckj/sfu026.
5. Schafers S, Naunheim R, Vijayan A, Tobin G. Incidence of hypoglycemia following insulin-based acute stabilization of hyperkalemia treatment. J Hosp Med. 2012;7(3):239-242. https://doi.org/10.1002/jhm.977.
6. Boughton CK, Dixon D, Goble E, et al. Preventing hypoglycemia following treatment of hyperkalemia in hospitalized patients. J Hosp Med. 2019;14:E1-E4. https://doi.org/10.12788/jhm.3145.
7. Wheeler DT, Schafers SJ, Horwedel TA, Deal EN, Tobin GS. Weight-based insulin dosing for acute hyperkalemia results in less hypoglycemia. J Hosp Med. 2016;11(5):355-357. https://doi.org/10.1002/jhm.2545.
8. Coca A, Valencia AL, Bustamante J, Mendiluce A, Floege J. Hypoglycemia following intravenous insulin plus glucose for hyperkalemia in patients with impaired renal function. PLoS ONE. 2017;12(2):e0172961. https://doi.org/10.1371/journal.pone.0172961.
9. LaRue HA, Peksa GD, Shah SC. A comparison of insulin doses for the treatment of hyperkalemia in patients with renal insufficiency. Pharmacotherapy. 2017;37(12):1516-1522. https://doi.org/10.1002/phar.2038.
10. Brown K, Setji TL, Hale SL, et al. Assessing the impact of an order panel utilizing weight-based insulin and standardized monitoring of blood glucose for patients with hyperkalemia. Am J Med Qual. 2018;33(6):598-603. https://doi.org/10.1177/1062860618764610.
11. Farina N, Anderson C. Impact of dextrose dose on hypoglycemia development following treatment of hyperkalemia. Ther Adv Drug Saf. 2018;9(6):323-329. https://doi.org/10.1177/2042098618768725.
12. Neinstein A, MacMaster HW, Sullivan MM, Rushakoff R. A detailed description of the implementation of inpatient insulin orders with a commercial electronic health record system. J Diabetes Sci Technol. 2014;8(4):641-651. https://doi.org/10.1177/1932296814536290.
13. MacMaster HW, Gonzalez S, Maruoka A, et al. Development and implementation of a subcutaneous Insulin pen label bar code scanning protocol to prevent wrong-patient insulin pen errors. Jt Comm J Qual Patient Saf. 2019;45(5):380-386. https://doi.org/10.1016/j.jcjq.2018.08.006.
Hyperkalemia (serum potassium ≥5.1 mEq/L), if left untreated, may result in cardiac arrhythmias, severe muscle weakness, or paralysis.1,2 Insulin administration can rapidly correct hyperkalemia by shifting serum potassiufm intracellularly.3 Treatment of hyperkalemia with insulin may lead to hypoglycemia, which, when severe, can cause confusion, seizures, loss of consciousness, and death. The use of regular and short-acting insulins to correct hyperkalemia quickly in hospitalized patients results in the greatest risk of hypoglycemia within three hours of treatment.4 Nonetheless, monitoring blood glucose levels within six hours of postinsulin administration is not a standard part of hyperkalemia treatment guidelines,3 leaving the rates of hypoglycemia in this setting poorly characterized.
Without standardized blood glucose measurement protocols, retrospective studies have reported posttreatment hypoglycemia rates of 8.7%-17.5% among all patients with hyperkalemia,5,6 and 13% among patients with end-stage renal disease.4 These estimates likely underestimate the true hypoglycemia rates as they measure blood glucose sporadically and are often outside the three-hour window of highest risk after insulin administration.
At the University of California, San Francisco Medical Center (UCSFMC), we faced similar issues in measuring the true hypoglycemia rates associated with hyperkalemia treatment. In December 2015, a 12-month retrospective review revealed a 12% hypoglycemia rate among patients treated with insulin for hyperkalemia. This review was limited by the inclusion of only patients treated for hyperkalemia using the standard orderset supplied with the electronic health record system (EHR; EPIC Systems, Verona, Wisconsin) and the absence of specific orders for glucose monitoring. As a result, more than 40% of these inpatients had no documented glucose within six hours of postinsulin administration.
We subsequently designed and implemented an adult inpatient hyperkalemia treatment orderset aimed at reducing iatrogenic hypoglycemia by promoting appropriate insulin use and blood glucose monitoring during the treatment of hyperkalemia. Through rapid improvement cycles, we iteratively revised the orderset to optimally mitigate the risk of hypoglycemia that was associated with insulin use. We describe implementation and outcomes of weight-based insulin dosing,7 automated alerts to identify patients at greatest risk for hypoglycemia, and clinical decision support based on the preinsulin blood glucose level. We report the rates of iatrogenic hypoglycemia after the implementation of these order-set changes.
METHODS
Design Overview
EHR data were extracted from Epic Clarity. We analyzed data following Orderset 1.1 implementation (January 1, 2016-March 19, 2017) when hypoglycemia rates were reliably quantifiable and following orderset revision 1.2 (March 20, 2017-September 30, 2017) to evaluate the impact of the orderset intervention. The data collection was approved by the Institutional Review Board at the University of California, San Francisco.
Additionally, we explored the frequency in which providers ordered insulin through the hyperkalemia orderset for each version of the orderset via two-month baseline reviews. Investigation for Orderset 1.1 was from January 1, 2017 to February 28, 2017 and for Orderset 1.2 was from August 1, 2017 to September 30, 2017. Insulin ordering frequency through the hyperkalemia orderset was defined as ordering insulin through the adult inpatient hyperkalemia orderset versus ordering insulin in and outside of the hyperkalemia orderset.
Last, we measured the nursing point of care testing (POCT) blood glucose measurement compliance with the hyperkalemia orderset. Nursing utilization acceptance of the hyperkalemia orderset was defined as adequate POCT blood glucose levels monitored in comparison to all insulin treatments via the hyperkalemia orderset.
Setting and Participants
We evaluated nonobstetric adult inpatients admitted to UCSF Medical Center between January 2016 and September 2017. All medical and surgical wards and intensive care units were included in the analysis.
Intervention
In June 2012, an EHR developed by Epic Systems was introduced at UCSFMC. In January 2016, we designed a new EHR-based hyperkalemia treatment orderset (Orderset 1.1), which added standard POCT blood glucose checks before and at one, two, four, and six hours after insulin injection (Appendix 1). In March 2017, a newly designed orderset (Orderset 1.2) replaced the previous hyperkalemia treatment orderset (Appendix 2). Orderset 1.2 included three updates. First, providers were now presented the option of ordering insulin as a
CORRECTED FIGURE PER ERRATUM
Inclusion and exclusion criteria are shown in the Figure. All patients who had insulin ordered via a hyperkalemia orderset were included in an intention-to-treat analysis. A further analysis was performed for patients for whom orderset compliance was achieved (ie, insulin ordered through the ordersets with adequate blood glucose monitoring). These patients were required to have a POCT blood glucose check preinsulin administration and postinsulin administration as follows: (1) between 30 to 180 minutes (0.5 to three hours) after insulin administration, and (2) between 180 and 360 minutes (three to six hours) after insulin administration. For patients receiving repeated insulin treatments for hyperkalemia within six hours, the first treatment data points were excluded to prevent duplication.
Outcomes
We extracted data on all nonobstetric adult patients admitted to UCSFMC between January 1, 2016 and March 19, 2017 (Orderset 1.1) and between March 20, 2017 and September 30, 2017 (Orderset 1.2).
We measured unique insulin administrations given that each insulin injection poses a risk of iatrogenic hypoglycemia. Hypoglycemia was defined as glucose <70 mg/dL and severe hypoglycemia was defined as glucose <40 mg/dL. Covariates included time and date of insulin administration; blood glucose levels before and at one, two, four, and six hours after insulin injection (if available); sex; weight; dose of insulin given for hyperkalemia treatment; creatinine; known diagnosis of diabetes; concomitant use of albuterol; and concomitant use of corticosteroids. Hyperglycemia was defined as glucose >180 mg/dL. We collected potassium levels pre- and postinsulin treatment. The responsible team’s discipline and the location of the patient (eg, medical/surgical unit, intensive care unit, emergency department) where the insulin orderset was used were recorded.
Statistical Analysis
Statistical analysis for our data included the χ2 test for categorical data and Student t test for continuous data. The bivariate analysis identified potential risk factors and protective factors for hypoglycemia, and logistic regression was used to determine independent predictors of hypoglycemia. Through bivariate analyses, any factor with a P value below .05 was included in the multivariable analyses to investigate a significant contribution to hypoglycemia outcomes. Analyses for hypoglycemia and severe hypoglycemia rates, potassium levels pre- and postinsulin treatment, and hyperglycemia rates were done for both the intention-to-treat group and the group with all criteria met. All analyses were rendered utilizing Stata version 14 (Stata Corp LLC, College Station, Texas).
RESULTS
Baseline patient characteristics, initial insulin dosing, the treatment team, and the location are shown in Table 1. With the implementation of weight-based dosing, a lower dose of insulin was administered with Orderset 1.2 compared with Orderset 1.1.
Orderset adherence rates for Orderset 1.1 and 1.2 were as follows: Acute Care Floor 65% (70%), Intensive Care Unit 63% (66%), and Emergency Department 60% (55%). A two-month audit of orderset usage and compliance revealed that 73% (70 of 96) of insulin treatments were ordered through Orderset 1.1, and 77% (71 of 92) of insulin treatments were ordered through Orderset 1.2. The distribution of orderset usage across location and primary service are shown in Table 1.
The patient distribution is shown in the Figure. In the Orderset 1.1 period, there were 352 total insulin treatments utilizing the newly revised UCSFMC adult inpatient hyperkalemia orderset that were used for the intention-to-treat analysis, and there were 225 patients for whom compliance with orderset monitoring was achieved. Notably, 112 treatments were excluded for the lack of adequate blood glucose monitoring. In the Orderset 1.2 period, there were 239 total insulin treatments utilizing the newly revised UCSFMC adult inpatient hyperkalemia orderset that were used for the intention-to-treat analysis, and there were 145 patients for whom compliance with orderset monitoring was achieved. During this phase, 80 treatments were excluded for inadequate blood glucose monitoring.
Predictors of hypoglycemia following the implementation of Orderset 1.1 are shown in Table 2, and the logistic regression model of these risks is shown in Appendix Table 1. Female gender, weight-based dosing of insulin exceeding 0.14 units/kg, preinsulin blood glucose less than 140 mg/dL, and serum creatinine greater than 2.5 mg/dl were associated with an increased risk of hypoglycemia. A known diagnosis of Type 2 diabetes, concomitant albuterol within one hour of insulin administration, and corticosteroid administration within two hours of insulin administration were associated with a decreased risk of hypoglycemia.
The rates of hypoglycemia (<70 mg/dl) and severe hypoglycemia (<40 mg/dl) are shown in Table 3. During the Orderset 1.1 period,
During the Orderset 1.2 period, for patients with all criteria met, 14 of 145 (10%) had hypoglycemia, and three of 145 (2%) had severe hypoglycemia. Ten of 14 (72%) of these hypoglycemic events occurred in the first three hours, with the remaining four hypoglycemic events (28%) occurring in the last three hours.
An intention-to-treat analysis for hyperglycemia, defined as glucose >180 mg/dl, revealed that during the Orderset 1.1 period, 80 of 352 (23%) had hyperglycemia before insulin administration, and 38 of 352 (11%) had hyperglycemia after insulin administration. During the Orderset 1.2 period, 52 of 239 (22%) had hyperglycemia before insulin administration, and 15 of 239 (6%) had hyperglycemia after insulin administration. Results can be found in Table 3.
Pre- and posttreatment potassium levels are shown in Table 3. An intention-to-treat analysis for potassium reduction postinsulin administration revealed that during the Orderset 1.1 period, there was an absolute reduction of 0.73 mmol/L, while during the Orderset 1.2 period, there was an absolute reduction of 0.95 mmol/L.
DISCUSSION
Treatment of hyperkalemia with insulin may result in significant iatrogenic hypoglycemia. Prior studies have likely underestimated the incidence of hyperkalemia treatment-associated hypoglycemia as glucose levels are rarely checked within three hours of insulin administration.8 In our study, which was designed to ensure appropriate blood glucose measurement, 21% of insulin treatments for hyperkalemia resulted in hypoglycemia, with 92% of hypoglycemic events occurring within the first three hours.
For the Orderset 1.1 period, patient risk factors identified for iatrogenic hypoglycemia postinsulin administration were female sex, doses of regular insulin greater than 0.14 units/kg, preinsulin blood glucose less than 140 mg/dL, and serum creatinine greater than 2.5 mg/dL. These results are consistent with studies suggesting that preinsulin blood glucose levels less than 140 mg/dL and the standard 10 units of insulin for hyperkalemia treatment may increase the risk of hypoglycemia.4,7,9
To decrease the risk of iatrogenic hypoglycemia, we redesigned our hyperkalemia insulin orderset to address the strongest predictors of hypoglycemia (doses of regular insulin greater than 0.14 units/kg and preinsulin blood glucose less than 140 mg/dL). The main changes were weight-based insulin dosing (based on previously published data)10 and adjustment of glucose administration based on the patient’s glucose levels.11 Following these changes, the rates of both hypoglycemia and severe hypoglycemia were statistically significantly reduced. In addition, of the 14 hypoglycemia events identified after the introduction of Orderset 1.2, five could have been prevented (36%) had the protocol been strictly followed. These five hypoglycemia events occurred later than one-hour postinsulin administration in patients with blood sugars < 150 mg/dL prior to insulin administration. In each of these cases, Orderset 1.2 called for an additional dextrose 50% (50 mL) IV bolus, which likely would have prevented the subsequently recorded hypoglycemia. In other words, our orderset indicated that these patients received an additional bolus of dextrose. However, they did not receive their glucose at the appropriate time, contributing to the hypoglycemia events. The orderset did not include a best practice alert (BPA) to remind providers about the extra dextrose bolus. In the future, we plan to add this BPA.
The hypoglycemia rate identified by Orderset 1.1 was 21% and the hypoglycemia rate identified by the Orderset 1.2 was 10%. The severe hypoglycemia rate identified by Orderset 1.1 was 5% and the severe hypoglycemia rate identified by Orderset 1.2 was 2%. The hypoglycemia and severe hypoglycemia rates significantly decreased after the introduction of Orderset 1.2. To mimic a real-world clinical setting, where monitoring of blood glucose is not always achieved multiple times within a six-hour timeframe of postinsulin treatment for hyperkalemia, we conducted an intention-to-treat analysis. Even when including patients for whom full blood glucose monitoring was not achieved, the introduction of Orderset 1.2 was associated with a significant decrease in the hypoglycemia rate.
To demonstrate whether weight-based dosing of insulin was as effective as a standard dose for hyperkalemia treatment, we compared the impact of Orderset 1.1, which only had the option for single standard doses of insulin, with the impact of Orderset 1.2, which included weight-based dosing options. With the introduction of Orderset 1.2, there was a significant decrease in serum potassium, indicating that weight-based dosing options may not only prevent hypoglycemia but may potentially provide more effective hyperkalemia treatment.
We also compared the rate of hyperglycemia (a glucose >180 mg/dl) pre- and posttreatment (Table 3). Although not statistically significant, the rate of hyperglycemia decreased from 11% to 6%, suggesting a trend toward decreased hyperglycemia with orderset usage.
As orderset usage for hyperkalemia management only occurred approximately 75% of the time, likely, forcing the use of these ordersets would further reduce the incidence of treatment-associated hypoglycemia. To encourage the use of ordersets for hyperkalemia management, our medical center has largely restricted insulin ordering so that it can only be done through ordersets with the proper precautions in place, regardless of the indication. Furthermore, adherence to all the blood glucose monitoring orders embedded in the ordersets remained suboptimal irrespective of managing the service or clinical setting
Finally, development and implementation of these hyperkalemia treatment ordersets required an experienced multidisciplinary team, including pharmacists, nurses, hospitalists, endocrinologists, and EHR system programmers.12,13 We, therefore, encourage interprofessional collaboration for any institutions seeking to establish innovative clinical protocols.
This analysis was limited to the insulin administration meeting our inclusion criteria. Thus, we could not identify a true hypoglycemia rate for treatments that were not followed by adequate blood glucose monitoring postinsulin administration, or for insulin administration ordered outside of the hyperkalemia ordersets.
CONCLUSION
The use of a comprehensive EHR orderset for the treatment of hyperkalemia with predefined times for blood glucose monitoring, weight-based insulin dosing, and prompts to warn providers of an individual patient’s risk for hypoglycemia may significantly reduce the incidence of iatrogenic hypoglycemia.
1. Acker CG, Johnson JP, Palevsky PM, Greenberg A. Hyperkalemia in hospitalized patients: causes, adequacy of treatment, and results of an attempt to improve physician compliance with published therapy guidelines. Arch Intern Med. 1998;158(8):917-924. https://doi.org/10.1001/archinte.158.8.917.
2. Fordjour KN, Walton T, Doran JJ. Management of hyperkalemia in hospitalized patients. Am J Med Sci. 2014;347(2):93-100. https://doi.org/10.1097/MAJ.0b013e318279b105.
3. Part-10-Special-Circumstances-of-Resuscitation.pdf. https://eccguidelines.heart.org/wp-content/themes/eccstaging/dompdf-master/pdffiles/part-10-special-circumstances-of-resuscitation.pdf. Accessed December 16, 2017.
4. Apel J, Reutrakul S, Baldwin D. Hypoglycemia in the treatment of hyperkalemia with insulin in patients with end-stage renal disease. Clin Kidney J. 2014;7(3):248-250. https://doi.org/10.1093/ckj/sfu026.
5. Schafers S, Naunheim R, Vijayan A, Tobin G. Incidence of hypoglycemia following insulin-based acute stabilization of hyperkalemia treatment. J Hosp Med. 2012;7(3):239-242. https://doi.org/10.1002/jhm.977.
6. Boughton CK, Dixon D, Goble E, et al. Preventing hypoglycemia following treatment of hyperkalemia in hospitalized patients. J Hosp Med. 2019;14:E1-E4. https://doi.org/10.12788/jhm.3145.
7. Wheeler DT, Schafers SJ, Horwedel TA, Deal EN, Tobin GS. Weight-based insulin dosing for acute hyperkalemia results in less hypoglycemia. J Hosp Med. 2016;11(5):355-357. https://doi.org/10.1002/jhm.2545.
8. Coca A, Valencia AL, Bustamante J, Mendiluce A, Floege J. Hypoglycemia following intravenous insulin plus glucose for hyperkalemia in patients with impaired renal function. PLoS ONE. 2017;12(2):e0172961. https://doi.org/10.1371/journal.pone.0172961.
9. LaRue HA, Peksa GD, Shah SC. A comparison of insulin doses for the treatment of hyperkalemia in patients with renal insufficiency. Pharmacotherapy. 2017;37(12):1516-1522. https://doi.org/10.1002/phar.2038.
10. Brown K, Setji TL, Hale SL, et al. Assessing the impact of an order panel utilizing weight-based insulin and standardized monitoring of blood glucose for patients with hyperkalemia. Am J Med Qual. 2018;33(6):598-603. https://doi.org/10.1177/1062860618764610.
11. Farina N, Anderson C. Impact of dextrose dose on hypoglycemia development following treatment of hyperkalemia. Ther Adv Drug Saf. 2018;9(6):323-329. https://doi.org/10.1177/2042098618768725.
12. Neinstein A, MacMaster HW, Sullivan MM, Rushakoff R. A detailed description of the implementation of inpatient insulin orders with a commercial electronic health record system. J Diabetes Sci Technol. 2014;8(4):641-651. https://doi.org/10.1177/1932296814536290.
13. MacMaster HW, Gonzalez S, Maruoka A, et al. Development and implementation of a subcutaneous Insulin pen label bar code scanning protocol to prevent wrong-patient insulin pen errors. Jt Comm J Qual Patient Saf. 2019;45(5):380-386. https://doi.org/10.1016/j.jcjq.2018.08.006.
© 2020 Society of Hospital Medicine
Stimulant Medication Prescribing Practices Within a VA Health Care System
Dispensing of prescription stimulant medications, such as methylphenidate or amphetamine salts, has been expanding at a rapid rate over the past 2 decades. An astounding 58 million stimulant medications were prescribed in 2014.1,2 Adults now exceed youths in the proportion of prescribed stimulant medications.1,3
Off-label use of prescription stimulant medications, such as for performance enhancement, fatigue management, weight loss, medication-assisted therapy for stimulant use disorders, and adjunctive treatment for certain depressive disorders, is reported to be ≥ 40% of total stimulant use and is much more common in adults.1 A 2017 study assessing risk of amphetamine use disorder and mortality among veterans prescribed stimulant medications within the Veterans Health Administration (VHA) reported off-label use in nearly 3 of every 5 incident users in 2012.4 Off-label use also is significantly more common when prescribed by nonpsychiatric physicians compared with that of psychiatrists.1
One study assessing stimulant prescribing from 2006 to 2009 found that nearly 60% of adults were prescribed stimulant medications by nonpsychiatrist physicians, and only 34% of those adults prescribed a stimulant by a nonpsychiatrist physician had a diagnosis of attention-deficit hyperactivity disorder (ADHD).5 Findings from managed care plans covering years from 2000 to 2004 were similar, concluding that 30% of the adult patients who were prescribed methylphenidate had at least 1 medical claim with a diagnosis of ADHD.6 Of the approximately 16 million adults prescribed stimulant medications in 2017, > 5 million of them reported stimulant misuse.3 Much attention has been focused on misuse of stimulant medications by youths and young adults, but new information suggests that increased monitoring is needed among the US adult population. Per the US Department of Veterans Affairs (VA) Academic Detailing Stimulant Dashboard, as of October 2018 the national average of veterans with a documented substance use disorder (SUD) who are also prescribed stimulant medications through the VHA exceeds 20%, < 50% have an annual urine drug screen (UDS), and > 10% are coprescribed opioids and benzodiazepines.The percentage of veterans prescribed stimulant medications in the presence of a SUD has increased over the past decade, with a reported 8.7% incidence in 2002 increasing to 14.3% in 2012.4
There are currently no protocols, prescribing restrictions, or required monitoring parameters in place for prescription stimulant use within the Lexington VA Health Care System (LVAHCS). The purpose of this study was to evaluate the prescribing practices at LVAHCS of stimulant medications and identify opportunities for improvement in the prescribing and monitoring of this drug class.
Methods
This study was a single-center quality improvement project evaluating the prescribing practices of stimulant medications within LVAHCS and exempt from institutional review board approval. Veterans were included in the study if they were prescribed amphetamine salts, dextroamphetamine, lisdexamphetamine, or methylphenidate between January 1, 2018 and June 30, 2018; however, the veterans’ entire stimulant use history was assessed. Exclusion criteria included duration of use of < 2 months or < 2 prescriptions filled during the study period. Data for veterans who met the prespecified inclusion and exclusion criteria were collected via chart review and Microsoft SQL Server Management Studio.
Collected data included age, gender, stimulant regimen (drug name, dose, frequency), indication and duration of use, prescriber name and specialty, prescribing origin of initial stimulant medication, and whether stimulant use predated military service. Monitoring of stimulant medications was assessed via UDS at least annually, query of the prescription drug monitoring program (PDMP) at least quarterly, and average time between follow-up appointments with stimulant prescriber.
Monitoring parameters were assessed from January 1, 2017 through June 30, 2018, as it was felt that the 6-month study period would be too narrow to accurately assess monitoring trends. Mental health diagnoses, ADHD diagnostic testing if applicable, documented SUD or stimulant misuse past or present, and concomitant central nervous system (CNS) depressant use also were collected. CNS depressants evaluated were those that have abuse potential or significant psychotropic effects and included benzodiazepines, antipsychotics, opioids, gabapentin/pregabalin, Z-hypnotics, and muscle relaxants.
Results
The majority of participants were male (168/200) with an average age of 43.3 years. Dextroamphetamine/amphetamine was the most used stimulant (48.5%), followed by methylphenidate (40%), and dextroamphetamine (10%). Lisdexamphetamine was the least used stimulant, likely due to its formulary-restricted status within this facility. An extended release (ER) formulation was utilized in 1 of 4 participants, with 1 of 20 participants prescribed a combination of immediate release (IR) and ER formulations. Duration of use ranged from 3 months to 14 years, with an average duration of 4 years (Table 1).
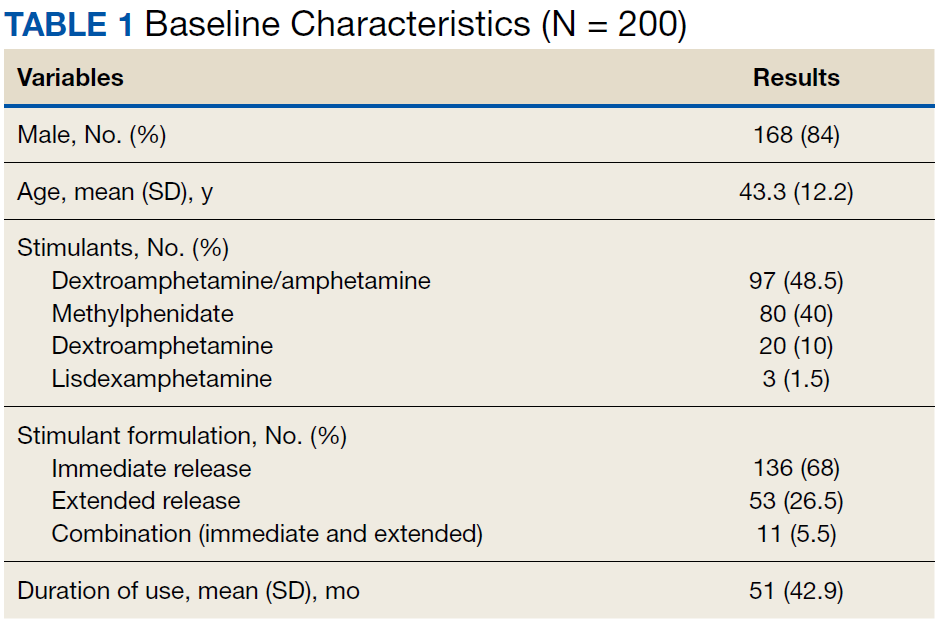
Nearly 40% of participants reported an origin of stimulant initiation outside of LVAHCS. Fourteen percent of participants were started on prescription stimulant medications while active-duty service members. Stimulant medications were initiated at another VA facility in 10.5% of instances, and 15% of participants reported being prescribed stimulant medications by a civilian prescriber prior to receiving them at LVAHCS. Seventy-four of 79 (93.6%) participants with an origin of stimulant prescription outside of LVAHCS reported a US Federal Food and Drug Administration (FDA)-approved indication for use.
Stimulant medications were used for FDA-approved indications (ADHD and narcolepsy) in 69.5% of participants. Note, this included patients who maintained an ADHD diagnosis in their medical record even if it was not substantiated with diagnostic testing. Of the participants reporting ADHD as an indication for stimulant use, diagnostic testing was conducted at LVAHCS to confirm an ADHD diagnosis in 58.6% (78/133) participants; 20.5% (16/78) of these diagnostic tests did not support the diagnosis of ADHD. All documented indications for use can be found in Table 2.
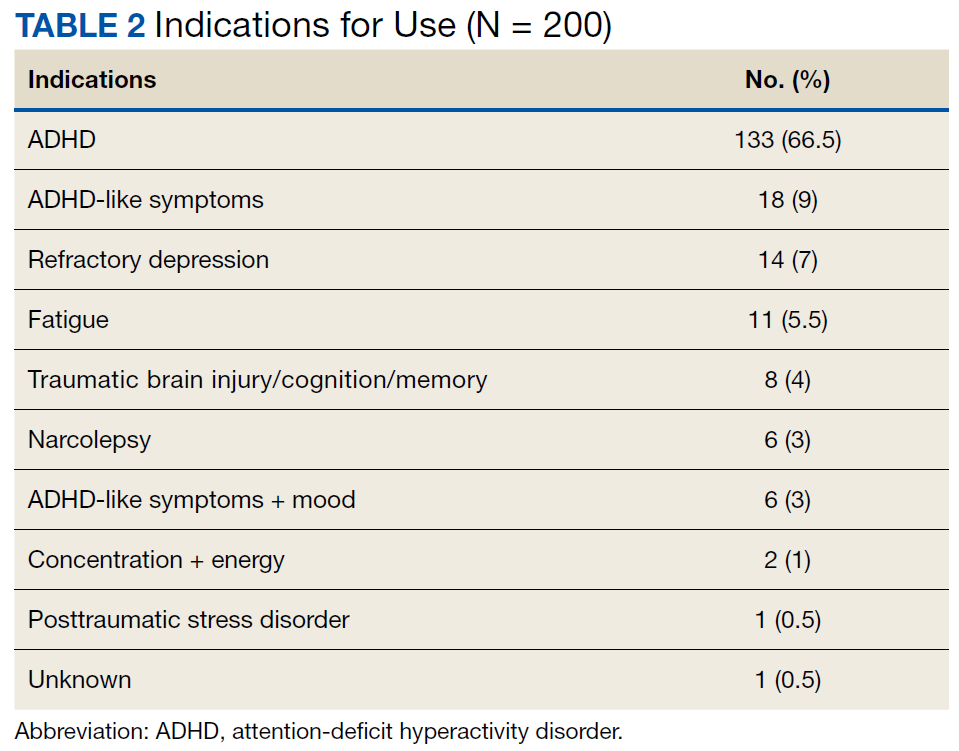
As expected, the most common indication was ADHD (66.5%), followed by ADHD-like symptoms (9%), refractory depression (7%), and fatigue (5.5%). Fourteen percent of participants had ≥ 1 change in indication for use, with some participants having up to 4 different documented indications while being prescribed stimulant medications. Twelve percent of participants were either denied stimulant initiation, or current stimulant medications were discontinued by one health provider and were restarted by another following a prescriber change. Aside from indication for stimulant use, 90% of participants had at least one additional mental health diagnosis. The rate of all mental health diagnoses documented in the medical record problem list can be found in Table 3.
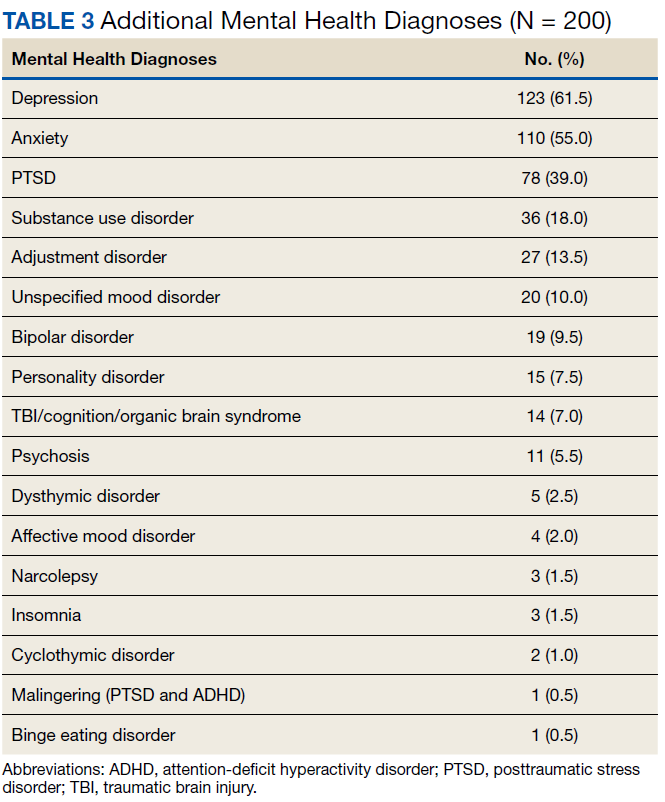
A UDS was collected at least annually in 37% of participants. A methylphenidate confirmatory screen was ordered to assess adherence in just 2 (2.5%) participants prescribed methylphenidate. While actively prescribed stimulant medications, PDMP was queried quarterly in 26% of participants. Time to follow-up with the prescriber ranged from 1 to 15 months, and 40% of participants had follow-up at least quarterly. Instance of SUD, either active or in remission, differed when searched via problem list (36/200) and prescriber documentation (63/200). The most common SUD was alcohol use disorder (13%), followed by cannabis use disorder (5%), polysubstance use disorder (5%), opioid use disorder (4.5%), stimulant use disorder (2.5%), and sedative use disorder (1%). Twenty-five participants currently prescribed stimulant medications had stimulant abuse/misuse documented in their medical record. Fifty-four percent of participants were prescribed at least 1 CNS depressant considered to have abuse potential or significant psychotropic effects. Opioids were most common (23%), followed by muscle relaxants (15.5%), benzodiazepines (15%), antipsychotics (13%), gabapentin/pregabalin (12%), and Z-hypnotics (12%).
Discussion
The source of the initial stimulant prescription was assessed. The majority of veterans had received medical care prior to receiving care at LVAHCS, whether on active duty, from another VA facility throughout the country, or by a private civilian prescriber. The origin of initial stimulant medication and indication for stimulant medication use were patient reported. Requiring medical records from civilian providers prior to continuing stimulant medication is prescriber-dependent and was not available for all participants.
As expected, the majority of participants
The reasons for discontinuation included a positive UDS result for cocaine, psychosis, broken narcotic contract, ADHD diagnosis not supported by psychological testing, chronic bipolar disorder secondary to stimulant use, diversion, stimulant misuse, and lack of indication for use. There also were a handful of veterans whose VA prescribers declined to initiate prescription stimulant medications for various reasons, so the veteran sought care from a civilian prescriber who prescribed stimulant medications, then returned to the VA for medication management, and stimulant medications were continued. Fourteen percent (28/200) of participants had multiple indications for use at some point during stimulant medication therapy. Eight of those were a reasonable change from ADHD to ADHD-like symptoms when diagnosis was not substantiated by testing. The cause of other changes in indication for use was not well documented and often unclear. One veteran had 4 different indications for use documented in the medical record, often changing with each change in prescriber. It appeared that the most recent prescriber was uncertain of the actual indication for use but did not want to discontinue the medication. This prescriber documented that the stimulant medication should continue for presumed ADHD/mood/fatigue/cognitive dysfunction, which were all of the indications documented by the veteran’s previous prescribers.
Reasons for Discontinuation
ADHD was the most prominent indication for use, although the indication was changed to ADHD-like symptoms in several veterans for whom diagnostic testing did not support the ADHD diagnosis. Seventy-eight of 133 veterans prescribed stimulant medications for ADHD received diagnostic testing via a psychologist at LVAHCS. For the 11 veterans who had testing after stimulant initiation, a stimulant-free period was required prior to testing to ensure an accurate diagnosis. For 21% of veterans, the ADHD diagnosis was unsubstantiated by formal testing; however, all of these veterans continued stimulant medication use. For 1 veteran, the psychologist performing the testing documented new diagnoses, including moderate to severe stimulant use disorder and malingering both for PTSD and ADHD. The rate of stimulant prescribing inconsistency, “prescriber-hopping,” and unsupported ADHD diagnosis results warrant a conversation about expectations for transitions of care regarding stimulant medications, not only from outside to inside LVAHCS, but from prescriber to prescriber within the facility.
In some cases, stimulant medications were discontinued by a prescriber secondary to a worsening of another mental health condition. More than half of the participants in this study had an anxiety disorder diagnosis. Whether or not anxiety predated stimulant use or whether the use of stimulant medications contributed to the diagnosis and thus the addition of an additional CNS depressant to treat anxiety may be an area of research for future consideration. Although bipolar disorder, anxiety disorders, psychosis, and SUD are not contraindications for use of stimulant medications, caution must be used in patients with these diagnoses. Prescribers must weigh risks vs benefits as well as perform close monitoring during use. Similarly, one might look further into stimulant medications prescribed for fatigue and assess the role of any simultaneously prescribed CNS depressants. Is the stimulant being used to treat the adverse effect (AE) of another medication? In 2 documented instances in this study, a psychologist conducted diagnostic testing who reported that the veteran did not meet the criteria for ADHD but that a stimulant may help counteract the iatrogenic effect of anticonvulsants. In both instances stimulant use continued.
Prescription Monitoring
Polysubstance use disorder (5%) was the third most common SUD recorded among study participants. The majority of those with polysubstance use disorder reported abuse/misuse of illicit or prescribed stimulants. Stimulant abuse/misuse was documented in 25 of 200 (12.5%) study participants. In several instances, abuse/misuse was detected by the LVAHCS delivery coordination pharmacist who tracks patterns of early fill requests and prescriptions reported lost/stolen. This pharmacist may request that the prescriber obtain PDMP query, UDS, or pill count if concerning patterns are noted. Lisdexamphetamine is a formulary-restricted medication at LVAHCS, but it was noted to be approved for use when prescribers requested an abuse-deterrent formulation. Investigators noticed a trend in veterans whose prescriptions exceeded the recommended maximum dosage also having stimulant abuse/misuse documented in their medical record. The highest documented total daily dose in this study was 120-mg amphetamine salts IR for ADHD, compared with the normal recommended dosing range of 5 to 40 mg/d for the same indication.
Various modalities were used to monitor participants but less than half of veterans had an annual UDS, quarterly PDMP query, and quarterly prescriber follow-up. PDMP queries and prescriber follow-up was assessed quarterly as would be reasonable given that private sector practitioners may issue multiple prescriptions authorizing the patient to receive up to a 90-day supply.7 Prescriber follow-up ranged from 1 to 15 months. A longer time to follow-up was seen more frequently in stimulant medications prescribed by primary care as compared with that of mental health.
Clinical Practice Protocol
Data from this study were collected with the intent to identify opportunities for improvement in the prescribing and monitoring of stimulant medications. From the above results investigators concluded that this facility may benefit from implementation of a facility-specific clinical practice protocol (CPP) for stimulant prescribing. It may also be beneficial to formulate a chronic stimulant management agreement between patient and prescriber to provide informed consent and clear expectations prior to stimulant medication initiation.
A CPP could be used to establish stimulant prescribing rules within a facility, which may limit who can prescribe stimulant medications or include a review process and/or required documentation in the medical record when being prescribed outside of specified dosing range and indications for use designated in the CPP or other evidence-based guidelines. Transition of care was found to be an area of opportunity in this study, which could be mitigated with the requirement of a baseline assessment prior to stimulant initiation with the expectation that it be completed regardless of prior prescription stimulant medication use. There was a lack of consistent monitoring for participants in this study, which may be improved if required monitoring parameters and frequency were provided for prescribers. For example, monitoring of heart rate and blood pressure was not assessed in this study, but a CPP may include monitoring vital signs before and after each dose change and every 6 months, per recommendation from the National Institute for Health and Care Excellence ADHD Diagnosis and Management guideline published in 2018.8The CPP may list the responsibilities of all those involved in the prescribing of stimulant medications, such as mental health service leadership, prescribers, nursing staff, pharmacists, social workers, psychologists, and other mental health staff. For prescribers this may include a thorough baseline assessment and criteria for use that must be met prior to stimulant initiation, documentation that must be included in the medical record and required monitoring during stimulant treatment, and expectations for increased monitoring and/or termination of treatment with nonadherence, diversion, or abuse/misuse.
The responsibilities of pharmacists may include establishing criteria for use of nonformulary and restricted agents as well as completion of nonformulary/restricted requests, reviewing dosages that exceed the recommended FDA daily maximum, reviewing uncommon off-label uses of stimulant medications, review and document early fill requests, potential nonadherence, potential drug-seeking behavior, and communication of the following information to the primary prescriber. For other mental health staff this may include documenting any reported AEs of the medication, referring the patient to their prescriber or pharmacist for any medication questions or concerns, and assessment of effectiveness and/or worsening behavior during patient contact.
Limitations
One limitation of this study was the way that data were pulled from patient charts. For example, only 3/200 participants in this study had insomnia per diagnosis codes, whereas that number was substantially higher when chart review was used to assess active prescriptions for sleep aids or documented complaints of insomnia in prescriber progress notes. For this same reason, rates of SUDs must be interpreted with caution as well. SUD diagnosis, both current and in remission were taken into account during data collection. Per diagnosis codes, 36 (18%) veterans in this study had a history of SUD, but this number was higher (31.5%) during chart review. The majority of discrepancies were found when participants reported a history of SUD to the prescriber, but this information was not captured via the problem list or encounter codes. What some may consider a minor omission in documentation can have a large impact on patient care as it is unlikely that prescribers have adequate administrative time to complete a chart review in order to find a complete past medical history as was required of investigators in this study. For this reason, incomplete provider documentation and human error that can occur as a result of a retrospective chart review were also identified as study limitations.
Conclusion
Our data show that there is still substantial room for improvement in the prescribing and monitoring of stimulant medications. The rate of stimulant prescribing inconsistency, prescriber-hopping, and unsupported ADHD diagnosis resulting from formal diagnostic testing warrant a review in the processes for transition of care regarding stimulant medications, both within and outside of this facility. A lack of consistent monitoring was also identified in this study. One of the most appreciable areas of opportunity resulting from this study is the need for consistency in both the prescribing and monitoring of stimulant medications. From the above results investigators concluded that this facility may benefit from implementation of a CPP for stimulant prescribing as well as a chronic stimulant management agreement to provide clear expectations for patients and prescribers prior to and during prescription stimulant use.
Acknowledgments
We thank Tori Wilhoit, PharmD candidate, and Dana Fischer, PharmD candidate, for their participation in data collection and Courtney Eatmon, PharmD, BCPP, for her general administrative support throughout this study.
1. Safer DJ. Recent trends in stimulant usage. J Atten Disord. 2016;20(6):471-477.
2. Christopher Jones; US Food and Drug Administration. The opioid epidemic overview and a look to the future. http://www.agencymeddirectors.wa.gov/Files/OpioidConference/2Jones_OPIOIDEPIDEMICOVERVIEW.pdf. Published June 12, 2015. Accessed January 16, 2020.
3. Compton WM, Han B, Blanco C, Johnson K, Jones CM. Prevalence and correlates of prescription stimulant use, misuse, use disorders, motivations for misuse among adults in the United States. Am J Psychiatry. 2018;175(8):741-755.
4. Westover AN, Nakonezney PA, Halm EA, Adinoff B. Risk of amphetamine use disorder and mortality among incident users of prescribed stimulant medications in the Veterans Administration. Addiction. 2018;113(5):857-867.
5. Olfson M, Blanco C, Wang S, Greenhill LL. Trends in office-based treatment of adults with stimulant medications in the United States. J Clin Psychiatry. 2013;74(1):43-50.
6. Olfson M, Marcus SC, Zhang HF, and Wan GJ. Continuity in methylphenidate treatment of adults with attention-deficit/hyperactivity disorder. J Manag Care Pharm. 2007;13(7): 570-577.
7. 21 CFR § 1306.12
8. National Collaborating Centre for Mental Health (UK). Attention deficit hyperactivity disorder: diagnosis and management of ADHD in children, young people and adults. NICE Clinical Guidelines, No. 87. Leicester, United Kingdom: British Psychological Society; 2018.
Dispensing of prescription stimulant medications, such as methylphenidate or amphetamine salts, has been expanding at a rapid rate over the past 2 decades. An astounding 58 million stimulant medications were prescribed in 2014.1,2 Adults now exceed youths in the proportion of prescribed stimulant medications.1,3
Off-label use of prescription stimulant medications, such as for performance enhancement, fatigue management, weight loss, medication-assisted therapy for stimulant use disorders, and adjunctive treatment for certain depressive disorders, is reported to be ≥ 40% of total stimulant use and is much more common in adults.1 A 2017 study assessing risk of amphetamine use disorder and mortality among veterans prescribed stimulant medications within the Veterans Health Administration (VHA) reported off-label use in nearly 3 of every 5 incident users in 2012.4 Off-label use also is significantly more common when prescribed by nonpsychiatric physicians compared with that of psychiatrists.1
One study assessing stimulant prescribing from 2006 to 2009 found that nearly 60% of adults were prescribed stimulant medications by nonpsychiatrist physicians, and only 34% of those adults prescribed a stimulant by a nonpsychiatrist physician had a diagnosis of attention-deficit hyperactivity disorder (ADHD).5 Findings from managed care plans covering years from 2000 to 2004 were similar, concluding that 30% of the adult patients who were prescribed methylphenidate had at least 1 medical claim with a diagnosis of ADHD.6 Of the approximately 16 million adults prescribed stimulant medications in 2017, > 5 million of them reported stimulant misuse.3 Much attention has been focused on misuse of stimulant medications by youths and young adults, but new information suggests that increased monitoring is needed among the US adult population. Per the US Department of Veterans Affairs (VA) Academic Detailing Stimulant Dashboard, as of October 2018 the national average of veterans with a documented substance use disorder (SUD) who are also prescribed stimulant medications through the VHA exceeds 20%, < 50% have an annual urine drug screen (UDS), and > 10% are coprescribed opioids and benzodiazepines.The percentage of veterans prescribed stimulant medications in the presence of a SUD has increased over the past decade, with a reported 8.7% incidence in 2002 increasing to 14.3% in 2012.4
There are currently no protocols, prescribing restrictions, or required monitoring parameters in place for prescription stimulant use within the Lexington VA Health Care System (LVAHCS). The purpose of this study was to evaluate the prescribing practices at LVAHCS of stimulant medications and identify opportunities for improvement in the prescribing and monitoring of this drug class.
Methods
This study was a single-center quality improvement project evaluating the prescribing practices of stimulant medications within LVAHCS and exempt from institutional review board approval. Veterans were included in the study if they were prescribed amphetamine salts, dextroamphetamine, lisdexamphetamine, or methylphenidate between January 1, 2018 and June 30, 2018; however, the veterans’ entire stimulant use history was assessed. Exclusion criteria included duration of use of < 2 months or < 2 prescriptions filled during the study period. Data for veterans who met the prespecified inclusion and exclusion criteria were collected via chart review and Microsoft SQL Server Management Studio.
Collected data included age, gender, stimulant regimen (drug name, dose, frequency), indication and duration of use, prescriber name and specialty, prescribing origin of initial stimulant medication, and whether stimulant use predated military service. Monitoring of stimulant medications was assessed via UDS at least annually, query of the prescription drug monitoring program (PDMP) at least quarterly, and average time between follow-up appointments with stimulant prescriber.
Monitoring parameters were assessed from January 1, 2017 through June 30, 2018, as it was felt that the 6-month study period would be too narrow to accurately assess monitoring trends. Mental health diagnoses, ADHD diagnostic testing if applicable, documented SUD or stimulant misuse past or present, and concomitant central nervous system (CNS) depressant use also were collected. CNS depressants evaluated were those that have abuse potential or significant psychotropic effects and included benzodiazepines, antipsychotics, opioids, gabapentin/pregabalin, Z-hypnotics, and muscle relaxants.
Results
The majority of participants were male (168/200) with an average age of 43.3 years. Dextroamphetamine/amphetamine was the most used stimulant (48.5%), followed by methylphenidate (40%), and dextroamphetamine (10%). Lisdexamphetamine was the least used stimulant, likely due to its formulary-restricted status within this facility. An extended release (ER) formulation was utilized in 1 of 4 participants, with 1 of 20 participants prescribed a combination of immediate release (IR) and ER formulations. Duration of use ranged from 3 months to 14 years, with an average duration of 4 years (Table 1).
Nearly 40% of participants reported an origin of stimulant initiation outside of LVAHCS. Fourteen percent of participants were started on prescription stimulant medications while active-duty service members. Stimulant medications were initiated at another VA facility in 10.5% of instances, and 15% of participants reported being prescribed stimulant medications by a civilian prescriber prior to receiving them at LVAHCS. Seventy-four of 79 (93.6%) participants with an origin of stimulant prescription outside of LVAHCS reported a US Federal Food and Drug Administration (FDA)-approved indication for use.
Stimulant medications were used for FDA-approved indications (ADHD and narcolepsy) in 69.5% of participants. Note, this included patients who maintained an ADHD diagnosis in their medical record even if it was not substantiated with diagnostic testing. Of the participants reporting ADHD as an indication for stimulant use, diagnostic testing was conducted at LVAHCS to confirm an ADHD diagnosis in 58.6% (78/133) participants; 20.5% (16/78) of these diagnostic tests did not support the diagnosis of ADHD. All documented indications for use can be found in Table 2.
As expected, the most common indication was ADHD (66.5%), followed by ADHD-like symptoms (9%), refractory depression (7%), and fatigue (5.5%). Fourteen percent of participants had ≥ 1 change in indication for use, with some participants having up to 4 different documented indications while being prescribed stimulant medications. Twelve percent of participants were either denied stimulant initiation, or current stimulant medications were discontinued by one health provider and were restarted by another following a prescriber change. Aside from indication for stimulant use, 90% of participants had at least one additional mental health diagnosis. The rate of all mental health diagnoses documented in the medical record problem list can be found in Table 3.
A UDS was collected at least annually in 37% of participants. A methylphenidate confirmatory screen was ordered to assess adherence in just 2 (2.5%) participants prescribed methylphenidate. While actively prescribed stimulant medications, PDMP was queried quarterly in 26% of participants. Time to follow-up with the prescriber ranged from 1 to 15 months, and 40% of participants had follow-up at least quarterly. Instance of SUD, either active or in remission, differed when searched via problem list (36/200) and prescriber documentation (63/200). The most common SUD was alcohol use disorder (13%), followed by cannabis use disorder (5%), polysubstance use disorder (5%), opioid use disorder (4.5%), stimulant use disorder (2.5%), and sedative use disorder (1%). Twenty-five participants currently prescribed stimulant medications had stimulant abuse/misuse documented in their medical record. Fifty-four percent of participants were prescribed at least 1 CNS depressant considered to have abuse potential or significant psychotropic effects. Opioids were most common (23%), followed by muscle relaxants (15.5%), benzodiazepines (15%), antipsychotics (13%), gabapentin/pregabalin (12%), and Z-hypnotics (12%).
Discussion
The source of the initial stimulant prescription was assessed. The majority of veterans had received medical care prior to receiving care at LVAHCS, whether on active duty, from another VA facility throughout the country, or by a private civilian prescriber. The origin of initial stimulant medication and indication for stimulant medication use were patient reported. Requiring medical records from civilian providers prior to continuing stimulant medication is prescriber-dependent and was not available for all participants.
As expected, the majority of participants
The reasons for discontinuation included a positive UDS result for cocaine, psychosis, broken narcotic contract, ADHD diagnosis not supported by psychological testing, chronic bipolar disorder secondary to stimulant use, diversion, stimulant misuse, and lack of indication for use. There also were a handful of veterans whose VA prescribers declined to initiate prescription stimulant medications for various reasons, so the veteran sought care from a civilian prescriber who prescribed stimulant medications, then returned to the VA for medication management, and stimulant medications were continued. Fourteen percent (28/200) of participants had multiple indications for use at some point during stimulant medication therapy. Eight of those were a reasonable change from ADHD to ADHD-like symptoms when diagnosis was not substantiated by testing. The cause of other changes in indication for use was not well documented and often unclear. One veteran had 4 different indications for use documented in the medical record, often changing with each change in prescriber. It appeared that the most recent prescriber was uncertain of the actual indication for use but did not want to discontinue the medication. This prescriber documented that the stimulant medication should continue for presumed ADHD/mood/fatigue/cognitive dysfunction, which were all of the indications documented by the veteran’s previous prescribers.
Reasons for Discontinuation
ADHD was the most prominent indication for use, although the indication was changed to ADHD-like symptoms in several veterans for whom diagnostic testing did not support the ADHD diagnosis. Seventy-eight of 133 veterans prescribed stimulant medications for ADHD received diagnostic testing via a psychologist at LVAHCS. For the 11 veterans who had testing after stimulant initiation, a stimulant-free period was required prior to testing to ensure an accurate diagnosis. For 21% of veterans, the ADHD diagnosis was unsubstantiated by formal testing; however, all of these veterans continued stimulant medication use. For 1 veteran, the psychologist performing the testing documented new diagnoses, including moderate to severe stimulant use disorder and malingering both for PTSD and ADHD. The rate of stimulant prescribing inconsistency, “prescriber-hopping,” and unsupported ADHD diagnosis results warrant a conversation about expectations for transitions of care regarding stimulant medications, not only from outside to inside LVAHCS, but from prescriber to prescriber within the facility.
In some cases, stimulant medications were discontinued by a prescriber secondary to a worsening of another mental health condition. More than half of the participants in this study had an anxiety disorder diagnosis. Whether or not anxiety predated stimulant use or whether the use of stimulant medications contributed to the diagnosis and thus the addition of an additional CNS depressant to treat anxiety may be an area of research for future consideration. Although bipolar disorder, anxiety disorders, psychosis, and SUD are not contraindications for use of stimulant medications, caution must be used in patients with these diagnoses. Prescribers must weigh risks vs benefits as well as perform close monitoring during use. Similarly, one might look further into stimulant medications prescribed for fatigue and assess the role of any simultaneously prescribed CNS depressants. Is the stimulant being used to treat the adverse effect (AE) of another medication? In 2 documented instances in this study, a psychologist conducted diagnostic testing who reported that the veteran did not meet the criteria for ADHD but that a stimulant may help counteract the iatrogenic effect of anticonvulsants. In both instances stimulant use continued.
Prescription Monitoring
Polysubstance use disorder (5%) was the third most common SUD recorded among study participants. The majority of those with polysubstance use disorder reported abuse/misuse of illicit or prescribed stimulants. Stimulant abuse/misuse was documented in 25 of 200 (12.5%) study participants. In several instances, abuse/misuse was detected by the LVAHCS delivery coordination pharmacist who tracks patterns of early fill requests and prescriptions reported lost/stolen. This pharmacist may request that the prescriber obtain PDMP query, UDS, or pill count if concerning patterns are noted. Lisdexamphetamine is a formulary-restricted medication at LVAHCS, but it was noted to be approved for use when prescribers requested an abuse-deterrent formulation. Investigators noticed a trend in veterans whose prescriptions exceeded the recommended maximum dosage also having stimulant abuse/misuse documented in their medical record. The highest documented total daily dose in this study was 120-mg amphetamine salts IR for ADHD, compared with the normal recommended dosing range of 5 to 40 mg/d for the same indication.
Various modalities were used to monitor participants but less than half of veterans had an annual UDS, quarterly PDMP query, and quarterly prescriber follow-up. PDMP queries and prescriber follow-up was assessed quarterly as would be reasonable given that private sector practitioners may issue multiple prescriptions authorizing the patient to receive up to a 90-day supply.7 Prescriber follow-up ranged from 1 to 15 months. A longer time to follow-up was seen more frequently in stimulant medications prescribed by primary care as compared with that of mental health.
Clinical Practice Protocol
Data from this study were collected with the intent to identify opportunities for improvement in the prescribing and monitoring of stimulant medications. From the above results investigators concluded that this facility may benefit from implementation of a facility-specific clinical practice protocol (CPP) for stimulant prescribing. It may also be beneficial to formulate a chronic stimulant management agreement between patient and prescriber to provide informed consent and clear expectations prior to stimulant medication initiation.
A CPP could be used to establish stimulant prescribing rules within a facility, which may limit who can prescribe stimulant medications or include a review process and/or required documentation in the medical record when being prescribed outside of specified dosing range and indications for use designated in the CPP or other evidence-based guidelines. Transition of care was found to be an area of opportunity in this study, which could be mitigated with the requirement of a baseline assessment prior to stimulant initiation with the expectation that it be completed regardless of prior prescription stimulant medication use. There was a lack of consistent monitoring for participants in this study, which may be improved if required monitoring parameters and frequency were provided for prescribers. For example, monitoring of heart rate and blood pressure was not assessed in this study, but a CPP may include monitoring vital signs before and after each dose change and every 6 months, per recommendation from the National Institute for Health and Care Excellence ADHD Diagnosis and Management guideline published in 2018.8The CPP may list the responsibilities of all those involved in the prescribing of stimulant medications, such as mental health service leadership, prescribers, nursing staff, pharmacists, social workers, psychologists, and other mental health staff. For prescribers this may include a thorough baseline assessment and criteria for use that must be met prior to stimulant initiation, documentation that must be included in the medical record and required monitoring during stimulant treatment, and expectations for increased monitoring and/or termination of treatment with nonadherence, diversion, or abuse/misuse.
The responsibilities of pharmacists may include establishing criteria for use of nonformulary and restricted agents as well as completion of nonformulary/restricted requests, reviewing dosages that exceed the recommended FDA daily maximum, reviewing uncommon off-label uses of stimulant medications, review and document early fill requests, potential nonadherence, potential drug-seeking behavior, and communication of the following information to the primary prescriber. For other mental health staff this may include documenting any reported AEs of the medication, referring the patient to their prescriber or pharmacist for any medication questions or concerns, and assessment of effectiveness and/or worsening behavior during patient contact.
Limitations
One limitation of this study was the way that data were pulled from patient charts. For example, only 3/200 participants in this study had insomnia per diagnosis codes, whereas that number was substantially higher when chart review was used to assess active prescriptions for sleep aids or documented complaints of insomnia in prescriber progress notes. For this same reason, rates of SUDs must be interpreted with caution as well. SUD diagnosis, both current and in remission were taken into account during data collection. Per diagnosis codes, 36 (18%) veterans in this study had a history of SUD, but this number was higher (31.5%) during chart review. The majority of discrepancies were found when participants reported a history of SUD to the prescriber, but this information was not captured via the problem list or encounter codes. What some may consider a minor omission in documentation can have a large impact on patient care as it is unlikely that prescribers have adequate administrative time to complete a chart review in order to find a complete past medical history as was required of investigators in this study. For this reason, incomplete provider documentation and human error that can occur as a result of a retrospective chart review were also identified as study limitations.
Conclusion
Our data show that there is still substantial room for improvement in the prescribing and monitoring of stimulant medications. The rate of stimulant prescribing inconsistency, prescriber-hopping, and unsupported ADHD diagnosis resulting from formal diagnostic testing warrant a review in the processes for transition of care regarding stimulant medications, both within and outside of this facility. A lack of consistent monitoring was also identified in this study. One of the most appreciable areas of opportunity resulting from this study is the need for consistency in both the prescribing and monitoring of stimulant medications. From the above results investigators concluded that this facility may benefit from implementation of a CPP for stimulant prescribing as well as a chronic stimulant management agreement to provide clear expectations for patients and prescribers prior to and during prescription stimulant use.
Acknowledgments
We thank Tori Wilhoit, PharmD candidate, and Dana Fischer, PharmD candidate, for their participation in data collection and Courtney Eatmon, PharmD, BCPP, for her general administrative support throughout this study.
1. Safer DJ. Recent trends in stimulant usage. J Atten Disord. 2016;20(6):471-477.
2. Christopher Jones; US Food and Drug Administration. The opioid epidemic overview and a look to the future. http://www.agencymeddirectors.wa.gov/Files/OpioidConference/2Jones_OPIOIDEPIDEMICOVERVIEW.pdf. Published June 12, 2015. Accessed January 16, 2020.
3. Compton WM, Han B, Blanco C, Johnson K, Jones CM. Prevalence and correlates of prescription stimulant use, misuse, use disorders, motivations for misuse among adults in the United States. Am J Psychiatry. 2018;175(8):741-755.
4. Westover AN, Nakonezney PA, Halm EA, Adinoff B. Risk of amphetamine use disorder and mortality among incident users of prescribed stimulant medications in the Veterans Administration. Addiction. 2018;113(5):857-867.
5. Olfson M, Blanco C, Wang S, Greenhill LL. Trends in office-based treatment of adults with stimulant medications in the United States. J Clin Psychiatry. 2013;74(1):43-50.
6. Olfson M, Marcus SC, Zhang HF, and Wan GJ. Continuity in methylphenidate treatment of adults with attention-deficit/hyperactivity disorder. J Manag Care Pharm. 2007;13(7): 570-577.
7. 21 CFR § 1306.12
8. National Collaborating Centre for Mental Health (UK). Attention deficit hyperactivity disorder: diagnosis and management of ADHD in children, young people and adults. NICE Clinical Guidelines, No. 87. Leicester, United Kingdom: British Psychological Society; 2018.
The Group Practice Manager in the VHA: A View From the Field
The Veterans Health Administration (VHA) provides care for 9 million veterans at 1,255 health care sites linked to one of 170 local medical systems.1 Recognizing that providing timely care requires effective access management, the US Congress mandated training of VHA staff to manage and improve access to care but did not provide additional local funds for new positions.2 In response, the VHA created the group practice manager (GPM), a new position responsible for improving clinical practice management and unifying access improvement across leadership levels, professions, and services within each local medical system.
In May 2015, the VHA began hiring and training GPMs to spearhead management of access to services. The US Department of Veterans Affairs (VA) Office of Veteran Access to Care spearheaded GPM training, including face-to-face sessions, national calls, webinars, and educational materials. Five local medical systems were selected by the VA Office of Veteran Access to Care to implement the GPM role to allow for an early evaluation of the program that would inform a subsequent nationwide rollout. Implementation of the GPM role remained in the hands of local medical systems.
Longer wait times are shown to impact patient health.3,4 Open access scheduling and other patient-centered access management interventions have been shown to improve availability of primary care appointments.5 However, little empirical evidence exists regarding the managers who focus on clinic access interventions. While the nonpeer-reviewed literature includes references to such roles, including GPMs, the empirical literature has focused on external practice faciliators,6-8 “mid-level managers,”9 and clinic staff.10 We found no peer-reviewed articles on the needs and experiences of practice managers who are focused on improving access. The purpose of this study was to examine GPM prototype sites to both enhance subsequent nationwide implementation and to advance empirical literature on managing patient access within health care.
Methods
In 2015, the VA identified 5 prototype sites representing diverse geographic locations, size, and complexity for the implementation of the GPM role (Table 1). These sites self-identified as having clinical practice management experience. GPMs attended 4 training sessions between February and August 2015.
Data Collection
Participants from each prototype site included GPMs, national trainers, clinic leaders, and frontline staff. Table 2 includes the roles and sample size. Participants were recruited through purposive sampling followed by snowball sampling until thematic saturation was reached (the point at which subsequent data fail to produce new findings across sites and roles of interest).
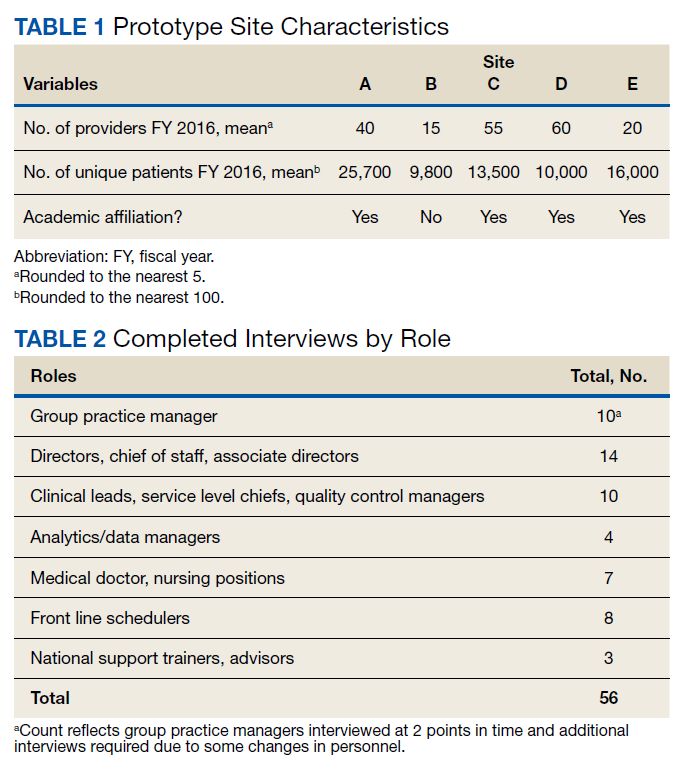
Guided by the Consolidated Framework for Implementation Research (CFIR), the research team developed semistructured interview guides tailored to participants’ roles to elicit rich descriptions regarding overall impressions, practice management strategies, goals, activities, relationship to clinic roles, data analytics usage, challenges, barriers, and facilitators.11 These guides included open-ended questions and structured prompts utilizing participant language for follow-up probes to minimize interviewing bias (eAppendix:
Data Analysis
Data were analyzed using iterative deductive and inductive content analysis.12 Deductive content analysis consisted of identifying quotes that fit within preidentified categories (ie, perceptions of national effort, organizational structure for GPM, challenges, facilitators, metrics and tools, and mobilizing access culture) developed by the interdisciplinary research team. Further content analysis entailed open-coding and iteratively revisiting and reconciling codes associated within each preidentified category as new codes emerged. The team analyzed the resulting codes to inductively and iteratively identify and stabilize themes regarding the GPM role: roles and tasks, GPM characteristics, issues, and challenges. Through this process we moved coded data to reconciled descriptions suited to addressing the purposes of this study. Dedoose 7.0.23 software was used for qualitative data management and analysis.
Results
The study identified participants’ overall impressions of the GPM initiative and key themes within 4 major domains regarding implementing the GPM role: roles and tasks (implementing clinic practice management, leading patient access, supporting data analytics, and enabling self and staff); GPM characteristics (familiarity with clinical services, knowledge of VHA systems, ability to analyze patient data, communication skills, and the ability to work with others); and issues, and challenges (technical, social, and structural).
Overall Impressions
Interviewees perceived the GPM initiative as a consolidation of existing distributed responsibilities into one role that directly reported to local top-level management with indirect reporting to national leaders. Many of the sites reported that they had designated or planned to designate a role resembling the GPM prior to the initiative. “There are staff who’ve been doing some of this work all along,” a GPM noted. “We just didn’t have them grouped together. They weren’t necessarily all working in the same type of service under the same type of structure.”
Whether the GPM position was new or not, participants referenced the importance and challenges of engaging the local facility in recognizing the agency associated with the GPM position. According to national support, the staff are trying to get the facility to understand “why the group practice manager is so important… we’ve got to embed that standard position in the system.”
While the GPM was recognized as the hub of access management, respondents recognized that transformation regarding access involved many players. “We have to create [an] orchestrated team inside each facility,” an advisor argued.
Respondents discussed how the initiative allows local facilities to appoint a specific person with a specific title and role who helps facilitate, organize, and legitimize an access focus at their sites. One GPM interviewee noted how the initiative helped refocus some of their previously less centralized efforts. “We’ve always looked at productivity; we’ve always looked at access; we’ve always looked at efficiency. I think the bigger difference is now there are individuals identified in the clinics, as practice managers as well…I interact with them. They interact with individual clinic staff, and it’s more of a group process than a single individual.”
The value of having tools available and being able to track and manage patient care as a specific example of the positive impact of this new role was noted by participants. A GPM noted that many health care providers will be happy to have tools to better manage their services and a process “that flows from a service level all the way up to executive management, where there is a common interest in making those things happen—I think that’s going to be a tremendous help.”
Participants expressed concern that the national GPM rollout would be a one-size-fits-all approach. These respondents emphasized the need to have the flexibility to customize their activities to meet their unique site and patient needs.
GPM Roles and Tasks
Participants described 4 primary roles that the GPM was expected to fill: implementing clinic practice management, leading patient access, supporting data analytics, and enabling self and staff. Some activities overlapped in that they served to support multiple role areas (Figure 1).
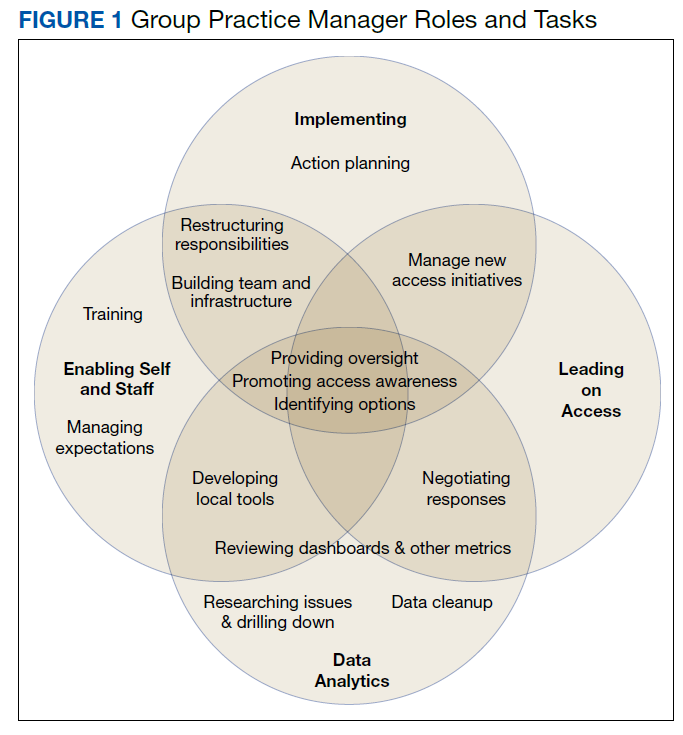
Implementing clinic practice management. In the early stages of the initiative, the GPM’s primary role was to prepare the facility to implement a standardized set of clinic practice management (CPM) team processes. Part of standardizing the CPM process was defining the scope and tasks of the GPM, which requires significant planning for the implementation. “My big job is to finalize what we think group practice management is going to look [like] here,” a GPM reported.
Each prototype site had latitude to interpret the GPM initiative in a way that would work in their context within given VHA boundaries and ongoing initiatives. To achieve the high-level vision and purpose, the GPM first had to develop action plans that accounted for the operating environment of the facility. According to one GPM, VA national officials are “constantly” asking for action plans, which required significant time by specific deadlines. “They want an action plan [and to] clean up all your consults, [and to] clean up all your recall reminders.”
Leading on improving access efforts. Participants saw the GPM as the central staff member responsible for providing oversight of any activities and people involved in improving access. “I ensure everybody is doing what they’re supposed to do,” one GPM reported. When the GPM sees areas that are not being addressed, the individual tries to develop a process or training to “close those gaps.”
GPMs promoted an awareness of their goals, changes in process, and new tools accompanying the initiative. However, other access initiatives were occurring simultaneously creating confusion for health care providers and patients; thus GPMs found they were managing a wide array of related initiatives.
GPMs have to negotiate with leaders across the VHA facility, many of whom operated at a higher leadership level and had different priorities, to address access problems.
“I’m a lieutenant as a GPM in a clinic, a GPM noted. “How is the lieutenant going to talk to a major or a colonel in the clinic and say your clinic has problems. How[‘s] that lieutenant...going to do that? With people skills!”
Managing expectations about the speed and to what extent a problem could be resolved was an important part of the GPM leadership role. “I see myself as managing expectations both up to the leadership and down to the frontline,” a GPM explained. “I find myself talking to leadership [about] our progress. But at the same time, we have to say, ‘not everything can be fixed overnight.’”
Providing leadership on access-related issues included developing a range of options for addressing patient access problems. One analytics manager recounted how the GPM role led to evaluating how physical space limited efficiency in clinic flow. The first step was identifying possible additional rooms to improve clinic flow. This required working with the space committee to “get someone to look at our overarching space and find someplace else for them to sit” to avoid adding to congestion in the clinic area.
Supporting data analytics.
GPMs routinely immersed themselves in the data to understand access issues. GPMs worked with clinic leaders to identify the underlying causes and various solutions. The GPMs maintained access through administrative scrubbing of the data and finding “smart ways to get patients scheduled,” a GPM explained. “I don’t think our facility would have taken care of as many veterans in the time frame as we did....We’ve cleared over 4,000 consults that were older than 90 days. We have cleared thousands and thousands of weekly reminders.”
GPMs expressed the need for aggregated (ie, dashboard) and standardized information to efficiently address access issues. “I would like to have some more standardization on what’s being reviewed; it seems to change frequently, and so [to] be able to track and trend and have something given to me to review,” one health care provider requested. On the other hand, participants also described a need for decision support tools that would lead to action aligned with best practices. “Instead of a dashboard or something that’s just measuring their performance, it’s more something that they can look at and take action” a national support staff advisor suggested.
Enabling self and staff. GPMs felt they were most effective if they enabled themselves and stakeholders through training and by cultivating relationships and team building. Figure 2 illustrates the various stakeholders GPMs reported engaging with. The GPMS should be building relationships, bridging relationships, developing trust, and then providing a higher level of hands-on management. However, “that doesn’t really happen right now, day to day,” one member of leadership reported.
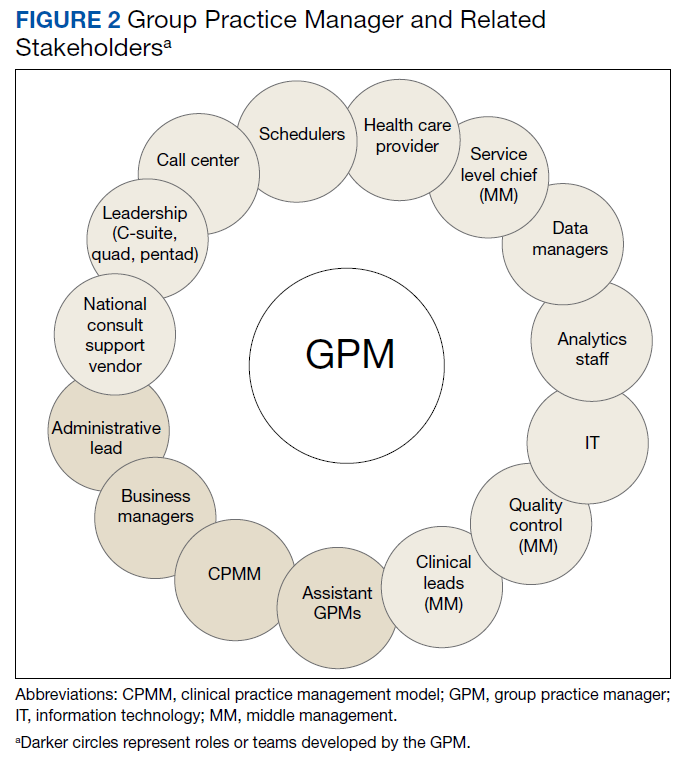
Key topics in GPM leadership training included both soft skills (change management, culture change, and negotiation skills) and crucial analytic/technical training (understanding each metric and dashboard available, data analytics, and supply/demand balancing techniques). The GPMs not only wanted to understand metrics as part of their training, but also want to know what to do about them.
An “operationalization” training approach (discerning the meaning of data, data-based decision making, and determining action from multiple options) inspired by real-life situations was preferred by participants. Other effective learning structures included job aids in the form of templated Gantt charts, process maps to guide GPMs through implementation of new processes, formalized peer learning (accumulated field insights shared during training courses), and informal peer sharing of direct experiences during calls.
GPMs also emphasized training for frontline clinical and support staff, including schedulers. VHA schedulers typically have less education and experience higher turnover rates than do other clinic staff, yet they carry out complex and critical tasks. Providing training and ensuring that any materials developed for training and education were appropriate to the level of education of schedulers was an important task for GPMs. “If they don’t understand all of the scheduling principles and potential,” one GPM explained, “we will not be maximizing the utilization of our parts.”
GPMs also provided informal education to clinicians. Participants noted GPMs have to avoid appearing to overstep their positions or presuming more knowledge and expertise than clinicians. They “have to be able to teach a physician without being overbearing, in a way a physician will accept it as advisement,” one program leader reported.
GPM knowledge, skills, and abilities. GPMs presented a complex range of knowledge, skills, and abilities, including clinical, administrative, analytics, and people skills. All interviewees reported that their prior education and experience did not sufficiently train them for the GPM role. GPMs identified a willingness to learn quickly as a critical characteristic. Many GPMs tended to have a formal education in health administration or business (eg, MBAs); others had administrative experience (eg, administrative assistance to executive leadership) or clinical training (eg, physician assistant). Detailed clinical knowledge was not expected, but clinical familiarity was helpful.
Some interviewees also mentioned previous experience and familiarity with the VHA system specifically as an advantage. This was especially true for VA outpatient flows, clinic flows, and understanding what an outpatient is in a VA context. Interviewees noted the importance of GPMs needing to be able to analyze patient demand metrics and underlying data in order to determine supply of providers and then to allocate adequate resources to complement providers. Forecasting skills were referenced as a key point. “They need to be able to be assured that they can recruit more providers if needed,” a national support staff advisor noted.
Given the importance of developing effective relationships, communication skills were mentioned by most participants and underscored as critical to establishing trust between GPMs and others as the initiative was being implemented. Interviewees indicated that relationship building was further enhanced when GPMs possessed the ability to “work with” rather than command clinicians and staff; navigate politics; and were respectful of other people’s knowledge, skills, abilities, and status. “They have to work with the nursing staff and teach them,” a leader described, “so that people understand that we are going to a different place to achieve our primary objectives and goals.”
Issues and Challenges
Participants identified several technical, social, and structural challenges and barriers to successfully implementing the GPM role.
Technical challenges. Recurring themes across all phases of data analytics were GPMs’ capability to challenge data use and use large volumes of information from multiple data sources (entering and accessing data; “drilling down” from summaries; generating reports; and analyzing and interpreting resulting metrics). Interviewees reported that information assessment and analytic support were not consistent. One GPM had a data analyst pulling reports needed to support clinical units while other GPMs trained staff to pull data. Even with support, some GPMs had issues due to limited information technology (IT) skills or access privileges leading to inefficiencies and delays. “Whenever I need anything from a programmer, I have to go through, you know, the IT gods in the sky,” one GPM remarked. “That usually takes a few months or more.”
Social challenges. Instituting the GPM role was a cultural change, and interviewees reported needing to address resistance to CPM model efforts. Resistance to change “is particularly hard in the VA just because it has a unique culture,” one leader noted. “There is a comfort in the legacy way of doing things.” The GPM initiative was introduced during a time when other national level initiatives were being implemented throughout the VHA. Fulfilling requests for information for these initiatives became the responsibility of the GPM and their team, which diverted attention from the mandate to improve access. Furthermore, GPMs were often considered the “change communicators” to clinics putting them in the role of “bad messenger,” which degraded trust and made it difficult to partner with clinicians.
Efforts to work through change management and build relationships included general program awareness presentation to internal stakeholders; including key stakeholders in GPM committees; pre-emptive conversations with unit chiefs; creating awareness of the GPM activities and progress through formal and informal update meetings; and identifying successes regarding access.
Structural challenges. The GPM role did not have direct supervision over clinical and administrative leaders, making it challenging to enact change. GPMs reported that “they do not always have authority over the area that they are being asked to manage,” which made their work difficult, requiring strong negotiation skills and political savvy to affect change. However, as the clinic staff and providers saw how the GPM could support and positively impact their practice, these challenges began to subside.
Discussion
This study provides empirical evidence regarding the implementation of a new access management strategy for health care systems focused on improving timeliness of care. First, the GPM position was seen as critical at each facility, as a single point person, to help local system leaders respond effectively to both national mandates and local context. Second, requiring the GPMs to report to the medical center director or chief of staff was important for integrating access perspectives across service lines and to facilitate a strong GPM role in strategic planning. Third, the intentional flexibility of the access management initiative, beyond the nationally specified aspects of the GPM role, was key for allowing individual sites to adapt to unique local challenges, resources, and population demands. Fourth, the initiative provided GPMs with opportunities to learn important skills and support the acquisition, utilization, and communication of a tremendous range of data toward responsive action.
According to our respondents, the GPM role demands functioning across a broad set of responsibilities; understanding the big picture as well as the complex underlying variables; engaging facility leaders, clinical and administrative staff; and prioritizing competing national and local demands. Consistent with previous findings, effective GPMs must possess a complex set of skills (interpersonal, analytic, and leadership) and the ability to create a supporting team.13
In practice, improving access at individual sites of care (VA medical centers and community-based outpatient clinics) poses significant challenges, especially in the early stages, even with the assistance of a GPM. For example, some respondents reported being overwhelmed by the volume of available data and dashboards, and responding to current requests for data analysis and dissemination sometimes impeded long range planning. Multiple national access-related initiatives and local pressures also generated excessive and potentially conflicting demands. Thus, while the creation of a GPM position seemed to be essential for the pilot sites to improve local access and timeliness to care, success also requires ongoing national and facility-wide communication, education, and support. Ongoing data analysis training and support will be critical to ensuring the sustainability of the position. Last, recruiting GPMs with the needed complex skill set may prove to be challenging, and it will be important to provide resources to identify, attract, and retain well-qualified GPMs.
Limitations and Future Work
This study was based on a small initial sample of pilot sites of varying sizes and, as such, may not reflect the experience of all VHA GPMs. In addition, the use of snowball sampling, while facilitating identification of key stakeholders, may introduce bias in participant sampling. Nonetheless, the results from this study provide findings that informed the national VHA GPM initiative and can inform further studies of practice management roles outside of the VA.
Further study of the VHA GPM implementation and similar roles in other health care systems is needed. As the GPM position is fully implemented across the VHA, large scale evaluation is needed to gain a more representative picture and allow for comparison of the GPM role at various types of facilities (eg, size, rurality, complexity, ranking based on access performance metrics).
Conclusion
Improving access to care is a central goal for health care systems. The incorporation of the GPM role is an innovative approach to improve access management strategies. Early study of prototype sites provided VHA leadership with valuable insights used to influence further rollout of this initiative. Based on our findings, national and local support are important to ongoing success. National access mandates, training, and resources should focus on ensuring sufficient GPM authority, enabling GPMs to use data, and ensuring GPMs engage with frontline clinical and administrative staff to improve veteran access to care.
1. US Department of Veterans Affairs. Veterans Health Administration. https://www.va.gov/health. Updated October 25, 2019. Accessed January 8, 2020.
2. Veterans Access, Choice, and Accountability Act of 2014. 38 CFR § 17.1500 (2014).
3. Fahmy N, Aprikian A, Al-Otaibi M, et al. Impact of treatment delay in patients with bladder cancer managed with partial cystectomy in Quebec: a population-based study. Can Urol Assoc J. 2009;3(2):131-135.
4. Hill CJ, Joonas K. The impact of unacceptable wait time on health care patients’ attitudes and actions. Health Mark Q. 2005;23(2):69-87.
5. Ansell D, Crispo JAG, Simard B, Bjerre LM. Interventions to reduce wait times for primary care appointments: a systematic review. BMC Health Serv Res. 2017;17(1):295.
6. Kotecha J, Han H, Green M, Russell G, Martin MI, Birtwhistle R. The role of the practice facilitators in Ontario primary healthcare quality improvement. BMC Fam Pract. 2015;16:93.
7. Taylor EF, Machta RM, Meyers DS, Genevro J, Peikes DN. Enhancing the primary care team to provide redesigned care: the roles of practice facilitators and care managers. Ann Fam Med. 2013;11(1):80-83.
8. Liddy C, Laferriere D, Baskerville B, Dahrouge S, Knox L, Hogg W. An overview of practice facilitation programs in Canada: current perspectives and future directions. Healthc Policy. 2013;8(3):58-67.
9. Birken SA, Lee SY, Weiner BJ, Chin MH, Schaefer CT. Improving the effectiveness of health care innovation implementation: middle managers as change agents. Med Care Res Rev. 2013;70(1):29-45.
10. Ahluwalia S, Offredy M. A qualitative study of the impact of the implementation of advanced access in primary healthcare on the working lives of general practice staff. BMC Fam Pract. 2005;6:39.
11. Damschroder LJ, Aron DC, Keith RE, Kirsh SR, Alexander JA, Lowery JC. Fostering implementation of health services research findings into practice: a consolidated framework for advancing implementation science. Implement Sci. 2009;4:50.
12. Elo S, Kyngäs H. The qualitative content analysis process. J Adv Nurs. 2008;62(1):107-115.
13. Stefl ME. Common competencies for all healthcare managers: the Healthcare Leadership Alliance model. J Healthc Manag. 2008;53(6):360-374.
The Veterans Health Administration (VHA) provides care for 9 million veterans at 1,255 health care sites linked to one of 170 local medical systems.1 Recognizing that providing timely care requires effective access management, the US Congress mandated training of VHA staff to manage and improve access to care but did not provide additional local funds for new positions.2 In response, the VHA created the group practice manager (GPM), a new position responsible for improving clinical practice management and unifying access improvement across leadership levels, professions, and services within each local medical system.
In May 2015, the VHA began hiring and training GPMs to spearhead management of access to services. The US Department of Veterans Affairs (VA) Office of Veteran Access to Care spearheaded GPM training, including face-to-face sessions, national calls, webinars, and educational materials. Five local medical systems were selected by the VA Office of Veteran Access to Care to implement the GPM role to allow for an early evaluation of the program that would inform a subsequent nationwide rollout. Implementation of the GPM role remained in the hands of local medical systems.
Longer wait times are shown to impact patient health.3,4 Open access scheduling and other patient-centered access management interventions have been shown to improve availability of primary care appointments.5 However, little empirical evidence exists regarding the managers who focus on clinic access interventions. While the nonpeer-reviewed literature includes references to such roles, including GPMs, the empirical literature has focused on external practice faciliators,6-8 “mid-level managers,”9 and clinic staff.10 We found no peer-reviewed articles on the needs and experiences of practice managers who are focused on improving access. The purpose of this study was to examine GPM prototype sites to both enhance subsequent nationwide implementation and to advance empirical literature on managing patient access within health care.
Methods
In 2015, the VA identified 5 prototype sites representing diverse geographic locations, size, and complexity for the implementation of the GPM role (Table 1). These sites self-identified as having clinical practice management experience. GPMs attended 4 training sessions between February and August 2015.
Data Collection
Participants from each prototype site included GPMs, national trainers, clinic leaders, and frontline staff. Table 2 includes the roles and sample size. Participants were recruited through purposive sampling followed by snowball sampling until thematic saturation was reached (the point at which subsequent data fail to produce new findings across sites and roles of interest).
Guided by the Consolidated Framework for Implementation Research (CFIR), the research team developed semistructured interview guides tailored to participants’ roles to elicit rich descriptions regarding overall impressions, practice management strategies, goals, activities, relationship to clinic roles, data analytics usage, challenges, barriers, and facilitators.11 These guides included open-ended questions and structured prompts utilizing participant language for follow-up probes to minimize interviewing bias (eAppendix:
Data Analysis
Data were analyzed using iterative deductive and inductive content analysis.12 Deductive content analysis consisted of identifying quotes that fit within preidentified categories (ie, perceptions of national effort, organizational structure for GPM, challenges, facilitators, metrics and tools, and mobilizing access culture) developed by the interdisciplinary research team. Further content analysis entailed open-coding and iteratively revisiting and reconciling codes associated within each preidentified category as new codes emerged. The team analyzed the resulting codes to inductively and iteratively identify and stabilize themes regarding the GPM role: roles and tasks, GPM characteristics, issues, and challenges. Through this process we moved coded data to reconciled descriptions suited to addressing the purposes of this study. Dedoose 7.0.23 software was used for qualitative data management and analysis.
Results
The study identified participants’ overall impressions of the GPM initiative and key themes within 4 major domains regarding implementing the GPM role: roles and tasks (implementing clinic practice management, leading patient access, supporting data analytics, and enabling self and staff); GPM characteristics (familiarity with clinical services, knowledge of VHA systems, ability to analyze patient data, communication skills, and the ability to work with others); and issues, and challenges (technical, social, and structural).
Overall Impressions
Interviewees perceived the GPM initiative as a consolidation of existing distributed responsibilities into one role that directly reported to local top-level management with indirect reporting to national leaders. Many of the sites reported that they had designated or planned to designate a role resembling the GPM prior to the initiative. “There are staff who’ve been doing some of this work all along,” a GPM noted. “We just didn’t have them grouped together. They weren’t necessarily all working in the same type of service under the same type of structure.”
Whether the GPM position was new or not, participants referenced the importance and challenges of engaging the local facility in recognizing the agency associated with the GPM position. According to national support, the staff are trying to get the facility to understand “why the group practice manager is so important… we’ve got to embed that standard position in the system.”
While the GPM was recognized as the hub of access management, respondents recognized that transformation regarding access involved many players. “We have to create [an] orchestrated team inside each facility,” an advisor argued.
Respondents discussed how the initiative allows local facilities to appoint a specific person with a specific title and role who helps facilitate, organize, and legitimize an access focus at their sites. One GPM interviewee noted how the initiative helped refocus some of their previously less centralized efforts. “We’ve always looked at productivity; we’ve always looked at access; we’ve always looked at efficiency. I think the bigger difference is now there are individuals identified in the clinics, as practice managers as well…I interact with them. They interact with individual clinic staff, and it’s more of a group process than a single individual.”
The value of having tools available and being able to track and manage patient care as a specific example of the positive impact of this new role was noted by participants. A GPM noted that many health care providers will be happy to have tools to better manage their services and a process “that flows from a service level all the way up to executive management, where there is a common interest in making those things happen—I think that’s going to be a tremendous help.”
Participants expressed concern that the national GPM rollout would be a one-size-fits-all approach. These respondents emphasized the need to have the flexibility to customize their activities to meet their unique site and patient needs.
GPM Roles and Tasks
Participants described 4 primary roles that the GPM was expected to fill: implementing clinic practice management, leading patient access, supporting data analytics, and enabling self and staff. Some activities overlapped in that they served to support multiple role areas (Figure 1).
Implementing clinic practice management. In the early stages of the initiative, the GPM’s primary role was to prepare the facility to implement a standardized set of clinic practice management (CPM) team processes. Part of standardizing the CPM process was defining the scope and tasks of the GPM, which requires significant planning for the implementation. “My big job is to finalize what we think group practice management is going to look [like] here,” a GPM reported.
Each prototype site had latitude to interpret the GPM initiative in a way that would work in their context within given VHA boundaries and ongoing initiatives. To achieve the high-level vision and purpose, the GPM first had to develop action plans that accounted for the operating environment of the facility. According to one GPM, VA national officials are “constantly” asking for action plans, which required significant time by specific deadlines. “They want an action plan [and to] clean up all your consults, [and to] clean up all your recall reminders.”
Leading on improving access efforts. Participants saw the GPM as the central staff member responsible for providing oversight of any activities and people involved in improving access. “I ensure everybody is doing what they’re supposed to do,” one GPM reported. When the GPM sees areas that are not being addressed, the individual tries to develop a process or training to “close those gaps.”
GPMs promoted an awareness of their goals, changes in process, and new tools accompanying the initiative. However, other access initiatives were occurring simultaneously creating confusion for health care providers and patients; thus GPMs found they were managing a wide array of related initiatives.
GPMs have to negotiate with leaders across the VHA facility, many of whom operated at a higher leadership level and had different priorities, to address access problems.
“I’m a lieutenant as a GPM in a clinic, a GPM noted. “How is the lieutenant going to talk to a major or a colonel in the clinic and say your clinic has problems. How[‘s] that lieutenant...going to do that? With people skills!”
Managing expectations about the speed and to what extent a problem could be resolved was an important part of the GPM leadership role. “I see myself as managing expectations both up to the leadership and down to the frontline,” a GPM explained. “I find myself talking to leadership [about] our progress. But at the same time, we have to say, ‘not everything can be fixed overnight.’”
Providing leadership on access-related issues included developing a range of options for addressing patient access problems. One analytics manager recounted how the GPM role led to evaluating how physical space limited efficiency in clinic flow. The first step was identifying possible additional rooms to improve clinic flow. This required working with the space committee to “get someone to look at our overarching space and find someplace else for them to sit” to avoid adding to congestion in the clinic area.
Supporting data analytics.
GPMs routinely immersed themselves in the data to understand access issues. GPMs worked with clinic leaders to identify the underlying causes and various solutions. The GPMs maintained access through administrative scrubbing of the data and finding “smart ways to get patients scheduled,” a GPM explained. “I don’t think our facility would have taken care of as many veterans in the time frame as we did....We’ve cleared over 4,000 consults that were older than 90 days. We have cleared thousands and thousands of weekly reminders.”
GPMs expressed the need for aggregated (ie, dashboard) and standardized information to efficiently address access issues. “I would like to have some more standardization on what’s being reviewed; it seems to change frequently, and so [to] be able to track and trend and have something given to me to review,” one health care provider requested. On the other hand, participants also described a need for decision support tools that would lead to action aligned with best practices. “Instead of a dashboard or something that’s just measuring their performance, it’s more something that they can look at and take action” a national support staff advisor suggested.
Enabling self and staff. GPMs felt they were most effective if they enabled themselves and stakeholders through training and by cultivating relationships and team building. Figure 2 illustrates the various stakeholders GPMs reported engaging with. The GPMS should be building relationships, bridging relationships, developing trust, and then providing a higher level of hands-on management. However, “that doesn’t really happen right now, day to day,” one member of leadership reported.
Key topics in GPM leadership training included both soft skills (change management, culture change, and negotiation skills) and crucial analytic/technical training (understanding each metric and dashboard available, data analytics, and supply/demand balancing techniques). The GPMs not only wanted to understand metrics as part of their training, but also want to know what to do about them.
An “operationalization” training approach (discerning the meaning of data, data-based decision making, and determining action from multiple options) inspired by real-life situations was preferred by participants. Other effective learning structures included job aids in the form of templated Gantt charts, process maps to guide GPMs through implementation of new processes, formalized peer learning (accumulated field insights shared during training courses), and informal peer sharing of direct experiences during calls.
GPMs also emphasized training for frontline clinical and support staff, including schedulers. VHA schedulers typically have less education and experience higher turnover rates than do other clinic staff, yet they carry out complex and critical tasks. Providing training and ensuring that any materials developed for training and education were appropriate to the level of education of schedulers was an important task for GPMs. “If they don’t understand all of the scheduling principles and potential,” one GPM explained, “we will not be maximizing the utilization of our parts.”
GPMs also provided informal education to clinicians. Participants noted GPMs have to avoid appearing to overstep their positions or presuming more knowledge and expertise than clinicians. They “have to be able to teach a physician without being overbearing, in a way a physician will accept it as advisement,” one program leader reported.
GPM knowledge, skills, and abilities. GPMs presented a complex range of knowledge, skills, and abilities, including clinical, administrative, analytics, and people skills. All interviewees reported that their prior education and experience did not sufficiently train them for the GPM role. GPMs identified a willingness to learn quickly as a critical characteristic. Many GPMs tended to have a formal education in health administration or business (eg, MBAs); others had administrative experience (eg, administrative assistance to executive leadership) or clinical training (eg, physician assistant). Detailed clinical knowledge was not expected, but clinical familiarity was helpful.
Some interviewees also mentioned previous experience and familiarity with the VHA system specifically as an advantage. This was especially true for VA outpatient flows, clinic flows, and understanding what an outpatient is in a VA context. Interviewees noted the importance of GPMs needing to be able to analyze patient demand metrics and underlying data in order to determine supply of providers and then to allocate adequate resources to complement providers. Forecasting skills were referenced as a key point. “They need to be able to be assured that they can recruit more providers if needed,” a national support staff advisor noted.
Given the importance of developing effective relationships, communication skills were mentioned by most participants and underscored as critical to establishing trust between GPMs and others as the initiative was being implemented. Interviewees indicated that relationship building was further enhanced when GPMs possessed the ability to “work with” rather than command clinicians and staff; navigate politics; and were respectful of other people’s knowledge, skills, abilities, and status. “They have to work with the nursing staff and teach them,” a leader described, “so that people understand that we are going to a different place to achieve our primary objectives and goals.”
Issues and Challenges
Participants identified several technical, social, and structural challenges and barriers to successfully implementing the GPM role.
Technical challenges. Recurring themes across all phases of data analytics were GPMs’ capability to challenge data use and use large volumes of information from multiple data sources (entering and accessing data; “drilling down” from summaries; generating reports; and analyzing and interpreting resulting metrics). Interviewees reported that information assessment and analytic support were not consistent. One GPM had a data analyst pulling reports needed to support clinical units while other GPMs trained staff to pull data. Even with support, some GPMs had issues due to limited information technology (IT) skills or access privileges leading to inefficiencies and delays. “Whenever I need anything from a programmer, I have to go through, you know, the IT gods in the sky,” one GPM remarked. “That usually takes a few months or more.”
Social challenges. Instituting the GPM role was a cultural change, and interviewees reported needing to address resistance to CPM model efforts. Resistance to change “is particularly hard in the VA just because it has a unique culture,” one leader noted. “There is a comfort in the legacy way of doing things.” The GPM initiative was introduced during a time when other national level initiatives were being implemented throughout the VHA. Fulfilling requests for information for these initiatives became the responsibility of the GPM and their team, which diverted attention from the mandate to improve access. Furthermore, GPMs were often considered the “change communicators” to clinics putting them in the role of “bad messenger,” which degraded trust and made it difficult to partner with clinicians.
Efforts to work through change management and build relationships included general program awareness presentation to internal stakeholders; including key stakeholders in GPM committees; pre-emptive conversations with unit chiefs; creating awareness of the GPM activities and progress through formal and informal update meetings; and identifying successes regarding access.
Structural challenges. The GPM role did not have direct supervision over clinical and administrative leaders, making it challenging to enact change. GPMs reported that “they do not always have authority over the area that they are being asked to manage,” which made their work difficult, requiring strong negotiation skills and political savvy to affect change. However, as the clinic staff and providers saw how the GPM could support and positively impact their practice, these challenges began to subside.
Discussion
This study provides empirical evidence regarding the implementation of a new access management strategy for health care systems focused on improving timeliness of care. First, the GPM position was seen as critical at each facility, as a single point person, to help local system leaders respond effectively to both national mandates and local context. Second, requiring the GPMs to report to the medical center director or chief of staff was important for integrating access perspectives across service lines and to facilitate a strong GPM role in strategic planning. Third, the intentional flexibility of the access management initiative, beyond the nationally specified aspects of the GPM role, was key for allowing individual sites to adapt to unique local challenges, resources, and population demands. Fourth, the initiative provided GPMs with opportunities to learn important skills and support the acquisition, utilization, and communication of a tremendous range of data toward responsive action.
According to our respondents, the GPM role demands functioning across a broad set of responsibilities; understanding the big picture as well as the complex underlying variables; engaging facility leaders, clinical and administrative staff; and prioritizing competing national and local demands. Consistent with previous findings, effective GPMs must possess a complex set of skills (interpersonal, analytic, and leadership) and the ability to create a supporting team.13
In practice, improving access at individual sites of care (VA medical centers and community-based outpatient clinics) poses significant challenges, especially in the early stages, even with the assistance of a GPM. For example, some respondents reported being overwhelmed by the volume of available data and dashboards, and responding to current requests for data analysis and dissemination sometimes impeded long range planning. Multiple national access-related initiatives and local pressures also generated excessive and potentially conflicting demands. Thus, while the creation of a GPM position seemed to be essential for the pilot sites to improve local access and timeliness to care, success also requires ongoing national and facility-wide communication, education, and support. Ongoing data analysis training and support will be critical to ensuring the sustainability of the position. Last, recruiting GPMs with the needed complex skill set may prove to be challenging, and it will be important to provide resources to identify, attract, and retain well-qualified GPMs.
Limitations and Future Work
This study was based on a small initial sample of pilot sites of varying sizes and, as such, may not reflect the experience of all VHA GPMs. In addition, the use of snowball sampling, while facilitating identification of key stakeholders, may introduce bias in participant sampling. Nonetheless, the results from this study provide findings that informed the national VHA GPM initiative and can inform further studies of practice management roles outside of the VA.
Further study of the VHA GPM implementation and similar roles in other health care systems is needed. As the GPM position is fully implemented across the VHA, large scale evaluation is needed to gain a more representative picture and allow for comparison of the GPM role at various types of facilities (eg, size, rurality, complexity, ranking based on access performance metrics).
Conclusion
Improving access to care is a central goal for health care systems. The incorporation of the GPM role is an innovative approach to improve access management strategies. Early study of prototype sites provided VHA leadership with valuable insights used to influence further rollout of this initiative. Based on our findings, national and local support are important to ongoing success. National access mandates, training, and resources should focus on ensuring sufficient GPM authority, enabling GPMs to use data, and ensuring GPMs engage with frontline clinical and administrative staff to improve veteran access to care.
1. US Department of Veterans Affairs. Veterans Health Administration. https://www.va.gov/health. Updated October 25, 2019. Accessed January 8, 2020.
2. Veterans Access, Choice, and Accountability Act of 2014. 38 CFR § 17.1500 (2014).
3. Fahmy N, Aprikian A, Al-Otaibi M, et al. Impact of treatment delay in patients with bladder cancer managed with partial cystectomy in Quebec: a population-based study. Can Urol Assoc J. 2009;3(2):131-135.
4. Hill CJ, Joonas K. The impact of unacceptable wait time on health care patients’ attitudes and actions. Health Mark Q. 2005;23(2):69-87.
5. Ansell D, Crispo JAG, Simard B, Bjerre LM. Interventions to reduce wait times for primary care appointments: a systematic review. BMC Health Serv Res. 2017;17(1):295.
6. Kotecha J, Han H, Green M, Russell G, Martin MI, Birtwhistle R. The role of the practice facilitators in Ontario primary healthcare quality improvement. BMC Fam Pract. 2015;16:93.
7. Taylor EF, Machta RM, Meyers DS, Genevro J, Peikes DN. Enhancing the primary care team to provide redesigned care: the roles of practice facilitators and care managers. Ann Fam Med. 2013;11(1):80-83.
8. Liddy C, Laferriere D, Baskerville B, Dahrouge S, Knox L, Hogg W. An overview of practice facilitation programs in Canada: current perspectives and future directions. Healthc Policy. 2013;8(3):58-67.
9. Birken SA, Lee SY, Weiner BJ, Chin MH, Schaefer CT. Improving the effectiveness of health care innovation implementation: middle managers as change agents. Med Care Res Rev. 2013;70(1):29-45.
10. Ahluwalia S, Offredy M. A qualitative study of the impact of the implementation of advanced access in primary healthcare on the working lives of general practice staff. BMC Fam Pract. 2005;6:39.
11. Damschroder LJ, Aron DC, Keith RE, Kirsh SR, Alexander JA, Lowery JC. Fostering implementation of health services research findings into practice: a consolidated framework for advancing implementation science. Implement Sci. 2009;4:50.
12. Elo S, Kyngäs H. The qualitative content analysis process. J Adv Nurs. 2008;62(1):107-115.
13. Stefl ME. Common competencies for all healthcare managers: the Healthcare Leadership Alliance model. J Healthc Manag. 2008;53(6):360-374.