User login
Mismatch Between Process and Outcome Measures for Hospital-Acquired Venous Thromboembolism in a Surgical Cohort
From Tufts Medical Center, Boston, MA.
Abstract
- Objective: Audits at our academic medical center revealed near 100% compliance with protocols for perioperative venous thromboembolism (VTE) prophylaxis, but recent National Surgical Quality Improvement Program data demonstrated a higher than expected incidence of VTE (observed/expected = 1.32). The objective of this study was to identify potential causes of this discrepancy.
- Design: Retrospective case-control study.
- Setting: Urban academic medical center with high case-mix indices (Medicare approximately 2.4, non-Medicare approximately 2.0).
- Participants: 102 surgical inpatients with VTE (September 2012 to October 2015) matched with controls for age, gender, and type of procedure.
- Measurements: Prevalence of common VTE risk factors, length of stay, number of procedures, index operation times, and postoperative bed rest > 12 hours were assessed. Utilization of and compliance with our VTE risk assessment tool was also investigated.
- Results: Cases underwent more procedures and had longer lengths of stay and index procedures than controls. In addition, cases were more likely to have had > 12 hours of postoperative bed rest and central venous access than controls. Cases had more infections and were more likely to have severe lung disease, thrombophilia, and a history of prior VTE than controls. No differences in body mass index, tobacco use, current or previous malignancy, or VTE risk assessment form use were observed. Overall, care complexity and risk factors were equally important in determining VTE incidence. Our analyses also revealed lack of strict adherence to our VTE risk stratification protocol and frequent use of suboptimal prophylactic regimens.
- Conclusion: Well-accepted risk factors and overall care complexity determine VTE risk. Preventing VTE in high-risk patients requires assiduous attention to detail in VTE risk assessment and in delivery of optimal prophylaxis. Patients at especially high risk may require customized prophylactic regimens.
Keywords: hospital-acquired venous thromboembolic disease; VTE prophylaxis, surgical patients.
Deep vein thrombosis (DVT) and pulmonary embolism (PE) are well-recognized causes of morbidity and mortality in surgical patients. Between 350,000 and 600,000 cases of venous thromboembolism (VTE) occur each year in the United States, and it is responsible for approximately 10% of preventable in-hospital fatalities.1-3 Given VTE’s impact on patients and the healthcare system and the fact that it is preventable, intense effort has been focused on developing more effective prophylactic measures to decrease its incidence.2-4 In 2008, the surgeon general issued a “call to action” for increased efforts to prevent VTE.5
The American College of Chest Physicians (ACCP) guidelines subcategorize patients based on type of surgery. In addition, the ACCP guidelines support the use of a Caprini-based scoring system to aid in risk stratification and improve clinical decision-making (

Our hospital, a 350-bed academic medical center in downtown Boston, MA, serving a diverse population with a very high case-mix index (2.4 Medicare and 2.0 non-Medicare), has strict protocols for VTE prophylaxis consistent with the ACCP guidelines and based on the Surgical Care Improvement Project (SCIP) measures published in 2006.10 The SCIP mandates allow for considerable surgeon discretion in the use of chemoprophylaxis for neurosurgical cases and general and orthopedic surgery cases deemed to be at high risk for bleeding. In addition, SCIP requires only that prophylaxis be initiated within 24 hours of surgical end time. Although recent audits revealed nearly 100% compliance with SCIP-mandated protocols, National Surgical Quality Improvement Program (NSQIP) data showed that the incidence of VTE events at our institution was higher than expected (observed/expected [O/E] = 1.32).
In order to determine the reasons for this mismatch between process and outcome performance, we investigated whether there were characteristics of our patient population that contributed to the higher than expected rates of VTE, and we scrutinized our VTE prophylaxis protocol to determine if there were aspects of our process that were also contributory.
Methods
Study Sample
This is a retrospective case-control study of surgical inpatients at our hospital during the period September 2012 to October 2015. Cases were identified as patients diagnosed with a VTE (DVT or PE). Controls were identified from a pool of surgical patients whose courses were not complicated by VTE during the same time frame as the cases and who were matched as closely as possible by procedure code, age, and gender.
Variables
Patient and hospital course variables that were analyzed included demographics, comorbidities, length of stay, number of procedures, index operation times, duration of postoperative bed rest, use of mechanical prophylaxis, and type of chemoprophylaxis and time frame within which it was initiated. Data were collected via chart review using International Classification of Diseases-9 and -10 codes to identify surgical cases within the allotted time period who were diagnosed with VTE. Demographic variables included age, sex, and ethnicity. Comorbidities included hypertension, diabetes, coronary artery disease, serious lung disease, previous or current malignancy, documented hypercoagulable state, and previous history of VTE. Body mass index (BMI) was also recorded. The aforementioned disease-specific variables were not matched between the case and control groups, as this data was obtained retrospectively during data collection.
Analysis
Associations between case and matched control were analyzed using the paired t-test for continuous variables and McNemar’s test for categorical variables. P values < 0.05 were considered statistically significant. SAS Enterprise Guide 7.15 (Cary, NC) was used for all statistical analyses.
The requirement for informed consent was waived by our Institutional Review Board, as the study was initially deemed to be a quality improvement project, and all data used for this report were de-identified.
Results
Our retrospective case-control analysis included a sample of 102 surgical patients whose courses were complicated by VTE between September 2012 and October 2015. The cases were distributed among 6 different surgical categories (Figure 1): trauma (20%), cancer (10%), cardiovascular (21%), noncancer neurosurgery (28%), elective orthopedics (11%), and miscellaneous general surgery (10%). 
Comparisons between cases and controls in terms of patient demographics and risk factors are shown in Table 2. No statistically significant difference was observed in ethnicity or race between the 2 groups. Overall, cases had more hip/pelvis/leg fractures at presentation (P = 0.0008). The case group also had higher proportions of patients with postoperative bed rest greater than 12 hours (P = 0.009), central venous access (P < 0.0001), infection (P < 0.0001), and lower extremity edema documented during the hospitalization prior to development of DVT (P < 0.0001). Additionally, cases had significantly greater rates of previous VTE (P = 0.0004), inherited or acquired thrombophilia (P = 0.03), history of stroke (P = 0.0003), and severe lung disease, including pneumonia (P = 0.0008). No significant differences were noted between cases and matched controls in BMI (P = 0.43), current tobacco use (P = 0.71), current malignancy (P = 0.80), previous malignancy (P = 0.83), head trauma (P = 0.17), or acute cardiac disease (myocardial infarction or congestive heart failure; P = 0.12).

Variables felt to indicate overall complexity of hospital course for cases as compared to controls are outlined in Table 3. Cases were found to have significantly longer lengths of stay (median, 15.5 days versus 3 days, P < 0.0001). To account for the possibility that the development of VTE contributed to the increased length of stay in the cases, we also looked at the duration between admission date and the date of VTE diagnosis and determined that cases still had a longer length of stay when this was accounted for (median, 7 days versus 3 days, P < 0.0001). A much higher proportion of cases underwent more than 1 procedure compared to controls (P < 0.0001), and cases had significantly longer index operations as compared to controls (P = 0.002).

Seventeen cases received heparin on induction during their index procedure, compared to 23 controls (P = 0.24). Additionally, 63 cases began a prophylaxis regimen within 24 hours of surgery end time, compared to 68 controls (P = 0.24). The chemoprophylactic regimens utilized in cases and in controls are summarized in Figure 2. Of note, only 26 cases and 32 controls received standard prophylactic regimens with no missed doses (heparin 5000 units 3 times daily or enoxaparin 40 mg daily). Additionally, in over half of cases and a third of controls, nonstandard regimens were ordered. Examples of nonstandard regimens included nonstandard heparin or enoxaparin doses, low-dose warfarin, or aspirin alone. In most cases, nonstandard regimens were justified on the basis of high risk for bleeding.

Mechanical prophylaxis with pneumatic sequential compression devices (SCDs) was ordered in 93 (91%) cases and 87 (85%) controls; however, we were unable to accurately document uniform compliance in the use of these devices.
With regard to evaluation of our process measures, we found only 17% of cases and controls combined actually had a VTE risk assessment in their chart, and when it was present, it was often incomplete or was completed inaccurately.
Discussion
The goal of this study was to identify factors (patient characteristics and/or processes of care) that may be contributing to the higher than expected incidence of VTE events at our medical center, despite internal audits suggesting near perfect compliance with SCIP-mandated protocols. We found that in addition to usual risk factors for VTE, an overarching theme of our case cohort was their high complexity of illness. At baseline, these patients had significantly greater rates of stroke, thrombophilia, severe lung disease, infection, and history of VTE than controls. Moreover, the hospital courses of cases were significantly more complex than those of controls, as these patients had more procedures, longer lengths of stay and longer index operations, higher rates of postoperative bed rest exceeding 12 hours, and more prevalent central venous access than controls (Table 2). Several of these risk factors have been found to contribute to VTE development despite compliance with prophylaxis protocols.
Cassidy et al reviewed a cohort of nontrauma general surgery patients who developed VTE despite receiving appropriate prophylaxis and found that both multiple operations and emergency procedures contributed to the failure of VTE prophylaxis.11 Similarly, Wang et al identified several independent risk factors for VTE despite thromboprophylaxis, including central venous access and infection, as well as intensive care unit admission, hospitalization for cranial surgery, and admission from a long-term care facility.12 While our study did not capture some of these additional factors considered by Wang et al, the presence of risk factors not captured in traditional assessment tools suggests that additional consideration for complex patients is warranted.
In addition to these nonmodifiable patient characteristics, aspects of our VTE prophylaxis processes likely contributed to the higher than expected rate of VTE. While the electronic medical record at our institution does contain a VTE risk assessment tool based on the Caprini score, we found it often is not used at all or is used incorrectly/incompletely, which likely reflects the fact that physicians are neither prompted nor required to complete the assessment prior to prescribing VTE prophylaxis.
There is a significant body of evidence demonstrating that mandatory computerized VTE risk assessments can effectively reduce VTE rates and that improved outcomes occur shortly after implementation. Cassidy et al demonstrated the benefits of instituting a hospital-wide, mandatory, Caprini-based computerized VTE risk assessment that provides prophylaxis/early ambulation recommendations. Two years after implementing this system, they observed an 84% reduction in DVTs (P < 0.001) and a 55% reduction in PEs (P < 0.001).13 Nimeri et al had similarly impressive success, achieving a reduction in their NSQIP O/E for PE/DVT in general surgery from 6.00 in 2010 to 0.82 (for DVTs) and 0.78 (for PEs) 5 years after implementation of mandatory VTE risk assessment (though they noted that the most dramatic reduction occurred 1 year after implementation).14 Additionally, a recent systematic review and meta-analysis by Borab et al found computerized VTE risk assessments to be associated with a significant decrease in VTE events.15
The risk assessment tool used at our institution is qualitative in nature, and current literature suggests that employing a more quantitative tool may yield improved outcomes. Numerous studies have highlighted the importance of identifying patients at very high risk for VTE, as higher risk may necessitate more careful consideration of their prophylactic regimens. Obi et al found patients with Caprini scores higher than 8 to be at significantly greater risk of developing VTE compared to patients with scores of 7 or 8. Also, patients with scores of 7 or 8 were significantly more likely to have a VTE compared to those with scores of 5 or 6.16 In another study, Lobastov et al identified Caprini scores of 11 or higher as representing an extremely high-risk category for which standard prophylaxis regimens may not be effective.17 Thus, while having mandatory risk assessment has been shown to dramatically decrease VTE incidence, it is important to consider the magnitude of the numerical risk score. This is of particular importance at medical centers with high case-mix indices where patients at the highest risk might need to be managed with different prophylactic guidelines.
Another notable aspect of the process at our hospital was the great variation in the types of prophylactic regimens ordered, and the adherence to what was ordered. Only 25.5% of patients were maintained on a standard prophylactic regimen with no missed doses (heparin 5000 every 8 hours or enoxaparin 40 mg daily). Thus, the vast majority of the patients who went on to develop VTE either were prescribed a nontraditional prophylaxis regimen or missed doses of standard agents. The need for secondary surgical procedures or other invasive interventions may explain many, but not all, of the missed doses.
The timing of prophylaxis initiation for our patients was also found to deviate from accepted standards. Only 16.8% of cases received prophylaxis upon induction of anesthesia, and furthermore, 38% of cases did not receive any anticoagulation within 24 hours of their index operation. While this variability in prophylaxis implementation was acceptable within the SCIP guidelines based on “high risk for bleeding” or other considerations, it likely contributed to our suboptimal outcomes. The variations and interruptions in prophylactic regimens speak to barriers that have previously been reported as contributing factors to noncompliance with VTE prophylaxis.18
Given these known barriers and the observed underutilization and improper use of our risk assessment tool, we have recently changed our surgical admission order sets such that a mandatory quantitative risk assessment must be done for every surgical patient at the time of admission/operation before other orders can be completed. Following completion of the assessment, the physician will be presented with an appropriate standard regimen based on the individual patient’s risk assessment. Early results of our VTE quality improvement project have been satisfying: in the most recent NSQIP semi-annual report, our O/E for VTE was 0.74, placing us in the first decile. Some of these early reports may simply be the product of the Hawthorne effect; however, we are encouraged by the early improvements seen in other research. While we are hopeful that these changes will result in sustainable improvements in outcomes, patients at extremely high risk may require novel weight-based or otherwise customized aggressive prophylactic regimens. Such regimens have already been proposed for arthroplasty and other high-risk patients.
Future research may identify other risk factors not captured by traditional risk assessments. In addition, research should continue to explore the use and efficacy of standard prophylactic regimens in these populations to help determine if they are sufficient. Currently, weight-based low-molecular-weight heparin dosing and alternative regimens employing fondaparinux are under investigation for very-high-risk patients.19
There were several limitations to the present study. First, due to the retrospective design of our study, we could collect only data that had been uniformly recorded in the charts throughout the study period. Second, we were unable to accurately assess compliance with mechanical prophylaxis. While our chart review showed that the vast majority of cases and controls were ordered to have mechanical prophylaxis, it is impossible to document how often these devices were used appropriately in a retrospective analysis. Anecdotal observation suggests that once patients are out of post-anesthesia or critical care units, SCD use is not standardized. The inability to measure compliance precisely may be leading to an overestimation of our compliance with prophylaxis. Finally, because our study included only patients who underwent surgery at our hospital, our observations may not be generalizable outside our institution.
Conclusion
Our study findings reinforce the importance of attention to detail in VTE risk assessment and in ordering and administering VTE prophylactic regimens, especially in high-risk surgical patients. While we adhered to the SCIP-mandated prophylaxis requirements, the complexity of our patients and our lack of a truly standardized approach to risk assessment and prophylactic regimens resulted in suboptimal outcomes. Stricter and more quantitative mandatory VTE risk assessment, along with highly standardized VTE prophylaxis regimens, are required to achieve optimal outcomes.
Corresponding author: Jason C. DeGiovanni, MS, BA, [email protected].
Financial disclosures: None.
1. Spyropoulos AC, Hussein M, Lin J, et al. Rates of symptomatic venous thromboembolism in US surgical patients: a retrospective administrative database study. J Thromb Thrombolysis. 2009;28:458-464.
2. Deitzelzweig SB, Johnson BH, Lin J, et al. Prevalence of clinical venous thromboembolism in the USA: Current trends and future projections. Am J Hematol. 2011;86:217-220.
3. Horlander KT, Mannino DM, Leeper KV. Pulmonary embolism mortality in the United States, 1979-1998: an analysis using multiple-cause mortality data. Arch Intern Med. 2003;163:1711-1717.
4. Guyatt GH, Akl EA, Crowther M, et al. Introduction to the ninth edition: antithrombotic therapy and prevention of thrombosis, 9th ed: American College of Chest Physicians Evidence-Based Clinical Practice Guidelines. Chest. 2012;141(suppl):48S-52S.
5. Office of the Surgeon General; National Heart, Lung, and Blood Institute. The Surgeon General’s Call to Action to Prevent Deep Vein Thrombosis and Pulmonary Embolism. Rockville, MD: Office of the Surgeon General; 2008. www.ncbi.nlm.nih.gov/books/NBK44178/. Accessed May 2, 2019.
6. Pannucci CJ, Swistun L, MacDonald JK, et al. Individualized venous thromboembolism risk stratification using the 2005 Caprini score to identify the benefits and harms of chemoprophylaxis in surgical patients: a meta-analysis. Ann Surg. 2017;265:1094-1102.
7. Caprini JA, Arcelus JI, Hasty JH, et al. Clinical assessment of venous thromboembolic risk in surgical patients. Semin Thromb Hemost. 1991;17(suppl 3):304-312.
8. Caprini JA. Risk assessment as a guide for the prevention of the many faces of venous thromboembolism. Am J Surg. 2010;199:S3-S10.
9. Gould MK, Garcia DA, Wren SM, et al. Prevention of VTE in nonorthopedic surgical patients: antithrombotic therapy and prevention of thrombosis, 9th ed: American College of Chest Physicians Evidence-Based Clinical Practice Guidelines. Chest. 2012;141(2 Suppl):e227S-e277S.
10. The Joint Commission. Surgical Care Improvement Project (SCIP) Measure Information Form (Version 2.1c). www.jointcommission.org/surgical_care_improvement_project_scip_measure_information_form_version_21c/. Accessed June 22, 2016.
11. Cassidy MR, Macht RD, Rosenkranz P, et al. Patterns of failure of a standardized perioperative venous thromboembolism prophylaxis protocol. J Am Coll Surg. 2016;222:1074-1081.
12. Wang TF, Wong CA, Milligan PE, et al. Risk factors for inpatient venous thromboembolism despite thromboprophylaxis. Thromb Res. 2014;133:25-29.
13. Cassidy MR, Rosenkranz P, McAneny D. Reducing postoperative venous thromboembolism complications with a standardized risk-stratified prophylaxis protocol and mobilization program. J Am Coll Surg. 2014;218:1095-1104.
14. Nimeri AA, Gamaleldin MM, McKenna KL, et al. Reduction of venous thromboembolism in surgical patients using a mandatory risk-scoring system: 5-year follow-up of an American College of Surgeons National Quality Improvement Program. Clin Appl Thromb Hemost. 2017;23:392-396.
15. Borab ZM, Lanni MA, Tecce MG, et al. Use of computerized clinical decision support systems to prevent venous thromboembolism in surgical patients: a systematic review and meta-analysis. JAMA Surg. 2017;152:638–645.
16. Obi AT, Pannucci CJ, Nackashi A, et al. Validation of the Caprini venous thromboembolism risk assessment model in critically ill surgical patients. JAMA Surg. 2015;150:941-948.
17. Lobastov K, Barinov V, Schastlivtsev I, et al. Validation of the Caprini risk assessment model for venous thromboembolism in high-risk surgical patients in the background of standard prophylaxis. J Vasc Surg Venous Lymphat Disord. 2016;4:153-160.
18. Kakkar AK, Cohen AT, Tapson VF, et al. Venous thromboembolism risk and prophylaxis in the acute care hospital setting (ENDORSE survey): findings in surgical patients. Ann Surg. 2010;251:330-338.
19. Smythe MA, Priziola J, Dobesh PP, et al. Guidance for the practical management of the heparin anticoagulants in the treatment of venous thromboembolism. J Thromb Thrombolysis. 2016;41:165-186.
From Tufts Medical Center, Boston, MA.
Abstract
- Objective: Audits at our academic medical center revealed near 100% compliance with protocols for perioperative venous thromboembolism (VTE) prophylaxis, but recent National Surgical Quality Improvement Program data demonstrated a higher than expected incidence of VTE (observed/expected = 1.32). The objective of this study was to identify potential causes of this discrepancy.
- Design: Retrospective case-control study.
- Setting: Urban academic medical center with high case-mix indices (Medicare approximately 2.4, non-Medicare approximately 2.0).
- Participants: 102 surgical inpatients with VTE (September 2012 to October 2015) matched with controls for age, gender, and type of procedure.
- Measurements: Prevalence of common VTE risk factors, length of stay, number of procedures, index operation times, and postoperative bed rest > 12 hours were assessed. Utilization of and compliance with our VTE risk assessment tool was also investigated.
- Results: Cases underwent more procedures and had longer lengths of stay and index procedures than controls. In addition, cases were more likely to have had > 12 hours of postoperative bed rest and central venous access than controls. Cases had more infections and were more likely to have severe lung disease, thrombophilia, and a history of prior VTE than controls. No differences in body mass index, tobacco use, current or previous malignancy, or VTE risk assessment form use were observed. Overall, care complexity and risk factors were equally important in determining VTE incidence. Our analyses also revealed lack of strict adherence to our VTE risk stratification protocol and frequent use of suboptimal prophylactic regimens.
- Conclusion: Well-accepted risk factors and overall care complexity determine VTE risk. Preventing VTE in high-risk patients requires assiduous attention to detail in VTE risk assessment and in delivery of optimal prophylaxis. Patients at especially high risk may require customized prophylactic regimens.
Keywords: hospital-acquired venous thromboembolic disease; VTE prophylaxis, surgical patients.
Deep vein thrombosis (DVT) and pulmonary embolism (PE) are well-recognized causes of morbidity and mortality in surgical patients. Between 350,000 and 600,000 cases of venous thromboembolism (VTE) occur each year in the United States, and it is responsible for approximately 10% of preventable in-hospital fatalities.1-3 Given VTE’s impact on patients and the healthcare system and the fact that it is preventable, intense effort has been focused on developing more effective prophylactic measures to decrease its incidence.2-4 In 2008, the surgeon general issued a “call to action” for increased efforts to prevent VTE.5
The American College of Chest Physicians (ACCP) guidelines subcategorize patients based on type of surgery. In addition, the ACCP guidelines support the use of a Caprini-based scoring system to aid in risk stratification and improve clinical decision-making (
Our hospital, a 350-bed academic medical center in downtown Boston, MA, serving a diverse population with a very high case-mix index (2.4 Medicare and 2.0 non-Medicare), has strict protocols for VTE prophylaxis consistent with the ACCP guidelines and based on the Surgical Care Improvement Project (SCIP) measures published in 2006.10 The SCIP mandates allow for considerable surgeon discretion in the use of chemoprophylaxis for neurosurgical cases and general and orthopedic surgery cases deemed to be at high risk for bleeding. In addition, SCIP requires only that prophylaxis be initiated within 24 hours of surgical end time. Although recent audits revealed nearly 100% compliance with SCIP-mandated protocols, National Surgical Quality Improvement Program (NSQIP) data showed that the incidence of VTE events at our institution was higher than expected (observed/expected [O/E] = 1.32).
In order to determine the reasons for this mismatch between process and outcome performance, we investigated whether there were characteristics of our patient population that contributed to the higher than expected rates of VTE, and we scrutinized our VTE prophylaxis protocol to determine if there were aspects of our process that were also contributory.
Methods
Study Sample
This is a retrospective case-control study of surgical inpatients at our hospital during the period September 2012 to October 2015. Cases were identified as patients diagnosed with a VTE (DVT or PE). Controls were identified from a pool of surgical patients whose courses were not complicated by VTE during the same time frame as the cases and who were matched as closely as possible by procedure code, age, and gender.
Variables
Patient and hospital course variables that were analyzed included demographics, comorbidities, length of stay, number of procedures, index operation times, duration of postoperative bed rest, use of mechanical prophylaxis, and type of chemoprophylaxis and time frame within which it was initiated. Data were collected via chart review using International Classification of Diseases-9 and -10 codes to identify surgical cases within the allotted time period who were diagnosed with VTE. Demographic variables included age, sex, and ethnicity. Comorbidities included hypertension, diabetes, coronary artery disease, serious lung disease, previous or current malignancy, documented hypercoagulable state, and previous history of VTE. Body mass index (BMI) was also recorded. The aforementioned disease-specific variables were not matched between the case and control groups, as this data was obtained retrospectively during data collection.
Analysis
Associations between case and matched control were analyzed using the paired t-test for continuous variables and McNemar’s test for categorical variables. P values < 0.05 were considered statistically significant. SAS Enterprise Guide 7.15 (Cary, NC) was used for all statistical analyses.
The requirement for informed consent was waived by our Institutional Review Board, as the study was initially deemed to be a quality improvement project, and all data used for this report were de-identified.
Results
Our retrospective case-control analysis included a sample of 102 surgical patients whose courses were complicated by VTE between September 2012 and October 2015. The cases were distributed among 6 different surgical categories (Figure 1): trauma (20%), cancer (10%), cardiovascular (21%), noncancer neurosurgery (28%), elective orthopedics (11%), and miscellaneous general surgery (10%).
Comparisons between cases and controls in terms of patient demographics and risk factors are shown in Table 2. No statistically significant difference was observed in ethnicity or race between the 2 groups. Overall, cases had more hip/pelvis/leg fractures at presentation (P = 0.0008). The case group also had higher proportions of patients with postoperative bed rest greater than 12 hours (P = 0.009), central venous access (P < 0.0001), infection (P < 0.0001), and lower extremity edema documented during the hospitalization prior to development of DVT (P < 0.0001). Additionally, cases had significantly greater rates of previous VTE (P = 0.0004), inherited or acquired thrombophilia (P = 0.03), history of stroke (P = 0.0003), and severe lung disease, including pneumonia (P = 0.0008). No significant differences were noted between cases and matched controls in BMI (P = 0.43), current tobacco use (P = 0.71), current malignancy (P = 0.80), previous malignancy (P = 0.83), head trauma (P = 0.17), or acute cardiac disease (myocardial infarction or congestive heart failure; P = 0.12).
Variables felt to indicate overall complexity of hospital course for cases as compared to controls are outlined in Table 3. Cases were found to have significantly longer lengths of stay (median, 15.5 days versus 3 days, P < 0.0001). To account for the possibility that the development of VTE contributed to the increased length of stay in the cases, we also looked at the duration between admission date and the date of VTE diagnosis and determined that cases still had a longer length of stay when this was accounted for (median, 7 days versus 3 days, P < 0.0001). A much higher proportion of cases underwent more than 1 procedure compared to controls (P < 0.0001), and cases had significantly longer index operations as compared to controls (P = 0.002).
Seventeen cases received heparin on induction during their index procedure, compared to 23 controls (P = 0.24). Additionally, 63 cases began a prophylaxis regimen within 24 hours of surgery end time, compared to 68 controls (P = 0.24). The chemoprophylactic regimens utilized in cases and in controls are summarized in Figure 2. Of note, only 26 cases and 32 controls received standard prophylactic regimens with no missed doses (heparin 5000 units 3 times daily or enoxaparin 40 mg daily). Additionally, in over half of cases and a third of controls, nonstandard regimens were ordered. Examples of nonstandard regimens included nonstandard heparin or enoxaparin doses, low-dose warfarin, or aspirin alone. In most cases, nonstandard regimens were justified on the basis of high risk for bleeding.
Mechanical prophylaxis with pneumatic sequential compression devices (SCDs) was ordered in 93 (91%) cases and 87 (85%) controls; however, we were unable to accurately document uniform compliance in the use of these devices.
With regard to evaluation of our process measures, we found only 17% of cases and controls combined actually had a VTE risk assessment in their chart, and when it was present, it was often incomplete or was completed inaccurately.
Discussion
The goal of this study was to identify factors (patient characteristics and/or processes of care) that may be contributing to the higher than expected incidence of VTE events at our medical center, despite internal audits suggesting near perfect compliance with SCIP-mandated protocols. We found that in addition to usual risk factors for VTE, an overarching theme of our case cohort was their high complexity of illness. At baseline, these patients had significantly greater rates of stroke, thrombophilia, severe lung disease, infection, and history of VTE than controls. Moreover, the hospital courses of cases were significantly more complex than those of controls, as these patients had more procedures, longer lengths of stay and longer index operations, higher rates of postoperative bed rest exceeding 12 hours, and more prevalent central venous access than controls (Table 2). Several of these risk factors have been found to contribute to VTE development despite compliance with prophylaxis protocols.
Cassidy et al reviewed a cohort of nontrauma general surgery patients who developed VTE despite receiving appropriate prophylaxis and found that both multiple operations and emergency procedures contributed to the failure of VTE prophylaxis.11 Similarly, Wang et al identified several independent risk factors for VTE despite thromboprophylaxis, including central venous access and infection, as well as intensive care unit admission, hospitalization for cranial surgery, and admission from a long-term care facility.12 While our study did not capture some of these additional factors considered by Wang et al, the presence of risk factors not captured in traditional assessment tools suggests that additional consideration for complex patients is warranted.
In addition to these nonmodifiable patient characteristics, aspects of our VTE prophylaxis processes likely contributed to the higher than expected rate of VTE. While the electronic medical record at our institution does contain a VTE risk assessment tool based on the Caprini score, we found it often is not used at all or is used incorrectly/incompletely, which likely reflects the fact that physicians are neither prompted nor required to complete the assessment prior to prescribing VTE prophylaxis.
There is a significant body of evidence demonstrating that mandatory computerized VTE risk assessments can effectively reduce VTE rates and that improved outcomes occur shortly after implementation. Cassidy et al demonstrated the benefits of instituting a hospital-wide, mandatory, Caprini-based computerized VTE risk assessment that provides prophylaxis/early ambulation recommendations. Two years after implementing this system, they observed an 84% reduction in DVTs (P < 0.001) and a 55% reduction in PEs (P < 0.001).13 Nimeri et al had similarly impressive success, achieving a reduction in their NSQIP O/E for PE/DVT in general surgery from 6.00 in 2010 to 0.82 (for DVTs) and 0.78 (for PEs) 5 years after implementation of mandatory VTE risk assessment (though they noted that the most dramatic reduction occurred 1 year after implementation).14 Additionally, a recent systematic review and meta-analysis by Borab et al found computerized VTE risk assessments to be associated with a significant decrease in VTE events.15
The risk assessment tool used at our institution is qualitative in nature, and current literature suggests that employing a more quantitative tool may yield improved outcomes. Numerous studies have highlighted the importance of identifying patients at very high risk for VTE, as higher risk may necessitate more careful consideration of their prophylactic regimens. Obi et al found patients with Caprini scores higher than 8 to be at significantly greater risk of developing VTE compared to patients with scores of 7 or 8. Also, patients with scores of 7 or 8 were significantly more likely to have a VTE compared to those with scores of 5 or 6.16 In another study, Lobastov et al identified Caprini scores of 11 or higher as representing an extremely high-risk category for which standard prophylaxis regimens may not be effective.17 Thus, while having mandatory risk assessment has been shown to dramatically decrease VTE incidence, it is important to consider the magnitude of the numerical risk score. This is of particular importance at medical centers with high case-mix indices where patients at the highest risk might need to be managed with different prophylactic guidelines.
Another notable aspect of the process at our hospital was the great variation in the types of prophylactic regimens ordered, and the adherence to what was ordered. Only 25.5% of patients were maintained on a standard prophylactic regimen with no missed doses (heparin 5000 every 8 hours or enoxaparin 40 mg daily). Thus, the vast majority of the patients who went on to develop VTE either were prescribed a nontraditional prophylaxis regimen or missed doses of standard agents. The need for secondary surgical procedures or other invasive interventions may explain many, but not all, of the missed doses.
The timing of prophylaxis initiation for our patients was also found to deviate from accepted standards. Only 16.8% of cases received prophylaxis upon induction of anesthesia, and furthermore, 38% of cases did not receive any anticoagulation within 24 hours of their index operation. While this variability in prophylaxis implementation was acceptable within the SCIP guidelines based on “high risk for bleeding” or other considerations, it likely contributed to our suboptimal outcomes. The variations and interruptions in prophylactic regimens speak to barriers that have previously been reported as contributing factors to noncompliance with VTE prophylaxis.18
Given these known barriers and the observed underutilization and improper use of our risk assessment tool, we have recently changed our surgical admission order sets such that a mandatory quantitative risk assessment must be done for every surgical patient at the time of admission/operation before other orders can be completed. Following completion of the assessment, the physician will be presented with an appropriate standard regimen based on the individual patient’s risk assessment. Early results of our VTE quality improvement project have been satisfying: in the most recent NSQIP semi-annual report, our O/E for VTE was 0.74, placing us in the first decile. Some of these early reports may simply be the product of the Hawthorne effect; however, we are encouraged by the early improvements seen in other research. While we are hopeful that these changes will result in sustainable improvements in outcomes, patients at extremely high risk may require novel weight-based or otherwise customized aggressive prophylactic regimens. Such regimens have already been proposed for arthroplasty and other high-risk patients.
Future research may identify other risk factors not captured by traditional risk assessments. In addition, research should continue to explore the use and efficacy of standard prophylactic regimens in these populations to help determine if they are sufficient. Currently, weight-based low-molecular-weight heparin dosing and alternative regimens employing fondaparinux are under investigation for very-high-risk patients.19
There were several limitations to the present study. First, due to the retrospective design of our study, we could collect only data that had been uniformly recorded in the charts throughout the study period. Second, we were unable to accurately assess compliance with mechanical prophylaxis. While our chart review showed that the vast majority of cases and controls were ordered to have mechanical prophylaxis, it is impossible to document how often these devices were used appropriately in a retrospective analysis. Anecdotal observation suggests that once patients are out of post-anesthesia or critical care units, SCD use is not standardized. The inability to measure compliance precisely may be leading to an overestimation of our compliance with prophylaxis. Finally, because our study included only patients who underwent surgery at our hospital, our observations may not be generalizable outside our institution.
Conclusion
Our study findings reinforce the importance of attention to detail in VTE risk assessment and in ordering and administering VTE prophylactic regimens, especially in high-risk surgical patients. While we adhered to the SCIP-mandated prophylaxis requirements, the complexity of our patients and our lack of a truly standardized approach to risk assessment and prophylactic regimens resulted in suboptimal outcomes. Stricter and more quantitative mandatory VTE risk assessment, along with highly standardized VTE prophylaxis regimens, are required to achieve optimal outcomes.
Corresponding author: Jason C. DeGiovanni, MS, BA, [email protected].
Financial disclosures: None.
1. Spyropoulos AC, Hussein M, Lin J, et al. Rates of symptomatic venous thromboembolism in US surgical patients: a retrospective administrative database study. J Thromb Thrombolysis. 2009;28:458-464.
2. Deitzelzweig SB, Johnson BH, Lin J, et al. Prevalence of clinical venous thromboembolism in the USA: Current trends and future projections. Am J Hematol. 2011;86:217-220.
3. Horlander KT, Mannino DM, Leeper KV. Pulmonary embolism mortality in the United States, 1979-1998: an analysis using multiple-cause mortality data. Arch Intern Med. 2003;163:1711-1717.
4. Guyatt GH, Akl EA, Crowther M, et al. Introduction to the ninth edition: antithrombotic therapy and prevention of thrombosis, 9th ed: American College of Chest Physicians Evidence-Based Clinical Practice Guidelines. Chest. 2012;141(suppl):48S-52S.
5. Office of the Surgeon General; National Heart, Lung, and Blood Institute. The Surgeon General’s Call to Action to Prevent Deep Vein Thrombosis and Pulmonary Embolism. Rockville, MD: Office of the Surgeon General; 2008. www.ncbi.nlm.nih.gov/books/NBK44178/. Accessed May 2, 2019.
6. Pannucci CJ, Swistun L, MacDonald JK, et al. Individualized venous thromboembolism risk stratification using the 2005 Caprini score to identify the benefits and harms of chemoprophylaxis in surgical patients: a meta-analysis. Ann Surg. 2017;265:1094-1102.
7. Caprini JA, Arcelus JI, Hasty JH, et al. Clinical assessment of venous thromboembolic risk in surgical patients. Semin Thromb Hemost. 1991;17(suppl 3):304-312.
8. Caprini JA. Risk assessment as a guide for the prevention of the many faces of venous thromboembolism. Am J Surg. 2010;199:S3-S10.
9. Gould MK, Garcia DA, Wren SM, et al. Prevention of VTE in nonorthopedic surgical patients: antithrombotic therapy and prevention of thrombosis, 9th ed: American College of Chest Physicians Evidence-Based Clinical Practice Guidelines. Chest. 2012;141(2 Suppl):e227S-e277S.
10. The Joint Commission. Surgical Care Improvement Project (SCIP) Measure Information Form (Version 2.1c). www.jointcommission.org/surgical_care_improvement_project_scip_measure_information_form_version_21c/. Accessed June 22, 2016.
11. Cassidy MR, Macht RD, Rosenkranz P, et al. Patterns of failure of a standardized perioperative venous thromboembolism prophylaxis protocol. J Am Coll Surg. 2016;222:1074-1081.
12. Wang TF, Wong CA, Milligan PE, et al. Risk factors for inpatient venous thromboembolism despite thromboprophylaxis. Thromb Res. 2014;133:25-29.
13. Cassidy MR, Rosenkranz P, McAneny D. Reducing postoperative venous thromboembolism complications with a standardized risk-stratified prophylaxis protocol and mobilization program. J Am Coll Surg. 2014;218:1095-1104.
14. Nimeri AA, Gamaleldin MM, McKenna KL, et al. Reduction of venous thromboembolism in surgical patients using a mandatory risk-scoring system: 5-year follow-up of an American College of Surgeons National Quality Improvement Program. Clin Appl Thromb Hemost. 2017;23:392-396.
15. Borab ZM, Lanni MA, Tecce MG, et al. Use of computerized clinical decision support systems to prevent venous thromboembolism in surgical patients: a systematic review and meta-analysis. JAMA Surg. 2017;152:638–645.
16. Obi AT, Pannucci CJ, Nackashi A, et al. Validation of the Caprini venous thromboembolism risk assessment model in critically ill surgical patients. JAMA Surg. 2015;150:941-948.
17. Lobastov K, Barinov V, Schastlivtsev I, et al. Validation of the Caprini risk assessment model for venous thromboembolism in high-risk surgical patients in the background of standard prophylaxis. J Vasc Surg Venous Lymphat Disord. 2016;4:153-160.
18. Kakkar AK, Cohen AT, Tapson VF, et al. Venous thromboembolism risk and prophylaxis in the acute care hospital setting (ENDORSE survey): findings in surgical patients. Ann Surg. 2010;251:330-338.
19. Smythe MA, Priziola J, Dobesh PP, et al. Guidance for the practical management of the heparin anticoagulants in the treatment of venous thromboembolism. J Thromb Thrombolysis. 2016;41:165-186.
Use and Effectiveness of the Teach-Back Method in Patient Education and Health Outcomes
Studies have shown that a majority of patients remain confused about their health care plans after being discharged from the hospital.1,2 Furthermore, most patients do not recognize their lack of comprehension.2 A substantial proportion of medical information is forgotten immediately after discharge. Kessels found that when larger amounts of information were presented, less was recalled, and almost half of the recalled information was incorrect.3 Researchers also have found that health information that was focused on individual needs not only increased patients’ understanding of their health needs and improved their health literacy, but supported self-management and promoted health outcomes for adults with chronic illness.4,5
Health literacy is the “capacity to obtain, process, and understand basic health information and services needed to make appropriate health decisions.”6 To read instructions on a prescription bottle, patients need an intermediate level of health literacy. Even for patients with such a level of health literacy, comprehending and managing a health care plan for a chronic disease can be challenging. About 35% of Americans had lower than an intermediate level of health literacy.7 Insufficient health literacy is associated with increased health system use and costs, health disparities, and poor health outcomes.8 As a result, it is crucial to gear oral instructions to patients’ health literacy levels to ensure that patients understand health information and instructions and perform self-care at home. The teach-back method, a technique for verifying patients’ understanding of their health information, has been recommended by the Agency for Healthcare Research and Quality (AHRQ) and the Institute for Healthcare Improvement (IHI) as a strategy for taking universal precautions for health literacy. Patients are asked to repeat the instructions they receive from their health care professionals (HCPs). HCPs should use caring and plain language in a shame-free environment during patient education. By using the teach-back method, HCPs can assess patients’ understanding, and reteach or modify teaching if comprehension is not demonstrated. Patients have an important role in their health and their ability to understand health information has a significant impact on their health behavior and outcomes.
In our systematic research, we examined the effectiveness of using the teach-back method to understand health education as well as the impact of this method on patients’ disease self-management and health outcomes.
Methods
In the teach-back method, patients explain health information in their own words.9 To gauge the use and effectiveness of this method, investigators have studied patient perceptions and acknowledgments of the method as well as the effects of the method on health interventions. According to Dorothea Orem’s self-care deficit nursing theory, disease self-management is an “executive ability” to “control, handle, direct or govern” self-care activities.10 We define disease self-management as disease knowledge and disease management changes that promote self-care activities. In addition, we define health outcomes as health changes that result from the teach-back method, such as changes in postdischarge readmission rates, patient satisfaction, and health behavior.
Inclusion Criteria
We systematically reviewed evidence regarding the teach-back method as an educational intervention for patients aged ≥ 18 years. We included articles if they reported the process and outcomes of using the method alone or in combination with other educational strategies. The literature search focused on English-language articles published in peer-reviewed journals. Included in the review were qualitative, randomized controlled trials (RCTs); quasi-experimental studies; cohort studies; and pretest–posttest studies on the effects of the teach-back method. As the method can be applied in any health care setting, we used studies conducted in a variety of settings, including primary care, inpatient, outpatient, emergency department (ED), and community, in any time frame. Study participants had heart failure, diabetes mellitus (DM), hypertension, asthma, or other chronic diseases.
Exclusion Criteria
Studies that used the teach-back method as an outcome measurement but not an intervention were excluded. For example, those that used the method to measure patients’ postintervention understanding were excluded. Also excluded were those that used the method to examine HCP training or to measure HCP outcomes (ie, studies that did not use the method for patient education or outcomes).
Literature Search
In September 2017, we searched 4 databases: Ovid Medline, PubMed, EBSCO (Elton B. Stephens Co), CINAHL (Cumulative Index to Nursing and Allied Health Literature), and ProQuest. Also included were relevant studies from cited reference searching (Figure).
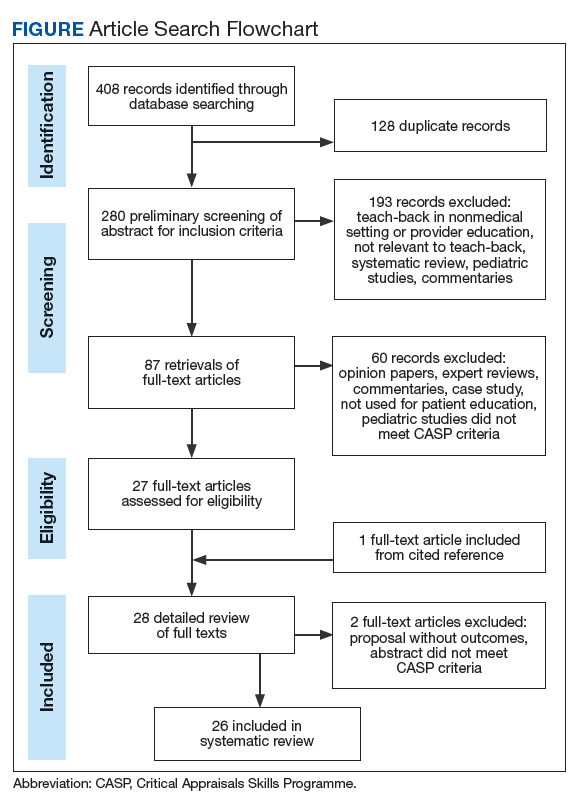
This systematic review followed the PRISMA (Preferred Reporting Items for Systematic Reviews and Meta-Analyses) guideline for searches and formatting results. The literature search was performed with the term teach-back and terms from the structured PICO (population, intervention, comparison, outcomes) statement. The study population consisted of patients who received the teach-back intervention as part of the patient education process in a medical care setting, and the comparator population consisted of patients who did not receive the intervention in their patient education. Target outcomes were disease self-management, self-care, patient satisfaction, patient perception and acknowledgment of the teach-back method, and other health outcomes.
Data Collection
Data collected included authors, publication date, and journal; purpose; study design; setting, sample, and population; intervention; and outcomes.
The methodologic quality of papers retrieved for review was determined with Critical Appraisals Skills Programme (CASP) guidelines (casp-uk.net/casp-tools-checklists). CASP randomised controlled trial, cohort study, case control study, and qualitative checklists were used. The authors assessed the full texts for eligibility. Disagreements were resolved through discussion.
The initial literature search found 112, 135, and 161 articles from EBSCO CINAHL, Ovid Medline, and PubMed, respectively. Five articles from ProQuest were identified through the EBSCO CINAHL search. After inclusion and exclusion criteria were applied, duplicate articles removed, a cited reference added, and CASP criteria assessed, 26 articles remained in the review. The 26 studies consisted of 15 cohort studies, 5 case–control studies, 5 RCTs, and 1 qualitative interview. Twenty-two of the articles were published in the US, the other 4 in Australia and Iran (2 each).11-14 All 26 studies used the teach-back method with other educational interventions to reinforce learning (eg, the method was used after heart failure or DM education). Of the 26 studies, 10 used a pretest–posttest intervention design,15-24 and 10 used a quasi-experimental or experimental design.11,13,14,25-31
Results
The common outcome measures used in the 26 studies fall into 5 categories: patient satisfaction; postdischarge readmission; patient perception of teach-back method effectiveness; disease knowledge and disease management improvements; and intervention effects on health-related quality of life (HR-QOL). A summary of included articles, study setting, design, outcomes, and details is available from the author.
Patient Satisfaction
Ten studies examined the impact of the teach-back method on patient satisfaction.15,17,19,21,23,26,27,29,31,32 Of these 10 studies, 6 explored the influence of the method on Hospital Consumer Assessment of Healthcare Providers and Systems survey scores.15,17,19,21,22,26 All included studies indicated improved satisfaction with medication education, discharge information, and health management—except for the Silva study, who found an upward trend but not a statistically significant improvement in patient understanding of the purpose of a medication.23
Grice and colleagues also found that community-dwelling seniors expressed satisfaction with using the teach-back method while being evaluated and assessed for health services at home.32 Improvement or a positive trend in teach-back groups was reported in a majority of the studies except for those by Hyrkas and Wiggins, and Griffey and colleagues.27,29 Hyrkas and Wiggins found the method slightly improved patients’ medication confidence after hospital discharge, though patient satisfaction scores were associated with patient–nurse relationships, not with use of the teach-back method and a motivational interview.27 Similarly, Griffey and colleagues found that patients who had limited health literacy and received a standard discharge with teach-back scored higher on medication comprehension, compared with patients who received only a standard discharge, but there was no difference in patient satisfaction after an ED visit.29
Postdischarge Readmission
Results emphasized the importance of teach-back in reinforcing discharge instructions and improving postdischarge readmission rates. Of the 6 studies on the effect that teach-back with discharge summary had on readmission rates, 2 found statistically significant improvement for patients with heart failure at 12 months (teach-back, 59%; non-teach-back, 44%; P = .005) and patients with coronary artery bypass grafting (CABG) at 30 days (preintervention, 25%; postintervention, 12%; P = .02).11,16 In addition, 3 of the 6 studies reported improvement but did not provide P values.18,20,22 One study indicated improvement in other measured outcomes but found no significant difference for patients who received teach-back with their discharge summaries.27 In all studies, teach-back was added to an intervention and used to confirm and promote knowledge and self-care management.
Patient Perception of Teach-Back Effectiveness
In 2 qualitative studies, patients indicated teach-back was an effective educational method.16,33 For patients with CABG, Bates and colleagues added a scheduled cardiology follow-up appointment and teach-back patient education to their State Action on Avoidable Rehospitalizations interventions; 96% of participants rated teach-back effective or highly effective.16 In the other study, Samuels-Kalow and colleagues interviewed 51 patients and parents who received teach-back as part of the discharge process in 2 EDs; participants indicated teach-back helped them remember what they learned from their HCPs, and gave them the opportunity to connect with their HCPs, though some with lower health literacy expressed concerns about perceived judgment by HCPs.33
Disease Knowledge and Management
Thirteen studies examined knowledge improvement after interventions that included teach-back. Study participants answered most questions correctly after receiving teach-back.20,32,34,35 Slater and colleagues found ED patients who received discharge instructions with teach-back had significantly higher scores measuring knowledge of diagnosis (P < .001), signs and symptoms indicating a need to return to the ED (P < .001), and follow-up instructions (P = .03); scores measuring knowledge of medication were higher as well, but were not statistically different (P = .14).24 In multiple studies, improvement was not always statistically significant in terms of knowledge retention.12,25,29-31,36 Studies that compared medication adherence found teach-back was more effective than motivational interviews (P = .56).27
Teach-back has been widely used in primary care, inpatient, and ED settings. Two studies on the effect of teach-back in primary care sampled patients with DM.28,36 Kandula and colleagues found that participants who answered questions incorrectly after watching a multimedia DM education program could significantly improve their DM knowledge by engaging in teach-back immediately after the intervention; however, knowledge retention was not improved at 2-week follow-up (phone call).28 In contrast, Swavely and colleagues compared patients who completed a 13-hour DM education program with or without teach-back and found that teach-back patients demonstrated significantly improved DM knowledge and self-care activities at 3 months.36
Effects of Interventions on HR-QOL
The teach-back method had been used with QOL improvement programs and other interventions. Ahmadidarrehsima and colleagues incorporated teach-back into their medical self-management program (8 to 11 sessions, each lasting 1.5 to 2 hours) for women with breast cancer and found that the mean happiness score increased to 62.9 from 37.2 (P < .001) in the intervention group, whereas the score for the usual-care group decreased from 41.4 to 29.8.13 Ghiasvand and colleagues compared QOL of postpartum mothers who received routine care with QOL of those who received routine care plus 2 sessions of postpartum self-care with teach-back; mean QOL scores were significantly (P < .001) higher for the teach-back group (124.73) than for the no teach-back group (115.03).14
Discussion
This review examined the use and effectiveness of the teach-back method in health education and its influence in patients’ disease self-management and health outcomes. Results showed positive effects of teach-back on patient satisfaction, patient perceptions and acknowledgments, postdischarge readmissions, disease self-management and knowledge, and HR-QOL.
The teach-back method has been widely used in inpatient, outpatient, ED, and community settings as part of health education programs and interventions. It has been paired with educational interventions ranging from short instructions to 20-hour programs. These differences reflect the broad application of the method in patient education. Many studies have found that teach-back improves disease knowledge and self-management, though their results are not always statistically significant. In an RCT of patients with low health literacy, Griffey and colleagues studied the effect of ED discharge education with and without teach-back and found teach-back did not increase post-ED comprehension of diagnoses, medical examinations, and treatments or perceived comprehension of treatment and care; however, compared with the no teach-back group, the teach-back group had significantly higher scores on comprehension of post-ED self-care (P < .02), follow-up (P < .0001), and medication (P = .054).29 This finding indicates teach-back is an effective method for helping patients understand self-care and disease self-management at home.
Comprehending medical diagnoses, examinations, and treatments involves acquiring, analyzing, and comparing multiple pieces of health information. Because comprehension requires a level of abstract thinking usually present in patients with intermediate and proficient health literacy,improvements might be more difficult to see in patients with low health literacy.8 Press and colleagues found that asthma patients who repeated respiratory inhaler instructions with teach-back during discharge education had less misuse of (P = .01) metered-dose and Diskus (P = .05) inhalers and lower 30-day readmission rates (P = .02) compared with the misuse of patients who received only 1 set of oral and written instructions.31 Even though the Diskus result was not statistically significant, it demonstrated teach-back can be used to improve patient self-care and education.31
Most participants in the reviewed studies improved their disease knowledge with teach-back, though the evidence regarding improved health care knowledge retention was limited. For example, the 2 studies on use of teach-back in primary care clinics had contradictory knowledge retention results.28,36 As both studies incorporated teach-back into existing interventions, these results could be associated with those interventions and not with the teach-back method.
Health literacy is achieved through a complicated process of obtaining, analyzing, choosing, and communicating health information. Even though its knowledge retention results are inconsistent, the teach-back method is recommended by the American Academy of Family Physicians at strength of recommendation taxonomy level C.8 Such a designation indicates that the recommendation is based on expert opinion, bench research, consensus guideline, usual practice, clinical experience, or a case series and is appropriate for assessment of patient comprehension.37 Teach-back is also suggested by AHRQ and IHI for university precautions regarding health literacy and as such should remain a standard of practice. More study is needed to understand the inconsistent results of knowledge retention and the long-term effects of the teach-back method.
Limitations
Although this review did not limit the publication years of its articles, no pre-2011 articles were found. The teach-back method has been used to measure patients’ postintervention understanding and to educate HCPs on ways to improve patient communication. As this review did not include studies of teach-back as an outcome measurement or studies of training and adaptation of teach-back in HCP or nurse education, other study results may have a bearing on the current findings. Teach-back has been used to close communication gaps between patients and HCPs.
All articles included in this review used the teach-back method with other educational or organizational interventions. The outcomes found in this review may be associated with those interventions and not with teach-back itself. Data reported here have not demonstrated a definite association between teach-back and the measured outcomes; therefore, caution should be exercised when drawing conclusions based on these data. In addition, most of the studies considered in this review were cohort or case–control studies; only 5 RCTs were included. Other confounding factors, including patient health literacy levels, HCP types, HCP competencies in use of teach-back, and type and duration of interventions used before teach-back, may have contributed to this review’s findings.
Conclusion
Findings of this systematic review support use of the teach-back method as effective in reinforcing or confirming patient education. As none of the included studies reported harmful outcomes, the teach-back method poses little risk with respect to increasing patients’ understanding of their education. The findings emphasize the importance of conducting more studies to try to understand the inconsistent results of knowledge retention and determine ways to preserve the long-term effects of teach-back.
1. Zavala S, Shaffer C. Do patients understand discharge instruction? J Emerg Nurs. 2011;37(2):138-140.
2. Engel KG, Heisler M, Smith DM, Robinson CH, Forman JH, Ubel PA. Patient comprehension of emergency department care and instructions: are patients aware of when they do not understand? Ann Emerg Med. 2009;53(4):454-461.
3. Kessels RP. Patients’ memory for medical information. J R Soc Med. 2003;96(5):219-222.
4. Coulter A. Patient engagement—what works? J Ambul Care Manage. 2012;35(2):80-89.
5. Rees S, Williams A. Promoting and supporting self-management for adults living in the community with physical chronic illness: a systematic review of the effectiveness and meaningfulness of the patient–practitioner encounter. JBI Libr Syst Rev. 2009;7(13):492-582.
6. Somers SA, Mahadevan R. Health Literacy Implications of the Affordable Care Act. https://www.chcs.org/media/Health_Literacy_Implications_of_the_Affordable_Care_Act.pdf. Published November 2010. Accessed May 9, 2019.
7. US Department of Health and Human Services, Office of Disease Prevention and Health Promotion. America’s Health Literacy: Why We Need Accessible Health Information [issue brief]. https://health.gov/communication/literacy/issuebrief. Published 2008. Accessed May 9, 2019.
8. Hersh L, Salzman B, Snyderman D. Health literacy in primary care practice. Am Fam Physician. 2015;92(2):118-124.
9. Always Use Teach-back! [training toolkit]. http://www.teachbacktraining.org. Accessed May 9, 2019.
10. Taylor SG, Renpenning K. Self-Care Science, Nursing Theory and Evidence Based Practice. New York, NY: Springer; 2011.
11. Boyde M, Peters R, New N, Hwang R, Ha T, Korczyk D. Self-care educational intervention to reduce hospitalisations in heart failure: a randomised controlled trial. Eur J Cardiovasc Nurs. 2018;17(2):178-185.
12. Goeman D, Conway S, Norman R, et al. Optimising health literacy and access of service provision to community dwelling older people with diabetes receiving home nursing support. J Diabetes Res. 2016;2016:2483263.
13. Ahmadidarrehsima S, Rahnama M, Afshari M, Asadi Bidmeshki E. Effectiveness of teach-back self-management training program on happiness of breast cancer patients. Asian Pac J Cancer Prev. 2016;17(10):4555-4561.
14. Ghiasvand F, Riazi H, Hajian S, Kazemi E, Firoozi A. The effect of a self-care program based on the teach back method on the postpartum quality of life. Electron Physician. 2017;9(4):4180-4189.
15. Ahrens SL, Wirges AM. Using evidence to improve satisfaction with medication side-effects education on a neuro-medical surgical unit. J Neurosci Nurs. 2013;45(5):281-287.
16. Bates OL, O’Connor N, Dunn D, Hasenau SM. Applying STAAR interventions in incremental bundles: improving post-CABG surgical patient care. Worldviews Evid Based Nurs. 2014;11(2):89-97.
17. Gillam SW, Gillam AR, Casler TL, Curcio K. Education for medications and side effects: a two part mechanism for improving the patient experience. Appl Nurs Res. 2016;31:72-78.
18. Green UR, Dearmon V, Taggart H. Improving transition of care for veterans after total joint replacement. Orthop Nurs. 2015;34(2):79-86.
19. Kelly AM, Putney L. Teach back technique improves patient satisfaction in heart failure patients. Heart Lung. 2015;44(6):556-557.
20. Peter D, Robinson P, Jordan M, Lawrence S, Casey K, Salas-Lopez D. Reducing readmissions using teach-back: enhancing patient and family education. J Nurs Adm. 2015;45(1):35-42.
21. Price KA. Teach-Back Effect on Self-Reported Understanding of Health Management After Discharge. Minneapolis, MN: Walden University; 2014.
22. LeBreton M. Implementation of a Validated Health Literacy Tool With Teach-Back Education in a Super Utilizer Patient Population. Chester, PA: Widener University; 2015.
23. Silva LA. Teach-Back Effects on Self-Reported Understanding of Medication Management After Discharge. Minneapolis, MN: Walden University; 2014.
24. Slater BA, Huang Y, Dalawari P. The impact of teach-back method on retention of key domains of emergency department discharge instructions. J Emerg Med. 2017;53(5):e59-e65.
25. Betts V. Implementing a Discharge Process Change Using the Teach-Back Method for COPD Patients. Jersey City, NJ: Saint Peter’s University; 2014.
26. Centrella-Nigro AM, Alexander C. Using the teach-back method in patient education to improve patient satisfaction. J Contin Educ Nurs. 2017;48(1):47-52.
27. Hyrkas K, Wiggins M. A comparison of usual care, a patient-centred education intervention and motivational interviewing to improve medication adherence and readmissions of adults in an acute-care setting. J Nurs Manag. 2014;22(3):350-361.
28. Kandula NR, Malli T, Zei CP, Larsen E, Baker DW. Literacy and retention of information after a multimedia diabetes education program and teach-back. J Health Commun. 2011;16(suppl 3):89-102.
29. Griffey RT, Shin N, Jones S, et al. The impact of teach-back on comprehension of discharge instructions and satisfaction among emergency patients with limited health literacy: a randomized, controlled study. J Commun Healthc. 2015;8(1):10-21.
30. Negarandeh R, Mahmoodi H, Noktehdan H, Heshmat R, Shakibazadeh E. Teach back and pictorial image educational strategies on knowledge about diabetes and medication/dietary adherence among low health literate patients with type 2 diabetes. Prim Care Diabetes. 2013;7(2):111-118.
31. Press VG, Arora VM, Shah LM, et al. Teaching the use of respiratory inhalers to hospitalized patients with asthma or COPD: a randomized trial. J Gen Intern Med. 2012;27(10):1317-1325.
32. White M, Garbez R, Carroll M, Brinker E, Howie-Esquivel J. Is “teach-back” associated with knowledge retention and hospital readmission in hospitalized heart failure patients? J Cardiovasc Nurs. 2013;28(2):137-146.
33. Grice GR, Tiemeier A, Hurd P, et al. Student use of health literacy tools to improve patient understanding and medication adherence. Consult Pharm. 2014;29(4):240-253.
34. Samuels-Kalow M, Hardy E, Rhodes K, Mollen C. “Like a dialogue”: Teach-back in the emergency department. Patient Educ Couns. 2016;99(4):549-554.
35. Wilson FL, Mayeta-Peart A, Parada-Webster L, Nordstrom C. Using the teach-back method to increase maternal immunization literacy among low-income pregnant women in Jamaica: a pilot study. J Pediatr Nurs. 2012;27(5):451-459.
36. Swavely D, Vorderstrasse A, Maldonado E, Eid S, Etchason J. Implementation and evaluation of a low health literacy and culturally sensitive diabetes education program. J Healthc Qual. 2014;36(6):16-23.
37. Ebell MH, Siwek J, Weiss BD, et al. Strength of recommendation taxonomy (SORT): a patient-centered approach to grading evidence in the medical literature. Am Fam Physician. 2004;69(3):548-556.
Studies have shown that a majority of patients remain confused about their health care plans after being discharged from the hospital.1,2 Furthermore, most patients do not recognize their lack of comprehension.2 A substantial proportion of medical information is forgotten immediately after discharge. Kessels found that when larger amounts of information were presented, less was recalled, and almost half of the recalled information was incorrect.3 Researchers also have found that health information that was focused on individual needs not only increased patients’ understanding of their health needs and improved their health literacy, but supported self-management and promoted health outcomes for adults with chronic illness.4,5
Health literacy is the “capacity to obtain, process, and understand basic health information and services needed to make appropriate health decisions.”6 To read instructions on a prescription bottle, patients need an intermediate level of health literacy. Even for patients with such a level of health literacy, comprehending and managing a health care plan for a chronic disease can be challenging. About 35% of Americans had lower than an intermediate level of health literacy.7 Insufficient health literacy is associated with increased health system use and costs, health disparities, and poor health outcomes.8 As a result, it is crucial to gear oral instructions to patients’ health literacy levels to ensure that patients understand health information and instructions and perform self-care at home. The teach-back method, a technique for verifying patients’ understanding of their health information, has been recommended by the Agency for Healthcare Research and Quality (AHRQ) and the Institute for Healthcare Improvement (IHI) as a strategy for taking universal precautions for health literacy. Patients are asked to repeat the instructions they receive from their health care professionals (HCPs). HCPs should use caring and plain language in a shame-free environment during patient education. By using the teach-back method, HCPs can assess patients’ understanding, and reteach or modify teaching if comprehension is not demonstrated. Patients have an important role in their health and their ability to understand health information has a significant impact on their health behavior and outcomes.
In our systematic research, we examined the effectiveness of using the teach-back method to understand health education as well as the impact of this method on patients’ disease self-management and health outcomes.
Methods
In the teach-back method, patients explain health information in their own words.9 To gauge the use and effectiveness of this method, investigators have studied patient perceptions and acknowledgments of the method as well as the effects of the method on health interventions. According to Dorothea Orem’s self-care deficit nursing theory, disease self-management is an “executive ability” to “control, handle, direct or govern” self-care activities.10 We define disease self-management as disease knowledge and disease management changes that promote self-care activities. In addition, we define health outcomes as health changes that result from the teach-back method, such as changes in postdischarge readmission rates, patient satisfaction, and health behavior.
Inclusion Criteria
We systematically reviewed evidence regarding the teach-back method as an educational intervention for patients aged ≥ 18 years. We included articles if they reported the process and outcomes of using the method alone or in combination with other educational strategies. The literature search focused on English-language articles published in peer-reviewed journals. Included in the review were qualitative, randomized controlled trials (RCTs); quasi-experimental studies; cohort studies; and pretest–posttest studies on the effects of the teach-back method. As the method can be applied in any health care setting, we used studies conducted in a variety of settings, including primary care, inpatient, outpatient, emergency department (ED), and community, in any time frame. Study participants had heart failure, diabetes mellitus (DM), hypertension, asthma, or other chronic diseases.
Exclusion Criteria
Studies that used the teach-back method as an outcome measurement but not an intervention were excluded. For example, those that used the method to measure patients’ postintervention understanding were excluded. Also excluded were those that used the method to examine HCP training or to measure HCP outcomes (ie, studies that did not use the method for patient education or outcomes).
Literature Search
In September 2017, we searched 4 databases: Ovid Medline, PubMed, EBSCO (Elton B. Stephens Co), CINAHL (Cumulative Index to Nursing and Allied Health Literature), and ProQuest. Also included were relevant studies from cited reference searching (Figure).
This systematic review followed the PRISMA (Preferred Reporting Items for Systematic Reviews and Meta-Analyses) guideline for searches and formatting results. The literature search was performed with the term teach-back and terms from the structured PICO (population, intervention, comparison, outcomes) statement. The study population consisted of patients who received the teach-back intervention as part of the patient education process in a medical care setting, and the comparator population consisted of patients who did not receive the intervention in their patient education. Target outcomes were disease self-management, self-care, patient satisfaction, patient perception and acknowledgment of the teach-back method, and other health outcomes.
Data Collection
Data collected included authors, publication date, and journal; purpose; study design; setting, sample, and population; intervention; and outcomes.
The methodologic quality of papers retrieved for review was determined with Critical Appraisals Skills Programme (CASP) guidelines (casp-uk.net/casp-tools-checklists). CASP randomised controlled trial, cohort study, case control study, and qualitative checklists were used. The authors assessed the full texts for eligibility. Disagreements were resolved through discussion.
The initial literature search found 112, 135, and 161 articles from EBSCO CINAHL, Ovid Medline, and PubMed, respectively. Five articles from ProQuest were identified through the EBSCO CINAHL search. After inclusion and exclusion criteria were applied, duplicate articles removed, a cited reference added, and CASP criteria assessed, 26 articles remained in the review. The 26 studies consisted of 15 cohort studies, 5 case–control studies, 5 RCTs, and 1 qualitative interview. Twenty-two of the articles were published in the US, the other 4 in Australia and Iran (2 each).11-14 All 26 studies used the teach-back method with other educational interventions to reinforce learning (eg, the method was used after heart failure or DM education). Of the 26 studies, 10 used a pretest–posttest intervention design,15-24 and 10 used a quasi-experimental or experimental design.11,13,14,25-31
Results
The common outcome measures used in the 26 studies fall into 5 categories: patient satisfaction; postdischarge readmission; patient perception of teach-back method effectiveness; disease knowledge and disease management improvements; and intervention effects on health-related quality of life (HR-QOL). A summary of included articles, study setting, design, outcomes, and details is available from the author.
Patient Satisfaction
Ten studies examined the impact of the teach-back method on patient satisfaction.15,17,19,21,23,26,27,29,31,32 Of these 10 studies, 6 explored the influence of the method on Hospital Consumer Assessment of Healthcare Providers and Systems survey scores.15,17,19,21,22,26 All included studies indicated improved satisfaction with medication education, discharge information, and health management—except for the Silva study, who found an upward trend but not a statistically significant improvement in patient understanding of the purpose of a medication.23
Grice and colleagues also found that community-dwelling seniors expressed satisfaction with using the teach-back method while being evaluated and assessed for health services at home.32 Improvement or a positive trend in teach-back groups was reported in a majority of the studies except for those by Hyrkas and Wiggins, and Griffey and colleagues.27,29 Hyrkas and Wiggins found the method slightly improved patients’ medication confidence after hospital discharge, though patient satisfaction scores were associated with patient–nurse relationships, not with use of the teach-back method and a motivational interview.27 Similarly, Griffey and colleagues found that patients who had limited health literacy and received a standard discharge with teach-back scored higher on medication comprehension, compared with patients who received only a standard discharge, but there was no difference in patient satisfaction after an ED visit.29
Postdischarge Readmission
Results emphasized the importance of teach-back in reinforcing discharge instructions and improving postdischarge readmission rates. Of the 6 studies on the effect that teach-back with discharge summary had on readmission rates, 2 found statistically significant improvement for patients with heart failure at 12 months (teach-back, 59%; non-teach-back, 44%; P = .005) and patients with coronary artery bypass grafting (CABG) at 30 days (preintervention, 25%; postintervention, 12%; P = .02).11,16 In addition, 3 of the 6 studies reported improvement but did not provide P values.18,20,22 One study indicated improvement in other measured outcomes but found no significant difference for patients who received teach-back with their discharge summaries.27 In all studies, teach-back was added to an intervention and used to confirm and promote knowledge and self-care management.
Patient Perception of Teach-Back Effectiveness
In 2 qualitative studies, patients indicated teach-back was an effective educational method.16,33 For patients with CABG, Bates and colleagues added a scheduled cardiology follow-up appointment and teach-back patient education to their State Action on Avoidable Rehospitalizations interventions; 96% of participants rated teach-back effective or highly effective.16 In the other study, Samuels-Kalow and colleagues interviewed 51 patients and parents who received teach-back as part of the discharge process in 2 EDs; participants indicated teach-back helped them remember what they learned from their HCPs, and gave them the opportunity to connect with their HCPs, though some with lower health literacy expressed concerns about perceived judgment by HCPs.33
Disease Knowledge and Management
Thirteen studies examined knowledge improvement after interventions that included teach-back. Study participants answered most questions correctly after receiving teach-back.20,32,34,35 Slater and colleagues found ED patients who received discharge instructions with teach-back had significantly higher scores measuring knowledge of diagnosis (P < .001), signs and symptoms indicating a need to return to the ED (P < .001), and follow-up instructions (P = .03); scores measuring knowledge of medication were higher as well, but were not statistically different (P = .14).24 In multiple studies, improvement was not always statistically significant in terms of knowledge retention.12,25,29-31,36 Studies that compared medication adherence found teach-back was more effective than motivational interviews (P = .56).27
Teach-back has been widely used in primary care, inpatient, and ED settings. Two studies on the effect of teach-back in primary care sampled patients with DM.28,36 Kandula and colleagues found that participants who answered questions incorrectly after watching a multimedia DM education program could significantly improve their DM knowledge by engaging in teach-back immediately after the intervention; however, knowledge retention was not improved at 2-week follow-up (phone call).28 In contrast, Swavely and colleagues compared patients who completed a 13-hour DM education program with or without teach-back and found that teach-back patients demonstrated significantly improved DM knowledge and self-care activities at 3 months.36
Effects of Interventions on HR-QOL
The teach-back method had been used with QOL improvement programs and other interventions. Ahmadidarrehsima and colleagues incorporated teach-back into their medical self-management program (8 to 11 sessions, each lasting 1.5 to 2 hours) for women with breast cancer and found that the mean happiness score increased to 62.9 from 37.2 (P < .001) in the intervention group, whereas the score for the usual-care group decreased from 41.4 to 29.8.13 Ghiasvand and colleagues compared QOL of postpartum mothers who received routine care with QOL of those who received routine care plus 2 sessions of postpartum self-care with teach-back; mean QOL scores were significantly (P < .001) higher for the teach-back group (124.73) than for the no teach-back group (115.03).14
Discussion
This review examined the use and effectiveness of the teach-back method in health education and its influence in patients’ disease self-management and health outcomes. Results showed positive effects of teach-back on patient satisfaction, patient perceptions and acknowledgments, postdischarge readmissions, disease self-management and knowledge, and HR-QOL.
The teach-back method has been widely used in inpatient, outpatient, ED, and community settings as part of health education programs and interventions. It has been paired with educational interventions ranging from short instructions to 20-hour programs. These differences reflect the broad application of the method in patient education. Many studies have found that teach-back improves disease knowledge and self-management, though their results are not always statistically significant. In an RCT of patients with low health literacy, Griffey and colleagues studied the effect of ED discharge education with and without teach-back and found teach-back did not increase post-ED comprehension of diagnoses, medical examinations, and treatments or perceived comprehension of treatment and care; however, compared with the no teach-back group, the teach-back group had significantly higher scores on comprehension of post-ED self-care (P < .02), follow-up (P < .0001), and medication (P = .054).29 This finding indicates teach-back is an effective method for helping patients understand self-care and disease self-management at home.
Comprehending medical diagnoses, examinations, and treatments involves acquiring, analyzing, and comparing multiple pieces of health information. Because comprehension requires a level of abstract thinking usually present in patients with intermediate and proficient health literacy,improvements might be more difficult to see in patients with low health literacy.8 Press and colleagues found that asthma patients who repeated respiratory inhaler instructions with teach-back during discharge education had less misuse of (P = .01) metered-dose and Diskus (P = .05) inhalers and lower 30-day readmission rates (P = .02) compared with the misuse of patients who received only 1 set of oral and written instructions.31 Even though the Diskus result was not statistically significant, it demonstrated teach-back can be used to improve patient self-care and education.31
Most participants in the reviewed studies improved their disease knowledge with teach-back, though the evidence regarding improved health care knowledge retention was limited. For example, the 2 studies on use of teach-back in primary care clinics had contradictory knowledge retention results.28,36 As both studies incorporated teach-back into existing interventions, these results could be associated with those interventions and not with the teach-back method.
Health literacy is achieved through a complicated process of obtaining, analyzing, choosing, and communicating health information. Even though its knowledge retention results are inconsistent, the teach-back method is recommended by the American Academy of Family Physicians at strength of recommendation taxonomy level C.8 Such a designation indicates that the recommendation is based on expert opinion, bench research, consensus guideline, usual practice, clinical experience, or a case series and is appropriate for assessment of patient comprehension.37 Teach-back is also suggested by AHRQ and IHI for university precautions regarding health literacy and as such should remain a standard of practice. More study is needed to understand the inconsistent results of knowledge retention and the long-term effects of the teach-back method.
Limitations
Although this review did not limit the publication years of its articles, no pre-2011 articles were found. The teach-back method has been used to measure patients’ postintervention understanding and to educate HCPs on ways to improve patient communication. As this review did not include studies of teach-back as an outcome measurement or studies of training and adaptation of teach-back in HCP or nurse education, other study results may have a bearing on the current findings. Teach-back has been used to close communication gaps between patients and HCPs.
All articles included in this review used the teach-back method with other educational or organizational interventions. The outcomes found in this review may be associated with those interventions and not with teach-back itself. Data reported here have not demonstrated a definite association between teach-back and the measured outcomes; therefore, caution should be exercised when drawing conclusions based on these data. In addition, most of the studies considered in this review were cohort or case–control studies; only 5 RCTs were included. Other confounding factors, including patient health literacy levels, HCP types, HCP competencies in use of teach-back, and type and duration of interventions used before teach-back, may have contributed to this review’s findings.
Conclusion
Findings of this systematic review support use of the teach-back method as effective in reinforcing or confirming patient education. As none of the included studies reported harmful outcomes, the teach-back method poses little risk with respect to increasing patients’ understanding of their education. The findings emphasize the importance of conducting more studies to try to understand the inconsistent results of knowledge retention and determine ways to preserve the long-term effects of teach-back.
1. Zavala S, Shaffer C. Do patients understand discharge instruction? J Emerg Nurs. 2011;37(2):138-140.
2. Engel KG, Heisler M, Smith DM, Robinson CH, Forman JH, Ubel PA. Patient comprehension of emergency department care and instructions: are patients aware of when they do not understand? Ann Emerg Med. 2009;53(4):454-461.
3. Kessels RP. Patients’ memory for medical information. J R Soc Med. 2003;96(5):219-222.
4. Coulter A. Patient engagement—what works? J Ambul Care Manage. 2012;35(2):80-89.
5. Rees S, Williams A. Promoting and supporting self-management for adults living in the community with physical chronic illness: a systematic review of the effectiveness and meaningfulness of the patient–practitioner encounter. JBI Libr Syst Rev. 2009;7(13):492-582.
6. Somers SA, Mahadevan R. Health Literacy Implications of the Affordable Care Act. https://www.chcs.org/media/Health_Literacy_Implications_of_the_Affordable_Care_Act.pdf. Published November 2010. Accessed May 9, 2019.
7. US Department of Health and Human Services, Office of Disease Prevention and Health Promotion. America’s Health Literacy: Why We Need Accessible Health Information [issue brief]. https://health.gov/communication/literacy/issuebrief. Published 2008. Accessed May 9, 2019.
8. Hersh L, Salzman B, Snyderman D. Health literacy in primary care practice. Am Fam Physician. 2015;92(2):118-124.
9. Always Use Teach-back! [training toolkit]. http://www.teachbacktraining.org. Accessed May 9, 2019.
10. Taylor SG, Renpenning K. Self-Care Science, Nursing Theory and Evidence Based Practice. New York, NY: Springer; 2011.
11. Boyde M, Peters R, New N, Hwang R, Ha T, Korczyk D. Self-care educational intervention to reduce hospitalisations in heart failure: a randomised controlled trial. Eur J Cardiovasc Nurs. 2018;17(2):178-185.
12. Goeman D, Conway S, Norman R, et al. Optimising health literacy and access of service provision to community dwelling older people with diabetes receiving home nursing support. J Diabetes Res. 2016;2016:2483263.
13. Ahmadidarrehsima S, Rahnama M, Afshari M, Asadi Bidmeshki E. Effectiveness of teach-back self-management training program on happiness of breast cancer patients. Asian Pac J Cancer Prev. 2016;17(10):4555-4561.
14. Ghiasvand F, Riazi H, Hajian S, Kazemi E, Firoozi A. The effect of a self-care program based on the teach back method on the postpartum quality of life. Electron Physician. 2017;9(4):4180-4189.
15. Ahrens SL, Wirges AM. Using evidence to improve satisfaction with medication side-effects education on a neuro-medical surgical unit. J Neurosci Nurs. 2013;45(5):281-287.
16. Bates OL, O’Connor N, Dunn D, Hasenau SM. Applying STAAR interventions in incremental bundles: improving post-CABG surgical patient care. Worldviews Evid Based Nurs. 2014;11(2):89-97.
17. Gillam SW, Gillam AR, Casler TL, Curcio K. Education for medications and side effects: a two part mechanism for improving the patient experience. Appl Nurs Res. 2016;31:72-78.
18. Green UR, Dearmon V, Taggart H. Improving transition of care for veterans after total joint replacement. Orthop Nurs. 2015;34(2):79-86.
19. Kelly AM, Putney L. Teach back technique improves patient satisfaction in heart failure patients. Heart Lung. 2015;44(6):556-557.
20. Peter D, Robinson P, Jordan M, Lawrence S, Casey K, Salas-Lopez D. Reducing readmissions using teach-back: enhancing patient and family education. J Nurs Adm. 2015;45(1):35-42.
21. Price KA. Teach-Back Effect on Self-Reported Understanding of Health Management After Discharge. Minneapolis, MN: Walden University; 2014.
22. LeBreton M. Implementation of a Validated Health Literacy Tool With Teach-Back Education in a Super Utilizer Patient Population. Chester, PA: Widener University; 2015.
23. Silva LA. Teach-Back Effects on Self-Reported Understanding of Medication Management After Discharge. Minneapolis, MN: Walden University; 2014.
24. Slater BA, Huang Y, Dalawari P. The impact of teach-back method on retention of key domains of emergency department discharge instructions. J Emerg Med. 2017;53(5):e59-e65.
25. Betts V. Implementing a Discharge Process Change Using the Teach-Back Method for COPD Patients. Jersey City, NJ: Saint Peter’s University; 2014.
26. Centrella-Nigro AM, Alexander C. Using the teach-back method in patient education to improve patient satisfaction. J Contin Educ Nurs. 2017;48(1):47-52.
27. Hyrkas K, Wiggins M. A comparison of usual care, a patient-centred education intervention and motivational interviewing to improve medication adherence and readmissions of adults in an acute-care setting. J Nurs Manag. 2014;22(3):350-361.
28. Kandula NR, Malli T, Zei CP, Larsen E, Baker DW. Literacy and retention of information after a multimedia diabetes education program and teach-back. J Health Commun. 2011;16(suppl 3):89-102.
29. Griffey RT, Shin N, Jones S, et al. The impact of teach-back on comprehension of discharge instructions and satisfaction among emergency patients with limited health literacy: a randomized, controlled study. J Commun Healthc. 2015;8(1):10-21.
30. Negarandeh R, Mahmoodi H, Noktehdan H, Heshmat R, Shakibazadeh E. Teach back and pictorial image educational strategies on knowledge about diabetes and medication/dietary adherence among low health literate patients with type 2 diabetes. Prim Care Diabetes. 2013;7(2):111-118.
31. Press VG, Arora VM, Shah LM, et al. Teaching the use of respiratory inhalers to hospitalized patients with asthma or COPD: a randomized trial. J Gen Intern Med. 2012;27(10):1317-1325.
32. White M, Garbez R, Carroll M, Brinker E, Howie-Esquivel J. Is “teach-back” associated with knowledge retention and hospital readmission in hospitalized heart failure patients? J Cardiovasc Nurs. 2013;28(2):137-146.
33. Grice GR, Tiemeier A, Hurd P, et al. Student use of health literacy tools to improve patient understanding and medication adherence. Consult Pharm. 2014;29(4):240-253.
34. Samuels-Kalow M, Hardy E, Rhodes K, Mollen C. “Like a dialogue”: Teach-back in the emergency department. Patient Educ Couns. 2016;99(4):549-554.
35. Wilson FL, Mayeta-Peart A, Parada-Webster L, Nordstrom C. Using the teach-back method to increase maternal immunization literacy among low-income pregnant women in Jamaica: a pilot study. J Pediatr Nurs. 2012;27(5):451-459.
36. Swavely D, Vorderstrasse A, Maldonado E, Eid S, Etchason J. Implementation and evaluation of a low health literacy and culturally sensitive diabetes education program. J Healthc Qual. 2014;36(6):16-23.
37. Ebell MH, Siwek J, Weiss BD, et al. Strength of recommendation taxonomy (SORT): a patient-centered approach to grading evidence in the medical literature. Am Fam Physician. 2004;69(3):548-556.
Evolving Sex and Gender in Electronic Health Records
Providing consistent and high-quality services to gender diverse patients is a top priority for health care systems, including the Veterans Health Administration (VHA).1 Over the past decade, awareness of transgender and gender nonconforming (TGNC) people in the US has increased. Gender identity refers to a person’s inner sense of where that person belongs on a continuum of masculine to androgynous to feminine traits. This identity range can additionally include nonbinary identifications, such as “gender fluid” or “genderqueer.” A goal of patient-centered care is for health care providers (HCPs) to refer to TGNC individuals, like their cisgender counterparts, according to their gender identity. Gender identity for TGNC individuals may be different from their birth sex. Birth sex, commonly referred to as “sex assigned at birth,” is the biologic and physiologic characteristics that are reflected on a person’s original birth certificate and described as male or female.
Background
In the electronic health record (EHR), birth sex is an important, structured variable that is used to facilitate effective patient care that is efficient, equitable, and patient-centered. Birth sex in an EHR often is used to cue automatic timely generation of health screens (eg, pap smears, prostate exams) and calculation of medication dosages and laboratory test ranges by adjusting for a person’s typical hormonal history and anatomy.
Gender identity fields are independently helpful to include in the EHR, because clinicians can use this information to ensure proper pronoun use and avoid misgendering a patient. Additionally, the gender identity field informs HCPs who may conduct more frequent or different health screenings to evaluate specific health risks that are more prevalent in gender minority (ie, lesbian, gay, bisexual) patients.2,3
EHRs rely on structured data elements to standardize data about patients for clinical care, quality improvement, data sharing, and patient safety.4,5 However, health care organizations are grappling with how to incorporate gender identity and birth sex information into EHRs.3 A 2011 Veterans Health Administration (VHA) directive required staff and providers to address and provide care to veterans based on their gender identity. Like other health systems, VHA had 1 demographic data field in the EHR to indicate birth sex, with no field for gender identity. A HCP could enter gender identity information into a progress note, but this addition might not be noticed by other HCPs. Consequently, staff and providers had no effective way of knowing a veteran’s gender identity from the EHR, which contributed to misgendering TGNC veterans.
With the singular demographic field of sex representing both birth sex and gender identity, some TGNC veterans chose to change their birth sex information to align with their gender identity. This change assured TGNC veterans that staff and providers would not misgender them because the birth sex field is easily observed and would allow providers to use respectful, gender-consistent pronouns when speaking with them. However, changing the birth sex field can misalign natal sex–based clinical reminders, medication dosages, and laboratory test values, which created potential patient safety risks. Thus, birth sex created potential hazards to quality and safety when used as a marker even with other variables—such as current anatomy, height, and weight—for health screenings, medication dosing, and other medical decisions.
In this article, we: (1) outline several patient safety issues that can arise with the birth sex field serving as an indicator for both birth sex and gender identity; (2) present case examples that illustrate the benefits of self-identified gender identity (SIGI) in an EHR; (3) describe the process of work-group development of patient-provider communication tools to improve patient safety; and (4) provide a brief overview of resources rolled out as a part of SIGI. This report serves as a guide for other federal organizations that wish to increase affirmative care and safe practices for transgender consumers. We will provide an overview of the tasks leading up to SIGI implementation, deliverables from the project, and lessons learned.
Veterans Affairs SIGI EHR Field
In 2016, the US Department of Veterans Affairs (VA) began implementing a SIGI demographic field across all EHRs, requiring administrative staff to ask enrolled and new veterans their gender identity (full implementation of SIGI has not yet occurred and will occur when a later EHR upgrade displays SIGI in the EHR). The initiation of SIGI did not change any information in the birth sex field, meaning that some veterans continue to have birth sex field information that results in problematic automatic medical reminders and dosing values. Consequently, the National Center for Patient Safety (NCPS) noted that this discrepancy may be a pertinent patient safety issue. The NCPS and Lesbian, Gay Bisexual, and Transgender (LGBT) Health national program offices worked to provide documentation to TGNC veterans to inform them of the clinical health care implications of having their birth sex demographic field reflect gender identity that is inconsistent with their natal sex (ie, original birth certificate record of sex).
Patient Safety Issues
Conversations between transgender patients and their HCPs about transition goals, necessary medical tests, and laboratory ranges based on their current anatomy and physiology can improve patient safety and satisfaction with medical care. Prior to the availability of the SIGI field, VA facilities varied in their documentation of gender identity in the patient chart. LGBT veteran care coordinators discussed diverse suggestions that ranged from informally documenting SIGI in each progress note to using flags to draw attention to use certain sections of local EHRs. These suggestions, though well intentioned, were not adequate for documenting gender identity at the national level because of regional variations in EHR customization options. Furthermore, the use of flags for drawing clinical attention to gender identity posed a potential for stigma toward patients, given that flags are typically reserved for behavioral or other risk concerns.
Several problems can emerge when HCPs are not equipped with accurate information about patient birth sex and SIGI. For instance, TGNC patients lack a way of being known from clinic to clinic by proper pronouns or self-labels. Providers may misgender veterans, which is a negative experience for TGNC veterans linked with increased barriers to care and decreased frequency of health care visits.4 Moreover, the quality and personalization of care across clinic locations in the facility’s system is variable without a consistent method of documenting birth sex and SIGI. For example, in clinics where the veteran is well known (eg, primary care), staff may be more affirming of the veteran’s gender identity than those in specialty care clinics that lack prior patient contact.
Furthermore, depending on hormone and surgical interventions, some health screenings may be irrelevant for TGNC patients. To determine appropriate health screens and assess potential risks associated with hormone therapy, providers must have access to current information regarding a patient’s physiologic anatomy.6 Health screenings and laboratory results in sophisticated EHRs (ie, EHRs that might autodetermine normative values) may populate incorrect treatment recommendations, such as sex-based medication dosages. Furthermore, laboratory test results could be incorrectly paired with a different assumed hormonal history, potentially putting the patient at risk.
Case Examples
An important element of EHRs facilitating the goal of patient-centered care is that patients have their EHR validate their sense of self, and their providers can use names and pronouns that correspond to the patient’s SIGI. Some patients have spent a great amount of effort altering their name and sex in legal records and may want their birth sex field to conform to their gender identity. To that end, patients may seek to alter their birth sex information so that it is congruent with how they see themselves to affirm their identity, despite patient safety risks. Several scenarios below demonstrate the potential costs and benefits to patients altering birth sex and SIGI in the EHR.
Case 1 Presentation
A young transman is working with his therapist on engaging in self-validating behaviors. This veteran has met with his PCP and informed the provider of his decision to alter the birth sex field in his EHR from female to male.
Ideally, the patient would begin to have regular conversations with his HCPs about his birth sex and gender identity, so that medical professionals can provide relevant screenings and affirm the patient’s gender identity while acknowledging his right to list his birth sex as he chooses. However, particular attention will need to be paid to assuring that natal sex–based health screenings (eg, pap smears, mammograms) are conducted on an appropriate schedule and that the veteran continues to discuss his current anatomy with providers.
Case 2 Presentation
A veteran has a male birth sex, identifies as a transwoman, and uses nongendered plural pronouns “they/them/theirs.” The word “they,” used as a singular pronoun may feel uncomfortable to some providers, but it validates the veteran’s sense of self and helps them feel welcome in the treatment environment. This patient communicated proactively with their HCPs about their transition goals and current hormone use.
They opted to have their birth sex field continue to indicate “male” because they, after a discussion with their PCP, are aware of the health implications of receiving an incorrect dose for their diabetes medication. They understand that having open communication and receiving input from their HCPs is part of good health care.
Case 3 Presentation
A patient with a sexual development disorder (intersex condition) identifies as a man (indicated as “male” in the SIGI field) and had his birth sex field changed to match his gender identity. He now seeks to change his birth sex field back to female, as he has complicated health considerations due to breast cancer.
The veteran thinks it is important that providers know about his intersex condition so that his breast cancer care is as seamless as possible. In particular, although this veteran is comfortable talking about his intersex condition and his identity with his PCP and oncologist, he wants to ensure that all people involved in his care (eg, pharmacists, radiologists) use the correct values in interpreting his medical data. Providers will need to use the female birth sex field for interpreting his medical data but use male pronouns when interacting with the veteran and documenting his care.
These case examples illustrate the need for HCPs to have patient-affirming education and appropriate clinical tools available when speaking to patients about birth sex, SIGI, and the implications of changing birth sex in the EHR. Moreover, these cases highlight that patient health needs may vary over time, due to factors such as perceived costs/benefits of a change in the sex field of the EHR as well as patient comfort with providers.
Current Status of SIGI and EHR
Although having separate fields for birth sex and SIGI in the EHR is ideal, the VHA does not yet have a fully functional SIGI field, and several TGNC veterans have changed their birth sex field to align with their gender identity. Roughly 9,700 patients have diagnostic codes related to transgender care in the VHA, meaning thousands of current patients would potentially benefit from SIGI implementation (John Blosnich, written communication, March 2018). A possible action that the VHA could take with the goal of enhancing patient safety would be to revert the birth sex field of patients who had previously changed the field back to the patient’s original birth sex. However, if this alteration to the EHR were done without the patient’s consent, numerous additional problems would result—including invalidating a veteran’s wishes—potentially driving patients away from receiving health care.
Moreover, in the absence of updated SIGI information (which only the veteran can provide), making a change in the EHR would perpetuate the misgendering of TGNC veterans who have already sought an administrative fix for this problem. Thus, the agency decided to engage patients in a discussion about their decision to keep the birth sex field consistent with their original birth certificate. In cases in which the field had been changed previously, the recommendation is for HCPs to gain patient consent to change the birth sex field back to what was on their original birth certificate. Thus, decisions about what should be listed in the EHR are made by the veteran using an informed decision-making model.
Patient Safety Education Workgroup
To begin the process of disentangling birth sex and SIGI fields in the EHR, 2 work groups were created: a technical work group (coding the patches for SIGI implementation) and a SIGI patient safety education work group. The patient safety education work group was committed to promoting affirmative VA policies that require validation of the gender identity of all veterans and pursuing best practices through clinical guidelines to promote effective, efficient, equitable, and safe veteran care. The patient safety education work group included representatives from all 3 branches of the VA (VHA, Veterans Benefits Administration, and National Cemetery Administration), including clinical media, patient safety, information technology, and education specialists. The group developed trainings for administrative staff about the appropriate ways to ask birth sex and SIGI questions, and how to record veteran-driven responses.
SIGI Fact Sheet
The patient safety education work group examined clinical literature and developed tools for staff and veterans to facilitate effective discussions about the importance and utility of documenting both birth sex and SIGI in the EHR. The patient safety education work group along with media and educational experts created basic key term definition documents to address the importance, purpose, and use of the SIGI field. The patient safety education work group developed 2 documents to facilitate communication between patients and providers.

A 1-page veteran-facing fact sheet was developed that described the differences between birth sex and SIGI fields and how these fields are used in the VA EHR system (Figure 1). In addition, a 1-page HCP-facing fact sheet was designed to inform HCPs that patients may have changed their birth sex in their EHR or might still wish to change their birth sex field, and to inform HCPs of the importance of patient-centered, gender-affirmative care (Figure 2). An additional goal of both documents was to educate veterans and HCPs on how the EHR automatically calculates laboratory results and screening notifications based on birth sex.
Review Process
As part of reviewing and finalizing the SIGI patient fact sheet, the patient safety education work group previewed the document’s content with veterans who provided feedback on drafts to improve comprehension, patient-centered care, and clinical accuracy. For instance, several patients commented that the document should address many gender identities, including intersex identities. As noted in one of the case presentations earlier, individuals who identify as intersex may have changed their birth sex to be consistent with their gender and might benefit from being informed about the EHR’s autocalculation feature. The patient safety education work group adjusted the SIGI patient fact sheet to include individuals who identify as intersex and instructed them to have a conversation with their HCP regarding potential birth sex changes in the EHR.

Much of the veteran feedback to the patient safety education work group reflected veteran concerns, more broadly, about implementation of SIGI. Many veterans were interested in how federal policy changes might affect their benefits package or clinical care within the VA. The SIGI patient fact sheet was a tool for communicating that Department of Defense (DoD) policies, specifically, do not have a bearing on VA care for LGBT veterans. Therefore, SIGI information does not affect service connection or benefits eligibility and is not shared with the DoD. Veterans found this information helpful to see reflected in the SIGI patient fact sheet.
The patient safety education work group also shared the SIGI provider fact sheet with VHA providers before finalizing the content. PCPs gave feedback to improve the specification of patient safety concerns and appropriate readership language. The patient safety education work group adjusted the SIGI provider fact sheet to be inclusive of relevant literature and an e-consultation link for assisting HCPs who are unsure how to proceed with a patient.
Implementation
The patient safety education work group also developed several materials to provide information about the birth sex and SIGI fields in the EHR. Because the SIGI demographic field is new and collected by clerical staff, training was necessary to explain the difference between birth sex and SIGI before implementation in the EHR. The training sessions educated staff about the difference between birth sex and SIGI, how to ask and respond to questions respectfully, and how to update these fields in the EHR. These trainings included a 20-minute video demonstrating best practices for asking about SIGI, a frequently asked questions document responding to 7 common questions about the new fields, and a quick reference guide for administrative staff to have handy at their desks.
Dissemination of the SIGI patient and provider fact sheets is planned to occur, ideally, several weeks before implementation of the new patches updating the EHR fields in spring 2020. Building on existing resources, the patient safety education work group plans to disseminate the patient fact sheets via e-mail lists for the national mental health facility leaders as well as through e-mail lists for VA PCPs, nursing and clerical staff, privacy officers, facility LGBT veteran care coordinators, VISN leads, transgender e-consultation, the Office of Connected Care, the LGBT external homepage for the VA, and the training website for VA employees. The goal is to target potential points of contact for veterans who may have already changed their birth sex and might benefit medically from altering birth sex to be consistent with their original birth certificate.
The SIGI provider fact sheet will be disseminated using internal e-mails, announcements on routine LGBT veteran care coordinator calls, weekly Ask LGBT Health teleconferences, and announcements at LGBT health training events both internally and externally. Several dissemination tools have already ensured that VA employees are aware of the SIGI field in the EHR. Leadership throughout the VA will be encouraged to share SIGI trainings with clerical staff. Additionally, broad-based e-mails summarizing changes to the EHR will be provided concurrent to the SIGI patch implementation to VA staff as well as links to the resources and training materials.
Challenges
One difficulty in the development process for both SIGI fact sheets was addressing the issue of patient safety for veterans who may be at different points in their gender transition process. It was challenging for the patient safety education work group to not sound alarmist in discussing the safety implications of birth sex changes in the EHR, as this is just one factor in clinical decision making. The goal was to educate veterans from a patient safety perspective about the implications of having a state-of-the-art, automated EHR. However, text can be perceived differently by different people, which is why the patient safety education work group asked veterans to preview the patient document and clinical providers to preview the provider document.
Both work groups encountered technologic challenges, including a delay in the implementation of the SIGI field due to a systemwide delay of EHR updates. Although it released training and educational materials to the VHA, the patient safety education work group understood that at some point in the future, VA programmers will update the EHR to change the information clerks and HCPs can see in the EHR. Coordination of the fact sheet release alongside information technology has been an important part of the SIGI rollout process.
Conclusion
HCPs have a complex role in providing treatment to TGNC patients in the VHA: They must affirm a patient’s gender identity through how they address them, while openly communicating the health risks inherent in having their birth sex field be incongruent with the sex recorded on their original birth certificate. Accomplishing these tasks simultaneously is difficult without invalidating the veteran’s identity or right to choose their EHR demographic birth sex label. Furthermore, patients may ask HCPs to write letters of support for either medical or surgical intervention or other documentation changes (eg, changes to a patient’s legal name, passport changes, or a safe passage letter for TGNC patients). Navigating the dialectic of safety and validation requires strong rapport, trust, and effective communication in the patient-provider relationship and great empathy by the provider.
A future task for the SIGI patient safety education work group is to continue to communicate with the technical work group and providers in the field about how demographic fields in the EHR are utilized to enable future EHR changes. This hurdle is not easy because EHR updates change the infrastructure through which demographic content is delivered and incorporated into a patient’s treatment. The VA HCPs are tasked with thoroughly examining the results that automated systems produce to ensure safe and accurate medical services are always provided to all patients. An integral part of patient-centered care is balancing any computer-guided recommendations with an understanding that actual patient needs may differ due to presence/absence of anatomy and other factors (eg, weight, current medications).
From a systems perspective, a benefit of adding the SIGI demographic field is systemic improvement in calculating the number of transgender veterans under VA care and evaluating health outcomes for this population. SIGI is particularly important for signaling gender pronouns for veterans, regardless of whether they are receiving care for a gender-related diagnosis. In terms of scope, the SIGI project potentially will apply to > 9 million enrolled veterans and nearly 400,000 VA employees.
Improvements could be made in the SIGI field of the new EHR, such as expanding the options for self-labels. Additionally, a text field could be used to enhance the quality of personalization provided to veterans self-identifying in the EHR, including pronoun specification. Moreover, adding new fields such as “preferred name” could improve the health care experience of not only TGNC veterans but all veterans who use something other than their full legal name (eg, a nickname). It will be good practice to notify providers and staff of a veteran’s requested name and pronouns when the patient checks in at an electronic kiosk so that all staff immediately know how to address the patient. The VHA can continue to adjust the options for the SIGI field once the new EHR system is operational. Ideally, this new EHR will display birth sex and SIGI to clinicians or clerks engaged in patient interactions.
Technology will continue to automate medical care, meaning that HCPs must be vigilant about how computer programming and the accuracy of prepopulated information affect patient care. The concerns discussed in this report relating to patient safety are relatively absent in the medical literature, even though substantial health risks exist to patients who have birth sex listed incorrectly for any reason.6,7 Additionally, administrative burden can be reduced if patients who do not need certain screenings based on their current anatomy are not contacted for unnecessary screenings. Future EHR systems might incorporate anatomical considerations from an inventory to assist in automating patient care in safe and accessible ways.
1. Institute of Medicine Committee on Quality of Health Care. Crossing the Quality Chasm: A New Health System for the 21st Century. Washington, DC: National Academies Press; 2001. https://www.ncbi.nlm.nih.gov/books/NBK222274. Accessed April 10, 2019.
2. Cahill SR, Baker K, Deutsch MB, Keatley J, Makadon HJ. Inclusion of sexual orientation and gender identity in stage 3 meaningful use guidelines: a huge step forward for LGBT health. LGBT Health. 2016;3(2):100-102.
3. Cahill SR, Makadon HJ. Sexual orientation and gender identity data collection update: U.S. government takes steps to promote sexual orientation and gender identity data collection through meaningful use guidelines. LGBT Health. 2014;1(3):157-160.
4. Fridsma D. EHR interoperability: the structured data capture initiative. https://www.healthit.gov/buzz-blog/electronic-health-and-medical-records/ehr-interoperabiity-structured-data-capture-initiative. Published January 31, 2013. Accessed April 10, 2019.
5. Muray T, Berberian L. The importance of structured data elements in EHRs. Computerworld website. https://www.computerworld.com/article/2470987/healthcare-it/the-importance-of-structured-data-elements-in-ehrs.html. Published March 31, 2011. Accessed April 10, 2019.
6. Deutsch MB, Green J, Keatley J, Mayer G, Hastings J, Hall AM; World Professional Association for Transgender Health EMR Working Group. Electronic medical records and the transgender patient: recommendations from the World Professional Association for Transgender Health EMR Working Group.
7. Deutsch MB, Keatley J, Sevelius J, Shade SB. Collection of gender identity data using electronic medical records: survey of current end-user practices. J Assoc Nurses AIDS Care. 2014;25(6):657-663.
Providing consistent and high-quality services to gender diverse patients is a top priority for health care systems, including the Veterans Health Administration (VHA).1 Over the past decade, awareness of transgender and gender nonconforming (TGNC) people in the US has increased. Gender identity refers to a person’s inner sense of where that person belongs on a continuum of masculine to androgynous to feminine traits. This identity range can additionally include nonbinary identifications, such as “gender fluid” or “genderqueer.” A goal of patient-centered care is for health care providers (HCPs) to refer to TGNC individuals, like their cisgender counterparts, according to their gender identity. Gender identity for TGNC individuals may be different from their birth sex. Birth sex, commonly referred to as “sex assigned at birth,” is the biologic and physiologic characteristics that are reflected on a person’s original birth certificate and described as male or female.
Background
In the electronic health record (EHR), birth sex is an important, structured variable that is used to facilitate effective patient care that is efficient, equitable, and patient-centered. Birth sex in an EHR often is used to cue automatic timely generation of health screens (eg, pap smears, prostate exams) and calculation of medication dosages and laboratory test ranges by adjusting for a person’s typical hormonal history and anatomy.
Gender identity fields are independently helpful to include in the EHR, because clinicians can use this information to ensure proper pronoun use and avoid misgendering a patient. Additionally, the gender identity field informs HCPs who may conduct more frequent or different health screenings to evaluate specific health risks that are more prevalent in gender minority (ie, lesbian, gay, bisexual) patients.2,3
EHRs rely on structured data elements to standardize data about patients for clinical care, quality improvement, data sharing, and patient safety.4,5 However, health care organizations are grappling with how to incorporate gender identity and birth sex information into EHRs.3 A 2011 Veterans Health Administration (VHA) directive required staff and providers to address and provide care to veterans based on their gender identity. Like other health systems, VHA had 1 demographic data field in the EHR to indicate birth sex, with no field for gender identity. A HCP could enter gender identity information into a progress note, but this addition might not be noticed by other HCPs. Consequently, staff and providers had no effective way of knowing a veteran’s gender identity from the EHR, which contributed to misgendering TGNC veterans.
With the singular demographic field of sex representing both birth sex and gender identity, some TGNC veterans chose to change their birth sex information to align with their gender identity. This change assured TGNC veterans that staff and providers would not misgender them because the birth sex field is easily observed and would allow providers to use respectful, gender-consistent pronouns when speaking with them. However, changing the birth sex field can misalign natal sex–based clinical reminders, medication dosages, and laboratory test values, which created potential patient safety risks. Thus, birth sex created potential hazards to quality and safety when used as a marker even with other variables—such as current anatomy, height, and weight—for health screenings, medication dosing, and other medical decisions.
In this article, we: (1) outline several patient safety issues that can arise with the birth sex field serving as an indicator for both birth sex and gender identity; (2) present case examples that illustrate the benefits of self-identified gender identity (SIGI) in an EHR; (3) describe the process of work-group development of patient-provider communication tools to improve patient safety; and (4) provide a brief overview of resources rolled out as a part of SIGI. This report serves as a guide for other federal organizations that wish to increase affirmative care and safe practices for transgender consumers. We will provide an overview of the tasks leading up to SIGI implementation, deliverables from the project, and lessons learned.
Veterans Affairs SIGI EHR Field
In 2016, the US Department of Veterans Affairs (VA) began implementing a SIGI demographic field across all EHRs, requiring administrative staff to ask enrolled and new veterans their gender identity (full implementation of SIGI has not yet occurred and will occur when a later EHR upgrade displays SIGI in the EHR). The initiation of SIGI did not change any information in the birth sex field, meaning that some veterans continue to have birth sex field information that results in problematic automatic medical reminders and dosing values. Consequently, the National Center for Patient Safety (NCPS) noted that this discrepancy may be a pertinent patient safety issue. The NCPS and Lesbian, Gay Bisexual, and Transgender (LGBT) Health national program offices worked to provide documentation to TGNC veterans to inform them of the clinical health care implications of having their birth sex demographic field reflect gender identity that is inconsistent with their natal sex (ie, original birth certificate record of sex).
Patient Safety Issues
Conversations between transgender patients and their HCPs about transition goals, necessary medical tests, and laboratory ranges based on their current anatomy and physiology can improve patient safety and satisfaction with medical care. Prior to the availability of the SIGI field, VA facilities varied in their documentation of gender identity in the patient chart. LGBT veteran care coordinators discussed diverse suggestions that ranged from informally documenting SIGI in each progress note to using flags to draw attention to use certain sections of local EHRs. These suggestions, though well intentioned, were not adequate for documenting gender identity at the national level because of regional variations in EHR customization options. Furthermore, the use of flags for drawing clinical attention to gender identity posed a potential for stigma toward patients, given that flags are typically reserved for behavioral or other risk concerns.
Several problems can emerge when HCPs are not equipped with accurate information about patient birth sex and SIGI. For instance, TGNC patients lack a way of being known from clinic to clinic by proper pronouns or self-labels. Providers may misgender veterans, which is a negative experience for TGNC veterans linked with increased barriers to care and decreased frequency of health care visits.4 Moreover, the quality and personalization of care across clinic locations in the facility’s system is variable without a consistent method of documenting birth sex and SIGI. For example, in clinics where the veteran is well known (eg, primary care), staff may be more affirming of the veteran’s gender identity than those in specialty care clinics that lack prior patient contact.
Furthermore, depending on hormone and surgical interventions, some health screenings may be irrelevant for TGNC patients. To determine appropriate health screens and assess potential risks associated with hormone therapy, providers must have access to current information regarding a patient’s physiologic anatomy.6 Health screenings and laboratory results in sophisticated EHRs (ie, EHRs that might autodetermine normative values) may populate incorrect treatment recommendations, such as sex-based medication dosages. Furthermore, laboratory test results could be incorrectly paired with a different assumed hormonal history, potentially putting the patient at risk.
Case Examples
An important element of EHRs facilitating the goal of patient-centered care is that patients have their EHR validate their sense of self, and their providers can use names and pronouns that correspond to the patient’s SIGI. Some patients have spent a great amount of effort altering their name and sex in legal records and may want their birth sex field to conform to their gender identity. To that end, patients may seek to alter their birth sex information so that it is congruent with how they see themselves to affirm their identity, despite patient safety risks. Several scenarios below demonstrate the potential costs and benefits to patients altering birth sex and SIGI in the EHR.
Case 1 Presentation
A young transman is working with his therapist on engaging in self-validating behaviors. This veteran has met with his PCP and informed the provider of his decision to alter the birth sex field in his EHR from female to male.
Ideally, the patient would begin to have regular conversations with his HCPs about his birth sex and gender identity, so that medical professionals can provide relevant screenings and affirm the patient’s gender identity while acknowledging his right to list his birth sex as he chooses. However, particular attention will need to be paid to assuring that natal sex–based health screenings (eg, pap smears, mammograms) are conducted on an appropriate schedule and that the veteran continues to discuss his current anatomy with providers.
Case 2 Presentation
A veteran has a male birth sex, identifies as a transwoman, and uses nongendered plural pronouns “they/them/theirs.” The word “they,” used as a singular pronoun may feel uncomfortable to some providers, but it validates the veteran’s sense of self and helps them feel welcome in the treatment environment. This patient communicated proactively with their HCPs about their transition goals and current hormone use.
They opted to have their birth sex field continue to indicate “male” because they, after a discussion with their PCP, are aware of the health implications of receiving an incorrect dose for their diabetes medication. They understand that having open communication and receiving input from their HCPs is part of good health care.
Case 3 Presentation
A patient with a sexual development disorder (intersex condition) identifies as a man (indicated as “male” in the SIGI field) and had his birth sex field changed to match his gender identity. He now seeks to change his birth sex field back to female, as he has complicated health considerations due to breast cancer.
The veteran thinks it is important that providers know about his intersex condition so that his breast cancer care is as seamless as possible. In particular, although this veteran is comfortable talking about his intersex condition and his identity with his PCP and oncologist, he wants to ensure that all people involved in his care (eg, pharmacists, radiologists) use the correct values in interpreting his medical data. Providers will need to use the female birth sex field for interpreting his medical data but use male pronouns when interacting with the veteran and documenting his care.
These case examples illustrate the need for HCPs to have patient-affirming education and appropriate clinical tools available when speaking to patients about birth sex, SIGI, and the implications of changing birth sex in the EHR. Moreover, these cases highlight that patient health needs may vary over time, due to factors such as perceived costs/benefits of a change in the sex field of the EHR as well as patient comfort with providers.
Current Status of SIGI and EHR
Although having separate fields for birth sex and SIGI in the EHR is ideal, the VHA does not yet have a fully functional SIGI field, and several TGNC veterans have changed their birth sex field to align with their gender identity. Roughly 9,700 patients have diagnostic codes related to transgender care in the VHA, meaning thousands of current patients would potentially benefit from SIGI implementation (John Blosnich, written communication, March 2018). A possible action that the VHA could take with the goal of enhancing patient safety would be to revert the birth sex field of patients who had previously changed the field back to the patient’s original birth sex. However, if this alteration to the EHR were done without the patient’s consent, numerous additional problems would result—including invalidating a veteran’s wishes—potentially driving patients away from receiving health care.
Moreover, in the absence of updated SIGI information (which only the veteran can provide), making a change in the EHR would perpetuate the misgendering of TGNC veterans who have already sought an administrative fix for this problem. Thus, the agency decided to engage patients in a discussion about their decision to keep the birth sex field consistent with their original birth certificate. In cases in which the field had been changed previously, the recommendation is for HCPs to gain patient consent to change the birth sex field back to what was on their original birth certificate. Thus, decisions about what should be listed in the EHR are made by the veteran using an informed decision-making model.
Patient Safety Education Workgroup
To begin the process of disentangling birth sex and SIGI fields in the EHR, 2 work groups were created: a technical work group (coding the patches for SIGI implementation) and a SIGI patient safety education work group. The patient safety education work group was committed to promoting affirmative VA policies that require validation of the gender identity of all veterans and pursuing best practices through clinical guidelines to promote effective, efficient, equitable, and safe veteran care. The patient safety education work group included representatives from all 3 branches of the VA (VHA, Veterans Benefits Administration, and National Cemetery Administration), including clinical media, patient safety, information technology, and education specialists. The group developed trainings for administrative staff about the appropriate ways to ask birth sex and SIGI questions, and how to record veteran-driven responses.
SIGI Fact Sheet
The patient safety education work group examined clinical literature and developed tools for staff and veterans to facilitate effective discussions about the importance and utility of documenting both birth sex and SIGI in the EHR. The patient safety education work group along with media and educational experts created basic key term definition documents to address the importance, purpose, and use of the SIGI field. The patient safety education work group developed 2 documents to facilitate communication between patients and providers.
A 1-page veteran-facing fact sheet was developed that described the differences between birth sex and SIGI fields and how these fields are used in the VA EHR system (Figure 1). In addition, a 1-page HCP-facing fact sheet was designed to inform HCPs that patients may have changed their birth sex in their EHR or might still wish to change their birth sex field, and to inform HCPs of the importance of patient-centered, gender-affirmative care (Figure 2). An additional goal of both documents was to educate veterans and HCPs on how the EHR automatically calculates laboratory results and screening notifications based on birth sex.
Review Process
As part of reviewing and finalizing the SIGI patient fact sheet, the patient safety education work group previewed the document’s content with veterans who provided feedback on drafts to improve comprehension, patient-centered care, and clinical accuracy. For instance, several patients commented that the document should address many gender identities, including intersex identities. As noted in one of the case presentations earlier, individuals who identify as intersex may have changed their birth sex to be consistent with their gender and might benefit from being informed about the EHR’s autocalculation feature. The patient safety education work group adjusted the SIGI patient fact sheet to include individuals who identify as intersex and instructed them to have a conversation with their HCP regarding potential birth sex changes in the EHR.
Much of the veteran feedback to the patient safety education work group reflected veteran concerns, more broadly, about implementation of SIGI. Many veterans were interested in how federal policy changes might affect their benefits package or clinical care within the VA. The SIGI patient fact sheet was a tool for communicating that Department of Defense (DoD) policies, specifically, do not have a bearing on VA care for LGBT veterans. Therefore, SIGI information does not affect service connection or benefits eligibility and is not shared with the DoD. Veterans found this information helpful to see reflected in the SIGI patient fact sheet.
The patient safety education work group also shared the SIGI provider fact sheet with VHA providers before finalizing the content. PCPs gave feedback to improve the specification of patient safety concerns and appropriate readership language. The patient safety education work group adjusted the SIGI provider fact sheet to be inclusive of relevant literature and an e-consultation link for assisting HCPs who are unsure how to proceed with a patient.
Implementation
The patient safety education work group also developed several materials to provide information about the birth sex and SIGI fields in the EHR. Because the SIGI demographic field is new and collected by clerical staff, training was necessary to explain the difference between birth sex and SIGI before implementation in the EHR. The training sessions educated staff about the difference between birth sex and SIGI, how to ask and respond to questions respectfully, and how to update these fields in the EHR. These trainings included a 20-minute video demonstrating best practices for asking about SIGI, a frequently asked questions document responding to 7 common questions about the new fields, and a quick reference guide for administrative staff to have handy at their desks.
Dissemination of the SIGI patient and provider fact sheets is planned to occur, ideally, several weeks before implementation of the new patches updating the EHR fields in spring 2020. Building on existing resources, the patient safety education work group plans to disseminate the patient fact sheets via e-mail lists for the national mental health facility leaders as well as through e-mail lists for VA PCPs, nursing and clerical staff, privacy officers, facility LGBT veteran care coordinators, VISN leads, transgender e-consultation, the Office of Connected Care, the LGBT external homepage for the VA, and the training website for VA employees. The goal is to target potential points of contact for veterans who may have already changed their birth sex and might benefit medically from altering birth sex to be consistent with their original birth certificate.
The SIGI provider fact sheet will be disseminated using internal e-mails, announcements on routine LGBT veteran care coordinator calls, weekly Ask LGBT Health teleconferences, and announcements at LGBT health training events both internally and externally. Several dissemination tools have already ensured that VA employees are aware of the SIGI field in the EHR. Leadership throughout the VA will be encouraged to share SIGI trainings with clerical staff. Additionally, broad-based e-mails summarizing changes to the EHR will be provided concurrent to the SIGI patch implementation to VA staff as well as links to the resources and training materials.
Challenges
One difficulty in the development process for both SIGI fact sheets was addressing the issue of patient safety for veterans who may be at different points in their gender transition process. It was challenging for the patient safety education work group to not sound alarmist in discussing the safety implications of birth sex changes in the EHR, as this is just one factor in clinical decision making. The goal was to educate veterans from a patient safety perspective about the implications of having a state-of-the-art, automated EHR. However, text can be perceived differently by different people, which is why the patient safety education work group asked veterans to preview the patient document and clinical providers to preview the provider document.
Both work groups encountered technologic challenges, including a delay in the implementation of the SIGI field due to a systemwide delay of EHR updates. Although it released training and educational materials to the VHA, the patient safety education work group understood that at some point in the future, VA programmers will update the EHR to change the information clerks and HCPs can see in the EHR. Coordination of the fact sheet release alongside information technology has been an important part of the SIGI rollout process.
Conclusion
HCPs have a complex role in providing treatment to TGNC patients in the VHA: They must affirm a patient’s gender identity through how they address them, while openly communicating the health risks inherent in having their birth sex field be incongruent with the sex recorded on their original birth certificate. Accomplishing these tasks simultaneously is difficult without invalidating the veteran’s identity or right to choose their EHR demographic birth sex label. Furthermore, patients may ask HCPs to write letters of support for either medical or surgical intervention or other documentation changes (eg, changes to a patient’s legal name, passport changes, or a safe passage letter for TGNC patients). Navigating the dialectic of safety and validation requires strong rapport, trust, and effective communication in the patient-provider relationship and great empathy by the provider.
A future task for the SIGI patient safety education work group is to continue to communicate with the technical work group and providers in the field about how demographic fields in the EHR are utilized to enable future EHR changes. This hurdle is not easy because EHR updates change the infrastructure through which demographic content is delivered and incorporated into a patient’s treatment. The VA HCPs are tasked with thoroughly examining the results that automated systems produce to ensure safe and accurate medical services are always provided to all patients. An integral part of patient-centered care is balancing any computer-guided recommendations with an understanding that actual patient needs may differ due to presence/absence of anatomy and other factors (eg, weight, current medications).
From a systems perspective, a benefit of adding the SIGI demographic field is systemic improvement in calculating the number of transgender veterans under VA care and evaluating health outcomes for this population. SIGI is particularly important for signaling gender pronouns for veterans, regardless of whether they are receiving care for a gender-related diagnosis. In terms of scope, the SIGI project potentially will apply to > 9 million enrolled veterans and nearly 400,000 VA employees.
Improvements could be made in the SIGI field of the new EHR, such as expanding the options for self-labels. Additionally, a text field could be used to enhance the quality of personalization provided to veterans self-identifying in the EHR, including pronoun specification. Moreover, adding new fields such as “preferred name” could improve the health care experience of not only TGNC veterans but all veterans who use something other than their full legal name (eg, a nickname). It will be good practice to notify providers and staff of a veteran’s requested name and pronouns when the patient checks in at an electronic kiosk so that all staff immediately know how to address the patient. The VHA can continue to adjust the options for the SIGI field once the new EHR system is operational. Ideally, this new EHR will display birth sex and SIGI to clinicians or clerks engaged in patient interactions.
Technology will continue to automate medical care, meaning that HCPs must be vigilant about how computer programming and the accuracy of prepopulated information affect patient care. The concerns discussed in this report relating to patient safety are relatively absent in the medical literature, even though substantial health risks exist to patients who have birth sex listed incorrectly for any reason.6,7 Additionally, administrative burden can be reduced if patients who do not need certain screenings based on their current anatomy are not contacted for unnecessary screenings. Future EHR systems might incorporate anatomical considerations from an inventory to assist in automating patient care in safe and accessible ways.
1. Institute of Medicine Committee on Quality of Health Care. Crossing the Quality Chasm: A New Health System for the 21st Century. Washington, DC: National Academies Press; 2001. https://www.ncbi.nlm.nih.gov/books/NBK222274. Accessed April 10, 2019.
2. Cahill SR, Baker K, Deutsch MB, Keatley J, Makadon HJ. Inclusion of sexual orientation and gender identity in stage 3 meaningful use guidelines: a huge step forward for LGBT health. LGBT Health. 2016;3(2):100-102.
3. Cahill SR, Makadon HJ. Sexual orientation and gender identity data collection update: U.S. government takes steps to promote sexual orientation and gender identity data collection through meaningful use guidelines. LGBT Health. 2014;1(3):157-160.
4. Fridsma D. EHR interoperability: the structured data capture initiative. https://www.healthit.gov/buzz-blog/electronic-health-and-medical-records/ehr-interoperabiity-structured-data-capture-initiative. Published January 31, 2013. Accessed April 10, 2019.
5. Muray T, Berberian L. The importance of structured data elements in EHRs. Computerworld website. https://www.computerworld.com/article/2470987/healthcare-it/the-importance-of-structured-data-elements-in-ehrs.html. Published March 31, 2011. Accessed April 10, 2019.
6. Deutsch MB, Green J, Keatley J, Mayer G, Hastings J, Hall AM; World Professional Association for Transgender Health EMR Working Group. Electronic medical records and the transgender patient: recommendations from the World Professional Association for Transgender Health EMR Working Group.
7. Deutsch MB, Keatley J, Sevelius J, Shade SB. Collection of gender identity data using electronic medical records: survey of current end-user practices. J Assoc Nurses AIDS Care. 2014;25(6):657-663.
Unrelated Death After Colorectal Cancer Screening: Implications for Improving Colonoscopy Referrals
Colorectal cancer (CRC) ranks among the most common causes of cancer and cancer-related death in the US. The US Multi-Society Task Force (USMSTF) on Colorectal Cancer thus strongly endorsed using several available screening options.1 The published guidelines largely rely on age to define the target population (Table 1). For average-risk individuals, national and Veterans Health Administration (VHA) guidelines currently recommend CRC screening in individuals aged between 50 and 75 years with a life expectancy of > 5 years.1
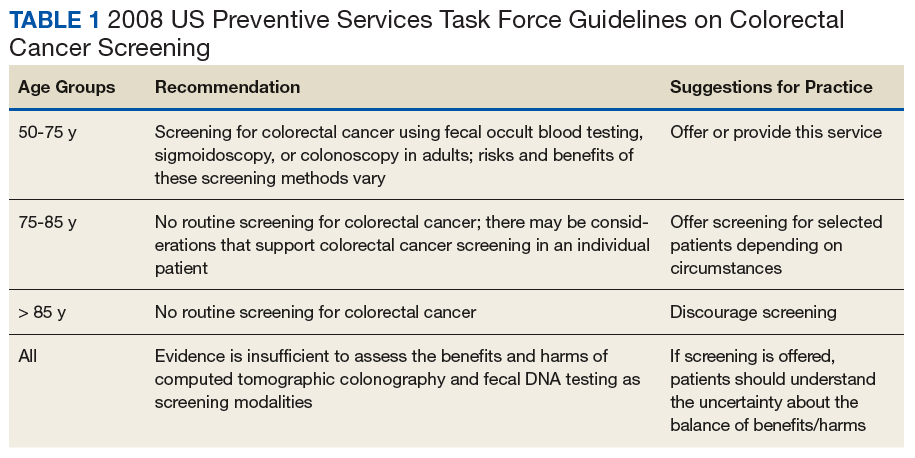
Although case-control studies also point to a potential benefit in persons aged > 75 years,2,3 the USMSTF cited less convincing evidence and suggested an individualized approach that should consider relative cancer risk and comorbidity burden. Such an approach is supported by modeling studies, which suggest reduced benefit and increased risk of screening with increasing age. The reduced benefit also is significantly affected by comorbidity and relative cancer risk.4 The VHA has successfully implemented CRC screening, capturing the majority of eligible patients based on age criteria. A recent survey showed that more than three-quarters of veterans between age 50 and 75 years had undergone some screening test for CRC as part of routine preventive care. Colonoscopy clearly emerged as the dominant modality chosen for CRC screening and accounted for nearly 84% of these screening tests.5 Consistent with these data, a case-control study confirmed that the widespread implementation of colonoscopy as CRC screening method reduced cancer-related mortality in veterans for cases of left but not right-sided colon cancer.6
With calls to expand the age range of CRC screening beyond aged 75 years, we decided to assess survival rates of a cohort of veterans who underwent a screening or surveillance colonoscopy between 2008 and 2014.7 The goals were to characterize the portion of the cohort that had died, the time between a screening colonoscopy and death, the portion of deaths that were aged ≥ 80 years, and the causes of the deaths. In addition, we focused on a subgroup of the cohort, defined by death within 2 years after the index colonoscopy, to identify predictors of early death that were independent of age.
Methods
We queried the endoscopy reporting system (EndoWorks; Olympus America, Center Valley, PA) for all colonoscopies performed by 2 of 14 physicians at the George Wahlen VA Medical Center (GWVAMC) in Salt Lake City, Utah, who performed endoscopic procedures between January 1, 2008 and December 1, 2014. These physicians had focused their clinical practice exclusively on elective outpatient colonoscopies and accounted for 37.4% of the examinations at GWVAMC during the study period. All colonoscopy requests were triaged and assigned based on availability of open and appropriate procedure time slots without direct physician-specific referral, thus reducing the chance of skewing results. The reports were filtered through a text search to focus on examinations that listed screening or surveillance as indication. The central patient electronic health record was then reviewed to extract basic demographic data, survival status (as of August 1, 2018), and survival time in years after the index or subsequent colonoscopy. For deceased veterans, the age at the time of death, cause of death, and comorbidities were queried.
This study compared cases and control across the study. Cases were persons who clearly died early (defined as > 2 years following the index examination). They were matched with controls who lived for ≥ 5 years after their colonoscopy. These periods were selected because the USMSTF recommended that CRC screening or surveillance colonoscopy should be discontinued in persons with a life expectancy of < 5 years, and most study patients underwent their index procedure ≥ 5 years before August 2018. Cases and controls underwent a colonoscopy in the same year and were matched for age, sex, and presence of underlying inflammatory bowel disease (IBD). For cases and controls, we identified the ordering health care provider specialty, (ie, primary care, gastroenterology, or other).
In addition, we reviewed the encounter linked to the order and abstracted relevant comorbidities listed at that time, noted the use of anticoagulants, opioid analgesics, and benzodiazepines. The comorbidity burden was quantified using the Charlson Comorbidity Index.8 In addition, we denoted the presence of psychiatric problems (eg, anxiety, depression, bipolar disease, psychosis, substance abuse), the diagnosis of atrial fibrillation (AF) or other cardiac arrhythmias, and whether the patient had previously been treated for a malignancy that was in apparent clinical remission. Finally, we searched for routine laboratory tests at the time of this visit or, when not obtained, within 6 months of the encounter, and abstracted serum creatinine, hemoglobin (Hgb), platelet number, serum protein, and albumin. In clinical practice, cutoff values of test results are often more helpful in decision making. We, therefore, dichotomized results for Hgb (cutoff: 10 g/dL), creatinine (cutoff: 2 mg/dL), and albumin (cutoff: 3.2 mg/dL).
Descriptive and analytical statistics were obtained with Stata Version 14.1 (College Station, TX). Unless indicated otherwise, continuous data are shown as mean with 95% CIs. For dichotomous data, we used percentages with their 95% CIs. Analytic statistics were performed with the t test for continuous variables and the 2-tailed test for proportions. A P < .05 was considered a significant difference. To determine independent predictors of early death, we performed a logistic regression analysis with results being expressed as odds ratio with 95% CIs. Survival status was chosen as a dependent variable, and we entered variables that significantly correlated with survival in the bivariate analysis as independent variables.
The study was designed and conducted as a quality improvement project to assess colonoscopy performance and outcomes with the Salt Lake City Specialty Care Center of Innovation (COI), one of 5 regional COIs with an operational mission to improve health care access, utilization, and quality. Our work related to colonoscopy and access within the COI region, including Salt Lake City, has been reviewed and acknowledged by the GWVAMC Institutional Review Board as quality improvement. Andrew Gawron has an operational appointment in the GWVAMC COI, which is part of a US Department of Veterans Affairs (VA) central office initiative established in 2015. The COIs are charged with identifying best practices within the VA and applying those practices throughout the COI region. This local project to identify practice patterns and outcomes locally was sponsored by the GWVAMC COI with a focus to generate information to improve colonoscopy referral quality in patients at Salt Lake City and inform regional and national efforts in this domain.
Results
During the study period, 4,879 veterans (96.9% male) underwent at least 1 colonoscopy for screening or surveillance by 1 of the 2 providers. A total of 306 persons (6.3%) were aged > 80 years. The indication for surveillance colonoscopies included IBD in 78 (1.6%) veterans 2 of whom were women. The mean (SD) follow-up period between the index colonoscopy and study closure or death was 7.4 years (1.7). During the study time, 1,439 persons underwent a repeat examination for surveillance. The percentage of veterans with at least 1 additional colonoscopy after the index test was significantly higher in patients with known IBD compared with those without IBD (78.2% vs 28.7%; P < .01).
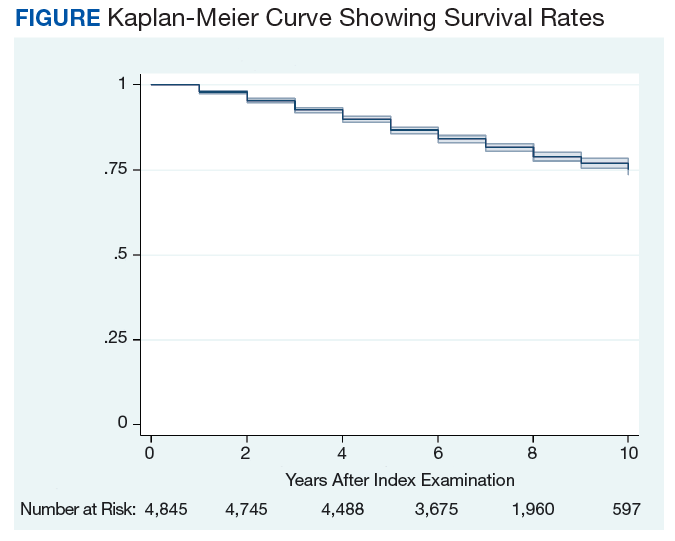
Between the index colonoscopy and August 2018, 974 patients (20.0%) died (Figure). The mean (SD) time between the colonoscopy and recorded year of death was 4.4 years (4.1). The fraction of women in the cohort that died (n = 18) was lower compared with 132 for the group of persons still alive (1.8% vs 3.4%; P < .05). The fraction of veterans with IBD who died by August 2018 did not differ from that of patients with IBD in the cohort of individuals who survived (19.2% vs 20.0%; P = .87). The cohort of veterans who died before study closure included 107 persons who were aged > 80 years at the time of their index colonoscopy, which is significantly more than in the cohort of persons still alive (11.0% vs 5.1%; P < .01).
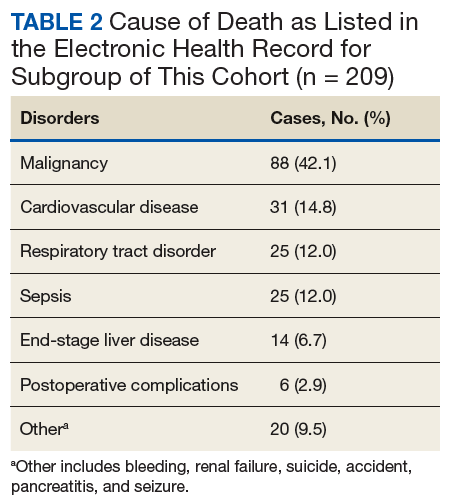
Cause of Death
In 209 of the 974 (21.5%) veteran deaths a cause was recorded. Malignancies accounted for 88 of the deaths (42.1%), and CRCs were responsible for 14 (6.7%) deaths (Table 2). In 8 of these patients, the cancer had been identified at an advanced stage, not allowing for curative therapy. One patient had been asked to return for a repeat test as residual fecal matter did not allow proper visualization. He died 1 year later due to complications of sepsis after colonic perforation caused by a proximal colon cancer. Five patients underwent surgery with curative intent but suffered recurrences. In addition to malignancies, advanced diseases, such as cardiovascular, bronchopulmonary illnesses, and infections, were other commonly listed causes of death.
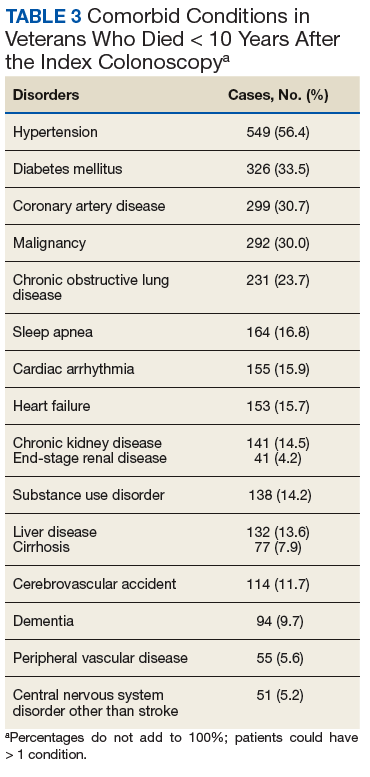
We also abstracted comorbidities that were known at the time of death or the most recent encounter within the VHA system. Hypertension was most commonly listed (549) followed by a current or prior diagnosis of malignancies (355) and diabetes mellitus (DM) (Table 3). Prostate cancer was the most commonly diagnosed malignancy (80), 17 of whom had a second malignancy. CRC accounted for 54 of the malignancies, 1 of which developed in a patient with long-standing ulcerative colitis, 2 were a manifestation of a known hereditary cancer syndrome (Lynch syndrome), and the remaining 51 cases were various cancers without known predisposition. The diagnosis of CRC was made during the study period in 29 veterans. In the remaining 25 patients, the colonoscopy was performed as a surveillance examination after previous surgery for CRC.
Potential Predictors of Early Death
To better define potential predictors of early death, we focused on the 258 persons (5.3%) who died within 2 years after the index procedure and paired them with matched controls. One patient underwent a colonoscopy for surveillance of previously treated cancer and was excluded due to very advanced age, as no matched control could be identified. The mean (SD) age of this male-predominant cohort was 68.2 (9.6) vs 67.9 (9.4) years for cases and controls, respectively. At the time of referral for the test, 29 persons (11.3%) were aged > 80 years, which is significantly more than seen for the overall cohort with 306 (6.3%; P < .001). While primary care providers accounted for most referrals in cases (85.2%) and controls (93.0%), the fraction of veterans referred by gastroenterologists or other specialty care providers was significantly higher in the case group compared with that in the controls (14.8% vs 7.0%; P < .05).
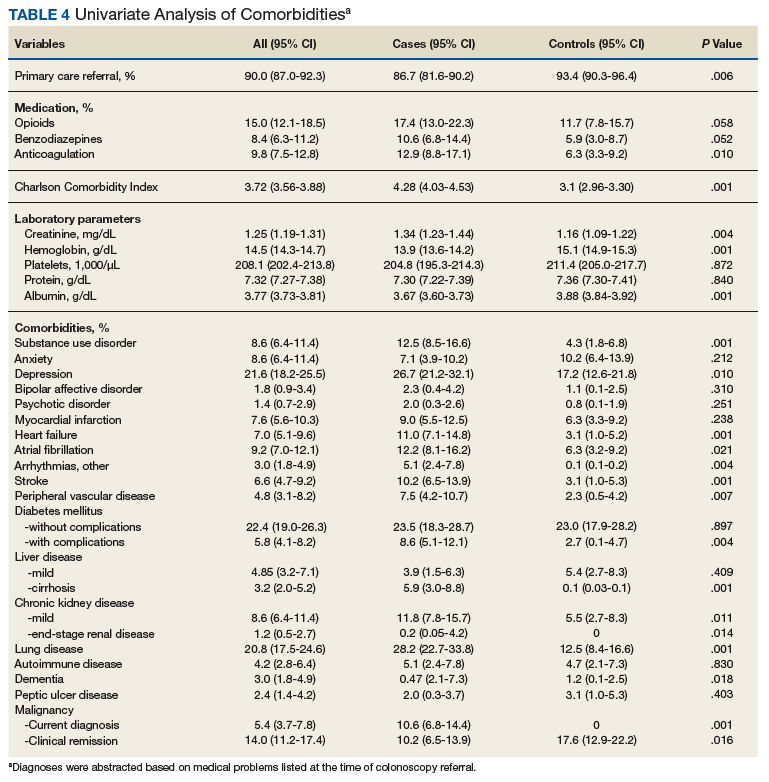
In our age-matched analysis, we examined other potential factors that could influence survival. The burden of comorbid conditions summarized in the Charlson Comorbidity Index significantly correlated with survival status (Table 4). As this composite index does not include psychiatric conditions, we separately examined the impact of anxiety, depression, bipolar disease, psychotic disorders, and substance abuse. The diagnoses of depression and substance use disorders (SUDs) were associated with higher rates of early death. Considering concerns about SUDs, we also assessed the association between prescription for opioids or benzodiazepines and survival status, which showed a marginal correlation. Anticoagulant use, a likely surrogate for cardiovascular disorders, were more commonly listed in the cases than they were in the controls.
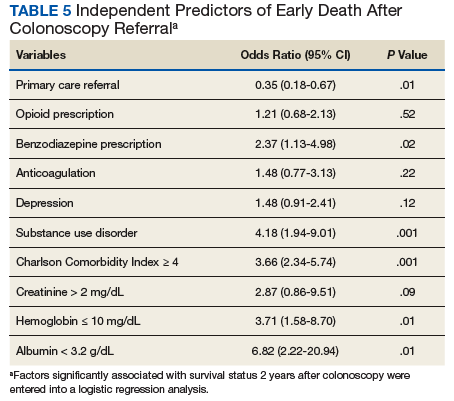
Looking at specific comorbid conditions, significant problems affecting key organ systems from heart to lung, liver, kidneys, or brain (dementia) were all predictors of poor outcome. Similarly, DM with secondary complication correlated with early death after the index procedure. In contrast, a history of prior myocardial infarction, prior cancer treatment without evidence of persistent or recurrent disease, or prior peptic ulcer disease did not differ between cases and controls. Focusing on routine blood tests, we noted marginal, but statistically different results for Hgb, serum creatinine, and albumin in cases compared with controls.
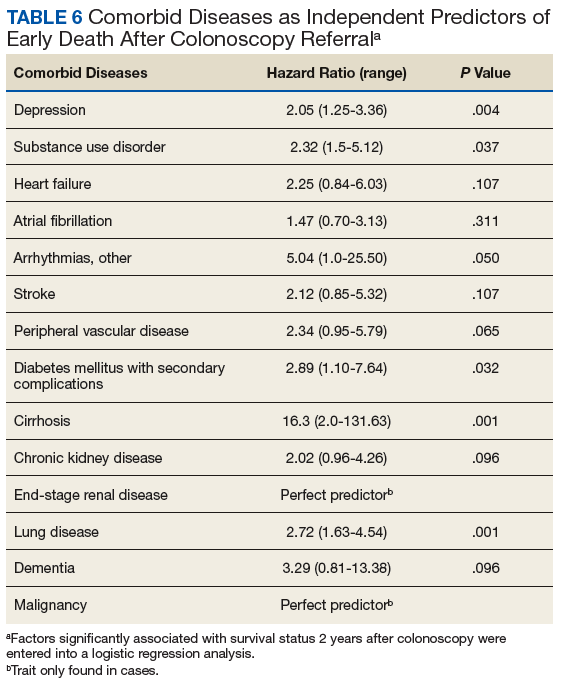
Next we performed a logistic regression to identify independent predictors of survival status. The referring provider specialty, Charlson Comorbidity Index, the diagnosis of a SUD, current benzodiazepine use, and significant anemia or hypoalbuminemia independently predicted death within 2 years of the index examination (Table 5). Considering the composite nature of the Charlson Comorbidity Index, we separately examined the relative importance of different comorbid conditions using a logistic regression analysis. Consistent with the univariate analyses, a known malignancy; severe liver, lung, or kidney disease; and DM with secondary complications were associated with poor outcome. Only arrhythmias other than AF were independent marginal predictors of early death, whereas other variables related to cardiac performance did not reach the level of significance (Table 6). As was true for our analysis examining the composite comorbidity index, the diagnosis of a SUD remained significant as a predictor of death within 2 years of the index colonoscopy.
Discussion
This retrospective analysis followed patients for a mean time of 7 years after a colonoscopy for CRC screening or polyp surveillance. We noted a high rate of all-cause mortality, with 20% of the cohort dying within the period studied. Malignancies, cardiovascular diseases, and advanced lung diseases were most commonly listed causes of death. As expected, CRC was among the 3 most common malignancies and was the cause of death in 6.7% of the group with sufficiently detailed information. While these results fall within the expected range for the mortality related to CRC,9 the results do not allow us to assess the impact of screening, which has been shown to decrease cancer-related mortality in veterans.6 This was limited because the sample size was too small to assess the impact of screening and the cause of death was ascertained for a small percentage of the sample.
Although our findings are limited to a subset of patients seen in a single center, they suggest the importance of appropriate eligibility criteria for screening tests, as also defined in national guidelines.1 As a key anchoring point that describes the target population, age contributed to the rate of relatively early death after the index procedure. Consistent with previously published data, we saw a significant impact of comorbid diseases.10,11 However, our findings go beyond prior reports and show the important impact of psychiatric disease burden, most important the role of SUDs. The predictive value of a summary score, such as the Charlson Comorbidity Index, supports the idea of a cumulative impact, with an increasing disease burden decreasing life expectancy.10-14 It is important to consider the ongoing impact of such coexisting illnesses. Our analysis shows, the mere history of prior problems did not independently predict survival status in our cohort.
Although age is the key anchoring point that defines the target population for CRC screening programs, the benefit of earlier cancer detection or, in the context of colonoscopy with polypectomy, cancer prevention comes with a delay. Thus, cancer risk, procedural risk, and life expectancy should all be weighed when discussing and deciding on the appropriateness of CRC screening. When we disregard inherited cancer syndromes, CRC is clearly a disease of the second half of life with the incidence increasing with age.15 However, other disease burdens rise, which may affects the risk of screening and treatment should cancer be found.
Using our understanding of disease development, researchers have introduced the concept of time to benefit or lag time to help decisions about screening strategies. The period defines the likely time for a precursor or early form of cancer potentially detected by screening to manifest as a clinically relevant lesion. This lag time becomes an especially important consideration in screening of older and/or chronically ill adults with life expectancies that may be close to or even less than the time to benefit.16 Modeling studies suggest that 1,000 flexible sigmoidoscopy screenings are needed to prevent 1 cancer that would manifest about 10 years after the index examination.17,18 The mean life expectancy of a healthy person aged 75 years exceeds 10 years but drops with comorbidity burden. Consistent with these considerations, an analysis of Medicare claims data concluded that individuals with ≥ 3 significant comorbidities do not derive any benefit from screening colonoscopy.14 Looking at the impact of comorbidities, mathematical models concluded that colorectal cancer screening should not be continued in persons with moderate or severe comorbid conditions aged 66 years and 72 years, respectively.19 In contrast, modeling results suggest a benefit of continued screening up to and even above the age of 80 years if persons have an increased cancer risk and if there are no confounding comorbidities.4
Life expectancy and time to benefit describe probabilities. Although such probabilities are relevant in public policy decision, providers and patients may struggle with probabilistic thinking when faced with decisions that involve probabilities of individual health care vs population health care. Both are concerned about the seemingly gloomy or pessimistic undertone of discussing life expectancy and the inherent uncertainty of prognostic tools.20,21 Prior research indicates that this reluctance translates into clinical practice. When faced with vignettes, most clinicians would offer CRC screening to healthy persons aged 80 years with rates falling when the description included a significant comorbid burden; however, more than 40% would still consider screening in octogenarians with poor health.22
Consistent with these responses to theoretical scenarios, CRC screening of veterans dropped with age but was still continued in persons with significant comorbidity.23 Large studies of the veteran population suggest that about 10% of veterans aged > 70 years have chronic medical problems that limit their life expectancy to < 5 years; nonetheless, more than 40% of this cohort underwent colonoscopies for CRC screening.24,25 Interestingly, more illness burden and more clinical encounters translated into more screening examinations in older sick veterans compared with that of the cohort of healthier older persons, suggesting an impact of clinical reminders and the key role of age as the main anchoring variable.23
Ongoing screening despite limited or even no benefit is not unique to CRC. Using validated tools, Pollock and colleagues showed comparable screening rates for breast and prostate cancer when they examined cohorts at either high or low risk of early mortality.26 Similar results have been reported in veterans with about one-third of elderly males with poor life expectancy still undergoing prostate cancer screening.27 Interestingly, inappropriate screening is more common in nonacademic centers and influenced by provider characteristics: nurse practitioner, physician assistants, older attending physicians and male physicians were more likely to order such tests.27,28
Limitations
In this study, we examined a cohort of veterans enrolled in CRC screening within a single institution and obtained survival data for a mean follow-up of > 7 years. We also restricted our study to patients undergoing examinations that explicitly listed screening as indication or polyp surveillance for the test. However, inclusion was based on the indication listed in the report, which may differ from the intent of the ordering provider. Reporting systems often come with default settings, which may skew data. Comorbidities for the entire cohort of veterans who died within the time frame of the study were extracted from the chart without controlling for time-dependent changes, which may more appropriately describe the comorbidity burden at the time of the test. Using a case-control design, we addressed this potential caveat and included only illnesses recorded in the encounter linked to the colonoscopy order. Despite these limitations, our results highlight the importance to more effectively define and target appropriate candidates for CRC screening.
Conclusion
This study shows that age is a simple but not sufficiently accurate criterion to define potential candidates for CRC screening. As automated reminders often prompt discussions about and referral to screening examinations, we should develop algorithms that estimate the individual cancer risk and/or integrate an automatically calculated comorbidity index with these alerts or insert such a tool into order-sets. In addition, providers and patients need to be educated about the rationale and need for a more comprehensive approach to CRC screening that considers anticipated life expectancy. On an individual and health system level, our goal should be to reduce overall mortality rather than only cancer-specific death rates.
1. Rex DK, Boland CR, Dominitz JA, et al. Colorectal cancer screening: recommendations for physicians and patients from the U.S. Multi-Society Task Force on Colorectal Cancer. Gastroenterology. 2017;153(1):307-323.
2. Kahi CJ, Myers LJ, Slaven JE, et al. Lower endoscopy reduces colorectal cancer incidence in older individuals. Gastroenterology. 2014;146(3):718-725.e3.
3. Wang YR, Cangemi JR, Loftus EV Jr, Picco MF. Decreased risk of colorectal cancer after colonoscopy in patients 76-85 years old in the United States. Digestion. 2016;93(2):132-138.
4. van Hees F, Saini SD, Lansdorp-Vogelaar I, et al. Personalizing colonoscopy screening for elderly individuals based on screening history, cancer risk, and comorbidity status could increase cost effectiveness. Gastroenterology. 2015;149(6):1425-1437.
5. May FP, Yano EM, Provenzale D, Steers NW, Washington DL. The association between primary source of healthcare coverage and colorectal cancer screening among US veterans. Dig Dis Sci. 2017;62(8):1923-1932.
6. Kahi CJ, Pohl H, Myers LJ, Mobarek D, Robertson DJ, Imperiale TF. Colonoscopy and colorectal cancer mortality in the Veterans Affairs Health Care System: a case-control study. Ann Intern Med. 2018;168(7):481-488.
7. Holt PR, Kozuch P, Mewar S. Colon cancer and the elderly: from screening to treatment in management of GI disease in the elderly. Best Pract Res Clin Gastroenterol. 2009;23(6):889-907.
8. Charlson M, Szatrowski TP, Peterson J, Gold J. Validation of a combined comorbidity index. J Clin Epidemiol. 1994;47(11):1245-1251.
9. Mandel JS, Bond JH, Church TR, et al. Reducing mortality from colorectal cancer by screening for fecal occult blood. Minnesota Colon Cancer Control Study. N Engl J Med. 1993;328(19):1365-1371.
10. Lee TA, Shields AE, Vogeli C, et al. Mortality rate in veterans with multiple chronic conditions. J Gen Intern Med. 2007;22(suppl 3):403-407.
11. Nguyen-Nielsen M, Norgaard M, Jacobsen JB, et al. Comorbidity and survival of Danish prostate cancer patients from 2000-2011: a population-based cohort study. Clin Epidemiol. 2013;5(suppl 1):47-55.
12. Jang SH, Chea JW, Lee KB. Charlson comorbidity index using administrative database in incident PD patients. Clin Nephrol. 2010;73(3):204-209.
13. Fried L, Bernardini J, Piraino B. Charlson comorbidity index as a predictor of outcomes in incident peritoneal dialysis patients. Am J Kidney Dis. 2001;37(2):337-342.
14. Gross CP, Soulos PR, Ross JS, et al. Assessing the impact of screening colonoscopy on mortality in the medicare population. J Gen Intern Med. 2011;26(12):1441-1449.
15. Chouhan V, Mansoor E, Parasa S, Cooper GS. Rates of prevalent colorectal cancer occurrence in persons 75 years of age and older: a population-based national study. Dig Dis Sci. 2018;63(7):1929-1936.
16. Lee SJ, Kim CM. Individualizing prevention for older adults. J Am Geriatr Soc. 2018;66(2):229-234.
17. Tang V, Boscardin WJ, Stijacic-Cenzer I, et al. Time to benefit for colorectal cancer screening: survival meta-analysis of flexible sigmoidoscopy trials. BMJ. 2015;350:h1662.
18. Lee SJ, Boscardin WJ, Stijacic-Cenzer I, et al. Time lag to benefit after screening for breast and colorectal cancer: meta-analysis of survival data from the United States, Sweden, United Kingdom, and Denmark. BMJ. 2013;346:e8441.
19. Lansdorp-Vogelaar I, Gulati R, Mariotto AB, et al. Personalizing age of cancer screening cessation based on comorbid conditions: model estimates of harms and benefits. Ann Intern Med. 2014;161(2):104-112.
20. Schoenborn NL, Bowman TL II, Cayea D, Pollack CE, Feeser S, Boyd C. Primary care practitioners’ views on incorporating long-term prognosis in the care of older adults. JAMA Intern Med. 2016;176(5):671-678.
21. Schoenborn NL, Lee K, Pollack CE, et al. Older adults’ views and communication preferences about cancer screening cessation. JAMA Intern Med. 2017;177(8):1121-1128.
22. Lewis CL, Esserman D, DeLeon C, Pignone MP, Pathman DE, Golin C. Physician decision making for colorectal cancer screening in the elderly. J Gen Intern Med. 2013;28(9):1202-1217.
23. Saini SD, Vijan S, Schoenfeld P, Powell AA, Moser S, Kerr EA. Role of quality measurement in inappropriate use of screening for colorectal cancer: retrospective cohort study. BMJ. 2014;348:g1247.
24. Walter LC, Lindquist K, Nugent S, et al. Impact of age and comorbidity on colorectal cancer screening among older veterans. Ann Intern Med. 2009;150(7):465-473.
25. Powell AA, Saini SD, Breitenstein MK, et al. Rates and correlates of potentially inappropriate colorectal cancer screening in the Veterans Health Administration. J Gen Intern Med. 2015;30(6):732-741.
26. Pollack CE, Blackford AL, Schoenborn NL, Boyd CM, Peairs KS, DuGoff EH. Comparing prognostic tools for cancer screening: considerations for clinical practice and performance assessment. J Am Geriatr Soc. 2016;64(5):1032-1038.
27. So C, Kirby KA, Mehta K, et al. Medical center characteristics associated with PSA screening in elderly veterans with limited life expectancy. J Gen Intern Med. 2012;27(6):653-660.
28. Tang VL, Shi Y, Fung K, et al. Clinician factors associated with prostate-specific antigen screening in older veterans with limited life expectancy. JAMA Intern Med. 2016;176(5):654-661.
Colorectal cancer (CRC) ranks among the most common causes of cancer and cancer-related death in the US. The US Multi-Society Task Force (USMSTF) on Colorectal Cancer thus strongly endorsed using several available screening options.1 The published guidelines largely rely on age to define the target population (Table 1). For average-risk individuals, national and Veterans Health Administration (VHA) guidelines currently recommend CRC screening in individuals aged between 50 and 75 years with a life expectancy of > 5 years.1
Although case-control studies also point to a potential benefit in persons aged > 75 years,2,3 the USMSTF cited less convincing evidence and suggested an individualized approach that should consider relative cancer risk and comorbidity burden. Such an approach is supported by modeling studies, which suggest reduced benefit and increased risk of screening with increasing age. The reduced benefit also is significantly affected by comorbidity and relative cancer risk.4 The VHA has successfully implemented CRC screening, capturing the majority of eligible patients based on age criteria. A recent survey showed that more than three-quarters of veterans between age 50 and 75 years had undergone some screening test for CRC as part of routine preventive care. Colonoscopy clearly emerged as the dominant modality chosen for CRC screening and accounted for nearly 84% of these screening tests.5 Consistent with these data, a case-control study confirmed that the widespread implementation of colonoscopy as CRC screening method reduced cancer-related mortality in veterans for cases of left but not right-sided colon cancer.6
With calls to expand the age range of CRC screening beyond aged 75 years, we decided to assess survival rates of a cohort of veterans who underwent a screening or surveillance colonoscopy between 2008 and 2014.7 The goals were to characterize the portion of the cohort that had died, the time between a screening colonoscopy and death, the portion of deaths that were aged ≥ 80 years, and the causes of the deaths. In addition, we focused on a subgroup of the cohort, defined by death within 2 years after the index colonoscopy, to identify predictors of early death that were independent of age.
Methods
We queried the endoscopy reporting system (EndoWorks; Olympus America, Center Valley, PA) for all colonoscopies performed by 2 of 14 physicians at the George Wahlen VA Medical Center (GWVAMC) in Salt Lake City, Utah, who performed endoscopic procedures between January 1, 2008 and December 1, 2014. These physicians had focused their clinical practice exclusively on elective outpatient colonoscopies and accounted for 37.4% of the examinations at GWVAMC during the study period. All colonoscopy requests were triaged and assigned based on availability of open and appropriate procedure time slots without direct physician-specific referral, thus reducing the chance of skewing results. The reports were filtered through a text search to focus on examinations that listed screening or surveillance as indication. The central patient electronic health record was then reviewed to extract basic demographic data, survival status (as of August 1, 2018), and survival time in years after the index or subsequent colonoscopy. For deceased veterans, the age at the time of death, cause of death, and comorbidities were queried.
This study compared cases and control across the study. Cases were persons who clearly died early (defined as > 2 years following the index examination). They were matched with controls who lived for ≥ 5 years after their colonoscopy. These periods were selected because the USMSTF recommended that CRC screening or surveillance colonoscopy should be discontinued in persons with a life expectancy of < 5 years, and most study patients underwent their index procedure ≥ 5 years before August 2018. Cases and controls underwent a colonoscopy in the same year and were matched for age, sex, and presence of underlying inflammatory bowel disease (IBD). For cases and controls, we identified the ordering health care provider specialty, (ie, primary care, gastroenterology, or other).
In addition, we reviewed the encounter linked to the order and abstracted relevant comorbidities listed at that time, noted the use of anticoagulants, opioid analgesics, and benzodiazepines. The comorbidity burden was quantified using the Charlson Comorbidity Index.8 In addition, we denoted the presence of psychiatric problems (eg, anxiety, depression, bipolar disease, psychosis, substance abuse), the diagnosis of atrial fibrillation (AF) or other cardiac arrhythmias, and whether the patient had previously been treated for a malignancy that was in apparent clinical remission. Finally, we searched for routine laboratory tests at the time of this visit or, when not obtained, within 6 months of the encounter, and abstracted serum creatinine, hemoglobin (Hgb), platelet number, serum protein, and albumin. In clinical practice, cutoff values of test results are often more helpful in decision making. We, therefore, dichotomized results for Hgb (cutoff: 10 g/dL), creatinine (cutoff: 2 mg/dL), and albumin (cutoff: 3.2 mg/dL).
Descriptive and analytical statistics were obtained with Stata Version 14.1 (College Station, TX). Unless indicated otherwise, continuous data are shown as mean with 95% CIs. For dichotomous data, we used percentages with their 95% CIs. Analytic statistics were performed with the t test for continuous variables and the 2-tailed test for proportions. A P < .05 was considered a significant difference. To determine independent predictors of early death, we performed a logistic regression analysis with results being expressed as odds ratio with 95% CIs. Survival status was chosen as a dependent variable, and we entered variables that significantly correlated with survival in the bivariate analysis as independent variables.
The study was designed and conducted as a quality improvement project to assess colonoscopy performance and outcomes with the Salt Lake City Specialty Care Center of Innovation (COI), one of 5 regional COIs with an operational mission to improve health care access, utilization, and quality. Our work related to colonoscopy and access within the COI region, including Salt Lake City, has been reviewed and acknowledged by the GWVAMC Institutional Review Board as quality improvement. Andrew Gawron has an operational appointment in the GWVAMC COI, which is part of a US Department of Veterans Affairs (VA) central office initiative established in 2015. The COIs are charged with identifying best practices within the VA and applying those practices throughout the COI region. This local project to identify practice patterns and outcomes locally was sponsored by the GWVAMC COI with a focus to generate information to improve colonoscopy referral quality in patients at Salt Lake City and inform regional and national efforts in this domain.
Results
During the study period, 4,879 veterans (96.9% male) underwent at least 1 colonoscopy for screening or surveillance by 1 of the 2 providers. A total of 306 persons (6.3%) were aged > 80 years. The indication for surveillance colonoscopies included IBD in 78 (1.6%) veterans 2 of whom were women. The mean (SD) follow-up period between the index colonoscopy and study closure or death was 7.4 years (1.7). During the study time, 1,439 persons underwent a repeat examination for surveillance. The percentage of veterans with at least 1 additional colonoscopy after the index test was significantly higher in patients with known IBD compared with those without IBD (78.2% vs 28.7%; P < .01).
Between the index colonoscopy and August 2018, 974 patients (20.0%) died (Figure). The mean (SD) time between the colonoscopy and recorded year of death was 4.4 years (4.1). The fraction of women in the cohort that died (n = 18) was lower compared with 132 for the group of persons still alive (1.8% vs 3.4%; P < .05). The fraction of veterans with IBD who died by August 2018 did not differ from that of patients with IBD in the cohort of individuals who survived (19.2% vs 20.0%; P = .87). The cohort of veterans who died before study closure included 107 persons who were aged > 80 years at the time of their index colonoscopy, which is significantly more than in the cohort of persons still alive (11.0% vs 5.1%; P < .01).
Cause of Death
In 209 of the 974 (21.5%) veteran deaths a cause was recorded. Malignancies accounted for 88 of the deaths (42.1%), and CRCs were responsible for 14 (6.7%) deaths (Table 2). In 8 of these patients, the cancer had been identified at an advanced stage, not allowing for curative therapy. One patient had been asked to return for a repeat test as residual fecal matter did not allow proper visualization. He died 1 year later due to complications of sepsis after colonic perforation caused by a proximal colon cancer. Five patients underwent surgery with curative intent but suffered recurrences. In addition to malignancies, advanced diseases, such as cardiovascular, bronchopulmonary illnesses, and infections, were other commonly listed causes of death.
We also abstracted comorbidities that were known at the time of death or the most recent encounter within the VHA system. Hypertension was most commonly listed (549) followed by a current or prior diagnosis of malignancies (355) and diabetes mellitus (DM) (Table 3). Prostate cancer was the most commonly diagnosed malignancy (80), 17 of whom had a second malignancy. CRC accounted for 54 of the malignancies, 1 of which developed in a patient with long-standing ulcerative colitis, 2 were a manifestation of a known hereditary cancer syndrome (Lynch syndrome), and the remaining 51 cases were various cancers without known predisposition. The diagnosis of CRC was made during the study period in 29 veterans. In the remaining 25 patients, the colonoscopy was performed as a surveillance examination after previous surgery for CRC.
Potential Predictors of Early Death
To better define potential predictors of early death, we focused on the 258 persons (5.3%) who died within 2 years after the index procedure and paired them with matched controls. One patient underwent a colonoscopy for surveillance of previously treated cancer and was excluded due to very advanced age, as no matched control could be identified. The mean (SD) age of this male-predominant cohort was 68.2 (9.6) vs 67.9 (9.4) years for cases and controls, respectively. At the time of referral for the test, 29 persons (11.3%) were aged > 80 years, which is significantly more than seen for the overall cohort with 306 (6.3%; P < .001). While primary care providers accounted for most referrals in cases (85.2%) and controls (93.0%), the fraction of veterans referred by gastroenterologists or other specialty care providers was significantly higher in the case group compared with that in the controls (14.8% vs 7.0%; P < .05).
In our age-matched analysis, we examined other potential factors that could influence survival. The burden of comorbid conditions summarized in the Charlson Comorbidity Index significantly correlated with survival status (Table 4). As this composite index does not include psychiatric conditions, we separately examined the impact of anxiety, depression, bipolar disease, psychotic disorders, and substance abuse. The diagnoses of depression and substance use disorders (SUDs) were associated with higher rates of early death. Considering concerns about SUDs, we also assessed the association between prescription for opioids or benzodiazepines and survival status, which showed a marginal correlation. Anticoagulant use, a likely surrogate for cardiovascular disorders, were more commonly listed in the cases than they were in the controls.
Looking at specific comorbid conditions, significant problems affecting key organ systems from heart to lung, liver, kidneys, or brain (dementia) were all predictors of poor outcome. Similarly, DM with secondary complication correlated with early death after the index procedure. In contrast, a history of prior myocardial infarction, prior cancer treatment without evidence of persistent or recurrent disease, or prior peptic ulcer disease did not differ between cases and controls. Focusing on routine blood tests, we noted marginal, but statistically different results for Hgb, serum creatinine, and albumin in cases compared with controls.
Next we performed a logistic regression to identify independent predictors of survival status. The referring provider specialty, Charlson Comorbidity Index, the diagnosis of a SUD, current benzodiazepine use, and significant anemia or hypoalbuminemia independently predicted death within 2 years of the index examination (Table 5). Considering the composite nature of the Charlson Comorbidity Index, we separately examined the relative importance of different comorbid conditions using a logistic regression analysis. Consistent with the univariate analyses, a known malignancy; severe liver, lung, or kidney disease; and DM with secondary complications were associated with poor outcome. Only arrhythmias other than AF were independent marginal predictors of early death, whereas other variables related to cardiac performance did not reach the level of significance (Table 6). As was true for our analysis examining the composite comorbidity index, the diagnosis of a SUD remained significant as a predictor of death within 2 years of the index colonoscopy.
Discussion
This retrospective analysis followed patients for a mean time of 7 years after a colonoscopy for CRC screening or polyp surveillance. We noted a high rate of all-cause mortality, with 20% of the cohort dying within the period studied. Malignancies, cardiovascular diseases, and advanced lung diseases were most commonly listed causes of death. As expected, CRC was among the 3 most common malignancies and was the cause of death in 6.7% of the group with sufficiently detailed information. While these results fall within the expected range for the mortality related to CRC,9 the results do not allow us to assess the impact of screening, which has been shown to decrease cancer-related mortality in veterans.6 This was limited because the sample size was too small to assess the impact of screening and the cause of death was ascertained for a small percentage of the sample.
Although our findings are limited to a subset of patients seen in a single center, they suggest the importance of appropriate eligibility criteria for screening tests, as also defined in national guidelines.1 As a key anchoring point that describes the target population, age contributed to the rate of relatively early death after the index procedure. Consistent with previously published data, we saw a significant impact of comorbid diseases.10,11 However, our findings go beyond prior reports and show the important impact of psychiatric disease burden, most important the role of SUDs. The predictive value of a summary score, such as the Charlson Comorbidity Index, supports the idea of a cumulative impact, with an increasing disease burden decreasing life expectancy.10-14 It is important to consider the ongoing impact of such coexisting illnesses. Our analysis shows, the mere history of prior problems did not independently predict survival status in our cohort.
Although age is the key anchoring point that defines the target population for CRC screening programs, the benefit of earlier cancer detection or, in the context of colonoscopy with polypectomy, cancer prevention comes with a delay. Thus, cancer risk, procedural risk, and life expectancy should all be weighed when discussing and deciding on the appropriateness of CRC screening. When we disregard inherited cancer syndromes, CRC is clearly a disease of the second half of life with the incidence increasing with age.15 However, other disease burdens rise, which may affects the risk of screening and treatment should cancer be found.
Using our understanding of disease development, researchers have introduced the concept of time to benefit or lag time to help decisions about screening strategies. The period defines the likely time for a precursor or early form of cancer potentially detected by screening to manifest as a clinically relevant lesion. This lag time becomes an especially important consideration in screening of older and/or chronically ill adults with life expectancies that may be close to or even less than the time to benefit.16 Modeling studies suggest that 1,000 flexible sigmoidoscopy screenings are needed to prevent 1 cancer that would manifest about 10 years after the index examination.17,18 The mean life expectancy of a healthy person aged 75 years exceeds 10 years but drops with comorbidity burden. Consistent with these considerations, an analysis of Medicare claims data concluded that individuals with ≥ 3 significant comorbidities do not derive any benefit from screening colonoscopy.14 Looking at the impact of comorbidities, mathematical models concluded that colorectal cancer screening should not be continued in persons with moderate or severe comorbid conditions aged 66 years and 72 years, respectively.19 In contrast, modeling results suggest a benefit of continued screening up to and even above the age of 80 years if persons have an increased cancer risk and if there are no confounding comorbidities.4
Life expectancy and time to benefit describe probabilities. Although such probabilities are relevant in public policy decision, providers and patients may struggle with probabilistic thinking when faced with decisions that involve probabilities of individual health care vs population health care. Both are concerned about the seemingly gloomy or pessimistic undertone of discussing life expectancy and the inherent uncertainty of prognostic tools.20,21 Prior research indicates that this reluctance translates into clinical practice. When faced with vignettes, most clinicians would offer CRC screening to healthy persons aged 80 years with rates falling when the description included a significant comorbid burden; however, more than 40% would still consider screening in octogenarians with poor health.22
Consistent with these responses to theoretical scenarios, CRC screening of veterans dropped with age but was still continued in persons with significant comorbidity.23 Large studies of the veteran population suggest that about 10% of veterans aged > 70 years have chronic medical problems that limit their life expectancy to < 5 years; nonetheless, more than 40% of this cohort underwent colonoscopies for CRC screening.24,25 Interestingly, more illness burden and more clinical encounters translated into more screening examinations in older sick veterans compared with that of the cohort of healthier older persons, suggesting an impact of clinical reminders and the key role of age as the main anchoring variable.23
Ongoing screening despite limited or even no benefit is not unique to CRC. Using validated tools, Pollock and colleagues showed comparable screening rates for breast and prostate cancer when they examined cohorts at either high or low risk of early mortality.26 Similar results have been reported in veterans with about one-third of elderly males with poor life expectancy still undergoing prostate cancer screening.27 Interestingly, inappropriate screening is more common in nonacademic centers and influenced by provider characteristics: nurse practitioner, physician assistants, older attending physicians and male physicians were more likely to order such tests.27,28
Limitations
In this study, we examined a cohort of veterans enrolled in CRC screening within a single institution and obtained survival data for a mean follow-up of > 7 years. We also restricted our study to patients undergoing examinations that explicitly listed screening as indication or polyp surveillance for the test. However, inclusion was based on the indication listed in the report, which may differ from the intent of the ordering provider. Reporting systems often come with default settings, which may skew data. Comorbidities for the entire cohort of veterans who died within the time frame of the study were extracted from the chart without controlling for time-dependent changes, which may more appropriately describe the comorbidity burden at the time of the test. Using a case-control design, we addressed this potential caveat and included only illnesses recorded in the encounter linked to the colonoscopy order. Despite these limitations, our results highlight the importance to more effectively define and target appropriate candidates for CRC screening.
Conclusion
This study shows that age is a simple but not sufficiently accurate criterion to define potential candidates for CRC screening. As automated reminders often prompt discussions about and referral to screening examinations, we should develop algorithms that estimate the individual cancer risk and/or integrate an automatically calculated comorbidity index with these alerts or insert such a tool into order-sets. In addition, providers and patients need to be educated about the rationale and need for a more comprehensive approach to CRC screening that considers anticipated life expectancy. On an individual and health system level, our goal should be to reduce overall mortality rather than only cancer-specific death rates.
1. Rex DK, Boland CR, Dominitz JA, et al. Colorectal cancer screening: recommendations for physicians and patients from the U.S. Multi-Society Task Force on Colorectal Cancer. Gastroenterology. 2017;153(1):307-323.
2. Kahi CJ, Myers LJ, Slaven JE, et al. Lower endoscopy reduces colorectal cancer incidence in older individuals. Gastroenterology. 2014;146(3):718-725.e3.
3. Wang YR, Cangemi JR, Loftus EV Jr, Picco MF. Decreased risk of colorectal cancer after colonoscopy in patients 76-85 years old in the United States. Digestion. 2016;93(2):132-138.
4. van Hees F, Saini SD, Lansdorp-Vogelaar I, et al. Personalizing colonoscopy screening for elderly individuals based on screening history, cancer risk, and comorbidity status could increase cost effectiveness. Gastroenterology. 2015;149(6):1425-1437.
5. May FP, Yano EM, Provenzale D, Steers NW, Washington DL. The association between primary source of healthcare coverage and colorectal cancer screening among US veterans. Dig Dis Sci. 2017;62(8):1923-1932.
6. Kahi CJ, Pohl H, Myers LJ, Mobarek D, Robertson DJ, Imperiale TF. Colonoscopy and colorectal cancer mortality in the Veterans Affairs Health Care System: a case-control study. Ann Intern Med. 2018;168(7):481-488.
7. Holt PR, Kozuch P, Mewar S. Colon cancer and the elderly: from screening to treatment in management of GI disease in the elderly. Best Pract Res Clin Gastroenterol. 2009;23(6):889-907.
8. Charlson M, Szatrowski TP, Peterson J, Gold J. Validation of a combined comorbidity index. J Clin Epidemiol. 1994;47(11):1245-1251.
9. Mandel JS, Bond JH, Church TR, et al. Reducing mortality from colorectal cancer by screening for fecal occult blood. Minnesota Colon Cancer Control Study. N Engl J Med. 1993;328(19):1365-1371.
10. Lee TA, Shields AE, Vogeli C, et al. Mortality rate in veterans with multiple chronic conditions. J Gen Intern Med. 2007;22(suppl 3):403-407.
11. Nguyen-Nielsen M, Norgaard M, Jacobsen JB, et al. Comorbidity and survival of Danish prostate cancer patients from 2000-2011: a population-based cohort study. Clin Epidemiol. 2013;5(suppl 1):47-55.
12. Jang SH, Chea JW, Lee KB. Charlson comorbidity index using administrative database in incident PD patients. Clin Nephrol. 2010;73(3):204-209.
13. Fried L, Bernardini J, Piraino B. Charlson comorbidity index as a predictor of outcomes in incident peritoneal dialysis patients. Am J Kidney Dis. 2001;37(2):337-342.
14. Gross CP, Soulos PR, Ross JS, et al. Assessing the impact of screening colonoscopy on mortality in the medicare population. J Gen Intern Med. 2011;26(12):1441-1449.
15. Chouhan V, Mansoor E, Parasa S, Cooper GS. Rates of prevalent colorectal cancer occurrence in persons 75 years of age and older: a population-based national study. Dig Dis Sci. 2018;63(7):1929-1936.
16. Lee SJ, Kim CM. Individualizing prevention for older adults. J Am Geriatr Soc. 2018;66(2):229-234.
17. Tang V, Boscardin WJ, Stijacic-Cenzer I, et al. Time to benefit for colorectal cancer screening: survival meta-analysis of flexible sigmoidoscopy trials. BMJ. 2015;350:h1662.
18. Lee SJ, Boscardin WJ, Stijacic-Cenzer I, et al. Time lag to benefit after screening for breast and colorectal cancer: meta-analysis of survival data from the United States, Sweden, United Kingdom, and Denmark. BMJ. 2013;346:e8441.
19. Lansdorp-Vogelaar I, Gulati R, Mariotto AB, et al. Personalizing age of cancer screening cessation based on comorbid conditions: model estimates of harms and benefits. Ann Intern Med. 2014;161(2):104-112.
20. Schoenborn NL, Bowman TL II, Cayea D, Pollack CE, Feeser S, Boyd C. Primary care practitioners’ views on incorporating long-term prognosis in the care of older adults. JAMA Intern Med. 2016;176(5):671-678.
21. Schoenborn NL, Lee K, Pollack CE, et al. Older adults’ views and communication preferences about cancer screening cessation. JAMA Intern Med. 2017;177(8):1121-1128.
22. Lewis CL, Esserman D, DeLeon C, Pignone MP, Pathman DE, Golin C. Physician decision making for colorectal cancer screening in the elderly. J Gen Intern Med. 2013;28(9):1202-1217.
23. Saini SD, Vijan S, Schoenfeld P, Powell AA, Moser S, Kerr EA. Role of quality measurement in inappropriate use of screening for colorectal cancer: retrospective cohort study. BMJ. 2014;348:g1247.
24. Walter LC, Lindquist K, Nugent S, et al. Impact of age and comorbidity on colorectal cancer screening among older veterans. Ann Intern Med. 2009;150(7):465-473.
25. Powell AA, Saini SD, Breitenstein MK, et al. Rates and correlates of potentially inappropriate colorectal cancer screening in the Veterans Health Administration. J Gen Intern Med. 2015;30(6):732-741.
26. Pollack CE, Blackford AL, Schoenborn NL, Boyd CM, Peairs KS, DuGoff EH. Comparing prognostic tools for cancer screening: considerations for clinical practice and performance assessment. J Am Geriatr Soc. 2016;64(5):1032-1038.
27. So C, Kirby KA, Mehta K, et al. Medical center characteristics associated with PSA screening in elderly veterans with limited life expectancy. J Gen Intern Med. 2012;27(6):653-660.
28. Tang VL, Shi Y, Fung K, et al. Clinician factors associated with prostate-specific antigen screening in older veterans with limited life expectancy. JAMA Intern Med. 2016;176(5):654-661.
How Much Time are Physicians and Nurses Spending Together at the Patient Bedside?
Effective communication between physicians and nurses is an essential element of any healthcare system. Numerous studies have highlighted the benefits of high quality physician–nurse (MD–RN) communication, including improved patient outcomes,1 higher patient satisfaction,2 and better nurse job satisfaction and retention rates.3-5 Having physicians and nurses round together (bedside interdisciplinary rounding) has been shown to improve the perception of teamwork,6,7 reduce the number of pages for the physician team,6,8 better involve the patients in developing the plan of care,8 and even decrease the length and cost of stay.9
Being physically in the same space at the same time is the first and nonnegotiable requirement of bedside interdisciplinary rounding. However, precise and objective data regarding the extent to which physicians and nurses overlap at the patient bedside are lacking. Studies that examine the face-to-face component of MD–RN communication have generally relied on either qualitative methods, such as focus groups and surveys,10,11 or quantitative methods that are subjective, such as validated scales.12 In addition, the few studies that report quantitative data usually rely on manual observation methods that can be affected by various forms of observer bias.10,13,14 There is also a paucity of data on how bedside overlap changes over the work week or as a function of room location.
Recently, real-time locator systems using radio frequency identification (RFID) have allowed measurement of staff and equipment movement in a precise and quantitative manner.9,15 Although there have been previous studies using RFID locators to create time-motion maps of various hospital staff, no study has used RFID to measure and analyze the workflow of both physicians and nurses simultaneously.16-18 The purpose of our investigation was to utilize our hospital-wide RFID staff locator technology to accurately and quantitatively assess physician and nurse rounding habits. Understanding the current rate of overlap is an important first step to establishing bedside interdisciplinary rounding.
METHODS
Setting and Participants
The investigation was conducted at a single quaternary-care academic center. The study is exempt per our Institutional Review Board. Data were gathered from three adjacent medical-surgical acute care wards. The layout for each ward was the same: 19 single- or double-occupancy patient rooms arranged in a linear hallway, with a nursing station located at the center of the ward.
The study utilized wearable RFID tags (manufactured by Hill-Rom Holdings, Inc) that located specific staff within the hospital in real time. The RFID tags were checked at Hill-Rom graphical stations to ensure that their locations were tracked accurately. The investigators also wore them and walked around the wards in a prescripted manner to ensure validity. In addition, the locator accuracy was audited by participating attendings once per week and cross-checked with the generated data. Attending physicians on the University Hospitalist inpatient medicine teams were then given their uniquely-tagged RFIDs at the beginning of this study. Nurses already wear individual RFID tags as part of their normal standard-of-care workflow.
The attending hospitalists wore their RFID tags when they were on service for the entirety of the shift. They were encouraged to include nurses at the bedside, but this was not mandatory. The rounding team also included residents and medical students. Rounding usually begins at a prespecified time, but the route taken varies daily depending on patient location. Afternoon rounds were done as needed, depending on patient acuity. The attending physicians’ participation in this study was not disclosed to the patient. The patient care activities and daily routines of both nurses and physicians were otherwise unaltered.
Study Design and Data Collection
Data were collected on the three wards for 90 consecutive days, including nights and weekends. As physicians and nurses moved throughout the ward to conduct their usual patient care activities, the temporal-spatial data associated with their unique RFIDs were automatically collected in real time by the Hill-Rom receivers built into each patient room. Every day, a spreadsheet detailing the activity of all participating nurses and physicians for the past 24 hours was generated for the investigators.
A rounding event was defined as any episode in which a physician was in a patient room for more than 10 seconds. Incidences in which a physician entered and left a room multiple times over a short time span (with less than five minutes in between each event) were classified as a single rounding event. A physician and a nurse were defined as having overlapped if their RFID data showed that they were in the same patient room for a minimum of 10 seconds at the same time. For the purposes of this study, data generated from other RFID-wearing professionals, such as nursing assistants or unit secretaries, as well as data collected from the hallways, were excluded.
Statistical Analysis
All statistical analyses were conducted using GraphPad Prism (GraphPad Software, San Diego, California). Rounding and overlap lengths were rounded to the nearest minute (minimum one minute). Mean lengths are expressed along with the standard error. Comparisons of the average lengths of MD rounding events between wards was conducted using two-tailed Student t-test or one-way ANOVA. Comparisons of the frequency of MD–RN overlap between wards and across different days of the week were performed using a Chi-squared test. The analysis of correlation between the frequency of MD–RN overlap and distance between patient room and nursing station was conducted by calculating Pearson’s correlation. A P value of less than .05 was considered statistically significant.
RESULTS
Baseline Rounding Characteristics
Over the study period of 90 consecutive days, 739 MD rounding events were captured, for an average of 8.2 events per day. The mean length of all MD rounding events was 7.31 minutes (±0.27, ranging from one to 70 minutes). Of these 739 MD rounding events, we separately examined the 267 events that took place in single-bed patient rooms, to control for false-positive physician and nurse interactions (for example, if the MD and RN were caring for two separate roommates). The average rounding length of single-bed rooms was 6.93 (±0.27) minutes (Figure 1). For the three individual wards, the average rounding lengths were 6.40 ± 0.73, 7.48 ± 0.94, and 7.02 ± 0.54 minutes, respectively (no statistically significant difference).
Frequency of MD–RN Overlap
Of the 267 MD rounding events observed in single-bed rooms, a nurse was present in the room for 80 events (30.0%). The frequencies of MD–RN overlap in patient rooms were 37.0% (30/81), 28.0% (14/50), and 26.5% (36/136) for the three individual wards (P > .05), respectively.
The durations of MD–RN overlap, when these events did occur, were 3.43 ± 0.38, 3.00 ± 0.70, and 3.69 ± 0.92 minutes, respectively (P > .05). The overall mean length of MD–RN overlap for all single rooms was 3.48 ± 0.45 minutes.
Rounding Characteristics over the Course of the Week
To assess how rounding characteristics differed over the work week, we partitioned our data into the individual days of the week. The length of each MD rounding event (time spent in each patient room) did not vary significantly over the course of the week (Figure 2a). When the data for the individual days were aggregated into “weekdays” (Monday through Friday) and “weekends” (Saturday and Sunday), the mean lengths of MD rounds were 7.26 ± 0.32 minutes on weekdays and 7.47 ± 0.52 minutes on weekends (P > .05).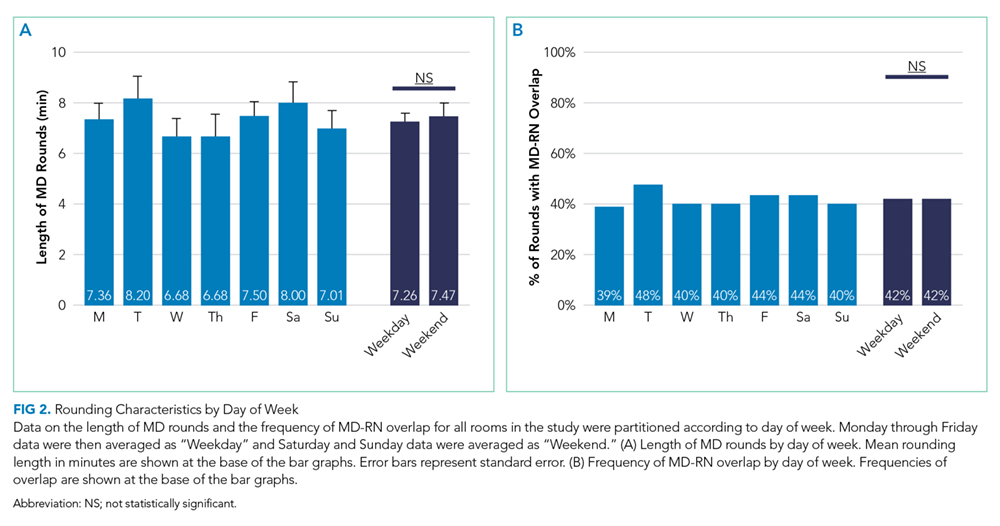
In addition, there was no difference in how frequently physicians and nurses overlapped at the patient bedside between weekdays and weekends. Of the 565 weekday MD rounding events, 238 had a nurse at bedside (42.1%), and of the 173 weekend MD rounding events, 73 had a nurse at bedside (42.2%; Figure 2b).
Effect of a Bedside Nurse on the Length of Rounds
Next, the data on the length of MD rounds were partitioned based on whether there was a bedside nurse present during rounds. The mean length of rounds with only MDs (without a bedside nurse) was 5.68 ± 0.24 minutes. By comparison, the mean length of rounds with both a nurse and a physician at the patient bedside was 9.56 ± 0.53 minutes (Figure 3). This difference was statistically significant (P < .001).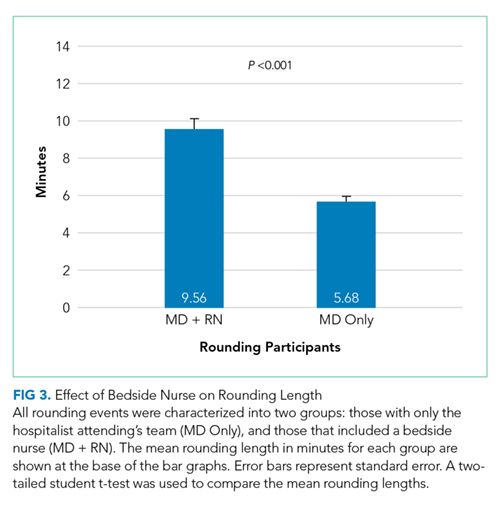
Association between Patient Room Location and the Likelihood of MD–RN Overlap
All three wards in this study have a linear layout, consisting of 19 patient rooms in a row (Figure 4a). The nursing station is located in a central position within each ward, across from the 10th patient room. The frequency of MD–RN overlap was calculated for each room, and each room was ranked according to its relative distance from the nursing station. For each individual ward, there was no statistically significant trend in MD–RN overlap frequency as a function of the distance to the nursing station (data not shown). However, when the data from all three wards were aggregated, there was a statistically significant trend (P < .05) with a negative Pearson correlation (r = –0.670; Figure 4b). The slope of the best fit line was 1.94, suggesting that for each additional room farther away from the nursing station, the likelihood of interdisciplinary rounds (with both physicians and nurses together at the bedside) decreases by almost 2%.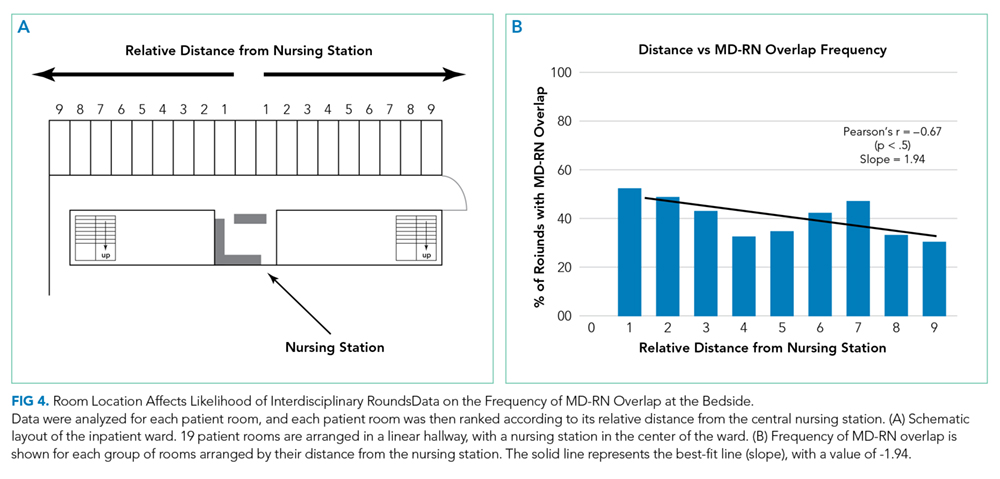
DISCUSSION
To the best of our knowledge, this is the first time-motion study of MD–RN overlap using real-time, RFID-based location technology to capture the rounding activity of both nurses and physicians. Our primary interest was to examine the extent of MD–RN overlap at the patient bedside. This is an important metric that can pave the way for bedside interdisciplinary rounds. Although the exact nature of nurse-physician communication was not measured using the methodology in this study, understanding the length of time physicians spend in patient rooms, across different wards and throughout the work week, provides insights on the current workflow and potential areas of improvement. For example, we found that 30.0% of MD rounds overlapped with a nurse at the bedside. This baseline data highlight one potential barrier to institution-wide bedside interdisciplinary rounds. Workflow changes, such as better co-localization of patients by service lines or utilization of technologies to augment the visibility of rounding physicians, may improve this overlap frequency.
Data in the literature regarding how much interaction physicians and nurses have, especially at the bedside, are sparse and vary widely. In a recent study using medical students as observers by Stickrath et al., 807 MD rounding events led by medicine attendings were observed over 90 days. The frequency of rounding events that included “communication with nurse” was only 12%.19 Furthermore, only 64.9% of these communications were at the bedside, for an effective prevalence of bedside MD–RN communication of 7.8%. This number is low compared to our observed frequency of 30.0%. On the other extreme, a study from a hospital that intentionally institutes multidisciplinary rounding (explicitly defined as involving a physician and a nurse at a bedside) reported a frequency range of 63% to 81%.7 A follow-up study by the same group again demonstrated a high frequency of multidisciplinary rounds (74%) across a variety of ward and specialty types (range 35% to 97%.).11 However, because of the selection bias of this particular setting, the high prevalence does not reflect a generalizable frequency of bedside MD–RN overlap at most hospitals.
The length of time spent by physicians at the patient bedside balances the competing demands of patient care and rapport-building with maintaining efficiency and progressing to other important tasks. In our study, physicians spent an average of 7.31 minutes at the bedside per patient. A previously published multiinstitutional observational study, which included our hospital, reported that the average length of rounds at bedside was 4.8 minutes.13 A second study reported that 8.0 minutes were spent at the bedside per patient.7 All three studies examined the same setting of internal medicine rounds at academic university-based hospitals, led by an attending physician with junior and senior residents present. However, the methodologies to measure the length of physician rounds were different: Priest et al. involved observers, Gonzalos et al. used E-mail-based surveys, and we utilized RFID-based locators. Additional institutional, individual, and patient-based factors also influence the length of rounds and are challenging to directly measure.
Furthermore, the discovery that the length of rounds and the frequency of MD–RN overlap did not statistically differ between weekdays and weekends (P > .05) was unexpected. Given the general trend of reduced physician staffing on weekends and the practice of cross-covering larger patient censuses, we would have expected shorter rounds and less frequent MD–RN overlap on the weekends.7,20 The remarkable similarity between weekday and weekend metrics suggests that our workflow and rounding habits are not compromised on the weekends.
In addition, we found that MD rounds with a nurse at bedside took longer than rounds without a nurse, and that patient rooms located farther away from the central nursing station had a lower frequency of MD–RN overlap. However, we want to emphasize that these findings are merely associative, and not causal. For example, sicker patients usually take longer to round on than stable patients, and it is also the sicker patients who are more likely to have their nurses at the bedside, independent of physician rounding activity. Furthermore, even if rounding with nurses takes more time, it may ultimately result in fewer pages and overall time savings for both physicians and nurses.6
With regards to the association between room location and frequency of MD–RN overlap, the data can be interpreted in two ways. On the one hand, if the distance between the patient room and the nursing station does, in fact, reduce the frequency of overlap by almost 2% per room (Figure 4b), these data can be informative for future workflow development, quality improvement projects, or even hospital design. On the other hand, many wards might intentionally place more stable, less acute patients farther away from the nursing station because they do not need to be watched as closely. In that case, these data confirm their expectations and no action is needed.
There are several limitations to our study. The principal limitation, as discussed above, is that while our RFID system can generate large quantities of precise data on MD–RN overlap, we do not know the qualitative nature of the overlap. Just because a nurse and a physician are in the same room at the same time does not mean that they are communicating with each other. Second, we defined “rounding” as lasting a minimum of 10 seconds at the bedside. We believe that at least 10 seconds is needed to engage in any meaningful interaction between the physician and the patient, or the physician and the nurse. Reducing the time cutoff below 10 seconds risks capturing more “noise,” (decreasing specificity) whereas increasing the time cutoff above 10 seconds risks losing out on encounters that actually had substantial communication (decreasing sensitivity). Even if the communications can be classified as pure “social check-ins,” we believe these are important data to capture, as social check-ins are an important part of the patient’s care and experience. Third, several studies have commented on the modest accuracy of RFID technology as a locator system.15,21 To address this, we both validated the accuracy of our RFID tags prior to the study and restricted our measurements to only inside patient rooms, which has less signal noise than hallways.
Future directions include expanding this study to include housestaff and physicians from other specialities, which may reveal different patterns and metrics of patient and nurse interactions.
CONCLUSION
RFID technology is a high-throughput method of generating precise, quantitative, and objective data on physician and nurse rounding habits. This tool can be widely applied to generate baseline rounding and overlap data for a variety of wards and settings, especially for institutions that are interested in comparing their metrics and performance to other peer wards or hospitals. Furthermore, this method can generate the necessary pre- and postintervention data for countless quality improvement endeavors, including efforts to enhance bedside interdisciplinary rounding.
Acknowledgments
The authors would like to thank the attending hospitalists who piloted wearing the RFID tags. This study would not be possible without your participation. The authors also wish to extend their appreciation to Gretchen Brown, MSN RN NEA-BC, for her support. Finally, the authors would like to thank Dr. Laurence Katznelson, Thi Dinh La, and the Resident Safety Council at Stanford, as well as the Stanford GME Office.
Disclosures
The authors have nothing to disclose.
1. Knaus WA, Draper EA, Wagner DP, Zimmerman JE. An evaluation of outcome from intensive care in major medical centers. Ann Intern Med. 1986;104(3):410-418. https://doi.org/10.7326/0003-4819-104-3-410.
2. Larrabee JH, Ostrow CL, Withrow ML, Janney MA, Hobbs GR, Burant C. Predictors of patient satisfaction with inpatient hospital nursing care. Res Nurs Health. 2004;27(4):254-268. https://doi.org/10.1002/nur.20021.
3. Rosenstein AH. Nurse-physician relationships: impact on nurse satisfaction and retention. AJN Am J Nurs. 2002;102(6):26-34. PubMed
4. Galletta M, Portoghese I, Battistelli A, Leiter MP. The roles of unit leadership and nurse-physician collaboration on nursing turnover intention. J Adv Nurs. 2013;69(8):1771-1784. https://doi.org/10.1111/jan.12039.
5. Wanzer MB, Wojtaszczyk AM, Kelly J. Nurses’ perceptions of physicians’ communication: the relationship among communication practices, satisfaction, and collaboration. Health Commun. 2009;24(8):683-691. https://doi.org/10.1080/10410230903263990.
6. Ratelle J, Henkin S, Chon T, Christopherson M, Halvorsen A, Worden L. Improving nurse-physician teamwork through interprofessional bedside rounding. J Multidiscip Healthc. 2016;9:201. https://doi.org/10.2147/JMDH.S106644.
7. Gonzalo JD, Kuperman E, Lehman E, Haidet P. Bedside interprofessional rounds: perceptions of benefits and barriers by internal medicine nursing staff, attending physicians, and housestaff physicians. J Hosp Med. 2014;9(10):646-651. https://doi.org/10.1002/jhm.2245.
8. Rimmerman CM. Establishing patient-centered physician and nurse bedside rounding. Physician Exec. 2013;39(3):22. PubMed
9. Curley C, McEachern JE, Speroff T. A firm trial of interdisciplinary rounds on the inpatient medical wards: an intervention designed using continuous quality improvement. Med Care. 1998;36(8):AS4-AS12. PubMed
10. Rothberg MB, Steele JR, Wheeler J, Arora A, Priya A, Lindenauer PK. The relationship between time spent communicating and communication outcomes on a hospital medicine service. J Gen Intern Med. 2012;27(2):185-189. https://doi.org/10.1007/s11606-011-1857-8.
11. Gonzalo JD, Himes J, McGillen B, Shifflet V, Lehman E. Interprofessional collaborative care characteristics and the occurrence of bedside interprofessional rounds: a cross-sectional analysis. BMC Health Serv Res. 2016;16(1):459. https://doi.org/10.1186/s12913-016-1714-x.
12. Nair DM, Fitzpatrick JJ, McNulty R, Click ER, Glembocki MM. Frequency of nurse-physician collaborative behaviors in an acute care hospital. J Interprof Care. 2012;26(2):115-120. https://doi.org/10.3109/13561820.2011.637647.
13. Priest JR, Bereknyei S, Hooper K, Braddock CH. Relationships of the location and content of rounds to specialty, institution, patient-census, and team Size. PLoS One. 2010;5(6):e11246. https://doi.org/10.1371/journal.pone.0011246.
14. Li L, Hains I, Hordern T, Milliss D, Raper R, Westbrook J. What do ICU doctors do?: a multisite time and motion study of the clinical work patterns of registrars. Crit Care Resusc. 2015;17(3):159. PubMed
15. Okoniewska B, Graham A, Gavrilova M, et al. Multidimensional evaluation of a radio frequency identification wi-fi location tracking system in an acute-care hospital setting. J Am Med Inform Assoc. 2012;19(4):674-679. https://doi.org/10.1136/amiajnl-2011-000560.
16. Ward DR, Ghali WA, Graham A, Lemaire JB. A real-time locating system observes physician time-motion patterns during walk-rounds: a pilot study. BMC Med Educ. 2014;14:37. https://doi.org/10.1186/1472-6920-14-37.
17. Fahey L, Dunn Lopez K, Storfjell J, Keenan G. Expanding potential of radiofrequency nurse call systems to measure nursing time in patient rooms. J Nurs Adm. 2013;43(5):302-307. https://doi.org/10.1097/NNA.0b013e31828eebe1.
18. Hendrich A, Chow M, Skierczynski BA, Lu Z. A 36-hospital time and motion study: how do medical-surgical nurses spend their time? Perm J. 2008:50. PubMed
19. Stickrath C, Noble M, Prochazka A, et al. Attending rounds in the current era: what is and is not happening. JAMA Intern Med. 2013;173(12):1084. https://doi.org/10.1001/jamainternmed.2013.6041.
20. Blecker S, Goldfeld K, Park H, et al. Impact of an intervention to improve weekend hospital care at an academic medical center: an observational study. J Gen Intern Med. 2015;30(11):1657-1664. https://doi.org/10.1007/s11606-015-3330-6
21. Westbrook JI, Duffield C, Li L, Creswick NJ. How much time do nurses have for patients? A longitudinal study quantifying hospital nurses’ patterns of task time distribution and interactions with health professionals. BMC Health Serv Res. 2011;11(1):319. https://doi.org/10.1186/1472-6963-11-319.
Effective communication between physicians and nurses is an essential element of any healthcare system. Numerous studies have highlighted the benefits of high quality physician–nurse (MD–RN) communication, including improved patient outcomes,1 higher patient satisfaction,2 and better nurse job satisfaction and retention rates.3-5 Having physicians and nurses round together (bedside interdisciplinary rounding) has been shown to improve the perception of teamwork,6,7 reduce the number of pages for the physician team,6,8 better involve the patients in developing the plan of care,8 and even decrease the length and cost of stay.9
Being physically in the same space at the same time is the first and nonnegotiable requirement of bedside interdisciplinary rounding. However, precise and objective data regarding the extent to which physicians and nurses overlap at the patient bedside are lacking. Studies that examine the face-to-face component of MD–RN communication have generally relied on either qualitative methods, such as focus groups and surveys,10,11 or quantitative methods that are subjective, such as validated scales.12 In addition, the few studies that report quantitative data usually rely on manual observation methods that can be affected by various forms of observer bias.10,13,14 There is also a paucity of data on how bedside overlap changes over the work week or as a function of room location.
Recently, real-time locator systems using radio frequency identification (RFID) have allowed measurement of staff and equipment movement in a precise and quantitative manner.9,15 Although there have been previous studies using RFID locators to create time-motion maps of various hospital staff, no study has used RFID to measure and analyze the workflow of both physicians and nurses simultaneously.16-18 The purpose of our investigation was to utilize our hospital-wide RFID staff locator technology to accurately and quantitatively assess physician and nurse rounding habits. Understanding the current rate of overlap is an important first step to establishing bedside interdisciplinary rounding.
METHODS
Setting and Participants
The investigation was conducted at a single quaternary-care academic center. The study is exempt per our Institutional Review Board. Data were gathered from three adjacent medical-surgical acute care wards. The layout for each ward was the same: 19 single- or double-occupancy patient rooms arranged in a linear hallway, with a nursing station located at the center of the ward.
The study utilized wearable RFID tags (manufactured by Hill-Rom Holdings, Inc) that located specific staff within the hospital in real time. The RFID tags were checked at Hill-Rom graphical stations to ensure that their locations were tracked accurately. The investigators also wore them and walked around the wards in a prescripted manner to ensure validity. In addition, the locator accuracy was audited by participating attendings once per week and cross-checked with the generated data. Attending physicians on the University Hospitalist inpatient medicine teams were then given their uniquely-tagged RFIDs at the beginning of this study. Nurses already wear individual RFID tags as part of their normal standard-of-care workflow.
The attending hospitalists wore their RFID tags when they were on service for the entirety of the shift. They were encouraged to include nurses at the bedside, but this was not mandatory. The rounding team also included residents and medical students. Rounding usually begins at a prespecified time, but the route taken varies daily depending on patient location. Afternoon rounds were done as needed, depending on patient acuity. The attending physicians’ participation in this study was not disclosed to the patient. The patient care activities and daily routines of both nurses and physicians were otherwise unaltered.
Study Design and Data Collection
Data were collected on the three wards for 90 consecutive days, including nights and weekends. As physicians and nurses moved throughout the ward to conduct their usual patient care activities, the temporal-spatial data associated with their unique RFIDs were automatically collected in real time by the Hill-Rom receivers built into each patient room. Every day, a spreadsheet detailing the activity of all participating nurses and physicians for the past 24 hours was generated for the investigators.
A rounding event was defined as any episode in which a physician was in a patient room for more than 10 seconds. Incidences in which a physician entered and left a room multiple times over a short time span (with less than five minutes in between each event) were classified as a single rounding event. A physician and a nurse were defined as having overlapped if their RFID data showed that they were in the same patient room for a minimum of 10 seconds at the same time. For the purposes of this study, data generated from other RFID-wearing professionals, such as nursing assistants or unit secretaries, as well as data collected from the hallways, were excluded.
Statistical Analysis
All statistical analyses were conducted using GraphPad Prism (GraphPad Software, San Diego, California). Rounding and overlap lengths were rounded to the nearest minute (minimum one minute). Mean lengths are expressed along with the standard error. Comparisons of the average lengths of MD rounding events between wards was conducted using two-tailed Student t-test or one-way ANOVA. Comparisons of the frequency of MD–RN overlap between wards and across different days of the week were performed using a Chi-squared test. The analysis of correlation between the frequency of MD–RN overlap and distance between patient room and nursing station was conducted by calculating Pearson’s correlation. A P value of less than .05 was considered statistically significant.
RESULTS
Baseline Rounding Characteristics
Over the study period of 90 consecutive days, 739 MD rounding events were captured, for an average of 8.2 events per day. The mean length of all MD rounding events was 7.31 minutes (±0.27, ranging from one to 70 minutes). Of these 739 MD rounding events, we separately examined the 267 events that took place in single-bed patient rooms, to control for false-positive physician and nurse interactions (for example, if the MD and RN were caring for two separate roommates). The average rounding length of single-bed rooms was 6.93 (±0.27) minutes (Figure 1). For the three individual wards, the average rounding lengths were 6.40 ± 0.73, 7.48 ± 0.94, and 7.02 ± 0.54 minutes, respectively (no statistically significant difference).
Frequency of MD–RN Overlap
Of the 267 MD rounding events observed in single-bed rooms, a nurse was present in the room for 80 events (30.0%). The frequencies of MD–RN overlap in patient rooms were 37.0% (30/81), 28.0% (14/50), and 26.5% (36/136) for the three individual wards (P > .05), respectively.
The durations of MD–RN overlap, when these events did occur, were 3.43 ± 0.38, 3.00 ± 0.70, and 3.69 ± 0.92 minutes, respectively (P > .05). The overall mean length of MD–RN overlap for all single rooms was 3.48 ± 0.45 minutes.
Rounding Characteristics over the Course of the Week
To assess how rounding characteristics differed over the work week, we partitioned our data into the individual days of the week. The length of each MD rounding event (time spent in each patient room) did not vary significantly over the course of the week (Figure 2a). When the data for the individual days were aggregated into “weekdays” (Monday through Friday) and “weekends” (Saturday and Sunday), the mean lengths of MD rounds were 7.26 ± 0.32 minutes on weekdays and 7.47 ± 0.52 minutes on weekends (P > .05).
In addition, there was no difference in how frequently physicians and nurses overlapped at the patient bedside between weekdays and weekends. Of the 565 weekday MD rounding events, 238 had a nurse at bedside (42.1%), and of the 173 weekend MD rounding events, 73 had a nurse at bedside (42.2%; Figure 2b).
Effect of a Bedside Nurse on the Length of Rounds
Next, the data on the length of MD rounds were partitioned based on whether there was a bedside nurse present during rounds. The mean length of rounds with only MDs (without a bedside nurse) was 5.68 ± 0.24 minutes. By comparison, the mean length of rounds with both a nurse and a physician at the patient bedside was 9.56 ± 0.53 minutes (Figure 3). This difference was statistically significant (P < .001).
Association between Patient Room Location and the Likelihood of MD–RN Overlap
All three wards in this study have a linear layout, consisting of 19 patient rooms in a row (Figure 4a). The nursing station is located in a central position within each ward, across from the 10th patient room. The frequency of MD–RN overlap was calculated for each room, and each room was ranked according to its relative distance from the nursing station. For each individual ward, there was no statistically significant trend in MD–RN overlap frequency as a function of the distance to the nursing station (data not shown). However, when the data from all three wards were aggregated, there was a statistically significant trend (P < .05) with a negative Pearson correlation (r = –0.670; Figure 4b). The slope of the best fit line was 1.94, suggesting that for each additional room farther away from the nursing station, the likelihood of interdisciplinary rounds (with both physicians and nurses together at the bedside) decreases by almost 2%.
DISCUSSION
To the best of our knowledge, this is the first time-motion study of MD–RN overlap using real-time, RFID-based location technology to capture the rounding activity of both nurses and physicians. Our primary interest was to examine the extent of MD–RN overlap at the patient bedside. This is an important metric that can pave the way for bedside interdisciplinary rounds. Although the exact nature of nurse-physician communication was not measured using the methodology in this study, understanding the length of time physicians spend in patient rooms, across different wards and throughout the work week, provides insights on the current workflow and potential areas of improvement. For example, we found that 30.0% of MD rounds overlapped with a nurse at the bedside. This baseline data highlight one potential barrier to institution-wide bedside interdisciplinary rounds. Workflow changes, such as better co-localization of patients by service lines or utilization of technologies to augment the visibility of rounding physicians, may improve this overlap frequency.
Data in the literature regarding how much interaction physicians and nurses have, especially at the bedside, are sparse and vary widely. In a recent study using medical students as observers by Stickrath et al., 807 MD rounding events led by medicine attendings were observed over 90 days. The frequency of rounding events that included “communication with nurse” was only 12%.19 Furthermore, only 64.9% of these communications were at the bedside, for an effective prevalence of bedside MD–RN communication of 7.8%. This number is low compared to our observed frequency of 30.0%. On the other extreme, a study from a hospital that intentionally institutes multidisciplinary rounding (explicitly defined as involving a physician and a nurse at a bedside) reported a frequency range of 63% to 81%.7 A follow-up study by the same group again demonstrated a high frequency of multidisciplinary rounds (74%) across a variety of ward and specialty types (range 35% to 97%.).11 However, because of the selection bias of this particular setting, the high prevalence does not reflect a generalizable frequency of bedside MD–RN overlap at most hospitals.
The length of time spent by physicians at the patient bedside balances the competing demands of patient care and rapport-building with maintaining efficiency and progressing to other important tasks. In our study, physicians spent an average of 7.31 minutes at the bedside per patient. A previously published multiinstitutional observational study, which included our hospital, reported that the average length of rounds at bedside was 4.8 minutes.13 A second study reported that 8.0 minutes were spent at the bedside per patient.7 All three studies examined the same setting of internal medicine rounds at academic university-based hospitals, led by an attending physician with junior and senior residents present. However, the methodologies to measure the length of physician rounds were different: Priest et al. involved observers, Gonzalos et al. used E-mail-based surveys, and we utilized RFID-based locators. Additional institutional, individual, and patient-based factors also influence the length of rounds and are challenging to directly measure.
Furthermore, the discovery that the length of rounds and the frequency of MD–RN overlap did not statistically differ between weekdays and weekends (P > .05) was unexpected. Given the general trend of reduced physician staffing on weekends and the practice of cross-covering larger patient censuses, we would have expected shorter rounds and less frequent MD–RN overlap on the weekends.7,20 The remarkable similarity between weekday and weekend metrics suggests that our workflow and rounding habits are not compromised on the weekends.
In addition, we found that MD rounds with a nurse at bedside took longer than rounds without a nurse, and that patient rooms located farther away from the central nursing station had a lower frequency of MD–RN overlap. However, we want to emphasize that these findings are merely associative, and not causal. For example, sicker patients usually take longer to round on than stable patients, and it is also the sicker patients who are more likely to have their nurses at the bedside, independent of physician rounding activity. Furthermore, even if rounding with nurses takes more time, it may ultimately result in fewer pages and overall time savings for both physicians and nurses.6
With regards to the association between room location and frequency of MD–RN overlap, the data can be interpreted in two ways. On the one hand, if the distance between the patient room and the nursing station does, in fact, reduce the frequency of overlap by almost 2% per room (Figure 4b), these data can be informative for future workflow development, quality improvement projects, or even hospital design. On the other hand, many wards might intentionally place more stable, less acute patients farther away from the nursing station because they do not need to be watched as closely. In that case, these data confirm their expectations and no action is needed.
There are several limitations to our study. The principal limitation, as discussed above, is that while our RFID system can generate large quantities of precise data on MD–RN overlap, we do not know the qualitative nature of the overlap. Just because a nurse and a physician are in the same room at the same time does not mean that they are communicating with each other. Second, we defined “rounding” as lasting a minimum of 10 seconds at the bedside. We believe that at least 10 seconds is needed to engage in any meaningful interaction between the physician and the patient, or the physician and the nurse. Reducing the time cutoff below 10 seconds risks capturing more “noise,” (decreasing specificity) whereas increasing the time cutoff above 10 seconds risks losing out on encounters that actually had substantial communication (decreasing sensitivity). Even if the communications can be classified as pure “social check-ins,” we believe these are important data to capture, as social check-ins are an important part of the patient’s care and experience. Third, several studies have commented on the modest accuracy of RFID technology as a locator system.15,21 To address this, we both validated the accuracy of our RFID tags prior to the study and restricted our measurements to only inside patient rooms, which has less signal noise than hallways.
Future directions include expanding this study to include housestaff and physicians from other specialities, which may reveal different patterns and metrics of patient and nurse interactions.
CONCLUSION
RFID technology is a high-throughput method of generating precise, quantitative, and objective data on physician and nurse rounding habits. This tool can be widely applied to generate baseline rounding and overlap data for a variety of wards and settings, especially for institutions that are interested in comparing their metrics and performance to other peer wards or hospitals. Furthermore, this method can generate the necessary pre- and postintervention data for countless quality improvement endeavors, including efforts to enhance bedside interdisciplinary rounding.
Acknowledgments
The authors would like to thank the attending hospitalists who piloted wearing the RFID tags. This study would not be possible without your participation. The authors also wish to extend their appreciation to Gretchen Brown, MSN RN NEA-BC, for her support. Finally, the authors would like to thank Dr. Laurence Katznelson, Thi Dinh La, and the Resident Safety Council at Stanford, as well as the Stanford GME Office.
Disclosures
The authors have nothing to disclose.
1. Knaus WA, Draper EA, Wagner DP, Zimmerman JE. An evaluation of outcome from intensive care in major medical centers. Ann Intern Med. 1986;104(3):410-418. https://doi.org/10.7326/0003-4819-104-3-410.
2. Larrabee JH, Ostrow CL, Withrow ML, Janney MA, Hobbs GR, Burant C. Predictors of patient satisfaction with inpatient hospital nursing care. Res Nurs Health. 2004;27(4):254-268. https://doi.org/10.1002/nur.20021.
3. Rosenstein AH. Nurse-physician relationships: impact on nurse satisfaction and retention. AJN Am J Nurs. 2002;102(6):26-34. PubMed
4. Galletta M, Portoghese I, Battistelli A, Leiter MP. The roles of unit leadership and nurse-physician collaboration on nursing turnover intention. J Adv Nurs. 2013;69(8):1771-1784. https://doi.org/10.1111/jan.12039.
5. Wanzer MB, Wojtaszczyk AM, Kelly J. Nurses’ perceptions of physicians’ communication: the relationship among communication practices, satisfaction, and collaboration. Health Commun. 2009;24(8):683-691. https://doi.org/10.1080/10410230903263990.
6. Ratelle J, Henkin S, Chon T, Christopherson M, Halvorsen A, Worden L. Improving nurse-physician teamwork through interprofessional bedside rounding. J Multidiscip Healthc. 2016;9:201. https://doi.org/10.2147/JMDH.S106644.
7. Gonzalo JD, Kuperman E, Lehman E, Haidet P. Bedside interprofessional rounds: perceptions of benefits and barriers by internal medicine nursing staff, attending physicians, and housestaff physicians. J Hosp Med. 2014;9(10):646-651. https://doi.org/10.1002/jhm.2245.
8. Rimmerman CM. Establishing patient-centered physician and nurse bedside rounding. Physician Exec. 2013;39(3):22. PubMed
9. Curley C, McEachern JE, Speroff T. A firm trial of interdisciplinary rounds on the inpatient medical wards: an intervention designed using continuous quality improvement. Med Care. 1998;36(8):AS4-AS12. PubMed
10. Rothberg MB, Steele JR, Wheeler J, Arora A, Priya A, Lindenauer PK. The relationship between time spent communicating and communication outcomes on a hospital medicine service. J Gen Intern Med. 2012;27(2):185-189. https://doi.org/10.1007/s11606-011-1857-8.
11. Gonzalo JD, Himes J, McGillen B, Shifflet V, Lehman E. Interprofessional collaborative care characteristics and the occurrence of bedside interprofessional rounds: a cross-sectional analysis. BMC Health Serv Res. 2016;16(1):459. https://doi.org/10.1186/s12913-016-1714-x.
12. Nair DM, Fitzpatrick JJ, McNulty R, Click ER, Glembocki MM. Frequency of nurse-physician collaborative behaviors in an acute care hospital. J Interprof Care. 2012;26(2):115-120. https://doi.org/10.3109/13561820.2011.637647.
13. Priest JR, Bereknyei S, Hooper K, Braddock CH. Relationships of the location and content of rounds to specialty, institution, patient-census, and team Size. PLoS One. 2010;5(6):e11246. https://doi.org/10.1371/journal.pone.0011246.
14. Li L, Hains I, Hordern T, Milliss D, Raper R, Westbrook J. What do ICU doctors do?: a multisite time and motion study of the clinical work patterns of registrars. Crit Care Resusc. 2015;17(3):159. PubMed
15. Okoniewska B, Graham A, Gavrilova M, et al. Multidimensional evaluation of a radio frequency identification wi-fi location tracking system in an acute-care hospital setting. J Am Med Inform Assoc. 2012;19(4):674-679. https://doi.org/10.1136/amiajnl-2011-000560.
16. Ward DR, Ghali WA, Graham A, Lemaire JB. A real-time locating system observes physician time-motion patterns during walk-rounds: a pilot study. BMC Med Educ. 2014;14:37. https://doi.org/10.1186/1472-6920-14-37.
17. Fahey L, Dunn Lopez K, Storfjell J, Keenan G. Expanding potential of radiofrequency nurse call systems to measure nursing time in patient rooms. J Nurs Adm. 2013;43(5):302-307. https://doi.org/10.1097/NNA.0b013e31828eebe1.
18. Hendrich A, Chow M, Skierczynski BA, Lu Z. A 36-hospital time and motion study: how do medical-surgical nurses spend their time? Perm J. 2008:50. PubMed
19. Stickrath C, Noble M, Prochazka A, et al. Attending rounds in the current era: what is and is not happening. JAMA Intern Med. 2013;173(12):1084. https://doi.org/10.1001/jamainternmed.2013.6041.
20. Blecker S, Goldfeld K, Park H, et al. Impact of an intervention to improve weekend hospital care at an academic medical center: an observational study. J Gen Intern Med. 2015;30(11):1657-1664. https://doi.org/10.1007/s11606-015-3330-6
21. Westbrook JI, Duffield C, Li L, Creswick NJ. How much time do nurses have for patients? A longitudinal study quantifying hospital nurses’ patterns of task time distribution and interactions with health professionals. BMC Health Serv Res. 2011;11(1):319. https://doi.org/10.1186/1472-6963-11-319.
© 2019 Society of Hospital Medicine
Evaluation of the Mantram Repetition Program for Health Care Providers
According to the National Institute for Occupational Safety and Health (NIOSH), stress is a major problem for more than 18 million US health care workers (HCWs).1 Increases in technology, high patient acuity, and new demands for meeting institutional benchmarks create stressful clinical work environments. HCWs at the US Department of Veterans Affairs (VA) are perhaps at particular risk of experiencing burnout due to the unique needs of VA patients and bureaucratic demands.2 Stress may lead to depression, decreased job satisfaction, and other psychological distress among HCWs.3 This, in turn, affects the delivery of care. High levels of burnout have been associated with increased medication errors, lower quality of care, and lower patient satisfaction scores.4-10
A Cochrane Review found that mental and physical relaxation reduce stress in HCWs.11 Among these, meditative interventions (eg, mindfulness, meditation, yoga) have demonstrated promise.12-14 Results from a systematic meta-analysis of meditative interventions for HCWs indicated small-to-moderate improvements in emotional exhaustion, sense of personal accomplishment, and life satisfaction. Additional research is needed to determine effects of meditative interventions on burnout and caregiver burden.15
Unfortunately, many meditative intervention programs are lengthy and require a significant investment of time. They also require some form of sitting meditation every day, placing additional demands on busy HCWs. There remains a need for practical strategies to reduce HCW stress that are easier to master and practice.
Background
We developed, implemented, evaluated, and modified an evidence-based meditative intervention called the Mantram Repetition Program (MRP) to address workplace stress and burnout. The MRP is a mind-body, spiritually enhanced intervention that offers benefits similar to other types of meditative interventions.16 MRP is composed of 3 primary components: (1) silently repeating a self-selected, meaningful word or phrase (here called a mantram); (2) intentionally slowing down thoughts and behaviors; and (3) developing the ability to focus on a single task at a time (ie, one-pointed attention). The MRP does not require participants to set aside a specific place to practice, and mantram repetition can be initiated intermittently and privately throughout the day (eg, between tasks, while walking or waiting). Examples of 4 sessions (eg, Mantram 1, 2, 3, and 4) can be found on the PsychArmor Institute website (www.psycharmor.org; San Diego, CA).
Initially, the MRP was offered in a group format, in 6 or 8 weekly, 90-minute face-to-face sessions to both patient and nonpatient populations. Studies in veterans with chronic diseases demonstrated improvements in perceived stress, anxiety, and anger, and increased levels of spiritual well-being and quality of life (QOL).17-19 Veterans with posttraumatic stress disorder (PTSD) reported improvements in PTSD symptoms, QOL, and spiritual well-being.20-23 Family caregivers of veterans with dementia reported significant reductions in caregiver burden, depression, and anxiety after participating in the MRP.24
Similar results have substantiated the effects of the MRP among HCWs, including reductions in perceived stress, stress of conscience (ie, the conflict that results from competing values and behaviors in the workplace), and burnout.25-27 HCWs also reported improvements in mindfulness and spiritual well-being.28 In a randomized controlled trial, South Korean nurse managers who completed the MRP demonstrated significant improvements in psychosocial and spiritual well-being and leadership practice and experienced reductions in burnout compared with that of the control group.27 In a qualitative study, the most frequently reported benefits of the MRP were improvements in managing symptoms of stress, anxiety, and feeling out of control.18
HCWs reported they found it difficult to attend the 8-week MRP face-to-face group classes. Therefore, we developed a shorter online version of the MRP consisting of six 1-hour educational sessions: 4 online self-learning modules, and 2 live meeting webinars with the course facilitator.28 VA employees were invited to enroll in the program from June 2013 through 2016 through group e-mails and announcements in the VA Employee Education Service newsletters. Those eligible to participate could earn up to 6 hours of continuing education.
Although the program was generally well accepted, feedback from HCWs indicated that providers still lacked enough time to participate fully. We therefore condensed the MRP into one 90-minute, videotaped webinar entitled “Mind-Body-Spiritual Strategies for a Healthy Workforce: The Mantram Repetition Program.” The webinar was delivered in real time in June 2013 and archived for viewing later. This condensed course provided an overview of the development, theory, and practice of MRP core components. Specific instructions included how to choose and use a mantram; the importance of acting slowly with intention to avoid mistakes; and ways of developing single-pointed attention. Participants were invited to complete a standard course evaluation using an online survey.
This article presents results from qualitative analyses of participant feedback for the condensed MRP in a nationwide sample of more than 1,700 HCWs within the VA. We used template summary analysis to identify themes in participants’ responses to 2 open-ended questions: “What about this learning activity was most useful to you?” and “What about this learning activity was least useful to you?” These results have implications for reducing HCW stress and developing training programs for HCWs.
Analysis
Responses to the what was most useful question were downloaded to a spreadsheet file for analyses. Investigators chose summary template analysis, a rapid qualitative analytic technique, as the best strategy for analyzing these textual data. This technique is often used in health services research when it is unrealistic to use more time-consuming qualitative methods, such as coding.29
To begin, the analyst, a PhD-level anthropologist, read through the feedback to identify similar words, phrases, and/or concepts (ie, themes). Once the analyst gained a sense of general themes, she developed category labels using verbatim words and/or phrases in the feedback (similar to developing in vivo codes.30 She listed these categories at the top of a summary template document, providing a definition for each to ensure analytic rigor.
Next, each category was listed down the left side of the template. Participant feedback was copied and pasted from the spreadsheet form into the appropriate category for each of 200 responses. The investigator identified subthemes within each category. After analysis was completed for the first 200 course participants, the analyst grouped similar categories together into broader domains to further organize the data. She then read through the feedback from the remaining 917 course participants to identify negative cases (ie, dissimilarities in feedback). An additional researcher familiar with the condensed MRP training then examined the categories and domains. Together, they discussed and resolved any inconsistencies in interpretation of the data.
To get a better sense of the full range of perspectives about the training, the analyst then read through the written feedback for the what was least useful question. She scanned the feedback for negative cases that contradicted template findings and noted these in a document. A more balanced evaluation of the course emerged through this secondary analysis.
Results
Online surveys were completed by 1,117 participants, of which three-quarters (841) were female. Two hundred eleven (19%) viewed the condensed MRP in real time. The remaining participants viewed an online video of the course. Anonymous course evaluations captured only gender and professional classification of participants. Participants represented a wide range of professional roles. The majority (63%) held clinical positions with direct patient care. The next largest category included administrative or health information personnel (21%). There were also students and trainees among these categories.
Qualitative Findings
Feedback about the course was organized into categories during analysis: (1) instructional format; (2) mode of delivery; (3) course content; (4) professional and personal empowerment; (5) religion and spirituality; and (6) ease of mantram practice. These categories represented 2 broad domains: feedback about the course and feedback about the intervention.
Instructional Format
HCWs often reported that the most useful aspect of the course was the instructional format. Most cited the ease with which they could understand the materials and helpfulness of the examples of mantram practice. The option to download course materials for later reference was also useful. Some HCWs indicated that the course could have been improved by incorporating an experiential component in which participants paused to practice a mantram.
Mode of Delivery
Delivery mode including the convenience of the training and the flexibility of having the course available at both work and home was mentioned in the feedback. Some HCWs reported that the most useful aspect of the training was the on-demand feature, which allowed them to stop and restart the program as needed. A few, however, referenced technical difficulties with the webinar.
Content
HCWs also indicated that general information about mantram repetition and information regarding the benefits of the intervention (eg, stress reduction) were useful. The scientific basis of mantram was described as useful by some, though others reported it as least useful. Practical guidance regarding the appropriate time and place to practice a mantram as well as concrete information regarding how to select a mantram was mentioned as the most useful by other participants.
Professional and Personal Empowerment
Professional and personal empowerment was referenced in evaluations. Professional development, such as learning a strategy for enhancing work performance, was reported as positive. HCWs also reported that learning a new strategy for self-care and coping with stress was useful. Some described having experienced a sense of validation by participating in the course that was empowering. Finally, some HCWs indicated the personal growth experienced as the most useful.
Religion and Spirituality
General statements regarding the utility of having learned a spiritually-based practice that crossed religious boundaries as well as general references to the power of prayer were listed in the feedback. Other HCWs indicated the usefulness of having learned that a mantram could be secular.
Ease of Mantram
HCWs referenced the ease with which a mantram can be learned and/or practiced. Course participants described the simplicity of mantram repetition and referenced its portability (ie, it can be practiced in many different settings). Finally, the overall flexibility of mantram practice of where and when it can be performed was also described as useful.
Discussion
Qualitative feedback from participant evaluations of a 90-minute, virtual online MRP course suggests that HCWs representing all areas of care are interested in learning practical strategies for managing workplace stress. Participants overwhelmingly perceived mantram practice as feasible to implement, with the portability of mantram repetition described as particularly useful. This aspect of mantram repetition represents a distinct advantage over meditative interventions that require a dedicated space and time in which to practice (eg, yoga postures, sitting meditation).
These preliminary findings also suggest that mantram practice is acceptable to HCWs representing a variety of roles. Participants indicated that they valued learning a meditative practice that can be interpreted as spiritual or secular, depending on the word or phrase chosen. Only 1 participant reported that the practice of mantram conflicted with his/her personal beliefs. A small minority of participants who found the discussion of spirituality disconcerting nevertheless indicated that the intervention was acceptable to them.
The finding that even a 90-minute course was challenging for some HCWs to accommodate speaks to the importance of developing short-duration stress-reduction programs. The standardized Mindfulness Based Stress Reduction (MBSR) program consists of 8 weekly 2.5-hour sessions and a full-day retreat for an overall commitment of 29 to 33 hours.31 Additionally, a systematic review of meditative interventions for informal and professional caregivers found that programs ranged from 4 to 8 weeks.15 These lengthier programs are likely more challenging than the condensed MRP.
These results also suggest the importance of general guidelines for meditative intervention courses for reducing HCW stress. The mode of delivery should be as flexible as possible, allowing course participants to start, stop, and restart the program as needed and to participate from a location most convenient to them. Although presenting evidence for clinical effectiveness is critical for establishing credibility, statistical data should be briefly summarized. An experiential component in which participants are encouraged to practice the intervention will enhance learning and ensure the translation of knowledge into practice. Finally, framing meditative practices as compatible with many different faiths and/or secular will enhance their acceptability.
Three recommended components of an overall strategy for reducing occupational burnout in health care settings include modifying the organizational structure and work processes, improving the fit between the organization and HCWs, and promoting and allowing time for individuals to learn strategies for coping with work-related stress.32 This 90-minute online MRP course represents an aspect of an overall strategy to reduce HCW stress and burnout. Providing opportunities for HCWs to learn strategies for managing stress could enhance the quality of care and improve patient outcomes. Future pragmatic trials could determine whether mantram practice impacts clinical care at the VA and elsewhere.
Limitations
All participants were self-selected; therefore, the findings may be biased favorably toward the intervention. These qualitative analyses are not generalizable. HCWs in other, non-VA settings might have different needs and/or stressors that should be considered in future program development. If this intervention is offered to a wider audience, then other formats ought to be offered, such as print, at-home recordings, live meeting, and face-to-face.
Conclusion
Course participants reported that the condensed 90-minute virtual MRP was convenient to complete. They described the intervention as flexible and easy to learn. Participants indicated that they intended to implement what they learned in the course to reduce work-related stress. This feedback can be used to recommend guidelines for developing meditative interventions aimed at reducing stress in HCWs.
Acknowledgments
This material is based on work supported by the US Department of Veterans Affairs (VA), VA Employee Education Service and with resources from the VA San Diego Healthcare System and the VA Center for Mental Healthcare & Outcomes Research, South Central Mental Illness Research, Education, and Clinical Center at the Central Arkansas Veterans Healthcare System.
1. Centers for Disease Control and Prevention, National Institute for Occupational Safety and Health (NIOSH). Workplace safety and health topic: health care workers. http://www.cdc.gov/niosh/topics/healthcare. Updated May 9, 2018. Accessed April 8, 2019.
2. Voss Horrell SC, Holohan DR, Didion LM, Vance GT. Treating traumatized OEF/OIF veterans: how does trauma treatment affect the clinician? Prof Psychol Res Pract. 2011;42(1):79-86.
3. Centers for Disease Control and Prevention, National Institute for Occupational Safety and Health. Exposure to stress: occupational hazards in hospitals. http://www.cdc.gov/niosh/docs/2008-136/default.html. Published July 2008. Accessed April 9, 2019.
4. Fahrenkopf AM, Sectish TC, Barger LK. Rates of medication errors among depressed and burnt out residents: prospective cohort study. BMJ. 2008;336(7642):488-491.
5. Melnyk BM, Orsolini L, Tan A, et al. A national study links nurses’ physical and mental health to medical errors and perceived worksite wellness. J Occup Environ Med. 2018;60(2):126-131.
6. Shanafelt TD, Balch CM, Bechamps G, et al. Burnout and medical errors among American surgeons. Ann Surg. 2010;251(6):995-1000.
7. Aiken LH, Clarke SP, Sloane DM, Sochalski J, Silber JH. Hospital nurse staffing and patient mortality, nurse burnout, and job dissatisfaction. JAMA. 2002;288(16):1987-1993.
8. Poghosyan L, Clarke SP, Finlayson M, Aiken LH. Nurse burnout and quality of care: cross-national investigation in six countries. Res Nurs Health. 2010;33(4):288-298.
9. Rios-Risquez MI, García-Izquierdo M. Patient satisfaction, stress and burnout in nursing personnel in emergency departments: a cross-sectional study. Int J Nurs Stud. 2016;59:60-67.
10. Vahey DC, Aiken LH, Sloane DM, Clarke SP, Delfino V. Nurse burnout and patient satisfaction. Med Care. 2004;42(2 suppl):II57-II66.
11. Ruotsalainen JH, Verbeek JH, Mariné A, Serra C. Preventing occupational stress in health care workers. Cochrane Database Syst Rev. 2015;7(4):CD002892.
12. Elder C, Nidich S, Moriarty F, Nidich R. Effect of transcendental meditation on employee stress, depression, and burnout: a randomized controlled study. Perm J. 2014;18(1):19-23.
13. Prasad K, Wahner-Roedler DL, Cha SS, Sood A. Effect of a single-session meditation training to reduce stress and improve quality of life among health care professionals: a “dose-ranging” feasibility study. Altern Ther Health Med. 2011;17(3):46-49.
14. Jamieson SD, Tuckey MR. Mindfulness interventions in the workplace: a critique of the current state of the literature. J Occup Health Psychol. 2017;22(2):180-193.
15. Dharmawardene M, Givens J, Wachholtz A, Makowski S, Tjia J. A systematic review and meta-analysis of meditative interventions for informal caregivers and health professionals. BMJ Support Palliat Care. 2016;6(2):160-169.
16. Goyal M, Singh S, Sibinga EM, et al. Meditation programs for psychological stress and well-being: a systematic review and meta-analysis. JAMA Intern Med. 2014;174(3):357-368.
17. Bormann JE, Smith TL, Becker S, et al. Efficacy of frequent mantram repetition on stress, quality of life, and spiritual well-being in veterans: a pilot study. J Holist Nurs. 2005;23(4):395-414.
18. Bormann JE, Oman D, Kemppainen JK, Becker S, Gershwin M, Kelly A. Mantram repetition for stress management in veterans and employees: a critical incident study. J Adv Nurs. 2006;53(5):502-512.
19. Buttner MM, Bormann JE, Weingart K, Andrews T, Ferguson M, Afari N. Multi-site evaluation of a complementary, spiritually-based intervention for veterans: the mantram repetition program. Complement Ther Clin Pract. 2016;22:74-79.
20. Bormann JE, Hurst S, Kelly A. Responses to mantram repetition program from veterans with posttraumatic stress disorder: a qualitative analysis. J Rehabil Res Dev. 2013;50(6):769-784.
21. Bormann JE, Thorp S, Wetherell JL, Golshan S. A spiritually based group intervention for combat veterans with posttraumatic stress disorder: feasibility study. J Holist Nurs. 2008;26(2):109-116.
22. Bormann JE, Thorp SR, Wetherell JL, Golshan S, Lang AJ. Meditation-based mantram intervention for veterans with posttraumatic stress disorder: a randomized trial. Psychol Trauma: Theory Res Pract Policy. 2013;5(3):259-267.
23. Bormann JE, Thorp SR, Smith E, et al. Individual treatment of posttraumatic stress disorder using mantram repetition: a randomized clinical trial. Am J Psych. 2018;175(10):979-988.
24. Bormann JE, Warren KA, Regalbuto L, et al. A spiritually-based caregiver intervention with telephone delivery for family caregivers of veterans with dementia. Fam Community Health. 2009;32(4):345-353.
25. Bormann JE, Becker S, Gershwin M, et al. Relationship of frequent mantram repetition to emotional and spiritual well-being in healthcare workers. J Contin Educ Nurs. 2006;37(5):218-224.
26. Leary F, Weingart K, Topp R, Bormann JE. The effect of mantram repetition on burnout and stress among VA staff. Workplace Health Saf. 2018;66(3):120-128.
27. Yong J, Kim J, Park J, Seo I, Swinton BD. Effects of a spirituality training program on the spiritual and psychosocial well-being of hospital middle manager nurses in Korea. J Contin Educ Nurs. 2011;42(6):280-288.
28. Bormann JE, Walter KH, Leary S, Glaser D. An internet-delivered mantram repetition program for spiritual well-being and mindfulness for health care workers. Spirit Clin Pract. 2017;4(1):64-73.
29. Hamilton S, Pinfold V, Cotney J. Qualitative analysis of mental health service users’ reported experiences of discrimination. Acta Psychiatr Scand. 2016;134(suppl 446):14-22.
30. Ryan GW, Bernard HR. Techniques to identify themes. Field Meth. 2003;15(1):85-109.
31. Hoge EA, Bui E, Marques L, et al. Randomized controlled trial of mindfulness meditation for generalized anxiety disorder: effects on anxiety and stress reactivity. J Clin Psychiatry. 2013;74(8):786-792.
32. Lee RT, Seo B, Hladkyj S, Lovell BL, Schwartzmann L. Correlates of physician burnout across regions and specialties: a meta-analysis. Hum Resour Health. 2013;11(1):48.
According to the National Institute for Occupational Safety and Health (NIOSH), stress is a major problem for more than 18 million US health care workers (HCWs).1 Increases in technology, high patient acuity, and new demands for meeting institutional benchmarks create stressful clinical work environments. HCWs at the US Department of Veterans Affairs (VA) are perhaps at particular risk of experiencing burnout due to the unique needs of VA patients and bureaucratic demands.2 Stress may lead to depression, decreased job satisfaction, and other psychological distress among HCWs.3 This, in turn, affects the delivery of care. High levels of burnout have been associated with increased medication errors, lower quality of care, and lower patient satisfaction scores.4-10
A Cochrane Review found that mental and physical relaxation reduce stress in HCWs.11 Among these, meditative interventions (eg, mindfulness, meditation, yoga) have demonstrated promise.12-14 Results from a systematic meta-analysis of meditative interventions for HCWs indicated small-to-moderate improvements in emotional exhaustion, sense of personal accomplishment, and life satisfaction. Additional research is needed to determine effects of meditative interventions on burnout and caregiver burden.15
Unfortunately, many meditative intervention programs are lengthy and require a significant investment of time. They also require some form of sitting meditation every day, placing additional demands on busy HCWs. There remains a need for practical strategies to reduce HCW stress that are easier to master and practice.
Background
We developed, implemented, evaluated, and modified an evidence-based meditative intervention called the Mantram Repetition Program (MRP) to address workplace stress and burnout. The MRP is a mind-body, spiritually enhanced intervention that offers benefits similar to other types of meditative interventions.16 MRP is composed of 3 primary components: (1) silently repeating a self-selected, meaningful word or phrase (here called a mantram); (2) intentionally slowing down thoughts and behaviors; and (3) developing the ability to focus on a single task at a time (ie, one-pointed attention). The MRP does not require participants to set aside a specific place to practice, and mantram repetition can be initiated intermittently and privately throughout the day (eg, between tasks, while walking or waiting). Examples of 4 sessions (eg, Mantram 1, 2, 3, and 4) can be found on the PsychArmor Institute website (www.psycharmor.org; San Diego, CA).
Initially, the MRP was offered in a group format, in 6 or 8 weekly, 90-minute face-to-face sessions to both patient and nonpatient populations. Studies in veterans with chronic diseases demonstrated improvements in perceived stress, anxiety, and anger, and increased levels of spiritual well-being and quality of life (QOL).17-19 Veterans with posttraumatic stress disorder (PTSD) reported improvements in PTSD symptoms, QOL, and spiritual well-being.20-23 Family caregivers of veterans with dementia reported significant reductions in caregiver burden, depression, and anxiety after participating in the MRP.24
Similar results have substantiated the effects of the MRP among HCWs, including reductions in perceived stress, stress of conscience (ie, the conflict that results from competing values and behaviors in the workplace), and burnout.25-27 HCWs also reported improvements in mindfulness and spiritual well-being.28 In a randomized controlled trial, South Korean nurse managers who completed the MRP demonstrated significant improvements in psychosocial and spiritual well-being and leadership practice and experienced reductions in burnout compared with that of the control group.27 In a qualitative study, the most frequently reported benefits of the MRP were improvements in managing symptoms of stress, anxiety, and feeling out of control.18
HCWs reported they found it difficult to attend the 8-week MRP face-to-face group classes. Therefore, we developed a shorter online version of the MRP consisting of six 1-hour educational sessions: 4 online self-learning modules, and 2 live meeting webinars with the course facilitator.28 VA employees were invited to enroll in the program from June 2013 through 2016 through group e-mails and announcements in the VA Employee Education Service newsletters. Those eligible to participate could earn up to 6 hours of continuing education.
Although the program was generally well accepted, feedback from HCWs indicated that providers still lacked enough time to participate fully. We therefore condensed the MRP into one 90-minute, videotaped webinar entitled “Mind-Body-Spiritual Strategies for a Healthy Workforce: The Mantram Repetition Program.” The webinar was delivered in real time in June 2013 and archived for viewing later. This condensed course provided an overview of the development, theory, and practice of MRP core components. Specific instructions included how to choose and use a mantram; the importance of acting slowly with intention to avoid mistakes; and ways of developing single-pointed attention. Participants were invited to complete a standard course evaluation using an online survey.
This article presents results from qualitative analyses of participant feedback for the condensed MRP in a nationwide sample of more than 1,700 HCWs within the VA. We used template summary analysis to identify themes in participants’ responses to 2 open-ended questions: “What about this learning activity was most useful to you?” and “What about this learning activity was least useful to you?” These results have implications for reducing HCW stress and developing training programs for HCWs.
Analysis
Responses to the what was most useful question were downloaded to a spreadsheet file for analyses. Investigators chose summary template analysis, a rapid qualitative analytic technique, as the best strategy for analyzing these textual data. This technique is often used in health services research when it is unrealistic to use more time-consuming qualitative methods, such as coding.29
To begin, the analyst, a PhD-level anthropologist, read through the feedback to identify similar words, phrases, and/or concepts (ie, themes). Once the analyst gained a sense of general themes, she developed category labels using verbatim words and/or phrases in the feedback (similar to developing in vivo codes.30 She listed these categories at the top of a summary template document, providing a definition for each to ensure analytic rigor.
Next, each category was listed down the left side of the template. Participant feedback was copied and pasted from the spreadsheet form into the appropriate category for each of 200 responses. The investigator identified subthemes within each category. After analysis was completed for the first 200 course participants, the analyst grouped similar categories together into broader domains to further organize the data. She then read through the feedback from the remaining 917 course participants to identify negative cases (ie, dissimilarities in feedback). An additional researcher familiar with the condensed MRP training then examined the categories and domains. Together, they discussed and resolved any inconsistencies in interpretation of the data.
To get a better sense of the full range of perspectives about the training, the analyst then read through the written feedback for the what was least useful question. She scanned the feedback for negative cases that contradicted template findings and noted these in a document. A more balanced evaluation of the course emerged through this secondary analysis.
Results
Online surveys were completed by 1,117 participants, of which three-quarters (841) were female. Two hundred eleven (19%) viewed the condensed MRP in real time. The remaining participants viewed an online video of the course. Anonymous course evaluations captured only gender and professional classification of participants. Participants represented a wide range of professional roles. The majority (63%) held clinical positions with direct patient care. The next largest category included administrative or health information personnel (21%). There were also students and trainees among these categories.
Qualitative Findings
Feedback about the course was organized into categories during analysis: (1) instructional format; (2) mode of delivery; (3) course content; (4) professional and personal empowerment; (5) religion and spirituality; and (6) ease of mantram practice. These categories represented 2 broad domains: feedback about the course and feedback about the intervention.
Instructional Format
HCWs often reported that the most useful aspect of the course was the instructional format. Most cited the ease with which they could understand the materials and helpfulness of the examples of mantram practice. The option to download course materials for later reference was also useful. Some HCWs indicated that the course could have been improved by incorporating an experiential component in which participants paused to practice a mantram.
Mode of Delivery
Delivery mode including the convenience of the training and the flexibility of having the course available at both work and home was mentioned in the feedback. Some HCWs reported that the most useful aspect of the training was the on-demand feature, which allowed them to stop and restart the program as needed. A few, however, referenced technical difficulties with the webinar.
Content
HCWs also indicated that general information about mantram repetition and information regarding the benefits of the intervention (eg, stress reduction) were useful. The scientific basis of mantram was described as useful by some, though others reported it as least useful. Practical guidance regarding the appropriate time and place to practice a mantram as well as concrete information regarding how to select a mantram was mentioned as the most useful by other participants.
Professional and Personal Empowerment
Professional and personal empowerment was referenced in evaluations. Professional development, such as learning a strategy for enhancing work performance, was reported as positive. HCWs also reported that learning a new strategy for self-care and coping with stress was useful. Some described having experienced a sense of validation by participating in the course that was empowering. Finally, some HCWs indicated the personal growth experienced as the most useful.
Religion and Spirituality
General statements regarding the utility of having learned a spiritually-based practice that crossed religious boundaries as well as general references to the power of prayer were listed in the feedback. Other HCWs indicated the usefulness of having learned that a mantram could be secular.
Ease of Mantram
HCWs referenced the ease with which a mantram can be learned and/or practiced. Course participants described the simplicity of mantram repetition and referenced its portability (ie, it can be practiced in many different settings). Finally, the overall flexibility of mantram practice of where and when it can be performed was also described as useful.
Discussion
Qualitative feedback from participant evaluations of a 90-minute, virtual online MRP course suggests that HCWs representing all areas of care are interested in learning practical strategies for managing workplace stress. Participants overwhelmingly perceived mantram practice as feasible to implement, with the portability of mantram repetition described as particularly useful. This aspect of mantram repetition represents a distinct advantage over meditative interventions that require a dedicated space and time in which to practice (eg, yoga postures, sitting meditation).
These preliminary findings also suggest that mantram practice is acceptable to HCWs representing a variety of roles. Participants indicated that they valued learning a meditative practice that can be interpreted as spiritual or secular, depending on the word or phrase chosen. Only 1 participant reported that the practice of mantram conflicted with his/her personal beliefs. A small minority of participants who found the discussion of spirituality disconcerting nevertheless indicated that the intervention was acceptable to them.
The finding that even a 90-minute course was challenging for some HCWs to accommodate speaks to the importance of developing short-duration stress-reduction programs. The standardized Mindfulness Based Stress Reduction (MBSR) program consists of 8 weekly 2.5-hour sessions and a full-day retreat for an overall commitment of 29 to 33 hours.31 Additionally, a systematic review of meditative interventions for informal and professional caregivers found that programs ranged from 4 to 8 weeks.15 These lengthier programs are likely more challenging than the condensed MRP.
These results also suggest the importance of general guidelines for meditative intervention courses for reducing HCW stress. The mode of delivery should be as flexible as possible, allowing course participants to start, stop, and restart the program as needed and to participate from a location most convenient to them. Although presenting evidence for clinical effectiveness is critical for establishing credibility, statistical data should be briefly summarized. An experiential component in which participants are encouraged to practice the intervention will enhance learning and ensure the translation of knowledge into practice. Finally, framing meditative practices as compatible with many different faiths and/or secular will enhance their acceptability.
Three recommended components of an overall strategy for reducing occupational burnout in health care settings include modifying the organizational structure and work processes, improving the fit between the organization and HCWs, and promoting and allowing time for individuals to learn strategies for coping with work-related stress.32 This 90-minute online MRP course represents an aspect of an overall strategy to reduce HCW stress and burnout. Providing opportunities for HCWs to learn strategies for managing stress could enhance the quality of care and improve patient outcomes. Future pragmatic trials could determine whether mantram practice impacts clinical care at the VA and elsewhere.
Limitations
All participants were self-selected; therefore, the findings may be biased favorably toward the intervention. These qualitative analyses are not generalizable. HCWs in other, non-VA settings might have different needs and/or stressors that should be considered in future program development. If this intervention is offered to a wider audience, then other formats ought to be offered, such as print, at-home recordings, live meeting, and face-to-face.
Conclusion
Course participants reported that the condensed 90-minute virtual MRP was convenient to complete. They described the intervention as flexible and easy to learn. Participants indicated that they intended to implement what they learned in the course to reduce work-related stress. This feedback can be used to recommend guidelines for developing meditative interventions aimed at reducing stress in HCWs.
Acknowledgments
This material is based on work supported by the US Department of Veterans Affairs (VA), VA Employee Education Service and with resources from the VA San Diego Healthcare System and the VA Center for Mental Healthcare & Outcomes Research, South Central Mental Illness Research, Education, and Clinical Center at the Central Arkansas Veterans Healthcare System.
1. Centers for Disease Control and Prevention, National Institute for Occupational Safety and Health (NIOSH). Workplace safety and health topic: health care workers. http://www.cdc.gov/niosh/topics/healthcare. Updated May 9, 2018. Accessed April 8, 2019.
2. Voss Horrell SC, Holohan DR, Didion LM, Vance GT. Treating traumatized OEF/OIF veterans: how does trauma treatment affect the clinician? Prof Psychol Res Pract. 2011;42(1):79-86.
3. Centers for Disease Control and Prevention, National Institute for Occupational Safety and Health. Exposure to stress: occupational hazards in hospitals. http://www.cdc.gov/niosh/docs/2008-136/default.html. Published July 2008. Accessed April 9, 2019.
4. Fahrenkopf AM, Sectish TC, Barger LK. Rates of medication errors among depressed and burnt out residents: prospective cohort study. BMJ. 2008;336(7642):488-491.
5. Melnyk BM, Orsolini L, Tan A, et al. A national study links nurses’ physical and mental health to medical errors and perceived worksite wellness. J Occup Environ Med. 2018;60(2):126-131.
6. Shanafelt TD, Balch CM, Bechamps G, et al. Burnout and medical errors among American surgeons. Ann Surg. 2010;251(6):995-1000.
7. Aiken LH, Clarke SP, Sloane DM, Sochalski J, Silber JH. Hospital nurse staffing and patient mortality, nurse burnout, and job dissatisfaction. JAMA. 2002;288(16):1987-1993.
8. Poghosyan L, Clarke SP, Finlayson M, Aiken LH. Nurse burnout and quality of care: cross-national investigation in six countries. Res Nurs Health. 2010;33(4):288-298.
9. Rios-Risquez MI, García-Izquierdo M. Patient satisfaction, stress and burnout in nursing personnel in emergency departments: a cross-sectional study. Int J Nurs Stud. 2016;59:60-67.
10. Vahey DC, Aiken LH, Sloane DM, Clarke SP, Delfino V. Nurse burnout and patient satisfaction. Med Care. 2004;42(2 suppl):II57-II66.
11. Ruotsalainen JH, Verbeek JH, Mariné A, Serra C. Preventing occupational stress in health care workers. Cochrane Database Syst Rev. 2015;7(4):CD002892.
12. Elder C, Nidich S, Moriarty F, Nidich R. Effect of transcendental meditation on employee stress, depression, and burnout: a randomized controlled study. Perm J. 2014;18(1):19-23.
13. Prasad K, Wahner-Roedler DL, Cha SS, Sood A. Effect of a single-session meditation training to reduce stress and improve quality of life among health care professionals: a “dose-ranging” feasibility study. Altern Ther Health Med. 2011;17(3):46-49.
14. Jamieson SD, Tuckey MR. Mindfulness interventions in the workplace: a critique of the current state of the literature. J Occup Health Psychol. 2017;22(2):180-193.
15. Dharmawardene M, Givens J, Wachholtz A, Makowski S, Tjia J. A systematic review and meta-analysis of meditative interventions for informal caregivers and health professionals. BMJ Support Palliat Care. 2016;6(2):160-169.
16. Goyal M, Singh S, Sibinga EM, et al. Meditation programs for psychological stress and well-being: a systematic review and meta-analysis. JAMA Intern Med. 2014;174(3):357-368.
17. Bormann JE, Smith TL, Becker S, et al. Efficacy of frequent mantram repetition on stress, quality of life, and spiritual well-being in veterans: a pilot study. J Holist Nurs. 2005;23(4):395-414.
18. Bormann JE, Oman D, Kemppainen JK, Becker S, Gershwin M, Kelly A. Mantram repetition for stress management in veterans and employees: a critical incident study. J Adv Nurs. 2006;53(5):502-512.
19. Buttner MM, Bormann JE, Weingart K, Andrews T, Ferguson M, Afari N. Multi-site evaluation of a complementary, spiritually-based intervention for veterans: the mantram repetition program. Complement Ther Clin Pract. 2016;22:74-79.
20. Bormann JE, Hurst S, Kelly A. Responses to mantram repetition program from veterans with posttraumatic stress disorder: a qualitative analysis. J Rehabil Res Dev. 2013;50(6):769-784.
21. Bormann JE, Thorp S, Wetherell JL, Golshan S. A spiritually based group intervention for combat veterans with posttraumatic stress disorder: feasibility study. J Holist Nurs. 2008;26(2):109-116.
22. Bormann JE, Thorp SR, Wetherell JL, Golshan S, Lang AJ. Meditation-based mantram intervention for veterans with posttraumatic stress disorder: a randomized trial. Psychol Trauma: Theory Res Pract Policy. 2013;5(3):259-267.
23. Bormann JE, Thorp SR, Smith E, et al. Individual treatment of posttraumatic stress disorder using mantram repetition: a randomized clinical trial. Am J Psych. 2018;175(10):979-988.
24. Bormann JE, Warren KA, Regalbuto L, et al. A spiritually-based caregiver intervention with telephone delivery for family caregivers of veterans with dementia. Fam Community Health. 2009;32(4):345-353.
25. Bormann JE, Becker S, Gershwin M, et al. Relationship of frequent mantram repetition to emotional and spiritual well-being in healthcare workers. J Contin Educ Nurs. 2006;37(5):218-224.
26. Leary F, Weingart K, Topp R, Bormann JE. The effect of mantram repetition on burnout and stress among VA staff. Workplace Health Saf. 2018;66(3):120-128.
27. Yong J, Kim J, Park J, Seo I, Swinton BD. Effects of a spirituality training program on the spiritual and psychosocial well-being of hospital middle manager nurses in Korea. J Contin Educ Nurs. 2011;42(6):280-288.
28. Bormann JE, Walter KH, Leary S, Glaser D. An internet-delivered mantram repetition program for spiritual well-being and mindfulness for health care workers. Spirit Clin Pract. 2017;4(1):64-73.
29. Hamilton S, Pinfold V, Cotney J. Qualitative analysis of mental health service users’ reported experiences of discrimination. Acta Psychiatr Scand. 2016;134(suppl 446):14-22.
30. Ryan GW, Bernard HR. Techniques to identify themes. Field Meth. 2003;15(1):85-109.
31. Hoge EA, Bui E, Marques L, et al. Randomized controlled trial of mindfulness meditation for generalized anxiety disorder: effects on anxiety and stress reactivity. J Clin Psychiatry. 2013;74(8):786-792.
32. Lee RT, Seo B, Hladkyj S, Lovell BL, Schwartzmann L. Correlates of physician burnout across regions and specialties: a meta-analysis. Hum Resour Health. 2013;11(1):48.
Improving Health Care for Veterans With Gulf War Illness
Many veterans of the Gulf War are experiencing deployment-related chronic illness, known as Gulf War illness (GWI). Symptoms of GWI include cognitive impairments (mood and memory), chronic fatigue, musculoskeletal pain, gastrointestinal (GI) disorders, respiratory problems, and skin rashes.1-4 Three survey studies of the physical and mental health of a large cohort of Gulf War and Gulf era veterans, conducted by the US Department of Veterans Affairs (VA) Office of Public Health, established the increased prevalence of GWI in the decades that followed the end of the conflict.5-7 Thus, GWI has become the signature adverse health-related outcome of the Gulf War. Quality improvement (QI) within the Veterans Health Administration (VHA) is needed in the diagnosis and treatment of GWI.
Background
GWI was first termed chronic multisymptom illness (CMI) by the Centers for Disease Control and Prevention (CDC). According to the CDC-10 case definition, CMI in veterans of the 1990-1991 Gulf War is defined as having ≥ 1 symptoms lasting ≥ 6 months in at least 2 of 3 categories: fatigue, depressed mood and altered cognition, and musculoskeletal pain.3 The Kansas case definition of GWI is more specific and is defined as having moderate-to-severe symptoms that are unexplained by any other diagnosis, in at least 3 of 6 categories: fatigue/sleep, somatic pain, neurologic/cognition/mood, GI, respiratory, and skin.4 Although chronic unexplained symptoms have occurred after other modern conflicts, the prevalence of GWI among Gulf War veterans has proven higher than those of prior conflicts.8
The Persian Gulf War Veterans Act of 1998 and the Veterans Programs Enhancement Act of 1998 mandated studies by the Institute of Medicine (IOM) on the biologic and chemical exposures that may have contributed to illness in the Kuwaiti theater of operations.9 However, elucidating the etiology and underlying pathophysiology of GWI has been a major research challenge. In the absence of objective diagnostic measures, an understanding of the fundamental pathophysiology, evidence-based treatments, a single case definition, and definitive guidelines for health care providers (HCPs) for the diagnosis and management of GWI has not been produced. As a result, veterans with GWI have struggled for nearly 3 decades to find a consistent diagnosis of and an effective treatment for their condition.
According to a report by the Government Accountability Office (GAO), the VA approved only 17% of claims for compensation for veterans with GWI from 2011 to 2015, about one-third the level of approval for all other claimed disabilities.10 Although the VA applied GAO recommendations to improve the compensation process, many veterans consider that their illness is treated as psychosomatic in clinical practice, despite emerging evidence of GWI-associated biomarkers.11 Others think they have been forgotten due to their short 1-year period of service in the Gulf War.12 To realign research, guidelines, clinical care, and the health care experience of veterans with GWI, focused QI within VHA is urgently needed.
Veterans of Operations Enduring Freedom, Iraqi Freedom, and New Dawn (OEF/OIF/OND) are experiencing similar CMI symptoms. A study of US Army Reserve OEF/OIF veterans found that > 60% met the CDC-10 case definition for GWI 1-year postdeployment.13 Thus, CMI is emerging as a serious health problem for post-9/11 veterans. The evidence of postdeployment CMI among veterans of recent conflicts underscores the need to increase efforts at a national level, beginning with the VHA. This report includes a summary of Gulf War veterans’ experiences at the Minneapolis VA Health Care System (MVAHCS) and a proposal for QI of MVAHCS processes focused on HCP education and clinical care.
Methods
To determine areas of GWI health care that needed QI at the MVAHCS, veterans with GWI were contacted for a telephone survey. These veterans had participated in the Gulf War Illness Inflammation Reduction Trial (ClinicalTrials.gov. Identifier: NCT02506192). Therefore, all met the Kansas case definition for GWI.4 The aim of the survey was to characterize veterans’ experiences seeking health care for chronic postdeployment symptoms.
Sixty Gulf War veterans were contacted by telephone and invited to participate in a 15-minute survey about their experience seeking diagnosis and treatment for GWI. They were informed that the survey was voluntary and confidential, that it was not part of the research trial in which they had been enrolled, and that their participation would not affect compensation received from VA. Verbal consent was requested, and 30 veterans agreed to participate in the survey.
The survey included questions about the course of illness, disability and service connection status, HCPs seen, and suggestions for improvement in their care (Table 1). 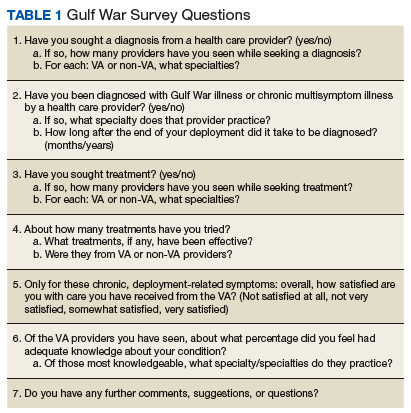
Results
Of the 30 veterans who participated in the survey, most were male with only 2 female veterans. This proportion of female veterans (7%) is similar to the overall percentage of female veterans (6.7%) of the first Gulf War.2 Ages ranged from 46 to 66 years with a mean age of 53. Mean duration of illness, defined as time elapsed since perceived onset of chronic systemic symptoms during or after deployment, was 22.8 years, with a range of 4 to 27 years. Most respondents reported symptom onset within a few years after the end of the conflict, while a few reported the onset within weeks of arriving in the Kuwaiti theater of operations. A little more than half the respondents considered themselves disabled due to their symptoms, while one-third reported losing the ability to work due to symptoms. Respondents described needing to reduce hours, retire early, or stop working altogether because of their symptoms.
Respondents attributed several common chronic symptoms to deployment in the Gulf Wars (Table 2). 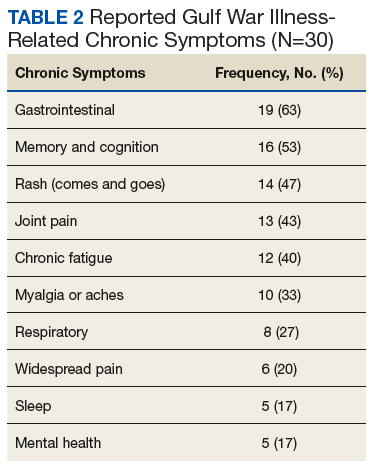
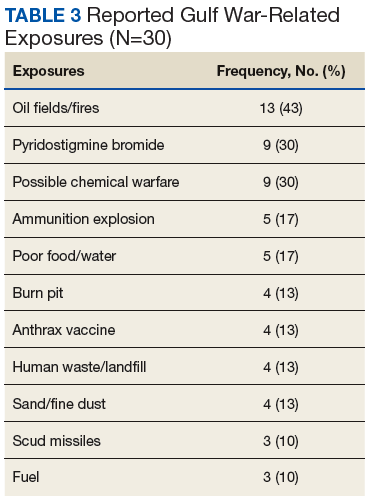
Most veterans surveyed were service connected for individual chronic symptoms. Some were service connected for systemic conditions such as fibromyalgia (FM), chronic fatigue syndrome (CFS), and irritable bowel syndrome (IBS) (5 veterans were connected for each condition). Three of the 30 veterans had been diagnosed with GWI—2 by past VA physicians and 1 by a physician at a GWI research center in another state. Of those 3, only 1 was service connected for the condition. Three respondents were not service connected at all.
The most common VA HCPs seen were in primary care and neurology followed by psychiatry and psychology. Of non-VA HCPs, most respondents saw primary care providers (PCPs) followed by chiropractors (Table 4). 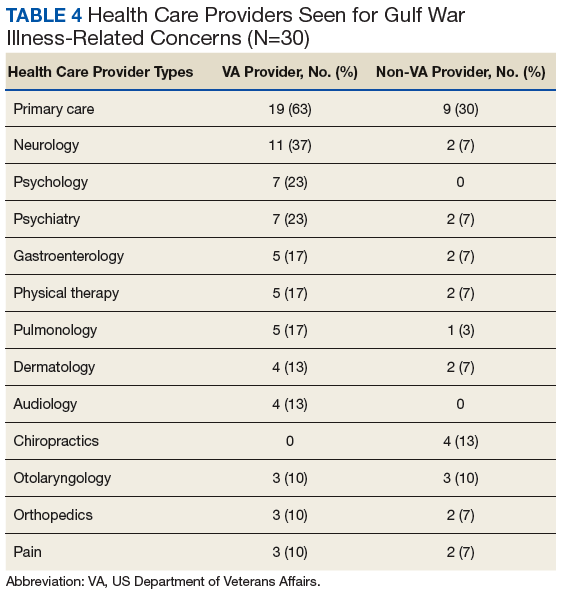
Before taking the Gulf War survey, a broad subjective question was posed. Respondents were asked whether VA HCPs were “supportive as you sought care for chronic postdeployment symptoms.” A majority of veterans reported that their VA HCPs were supportive. Reasons veterans gave for VA HCPs lack of support included feeling that HCPs did not believe them or trust their reported symptoms; did not care about their symptoms; refused to attribute their symptoms to Gulf War deployment; attributed symptoms to mental health issues; focused on doing things a certain way; or did not have the tools or information necessary to help.
Most non-VA HCPs were supportive. Reasons community HCPs were not supportive included “not looking at the whole picture,” not knowing veteran issues, not feeling comfortable with GWI, or not having much they could do.
Veterans were then asked whether they felt their HCPs were knowledgeable about GWI, and 13 respondents reported that their HCP was knowledgeable. Reasons respondents felt VA HCPs were not knowledgeable included denying that GWI exists, attributing symptoms to other conditions, not being aware of or familiar with GWI, needing education from the veteran, avoiding discussion about GWI or not caring to learn, or not knowing the latest research evidence to talk about GWI with authority. Compared with VA HCPs, veterans found community HCPs about half as likely to be knowledgeable about GWI. Many reported that community HCPs had not heard of GWI or had no knowledge about it.
Respondents also were asked what types of treatments they tried in order to typify the care received. The most common responses were pain medications, symptom-specific treatments, or “just putting up with it” (no treatment). Many patients were also self-medicating, trying lifestyle changes, or seeking alternative therapies.
Finally, respondents were asked on a scale of 0 (very unsatisfied) to 5 (very satisfied), how satisfied they were with their overall care at the VA. The majority were satisfied with their overall care, with two-thirds very satisfied (5 of 5) or pretty satisfied (4 of 5). Only 3 (10%) were unsatisfied or very unsatisfied. Respondents had the following comments about their care: “They treat me like I am important;” “I am very thankful even though they cannot figure it out;” “They are doing the best they can with no answers and not enough help;” “[I know] it is still a work in progress.” A number of respondents were satisfied with some HCPs or care for some but not all of their symptoms. Reasons respondents were less satisfied included desiring answers, feeling they were not respected, or feeling that their concerns were not addressed.
When asked for suggestions for improvement of GWI care, the most common response was providing up-to-date HCP education (Table 5). 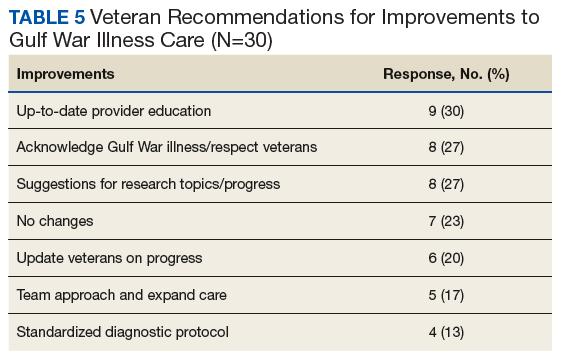
Discussion
The veterans participating in this QI survey had similar demographics, symptomology, and exposures as did those in other studies.1-7 Therefore, improvements based on their responses are likely applicable to the health care of veterans experiencing GWI-associated symptoms at other VA health care systems as well.
Veterans with GWI can lose significant functional capacity and productivity due to their symptoms. The symptoms are chronic and have afflicted many Gulf War veterans for nearly 3 decades. Furthermore, the prevalence of GWI in Gulf War veterans continues to increase.5-7 These facts testify to the enormous health-related quality-of-life impact of GWI.
Veterans who meet the Kansas case definition for GWI were not diagnosed or service connected in a uniform manner. Only 3 of the 30 veterans in this study were given a unifying diagnosis that connected their chronic illness to Gulf War deployment. Under current guidelines, Gulf War veterans are able to receive compensation for chronic symptoms in 3 ways: (1) compensation for chronic unexplained symptoms existing for ≥ 6 months that appeared during active duty in the Southwest Asia theater or by December 31, 2021, and are ≥ 10% disabling; (2) the 1995 Persian Gulf War Veterans’ Act recognizes 3 multisymptom illnesses for which veterans can be service connected: FM, CFS, and functional GI disorders, including IBS; and (3) expansion to include any CMI of unknown etiology is underway. A uniform diagnostic protocol based on biomarkers and updated understanding of disease pathology would be helpful.
Respondents shared experiences that demonstrated perceived gaps in HCP support or knowledge. Overall, more respondents found their HCPs supportive. Many of the reasons respondents found HCPs unsupportive related to acknowledgment of symptoms. Also, more respondents found that both VA and non-VA HCPs lacked knowledge about GWI symptoms. These findings further highlight the need for HCP education within the VA and in community-based care.
The treatments tried by respondents also highlight potential areas for improvement. Most of the treatments were for pain; therefore, more involvement with pain clinics and specialists could be helpful. Symptom-specific medications also are appropriate, although only one-third of patients reported use. While medications are not necessarily markers of quality care, the fact that many patients self-medicate or go without treatment suggests that access to care could be improved. In 2014, the VA and the US Department of Defense (DoD) released the “VA/DoD Clinical Practice Guideline for the Management of Chronic Multisymptom Illness,” which recommended treatments for the global disease and specific symptoms.15
Since then, GWI research points to inflammatory and metabolic disease mechanisms.11-14,16 As the underlying pathophysiology is further elucidated, practice guidelines will need to be updated to include anti-inflammatory and antioxidant treatments used in practice for GWI and similar chronic systemic illnesses (eg, CFS, FM, and IBS).17-19
Randomized control trials are needed to determine the efficacy of such medications for the treatment of GWI. As new results emerge, disseminating and updating evidence-based guidelines in a coordinated manner will be required for veterans to receive appropriate treatment. Veterans also seek alternative or nonpharmaceutical interventions, such as physical therapy and diet changes. Improving access to integrative medicine, physical therapy, nutritionists, and other practitioners also could optimize veterans’ health and function.
HCP Education
The Gulf War veteran respondents who participated in the survey noted HCP education, research progress, and veteran inclusion as areas for improvement. Respondents requested dissemination of information on diagnosis and treatment of GWI for HCPs and updates on research and other actions. They suggested ways research could be more effective (such as subgrouping by exposure, which researchers have been doing) and could extend to veterans experiencing CMI from other conflicts as well.20 Respondents also recommended team approaches or centers of excellence in order to receive more comprehensive care.
An asset of VHA is the culture of QI and education. The VA Employee Education System previously produced “Caring for Gulf War I Veterans,” a systemwide training module.21 In 2014, updated clinical practice guidelines for GWI were provided by the VA and the DoD, including evidence for each recommendation. In 2016, the VA in collaboration with the IOM produced a report summarizing conclusions and recommendations regarding associations between health concerns and Gulf War deployment.22 A concise guide for HCPs caring for veterans with GWI, updated in 2018, is available.23 Updated treatment guidelines, based on evolving understanding of GWI pathophysiology, and continuing efforts to disseminate information will be essential.
Respondents most often presented to primary care, both within and outside of MVAHCS. Therefore, VA and community PCPs who see veterans should be equipped to recognize and diagnose GWI as well as be familiar with basic disease management and specialists whom they could refer their patients. Neurology was the second most common specialty seen by respondents. The most prominent symptoms of GWI are related to nervous system function in addition to evidence of underlying neuroinflammation.20 Veterans may present to a neurologist with a variety of concerns, such as cognitive issues, sleep problems, migraines and headaches, and pain. Neurologists could best manage treatments targeting common neurologic GWI symptoms and neuroinflammation, especially as new treatments are discovered.
The next 2 most common specialty services seen were psychiatry and psychology (7 responses for each). Five respondents reported mental health issues as part of their chronic postdeployment symptoms. Population-based studies have indicated that rates of PTSD in Gulf War veterans is 3% to 6%, much lower than the prevalence of GWI.8,20 The 2010 IOM study concluded that GWI symptoms cannot be ascribed to any known psychiatric disorder. Unfortunately, several surveyed veterans made it clear that they had been denied care due to HCPs attributing their symptoms solely to mental health issues. Therefore, psychiatrists and psychologists must be educated about GWI, mental health issues occurring in Gulf War veterans, and physiologic symptoms of GWI that may mimic or coincide with mental health issues. These HCPs also would be important to include in an interdisciplinary clinic for veterans with GWI.
Finally, respondents sought care from numerous other specialties, including gastroenterology, physical therapy, pulmonology, dermatology, and surgical subspecialties, such as orthopedics and otolaryngology. This wide range of specialists seen emphasizes the need for medical education, beginning in medical school. If provided education on GWI, these specialists would be able to treat veterans with GWI, know to look for updates on GWI management, or know to look for other common symptoms, such as chronic sinusitis in otolaryngology or recurring rashes in dermatology. We also recommend identifying HCPs in these specialties who could be part of an interdisciplinary clinic or be referrals for symptom management.
Protocol Implementation
HCP education and clinical care protocol implementation should be the initial focus of improving GWI management. A team of stakeholders within the different areas of MVAHCS, including education, HCPs, and administrative staff, will need to be developed. Reaching out to VA HCPs who have seen veterans with GWI will be an essential first step to equip them with updated education about the diagnosis and management of CMI. Providing integrated widespread education to current HCPs who are likely to encounter veterans with deployment-related CMI from the Gulf War, OND/OEF/OIF, or other deployments also will be necessary. Finally, educating medical trainees, including residents and medical students, will ensure continuous care for future veterans, post-9/11 veterans.
GWI presentations at medical grand rounds or at other medical community educational events could provide educational outlets. These events create face-to-face opportunities to discuss GWI/CMI education with HCPs, giving them the opportunity to offer feedback about their experiences and create relationships with other HCPs who have seen patients with GWI/CMI. At an educational event, a short postevent feedback form that indicates whether HCPs would like more information or get involved in a clinic for veterans with CMI could be included. This information would help identify key HCPs and areas within the local VA needing further improvements, such as creating a clinic for veterans with GWI.
Since 1946, the VA has worked with academic institutions to provide state-of-the-art health care to US veterans and train new HCPs to meet the health care needs of the nation. Every year, > 40,000 residents and 20,000 medical students receive medical training at VA facilities, making VA the largest single provider of medical education in the country. Therefore, providing detailed GWI/CMI education to medical students and residents as a standard part of the VA Talent Management System would be of value for all VA professionals.
GWI Clinics
Access to comprehensive care can be accomplished by organizing a clinic for veterans with GWI. The most likely effective location would be in primary care. PCPs who have seen veterans with GWI and/or expressed interest in learning more about GWI will be the initial point of contact. As the primary care service has connections to ancillary services, such as pharmacists, dieticians, psychologists, and social workers, organizing 1 day each week to see patients with GWI would improve care.
As the need for specialty care arises, the team also would need to identify specialists willing to receive referrals from HCPs of veterans with GWI. These specialists could be identified via feedback forms from educational events, surveys after an online educational training, or through relationships among VA physicians. As the clinic becomes established, it may be effective to have certain commonly seen specialists available in person, most likely neurology, psychiatry, gastroenterology, pulmonology, and dermatology. Also, relationships with a pain clinic, sleep medicine, and integrative medicine services should be established.
Measures of improvement in the veteran health care experience could include veterans’ perceptions of the supportiveness and knowledge of physicians about GWI as well as overall satisfaction. A follow-up survey on these measures of veterans involved in a GWI clinic and those not involved would be a way to determine whether these clinics better meet veterans’ needs and what additional QI is needed.
Conclusion
A significant number of Gulf War veterans experience chronic postdeployment symptoms that need to be better addressed. Physicians need to be equipped to recognize and manage GWI and similar postdeployment CMI among veterans of OEF/OIF/OND. We recommend creating an educational initiative about GWI among VA physicians and trainees, connecting physicians who see veterans with GWI, and establishing an interdisciplinary clinic with a referral system as the next steps to improve care for veterans. An additional goal would be to reach out to veteran networks to update them on GWI research, education, and available health care, as veterans are the essential stakeholders in the QI process.
1. US Department of Veterans Affairs. Research Advisory Committee on Gulf War Veterans’ Illnesses. Gulf War Illness and the Health of Gulf War Veterans: Scientific Findings and Recommendations. https://www.va.gov/RAC-GWVI/docs/Committee_Documents/GWIandHealthofGWVeterans_RAC-GWVIReport_2008.pdf. Published November 2008. Accessed April 16, 2019.
2. Institute of Medicine. Gulf War and Health. Update of Health Effects of Serving in the Gulf War. Vol 8. Washington, DC: National Academies Press; 2009.
3. Fukuda K, Nisenbaum R, Stewart G, et al. Chronic multisymptom illness affecting Air Force veterans of the Gulf War. JAMA. 1998;280(11):981-988.
4. Steele L. Prevalence and patterns of Gulf War illness in Kansas veterans: association of symptoms with characteristics of person, place, and time of military service. Am J Epidemiol. 2000;152(10):992-1002.
5. Kang HK, Mahan CM, Lee KY, Magee CA, Murphy FM. Illnesses among United States veterans of the Gulf War: a population-based survey of 30,000 veterans. J Occup Environ Med. 2000;42(5):491-501.
6. Kang HK, Li B, Mahan CM, Eisen SA, Engel CC. Health of US veterans of 1991 Gulf War: a follow-up survey in 10 years. J Occup Environ Med. 2009;51(4):401-410.
7. Dursa EK, Barth SK, Schneiderman AI, Bossarte RM. Physical and mental health status of Gulf War and Gulf era veterans: results from a large population-based epidemiological study. J Occup Environ Med. 2016;58(1):41-46.
8. Institute of Medicine. Gulf War and Health: Treatment for Chronic Multisymptom Illness. Washington, DC: National Academies Press; 2013.
9. Institute of Medicine. Chronic Multisymptom Illness in Gulf War Veterans: Case Definitions Reexamined. Washington, DC: National Academies Press; 2014.
10. United States Government Accountability Office. Gulf War illness: improvements needed for VA to better understand, process, and communicate decisions on claims. https://www.gao.gov/assets/690/685562.pdf. Published June 2017. Accessed April 16, 2019.
11. Johnson GJ, Slater BC, Leis LA, Rector TS, Bach RR. Blood biomarkers of chronic inflammation in Gulf War illness. PLoS One. 2016;11(6):e0157855.
12. Reno J. Gulf War veterans still fighting serious health problems. https://www.healthline.com/health-news/gulf-war-veterans-still-fighting-serious-health-problems#1. Published June 17, 2016. Accessed April 16, 2019.
13. McAndrew LM, Helmer DA, Phillips LA, Chandler HK, Ray K, Quigley KS. Iraq and Afghanistan veterans report symptoms consistent with chronic multisymptom illness one year after deployment. J Rehabil Res Dev. 2016;53(1):59-70.
14. Steele L, Sastre A, Gerkovich MM, Cook MR. Complex factors in the etiology of Gulf War illness: wartime exposures and risk factors in veteran subgroups. Environ Health Perspect. 2012;120(1):112-118.
15. US Department of Veterans Affairs. VA/DoD Clinical Practice Guideline for the Management of Chronic Multisymptom Illness. Version 2.0. https://www.healthquality.va.gov/guidelines/MR/cmi/VADoDCMICPG2014.pdf. Published October 2014. Accessed April 22, 2019.
16. Koslik HJ, Hamilton G, Golomb BA. Mitochondrial dysfunction in Gulf War illness revealed by 31phosphorus magnetic resonance spectroscopy: a case-control study. PLoS One. 2014;9(3):e92887.
17. Brewer KL, Mainhart A, Meggs WJ. Double-blinded placebo-controlled cross-over pilot trial of naltrexone to treat Gulf War illness. Fatigue: Biomed Health Behav. 2018;6(3):132-140.
18. Golomb BA, Allison M, Koperski S, Koslik HJ, Devaraj S, Ritchie JB. Coenzyme Q10 benefits symptoms in Gulf War veterans: results of a randomized double-blind study. Neural Comput. 2014;26(11):2594-2651.
19. Weiduschat N, Mao X, Vu D, et al. N-acetylcysteine alleviates cortical glutathione deficit and improves symptoms in CFS: an in vivo validation study using proton magnetic resonance spectroscopy. In: Proceedings from the IACFS/ME 12th Biennial Conference; October 27-30, 2016; Fort Lauderdale, FL. Abstract. http://iacfsme.org/ME-CFS-Primer-Education/News/IACFSME-2016-Program.aspx. Accessed April 22, 2019.
20. White RF, Steele L, O’Callaghan JP, et al. Recent research on Gulf War illness and other health problems in veterans of the 1991 Gulf War: effects of toxicant exposures during deployment. Cortex. 2016;74:449-475.
21. US Department of Veterans Affairs. Caring for Gulf War I Veterans. http://www.ngwrc.net/PDF%20Files/caring-for-gulf-war.pdf. Published July 2011. Accessed April 15, 2019.
22. National Academies of Sciences, Engineering, and Medicine. Gulf War and Health. Update of Serving in the Gulf War. Vol 10. Washington, DC: National Academies Press; 2016.
23. US Department of Veterans Affairs. War-Related Illness and Injury Study Center. Gulf War illness: a guide for veteran health care providers. https://www.warrelatedillness.va.gov/education/factsheets/gulf-war-illness-for-providers.pdf. Updated October 2018. Accessed April 16, 2019.
Many veterans of the Gulf War are experiencing deployment-related chronic illness, known as Gulf War illness (GWI). Symptoms of GWI include cognitive impairments (mood and memory), chronic fatigue, musculoskeletal pain, gastrointestinal (GI) disorders, respiratory problems, and skin rashes.1-4 Three survey studies of the physical and mental health of a large cohort of Gulf War and Gulf era veterans, conducted by the US Department of Veterans Affairs (VA) Office of Public Health, established the increased prevalence of GWI in the decades that followed the end of the conflict.5-7 Thus, GWI has become the signature adverse health-related outcome of the Gulf War. Quality improvement (QI) within the Veterans Health Administration (VHA) is needed in the diagnosis and treatment of GWI.
Background
GWI was first termed chronic multisymptom illness (CMI) by the Centers for Disease Control and Prevention (CDC). According to the CDC-10 case definition, CMI in veterans of the 1990-1991 Gulf War is defined as having ≥ 1 symptoms lasting ≥ 6 months in at least 2 of 3 categories: fatigue, depressed mood and altered cognition, and musculoskeletal pain.3 The Kansas case definition of GWI is more specific and is defined as having moderate-to-severe symptoms that are unexplained by any other diagnosis, in at least 3 of 6 categories: fatigue/sleep, somatic pain, neurologic/cognition/mood, GI, respiratory, and skin.4 Although chronic unexplained symptoms have occurred after other modern conflicts, the prevalence of GWI among Gulf War veterans has proven higher than those of prior conflicts.8
The Persian Gulf War Veterans Act of 1998 and the Veterans Programs Enhancement Act of 1998 mandated studies by the Institute of Medicine (IOM) on the biologic and chemical exposures that may have contributed to illness in the Kuwaiti theater of operations.9 However, elucidating the etiology and underlying pathophysiology of GWI has been a major research challenge. In the absence of objective diagnostic measures, an understanding of the fundamental pathophysiology, evidence-based treatments, a single case definition, and definitive guidelines for health care providers (HCPs) for the diagnosis and management of GWI has not been produced. As a result, veterans with GWI have struggled for nearly 3 decades to find a consistent diagnosis of and an effective treatment for their condition.
According to a report by the Government Accountability Office (GAO), the VA approved only 17% of claims for compensation for veterans with GWI from 2011 to 2015, about one-third the level of approval for all other claimed disabilities.10 Although the VA applied GAO recommendations to improve the compensation process, many veterans consider that their illness is treated as psychosomatic in clinical practice, despite emerging evidence of GWI-associated biomarkers.11 Others think they have been forgotten due to their short 1-year period of service in the Gulf War.12 To realign research, guidelines, clinical care, and the health care experience of veterans with GWI, focused QI within VHA is urgently needed.
Veterans of Operations Enduring Freedom, Iraqi Freedom, and New Dawn (OEF/OIF/OND) are experiencing similar CMI symptoms. A study of US Army Reserve OEF/OIF veterans found that > 60% met the CDC-10 case definition for GWI 1-year postdeployment.13 Thus, CMI is emerging as a serious health problem for post-9/11 veterans. The evidence of postdeployment CMI among veterans of recent conflicts underscores the need to increase efforts at a national level, beginning with the VHA. This report includes a summary of Gulf War veterans’ experiences at the Minneapolis VA Health Care System (MVAHCS) and a proposal for QI of MVAHCS processes focused on HCP education and clinical care.
Methods
To determine areas of GWI health care that needed QI at the MVAHCS, veterans with GWI were contacted for a telephone survey. These veterans had participated in the Gulf War Illness Inflammation Reduction Trial (ClinicalTrials.gov. Identifier: NCT02506192). Therefore, all met the Kansas case definition for GWI.4 The aim of the survey was to characterize veterans’ experiences seeking health care for chronic postdeployment symptoms.
Sixty Gulf War veterans were contacted by telephone and invited to participate in a 15-minute survey about their experience seeking diagnosis and treatment for GWI. They were informed that the survey was voluntary and confidential, that it was not part of the research trial in which they had been enrolled, and that their participation would not affect compensation received from VA. Verbal consent was requested, and 30 veterans agreed to participate in the survey.
The survey included questions about the course of illness, disability and service connection status, HCPs seen, and suggestions for improvement in their care (Table 1).
Results
Of the 30 veterans who participated in the survey, most were male with only 2 female veterans. This proportion of female veterans (7%) is similar to the overall percentage of female veterans (6.7%) of the first Gulf War.2 Ages ranged from 46 to 66 years with a mean age of 53. Mean duration of illness, defined as time elapsed since perceived onset of chronic systemic symptoms during or after deployment, was 22.8 years, with a range of 4 to 27 years. Most respondents reported symptom onset within a few years after the end of the conflict, while a few reported the onset within weeks of arriving in the Kuwaiti theater of operations. A little more than half the respondents considered themselves disabled due to their symptoms, while one-third reported losing the ability to work due to symptoms. Respondents described needing to reduce hours, retire early, or stop working altogether because of their symptoms.
Respondents attributed several common chronic symptoms to deployment in the Gulf Wars (Table 2).
Most veterans surveyed were service connected for individual chronic symptoms. Some were service connected for systemic conditions such as fibromyalgia (FM), chronic fatigue syndrome (CFS), and irritable bowel syndrome (IBS) (5 veterans were connected for each condition). Three of the 30 veterans had been diagnosed with GWI—2 by past VA physicians and 1 by a physician at a GWI research center in another state. Of those 3, only 1 was service connected for the condition. Three respondents were not service connected at all.
The most common VA HCPs seen were in primary care and neurology followed by psychiatry and psychology. Of non-VA HCPs, most respondents saw primary care providers (PCPs) followed by chiropractors (Table 4).
Before taking the Gulf War survey, a broad subjective question was posed. Respondents were asked whether VA HCPs were “supportive as you sought care for chronic postdeployment symptoms.” A majority of veterans reported that their VA HCPs were supportive. Reasons veterans gave for VA HCPs lack of support included feeling that HCPs did not believe them or trust their reported symptoms; did not care about their symptoms; refused to attribute their symptoms to Gulf War deployment; attributed symptoms to mental health issues; focused on doing things a certain way; or did not have the tools or information necessary to help.
Most non-VA HCPs were supportive. Reasons community HCPs were not supportive included “not looking at the whole picture,” not knowing veteran issues, not feeling comfortable with GWI, or not having much they could do.
Veterans were then asked whether they felt their HCPs were knowledgeable about GWI, and 13 respondents reported that their HCP was knowledgeable. Reasons respondents felt VA HCPs were not knowledgeable included denying that GWI exists, attributing symptoms to other conditions, not being aware of or familiar with GWI, needing education from the veteran, avoiding discussion about GWI or not caring to learn, or not knowing the latest research evidence to talk about GWI with authority. Compared with VA HCPs, veterans found community HCPs about half as likely to be knowledgeable about GWI. Many reported that community HCPs had not heard of GWI or had no knowledge about it.
Respondents also were asked what types of treatments they tried in order to typify the care received. The most common responses were pain medications, symptom-specific treatments, or “just putting up with it” (no treatment). Many patients were also self-medicating, trying lifestyle changes, or seeking alternative therapies.
Finally, respondents were asked on a scale of 0 (very unsatisfied) to 5 (very satisfied), how satisfied they were with their overall care at the VA. The majority were satisfied with their overall care, with two-thirds very satisfied (5 of 5) or pretty satisfied (4 of 5). Only 3 (10%) were unsatisfied or very unsatisfied. Respondents had the following comments about their care: “They treat me like I am important;” “I am very thankful even though they cannot figure it out;” “They are doing the best they can with no answers and not enough help;” “[I know] it is still a work in progress.” A number of respondents were satisfied with some HCPs or care for some but not all of their symptoms. Reasons respondents were less satisfied included desiring answers, feeling they were not respected, or feeling that their concerns were not addressed.
When asked for suggestions for improvement of GWI care, the most common response was providing up-to-date HCP education (Table 5).
Discussion
The veterans participating in this QI survey had similar demographics, symptomology, and exposures as did those in other studies.1-7 Therefore, improvements based on their responses are likely applicable to the health care of veterans experiencing GWI-associated symptoms at other VA health care systems as well.
Veterans with GWI can lose significant functional capacity and productivity due to their symptoms. The symptoms are chronic and have afflicted many Gulf War veterans for nearly 3 decades. Furthermore, the prevalence of GWI in Gulf War veterans continues to increase.5-7 These facts testify to the enormous health-related quality-of-life impact of GWI.
Veterans who meet the Kansas case definition for GWI were not diagnosed or service connected in a uniform manner. Only 3 of the 30 veterans in this study were given a unifying diagnosis that connected their chronic illness to Gulf War deployment. Under current guidelines, Gulf War veterans are able to receive compensation for chronic symptoms in 3 ways: (1) compensation for chronic unexplained symptoms existing for ≥ 6 months that appeared during active duty in the Southwest Asia theater or by December 31, 2021, and are ≥ 10% disabling; (2) the 1995 Persian Gulf War Veterans’ Act recognizes 3 multisymptom illnesses for which veterans can be service connected: FM, CFS, and functional GI disorders, including IBS; and (3) expansion to include any CMI of unknown etiology is underway. A uniform diagnostic protocol based on biomarkers and updated understanding of disease pathology would be helpful.
Respondents shared experiences that demonstrated perceived gaps in HCP support or knowledge. Overall, more respondents found their HCPs supportive. Many of the reasons respondents found HCPs unsupportive related to acknowledgment of symptoms. Also, more respondents found that both VA and non-VA HCPs lacked knowledge about GWI symptoms. These findings further highlight the need for HCP education within the VA and in community-based care.
The treatments tried by respondents also highlight potential areas for improvement. Most of the treatments were for pain; therefore, more involvement with pain clinics and specialists could be helpful. Symptom-specific medications also are appropriate, although only one-third of patients reported use. While medications are not necessarily markers of quality care, the fact that many patients self-medicate or go without treatment suggests that access to care could be improved. In 2014, the VA and the US Department of Defense (DoD) released the “VA/DoD Clinical Practice Guideline for the Management of Chronic Multisymptom Illness,” which recommended treatments for the global disease and specific symptoms.15
Since then, GWI research points to inflammatory and metabolic disease mechanisms.11-14,16 As the underlying pathophysiology is further elucidated, practice guidelines will need to be updated to include anti-inflammatory and antioxidant treatments used in practice for GWI and similar chronic systemic illnesses (eg, CFS, FM, and IBS).17-19
Randomized control trials are needed to determine the efficacy of such medications for the treatment of GWI. As new results emerge, disseminating and updating evidence-based guidelines in a coordinated manner will be required for veterans to receive appropriate treatment. Veterans also seek alternative or nonpharmaceutical interventions, such as physical therapy and diet changes. Improving access to integrative medicine, physical therapy, nutritionists, and other practitioners also could optimize veterans’ health and function.
HCP Education
The Gulf War veteran respondents who participated in the survey noted HCP education, research progress, and veteran inclusion as areas for improvement. Respondents requested dissemination of information on diagnosis and treatment of GWI for HCPs and updates on research and other actions. They suggested ways research could be more effective (such as subgrouping by exposure, which researchers have been doing) and could extend to veterans experiencing CMI from other conflicts as well.20 Respondents also recommended team approaches or centers of excellence in order to receive more comprehensive care.
An asset of VHA is the culture of QI and education. The VA Employee Education System previously produced “Caring for Gulf War I Veterans,” a systemwide training module.21 In 2014, updated clinical practice guidelines for GWI were provided by the VA and the DoD, including evidence for each recommendation. In 2016, the VA in collaboration with the IOM produced a report summarizing conclusions and recommendations regarding associations between health concerns and Gulf War deployment.22 A concise guide for HCPs caring for veterans with GWI, updated in 2018, is available.23 Updated treatment guidelines, based on evolving understanding of GWI pathophysiology, and continuing efforts to disseminate information will be essential.
Respondents most often presented to primary care, both within and outside of MVAHCS. Therefore, VA and community PCPs who see veterans should be equipped to recognize and diagnose GWI as well as be familiar with basic disease management and specialists whom they could refer their patients. Neurology was the second most common specialty seen by respondents. The most prominent symptoms of GWI are related to nervous system function in addition to evidence of underlying neuroinflammation.20 Veterans may present to a neurologist with a variety of concerns, such as cognitive issues, sleep problems, migraines and headaches, and pain. Neurologists could best manage treatments targeting common neurologic GWI symptoms and neuroinflammation, especially as new treatments are discovered.
The next 2 most common specialty services seen were psychiatry and psychology (7 responses for each). Five respondents reported mental health issues as part of their chronic postdeployment symptoms. Population-based studies have indicated that rates of PTSD in Gulf War veterans is 3% to 6%, much lower than the prevalence of GWI.8,20 The 2010 IOM study concluded that GWI symptoms cannot be ascribed to any known psychiatric disorder. Unfortunately, several surveyed veterans made it clear that they had been denied care due to HCPs attributing their symptoms solely to mental health issues. Therefore, psychiatrists and psychologists must be educated about GWI, mental health issues occurring in Gulf War veterans, and physiologic symptoms of GWI that may mimic or coincide with mental health issues. These HCPs also would be important to include in an interdisciplinary clinic for veterans with GWI.
Finally, respondents sought care from numerous other specialties, including gastroenterology, physical therapy, pulmonology, dermatology, and surgical subspecialties, such as orthopedics and otolaryngology. This wide range of specialists seen emphasizes the need for medical education, beginning in medical school. If provided education on GWI, these specialists would be able to treat veterans with GWI, know to look for updates on GWI management, or know to look for other common symptoms, such as chronic sinusitis in otolaryngology or recurring rashes in dermatology. We also recommend identifying HCPs in these specialties who could be part of an interdisciplinary clinic or be referrals for symptom management.
Protocol Implementation
HCP education and clinical care protocol implementation should be the initial focus of improving GWI management. A team of stakeholders within the different areas of MVAHCS, including education, HCPs, and administrative staff, will need to be developed. Reaching out to VA HCPs who have seen veterans with GWI will be an essential first step to equip them with updated education about the diagnosis and management of CMI. Providing integrated widespread education to current HCPs who are likely to encounter veterans with deployment-related CMI from the Gulf War, OND/OEF/OIF, or other deployments also will be necessary. Finally, educating medical trainees, including residents and medical students, will ensure continuous care for future veterans, post-9/11 veterans.
GWI presentations at medical grand rounds or at other medical community educational events could provide educational outlets. These events create face-to-face opportunities to discuss GWI/CMI education with HCPs, giving them the opportunity to offer feedback about their experiences and create relationships with other HCPs who have seen patients with GWI/CMI. At an educational event, a short postevent feedback form that indicates whether HCPs would like more information or get involved in a clinic for veterans with CMI could be included. This information would help identify key HCPs and areas within the local VA needing further improvements, such as creating a clinic for veterans with GWI.
Since 1946, the VA has worked with academic institutions to provide state-of-the-art health care to US veterans and train new HCPs to meet the health care needs of the nation. Every year, > 40,000 residents and 20,000 medical students receive medical training at VA facilities, making VA the largest single provider of medical education in the country. Therefore, providing detailed GWI/CMI education to medical students and residents as a standard part of the VA Talent Management System would be of value for all VA professionals.
GWI Clinics
Access to comprehensive care can be accomplished by organizing a clinic for veterans with GWI. The most likely effective location would be in primary care. PCPs who have seen veterans with GWI and/or expressed interest in learning more about GWI will be the initial point of contact. As the primary care service has connections to ancillary services, such as pharmacists, dieticians, psychologists, and social workers, organizing 1 day each week to see patients with GWI would improve care.
As the need for specialty care arises, the team also would need to identify specialists willing to receive referrals from HCPs of veterans with GWI. These specialists could be identified via feedback forms from educational events, surveys after an online educational training, or through relationships among VA physicians. As the clinic becomes established, it may be effective to have certain commonly seen specialists available in person, most likely neurology, psychiatry, gastroenterology, pulmonology, and dermatology. Also, relationships with a pain clinic, sleep medicine, and integrative medicine services should be established.
Measures of improvement in the veteran health care experience could include veterans’ perceptions of the supportiveness and knowledge of physicians about GWI as well as overall satisfaction. A follow-up survey on these measures of veterans involved in a GWI clinic and those not involved would be a way to determine whether these clinics better meet veterans’ needs and what additional QI is needed.
Conclusion
A significant number of Gulf War veterans experience chronic postdeployment symptoms that need to be better addressed. Physicians need to be equipped to recognize and manage GWI and similar postdeployment CMI among veterans of OEF/OIF/OND. We recommend creating an educational initiative about GWI among VA physicians and trainees, connecting physicians who see veterans with GWI, and establishing an interdisciplinary clinic with a referral system as the next steps to improve care for veterans. An additional goal would be to reach out to veteran networks to update them on GWI research, education, and available health care, as veterans are the essential stakeholders in the QI process.
1. US Department of Veterans Affairs. Research Advisory Committee on Gulf War Veterans’ Illnesses. Gulf War Illness and the Health of Gulf War Veterans: Scientific Findings and Recommendations. https://www.va.gov/RAC-GWVI/docs/Committee_Documents/GWIandHealthofGWVeterans_RAC-GWVIReport_2008.pdf. Published November 2008. Accessed April 16, 2019.
2. Institute of Medicine. Gulf War and Health. Update of Health Effects of Serving in the Gulf War. Vol 8. Washington, DC: National Academies Press; 2009.
3. Fukuda K, Nisenbaum R, Stewart G, et al. Chronic multisymptom illness affecting Air Force veterans of the Gulf War. JAMA. 1998;280(11):981-988.
4. Steele L. Prevalence and patterns of Gulf War illness in Kansas veterans: association of symptoms with characteristics of person, place, and time of military service. Am J Epidemiol. 2000;152(10):992-1002.
5. Kang HK, Mahan CM, Lee KY, Magee CA, Murphy FM. Illnesses among United States veterans of the Gulf War: a population-based survey of 30,000 veterans. J Occup Environ Med. 2000;42(5):491-501.
6. Kang HK, Li B, Mahan CM, Eisen SA, Engel CC. Health of US veterans of 1991 Gulf War: a follow-up survey in 10 years. J Occup Environ Med. 2009;51(4):401-410.
7. Dursa EK, Barth SK, Schneiderman AI, Bossarte RM. Physical and mental health status of Gulf War and Gulf era veterans: results from a large population-based epidemiological study. J Occup Environ Med. 2016;58(1):41-46.
8. Institute of Medicine. Gulf War and Health: Treatment for Chronic Multisymptom Illness. Washington, DC: National Academies Press; 2013.
9. Institute of Medicine. Chronic Multisymptom Illness in Gulf War Veterans: Case Definitions Reexamined. Washington, DC: National Academies Press; 2014.
10. United States Government Accountability Office. Gulf War illness: improvements needed for VA to better understand, process, and communicate decisions on claims. https://www.gao.gov/assets/690/685562.pdf. Published June 2017. Accessed April 16, 2019.
11. Johnson GJ, Slater BC, Leis LA, Rector TS, Bach RR. Blood biomarkers of chronic inflammation in Gulf War illness. PLoS One. 2016;11(6):e0157855.
12. Reno J. Gulf War veterans still fighting serious health problems. https://www.healthline.com/health-news/gulf-war-veterans-still-fighting-serious-health-problems#1. Published June 17, 2016. Accessed April 16, 2019.
13. McAndrew LM, Helmer DA, Phillips LA, Chandler HK, Ray K, Quigley KS. Iraq and Afghanistan veterans report symptoms consistent with chronic multisymptom illness one year after deployment. J Rehabil Res Dev. 2016;53(1):59-70.
14. Steele L, Sastre A, Gerkovich MM, Cook MR. Complex factors in the etiology of Gulf War illness: wartime exposures and risk factors in veteran subgroups. Environ Health Perspect. 2012;120(1):112-118.
15. US Department of Veterans Affairs. VA/DoD Clinical Practice Guideline for the Management of Chronic Multisymptom Illness. Version 2.0. https://www.healthquality.va.gov/guidelines/MR/cmi/VADoDCMICPG2014.pdf. Published October 2014. Accessed April 22, 2019.
16. Koslik HJ, Hamilton G, Golomb BA. Mitochondrial dysfunction in Gulf War illness revealed by 31phosphorus magnetic resonance spectroscopy: a case-control study. PLoS One. 2014;9(3):e92887.
17. Brewer KL, Mainhart A, Meggs WJ. Double-blinded placebo-controlled cross-over pilot trial of naltrexone to treat Gulf War illness. Fatigue: Biomed Health Behav. 2018;6(3):132-140.
18. Golomb BA, Allison M, Koperski S, Koslik HJ, Devaraj S, Ritchie JB. Coenzyme Q10 benefits symptoms in Gulf War veterans: results of a randomized double-blind study. Neural Comput. 2014;26(11):2594-2651.
19. Weiduschat N, Mao X, Vu D, et al. N-acetylcysteine alleviates cortical glutathione deficit and improves symptoms in CFS: an in vivo validation study using proton magnetic resonance spectroscopy. In: Proceedings from the IACFS/ME 12th Biennial Conference; October 27-30, 2016; Fort Lauderdale, FL. Abstract. http://iacfsme.org/ME-CFS-Primer-Education/News/IACFSME-2016-Program.aspx. Accessed April 22, 2019.
20. White RF, Steele L, O’Callaghan JP, et al. Recent research on Gulf War illness and other health problems in veterans of the 1991 Gulf War: effects of toxicant exposures during deployment. Cortex. 2016;74:449-475.
21. US Department of Veterans Affairs. Caring for Gulf War I Veterans. http://www.ngwrc.net/PDF%20Files/caring-for-gulf-war.pdf. Published July 2011. Accessed April 15, 2019.
22. National Academies of Sciences, Engineering, and Medicine. Gulf War and Health. Update of Serving in the Gulf War. Vol 10. Washington, DC: National Academies Press; 2016.
23. US Department of Veterans Affairs. War-Related Illness and Injury Study Center. Gulf War illness: a guide for veteran health care providers. https://www.warrelatedillness.va.gov/education/factsheets/gulf-war-illness-for-providers.pdf. Updated October 2018. Accessed April 16, 2019.
Optimal Cosmetic Outcomes for Basal Cell Carcinoma: A Retrospective Study of Nonablative Laser Management
Nonablative laser therapy is emerging as an effective noninvasive treatment option for basal cell carcinoma (BCC) with reduced adverse effects and good cosmetic outcomes compared to surgery. Vascular lasers, such as the pulsed dye laser (PDL), are thought to work by selectively targeting the tumor’s vascular network while preserving normal surrounding tissue.1,2 Although high energy and multiple passes might be required, adjunctive use of dynamic cooling reduces the risk for nonselective thermal injury vs ablative lasers, which destroy the tumor itself through vaporization of tissue water.2
With no established laser management guidelines for the treatment of BCC, earlier studies using a 595-nm PDL varied highly in their protocol.3-8 Pulsed dye laser parameters ranged from a spot size of 7 to 10 mm, fluence of 7.5 to 15 J/cm2, and pulse duration of 0.5 to 3 milliseconds. Follow-up ranged from 12 days to 25 months after the final laser treatment. The number of lesions in prior studies ranged from 7 to 100 BCCs, with the clinical clearance rate ranging from 71.4% to 75% for facial BCC and 78.6% to 95% for nonfacial BCC.3-8 Studies with histologic confirmation had a clearance rate of 66.6% for facial BCC and 25% to 92.3% for nonfacial BCC.3-5,7,8 Most studies examined BCCs on the trunk and extremities with few investigating facial BCC,3-8 which is especially important given that the head and neck are the most common and cosmetically sensitive anatomic locations.9-13
Noninvasive imaging devices, such as reflectance confocal microscopy (RCM) and optical coherence tomography (OCT) can assist with the diagnosis and treatment monitoring of BCC. These devices enable in vivo visualization of tissue in both cross-sectional and en face views and therefore can reduce the need for diagnostic biopsy. Reflectance confocal microscopy enables near-histologic visualization of the epidermis and superficial dermis with a resolution of 0.5 to 1 μm.14 Optical coherence tomography uses an infrared broadband light source that allows users to view skin architecture as deep as 1.5 to 2 mm with a resolution of 5 μm.15
When used synergistically, both devices can enhance the efficacy of nonablative laser treatment. With its increased depth and wider field of view, OCT is an optimal tool for repetitive evaluation of the same site over time and for following biopsy-confirmed tumors undergoing management.16 In addition to delineating tumor margins before treatment, imaging improves the detection of residual skin cancers, despite clearance on clinical and dermoscopic examination. Noninvasive imaging and nonsurgical management with laser therapy allow the physician to leave the skin intact and avoid scar tissue that might otherwise make it more difficult to detect and manage recurrence. The ability of OCT and RCM to monitor the efficacy of nonsurgical therapies for skin cancer has been demonstrated with imiquimod, photodynamic therapy, vismodegib, and ablative laser therapy.17-20
With limited data on nonablative laser management of BCC, several gaps in the literature exist. First, in previously published studies the number of treatments was either determined to be an arbitrary set number or based on clinical clearance, which has the potential to miss residual tumor. Second, many follow-ups were limited to shortly after the final treatment, which limits the accuracy of the clearance rate, given that inflammation and scars can hide residual tumor.21-23 Third, because many studies excised the treated area, long-term follow-up for recurrence was obscured. Last, only a few studies involved facial BCC, which is the most common and cosmetically concerning anatomic location.13
Our study attempted to address these gaps by evaluating the use of noninvasive imaging to guide management of primarily facial BCC. The objective was to perform a retrospective chart review on a subgroup of patients with BCC who were treated with combined nonablative PDL and fractional laser treatment with an extended follow-up period.
Methods
Study Design
We performed a retrospective chart review of 68 patients with 93 BCCs who had been treated with nonablative laser therapy as an alternative to surgery at the Mount Sinai Faculty Practice Associates between February 2011 and December 2018. Patients were followed throughout this period for assessment of clinical and subclinical recurrence. The Icahn School of Medicine at Mount Sinai Program for the Protection of Human Subjects provided institutional review board approval.
Patients
Inclusion criteria included the following: (1) BCC diagnosed by biopsy (see eTable 1 for subtypes) and (2) treated with a nonablative laser due to patient preference and eligibility by the principal investigator (PI). As a retrospective study, lesions were included irrespective of tumor subtype or size. Although the risk for perineural invasion (PNI) is extremely low with BCC (<0.2%), none of the cases demonstrated PNI on diagnostic biopsy and none exhibited clinical evidence of PNI, such as paresthesia, pain, facial paralysis, or diplopia.24
Eligibility determined by the PI included limited clinical ulceration or bleeding, or both, and a safe distance from the eye when wearing an external eye shield (ie, outside the orbital rim). Patients who had Mohs micrographic surgery (MMS) or excision (or both) with recurrence at the treatment site were included. Detailed and thorough clinical and dermoscopic skin examination was critical in early detection of these cancers, allowing for treatment of less advanced tumors. The PI’s diagnostic approach utilized the published diagnostic color wheel algorithm,25 which encompasses both clinical and dermoscopic colors and patterns for early diagnosis (ie, ulceration, pink-white to white shiny areas, absence of pigmented network, leaflike structures, large blue-gray ovoid nests or globular structures, spoke wheel structures, a crystalline pattern, a singular vascular pattern of arborizing vessels), combined with OCT or RCM, when necessary.26 All lesions were imaged with OCT prior to laser treatment to confirm residual tumor following biopsy.
Although postsurgical patients were included, lesions receiving concurrent or prior nonsurgical therapy, such as a topical immunomodulator or oral hedgehog inhibitor (eg, vismodegib), were excluded.
Treatment Protocol
All patients received thorough information about the treatment, treatment alternatives, and potential adverse effects and complications. Lesions were selected based on clinical and dermoscopic findings and were biopsy confirmed. Clinical and dermoscopic photographs were taken at every visit. A camera was used for clinical photographs and a dermatoscope was attached for all contact polarized dermoscopic images. All lesions were imaged with OCT prior to laser therapy to delineate tumor margins and to confirm residual disease following biopsy to preclude biopsy-mediated regression.
Laser treatment consisted of a 595-nm PDL followed by fractional laser treatment with the 1927-nm setting. The range of PDL settings was similar to published studies of PDL for BCC (spot size, 7–10 mm; fluence, 6–15 J/cm2; pulse duration, 0.45–3 milliseconds).3-8 The fractional laser also was used at settings similar to earlier studies for actinic keratosis (fluence, 5–20 mJ; treatment density, 40%–70%).27 Laser treatment was performed by 1 of 5 medically trained providers who were fellows supervised by the PI.
All tumors received 1 to 7 treatments (average, 2.89) at 1- to 2-month intervals. Treatment end point (complete clearance) was judged on the absence of skin cancer clinically, dermoscopically on OCT, or histologically by biopsy, or a combination of these modalities. Recurrence was defined as a new histologically confirmed BCC occurring in an area that was previously documented as clear. Patients returned for follow-up 1 to 2 months after the final treatment to monitor tumor clearance and subsequently every 6 to 12 months for tumor recurrence. Posttreatment care included application of a thick emollient, such as a petrolatum-based product, until the area completely healed.
Data Collection
Clinical photographs, dermoscopic photographs, OCT scans, RCM scans, and biopsy reports were reviewed for each patient, as applicable. All patients were given an unidentifiable number; no protected health information was recorded. Data recorded for each patient included age, tumor subtype and location, tumor size, classification of the tumor as primary or a recurrence, number of treatments, treatment duration, lesion clearance, and length of follow-up.
Results
Patient and Lesion Characteristics
Sixty-eight patients with 93 BCCs (77 facial; 16 nonfacial) were included. The median age of patients was 70 years (range, 31–91 years). All 93 BCCs demonstrated residual tumor on OCT after diagnostic biopsy. Four BCCs had been treated earlier with MMS and were biopsy-proven recurrences. Most BCCs were of the nodular subtype; however, sclerosing, superficial, pigmented, morpheaform, and infiltrative subtypes also were included (eTable 1). Eight BCCs were obtained at outside institutions with no subtype provided. Facial BCCs had a mean (SD) clinical and dermoscopic diameter of 6.75 (4.71) mm (range, 2–24 mm). Patients were followed for 2.53 months to 6.03 years (mean follow-up, 2.43 years) and assessed for clinical and subclinical recurrence.
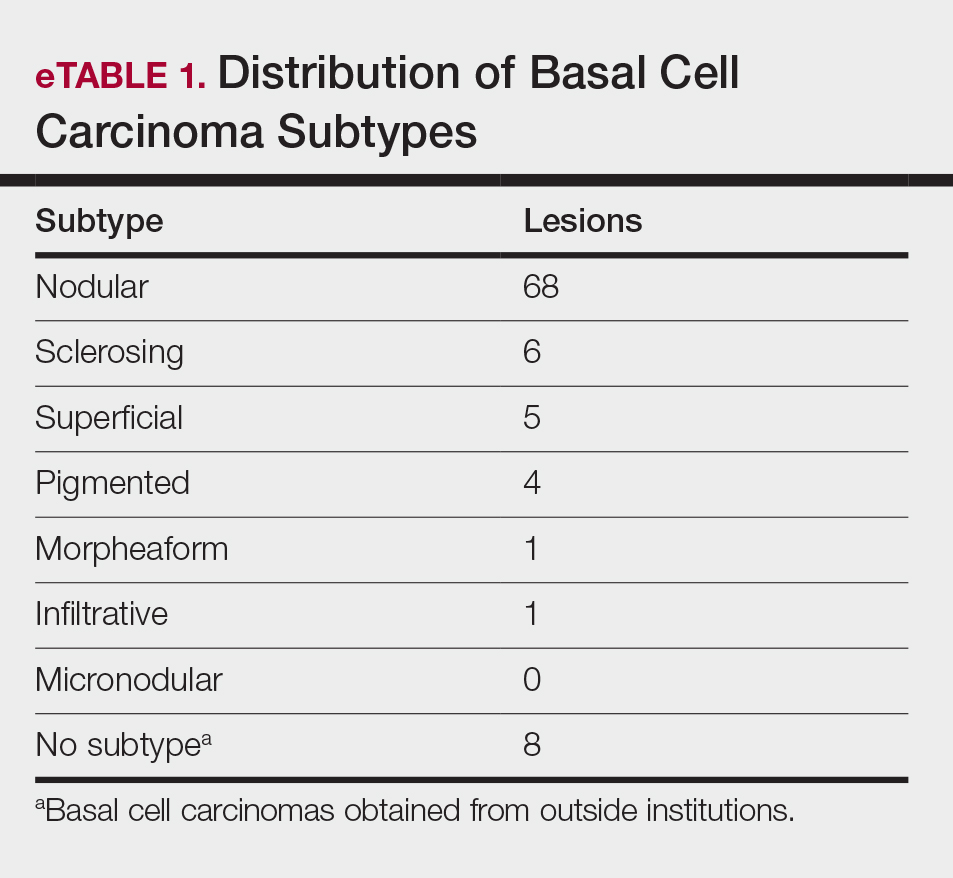
Tumor Clearance
Most lesions were effectively treated, with 89 of 93 BCCs (95.70%) demonstrating complete tumor clearance. Complete tumor clearance following laser therapy was reported in 74 of 77 facial BCCs (96.10%) and 15 of 16 nonfacial BCCs (93.75%)(eTable 2). Successfully treated BCCs underwent an average of 2.88 laser treatments over a mean duration of 3.54 months (range, 1 week to 1.92 years). Four incomplete responders underwent an average of 3.25 laser treatments over a mean duration of 3.44 months (range, 1.13–6.87 months). Of the 4 lesions that did not clear, 2 were nodular, 1 was pigmented, and 1 was sclerosing.
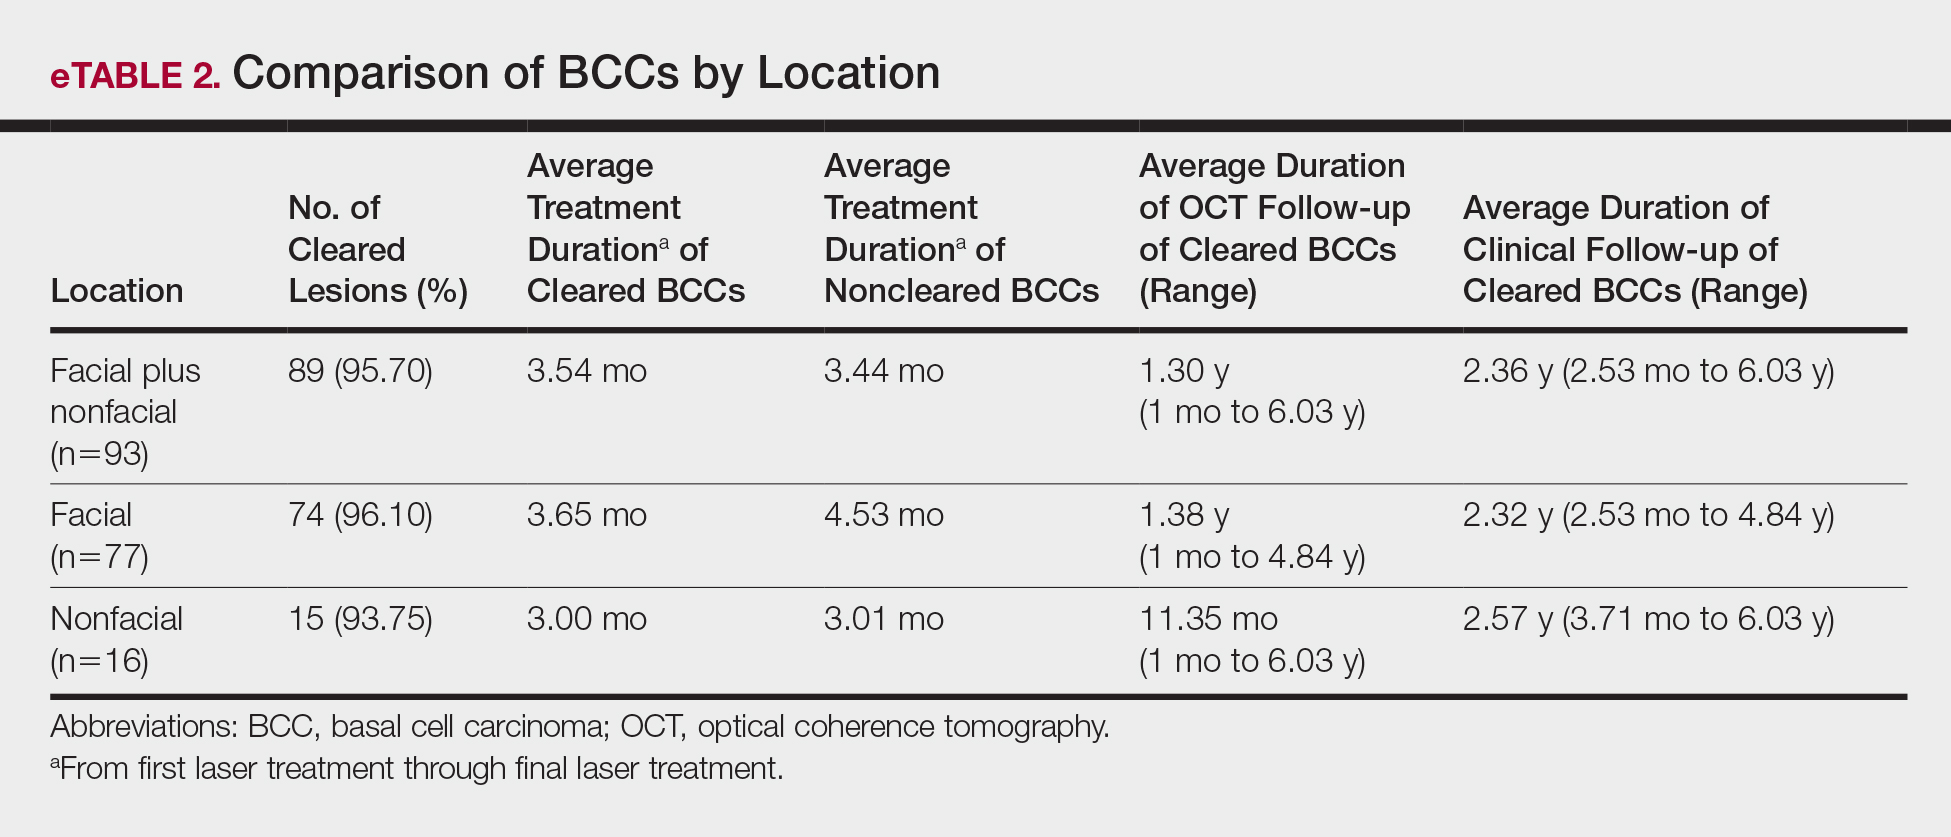
Number of Treatments
When the clearance rate is divided into lesions that received 3 or fewer laser treatments and those that received more than 3 laser treatments, the following results were determined:
• Lesions receiving 3 or fewer treatments had a clearance rate of 96.05% (73/76) for all BCCs, 96.72% (59/61) for facial BCCs, and 93.33% (14/15) for nonfacial BCCs.
• Lesions receiving more than 3 laser treatments had a clearance rate of 94.12% (16/17) for all BCCs, 93.75% (15/16) for facial BCCs, and 100% (1/1) for nonfacial BCCs.
The relationship between facial BCC tumor diameter and number of treatments required for clearance had a positive correlation coefficient (Pearson r=0.319), indicating that larger BCCs required more laser treatments (eTable 3).
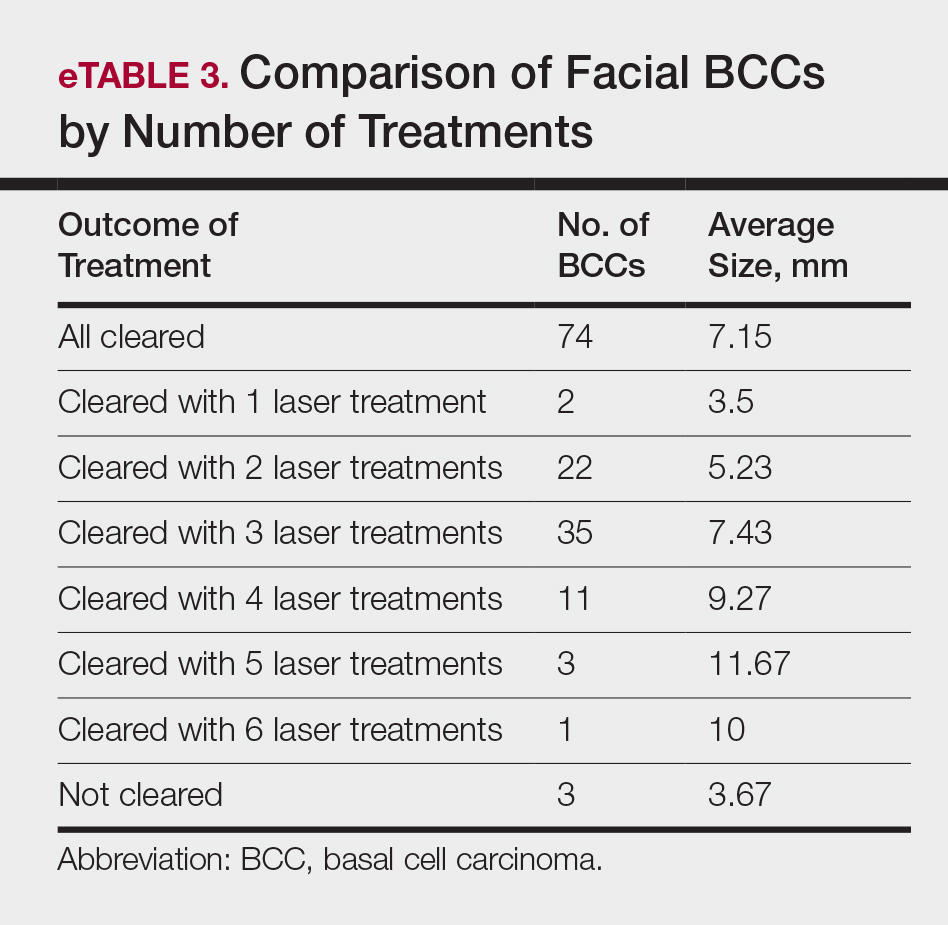
Tumor Recurrence
Four of 89 BCCs (4.49%)(4 of 74 facial BCCs [5.41%]) showed tumor recurrence following laser treatment, as assessed by OCT and dermoscopy. Of them, all were nodular BCCs. Prior to laser treatment, there were 4 additional patients each diagnosed with a recurrence from prior treatment with MMS; all were successfully treated with laser therapy without recurrence post–laser treatment (eFigure 1). Most of the recurrences from prior MMS required more than 3 laser treatments before clearing: 1 required 3 treatments, 2 required 4 treatments, and 1 required 6 treatments.
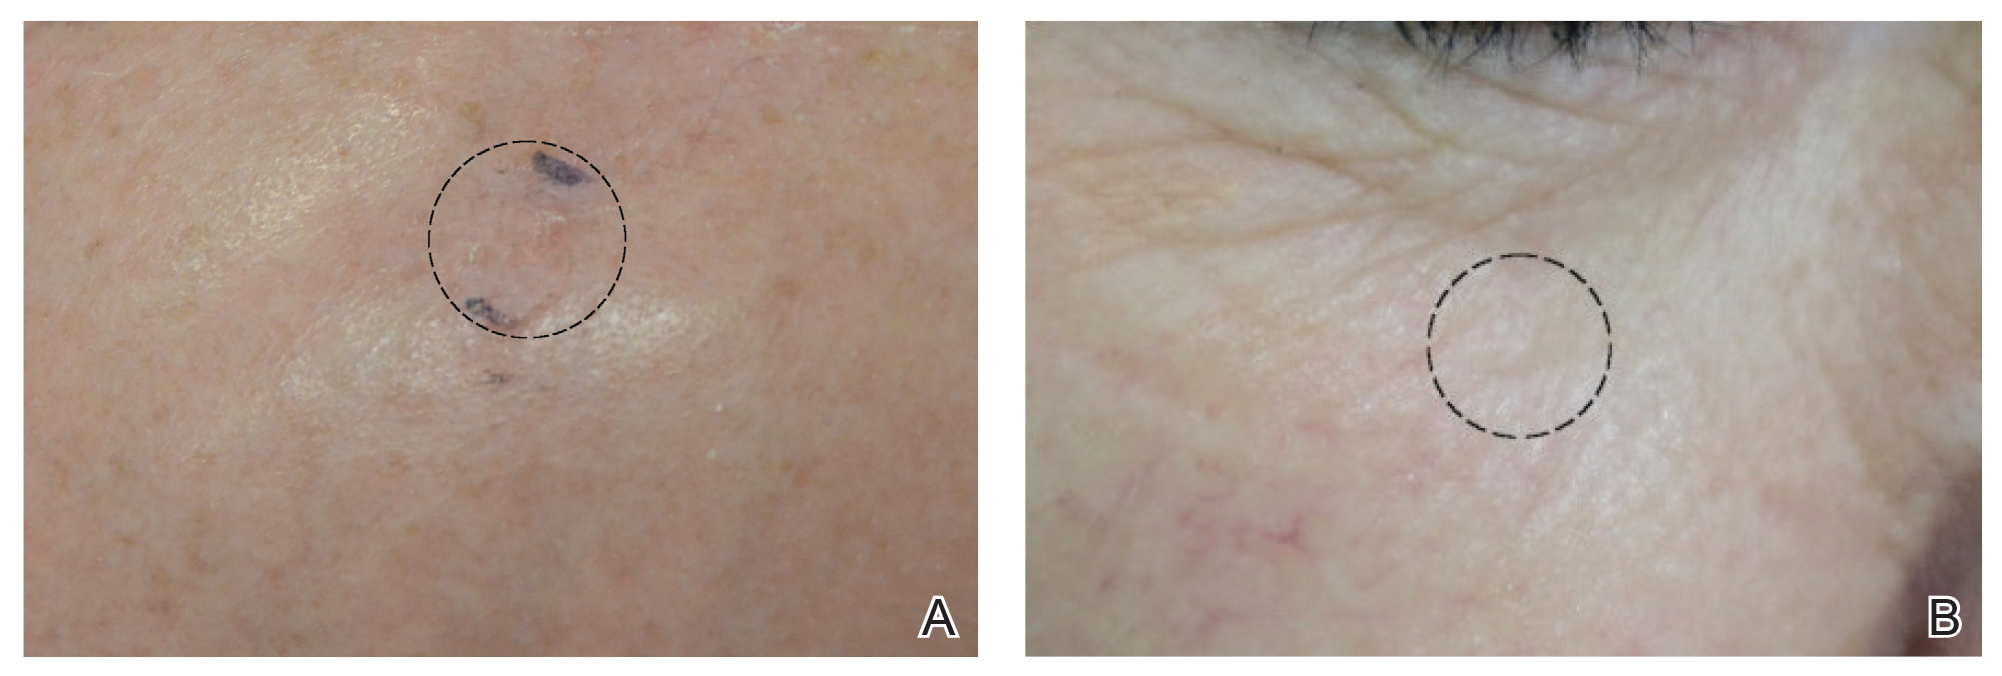
Of 93 lesions included in this study, 2 BCCs were deemed not clear on histologic analysis, which corresponded with residual tumor seen on OCT. Two additional lesions were determined to be not clear on OCT but were not confirmed as such on biopsy; both lesions were confirmed not clear, however, by histologic analysis on the first layer of MMS
Follow-up
All cleared lesions (89/93) showed complete clinical response to laser treatment for 6 months or more (median follow-up, 2–3 years; mode, 1–2 years; mean, 2.66 years)(eTable 4). Although 45% of patients (40/89) have been followed clinically and/or dermoscopically (as is done for MMS follow-ups) for 3 years to more than 5 years, only 20% of patients (18/89) were followed up with OCT in combination with clinical and/or dermoscopic examination between 3 years and more than 5 years. Follow-up took on a bimodal distribution, with a peak follow-up period at 1 to 2 years and again at 3 to 4 years. Half of the lesions (45/89) were followed up with OCT in combination with clinical and dermoscopic examination at 1 to 6 months (eTable 5). Of the 2 patients with 1-month OCT follow-up, 1 died from other medical causes and the other was unable to return for further follow-up scans.
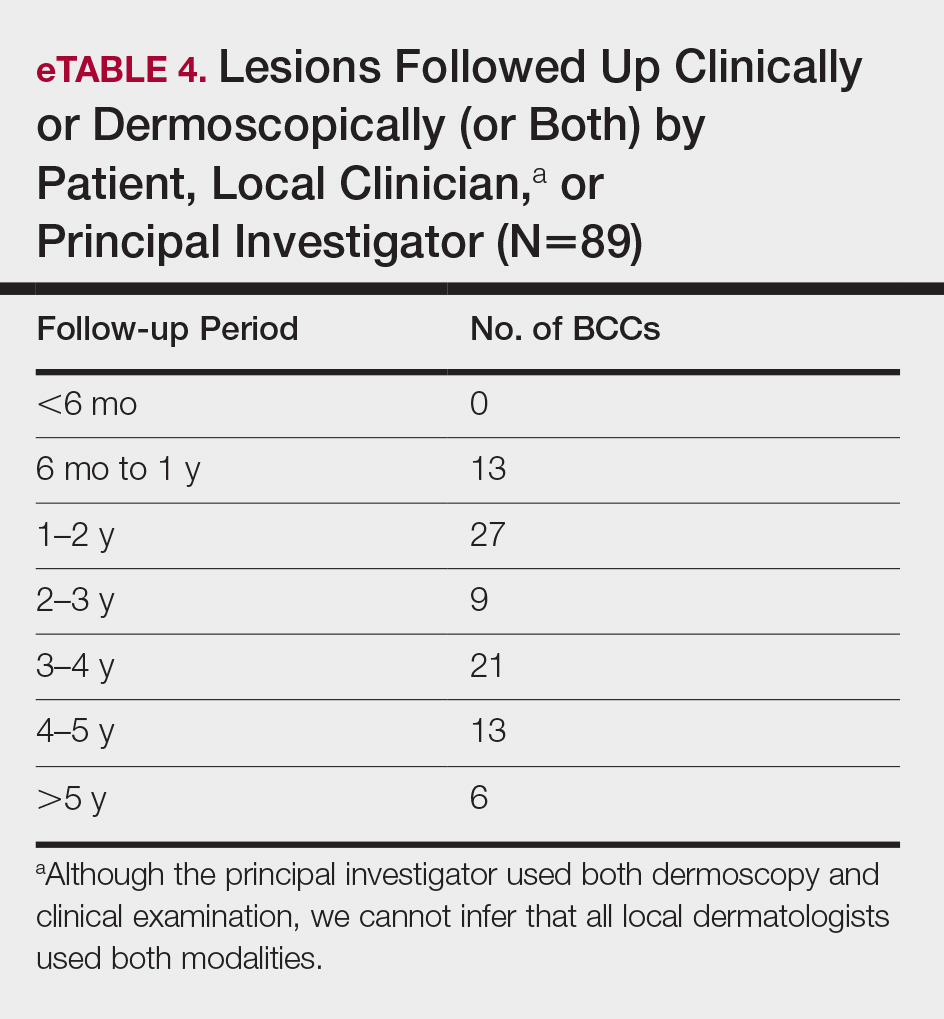

Comment
High Tumor Clearance Rates With OCT
This study yielded a clearance rate of 95.70% for all BCCs, 96.10% for facial BCCs, and 93.75% for nonfacial BCCs. This rate is higher than the clinical or histologic clearance rate (or both) of earlier studies on facial and nonfacial BCCs, which ranged from 25% to 95%.8-11 In this study, we were able to utilize OCT and histology to confirm clearance. Optical coherence tomography, which has been shown to have a high sensitivity ranging from 86% to 95.7%, is therefore optimally used in treatment monitoring.19,26,28 Optical coherence tomography has a broader specificity range of 75.3% to 98% and was not utilized for diagnostic purposes in this study. Combining OCT with a color wheel dermoscopic approach was helpful in confirming treatment efficacy of nonsurgical therapies and is significantly more accurate than clinical analysis alone (P<.01).19,26,28
We suspect that the higher clearance rates observed in our study were due to the OCT-guided treatment protocol. Optical coherence tomography was used for margination while providing a modality for tailored treatment through visualization of residual tumor on clinically and dermoscopically clear follow-ups, given that several studies found residual tumor at the lateral edge of the tumor margin on histopathologic analysis.5 Utilizing noninvasive imaging technology to delineate tumor margins before treatment can improve efficacy and limit unnecessary treatment to the surrounding normal skin (eFigure 2).29
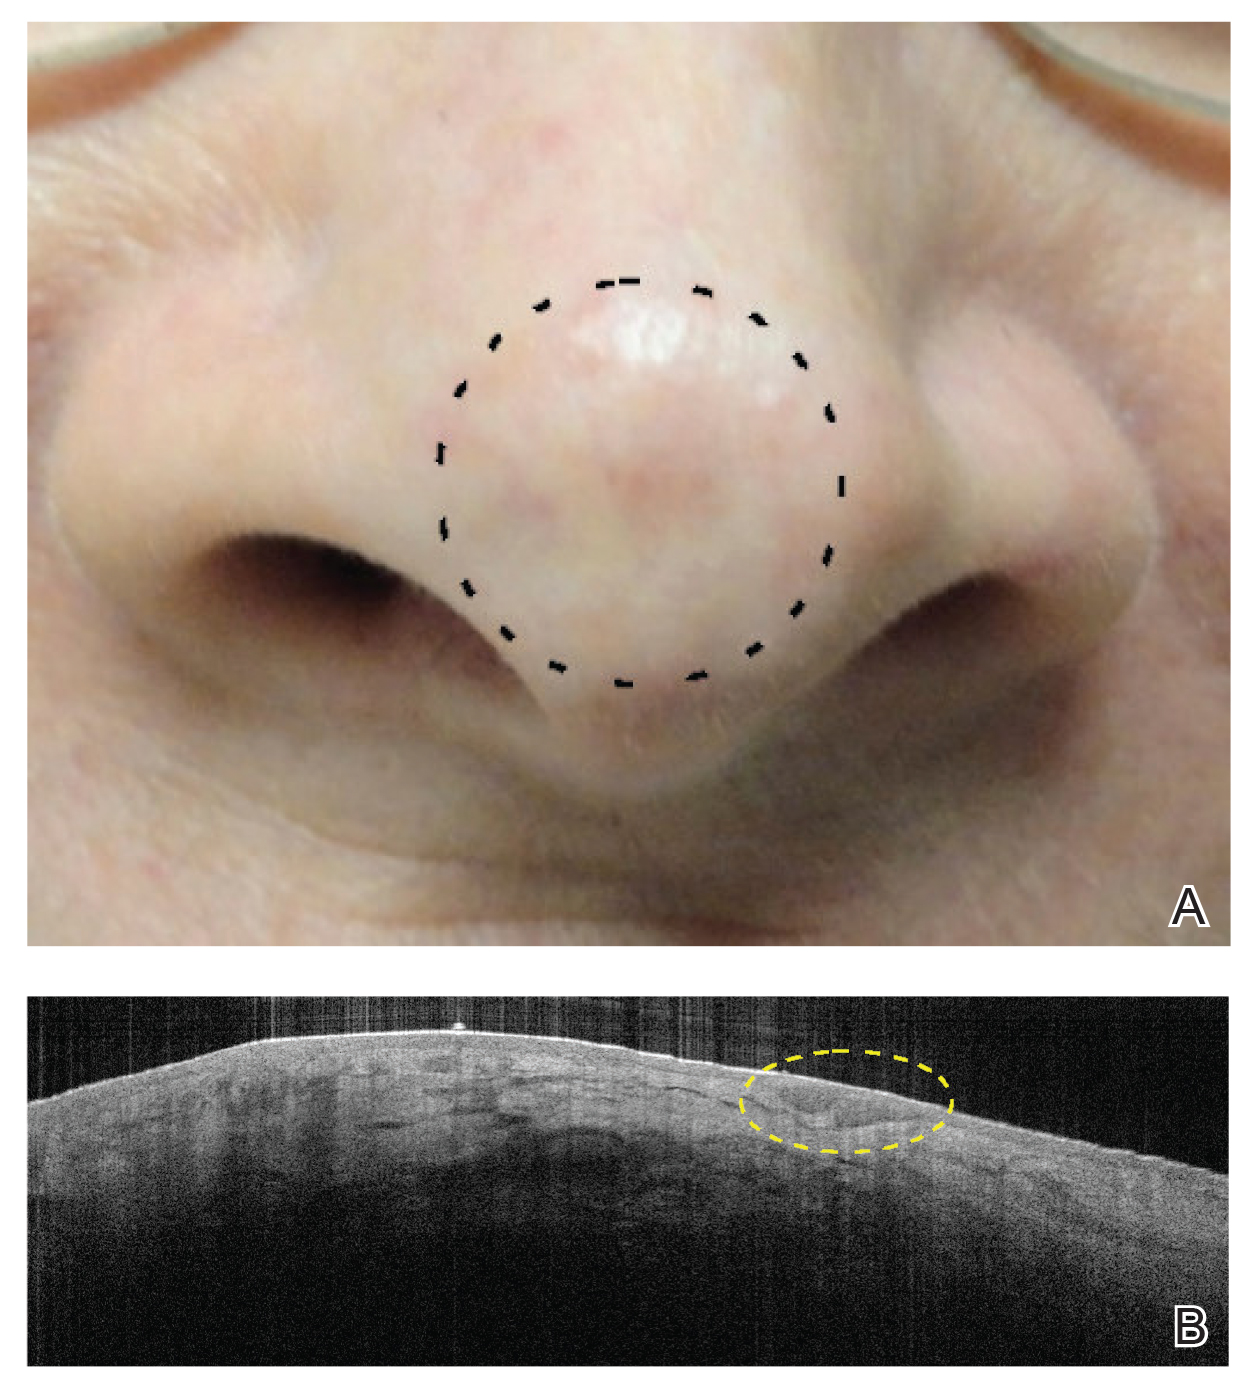
After grouping lesions by number of laser treatments, the clearance rate remained similar among facial BCCs with 3 or fewer treatments (59/61 [96.72%]), but there was a slightly decreased clearance rate for facial BCCs with more than 3 treatments (15/16 [93.75%]), which may be explained by the need for more laser treatments for larger BCCs (eTable 3). The relationship between facial BCC size and number of laser treatments was found to correlate positively (Pearson r=0.319). The largest lesion (24 mm) was successfully treated with 5 treatments (Figure). The number of nonfacial lesions was limited in this study and was not statistically significant.
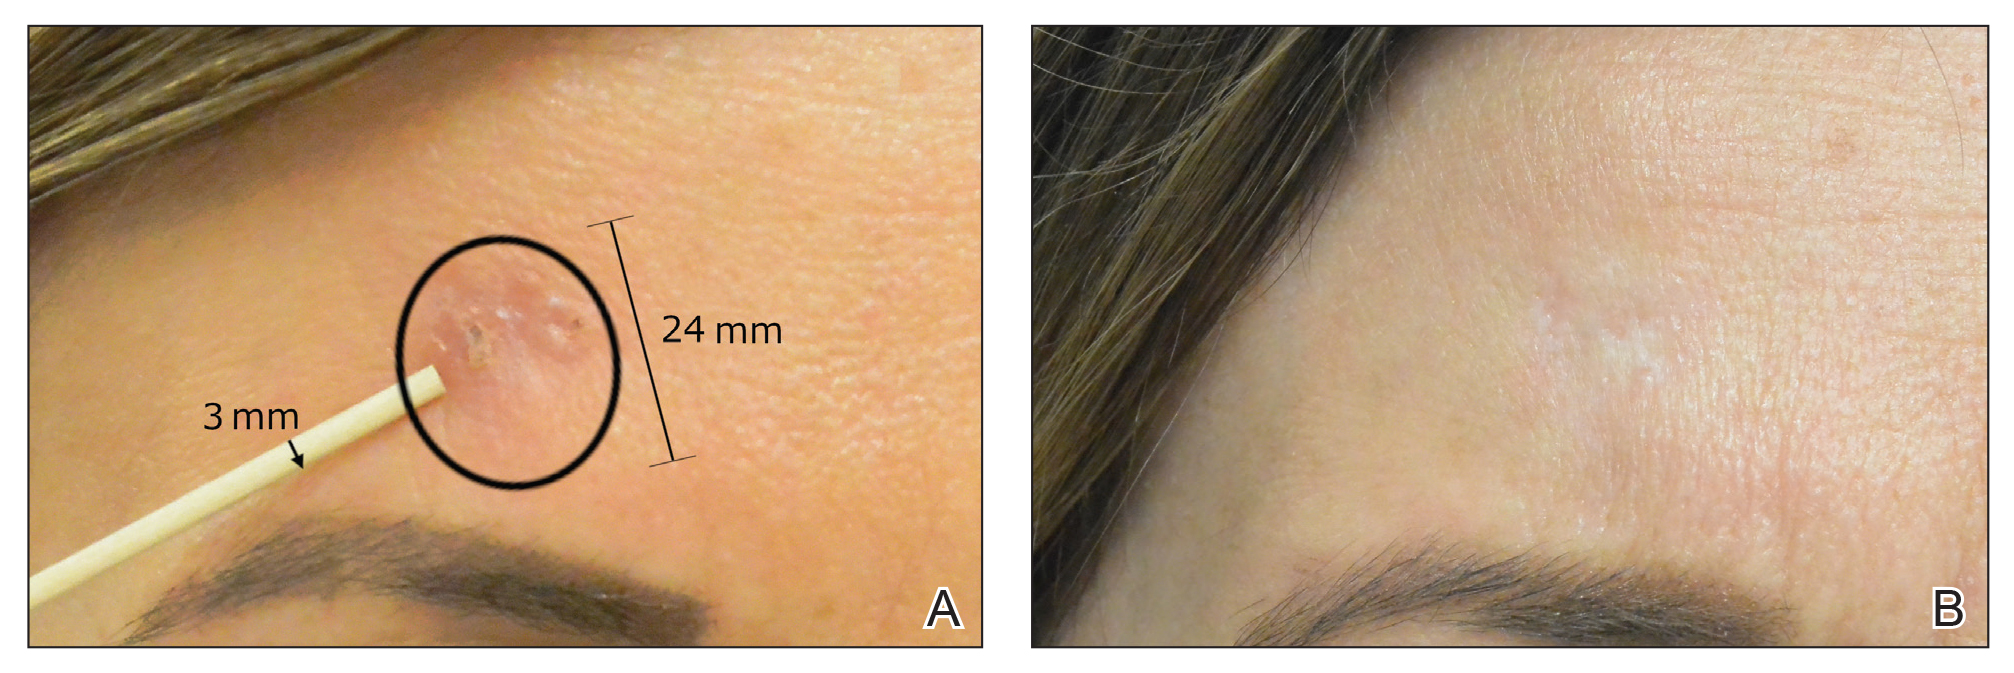
there was no clinical evidence of residual BCC.
Cosmetic Outcome
Adverse effects, including erythema, purpura, blistering, and crusting, were short-term and well tolerated. Few patients had subsequent hypopigmentation in the initial months after treatment, which we consider an optimal cosmetic outcome. For example, the patient shown in the Figure would have required extensive reconstruction of the defect using bilateral rotation flaps with incisions along the hairline, grafting, or second-intention healing with partial closure to avoid brow-lifting.30 Given the relatively young age of this patient (a 45-year-old woman) and therefore limited skin laxity, secondary intention or even attempting to match grafted tissue could have resulted in a less than optimal cosmetic outcome. None of the patients experienced clinical or dermoscopic evidence of scarring from the laser treatment.
A few lesions were found to have subclinical inflammation on OCT, which might have obscured residual tumor on the 1-month follow-up scan. This condition may be similar to how pre-MMS diagnostic biopsy scars mask skin cancer during surgery, making it necessary to obtain additional layers beyond the biopsy scar tissue. This scar tissue would otherwise obscure tumor on histology during MMS, similar to subclinical inflammation obscuring residual tumor on OCT.21-23,31 Invasive and noninvasive management of skin cancers will have different healing times and therefore different optimal times to confirm clearance by histology compared to noninvasive imaging. All of the lesions in which inflammation was obscured on OCT 1-month posttreatment remained cleared. However, 1 lesion was found to be clear at a 4-week clearance scan after only 2 nonablative laser treatments and was confirmed as scar tissue on histology. Scar tissue on histology might have obscured any residual tumor. The patient appeared clinically and dermoscopically to have a milia in the same location only 5 months later; however, on OCT and histology, the lesion was confirmed to be a BCC.
Treatment Intervals
Several other studies either used a set number of treatments or determined the number of treatments based on clinical clearance.3-8 When determining the best treatment interval, we considered the period for patients to be clinically and dermoscopically healed to be 1 month. Patients came for their final follow-up scan an additional month after the final treatment in case there was any obscuring inflammation on OCT at 1 month. Given that patients responded well to nonablative laser treatment once skin clinically healed and most patients required 3 treatments, the PI began recommending a total of 3 treatments performed 4 to 6 weeks apart in clinical practice, followed by a final clearance scan 2 months after the third treatment. A period of 2 months was considered ideal for the final clearance scan because no inflammation was seen at the 2-month follow-up in the group of patients who had inflammation at the 1-month follow-up on OCT in our study. Some patients had an extended treatment duration because of noncompliance with the 4- to 6-week follow-up regimen. Although this extension of treatment duration potentially skews the clearance rate, we still included these patients, given the retrospective design of this study.
Lesions That Did Not Clear
Four BCCs did not clear, 3 of which were facial BCCs. All 4 lesions demonstrated residual tumor on OCT. Of the 3 facial lesions that did not clear:
• One was the patient who had obscuring inflammation at the 1-month follow-up and only scar tissue on histologic confirmation.
• Another was a pigmented BCC on the right cheek of a patient with Fitzpatrick skin type IV. This patient received 3 treatments without a response clinically or on OCT. (Most patients who showed complete clearance also showed reduction in tumor size after the first laser treatment. Of note, there were other patients who had lighter skin types with pigmented BCCs and all of these patients had complete response to this treatment regimen; therefore, we do not think that a pigmented BCC is an exclusion to this therapy.)
• The third was a BCC on the nose of a nonadherent patient, which may have contributed to the lack of clearance. We defined nonadherent patients as those who did not follow-up within the appropriate periods and who therefore ran the risk for tumor growth in between treatments.
The nonfacial BCC that did not clear had histologic features of focal sclerosing BCC, a more aggressive subtype of basal cell skin cancer.
Tumor Recurrence
Only 4 of 89 BCCs (4.49%) recurred, with a 5.41% (4/74) recurrence rate among facial BCCs. All recurrences lacked clinical and dermoscopic evidence of BCC but were found on follow-up OCT scan and confirmed with RCM. All recurrences were found 1.5 to 3.9 years posttreatment.
Recurrent tumors following MMS required, on average, more laser treatments than primary tumors to achieve successful tumor clearance, which we attribute to scar tissue from prior therapy obscuring recurrence, resulting in delayed diagnosis, and to inflammation and fibrosis masking residual tumors (eFigure 1). An added benefit of laser treatment is that all 4 recurrent tumors demonstrated improved cosmetic appearance of the original MMS scar.
The benefit of using OCT scans to check for recurrences is that OCT can find residual skin cancers despite the area looking clinically clear, which is especially important during clinical evaluation of a healed postsurgical scar for recurrence because OCT imaging allows us to look as deep as 2 mm under the skin. Nonsurgical treatments also enable us to leave skin intact and avoid creating scar tissue, which makes it easier to detect and manage recurrence.
Limitations
There were several important limitations of this retrospective study:
• Patients were treated by 1 of 5 medically trained fellows. Although the fellows worked under the supervision of the PI, variation in their work from one to another might have led to different end points.
• All patients who appeared clinically clear were offered biopsy to confirm clearance on histology. Some patients agreed to biopsy, but many did not because they were pleased with the cosmetic outcome, which is similar to other studies exhibiting only clinical clearance rates without providing histologic clearance following nonsurgical therapy.6 We believe that imaging with OCT circumvents this problem and offers more accurate confirmation than clinical or dermoscopic correlation alone, or the combination of the 2 modalities.
• Lack of treatment standardization and short length of follow-up can result in underestimation of the recurrence rate. In particular, most patients were followed up with OCT in less than 6 months. These are unavoidable features in a retrospective study and we are currently addressing this problem in a new prospective study.
Extended Follow-up
Although this study is not a prospective design, it does provide recurrence data over extended follow-up for the nonablative laser management of BCCs (eTables 4 and 5). Studies have demonstrated that MMS has a 5-year cure rate as high as 99% for BCC.32 Given the limited follow-up period of prior nonablative laser management studies, recurrences might not have been fully evaluated. Our study had a 4.49% recurrence rate for all BCCs and a 5.41% recurrence rate for facial BCCs but was not detectable by clinical examination combined with dermoscopic findings alone. All recurrences required the utilization of OCT or RCM or a combination of these modalities to be diagnosed. In 1 patient with recurrence, we were able to see residual tumor on both OCT and RCM without any inflammation obscuring the scan, given that 3 years had passed. Although 2 months is an optimal follow-up time for OCT, we have not found an optimal follow-up time for RCM, which is another reason why OCT might be preferable to other imaging modalities, such as RCM and high-definition OCT, that have higher resolution but provide less depth on imaging. Although only 40 of 89 patients (4.49%) had follow-up ranging from 3 years to greater than 5 years, long-term follow-up to date has been limited in prior studies.
We believe the high clearance rates and limited recurrence are secondary to the utilization of noninvasive imaging, as the majority of these recurrences would not have been diagnosed based on clinical and/or dermoscopic information alone. Additionally, the 4 biopsy-proven post-MMS recurrence patients that were treated in this study also may not have been diagnosed this early without the use of additional noninvasive imaging. In our opinion, although laser management can be used without noninvasive imaging guidance—dermoscopy, OCT, and/or RCM—this technology is critical not only for early detection but also for proper management of patients.
Conclusion
This study showed a 95.70% clearance rate for all BCCs and a 96.10% clearance rate for facial BCCs. Although we had a zero clinical recurrence rate, 4.49% of all BCCs and 5.41% of facial BCCs had recurred on subsequent monitoring with noninvasive imaging. Given the large size of the study and extended follow-up, we found nonablative laser management to be a reliable treatment alternative with improved cosmetic outcome (Figure) and minimal short-term adverse effects compared to surgery.
Tailored care for the individual patient is based on a variety of options and patient preference, including ease of compliance, number of follow-up visits, invasive vs noninvasive diagnosis and monitoring, and downtime for healing. The use of noninvasive imaging also allowed us to find a more standardized treatment regimen using this nonablative laser combination. We found that 3 or fewer and more than 3 treatments had similar efficacy in tumor clearance. We recommend a standard laser protocol of 3 treatments every 4 to 6 weeks with follow-up 2 months after the final treatment to assess for clearance with OCT.
Larger BCCs might require additional treatments; therefore, we caution against laser therapy without concomitant use of OCT imaging to visualize residual tumor. Utilizing other noninvasive modalities, such as dermoscopy, in combination with thorough skin examination also is critical in the early detection of skin cancers to improve the efficacy of this less-aggressive, nonablative, and cosmetically optimal treatment protocol.
Acknowledgement—We would like to acknowledge Dimitrios Karponis, BSc, from the Impirial College London, England, for his assistance with a portion of the statistical analysis.
- Campolmi P, Troiano M, Bonan P, et al. Vascular based non conventional dye laser treatment for basal cell carcinoma. Dermatol Ther. 2008;21:402-405.
- Soleymani T, Abrouk M, Kelly KM. An analysis of laser therapy for the treatment of nonmelanoma skin cancer. Dermatol Surg. 2017;43:615-624.
- Alonso-Castro L, Ríos-Buceta L, Boixeda P, et al. The effect of pulsed dye laser on high-risk basal cell carcinomas with response control by Mohs micrographic surgery. Lasers Med Sci. 2015;30:2009-2014.
- Karsai S, Friedl H, Buhck H, et al. The role of the 595-nm pulsed dye laser in treating superficial basal cell carcinoma: outcome of a double-blind randomized placebo-controlled trial. Br J Dermatol. 2015;172:677-683.
- Konnikov N, Avram M, Jarell A, et al. Pulsed dye laser as a novel non-surgical treatment for basal cell carcinomas: response and follow up 12-21 months after treatment. Lasers Surg Med. 2011;43:72-78.
- Minars N, Blyumin-Karasik M. Treatment of basal cell carcinomas with pulsed dye laser: a case series. J Skin Cancer. 2012;2012:286480.
- Shah SM, Konnikov N, Duncan LM, et al. The effect of 595 nm pulsed dye laser on superficial and nodular basal cell carcinomas. Lasers Surg Med. 2009;41:417-422.
- Tran HT, Lee RA, Oganesyan G, et al. Single treatment of non-melanoma skin cancers using a pulsed-dye laser with stacked pulses. Lasers Surg Med. 2012;44:459-467.
- Cameron MC, Lee E, Hibler BP, et al. Basal cell carcinoma: epidemiology; pathophysiology; clinical and histological subtypes; and disease associations. J Am Acad Dermatol. 2019;80:303-317.
- Silverman MK, Kopf AW, Bart RS, et al. Recurrence rates of treated basal cell carcinomas. part 3: surgical excision. J Dermatol Surg Oncol. 1992;18:471-476.
- Silverman MK, Kopf AW, Grin CM, et al. Recurrence rates of treated basal cell carcinomas. part 2: curettage-electrodesiccation. J Dermatol Surg Oncol. 1991;17:720-726.
- Dubin N, Kopf AW. Multivariate risk score for recurrence of cutaneous basal cell carcinomas. Arch Dermatol. 1983;119:373-377.
- Subramaniam P, Olsen CM, Thompson BS, et al. Anatomical distributions of basal cell carcinoma and squamous cell carcinoma in a population-based study in Queensland, Australia. JAMA Dermatol. 2017;153:175-182.
- Rajadhyaksha M, Grossman M, Esterowitz D, et al. In vivo confocal scanning laser microscopy of human skin: melanin provides strong contrast.J Invest Dermatol. 1995;104:946-952.
- Levine A, Wang K, Markowitz O. Optical coherence tomography in the diagnosis of skin cancer. Dermatol Clin. 2017;35:465-488.
- Sattler E, Kästle R, Welzel J. Optical coherence tomography in dermatology. J Biomed Opt. 2013;18:061224.
- Banzhaf CA, Themstrup L, Ring HC, et al. Optical coherence tomography imaging of non-melanoma skin cancer undergoing imiquimod therapy. Ski Res Technol. 2014;20:170-176.
- Segura S, Puig S, Carrera C, et al. Non-invasive management of non-melanoma skin cancer in patients with cancer predisposition genodermatosis: a role for confocal microscopy and photodynamic therapy. J Eur Acad Dermatol Venereol. 2011;25:819-827.
- Ulrich M, Lange-Asschenfeldt S, Gonzalez S. The use of reflectance confocal microscopy for monitoring response to therapy of skin malignancies. Dermatol Pract Concept. 2012;2:43-52.
- Couzan C, Cinotti E, Labeille B, et al. Reflectance confocal microscopy identification of subclinical basal cell carcinomas during and after vismodegib treatment. J Eur Acad Dermatol Venereol. 2018;32:763-767.
- Ruiz ES, Karia PS, Morgan FC, et al. Multiple Mohs micrographic surgery is the most common reason for divergence from the appropriate use criteria: a single institution retrospective cohort study. J Am Acad Dermatol. 2016;75:830-831.
- Wagner RF Jr, Cottel WI. Multifocal recurrent basal cell carcinoma following primary tumor treatment by electrodesiccation and curettage. J Am Acad Dermatol. 1987;17:1047-1049.
- Connolly SM, Baker DR, Coldiron BM, et al. AAD/ACMS/ASDSA/ASMS 2012 appropriate use criteria for Mohs micrographic surgery: a report of the American Academy of Dermatology, American College of Mohs Surgery, American Society for Dermatologic Surgery Association, and the American Society for Mohs Surgery. Dermatol Surg. 2012;38:1582-1603.
- Lewin JM, Carucci JA. Advances in the management of basal cell carcinoma. F1000Prime Rep. 2015;7:53.
- Markowitz O. A Practical Guide to Dermoscopy. Philadelphia, PA: Wolters Kluwer; 2017.
- Markowitz O, Schwartz M, Feldman E, et al. Evaluation of optical coherence tomography as a means of identifying earlier stage basal cell carcinomas while reducing the use of diagnostic biopsy. J Clin Aesthet Dermatol. 2015;8:14-20.
- Weiss ET, Brauer JA, Anolik R, et al. 1927-nm fractional resurfacing of facial actinic keratoses: a promising new therapeutic option. J Am Acad Dermatol. 2013;68:98-102.
- Olsen J, Themstrup L, De Carvalho N, et al. Diagnostic accuracy of optical coherence tomography in actinic keratosis and basal cell carcinoma. Photodiagnosis Photodyn Ther. 2016;16:44-49.
- Levine A, Siegel D, Markowitz O. Imaging in cutaneous surgery. Future Oncol. 2017;13:2329-2340.
- Gross K, Steinman H, Rapini R. Mohs Surgery: Fundamentals and Techniques. St. Louis, MO: Mosby; 1998.
- Suzuki HS, Serafini SZ, Sato MS. Utility of dermoscopy for demarcation of surgical margins in Mohs micrographic surgery. An Bras Dermatol. 2014;89:38-43.
- Rowe DE, Carroll RJ, Day CL Jr. Mohs surgery is the treatment of choice for recurrent (previously treated) basal cell carcinoma. J Dermatol Surg Oncol. 1989;15:424-431
Nonablative laser therapy is emerging as an effective noninvasive treatment option for basal cell carcinoma (BCC) with reduced adverse effects and good cosmetic outcomes compared to surgery. Vascular lasers, such as the pulsed dye laser (PDL), are thought to work by selectively targeting the tumor’s vascular network while preserving normal surrounding tissue.1,2 Although high energy and multiple passes might be required, adjunctive use of dynamic cooling reduces the risk for nonselective thermal injury vs ablative lasers, which destroy the tumor itself through vaporization of tissue water.2
With no established laser management guidelines for the treatment of BCC, earlier studies using a 595-nm PDL varied highly in their protocol.3-8 Pulsed dye laser parameters ranged from a spot size of 7 to 10 mm, fluence of 7.5 to 15 J/cm2, and pulse duration of 0.5 to 3 milliseconds. Follow-up ranged from 12 days to 25 months after the final laser treatment. The number of lesions in prior studies ranged from 7 to 100 BCCs, with the clinical clearance rate ranging from 71.4% to 75% for facial BCC and 78.6% to 95% for nonfacial BCC.3-8 Studies with histologic confirmation had a clearance rate of 66.6% for facial BCC and 25% to 92.3% for nonfacial BCC.3-5,7,8 Most studies examined BCCs on the trunk and extremities with few investigating facial BCC,3-8 which is especially important given that the head and neck are the most common and cosmetically sensitive anatomic locations.9-13
Noninvasive imaging devices, such as reflectance confocal microscopy (RCM) and optical coherence tomography (OCT) can assist with the diagnosis and treatment monitoring of BCC. These devices enable in vivo visualization of tissue in both cross-sectional and en face views and therefore can reduce the need for diagnostic biopsy. Reflectance confocal microscopy enables near-histologic visualization of the epidermis and superficial dermis with a resolution of 0.5 to 1 μm.14 Optical coherence tomography uses an infrared broadband light source that allows users to view skin architecture as deep as 1.5 to 2 mm with a resolution of 5 μm.15
When used synergistically, both devices can enhance the efficacy of nonablative laser treatment. With its increased depth and wider field of view, OCT is an optimal tool for repetitive evaluation of the same site over time and for following biopsy-confirmed tumors undergoing management.16 In addition to delineating tumor margins before treatment, imaging improves the detection of residual skin cancers, despite clearance on clinical and dermoscopic examination. Noninvasive imaging and nonsurgical management with laser therapy allow the physician to leave the skin intact and avoid scar tissue that might otherwise make it more difficult to detect and manage recurrence. The ability of OCT and RCM to monitor the efficacy of nonsurgical therapies for skin cancer has been demonstrated with imiquimod, photodynamic therapy, vismodegib, and ablative laser therapy.17-20
With limited data on nonablative laser management of BCC, several gaps in the literature exist. First, in previously published studies the number of treatments was either determined to be an arbitrary set number or based on clinical clearance, which has the potential to miss residual tumor. Second, many follow-ups were limited to shortly after the final treatment, which limits the accuracy of the clearance rate, given that inflammation and scars can hide residual tumor.21-23 Third, because many studies excised the treated area, long-term follow-up for recurrence was obscured. Last, only a few studies involved facial BCC, which is the most common and cosmetically concerning anatomic location.13
Our study attempted to address these gaps by evaluating the use of noninvasive imaging to guide management of primarily facial BCC. The objective was to perform a retrospective chart review on a subgroup of patients with BCC who were treated with combined nonablative PDL and fractional laser treatment with an extended follow-up period.
Methods
Study Design
We performed a retrospective chart review of 68 patients with 93 BCCs who had been treated with nonablative laser therapy as an alternative to surgery at the Mount Sinai Faculty Practice Associates between February 2011 and December 2018. Patients were followed throughout this period for assessment of clinical and subclinical recurrence. The Icahn School of Medicine at Mount Sinai Program for the Protection of Human Subjects provided institutional review board approval.
Patients
Inclusion criteria included the following: (1) BCC diagnosed by biopsy (see eTable 1 for subtypes) and (2) treated with a nonablative laser due to patient preference and eligibility by the principal investigator (PI). As a retrospective study, lesions were included irrespective of tumor subtype or size. Although the risk for perineural invasion (PNI) is extremely low with BCC (<0.2%), none of the cases demonstrated PNI on diagnostic biopsy and none exhibited clinical evidence of PNI, such as paresthesia, pain, facial paralysis, or diplopia.24
Eligibility determined by the PI included limited clinical ulceration or bleeding, or both, and a safe distance from the eye when wearing an external eye shield (ie, outside the orbital rim). Patients who had Mohs micrographic surgery (MMS) or excision (or both) with recurrence at the treatment site were included. Detailed and thorough clinical and dermoscopic skin examination was critical in early detection of these cancers, allowing for treatment of less advanced tumors. The PI’s diagnostic approach utilized the published diagnostic color wheel algorithm,25 which encompasses both clinical and dermoscopic colors and patterns for early diagnosis (ie, ulceration, pink-white to white shiny areas, absence of pigmented network, leaflike structures, large blue-gray ovoid nests or globular structures, spoke wheel structures, a crystalline pattern, a singular vascular pattern of arborizing vessels), combined with OCT or RCM, when necessary.26 All lesions were imaged with OCT prior to laser treatment to confirm residual tumor following biopsy.
Although postsurgical patients were included, lesions receiving concurrent or prior nonsurgical therapy, such as a topical immunomodulator or oral hedgehog inhibitor (eg, vismodegib), were excluded.
Treatment Protocol
All patients received thorough information about the treatment, treatment alternatives, and potential adverse effects and complications. Lesions were selected based on clinical and dermoscopic findings and were biopsy confirmed. Clinical and dermoscopic photographs were taken at every visit. A camera was used for clinical photographs and a dermatoscope was attached for all contact polarized dermoscopic images. All lesions were imaged with OCT prior to laser therapy to delineate tumor margins and to confirm residual disease following biopsy to preclude biopsy-mediated regression.
Laser treatment consisted of a 595-nm PDL followed by fractional laser treatment with the 1927-nm setting. The range of PDL settings was similar to published studies of PDL for BCC (spot size, 7–10 mm; fluence, 6–15 J/cm2; pulse duration, 0.45–3 milliseconds).3-8 The fractional laser also was used at settings similar to earlier studies for actinic keratosis (fluence, 5–20 mJ; treatment density, 40%–70%).27 Laser treatment was performed by 1 of 5 medically trained providers who were fellows supervised by the PI.
All tumors received 1 to 7 treatments (average, 2.89) at 1- to 2-month intervals. Treatment end point (complete clearance) was judged on the absence of skin cancer clinically, dermoscopically on OCT, or histologically by biopsy, or a combination of these modalities. Recurrence was defined as a new histologically confirmed BCC occurring in an area that was previously documented as clear. Patients returned for follow-up 1 to 2 months after the final treatment to monitor tumor clearance and subsequently every 6 to 12 months for tumor recurrence. Posttreatment care included application of a thick emollient, such as a petrolatum-based product, until the area completely healed.
Data Collection
Clinical photographs, dermoscopic photographs, OCT scans, RCM scans, and biopsy reports were reviewed for each patient, as applicable. All patients were given an unidentifiable number; no protected health information was recorded. Data recorded for each patient included age, tumor subtype and location, tumor size, classification of the tumor as primary or a recurrence, number of treatments, treatment duration, lesion clearance, and length of follow-up.
Results
Patient and Lesion Characteristics
Sixty-eight patients with 93 BCCs (77 facial; 16 nonfacial) were included. The median age of patients was 70 years (range, 31–91 years). All 93 BCCs demonstrated residual tumor on OCT after diagnostic biopsy. Four BCCs had been treated earlier with MMS and were biopsy-proven recurrences. Most BCCs were of the nodular subtype; however, sclerosing, superficial, pigmented, morpheaform, and infiltrative subtypes also were included (eTable 1). Eight BCCs were obtained at outside institutions with no subtype provided. Facial BCCs had a mean (SD) clinical and dermoscopic diameter of 6.75 (4.71) mm (range, 2–24 mm). Patients were followed for 2.53 months to 6.03 years (mean follow-up, 2.43 years) and assessed for clinical and subclinical recurrence.
Tumor Clearance
Most lesions were effectively treated, with 89 of 93 BCCs (95.70%) demonstrating complete tumor clearance. Complete tumor clearance following laser therapy was reported in 74 of 77 facial BCCs (96.10%) and 15 of 16 nonfacial BCCs (93.75%)(eTable 2). Successfully treated BCCs underwent an average of 2.88 laser treatments over a mean duration of 3.54 months (range, 1 week to 1.92 years). Four incomplete responders underwent an average of 3.25 laser treatments over a mean duration of 3.44 months (range, 1.13–6.87 months). Of the 4 lesions that did not clear, 2 were nodular, 1 was pigmented, and 1 was sclerosing.
Number of Treatments
When the clearance rate is divided into lesions that received 3 or fewer laser treatments and those that received more than 3 laser treatments, the following results were determined:
• Lesions receiving 3 or fewer treatments had a clearance rate of 96.05% (73/76) for all BCCs, 96.72% (59/61) for facial BCCs, and 93.33% (14/15) for nonfacial BCCs.
• Lesions receiving more than 3 laser treatments had a clearance rate of 94.12% (16/17) for all BCCs, 93.75% (15/16) for facial BCCs, and 100% (1/1) for nonfacial BCCs.
The relationship between facial BCC tumor diameter and number of treatments required for clearance had a positive correlation coefficient (Pearson r=0.319), indicating that larger BCCs required more laser treatments (eTable 3).
Tumor Recurrence
Four of 89 BCCs (4.49%)(4 of 74 facial BCCs [5.41%]) showed tumor recurrence following laser treatment, as assessed by OCT and dermoscopy. Of them, all were nodular BCCs. Prior to laser treatment, there were 4 additional patients each diagnosed with a recurrence from prior treatment with MMS; all were successfully treated with laser therapy without recurrence post–laser treatment (eFigure 1). Most of the recurrences from prior MMS required more than 3 laser treatments before clearing: 1 required 3 treatments, 2 required 4 treatments, and 1 required 6 treatments.
Of 93 lesions included in this study, 2 BCCs were deemed not clear on histologic analysis, which corresponded with residual tumor seen on OCT. Two additional lesions were determined to be not clear on OCT but were not confirmed as such on biopsy; both lesions were confirmed not clear, however, by histologic analysis on the first layer of MMS
Follow-up
All cleared lesions (89/93) showed complete clinical response to laser treatment for 6 months or more (median follow-up, 2–3 years; mode, 1–2 years; mean, 2.66 years)(eTable 4). Although 45% of patients (40/89) have been followed clinically and/or dermoscopically (as is done for MMS follow-ups) for 3 years to more than 5 years, only 20% of patients (18/89) were followed up with OCT in combination with clinical and/or dermoscopic examination between 3 years and more than 5 years. Follow-up took on a bimodal distribution, with a peak follow-up period at 1 to 2 years and again at 3 to 4 years. Half of the lesions (45/89) were followed up with OCT in combination with clinical and dermoscopic examination at 1 to 6 months (eTable 5). Of the 2 patients with 1-month OCT follow-up, 1 died from other medical causes and the other was unable to return for further follow-up scans.
Comment
High Tumor Clearance Rates With OCT
This study yielded a clearance rate of 95.70% for all BCCs, 96.10% for facial BCCs, and 93.75% for nonfacial BCCs. This rate is higher than the clinical or histologic clearance rate (or both) of earlier studies on facial and nonfacial BCCs, which ranged from 25% to 95%.8-11 In this study, we were able to utilize OCT and histology to confirm clearance. Optical coherence tomography, which has been shown to have a high sensitivity ranging from 86% to 95.7%, is therefore optimally used in treatment monitoring.19,26,28 Optical coherence tomography has a broader specificity range of 75.3% to 98% and was not utilized for diagnostic purposes in this study. Combining OCT with a color wheel dermoscopic approach was helpful in confirming treatment efficacy of nonsurgical therapies and is significantly more accurate than clinical analysis alone (P<.01).19,26,28
We suspect that the higher clearance rates observed in our study were due to the OCT-guided treatment protocol. Optical coherence tomography was used for margination while providing a modality for tailored treatment through visualization of residual tumor on clinically and dermoscopically clear follow-ups, given that several studies found residual tumor at the lateral edge of the tumor margin on histopathologic analysis.5 Utilizing noninvasive imaging technology to delineate tumor margins before treatment can improve efficacy and limit unnecessary treatment to the surrounding normal skin (eFigure 2).29
After grouping lesions by number of laser treatments, the clearance rate remained similar among facial BCCs with 3 or fewer treatments (59/61 [96.72%]), but there was a slightly decreased clearance rate for facial BCCs with more than 3 treatments (15/16 [93.75%]), which may be explained by the need for more laser treatments for larger BCCs (eTable 3). The relationship between facial BCC size and number of laser treatments was found to correlate positively (Pearson r=0.319). The largest lesion (24 mm) was successfully treated with 5 treatments (Figure). The number of nonfacial lesions was limited in this study and was not statistically significant.
there was no clinical evidence of residual BCC.
Cosmetic Outcome
Adverse effects, including erythema, purpura, blistering, and crusting, were short-term and well tolerated. Few patients had subsequent hypopigmentation in the initial months after treatment, which we consider an optimal cosmetic outcome. For example, the patient shown in the Figure would have required extensive reconstruction of the defect using bilateral rotation flaps with incisions along the hairline, grafting, or second-intention healing with partial closure to avoid brow-lifting.30 Given the relatively young age of this patient (a 45-year-old woman) and therefore limited skin laxity, secondary intention or even attempting to match grafted tissue could have resulted in a less than optimal cosmetic outcome. None of the patients experienced clinical or dermoscopic evidence of scarring from the laser treatment.
A few lesions were found to have subclinical inflammation on OCT, which might have obscured residual tumor on the 1-month follow-up scan. This condition may be similar to how pre-MMS diagnostic biopsy scars mask skin cancer during surgery, making it necessary to obtain additional layers beyond the biopsy scar tissue. This scar tissue would otherwise obscure tumor on histology during MMS, similar to subclinical inflammation obscuring residual tumor on OCT.21-23,31 Invasive and noninvasive management of skin cancers will have different healing times and therefore different optimal times to confirm clearance by histology compared to noninvasive imaging. All of the lesions in which inflammation was obscured on OCT 1-month posttreatment remained cleared. However, 1 lesion was found to be clear at a 4-week clearance scan after only 2 nonablative laser treatments and was confirmed as scar tissue on histology. Scar tissue on histology might have obscured any residual tumor. The patient appeared clinically and dermoscopically to have a milia in the same location only 5 months later; however, on OCT and histology, the lesion was confirmed to be a BCC.
Treatment Intervals
Several other studies either used a set number of treatments or determined the number of treatments based on clinical clearance.3-8 When determining the best treatment interval, we considered the period for patients to be clinically and dermoscopically healed to be 1 month. Patients came for their final follow-up scan an additional month after the final treatment in case there was any obscuring inflammation on OCT at 1 month. Given that patients responded well to nonablative laser treatment once skin clinically healed and most patients required 3 treatments, the PI began recommending a total of 3 treatments performed 4 to 6 weeks apart in clinical practice, followed by a final clearance scan 2 months after the third treatment. A period of 2 months was considered ideal for the final clearance scan because no inflammation was seen at the 2-month follow-up in the group of patients who had inflammation at the 1-month follow-up on OCT in our study. Some patients had an extended treatment duration because of noncompliance with the 4- to 6-week follow-up regimen. Although this extension of treatment duration potentially skews the clearance rate, we still included these patients, given the retrospective design of this study.
Lesions That Did Not Clear
Four BCCs did not clear, 3 of which were facial BCCs. All 4 lesions demonstrated residual tumor on OCT. Of the 3 facial lesions that did not clear:
• One was the patient who had obscuring inflammation at the 1-month follow-up and only scar tissue on histologic confirmation.
• Another was a pigmented BCC on the right cheek of a patient with Fitzpatrick skin type IV. This patient received 3 treatments without a response clinically or on OCT. (Most patients who showed complete clearance also showed reduction in tumor size after the first laser treatment. Of note, there were other patients who had lighter skin types with pigmented BCCs and all of these patients had complete response to this treatment regimen; therefore, we do not think that a pigmented BCC is an exclusion to this therapy.)
• The third was a BCC on the nose of a nonadherent patient, which may have contributed to the lack of clearance. We defined nonadherent patients as those who did not follow-up within the appropriate periods and who therefore ran the risk for tumor growth in between treatments.
The nonfacial BCC that did not clear had histologic features of focal sclerosing BCC, a more aggressive subtype of basal cell skin cancer.
Tumor Recurrence
Only 4 of 89 BCCs (4.49%) recurred, with a 5.41% (4/74) recurrence rate among facial BCCs. All recurrences lacked clinical and dermoscopic evidence of BCC but were found on follow-up OCT scan and confirmed with RCM. All recurrences were found 1.5 to 3.9 years posttreatment.
Recurrent tumors following MMS required, on average, more laser treatments than primary tumors to achieve successful tumor clearance, which we attribute to scar tissue from prior therapy obscuring recurrence, resulting in delayed diagnosis, and to inflammation and fibrosis masking residual tumors (eFigure 1). An added benefit of laser treatment is that all 4 recurrent tumors demonstrated improved cosmetic appearance of the original MMS scar.
The benefit of using OCT scans to check for recurrences is that OCT can find residual skin cancers despite the area looking clinically clear, which is especially important during clinical evaluation of a healed postsurgical scar for recurrence because OCT imaging allows us to look as deep as 2 mm under the skin. Nonsurgical treatments also enable us to leave skin intact and avoid creating scar tissue, which makes it easier to detect and manage recurrence.
Limitations
There were several important limitations of this retrospective study:
• Patients were treated by 1 of 5 medically trained fellows. Although the fellows worked under the supervision of the PI, variation in their work from one to another might have led to different end points.
• All patients who appeared clinically clear were offered biopsy to confirm clearance on histology. Some patients agreed to biopsy, but many did not because they were pleased with the cosmetic outcome, which is similar to other studies exhibiting only clinical clearance rates without providing histologic clearance following nonsurgical therapy.6 We believe that imaging with OCT circumvents this problem and offers more accurate confirmation than clinical or dermoscopic correlation alone, or the combination of the 2 modalities.
• Lack of treatment standardization and short length of follow-up can result in underestimation of the recurrence rate. In particular, most patients were followed up with OCT in less than 6 months. These are unavoidable features in a retrospective study and we are currently addressing this problem in a new prospective study.
Extended Follow-up
Although this study is not a prospective design, it does provide recurrence data over extended follow-up for the nonablative laser management of BCCs (eTables 4 and 5). Studies have demonstrated that MMS has a 5-year cure rate as high as 99% for BCC.32 Given the limited follow-up period of prior nonablative laser management studies, recurrences might not have been fully evaluated. Our study had a 4.49% recurrence rate for all BCCs and a 5.41% recurrence rate for facial BCCs but was not detectable by clinical examination combined with dermoscopic findings alone. All recurrences required the utilization of OCT or RCM or a combination of these modalities to be diagnosed. In 1 patient with recurrence, we were able to see residual tumor on both OCT and RCM without any inflammation obscuring the scan, given that 3 years had passed. Although 2 months is an optimal follow-up time for OCT, we have not found an optimal follow-up time for RCM, which is another reason why OCT might be preferable to other imaging modalities, such as RCM and high-definition OCT, that have higher resolution but provide less depth on imaging. Although only 40 of 89 patients (4.49%) had follow-up ranging from 3 years to greater than 5 years, long-term follow-up to date has been limited in prior studies.
We believe the high clearance rates and limited recurrence are secondary to the utilization of noninvasive imaging, as the majority of these recurrences would not have been diagnosed based on clinical and/or dermoscopic information alone. Additionally, the 4 biopsy-proven post-MMS recurrence patients that were treated in this study also may not have been diagnosed this early without the use of additional noninvasive imaging. In our opinion, although laser management can be used without noninvasive imaging guidance—dermoscopy, OCT, and/or RCM—this technology is critical not only for early detection but also for proper management of patients.
Conclusion
This study showed a 95.70% clearance rate for all BCCs and a 96.10% clearance rate for facial BCCs. Although we had a zero clinical recurrence rate, 4.49% of all BCCs and 5.41% of facial BCCs had recurred on subsequent monitoring with noninvasive imaging. Given the large size of the study and extended follow-up, we found nonablative laser management to be a reliable treatment alternative with improved cosmetic outcome (Figure) and minimal short-term adverse effects compared to surgery.
Tailored care for the individual patient is based on a variety of options and patient preference, including ease of compliance, number of follow-up visits, invasive vs noninvasive diagnosis and monitoring, and downtime for healing. The use of noninvasive imaging also allowed us to find a more standardized treatment regimen using this nonablative laser combination. We found that 3 or fewer and more than 3 treatments had similar efficacy in tumor clearance. We recommend a standard laser protocol of 3 treatments every 4 to 6 weeks with follow-up 2 months after the final treatment to assess for clearance with OCT.
Larger BCCs might require additional treatments; therefore, we caution against laser therapy without concomitant use of OCT imaging to visualize residual tumor. Utilizing other noninvasive modalities, such as dermoscopy, in combination with thorough skin examination also is critical in the early detection of skin cancers to improve the efficacy of this less-aggressive, nonablative, and cosmetically optimal treatment protocol.
Acknowledgement—We would like to acknowledge Dimitrios Karponis, BSc, from the Impirial College London, England, for his assistance with a portion of the statistical analysis.
- Campolmi P, Troiano M, Bonan P, et al. Vascular based non conventional dye laser treatment for basal cell carcinoma. Dermatol Ther. 2008;21:402-405.
- Soleymani T, Abrouk M, Kelly KM. An analysis of laser therapy for the treatment of nonmelanoma skin cancer. Dermatol Surg. 2017;43:615-624.
- Alonso-Castro L, Ríos-Buceta L, Boixeda P, et al. The effect of pulsed dye laser on high-risk basal cell carcinomas with response control by Mohs micrographic surgery. Lasers Med Sci. 2015;30:2009-2014.
- Karsai S, Friedl H, Buhck H, et al. The role of the 595-nm pulsed dye laser in treating superficial basal cell carcinoma: outcome of a double-blind randomized placebo-controlled trial. Br J Dermatol. 2015;172:677-683.
- Konnikov N, Avram M, Jarell A, et al. Pulsed dye laser as a novel non-surgical treatment for basal cell carcinomas: response and follow up 12-21 months after treatment. Lasers Surg Med. 2011;43:72-78.
- Minars N, Blyumin-Karasik M. Treatment of basal cell carcinomas with pulsed dye laser: a case series. J Skin Cancer. 2012;2012:286480.
- Shah SM, Konnikov N, Duncan LM, et al. The effect of 595 nm pulsed dye laser on superficial and nodular basal cell carcinomas. Lasers Surg Med. 2009;41:417-422.
- Tran HT, Lee RA, Oganesyan G, et al. Single treatment of non-melanoma skin cancers using a pulsed-dye laser with stacked pulses. Lasers Surg Med. 2012;44:459-467.
- Cameron MC, Lee E, Hibler BP, et al. Basal cell carcinoma: epidemiology; pathophysiology; clinical and histological subtypes; and disease associations. J Am Acad Dermatol. 2019;80:303-317.
- Silverman MK, Kopf AW, Bart RS, et al. Recurrence rates of treated basal cell carcinomas. part 3: surgical excision. J Dermatol Surg Oncol. 1992;18:471-476.
- Silverman MK, Kopf AW, Grin CM, et al. Recurrence rates of treated basal cell carcinomas. part 2: curettage-electrodesiccation. J Dermatol Surg Oncol. 1991;17:720-726.
- Dubin N, Kopf AW. Multivariate risk score for recurrence of cutaneous basal cell carcinomas. Arch Dermatol. 1983;119:373-377.
- Subramaniam P, Olsen CM, Thompson BS, et al. Anatomical distributions of basal cell carcinoma and squamous cell carcinoma in a population-based study in Queensland, Australia. JAMA Dermatol. 2017;153:175-182.
- Rajadhyaksha M, Grossman M, Esterowitz D, et al. In vivo confocal scanning laser microscopy of human skin: melanin provides strong contrast.J Invest Dermatol. 1995;104:946-952.
- Levine A, Wang K, Markowitz O. Optical coherence tomography in the diagnosis of skin cancer. Dermatol Clin. 2017;35:465-488.
- Sattler E, Kästle R, Welzel J. Optical coherence tomography in dermatology. J Biomed Opt. 2013;18:061224.
- Banzhaf CA, Themstrup L, Ring HC, et al. Optical coherence tomography imaging of non-melanoma skin cancer undergoing imiquimod therapy. Ski Res Technol. 2014;20:170-176.
- Segura S, Puig S, Carrera C, et al. Non-invasive management of non-melanoma skin cancer in patients with cancer predisposition genodermatosis: a role for confocal microscopy and photodynamic therapy. J Eur Acad Dermatol Venereol. 2011;25:819-827.
- Ulrich M, Lange-Asschenfeldt S, Gonzalez S. The use of reflectance confocal microscopy for monitoring response to therapy of skin malignancies. Dermatol Pract Concept. 2012;2:43-52.
- Couzan C, Cinotti E, Labeille B, et al. Reflectance confocal microscopy identification of subclinical basal cell carcinomas during and after vismodegib treatment. J Eur Acad Dermatol Venereol. 2018;32:763-767.
- Ruiz ES, Karia PS, Morgan FC, et al. Multiple Mohs micrographic surgery is the most common reason for divergence from the appropriate use criteria: a single institution retrospective cohort study. J Am Acad Dermatol. 2016;75:830-831.
- Wagner RF Jr, Cottel WI. Multifocal recurrent basal cell carcinoma following primary tumor treatment by electrodesiccation and curettage. J Am Acad Dermatol. 1987;17:1047-1049.
- Connolly SM, Baker DR, Coldiron BM, et al. AAD/ACMS/ASDSA/ASMS 2012 appropriate use criteria for Mohs micrographic surgery: a report of the American Academy of Dermatology, American College of Mohs Surgery, American Society for Dermatologic Surgery Association, and the American Society for Mohs Surgery. Dermatol Surg. 2012;38:1582-1603.
- Lewin JM, Carucci JA. Advances in the management of basal cell carcinoma. F1000Prime Rep. 2015;7:53.
- Markowitz O. A Practical Guide to Dermoscopy. Philadelphia, PA: Wolters Kluwer; 2017.
- Markowitz O, Schwartz M, Feldman E, et al. Evaluation of optical coherence tomography as a means of identifying earlier stage basal cell carcinomas while reducing the use of diagnostic biopsy. J Clin Aesthet Dermatol. 2015;8:14-20.
- Weiss ET, Brauer JA, Anolik R, et al. 1927-nm fractional resurfacing of facial actinic keratoses: a promising new therapeutic option. J Am Acad Dermatol. 2013;68:98-102.
- Olsen J, Themstrup L, De Carvalho N, et al. Diagnostic accuracy of optical coherence tomography in actinic keratosis and basal cell carcinoma. Photodiagnosis Photodyn Ther. 2016;16:44-49.
- Levine A, Siegel D, Markowitz O. Imaging in cutaneous surgery. Future Oncol. 2017;13:2329-2340.
- Gross K, Steinman H, Rapini R. Mohs Surgery: Fundamentals and Techniques. St. Louis, MO: Mosby; 1998.
- Suzuki HS, Serafini SZ, Sato MS. Utility of dermoscopy for demarcation of surgical margins in Mohs micrographic surgery. An Bras Dermatol. 2014;89:38-43.
- Rowe DE, Carroll RJ, Day CL Jr. Mohs surgery is the treatment of choice for recurrent (previously treated) basal cell carcinoma. J Dermatol Surg Oncol. 1989;15:424-431
Practice Points
- A major benefit of nonablative laser therapy over more invasive options in the management of basal cell carcinoma (BCC) is minimal scarring.
- When patients are managed with nonablative laser therapy, follow-up with clinical, dermoscopic, and/or noninvasive imaging is more efficient during treatment as well as when assessing for recurrences.
- Optical coherence tomography in combination with nonablative laser therapy allows for detection of residual skin cancers that would not be evident on clinical and/or dermoscopic examination.
- Utilizing early detection techniques, such as a color wheel dermoscopic approach, along with other noninvasive imaging modalities facilitates the use of less invasive treatment options for primary and/or recurrent BCCs.
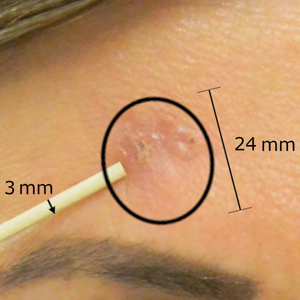
Quantity and Characteristics of Flap or Graft Repairs for Skin Cancer on the Nose or Ears: A Comparison Between Mohs Micrographic Surgery and Plastic Surgery
The incidence of nonmelanoma skin cancer (NMSC) is steadily increasing, and it accounts for more annual cancer diagnoses than all other malignancies combined.1,2 For NMSCs of the head and neck, Mohs micrographic surgery (MMS) has become a preferred technique because of its high cure rates, intraprocedural margin control, and improved tissue preservation in cosmetically sensitive areas.3 The nose and ears are especially sensitive anatomic locations given their prominent positions and relative lack of skin reservoir and laxity compared to other areas of the head and neck. For the nose and ears, both patients and referring providers may question who is best suited to surgically remove a malignancy and repair the defect with positive functional and cosmetic results, as a large portion of the defects following tumor extirpation will require a flap or graft for repair.
The notion of plastic surgery is strongly associated with supreme cosmesis for many patients and providers, as the specialty trains in several surgical and nonsurgical elective techniques to preserve and improve appearance. Consequently, patients commonly ask dermatologists if they should be referred to a plastic surgeon for skin cancer removal in cosmetically sensitive areas, especially areas that may require more complex surgical repairs. However, recent Medicare data indicate that dermatologists perform the vast majority of reconstructive skin surgeries, with more than 15 times the number of intermediate and complex closures and more than 4 times the number of flaps and grafts as the next closest specialty.4 Earlier studies using Medicare data revealed similar findings, with dermatologic surgeons performing more reconstructions of head and neck skin than both plastic surgeons and otorhinolaryngologists.5 However, these studies did not address the characteristics of the tumor, defects, or repairs performed by the specialties for comparison.
We sought to compare the quantity and characteristics of flaps or grafts performed for skin cancer on the nose or ears by fellowship-trained Mohs surgeons and plastic surgeons at 1 academic institution.
Methods
We performed a retrospective chart review of all skin cancer surgeries requiring a flap or graft on the nose or ears at Baylor Scott & White Health (Temple, Texas) from October 1, 2016, to October 1, 2017. This study was approved by the Baylor Scott & White Health institutional review board.
Data Collection
The analysis included full-time, fellowship-trained Mohs surgeons and all full-time plastic surgeons who accepted skin cancer surgery patient referrals as part of their practice and performed all procedures within our hospital system. We reviewed individual provider schedules for both outpatient consultation and operating room notes to capture each procedure performed. To ensure we captured all procedures for both Mohs and plastic surgeons, we used billing codes for any flap or graft repair done on the nose or ears to cross-reference and confirm the cases found by chart review. The total number of flaps or grafts on the nose or ears were collected. Data also were collected regarding the anatomic location of the skin cancer, final defect size prior to the repair, skin tumor type, repair type (flap or graft), and flap (transposition vs advancement) or graft (full thickness vs partial thickness) type. All surgical data were collected from operative notes. Demographic data, including age, race, and sex, also were collected. We also collected data on the specialty of the physicians who referred patients for surgical management of biopsy-proven skin malignancy.
Statistical Analysis
Sample characteristics were described using descriptive statistics. Frequencies and percentages were used to describe categorical variables. Medians and ranges were used to describe continuous variables due to nonsymmetrically distributed data. χ2 tests (or Fisher exact tests when low cell counts were present) for categorical variables and Wilcoxon signed rank tests for continuous variables were used to test for associations in bivariate comparisons between MMS and plastic surgery.
Results
A total of 7 physicians (1 fellowship-trained Mohs surgeon and 6 plastic surgeons) at our institution met the inclusion criteria. The Mohs surgeon performed a significantly higher number of flaps and grafts (n=276) than the plastic surgeons (n=17 combined; average per plastic surgeon, 2.83) on the nose or ears in a 12-month period (P<.05)(Table). The median final defect size was not significantly different between MMS (1.5 cm) and plastic surgery (1.8 cm)(P=.306). Flap repairs were more common in patients undergoing MMS (80%) vs plastic surgery (53%)(P=.022)(Figure). For flap repair, advancement flaps were used more commonly (MMS, 53%; plastic surgery, 35%) than transposition flaps (MMS, 27%; plastic surgery, 12%) by both specialties.
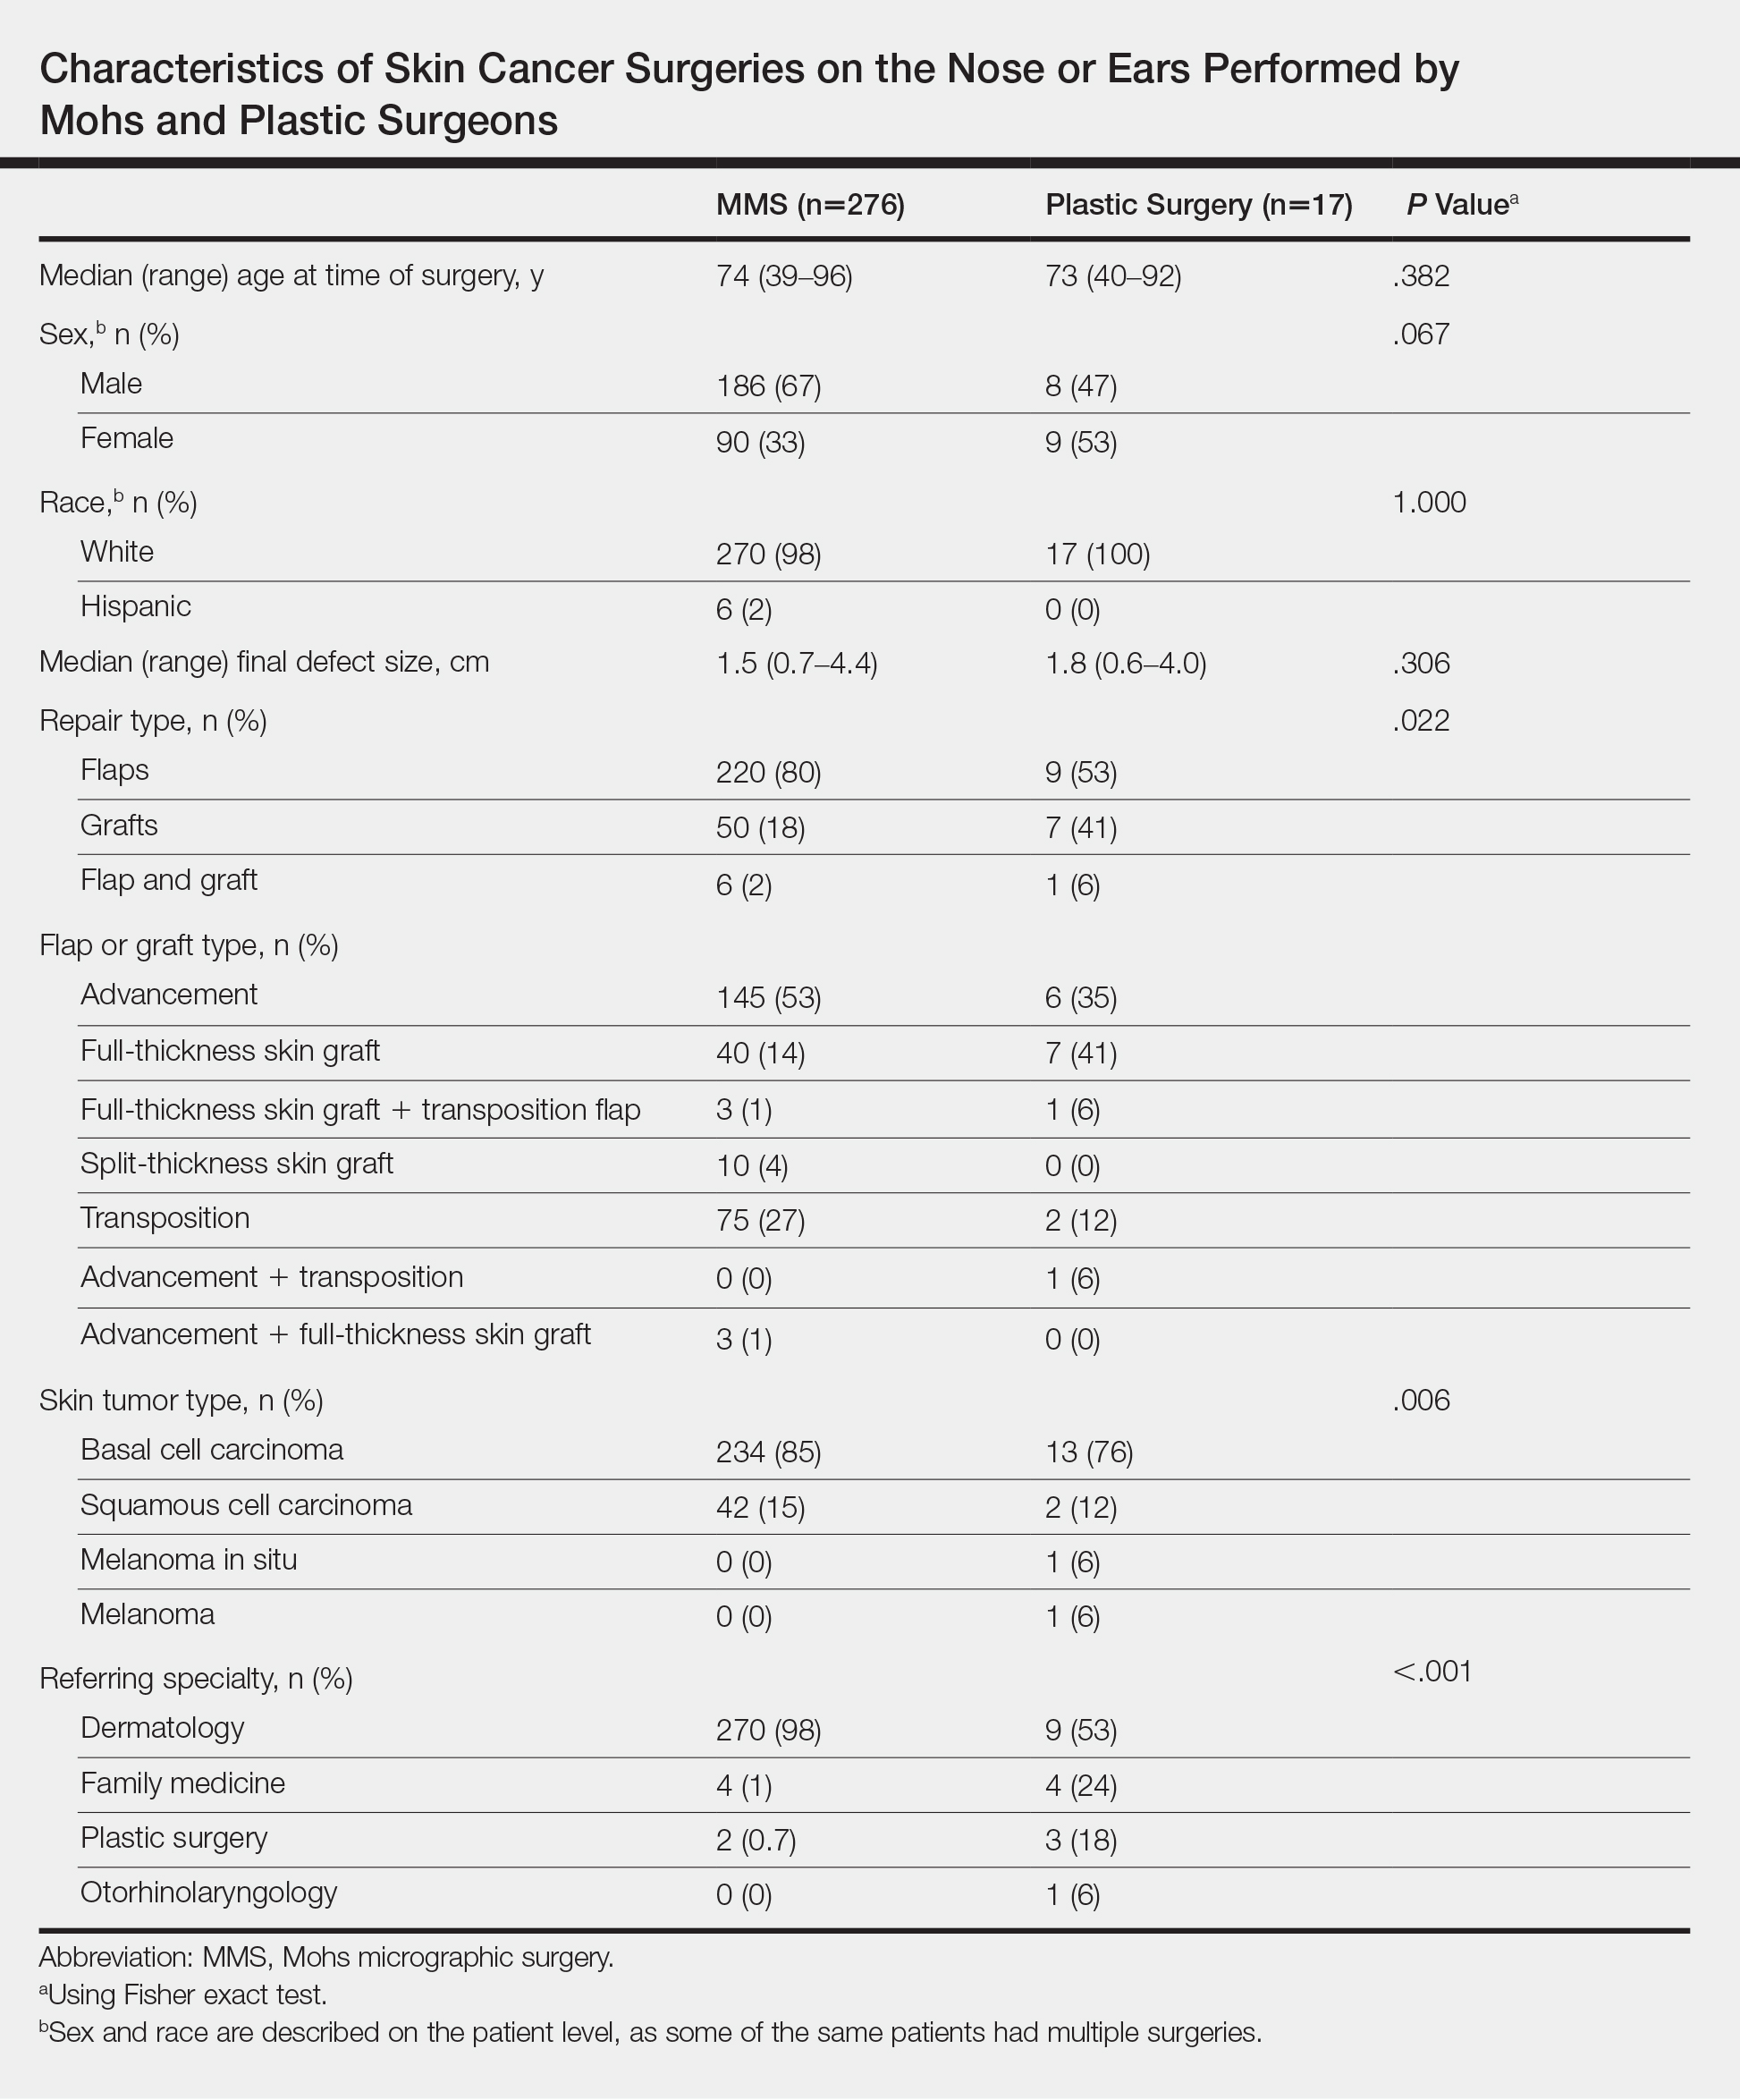
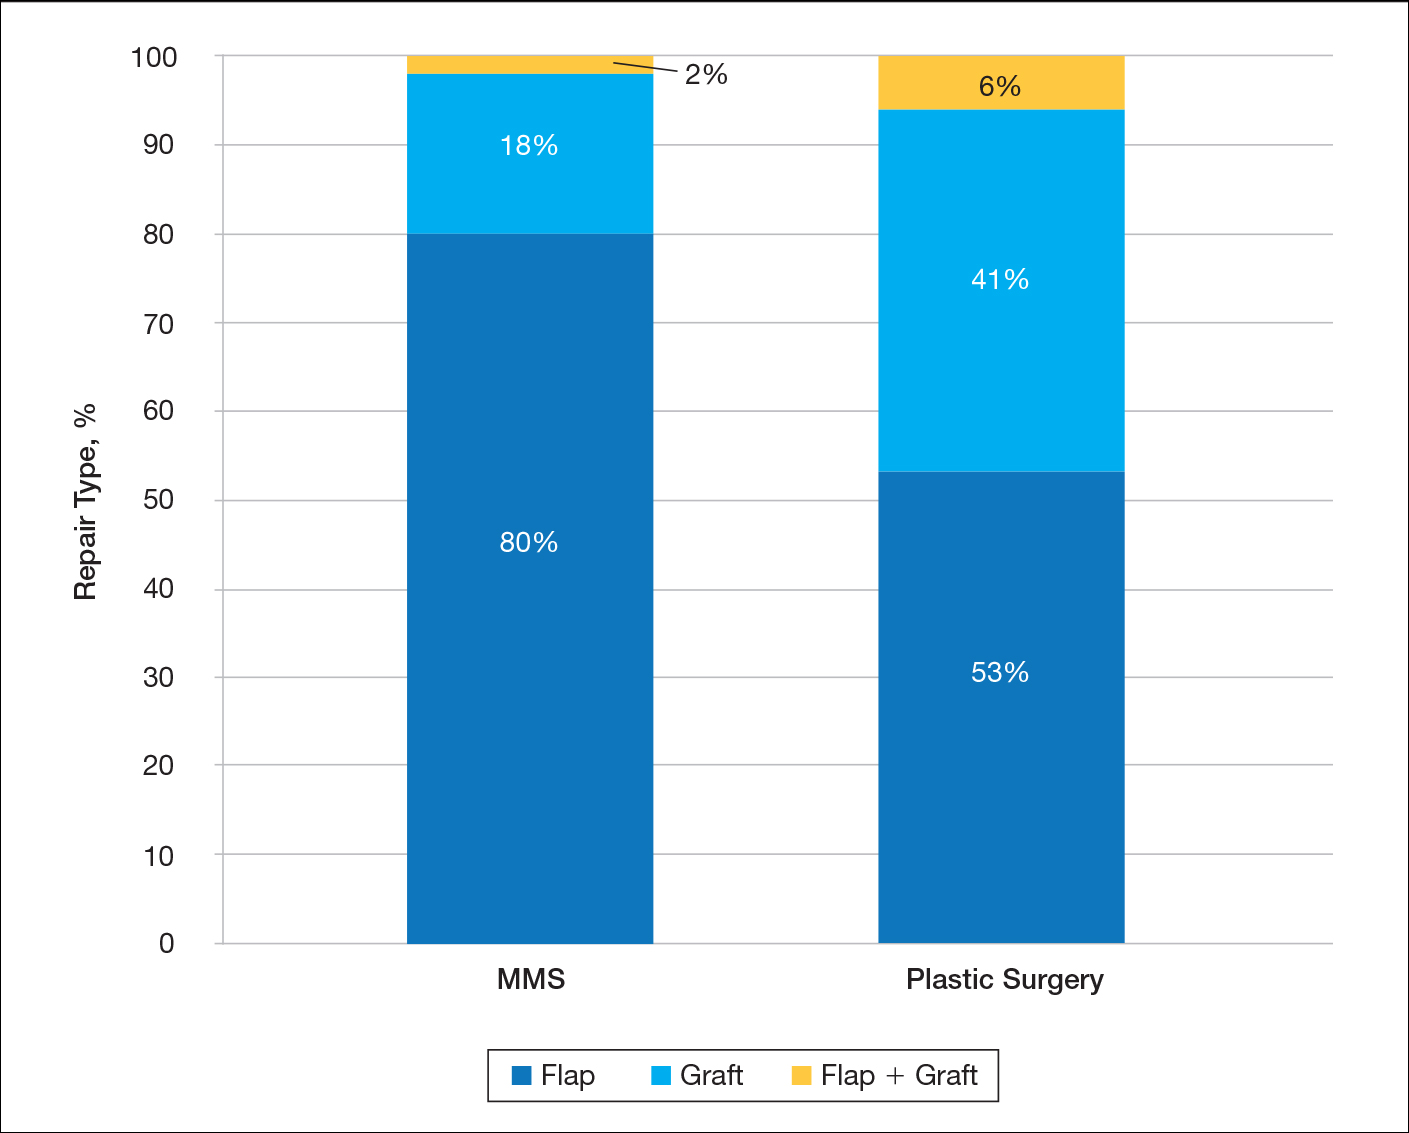
Patient age was similar between MMS (median, 74 years) and plastic surgery (median, 73 years) patients (P=.382), but a greater percentage of women were treated by plastic surgeons (53%) compared with Mohs surgeons (33%). The predominant skin tumor type for both specialties was basal cell carcinoma (MMS, 85%; plastic surgery, 76%). Dermatology was the largest referring specialty to both MMS (98%) and plastic surgery (53%). Family medicine referrals comprised a much larger percentage of cases for plastic surgery (24%) compared to MMS (1%).
Comment
This study supports and adds to recent studies and data regarding the utilization of MMS for the treatment of NMSCs. Although the percentage of all skin cancer surgery is increasing for dermatology, little has been reported on more complex repairs. This study highlights the volume and complexity of skin surgery performed by Mohs surgeons compared to our colleagues in plastic surgery.
Defect Size
The defect sizes prior to repair were not statistically different between the 2 types of surgeries, though the median size was slightly larger for plastic surgery (1.8 cm) compared to MMS (1.5 cm). These non–statistically significant differences may be explained by potentially larger tumors requiring repair by plastic surgeons in an operating room. Plastic surgeons, however, may be more likely to take a larger margin of clinically unaffected tissue as part of the initial layer. Plastic surgeons also may be less likely to curette the lesion prior to excision to obtain more clear tumor margins, possibly leading to more stages and a subsequently larger defect. Knowing the clinical sizes of these NMSCs prior to biopsy would have been beneficial to our study, but these data often were not available from the referring providers.
Repair Type
Most patients who underwent MMS had surgical defects repaired with a flap vs a graft, and a much higher percentage of patients who had undergone MMS vs surgical excision with plastic surgery had their defects repaired with flaps. Using a visual analog scale score and Hollander Wound Evaluation Scale, Jacobs et al6 found flaps to be cosmetically superior to grafts following tumor extirpation on the nose. The more frequent use of grafts by plastic surgeons could be at least partially explained by larger defect size or by a few outlier larger lesions among an otherwise small sample size. Larger studies may be needed to see if a true discrepancy in repair preferences exists between the specialties.
Referring Specialty
Primary care physician referral comprised a much larger percentage of cases sent for treatment with plastic surgery (24%) compared to MMS (1%). This statistic may represent a practice gap in the perception of MMS and its benefits among our primary care colleagues, particularly among female patients, as a much higher percentage of women were treated with plastic surgery. Important potential benefits of MMS, particularly tissue conservation, cure rates for skin cancer, and the volume of repairs performed by Mohs surgeons, may need to be emphasized.
Scope of Practice
Our colleagues in plastic surgery are extremely gifted and perform numerous repairs outside the scope of most Mohs surgeons. They are vital to multidisciplinary approaches to patients with skin cancer. Although Mohs surgeons focus on treating skin cancers that arise in a narrower range of anatomic locations, the breadth and variety of surgical procedures performed by plastic surgeons is more diverse. Skin cancer surgery may account for a smaller portion of procedures in a plastic surgery practice.
Limitations
There are several limitations to this study. We did not compare cosmesis or wound healing in patients treated by MMS or plastic surgery. The sample size, particularly with plastic surgery, was small and did not allow for a larger, more powerful comparison of data between the 2 specialties. Finally, our study only represents 1 institution over the course of 1 year.
Conclusion
To provide the best care possible, it is imperative for referring physicians to possess an accurate understanding of the volume of cases and the types of repairs that treating specialties perform on a regular basis for NMSCs. This knowledge is particularly important when there is a treatment overlap among specialties. Our data show Mohs surgeons are performing more complex repairs and reconstructions on even the most cosmetically sensitive areas; therefore, primary care physicians and other specialists may be more likely to involve dermatology in the care of skin cancer.
- Rogers HW, Weinstock MA, Feldman SR, et al. Incidence estimate of nonmelanoma skin cancer (keratinocyte carcinomas) in the US population, 2012. JAMA Dermatol. 2015;151:1081-1086.
- Rogers HW, Weinstock MA, Harris AR, et al. Incidence estimate of nonmelanoma skin cancer in the united states, 2006. Arch Dermatol. 2010;146:283-287.
- Mansouri B, Bicknell LM, Hill D, et al. Mohs micrographic surgery for the management of cutaneous malignancies. Facial Plast Surg Clin North Am. 2017;25:291-301.
- Kantor J. Dermatologists perform more reconstructive surgery in the Medicare population than any other specialist group: a cross-sectional individual-level analysis of Medicare volume and specialist type in cutaneous and reconstructive surgery. J Am Acad Dermatol. 2018;78:171-173.e1.
- Donaldson MR, Coldiron BM. Dermatologists perform the majority of cutaneous reconstructions in the Medicare population: numbers and trends from 2004 to 2009. J Am Acad Dermatol. 2013;68:803-808.
- Jacobs MA, Christenson LJ, Weaver AL, et al. Clinical outcome of cutaneous flaps versus full-thickness skin grafts after Mohs surgery on the nose. Dermatol Surg. 2010;36:23-30.
The incidence of nonmelanoma skin cancer (NMSC) is steadily increasing, and it accounts for more annual cancer diagnoses than all other malignancies combined.1,2 For NMSCs of the head and neck, Mohs micrographic surgery (MMS) has become a preferred technique because of its high cure rates, intraprocedural margin control, and improved tissue preservation in cosmetically sensitive areas.3 The nose and ears are especially sensitive anatomic locations given their prominent positions and relative lack of skin reservoir and laxity compared to other areas of the head and neck. For the nose and ears, both patients and referring providers may question who is best suited to surgically remove a malignancy and repair the defect with positive functional and cosmetic results, as a large portion of the defects following tumor extirpation will require a flap or graft for repair.
The notion of plastic surgery is strongly associated with supreme cosmesis for many patients and providers, as the specialty trains in several surgical and nonsurgical elective techniques to preserve and improve appearance. Consequently, patients commonly ask dermatologists if they should be referred to a plastic surgeon for skin cancer removal in cosmetically sensitive areas, especially areas that may require more complex surgical repairs. However, recent Medicare data indicate that dermatologists perform the vast majority of reconstructive skin surgeries, with more than 15 times the number of intermediate and complex closures and more than 4 times the number of flaps and grafts as the next closest specialty.4 Earlier studies using Medicare data revealed similar findings, with dermatologic surgeons performing more reconstructions of head and neck skin than both plastic surgeons and otorhinolaryngologists.5 However, these studies did not address the characteristics of the tumor, defects, or repairs performed by the specialties for comparison.
We sought to compare the quantity and characteristics of flaps or grafts performed for skin cancer on the nose or ears by fellowship-trained Mohs surgeons and plastic surgeons at 1 academic institution.
Methods
We performed a retrospective chart review of all skin cancer surgeries requiring a flap or graft on the nose or ears at Baylor Scott & White Health (Temple, Texas) from October 1, 2016, to October 1, 2017. This study was approved by the Baylor Scott & White Health institutional review board.
Data Collection
The analysis included full-time, fellowship-trained Mohs surgeons and all full-time plastic surgeons who accepted skin cancer surgery patient referrals as part of their practice and performed all procedures within our hospital system. We reviewed individual provider schedules for both outpatient consultation and operating room notes to capture each procedure performed. To ensure we captured all procedures for both Mohs and plastic surgeons, we used billing codes for any flap or graft repair done on the nose or ears to cross-reference and confirm the cases found by chart review. The total number of flaps or grafts on the nose or ears were collected. Data also were collected regarding the anatomic location of the skin cancer, final defect size prior to the repair, skin tumor type, repair type (flap or graft), and flap (transposition vs advancement) or graft (full thickness vs partial thickness) type. All surgical data were collected from operative notes. Demographic data, including age, race, and sex, also were collected. We also collected data on the specialty of the physicians who referred patients for surgical management of biopsy-proven skin malignancy.
Statistical Analysis
Sample characteristics were described using descriptive statistics. Frequencies and percentages were used to describe categorical variables. Medians and ranges were used to describe continuous variables due to nonsymmetrically distributed data. χ2 tests (or Fisher exact tests when low cell counts were present) for categorical variables and Wilcoxon signed rank tests for continuous variables were used to test for associations in bivariate comparisons between MMS and plastic surgery.
Results
A total of 7 physicians (1 fellowship-trained Mohs surgeon and 6 plastic surgeons) at our institution met the inclusion criteria. The Mohs surgeon performed a significantly higher number of flaps and grafts (n=276) than the plastic surgeons (n=17 combined; average per plastic surgeon, 2.83) on the nose or ears in a 12-month period (P<.05)(Table). The median final defect size was not significantly different between MMS (1.5 cm) and plastic surgery (1.8 cm)(P=.306). Flap repairs were more common in patients undergoing MMS (80%) vs plastic surgery (53%)(P=.022)(Figure). For flap repair, advancement flaps were used more commonly (MMS, 53%; plastic surgery, 35%) than transposition flaps (MMS, 27%; plastic surgery, 12%) by both specialties.
Patient age was similar between MMS (median, 74 years) and plastic surgery (median, 73 years) patients (P=.382), but a greater percentage of women were treated by plastic surgeons (53%) compared with Mohs surgeons (33%). The predominant skin tumor type for both specialties was basal cell carcinoma (MMS, 85%; plastic surgery, 76%). Dermatology was the largest referring specialty to both MMS (98%) and plastic surgery (53%). Family medicine referrals comprised a much larger percentage of cases for plastic surgery (24%) compared to MMS (1%).
Comment
This study supports and adds to recent studies and data regarding the utilization of MMS for the treatment of NMSCs. Although the percentage of all skin cancer surgery is increasing for dermatology, little has been reported on more complex repairs. This study highlights the volume and complexity of skin surgery performed by Mohs surgeons compared to our colleagues in plastic surgery.
Defect Size
The defect sizes prior to repair were not statistically different between the 2 types of surgeries, though the median size was slightly larger for plastic surgery (1.8 cm) compared to MMS (1.5 cm). These non–statistically significant differences may be explained by potentially larger tumors requiring repair by plastic surgeons in an operating room. Plastic surgeons, however, may be more likely to take a larger margin of clinically unaffected tissue as part of the initial layer. Plastic surgeons also may be less likely to curette the lesion prior to excision to obtain more clear tumor margins, possibly leading to more stages and a subsequently larger defect. Knowing the clinical sizes of these NMSCs prior to biopsy would have been beneficial to our study, but these data often were not available from the referring providers.
Repair Type
Most patients who underwent MMS had surgical defects repaired with a flap vs a graft, and a much higher percentage of patients who had undergone MMS vs surgical excision with plastic surgery had their defects repaired with flaps. Using a visual analog scale score and Hollander Wound Evaluation Scale, Jacobs et al6 found flaps to be cosmetically superior to grafts following tumor extirpation on the nose. The more frequent use of grafts by plastic surgeons could be at least partially explained by larger defect size or by a few outlier larger lesions among an otherwise small sample size. Larger studies may be needed to see if a true discrepancy in repair preferences exists between the specialties.
Referring Specialty
Primary care physician referral comprised a much larger percentage of cases sent for treatment with plastic surgery (24%) compared to MMS (1%). This statistic may represent a practice gap in the perception of MMS and its benefits among our primary care colleagues, particularly among female patients, as a much higher percentage of women were treated with plastic surgery. Important potential benefits of MMS, particularly tissue conservation, cure rates for skin cancer, and the volume of repairs performed by Mohs surgeons, may need to be emphasized.
Scope of Practice
Our colleagues in plastic surgery are extremely gifted and perform numerous repairs outside the scope of most Mohs surgeons. They are vital to multidisciplinary approaches to patients with skin cancer. Although Mohs surgeons focus on treating skin cancers that arise in a narrower range of anatomic locations, the breadth and variety of surgical procedures performed by plastic surgeons is more diverse. Skin cancer surgery may account for a smaller portion of procedures in a plastic surgery practice.
Limitations
There are several limitations to this study. We did not compare cosmesis or wound healing in patients treated by MMS or plastic surgery. The sample size, particularly with plastic surgery, was small and did not allow for a larger, more powerful comparison of data between the 2 specialties. Finally, our study only represents 1 institution over the course of 1 year.
Conclusion
To provide the best care possible, it is imperative for referring physicians to possess an accurate understanding of the volume of cases and the types of repairs that treating specialties perform on a regular basis for NMSCs. This knowledge is particularly important when there is a treatment overlap among specialties. Our data show Mohs surgeons are performing more complex repairs and reconstructions on even the most cosmetically sensitive areas; therefore, primary care physicians and other specialists may be more likely to involve dermatology in the care of skin cancer.
- Rogers HW, Weinstock MA, Feldman SR, et al. Incidence estimate of nonmelanoma skin cancer (keratinocyte carcinomas) in the US population, 2012. JAMA Dermatol. 2015;151:1081-1086.
- Rogers HW, Weinstock MA, Harris AR, et al. Incidence estimate of nonmelanoma skin cancer in the united states, 2006. Arch Dermatol. 2010;146:283-287.
- Mansouri B, Bicknell LM, Hill D, et al. Mohs micrographic surgery for the management of cutaneous malignancies. Facial Plast Surg Clin North Am. 2017;25:291-301.
- Kantor J. Dermatologists perform more reconstructive surgery in the Medicare population than any other specialist group: a cross-sectional individual-level analysis of Medicare volume and specialist type in cutaneous and reconstructive surgery. J Am Acad Dermatol. 2018;78:171-173.e1.
- Donaldson MR, Coldiron BM. Dermatologists perform the majority of cutaneous reconstructions in the Medicare population: numbers and trends from 2004 to 2009. J Am Acad Dermatol. 2013;68:803-808.
- Jacobs MA, Christenson LJ, Weaver AL, et al. Clinical outcome of cutaneous flaps versus full-thickness skin grafts after Mohs surgery on the nose. Dermatol Surg. 2010;36:23-30.
Practice Points
- Patients and nondermatologist physicians may be unaware of how frequently Mohs surgeons perform complex surgical repairs compared to other specialists.
- Compared to plastic surgeons, Mohs surgeons performed a larger number of complex skin cancer repairs on the nose or ears with similar-sized defects.
- Primary care physicians and other specialists may be more likely to involve dermatology in the care of skin cancer through awareness of this type of data.
Gut microbiota and its implications for psychiatry: A review of 3 studies
The “human microbiota” describes all microorganisms within the human body, including bacteria, viruses, and eukaryotes. The related term “microbiome” refers to the complete catalog of these microbes and their genes.1 There is a growing awareness that the human microbiota plays an important role in maintaining mental health, and that a disruption in its composition can contribute to manifestations of psychiatric disorders. A growing body of evidence has also linked mental health outcomes to the gut microbiome, suggesting that the gut microbiota can modulate the gut-brain axis.2
Numerous neurotransmitters, including dopamine, serotonin, gamma-aminobutyric acid, and acetylcholine, are produced in the gastrointestinal (GI) tract, and our diet is vital in sustaining and replenishing them. At the same time, our brain regulates our GI tract by secretion of hormones such as oxytocin, leptin, ghrelin, neuropeptide Y, corticotrophin-releasing factor, and a plethora of others. Dysregulation of this microbiome can lead to both physical and mental illnesses. Symptoms of psychiatric disorders, such as depression, psychosis, anxiety, and autism, can be a consequence of this dysregulation.2
Our diet can also modify the gut microorganisms and therefore many of its metabolic pathways. More attention has been given to pre- and probiotics and their effects on DNA by epigenetic changes. One can quickly start to appreciate how this intricate crosstalk can lead to a variety of pathologic and psychiatric problems that have an adverse effect on autoimmune, inflammatory, metabolic, cognitive, and behavioral processes.2,3
Thus far, links have mostly been reported in animal models, and human studies are limited.4 Researchers are just beginning to elucidate how the microbiota affect gut-brain signaling in humans. Such mechanisms may include alterations in microbial composition, immune activation, vagus nerve signaling, alterations in tryptophan metabolism, production of specific microbial neuroactive metabolites, and bacterial cell wall sugars.5 The microbiota-gut-brain axis plays a part in regulating/programming the hypothalamic-pituitary-adrenal (HPA) axis throughout the life span.3 The interactions between the gut microbiome, the immune system, and the CNS are regulated through pathways that involve endocrine functions (HPA axis), the immune system, and metabolic factors.3,4 Recent research focusing on the gut microbiome has also given rise to international projects such as the Human Microbiome Project (Human Microbiome Project Consortium, 2012).3
Several studies have looked into psychiatry and inflammatory/immune pathways. Here we review 3 recent studies that have focused on the gut-brain axis (Table6-8).

1. Rudzki L, Pawlak D, Pawlak K, et al. Immune suppression of IgG response against dairy proteins in major depression. BMC Psychiatry. 2017;17(1):268.
The aim of this study was to evaluate immunoglobulin G (IgG) response against 40 food products in patients with depression vs those in a control group, along with changes in inflammatory markers, psychological stress, and dietary variables.6
Study design
- N = 63, IgG levels against 44 food products, cortisol levels, tumor necrosis factor (TNF)-alpha, interleukin 6 (IL-6), and IL-1 beta levels were recorded. The psychological parameters of 34 participants with depression and 29 controls were compared using the Hamilton Depression Rating scale, (HAM-D-17), Perceived Stress scale, and Symptom Checklist scale. The study was conducted in Poland.
Continue to: Outcomes
Outcomes
- Patients who were depressed had lower IgG levels against dairy products compared to controls when there was high dairy consumption. However, there was no overall difference between patients and controls in mean IgG concentration against food products.
- Patients who were depressed had higher levels of cortisol. Levels of cortisol had a positive correlation with HAM-D-17 score. Patients with depression had lower levels of TNF-alpha.
Conclusion
- Patients with depression had lower levels of IgG against dairy protein. Patients with depression had high cortisol levels but decreased levels of TNF-alpha, which could explain an immune suppression of IgG in these patients. There were no differences in IL-6 or IL-1beta levels.
Hypercortisolemia is present in approximately 60% of patients with depression. Elevated cortisol levels have a negative effect on lymphocyte function. B-lymphocytes (CD 10+ and CD 19+) are sensitive to glucocorticoids. Studies in mice have demonstrated that elevated glucocorticoid levels are associated with a 50% decrease in serum B-lymphocytes, and this can be explained by downregulation of c-myc protein, which plays a role in cell proliferation and cell survival. Glucocorticoids also decrease levels of protein kinases that are vital for the cell cycle to continue, and they upregulate p27 and p21, which are cell cycle inhibitors. Therefore, if high cortisol suppresses B-lymphocyte production, this can explain how patients with depression have low IgG levels, since B-lymphocytes differentiate into plasma cells that will produce antibodies.6
Depression can trigger an inflammatory response by increasing levels of inflammatory cytokines, acute phase reactants, and oxidative molecules. The inflammatory response can lead to intestinal wall disruption, and therefore bacteria can migrate across the GI barrier, along with food antigens, which could then lead to food antigen hypersensitivity.6
The significance of diet
Many studies have looked into specific types of diets, such as the Mediterranean diet, the ketogenic diet, and the addition of supplements such as probiotics, omega-3 fatty acids, zinc, and multivitamins.7 The Mediterranean diet is high in fiber, nuts, legumes, and fish.7 The ketogenic diet includes a controlled amount of fat, but is low in protein and carbohydrates.7 The main point is that a balanced diet can have a positive effect on mental health.7 The Mediterranean diet has shown to decrease the incidence of cardiovascular disease and lower the risk of depression.7 In animal studies, the ketogenic diet has improved anxiety, depression, and autism.7 Diet clearly affects gut microbiota and, as a consequence, the body’s level of inflammation.7
Continue to: The following review...
The following review highlighted the significance of diet on gut microbiome and mental health.7
2. Mörkl S, Wagner-Skacel J, Lahousen T, et al. The role of nutrition and the gut- brain axis in psychiatry: a review of the literature. Neuropsychobiology. 2018;17: 1-9.
Study design
- These researchers provided a narrative review of the significance of a healthy diet and nutritional supplements on the gut microbiome and the treatment of patients with psychiatric illness.
Outcomes
- This review suggested dietary coaching as a nonpharmacologic treatment for patients with psychiatric illness.
Conclusion
- The utilization of nutritional advice, along with medication management, therapy, and physical activity, can provide a holistic approach to the biopsychosocial treatment of patients with psychiatric illness.
This review also emphasized the poor dietary trends of Westernized countries, which include calorie-dense, genetically altered, processed meals. As Mörkl et al7 noted, we are overfed but undernourished. Mörkl et al7 reviewed studies that involve dietary coaching as part of the treatment plan of patients with mental illness. In one of these studies, patients who received nutritional advice and coaching over 6 weeks had a 40% to 50% decrease in depressive symptoms. These effects persisted for 2 more years. Mörkl et al7 also reviewed an Italian study that found that providing nutritional advice in patients with affective disorders and psychosis helped improve symptom severity and sleep.7
Continue to: Mörkl et al...
Mörkl et al7 also reviewed dietary supplements. Some studies have linked use of omega-3 fatty acids with improvement in affective disorders, Alzheimer’s disease, and posttraumatic stress disorder, as well as cardiovascular conditions. Omega-3 fatty acids may exert beneficial effects by enhancing brain-derived neurotrophic factor and neurogenesis as well as by decreasing inflammation.7
Zinc supplementation can also improve depression, as it has been linked to cytokine variation and hippocampal neuronal growth. Vitamin B9 deficiency and vitamin D deficiency also have been associated with depression. Mörkl et al7 emphasized that a balanced diet that incorporates a variety of nutrients is more beneficial than supplementation of any individual vitamin alone.
Researchers have long emphasized the importance of a healthy balanced diet when treating patients with medical conditions such as cardiovascular or cerebrovascular diseases. Based on the studies Mörkl et al7 reviewed, the same emphasis should be communicated to our patients who suffer from psychiatric conditions.
The gut and anxiety
The gut microbiome has also been an area of research when studying generalized anxiety disorder (GAD).8
3. Jiang HY, Zhang X, Yu ZH, et al. Altered gut microbiota profile in patients with generalized anxiety disorder. J Psychiatr Res. 2018;104:130-136.
The aim of the study was to determine if there were changes in the composition of the gut microbiome in patients with GAD compared with healthy controls.8
Continue to: Study design
Study design
- A cross-sectional study of 76 patients in Zhejiang, China. Forty patients with GAD in the active state and 36 healthy controls were compared in terms of composition of GI microbacterial flora.
- Researchers also examined a subgroup of 12 patients who were treatment-naïve and 17 controls. Stool samples were collected from the 12 patients who were treatment-naïve before initiating medication.
- Researchers also conducted a prospective study in a subgroup of 9 patients with GAD in both the active state and remissive state. Two stool samples were collected from each patient—one during the active state of GAD and one during the remissive state—for a total of 18 samples. Stool samples analyzed with the use of polymerase chain reaction and microbial analysis.
- Patients completed the Hamilton Anxiety Rating (HAM-A) scale and were classified into groups. Those with HAM-A scores >14 were classified as being in the active state of GAD, and those with scores <7 were classified as being in the remissive state.
Outcomes
- Among the samples collected, 8 bacterial taxa were found in different amounts in patients with GAD and healthy controls. Bacteroidetes, Ruminococcus gnavus, and Fusobacterium were increased in patients with GAD compared with controls, while Faecalibacterium, Eubacterium rectale, Sutterella, Lachnospira, and Butyricicoccus were increased in healthy controls.
- Bacterial variety was notably lower in the 12 patients who were treatment-naïve compared with the control group.
- There was no notable difference in microbial composition between patients in the active vs remissive state.
Conclusion
- Patients with GAD had less short chain fatty acid–producing bacteria (Faecalibacterium, Eubacterium rectale, Sutterella, Lachnospira, and Butyricicoccus) compared with controls. Decreased formation of short chain fatty acids could lead to GI barrier disruption. Fusobacterium and Ruminococcus were increased in patients with GAD. Fusobacterium can cause disease and be invasive when it disseminates within the body. The inflammatory characteristics of Fusobacterium contribute to the immunologic activation in GAD. Ruminococcus breaks down mucin, which could then increase GI permeability by mucous degradation of the GI lumen.
Changes in food processing and manufacturing have led to changes in our diets. Changes in our normal GI microbacterial flora could lead to increased gut permeability, bacterial dissemination, and subsequent systemic inflammation. Research has shown that the composition of the microbiota changes across the life span.9 A balanced intake of nutrients is important for both our physical and mental health and safeguards the basis of gut microbiome regulation. A well-regulated gut microbiome ensures low levels of inflammation in the brain and body. Lifestyle modifications and dietary coaching could be practical interventions for patients with psychiatric conditions.5 Current advances in technology now offer precise analyses of thousands of metabolites, enabling metabolomics to offer the promise of discovering new drug targets and biomarkers that may help pave a way to precision medicine.
1. Dave M, Higgins PD, Middha S, et al. The human gut microbiome: current knowledge, challenges, and future directions. Transl Res. 2012;160:246-257.
2. Nasrallah HA. It takes guts to be mentally ill: microbiota and psychopathology. Current Psychiatry. 2018;17(9):4-6.
3. Malan-Muller S, Valles-Colomer M, Raes J, et al. The gut microbiome and mental health: implications for anxiety-and trauma-related disorders. OMICS. 2018;22(2):90-107.
4. Du Toit A. The gut microbiome and mental health. Nat Rev Microbiol. 2019;17(4):196.
5. Cryan JF, Dinan TG. Mind-altering microorganisms: the impact of the gut microbiota on brain and behaviour. Nat Rev Neurosci. 2012;13(10):701-712.
6. Rudzki L, Pawlak D, Pawlak K, et al. Immune suppression of IgG response against dairy proteins in major depression. BMC Psychiatry. 2017;17(1):268.
7. Mörkl S, Wagner-Skacel J, Lahousen T, et al. The role of nutrition and the gut-brain axis in psychiatry: a review of the literature. Neuropsychobiology. 2018;17:1-9.
8. Jiang HY, Zhang X, Yu ZH, et al. Altered gut microbiota profile in patients with generalized anxiety disorder. J Psychiatr Res. 2018;104:130-136.
9. Douglas-Escobar M, Elliott E, Neu J. Effect of intestinal microbial ecology on the developing brain. JAMA Pediatr. 2013;167(4):374-379.
The “human microbiota” describes all microorganisms within the human body, including bacteria, viruses, and eukaryotes. The related term “microbiome” refers to the complete catalog of these microbes and their genes.1 There is a growing awareness that the human microbiota plays an important role in maintaining mental health, and that a disruption in its composition can contribute to manifestations of psychiatric disorders. A growing body of evidence has also linked mental health outcomes to the gut microbiome, suggesting that the gut microbiota can modulate the gut-brain axis.2
Numerous neurotransmitters, including dopamine, serotonin, gamma-aminobutyric acid, and acetylcholine, are produced in the gastrointestinal (GI) tract, and our diet is vital in sustaining and replenishing them. At the same time, our brain regulates our GI tract by secretion of hormones such as oxytocin, leptin, ghrelin, neuropeptide Y, corticotrophin-releasing factor, and a plethora of others. Dysregulation of this microbiome can lead to both physical and mental illnesses. Symptoms of psychiatric disorders, such as depression, psychosis, anxiety, and autism, can be a consequence of this dysregulation.2
Our diet can also modify the gut microorganisms and therefore many of its metabolic pathways. More attention has been given to pre- and probiotics and their effects on DNA by epigenetic changes. One can quickly start to appreciate how this intricate crosstalk can lead to a variety of pathologic and psychiatric problems that have an adverse effect on autoimmune, inflammatory, metabolic, cognitive, and behavioral processes.2,3
Thus far, links have mostly been reported in animal models, and human studies are limited.4 Researchers are just beginning to elucidate how the microbiota affect gut-brain signaling in humans. Such mechanisms may include alterations in microbial composition, immune activation, vagus nerve signaling, alterations in tryptophan metabolism, production of specific microbial neuroactive metabolites, and bacterial cell wall sugars.5 The microbiota-gut-brain axis plays a part in regulating/programming the hypothalamic-pituitary-adrenal (HPA) axis throughout the life span.3 The interactions between the gut microbiome, the immune system, and the CNS are regulated through pathways that involve endocrine functions (HPA axis), the immune system, and metabolic factors.3,4 Recent research focusing on the gut microbiome has also given rise to international projects such as the Human Microbiome Project (Human Microbiome Project Consortium, 2012).3
Several studies have looked into psychiatry and inflammatory/immune pathways. Here we review 3 recent studies that have focused on the gut-brain axis (Table6-8).
1. Rudzki L, Pawlak D, Pawlak K, et al. Immune suppression of IgG response against dairy proteins in major depression. BMC Psychiatry. 2017;17(1):268.
The aim of this study was to evaluate immunoglobulin G (IgG) response against 40 food products in patients with depression vs those in a control group, along with changes in inflammatory markers, psychological stress, and dietary variables.6
Study design
- N = 63, IgG levels against 44 food products, cortisol levels, tumor necrosis factor (TNF)-alpha, interleukin 6 (IL-6), and IL-1 beta levels were recorded. The psychological parameters of 34 participants with depression and 29 controls were compared using the Hamilton Depression Rating scale, (HAM-D-17), Perceived Stress scale, and Symptom Checklist scale. The study was conducted in Poland.
Continue to: Outcomes
Outcomes
- Patients who were depressed had lower IgG levels against dairy products compared to controls when there was high dairy consumption. However, there was no overall difference between patients and controls in mean IgG concentration against food products.
- Patients who were depressed had higher levels of cortisol. Levels of cortisol had a positive correlation with HAM-D-17 score. Patients with depression had lower levels of TNF-alpha.
Conclusion
- Patients with depression had lower levels of IgG against dairy protein. Patients with depression had high cortisol levels but decreased levels of TNF-alpha, which could explain an immune suppression of IgG in these patients. There were no differences in IL-6 or IL-1beta levels.
Hypercortisolemia is present in approximately 60% of patients with depression. Elevated cortisol levels have a negative effect on lymphocyte function. B-lymphocytes (CD 10+ and CD 19+) are sensitive to glucocorticoids. Studies in mice have demonstrated that elevated glucocorticoid levels are associated with a 50% decrease in serum B-lymphocytes, and this can be explained by downregulation of c-myc protein, which plays a role in cell proliferation and cell survival. Glucocorticoids also decrease levels of protein kinases that are vital for the cell cycle to continue, and they upregulate p27 and p21, which are cell cycle inhibitors. Therefore, if high cortisol suppresses B-lymphocyte production, this can explain how patients with depression have low IgG levels, since B-lymphocytes differentiate into plasma cells that will produce antibodies.6
Depression can trigger an inflammatory response by increasing levels of inflammatory cytokines, acute phase reactants, and oxidative molecules. The inflammatory response can lead to intestinal wall disruption, and therefore bacteria can migrate across the GI barrier, along with food antigens, which could then lead to food antigen hypersensitivity.6
The significance of diet
Many studies have looked into specific types of diets, such as the Mediterranean diet, the ketogenic diet, and the addition of supplements such as probiotics, omega-3 fatty acids, zinc, and multivitamins.7 The Mediterranean diet is high in fiber, nuts, legumes, and fish.7 The ketogenic diet includes a controlled amount of fat, but is low in protein and carbohydrates.7 The main point is that a balanced diet can have a positive effect on mental health.7 The Mediterranean diet has shown to decrease the incidence of cardiovascular disease and lower the risk of depression.7 In animal studies, the ketogenic diet has improved anxiety, depression, and autism.7 Diet clearly affects gut microbiota and, as a consequence, the body’s level of inflammation.7
Continue to: The following review...
The following review highlighted the significance of diet on gut microbiome and mental health.7
2. Mörkl S, Wagner-Skacel J, Lahousen T, et al. The role of nutrition and the gut- brain axis in psychiatry: a review of the literature. Neuropsychobiology. 2018;17: 1-9.
Study design
- These researchers provided a narrative review of the significance of a healthy diet and nutritional supplements on the gut microbiome and the treatment of patients with psychiatric illness.
Outcomes
- This review suggested dietary coaching as a nonpharmacologic treatment for patients with psychiatric illness.
Conclusion
- The utilization of nutritional advice, along with medication management, therapy, and physical activity, can provide a holistic approach to the biopsychosocial treatment of patients with psychiatric illness.
This review also emphasized the poor dietary trends of Westernized countries, which include calorie-dense, genetically altered, processed meals. As Mörkl et al7 noted, we are overfed but undernourished. Mörkl et al7 reviewed studies that involve dietary coaching as part of the treatment plan of patients with mental illness. In one of these studies, patients who received nutritional advice and coaching over 6 weeks had a 40% to 50% decrease in depressive symptoms. These effects persisted for 2 more years. Mörkl et al7 also reviewed an Italian study that found that providing nutritional advice in patients with affective disorders and psychosis helped improve symptom severity and sleep.7
Continue to: Mörkl et al...
Mörkl et al7 also reviewed dietary supplements. Some studies have linked use of omega-3 fatty acids with improvement in affective disorders, Alzheimer’s disease, and posttraumatic stress disorder, as well as cardiovascular conditions. Omega-3 fatty acids may exert beneficial effects by enhancing brain-derived neurotrophic factor and neurogenesis as well as by decreasing inflammation.7
Zinc supplementation can also improve depression, as it has been linked to cytokine variation and hippocampal neuronal growth. Vitamin B9 deficiency and vitamin D deficiency also have been associated with depression. Mörkl et al7 emphasized that a balanced diet that incorporates a variety of nutrients is more beneficial than supplementation of any individual vitamin alone.
Researchers have long emphasized the importance of a healthy balanced diet when treating patients with medical conditions such as cardiovascular or cerebrovascular diseases. Based on the studies Mörkl et al7 reviewed, the same emphasis should be communicated to our patients who suffer from psychiatric conditions.
The gut and anxiety
The gut microbiome has also been an area of research when studying generalized anxiety disorder (GAD).8
3. Jiang HY, Zhang X, Yu ZH, et al. Altered gut microbiota profile in patients with generalized anxiety disorder. J Psychiatr Res. 2018;104:130-136.
The aim of the study was to determine if there were changes in the composition of the gut microbiome in patients with GAD compared with healthy controls.8
Continue to: Study design
Study design
- A cross-sectional study of 76 patients in Zhejiang, China. Forty patients with GAD in the active state and 36 healthy controls were compared in terms of composition of GI microbacterial flora.
- Researchers also examined a subgroup of 12 patients who were treatment-naïve and 17 controls. Stool samples were collected from the 12 patients who were treatment-naïve before initiating medication.
- Researchers also conducted a prospective study in a subgroup of 9 patients with GAD in both the active state and remissive state. Two stool samples were collected from each patient—one during the active state of GAD and one during the remissive state—for a total of 18 samples. Stool samples analyzed with the use of polymerase chain reaction and microbial analysis.
- Patients completed the Hamilton Anxiety Rating (HAM-A) scale and were classified into groups. Those with HAM-A scores >14 were classified as being in the active state of GAD, and those with scores <7 were classified as being in the remissive state.
Outcomes
- Among the samples collected, 8 bacterial taxa were found in different amounts in patients with GAD and healthy controls. Bacteroidetes, Ruminococcus gnavus, and Fusobacterium were increased in patients with GAD compared with controls, while Faecalibacterium, Eubacterium rectale, Sutterella, Lachnospira, and Butyricicoccus were increased in healthy controls.
- Bacterial variety was notably lower in the 12 patients who were treatment-naïve compared with the control group.
- There was no notable difference in microbial composition between patients in the active vs remissive state.
Conclusion
- Patients with GAD had less short chain fatty acid–producing bacteria (Faecalibacterium, Eubacterium rectale, Sutterella, Lachnospira, and Butyricicoccus) compared with controls. Decreased formation of short chain fatty acids could lead to GI barrier disruption. Fusobacterium and Ruminococcus were increased in patients with GAD. Fusobacterium can cause disease and be invasive when it disseminates within the body. The inflammatory characteristics of Fusobacterium contribute to the immunologic activation in GAD. Ruminococcus breaks down mucin, which could then increase GI permeability by mucous degradation of the GI lumen.
Changes in food processing and manufacturing have led to changes in our diets. Changes in our normal GI microbacterial flora could lead to increased gut permeability, bacterial dissemination, and subsequent systemic inflammation. Research has shown that the composition of the microbiota changes across the life span.9 A balanced intake of nutrients is important for both our physical and mental health and safeguards the basis of gut microbiome regulation. A well-regulated gut microbiome ensures low levels of inflammation in the brain and body. Lifestyle modifications and dietary coaching could be practical interventions for patients with psychiatric conditions.5 Current advances in technology now offer precise analyses of thousands of metabolites, enabling metabolomics to offer the promise of discovering new drug targets and biomarkers that may help pave a way to precision medicine.
1. Dave M, Higgins PD, Middha S, et al. The human gut microbiome: current knowledge, challenges, and future directions. Transl Res. 2012;160:246-257.
2. Nasrallah HA. It takes guts to be mentally ill: microbiota and psychopathology. Current Psychiatry. 2018;17(9):4-6.
3. Malan-Muller S, Valles-Colomer M, Raes J, et al. The gut microbiome and mental health: implications for anxiety-and trauma-related disorders. OMICS. 2018;22(2):90-107.
4. Du Toit A. The gut microbiome and mental health. Nat Rev Microbiol. 2019;17(4):196.
5. Cryan JF, Dinan TG. Mind-altering microorganisms: the impact of the gut microbiota on brain and behaviour. Nat Rev Neurosci. 2012;13(10):701-712.
6. Rudzki L, Pawlak D, Pawlak K, et al. Immune suppression of IgG response against dairy proteins in major depression. BMC Psychiatry. 2017;17(1):268.
7. Mörkl S, Wagner-Skacel J, Lahousen T, et al. The role of nutrition and the gut-brain axis in psychiatry: a review of the literature. Neuropsychobiology. 2018;17:1-9.
8. Jiang HY, Zhang X, Yu ZH, et al. Altered gut microbiota profile in patients with generalized anxiety disorder. J Psychiatr Res. 2018;104:130-136.
9. Douglas-Escobar M, Elliott E, Neu J. Effect of intestinal microbial ecology on the developing brain. JAMA Pediatr. 2013;167(4):374-379.
