User login
Beyond the Polygraph: Deception Detection and the Autonomic Nervous System
The US Department of Defense (DoD) and law enforcement agencies around the country utilize polygraph as an aid in security screenings and interrogation. It is assumed that a person being interviewed will have a visceral response when attempting to deceive the interviewer, and that this response can be detected by measuring the change in vital signs between questions. By using vital signs as an indirect measurement of deception-induced stress, the polygraph machine may provide a false positive or negative result if a patient has an inherited or acquired condition that affects the autonomic nervous system (ANS).
A variety of diseases from alcohol use disorder to rheumatoid arthritis can affect the ANS. In addition, a multitude of commonly prescribed drugs can affect the ANS. Although in their infancy, functional magnetic resonance imaging (fMRI) and EEG (electroencephalogram) deception detection techniques circumvent these issues. Dysautonomias may be an underappreciated cause of error in polygraph interpretation. Polygraph examiners and DoD agencies should be aware of the potential for these disorders to interfere with interpretation of results. In the near future, other modalities that do not measure autonomic variables may be utilized to avoid these pitfalls.
Polygraphy
Throughout history, humans have been interested in techniques and devices that can discern lies from the truth. Even in the ancient era, it was known that the act of lying had physiologic effects. In ancient Israel, if a woman accused of adultery should develop a swollen abdomen after drinking “waters of bitterness,” she was considered guilty of the crime, as described in Numbers 5:11-31. In Ancient China, those accused of fraud would be forced to hold dry rice in their mouths; if the expectorated rice was dry, the suspect was found guilty.1 We now know that catecholamines, particularly epinephrine, secreted during times of stress, cause relaxation of smooth muscle, leading to reduced bowel motility and dry mouth.2-4 However, most methods before the modern era were based more on superstition and chance rather than any sound physiologic premise.
When asked to discern the truth from falsehood based on their own perceptions, people correctly discern lies as false merely 47% of the time and truth as nondeceptive about 61% of the time.5 In short, unaided, we are very poor lie detectors. Therefore, a great deal of interest in technology that can aid in lie detection has ensued. With enhanced technology and understanding of human physiology came a renewed interest in lie detection. Since it was known that vital signs such as blood pressure (BP), heart rate, and breathing could be affected by the stressful situation brought on by deception, quantifying and measuring those responses in an effort to detect lying became a goal. In 1881, the Italian criminologist Cesare Lombroso invented a glove that when worn by a suspect, measured their BP.6-8 Changes in BP also were the target variable of the systolic BP deception test invented by William M. Marston, PhD, in 1915.8 Marston also experimented with measurements of other variables, such as muscle tension.9 In 1921, John Larson invented the first modern polygraph machine.7
Procedures
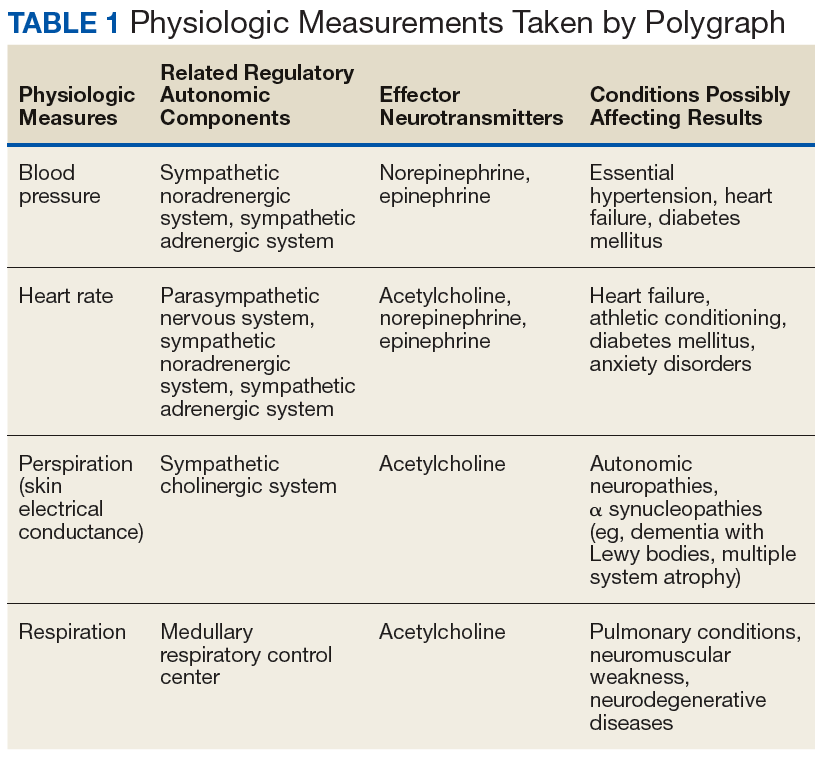
Today’s polygraph builds on these techniques. A standard polygraph measures respiration, heart rate, BP, and sudomotor function (sweating). Respiration is measured via strain gauges strapped around the chest and abdomen that respond to chest expansion during inhalation. BP and pulse can be measured through a variety of means, including finger pulse measurement or sphygmomanometer.8
Perspiration is measured by skin electrical conductance. Human sweat contains a variety of cations and anions—mostly sodium and chloride, but also potassium, bicarbonate, and lactate. The presence of these electrolytes alter electrical conduction at the skin surface when sweat is released.10
The exact questioning procedure used to perform a polygraph examination can vary. The Comparison Question Test is most commonly used. In this format, the interview consists of questions that are relevant to the investigation at hand, interspersed with control questions. The examiner compares the changes in vital signs and skin conduction to the baseline measurements generated during the pretest interview and during control questions.8 Using these standardized techniques, some studies have shown accuracy rates between 83% and 95% in controlled settings.8 However, studies performed outside of the polygraph community have found very high false positive rates, up to 50% or greater.11
The US Supreme Court has ruled that individual jurisdictions can decide whether or not to admit polygraph evidence in court, and the US Court of Appeals for the Eleventh Circuit has ruled that polygraph results are only admissible if both parties agree to it and are given sufficient notice.12,13 Currently, New Mexico is the only state that allows polygraph results to be used as evidence without a pretrial agreement; all other states either require such an agreement or forbid the results to be used as evidence.14
Although rarely used in federal and state courts as evidence, polygraphy is commonly used during investigations and in the hiring process of government agencies. DoD Directive 5210.48 and Instruction 5210.91 enable DoD investigative organizations (eg, Naval Criminal Investigative Service, National Security Agency, US Army Investigational Command) to use polygraph as an aid during investigations into suspected involvement with foreign intelligence, terrorism against the US, mishandling of classified documents, and other serious violations.15
The Role of the Physician in Polygraph Assessment
It may be rare that the physician is called upon to provide information regarding an individual’s medical condition or related medication use and the effect of these on polygraph results. In such cases, however, the physician must remember the primary fiduciary duty to the patient. Disclosure of medical conditions cannot be made without the patient’s consent, save in very specific situations (eg, Commanding Officer Inquiry, Tarasoff Duty to Protect, etc). It is the polygraph examiner’s responsibility to be aware of potential confounders in a particular examination.10
Physicians can have a responsibility when in administrative or supervisory positions, to advise security and other officials regarding the fitness for certain duties of candidates with whom there is no physician-patient relationship. This may include an individual’s ability to undergo polygraph examination and the validity of such results. However, when a physician-patient relationship is involved, care must be given to ensure that the patient understands that the relationship is protected both by professional standards and by law and that no information will be shared without the patient’s authorization (aside from those rare exceptions provided by law). Often, a straightforward explanation to the patient of the medical condition and any medication’s potential effects on polygraph results will be sufficient, allowing the patient to report as much as is deemed necessary to the polygraph examiner.
Polygraphy Pitfalls
Polygraphy presupposes that the subject will have a consistent and measurable physiologic response when he or she attempts to deceive the interviewer. The changes in BP, heart rate, respirations, and perspiration that are detected by polygraphy and interpreted by the examiner are controlled by the ANS (Table 1). There are a variety of diseases that are known to cause autonomic dysfunction (dysautonomia). Small fiber autonomic neuropathies often result in loss of sweating and altered heart rate and BP variation and can arise from many underlying conditions. Synucleinopathies, such as Parkinson disease, alter cardiovascular reflexes.14,16
Even diseases not commonly recognized as having a predominant clinical impact on ANS function can demonstrate measurable physiologic effect. For example, approximately 60% of patients with rheumatoid arthritis will have blunted cardiovagal baroreceptor responses and heart rate variability.17 ANS dysfunction is also a common sequela of alcoholism.18 Patients with diabetes mellitus often have an elevated resting heart rate and low heart rate variability due to dysregulated β-adrenergic activity.19 The impact of reduced baroreceptor response and reduced heart rate variability could impact the polygraph interpreter’s ability to discern responses using heart rate. Individuals with ANS dysfunction that causes blunted physiologic responses could have inconclusive or potentially worse false-negative polygraph results due to lack of variation between control and target questions.
To our knowledge, no study has been performed on the validity of polygraphy in patients with any form of dysautonomia. Additionally, a 2011 process and compliance study of the DoD polygraph program specifically recommended that “adjudicators would benefit from training in polygraph capabilities and limitations.”20 Although specific requirements vary from program to program, all programs accredited by the American Polygraph Association provide training in physiology, psychology, and standardization of test results.
Many commonly prescribed medications have effects on the ANS that could affect the results of a polygraph exam (Table 2). For example, β blockers reduce β adrenergic receptor activation in cardiac muscle and blood vessels, reducing heart rate, heart rate variability, cardiac contractility, and BP.21 This class of medication is prescribed for a variety of conditions, including congestive heart failure, hypertension, panic disorder, and posttraumatic stress disorder. Thus, a patient taking β blockers will have a blunted physiologic response to stress and have an increased likelihood of an inconclusive or false-negative polygraph exam.
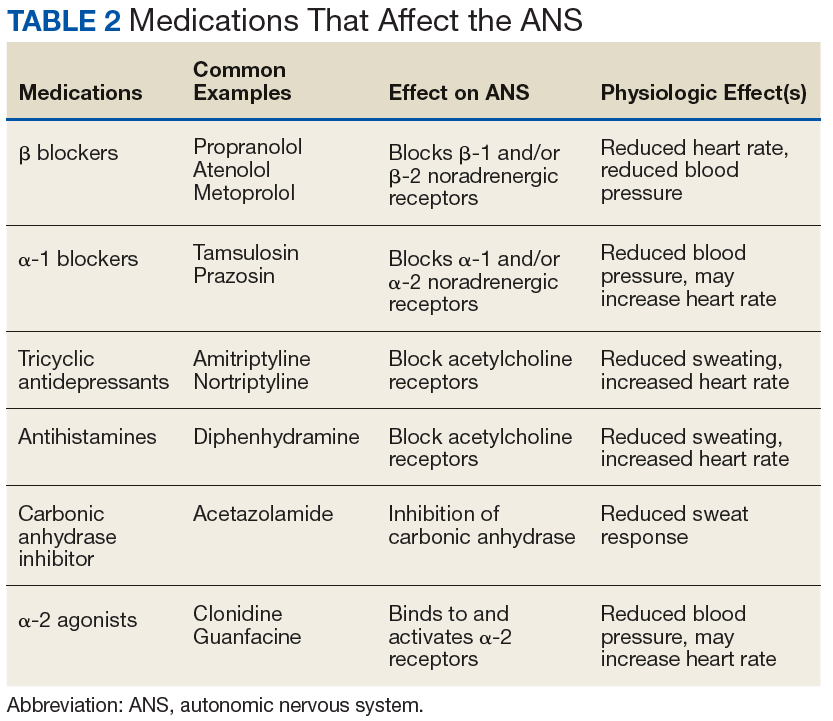
Some over-the-counter medications also have effects on autonomic function. Sympathomimetics such as pseudoephedrine or antihistamines with anticholinergic activity like diphenhydramine can both increase heart rate and BP.22,23 Of the 10 most prescribed medications of 2016, 5 have direct effects on the ANS or the variables measured by the polygraph machine.24 An exhaustive list of medication effects on autonomic function is beyond the scope of this article.
A medication that may affect the results of a polygraph study that is of special interest to the DoD and military is mefloquine. Mefloquine is an antimalarial drug that has been used by military personnel deployed to malaria endemic regions.25 In murine models, mefloquine has been shown to disrupt autonomic and respiratory control in the central nervous system.26 The neuropsychiatric adverse effects of mefloquine are well documented and can last for years after exposure to the drug.27 Therefore, mefloquine could affect the results of a polygraph test through both direct toxic effects on the ANS as well as causing anxiety and depression, potentially affecting the subject’s response to questioning.
Alternative Modalities
Given the pitfalls inherent with external physiologic measures for lie detection, additional modalities that bypass measurement of ANS-governed responses have been sought. Indeed, the integration and combination of more comprehensive modalities has come to be named the forensic credibility assessment.
Functional MRI
Beginning in 1991, researchers began using fMRI to see real-time perfusion changes in areas of the cerebral cortex between times of rest and mental stimulation.26 This modality provides a noninvasive technique for viewing which specific parts of the brain are stimulated during activity. When someone is engaged in active deception, the dorsolateral prefrontal cortex has greater perfusion than when the patient is engaged in truth telling.28 Since fMRI involves imaging for evaluation of the central nervous system, it avoids the potential inaccuracies that can be seen in some subjects with autonomic irregularities. In fact, fMRI may have superior sensitivity and specificity for lie detection compared with that of conventional polygraphy.29
Significant limitations to the use of fMRI include the necessity of expensive specialized equipment and trained personnel to operate the MRI. Agencies that use polygraph examinations may be unwilling to make such an investment. Further, subjects with metallic foreign bodies or noncompatible medical implants cannot undergo the MRI procedure. Finally, there have been bioethical and legal concerns raised that measuring brain activity during interrogation may endanger “cognitive freedom” and may even be considered unreasonable search and seizure under the Fourth Amendment to the US Constitution.30 However, fMRI—like polygraphy—can only measure the difference between brain perfusion in 2 states. The idea of fMRI as “mind reading” is largely a misconception.31
Electroencephalography
Various EEG modalities have received increased interest for lie detection. In EEG, electrodes are used to measure the summation of a multitude of postsynaptic action potentials and the local voltage gradient they produce when cortical pyramidal neurons are fired in synchrony.32 These voltage gradients are detectable at the scalp surface. Shortly after the invention of EEG, it was observed that specific stimuli generated unique and predicable changes in EEG morphology. These event-related potentials (ERP) are detectable by scalp EEG shortly after the stimulus is given.33
ERPs can be elicited by a multitude of sensory stimuli, have a predictable and reproducible morphology, and are believed to be a psychophysiologic correlate of mental processing of stimuli.34 The P300 is an ERP characterized by a positive change in voltage occurring 300 milliseconds after a stimulus. It is associated with stimulus processing and categorization.35 Since deception is a complex cognitive process involving recognizing pertinent stimuli and inventing false responses to them, it was theorized that the detection of a P300 ERP during a patient interview would mean the patient truly recognizes the stimulus and is denying such knowledge. Early studies performed on P300 had variable accuracy for lie detection, roughly 40% to 80%, depending on the study. Thus, the rate of false negatives would increase if the subjects were coached on countermeasures, such as increasing the significance of distractor data or counting backward by 7s.36,37 Later studies have found ways of minimizing these issues, such as detection of a P900 ERP (a cortical potential at 900 milliseconds) that can be seen when subjects are attempting countermeasures.38
Another technique for increasing accuracy in EEG-mediated lie detection is measurement of multifaceted electroencephalographic response (MER), which involves a more detailed analysis of multiple EEG electrode sites and how the signaling changes over time using both visual comparison of multiple trials as well as bootstrap analysis.37 In particular, memory- and encoding-related multifaceted electroencephalographic response (MERMER) using P300 coupled with an electrically negative impulse recorded at the frontal lobe and phasic changes in the global EEG had superior accuracy than P300 alone.37
The benefits of EEG compared with that of fMRI include large reductions in cost, space, and restrictions for use in some individuals (EEG is safe for virtually all patients, including those with metallic foreign bodies). However, like fMRI, EEG still requires trained personnel to operate and interpret. Also, it has yet to be tested outside of the laboratory.
Conclusion
The ability to detect deception is an important factor in determining security risk and adjudication of legal proceedings, but untrained persons are surprisingly poor at discerning truth from lies. The polygraph has been used by law enforcement and government agencies for decades to aid in interrogation and the screening of employees for security clearances and other types of access. However, results are vulnerable to inaccuracies in subjects with autonomic disorders and may be confounded by multiple medications. While emerging technologies such as fMRI and EEG may allow superior accuracy by bypassing ANS-based physiologic outputs, the polygraph examiner and the physician must be aware of the effect of autonomic dysfunction and of the medications that affect the ANS. This is particularly true within military medicine, as many patients within this population are subject to polygraph examination.
1. Ford EB. Lie detection: historical, neuropsychiatric and legal dimensions. Int J Law Psychiatry. 2006;29(3):159-177.
2. Ohrn PG. Catecholamine infusion and gastrointestinal propulsion in the rat. Acta Chir Scand Suppl. 1979(461):43-52.
3. Sakamoto H. The study of catecholamine, acetylcholine and bradykinin in buccal circulation in dogs. Kurume Med J. 1979;26(2):153-162.
4. Bond CF Jr, Depaulo BM. Accuracy of deception judgments. Pers Soc Psychol Rev. 2006;10(3):214-234.
5. Vicianova M. Historical techniques of lie detection. Eur J sychology. 2015;11(3):522-534.
6. Matté JA. Forensic Psychophysiology Using the Polygraph: Scientific Truth Verification, Lie Detection. Williamsville, NY: JAM Publications; 2012.
7. Segrave K. Lie Detectors: A Social History. Jefferson, NC: McFarland & Company; 2004.
8. Nelson R. Scientific basis for polygraph testing. Polygraph. 2015;44(1):28-61.
9. Boucsein W. Electrodermal Activity. New York, NY: Springer Publishing; 2012.
10. US Congress, Office of Assessment and Technology. Scientific validity of polygraph testing: a research review and evaluation. https://ota.fas.org/reports/8320.pdf. Published 1983. Accessed June 12, 2019.
11. United States v Scheffer, 523 US 303 (1998).
12. United States v Piccinonna, 729 F Supp 1336 (SD Fl 1990).
13. Fridman DS, Janoe JS. The state of judicial gatekeeping in New Mexico. https://cyber.harvard.edu/daubert/nm.htm. Updated April 17, 1999. Accessed May 20, 2019.
14. Gibbons CH. Small fiber neuropathies. Continuum (Minneap Minn). 2014;20(5 Peripheral Nervous System Disorders):1398-1412.
15. US Department of Defense. Directive 5210.48: Credibility assessment (CA) program. https://fas.org/irp/doddir/dod/d5210_48.pdf. Updated February 12, 2018. Accessed May 30, 2019.
16. Postuma RB, Gagnon JF, Pelletier A, Montplaisir J. Prodromal autonomic symptoms and signs in Parkinson’s disease and dementia with Lewy bodies. Mov Disord. 2013;28(5):597-604.
17. Adlan AM, Lip GY, Paton JF, Kitas GD, Fisher JP. Autonomic function and rheumatoid arthritis: a systematic review. Semin Arthritis Rheum. 2014;44(3):283-304.
18. Di Ciaula A, Grattagliano I, Portincasa P. Chronic alcoholics retain dyspeptic symptoms, pan-enteric dysmotility, and autonomic neuropathy before and after abstinence. J Dig Dis. 2016;17(11):735-746.
19. Thaung HA, Baldi JC, Wang H, et al. Increased efferent cardiac sympathetic nerve activity and defective intrinsic heart rate regulation in type 2 diabetes. Diabetes. 2015;64(8):2944-2956.
20. US Department of Defense, Office of the Undersecretary of Defense for Intelligence. Department of Defense polygraph program process and compliance study: study report. https://fas.org/sgp/othergov/polygraph/dod-poly.pdf. Published December 19, 2011. Accessed May 20, 2019.
21. Ladage D, Schwinger RH, Brixius K. Cardio-selective beta-blocker: pharmacological evidence and their influence on exercise capacity. Cardiovasc Ther. 2013;31(2):76-83.
22. D’Souza RS, Mercogliano C, Ojukwu E, et al. Effects of prophylactic anticholinergic medications to decrease extrapyramidal side effects in patients taking acute antiemetic drugs: a systematic review and meta-analysis Emerg Med J. 2018;35:325-331.
23. Gheorghiev MD, Hosseini F, Moran J, Cooper CE. Effects of pseudoephedrine on parameters affecting exercise performance: a meta-analysis. Sports Med Open. 2018;4(1):44.
24. Frellick M. Top-selling, top-prescribed drugs for 2016. https://www.medscape.com/viewarticle/886404. Published October 2, 2017. Accessed May 20, 2019.
25. Lall DM, Dutschmann M, Deuchars J, Deuchars S. The anti-malarial drug mefloquine disrupts central autonomic and respiratory control in the working heart brainstem preparation of the rat. J Biomed Sci. 2012;19:103.
26. Ritchie EC, Block J, Nevin RL. Psychiatric side effects of mefloquine: applications to forensic psychiatry. J Am Acad Psychiatry Law. 2013;41(2):224-235.
27. Belliveau JW, Kennedy DN Jr, McKinstry RC, et al. Functional mapping of the human visual cortex by magnetic resonance imaging. Science. 1991;254(5032):716-719.
28. Ito A, Abe N, Fujii T, et al. The contribution of the dorsolateral prefrontal cortex to the preparation for deception and truth-telling. Brain Res. 2012;1464:43-52.
29. Langleben DD, Hakun JG, Seelig D. Polygraphy and functional magnetic resonance imaging in lie detection: a controlled blind comparison using the concealed information test. J Clin Psychiatry. 2016;77(10):1372-1380.
30. Boire RG. Searching the brain: the Fourth Amendment implications of brain-based deception detection devices. Am J Bioeth. 2005;5(2):62-63; discussion W5.
31. Langleben DD. Detection of deception with fMRI: Are we there yet? Legal Criminological Psychol. 2008;13(1):1-9.
32. Marcuse LV, Fields MC, Yoo J. Rowans Primer of EEG. 2nd ed. Edinburgh, Scotland, United Kingdom: Elsevier; 2016.
33. Farwell LA, Donchin E. The truth will out: interrogative polygraphy (“lie detection”) with event-related brain potentials. Psychophysiology. 1991;28(5):531-547.
34. Sur S, Sinha VK. Event-related potential: an overview. Ind Psychiatry J. 2009;18(1):70-73.
35. Polich J. Updating P300: an integrative theory of P3a and P3b. Clinical Neurophysiol. 2007;118(10):2128-2148.
36. Mertens R, Allen, JJB. The role of psychophysiology in forensic assessments: Deception detection, ERPs, and virtual reality mock crime scenarios. Psychophysiology. 2008;45(2):286-298.
37. Rosenfeld JP, Labkovsky E. New P300-based protocol to detect concealed information: resistance to mental countermeasures against only half the irrelevant stimuli and a possible ERP indicator of countermeasures. Psychophysiology. 2010;47(6):1002-1010.
38. Farwell LA, Smith SS. Using brain MERMER testing to detect knowledge despite efforts to conceal. J Forensic Sci. 2001;46(1):135-143.
The US Department of Defense (DoD) and law enforcement agencies around the country utilize polygraph as an aid in security screenings and interrogation. It is assumed that a person being interviewed will have a visceral response when attempting to deceive the interviewer, and that this response can be detected by measuring the change in vital signs between questions. By using vital signs as an indirect measurement of deception-induced stress, the polygraph machine may provide a false positive or negative result if a patient has an inherited or acquired condition that affects the autonomic nervous system (ANS).
A variety of diseases from alcohol use disorder to rheumatoid arthritis can affect the ANS. In addition, a multitude of commonly prescribed drugs can affect the ANS. Although in their infancy, functional magnetic resonance imaging (fMRI) and EEG (electroencephalogram) deception detection techniques circumvent these issues. Dysautonomias may be an underappreciated cause of error in polygraph interpretation. Polygraph examiners and DoD agencies should be aware of the potential for these disorders to interfere with interpretation of results. In the near future, other modalities that do not measure autonomic variables may be utilized to avoid these pitfalls.
Polygraphy
Throughout history, humans have been interested in techniques and devices that can discern lies from the truth. Even in the ancient era, it was known that the act of lying had physiologic effects. In ancient Israel, if a woman accused of adultery should develop a swollen abdomen after drinking “waters of bitterness,” she was considered guilty of the crime, as described in Numbers 5:11-31. In Ancient China, those accused of fraud would be forced to hold dry rice in their mouths; if the expectorated rice was dry, the suspect was found guilty.1 We now know that catecholamines, particularly epinephrine, secreted during times of stress, cause relaxation of smooth muscle, leading to reduced bowel motility and dry mouth.2-4 However, most methods before the modern era were based more on superstition and chance rather than any sound physiologic premise.
When asked to discern the truth from falsehood based on their own perceptions, people correctly discern lies as false merely 47% of the time and truth as nondeceptive about 61% of the time.5 In short, unaided, we are very poor lie detectors. Therefore, a great deal of interest in technology that can aid in lie detection has ensued. With enhanced technology and understanding of human physiology came a renewed interest in lie detection. Since it was known that vital signs such as blood pressure (BP), heart rate, and breathing could be affected by the stressful situation brought on by deception, quantifying and measuring those responses in an effort to detect lying became a goal. In 1881, the Italian criminologist Cesare Lombroso invented a glove that when worn by a suspect, measured their BP.6-8 Changes in BP also were the target variable of the systolic BP deception test invented by William M. Marston, PhD, in 1915.8 Marston also experimented with measurements of other variables, such as muscle tension.9 In 1921, John Larson invented the first modern polygraph machine.7
Procedures
Today’s polygraph builds on these techniques. A standard polygraph measures respiration, heart rate, BP, and sudomotor function (sweating). Respiration is measured via strain gauges strapped around the chest and abdomen that respond to chest expansion during inhalation. BP and pulse can be measured through a variety of means, including finger pulse measurement or sphygmomanometer.8
Perspiration is measured by skin electrical conductance. Human sweat contains a variety of cations and anions—mostly sodium and chloride, but also potassium, bicarbonate, and lactate. The presence of these electrolytes alter electrical conduction at the skin surface when sweat is released.10
The exact questioning procedure used to perform a polygraph examination can vary. The Comparison Question Test is most commonly used. In this format, the interview consists of questions that are relevant to the investigation at hand, interspersed with control questions. The examiner compares the changes in vital signs and skin conduction to the baseline measurements generated during the pretest interview and during control questions.8 Using these standardized techniques, some studies have shown accuracy rates between 83% and 95% in controlled settings.8 However, studies performed outside of the polygraph community have found very high false positive rates, up to 50% or greater.11
The US Supreme Court has ruled that individual jurisdictions can decide whether or not to admit polygraph evidence in court, and the US Court of Appeals for the Eleventh Circuit has ruled that polygraph results are only admissible if both parties agree to it and are given sufficient notice.12,13 Currently, New Mexico is the only state that allows polygraph results to be used as evidence without a pretrial agreement; all other states either require such an agreement or forbid the results to be used as evidence.14
Although rarely used in federal and state courts as evidence, polygraphy is commonly used during investigations and in the hiring process of government agencies. DoD Directive 5210.48 and Instruction 5210.91 enable DoD investigative organizations (eg, Naval Criminal Investigative Service, National Security Agency, US Army Investigational Command) to use polygraph as an aid during investigations into suspected involvement with foreign intelligence, terrorism against the US, mishandling of classified documents, and other serious violations.15
The Role of the Physician in Polygraph Assessment
It may be rare that the physician is called upon to provide information regarding an individual’s medical condition or related medication use and the effect of these on polygraph results. In such cases, however, the physician must remember the primary fiduciary duty to the patient. Disclosure of medical conditions cannot be made without the patient’s consent, save in very specific situations (eg, Commanding Officer Inquiry, Tarasoff Duty to Protect, etc). It is the polygraph examiner’s responsibility to be aware of potential confounders in a particular examination.10
Physicians can have a responsibility when in administrative or supervisory positions, to advise security and other officials regarding the fitness for certain duties of candidates with whom there is no physician-patient relationship. This may include an individual’s ability to undergo polygraph examination and the validity of such results. However, when a physician-patient relationship is involved, care must be given to ensure that the patient understands that the relationship is protected both by professional standards and by law and that no information will be shared without the patient’s authorization (aside from those rare exceptions provided by law). Often, a straightforward explanation to the patient of the medical condition and any medication’s potential effects on polygraph results will be sufficient, allowing the patient to report as much as is deemed necessary to the polygraph examiner.
Polygraphy Pitfalls
Polygraphy presupposes that the subject will have a consistent and measurable physiologic response when he or she attempts to deceive the interviewer. The changes in BP, heart rate, respirations, and perspiration that are detected by polygraphy and interpreted by the examiner are controlled by the ANS (Table 1). There are a variety of diseases that are known to cause autonomic dysfunction (dysautonomia). Small fiber autonomic neuropathies often result in loss of sweating and altered heart rate and BP variation and can arise from many underlying conditions. Synucleinopathies, such as Parkinson disease, alter cardiovascular reflexes.14,16
Even diseases not commonly recognized as having a predominant clinical impact on ANS function can demonstrate measurable physiologic effect. For example, approximately 60% of patients with rheumatoid arthritis will have blunted cardiovagal baroreceptor responses and heart rate variability.17 ANS dysfunction is also a common sequela of alcoholism.18 Patients with diabetes mellitus often have an elevated resting heart rate and low heart rate variability due to dysregulated β-adrenergic activity.19 The impact of reduced baroreceptor response and reduced heart rate variability could impact the polygraph interpreter’s ability to discern responses using heart rate. Individuals with ANS dysfunction that causes blunted physiologic responses could have inconclusive or potentially worse false-negative polygraph results due to lack of variation between control and target questions.
To our knowledge, no study has been performed on the validity of polygraphy in patients with any form of dysautonomia. Additionally, a 2011 process and compliance study of the DoD polygraph program specifically recommended that “adjudicators would benefit from training in polygraph capabilities and limitations.”20 Although specific requirements vary from program to program, all programs accredited by the American Polygraph Association provide training in physiology, psychology, and standardization of test results.
Many commonly prescribed medications have effects on the ANS that could affect the results of a polygraph exam (Table 2). For example, β blockers reduce β adrenergic receptor activation in cardiac muscle and blood vessels, reducing heart rate, heart rate variability, cardiac contractility, and BP.21 This class of medication is prescribed for a variety of conditions, including congestive heart failure, hypertension, panic disorder, and posttraumatic stress disorder. Thus, a patient taking β blockers will have a blunted physiologic response to stress and have an increased likelihood of an inconclusive or false-negative polygraph exam.
Some over-the-counter medications also have effects on autonomic function. Sympathomimetics such as pseudoephedrine or antihistamines with anticholinergic activity like diphenhydramine can both increase heart rate and BP.22,23 Of the 10 most prescribed medications of 2016, 5 have direct effects on the ANS or the variables measured by the polygraph machine.24 An exhaustive list of medication effects on autonomic function is beyond the scope of this article.
A medication that may affect the results of a polygraph study that is of special interest to the DoD and military is mefloquine. Mefloquine is an antimalarial drug that has been used by military personnel deployed to malaria endemic regions.25 In murine models, mefloquine has been shown to disrupt autonomic and respiratory control in the central nervous system.26 The neuropsychiatric adverse effects of mefloquine are well documented and can last for years after exposure to the drug.27 Therefore, mefloquine could affect the results of a polygraph test through both direct toxic effects on the ANS as well as causing anxiety and depression, potentially affecting the subject’s response to questioning.
Alternative Modalities
Given the pitfalls inherent with external physiologic measures for lie detection, additional modalities that bypass measurement of ANS-governed responses have been sought. Indeed, the integration and combination of more comprehensive modalities has come to be named the forensic credibility assessment.
Functional MRI
Beginning in 1991, researchers began using fMRI to see real-time perfusion changes in areas of the cerebral cortex between times of rest and mental stimulation.26 This modality provides a noninvasive technique for viewing which specific parts of the brain are stimulated during activity. When someone is engaged in active deception, the dorsolateral prefrontal cortex has greater perfusion than when the patient is engaged in truth telling.28 Since fMRI involves imaging for evaluation of the central nervous system, it avoids the potential inaccuracies that can be seen in some subjects with autonomic irregularities. In fact, fMRI may have superior sensitivity and specificity for lie detection compared with that of conventional polygraphy.29
Significant limitations to the use of fMRI include the necessity of expensive specialized equipment and trained personnel to operate the MRI. Agencies that use polygraph examinations may be unwilling to make such an investment. Further, subjects with metallic foreign bodies or noncompatible medical implants cannot undergo the MRI procedure. Finally, there have been bioethical and legal concerns raised that measuring brain activity during interrogation may endanger “cognitive freedom” and may even be considered unreasonable search and seizure under the Fourth Amendment to the US Constitution.30 However, fMRI—like polygraphy—can only measure the difference between brain perfusion in 2 states. The idea of fMRI as “mind reading” is largely a misconception.31
Electroencephalography
Various EEG modalities have received increased interest for lie detection. In EEG, electrodes are used to measure the summation of a multitude of postsynaptic action potentials and the local voltage gradient they produce when cortical pyramidal neurons are fired in synchrony.32 These voltage gradients are detectable at the scalp surface. Shortly after the invention of EEG, it was observed that specific stimuli generated unique and predicable changes in EEG morphology. These event-related potentials (ERP) are detectable by scalp EEG shortly after the stimulus is given.33
ERPs can be elicited by a multitude of sensory stimuli, have a predictable and reproducible morphology, and are believed to be a psychophysiologic correlate of mental processing of stimuli.34 The P300 is an ERP characterized by a positive change in voltage occurring 300 milliseconds after a stimulus. It is associated with stimulus processing and categorization.35 Since deception is a complex cognitive process involving recognizing pertinent stimuli and inventing false responses to them, it was theorized that the detection of a P300 ERP during a patient interview would mean the patient truly recognizes the stimulus and is denying such knowledge. Early studies performed on P300 had variable accuracy for lie detection, roughly 40% to 80%, depending on the study. Thus, the rate of false negatives would increase if the subjects were coached on countermeasures, such as increasing the significance of distractor data or counting backward by 7s.36,37 Later studies have found ways of minimizing these issues, such as detection of a P900 ERP (a cortical potential at 900 milliseconds) that can be seen when subjects are attempting countermeasures.38
Another technique for increasing accuracy in EEG-mediated lie detection is measurement of multifaceted electroencephalographic response (MER), which involves a more detailed analysis of multiple EEG electrode sites and how the signaling changes over time using both visual comparison of multiple trials as well as bootstrap analysis.37 In particular, memory- and encoding-related multifaceted electroencephalographic response (MERMER) using P300 coupled with an electrically negative impulse recorded at the frontal lobe and phasic changes in the global EEG had superior accuracy than P300 alone.37
The benefits of EEG compared with that of fMRI include large reductions in cost, space, and restrictions for use in some individuals (EEG is safe for virtually all patients, including those with metallic foreign bodies). However, like fMRI, EEG still requires trained personnel to operate and interpret. Also, it has yet to be tested outside of the laboratory.
Conclusion
The ability to detect deception is an important factor in determining security risk and adjudication of legal proceedings, but untrained persons are surprisingly poor at discerning truth from lies. The polygraph has been used by law enforcement and government agencies for decades to aid in interrogation and the screening of employees for security clearances and other types of access. However, results are vulnerable to inaccuracies in subjects with autonomic disorders and may be confounded by multiple medications. While emerging technologies such as fMRI and EEG may allow superior accuracy by bypassing ANS-based physiologic outputs, the polygraph examiner and the physician must be aware of the effect of autonomic dysfunction and of the medications that affect the ANS. This is particularly true within military medicine, as many patients within this population are subject to polygraph examination.
1. Ford EB. Lie detection: historical, neuropsychiatric and legal dimensions. Int J Law Psychiatry. 2006;29(3):159-177.
2. Ohrn PG. Catecholamine infusion and gastrointestinal propulsion in the rat. Acta Chir Scand Suppl. 1979(461):43-52.
3. Sakamoto H. The study of catecholamine, acetylcholine and bradykinin in buccal circulation in dogs. Kurume Med J. 1979;26(2):153-162.
4. Bond CF Jr, Depaulo BM. Accuracy of deception judgments. Pers Soc Psychol Rev. 2006;10(3):214-234.
5. Vicianova M. Historical techniques of lie detection. Eur J sychology. 2015;11(3):522-534.
6. Matté JA. Forensic Psychophysiology Using the Polygraph: Scientific Truth Verification, Lie Detection. Williamsville, NY: JAM Publications; 2012.
7. Segrave K. Lie Detectors: A Social History. Jefferson, NC: McFarland & Company; 2004.
8. Nelson R. Scientific basis for polygraph testing. Polygraph. 2015;44(1):28-61.
9. Boucsein W. Electrodermal Activity. New York, NY: Springer Publishing; 2012.
10. US Congress, Office of Assessment and Technology. Scientific validity of polygraph testing: a research review and evaluation. https://ota.fas.org/reports/8320.pdf. Published 1983. Accessed June 12, 2019.
11. United States v Scheffer, 523 US 303 (1998).
12. United States v Piccinonna, 729 F Supp 1336 (SD Fl 1990).
13. Fridman DS, Janoe JS. The state of judicial gatekeeping in New Mexico. https://cyber.harvard.edu/daubert/nm.htm. Updated April 17, 1999. Accessed May 20, 2019.
14. Gibbons CH. Small fiber neuropathies. Continuum (Minneap Minn). 2014;20(5 Peripheral Nervous System Disorders):1398-1412.
15. US Department of Defense. Directive 5210.48: Credibility assessment (CA) program. https://fas.org/irp/doddir/dod/d5210_48.pdf. Updated February 12, 2018. Accessed May 30, 2019.
16. Postuma RB, Gagnon JF, Pelletier A, Montplaisir J. Prodromal autonomic symptoms and signs in Parkinson’s disease and dementia with Lewy bodies. Mov Disord. 2013;28(5):597-604.
17. Adlan AM, Lip GY, Paton JF, Kitas GD, Fisher JP. Autonomic function and rheumatoid arthritis: a systematic review. Semin Arthritis Rheum. 2014;44(3):283-304.
18. Di Ciaula A, Grattagliano I, Portincasa P. Chronic alcoholics retain dyspeptic symptoms, pan-enteric dysmotility, and autonomic neuropathy before and after abstinence. J Dig Dis. 2016;17(11):735-746.
19. Thaung HA, Baldi JC, Wang H, et al. Increased efferent cardiac sympathetic nerve activity and defective intrinsic heart rate regulation in type 2 diabetes. Diabetes. 2015;64(8):2944-2956.
20. US Department of Defense, Office of the Undersecretary of Defense for Intelligence. Department of Defense polygraph program process and compliance study: study report. https://fas.org/sgp/othergov/polygraph/dod-poly.pdf. Published December 19, 2011. Accessed May 20, 2019.
21. Ladage D, Schwinger RH, Brixius K. Cardio-selective beta-blocker: pharmacological evidence and their influence on exercise capacity. Cardiovasc Ther. 2013;31(2):76-83.
22. D’Souza RS, Mercogliano C, Ojukwu E, et al. Effects of prophylactic anticholinergic medications to decrease extrapyramidal side effects in patients taking acute antiemetic drugs: a systematic review and meta-analysis Emerg Med J. 2018;35:325-331.
23. Gheorghiev MD, Hosseini F, Moran J, Cooper CE. Effects of pseudoephedrine on parameters affecting exercise performance: a meta-analysis. Sports Med Open. 2018;4(1):44.
24. Frellick M. Top-selling, top-prescribed drugs for 2016. https://www.medscape.com/viewarticle/886404. Published October 2, 2017. Accessed May 20, 2019.
25. Lall DM, Dutschmann M, Deuchars J, Deuchars S. The anti-malarial drug mefloquine disrupts central autonomic and respiratory control in the working heart brainstem preparation of the rat. J Biomed Sci. 2012;19:103.
26. Ritchie EC, Block J, Nevin RL. Psychiatric side effects of mefloquine: applications to forensic psychiatry. J Am Acad Psychiatry Law. 2013;41(2):224-235.
27. Belliveau JW, Kennedy DN Jr, McKinstry RC, et al. Functional mapping of the human visual cortex by magnetic resonance imaging. Science. 1991;254(5032):716-719.
28. Ito A, Abe N, Fujii T, et al. The contribution of the dorsolateral prefrontal cortex to the preparation for deception and truth-telling. Brain Res. 2012;1464:43-52.
29. Langleben DD, Hakun JG, Seelig D. Polygraphy and functional magnetic resonance imaging in lie detection: a controlled blind comparison using the concealed information test. J Clin Psychiatry. 2016;77(10):1372-1380.
30. Boire RG. Searching the brain: the Fourth Amendment implications of brain-based deception detection devices. Am J Bioeth. 2005;5(2):62-63; discussion W5.
31. Langleben DD. Detection of deception with fMRI: Are we there yet? Legal Criminological Psychol. 2008;13(1):1-9.
32. Marcuse LV, Fields MC, Yoo J. Rowans Primer of EEG. 2nd ed. Edinburgh, Scotland, United Kingdom: Elsevier; 2016.
33. Farwell LA, Donchin E. The truth will out: interrogative polygraphy (“lie detection”) with event-related brain potentials. Psychophysiology. 1991;28(5):531-547.
34. Sur S, Sinha VK. Event-related potential: an overview. Ind Psychiatry J. 2009;18(1):70-73.
35. Polich J. Updating P300: an integrative theory of P3a and P3b. Clinical Neurophysiol. 2007;118(10):2128-2148.
36. Mertens R, Allen, JJB. The role of psychophysiology in forensic assessments: Deception detection, ERPs, and virtual reality mock crime scenarios. Psychophysiology. 2008;45(2):286-298.
37. Rosenfeld JP, Labkovsky E. New P300-based protocol to detect concealed information: resistance to mental countermeasures against only half the irrelevant stimuli and a possible ERP indicator of countermeasures. Psychophysiology. 2010;47(6):1002-1010.
38. Farwell LA, Smith SS. Using brain MERMER testing to detect knowledge despite efforts to conceal. J Forensic Sci. 2001;46(1):135-143.
Enoxaparin vs Continuous Heparin for Periprocedural Bridging in Patients With Atrial Fibrillation and Advanced Chronic Kidney Disease
There has been a long-standing controversy in the use of parenteral anticoagulation for perioperative bridging in patients with atrial fibrillation (AF) pursuing elective surgery.1 The decision to bridge is dependent on the patient’s risk of thromboembolic complications and susceptibility to bleed.1 The BRIDGE trial showed noninferiority in rate of stroke and embolism events between low molecular weight heparins (LMWHs) and no perioperative bridging.2 However, according to the American College of Chest Physicians (CHEST) 2012 guidelines, patients in the BRIDGE trial would be deemed low risk for thromboembolic events displayed by a mean CHADS2 (congestive heart failure [CHF], hypertension, age, diabetes mellitus, and stroke/transient ischemic attack) score of 2.3. Also, the BRIDGE study and many others excluded patients with advanced forms of chronic kidney disease (CKD).2,3
Similar to patients with AF, patients with advanced CKD (ACKD, stage 4 and 5 CKD) have an increased risk of stroke and venous thromboembolism (VTE).4,5 Patients with AF and ACKD have not been adequately studied for perioperative anticoagulation bridging outcomes. Although unfractionated heparin (UFH) is preferred over LMWH in ACKD patients,enoxaparin can be used in this population.1,6 Enoxaparin 1 mg/kg once daily is approved by the US Food and Drug Administration (FDA) for use in patients with severe renal insufficiency defined as creatinine clearance (CrCl) < 30 mL/min. This dosage adjustment is subsequent to studies with enoxaparin 1 mg/kg twice daily that showed a significant increase in major and minor bleeding in severe renal-insufficient patients with CrCl < 30 mL/min vs patients with CrCl > 30 mL/min.7 When comparing the myocardial infarction (MI) outcomes of severe renal-insufficient patients in the ExTRACT-TIMI 25 trial, enoxaparin 1 mg/kg once daily had no significant difference in nonfatal major bleeding vs UFH.8 In patients without renal impairment (no documentation of kidney disease), bridging therapy with LMWH was completed more than UFH in < 24 hours of hospital stay and with similar rates of VTEs and major bleeding.9 In addition to its ability to be administered outpatient, enoxaparin has a more predictable pharmacokinetic profile, allowing for less monitoring and a lower incidence of heparin-induced thrombocytopenia (HIT) vs that of UFH.6
The Michael E. DeBakey Veteran Affairs Medical Center (MEDVAMC) in Houston, Texas, is one of the largest US Department of Veterans Affairs (VA) hospitals in the US, managing > 150,000 veterans in Southeast Texas and other southern states. As a referral center for traveling patients, it is crucial that MEDVAMC decrease hospital length of stay (LOS) to increase space for incoming patients. Reducing LOS also reduces costs and may have a correlation with decreasing the incidence of nosocomial infections. Because of its significance to this facility, hospital LOS is an appropriate primary outcome for this study.
To our knowledge, bridging outcomes between LMWH and UFH in patients with AF and ACKD have never been studied. We hypothesized that using enoxaparin instead of heparin for periprocedural management would result in decreased hospital LOS, leading to a lower economic burden and lower incidence of nosocomial infections with no significant differences in major and minor bleeding and thromboembolic complications.10
Methods
This study was a single-center, retrospective chart review of adult patients from January 2008 to September 2017. The review was conducted at MEDVAMC and was approved by the research and development committee and by the Baylor College of Medicine Institutional Review Board. Formal consent was not required.
Included patients were aged ≥ 18 years with diagnoses of AF or atrial flutter and ACKD as recognized by a glomerular filtration rate (eGFR) of < 30 mL/min/1.73 m2 as calculated by use of the Modification of Diet in Renal Disease Study (MDRD) equation.11 Patients must have previously been on warfarin and required temporary interruption of warfarin for an elective procedure. During the interruption of warfarin therapy, a requirement was set for patients to be on periprocedural anticoagulation with subcutaneous (SC) enoxaparin 1 mg/kg daily or continuous IV heparin per MEDVAMC heparin protocol. Patients were excluded if they had experienced major bleeding in the 6 weeks prior to the elective procedure, had current thrombocytopenia (platelet count < 100 × 109/L), or had a history of heparin-induced thrombocytopenia (HIT) or a heparin allergy.
This patient population was identified using TheraDoc Clinical Surveillance Software System (Charlotte, NC), which has prebuilt alert reviews for anticoagulation medications, including enoxaparin and heparin. An alert for patients on enoxaparin with serum creatinine (SCr) > 1.5 mg/dL was used to screen patients who met the inclusion criteria. A second alert identified patients on heparin. The VA Computerized Patient Record System (CPRS) was used to collect patient data.
Economic Analysis
An economic analysis was conducted using data from the VA Managerial Cost Accounting Reports. Data on the national average cost per bed day was used for the purpose of extrapolating this information to multiple VA institutions.12 National average cost per day was determined by dividing the total cost by the number of bed days for the identified treating specialty during the fiscal period of 2018. Average cost per day data included costs for bed day, surgery, radiology services, laboratory tests, pharmacy services, treatment location (ie, intensive care units [ICUs]) and all other costs associated with an inpatient stay. A cost analysis was performed using this average cost per bed day and the mean LOS between enoxaparin and UFH for each treating specialty. The major outcome of the cost analysis was the total cost per average inpatient stay. The national average cost per bed day for each treating specialty was multiplied by the average LOS found for each treating specialty in this study; the sum of all the average costs per inpatient stay for the treating specialties resulted in the total cost per average inpatient stay. Permission to use these data was granted by the Pharmacy and Critical Care Services at MEDVAMC.
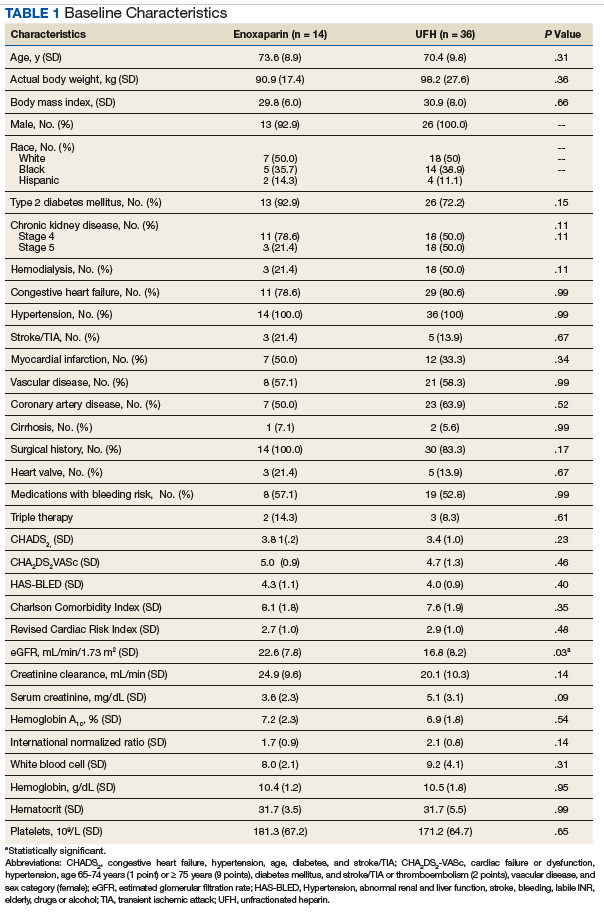
Patient Demographics and Characteristics
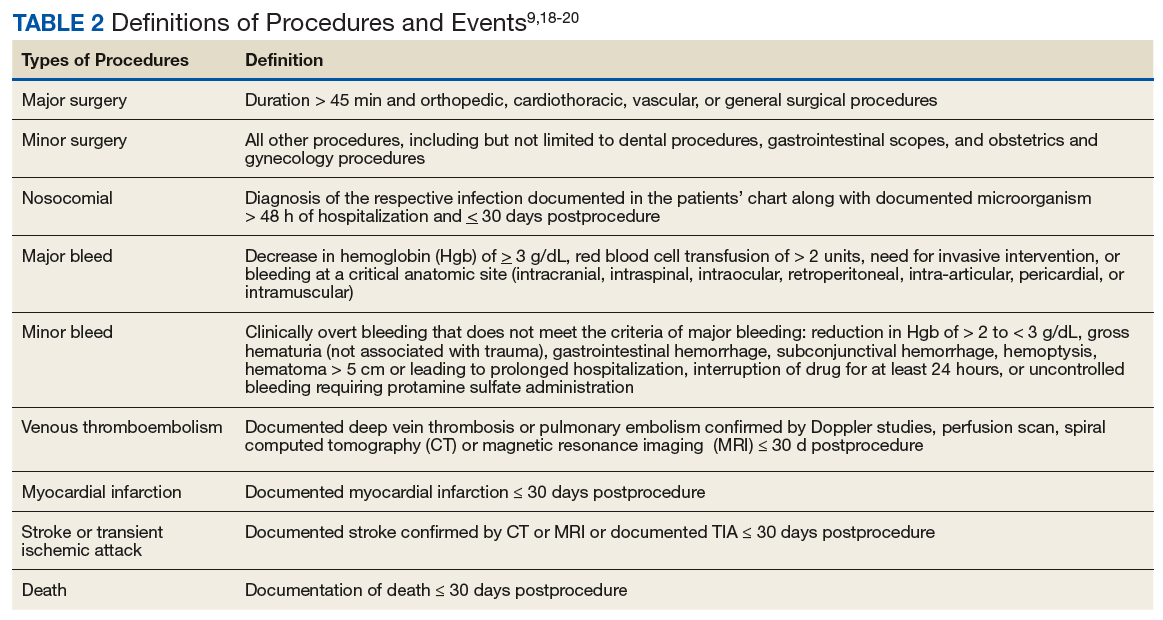
Data were collected on patient demographics (Table 1). Nosocomial infections, stroke/transient ischemic attack, MI, VTE, major and minor bleeding, and death are defined in Table 2.
The primary outcome of the study was hospital LOS. The study was powered at 90% for α = .05, which gives a required study population of 114 (1:1 enrollment ratio) patients to determine a statistically significant difference in hospital stay. This sample size was calculated using the mean hospital LOS (the primary objective) in the REGIMEN registry for LMWH (4.6 days) and UFH (10.3 days).9 To our knowledge, the incidence of nosocomial infections (a secondary outcome) has not been studied in this patient population; therefore, there was no basis to assess an appropriate sample size to find a difference in this outcome. Furthermore, the goal was to collect as many patients as possible to best assess this variable. Because of an expected high exclusion rate, 504 patients were reviewed to target a sample size of 120 patients. Due to the single-center nature of this review, the secondary outcomes of thromboembolic complications and major and minor bleeding were expected to be underpowered.
The final analysis compared the enoxaparin arm with the UFH arm. Univariate differences between the treatment groups were compared using the Fisher exact test for categorical variables. Demographic data and other continuous variables were analyzed by an unpaired t test to compare means between the 2 arms. Outcomes and characteristics were deemed statistically significant when α (P value) was < .05. All P values reported were 2-tailed with a 95% CI. No statistical analysis was performed for the cost differences (based on LOS per treating specialty) in the 2 treatment arms. Statistical analyses were completed by utilizing GraphPad Software (San Diego, CA).
Results
In total, 50 patients were analyzed in the study. There were 36 patients bridged with IV UFH at a concentration of 25,000 U/250 mL with an initial infusion rate of 12 U/kg/h. For the other arm, 14 patients were anticoagulated with renally dosed enoxaparin 1 mg/kg/d with an average daily dose of 89.3 mg; the mean actual body weight in this group was 90.9 mg (correlates with enoxaparin daily dose). Physicians of the primary team decided which parenteral anticoagulant to use. The difference in mean duration of inpatient parental anticoagulation between both groups was not statistically significant: enoxaparin at 7.1 days and UFH at 9.6 days (P = .19). Patients in the enoxaparin arm were off warfarin therapy for an average of 6.0 days vs 7.5 days for the UFH group (P = .29). The duration of outpatient anticoagulation with enoxaparin was not analyzed in this study.
Patient and Procedure Characteristics
All patients had AF or atrial flutter with 86% of patients (n = 43) having a CHADS2 > 2 and 48% (n = 29) having a CHA2DS2VASc > 4. Overall, the mean age was 71.3 years with similarities in ethnicity distribution. Patients had multiple comorbidities as shown by a mean Charlson Comorbidity Index (CCI) of 7.7 and an increased risk of bleeding as evidenced by 98% (n = 48) of patients having a HAS-BLED score of ≥ 3. A greater percentage of patients bridged with enoxaparin had DM, history of stroke and MI, and a heart valve, whereas UFH patients were more likely to be in stage 5 CKD (eGFR < 15 mL/min/1.73m2) with a significantly lower mean eGFR (16.76 vs 22.64, P = .03). Furthermore, there were more patients on hemodialysis in the UFH (50%) arm vs enoxaparin (21%) arm and a lower mean CrCl with UFH (20.1 mL/min) compared with enoxaparin (24.9 mL/min); however, the differences in hemodialysis and mean CrCl were not statistically significant. There were no patients on peritoneal dialysis in this review.
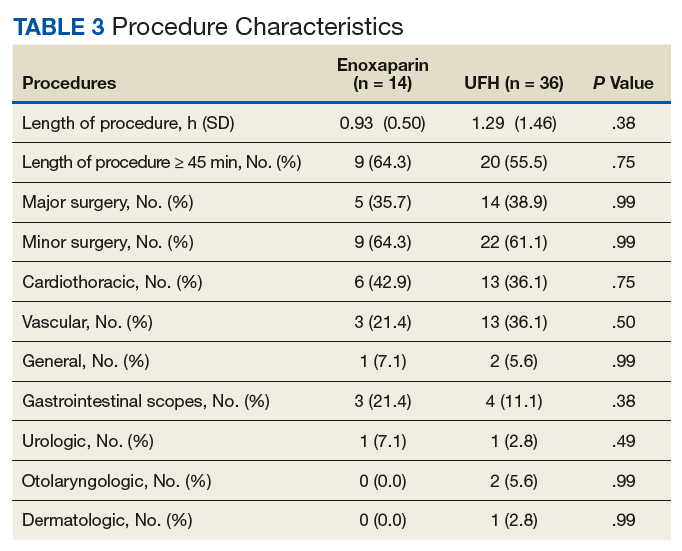
Procedure Characteristics
The average Revised Cardiac Risk Index (RCRI) score was about 3, indicating that these patients were at a Class IV risk (11%) of having a perioperative cardiac event (Table 3). Nineteen patients (38%) elected for a major surgery with all but 1 of the surgeries (major or minor) being invasive. The average length of surgery was 1.2 hours, and patients were more likely to undergo cardiothoracic procedures (38%). There were 2 out of 14 (14%) patients on enoxaparin who were able to have surgery as an outpatient; whereas this did not occur in patients on UFH. The procedures completed for these patients were a colostomy (minor surgery) and arteriovenous graft repair (major surgery). There were no statistically significant differences regarding types of procedures between the 2 arms.
Outcomes
The primary outcome of this study, hospital LOS, differed significantly in the enoxaparin arm vs UFH: 10.2 days vs 17.5 days, P = .04 (Table 4). The time-to-discharge from initiation of parenteral anticoagulation was significantly reduced with enoxaparin (7.1 days) compared with UFH (11.9 days); P = .04. Although also reduced in the enoxaparin arm, ICU LOS did not show statistical significance (1.1 days vs 4.0 days, P = .09).
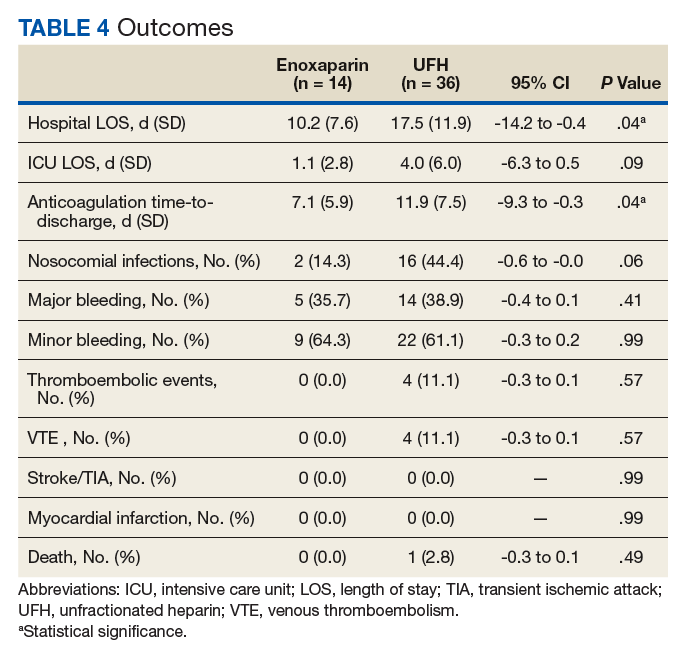
About 36% (n = 18) of patients in this study acquired an infection during hospitalization for elective surgery. The most common microorganism and site of infection were Enterococcus species and urinary tract, respectively (Table 5). Nearly half (44%, n = 16) of the patients in the UFH group had a nosocomial infection vs 14% (n = 2) of enoxaparin-bridged patients with a difference approaching significance; P = .056. Both patients in the enoxaparin group had the urinary tract as the primary source of infection; 1 of these patients had a urologic procedure.
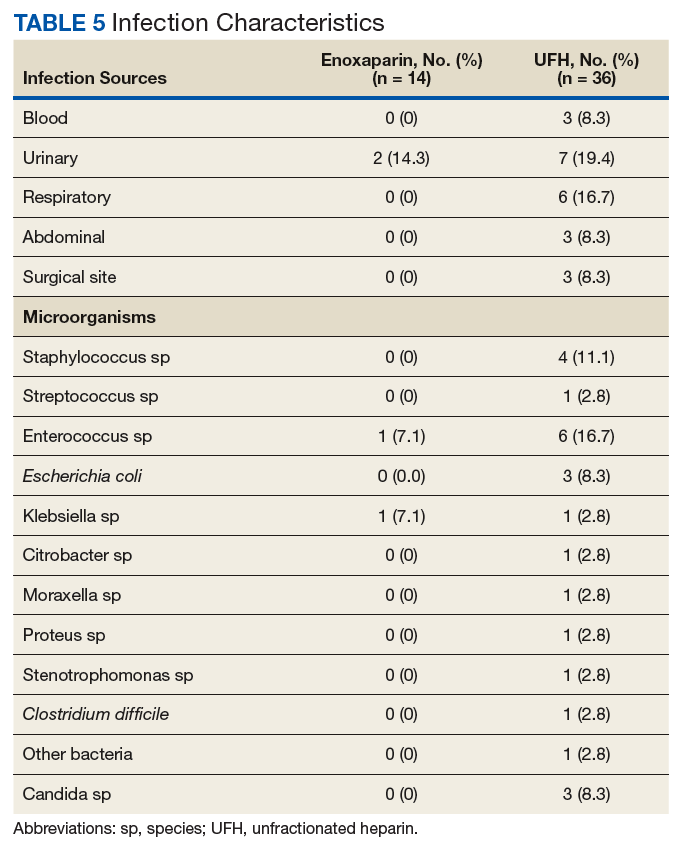
Major bleeding occurred in 7% (n = 1) of enoxaparin patients vs 22% (n = 8) in the UFH arm, but this was not found to be statistically significant (P = .41). Minor bleeding was similar between enoxaparin and UFH arms (14% vs 19%, P = .99). Regarding thromboembolic complications, the enoxaparin group (0%) had a numerical reduction compared to UFH (11%) with VTE (n = 4) being the only occurrence of the composite outcome (P = .57). There were 4 deaths within 30 days posthospitalization—all were from the UFH group (P = .57). Due to the small sample size of this study, these outcomes (bleeding and thrombotic events) were not powered to detect a statistically significant difference.
Economic Analysis
The average cost differences (Table 6) of hospitalization between enoxaparin and UFH were calculated using the average LOS per treating specialty multiplied by the national average cost of the MCO for an inpatient bed day in 2018.12 The treating specialty with the longest average LOS in the enoxaparin arm was thoracic (4.7 days). The UFH arm also had a large LOS (average days) for the thoracic specialty (6.4 days); however, the vascular specialty (6.7 days) had the longest average LOS in this group. Due to a mean LOS of 10.2 days in the enoxaparin arm, which was further stratified by treating specialty, the total cost per average inpatient stay was calculated as $51,710. On the other hand, patients in the UFH arm had a total cost per average inpatient stay of $92,848.
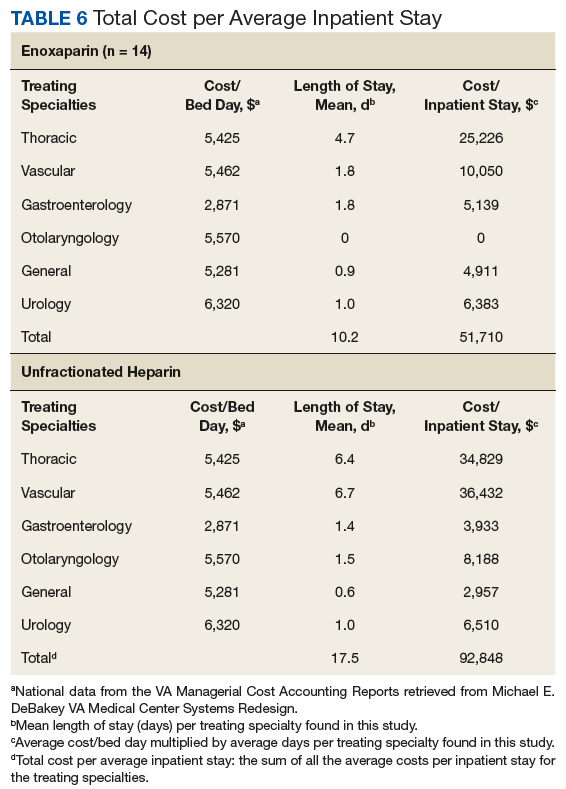
Monitoring
Anti-factor Xa levels for LMWH monitoring were not analyzed in this study due to a lack of values collected; only 1 patient had an anti-factor Xa level checked during this time frame. Infusion rates of UFH were adjusted based on aPTT levels collected per MEDVAMC inpatient anticoagulation protocol. The average percentage of aPTT in therapeutic range was 46.3% and the mean time-to-therapeutic range (SD) was about 2.4 (1.3) days. Due to this study’s retrospective nature, there were inconsistencies with availability of documentation of UFH infusion rates. For this reason, these values were not analyzed further.
Discussion
In 2017, the American College of Cardiology published the Periprocedural Anticoagulation Expert Consensus Pathway, which recommends for patients with AF at low risk (CHA2DS2VASc 1-4) of thromboembolism to not be bridged (unless patient had a prior VTE or stroke/TIA).13 Nearly half the patients in this study, were classified as moderate-to-high thrombotic risk as evidenced by a CHA2DS2VASc > 4 with a mean score of 4.8. Due to this study’s retrospective design from 2008 to 2017, many of the clinicians may have referenced the 2008 CHEST antithrombotic guidelines when making the decision to bridge patients; these guidelines and the previous MEDVAMC anticoagulation protocol recommend bridging patients with AF with CHADS2 > 2 (moderate-to-high thrombotic risk) in which all but 1 of the patients in this study met criteria.1,14 In contrast to the landmark BRIDGE trial, the mean CHADS2 score in this study was 3.6; this is an indication that our patient population was of individuals at an increased risk of stroke and embolism.
In addition to thromboembolic complications, patients in the current study also were at increased risk of clinically relevant bleeding with a mean HAS-BLED score of 4.1 and nearly all patients having a score > 3. The complexity of the veteran population also was displayed by this study’s mean CCI (7.7) and RCRI (3.0) indicating a 0% estimated 10-year survival and a 11% increase in having a perioperative cardiac event, respectively. A mean CCI of 7.7 is associated with a 13.3 relative risk of death within 6 years postoperation.15 All patients had a diagnosis of hypertension, and > 75% had this diagnosis complicated by DM. In addition, this patient population was of those with extensive cardiovascular disease or increased risk, which makes for a clinically relevant application of patients who would require periprocedural bridging.
Another positive aspect of this study is that all the baseline characteristics, apart from renal function, were similar between arms, helping to strengthen the ability to adequately compare the 2 bridging modalities. Our assumption for the reasoning that more stage 5 CKD and dialysis patients were anticoagulated with UFH vs enoxaparin is a result of concern for an increased risk of bleeding with a medication that is renally cleared 30% less in CrCl < 30 mL/min.16 Although, enoxaparin 1 mg/kg/d is FDA approved as a therapeutic anticoagulant option, clinicians at MEDVAMC likely had reservations about its use in end-stage CKD patients. Unlike many studies, including the BRIDGE trial, patients with ACKD were not excluded from this trial, and the outcomes with enoxaparin are available for interpretation.
To no surprise, for patients included in this study, enoxaparin use led to shorter hospital LOS, reduced ICU LOS, and a quicker time-to-discharge from initiation. This is credited to the 100% bioavailability of SC enoxaparin in conjunction with its means to be a therapeutic option as an outpatient.16 Unlike IV UFH, patients requiring bridging can be discharged on SC injections of enoxaparin until a therapeutic INR is maintained with warfarin.The duration of hospital LOS in both arms were longer in this study compared with that of other studies.9 This may be due to clinicians being more cautious with renal insufficient patients, and the patients included in this study had multiple comorbidities. According to an economic analysis performed by Amorosi and colleagues in 2004, bridging with enoxaparin instead of UFH can save up to $3,733 per patient and reduce bridging costs by 63% to 85% driven primarily by decreased hospital LOS.10
Economic Outcome
In our study, we conducted a cost analysis using national VA data that indicated a $41,138 or 44% reduction in total cost per average inpatient stay when bridging 1 patient with enoxaparin vs UFH. The benefit of this cost analysis is that it reflects direct costs at VA institutions nationally; this will allow these data to be useful for practitioners at MEDVAMC and other VA hospitals. Stratifying the costs by treating specialty instead of treatment location minimized skewing of the data as there were some patients with long LOS in the ICU. No patients in the enoxaparin arm were treated in otolaryngology, which may have skewed the data. The data included direct costs for beds as well as costs for multiple services, such as procedures, pharmacy, nursing, laboratory tests, and imaging. Unlike the Amorosi study, our review did not include acquisition costs for enoxaparin syringes and bags of UFH or laboratory costs for aPTT and anti-factor Xa levels in part because of the data source and the difficulty calculating costs over a 10-year span.
Patients in the enoxaparin arm had a trend toward fewer occurrences of hospital-acquired infections than did those in the UFH arm, which we believe is due to a decreased LOS (in both total hospital and ICU days) and fewer blood draws needed for monitoring. This also may be attributed to a longer mean duration of surgery in the UFH arm (1.3 hours) vs enoxaparin (0.9 hours). The percentage of patients with procedures ≥ 45 minutes and the types of procedures between both arms were similar. However, these outcomes were not statistically significant. In addition, elderly males who are hospitalized may require a catheter (due to urinary retention), and catheter-associated urinary tract infection (CAUTI) is one of the highest reported infections in acute care hospitals in the US. This is in line with our patient population and may be a supplementary reason for the increase in infection incidence with UFH. Though, whether urinary catheters were used in these patients was not evaluated in this study.
Despite being at an increased risk of experiencing a major adverse cardiovascular event (MACE), no patients in either arm had a stroke/TIA or MI within 30 days postprocedure. The only occurrences documented were VTEs, which happened only in 4 patients on UFH. Four people died in this study, solely in the UFH arm. The incidence of thromboembolic complications and death along with major and minor bleeding cannot be deduced as meaningful as this study was underpowered for these outcomes. Despite anti-factor Xa monitoring being recommended in ACKD patients on enoxaparin, this monitoring was not routinely performed in this study. Another limitation was the inability to adequately assess the appropriateness of nurse-adjusted UFH infusion rates largely due to the retrospective nature of this study. The variability of aPTT percentage in therapeutic range and time-to-therapeutic range reported was indicative of the difficulties of monitoring for the safety and efficacy of UFH.
In 1991, Cruickshank and colleagues conducted a study in which a standard nomogram (similar to the MEDVAMC nomogram) for the adjustment of IV heparin was implemented at a single hospital.17 The success rate (aPTT percentage in therapeutic range) was 59.4% and average time-to-therapeutic range was about 1 day. The success rate (46.3%) and time-to-therapeutic range (2.4 days) in our study were lower and longer, respectively, than was expected. One potential reason for this discrepancy could be the differences in indication as the patients in Cruickshank and colleagues were being treated for VTE, whereas patients in our study had AF or atrial flutter. Also, there were inconsistencies in the availability of documentation of monitoring parameters for heparin due to the study time frame and retrospective design. Patients on UFH who are not within the therapeutic range in a timely manner are at greater risk of MACE and major/minor bleeding. Our study was not powered to detect these findings.
Strengths and Limitations
A significant limitation of this study was its small sample size; the study was not able to meet power for the primary outcome; it is unknown whether our study met power for nosocomial infections. The study also was not a powered review of other adverse events, such as thromboembolic complications, bleeding, and death. The study had an uneven number of patients, which made it more difficult to appropriately compare 2 patient populations; the study also did not include medians for patient characteristics and outcomes.
Due to this study’s time frame, the clinical pharmacy services at MEDVAMC were not as robust as they are now, which is the reason the decisions on which anticoagulant to use were primarily physician based. The use of TheraDoc to identify patients posed the risk of missing patients who may not have had the appropriate laboratory tests performed (ie, SCr). Patients on UFH had a reduced eGFR compared with that of enoxaparin, which may limit our extrapolation of enoxaparin’s use in end-stage renal disease. The reduced eGFR and higher number of dialysis patients in the UFH arm may have increased the occurrence of more labile INRs and bleeding outcomes. Patients on hemodialysis typically have more comorbidities and an increased risk of infection due to the frequent use of catheters and needles to access the bloodstream. In addition, the potential differences in catheter use and duration between groups were not identified. If these parameters were studied, the data collected may have helped better explain the reasoning for increased incidence of infection in the UFH arm.
Strengths of this study include a complex patient population with similar characteristics, distribution of ethnicities representative of the US population, patients at moderate-to-high thrombotic risk, the analysis of nosocomial infections, and the exclusion of patients with normal renal function or moderate CKD.
Conclusion
To our knowledge, this is the first study to compare periprocedural bridging outcomes and incidence of nosocomial infections in patients with AF and ACKD. This review provides new evidence that in this patient population, enoxaparin is a potential anticoagulant to reduce hospital LOS and hospital-acquired infections. Compared with UFH, bridging with enoxaparin reduced hospital LOS and anticoagulation time-to-discharge by 7 and 5 days, respectively, and decreased the incidence of nosocomial infections by 30%. Using the mean LOS per treating specialty for both arms, bridging 1 patient with AF with enoxaparin vs UFH can potentially lead to an estimated $40,000 (44%) reduction in total cost of hospitalization. Enoxaparin also had no numeric differences in mortality and adverse events (stroke/TIA, MI, VTE) vs that of UFH, but it is important to note that this study was not powered to find a significant difference in these outcomes. Due to the mean eGFR of patients on enoxaparin being 22.6 mL/min/1.73 m2 and only 1 in 5 having stage 5 CKD, at this time, we do not recommend enoxaparin for periprocedural use in stage 5 CKD or in patients on hemodialysis. Larger studies are needed, including randomized trials, in this patient population to further evaluate these outcomes and assess the use of enoxaparin in patients with ACKD.
1. Douketis JD, Spyropoulos AC, Spencer FA, et al. Perioperative management of antithrombotic therapy: Antithrombotic Therapy and Prevention of Thrombosis, 9th ed: American College of Chest Physicians Evidence-Based Clinical Practice Guidelines. Chest. 2012;141(2)(suppl):e326S-350S.
2. Douketis JD, Spyropoulos AC, Kaatz S, et al; BRIDGE Investigators. Perioperative bridging anticoagulation in patients with atrial fibrillation. N Engl J Med. 2015;373(9):823-833.
3. Hammerstingl C, Schmitz A, Fimmers R, Omran H. Bridging of chronic oral anticoagulation with enoxaparin in patients with atrial fibrillation: results from the prospective BRAVE registry. Cardiovasc Ther. 2009;27(4):230-238.
4. Dad T, Weiner DE. Stroke and chronic kidney disease: epidemiology, pathogenesis, and management across kidney disease stages. Semin Nephrol. 2015;35(4):311-322.
5. Wattanakit K, Cushman M. Chronic kidney disease and venous thromboembolism: epidemiology and mechanisms. Curr Opin Pulm Med. 2009;15(5):408-412.
6. Saltiel M. Dosing low molecular weight heparins in kidney disease. J Pharm Pract. 2010;23(3):205-209.
7. Spinler SA, Inverso SM, Cohen M, Goodman SG, Stringer KA, Antman EM; ESSENCE and TIMI 11B Investigators. Safety and efficacy of unfractionated heparin versus enoxaparin in patients who are obese and patients with severe renal impairment: analysis from the ESSENCE and TIMI 11B studies. Am Heart J. 2003;146(1):33-41.
8. Fox KA, Antman EM, Montalescot G, et al. The impact of renal dysfunction on outcomes in the ExTRACT-TIMI 25 trial. J Am Coll Cardiol. 2007;49(23):2249-2255.
9. Spyropoulos AC, Turpie AG, Dunn AS, et al; REGIMEN Investigators. Clinical outcomes with unfractionated heparin or low-molecular-weight heparin as bridging therapy in patients on long-term oral anticoagulants: the REGIMEN registry. J Thromb Haemost. 2006;4(6):1246-1252.
10. Amorosi SL, Tsilimingras K, Thompson D, Fanikos J, Weinstein MC, Goldhaber SZ. Cost analysis of “bridging therapy” with low-molecular-weight heparin versus unfractionated heparin during temporary interruption of chronic anticoagulation. Am J Cardiol. 2004;93(4):509-511.
11. Inker LA, Astor BC, Fox CH, et al. KDOQI US commentary on the 2012 KDIGO clinical practice guideline for the evaluation and management of CKD. Am J Kidney Dis. 2014;63(5):713-735.
12. US Department of Veteran Affairs. Managerial Cost Accounting Financial User Support Reports: fiscal year 2018. https://www.herc.research.va.gov/include/page.asp?id=managerial-cost-accounting. [Source not verified.]
13. Doherty JU, Gluckman TJ, Hucker WJ, et al. 2017 ACC Expert Consensus Decision Pathway for Periprocedural Management of Anticoagulation in Patients With Nonvalvular Atrial Fibrillation: a report of the American College of Cardiology Clinical Expert Consensus Document Task Force. J Am Coll Cardiol. 2017;69(7):871-898.
14. Kearon C, Kahn SR, Agnelli G, et al. Antithrombotic therapy for venous thromboembolic disease: American College of Chest Physicians Evidence-Based Clinical Practice Guidelines (8th Edition). Chest. 2008;133(6 suppl):454S-545S.
15. Charlson M, Szatrowski TP, Peterson J, Gold J. Validation of a combined comorbidity index. J Clin Epidemiol. 1994;47(11):1245-1251.
16. Lovenox [package insert]. Bridgewater, NJ: Sanofi-Aventis; December 2017.
17. Cruickshank MK, Levine MN, Hirsh J, Roberts R, Siguenza M. A standard heparin nomogram for the management of heparin therapy. Arch Intern Med. 1991;151(2):333-337.
18. Steinberg BA, Peterson ED, Kim S, et al; Outcomes Registry for Better Informed Treatment of Atrial Fibrillation Investigators and Patients. Use and outcomes associated with bridging during anticoagulation interruptions in patients with atrial fibrillation: findings from the Outcomes Registry for Better Informed Treatment of Atrial Fibrillation (ORBIT-AF). Circulation. 2015;131(5):488-494.
19. Verheugt FW, Steinhubl SR, Hamon M, et al. Incidence, prognostic impact, and influence of antithrombotic therapy on access and nonaccess site bleeding in percutaneous coronary intervention. JACC Cardiovasc Interv. 2011;4(2):191-197.
20. Bijsterveld NR, Peters RJ, Murphy SA, Bernink PJ, Tijssen JG, Cohen M. Recurrent cardiac ischemic events early after discontinuation of short-term heparin treatment in acute coronary syndromes: results from the Thrombolysis in Myocardial Infarction (TIMI) 11B and Efficacy and Safety of Subcutaneous Enoxaparin in Non-Q-Wave Coronary Events (ESSENCE) studies. J Am Coll Cardiol. 2003;42(12):2083-2089.
There has been a long-standing controversy in the use of parenteral anticoagulation for perioperative bridging in patients with atrial fibrillation (AF) pursuing elective surgery.1 The decision to bridge is dependent on the patient’s risk of thromboembolic complications and susceptibility to bleed.1 The BRIDGE trial showed noninferiority in rate of stroke and embolism events between low molecular weight heparins (LMWHs) and no perioperative bridging.2 However, according to the American College of Chest Physicians (CHEST) 2012 guidelines, patients in the BRIDGE trial would be deemed low risk for thromboembolic events displayed by a mean CHADS2 (congestive heart failure [CHF], hypertension, age, diabetes mellitus, and stroke/transient ischemic attack) score of 2.3. Also, the BRIDGE study and many others excluded patients with advanced forms of chronic kidney disease (CKD).2,3
Similar to patients with AF, patients with advanced CKD (ACKD, stage 4 and 5 CKD) have an increased risk of stroke and venous thromboembolism (VTE).4,5 Patients with AF and ACKD have not been adequately studied for perioperative anticoagulation bridging outcomes. Although unfractionated heparin (UFH) is preferred over LMWH in ACKD patients,enoxaparin can be used in this population.1,6 Enoxaparin 1 mg/kg once daily is approved by the US Food and Drug Administration (FDA) for use in patients with severe renal insufficiency defined as creatinine clearance (CrCl) < 30 mL/min. This dosage adjustment is subsequent to studies with enoxaparin 1 mg/kg twice daily that showed a significant increase in major and minor bleeding in severe renal-insufficient patients with CrCl < 30 mL/min vs patients with CrCl > 30 mL/min.7 When comparing the myocardial infarction (MI) outcomes of severe renal-insufficient patients in the ExTRACT-TIMI 25 trial, enoxaparin 1 mg/kg once daily had no significant difference in nonfatal major bleeding vs UFH.8 In patients without renal impairment (no documentation of kidney disease), bridging therapy with LMWH was completed more than UFH in < 24 hours of hospital stay and with similar rates of VTEs and major bleeding.9 In addition to its ability to be administered outpatient, enoxaparin has a more predictable pharmacokinetic profile, allowing for less monitoring and a lower incidence of heparin-induced thrombocytopenia (HIT) vs that of UFH.6
The Michael E. DeBakey Veteran Affairs Medical Center (MEDVAMC) in Houston, Texas, is one of the largest US Department of Veterans Affairs (VA) hospitals in the US, managing > 150,000 veterans in Southeast Texas and other southern states. As a referral center for traveling patients, it is crucial that MEDVAMC decrease hospital length of stay (LOS) to increase space for incoming patients. Reducing LOS also reduces costs and may have a correlation with decreasing the incidence of nosocomial infections. Because of its significance to this facility, hospital LOS is an appropriate primary outcome for this study.
To our knowledge, bridging outcomes between LMWH and UFH in patients with AF and ACKD have never been studied. We hypothesized that using enoxaparin instead of heparin for periprocedural management would result in decreased hospital LOS, leading to a lower economic burden and lower incidence of nosocomial infections with no significant differences in major and minor bleeding and thromboembolic complications.10
Methods
This study was a single-center, retrospective chart review of adult patients from January 2008 to September 2017. The review was conducted at MEDVAMC and was approved by the research and development committee and by the Baylor College of Medicine Institutional Review Board. Formal consent was not required.
Included patients were aged ≥ 18 years with diagnoses of AF or atrial flutter and ACKD as recognized by a glomerular filtration rate (eGFR) of < 30 mL/min/1.73 m2 as calculated by use of the Modification of Diet in Renal Disease Study (MDRD) equation.11 Patients must have previously been on warfarin and required temporary interruption of warfarin for an elective procedure. During the interruption of warfarin therapy, a requirement was set for patients to be on periprocedural anticoagulation with subcutaneous (SC) enoxaparin 1 mg/kg daily or continuous IV heparin per MEDVAMC heparin protocol. Patients were excluded if they had experienced major bleeding in the 6 weeks prior to the elective procedure, had current thrombocytopenia (platelet count < 100 × 109/L), or had a history of heparin-induced thrombocytopenia (HIT) or a heparin allergy.
This patient population was identified using TheraDoc Clinical Surveillance Software System (Charlotte, NC), which has prebuilt alert reviews for anticoagulation medications, including enoxaparin and heparin. An alert for patients on enoxaparin with serum creatinine (SCr) > 1.5 mg/dL was used to screen patients who met the inclusion criteria. A second alert identified patients on heparin. The VA Computerized Patient Record System (CPRS) was used to collect patient data.
Economic Analysis
An economic analysis was conducted using data from the VA Managerial Cost Accounting Reports. Data on the national average cost per bed day was used for the purpose of extrapolating this information to multiple VA institutions.12 National average cost per day was determined by dividing the total cost by the number of bed days for the identified treating specialty during the fiscal period of 2018. Average cost per day data included costs for bed day, surgery, radiology services, laboratory tests, pharmacy services, treatment location (ie, intensive care units [ICUs]) and all other costs associated with an inpatient stay. A cost analysis was performed using this average cost per bed day and the mean LOS between enoxaparin and UFH for each treating specialty. The major outcome of the cost analysis was the total cost per average inpatient stay. The national average cost per bed day for each treating specialty was multiplied by the average LOS found for each treating specialty in this study; the sum of all the average costs per inpatient stay for the treating specialties resulted in the total cost per average inpatient stay. Permission to use these data was granted by the Pharmacy and Critical Care Services at MEDVAMC.
Patient Demographics and Characteristics
Data were collected on patient demographics (Table 1). Nosocomial infections, stroke/transient ischemic attack, MI, VTE, major and minor bleeding, and death are defined in Table 2.
The primary outcome of the study was hospital LOS. The study was powered at 90% for α = .05, which gives a required study population of 114 (1:1 enrollment ratio) patients to determine a statistically significant difference in hospital stay. This sample size was calculated using the mean hospital LOS (the primary objective) in the REGIMEN registry for LMWH (4.6 days) and UFH (10.3 days).9 To our knowledge, the incidence of nosocomial infections (a secondary outcome) has not been studied in this patient population; therefore, there was no basis to assess an appropriate sample size to find a difference in this outcome. Furthermore, the goal was to collect as many patients as possible to best assess this variable. Because of an expected high exclusion rate, 504 patients were reviewed to target a sample size of 120 patients. Due to the single-center nature of this review, the secondary outcomes of thromboembolic complications and major and minor bleeding were expected to be underpowered.
The final analysis compared the enoxaparin arm with the UFH arm. Univariate differences between the treatment groups were compared using the Fisher exact test for categorical variables. Demographic data and other continuous variables were analyzed by an unpaired t test to compare means between the 2 arms. Outcomes and characteristics were deemed statistically significant when α (P value) was < .05. All P values reported were 2-tailed with a 95% CI. No statistical analysis was performed for the cost differences (based on LOS per treating specialty) in the 2 treatment arms. Statistical analyses were completed by utilizing GraphPad Software (San Diego, CA).
Results
In total, 50 patients were analyzed in the study. There were 36 patients bridged with IV UFH at a concentration of 25,000 U/250 mL with an initial infusion rate of 12 U/kg/h. For the other arm, 14 patients were anticoagulated with renally dosed enoxaparin 1 mg/kg/d with an average daily dose of 89.3 mg; the mean actual body weight in this group was 90.9 mg (correlates with enoxaparin daily dose). Physicians of the primary team decided which parenteral anticoagulant to use. The difference in mean duration of inpatient parental anticoagulation between both groups was not statistically significant: enoxaparin at 7.1 days and UFH at 9.6 days (P = .19). Patients in the enoxaparin arm were off warfarin therapy for an average of 6.0 days vs 7.5 days for the UFH group (P = .29). The duration of outpatient anticoagulation with enoxaparin was not analyzed in this study.
Patient and Procedure Characteristics
All patients had AF or atrial flutter with 86% of patients (n = 43) having a CHADS2 > 2 and 48% (n = 29) having a CHA2DS2VASc > 4. Overall, the mean age was 71.3 years with similarities in ethnicity distribution. Patients had multiple comorbidities as shown by a mean Charlson Comorbidity Index (CCI) of 7.7 and an increased risk of bleeding as evidenced by 98% (n = 48) of patients having a HAS-BLED score of ≥ 3. A greater percentage of patients bridged with enoxaparin had DM, history of stroke and MI, and a heart valve, whereas UFH patients were more likely to be in stage 5 CKD (eGFR < 15 mL/min/1.73m2) with a significantly lower mean eGFR (16.76 vs 22.64, P = .03). Furthermore, there were more patients on hemodialysis in the UFH (50%) arm vs enoxaparin (21%) arm and a lower mean CrCl with UFH (20.1 mL/min) compared with enoxaparin (24.9 mL/min); however, the differences in hemodialysis and mean CrCl were not statistically significant. There were no patients on peritoneal dialysis in this review.
Procedure Characteristics
The average Revised Cardiac Risk Index (RCRI) score was about 3, indicating that these patients were at a Class IV risk (11%) of having a perioperative cardiac event (Table 3). Nineteen patients (38%) elected for a major surgery with all but 1 of the surgeries (major or minor) being invasive. The average length of surgery was 1.2 hours, and patients were more likely to undergo cardiothoracic procedures (38%). There were 2 out of 14 (14%) patients on enoxaparin who were able to have surgery as an outpatient; whereas this did not occur in patients on UFH. The procedures completed for these patients were a colostomy (minor surgery) and arteriovenous graft repair (major surgery). There were no statistically significant differences regarding types of procedures between the 2 arms.
Outcomes
The primary outcome of this study, hospital LOS, differed significantly in the enoxaparin arm vs UFH: 10.2 days vs 17.5 days, P = .04 (Table 4). The time-to-discharge from initiation of parenteral anticoagulation was significantly reduced with enoxaparin (7.1 days) compared with UFH (11.9 days); P = .04. Although also reduced in the enoxaparin arm, ICU LOS did not show statistical significance (1.1 days vs 4.0 days, P = .09).
About 36% (n = 18) of patients in this study acquired an infection during hospitalization for elective surgery. The most common microorganism and site of infection were Enterococcus species and urinary tract, respectively (Table 5). Nearly half (44%, n = 16) of the patients in the UFH group had a nosocomial infection vs 14% (n = 2) of enoxaparin-bridged patients with a difference approaching significance; P = .056. Both patients in the enoxaparin group had the urinary tract as the primary source of infection; 1 of these patients had a urologic procedure.
Major bleeding occurred in 7% (n = 1) of enoxaparin patients vs 22% (n = 8) in the UFH arm, but this was not found to be statistically significant (P = .41). Minor bleeding was similar between enoxaparin and UFH arms (14% vs 19%, P = .99). Regarding thromboembolic complications, the enoxaparin group (0%) had a numerical reduction compared to UFH (11%) with VTE (n = 4) being the only occurrence of the composite outcome (P = .57). There were 4 deaths within 30 days posthospitalization—all were from the UFH group (P = .57). Due to the small sample size of this study, these outcomes (bleeding and thrombotic events) were not powered to detect a statistically significant difference.
Economic Analysis
The average cost differences (Table 6) of hospitalization between enoxaparin and UFH were calculated using the average LOS per treating specialty multiplied by the national average cost of the MCO for an inpatient bed day in 2018.12 The treating specialty with the longest average LOS in the enoxaparin arm was thoracic (4.7 days). The UFH arm also had a large LOS (average days) for the thoracic specialty (6.4 days); however, the vascular specialty (6.7 days) had the longest average LOS in this group. Due to a mean LOS of 10.2 days in the enoxaparin arm, which was further stratified by treating specialty, the total cost per average inpatient stay was calculated as $51,710. On the other hand, patients in the UFH arm had a total cost per average inpatient stay of $92,848.
Monitoring
Anti-factor Xa levels for LMWH monitoring were not analyzed in this study due to a lack of values collected; only 1 patient had an anti-factor Xa level checked during this time frame. Infusion rates of UFH were adjusted based on aPTT levels collected per MEDVAMC inpatient anticoagulation protocol. The average percentage of aPTT in therapeutic range was 46.3% and the mean time-to-therapeutic range (SD) was about 2.4 (1.3) days. Due to this study’s retrospective nature, there were inconsistencies with availability of documentation of UFH infusion rates. For this reason, these values were not analyzed further.
Discussion
In 2017, the American College of Cardiology published the Periprocedural Anticoagulation Expert Consensus Pathway, which recommends for patients with AF at low risk (CHA2DS2VASc 1-4) of thromboembolism to not be bridged (unless patient had a prior VTE or stroke/TIA).13 Nearly half the patients in this study, were classified as moderate-to-high thrombotic risk as evidenced by a CHA2DS2VASc > 4 with a mean score of 4.8. Due to this study’s retrospective design from 2008 to 2017, many of the clinicians may have referenced the 2008 CHEST antithrombotic guidelines when making the decision to bridge patients; these guidelines and the previous MEDVAMC anticoagulation protocol recommend bridging patients with AF with CHADS2 > 2 (moderate-to-high thrombotic risk) in which all but 1 of the patients in this study met criteria.1,14 In contrast to the landmark BRIDGE trial, the mean CHADS2 score in this study was 3.6; this is an indication that our patient population was of individuals at an increased risk of stroke and embolism.
In addition to thromboembolic complications, patients in the current study also were at increased risk of clinically relevant bleeding with a mean HAS-BLED score of 4.1 and nearly all patients having a score > 3. The complexity of the veteran population also was displayed by this study’s mean CCI (7.7) and RCRI (3.0) indicating a 0% estimated 10-year survival and a 11% increase in having a perioperative cardiac event, respectively. A mean CCI of 7.7 is associated with a 13.3 relative risk of death within 6 years postoperation.15 All patients had a diagnosis of hypertension, and > 75% had this diagnosis complicated by DM. In addition, this patient population was of those with extensive cardiovascular disease or increased risk, which makes for a clinically relevant application of patients who would require periprocedural bridging.
Another positive aspect of this study is that all the baseline characteristics, apart from renal function, were similar between arms, helping to strengthen the ability to adequately compare the 2 bridging modalities. Our assumption for the reasoning that more stage 5 CKD and dialysis patients were anticoagulated with UFH vs enoxaparin is a result of concern for an increased risk of bleeding with a medication that is renally cleared 30% less in CrCl < 30 mL/min.16 Although, enoxaparin 1 mg/kg/d is FDA approved as a therapeutic anticoagulant option, clinicians at MEDVAMC likely had reservations about its use in end-stage CKD patients. Unlike many studies, including the BRIDGE trial, patients with ACKD were not excluded from this trial, and the outcomes with enoxaparin are available for interpretation.
To no surprise, for patients included in this study, enoxaparin use led to shorter hospital LOS, reduced ICU LOS, and a quicker time-to-discharge from initiation. This is credited to the 100% bioavailability of SC enoxaparin in conjunction with its means to be a therapeutic option as an outpatient.16 Unlike IV UFH, patients requiring bridging can be discharged on SC injections of enoxaparin until a therapeutic INR is maintained with warfarin.The duration of hospital LOS in both arms were longer in this study compared with that of other studies.9 This may be due to clinicians being more cautious with renal insufficient patients, and the patients included in this study had multiple comorbidities. According to an economic analysis performed by Amorosi and colleagues in 2004, bridging with enoxaparin instead of UFH can save up to $3,733 per patient and reduce bridging costs by 63% to 85% driven primarily by decreased hospital LOS.10
Economic Outcome
In our study, we conducted a cost analysis using national VA data that indicated a $41,138 or 44% reduction in total cost per average inpatient stay when bridging 1 patient with enoxaparin vs UFH. The benefit of this cost analysis is that it reflects direct costs at VA institutions nationally; this will allow these data to be useful for practitioners at MEDVAMC and other VA hospitals. Stratifying the costs by treating specialty instead of treatment location minimized skewing of the data as there were some patients with long LOS in the ICU. No patients in the enoxaparin arm were treated in otolaryngology, which may have skewed the data. The data included direct costs for beds as well as costs for multiple services, such as procedures, pharmacy, nursing, laboratory tests, and imaging. Unlike the Amorosi study, our review did not include acquisition costs for enoxaparin syringes and bags of UFH or laboratory costs for aPTT and anti-factor Xa levels in part because of the data source and the difficulty calculating costs over a 10-year span.
Patients in the enoxaparin arm had a trend toward fewer occurrences of hospital-acquired infections than did those in the UFH arm, which we believe is due to a decreased LOS (in both total hospital and ICU days) and fewer blood draws needed for monitoring. This also may be attributed to a longer mean duration of surgery in the UFH arm (1.3 hours) vs enoxaparin (0.9 hours). The percentage of patients with procedures ≥ 45 minutes and the types of procedures between both arms were similar. However, these outcomes were not statistically significant. In addition, elderly males who are hospitalized may require a catheter (due to urinary retention), and catheter-associated urinary tract infection (CAUTI) is one of the highest reported infections in acute care hospitals in the US. This is in line with our patient population and may be a supplementary reason for the increase in infection incidence with UFH. Though, whether urinary catheters were used in these patients was not evaluated in this study.
Despite being at an increased risk of experiencing a major adverse cardiovascular event (MACE), no patients in either arm had a stroke/TIA or MI within 30 days postprocedure. The only occurrences documented were VTEs, which happened only in 4 patients on UFH. Four people died in this study, solely in the UFH arm. The incidence of thromboembolic complications and death along with major and minor bleeding cannot be deduced as meaningful as this study was underpowered for these outcomes. Despite anti-factor Xa monitoring being recommended in ACKD patients on enoxaparin, this monitoring was not routinely performed in this study. Another limitation was the inability to adequately assess the appropriateness of nurse-adjusted UFH infusion rates largely due to the retrospective nature of this study. The variability of aPTT percentage in therapeutic range and time-to-therapeutic range reported was indicative of the difficulties of monitoring for the safety and efficacy of UFH.
In 1991, Cruickshank and colleagues conducted a study in which a standard nomogram (similar to the MEDVAMC nomogram) for the adjustment of IV heparin was implemented at a single hospital.17 The success rate (aPTT percentage in therapeutic range) was 59.4% and average time-to-therapeutic range was about 1 day. The success rate (46.3%) and time-to-therapeutic range (2.4 days) in our study were lower and longer, respectively, than was expected. One potential reason for this discrepancy could be the differences in indication as the patients in Cruickshank and colleagues were being treated for VTE, whereas patients in our study had AF or atrial flutter. Also, there were inconsistencies in the availability of documentation of monitoring parameters for heparin due to the study time frame and retrospective design. Patients on UFH who are not within the therapeutic range in a timely manner are at greater risk of MACE and major/minor bleeding. Our study was not powered to detect these findings.
Strengths and Limitations
A significant limitation of this study was its small sample size; the study was not able to meet power for the primary outcome; it is unknown whether our study met power for nosocomial infections. The study also was not a powered review of other adverse events, such as thromboembolic complications, bleeding, and death. The study had an uneven number of patients, which made it more difficult to appropriately compare 2 patient populations; the study also did not include medians for patient characteristics and outcomes.
Due to this study’s time frame, the clinical pharmacy services at MEDVAMC were not as robust as they are now, which is the reason the decisions on which anticoagulant to use were primarily physician based. The use of TheraDoc to identify patients posed the risk of missing patients who may not have had the appropriate laboratory tests performed (ie, SCr). Patients on UFH had a reduced eGFR compared with that of enoxaparin, which may limit our extrapolation of enoxaparin’s use in end-stage renal disease. The reduced eGFR and higher number of dialysis patients in the UFH arm may have increased the occurrence of more labile INRs and bleeding outcomes. Patients on hemodialysis typically have more comorbidities and an increased risk of infection due to the frequent use of catheters and needles to access the bloodstream. In addition, the potential differences in catheter use and duration between groups were not identified. If these parameters were studied, the data collected may have helped better explain the reasoning for increased incidence of infection in the UFH arm.
Strengths of this study include a complex patient population with similar characteristics, distribution of ethnicities representative of the US population, patients at moderate-to-high thrombotic risk, the analysis of nosocomial infections, and the exclusion of patients with normal renal function or moderate CKD.
Conclusion
To our knowledge, this is the first study to compare periprocedural bridging outcomes and incidence of nosocomial infections in patients with AF and ACKD. This review provides new evidence that in this patient population, enoxaparin is a potential anticoagulant to reduce hospital LOS and hospital-acquired infections. Compared with UFH, bridging with enoxaparin reduced hospital LOS and anticoagulation time-to-discharge by 7 and 5 days, respectively, and decreased the incidence of nosocomial infections by 30%. Using the mean LOS per treating specialty for both arms, bridging 1 patient with AF with enoxaparin vs UFH can potentially lead to an estimated $40,000 (44%) reduction in total cost of hospitalization. Enoxaparin also had no numeric differences in mortality and adverse events (stroke/TIA, MI, VTE) vs that of UFH, but it is important to note that this study was not powered to find a significant difference in these outcomes. Due to the mean eGFR of patients on enoxaparin being 22.6 mL/min/1.73 m2 and only 1 in 5 having stage 5 CKD, at this time, we do not recommend enoxaparin for periprocedural use in stage 5 CKD or in patients on hemodialysis. Larger studies are needed, including randomized trials, in this patient population to further evaluate these outcomes and assess the use of enoxaparin in patients with ACKD.
1. Douketis JD, Spyropoulos AC, Spencer FA, et al. Perioperative management of antithrombotic therapy: Antithrombotic Therapy and Prevention of Thrombosis, 9th ed: American College of Chest Physicians Evidence-Based Clinical Practice Guidelines. Chest. 2012;141(2)(suppl):e326S-350S.
2. Douketis JD, Spyropoulos AC, Kaatz S, et al; BRIDGE Investigators. Perioperative bridging anticoagulation in patients with atrial fibrillation. N Engl J Med. 2015;373(9):823-833.
3. Hammerstingl C, Schmitz A, Fimmers R, Omran H. Bridging of chronic oral anticoagulation with enoxaparin in patients with atrial fibrillation: results from the prospective BRAVE registry. Cardiovasc Ther. 2009;27(4):230-238.
4. Dad T, Weiner DE. Stroke and chronic kidney disease: epidemiology, pathogenesis, and management across kidney disease stages. Semin Nephrol. 2015;35(4):311-322.
5. Wattanakit K, Cushman M. Chronic kidney disease and venous thromboembolism: epidemiology and mechanisms. Curr Opin Pulm Med. 2009;15(5):408-412.
6. Saltiel M. Dosing low molecular weight heparins in kidney disease. J Pharm Pract. 2010;23(3):205-209.
7. Spinler SA, Inverso SM, Cohen M, Goodman SG, Stringer KA, Antman EM; ESSENCE and TIMI 11B Investigators. Safety and efficacy of unfractionated heparin versus enoxaparin in patients who are obese and patients with severe renal impairment: analysis from the ESSENCE and TIMI 11B studies. Am Heart J. 2003;146(1):33-41.
8. Fox KA, Antman EM, Montalescot G, et al. The impact of renal dysfunction on outcomes in the ExTRACT-TIMI 25 trial. J Am Coll Cardiol. 2007;49(23):2249-2255.
9. Spyropoulos AC, Turpie AG, Dunn AS, et al; REGIMEN Investigators. Clinical outcomes with unfractionated heparin or low-molecular-weight heparin as bridging therapy in patients on long-term oral anticoagulants: the REGIMEN registry. J Thromb Haemost. 2006;4(6):1246-1252.
10. Amorosi SL, Tsilimingras K, Thompson D, Fanikos J, Weinstein MC, Goldhaber SZ. Cost analysis of “bridging therapy” with low-molecular-weight heparin versus unfractionated heparin during temporary interruption of chronic anticoagulation. Am J Cardiol. 2004;93(4):509-511.
11. Inker LA, Astor BC, Fox CH, et al. KDOQI US commentary on the 2012 KDIGO clinical practice guideline for the evaluation and management of CKD. Am J Kidney Dis. 2014;63(5):713-735.
12. US Department of Veteran Affairs. Managerial Cost Accounting Financial User Support Reports: fiscal year 2018. https://www.herc.research.va.gov/include/page.asp?id=managerial-cost-accounting. [Source not verified.]
13. Doherty JU, Gluckman TJ, Hucker WJ, et al. 2017 ACC Expert Consensus Decision Pathway for Periprocedural Management of Anticoagulation in Patients With Nonvalvular Atrial Fibrillation: a report of the American College of Cardiology Clinical Expert Consensus Document Task Force. J Am Coll Cardiol. 2017;69(7):871-898.
14. Kearon C, Kahn SR, Agnelli G, et al. Antithrombotic therapy for venous thromboembolic disease: American College of Chest Physicians Evidence-Based Clinical Practice Guidelines (8th Edition). Chest. 2008;133(6 suppl):454S-545S.
15. Charlson M, Szatrowski TP, Peterson J, Gold J. Validation of a combined comorbidity index. J Clin Epidemiol. 1994;47(11):1245-1251.
16. Lovenox [package insert]. Bridgewater, NJ: Sanofi-Aventis; December 2017.
17. Cruickshank MK, Levine MN, Hirsh J, Roberts R, Siguenza M. A standard heparin nomogram for the management of heparin therapy. Arch Intern Med. 1991;151(2):333-337.
18. Steinberg BA, Peterson ED, Kim S, et al; Outcomes Registry for Better Informed Treatment of Atrial Fibrillation Investigators and Patients. Use and outcomes associated with bridging during anticoagulation interruptions in patients with atrial fibrillation: findings from the Outcomes Registry for Better Informed Treatment of Atrial Fibrillation (ORBIT-AF). Circulation. 2015;131(5):488-494.
19. Verheugt FW, Steinhubl SR, Hamon M, et al. Incidence, prognostic impact, and influence of antithrombotic therapy on access and nonaccess site bleeding in percutaneous coronary intervention. JACC Cardiovasc Interv. 2011;4(2):191-197.
20. Bijsterveld NR, Peters RJ, Murphy SA, Bernink PJ, Tijssen JG, Cohen M. Recurrent cardiac ischemic events early after discontinuation of short-term heparin treatment in acute coronary syndromes: results from the Thrombolysis in Myocardial Infarction (TIMI) 11B and Efficacy and Safety of Subcutaneous Enoxaparin in Non-Q-Wave Coronary Events (ESSENCE) studies. J Am Coll Cardiol. 2003;42(12):2083-2089.
Fluoroscopically Guided Lateral Approach Hip Injection
Hip injections are performed as diagnostic and therapeutic interventions across a variety of medical subspecialties, including but not limited to those practicing physical medicine and rehabilitation, pain medicine, sports medicine, orthopedic surgery, and radiology. Traditional image-guided intra-articular hip injection commonly uses an anterior-oblique approach from a starting point on the anterior groin traversing soft tissue anterior to the femoral neck to the target needle placement at the femoral head-neck junction.
In fluoroscopic procedures, a coaxial technique for needles placement is used for safe and precise insertion of needles. An X-ray beam is angled in line with the projected path of the needle from skin entry point to injection target. Coaxial, en face technique (also called EF, parallel, hub view, down the barrel, or barrel view) appears as a single radiopaque dot over the target injection site.1 This technique minimizes needle redirection for correction of the injection path and minimal disturbance of surrounding tissue on the approach to the intended target.
Noncoaxial technique, as used in the anterior-oblique approach, intentionally directs the needle away from a skin entry point, the needle barrel traversing the X-ray beam toward an injection target. Clinical challenges to injection with the anterior-oblique approach include using a noncoaxial technique. Additional challenges to the anterior-oblique (also referred to as anterior) approach are body habitus and pannus, proximity to neurovascular structures, and patient positioning. By understanding the risks and benefits of varied technical approaches to accomplish a clinical goal and outcome, trainees are better able to select the technique most appropriate for a varied patient population.
Common risks to patients for all intra-articular interventions include bleeding, infection, and pain. Risk of damage to nearby structures is often mentioned as part of a standard informed consent process as it relates to the femoral vein, artery, and nerve that are in close anatomical proximity to the target injection site. When prior studies have examined the risk of complications resulting from intra-articular hip injections, a common conclusion is that despite a relatively low-risk profile for skilled interventionalists, efforts to avoid needle placement in the medial 50% of the femoral head on antero-posterior imaging is recommended.2
The anterior technique is a commonly described approach, and the same can be used for both ultrasound-guided and fluoroscopically guided hip injections.3 Using ultrasound guidance, the anterior technique can be performed with in-plane direct visualization of the needle throughout the procedure. With fluoroscopic guidance, the anterior approach is performed out-of-plane, using the noncoaxial technique. This requires the interventionalist to use tactile and anatomic guidance to the target injection site. The anterior approach for hip injection is one of few interventions where coaxial technique is not used for the procedure, making the instruction for a learner less concrete and potentially more challenging related to the needle path not under direct visualization in plane with the X-ray beam.
Technical guidance and detailed instruction for the lateral approach is infrequently described in fluoroscopic interventional texts. Reference to a lateral approach hip injection was made as early as the 1970s, without detail provided on the technique, with respect to the advantage of visualization of the hip joint for needle placement when hardware is in place.4 A more recent article described a lateral approach technique involving the patient in a decubitus (lateral) supine position, which presents limitations in consistent fluoroscopic imaging and can be a challenging static position for the patient to maintain.5
The retrospective review of anterior-oblique and lateral approach procedures in this study aims to demonstrate that there is no significant difference in radiation exposure, rate of successful intra-articular injection, or complication rate. If proven as a noninferior technique, the lateral approach may be a valuable interventional skill to those performing hip injections. Potential benefits to the patient and provider include options for the provider to access the joint using either technique. Additionally, the approach can be added to the instructional plan for those practitioners providing technical instruction to trainees within their health care system.
Methods
The institutional review board at the VA Ann Arbor Healthcare System reviewed and granted approval for this study. One of 5 interventional pain physician staff members at the VA Ann Arbor Healthcare System performed fluoroscopically guided hip injections. Interventional pain fellows under the direct supervision of board-certified physicians performed the procedures for the study cases. Supervising physicians included both physiatrists and anesthesiologists. Images were reviewed and evaluated without corresponding patient biographic data.
For cases using the lateral approach, the patients were positioned supine on the fluoroscopy table. In anterior-posterior and lateral views, trajectory lines are drawn using a long metal marking rod held adjacent to the patient. With pulsed low-dose fluoroscopy, transverse lines are drawn to identify midpoint of the femoral head in lateral view (Figure 1A, x-axis) and the most direct line from skin to lateral femoral head neck junction joint target (Figure 1B, z-axis). Also confirmed in lateral view, the z-axis marked line drawn on the skin is used to confirm that this transverse plane crosses the overlapping femoral heads (Figure 1A, y-axis).

The cross-section of these transverse and coronal plane lines identifies the starting point for the most direct approach from skin to injection target at femoral head-neck junction. Using the coaxial technique in the lateral view, the needle is introduced and advanced using intermittent fluoroscopic images to the lateral joint target. Continuing in this view, the interventionalist can ensure that advancing the needle to the osseous endpoint will place the tip at the midpoint of the femoral head at the target on the lateral surface, avoiding inadvertent advance of the needle anterior or posterior the femoral head. Final needle placement confirmation is then completed in antero-posterior view (Figure 2A). Contrast enhancement is used to confirm intra-articular spread (Figure 2B).
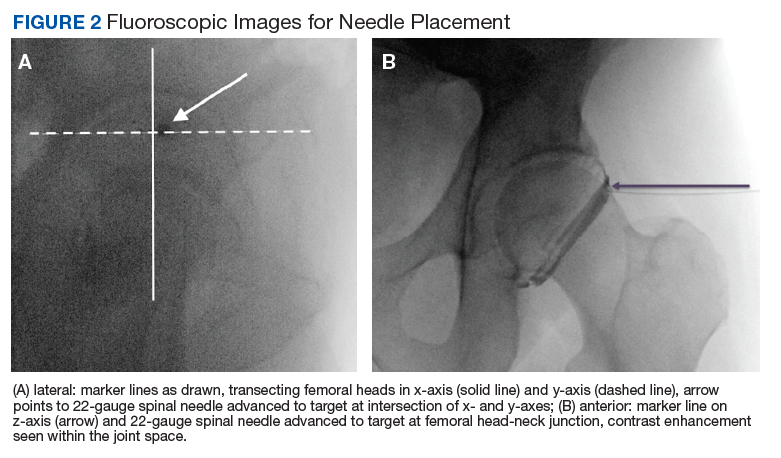
Cases included in the study were performed over an 8-month period in 2017. Case images recorded in IntelliSpace PACS Radiology software (Andover, MA) were included by creating a list of all cases performed and documented using the major joint injection procedure code. The cases reviewed began with the most recent cases. Two research team members (1 radiologist and 1 interventional pain physician) reviewed the series of saved images for each patient and the associated procedure report. The research team members documented and recorded de-identified study data in Microsoft Excel (Redmond, WA).
Imaging reports, using the saved images and the associated procedure report, were classified for technical approach (anterior, lateral, or inconclusive), success of joint injection as evidenced by appropriate contrast enhancement within the joint space (successful, unsuccessful, or incomplete images), documented use of sedation (yes, no), patient positioning (supine, prone), radiation exposure dose, radiation exposure time, and additional comments, such as “notable pannus” or “hardware present” to annotate significant findings on imaging review.
Statistical Analysis
The distribution of 2 outcomes used to compare rates of complication, radiation dose, and exposure time was checked using the Shapiro-Wilk test. Power analysis determined that inclusion of 30 anterior and 30 lateral cases results in adequate power to detect a 1-point mean difference, assuming a standard deviation of 1.5 in each group. Both radiation dose and exposure time were found to be nonnormally distributed (W = 0.65, P < .001; W = 0.86, P < .001; respectively). Median and interquartile range (IQR) of dose and time in seconds for anterior and lateral approaches were computed. Median differences in radiation dose and exposure time between anterior and lateral approaches were assessed with the k-sample test of equality of medians. All analyses were conducted using Stata Version 14.1 (College Station, TX).
Results
Between June 2017 and January 2018, 88 cases were reviewed as performed, with 30 anterior and 30 lateral approach cases included in this retrospective comparison study. A total of 28 cases were excluded from the study for using an inconclusive approach, multiple or bilateral procedures, cases without recorded dose and time data, and inadequately saved images to provide meaningful data (Figure 3).

Rate of successful intervention with needle placement confirmed within the articular space on contrast enhancement was not significantly different in the study groups with 96.7% (29 of 30) anterior approach cases reported as successful, 100% (30 of 30) lateral approach cases reported as successful. Overhanging pannus in the viewing area was reported in 5 anterior approach cases and 4 lateral cases. Hardware was noted in 2 lateral approach cases, none in anterior approach cases. Sedation was used for 3 of the anterior approach cases and none of the lateral approach cases.

Patients undergoing the lateral approach received a higher median radiation dose than did those undergoing the anterior approach, but this was not statistically significant (P = .07) (Table). Those undergoing the lateral approach also had a longer median exposure time than did those undergoing the anterior approach, but this also was not statistically significant (P = .3). With no immediate complications reported in any of the studied interventions, there was no difference in complication rates between anterior and lateral approach cases.
Discussion
Pain medicine fellows who have previously completed residency in a variety of disciplines, often either anesthesiology or physical medicine and rehabilitation, perform fluoroscopically guided procedures and benefit from increased experience with coaxial technique as this improves needle depth and location awareness. Once mastered, this skill set can be applied to and useful for multiple interventional pain procedures. Similar technical instruction with an emphasis on coaxial technique for hip injections as performed in the anterior or anterolateral approach can be used in both fluoroscopic and ultrasound-guided procedures, including facet injection, transforaminal epidural steroid injection, and myriad other procedures performed to ameliorate pain. There are advantages to pursuing a similar approach with all image-guided procedures. Evaluated in this comparison study is an alternative technique that has potential for risk reduction benefit with reduced proximity to neurovascular structures, which ultimately leads to a safer procedure profile.
Using a lateral approach, the interventionalist determines a starting point, entering the skin at a greater distance from any overlying pannus and the elevated concentration of gram-negative and gram-positive bacteria contained within the inguinal skin.6 A previous study demonstrated improved success of intra-articular needle tip placement without image guidance in patients with body mass index (BMI) < 30.7 A prior study of anterior approach using anatomic landmarks as compared to lateral approach demonstrated the anterior approach pierced or contacted the femoral nerve in 27% of anterior cases and came within 5 mm of 60% of anterior cases.2 Use of image guidance, whether ultrasound, fluoroscopy, or computed tomography (CT) is preferred related to reduced risk of contact with adjacent neurovascular structures. Anatomic surface landmarks have been described as an alternative injection technique, without the use of fluoroscopy for confirmatory initial, intraprocedure, and final placement.8 Palpation of anatomic structures is required for this nonimage-guided technique, and although similar to the described technique in this study, the anatomically guided injection starting point is more lateral than the anterior approach but not in the most lateral position in the transverse plane that is used for this fluoroscopically guided lateral approach study.
Physiologic characteristics of subjects and technical aspects of fluoroscopy both can be factors in radiation dose and exposure times for hip injections. Patient BMI was not included in the data collection, but further study would seek to determine whether BMI is a significant risk for any increased radiation dose and exposure times using lateral approach injections. Use of lateral images for fluoroscopy requires penetration of X-ray beam through more tissue compared with that of anterior-posterior images. Further study of these techniques would benefit from comparing the pulse rate of fluoroscopic images and collimation (or focusing of the radiation beam over a smaller area of tissue) as factors in any observed increase in total radiation dose and exposure times.
Improving the safety profile of this procedure could have a positive impact on the patient population receiving fluoroscopic hip injections, both within the VA Ann Arbor Health System and elsewhere. While the study population was limited to the VA patient population seeking subspecialty nonsurgical joint care at a single tertiary care center, this technique is generalizable and can be used in most patients, as hip pain is a common condition necessitating nonoperative evaluation and treatment.
Radiation Exposures
As our analysis demonstrates, mean radiation dose exposure for each group was consistent with low (≤ 3 mSv) to moderate (> 3-20 mSv) annual effective doses in the general population.7 Both anterior and lateral median radiation dose of 1 mGy and 3 mGy, respectively, are within the standard exposure for radiographs of the pelvis (1.31 mGy).9 It is therefore reasonable to consider a lateral approach for hip injection, given the benefits of direct coaxial approach and avoiding needle entry through higher bacteria-concentrated skin.
The lateral approach did have increased radiation dose and exposure time, although it was not statistically significantly greater than the anterior approach. The difference between radiation dose and time to perform either technique was not clinically significant. One potential explanation for this is that the lateral technique has increased tissue to penetrate, which can be reduced with collimation and other fluoroscopic image adjustments. Additionally, as trainees progress in competency, fewer images should need to be obtained.7 We hypothesize that as familiarity and comfort with this technique increase, the number of images necessary for successful injection would decrease, leading to decreased radiation dose and exposure time. We would expect that in the hands of a board-certified interventionalist, radiation dose and exposure time would be significantly decreased as compared to our current dataset, and this is an area of planned further study. With our existing dataset, the majority of procedures were performed with trainees, with inadequate information documented for comparison of dose over time and procedural experience under individual physicians.
Notable strengths of this study are the direct comparison of the anterior approach when compared to the lateral approach with regard to radiation dose and exposure time, which we have not seen described in the literature. A detailed description of the technique may result in increased utilization by other providers. Data were collected from multiple providers, as board-certified pain physicians and board-eligible interventional pain fellows performed the procedures. This variability in providers increases the generalizability of the findings, with a variety of providers, disciplines, years of experiences, and type of training represented.
Limitations
Limitations include the retrospective nature of the study and the relatively small sample size. However, even with this limitation, it is notable that no statistically significant differences were observed in mean radiation dose or fluoroscopy exposure time, making the lateral approach, at minimum, a noninferior technique. Combined with the improved safety profile, this technique is a viable alternative to the traditional anterior-oblique approach. Further study should be performed, such as a prospective, randomized control trial investigating the 2 techniques and following pain scores and functional ability after the procedure.
Conclusion
Given the decreased procedural risk related to proximity of neurovascular structures and coaxial technique for needle advancement, lateral approach for hip injection should be considered by those in any discipline performing fluoroscopically guided procedures. Lateral technique may be particularly useful in technically challenging cases and when skin entry at the anterior groin is suboptimal, as a noninferior alternative to traditional anterior method.
1. Cianfoni A, Boulter DJ, Rumboldt Z, Sapton T, Bonaldi G. Guidelines to imaging landmarks for interventional spine procedures: fluoroscopy and CT anatomy. Neurographics. 2011;1(1):39-48.
2. Leopold SS, Battista V, Oliverio JA. Safety and efficacy of intraarticular hip injection using anatomic landmarks. Clin Orthop Relat Res. 2001;(391):192-197.
3. Dodré E, Lefebvre G, Cockenpot E, Chastanet P, Cotten A. Interventional MSK procedures: the hip. Br J Radiol. 2016;89(1057):20150408.
4. Hankey S, McCall IW, Park WM, O’Connor BT. Technical problems in arthrography of the painful hip arthroplasty. Clin Radiol. 1979;30(6):653-656.
5. Yasar E, Singh JR, Hill J, Akuthota V. Image-guided injections of the hip. J Nov Physiother Phys Rehabil. 2014;1(2):39-48.
6. Aly R, Maibach HI. Aerobic microbial flora of intertrigenous skin. Appl Environ Microbiol. 1977;33(1):97-100.
7. Fazel R, Krumholz HM, Wang W, et al. Exposure to low-dose ionizing radiation from medical imaging procedures. N Engl J Med. 2009;361(9):849-857.
8. Masoud MA, Said HG. Intra-articular hip injection using anatomic surface landmarks. Arthosc Tech. 2013;2(2):e147-e149.
9. Ofori K, Gordon SW, Akrobortu E, Ampene AA, Darko EO. Estimation of adult patient doses for selected x-ray diagnostic examinations. J Radiat Res Appl Sci. 2014;7(4):459-462.
Hip injections are performed as diagnostic and therapeutic interventions across a variety of medical subspecialties, including but not limited to those practicing physical medicine and rehabilitation, pain medicine, sports medicine, orthopedic surgery, and radiology. Traditional image-guided intra-articular hip injection commonly uses an anterior-oblique approach from a starting point on the anterior groin traversing soft tissue anterior to the femoral neck to the target needle placement at the femoral head-neck junction.
In fluoroscopic procedures, a coaxial technique for needles placement is used for safe and precise insertion of needles. An X-ray beam is angled in line with the projected path of the needle from skin entry point to injection target. Coaxial, en face technique (also called EF, parallel, hub view, down the barrel, or barrel view) appears as a single radiopaque dot over the target injection site.1 This technique minimizes needle redirection for correction of the injection path and minimal disturbance of surrounding tissue on the approach to the intended target.
Noncoaxial technique, as used in the anterior-oblique approach, intentionally directs the needle away from a skin entry point, the needle barrel traversing the X-ray beam toward an injection target. Clinical challenges to injection with the anterior-oblique approach include using a noncoaxial technique. Additional challenges to the anterior-oblique (also referred to as anterior) approach are body habitus and pannus, proximity to neurovascular structures, and patient positioning. By understanding the risks and benefits of varied technical approaches to accomplish a clinical goal and outcome, trainees are better able to select the technique most appropriate for a varied patient population.
Common risks to patients for all intra-articular interventions include bleeding, infection, and pain. Risk of damage to nearby structures is often mentioned as part of a standard informed consent process as it relates to the femoral vein, artery, and nerve that are in close anatomical proximity to the target injection site. When prior studies have examined the risk of complications resulting from intra-articular hip injections, a common conclusion is that despite a relatively low-risk profile for skilled interventionalists, efforts to avoid needle placement in the medial 50% of the femoral head on antero-posterior imaging is recommended.2
The anterior technique is a commonly described approach, and the same can be used for both ultrasound-guided and fluoroscopically guided hip injections.3 Using ultrasound guidance, the anterior technique can be performed with in-plane direct visualization of the needle throughout the procedure. With fluoroscopic guidance, the anterior approach is performed out-of-plane, using the noncoaxial technique. This requires the interventionalist to use tactile and anatomic guidance to the target injection site. The anterior approach for hip injection is one of few interventions where coaxial technique is not used for the procedure, making the instruction for a learner less concrete and potentially more challenging related to the needle path not under direct visualization in plane with the X-ray beam.
Technical guidance and detailed instruction for the lateral approach is infrequently described in fluoroscopic interventional texts. Reference to a lateral approach hip injection was made as early as the 1970s, without detail provided on the technique, with respect to the advantage of visualization of the hip joint for needle placement when hardware is in place.4 A more recent article described a lateral approach technique involving the patient in a decubitus (lateral) supine position, which presents limitations in consistent fluoroscopic imaging and can be a challenging static position for the patient to maintain.5
The retrospective review of anterior-oblique and lateral approach procedures in this study aims to demonstrate that there is no significant difference in radiation exposure, rate of successful intra-articular injection, or complication rate. If proven as a noninferior technique, the lateral approach may be a valuable interventional skill to those performing hip injections. Potential benefits to the patient and provider include options for the provider to access the joint using either technique. Additionally, the approach can be added to the instructional plan for those practitioners providing technical instruction to trainees within their health care system.
Methods
The institutional review board at the VA Ann Arbor Healthcare System reviewed and granted approval for this study. One of 5 interventional pain physician staff members at the VA Ann Arbor Healthcare System performed fluoroscopically guided hip injections. Interventional pain fellows under the direct supervision of board-certified physicians performed the procedures for the study cases. Supervising physicians included both physiatrists and anesthesiologists. Images were reviewed and evaluated without corresponding patient biographic data.
For cases using the lateral approach, the patients were positioned supine on the fluoroscopy table. In anterior-posterior and lateral views, trajectory lines are drawn using a long metal marking rod held adjacent to the patient. With pulsed low-dose fluoroscopy, transverse lines are drawn to identify midpoint of the femoral head in lateral view (Figure 1A, x-axis) and the most direct line from skin to lateral femoral head neck junction joint target (Figure 1B, z-axis). Also confirmed in lateral view, the z-axis marked line drawn on the skin is used to confirm that this transverse plane crosses the overlapping femoral heads (Figure 1A, y-axis).
The cross-section of these transverse and coronal plane lines identifies the starting point for the most direct approach from skin to injection target at femoral head-neck junction. Using the coaxial technique in the lateral view, the needle is introduced and advanced using intermittent fluoroscopic images to the lateral joint target. Continuing in this view, the interventionalist can ensure that advancing the needle to the osseous endpoint will place the tip at the midpoint of the femoral head at the target on the lateral surface, avoiding inadvertent advance of the needle anterior or posterior the femoral head. Final needle placement confirmation is then completed in antero-posterior view (Figure 2A). Contrast enhancement is used to confirm intra-articular spread (Figure 2B).
Cases included in the study were performed over an 8-month period in 2017. Case images recorded in IntelliSpace PACS Radiology software (Andover, MA) were included by creating a list of all cases performed and documented using the major joint injection procedure code. The cases reviewed began with the most recent cases. Two research team members (1 radiologist and 1 interventional pain physician) reviewed the series of saved images for each patient and the associated procedure report. The research team members documented and recorded de-identified study data in Microsoft Excel (Redmond, WA).
Imaging reports, using the saved images and the associated procedure report, were classified for technical approach (anterior, lateral, or inconclusive), success of joint injection as evidenced by appropriate contrast enhancement within the joint space (successful, unsuccessful, or incomplete images), documented use of sedation (yes, no), patient positioning (supine, prone), radiation exposure dose, radiation exposure time, and additional comments, such as “notable pannus” or “hardware present” to annotate significant findings on imaging review.
Statistical Analysis
The distribution of 2 outcomes used to compare rates of complication, radiation dose, and exposure time was checked using the Shapiro-Wilk test. Power analysis determined that inclusion of 30 anterior and 30 lateral cases results in adequate power to detect a 1-point mean difference, assuming a standard deviation of 1.5 in each group. Both radiation dose and exposure time were found to be nonnormally distributed (W = 0.65, P < .001; W = 0.86, P < .001; respectively). Median and interquartile range (IQR) of dose and time in seconds for anterior and lateral approaches were computed. Median differences in radiation dose and exposure time between anterior and lateral approaches were assessed with the k-sample test of equality of medians. All analyses were conducted using Stata Version 14.1 (College Station, TX).
Results
Between June 2017 and January 2018, 88 cases were reviewed as performed, with 30 anterior and 30 lateral approach cases included in this retrospective comparison study. A total of 28 cases were excluded from the study for using an inconclusive approach, multiple or bilateral procedures, cases without recorded dose and time data, and inadequately saved images to provide meaningful data (Figure 3).
Rate of successful intervention with needle placement confirmed within the articular space on contrast enhancement was not significantly different in the study groups with 96.7% (29 of 30) anterior approach cases reported as successful, 100% (30 of 30) lateral approach cases reported as successful. Overhanging pannus in the viewing area was reported in 5 anterior approach cases and 4 lateral cases. Hardware was noted in 2 lateral approach cases, none in anterior approach cases. Sedation was used for 3 of the anterior approach cases and none of the lateral approach cases.
Patients undergoing the lateral approach received a higher median radiation dose than did those undergoing the anterior approach, but this was not statistically significant (P = .07) (Table). Those undergoing the lateral approach also had a longer median exposure time than did those undergoing the anterior approach, but this also was not statistically significant (P = .3). With no immediate complications reported in any of the studied interventions, there was no difference in complication rates between anterior and lateral approach cases.
Discussion
Pain medicine fellows who have previously completed residency in a variety of disciplines, often either anesthesiology or physical medicine and rehabilitation, perform fluoroscopically guided procedures and benefit from increased experience with coaxial technique as this improves needle depth and location awareness. Once mastered, this skill set can be applied to and useful for multiple interventional pain procedures. Similar technical instruction with an emphasis on coaxial technique for hip injections as performed in the anterior or anterolateral approach can be used in both fluoroscopic and ultrasound-guided procedures, including facet injection, transforaminal epidural steroid injection, and myriad other procedures performed to ameliorate pain. There are advantages to pursuing a similar approach with all image-guided procedures. Evaluated in this comparison study is an alternative technique that has potential for risk reduction benefit with reduced proximity to neurovascular structures, which ultimately leads to a safer procedure profile.
Using a lateral approach, the interventionalist determines a starting point, entering the skin at a greater distance from any overlying pannus and the elevated concentration of gram-negative and gram-positive bacteria contained within the inguinal skin.6 A previous study demonstrated improved success of intra-articular needle tip placement without image guidance in patients with body mass index (BMI) < 30.7 A prior study of anterior approach using anatomic landmarks as compared to lateral approach demonstrated the anterior approach pierced or contacted the femoral nerve in 27% of anterior cases and came within 5 mm of 60% of anterior cases.2 Use of image guidance, whether ultrasound, fluoroscopy, or computed tomography (CT) is preferred related to reduced risk of contact with adjacent neurovascular structures. Anatomic surface landmarks have been described as an alternative injection technique, without the use of fluoroscopy for confirmatory initial, intraprocedure, and final placement.8 Palpation of anatomic structures is required for this nonimage-guided technique, and although similar to the described technique in this study, the anatomically guided injection starting point is more lateral than the anterior approach but not in the most lateral position in the transverse plane that is used for this fluoroscopically guided lateral approach study.
Physiologic characteristics of subjects and technical aspects of fluoroscopy both can be factors in radiation dose and exposure times for hip injections. Patient BMI was not included in the data collection, but further study would seek to determine whether BMI is a significant risk for any increased radiation dose and exposure times using lateral approach injections. Use of lateral images for fluoroscopy requires penetration of X-ray beam through more tissue compared with that of anterior-posterior images. Further study of these techniques would benefit from comparing the pulse rate of fluoroscopic images and collimation (or focusing of the radiation beam over a smaller area of tissue) as factors in any observed increase in total radiation dose and exposure times.
Improving the safety profile of this procedure could have a positive impact on the patient population receiving fluoroscopic hip injections, both within the VA Ann Arbor Health System and elsewhere. While the study population was limited to the VA patient population seeking subspecialty nonsurgical joint care at a single tertiary care center, this technique is generalizable and can be used in most patients, as hip pain is a common condition necessitating nonoperative evaluation and treatment.
Radiation Exposures
As our analysis demonstrates, mean radiation dose exposure for each group was consistent with low (≤ 3 mSv) to moderate (> 3-20 mSv) annual effective doses in the general population.7 Both anterior and lateral median radiation dose of 1 mGy and 3 mGy, respectively, are within the standard exposure for radiographs of the pelvis (1.31 mGy).9 It is therefore reasonable to consider a lateral approach for hip injection, given the benefits of direct coaxial approach and avoiding needle entry through higher bacteria-concentrated skin.
The lateral approach did have increased radiation dose and exposure time, although it was not statistically significantly greater than the anterior approach. The difference between radiation dose and time to perform either technique was not clinically significant. One potential explanation for this is that the lateral technique has increased tissue to penetrate, which can be reduced with collimation and other fluoroscopic image adjustments. Additionally, as trainees progress in competency, fewer images should need to be obtained.7 We hypothesize that as familiarity and comfort with this technique increase, the number of images necessary for successful injection would decrease, leading to decreased radiation dose and exposure time. We would expect that in the hands of a board-certified interventionalist, radiation dose and exposure time would be significantly decreased as compared to our current dataset, and this is an area of planned further study. With our existing dataset, the majority of procedures were performed with trainees, with inadequate information documented for comparison of dose over time and procedural experience under individual physicians.
Notable strengths of this study are the direct comparison of the anterior approach when compared to the lateral approach with regard to radiation dose and exposure time, which we have not seen described in the literature. A detailed description of the technique may result in increased utilization by other providers. Data were collected from multiple providers, as board-certified pain physicians and board-eligible interventional pain fellows performed the procedures. This variability in providers increases the generalizability of the findings, with a variety of providers, disciplines, years of experiences, and type of training represented.
Limitations
Limitations include the retrospective nature of the study and the relatively small sample size. However, even with this limitation, it is notable that no statistically significant differences were observed in mean radiation dose or fluoroscopy exposure time, making the lateral approach, at minimum, a noninferior technique. Combined with the improved safety profile, this technique is a viable alternative to the traditional anterior-oblique approach. Further study should be performed, such as a prospective, randomized control trial investigating the 2 techniques and following pain scores and functional ability after the procedure.
Conclusion
Given the decreased procedural risk related to proximity of neurovascular structures and coaxial technique for needle advancement, lateral approach for hip injection should be considered by those in any discipline performing fluoroscopically guided procedures. Lateral technique may be particularly useful in technically challenging cases and when skin entry at the anterior groin is suboptimal, as a noninferior alternative to traditional anterior method.
1. Cianfoni A, Boulter DJ, Rumboldt Z, Sapton T, Bonaldi G. Guidelines to imaging landmarks for interventional spine procedures: fluoroscopy and CT anatomy. Neurographics. 2011;1(1):39-48.
2. Leopold SS, Battista V, Oliverio JA. Safety and efficacy of intraarticular hip injection using anatomic landmarks. Clin Orthop Relat Res. 2001;(391):192-197.
3. Dodré E, Lefebvre G, Cockenpot E, Chastanet P, Cotten A. Interventional MSK procedures: the hip. Br J Radiol. 2016;89(1057):20150408.
4. Hankey S, McCall IW, Park WM, O’Connor BT. Technical problems in arthrography of the painful hip arthroplasty. Clin Radiol. 1979;30(6):653-656.
5. Yasar E, Singh JR, Hill J, Akuthota V. Image-guided injections of the hip. J Nov Physiother Phys Rehabil. 2014;1(2):39-48.
6. Aly R, Maibach HI. Aerobic microbial flora of intertrigenous skin. Appl Environ Microbiol. 1977;33(1):97-100.
7. Fazel R, Krumholz HM, Wang W, et al. Exposure to low-dose ionizing radiation from medical imaging procedures. N Engl J Med. 2009;361(9):849-857.
8. Masoud MA, Said HG. Intra-articular hip injection using anatomic surface landmarks. Arthosc Tech. 2013;2(2):e147-e149.
9. Ofori K, Gordon SW, Akrobortu E, Ampene AA, Darko EO. Estimation of adult patient doses for selected x-ray diagnostic examinations. J Radiat Res Appl Sci. 2014;7(4):459-462.
Nurse Responses to Physiologic Monitor Alarms on a General Pediatric Unit
Alarms from bedside continuous physiologic monitors (CPMs) occur frequently in children’s hospitals and can lead to harm. Recent studies conducted in children’s hospitals have identified alarm rates of up to 152 alarms per patient per day outside of the intensive care unit,1-3 with as few as 1% of alarms being considered clinically important.4 Excessive alarms have been linked to alarm fatigue, when providers become desensitized to and may miss alarms indicating impending patient deterioration. Alarm fatigue has been identified by national patient safety organizations as a patient safety concern given the risk of patient harm.5-7 Despite these concerns, CPMs are routinely used: up to 48% of pediatric patients in nonintensive care units at children’s hospitals are monitored.2
Although the low number of alarms that receive responses has been well-described,8,9 the reasons why clinicians do or do not respond to alarms are unclear. A study conducted in an adult perioperative unit noted prolonged nurse response times for patients with high alarm rates.10 A second study conducted in the pediatric inpatient setting demonstrated a dose-response effect and noted progressively prolonged nurse response times with increased rates of nonactionable alarms.4,11 Findings from another study suggested that underlying factors are highly complex and may be a result of excessive alarms, clinician characteristics, and working conditions (eg, workload and unit noise level).12 Evidence also suggests that humans have difficulty distinguishing the importance of alarms in situations where multiple alarm tones are used, a common scenario in hospitals.
An enhanced understanding of why nurses respond to alarms in daily practice will inform intervention development and improvement work. In the long term, this information could help improve systems for monitoring pediatric inpatients that are less prone to issues with alarm fatigue. The objective of this qualitative study, which employed structured observation, was to describe how bedside nurses think about and act upon bedside monitor alarms in a general pediatric inpatient unit.
METHODS
Study Design and Setting
This prospective observational study took place on a 48-bed hospital medicine unit at a large, freestanding children’s hospital with >650 beds and >19,000 annual admissions. General Electric (Little Chalfont, United Kingdom) physiologic monitors (models Dash 3000, 4000, and 5000) were used at the time of the study, and nurses could be notified of monitor alarms in four ways: First, an in-room auditory alarm sounds. Second, a light positioned above the door outside of each patient room blinks for alarms that are at a “warning” or “critical level” (eg ventricular tachycardia or low oxygen saturation). Third, audible alarms occur at the unit’s central monitoring station. Lastly, another staff member can notify the patient’s nurse via in-person conversion or secure smart phone communication. On the study unit, CPMs are initiated and discontinued through a physician order.
This study was reviewed and approved by the hospital’s institutional review board.
Study Population
We used a purposive recruitment strategy to enroll bedside nurses working on general hospital medicine units, stratified to ensure varying levels of experience and primary shifts (eg, day vs night). We planned to conduct approximately two observations with each participating nurse and to continue collecting data until we could no longer identify new insights in terms of responses to alarms (ie, thematic saturation15). Observations were targeted to cover times of day that coincided with increased rates of distraction. These times included just prior to and after the morning and evening change of shifts (7:00
Data Sources
Prior to data collection, the research team, which consisted of physicians, bedside nurses, research coordinators, and a human factors expert, created a system for categorizing alarm responses. Categories for observed responses were based on the location and corresponding action taken. Initial categories were developed a priori from existing literature and expanded through input from the multidisciplinary study team, then vetted with bedside staff, and finally pilot tested through >4 hours of observations, thus producing the final categories. These categories were entered into a work-sampling program (WorkStudy by Quetech Ltd., Waterloo, Ontario, Canada) to facilitate quick data recording during observations.
The hospital uses a central alarm collection software (BedMasterEx by Anandic Medical Systems, Feuerthalen, Switzerland), which permitted the collection of date, time, trigger (eg, high heart rate), and level (eg, crisis, warning) of the generated CPM alarms. Alarms collected are based on thresholds preset at the bedside monitor. The central collection software does not differentiate between accurate (eg, correctly representing the physiologic state of the patient) and inaccurate alarms.
Observation Procedure
At the time of observation, nurse demographic information (eg, primary shift worked and years working as a nurse) was obtained. A brief preobservation questionnaire was administered to collect patient information (eg, age and diagnosis) and the nurses’ perspectives on the necessity of monitors for each monitored patient in his/her care.
The observer shadowed the nurse for a two-hour block of his/her shift. During this time, nurses were instructed to “think aloud” as they responded to alarms (eg, “I notice the oxygen saturation monitor alarming off, but the probe has fallen off”). A trained observer (AML or KMT) recorded responses verbalized by the nurse and his/her reaction by selecting the appropriate category using the work-sampling software. Data were also collected on the vital sign associated with the alarm (eg, heart rate). Moreover, the observer kept written notes to provide context for electronically recorded data. Alarms that were not verbalized by the nurse were not counted. Similarly, alarms that were noted outside of the room by the nurse were not classified by vital sign unless the nurse confirmed with the bedside monitor. Observers did not adjudicate the accuracy of the alarms. The session was stopped if monitors were discontinued during the observation period. Alarm data generated by the bedside monitor were pulled for each patient room after observations were completed.
Analysis
Descriptive statistics were used to assess the percentage of each nurse response category and each alarm type (eg, heart rate and respiratory rate). The observed alarm rate was calculated by taking the total number of observed alarms (ie, alarms noted by the nurse) divided by the total number of patient-hours observed. The monitor-generated alarm rate was calculated by taking the total number of alarms from the bedside-alarm generated data divided by the number of patient-hours observed.
Electronically recorded observations using the work-sampling program were cross-referenced with hand-written field notes to assess for any discrepancies or identify relevant events not captured by the program. Three study team members (AML, KMT, and ACS) reviewed each observation independently and compared field notes to ensure accurate categorization. Discrepancies were referred to the larger study group in cases of uncertainty.
RESULTS
Nine nurses had monitored patients during the available observations and participated in 19 observation sessions, which included 35 monitored patients for a total of 61.3 patient-hours of observation. Nurses were observed for a median of two times each (range 1-4). The median number of monitored patients during a single observation session was two (range 1-3). Observed nurses were female with a median of eight years of experience (range 0.5-26 years). Patients represented a broad range of age categories and were hospitalized with a variety of diagnoses (Table). Nurses, when queried at the start of the observation, felt that monitors were necessary for 29 (82.9%) of the observed patients given either patient condition or unit policy.
A total of 207 observed nurse responses to alarms occurred during the study period for a rate of 3.4 responses per patient per hour. Of the total number of responses, 45 (21.7%) were noted outside of a patient room, and in 15 (33.3%) the nurse chose to go to the room. The other 162 were recorded when the nurse was present in the room when the alarm activated. Of the 177 in-person nurse responses, 50 were related to a pulse oximetry alarm, 66 were related to a heart rate alarm, and 61 were related to a respiratory rate alarm. The most common observed in-person response to an alarm involved the nurse judging that no intervention was necessary (n = 152, 73.1%). Only 14 (7% of total responses) observed in-person responses involved a clinical intervention, such as suctioning or titrating supplemental oxygen. Findings are summarized in the Figure and describe nurse-verbalized reasons to further assess (or not) and then whether the nurse chose to take action (or not) after an alarm.
Alarm data were available for 17 of the 19 observation periods during the study. Technical issues with the central alarm collection software precluded alarm data collection for two of the observation sessions. A total of 483 alarms were recorded on bedside monitors during those 17 observation periods or 8.8 alarms per patient per hour, which was equivalent to 211.2 alarms per patient-day. A total of 175 observed responses were collected during these 17 observation periods. This number of responses was 36% of the number we would have expected on the basis of the alarm count from the central alarm software.
There were no patients transferred to the intensive care unit during the observation period. Nurses who chose not to respond to alarms outside the room most often cited the brevity of the alarm or other reassuring contextual details, such as that a family member was in the room to notify them if anything was truly wrong, that another member of the medical team was with the patient, or that they had recently assessed the patient and thought likely the alarm did not require any action. During three observations, the observed nurse cited the presence of family in the patient’s room in their decision not to conduct further assessment in response to the alarm, noting that the parent would be able to notify the nurse if something required attention. On two occasions in which a nurse had multiple monitored patients, the observed nurse noted that if the other monitored patients were alarming and she happened to be in another patient’s room, she would not be able to hear them. Four nurses cited policy as the reason a patient was on monitors (eg, patient was on respiratory support at night for obstructive sleep apnea).
DISCUSSION
We characterized responses to physiologic monitor alarms by a group of nurses with a range of experience levels. We found that most nurse responses to alarms in continuously monitored general pediatric patients involved no intervention, and further assessment was often not conducted for alarms that occurred outside of the room if the nurse noted otherwise reassuring clinical context. Observed responses occurred for 36% of alarms during the study period when compared with bedside monitor-alarm generated data. Overall, only 14 clinical interventions were noted among the observed responses. Nurses noted that they felt the monitors were necessary for 82.9% of monitored patients because of the clinical context or because of unit policy.
Our study findings highlight some potential contradictions in the current widespread use of CPMs in general pediatric units and how clinicians respond to them in practice.2 First, while nurses reported that monitors were necessary for most of their patients, participating nurses deemed few alarms clinically actionable and often chose not to further assess when they noted alarms outside of the room. This is in line with findings from prior studies suggesting that clinicians overvalue the contribution of monitoring systems to patient safety.
Our findings provide a novel understanding of previously observed phenomena, such as long response times or nonresponses in settings with high alarm rates.4,10 Similar to that in a prior study conducted in the pediatric setting,11 alarms with an observed response constituted a minority of the total alarms that occurred in our study. This finding has previously been attributed to mental fatigue, caregiver apathy, and desensitization.8 However, even though a minority of observed responses in our study included an intervention, the nurse had a rationale for why the alarm did or did not need a response. This behavior and the verbalized rationale indicate that in his/her opinion, not responding to the alarm was clinically appropriate. Study participants also reflected on the difficulties of responding to alarms given the monitor system setup, in which they may not always be capable of hearing alarms for their patients. Without data from nurses regarding the alarms that had no observed response, we can only speculate; however, based on our findings, each of these factors could contribute to nonresponse. Finally, while high numbers of false alarms have been posited as an underlying cause of alarm fatigue, we noted that a majority of nonresponse was reported to be related to other clinical factors. This relationship suggests that from the nurse’s perspective, a more applicable framework for understanding alarms would be based on clinical actionability4 over physiologic accuracy.
In total, our findings suggest that a multifaceted approach will be necessary to improve alarm response rates. These interventions should include adjusting parameters such that alarms are highly likely to indicate a need for intervention coupled with educational interventions addressing clinician knowledge of the alarm system and bias about the actionability of alarms may improve response rates. Changes in the monitoring system setup such that nurses can easily be notified when alarms occur may also be indicated, in addition to formally engaging patients and families around response to alarms. Although secondary notification systems (eg, alarms transmitted to individual clinician’s devices) are one solution, the utilization of these systems needs to be balanced with the risks of contributing to existing alarm fatigue and the need to appropriately tailor monitoring thresholds and strategies to patients.
Our study has several limitations. First, nurses may have responded in a way they perceive to be socially desirable, and studies using in-person observers are also prone to a Hawthorne-like effect,19-21 where the nurse may have tried to respond more frequently to alarms than usual during observations. However, given that the majority of bedside alarms did not receive a response and a substantial number of responses involved no action, these effects were likely weak. Second, we were unable to assess which alarms were accurately reflecting the patient’s physiologic status and which were not; we were also unable to link observed alarm response to monitor-recorded alarms. Third, despite the use of silent observers and an actual, rather than a simulated, clinical setting, by virtue of the data collection method we likely captured a more deliberate thought process (so-called System 2 thinking)22 rather than the subconscious processes that may predominate when nurses respond to alarms in the course of clinical care (System 1 thinking).22 Despite this limitation, our study findings, which reflect a nurse’s in-the-moment thinking, remain relevant to guiding the improvement of monitoring systems, and the development of nurse-facing interventions and education. Finally, we studied a small, purposive sample of nurses at a single hospital. Our study sample impacts the generalizability of our results and precluded a detailed analysis of the effect of nurse- and patient-level variables.
CONCLUSION
We found that nurses often deemed that no response was necessary for CPM alarms. Nurses cited contextual factors, including the duration of alarms and the presence of other providers or parents in their decision-making. Few (7%) of the alarm responses in our study included a clinical intervention. The number of observed alarm responses constituted roughly a third of the alarms recorded by bedside CPMs during the study. This result supports concerns about the nurse’s capacity to hear and process all CPM alarms given system limitations and a heavy clinical workload. Subsequent steps should include staff education, reducing overall alarm rates with appropriate monitor use and actionable alarm thresholds, and ensuring that patient alarms are easily recognizable for frontline staff.
Disclosures
The authors have no conflicts of interest to disclose.
Funding
This work was supported by the Place Outcomes Research Award from the Cincinnati Children’s Research Foundation. Dr. Brady is supported by the Agency for Healthcare Research and Quality under Award Number K08HS23827. The content is solely the responsibility of the authors and does not necessarily represent the official views of the Agency for Healthcare Research and Quality.
1. Schondelmeyer AC, Bonafide CP, Goel VV, et al. The frequency of physiologic monitor alarms in a children’s hospital. J Hosp Med. 2016;11(11):796-798. https://doi.org/10.1002/jhm.2612.
2. Schondelmeyer AC, Brady PW, Goel VV, et al. Physiologic monitor alarm rates at 5 children’s hospitals. J Hosp Med. 2018;13(6):396-398. https://doi.org/10.12788/jhm.2918.
3. Schondelmeyer AC, Brady PW, Sucharew H, et al. The impact of reduced pulse oximetry use on alarm frequency. Hosp Pediatr. In press. PubMed
4. Bonafide CP, Lin R, Zander M, et al. Association between exposure to nonactionable physiologic monitor alarms and response time in a children’s hospital. J Hosp Med. 2015;10(6):345-351. https://doi.org/10.1002/jhm.2331.
5. Siebig S, Kuhls S, Imhoff M, et al. Intensive care unit alarms--how many do we need? Crit Care Med. 2010;38(2):451-456. https://doi.org/10.1097/CCM.0b013e3181cb0888.
6. Sendelbach S, Funk M. Alarm fatigue: a patient safety concern. AACN Adv Crit Care. 2013;24(4):378-386. https://doi.org/10.1097/NCI.0b013e3182a903f9.
7. Sendelbach S. Alarm fatigue. Nurs Clin North Am. 2012;47(3):375-382. https://doi.org/10.1016/j.cnur.2012.05.009.
8. Cvach M. Monitor alarm fatigue: an integrative review. Biomed Instrum Technol. 2012;46(4):268-277. https://doi.org/10.2345/0899-8205-46.4.268.
9. Paine CW, Goel VV, Ely E, et al. Systematic review of physiologic monitor alarm characteristics and pragmatic interventions to reduce alarm frequency. J Hosp Med. 2016;11(2):136-144. https://doi.org/10.1002/jhm.2520.
10. Voepel-Lewis T, Parker ML, Burke CN, et al. Pulse oximetry desaturation alarms on a general postoperative adult unit: a prospective observational study of nurse response time. Int J Nurs Stud. 2013;50(10):1351-1358. https://doi.org/10.1016/j.ijnurstu.2013.02.006.
11. Bonafide CP, Localio AR, Holmes JH, et al. Video analysis of factors associated With response time to physiologic monitor alarms in a children’s hospital. JAMA Pediatr. 2017;171(6):524-531. https://doi.org/10.1001/jamapediatrics.2016.5123.
12. Deb S, Claudio D. Alarm fatigue and its influence on staff performance. IIE Trans Healthc Syst Eng. 2015;5(3):183-196. https://doi.org/10.1080/19488300.2015.1062065.
13. Mondor TA, Hurlburt J, Thorne L. Categorizing sounds by pitch: effects of stimulus similarity and response repetition. Percept Psychophys. 2003;65(1):107-114. https://doi.org/10.3758/BF03194787.
14. Mondor TA, Finley GA. The perceived urgency of auditory warning alarms used in the hospital operating room is inappropriate. Can J Anaesth. 2003;50(3):221-228. https://doi.org/10.1007/BF03017788.
15. Fusch PI, Ness LR. Are we there yet? Data saturation in qualitative research. Qual Rep; 20(9), 2015:1408-1416.
16. Najafi N, Auerbach A. Use and outcomes of telemetry monitoring on a medicine service. Arch Intern Med. 2012;172(17):1349-1350. https://doi.org/10.1001/archinternmed.2012.3163.
17. Estrada CA, Rosman HS, Prasad NK, et al. Role of telemetry monitoring in the non-intensive care unit. Am J Cardiol. 1995;76(12):960-965. https://doi.org/10.1016/S0002-9149(99)80270-7.
18. Khan A, Furtak SL, Melvin P et al. Parent-reported errors and adverse events in hospitalized children. JAMA Pediatr. 2016;170(4):e154608.https://doi.org/10.1001/jamapediatrics.2015.4608.
19. Adair JG. The Hawthorne effect: a reconsideration of the methodological artifact. J Appl Psychol. 1984;69(2):334-345. https://doi.org/10.1037/0021-9010.69.2.334.
20. Kovacs-Litman A, Wong K, Shojania KG, et al. Do physicians clean their hands? Insights from a covert observational study. J Hosp Med. 2016;11(12):862-864. https://doi.org/10.1002/jhm.2632.
21. Wolfe F, Michaud K. The Hawthorne effect, sponsored trials, and the overestimation of treatment effectiveness. J Rheumatol. 2010;37(11):2216-2220. https://doi.org/10.3899/jrheum.100497.
22. Kahneman D. Thinking, Fast and Slow. 1st Pbk. ed. New York: Farrar, Straus and Giroux; 2013.
Alarms from bedside continuous physiologic monitors (CPMs) occur frequently in children’s hospitals and can lead to harm. Recent studies conducted in children’s hospitals have identified alarm rates of up to 152 alarms per patient per day outside of the intensive care unit,1-3 with as few as 1% of alarms being considered clinically important.4 Excessive alarms have been linked to alarm fatigue, when providers become desensitized to and may miss alarms indicating impending patient deterioration. Alarm fatigue has been identified by national patient safety organizations as a patient safety concern given the risk of patient harm.5-7 Despite these concerns, CPMs are routinely used: up to 48% of pediatric patients in nonintensive care units at children’s hospitals are monitored.2
Although the low number of alarms that receive responses has been well-described,8,9 the reasons why clinicians do or do not respond to alarms are unclear. A study conducted in an adult perioperative unit noted prolonged nurse response times for patients with high alarm rates.10 A second study conducted in the pediatric inpatient setting demonstrated a dose-response effect and noted progressively prolonged nurse response times with increased rates of nonactionable alarms.4,11 Findings from another study suggested that underlying factors are highly complex and may be a result of excessive alarms, clinician characteristics, and working conditions (eg, workload and unit noise level).12 Evidence also suggests that humans have difficulty distinguishing the importance of alarms in situations where multiple alarm tones are used, a common scenario in hospitals.
An enhanced understanding of why nurses respond to alarms in daily practice will inform intervention development and improvement work. In the long term, this information could help improve systems for monitoring pediatric inpatients that are less prone to issues with alarm fatigue. The objective of this qualitative study, which employed structured observation, was to describe how bedside nurses think about and act upon bedside monitor alarms in a general pediatric inpatient unit.
METHODS
Study Design and Setting
This prospective observational study took place on a 48-bed hospital medicine unit at a large, freestanding children’s hospital with >650 beds and >19,000 annual admissions. General Electric (Little Chalfont, United Kingdom) physiologic monitors (models Dash 3000, 4000, and 5000) were used at the time of the study, and nurses could be notified of monitor alarms in four ways: First, an in-room auditory alarm sounds. Second, a light positioned above the door outside of each patient room blinks for alarms that are at a “warning” or “critical level” (eg ventricular tachycardia or low oxygen saturation). Third, audible alarms occur at the unit’s central monitoring station. Lastly, another staff member can notify the patient’s nurse via in-person conversion or secure smart phone communication. On the study unit, CPMs are initiated and discontinued through a physician order.
This study was reviewed and approved by the hospital’s institutional review board.
Study Population
We used a purposive recruitment strategy to enroll bedside nurses working on general hospital medicine units, stratified to ensure varying levels of experience and primary shifts (eg, day vs night). We planned to conduct approximately two observations with each participating nurse and to continue collecting data until we could no longer identify new insights in terms of responses to alarms (ie, thematic saturation15). Observations were targeted to cover times of day that coincided with increased rates of distraction. These times included just prior to and after the morning and evening change of shifts (7:00
Data Sources
Prior to data collection, the research team, which consisted of physicians, bedside nurses, research coordinators, and a human factors expert, created a system for categorizing alarm responses. Categories for observed responses were based on the location and corresponding action taken. Initial categories were developed a priori from existing literature and expanded through input from the multidisciplinary study team, then vetted with bedside staff, and finally pilot tested through >4 hours of observations, thus producing the final categories. These categories were entered into a work-sampling program (WorkStudy by Quetech Ltd., Waterloo, Ontario, Canada) to facilitate quick data recording during observations.
The hospital uses a central alarm collection software (BedMasterEx by Anandic Medical Systems, Feuerthalen, Switzerland), which permitted the collection of date, time, trigger (eg, high heart rate), and level (eg, crisis, warning) of the generated CPM alarms. Alarms collected are based on thresholds preset at the bedside monitor. The central collection software does not differentiate between accurate (eg, correctly representing the physiologic state of the patient) and inaccurate alarms.
Observation Procedure
At the time of observation, nurse demographic information (eg, primary shift worked and years working as a nurse) was obtained. A brief preobservation questionnaire was administered to collect patient information (eg, age and diagnosis) and the nurses’ perspectives on the necessity of monitors for each monitored patient in his/her care.
The observer shadowed the nurse for a two-hour block of his/her shift. During this time, nurses were instructed to “think aloud” as they responded to alarms (eg, “I notice the oxygen saturation monitor alarming off, but the probe has fallen off”). A trained observer (AML or KMT) recorded responses verbalized by the nurse and his/her reaction by selecting the appropriate category using the work-sampling software. Data were also collected on the vital sign associated with the alarm (eg, heart rate). Moreover, the observer kept written notes to provide context for electronically recorded data. Alarms that were not verbalized by the nurse were not counted. Similarly, alarms that were noted outside of the room by the nurse were not classified by vital sign unless the nurse confirmed with the bedside monitor. Observers did not adjudicate the accuracy of the alarms. The session was stopped if monitors were discontinued during the observation period. Alarm data generated by the bedside monitor were pulled for each patient room after observations were completed.
Analysis
Descriptive statistics were used to assess the percentage of each nurse response category and each alarm type (eg, heart rate and respiratory rate). The observed alarm rate was calculated by taking the total number of observed alarms (ie, alarms noted by the nurse) divided by the total number of patient-hours observed. The monitor-generated alarm rate was calculated by taking the total number of alarms from the bedside-alarm generated data divided by the number of patient-hours observed.
Electronically recorded observations using the work-sampling program were cross-referenced with hand-written field notes to assess for any discrepancies or identify relevant events not captured by the program. Three study team members (AML, KMT, and ACS) reviewed each observation independently and compared field notes to ensure accurate categorization. Discrepancies were referred to the larger study group in cases of uncertainty.
RESULTS
Nine nurses had monitored patients during the available observations and participated in 19 observation sessions, which included 35 monitored patients for a total of 61.3 patient-hours of observation. Nurses were observed for a median of two times each (range 1-4). The median number of monitored patients during a single observation session was two (range 1-3). Observed nurses were female with a median of eight years of experience (range 0.5-26 years). Patients represented a broad range of age categories and were hospitalized with a variety of diagnoses (Table). Nurses, when queried at the start of the observation, felt that monitors were necessary for 29 (82.9%) of the observed patients given either patient condition or unit policy.
A total of 207 observed nurse responses to alarms occurred during the study period for a rate of 3.4 responses per patient per hour. Of the total number of responses, 45 (21.7%) were noted outside of a patient room, and in 15 (33.3%) the nurse chose to go to the room. The other 162 were recorded when the nurse was present in the room when the alarm activated. Of the 177 in-person nurse responses, 50 were related to a pulse oximetry alarm, 66 were related to a heart rate alarm, and 61 were related to a respiratory rate alarm. The most common observed in-person response to an alarm involved the nurse judging that no intervention was necessary (n = 152, 73.1%). Only 14 (7% of total responses) observed in-person responses involved a clinical intervention, such as suctioning or titrating supplemental oxygen. Findings are summarized in the Figure and describe nurse-verbalized reasons to further assess (or not) and then whether the nurse chose to take action (or not) after an alarm.
Alarm data were available for 17 of the 19 observation periods during the study. Technical issues with the central alarm collection software precluded alarm data collection for two of the observation sessions. A total of 483 alarms were recorded on bedside monitors during those 17 observation periods or 8.8 alarms per patient per hour, which was equivalent to 211.2 alarms per patient-day. A total of 175 observed responses were collected during these 17 observation periods. This number of responses was 36% of the number we would have expected on the basis of the alarm count from the central alarm software.
There were no patients transferred to the intensive care unit during the observation period. Nurses who chose not to respond to alarms outside the room most often cited the brevity of the alarm or other reassuring contextual details, such as that a family member was in the room to notify them if anything was truly wrong, that another member of the medical team was with the patient, or that they had recently assessed the patient and thought likely the alarm did not require any action. During three observations, the observed nurse cited the presence of family in the patient’s room in their decision not to conduct further assessment in response to the alarm, noting that the parent would be able to notify the nurse if something required attention. On two occasions in which a nurse had multiple monitored patients, the observed nurse noted that if the other monitored patients were alarming and she happened to be in another patient’s room, she would not be able to hear them. Four nurses cited policy as the reason a patient was on monitors (eg, patient was on respiratory support at night for obstructive sleep apnea).
DISCUSSION
We characterized responses to physiologic monitor alarms by a group of nurses with a range of experience levels. We found that most nurse responses to alarms in continuously monitored general pediatric patients involved no intervention, and further assessment was often not conducted for alarms that occurred outside of the room if the nurse noted otherwise reassuring clinical context. Observed responses occurred for 36% of alarms during the study period when compared with bedside monitor-alarm generated data. Overall, only 14 clinical interventions were noted among the observed responses. Nurses noted that they felt the monitors were necessary for 82.9% of monitored patients because of the clinical context or because of unit policy.
Our study findings highlight some potential contradictions in the current widespread use of CPMs in general pediatric units and how clinicians respond to them in practice.2 First, while nurses reported that monitors were necessary for most of their patients, participating nurses deemed few alarms clinically actionable and often chose not to further assess when they noted alarms outside of the room. This is in line with findings from prior studies suggesting that clinicians overvalue the contribution of monitoring systems to patient safety.
Our findings provide a novel understanding of previously observed phenomena, such as long response times or nonresponses in settings with high alarm rates.4,10 Similar to that in a prior study conducted in the pediatric setting,11 alarms with an observed response constituted a minority of the total alarms that occurred in our study. This finding has previously been attributed to mental fatigue, caregiver apathy, and desensitization.8 However, even though a minority of observed responses in our study included an intervention, the nurse had a rationale for why the alarm did or did not need a response. This behavior and the verbalized rationale indicate that in his/her opinion, not responding to the alarm was clinically appropriate. Study participants also reflected on the difficulties of responding to alarms given the monitor system setup, in which they may not always be capable of hearing alarms for their patients. Without data from nurses regarding the alarms that had no observed response, we can only speculate; however, based on our findings, each of these factors could contribute to nonresponse. Finally, while high numbers of false alarms have been posited as an underlying cause of alarm fatigue, we noted that a majority of nonresponse was reported to be related to other clinical factors. This relationship suggests that from the nurse’s perspective, a more applicable framework for understanding alarms would be based on clinical actionability4 over physiologic accuracy.
In total, our findings suggest that a multifaceted approach will be necessary to improve alarm response rates. These interventions should include adjusting parameters such that alarms are highly likely to indicate a need for intervention coupled with educational interventions addressing clinician knowledge of the alarm system and bias about the actionability of alarms may improve response rates. Changes in the monitoring system setup such that nurses can easily be notified when alarms occur may also be indicated, in addition to formally engaging patients and families around response to alarms. Although secondary notification systems (eg, alarms transmitted to individual clinician’s devices) are one solution, the utilization of these systems needs to be balanced with the risks of contributing to existing alarm fatigue and the need to appropriately tailor monitoring thresholds and strategies to patients.
Our study has several limitations. First, nurses may have responded in a way they perceive to be socially desirable, and studies using in-person observers are also prone to a Hawthorne-like effect,19-21 where the nurse may have tried to respond more frequently to alarms than usual during observations. However, given that the majority of bedside alarms did not receive a response and a substantial number of responses involved no action, these effects were likely weak. Second, we were unable to assess which alarms were accurately reflecting the patient’s physiologic status and which were not; we were also unable to link observed alarm response to monitor-recorded alarms. Third, despite the use of silent observers and an actual, rather than a simulated, clinical setting, by virtue of the data collection method we likely captured a more deliberate thought process (so-called System 2 thinking)22 rather than the subconscious processes that may predominate when nurses respond to alarms in the course of clinical care (System 1 thinking).22 Despite this limitation, our study findings, which reflect a nurse’s in-the-moment thinking, remain relevant to guiding the improvement of monitoring systems, and the development of nurse-facing interventions and education. Finally, we studied a small, purposive sample of nurses at a single hospital. Our study sample impacts the generalizability of our results and precluded a detailed analysis of the effect of nurse- and patient-level variables.
CONCLUSION
We found that nurses often deemed that no response was necessary for CPM alarms. Nurses cited contextual factors, including the duration of alarms and the presence of other providers or parents in their decision-making. Few (7%) of the alarm responses in our study included a clinical intervention. The number of observed alarm responses constituted roughly a third of the alarms recorded by bedside CPMs during the study. This result supports concerns about the nurse’s capacity to hear and process all CPM alarms given system limitations and a heavy clinical workload. Subsequent steps should include staff education, reducing overall alarm rates with appropriate monitor use and actionable alarm thresholds, and ensuring that patient alarms are easily recognizable for frontline staff.
Disclosures
The authors have no conflicts of interest to disclose.
Funding
This work was supported by the Place Outcomes Research Award from the Cincinnati Children’s Research Foundation. Dr. Brady is supported by the Agency for Healthcare Research and Quality under Award Number K08HS23827. The content is solely the responsibility of the authors and does not necessarily represent the official views of the Agency for Healthcare Research and Quality.
1. Schondelmeyer AC, Bonafide CP, Goel VV, et al. The frequency of physiologic monitor alarms in a children’s hospital. J Hosp Med. 2016;11(11):796-798. https://doi.org/10.1002/jhm.2612.
2. Schondelmeyer AC, Brady PW, Goel VV, et al. Physiologic monitor alarm rates at 5 children’s hospitals. J Hosp Med. 2018;13(6):396-398. https://doi.org/10.12788/jhm.2918.
3. Schondelmeyer AC, Brady PW, Sucharew H, et al. The impact of reduced pulse oximetry use on alarm frequency. Hosp Pediatr. In press. PubMed
4. Bonafide CP, Lin R, Zander M, et al. Association between exposure to nonactionable physiologic monitor alarms and response time in a children’s hospital. J Hosp Med. 2015;10(6):345-351. https://doi.org/10.1002/jhm.2331.
5. Siebig S, Kuhls S, Imhoff M, et al. Intensive care unit alarms--how many do we need? Crit Care Med. 2010;38(2):451-456. https://doi.org/10.1097/CCM.0b013e3181cb0888.
6. Sendelbach S, Funk M. Alarm fatigue: a patient safety concern. AACN Adv Crit Care. 2013;24(4):378-386. https://doi.org/10.1097/NCI.0b013e3182a903f9.
7. Sendelbach S. Alarm fatigue. Nurs Clin North Am. 2012;47(3):375-382. https://doi.org/10.1016/j.cnur.2012.05.009.
8. Cvach M. Monitor alarm fatigue: an integrative review. Biomed Instrum Technol. 2012;46(4):268-277. https://doi.org/10.2345/0899-8205-46.4.268.
9. Paine CW, Goel VV, Ely E, et al. Systematic review of physiologic monitor alarm characteristics and pragmatic interventions to reduce alarm frequency. J Hosp Med. 2016;11(2):136-144. https://doi.org/10.1002/jhm.2520.
10. Voepel-Lewis T, Parker ML, Burke CN, et al. Pulse oximetry desaturation alarms on a general postoperative adult unit: a prospective observational study of nurse response time. Int J Nurs Stud. 2013;50(10):1351-1358. https://doi.org/10.1016/j.ijnurstu.2013.02.006.
11. Bonafide CP, Localio AR, Holmes JH, et al. Video analysis of factors associated With response time to physiologic monitor alarms in a children’s hospital. JAMA Pediatr. 2017;171(6):524-531. https://doi.org/10.1001/jamapediatrics.2016.5123.
12. Deb S, Claudio D. Alarm fatigue and its influence on staff performance. IIE Trans Healthc Syst Eng. 2015;5(3):183-196. https://doi.org/10.1080/19488300.2015.1062065.
13. Mondor TA, Hurlburt J, Thorne L. Categorizing sounds by pitch: effects of stimulus similarity and response repetition. Percept Psychophys. 2003;65(1):107-114. https://doi.org/10.3758/BF03194787.
14. Mondor TA, Finley GA. The perceived urgency of auditory warning alarms used in the hospital operating room is inappropriate. Can J Anaesth. 2003;50(3):221-228. https://doi.org/10.1007/BF03017788.
15. Fusch PI, Ness LR. Are we there yet? Data saturation in qualitative research. Qual Rep; 20(9), 2015:1408-1416.
16. Najafi N, Auerbach A. Use and outcomes of telemetry monitoring on a medicine service. Arch Intern Med. 2012;172(17):1349-1350. https://doi.org/10.1001/archinternmed.2012.3163.
17. Estrada CA, Rosman HS, Prasad NK, et al. Role of telemetry monitoring in the non-intensive care unit. Am J Cardiol. 1995;76(12):960-965. https://doi.org/10.1016/S0002-9149(99)80270-7.
18. Khan A, Furtak SL, Melvin P et al. Parent-reported errors and adverse events in hospitalized children. JAMA Pediatr. 2016;170(4):e154608.https://doi.org/10.1001/jamapediatrics.2015.4608.
19. Adair JG. The Hawthorne effect: a reconsideration of the methodological artifact. J Appl Psychol. 1984;69(2):334-345. https://doi.org/10.1037/0021-9010.69.2.334.
20. Kovacs-Litman A, Wong K, Shojania KG, et al. Do physicians clean their hands? Insights from a covert observational study. J Hosp Med. 2016;11(12):862-864. https://doi.org/10.1002/jhm.2632.
21. Wolfe F, Michaud K. The Hawthorne effect, sponsored trials, and the overestimation of treatment effectiveness. J Rheumatol. 2010;37(11):2216-2220. https://doi.org/10.3899/jrheum.100497.
22. Kahneman D. Thinking, Fast and Slow. 1st Pbk. ed. New York: Farrar, Straus and Giroux; 2013.
© 2019 Society of Hospital Medicine
Reducing Unneeded Clinical Variation in Sepsis and Heart Failure Care to Improve Outcomes and Reduce Cost: A Collaborative Engagement with Hospitalists in a MultiState System
Sepsis and heart failure are two common, costly, and deadly conditions. Among hospitalized Medicare patients, these conditions rank as the first and second most frequent principal diagnoses accounting for over $33 billion in spending across all payers.1 One-third to one-half of all hospital deaths are estimated to occur in patients with sepsis,2 and heart failure is listed as a contributing factor in over 10% of deaths in the United States.3
Previous research shows that evidence-based care decisions can impact the outcomes for these patients. For example, sepsis patients receiving intravenous fluids, blood cultures, broad-spectrum antibiotics, and lactate measurement within three hours of presentation have lower mortality rates.4 In heart failure, key interventions such as the appropriate use of ACE inhibitors, beta blockers, and referral to disease management programs reduce morbidity and mortality.5
However, rapid dissemination and adoption of evidence-based guidelines remain a challenge.6,7 Policy makers have introduced incentives and penalties to support adoption, with varying levels of success. After four years of Centers for Medicare and Medicaid Services (CMS) penalties for hospitals with excess heart failure readmissions, only 21% performed well enough to avoid a penalty in 2017.8 CMS has been tracking sepsis bundle adherence as a core measure, but the rate in 2018 sat at just 54%.9 It is clear that new solutions are needed.10
AdventHealth (formerly Adventist Health System) is a growing, faith-based health system with hospitals across nine states. AdventHealth is a national leader in quality, safety, and patient satisfaction but is not immune to the challenges of delivering consistent, evidence-based care across an extensive network. To accelerate system-wide practice change, AdventHealth’s Office of Clinical Excellence (OCE) partnered with QURE Healthcare and Premier, Inc., to implement a physician engagement and care standardization collaboration involving nearly 100 hospitalists at eight facilities across five states.
This paper describes the results of the Adventist QURE Quality Project (AQQP), which used QURE’s validated, simulation-based measurement and feedback approach to engage hospitalists and standardize evidence-based practices for patients with sepsis and heart failure. We documented specific areas of variation identified in the simulations, how those practices changed through serial feedback, and the impact of those changes on real-world outcomes and costs.
METHODS
Setting
AdventHealth has its headquarters in Altamonte Springs, Florida. It has facilities in nine states, which includes 48 hospitals. The OCE is comprised of physician leaders, project managers, and data analysts who sponsored the project from July 2016 through July 2018.
Study Participants
AdventHealth hospitals were invited to enroll their hospitalists in AQQP; eight AdventHealth hospitals across five states, representing 91 physicians and 16 nurse practitioners/physician’s assistants (APPs), agreed to participate. Participants included both AdventHealth-employed providers and contracted hospitalist groups. Provider participation was voluntary and not tied to financial incentives; however, participants received Continuing Medical Education credit and, if applicable, Maintenance of Certification points through the American Board of Internal Medicine.
Quasi-experimental Design
We used AdventHealth hospitals not participating in AQQP as a quasi-experimental control group. We leveraged this to measure the impact of concurrent secular effects, such as order sets and other system-wide training, that could also improve practice and outcomes in our study.
Study Objectives and Approach
The explicit goals of AQQP were to (1) measure how sepsis and heart failure patients are cared for across AdventHealth using Clinical Performance and Value (CPV) case simulations, (2) provide a forum for hospitalists to discuss clinical variation, and (3) reduce unneeded variation to improve quality and reduce cost. QURE developed 12 CPV simulated patient cases (six sepsis and six heart failure cases) with case-specific evidenced-based scoring criteria tied to national and AdventHealth evidence-based guidelines. AdventHealth order sets were embedded in the cases and accessible by participants as they cared for their patients.
CPV vignettes are simulated patient cases administered online, and have been validated as an accurate and responsive measure of clinical decision-making in both ambulatory11-13 and inpatient settings.14,15 Cases take 20-30 minutes each to complete and simulate a typical clinical encounter: taking the medical history, performing a physical examination, ordering tests, making the diagnosis, implementing initial treatment, and outlining a follow-up plan. Each case has predefined, evidence-based scoring criteria for each care domain. Cases and scoring criteria were reviewed by AdventHealth hospitalist program leaders and physician leaders in OCE. Provider responses were double-scored by trained physician abstractors. Scores range from 0%-100%, with higher scores reflecting greater alignment with best practice recommendations.
In each round of the project, AQQP participants completed two CPV cases, received personalized online feedback reports on their care decisions, and met (at the various sites and via web conference) for a facilitated group discussion on areas of high group variation. The personal feedback reports included the participant’s case score compared to the group average, a list of high-priority personalized improvement opportunities, a summary of the cost of unneeded care items, and links to relevant references. The group discussions focused on six items of high variation. Six total rounds of CPV measurement and feedback were held, one every four months.
At the study’s conclusion, we administered a brief satisfaction survey, asking providers to rate various aspects of the project on a five-point Likert scale.
Data
The study used two primary data sources: (1) care decisions made in the CPV simulated cases and (2) patient-level utilization data from Premier Inc.’s QualityAdvisorTM (QA) data system. QA integrates quality, safety, and financial data from AdventHealth’s electronic medical record, claims data, charge master, and other resources. QualityAdvisor also calculates expected performance for critical measures, including cost per case and length of stay (LOS), based on a proprietary algorithm, which uses DRG classification, severity-of-illness, risk-of-mortality, and other patient risk factors. We pulled patient-level observed and expected data from AQQP qualifying physicians, defined as physicians participating in a majority of CPV measurement rounds. Of the 107 total hospitalists who participated, six providers did not participate in enough CPV rounds, and 22 providers left AdventHealth and could not be included in a patient-level impact analysis. These providers were replaced with 21 new hospitalists who were enrolled in the study and included in the CPV analysis but who did not have patient-level data before AQQP enrollment. Overall, 58 providers met the qualifying criteria to be included in the impact analysis. We compared their performance to a group of 96 hospitalists at facilities that were not participating in the project. Comparator facilities were selected based on quantitative measures of size and demographic matching the AQQP-facilities ensuring that both sets of hospitals (comparator and AQQP) exhibited similar levels of engagement with Advent- Health quality activities such as quality dashboard performance and order set usage. Baseline patient-level cost and LOS data covered from October 2015 to June 2016 and were re-measured annually throughout the project, from July 2016 to June 2018.
Statistical Analyses
We analyzed three primary outcomes: (1) general CPV-measured improvements in each round (scored against evidence-based scoring criteria); (2) disease-specific CPV improvements over each round; and (3) changes in patient-level outcomes and economic savings among AdventHealth pneumonia/sepsis and heart failure patients from the aforementioned improvements. We used Student’s t-test to analyze continuous outcome variables (including CPV, cost of care, and length of stay data) and Fisher’s exact test for binary outcome data. All statistical analyses were performed using Stata 14.2 (StataCorp LLC, College Station, Texas).
RESULTS
Baseline Characteristics and Assessment
A total of 107 AdventHealth hospitalists participated in this study (Appendix Table 1). 78.1% of these providers rated the organization’s focus on quality and lowering unnecessary costs as either “good” or “excellent,” but 78.8% also reported that variation in care provided by the group was “moderate” to “very high”.
At baseline, we observed high variability in the care of pneumonia patients with sepsis (pneumonia/sepsis) and heart failure patients as measured by the care decisions obtained in the CPV cases. The overall quality score, which is a weighted average across all domains, averaged 61.9% ± 10.5% for the group (Table 1). Disaggregating scores by condition, we found an average overall score of 59.4% ± 10.9% for pneumonia/sepsis and 64.4% ± 9.4% for heart failure. The diagnosis and treatment domains, which require the most clinical judgment, had the lowest average domain scores of 53.4% ± 20.9% and 51.6% ± 15.1%, respectively.
Changes in CPV Scores
To determine the impact of serial measurement and feedback, we compared performance in the first two rounds of the project with the last two rounds. We found that overall CPV quality scores showed a 4.8%-point absolute improvement (P < .001; Table 1). We saw improvements in all care domains, and those increases were significant in all but the workup (P = .470); the most significant increase was in diagnostic accuracy (+19.1%; P < .001).
By condition, scores showed similar, statistically significant overall improvements: +4.4%-points for pneumonia/sepsis (P = .001) and +5.5%-points for heart failure (P < .001) driven by increases in the diagnosis and treatment domains. For example, providers increased appropriate identification of HF severity by 21.5%-points (P < .001) and primary diagnosis of pneumonia/sepsis by 3.6%-points (P = .385).
In the treatment domain, which included clinical decisions related to initial management and follow-up care, there were several specific improvements. For HF, we found that performing all the essential treatment elements—prescribing diuretics, ACE inhibitors and beta blockers for appropriate patients—improved by 13.9%-points (P = .038); ordering VTE prophylaxis increased more than threefold, from 16.6% to 51.0% (P < .001; Table 2). For pneumonia/sepsis patients, absolute adherence to all four elements of the 3-hour sepsis bundle improved by 11.7%-points (P = .034). We also saw a decrease in low-value diagnostic workup items for patient cases in which the guidelines suggest they are not needed, such as urinary antigen testing, which declined by 14.6%-points (P = .001) and sputum cultures, which declined 26.4%-points (P = .004). In addition, outlining an evidence-based discharge plan including a follow-up visit, patient education and medication reconciliation improved, especially for pneumonia/sepsis patients by 24.3%-points (P < .001).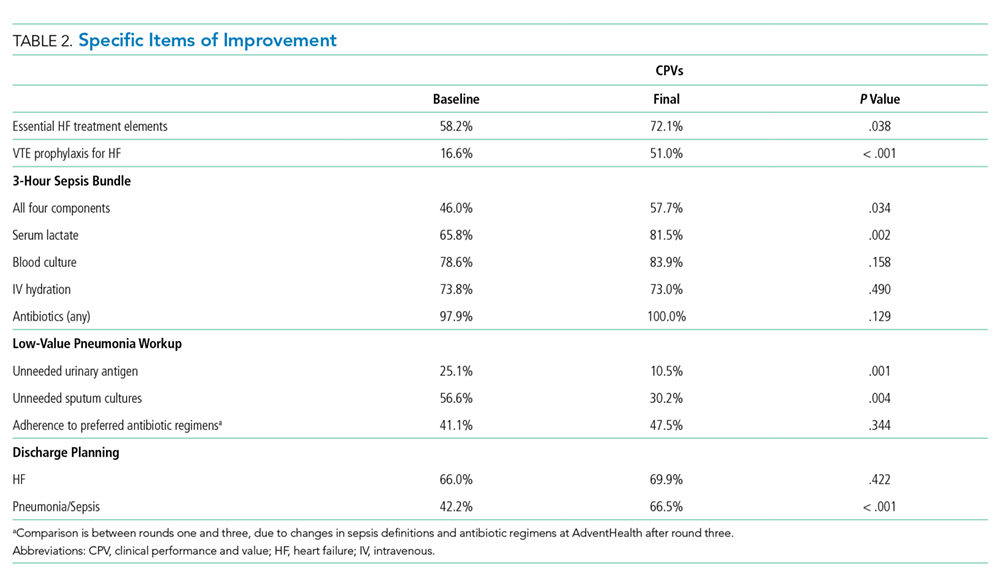
Adherence to AdventHealth-preferred, evidence-based empiric antibiotic regimens was only 41.1% at baseline, but by the third round, adherence to preferred antibiotics had increased by 37% (P = .047). In the summer of 2017, after the third round, we updated scoring criteria for the cases to align with new AdventHealth-preferred antibiotic regimens. Not surprisingly, when the new antibiotic regimens were introduced, CPV-measured adherence to the new guidelines then regressed to nearly baseline levels (42.4%) as providers adjusted to the new recommendations. However, by the end of the final round, AdventHealth-preferred antibiotics orders improved by 12%.
Next, we explored whether the improvements seen were due to the best performers getting better, which was not the case. At baseline the bottom-half performers scored 10.7%-points less than top-half performers but, over the course of the study, we found that the bottom half performers had an absolute improvement nearly two times of those in the top half (+5.7%-points vs +2.9%-points; P = .006), indicating that these bottom performers were able to close the gap in quality-of-care provided. In particular, these bottom performers improved the accuracy of their primary diagnosis by 16.7%-points, compared to a 2.0%-point improvement for the top-half performers.
Patient-Level Impact on LOS and Cost Per Case
We took advantage of the quasi-experimental design, in which only a portion of AdventHealth facilities participated in the project, to compare patient-level results from AQQP-participating physicians against the engagement-matched cohort of hospitalists at nonparticipating AdventHealth facilities. We adjusted for potential differences in patient-level case mix between the two groups by comparing the observed/expected (O/E) LOS and cost per case ratios for pneumonia/sepsis and heart failure patients.
At baseline, AQQP-hospitalists performed better on geometric LOS versus the comparator group (O/E of 1.13 vs 1.22; P = .006) but at about the same on cost per case (O/E of 1.16 vs 1.14; P = .390). Throughout the project, as patient volumes and expected per patient costs rose for both groups, O/E ratios improved among both AQQP and non-AQQP providers.
To set apart the contribution of system-wide improvements from the AQQP project-specific impacts, we applied the O/E improvement rates seen in the comparator group to the AQQP group baseline performance. We then compared that to the actual changes seen in the AQQP throughout the project to see if there was any additional benefit from the simulation measurement and feedback (Figure).
From baseline through year one of the project, the O/E LOS ratio decreased by 8.0% in the AQQP group (1.13 to 1.04; P = .004) and only 2.5% in the comparator group (1.22 to 1.19; P = .480), which is an absolute difference-in-difference of 0.06 LOS O/E. In year 1, these improvements represent a reduction in 892 patient days among patients cared for by AQQP-hospitalists of which 570 appear to be driven by the AQQP intervention and 322 attributable to secular system-wide improvements (Table 3). In year two, both groups continued to improve with the comparator group catching up to the AQQP group.
Geometric mean O/E cost per case also decreased for both AQQP (1.16 Baseline vs 0.98 Year 2; P < .001) and comparator physicians (1.14 Baseline vs 1.01 Year 2; P = .002), for an absolute difference-in-difference of 0.05 cost O/E. However, the AQQP-hospitalists showed greater improvement (15% vs 12%; P = .346; Table 3). As in the LOS analysis, the AQQP-specific impact on cost was markedly accelerated in year one, accounting for $1.6 million of the estimated $2.6 million total savings that year. Over the two-year project, these combined improvements drove an estimated $6.2 million in total savings among AQQP-hospitalists: $3.8 million of this appear to be driven by secular system effects and, based upon our quasi-experimental design, an additional $2.4 million of which are attributable to participation in AQQP.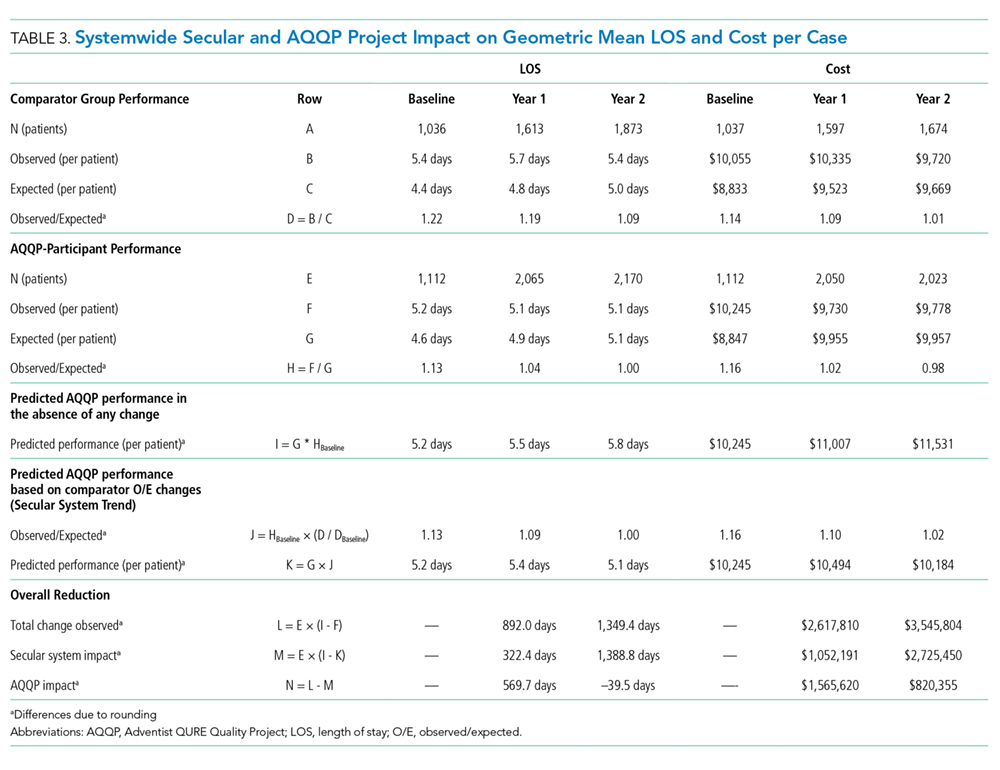
A Levene’s test for equality of variances on the log-transformed costs and LOS shows that the AQQP reductions in costs and LOS come from reduced variation among providers. Throughout the project, the standard deviation in LOS was reduced by 4.3%, from 3.8 days to 3.6 days (P = .046) and costs by 27.7%, from $9,391 to $6,793 (P < .001). The non-AQQP group saw a smaller, but still significant 14.6% reduction in cost variation (from $9,928 to $8,482), but saw a variation in LOS increase significantly by 20.6%, from 4.1 days to 5.0 days (P < .001).
Provider Satisfaction
At the project conclusion, we administered a brief survey. Participants were asked to rate aspects of the project (a five-point Likert scale with five being the highest), and 24 responded. The mean ratings of the relevance of the project to their practice and the overall quality of the material were 4.5 and 4.2, respectively. Providers found the individual feedback reports (3.9) slightly more helpful than the webcast group discussions (3.7; Appendix Table 2 ).
DISCUSSION
As health systems expand, the opportunity to standardize clinical practice within a system has the potential to enhance patient care and lower costs. However, achieving these goals is challenging when providers are dispersed across geographically separated sites and clinical decision-making is difficult to measure in a standardized way.16,17 We brought together over 100 physicians and APPs from eight different-sized hospitals in five different states to prospectively determine if we could improve care using a standardized measurement and feedback system. At baseline, we found that care varied dramatically among providers. Care varied in terms of diagnostic accuracy and treatment, which directly relate to care quality and outcomes.4 After serial measurement and feedback, we saw reductions in unnecessary testing, more guideline-based treatment decisions, and better discharge planning in the clinical vignettes.
We confirmed that changes in CPV-measured practice translated into lower costs and shorter LOS at the patient level. We further validated the improvements through a quasi-experimental design that compared these changes to those at nonparticipating AdventHealth facilities. We saw more significant cost reductions and decreases in LOS in the simulation-based measurement and feedback cohort with the biggest impact early on. The overall savings to the system, attributable specifically to the AQQP approach, is estimated to be $2.4 million.
One advantage of the online case simulation approach is the ability to bring geographically remote sites together in a shared quality-of-care discussion. The interventions specifically sought to remove barriers between facilities. For example, individual feedback reports allowed providers to see how they compare with providers at other AdventHealth facilities and webcast results discussions enable providers across facilities to discuss specific care decisions.
There were several limitations to the study. While the quasi-experimental design allowed us to make informative comparisons between AQQP-participating facilities and nonparticipating facilities, the assignments were not random, and participants were generally from higher performing hospital medicine groups. The determination of secular versus CPV-related improvement is confounded by other system improvement initiatives that may have impacted cost and LOS results. This is mitigated by the observation that facilities that opted to participate performed better at baseline in risk-adjusted LOS but slightly worse in cost per case, indicating that baseline differences were not dramatic. While both groups improved over time, the QURE measurement and feedback approach led to larger and more rapid gains than those seen in the comparator group. However, we could not exclude the potential that project participation at the site level was biased to those groups disposed to performance improvement. In addition, our patient-level data analysis was limited to the metrics available and did not allow us to directly compare patient-level performance across the plethora of clinically relevant CPV data that showed improvement. Our inpatient cost per case analysis showed significant savings for the system but did not include all potentially favorable economic impacts such as lower follow-up care costs for patients, more accurate reimbursement through better coding or fewer lost days of productivity.
With continued consolidation in healthcare and broader health systems spanning multiple geographies, new tools are needed to support standardized, evidence-based care across sites. This standardization is especially important, both clinically and financially, for high-volume, high-cost diseases such as sepsis and heart failure. However, changing practice cannot happen without collaborative engagement with providers. Standardized patient vignettes are an opportunity to measure and provide feedback in a systematic way that engages providers and is particularly well-suited to large systems and common clinical conditions. This analysis, from a real-world study, shows that an approach that standardizes care and lowers costs may be particularly helpful for large systems needing to bring disparate sites together as they concurrently move toward value-based payment.
Disclosures
QURE, LLC, whose intellectual property was used to prepare the cases and collect the data, was contracted by AdventHealth. Otherwise, any of the study authors report no potential conflicts to disclose.
Funding
This work was funded by a contract between AdventHealth (formerly Adventist Health System) and QURE, LLC.
1. Torio C, Moore B. National inpatient hospital costs: the most expensive conditions by payer, 2013. HCUP Statistical Brief #204. Published May 2016 http://www.hcup-us.ahrq.gov/reports/statbriefs/sb204-Most-Expensive-Hospital-Conditions.pdf. Accessed December 2018.
2. Liu, V, GJ Escobar, Greene JD, et al. Hospital deaths in patients with sepsis from 2 independent cohorts. JAMA. 2014;312(1):90-92. https://doi.org/10.1001/jama.2014.5804.
3. Mozzafarian D, Benjamin EJ, Go AS, et al. Heart disease and stroke statistics—2016 update: a report from the American Heart Association. Circulation. 2016;133(4):e38-e360. https://doi.org/10.1161/CIR.0000000000000350.
4. Seymour CW, Gesten F, Prescott HC, et al. Time to treatment and mortality during mandated emergency care for sepsis. N Engl J Med. 2017;376(23):2235-2244. https://doi.org/10.1056/NEJMoa1703058.
5. Yancy CW, Jessup M, Bozkurt B, et al. 2016 ACC/AHA/HFSA focused update on new pharmacological therapy for heart failure: an update of the 2013 ACCF/AHA guideline for the management of heart failure: a report of the American College of Cardiology/American Heart Association Task Force on Clinical Practice Guidelines and the Heart Failure Society of America. Circulation. 2016;134(13):e282-e293. https://doi.org/10.1161/CIR.0000000000000460.
6. Warren JI, McLaughlin M, Bardsley J, et al. The strengths and challenges of implementing EBP in healthcare systems. Worldviews Evid Based Nurs. 2016;13(1):15-24. https://doi.org/10.1111/wvn.12149.
7. Hisham R, Ng CJ, Liew SM, Hamzah N, Ho GJ. Why is there variation in the practice of evidence-based medicine in primary care? A qualitative study. BMJ Open. 2016;6(3):e010565. https://doi.org/10.1136/bmjopen-2015-010565.
8. Boccuti C, Casillas G. Aiming for Fewer Hospital U-turns: The Medicare Hospital Readmission Reduction Program, The Henry J. Kaiser Family Foundation. https://www.kff.org/medicare/issue-brief/aiming-for-fewer-hospital-u-turns-the-medicare-hospital-readmission-reduction-program/. Accessed Mar 10, 2017.
9. Venkatesh AK, Slesinger T, Whittle J, et al. Preliminary performance on the new CMS sepsis-1 national quality measure: early insights from the emergency quality network (E-QUAL). Ann Emerg Med. 2018;71(1):10-15. https://doi.org/10.1016/j.annemergmed.2017.06.032.
10. Braithwaite, J. Changing how we think about healthcare improvement. BMJ. 2018;36:k2014. https://doi.org/10.1136/bmj.k2014.
11. Peabody JW, Luck J, Glassman P, Dresselhaus TR, Lee M. Comparison of vignettes, standardized patients, and chart abstraction: a prospective validation study of 3 methods for measuring quality. JAMA. 2000;283(13):1715-1722. PubMed
12. Peabody JW, Luck J, Glassman P, et al. Measuring the quality of physician practice by using clinical vignettes: a prospective validation study. Ann Intern Med. 2004;141(10):771-780. https://doi.org/10.7326/0003-4819-141-10-200411160-00008.
13. Peabody JW, Shimkhada S, Quimbo S, Solon O, Javier X, McCulloch C. The impact of performance incentives on health outcomes: results from a cluster randomized controlled trial in the Philippines. Health Policy Plan. 2014;29(5):615-621. https://doi.org/10.1093/heapol/czt047.
14. Weems L, Strong J, Plummer D, et al. A quality collaboration in heart failure and pneumonia inpatient care at Novant Health: standardizing hospitalist practices to improve patient care and system performance. Jt Comm J Qual Patient Saf. 2019;45(3):199-206. https://doi.org/10.1016/j.jcjq.2018.09.005.
15. Bergmann S, Tran M, Robison K, et al. Standardizing hospitalist practice in sepsis and COPD care. BMJ Qual Safety. 2019. https://doi.org/10.1136/bmjqs-2018-008829.
16. Chassin MR, Galvin RM. the National Roundtable on Health Care Quality. The urgent need to improve health care quality: Institute of Medicine National Roundtable on Health Care Quality. JAMA. 1998;280(11):1000-1005. https://doi.org/10.1001/jama.280.11.1000.
17. Gupta DM, Boland RJ, Aron DC. The physician’s experience of changing clinical practice: a struggle to unlearn. Implementation Sci. 2017;12(1):28. https://doi.org/10.1186/s13012-017-0555-2.
Sepsis and heart failure are two common, costly, and deadly conditions. Among hospitalized Medicare patients, these conditions rank as the first and second most frequent principal diagnoses accounting for over $33 billion in spending across all payers.1 One-third to one-half of all hospital deaths are estimated to occur in patients with sepsis,2 and heart failure is listed as a contributing factor in over 10% of deaths in the United States.3
Previous research shows that evidence-based care decisions can impact the outcomes for these patients. For example, sepsis patients receiving intravenous fluids, blood cultures, broad-spectrum antibiotics, and lactate measurement within three hours of presentation have lower mortality rates.4 In heart failure, key interventions such as the appropriate use of ACE inhibitors, beta blockers, and referral to disease management programs reduce morbidity and mortality.5
However, rapid dissemination and adoption of evidence-based guidelines remain a challenge.6,7 Policy makers have introduced incentives and penalties to support adoption, with varying levels of success. After four years of Centers for Medicare and Medicaid Services (CMS) penalties for hospitals with excess heart failure readmissions, only 21% performed well enough to avoid a penalty in 2017.8 CMS has been tracking sepsis bundle adherence as a core measure, but the rate in 2018 sat at just 54%.9 It is clear that new solutions are needed.10
AdventHealth (formerly Adventist Health System) is a growing, faith-based health system with hospitals across nine states. AdventHealth is a national leader in quality, safety, and patient satisfaction but is not immune to the challenges of delivering consistent, evidence-based care across an extensive network. To accelerate system-wide practice change, AdventHealth’s Office of Clinical Excellence (OCE) partnered with QURE Healthcare and Premier, Inc., to implement a physician engagement and care standardization collaboration involving nearly 100 hospitalists at eight facilities across five states.
This paper describes the results of the Adventist QURE Quality Project (AQQP), which used QURE’s validated, simulation-based measurement and feedback approach to engage hospitalists and standardize evidence-based practices for patients with sepsis and heart failure. We documented specific areas of variation identified in the simulations, how those practices changed through serial feedback, and the impact of those changes on real-world outcomes and costs.
METHODS
Setting
AdventHealth has its headquarters in Altamonte Springs, Florida. It has facilities in nine states, which includes 48 hospitals. The OCE is comprised of physician leaders, project managers, and data analysts who sponsored the project from July 2016 through July 2018.
Study Participants
AdventHealth hospitals were invited to enroll their hospitalists in AQQP; eight AdventHealth hospitals across five states, representing 91 physicians and 16 nurse practitioners/physician’s assistants (APPs), agreed to participate. Participants included both AdventHealth-employed providers and contracted hospitalist groups. Provider participation was voluntary and not tied to financial incentives; however, participants received Continuing Medical Education credit and, if applicable, Maintenance of Certification points through the American Board of Internal Medicine.
Quasi-experimental Design
We used AdventHealth hospitals not participating in AQQP as a quasi-experimental control group. We leveraged this to measure the impact of concurrent secular effects, such as order sets and other system-wide training, that could also improve practice and outcomes in our study.
Study Objectives and Approach
The explicit goals of AQQP were to (1) measure how sepsis and heart failure patients are cared for across AdventHealth using Clinical Performance and Value (CPV) case simulations, (2) provide a forum for hospitalists to discuss clinical variation, and (3) reduce unneeded variation to improve quality and reduce cost. QURE developed 12 CPV simulated patient cases (six sepsis and six heart failure cases) with case-specific evidenced-based scoring criteria tied to national and AdventHealth evidence-based guidelines. AdventHealth order sets were embedded in the cases and accessible by participants as they cared for their patients.
CPV vignettes are simulated patient cases administered online, and have been validated as an accurate and responsive measure of clinical decision-making in both ambulatory11-13 and inpatient settings.14,15 Cases take 20-30 minutes each to complete and simulate a typical clinical encounter: taking the medical history, performing a physical examination, ordering tests, making the diagnosis, implementing initial treatment, and outlining a follow-up plan. Each case has predefined, evidence-based scoring criteria for each care domain. Cases and scoring criteria were reviewed by AdventHealth hospitalist program leaders and physician leaders in OCE. Provider responses were double-scored by trained physician abstractors. Scores range from 0%-100%, with higher scores reflecting greater alignment with best practice recommendations.
In each round of the project, AQQP participants completed two CPV cases, received personalized online feedback reports on their care decisions, and met (at the various sites and via web conference) for a facilitated group discussion on areas of high group variation. The personal feedback reports included the participant’s case score compared to the group average, a list of high-priority personalized improvement opportunities, a summary of the cost of unneeded care items, and links to relevant references. The group discussions focused on six items of high variation. Six total rounds of CPV measurement and feedback were held, one every four months.
At the study’s conclusion, we administered a brief satisfaction survey, asking providers to rate various aspects of the project on a five-point Likert scale.
Data
The study used two primary data sources: (1) care decisions made in the CPV simulated cases and (2) patient-level utilization data from Premier Inc.’s QualityAdvisorTM (QA) data system. QA integrates quality, safety, and financial data from AdventHealth’s electronic medical record, claims data, charge master, and other resources. QualityAdvisor also calculates expected performance for critical measures, including cost per case and length of stay (LOS), based on a proprietary algorithm, which uses DRG classification, severity-of-illness, risk-of-mortality, and other patient risk factors. We pulled patient-level observed and expected data from AQQP qualifying physicians, defined as physicians participating in a majority of CPV measurement rounds. Of the 107 total hospitalists who participated, six providers did not participate in enough CPV rounds, and 22 providers left AdventHealth and could not be included in a patient-level impact analysis. These providers were replaced with 21 new hospitalists who were enrolled in the study and included in the CPV analysis but who did not have patient-level data before AQQP enrollment. Overall, 58 providers met the qualifying criteria to be included in the impact analysis. We compared their performance to a group of 96 hospitalists at facilities that were not participating in the project. Comparator facilities were selected based on quantitative measures of size and demographic matching the AQQP-facilities ensuring that both sets of hospitals (comparator and AQQP) exhibited similar levels of engagement with Advent- Health quality activities such as quality dashboard performance and order set usage. Baseline patient-level cost and LOS data covered from October 2015 to June 2016 and were re-measured annually throughout the project, from July 2016 to June 2018.
Statistical Analyses
We analyzed three primary outcomes: (1) general CPV-measured improvements in each round (scored against evidence-based scoring criteria); (2) disease-specific CPV improvements over each round; and (3) changes in patient-level outcomes and economic savings among AdventHealth pneumonia/sepsis and heart failure patients from the aforementioned improvements. We used Student’s t-test to analyze continuous outcome variables (including CPV, cost of care, and length of stay data) and Fisher’s exact test for binary outcome data. All statistical analyses were performed using Stata 14.2 (StataCorp LLC, College Station, Texas).
RESULTS
Baseline Characteristics and Assessment
A total of 107 AdventHealth hospitalists participated in this study (Appendix Table 1). 78.1% of these providers rated the organization’s focus on quality and lowering unnecessary costs as either “good” or “excellent,” but 78.8% also reported that variation in care provided by the group was “moderate” to “very high”.
At baseline, we observed high variability in the care of pneumonia patients with sepsis (pneumonia/sepsis) and heart failure patients as measured by the care decisions obtained in the CPV cases. The overall quality score, which is a weighted average across all domains, averaged 61.9% ± 10.5% for the group (Table 1). Disaggregating scores by condition, we found an average overall score of 59.4% ± 10.9% for pneumonia/sepsis and 64.4% ± 9.4% for heart failure. The diagnosis and treatment domains, which require the most clinical judgment, had the lowest average domain scores of 53.4% ± 20.9% and 51.6% ± 15.1%, respectively.
Changes in CPV Scores
To determine the impact of serial measurement and feedback, we compared performance in the first two rounds of the project with the last two rounds. We found that overall CPV quality scores showed a 4.8%-point absolute improvement (P < .001; Table 1). We saw improvements in all care domains, and those increases were significant in all but the workup (P = .470); the most significant increase was in diagnostic accuracy (+19.1%; P < .001).
By condition, scores showed similar, statistically significant overall improvements: +4.4%-points for pneumonia/sepsis (P = .001) and +5.5%-points for heart failure (P < .001) driven by increases in the diagnosis and treatment domains. For example, providers increased appropriate identification of HF severity by 21.5%-points (P < .001) and primary diagnosis of pneumonia/sepsis by 3.6%-points (P = .385).
In the treatment domain, which included clinical decisions related to initial management and follow-up care, there were several specific improvements. For HF, we found that performing all the essential treatment elements—prescribing diuretics, ACE inhibitors and beta blockers for appropriate patients—improved by 13.9%-points (P = .038); ordering VTE prophylaxis increased more than threefold, from 16.6% to 51.0% (P < .001; Table 2). For pneumonia/sepsis patients, absolute adherence to all four elements of the 3-hour sepsis bundle improved by 11.7%-points (P = .034). We also saw a decrease in low-value diagnostic workup items for patient cases in which the guidelines suggest they are not needed, such as urinary antigen testing, which declined by 14.6%-points (P = .001) and sputum cultures, which declined 26.4%-points (P = .004). In addition, outlining an evidence-based discharge plan including a follow-up visit, patient education and medication reconciliation improved, especially for pneumonia/sepsis patients by 24.3%-points (P < .001).
Adherence to AdventHealth-preferred, evidence-based empiric antibiotic regimens was only 41.1% at baseline, but by the third round, adherence to preferred antibiotics had increased by 37% (P = .047). In the summer of 2017, after the third round, we updated scoring criteria for the cases to align with new AdventHealth-preferred antibiotic regimens. Not surprisingly, when the new antibiotic regimens were introduced, CPV-measured adherence to the new guidelines then regressed to nearly baseline levels (42.4%) as providers adjusted to the new recommendations. However, by the end of the final round, AdventHealth-preferred antibiotics orders improved by 12%.
Next, we explored whether the improvements seen were due to the best performers getting better, which was not the case. At baseline the bottom-half performers scored 10.7%-points less than top-half performers but, over the course of the study, we found that the bottom half performers had an absolute improvement nearly two times of those in the top half (+5.7%-points vs +2.9%-points; P = .006), indicating that these bottom performers were able to close the gap in quality-of-care provided. In particular, these bottom performers improved the accuracy of their primary diagnosis by 16.7%-points, compared to a 2.0%-point improvement for the top-half performers.
Patient-Level Impact on LOS and Cost Per Case
We took advantage of the quasi-experimental design, in which only a portion of AdventHealth facilities participated in the project, to compare patient-level results from AQQP-participating physicians against the engagement-matched cohort of hospitalists at nonparticipating AdventHealth facilities. We adjusted for potential differences in patient-level case mix between the two groups by comparing the observed/expected (O/E) LOS and cost per case ratios for pneumonia/sepsis and heart failure patients.
At baseline, AQQP-hospitalists performed better on geometric LOS versus the comparator group (O/E of 1.13 vs 1.22; P = .006) but at about the same on cost per case (O/E of 1.16 vs 1.14; P = .390). Throughout the project, as patient volumes and expected per patient costs rose for both groups, O/E ratios improved among both AQQP and non-AQQP providers.
To set apart the contribution of system-wide improvements from the AQQP project-specific impacts, we applied the O/E improvement rates seen in the comparator group to the AQQP group baseline performance. We then compared that to the actual changes seen in the AQQP throughout the project to see if there was any additional benefit from the simulation measurement and feedback (Figure).
From baseline through year one of the project, the O/E LOS ratio decreased by 8.0% in the AQQP group (1.13 to 1.04; P = .004) and only 2.5% in the comparator group (1.22 to 1.19; P = .480), which is an absolute difference-in-difference of 0.06 LOS O/E. In year 1, these improvements represent a reduction in 892 patient days among patients cared for by AQQP-hospitalists of which 570 appear to be driven by the AQQP intervention and 322 attributable to secular system-wide improvements (Table 3). In year two, both groups continued to improve with the comparator group catching up to the AQQP group.
Geometric mean O/E cost per case also decreased for both AQQP (1.16 Baseline vs 0.98 Year 2; P < .001) and comparator physicians (1.14 Baseline vs 1.01 Year 2; P = .002), for an absolute difference-in-difference of 0.05 cost O/E. However, the AQQP-hospitalists showed greater improvement (15% vs 12%; P = .346; Table 3). As in the LOS analysis, the AQQP-specific impact on cost was markedly accelerated in year one, accounting for $1.6 million of the estimated $2.6 million total savings that year. Over the two-year project, these combined improvements drove an estimated $6.2 million in total savings among AQQP-hospitalists: $3.8 million of this appear to be driven by secular system effects and, based upon our quasi-experimental design, an additional $2.4 million of which are attributable to participation in AQQP.
A Levene’s test for equality of variances on the log-transformed costs and LOS shows that the AQQP reductions in costs and LOS come from reduced variation among providers. Throughout the project, the standard deviation in LOS was reduced by 4.3%, from 3.8 days to 3.6 days (P = .046) and costs by 27.7%, from $9,391 to $6,793 (P < .001). The non-AQQP group saw a smaller, but still significant 14.6% reduction in cost variation (from $9,928 to $8,482), but saw a variation in LOS increase significantly by 20.6%, from 4.1 days to 5.0 days (P < .001).
Provider Satisfaction
At the project conclusion, we administered a brief survey. Participants were asked to rate aspects of the project (a five-point Likert scale with five being the highest), and 24 responded. The mean ratings of the relevance of the project to their practice and the overall quality of the material were 4.5 and 4.2, respectively. Providers found the individual feedback reports (3.9) slightly more helpful than the webcast group discussions (3.7; Appendix Table 2 ).
DISCUSSION
As health systems expand, the opportunity to standardize clinical practice within a system has the potential to enhance patient care and lower costs. However, achieving these goals is challenging when providers are dispersed across geographically separated sites and clinical decision-making is difficult to measure in a standardized way.16,17 We brought together over 100 physicians and APPs from eight different-sized hospitals in five different states to prospectively determine if we could improve care using a standardized measurement and feedback system. At baseline, we found that care varied dramatically among providers. Care varied in terms of diagnostic accuracy and treatment, which directly relate to care quality and outcomes.4 After serial measurement and feedback, we saw reductions in unnecessary testing, more guideline-based treatment decisions, and better discharge planning in the clinical vignettes.
We confirmed that changes in CPV-measured practice translated into lower costs and shorter LOS at the patient level. We further validated the improvements through a quasi-experimental design that compared these changes to those at nonparticipating AdventHealth facilities. We saw more significant cost reductions and decreases in LOS in the simulation-based measurement and feedback cohort with the biggest impact early on. The overall savings to the system, attributable specifically to the AQQP approach, is estimated to be $2.4 million.
One advantage of the online case simulation approach is the ability to bring geographically remote sites together in a shared quality-of-care discussion. The interventions specifically sought to remove barriers between facilities. For example, individual feedback reports allowed providers to see how they compare with providers at other AdventHealth facilities and webcast results discussions enable providers across facilities to discuss specific care decisions.
There were several limitations to the study. While the quasi-experimental design allowed us to make informative comparisons between AQQP-participating facilities and nonparticipating facilities, the assignments were not random, and participants were generally from higher performing hospital medicine groups. The determination of secular versus CPV-related improvement is confounded by other system improvement initiatives that may have impacted cost and LOS results. This is mitigated by the observation that facilities that opted to participate performed better at baseline in risk-adjusted LOS but slightly worse in cost per case, indicating that baseline differences were not dramatic. While both groups improved over time, the QURE measurement and feedback approach led to larger and more rapid gains than those seen in the comparator group. However, we could not exclude the potential that project participation at the site level was biased to those groups disposed to performance improvement. In addition, our patient-level data analysis was limited to the metrics available and did not allow us to directly compare patient-level performance across the plethora of clinically relevant CPV data that showed improvement. Our inpatient cost per case analysis showed significant savings for the system but did not include all potentially favorable economic impacts such as lower follow-up care costs for patients, more accurate reimbursement through better coding or fewer lost days of productivity.
With continued consolidation in healthcare and broader health systems spanning multiple geographies, new tools are needed to support standardized, evidence-based care across sites. This standardization is especially important, both clinically and financially, for high-volume, high-cost diseases such as sepsis and heart failure. However, changing practice cannot happen without collaborative engagement with providers. Standardized patient vignettes are an opportunity to measure and provide feedback in a systematic way that engages providers and is particularly well-suited to large systems and common clinical conditions. This analysis, from a real-world study, shows that an approach that standardizes care and lowers costs may be particularly helpful for large systems needing to bring disparate sites together as they concurrently move toward value-based payment.
Disclosures
QURE, LLC, whose intellectual property was used to prepare the cases and collect the data, was contracted by AdventHealth. Otherwise, any of the study authors report no potential conflicts to disclose.
Funding
This work was funded by a contract between AdventHealth (formerly Adventist Health System) and QURE, LLC.
1. Torio C, Moore B. National inpatient hospital costs: the most expensive conditions by payer, 2013. HCUP Statistical Brief #204. Published May 2016 http://www.hcup-us.ahrq.gov/reports/statbriefs/sb204-Most-Expensive-Hospital-Conditions.pdf. Accessed December 2018.
2. Liu, V, GJ Escobar, Greene JD, et al. Hospital deaths in patients with sepsis from 2 independent cohorts. JAMA. 2014;312(1):90-92. https://doi.org/10.1001/jama.2014.5804.
3. Mozzafarian D, Benjamin EJ, Go AS, et al. Heart disease and stroke statistics—2016 update: a report from the American Heart Association. Circulation. 2016;133(4):e38-e360. https://doi.org/10.1161/CIR.0000000000000350.
4. Seymour CW, Gesten F, Prescott HC, et al. Time to treatment and mortality during mandated emergency care for sepsis. N Engl J Med. 2017;376(23):2235-2244. https://doi.org/10.1056/NEJMoa1703058.
5. Yancy CW, Jessup M, Bozkurt B, et al. 2016 ACC/AHA/HFSA focused update on new pharmacological therapy for heart failure: an update of the 2013 ACCF/AHA guideline for the management of heart failure: a report of the American College of Cardiology/American Heart Association Task Force on Clinical Practice Guidelines and the Heart Failure Society of America. Circulation. 2016;134(13):e282-e293. https://doi.org/10.1161/CIR.0000000000000460.
6. Warren JI, McLaughlin M, Bardsley J, et al. The strengths and challenges of implementing EBP in healthcare systems. Worldviews Evid Based Nurs. 2016;13(1):15-24. https://doi.org/10.1111/wvn.12149.
7. Hisham R, Ng CJ, Liew SM, Hamzah N, Ho GJ. Why is there variation in the practice of evidence-based medicine in primary care? A qualitative study. BMJ Open. 2016;6(3):e010565. https://doi.org/10.1136/bmjopen-2015-010565.
8. Boccuti C, Casillas G. Aiming for Fewer Hospital U-turns: The Medicare Hospital Readmission Reduction Program, The Henry J. Kaiser Family Foundation. https://www.kff.org/medicare/issue-brief/aiming-for-fewer-hospital-u-turns-the-medicare-hospital-readmission-reduction-program/. Accessed Mar 10, 2017.
9. Venkatesh AK, Slesinger T, Whittle J, et al. Preliminary performance on the new CMS sepsis-1 national quality measure: early insights from the emergency quality network (E-QUAL). Ann Emerg Med. 2018;71(1):10-15. https://doi.org/10.1016/j.annemergmed.2017.06.032.
10. Braithwaite, J. Changing how we think about healthcare improvement. BMJ. 2018;36:k2014. https://doi.org/10.1136/bmj.k2014.
11. Peabody JW, Luck J, Glassman P, Dresselhaus TR, Lee M. Comparison of vignettes, standardized patients, and chart abstraction: a prospective validation study of 3 methods for measuring quality. JAMA. 2000;283(13):1715-1722. PubMed
12. Peabody JW, Luck J, Glassman P, et al. Measuring the quality of physician practice by using clinical vignettes: a prospective validation study. Ann Intern Med. 2004;141(10):771-780. https://doi.org/10.7326/0003-4819-141-10-200411160-00008.
13. Peabody JW, Shimkhada S, Quimbo S, Solon O, Javier X, McCulloch C. The impact of performance incentives on health outcomes: results from a cluster randomized controlled trial in the Philippines. Health Policy Plan. 2014;29(5):615-621. https://doi.org/10.1093/heapol/czt047.
14. Weems L, Strong J, Plummer D, et al. A quality collaboration in heart failure and pneumonia inpatient care at Novant Health: standardizing hospitalist practices to improve patient care and system performance. Jt Comm J Qual Patient Saf. 2019;45(3):199-206. https://doi.org/10.1016/j.jcjq.2018.09.005.
15. Bergmann S, Tran M, Robison K, et al. Standardizing hospitalist practice in sepsis and COPD care. BMJ Qual Safety. 2019. https://doi.org/10.1136/bmjqs-2018-008829.
16. Chassin MR, Galvin RM. the National Roundtable on Health Care Quality. The urgent need to improve health care quality: Institute of Medicine National Roundtable on Health Care Quality. JAMA. 1998;280(11):1000-1005. https://doi.org/10.1001/jama.280.11.1000.
17. Gupta DM, Boland RJ, Aron DC. The physician’s experience of changing clinical practice: a struggle to unlearn. Implementation Sci. 2017;12(1):28. https://doi.org/10.1186/s13012-017-0555-2.
© 2019 Society of Hospital Medicine
Documentation of Clinical Reasoning in Admission Notes of Hospitalists: Validation of the CRANAPL Assessment Rubric
Approximately 60,000 hospitalists were working in the United States in 2018.1 Hospitalist groups work collaboratively because of the shiftwork required for 24/7 patient coverage, and first-rate clinical documentation is essential for quality care.2 Thoughtful clinical documentation not only transmits one provider’s clinical reasoning to other providers but is a professional responsibility.3 Hospitalists spend two-thirds of their time in indirect patient-care activities and approximately one quarter of their time on documentation in electronic health records (EHRs).4 Despite documentation occupying a substantial portion of the clinician’s time, published literature on the best practices for the documentation of clinical reasoning in hospital medicine or its assessment remains scant.5-7
Clinical reasoning involves establishing a diagnosis and developing a therapeutic plan that fits the unique circumstances and needs of the patient.8 Inpatient providers who admit patients to the hospital end the admission note with their assessment and plan (A&P) after reflecting about a patient’s presenting illness. The A&P generally represents the interpretations, deductions, and clinical reasoning of the inpatient providers; this is the section of the note that fellow physicians concentrate on over others.9 The documentation of clinical reasoning in the A&P allows for many to consider how the recorded interpretations relate to their own elucidations resulting in distributed cognition.10
Disorganized documentation can contribute to cognitive overload and impede thoughtful consideration about the clinical presentation.3 The assessment of clinical documentation may translate into reduced medical errors and improved note quality.11,12 Studies that have formally evaluated the documentation of clinical reasoning have focused exclusively on medical students.13-15 The nonexistence of a detailed rubric for evaluating clinical reasoning in the A&Ps of hospitalists represents a missed opportunity for evaluating
METHODS
Study Design, Setting, and Subjects
This was a retrospective study that reviewed the admission notes of hospitalists for patients admitted over the period of January 2014 and October 2017 at three hospitals in Maryland. One is a community hospital (Hospital A) and two are academic medical centers (Hospital B and Hospital C). Even though these three hospitals are part of one health system, they have distinct cultures and leadership, serve different populations, and are staffed by different provider teams.
The notes of physicians working for the hospitalist groups at each of the three hospitals were the focus of the analysis in this study.
Development of the Documentation Assessment Rubric
A team was assembled to develop the Clinical Reasoning in Admission Note Assessment & PLan (CRANAPL) tool. The CRANAPL was designed to assess the comprehensiveness and thoughtfulness of the clinical reasoning documented in the A&P sections of the notes of patients who were admitted to the hospital with an acute illness. Validity evidence for CRANAPL was summarized on the basis of Messick’s unified validity framework by using four of the five sources of validity: content, response process, internal structure, and relations to other variables.17
Content Validity
The development team consisted of members who have an average of 10 years of clinical experience in hospital medicine; have studied clinical excellence and clinical reasoning; and have expertise in feedback, assessment, and professional development.18-22 The development of the CRANAPL tool by the team was informed by a review of the clinical reasoning literature, with particular attention paid to the standards and competencies outlined by the Liaison Committee on Medical Education, the Association of American Medical Colleges, the Accreditation Council on Graduate Medical Education, the Internal Medicine Milestone Project, and the Society of Hospital Medicine.23-26 For each of these parties, diagnostic reasoning and its impact on clinical decision-making are considered to be a core competency. Several works that heavily influenced the CRANAPL tool’s development were Baker’s Interpretive Summary, Differential Diagnosis, Explanation of Reasoning, And Alternatives (IDEA) assessment tool;14 King’s Pediatric History and Physical Exam Evaluation (P-HAPEE) rubric;15 and three other studies related to diagnostic reasoning.16,27,28 These manuscripts and other works substantively informed the preliminary behavioral-based anchors that formed the initial foundation for the tool under development. The CRANAPL tool was shown to colleagues at other institutions who are leaders on clinical reasoning and was presented at academic conferences in the Division of General Internal Medicine and the Division of Hospital Medicine of our institution. Feedback resulted in iterative revisions. The aforementioned methods established content validity evidence for the CRANAPL tool.
Response Process Validity
Several of the authors pilot-tested earlier iterations on admission notes that were excluded from the sample when refining the CRANAPL tool. The weaknesses and sources of confusion with specific items were addressed by scoring 10 A&Ps individually and then comparing data captured on the tool. This cycle was repeated three times for the iterative enhancement and finalization of the CRANAPL tool. On several occasions when two authors were piloting the near-final CRANAPL tool, a third author interviewed each of the two authors about reactivity while assessing individual items and exploring with probes how their own clinical documentation practices were being considered when scoring the notes. The reasonable and thoughtful answers provided by the two authors as they explained and justified the scores they were selecting during the pilot testing served to confer response process validity evidence.
Finalizing the CRANAPL Tool
The nine-item CRANAPL tool includes elements for problem representation, leading diagnosis, uncertainty, differential diagnosis, plans for diagnosis and treatment, estimated length of stay (LOS), potential for upgrade in status to a higher level of care, and consideration of disposition. Although the final three items are not core clinical reasoning domains in the medical education literature, they represent clinical judgments that are especially relevant for the delivery of the high-quality and cost-effective care of hospitalized patients. Given that the probabilities and estimations of these three elements evolve over the course of any hospitalization on the basis of test results and response to therapy, the documentation of initial expectations on these fronts can facilitate distributed cognition with all individuals becoming wiser from shared insights.10 The tool uses two- and three-point rating scales, with each number score being clearly defined by specific written criteria (total score range: 0-14; Appendix).
Data Collection
Hospitalists’ admission notes from the three hospitals were used to validate the CRANAPL tool. Admission notes from patients hospitalized to the general medical floors with an admission diagnosis of either fever, syncope/dizziness, or abdominal pain were used. These diagnoses were purposefully examined because they (1) have a wide differential diagnosis, (2) are common presenting symptoms, and (3) are prone to diagnostic errors.29-32
The centralized EHR system across the three hospitals identified admission notes with one of these primary diagnoses of patients admitted over the period of January 2014 to October 2017. We submitted a request for 650 admission notes to be randomly selected from the centralized institutional records system. The notes were stratified by hospital and diagnosis. The sample size of our study was comparable with that of prior psychometric validation studies.33,34 Upon reviewing the A&Ps associated with these admissions, 365 notes were excluded for one of three reasons: (1) the note was written by a nurse practitioner, physician assistant, resident, or medical student; (2) the admission diagnosis had been definitively confirmed in the emergency department (eg, abdominal pain due to diverticulitis seen on CT); and (3) the note represented the fourth or more note by any single provider (to sample notes of many providers, no more than three notes written by any single provider were analyzed). A total of 285 admission notes were ultimately included in the sample.
Data were deidentified, and the A&P sections of the admission notes were each copied from the EHR into a unique Word document. Patient and hospital demographic data (including age, gender, race, number of comorbid conditions, LOS, hospital charges, and readmission to the same health system within 30 days) were collected separately from the EHR. Select physician characteristics were also collected from the hospitalist groups at each of the three hospitals, as was the length (word count) of each A&P.
The study was approved by our institutional review board.
Data Analysis
Two authors scored all deidentified A&Ps by using the finalized version of the CRANAPL tool. Prior to using the CRANAPL tool on each of the notes, these raters read each A&P and scored them by using two single-item rating scales: a global clinical reasoning and a global readability/clarity measure. Both of these global scales used three-item Likert scales (below average, average, and above average). These global rating scales collected the reviewers’ gestalt about the quality and clarity of the A&P. The use of gestalt ratings as comparators is supported by other research.35
Descriptive statistics were computed for all variables. Each rater rescored a sample of 48 records (one month after the initial scoring) and intraclass correlations (ICCs) were computed for intrarater reliability. ICCs were calculated for each item and for the CRANAPL total to determine interrater reliability.
The averaged ratings from the two raters were used for all other analyses. For CRANAPL’s internal structure validity evidence, Cronbach’s alpha was calculated as a measure of internal consistency. For relations to other variables validity evidence, CRANAPL total scores were compared with the two global assessment variables with linear regressions.
Bivariate analyses were performed by applying parametric and nonparametric tests as appropriate. A series of multivariate linear regressions, controlling for diagnosis and clustered variance by hospital site, were performed using CRANAPL total as the dependent variable and patient variables as predictors.
All data were analyzed using Stata (StataCorp. 2013. Stata Statistical Software: Release 13. College Station, Texas: StataCorp LP.)
RESULTS
The admission notes of 120 hospitalists were evaluated (Table 1). A total of 39 (33%) physicians were moonlighters with primary appointments outside of the hospitalist division, and 81 (68%) were full-time hospitalists. Among the 120 hospitalists, 48 (40%) were female, 60 (50%) were international medical graduates, and 90 (75%) were of nonwhite race. Most hospitalist physicians (n = 47, 58%) had worked in our health system for less than five years, and 64 hospitalists (53%) devoted greater than 50% of their time to patient care.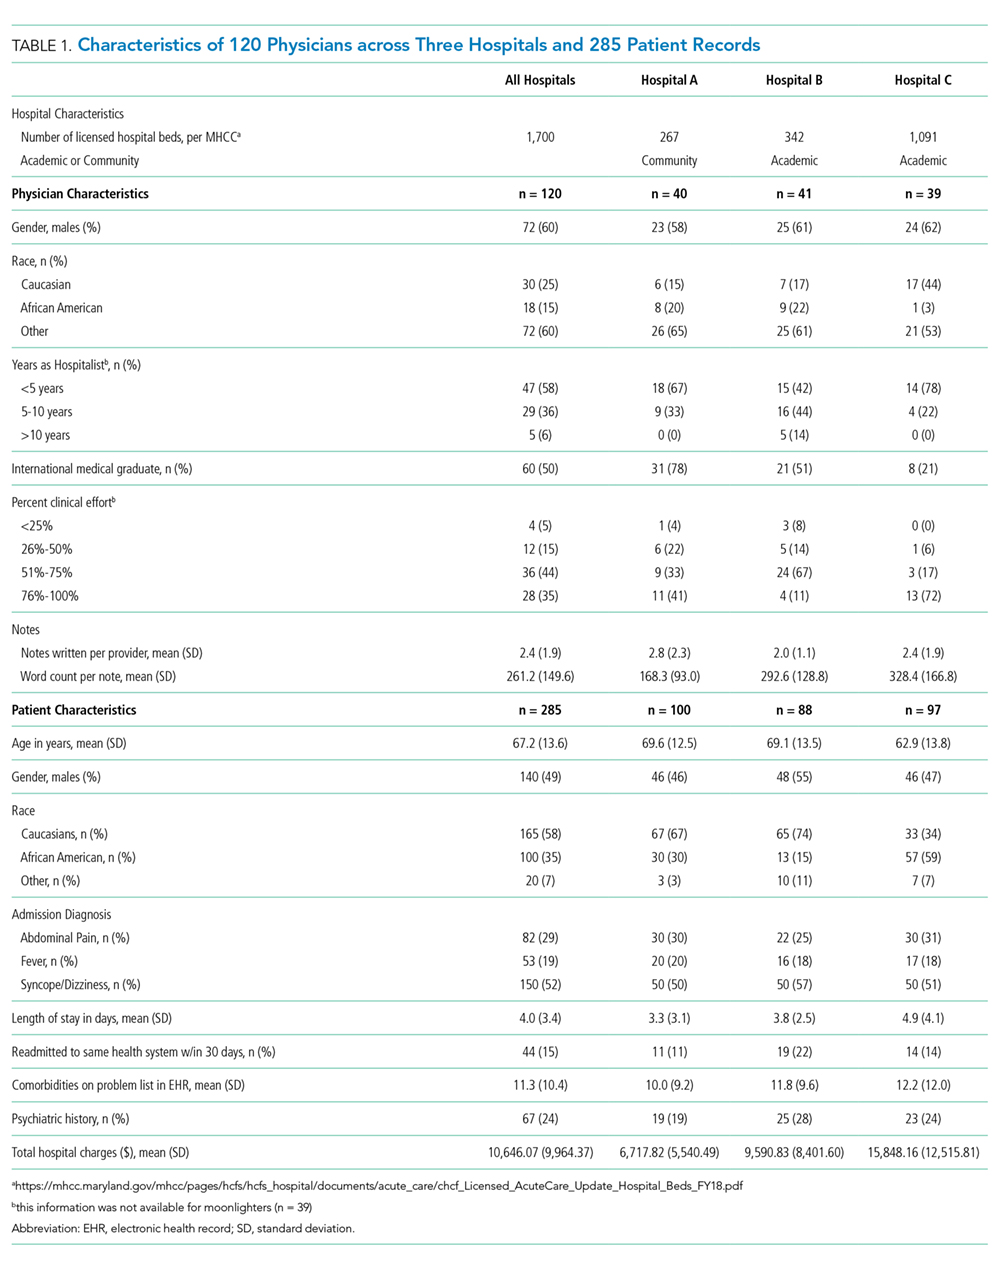
Approximately equal numbers of patient admission notes were pulled from each of the three hospitals. The average age of patients was 67.2 (SD 13.6) years, 145 (51%) were female, and 120 (42%) were of nonwhite race. The mean LOS for all patients was 4.0 (SD 3.4) days. A total of 44 (15%) patients were readmitted to the same health system within 30 days of discharge. None of the patients died during the incident hospitalization. The average charge for each of the hospitalizations was $10,646 (SD $9,964).
CRANAPL Data
Figure 1 shows the distribution of the scores given by each rater for each of the nine items. The mean of the total CRANAPL score given by both raters was 6.4 (SD 2.2). Scoring for some items were high (eg, summary statement: 1.5/2), whereas performance on others were low (eg, estimating LOS: 0.1/1 and describing the potential need for upgrade in care: 0.0/1).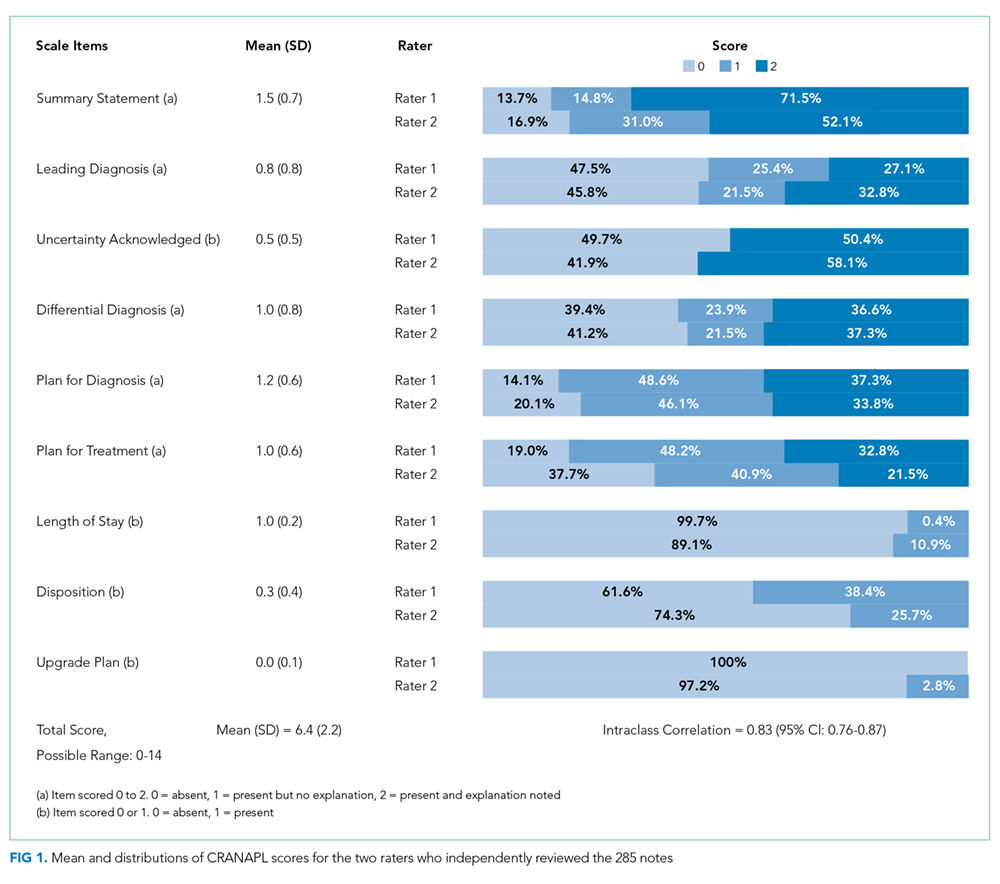
Validity of the CRANAPL Tool’s Internal Structure
Cronbach’s alpha, which was used to measure internal consistency within the CRANAPL tool, was 0.43. The ICC, which was applied to measure the interrater reliability for both raters for the total CRANAPL score, was 0.83 (95% CI: 0.76-0.87). The ICC values for intrarater reliability for raters 1 and 2 were 0.73 (95% CI: 0.60-0.83) and 0.73 (95% CI: 0.45-0.86), respectively.
Relations to Other Variables Validity
Associations between CRANAPL total scores, global clinical reasoning, and global scores for note readability/clarity were statistically significant (P < .001), Figure 2.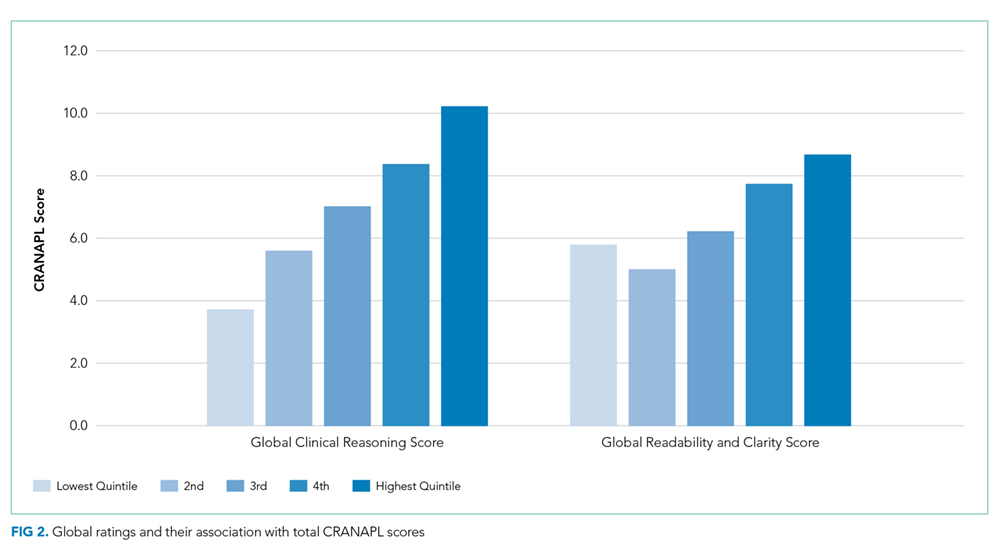
Eight out of nine CRANAPL variables were statistically significantly different across the three hospitals (P <. 01) when data were analyzed by hospital site. Hospital C had the highest mean score of 7.4 (SD 2.0), followed by Hospital B with a score of 6.6 (SD 2.1), and Hospital A had the lowest total CRANAPL score of 5.2 (SD 1.9). This difference was statistically significant (P < .001). Five variables with respect to admission diagnoses (uncertainty acknowledged, differential diagnosis, plan for diagnosis, plan for treatment, and upgrade plan) were statistically significantly different across notes. Notes for syncope/dizziness generally yielded higher scores than those for abdominal pain and fever.
Factors Associated with High CRANAPL Scores
Table 2 shows the associations between CRANAPL scores and several covariates. Before adjustment, high CRANAPL scores were associated with high word counts of A&Ps (P < .001) and high hospital charges (P < .05). These associations were no longer significant after adjusting for hospital site and admitting diagnoses.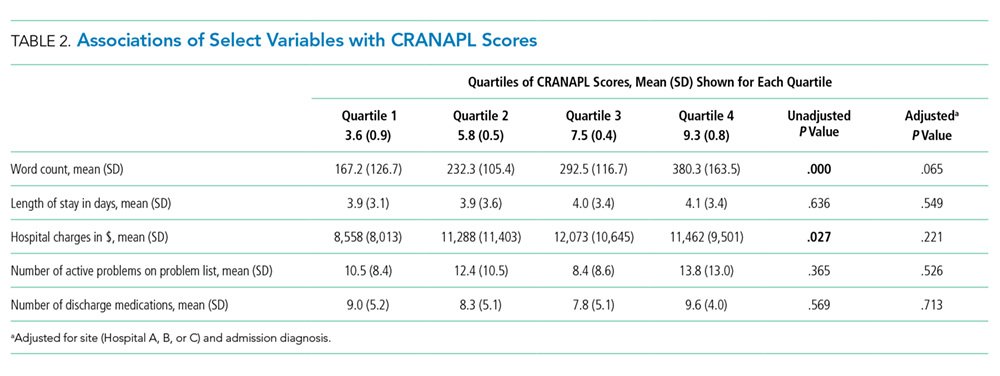
DISCUSSION
We reviewed the documentation of clinical reasoning in 285 admission notes at three different hospitals written by hospitalist physicians during routine clinical care. To our knowledge, this is the first study that assessed the documentation of hospitalists’ clinical reasoning with real patient notes. Wide variability exists in the documentation of clinical reasoning within the A&Ps of hospitalists’ admission notes. We have provided validity evidence to support the use of the user-friendly CRANAPL tool.
Prior studies have described rubrics for evaluating the clinical reasoning skills of medical students.14,15 The ICCs for the IDEA rubric used to assess medical students’ documentation of clinical reasoning were fair to moderate (0.29-0.67), whereas the ICC for the CRANAPL tool was high at 0.83. This measure of reliability is similar to that for the P-HAPEE rubric used to assess medical students’ documentation of pediatric history and physical notes.15 These data are markedly different from the data in previous studies that have found low interrater reliability for psychometric evaluations related to judgment and decision-making.36-39 CRANAPL was also found to have high intrarater reliability, which shows the reproducibility of an individual’s assessment over time. The strong association between the total CRANAPL score and global clinical reasoning assessment found in the present study is similar to that found in previous studies that have also embedded global rating scales as comparators when assessing clinical reasoning.13,,15,40,41 Global rating scales represent an overarching structure for comparison given the absence of an accepted method or gold standard for assessing clinical reasoning documentation. High-quality provider notes are defined by clarity, thoroughness, and accuracy;35 and effective documentation promotes communication and the coordination of care among the members of the care team.3
The total CRANAPL scores varied by hospital site with academic hospitals (B and C) scoring higher than the community hospital (A) in our study. Similarly, lengthy A&Ps were associated with high CRANAPL scores (P < .001) prior to adjustment for hospital site. Healthcare providers consider that the thoroughness of documentation denotes quality and attention to detail.35,42 Comprehensive documentation takes time; the longer notes by academic hospitalists than those by community hospitalists may be attributed to the fewer number of patients generally carried by hospitalists at academic centers than that by hospitalists at community hospitals.43
The documentation of the estimations of LOS, possibility of potential upgrade, and thoughts about disposition were consistently poorly described across all hospital sites and diagnoses. In contrast to CRANAPL, other clinical reasoning rubrics have excluded these items or discussed uncertainty.14,15,44 These elements represent the forward thinking that may be essential for high-quality progressive care by hospitalists. Physicians’s difficulty in acknowledging uncertainty has been associated with resource overuse, including the excessive ordering of tests, iatrogenic injury, and heavy financial burden on the healthcare system.45,46 The lack of thoughtful clinical and management reasoning at the time of admission is believed to be associated with medical errors.47 If used as a guide, the CRANAPL tool may promote reflection on the part of the admitting physician. The estimations of LOS, potential for upgrade to a higher level of care, and disposition are markers of optimal inpatient care, especially for hospitalists who work in shifts with embedded handoffs. When shared with colleagues (through documentation), there is the potential for distributed cognition10 to extend throughout the social network of the hospitalist group. The fact that so few providers are currently including these items in their A&P’s show that the providers are either not performing or documenting the ‘reasoning’. Either way, this is an opportunity that has been highlighted by the CRANAPL tool.
Several limitations of this study should be considered. First, the CRANAPL tool may not have captured elements of optimal clinical reasoning documentation. The reliance on multiple methods and an iterative process in the refinement of the CRANAPL tool should have minimized this. Second, this study was conducted across a single healthcare system that uses the same EHR; this EHR or institutional culture may influence documentation practices and behaviors. Given that using the CRANAPL tool to score an A&P is quick and easy, the benefit of giving providers feedback on their notes remains to be seen—here and at other hospitals. Third, our sample size could limit the generalizability of the results and the significance of the associations. However, the sample assessed in our study was significantly larger than that assessed in other studies that have validated clinical reasoning rubrics.14,15 Fourth, clinical reasoning is a broad and multidimensional construct. The CRANAPL tool focuses exclusively on hospitalists’ documentation of clinical reasoning and therefore does not assess aspects of clinical reasoning occurring in the physicians’ minds. Finally, given our goal to optimally validate the CRANAPL tool, we chose to test the tool on specific presentations that are known to be associated with diagnostic practice variation and errors. We may have observed different results had we chosen a different set of diagnoses from each hospital. Further validity evidence will be established when applying the CRANPL tool to different diagnoses and to notes from other clinical settings.
In conclusion, this study focuses on the development and validation of the CRANAPL tool that assesses how hospitalists document their clinical reasoning in the A&P section of admission notes. Our results show that wide variability exists in the documentation of clinical reasoning by hospitalists within and across hospitals. Given the CRANAPL tool’s ease-of-use and its versatility, hospitalist divisions in academic and nonacademic settings may use the CRANAPL tool to assess and provide feedback on the documentation of hospitalists’ clinical reasoning. Beyond studying whether physicians can be taught to improve their notes with feedback based on the CRANAPL tool, future studies may explore whether enhancing clinical reasoning documentation may be associated with improvements in patient care and clinical outcomes.
Acknowledgments
Dr. Wright is the Anne Gaines and G. Thomas Miller Professor of Medicine which is supported through Hopkins’ Center for Innovative Medicine.
The authors thank Christine Caufield-Noll, MLIS, AHIP (Johns Hopkins Bayview Medical Center, Baltimore, Maryland) for her assistance with this project.
Disclosures
The authors have nothing to disclose.
1. State of Hospital Medicine. Society of Hospital Medicine. https://www.hospitalmedicine.org/practice-management/shms-state-of-hospital-medicine/. Accessed August 19, 2018.
2. Mehta R, Radhakrishnan NS, Warring CD, et al. The use of evidence-based, problem-oriented templates as a clinical decision support in an inpatient electronic health record system. Appl Clin Inform. 2016;7(3):790-802. https://doi.org/10.4338/ACI-2015-11-RA-0164
3. Improving Diagnosis in Healthcare: Health and Medicine Division. http://www.nationalacademies.org/hmd/Reports/2015/Improving-Diagnosis-in-Healthcare.aspx. Accessed August 7, 2018.
4. Tipping MD, Forth VE, O’Leary KJ, et al. Where did the day go? A time-motion study of hospitalists. J Hosp Med. 2010;5(6):323-328. https://doi.org/10.1002/jhm.790
5. Varpio L, Rashotte J, Day K, King J, Kuziemsky C, Parush A. The EHR and building the patient’s story: a qualitative investigation of how EHR use obstructs a vital clinical activity. Int J Med Inform. 2015;84(12):1019-1028. https://doi.org/10.1016/j.ijmedinf.2015.09.004
6. Clynch N, Kellett J. Medical documentation: part of the solution, or part of the problem? A narrative review of the literature on the time spent on and value of medical documentation. Int J Med Inform. 2015;84(4):221-228. https://doi.org/10.1016/j.ijmedinf.2014.12.001
7. Varpio L, Day K, Elliot-Miller P, et al. The impact of adopting EHRs: how losing connectivity affects clinical reasoning. Med Educ. 2015;49(5):476-486. https://doi.org/10.1111/medu.12665
8. McBee E, Ratcliffe T, Schuwirth L, et al. Context and clinical reasoning: understanding the medical student perspective. Perspect Med Educ. 2018;7(4):256-263. https://doi.org/10.1007/s40037-018-0417-x
9. Brown PJ, Marquard JL, Amster B, et al. What do physicians read (and ignore) in electronic progress notes? Appl Clin Inform. 2014;5(2):430-444. https://doi.org/10.4338/ACI-2014-01-RA-0003
10. Katherine D, Shalin VL. Creating a common trajectory: Shared decision making and distributed cognition in medical consultations. https://pxjournal.org/cgi/viewcontent.cgi?article=1116&context=journal Accessed April 4, 2019.
11. Harchelroad FP, Martin ML, Kremen RM, Murray KW. Emergency department daily record review: a quality assurance system in a teaching hospital. QRB Qual Rev Bull. 1988;14(2):45-49. https://doi.org/10.1016/S0097-5990(16)30187-7.
12. Opila DA. The impact of feedback to medical housestaff on chart documentation and quality of care in the outpatient setting. J Gen Intern Med. 1997;12(6):352-356. https://doi.org/10.1007/s11606-006-5083-8.
13. Smith S, Kogan JR, Berman NB, Dell MS, Brock DM, Robins LS. The development and preliminary validation of a rubric to assess medical students’ written summary statements in virtual patient cases. Acad Med. 2016;91(1):94-100. https://doi.org/10.1097/ACM.0000000000000800
14. Baker EA, Ledford CH, Fogg L, Way DP, Park YS. The IDEA assessment tool: assessing the reporting, diagnostic reasoning, and decision-making skills demonstrated in medical students’ hospital admission notes. Teach Learn Med. 2015;27(2):163-173. https://doi.org/10.1080/10401334.2015.1011654
15. King MA, Phillipi CA, Buchanan PM, Lewin LO. Developing validity evidence for the written pediatric history and physical exam evaluation rubric. Acad Pediatr. 2017;17(1):68-73. https://doi.org/10.1016/j.acap.2016.08.001
16. Miller GE. The assessment of clinical skills/competence/performance. Acad Med. 1990;65(9):S63-S67.
17. Messick S. Standards of validity and the validity of standards in performance asessment. Educ Meas Issues Pract. 2005;14(4):5-8. https://doi.org/10.1111/j.1745-3992.1995.tb00881.x
18. Menachery EP, Knight AM, Kolodner K, Wright SM. Physician characteristics associated with proficiency in feedback skills. J Gen Intern Med. 2006;21(5):440-446. https://doi.org/10.1111/j.1525-1497.2006.00424.x
19. Tackett S, Eisele D, McGuire M, Rotello L, Wright S. Fostering clinical excellence across an academic health system. South Med J. 2016;109(8):471-476. https://doi.org/10.14423/SMJ.0000000000000498
20. Christmas C, Kravet SJ, Durso SC, Wright SM. Clinical excellence in academia: perspectives from masterful academic clinicians. Mayo Clin Proc. 2008;83(9):989-994. https://doi.org/10.4065/83.9.989
21. Wright SM, Kravet S, Christmas C, Burkhart K, Durso SC. Creating an academy of clinical excellence at Johns Hopkins Bayview Medical Center: a 3-year experience. Acad Med. 2010;85(12):1833-1839. https://doi.org/10.1097/ACM.0b013e3181fa416c
22. Kotwal S, Peña I, Howell E, Wright S. Defining clinical excellence in hospital medicine: a qualitative study. J Contin Educ Health Prof. 2017;37(1):3-8. https://doi.org/10.1097/CEH.0000000000000145
23. Common Program Requirements. https://www.acgme.org/What-We-Do/Accreditation/Common-Program-Requirements. Accessed August 21, 2018.
24. Warren J, Lupi C, Schwartz ML, et al. Chief Medical Education Officer.; 2017. https://www.aamc.org/download/482204/data/epa9toolkit.pdf. Accessed August 21, 2018.
25. Th He Inte. https://www.abim.org/~/media/ABIM Public/Files/pdf/milestones/internal-medicine-milestones-project.pdf. Accessed August 21, 2018.
26. Core Competencies. Society of Hospital Medicine. https://www.hospitalmedicine.org/professional-development/core-competencies/. Accessed August 21, 2018.
27. Bowen JL. Educational strategies to promote clinical diagnostic reasoning. Cox M,
28. Pangaro L. A new vocabulary and other innovations for improving descriptive in-training evaluations. Acad Med. 1999;74(11):1203-1207. https://doi.org/10.1097/00001888-199911000-00012.
29. Rao G, Epner P, Bauer V, Solomonides A, Newman-Toker DE. Identifying and analyzing diagnostic paths: a new approach for studying diagnostic practices. Diagnosis Berlin, Ger. 2017;4(2):67-72. https://doi.org/10.1515/dx-2016-0049
30. Ely JW, Kaldjian LC, D’Alessandro DM. Diagnostic errors in primary care: lessons learned. J Am Board Fam Med. 2012;25(1):87-97. https://doi.org/10.3122/jabfm.2012.01.110174
31. Kerber KA, Newman-Toker DE. Misdiagnosing dizzy patients: common pitfalls in clinical practice. Neurol Clin. 2015;33(3):565-75, viii. https://doi.org/10.1016/j.ncl.2015.04.009
32. Singh H, Giardina TD, Meyer AND, Forjuoh SN, Reis MD, Thomas EJ. Types and origins of diagnostic errors in primary care settings. JAMA Intern Med. 2013;173(6):418. https://doi.org/10.1001/jamainternmed.2013.2777.
33. Kahn D, Stewart E, Duncan M, et al. A prescription for note bloat: an effective progress note template. J Hosp Med. 2018;13(6):378-382. https://doi.org/10.12788/jhm.2898
34. Anthoine E, Moret L, Regnault A, Sébille V, Hardouin J-B. Sample size used to validate a scale: a review of publications on newly-developed patient reported outcomes measures. Health Qual Life Outcomes. 2014;12(1):176. https://doi.org/10.1186/s12955-014-0176-2
35. Stetson PD, Bakken S, Wrenn JO, Siegler EL. Assessing electronic note quality using the physician documentation quality instrument (PDQI-9). Appl Clin Inform. 2012;3(2):164-174. https://doi.org/10.4338/ACI-2011-11-RA-0070
36. Govaerts MJB, Schuwirth LWT, Van der Vleuten CPM, Muijtjens AMM. Workplace-based assessment: effects of rater expertise. Adv Health Sci Educ Theory Pract. 2011;16(2):151-165. https://doi.org/10.1007/s10459-010-9250-7
37. Kreiter CD, Ferguson KJ. Examining the generalizability of ratings across clerkships using a clinical evaluation form. Eval Health Prof. 2001;24(1):36-46. https://doi.org/10.1177/01632780122034768
38. Middleman AB, Sunder PK, Yen AG. Reliability of the history and physical assessment (HAPA) form. Clin Teach. 2011;8(3):192-195. https://doi.org/10.1111/j.1743-498X.2011.00459.x
39. Kogan JR, Shea JA. Psychometric characteristics of a write-up assessment form in a medicine core clerkship. Teach Learn Med. 2005;17(2):101-106. https://doi.org/10.1207/s15328015tlm1702_2
40. Lewin LO, Beraho L, Dolan S, Millstein L, Bowman D. Interrater reliability of an oral case presentation rating tool in a pediatric clerkship. Teach Learn Med. 2013;25(1):31-38. https://doi.org/10.1080/10401334.2012.741537
41. Gray JD. Global rating scales in residency education. Acad Med. 1996;71(1):S55-S63.
42. Rosenbloom ST, Crow AN, Blackford JU, Johnson KB. Cognitive factors influencing perceptions of clinical documentation tools. J Biomed Inform. 2007;40(2):106-113. https://doi.org/10.1016/j.jbi.2006.06.006
43. Michtalik HJ, Pronovost PJ, Marsteller JA, Spetz J, Brotman DJ. Identifying potential predictors of a safe attending physician workload: a survey of hospitalists. J Hosp Med. 2013;8(11):644-646. https://doi.org/10.1002/jhm.2088
44. Seo J-H, Kong H-H, Im S-J, et al. A pilot study on the evaluation of medical student documentation: assessment of SOAP notes. Korean J Med Educ. 2016;28(2):237-241. https://doi.org/10.3946/kjme.2016.26
45. Kassirer JP. Our stubborn quest for diagnostic certainty. A cause of excessive testing. N Engl J Med. 1989;320(22):1489-1491. https://doi.org/10.1056/NEJM198906013202211
46. Hatch S. Uncertainty in medicine. BMJ. 2017;357:j2180. https://doi.org/10.1136/bmj.j2180
47. Cook DA, Sherbino J, Durning SJ. Management reasoning. JAMA. 2018;319(22):2267. https://doi.org/10.1001/jama.2018.4385
Approximately 60,000 hospitalists were working in the United States in 2018.1 Hospitalist groups work collaboratively because of the shiftwork required for 24/7 patient coverage, and first-rate clinical documentation is essential for quality care.2 Thoughtful clinical documentation not only transmits one provider’s clinical reasoning to other providers but is a professional responsibility.3 Hospitalists spend two-thirds of their time in indirect patient-care activities and approximately one quarter of their time on documentation in electronic health records (EHRs).4 Despite documentation occupying a substantial portion of the clinician’s time, published literature on the best practices for the documentation of clinical reasoning in hospital medicine or its assessment remains scant.5-7
Clinical reasoning involves establishing a diagnosis and developing a therapeutic plan that fits the unique circumstances and needs of the patient.8 Inpatient providers who admit patients to the hospital end the admission note with their assessment and plan (A&P) after reflecting about a patient’s presenting illness. The A&P generally represents the interpretations, deductions, and clinical reasoning of the inpatient providers; this is the section of the note that fellow physicians concentrate on over others.9 The documentation of clinical reasoning in the A&P allows for many to consider how the recorded interpretations relate to their own elucidations resulting in distributed cognition.10
Disorganized documentation can contribute to cognitive overload and impede thoughtful consideration about the clinical presentation.3 The assessment of clinical documentation may translate into reduced medical errors and improved note quality.11,12 Studies that have formally evaluated the documentation of clinical reasoning have focused exclusively on medical students.13-15 The nonexistence of a detailed rubric for evaluating clinical reasoning in the A&Ps of hospitalists represents a missed opportunity for evaluating
METHODS
Study Design, Setting, and Subjects
This was a retrospective study that reviewed the admission notes of hospitalists for patients admitted over the period of January 2014 and October 2017 at three hospitals in Maryland. One is a community hospital (Hospital A) and two are academic medical centers (Hospital B and Hospital C). Even though these three hospitals are part of one health system, they have distinct cultures and leadership, serve different populations, and are staffed by different provider teams.
The notes of physicians working for the hospitalist groups at each of the three hospitals were the focus of the analysis in this study.
Development of the Documentation Assessment Rubric
A team was assembled to develop the Clinical Reasoning in Admission Note Assessment & PLan (CRANAPL) tool. The CRANAPL was designed to assess the comprehensiveness and thoughtfulness of the clinical reasoning documented in the A&P sections of the notes of patients who were admitted to the hospital with an acute illness. Validity evidence for CRANAPL was summarized on the basis of Messick’s unified validity framework by using four of the five sources of validity: content, response process, internal structure, and relations to other variables.17
Content Validity
The development team consisted of members who have an average of 10 years of clinical experience in hospital medicine; have studied clinical excellence and clinical reasoning; and have expertise in feedback, assessment, and professional development.18-22 The development of the CRANAPL tool by the team was informed by a review of the clinical reasoning literature, with particular attention paid to the standards and competencies outlined by the Liaison Committee on Medical Education, the Association of American Medical Colleges, the Accreditation Council on Graduate Medical Education, the Internal Medicine Milestone Project, and the Society of Hospital Medicine.23-26 For each of these parties, diagnostic reasoning and its impact on clinical decision-making are considered to be a core competency. Several works that heavily influenced the CRANAPL tool’s development were Baker’s Interpretive Summary, Differential Diagnosis, Explanation of Reasoning, And Alternatives (IDEA) assessment tool;14 King’s Pediatric History and Physical Exam Evaluation (P-HAPEE) rubric;15 and three other studies related to diagnostic reasoning.16,27,28 These manuscripts and other works substantively informed the preliminary behavioral-based anchors that formed the initial foundation for the tool under development. The CRANAPL tool was shown to colleagues at other institutions who are leaders on clinical reasoning and was presented at academic conferences in the Division of General Internal Medicine and the Division of Hospital Medicine of our institution. Feedback resulted in iterative revisions. The aforementioned methods established content validity evidence for the CRANAPL tool.
Response Process Validity
Several of the authors pilot-tested earlier iterations on admission notes that were excluded from the sample when refining the CRANAPL tool. The weaknesses and sources of confusion with specific items were addressed by scoring 10 A&Ps individually and then comparing data captured on the tool. This cycle was repeated three times for the iterative enhancement and finalization of the CRANAPL tool. On several occasions when two authors were piloting the near-final CRANAPL tool, a third author interviewed each of the two authors about reactivity while assessing individual items and exploring with probes how their own clinical documentation practices were being considered when scoring the notes. The reasonable and thoughtful answers provided by the two authors as they explained and justified the scores they were selecting during the pilot testing served to confer response process validity evidence.
Finalizing the CRANAPL Tool
The nine-item CRANAPL tool includes elements for problem representation, leading diagnosis, uncertainty, differential diagnosis, plans for diagnosis and treatment, estimated length of stay (LOS), potential for upgrade in status to a higher level of care, and consideration of disposition. Although the final three items are not core clinical reasoning domains in the medical education literature, they represent clinical judgments that are especially relevant for the delivery of the high-quality and cost-effective care of hospitalized patients. Given that the probabilities and estimations of these three elements evolve over the course of any hospitalization on the basis of test results and response to therapy, the documentation of initial expectations on these fronts can facilitate distributed cognition with all individuals becoming wiser from shared insights.10 The tool uses two- and three-point rating scales, with each number score being clearly defined by specific written criteria (total score range: 0-14; Appendix).
Data Collection
Hospitalists’ admission notes from the three hospitals were used to validate the CRANAPL tool. Admission notes from patients hospitalized to the general medical floors with an admission diagnosis of either fever, syncope/dizziness, or abdominal pain were used. These diagnoses were purposefully examined because they (1) have a wide differential diagnosis, (2) are common presenting symptoms, and (3) are prone to diagnostic errors.29-32
The centralized EHR system across the three hospitals identified admission notes with one of these primary diagnoses of patients admitted over the period of January 2014 to October 2017. We submitted a request for 650 admission notes to be randomly selected from the centralized institutional records system. The notes were stratified by hospital and diagnosis. The sample size of our study was comparable with that of prior psychometric validation studies.33,34 Upon reviewing the A&Ps associated with these admissions, 365 notes were excluded for one of three reasons: (1) the note was written by a nurse practitioner, physician assistant, resident, or medical student; (2) the admission diagnosis had been definitively confirmed in the emergency department (eg, abdominal pain due to diverticulitis seen on CT); and (3) the note represented the fourth or more note by any single provider (to sample notes of many providers, no more than three notes written by any single provider were analyzed). A total of 285 admission notes were ultimately included in the sample.
Data were deidentified, and the A&P sections of the admission notes were each copied from the EHR into a unique Word document. Patient and hospital demographic data (including age, gender, race, number of comorbid conditions, LOS, hospital charges, and readmission to the same health system within 30 days) were collected separately from the EHR. Select physician characteristics were also collected from the hospitalist groups at each of the three hospitals, as was the length (word count) of each A&P.
The study was approved by our institutional review board.
Data Analysis
Two authors scored all deidentified A&Ps by using the finalized version of the CRANAPL tool. Prior to using the CRANAPL tool on each of the notes, these raters read each A&P and scored them by using two single-item rating scales: a global clinical reasoning and a global readability/clarity measure. Both of these global scales used three-item Likert scales (below average, average, and above average). These global rating scales collected the reviewers’ gestalt about the quality and clarity of the A&P. The use of gestalt ratings as comparators is supported by other research.35
Descriptive statistics were computed for all variables. Each rater rescored a sample of 48 records (one month after the initial scoring) and intraclass correlations (ICCs) were computed for intrarater reliability. ICCs were calculated for each item and for the CRANAPL total to determine interrater reliability.
The averaged ratings from the two raters were used for all other analyses. For CRANAPL’s internal structure validity evidence, Cronbach’s alpha was calculated as a measure of internal consistency. For relations to other variables validity evidence, CRANAPL total scores were compared with the two global assessment variables with linear regressions.
Bivariate analyses were performed by applying parametric and nonparametric tests as appropriate. A series of multivariate linear regressions, controlling for diagnosis and clustered variance by hospital site, were performed using CRANAPL total as the dependent variable and patient variables as predictors.
All data were analyzed using Stata (StataCorp. 2013. Stata Statistical Software: Release 13. College Station, Texas: StataCorp LP.)
RESULTS
The admission notes of 120 hospitalists were evaluated (Table 1). A total of 39 (33%) physicians were moonlighters with primary appointments outside of the hospitalist division, and 81 (68%) were full-time hospitalists. Among the 120 hospitalists, 48 (40%) were female, 60 (50%) were international medical graduates, and 90 (75%) were of nonwhite race. Most hospitalist physicians (n = 47, 58%) had worked in our health system for less than five years, and 64 hospitalists (53%) devoted greater than 50% of their time to patient care.
Approximately equal numbers of patient admission notes were pulled from each of the three hospitals. The average age of patients was 67.2 (SD 13.6) years, 145 (51%) were female, and 120 (42%) were of nonwhite race. The mean LOS for all patients was 4.0 (SD 3.4) days. A total of 44 (15%) patients were readmitted to the same health system within 30 days of discharge. None of the patients died during the incident hospitalization. The average charge for each of the hospitalizations was $10,646 (SD $9,964).
CRANAPL Data
Figure 1 shows the distribution of the scores given by each rater for each of the nine items. The mean of the total CRANAPL score given by both raters was 6.4 (SD 2.2). Scoring for some items were high (eg, summary statement: 1.5/2), whereas performance on others were low (eg, estimating LOS: 0.1/1 and describing the potential need for upgrade in care: 0.0/1).
Validity of the CRANAPL Tool’s Internal Structure
Cronbach’s alpha, which was used to measure internal consistency within the CRANAPL tool, was 0.43. The ICC, which was applied to measure the interrater reliability for both raters for the total CRANAPL score, was 0.83 (95% CI: 0.76-0.87). The ICC values for intrarater reliability for raters 1 and 2 were 0.73 (95% CI: 0.60-0.83) and 0.73 (95% CI: 0.45-0.86), respectively.
Relations to Other Variables Validity
Associations between CRANAPL total scores, global clinical reasoning, and global scores for note readability/clarity were statistically significant (P < .001), Figure 2.
Eight out of nine CRANAPL variables were statistically significantly different across the three hospitals (P <. 01) when data were analyzed by hospital site. Hospital C had the highest mean score of 7.4 (SD 2.0), followed by Hospital B with a score of 6.6 (SD 2.1), and Hospital A had the lowest total CRANAPL score of 5.2 (SD 1.9). This difference was statistically significant (P < .001). Five variables with respect to admission diagnoses (uncertainty acknowledged, differential diagnosis, plan for diagnosis, plan for treatment, and upgrade plan) were statistically significantly different across notes. Notes for syncope/dizziness generally yielded higher scores than those for abdominal pain and fever.
Factors Associated with High CRANAPL Scores
Table 2 shows the associations between CRANAPL scores and several covariates. Before adjustment, high CRANAPL scores were associated with high word counts of A&Ps (P < .001) and high hospital charges (P < .05). These associations were no longer significant after adjusting for hospital site and admitting diagnoses.
DISCUSSION
We reviewed the documentation of clinical reasoning in 285 admission notes at three different hospitals written by hospitalist physicians during routine clinical care. To our knowledge, this is the first study that assessed the documentation of hospitalists’ clinical reasoning with real patient notes. Wide variability exists in the documentation of clinical reasoning within the A&Ps of hospitalists’ admission notes. We have provided validity evidence to support the use of the user-friendly CRANAPL tool.
Prior studies have described rubrics for evaluating the clinical reasoning skills of medical students.14,15 The ICCs for the IDEA rubric used to assess medical students’ documentation of clinical reasoning were fair to moderate (0.29-0.67), whereas the ICC for the CRANAPL tool was high at 0.83. This measure of reliability is similar to that for the P-HAPEE rubric used to assess medical students’ documentation of pediatric history and physical notes.15 These data are markedly different from the data in previous studies that have found low interrater reliability for psychometric evaluations related to judgment and decision-making.36-39 CRANAPL was also found to have high intrarater reliability, which shows the reproducibility of an individual’s assessment over time. The strong association between the total CRANAPL score and global clinical reasoning assessment found in the present study is similar to that found in previous studies that have also embedded global rating scales as comparators when assessing clinical reasoning.13,,15,40,41 Global rating scales represent an overarching structure for comparison given the absence of an accepted method or gold standard for assessing clinical reasoning documentation. High-quality provider notes are defined by clarity, thoroughness, and accuracy;35 and effective documentation promotes communication and the coordination of care among the members of the care team.3
The total CRANAPL scores varied by hospital site with academic hospitals (B and C) scoring higher than the community hospital (A) in our study. Similarly, lengthy A&Ps were associated with high CRANAPL scores (P < .001) prior to adjustment for hospital site. Healthcare providers consider that the thoroughness of documentation denotes quality and attention to detail.35,42 Comprehensive documentation takes time; the longer notes by academic hospitalists than those by community hospitalists may be attributed to the fewer number of patients generally carried by hospitalists at academic centers than that by hospitalists at community hospitals.43
The documentation of the estimations of LOS, possibility of potential upgrade, and thoughts about disposition were consistently poorly described across all hospital sites and diagnoses. In contrast to CRANAPL, other clinical reasoning rubrics have excluded these items or discussed uncertainty.14,15,44 These elements represent the forward thinking that may be essential for high-quality progressive care by hospitalists. Physicians’s difficulty in acknowledging uncertainty has been associated with resource overuse, including the excessive ordering of tests, iatrogenic injury, and heavy financial burden on the healthcare system.45,46 The lack of thoughtful clinical and management reasoning at the time of admission is believed to be associated with medical errors.47 If used as a guide, the CRANAPL tool may promote reflection on the part of the admitting physician. The estimations of LOS, potential for upgrade to a higher level of care, and disposition are markers of optimal inpatient care, especially for hospitalists who work in shifts with embedded handoffs. When shared with colleagues (through documentation), there is the potential for distributed cognition10 to extend throughout the social network of the hospitalist group. The fact that so few providers are currently including these items in their A&P’s show that the providers are either not performing or documenting the ‘reasoning’. Either way, this is an opportunity that has been highlighted by the CRANAPL tool.
Several limitations of this study should be considered. First, the CRANAPL tool may not have captured elements of optimal clinical reasoning documentation. The reliance on multiple methods and an iterative process in the refinement of the CRANAPL tool should have minimized this. Second, this study was conducted across a single healthcare system that uses the same EHR; this EHR or institutional culture may influence documentation practices and behaviors. Given that using the CRANAPL tool to score an A&P is quick and easy, the benefit of giving providers feedback on their notes remains to be seen—here and at other hospitals. Third, our sample size could limit the generalizability of the results and the significance of the associations. However, the sample assessed in our study was significantly larger than that assessed in other studies that have validated clinical reasoning rubrics.14,15 Fourth, clinical reasoning is a broad and multidimensional construct. The CRANAPL tool focuses exclusively on hospitalists’ documentation of clinical reasoning and therefore does not assess aspects of clinical reasoning occurring in the physicians’ minds. Finally, given our goal to optimally validate the CRANAPL tool, we chose to test the tool on specific presentations that are known to be associated with diagnostic practice variation and errors. We may have observed different results had we chosen a different set of diagnoses from each hospital. Further validity evidence will be established when applying the CRANPL tool to different diagnoses and to notes from other clinical settings.
In conclusion, this study focuses on the development and validation of the CRANAPL tool that assesses how hospitalists document their clinical reasoning in the A&P section of admission notes. Our results show that wide variability exists in the documentation of clinical reasoning by hospitalists within and across hospitals. Given the CRANAPL tool’s ease-of-use and its versatility, hospitalist divisions in academic and nonacademic settings may use the CRANAPL tool to assess and provide feedback on the documentation of hospitalists’ clinical reasoning. Beyond studying whether physicians can be taught to improve their notes with feedback based on the CRANAPL tool, future studies may explore whether enhancing clinical reasoning documentation may be associated with improvements in patient care and clinical outcomes.
Acknowledgments
Dr. Wright is the Anne Gaines and G. Thomas Miller Professor of Medicine which is supported through Hopkins’ Center for Innovative Medicine.
The authors thank Christine Caufield-Noll, MLIS, AHIP (Johns Hopkins Bayview Medical Center, Baltimore, Maryland) for her assistance with this project.
Disclosures
The authors have nothing to disclose.
1. State of Hospital Medicine. Society of Hospital Medicine. https://www.hospitalmedicine.org/practice-management/shms-state-of-hospital-medicine/. Accessed August 19, 2018.
2. Mehta R, Radhakrishnan NS, Warring CD, et al. The use of evidence-based, problem-oriented templates as a clinical decision support in an inpatient electronic health record system. Appl Clin Inform. 2016;7(3):790-802. https://doi.org/10.4338/ACI-2015-11-RA-0164
3. Improving Diagnosis in Healthcare: Health and Medicine Division. http://www.nationalacademies.org/hmd/Reports/2015/Improving-Diagnosis-in-Healthcare.aspx. Accessed August 7, 2018.
4. Tipping MD, Forth VE, O’Leary KJ, et al. Where did the day go? A time-motion study of hospitalists. J Hosp Med. 2010;5(6):323-328. https://doi.org/10.1002/jhm.790
5. Varpio L, Rashotte J, Day K, King J, Kuziemsky C, Parush A. The EHR and building the patient’s story: a qualitative investigation of how EHR use obstructs a vital clinical activity. Int J Med Inform. 2015;84(12):1019-1028. https://doi.org/10.1016/j.ijmedinf.2015.09.004
6. Clynch N, Kellett J. Medical documentation: part of the solution, or part of the problem? A narrative review of the literature on the time spent on and value of medical documentation. Int J Med Inform. 2015;84(4):221-228. https://doi.org/10.1016/j.ijmedinf.2014.12.001
7. Varpio L, Day K, Elliot-Miller P, et al. The impact of adopting EHRs: how losing connectivity affects clinical reasoning. Med Educ. 2015;49(5):476-486. https://doi.org/10.1111/medu.12665
8. McBee E, Ratcliffe T, Schuwirth L, et al. Context and clinical reasoning: understanding the medical student perspective. Perspect Med Educ. 2018;7(4):256-263. https://doi.org/10.1007/s40037-018-0417-x
9. Brown PJ, Marquard JL, Amster B, et al. What do physicians read (and ignore) in electronic progress notes? Appl Clin Inform. 2014;5(2):430-444. https://doi.org/10.4338/ACI-2014-01-RA-0003
10. Katherine D, Shalin VL. Creating a common trajectory: Shared decision making and distributed cognition in medical consultations. https://pxjournal.org/cgi/viewcontent.cgi?article=1116&context=journal Accessed April 4, 2019.
11. Harchelroad FP, Martin ML, Kremen RM, Murray KW. Emergency department daily record review: a quality assurance system in a teaching hospital. QRB Qual Rev Bull. 1988;14(2):45-49. https://doi.org/10.1016/S0097-5990(16)30187-7.
12. Opila DA. The impact of feedback to medical housestaff on chart documentation and quality of care in the outpatient setting. J Gen Intern Med. 1997;12(6):352-356. https://doi.org/10.1007/s11606-006-5083-8.
13. Smith S, Kogan JR, Berman NB, Dell MS, Brock DM, Robins LS. The development and preliminary validation of a rubric to assess medical students’ written summary statements in virtual patient cases. Acad Med. 2016;91(1):94-100. https://doi.org/10.1097/ACM.0000000000000800
14. Baker EA, Ledford CH, Fogg L, Way DP, Park YS. The IDEA assessment tool: assessing the reporting, diagnostic reasoning, and decision-making skills demonstrated in medical students’ hospital admission notes. Teach Learn Med. 2015;27(2):163-173. https://doi.org/10.1080/10401334.2015.1011654
15. King MA, Phillipi CA, Buchanan PM, Lewin LO. Developing validity evidence for the written pediatric history and physical exam evaluation rubric. Acad Pediatr. 2017;17(1):68-73. https://doi.org/10.1016/j.acap.2016.08.001
16. Miller GE. The assessment of clinical skills/competence/performance. Acad Med. 1990;65(9):S63-S67.
17. Messick S. Standards of validity and the validity of standards in performance asessment. Educ Meas Issues Pract. 2005;14(4):5-8. https://doi.org/10.1111/j.1745-3992.1995.tb00881.x
18. Menachery EP, Knight AM, Kolodner K, Wright SM. Physician characteristics associated with proficiency in feedback skills. J Gen Intern Med. 2006;21(5):440-446. https://doi.org/10.1111/j.1525-1497.2006.00424.x
19. Tackett S, Eisele D, McGuire M, Rotello L, Wright S. Fostering clinical excellence across an academic health system. South Med J. 2016;109(8):471-476. https://doi.org/10.14423/SMJ.0000000000000498
20. Christmas C, Kravet SJ, Durso SC, Wright SM. Clinical excellence in academia: perspectives from masterful academic clinicians. Mayo Clin Proc. 2008;83(9):989-994. https://doi.org/10.4065/83.9.989
21. Wright SM, Kravet S, Christmas C, Burkhart K, Durso SC. Creating an academy of clinical excellence at Johns Hopkins Bayview Medical Center: a 3-year experience. Acad Med. 2010;85(12):1833-1839. https://doi.org/10.1097/ACM.0b013e3181fa416c
22. Kotwal S, Peña I, Howell E, Wright S. Defining clinical excellence in hospital medicine: a qualitative study. J Contin Educ Health Prof. 2017;37(1):3-8. https://doi.org/10.1097/CEH.0000000000000145
23. Common Program Requirements. https://www.acgme.org/What-We-Do/Accreditation/Common-Program-Requirements. Accessed August 21, 2018.
24. Warren J, Lupi C, Schwartz ML, et al. Chief Medical Education Officer.; 2017. https://www.aamc.org/download/482204/data/epa9toolkit.pdf. Accessed August 21, 2018.
25. Th He Inte. https://www.abim.org/~/media/ABIM Public/Files/pdf/milestones/internal-medicine-milestones-project.pdf. Accessed August 21, 2018.
26. Core Competencies. Society of Hospital Medicine. https://www.hospitalmedicine.org/professional-development/core-competencies/. Accessed August 21, 2018.
27. Bowen JL. Educational strategies to promote clinical diagnostic reasoning. Cox M,
28. Pangaro L. A new vocabulary and other innovations for improving descriptive in-training evaluations. Acad Med. 1999;74(11):1203-1207. https://doi.org/10.1097/00001888-199911000-00012.
29. Rao G, Epner P, Bauer V, Solomonides A, Newman-Toker DE. Identifying and analyzing diagnostic paths: a new approach for studying diagnostic practices. Diagnosis Berlin, Ger. 2017;4(2):67-72. https://doi.org/10.1515/dx-2016-0049
30. Ely JW, Kaldjian LC, D’Alessandro DM. Diagnostic errors in primary care: lessons learned. J Am Board Fam Med. 2012;25(1):87-97. https://doi.org/10.3122/jabfm.2012.01.110174
31. Kerber KA, Newman-Toker DE. Misdiagnosing dizzy patients: common pitfalls in clinical practice. Neurol Clin. 2015;33(3):565-75, viii. https://doi.org/10.1016/j.ncl.2015.04.009
32. Singh H, Giardina TD, Meyer AND, Forjuoh SN, Reis MD, Thomas EJ. Types and origins of diagnostic errors in primary care settings. JAMA Intern Med. 2013;173(6):418. https://doi.org/10.1001/jamainternmed.2013.2777.
33. Kahn D, Stewart E, Duncan M, et al. A prescription for note bloat: an effective progress note template. J Hosp Med. 2018;13(6):378-382. https://doi.org/10.12788/jhm.2898
34. Anthoine E, Moret L, Regnault A, Sébille V, Hardouin J-B. Sample size used to validate a scale: a review of publications on newly-developed patient reported outcomes measures. Health Qual Life Outcomes. 2014;12(1):176. https://doi.org/10.1186/s12955-014-0176-2
35. Stetson PD, Bakken S, Wrenn JO, Siegler EL. Assessing electronic note quality using the physician documentation quality instrument (PDQI-9). Appl Clin Inform. 2012;3(2):164-174. https://doi.org/10.4338/ACI-2011-11-RA-0070
36. Govaerts MJB, Schuwirth LWT, Van der Vleuten CPM, Muijtjens AMM. Workplace-based assessment: effects of rater expertise. Adv Health Sci Educ Theory Pract. 2011;16(2):151-165. https://doi.org/10.1007/s10459-010-9250-7
37. Kreiter CD, Ferguson KJ. Examining the generalizability of ratings across clerkships using a clinical evaluation form. Eval Health Prof. 2001;24(1):36-46. https://doi.org/10.1177/01632780122034768
38. Middleman AB, Sunder PK, Yen AG. Reliability of the history and physical assessment (HAPA) form. Clin Teach. 2011;8(3):192-195. https://doi.org/10.1111/j.1743-498X.2011.00459.x
39. Kogan JR, Shea JA. Psychometric characteristics of a write-up assessment form in a medicine core clerkship. Teach Learn Med. 2005;17(2):101-106. https://doi.org/10.1207/s15328015tlm1702_2
40. Lewin LO, Beraho L, Dolan S, Millstein L, Bowman D. Interrater reliability of an oral case presentation rating tool in a pediatric clerkship. Teach Learn Med. 2013;25(1):31-38. https://doi.org/10.1080/10401334.2012.741537
41. Gray JD. Global rating scales in residency education. Acad Med. 1996;71(1):S55-S63.
42. Rosenbloom ST, Crow AN, Blackford JU, Johnson KB. Cognitive factors influencing perceptions of clinical documentation tools. J Biomed Inform. 2007;40(2):106-113. https://doi.org/10.1016/j.jbi.2006.06.006
43. Michtalik HJ, Pronovost PJ, Marsteller JA, Spetz J, Brotman DJ. Identifying potential predictors of a safe attending physician workload: a survey of hospitalists. J Hosp Med. 2013;8(11):644-646. https://doi.org/10.1002/jhm.2088
44. Seo J-H, Kong H-H, Im S-J, et al. A pilot study on the evaluation of medical student documentation: assessment of SOAP notes. Korean J Med Educ. 2016;28(2):237-241. https://doi.org/10.3946/kjme.2016.26
45. Kassirer JP. Our stubborn quest for diagnostic certainty. A cause of excessive testing. N Engl J Med. 1989;320(22):1489-1491. https://doi.org/10.1056/NEJM198906013202211
46. Hatch S. Uncertainty in medicine. BMJ. 2017;357:j2180. https://doi.org/10.1136/bmj.j2180
47. Cook DA, Sherbino J, Durning SJ. Management reasoning. JAMA. 2018;319(22):2267. https://doi.org/10.1001/jama.2018.4385
© 2019 Society of Hospital Medicine
Can medical scribes improve quality measure documentation?
ABSTRACT
Purpose To avoid disruption of administrative and clinical workflow in an increasingly complex system of health information technology, health care systems and providers have started using medical scribes. The purpose of this study was to investigate the impact of medical scribes on patient satisfaction, physician satisfaction, and quality measure documentation in a family medicine office.
Methods We reviewed 1000 electronic health records for documentation of specified quality measures in the family medicine setting, before and after the use of medical scribes. We surveyed 150 patients on attitude, comfort, and acceptance of medical scribes during their visit. Five physicians shared their perceptions related to productivity, efficiency, and overall job satisfaction on working with medical scribes.
Results Documentation of 4 quality measures improved with the use of scribes, demonstrating statistical significance: fall risk assessment (odds ratio [OR] = 5.5; P = .02), follow-up tobacco screen (OR = 6.4; P = .01), follow-up body mass index plan (OR = 6.2; P < .01), and follow-up blood pressure plan (OR = 39.6; P < .01). Patients reported comfort with scribes in the examination room (96%, n = 144), a more focused health care provider (76%, n = 113), increased efficiency (74%, n = 109), and a higher degree of satisfaction with the office visit (61%, n = 90). Physicians believed they were providing better care and developing better relationships with patients while spending less time documenting and experiencing less stress.
Conclusions Use of medical scribes in a primary care setting was associated with higher patient and physician satisfaction. Patients felt comfortable with a medical scribe in the room, attested to their professionalism, and understood their purpose during the visit. The use of medical scribes in this primary care setting improved documentation of 4 quality measures.
[polldaddy:10339849]
The widespread implementation and adoption of electronic health records (EHRs) continues to increase, primarily motivated by federal incentives through the Centers for Medicare and Medicaid Services to positively impact patient care. Physician use of the EHR in the exam room has the potential to affect the patient-physician relationship, patient satisfaction, physician satisfaction, physician productivity, and physician reimbursement. In the United States, the Health Information Technology for Economic and Clinical Health Act of 2009 established incentive programs to promote meaningful use of EHRs in primary care.1 Integrating EHRs into physician practice, adoption of meaningful use, and the increasing challenge of pay-for-performance quality measures have generated additional hours of administrative work for health care providers. These intrusions on routine clinical care, while hypothesized to improve care, have diminished physician satisfaction, increased stress, and contributed to physician burnout.2
The expanded role of clinicians incentivized to capture metrics for value-based care introduces an unprecedented level of multitasking required at the point of care. In a clinical setting, multitasking undermines the core clinical activities of observation, communication, problem solving, and, ultimately, the development of trusting relationships.3,4 EHR documentation creates a barrier to patient engagement and may contribute to patients feeling isolated when unable to view data being entered.5,6
Potential benefits of scribes. One means of increasing physician satisfaction and productivity may be the integration of medical scribes into health care systems. Medical scribes do not operate independently but are able to document activities or receive dictation critical for patient management—eg, recording patient histories, documenting physical examination findings and procedures, and following up on lab reports.7
Continue to: In a 2015 systematic review...
In a 2015 systematic review, Shultz and Holmstrom found that medical scribes in specialty settings may improve clinician satisfaction, productivity, time-related efficiency, revenue, and patient-clinician interactions.8 The use of scribes in one study increased the number of patients seen and time saved by emergency physicians, thereby increasing physician productivity.9 Studies have also shown that physicians were more satisfied during scribe engagement, related to increased time spent with patients, decreased work-related stress, and increased overall workplace satisfaction.10-12
Studies on the use of medical scribes have mainly focused on physician satisfaction and productivity; however, the data on patient satisfaction are limited. Data about the use of the medical scribe in the primary care setting are also limited. The aim of our research was threefold. We wanted to evaluate the effects of using a medical scribe on: (1) patient satisfaction, (2) documentation of primary care pay-for-performance quality measures, and (3) physicians’ perceptions of the use of scribes in the primary care setting.
METHODS
Data collection
This study was conducted at Family Practice Group in Arlington, Massachusetts, where 5 part-time physicians and 3 full-time physician assistants see approximately 400 patients each week. The representative patient population is approximately 80% privately insured, 10% Medicaid, and 10% Medicare. The EHR system is eClinicalWorks.
The scribes were undergraduate college students who were interested in careers as health care professionals. They had no scribe training or experience working in a medical office. These scribes underwent 4 hours of training in EHR functionality, pay-for-performance quality measures, and risk coding (using appropriate medical codes that capture the patient’s level of medical complexity). The Independent Physician Association affiliated with Family Practice Group provided this training at no cost to the practice. The 3 scribes worked full-time with the 5 part-time physicians in the study. Scribes were not required to have had a medical background prior to entering the program.
After the aforementioned training, scribes began working full-time with physicians during patient visits and continued learning on the job through feedback from supervising physicians. Scribes documented the patient encounters, recording medical and social histories and physical exam findings, and transcribing discussions of treatment plans and physicians’ instructions to patients.
Continue to: We reviewed patient EHRs...
We reviewed patient EHRs of 5 family physicians over 2 time periods: the 3 months prior to having a medical scribe and the 3 months after beginning to work with a medical scribe. Chart data extraction occurred from 4/11/13 to 8/28/14. We reviewed 1000 patient EHRs—100 EHRs each for the 5 participating physicians before and after scribe use. Selected EHRs ran chronologically from the start of each 3-month period. Reviewing EHRs at 3 months after the onset of the medical scribe program allowed time for the scribes to be fully integrated into the practice and confident in their job responsibilities. Chart review was performed by an office administrator who was blinded as to whether documentation had been done with or without a scribe present during the visit.
Eight quality measures were evaluated in chart review. These measures were drawn from the Healthcare Effectiveness Data and Information Set (HEDIS), a tool used to measure performance in medical care and service.
We surveyed 30 patients of each of the 5 providers, yielding a total of 150 survey responses. A medical assistant gave surveys to patients in the exam room following each office visit, to be completed anonymously and privately. Patients were told that surveys would take less than 2 minutes to complete. Office visits included episodic visits, physical exams, and chronic disease management.
After the trial period, we surveyed participating physicians regarding medical scribe assistance with documentation. We also asked the physicians 3 open-ended questions regarding their experiences with their medical scribe.
This study was reviewed and approved (IRB Approval #11424) by the Tufts Health Science Campus Institutional Review Board.
Continue to: Data analysis
Data analysis
During chart review, we assessed the rate at which documentation was completed for 8 quality outcome measures commonly used in the primary care setting (TABLE 1), before and after the introduction of medical scribes. These quality measures and pertinent descriptors are listed in TABLE 2.13 Presence or absence of documentation on all quality measures was noted for all applicable patients.

One hundred fifty patients were surveyed immediately after their office visit on their perceptions of medical scribes, including their attitude toward, comfort with, and acceptance of medical scribes (TABLE 3). Five participating physicians were surveyed to assess their perceptions related to productivity and job satisfaction with the use of medical scribes (TABLE 4), and regarding time saved and additional patients seen. Those who collected and analyzed the data from the surveys were blinded to patient and physician identifiers.

Statistical analysis
Using chi-squared tests, we compared the number of positive documentations for the 8 outcome measures before and after the use of medical scribes. Two-sided P values < .05 were considered statistically significant. All statistical analyses were performed with the use of STATA version 9 (StataCorp LP. College Station, Tex).

Physician survey data were calculated on a Likert scale, with a score of 1 corresponding to “strongly disagree,” 2 “disagree,” 3 “neither agree nor disagree,” 4 “agree,” and 5 “strongly agree.” Using the 5 answers generated from the 5 physicians, we calculated the mean for each question.

RESULTS
Continue to: We established at the beginning...
We established at the beginning of the study a target of obtaining surveys from 30 patients of each of the 5 physicians (total of 150). Response rates for surveys were 100% for both the 150 patients and the 5 physicians. No patients declined to complete the survey, although some did not answer every question.
Patients generally had positive experiences with medical scribes (TABLE 3). The majority of patients (96%, n = 144) felt comfortable with the scribe in the room during the visit with their provider. Patients felt that the provider focused on them “a little to a lot more” (75.8%, n = 113) and thought their visit was more efficient (73.6%, n = 109) as a result of the scribe being present vs not being present. Most patients were more satisfied with their office visit with the scribe being present (60.8%, n = 90).
Physicians felt that working with a medical scribe helped them connect with their patients, made patients feel that their physician was more attentive to them, contributed to better patient care, decreased the time they spent documenting in EHR, and contributed to faster work flow (TABLE 4). The physicians also believed they had saved a mean of 1.5 hours each day with the use of a medical scribe, and that they did not have to change their schedule in any way to accommodate additional patients as a result of having a scribe.
DISCUSSION
Documentation of fall risk assessment, follow-up tobacco screening, follow-up BMI plan, and follow-up blood pressure plan all demonstrated statistically significant increases with the use of medical scribes compared with practice before scribes. Follow-up depression screen and transition of care management had relatively high ORs (3.2 and 8, respectively), but did not yield statistically significant values, in part due to small sample sizes as the number of patients who were hospitalized and the number of patients who screened positive for depression were relatively small out of the total group of 1000 patients. The use of scribes had little effect on depression screen and tobacco screen. This is likely due to the fact that there were already effective office systems in place at the practice that alerted medical assistants to complete these screens for each appropriate patient.
We found that the use of medical scribes in a primary care setting was associated with both higher patient and physician satisfaction. Although the 5 physicians in this study chose not to see additional patients when using a medical scribe, they believed they were saving, on average, 1.5 hours of time each day with the use of a scribe. All 5 physicians reported that medical scribes enabled them to provide better patient care and to help patients feel as though they had more of the physician’s attention. Patient respondents attested to their provider focusing on them more during the visit. According to patient surveys, 40.4% of respondents felt that physicians addressed their concerns more thoroughly during the visit, while the remainder of patients did not.
Continue to: Some concerns...
Some concerns of introducing medical scribes into a health care system include possible patient discomfort with a third party being present during the visit and the cost of employing medical scribes. In this study, the vast majority of patients (96%) felt comfortable with a scribe in the room. Future research could compare patient discomfort due to the presence of a medical scribe with patient discomfort due to a physician using a computer during the visit.
Limitations of this study include the small sample size of both physicians and patients; a lack of validated measures for calculating productivity, time/efficiency, and overall satisfaction; and short time periods leading up to and following the introduction of medical scribes. In addition, EHRs of patients were chosen sequentially and not randomly, which could be a confounder. Participating physicians were aware of being studied; therefore, documentation could have been affected by the Hawthorne effect. The study also was limited to one family medicine site. Although improved documentation of primary care pay-for-performance quality measures was reported, wide confidence intervals and small patient numbers hindered generalizability of findings.
Additional studies are needed with a robust analytic plan sufficient to demonstrate baseline provider familiarity with EHRs, accuracy of medical scribe documentation, and improved documentation of pay-for-performance quality measures. Additional investigation regarding the variable competency of different medical scribes could be useful in measuring the effects of the scribe on a variety of outcomes related to both the physician and patient.
It is possible that the improved documentation yielded by the use of medical scribes could generate billing codes that reimburse physicians at a higher level (eg, a higher ratio of 99214 to 99213), leading to increased pay. Future research could aim to quantify this source of increased revenue. Furthermore, investigations could aim to quantify the revenue that medical scribes generate via improved quality measure pay-for-performance documentation.
CORRESPONDENCE
Jessica Platt, MD, 195 Canal Street, Malden, MA 02148; [email protected].
1. Blumenthal D. Wiring the health system—origins and provisions of a new federal program. N Engl J Med. 2011;365:2323-2329.
2. Welp A, Meier LL, Manser T. Emotional exhaustion and workload predict clinician-rated and objective patient safety. Front Psychol. 2015;5:1573.
3. Beasley JW, Wetterneck TB, Temte J, et al. Information chaos in primary care: implications for physician performance and patient safety. J Am Board Fam Med. 2011;24:745-751.
4. Sinsky CA, Beasley JW. Texting while doctoring: a patient safety hazard. Ann Intern Med. 2013;159:782-783.
5. Montague E, Asan O. Dynamic modeling of patient and physician eye gaze to understand the effects of electronic health records on doctor-patient communication and attention. Int J Med Inform. 2014;83:225-234.
6. Asan O, Montague E. Technology-mediated information sharing between patients and clinicians in primary care encounters. Behav Inf Technol. 2014;33:259-270.
7. The Joint Commission. Documentation assistance provided by scribes. https://www.jointcommission.org/standards_information/jcfaqdetails.aspx?StandardsFAQId=1908. Accessed June 4, 2019.
8. Shultz CG, Holmstrom HL. The use of medical scribes in health care settings: a systematic review and future directions. J Am Board Fam Med. 2015;28:371-381.
9. Arya R, Salovich DM, Ohman-Strickland P, et al. Impact of scribes on performance indicators in the emergency department. Acad Emerg Med. 2010;17:490-494.
10. Conn J. Getting it in writing: Docs using scribes to ease the transition to EHRs. Mod Healthc. 2010;40:30,32.
11. Koshy S, Feustel PJ, Hong M, et al. Scribes in an ambulatory urology practice: patient and physician satisfaction. J Urol. 2010;184:258-262.
12. Allen B, Banapoor B, Weeks E, et al. An assessment of emergency department throughput and provider satisfaction after the implementation of a scribe program. Adv Emerg Med. 2014. https://www.hindawi.com/journals/aem/2014/517319/. Accessed June 4, 2019.
13. Spitzer RL, Kroenke K, Williams JB. Validation and utility of a self-report Version of PRIME-MD: the PHQ primary care study. Primary Care Evaluation of Mental Disorders. Patient Health Questionnaire. JAMA. 1999;282:1737-1744.
ABSTRACT
Purpose To avoid disruption of administrative and clinical workflow in an increasingly complex system of health information technology, health care systems and providers have started using medical scribes. The purpose of this study was to investigate the impact of medical scribes on patient satisfaction, physician satisfaction, and quality measure documentation in a family medicine office.
Methods We reviewed 1000 electronic health records for documentation of specified quality measures in the family medicine setting, before and after the use of medical scribes. We surveyed 150 patients on attitude, comfort, and acceptance of medical scribes during their visit. Five physicians shared their perceptions related to productivity, efficiency, and overall job satisfaction on working with medical scribes.
Results Documentation of 4 quality measures improved with the use of scribes, demonstrating statistical significance: fall risk assessment (odds ratio [OR] = 5.5; P = .02), follow-up tobacco screen (OR = 6.4; P = .01), follow-up body mass index plan (OR = 6.2; P < .01), and follow-up blood pressure plan (OR = 39.6; P < .01). Patients reported comfort with scribes in the examination room (96%, n = 144), a more focused health care provider (76%, n = 113), increased efficiency (74%, n = 109), and a higher degree of satisfaction with the office visit (61%, n = 90). Physicians believed they were providing better care and developing better relationships with patients while spending less time documenting and experiencing less stress.
Conclusions Use of medical scribes in a primary care setting was associated with higher patient and physician satisfaction. Patients felt comfortable with a medical scribe in the room, attested to their professionalism, and understood their purpose during the visit. The use of medical scribes in this primary care setting improved documentation of 4 quality measures.
[polldaddy:10339849]
The widespread implementation and adoption of electronic health records (EHRs) continues to increase, primarily motivated by federal incentives through the Centers for Medicare and Medicaid Services to positively impact patient care. Physician use of the EHR in the exam room has the potential to affect the patient-physician relationship, patient satisfaction, physician satisfaction, physician productivity, and physician reimbursement. In the United States, the Health Information Technology for Economic and Clinical Health Act of 2009 established incentive programs to promote meaningful use of EHRs in primary care.1 Integrating EHRs into physician practice, adoption of meaningful use, and the increasing challenge of pay-for-performance quality measures have generated additional hours of administrative work for health care providers. These intrusions on routine clinical care, while hypothesized to improve care, have diminished physician satisfaction, increased stress, and contributed to physician burnout.2
The expanded role of clinicians incentivized to capture metrics for value-based care introduces an unprecedented level of multitasking required at the point of care. In a clinical setting, multitasking undermines the core clinical activities of observation, communication, problem solving, and, ultimately, the development of trusting relationships.3,4 EHR documentation creates a barrier to patient engagement and may contribute to patients feeling isolated when unable to view data being entered.5,6
Potential benefits of scribes. One means of increasing physician satisfaction and productivity may be the integration of medical scribes into health care systems. Medical scribes do not operate independently but are able to document activities or receive dictation critical for patient management—eg, recording patient histories, documenting physical examination findings and procedures, and following up on lab reports.7
Continue to: In a 2015 systematic review...
In a 2015 systematic review, Shultz and Holmstrom found that medical scribes in specialty settings may improve clinician satisfaction, productivity, time-related efficiency, revenue, and patient-clinician interactions.8 The use of scribes in one study increased the number of patients seen and time saved by emergency physicians, thereby increasing physician productivity.9 Studies have also shown that physicians were more satisfied during scribe engagement, related to increased time spent with patients, decreased work-related stress, and increased overall workplace satisfaction.10-12
Studies on the use of medical scribes have mainly focused on physician satisfaction and productivity; however, the data on patient satisfaction are limited. Data about the use of the medical scribe in the primary care setting are also limited. The aim of our research was threefold. We wanted to evaluate the effects of using a medical scribe on: (1) patient satisfaction, (2) documentation of primary care pay-for-performance quality measures, and (3) physicians’ perceptions of the use of scribes in the primary care setting.
METHODS
Data collection
This study was conducted at Family Practice Group in Arlington, Massachusetts, where 5 part-time physicians and 3 full-time physician assistants see approximately 400 patients each week. The representative patient population is approximately 80% privately insured, 10% Medicaid, and 10% Medicare. The EHR system is eClinicalWorks.
The scribes were undergraduate college students who were interested in careers as health care professionals. They had no scribe training or experience working in a medical office. These scribes underwent 4 hours of training in EHR functionality, pay-for-performance quality measures, and risk coding (using appropriate medical codes that capture the patient’s level of medical complexity). The Independent Physician Association affiliated with Family Practice Group provided this training at no cost to the practice. The 3 scribes worked full-time with the 5 part-time physicians in the study. Scribes were not required to have had a medical background prior to entering the program.
After the aforementioned training, scribes began working full-time with physicians during patient visits and continued learning on the job through feedback from supervising physicians. Scribes documented the patient encounters, recording medical and social histories and physical exam findings, and transcribing discussions of treatment plans and physicians’ instructions to patients.
Continue to: We reviewed patient EHRs...
We reviewed patient EHRs of 5 family physicians over 2 time periods: the 3 months prior to having a medical scribe and the 3 months after beginning to work with a medical scribe. Chart data extraction occurred from 4/11/13 to 8/28/14. We reviewed 1000 patient EHRs—100 EHRs each for the 5 participating physicians before and after scribe use. Selected EHRs ran chronologically from the start of each 3-month period. Reviewing EHRs at 3 months after the onset of the medical scribe program allowed time for the scribes to be fully integrated into the practice and confident in their job responsibilities. Chart review was performed by an office administrator who was blinded as to whether documentation had been done with or without a scribe present during the visit.
Eight quality measures were evaluated in chart review. These measures were drawn from the Healthcare Effectiveness Data and Information Set (HEDIS), a tool used to measure performance in medical care and service.
We surveyed 30 patients of each of the 5 providers, yielding a total of 150 survey responses. A medical assistant gave surveys to patients in the exam room following each office visit, to be completed anonymously and privately. Patients were told that surveys would take less than 2 minutes to complete. Office visits included episodic visits, physical exams, and chronic disease management.
After the trial period, we surveyed participating physicians regarding medical scribe assistance with documentation. We also asked the physicians 3 open-ended questions regarding their experiences with their medical scribe.
This study was reviewed and approved (IRB Approval #11424) by the Tufts Health Science Campus Institutional Review Board.
Continue to: Data analysis
Data analysis
During chart review, we assessed the rate at which documentation was completed for 8 quality outcome measures commonly used in the primary care setting (TABLE 1), before and after the introduction of medical scribes. These quality measures and pertinent descriptors are listed in TABLE 2.13 Presence or absence of documentation on all quality measures was noted for all applicable patients.
One hundred fifty patients were surveyed immediately after their office visit on their perceptions of medical scribes, including their attitude toward, comfort with, and acceptance of medical scribes (TABLE 3). Five participating physicians were surveyed to assess their perceptions related to productivity and job satisfaction with the use of medical scribes (TABLE 4), and regarding time saved and additional patients seen. Those who collected and analyzed the data from the surveys were blinded to patient and physician identifiers.
Statistical analysis
Using chi-squared tests, we compared the number of positive documentations for the 8 outcome measures before and after the use of medical scribes. Two-sided P values < .05 were considered statistically significant. All statistical analyses were performed with the use of STATA version 9 (StataCorp LP. College Station, Tex).
Physician survey data were calculated on a Likert scale, with a score of 1 corresponding to “strongly disagree,” 2 “disagree,” 3 “neither agree nor disagree,” 4 “agree,” and 5 “strongly agree.” Using the 5 answers generated from the 5 physicians, we calculated the mean for each question.
RESULTS
Continue to: We established at the beginning...
We established at the beginning of the study a target of obtaining surveys from 30 patients of each of the 5 physicians (total of 150). Response rates for surveys were 100% for both the 150 patients and the 5 physicians. No patients declined to complete the survey, although some did not answer every question.
Patients generally had positive experiences with medical scribes (TABLE 3). The majority of patients (96%, n = 144) felt comfortable with the scribe in the room during the visit with their provider. Patients felt that the provider focused on them “a little to a lot more” (75.8%, n = 113) and thought their visit was more efficient (73.6%, n = 109) as a result of the scribe being present vs not being present. Most patients were more satisfied with their office visit with the scribe being present (60.8%, n = 90).
Physicians felt that working with a medical scribe helped them connect with their patients, made patients feel that their physician was more attentive to them, contributed to better patient care, decreased the time they spent documenting in EHR, and contributed to faster work flow (TABLE 4). The physicians also believed they had saved a mean of 1.5 hours each day with the use of a medical scribe, and that they did not have to change their schedule in any way to accommodate additional patients as a result of having a scribe.
DISCUSSION
Documentation of fall risk assessment, follow-up tobacco screening, follow-up BMI plan, and follow-up blood pressure plan all demonstrated statistically significant increases with the use of medical scribes compared with practice before scribes. Follow-up depression screen and transition of care management had relatively high ORs (3.2 and 8, respectively), but did not yield statistically significant values, in part due to small sample sizes as the number of patients who were hospitalized and the number of patients who screened positive for depression were relatively small out of the total group of 1000 patients. The use of scribes had little effect on depression screen and tobacco screen. This is likely due to the fact that there were already effective office systems in place at the practice that alerted medical assistants to complete these screens for each appropriate patient.
We found that the use of medical scribes in a primary care setting was associated with both higher patient and physician satisfaction. Although the 5 physicians in this study chose not to see additional patients when using a medical scribe, they believed they were saving, on average, 1.5 hours of time each day with the use of a scribe. All 5 physicians reported that medical scribes enabled them to provide better patient care and to help patients feel as though they had more of the physician’s attention. Patient respondents attested to their provider focusing on them more during the visit. According to patient surveys, 40.4% of respondents felt that physicians addressed their concerns more thoroughly during the visit, while the remainder of patients did not.
Continue to: Some concerns...
Some concerns of introducing medical scribes into a health care system include possible patient discomfort with a third party being present during the visit and the cost of employing medical scribes. In this study, the vast majority of patients (96%) felt comfortable with a scribe in the room. Future research could compare patient discomfort due to the presence of a medical scribe with patient discomfort due to a physician using a computer during the visit.
Limitations of this study include the small sample size of both physicians and patients; a lack of validated measures for calculating productivity, time/efficiency, and overall satisfaction; and short time periods leading up to and following the introduction of medical scribes. In addition, EHRs of patients were chosen sequentially and not randomly, which could be a confounder. Participating physicians were aware of being studied; therefore, documentation could have been affected by the Hawthorne effect. The study also was limited to one family medicine site. Although improved documentation of primary care pay-for-performance quality measures was reported, wide confidence intervals and small patient numbers hindered generalizability of findings.
Additional studies are needed with a robust analytic plan sufficient to demonstrate baseline provider familiarity with EHRs, accuracy of medical scribe documentation, and improved documentation of pay-for-performance quality measures. Additional investigation regarding the variable competency of different medical scribes could be useful in measuring the effects of the scribe on a variety of outcomes related to both the physician and patient.
It is possible that the improved documentation yielded by the use of medical scribes could generate billing codes that reimburse physicians at a higher level (eg, a higher ratio of 99214 to 99213), leading to increased pay. Future research could aim to quantify this source of increased revenue. Furthermore, investigations could aim to quantify the revenue that medical scribes generate via improved quality measure pay-for-performance documentation.
CORRESPONDENCE
Jessica Platt, MD, 195 Canal Street, Malden, MA 02148; [email protected].
1. Blumenthal D. Wiring the health system—origins and provisions of a new federal program. N Engl J Med. 2011;365:2323-2329.
2. Welp A, Meier LL, Manser T. Emotional exhaustion and workload predict clinician-rated and objective patient safety. Front Psychol. 2015;5:1573.
3. Beasley JW, Wetterneck TB, Temte J, et al. Information chaos in primary care: implications for physician performance and patient safety. J Am Board Fam Med. 2011;24:745-751.
4. Sinsky CA, Beasley JW. Texting while doctoring: a patient safety hazard. Ann Intern Med. 2013;159:782-783.
5. Montague E, Asan O. Dynamic modeling of patient and physician eye gaze to understand the effects of electronic health records on doctor-patient communication and attention. Int J Med Inform. 2014;83:225-234.
6. Asan O, Montague E. Technology-mediated information sharing between patients and clinicians in primary care encounters. Behav Inf Technol. 2014;33:259-270.
7. The Joint Commission. Documentation assistance provided by scribes. https://www.jointcommission.org/standards_information/jcfaqdetails.aspx?StandardsFAQId=1908. Accessed June 4, 2019.
8. Shultz CG, Holmstrom HL. The use of medical scribes in health care settings: a systematic review and future directions. J Am Board Fam Med. 2015;28:371-381.
9. Arya R, Salovich DM, Ohman-Strickland P, et al. Impact of scribes on performance indicators in the emergency department. Acad Emerg Med. 2010;17:490-494.
10. Conn J. Getting it in writing: Docs using scribes to ease the transition to EHRs. Mod Healthc. 2010;40:30,32.
11. Koshy S, Feustel PJ, Hong M, et al. Scribes in an ambulatory urology practice: patient and physician satisfaction. J Urol. 2010;184:258-262.
12. Allen B, Banapoor B, Weeks E, et al. An assessment of emergency department throughput and provider satisfaction after the implementation of a scribe program. Adv Emerg Med. 2014. https://www.hindawi.com/journals/aem/2014/517319/. Accessed June 4, 2019.
13. Spitzer RL, Kroenke K, Williams JB. Validation and utility of a self-report Version of PRIME-MD: the PHQ primary care study. Primary Care Evaluation of Mental Disorders. Patient Health Questionnaire. JAMA. 1999;282:1737-1744.

Interprofessional Academic Patient Aligned Care Team Panel Management Model
This article is part of a series that illustrates strategies intended to redesign primary care education at the Veterans Health Administration (VHA), using interprofessional workplace learning. All have been implemented in the VA Centers of Excellence in Primary Care Education (CoEPCE). These models embody visionary transformation of clinical and educational environments that have potential for replication and dissemination throughout VA and other primary care clinical educational environments. For an introduction to the series see Klink K. Transforming primary care clinical learning environments to optimize education, outcomes, and satisfaction. Fed Pract. 2018;35(9):8-10.
Background
In 2011, 5 US Department of Veterans Affairs (VA) medical centers were selected by the VA Office of Academic Affiliations (OAA) to establish Centers of Excellence in Primary Care Education (CoEPCE). Part of the New Models of Care initiative, the 5 CoEPCEs use VA primary care settings to develop and test innovative approaches to prepare physician residents, medical students, advanced practice registered nurses, undergraduate nursing students, and other health professions’ trainees, such as social workers, pharmacists, psychologists, and physician assistants, for improved primary care practice. The CoEPCEs are interprofessional Academic PACTs (iAPACTs) with ≥ 2 professions of trainees engaged in learning on the PACT team.

The VA Puget Sound Seattle CoEPCE curriculum is embedded in a well-established academic VA primary care training site.1 Trainees include doctor of nursing practice (DNP) students in adult, family, and psychiatric mental health nurse practitioner (NP) programs; NP residents; internal medicine physician residents; postgraduate pharmacy residents; and other health professions’ trainees. A Seattle CoEPCE priority is to provide DNP students, DNP residents, and physician residents with a longitudinal experience in team-based care as well as interprofessional education and collaborative practice (IPECP). Learners spend the majority of CoEPCE time in supervised, direct patient care, including primary care, women’s health, deployment health, homeless care, and home care. Formal IPECP activities comprise about 20% of time, supported by 3 educational strategies: (1) Panel management (PM)/quality improvement (QI); (2) Team building/ communications; and (3) Clinical content seminars to expand trainee clinical knowledge and skills and curriculum developed with the CoEPCE enterprise core domains in mind (Table).
Panel Management
Clinicians are increasingly being required to proactively optimize the health of an assigned population of patients in addition to assessing and managing the health of individual patients presenting for care. To address the objectives of increased accountability for population health outcomes and improved face-to-face care, Seattle CoEPCE developed curriculum for trainees to learn PM, a set of tools and processes that can be applied in the primary care setting.
PM clinical providers use data to proactively provide care to their patients between traditional clinic visits. The process is proactive in that gaps are identified whether or not an in-person visit occurs and involves an outreach mechanism to increase continuity of care, such as follow-up communications with the patients.2 PM also has been associated with improvements in chronic disease care.3-5
The Seattle CoEPCE developed an interprofessional team approach to PM that teaches trainees about the tools and resources used to close the gaps in care, including the use of clinical team members as health care systems subject matter experts. CoEPCE trainees are taught to analyze the care they provide to their panel of veterans (eg, identifying patients who have not refilled chronic medications or those who use the emergency department [ED] for nonacute conditions) and take action to improve care. PM yields rich discussions on systems resources and processes and is easily applied to a range of health conditions as well as delivery system issues. PM gives learners the tools they can use to close these gaps, such as the expertise of their peers, clinical team, and specialists.6
Planning and Implementation
In addition to completing a literature review to determine the state of PM practice and models, CoEPCE faculty polled recent graduates inquiring about strategies they did not learn prior to graduation. Based on their responses, CoEPCE faculty identified 2 skill deficits: management of chronic diseases and proficiency with data and statistics about performance improvement in panel patient care over time. Addressing these unmet needs became the impetus for developing curriculum for conducting PM. Planning and launching the CoEPCE approach to PM took about 3 months and involved CoEPCE faculty, a data manager, and administrative support. The learning objectives of Seattle’s PM initiative are to:
- Promote preventive health and chronic disease care by use performance data;
- Develop individual- and populationfocused action plans;
- Work collaboratively, strategically, and effectively with an interprofessional care team; and
- Learn how to effectively use system resources.
Curriculum
The PM curriculum is a longitudinal, experiential approach to learning how to manage chronic diseases between visits by using patient data. It is designed for trainees in a continuity clinic to review the care of their patients on a regular basis. Seattle CoEPCE medicine residents are assigned patient panels, which increase from 70 patients in the first year to about 140 patients by the end of the third year. DNP postgraduate trainees are assigned an initial panel of 50 patients that increases incrementally over the year-long residency.
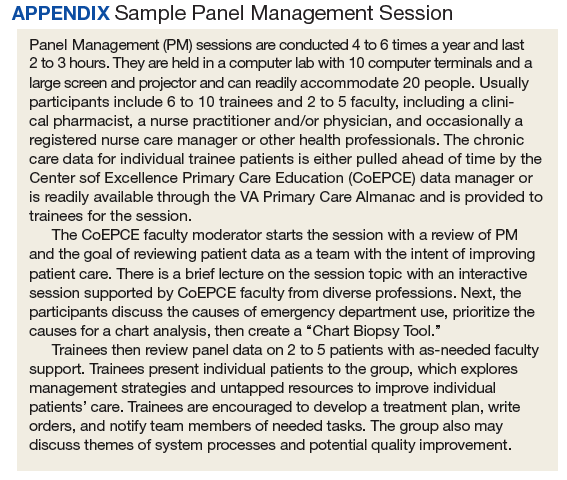
CoEPCE faculty determined the focus of PM sessions to be diabetes mellitus (DM), hypertension, obesity, chronic opioid therapy, and low-acuity ED use. Because PM sessions are designed to allow participants to identify systems issues that may affect multiple patients, some of these topics have expanded into QI projects. PM sessions run 2 to 3 hours per session and are held 4 to 6 times a year. Each session is repeated twice to accommodate diverse trainee schedules. PM participants must have their patient visit time blocked for each session (Appendix).
Faculty Roles and Development
PM faculty involved in any individual session may include a combination of a CoEPCE clinical pharmacy specialist, a registered nurse (RN) care manager, a social worker, a NP, a physician, a clinical psychologist, and a medicine outpatient chief resident (PGY4, termed clinician-teacher fellow at Seattle VA medical center). The chief resident is a medicine residency graduate and takes on teaching responsibilities depending on the topic of the session. The CoEPCE clinical pharmacist role varies depending on the session topic: They may facilitate the session or provide recommendations for medication management for individual cases. The RN care manager often knows the patients and brings a unique perspective that complements that of the primary care providers and ideally participates in every session. The patients of multiple RN care managers may be presented at each session, and it was not feasible to include all RN care managers in every session. After case discussions, trainees often communicated with the RN care managers about the case, using instant messaging, and CoEPCE provides other avenues for patient care discussion through huddles involving the provider, RN care manager, clinical pharmacist, and other clinical professions.
Resources
The primary resource required to support PM is an information technology (IT) system that provides relevant health outcome and health care utilization data on patients assigned to trainees. PM sessions include teaching trainees how to access patient data. Since discussion about the care of panel patients during the learning sessions often results in real-time adjustments in the care plan, modest administrative support required post-PM sessions, such as clerical scheduling of the requested clinic or telephone follow-up with the physician, nurse, or pharmacist.
Monitoring and Assessment
Panel performance is evaluated at each educational session. To assess the CoEPCE PM curriculum, participants provide feedback in 8 questions over 3 domains: trainee perception of curriculum content, confidence in performing PM involving completion of a PM workshop, and likelihood of using PM techniques in the future. CoEPCE faculty use the feedback to improve their instruction of panel management skill and develop new sessions that target additional population groups. Evaluation of the curriculum also includes monitoring of panel patients’ chronic disease measures.
Several partnerships have contributed to the success and integrations of PM into facility activities. First, having the primary care clinic director as a member of the Co- EPCE faculty has encouraged faculty and staff to operationalize and implement PM broadly by distributing data monthly to all clinic staff. Second, high facility staff interest outside the CoEPCE and primary care clinic has facilitated establishing communications outside the CoEPCE regarding clinic data.
Challenges and Solutions
Trainees at earlier academic levels often desire more instruction in clinical knowledge, such as treatment options for DM or goals of therapy in hypertension. In contrast, advanced trainees are able to review patient data, brainstorm, and optimize solutions. Seattle CoEPCE balances these different learning needs via a flexible approach to the 3-hour sessions. For example, advanced trainees progress from structured short lectures to informal sessions, which train them to perform PM on their own. In addition, the flexible design integrates trainees with diverse schedules, particularly among DNP students and residents, pharmacy residents, and physician residents. Some of this work falls on the RN care management team and administrative support staff.
Competing Priorities
The demand for direct patient care points to the importance of indirect patient care activities like PM to demonstrate improved results. Managing chronic conditions and matching appropriate services and resources should improve clinical outcomes and efficiency longterm. In the interim, it is important to note that PM demonstrates the continuous aspect of clinical care, particularly for trainees who have strict guidelines defining clinical care for the experiences to count toward eligibility for licensure. Additionally, PM results in trainees who are making decisions with VA patients and are more efficiently providing and supporting patient care. Therefore, it is critical to secure important resources, such as provider time for conducting PM.
Data Access
No single data system in VA covers the broad range of topics covered in the PM sessions, and not all trainees have their own assigned panels. For example, health professions students are not assigned a panel of patients. While they do not have access to panel data such as those generated by Primary Care Almanac in VSSC (a data source in the VA Support Service Center database),the Seattle CoEPCE data manager pulls a set of patient data from the students’ paired faculty preceptors’ panels for review. Thus they learn PM principles and strategies for improving patient care via PM as part of the unique VA longitudinal clinic experience and the opportunity to learn from a multidisciplinary team that is not available at other clinical sites. Postgraduate NP residents in CoEPCE training have their own panels of patients and thus the ability to directly access their panel performance data.
Success Factors
A key success factor includes CoEPCE faculty’s ability to develop and operationalize a panel management model that simultaneously aligns with the educational goals of an interprofessional education training program and supports VA adoption of the medical home or patient aligned care teams (PACT). The CoEPCE contributes staff expertise in accessing and reporting patient data, accessing appropriate teaching space, managing panels of patients with chronic diseases, and facilitating a team-based approach to care. Additionally, the CoEPCE brand is helpful for getting buy-in from the clinical and academic stakeholders necessary for moving PM forward.
Colocating CoEPCE trainees and faculty in the primary care clinic promotes team identity around the RN care managers and facilitated communications with non-CoEPCE clinical teams that have trainees from other professions. RN care managers serve as the locus of highquality PM since they share patient panels with the trainees and already track admissions, ED visits, and numerous chronic health care metrics. RN care managers offer a level of insight into chronic disease that other providers may not possess, such as the specific details on medication adherence and the impact of adverse effects (AEs) for that particular patient. RN care managers are able to teach about their team role and responsibilities, strengthening the model.
PM is an opportunity to expand CoEPCE interprofessional education capacity by creating colocation of different trainee and faculty professions during the PM sessions; the sharing of data with trainees; and sharing and reflecting on data, strengthening communications between professions and within the PACT. The Seattle CoEPCE now has systems in place that allow the RN care manager to send notes to a physician and DNP resident, and the resident is expected to respond. In addition, the PM approach provides experience with analyzing data to improve care in an interprofessional team setting, which is a requirement of the Accreditation Council for Graduate Medical Education.
Interprofessional Collaboration
PM sessions are intentionally designed to improve communication among team members and foster a team approach to care. PM sessions provide an opportunity for trainees and clinician faculty to be together and learn about each profession’s perspectives. For example, early in the process physician and DNP trainees learn about the importance of clinical pharmacists to the team who prescribe and make medication adjustments within their scope of practice as well as the importance of making appropriate pharmacy referrals. Additionally, the RN care manager and clinical pharmacy specialists who serve as faculty in the CoEPCE provide pertinent information on individual patients, increasing integration with the PACT. Finally, there is anecdotal evidence that faculty also are learning more about interprofessional education and expanding their own skills.
Clinical Performance
CoEPCE trainees, non-CoEPCE physician residents, and CoEPCE faculty participants regularly receive patient data with which they can proactively develop or amend a treatment plan between visits. PM has resulted in improved data sharing with providers. Instead of once a year, providers and clinic staff now receive patient data monthly on chronic conditions from the clinic director. Trainees on ambulatory rotations are expected to review their panel data at least a half day per week. CoEPCE staff evaluate trainee likelihood to use PM and ability to identify patients who benefit from team-based care.
At the population level of chronic disease management, preliminary evidence demonstrates that primary care clinic patient panels are increasingly within target for DM and blood pressure measures, as assessed by periodic clinical reports to providers. Some of the PM topics have resulted in systems-level improvements, such as reducing unnecessary ED use for nonacute conditions and better opioid prescription monitoring. Moreover, PM supports everyone working at the top of his/her professional capability. For example, the RN care manager has the impetus to initiate DM education with a particular patient.
Since CoEPCE began teaching PM, the Seattle primary care clinic has committed to the regular access and review of data. This has encouraged the alignment of standards of care for chronic disease management so that all care providers are working toward the same benchmark goals.
Patient Outcomes
At the individual level, PM provide a mechanism to systemically review trainee panel patients with out-of-target clinical measures, and develop new care approaches involving interprofessional strategies and problem solving. PM also helps identify patients who have missed follow-up, reducing the risk that patients with chronic care needs will be lost to clinical engagement if they are not reminded or do not pursue appointments. The PM-trained PACT reaches out to patients who might not otherwise get care before the next clinic visit and provides new care plans. Second, patients have the benefit of a team that manages their health needs. For example, including the clinical pharmacists in the PM sessions ensures timely identification of medication interactions and the potential AEs. Additionally, PM contributes to the care coordination model by involving individuals on the primary care team who know the patient. These members review the patient’s data between visits and initiate team-based changes to the care plan to improve care. More team members connect with a patient, resulting in more intense care and quicker follow-up to determine the effectiveness of a treatment plan.
PM topics have spun off QI projects resulting in new clinic processes and programs, including processes for managing wounds in primary care and to assure timely post-ED visit follow-ups. Areas for expansion include a follow-up QI project to reduce nonacute ED visits by patients on the homeless PACT panel and interventions for better management of care for women veterans with mental health needs. PM also has extended to non-Co- EPCE teams and to other clinic activities, such as strengthening huddles of team members specifically related to panel data and addressing selected patient cases between visits. Pharmacy residents and faculty are more involved in reviewing the panel before patients are seen to review medication lists and identify duplications.
The Future
Under stage 2 of the program, the Seattle CoEPCE intends to lead in the creation of a PM toolkit as well as a data access guide that will allow VA facilities with limited data management expertise to access chronic disease metrics. Second, the CoEPCE will continue its dissemination efforts locally to other residents in the internal medicine residency program in all of its continuity clinics. Additionally, there is high interest by DNP training programs to expand and export longitudinal training experience PM curriculum to non-VA based students.
1. Kaminetzky CP, Beste LA, Poppe AP, et al. Implementation of a novel panel management curriculum. BMC Med Educ. 2017;17(1):264-269.
2. Neuwirth EB, Schmittdiel JA, Tallman K, Bellows J. Understanding panel management: a comparative study of an emerging approach to population care. Perm J. 2007;11(3):12-20.
3. Loo TS, Davis RB, Lipsitz LA, et al. Electronic medical record reminders and panel management to improve primary care of elderly patients. Arch Intern Med. 2011;171(17):1552-1558.
4. Kanter M, Martinez O, Lindsay G, Andrews K, Denver C. Proactive office encounter: a systematic approach to preventive and chronic care at every patient encounter. Perm J. 2010;14(3):38-43.
5. Kravetz JD, Walsh RF. Team-based hypertension management to improve blood pressure control. J Prim Care Community Health. 2016;7(4):272-275.
6. Kaminetzky CP, Nelson KM. In the office and in-between: the role of panel management in primary care. J Gen Intern Med. 2015;30(7):876-877.
This article is part of a series that illustrates strategies intended to redesign primary care education at the Veterans Health Administration (VHA), using interprofessional workplace learning. All have been implemented in the VA Centers of Excellence in Primary Care Education (CoEPCE). These models embody visionary transformation of clinical and educational environments that have potential for replication and dissemination throughout VA and other primary care clinical educational environments. For an introduction to the series see Klink K. Transforming primary care clinical learning environments to optimize education, outcomes, and satisfaction. Fed Pract. 2018;35(9):8-10.
Background
In 2011, 5 US Department of Veterans Affairs (VA) medical centers were selected by the VA Office of Academic Affiliations (OAA) to establish Centers of Excellence in Primary Care Education (CoEPCE). Part of the New Models of Care initiative, the 5 CoEPCEs use VA primary care settings to develop and test innovative approaches to prepare physician residents, medical students, advanced practice registered nurses, undergraduate nursing students, and other health professions’ trainees, such as social workers, pharmacists, psychologists, and physician assistants, for improved primary care practice. The CoEPCEs are interprofessional Academic PACTs (iAPACTs) with ≥ 2 professions of trainees engaged in learning on the PACT team.
The VA Puget Sound Seattle CoEPCE curriculum is embedded in a well-established academic VA primary care training site.1 Trainees include doctor of nursing practice (DNP) students in adult, family, and psychiatric mental health nurse practitioner (NP) programs; NP residents; internal medicine physician residents; postgraduate pharmacy residents; and other health professions’ trainees. A Seattle CoEPCE priority is to provide DNP students, DNP residents, and physician residents with a longitudinal experience in team-based care as well as interprofessional education and collaborative practice (IPECP). Learners spend the majority of CoEPCE time in supervised, direct patient care, including primary care, women’s health, deployment health, homeless care, and home care. Formal IPECP activities comprise about 20% of time, supported by 3 educational strategies: (1) Panel management (PM)/quality improvement (QI); (2) Team building/ communications; and (3) Clinical content seminars to expand trainee clinical knowledge and skills and curriculum developed with the CoEPCE enterprise core domains in mind (Table).
Panel Management
Clinicians are increasingly being required to proactively optimize the health of an assigned population of patients in addition to assessing and managing the health of individual patients presenting for care. To address the objectives of increased accountability for population health outcomes and improved face-to-face care, Seattle CoEPCE developed curriculum for trainees to learn PM, a set of tools and processes that can be applied in the primary care setting.
PM clinical providers use data to proactively provide care to their patients between traditional clinic visits. The process is proactive in that gaps are identified whether or not an in-person visit occurs and involves an outreach mechanism to increase continuity of care, such as follow-up communications with the patients.2 PM also has been associated with improvements in chronic disease care.3-5
The Seattle CoEPCE developed an interprofessional team approach to PM that teaches trainees about the tools and resources used to close the gaps in care, including the use of clinical team members as health care systems subject matter experts. CoEPCE trainees are taught to analyze the care they provide to their panel of veterans (eg, identifying patients who have not refilled chronic medications or those who use the emergency department [ED] for nonacute conditions) and take action to improve care. PM yields rich discussions on systems resources and processes and is easily applied to a range of health conditions as well as delivery system issues. PM gives learners the tools they can use to close these gaps, such as the expertise of their peers, clinical team, and specialists.6
Planning and Implementation
In addition to completing a literature review to determine the state of PM practice and models, CoEPCE faculty polled recent graduates inquiring about strategies they did not learn prior to graduation. Based on their responses, CoEPCE faculty identified 2 skill deficits: management of chronic diseases and proficiency with data and statistics about performance improvement in panel patient care over time. Addressing these unmet needs became the impetus for developing curriculum for conducting PM. Planning and launching the CoEPCE approach to PM took about 3 months and involved CoEPCE faculty, a data manager, and administrative support. The learning objectives of Seattle’s PM initiative are to:
- Promote preventive health and chronic disease care by use performance data;
- Develop individual- and populationfocused action plans;
- Work collaboratively, strategically, and effectively with an interprofessional care team; and
- Learn how to effectively use system resources.
Curriculum
The PM curriculum is a longitudinal, experiential approach to learning how to manage chronic diseases between visits by using patient data. It is designed for trainees in a continuity clinic to review the care of their patients on a regular basis. Seattle CoEPCE medicine residents are assigned patient panels, which increase from 70 patients in the first year to about 140 patients by the end of the third year. DNP postgraduate trainees are assigned an initial panel of 50 patients that increases incrementally over the year-long residency.
CoEPCE faculty determined the focus of PM sessions to be diabetes mellitus (DM), hypertension, obesity, chronic opioid therapy, and low-acuity ED use. Because PM sessions are designed to allow participants to identify systems issues that may affect multiple patients, some of these topics have expanded into QI projects. PM sessions run 2 to 3 hours per session and are held 4 to 6 times a year. Each session is repeated twice to accommodate diverse trainee schedules. PM participants must have their patient visit time blocked for each session (Appendix).
Faculty Roles and Development
PM faculty involved in any individual session may include a combination of a CoEPCE clinical pharmacy specialist, a registered nurse (RN) care manager, a social worker, a NP, a physician, a clinical psychologist, and a medicine outpatient chief resident (PGY4, termed clinician-teacher fellow at Seattle VA medical center). The chief resident is a medicine residency graduate and takes on teaching responsibilities depending on the topic of the session. The CoEPCE clinical pharmacist role varies depending on the session topic: They may facilitate the session or provide recommendations for medication management for individual cases. The RN care manager often knows the patients and brings a unique perspective that complements that of the primary care providers and ideally participates in every session. The patients of multiple RN care managers may be presented at each session, and it was not feasible to include all RN care managers in every session. After case discussions, trainees often communicated with the RN care managers about the case, using instant messaging, and CoEPCE provides other avenues for patient care discussion through huddles involving the provider, RN care manager, clinical pharmacist, and other clinical professions.
Resources
The primary resource required to support PM is an information technology (IT) system that provides relevant health outcome and health care utilization data on patients assigned to trainees. PM sessions include teaching trainees how to access patient data. Since discussion about the care of panel patients during the learning sessions often results in real-time adjustments in the care plan, modest administrative support required post-PM sessions, such as clerical scheduling of the requested clinic or telephone follow-up with the physician, nurse, or pharmacist.
Monitoring and Assessment
Panel performance is evaluated at each educational session. To assess the CoEPCE PM curriculum, participants provide feedback in 8 questions over 3 domains: trainee perception of curriculum content, confidence in performing PM involving completion of a PM workshop, and likelihood of using PM techniques in the future. CoEPCE faculty use the feedback to improve their instruction of panel management skill and develop new sessions that target additional population groups. Evaluation of the curriculum also includes monitoring of panel patients’ chronic disease measures.
Several partnerships have contributed to the success and integrations of PM into facility activities. First, having the primary care clinic director as a member of the Co- EPCE faculty has encouraged faculty and staff to operationalize and implement PM broadly by distributing data monthly to all clinic staff. Second, high facility staff interest outside the CoEPCE and primary care clinic has facilitated establishing communications outside the CoEPCE regarding clinic data.
Challenges and Solutions
Trainees at earlier academic levels often desire more instruction in clinical knowledge, such as treatment options for DM or goals of therapy in hypertension. In contrast, advanced trainees are able to review patient data, brainstorm, and optimize solutions. Seattle CoEPCE balances these different learning needs via a flexible approach to the 3-hour sessions. For example, advanced trainees progress from structured short lectures to informal sessions, which train them to perform PM on their own. In addition, the flexible design integrates trainees with diverse schedules, particularly among DNP students and residents, pharmacy residents, and physician residents. Some of this work falls on the RN care management team and administrative support staff.
Competing Priorities
The demand for direct patient care points to the importance of indirect patient care activities like PM to demonstrate improved results. Managing chronic conditions and matching appropriate services and resources should improve clinical outcomes and efficiency longterm. In the interim, it is important to note that PM demonstrates the continuous aspect of clinical care, particularly for trainees who have strict guidelines defining clinical care for the experiences to count toward eligibility for licensure. Additionally, PM results in trainees who are making decisions with VA patients and are more efficiently providing and supporting patient care. Therefore, it is critical to secure important resources, such as provider time for conducting PM.
Data Access
No single data system in VA covers the broad range of topics covered in the PM sessions, and not all trainees have their own assigned panels. For example, health professions students are not assigned a panel of patients. While they do not have access to panel data such as those generated by Primary Care Almanac in VSSC (a data source in the VA Support Service Center database),the Seattle CoEPCE data manager pulls a set of patient data from the students’ paired faculty preceptors’ panels for review. Thus they learn PM principles and strategies for improving patient care via PM as part of the unique VA longitudinal clinic experience and the opportunity to learn from a multidisciplinary team that is not available at other clinical sites. Postgraduate NP residents in CoEPCE training have their own panels of patients and thus the ability to directly access their panel performance data.
Success Factors
A key success factor includes CoEPCE faculty’s ability to develop and operationalize a panel management model that simultaneously aligns with the educational goals of an interprofessional education training program and supports VA adoption of the medical home or patient aligned care teams (PACT). The CoEPCE contributes staff expertise in accessing and reporting patient data, accessing appropriate teaching space, managing panels of patients with chronic diseases, and facilitating a team-based approach to care. Additionally, the CoEPCE brand is helpful for getting buy-in from the clinical and academic stakeholders necessary for moving PM forward.
Colocating CoEPCE trainees and faculty in the primary care clinic promotes team identity around the RN care managers and facilitated communications with non-CoEPCE clinical teams that have trainees from other professions. RN care managers serve as the locus of highquality PM since they share patient panels with the trainees and already track admissions, ED visits, and numerous chronic health care metrics. RN care managers offer a level of insight into chronic disease that other providers may not possess, such as the specific details on medication adherence and the impact of adverse effects (AEs) for that particular patient. RN care managers are able to teach about their team role and responsibilities, strengthening the model.
PM is an opportunity to expand CoEPCE interprofessional education capacity by creating colocation of different trainee and faculty professions during the PM sessions; the sharing of data with trainees; and sharing and reflecting on data, strengthening communications between professions and within the PACT. The Seattle CoEPCE now has systems in place that allow the RN care manager to send notes to a physician and DNP resident, and the resident is expected to respond. In addition, the PM approach provides experience with analyzing data to improve care in an interprofessional team setting, which is a requirement of the Accreditation Council for Graduate Medical Education.
Interprofessional Collaboration
PM sessions are intentionally designed to improve communication among team members and foster a team approach to care. PM sessions provide an opportunity for trainees and clinician faculty to be together and learn about each profession’s perspectives. For example, early in the process physician and DNP trainees learn about the importance of clinical pharmacists to the team who prescribe and make medication adjustments within their scope of practice as well as the importance of making appropriate pharmacy referrals. Additionally, the RN care manager and clinical pharmacy specialists who serve as faculty in the CoEPCE provide pertinent information on individual patients, increasing integration with the PACT. Finally, there is anecdotal evidence that faculty also are learning more about interprofessional education and expanding their own skills.
Clinical Performance
CoEPCE trainees, non-CoEPCE physician residents, and CoEPCE faculty participants regularly receive patient data with which they can proactively develop or amend a treatment plan between visits. PM has resulted in improved data sharing with providers. Instead of once a year, providers and clinic staff now receive patient data monthly on chronic conditions from the clinic director. Trainees on ambulatory rotations are expected to review their panel data at least a half day per week. CoEPCE staff evaluate trainee likelihood to use PM and ability to identify patients who benefit from team-based care.
At the population level of chronic disease management, preliminary evidence demonstrates that primary care clinic patient panels are increasingly within target for DM and blood pressure measures, as assessed by periodic clinical reports to providers. Some of the PM topics have resulted in systems-level improvements, such as reducing unnecessary ED use for nonacute conditions and better opioid prescription monitoring. Moreover, PM supports everyone working at the top of his/her professional capability. For example, the RN care manager has the impetus to initiate DM education with a particular patient.
Since CoEPCE began teaching PM, the Seattle primary care clinic has committed to the regular access and review of data. This has encouraged the alignment of standards of care for chronic disease management so that all care providers are working toward the same benchmark goals.
Patient Outcomes
At the individual level, PM provide a mechanism to systemically review trainee panel patients with out-of-target clinical measures, and develop new care approaches involving interprofessional strategies and problem solving. PM also helps identify patients who have missed follow-up, reducing the risk that patients with chronic care needs will be lost to clinical engagement if they are not reminded or do not pursue appointments. The PM-trained PACT reaches out to patients who might not otherwise get care before the next clinic visit and provides new care plans. Second, patients have the benefit of a team that manages their health needs. For example, including the clinical pharmacists in the PM sessions ensures timely identification of medication interactions and the potential AEs. Additionally, PM contributes to the care coordination model by involving individuals on the primary care team who know the patient. These members review the patient’s data between visits and initiate team-based changes to the care plan to improve care. More team members connect with a patient, resulting in more intense care and quicker follow-up to determine the effectiveness of a treatment plan.
PM topics have spun off QI projects resulting in new clinic processes and programs, including processes for managing wounds in primary care and to assure timely post-ED visit follow-ups. Areas for expansion include a follow-up QI project to reduce nonacute ED visits by patients on the homeless PACT panel and interventions for better management of care for women veterans with mental health needs. PM also has extended to non-Co- EPCE teams and to other clinic activities, such as strengthening huddles of team members specifically related to panel data and addressing selected patient cases between visits. Pharmacy residents and faculty are more involved in reviewing the panel before patients are seen to review medication lists and identify duplications.
The Future
Under stage 2 of the program, the Seattle CoEPCE intends to lead in the creation of a PM toolkit as well as a data access guide that will allow VA facilities with limited data management expertise to access chronic disease metrics. Second, the CoEPCE will continue its dissemination efforts locally to other residents in the internal medicine residency program in all of its continuity clinics. Additionally, there is high interest by DNP training programs to expand and export longitudinal training experience PM curriculum to non-VA based students.
1. Kaminetzky CP, Beste LA, Poppe AP, et al. Implementation of a novel panel management curriculum. BMC Med Educ. 2017;17(1):264-269.
2. Neuwirth EB, Schmittdiel JA, Tallman K, Bellows J. Understanding panel management: a comparative study of an emerging approach to population care. Perm J. 2007;11(3):12-20.
3. Loo TS, Davis RB, Lipsitz LA, et al. Electronic medical record reminders and panel management to improve primary care of elderly patients. Arch Intern Med. 2011;171(17):1552-1558.
4. Kanter M, Martinez O, Lindsay G, Andrews K, Denver C. Proactive office encounter: a systematic approach to preventive and chronic care at every patient encounter. Perm J. 2010;14(3):38-43.
5. Kravetz JD, Walsh RF. Team-based hypertension management to improve blood pressure control. J Prim Care Community Health. 2016;7(4):272-275.
6. Kaminetzky CP, Nelson KM. In the office and in-between: the role of panel management in primary care. J Gen Intern Med. 2015;30(7):876-877.