User login
Restless Legs Syndrome Among Veterans With Spinal Cord Lesions (FULL)
Spinal cord injuries (SCI) are common in veteran populations.1 Veterans with spinal cord injuries and disorders (SCI/D) also may have concurrent sleep disturbances. Spinal cord injury typically causes spasticity.2,3 Hypersensitivity of the flexor reflex pathways is believed to cause painful muscle spasms in patients with SCI.4 Neuropathic pain at or below the level of the lesion also is common.
Restless legs syndrome (RLS) is a common sleep disorder that affects sleep quality and can occur concomitantly with spinal cord lesions.5 In about 80% of RLS cases, involuntary movements of legs across hip, knee, and ankle joints during sleep, known as periodic limb movement during sleep (PLMS), occurs.6 Several studies showed increased prevalence of PLMS in patients with SCI, and some case reports suggest an increased prevalence of RLS in this population.7,8 One small study showed that 100% of patients with SCI had symptoms of RLS.6 Another study found that SCI could trigger PLMS.8
The pathophysiology of RLS and PLMS in patients with SCI is not fully understood, but case reports describing PLM in SCI patients points to a possible role of central pattern generators and the flexor reflex afferents in the pathophysiology of PLMS.9,10 Changes of the tissue microstructure in the midbrain and upper cervical spinal cord have been described in patients with RLS.11The objective of this study was to assess the prevalence of RLS in a veteran population with SCI/D and
Methods
The institutional review and ethical approval boards of the Minneapolis VA Health Care System approved the study. Within the VA system, 666 patients with SCI/D were identified using a national database. Of the 666 people, 316 were excluded, 199 were included, and 151 were deceased.
Patients aged between 18 and 65 years were included in the study. Charts of patients who had been discharged with the diagnosis of SCI from 2002 to 2008 were studied. All patients met the inclusion criteria of the International Restless Legs Syndrome Study Group diagnosis.
Exclusion criteria were as follows: Patients with evidence of brain pathology (eg, stroke), concurrent neurologic condition associated with RLS (Parkinson disease, spinocerebellar ataxia, peripheral neuropathy), concurrent psychiatric condition within the setting of treatment with dopamine antagonists, secondary causes of RLS (renal failure/uremia, iron deficiency, rheumatoid arthritis, and pregnancy) and a recent history of alcohol or drug misuse or current evidence of substance use of < 1 year.
A patient list was compiled that included the etiology of the SCI (vascular injury, multiple sclerosis [MS], trauma, unknown, and other), the level(s) and completeness of the SCI per radiology report, RLS pharmacotherapies, and pertinent medical history.
Axial T2-weighted images on magnetic resonance imaging (MRI) scans were retrospectively reviewed. Sagittal T1/T2-weighted and axial T2-weighted sequences were performed routinely on all patients with spinal cord lesions. The analysis included the extension of the lesion on both sagittal and axial distributions. The anatomic location of the cord lesion was categorized by the following: (1) pure gray matter (central cord); (2) white matter (dorsal [D], dorsolateral [DL], ventral [V], ventrolateral areas [VL]).
A questionnaire using standard diagnostic criteria for RLS was mailed to the 199 patients who met the inclusion criteria (Appendix A). 

All analyses were carried out using StataCorp STATA 13 (College Station, TX). Descriptive statistics were used. The analyses were carried out using chi-square and Fisher exact tests. Differences between the groups were considered statistically significant at P < .05. The data were analyzed to obtain point prevalence among patients with SCI, and comparisons were made among the different subgroups.
Results
Of the 162 patients who chose to participate in the study, the sleep specialists confirmed 31 (19%) to have RLS, 112 (69%) were confirmed negative for RLS, and an additional 19 (12%) screened positive for RLS but were not confirmed to have RLS by the sleep specialists (Figure 1). 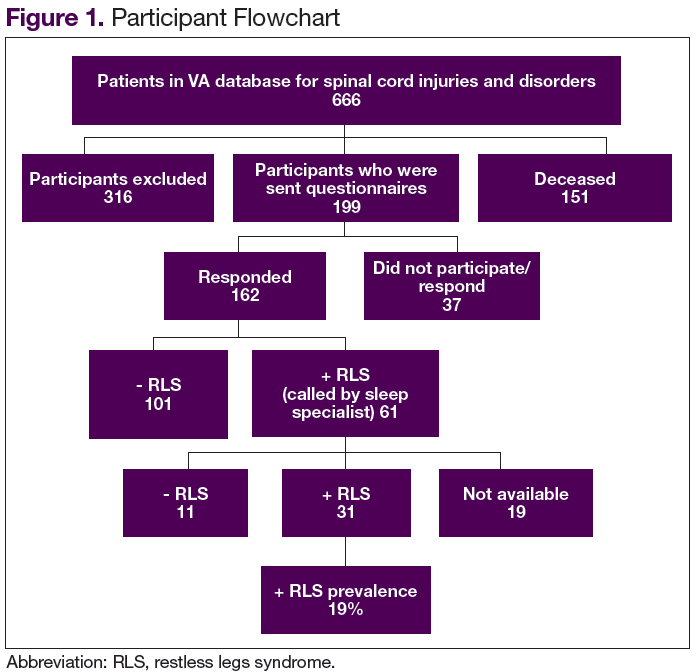
The etiology of SCI was subdivided into 4 groups: MS, trauma, vascular, and other/unknown. Within each group (– RLS vs + RLS), MS and trauma were the most common etiologies with 55% MS and 36% trauma in the + RLS group.
When comparing RLS among the spinal cord levels (cervical, thoracic, lumbar and cervical + thoracic), only the cervical + thoracic subgroup (18% + RLS vs 5% – RLS) showed a significant difference (Figure 2). 
There was no significant difference found with the prevalence of RLS in the axial plane of the spinal cord lesions (ventral/ventro-lateral/central cord vs dorsal/dorsolateral) or by the completeness of spinal cord lesions, P = .76. There was a higher prevalence of incomplete cord injury, however, within each subgroup of RLS.
The Mann-Whitney test was used to analyze the burden of disease in both groups (+ RLS vs – RLS). Moderate level of burden was most frequently reported with a higher prevalence within the + RLS group. Of those receiving treatment for RLS, 71% were + RLS vs 46% – RLS with a P value of .01. Symptoms of RLS after cord injury were 89% + RLS vs 55% – RLS with a P value of .03.
Discussion
This study represents one of the first studies to determine the prevalence of RLS in veterans with spinal cord disease. Research in this area is important to raise awareness of RLS among the veteran population with and without SCI and disorders. Restless legs syndrome often escapes diagnosis because of difficulty understanding the patient’s descriptions of their sensations. In addition, RLS may cause debilitating symptoms of sleep deprivation, daytime sleepiness, discomfort, and fatigue, which often results in decreased quality of life (QOL). Proper screening and treatment may improve QOL.
A study by Kumru and colleagues showed a similar rate of RLS in patients with SCI and RLS symptoms presented in the first year after SCI as did this study (18% vs 19%, respectively).4 In that study, RLS was more common in patients with lesions in lumbosacral area. Kumru and colleagues also showed that a dopaminergic medication improved symptoms of RLS in this population, whereas this study did not explore treatment outcomes.4
The pathogenesis of RLS is not fully known, but hereditary factors, iron metabolism, and the brain dopaminergic system are thought to be involved.11 It is hypothesized that spinal cord lesions allow the appearance of RLS symptoms and spinal leg movement generator by blocking descending inhibitory spinal pathways.12 One hypothesis is that damage to A11 nuclei (the main source of dopamine in the spinal cord or its diencephalospinal tract in animals) causes hyperexcitability of the spinal cord and leads to PLM and RLS symptoms.13 As the axons of A11 nuclei are present along the whole span of the spinal cord, SCI/D in patients with RLS might interrupt this dopaminergic tract and produce the RLS symptoms.
Limitations
This study included only veterans, so the prevalence may not apply to the nonveteran SCI population. Also, the population mainly was male, and there was no accurate information on race. Ferritin levels of the patients were not checked and is a major factor in RLS. The reported onset of RLS after the SCI could be due to recall bias.
Conclusion
The prevalence of RLS in veterans with SCI is above that reported in the general population (19% vs 10%, respectively). Furthermore, those with RLS have symptoms that often started after the SCI (suggesting causality) and required therapy due to their level of RLS symptom burden. A spectrum of severity of symptoms is present among those with RLS, with 83% having moderate-to-severe RLS affecting their QOL.
Although there was not a statistically significant relationship between RLS and spinal cord lesion level, there was a slightly higher prevalence of RLS at the cervical and thoracic levels, which may be relevant for future studies. There was no difference found between the RLS subgroups with respect to the location of the lesion within the spinal cord; however, a larger sample size may be needed to determine whether this would reach statistical significance. Prompt search for symptoms of RLS in veterans with SCI is warranted to provide adequate treatment to improve sleep health and QOL in this population.
1. Lasfargues JE, Custis D, Morrone F, Carswell J, Nguyen T. A model for estimating spinal cord injury prevalence in the United States. Paraplegia. 1995;33(2):62-68.
2. Sjölund BH. Pain and rehabilitation after spinal cord injury: the case of sensory spasticity? Brain Res Brain Res Rev. 2002;40(1-3):250-256.
3. Adams MM, Hicks AL. Spasticity after spinal cord injury. Spinal Cord. 2005;43(10):577-586.
4. Kumru H, Vidal J, Benito J, et al. Restless leg syndrome in patients with spinal cord injury. Parkinsonism Relat Disord. 2015;21(12):1461-1464.
5. Wilt TJ, MacDonald R, Ouellette J, et al. Pharmacologic therapy for primary restless legs syndrome: a systematic review and meta-analysis. JAMA Intern Med. 2013;173(7):496-505.
6. American Academy of Sleep Medicine. The International Classification of Sleep Disorders: Diagnostic and Coding Manual. (AASM ICSD-3). 3rd ed. Westchester, IL: American Academy of Sleep Medicine; 2014.
7. Telles SC, Alves RC, Chadi G. Periodic limb movements during sleep and restless legs syndrome in patients with ASIA A spinal cord injury. J Neurol Sci. 2011;303(1-2):119-123.
8. Telles SC, Alves RS, Chadi G. Spinal cord injury as a trigger to develop periodic leg movements during sleep: an evolutionary perspective. Arq Neuropsiquiatr. 2012;70(11):880-884.
9. Tings T, Baier PC, Paulus W, Trenkwalder C. Restless legs syndrome induced by impairment of sensory spinal pathways. J Neurol. 2003;250(4):499-500.
10. Paulus W, Trenkwalder C. Less is more: pathophysiology of dopaminergic-therapy-related augmentation in restless legs syndrome. Lancet Neurol. 2006;5(10):878-886.
11. Silber MH, Ehrenberg BL, Allen RP, et al; Medical Advisory Board of the Restless Legs Syndrome Foundation. An algorithm for the management of restless legs syndrome. Mayo Clin Proc. 2004;79(7):916-922.
12. Hartmann M, Pfister R, Pfadenhauer K. Restless legs syndrome associated with spinal cord lesions. J Neurol Neurosurg Psychiatry. 1999;66(5):688-689.
13. Clemens S, Rye D, Hochman S. Restless legs syndrome: revisiting the dopamine hypothesis from the spinal cord perspective. Neurology. 2006;67(1):125-130.
Spinal cord injuries (SCI) are common in veteran populations.1 Veterans with spinal cord injuries and disorders (SCI/D) also may have concurrent sleep disturbances. Spinal cord injury typically causes spasticity.2,3 Hypersensitivity of the flexor reflex pathways is believed to cause painful muscle spasms in patients with SCI.4 Neuropathic pain at or below the level of the lesion also is common.
Restless legs syndrome (RLS) is a common sleep disorder that affects sleep quality and can occur concomitantly with spinal cord lesions.5 In about 80% of RLS cases, involuntary movements of legs across hip, knee, and ankle joints during sleep, known as periodic limb movement during sleep (PLMS), occurs.6 Several studies showed increased prevalence of PLMS in patients with SCI, and some case reports suggest an increased prevalence of RLS in this population.7,8 One small study showed that 100% of patients with SCI had symptoms of RLS.6 Another study found that SCI could trigger PLMS.8
The pathophysiology of RLS and PLMS in patients with SCI is not fully understood, but case reports describing PLM in SCI patients points to a possible role of central pattern generators and the flexor reflex afferents in the pathophysiology of PLMS.9,10 Changes of the tissue microstructure in the midbrain and upper cervical spinal cord have been described in patients with RLS.11The objective of this study was to assess the prevalence of RLS in a veteran population with SCI/D and
Methods
The institutional review and ethical approval boards of the Minneapolis VA Health Care System approved the study. Within the VA system, 666 patients with SCI/D were identified using a national database. Of the 666 people, 316 were excluded, 199 were included, and 151 were deceased.
Patients aged between 18 and 65 years were included in the study. Charts of patients who had been discharged with the diagnosis of SCI from 2002 to 2008 were studied. All patients met the inclusion criteria of the International Restless Legs Syndrome Study Group diagnosis.
Exclusion criteria were as follows: Patients with evidence of brain pathology (eg, stroke), concurrent neurologic condition associated with RLS (Parkinson disease, spinocerebellar ataxia, peripheral neuropathy), concurrent psychiatric condition within the setting of treatment with dopamine antagonists, secondary causes of RLS (renal failure/uremia, iron deficiency, rheumatoid arthritis, and pregnancy) and a recent history of alcohol or drug misuse or current evidence of substance use of < 1 year.
A patient list was compiled that included the etiology of the SCI (vascular injury, multiple sclerosis [MS], trauma, unknown, and other), the level(s) and completeness of the SCI per radiology report, RLS pharmacotherapies, and pertinent medical history.
Axial T2-weighted images on magnetic resonance imaging (MRI) scans were retrospectively reviewed. Sagittal T1/T2-weighted and axial T2-weighted sequences were performed routinely on all patients with spinal cord lesions. The analysis included the extension of the lesion on both sagittal and axial distributions. The anatomic location of the cord lesion was categorized by the following: (1) pure gray matter (central cord); (2) white matter (dorsal [D], dorsolateral [DL], ventral [V], ventrolateral areas [VL]).
A questionnaire using standard diagnostic criteria for RLS was mailed to the 199 patients who met the inclusion criteria (Appendix A).
All analyses were carried out using StataCorp STATA 13 (College Station, TX). Descriptive statistics were used. The analyses were carried out using chi-square and Fisher exact tests. Differences between the groups were considered statistically significant at P < .05. The data were analyzed to obtain point prevalence among patients with SCI, and comparisons were made among the different subgroups.
Results
Of the 162 patients who chose to participate in the study, the sleep specialists confirmed 31 (19%) to have RLS, 112 (69%) were confirmed negative for RLS, and an additional 19 (12%) screened positive for RLS but were not confirmed to have RLS by the sleep specialists (Figure 1).
The etiology of SCI was subdivided into 4 groups: MS, trauma, vascular, and other/unknown. Within each group (– RLS vs + RLS), MS and trauma were the most common etiologies with 55% MS and 36% trauma in the + RLS group.
When comparing RLS among the spinal cord levels (cervical, thoracic, lumbar and cervical + thoracic), only the cervical + thoracic subgroup (18% + RLS vs 5% – RLS) showed a significant difference (Figure 2).
There was no significant difference found with the prevalence of RLS in the axial plane of the spinal cord lesions (ventral/ventro-lateral/central cord vs dorsal/dorsolateral) or by the completeness of spinal cord lesions, P = .76. There was a higher prevalence of incomplete cord injury, however, within each subgroup of RLS.
The Mann-Whitney test was used to analyze the burden of disease in both groups (+ RLS vs – RLS). Moderate level of burden was most frequently reported with a higher prevalence within the + RLS group. Of those receiving treatment for RLS, 71% were + RLS vs 46% – RLS with a P value of .01. Symptoms of RLS after cord injury were 89% + RLS vs 55% – RLS with a P value of .03.
Discussion
This study represents one of the first studies to determine the prevalence of RLS in veterans with spinal cord disease. Research in this area is important to raise awareness of RLS among the veteran population with and without SCI and disorders. Restless legs syndrome often escapes diagnosis because of difficulty understanding the patient’s descriptions of their sensations. In addition, RLS may cause debilitating symptoms of sleep deprivation, daytime sleepiness, discomfort, and fatigue, which often results in decreased quality of life (QOL). Proper screening and treatment may improve QOL.
A study by Kumru and colleagues showed a similar rate of RLS in patients with SCI and RLS symptoms presented in the first year after SCI as did this study (18% vs 19%, respectively).4 In that study, RLS was more common in patients with lesions in lumbosacral area. Kumru and colleagues also showed that a dopaminergic medication improved symptoms of RLS in this population, whereas this study did not explore treatment outcomes.4
The pathogenesis of RLS is not fully known, but hereditary factors, iron metabolism, and the brain dopaminergic system are thought to be involved.11 It is hypothesized that spinal cord lesions allow the appearance of RLS symptoms and spinal leg movement generator by blocking descending inhibitory spinal pathways.12 One hypothesis is that damage to A11 nuclei (the main source of dopamine in the spinal cord or its diencephalospinal tract in animals) causes hyperexcitability of the spinal cord and leads to PLM and RLS symptoms.13 As the axons of A11 nuclei are present along the whole span of the spinal cord, SCI/D in patients with RLS might interrupt this dopaminergic tract and produce the RLS symptoms.
Limitations
This study included only veterans, so the prevalence may not apply to the nonveteran SCI population. Also, the population mainly was male, and there was no accurate information on race. Ferritin levels of the patients were not checked and is a major factor in RLS. The reported onset of RLS after the SCI could be due to recall bias.
Conclusion
The prevalence of RLS in veterans with SCI is above that reported in the general population (19% vs 10%, respectively). Furthermore, those with RLS have symptoms that often started after the SCI (suggesting causality) and required therapy due to their level of RLS symptom burden. A spectrum of severity of symptoms is present among those with RLS, with 83% having moderate-to-severe RLS affecting their QOL.
Although there was not a statistically significant relationship between RLS and spinal cord lesion level, there was a slightly higher prevalence of RLS at the cervical and thoracic levels, which may be relevant for future studies. There was no difference found between the RLS subgroups with respect to the location of the lesion within the spinal cord; however, a larger sample size may be needed to determine whether this would reach statistical significance. Prompt search for symptoms of RLS in veterans with SCI is warranted to provide adequate treatment to improve sleep health and QOL in this population.
1. Lasfargues JE, Custis D, Morrone F, Carswell J, Nguyen T. A model for estimating spinal cord injury prevalence in the United States. Paraplegia. 1995;33(2):62-68.
2. Sjölund BH. Pain and rehabilitation after spinal cord injury: the case of sensory spasticity? Brain Res Brain Res Rev. 2002;40(1-3):250-256.
3. Adams MM, Hicks AL. Spasticity after spinal cord injury. Spinal Cord. 2005;43(10):577-586.
4. Kumru H, Vidal J, Benito J, et al. Restless leg syndrome in patients with spinal cord injury. Parkinsonism Relat Disord. 2015;21(12):1461-1464.
5. Wilt TJ, MacDonald R, Ouellette J, et al. Pharmacologic therapy for primary restless legs syndrome: a systematic review and meta-analysis. JAMA Intern Med. 2013;173(7):496-505.
6. American Academy of Sleep Medicine. The International Classification of Sleep Disorders: Diagnostic and Coding Manual. (AASM ICSD-3). 3rd ed. Westchester, IL: American Academy of Sleep Medicine; 2014.
7. Telles SC, Alves RC, Chadi G. Periodic limb movements during sleep and restless legs syndrome in patients with ASIA A spinal cord injury. J Neurol Sci. 2011;303(1-2):119-123.
8. Telles SC, Alves RS, Chadi G. Spinal cord injury as a trigger to develop periodic leg movements during sleep: an evolutionary perspective. Arq Neuropsiquiatr. 2012;70(11):880-884.
9. Tings T, Baier PC, Paulus W, Trenkwalder C. Restless legs syndrome induced by impairment of sensory spinal pathways. J Neurol. 2003;250(4):499-500.
10. Paulus W, Trenkwalder C. Less is more: pathophysiology of dopaminergic-therapy-related augmentation in restless legs syndrome. Lancet Neurol. 2006;5(10):878-886.
11. Silber MH, Ehrenberg BL, Allen RP, et al; Medical Advisory Board of the Restless Legs Syndrome Foundation. An algorithm for the management of restless legs syndrome. Mayo Clin Proc. 2004;79(7):916-922.
12. Hartmann M, Pfister R, Pfadenhauer K. Restless legs syndrome associated with spinal cord lesions. J Neurol Neurosurg Psychiatry. 1999;66(5):688-689.
13. Clemens S, Rye D, Hochman S. Restless legs syndrome: revisiting the dopamine hypothesis from the spinal cord perspective. Neurology. 2006;67(1):125-130.
Nail Irregularities Associated With Sézary Syndrome
Sézary syndrome (SS) is an advanced leukemic form of cutaneous T-cell lymphoma (CTCL) that is characterized by generalized erythroderma and T-cell leukemia. Skin changes can include erythroderma, keratosis pilaris–like lesions, keratoderma, ectropion, alopecia, and nail changes.1 Nail changes in SS patients frequently are overlooked and underreported; they vary greatly from patient to patient, and their incidence has not been widely evaluated in the literature.
In this retrospective study, we reviewed medical records from a previously collected CTCL clinic database at the University of Texas MD Anderson Cancer Center (Houston, Texas) and found nail abnormalities in 36 of 83 (43.4%) patients with a diagnosis of SS. Findings for 2 select cases are described in more detail; they were compared to prior case reports from the literature to establish a comprehensive list of nail irregularities that have been associated with SS.
Methods
We examined records from a previously collected CTCL clinic database at the University of Texas MD Anderson Cancer Center. This database was part of an institutional review board–approved protocol to prospectively collect data from patients with CTCL. Our search yielded 83 patients with SS who were seen between 2007 and 2014.
Results
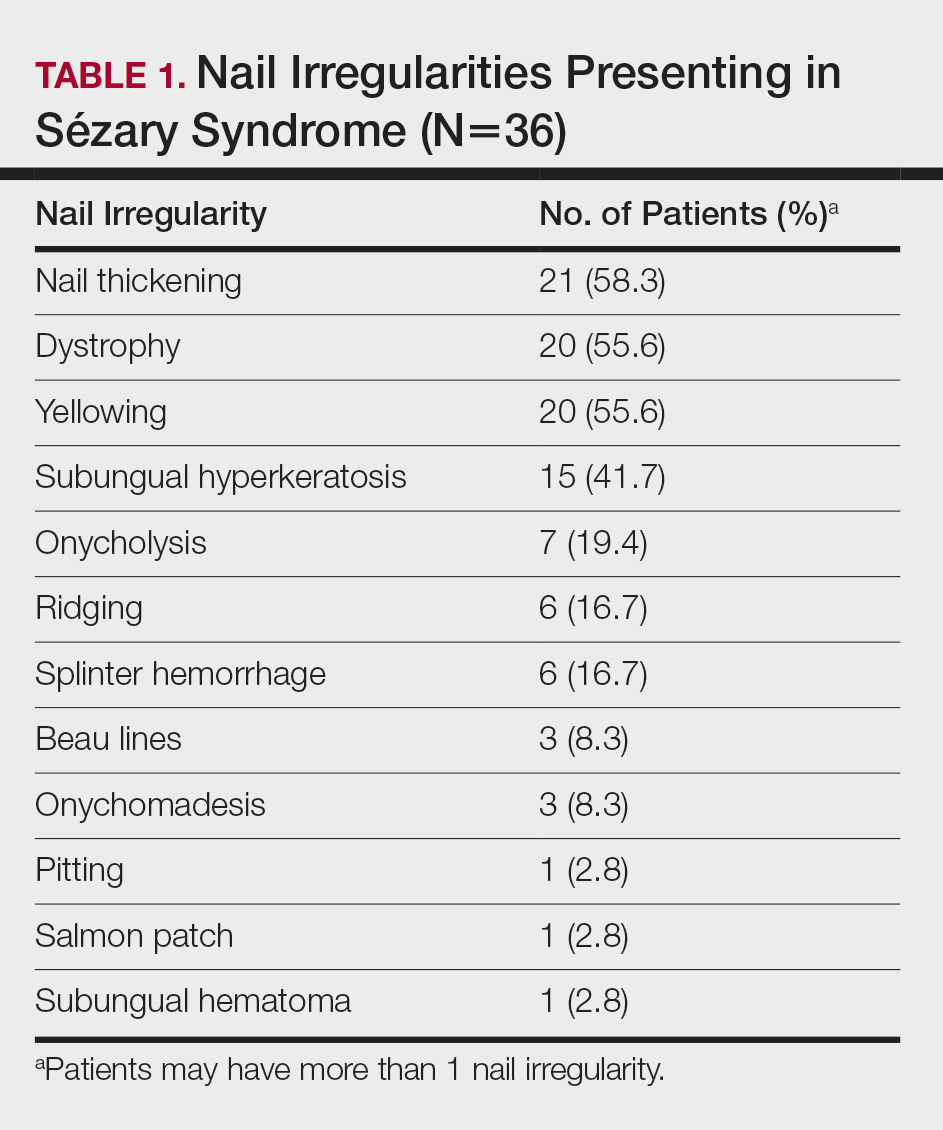
Of the 83 cases reviewed from the CTCL database, 36 (43.4%) SS patients reported at least 1 nail abnormality on the fingernails or toenails. Patients ranged in age from 59 to 85 years and included 27 (75%) men and 9 (25%) women. Nail irregularities noted on physical examination are summarized in Table 1. More than half of the patients presented with nail thickening (58.3% [21/36]), dystrophy (55.6% [20/36]), or yellowing (55.6% [20/36]) of 1 or more nails. Other findings included 15 (41.7%) patients with subungual hyperkeratosis, 3 (8.3%) with Beau lines, and 1 (2.8%) with multiple oil spots consistent with salmon patches. Five (13.9%) patients had only 1 reported nail irregularity, and 1 (2.8%) patient had 6 irregularities. The average number of nail abnormalities per patient was 2.88 (range, 1–6). We selected 2 patients with extensive nail findings who represent the spectrum of nail findings in patients with SS.
Patient 1
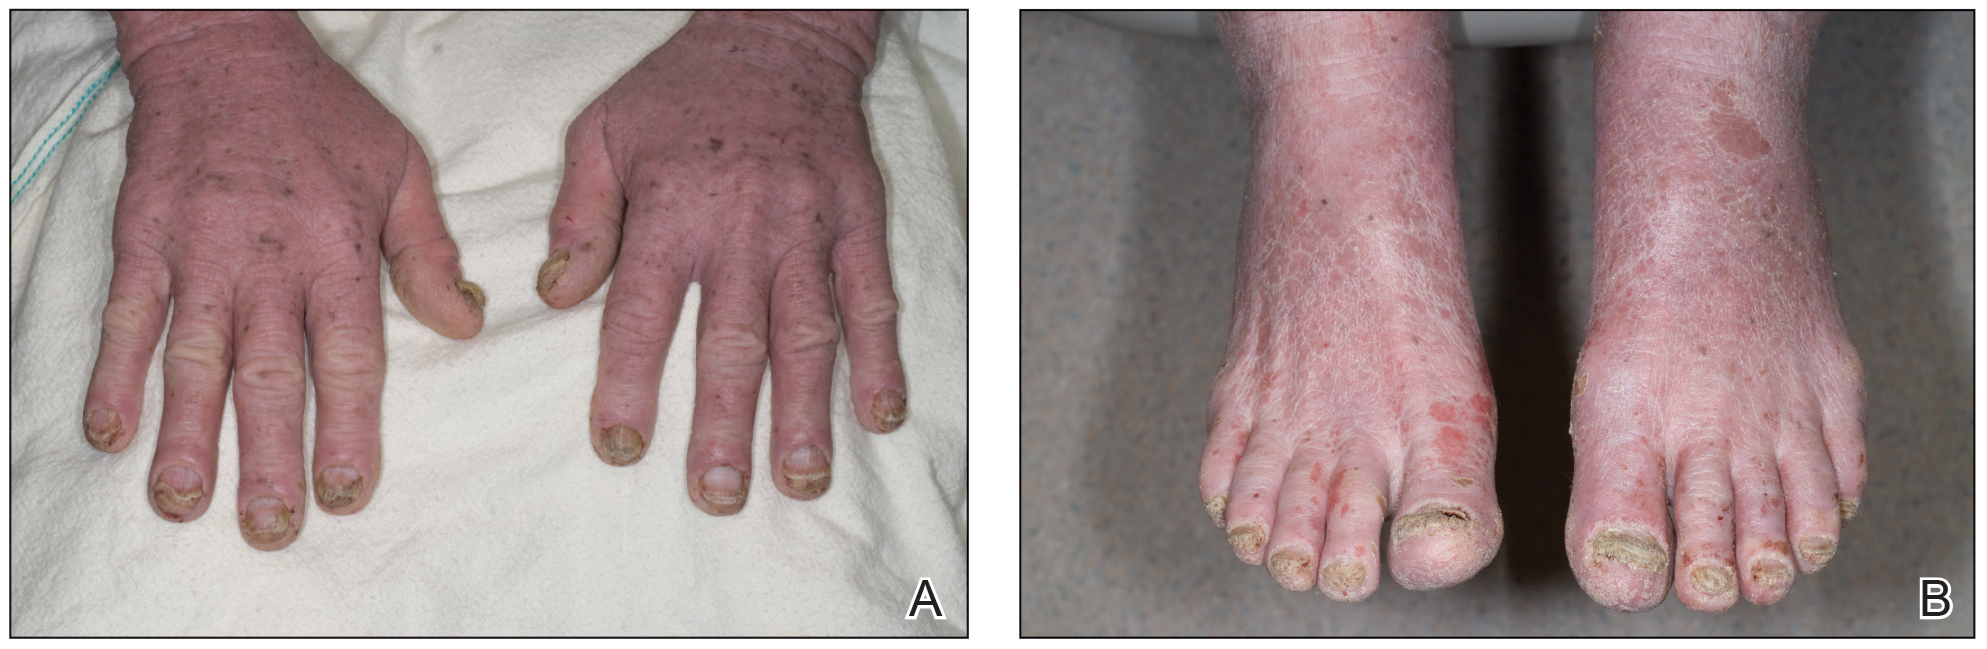
A 71-year-old white man presented with a papular rash of 30 years’ duration. The eruption first occurred on the soles of the feet but progressed to generalized erythroderma. He was found to be colonized with methicillin-resistant Staphylococcus aureus. Over the next 9 months, the patient was diagnosed with SS at an outside institution and was treated with cyclophosphamide, hydroxydaunorubicin, vincristine, prednisone, gemcitabine, etoposide, methylprednisolone, cytarabine, cisplatin, topical steroids, and intravenous methotrexate with no apparent improvement. At presentation to our institution, physical examination revealed pruritus; alopecia; generalized lymphadenopathy; erythroderma; and irregular nail findings, including yellowing, thickened fingernails and toenails with subungual debris, and splinter hemorrhage (Figure 1). A thick plaque with perioral distribution as well as erosions on the face and feet were noted. The total body surface area (BSA) affected was 100% (patches, 91%; plaques, 9%).
At diagnosis at our institution, the patient’s white blood cell (WBC) count was 17,800/µL (reference range, 4000–11,000/µL), with 11% Sézary cells noted. Biopsy of a lymph node from the inguinal area indicated T-cell lymphoma with clonal T-cell receptor (TCR) β gene rearrangement. Biopsy of lesional skin in the right groin area showed an atypical T-cell lymphocytic infiltrate with a CD4:CD8 ratio of 2.9:1 and partial loss of CD7 expression, consistent with mycosis fungoides (MF)/SS stage IVA. At presentation to our institution, the WBC count was 12,700/µL with a neutrophil count of 47% (reference range, 42%–66%), lymphocyte count of 36% (reference range, 24%–44%), monocyte count of 4% (reference range, 2%–7%), platelet count of 427,000/µL (reference range, 150,000–350,000/µL), hemoglobin of 9.9 g/dL (reference range, 14.0–17.5 g/dL), and lactate dehydrogenase of 733 U/L (reference range, 135–214 U/L). Lymphocytes were positive for CD2, CD3, CD4, CD5, CD25, CD52, TCRα, TCRβ, and TCR VB17; partial for CD26; and negative for CD7, CD8, and CD57. At follow-up 1 month later, the CD4+CD26− T-cell population was 56%, which was consistent with SS T-cell lymphoma.
Skin scrapings from the generalized keratoderma on the patient’s feet were positive for fungal hyphae under potassium hydroxide examination. Nail clippings showed compact keratin with periodic acid–Schiff–positive small yeast forms admixed with bacterial organisms, consistent with onychomycosis. At our institution, the patient received extracorporeal photopheresis, whirlpool therapy (a type of hydrotherapy), steroid wet wraps, and intravenous vancomycin for methicillin-resistant S aureus. He also received bexarotene, levothyroxine sodium, and fenofibrate. After antibiotics and 2 sessions of photopheresis, the total BSA improved from 100% to 33%. The feet and nails were treated with ciclopirox gel and terbinafine, but neither the keratoderma nor the nails improved.
Patient 2
An 84-year-old white man with B-cell chronic lymphocytic leukemia also was diagnosed with SS at an outside institution. One year later, he presented to our institution with mild pruritus and swelling of the lower left leg, which was diagnosed as deep vein thrombosis. There was bilateral scaling of the palms, with fissures present on the left palm. The fingernails showed dystrophy with Beau lines, and the toenails were dystrophic with onycholysis on the bilateral great toes (Figure 2). Patches were noted on most of the body, including the feet, with plaques limited to the hands; the total BSA affected was 80%. Flow cytometry showed an elevated Sézary cell count (CD4+CD26−) of 4700 cells/µL. Complete blood cell count with differential included a hemoglobin level of 11.4 g/dL, hematocrit level of 35.3% (reference range, 37%–47%), a platelet count of 217,000/µL, and a WBC count of 17,7

the bilateral great toes.
Comment
Nail changes are found in many cases of advanced-stage SS but rarely have been reported in the literature. A literature review of PubMed articles indexed for MEDLINE was conducted using the search terms Sézary, nail, onychodystrophy, cutaneous T-cell lymphoma, and CTCL. All results were reviewed for original reported cases of SS with at least 1 reported nail finding. A total of 7 reports2-8 met these requirements with a total of 43 SS patients with reported nail findings, which are summarized in Tables 2 and 3.
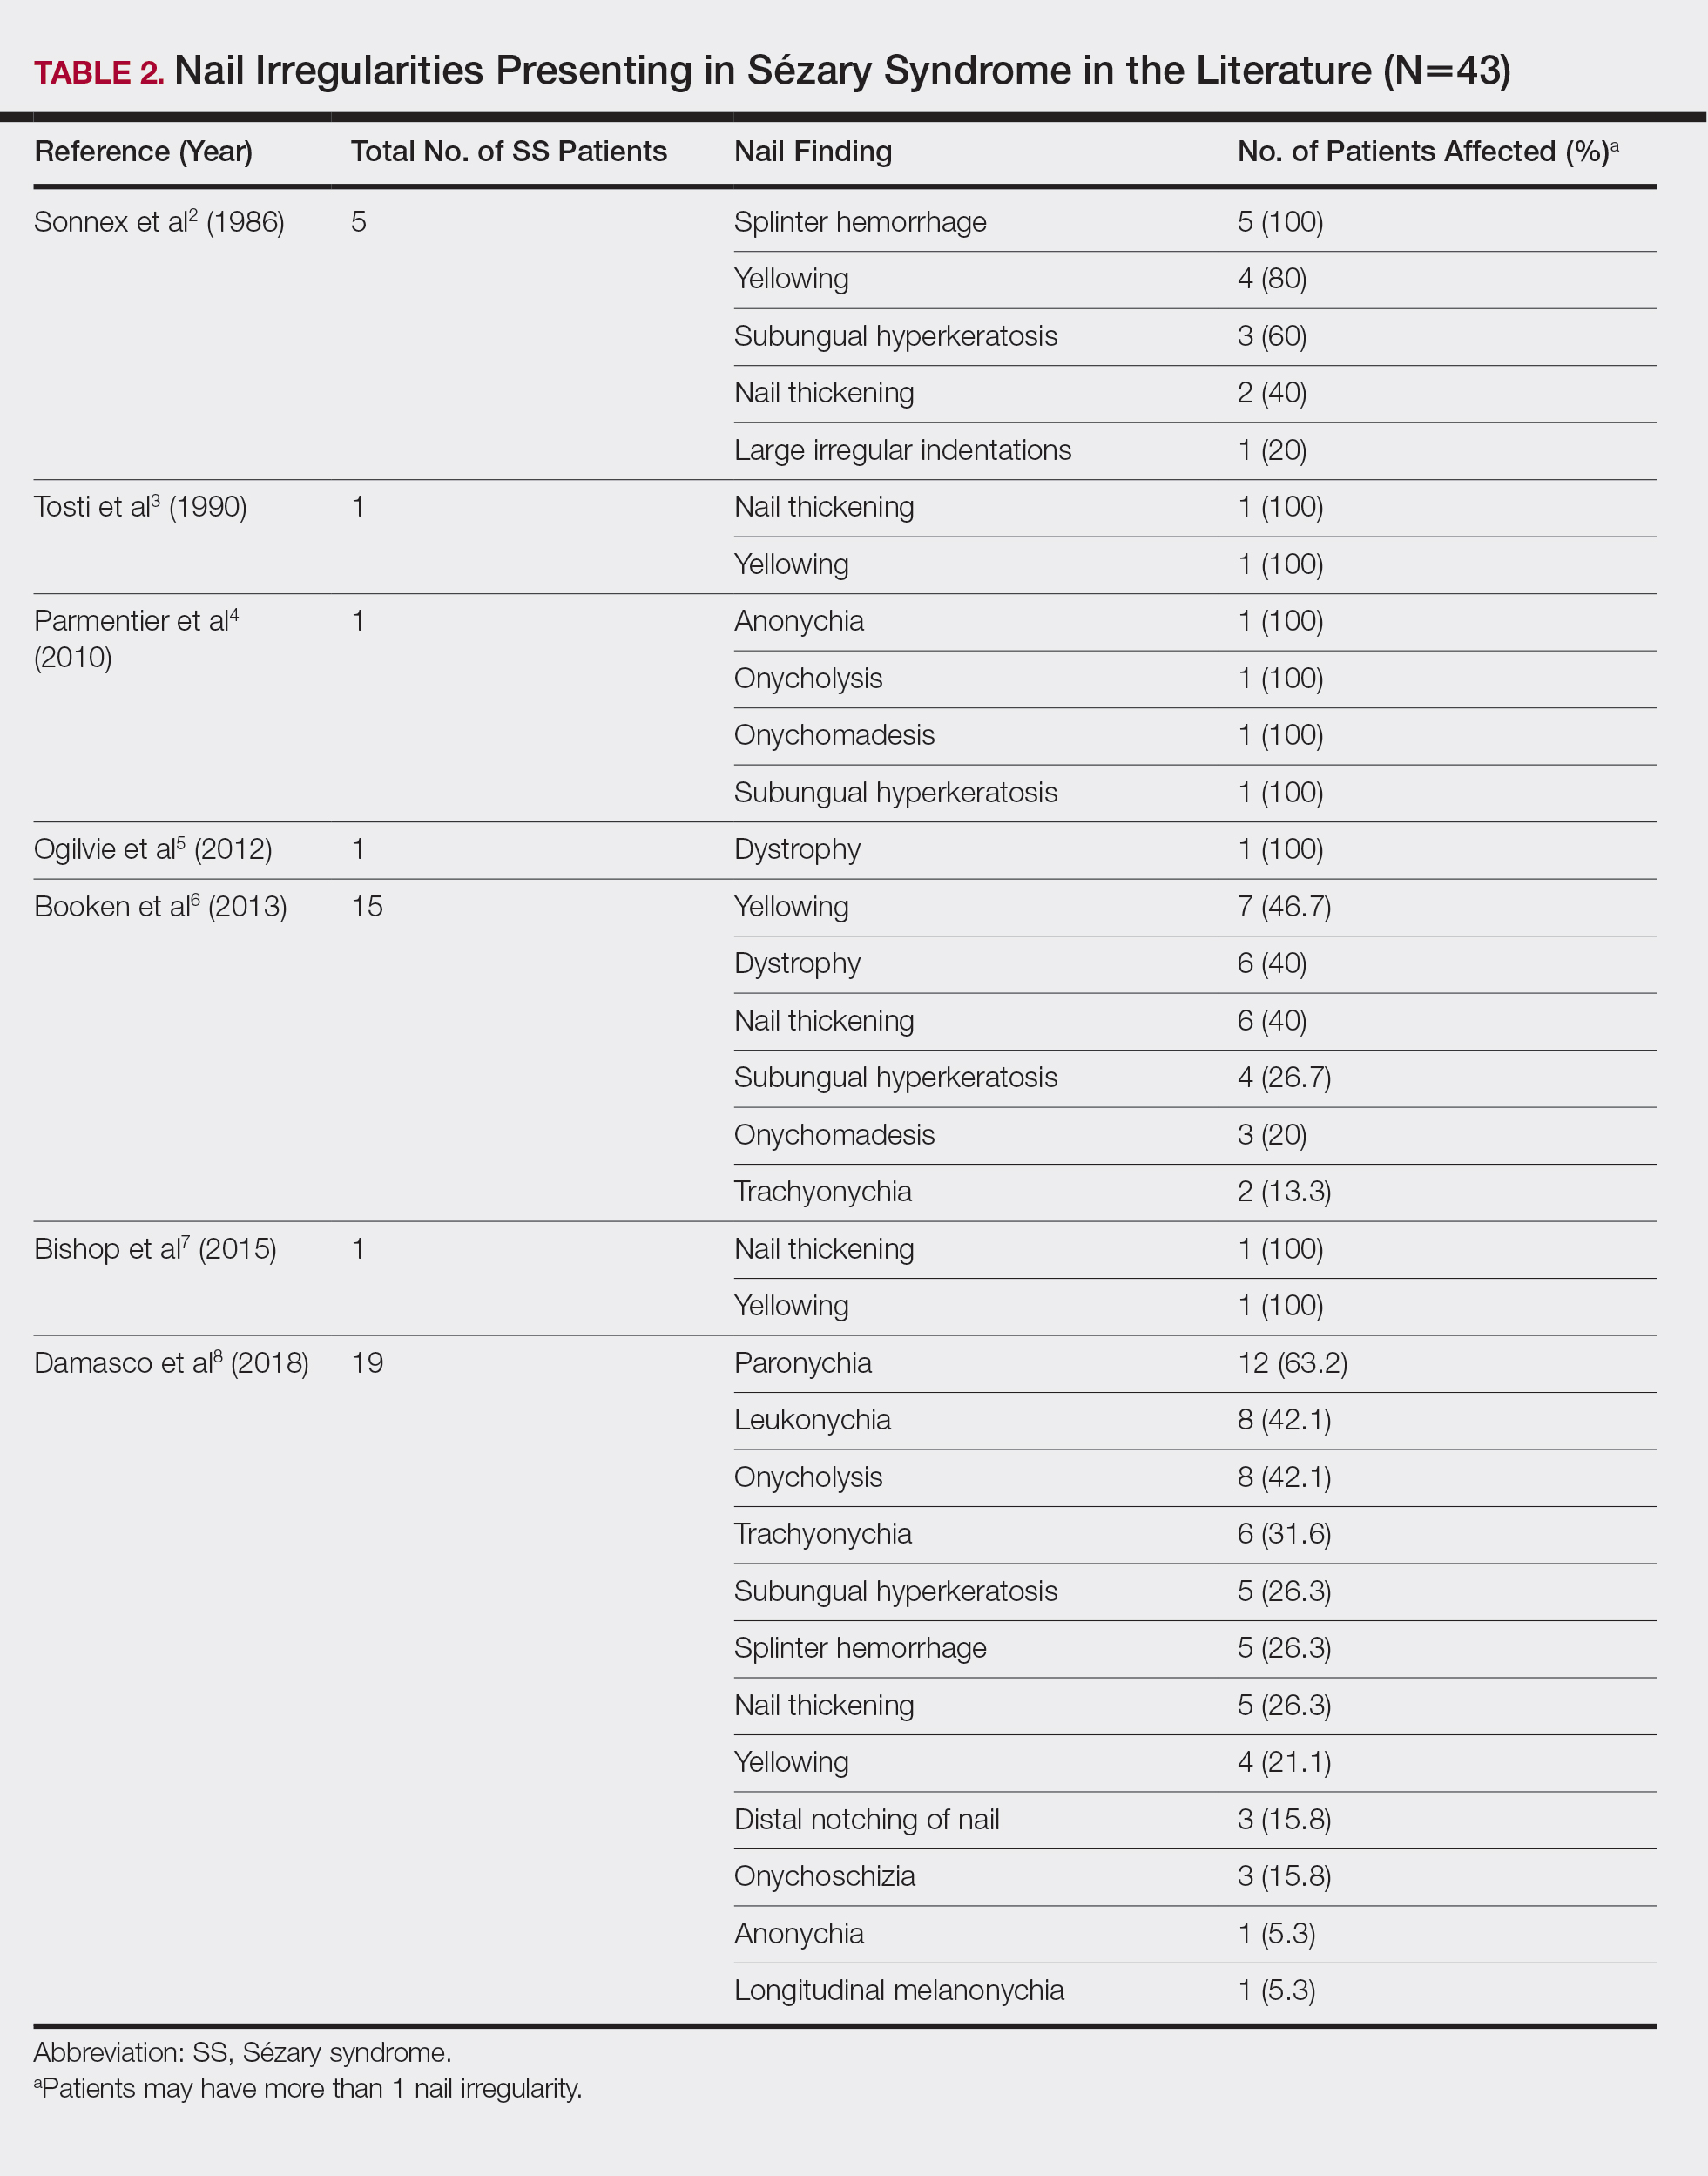

Our findings are generally consistent with those previously described in the literature. Nail thickening, yellowing, subungual hyperkeratosis, dystrophy, and onycholysis are consistently some of the most common nail findings in patients with SS. In 2012, Martin and Duvic9 found that 52.9% (45/85) of SS patients with keratoderma on physical examination were positive for dermatophyte hyphae when skin scrapings were done under potassium hydroxide examination, a considerably greater incidence than in the general population (10%–20%). The nail changes seen in our SS patients were identical to those found in dermatophyte infections, including discoloration, subungual debris, nail thickening, onycholysis, and dystrophy.10 In patient 1, nail clippings were positive for onychomycosis, a common nail condition that is especially prevalent in older or immunocompromised patients.9,10
Interestingly, findings not observed in the literature included salmon patches and Beau lines. Beau lines are horizontal depressions in the nail plate and often are indicative of temporary interruption of nail growth, such as due to an underlying disease process, severe illness, and/or chemotherapy.11,12 In our review, patient 2 had clinical findings of Beau lines. Because the average time for fingernail regrowth is 3 to 6 months,13 it is reasonable to assume that physical findings associated with fludarabine, cyclophosphamide, and rituximab chemotherapy treatment would no longer be demonstrated 11 months after completion of therapy. On the other hand, paronychia was frequently observed by Damasco et al8 (63.2% [12/19] of their cases), yet it was not found in our database or the other literature reports we reviewed. Perhaps these differences are due to differences in patient populations and/or available therapies, lack of documentation, or small sample size and limited reports in the literature.
A common question is: Are the nail irregularities caused by the physical symptoms of advanced CTCL or by the underlying disease process in response to the atypical T cells? Erythroderma has been speculated to cause many of the clinical findings of nail abnormalities found in CTCL patients.2,3 However, Fleming et al14 described an MF patient who experienced onychomadesis without erythroderma, which suggests that a different mechanism may cause these nail changes. The wide range of nail abnormalities in CTCL can cause problems with diagnosing the specific cause underlying the nail alteration.
To further complicate the issue, numerous therapies for CTCL also may cause nail changes, such as the previously described Beau lines. In 2010, Parmentier et al4 reported a patient with nail alterations that had been present for more than 1 year, with 9 of 10 fingernails demonstrating anonychia, onychomadesis, subungual distal hyperkeratosis, and onycholysis. In this case report, the authors were able to exclude phototherapy as the cause of onycholysis (visible separation of the nail plate from the nail bed) and other clinical nail findings in the SS patient based on the onset of nail changes prior to beginning psoralen plus UVA therapy and complete sparing of 1 finger.4 The findings in our patient 1, who had no history of psoralen plus UVA therapy at the time the irregular nail findings presented, supports this observation. Total skin electron beam therapy for MF also has been reported to cause temporary nail stasis and thus must be taken into account when considering nail changes in patients with MF/SS.15
A nail matrix biopsy may provide clues to the definitive cause of the clinically observed nail changes; however, this procedure typically is not performed due to patient concerns of postoperative complications including pain and nail dystrophy.16 Histopathology features were similar in reported nail biopsies of 2 SS patients.3,4 Tosti et al3 reported that longitudinal biopsy showed a dense lymphocytic infiltrate of atypical lymphocytes with involuted nuclei and notable epidermotropism. Parmentier et al4 reported a longitudinal nail biopsy in an SS patient that presented with atypical lymphocytes, epidermotropism, and Pautrier microabscess formation. Immunostaining showed CD3 positivity within the distal nail matrix, nail bed, and hyponychium. One-third of the cells stained positive for CD4, while the majority stained positive for CD8. Most notably, the skin, nails, and blood showed identical clonal rearrangement of TCRγ.4 Nail matrix biopsies in MF patients rarely have been reported in the literature, but those that are available show similar features to those seen in SS patients. Harland et al17 summarized the findings of 4 case reports of CTCL patients that included nail biopsies by stating, “[a]ll histopathologic findings from nail biopsies showed a dense subepithelial infiltrate of lymphocytes with marked epitheliotropism.” These histopathologic abnormalities are akin to skin biopsies in MF patients, thus providing an essential link to the disease state of MF and the nail abnormalities found within SS patients.
Treatment of the nail problems found within SS is challenging due to limited research. Parmentier et al4 noted an SS patient who was treated with topical mechlorethamine applied directly to the nail. In this case, topical mechlorethamine was effective at treating onychomadesis, subungual distal hyperkeratosis, and onycholysis within 6 months.4 Another SS patient, who presented with thickening and yellowing of the nail, had reported a proximal nail plate that resolved after chemotherapy. The patient did not survive long enough to note complete improvement of the nail.3 In our study, patient 1 was treated with ciclopirox gel and terbinafine, which did not result in nail improvement. Nail treatments in SS patients have yet to show much improvement and thus need more research and focus in the literature.
Conclusion
Sézary syndrome is a rare CTCL that can present with clinical features that may be mistaken for other diseases. Nail abnormalities in SS patients may be related to fungal involvement, medical therapy, or the underlying disease process of SS. We report one of the largest populations of SS patients with specific reported nail abnormalities, thus expanding the possibilities of nail changes that accompany the disease. Continued research and studies involving SS can provide a better understanding of nail involvement and successful treatment of these clinical findings.
- Willemz e R, Jaffe ES, Burg G, et al. WHO-EORTC classification for cutaneous lymphomas. Blood. 2005;105:3768-3785.
- Sonnex TS, Dawber RP, Zachary CB, et al. The nails in adult type 1 pityriasis rubra pilaris. a comparison with Sézary syndrome and psoriasis. J Am Acad Dermatol. 1986;15(5 pt 1):956-960.
- Tosti A, Fanti PA, Varotti C. Massive lymphomatous nail involvement in Sézary syndrome. Dermatologica. 1990;181:162-164.
- Parmentier L, Durr C, Vassella E, et al. Specific nail alterations in cutaneous T-cell lymphoma: successful treatment with topical mechlorethamine. Arch Dermatol. 2010;146:1287-1291.
- Ogilvie C, Jackson R, Leach M, et al. Sézary syndrome: diagnosis and management. J R Coll Physicians Edinb. 2012;42:317-321.
- Booken N, Nicolay JP, Weiss C, et al. Cutaneous tumor cell load correlates with survival in patients with Sézary syndrome. J Dtsch Dermatol Ges. 2013;11:67-79.
- Bishop BE, Wulkan A, Kerdel F, et al. Nail alterations in cutaneous T-cell lymphoma: a case series and review of nail manifestations. Skin Appendage Disord. 2015;1:82-86.
- Damasco FM, Geskin L, Akilov OE. Onychodystrophy in Sézary syndrome. J Am Acad Dermatol. 2018;79:972-973.
- Martin SJ, Duvic M. Prevalence and treatment of palmoplantar keratoderma and tinea pedis in patients with Sézary syndrome. Int J Dermatol. 2012;51:1195-1198.
- Mayo TT, Cantrell W. Putting onychomycosis under the microscope. Nurse Pract. 2014;39:8-11.
- Singh M, Kaur S. Chemotherapy-induced multiple Beau’s lines. Int J Dermatol. 1986;25:590-591.
- Tully AS, Trayes KP, Studdiford JS. Evaluation of nail abnormalities. Am Family Physician. 2012;85:779-787.
- Shirwaikar AA, Thomas T, Shirwaikar A, et al. Treatment of onychomycosis: an update. Indian J Pharm Sci. 2008;70:710-714.
- Fleming CJ, Hunt MJ, Barnetson RS. Mycosis fungoides with onychomadesis. Br J Dermatol. 1996;135:1012-1013.
- Jones GW, Kacinski BM, Wilson LD, et al. Total skin electron radiation in the management of mycosis fungoides: consensus of the European Organization for Research and Treatment of Cancer (EORTC) Cutaneous Lymphoma Project Group. J Am Acad Dermatol. 2002;47:364-370.
- Haneke E. Advanced nail surgery. J Cutan Aesthet Surg. 2011;4:167-175.
- Harland E, Dalle S, Balme B, et al. Ungueotropic T-cell lymphoma. Arch Dermatol. 2006;142:1071-1073.
Sézary syndrome (SS) is an advanced leukemic form of cutaneous T-cell lymphoma (CTCL) that is characterized by generalized erythroderma and T-cell leukemia. Skin changes can include erythroderma, keratosis pilaris–like lesions, keratoderma, ectropion, alopecia, and nail changes.1 Nail changes in SS patients frequently are overlooked and underreported; they vary greatly from patient to patient, and their incidence has not been widely evaluated in the literature.
In this retrospective study, we reviewed medical records from a previously collected CTCL clinic database at the University of Texas MD Anderson Cancer Center (Houston, Texas) and found nail abnormalities in 36 of 83 (43.4%) patients with a diagnosis of SS. Findings for 2 select cases are described in more detail; they were compared to prior case reports from the literature to establish a comprehensive list of nail irregularities that have been associated with SS.
Methods
We examined records from a previously collected CTCL clinic database at the University of Texas MD Anderson Cancer Center. This database was part of an institutional review board–approved protocol to prospectively collect data from patients with CTCL. Our search yielded 83 patients with SS who were seen between 2007 and 2014.
Results
Of the 83 cases reviewed from the CTCL database, 36 (43.4%) SS patients reported at least 1 nail abnormality on the fingernails or toenails. Patients ranged in age from 59 to 85 years and included 27 (75%) men and 9 (25%) women. Nail irregularities noted on physical examination are summarized in Table 1. More than half of the patients presented with nail thickening (58.3% [21/36]), dystrophy (55.6% [20/36]), or yellowing (55.6% [20/36]) of 1 or more nails. Other findings included 15 (41.7%) patients with subungual hyperkeratosis, 3 (8.3%) with Beau lines, and 1 (2.8%) with multiple oil spots consistent with salmon patches. Five (13.9%) patients had only 1 reported nail irregularity, and 1 (2.8%) patient had 6 irregularities. The average number of nail abnormalities per patient was 2.88 (range, 1–6). We selected 2 patients with extensive nail findings who represent the spectrum of nail findings in patients with SS.
Patient 1
A 71-year-old white man presented with a papular rash of 30 years’ duration. The eruption first occurred on the soles of the feet but progressed to generalized erythroderma. He was found to be colonized with methicillin-resistant Staphylococcus aureus. Over the next 9 months, the patient was diagnosed with SS at an outside institution and was treated with cyclophosphamide, hydroxydaunorubicin, vincristine, prednisone, gemcitabine, etoposide, methylprednisolone, cytarabine, cisplatin, topical steroids, and intravenous methotrexate with no apparent improvement. At presentation to our institution, physical examination revealed pruritus; alopecia; generalized lymphadenopathy; erythroderma; and irregular nail findings, including yellowing, thickened fingernails and toenails with subungual debris, and splinter hemorrhage (Figure 1). A thick plaque with perioral distribution as well as erosions on the face and feet were noted. The total body surface area (BSA) affected was 100% (patches, 91%; plaques, 9%).
At diagnosis at our institution, the patient’s white blood cell (WBC) count was 17,800/µL (reference range, 4000–11,000/µL), with 11% Sézary cells noted. Biopsy of a lymph node from the inguinal area indicated T-cell lymphoma with clonal T-cell receptor (TCR) β gene rearrangement. Biopsy of lesional skin in the right groin area showed an atypical T-cell lymphocytic infiltrate with a CD4:CD8 ratio of 2.9:1 and partial loss of CD7 expression, consistent with mycosis fungoides (MF)/SS stage IVA. At presentation to our institution, the WBC count was 12,700/µL with a neutrophil count of 47% (reference range, 42%–66%), lymphocyte count of 36% (reference range, 24%–44%), monocyte count of 4% (reference range, 2%–7%), platelet count of 427,000/µL (reference range, 150,000–350,000/µL), hemoglobin of 9.9 g/dL (reference range, 14.0–17.5 g/dL), and lactate dehydrogenase of 733 U/L (reference range, 135–214 U/L). Lymphocytes were positive for CD2, CD3, CD4, CD5, CD25, CD52, TCRα, TCRβ, and TCR VB17; partial for CD26; and negative for CD7, CD8, and CD57. At follow-up 1 month later, the CD4+CD26− T-cell population was 56%, which was consistent with SS T-cell lymphoma.
Skin scrapings from the generalized keratoderma on the patient’s feet were positive for fungal hyphae under potassium hydroxide examination. Nail clippings showed compact keratin with periodic acid–Schiff–positive small yeast forms admixed with bacterial organisms, consistent with onychomycosis. At our institution, the patient received extracorporeal photopheresis, whirlpool therapy (a type of hydrotherapy), steroid wet wraps, and intravenous vancomycin for methicillin-resistant S aureus. He also received bexarotene, levothyroxine sodium, and fenofibrate. After antibiotics and 2 sessions of photopheresis, the total BSA improved from 100% to 33%. The feet and nails were treated with ciclopirox gel and terbinafine, but neither the keratoderma nor the nails improved.
Patient 2
An 84-year-old white man with B-cell chronic lymphocytic leukemia also was diagnosed with SS at an outside institution. One year later, he presented to our institution with mild pruritus and swelling of the lower left leg, which was diagnosed as deep vein thrombosis. There was bilateral scaling of the palms, with fissures present on the left palm. The fingernails showed dystrophy with Beau lines, and the toenails were dystrophic with onycholysis on the bilateral great toes (Figure 2). Patches were noted on most of the body, including the feet, with plaques limited to the hands; the total BSA affected was 80%. Flow cytometry showed an elevated Sézary cell count (CD4+CD26−) of 4700 cells/µL. Complete blood cell count with differential included a hemoglobin level of 11.4 g/dL, hematocrit level of 35.3% (reference range, 37%–47%), a platelet count of 217,000/µL, and a WBC count of 17,7
the bilateral great toes.
Comment
Nail changes are found in many cases of advanced-stage SS but rarely have been reported in the literature. A literature review of PubMed articles indexed for MEDLINE was conducted using the search terms Sézary, nail, onychodystrophy, cutaneous T-cell lymphoma, and CTCL. All results were reviewed for original reported cases of SS with at least 1 reported nail finding. A total of 7 reports2-8 met these requirements with a total of 43 SS patients with reported nail findings, which are summarized in Tables 2 and 3.
Our findings are generally consistent with those previously described in the literature. Nail thickening, yellowing, subungual hyperkeratosis, dystrophy, and onycholysis are consistently some of the most common nail findings in patients with SS. In 2012, Martin and Duvic9 found that 52.9% (45/85) of SS patients with keratoderma on physical examination were positive for dermatophyte hyphae when skin scrapings were done under potassium hydroxide examination, a considerably greater incidence than in the general population (10%–20%). The nail changes seen in our SS patients were identical to those found in dermatophyte infections, including discoloration, subungual debris, nail thickening, onycholysis, and dystrophy.10 In patient 1, nail clippings were positive for onychomycosis, a common nail condition that is especially prevalent in older or immunocompromised patients.9,10
Interestingly, findings not observed in the literature included salmon patches and Beau lines. Beau lines are horizontal depressions in the nail plate and often are indicative of temporary interruption of nail growth, such as due to an underlying disease process, severe illness, and/or chemotherapy.11,12 In our review, patient 2 had clinical findings of Beau lines. Because the average time for fingernail regrowth is 3 to 6 months,13 it is reasonable to assume that physical findings associated with fludarabine, cyclophosphamide, and rituximab chemotherapy treatment would no longer be demonstrated 11 months after completion of therapy. On the other hand, paronychia was frequently observed by Damasco et al8 (63.2% [12/19] of their cases), yet it was not found in our database or the other literature reports we reviewed. Perhaps these differences are due to differences in patient populations and/or available therapies, lack of documentation, or small sample size and limited reports in the literature.
A common question is: Are the nail irregularities caused by the physical symptoms of advanced CTCL or by the underlying disease process in response to the atypical T cells? Erythroderma has been speculated to cause many of the clinical findings of nail abnormalities found in CTCL patients.2,3 However, Fleming et al14 described an MF patient who experienced onychomadesis without erythroderma, which suggests that a different mechanism may cause these nail changes. The wide range of nail abnormalities in CTCL can cause problems with diagnosing the specific cause underlying the nail alteration.
To further complicate the issue, numerous therapies for CTCL also may cause nail changes, such as the previously described Beau lines. In 2010, Parmentier et al4 reported a patient with nail alterations that had been present for more than 1 year, with 9 of 10 fingernails demonstrating anonychia, onychomadesis, subungual distal hyperkeratosis, and onycholysis. In this case report, the authors were able to exclude phototherapy as the cause of onycholysis (visible separation of the nail plate from the nail bed) and other clinical nail findings in the SS patient based on the onset of nail changes prior to beginning psoralen plus UVA therapy and complete sparing of 1 finger.4 The findings in our patient 1, who had no history of psoralen plus UVA therapy at the time the irregular nail findings presented, supports this observation. Total skin electron beam therapy for MF also has been reported to cause temporary nail stasis and thus must be taken into account when considering nail changes in patients with MF/SS.15
A nail matrix biopsy may provide clues to the definitive cause of the clinically observed nail changes; however, this procedure typically is not performed due to patient concerns of postoperative complications including pain and nail dystrophy.16 Histopathology features were similar in reported nail biopsies of 2 SS patients.3,4 Tosti et al3 reported that longitudinal biopsy showed a dense lymphocytic infiltrate of atypical lymphocytes with involuted nuclei and notable epidermotropism. Parmentier et al4 reported a longitudinal nail biopsy in an SS patient that presented with atypical lymphocytes, epidermotropism, and Pautrier microabscess formation. Immunostaining showed CD3 positivity within the distal nail matrix, nail bed, and hyponychium. One-third of the cells stained positive for CD4, while the majority stained positive for CD8. Most notably, the skin, nails, and blood showed identical clonal rearrangement of TCRγ.4 Nail matrix biopsies in MF patients rarely have been reported in the literature, but those that are available show similar features to those seen in SS patients. Harland et al17 summarized the findings of 4 case reports of CTCL patients that included nail biopsies by stating, “[a]ll histopathologic findings from nail biopsies showed a dense subepithelial infiltrate of lymphocytes with marked epitheliotropism.” These histopathologic abnormalities are akin to skin biopsies in MF patients, thus providing an essential link to the disease state of MF and the nail abnormalities found within SS patients.
Treatment of the nail problems found within SS is challenging due to limited research. Parmentier et al4 noted an SS patient who was treated with topical mechlorethamine applied directly to the nail. In this case, topical mechlorethamine was effective at treating onychomadesis, subungual distal hyperkeratosis, and onycholysis within 6 months.4 Another SS patient, who presented with thickening and yellowing of the nail, had reported a proximal nail plate that resolved after chemotherapy. The patient did not survive long enough to note complete improvement of the nail.3 In our study, patient 1 was treated with ciclopirox gel and terbinafine, which did not result in nail improvement. Nail treatments in SS patients have yet to show much improvement and thus need more research and focus in the literature.
Conclusion
Sézary syndrome is a rare CTCL that can present with clinical features that may be mistaken for other diseases. Nail abnormalities in SS patients may be related to fungal involvement, medical therapy, or the underlying disease process of SS. We report one of the largest populations of SS patients with specific reported nail abnormalities, thus expanding the possibilities of nail changes that accompany the disease. Continued research and studies involving SS can provide a better understanding of nail involvement and successful treatment of these clinical findings.
- Willemz e R, Jaffe ES, Burg G, et al. WHO-EORTC classification for cutaneous lymphomas. Blood. 2005;105:3768-3785.
- Sonnex TS, Dawber RP, Zachary CB, et al. The nails in adult type 1 pityriasis rubra pilaris. a comparison with Sézary syndrome and psoriasis. J Am Acad Dermatol. 1986;15(5 pt 1):956-960.
- Tosti A, Fanti PA, Varotti C. Massive lymphomatous nail involvement in Sézary syndrome. Dermatologica. 1990;181:162-164.
- Parmentier L, Durr C, Vassella E, et al. Specific nail alterations in cutaneous T-cell lymphoma: successful treatment with topical mechlorethamine. Arch Dermatol. 2010;146:1287-1291.
- Ogilvie C, Jackson R, Leach M, et al. Sézary syndrome: diagnosis and management. J R Coll Physicians Edinb. 2012;42:317-321.
- Booken N, Nicolay JP, Weiss C, et al. Cutaneous tumor cell load correlates with survival in patients with Sézary syndrome. J Dtsch Dermatol Ges. 2013;11:67-79.
- Bishop BE, Wulkan A, Kerdel F, et al. Nail alterations in cutaneous T-cell lymphoma: a case series and review of nail manifestations. Skin Appendage Disord. 2015;1:82-86.
- Damasco FM, Geskin L, Akilov OE. Onychodystrophy in Sézary syndrome. J Am Acad Dermatol. 2018;79:972-973.
- Martin SJ, Duvic M. Prevalence and treatment of palmoplantar keratoderma and tinea pedis in patients with Sézary syndrome. Int J Dermatol. 2012;51:1195-1198.
- Mayo TT, Cantrell W. Putting onychomycosis under the microscope. Nurse Pract. 2014;39:8-11.
- Singh M, Kaur S. Chemotherapy-induced multiple Beau’s lines. Int J Dermatol. 1986;25:590-591.
- Tully AS, Trayes KP, Studdiford JS. Evaluation of nail abnormalities. Am Family Physician. 2012;85:779-787.
- Shirwaikar AA, Thomas T, Shirwaikar A, et al. Treatment of onychomycosis: an update. Indian J Pharm Sci. 2008;70:710-714.
- Fleming CJ, Hunt MJ, Barnetson RS. Mycosis fungoides with onychomadesis. Br J Dermatol. 1996;135:1012-1013.
- Jones GW, Kacinski BM, Wilson LD, et al. Total skin electron radiation in the management of mycosis fungoides: consensus of the European Organization for Research and Treatment of Cancer (EORTC) Cutaneous Lymphoma Project Group. J Am Acad Dermatol. 2002;47:364-370.
- Haneke E. Advanced nail surgery. J Cutan Aesthet Surg. 2011;4:167-175.
- Harland E, Dalle S, Balme B, et al. Ungueotropic T-cell lymphoma. Arch Dermatol. 2006;142:1071-1073.
Practice Points
- Nail changes are frequently observed in patients with Sézary syndrome.
- Nail changes in patients with cutaneous T-cell lymphoma may result from the disease process or physical symptoms of advanced disease, or they may present secondary to treatment.

Self-Management in Epilepsy Care: Untapped Opportunities (FULL)
Epilepsy is a chronic neurologic condition defined by recurrent seizures not provoked by an environmental or a reversible trigger. About 1% of the US population has an epilepsy diagnosis, and an even higher percentage of the world’s population has seizures.1 For the many US soldiers who sustain blast-and concussion-related injuries, posttraumatic epilepsy is a potential risk.2 Although the risk of epilepsy remains unknown, the Veterans Health Administration (VHA) prioritizes diagnosis and management of the condition. Fortunately, antiepileptic therapies are effective for most patients. About 65% of patients can be free of seizures with use of a single daily medication.3 Although the other 35% often experience refractory seizures, advanced medication regimens, surgical approaches, and innovative devices can effect improvement in some cases.
Increasingly, patients are urged to practice epilepsy self-management. The idea of self-managing epilepsy, which has existed for decades, is supported primarily by a theory of robust patient education intended to increase disease knowledge and improve decision making. Multiple formal self-management programs have been developed and academically tested for patients with epilepsy. In a 2013 report, the Institute of Medicine emphasized the importance of research on the effects of behavioral self-management interventions on health outcomes and quality of life for people with epilepsy. The report recommended improving and expanding educational opportunities for patients.4 Nevertheless, self-management programs have not found widespread traction in mainstream clinical use.
This article provides a review of chronic disease self-management with a focus on its application and study in epilepsy. The authors discuss self-management, including underlying theory, definitions, and various tools. The principal formal epilepsy programs that have been studied and published are highlighted and summarized. This review also includes a discussion of the potential barriers to successful implementation of these epilepsy programs along with emerging solutions and tools for addressing these barriers.
Self-Management Theory
Disease self-management originated in social cognitive theory, which addresses the cognitive, emotional, and behavioral aspects of behavior change and is relevant to managing chronic illness.5,6 Self-management of chronic illness is defined as the daily actions that people take to keep their illness under control, to minimize its impact on physical health status and functioning, and to cope with psychosocial sequelae.7 These actions include making informed decisions about care, performing activities intended to manage the condition, and applying the necessary skills to maintain adequate psychosocial functioning.7
Related to self-management is self-efficacy, people’s confidence in their ability to engage in these actions.7 Evidence-based self-management and self-efficacy strategies are recognized as central in managing a variety of chronic diseases by improving the medical, emotional, and social role that management demands of chronic conditions.8
Self-management and self-efficacy have been explored in patients with epilepsy for decades, with various approaches being developed, implemented, and tested. Findings of several historical studies discussed in this review indicate that patients with epilepsy and high levels of self-efficacy are more successful in performing self-care tasks.9 This growing body of evidence led to the establishment of the Managing Epilepsy Well network in 2007.10 The Centers for Disease Control and Prevention created the network to expand epilepsy self-management research. Since 2007, more research has been focused on the potential for online and mobile health approaches in supporting epilepsy self-management and on intervention studies evaluating e-tools.
Elements of Epilepsy Self-Management
The first element of an epilepsy-specific self-management program is formal education on the diagnosis, treatment, and psychosocial impact of epilepsy and on strategies for coping with it. This element usually includes tools for evaluating and understanding epilepsy, with the goal of empowering patients to become actively engaged in managing and coping with their epilepsy diagnosis. Medication adherence is key in the optimal management of epilepsy. This point is evident in the development of a validated metric for self-efficacy: the Epilepsy Self-Efficacy Scale (ESES).11 Of the 33 items on the ESES, 14 are devoted to aspects of medication management. Other crucial behavioral elements for epilepsy self-management relate to lifestyle issues, such as safety, diet, exercise, sleep, and stress management.
Various self-management programs have incorporated tracking systems for these lifestyle elements as well as epilepsy-specific measures, such as seizure frequency, duration, and type. In addition, social support is an important factor in chronic illness self-management. Results of several studies support the hypothesis that higher levels of social support, particularly disease- and regimen-specific support, are related to better self-management behaviors.12 An increasing number of formal epilepsy self-management programs include peer support platforms and peer navigator features in their suite of services.
Patient Education and Self-Management Programs
Over the past several decades, multiple research groups have developed, implemented, and tested formal self-management platforms for patients with epilepsy. Designs and results of prominent studies are summarized in the Table. 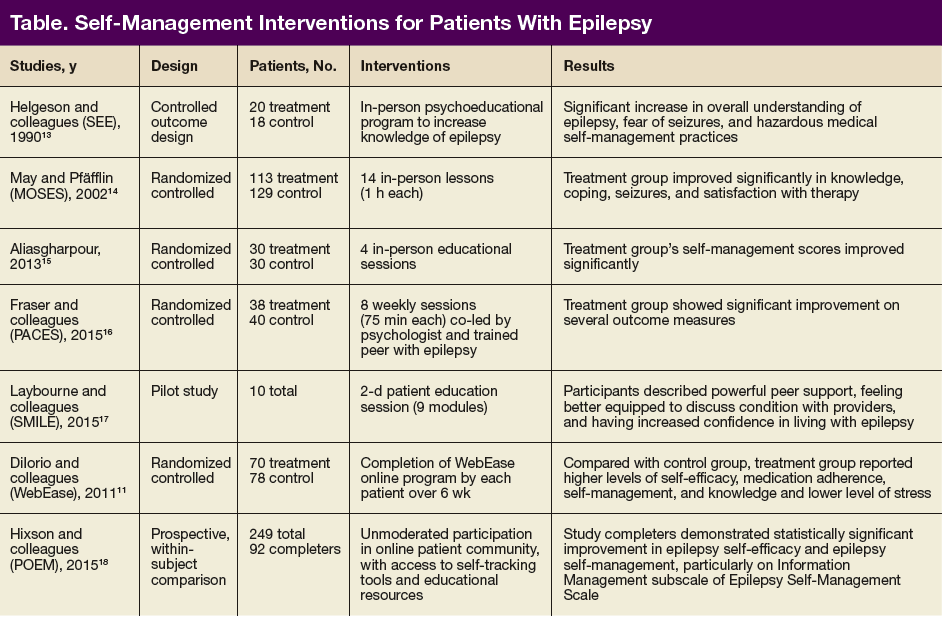
More recent programs also included a focus on peer-to-peer support and patient-driven content within the educational curriculum.16,17 In 2015, Hixson and colleagues used an entirely patient-driven online platform.18 Unlike the programs described thus far, this platform made educational modules available and did not require that patients complete them. Peer-to-peer support and self-tracking tools were prominently featured, and patients used them. In addition, this intervention focused exclusively on a group of US veterans with epilepsy.
Tools for Improving Self-Management
Self-management programs for patients with epilepsy historically have involved formalized programs conducted face-to-face with other patients, with professional moderators, and perhaps with caregivers. These programs depended entirely on in-person educational sessions and in-person support groups and were found to be very effective in improving self-management skills, though they were labor-intensive and logistically challenging for both practitioners and patients.
Since the advent of the Internet and mobile connectivity, many programs have incorporated the same elements in more accessible form. Educational content appears in live webinars and asynchronous video educational modules; the latter are attractive because patients and caregivers can access them independently at any time. Also readily available are tools for day-to-day self-management of medical conditions. These tools include mobile and online diaries for tracking seizure metrics and medication adherence reminder systems. Last, a variety of online and mobile disease-specific social networking platforms allow patients to connect directly to others without having to travel long distances to meet in-person. Although these digital solutions may not provide the exact experience offered by an in-person support group, the promise of superior accessibility creates an advantage in terms of accessibility and flexibility.
Self-Management in the Literature
In a recent review of care delivery and self-managementstrategies for adults with epilepsy, Bradley and colleagues analyzed 18 different studies of 16 separate interventions and concluded that 2 interventions, the specialist epilepsy nurse and self-management education, had some evidence of benefit. Four studies, detailed next, had the highest quality design, based on a focus on epilepsy self-management specifically, a prospective hypothesis-driven approach, and rigorous methodology.19
In 1990, Helgeson and colleagues evaluated Sepulveda Epilepsy Education, a 2-day in-person program designed to provide medical education and psychosocial therapy to patients with an epilepsy diagnosis.13 The program was based on the theory that having a better understanding of their epilepsy helps people cope with the condition. Medical, social, and emotional topics are covered. Medical topics include epilepsy and how it may change over time, as well as diagnosis, treatment, and first aid; social and emotional topics include coping with the psychological aspects of epilepsy, family, social aspects, and employment. In this small study (38 patients total), compared with the control group (18 patients), the treatment group (20 patients) demonstrated a significant reduction in the level of fear of death and brain damage caused by seizures, a significant decrease in hazardous medical self-management practices, and a significant decrease in misconceptions about epilepsy. The treatment group also increased their medication adherence, as determined by serum drug levels. In addition, statistically nonsignificant trends were shown by the treatment group toward improved emotional, interpersonal, and vocational functioning; improved adjustment to seizures; and improved overall psychosocial functioning.
In 2002, May and Pfäfflin evaluated the efficacy of the Modular Service Package Epilepsy (MOSES) educational program.14 This program was specifically developed to improve patient knowledge about epilepsy and its consequences and diagnostic and therapeutic measures, and to improve patient understanding of psychosocial and occupational problems. It was the first comprehensive program used in German-speaking countries. It had 9 modules: coping with epilepsy, epidemiology, basic knowledge, diagnostics, therapy, self-control, prognosis, psychosocial aspects, and network. To complete the program, patients work through about fourteen 1-hour lessons. The controlled, randomized study by May and Pfäfflin involved 242 patients (113 treatment, 129 control) aged 16 to 80 years. Patients in the treatment (MOSES) group demonstrated significant improvements in 2 of the 9 modules (knowledge, coping with epilepsy), had improved self-reported seizure outcomes, were more satisfied with therapy, experienced better tolerability of antiepileptic drugs with fewer adverse effects (AEs), and were highly satisfied with the program. The researchers concluded that educational programs, such as MOSES, should become a standard service for specialized epilepsy care.
Developed over many years, WebEase is an online epilepsy self-management program that supports education on medication, stress, and sleep management. In 2011, DiIorio and colleagues reported on a WebEase trial in which 194 patients were randomly assigned to either a treatment group (n = 96) or a wait-list control group (n = 96), and 2 were lost to follow up.11 After accounting for study criteria and study drop out, 70 participants completed the treatment arm, and 78 completed the control arm. The study measured the impact of the platform on multiple outcome metrics, including 3 behavioral areas of focus. At follow-up, self-reported levels of medication adherence were higher for patients in the treatment group than for those in the control group. Analyses also compared patients who completed WebEase modules with those who did not. Patients who completed at least some WebEase modules reported higher levels of self-efficacy, and a trend toward significance was found for medication adherence, perceived stress, self-management, and knowledge. The authors concluded that online tools that support epilepsy self-management could be effective.11
In 2015, Fraser and colleagues reported the results of the Program for Active Consumer Engagement in Self-Management in Epilepsy (PACES in Epilepsy), a consumer-generated self-management program.16 In the trial, 83 adults with chronic epilepsy were initially assigned either to an in-person intervention or to treatment as usual. After study drop outs, 38 patients remained in the intervention arm, with 40 in the control arm. In the intervention, 6 to 8 adults met for a 75-minute group session 1 evening per week for 8 weeks; these sessions were co-led by a psychologist and a trained peer with epilepsy. Topics included medical, psychosocial, cognitive, and self-management aspects of epilepsy, in addition to community integration and optimization of epilepsy-related communication. Outcomes were measured with various instruments, including the ESES, the Quality of Life in Epilepsy-31 (QOLIE-31), the Epilepsy Self-Management Scale (ESMS), the Patient Health Questionnaire-9, and the Generalized Anxiety Disorder-7. Each test was administered at baseline and after intervention. Outcomes were assessed immediately after program completion (8 weeks) and at follow-up 6 months later.
Findings suggested a substantial positive impact on epilepsy self-management capacities at program completion. In addition, benefit was sustained, particularly for epilepsy information management, over the 6 months after program completion. On the QOLIE-31 at 6 months, management of medication AEs also remained significantly improved, and fatigue management was improved at the P < .05 level. The researchers concluded that the PACES in Epilepsy program might have a more sustained impact on management of disability than on mood. They also noted that the effect was greater immediately after program completion than at 6 months. Patients gave the PACES program high satisfaction ratings.
Although these programs take slightly different approaches to epilepsy self-management, they have a similar focus: directed patient education. Furthermore, most of these programs are conducted in person, usually in a support group setting. In the WebEase trial, patients seem to have completed the online modules in a study setting, and a peer support component was not included. Overall, all programs successfully demonstrated various benefits for trial patients. These outcomes suggest that despite their subtle differences in approach, formal self-management programs are benefiting patients.
None of these platforms was designed for or specifically tested veterans with epilepsy. Although veterans theoretically would benefit from the same tools used by nonveterans, Iraq and Afghanistan veterans with epilepsy are more likely than are those without epilepsy to have mental and physical comorbidities and significantly higher mortality.2 Therefore, veterans potentially could benefit more from evidence-based chronic disease self-management programs designed to reduce physical and psychiatric comorbidities. Furthermore, programs that incorporate peer-to-peer support and direct links to VA care teams and mental health providers could be valuable.18
One research effort that directly addressed these issues is the Policy for Optimized Epilepsy Management (POEM) study, conducted by Hixson and colleagues in 2015.18 This study, not included in the review by Bradley and colleagues, used a purely online- and mobile-based social networking platform to promote self-management practices.19 Unlike the other programs described here, POEM did not require that patients view or attend formal educational seminars, though these seminars were available through the online platform for patient self-directed viewing. In addition, the intervention heavily promoted peer-to-peer engagement and disease tracking as means of increasing self-knowledge and activation. This study was unlike the other platforms in another way: It specifically focused on veterans with epilepsy, based on the idea that many veterans had a shared experience that would optimize a peer support approach.
The POEM investigators did not use a controlled design but found a significant benefit for both ESES and ESMS metrics on within-subject comparisons. Similar to the PACES in Epilepsy study, the POEM study found the highest benefit on the information management subscale of the ESMS.16 Practically speaking, this means patients were better able to use and manage digital and mobile information resources for controlling epilepsy. The POEM study results further reinforced the idea that epilepsy self-management programs are beneficial and expanded on earlier research to emphasize the value of peer support networks and digital interventions that can be used by patients at their convenience. These features provide greater access to more patients and maintain the crucial elements of peer-to-peer learning and counseling.
Implementation Barriers
Confirming the effectiveness of self-management programs is only the beginning of formal implementation and adoption. The real-world success of patient self-management programs has been documented for a few chronic diseases, including epilepsy. However, there is little research or commentary on lessons learned or on the challenges encountered with wide implementation of these programs.
Initial Setup and Sponsorship
To promote wider adoption, researchers should include commentary on initial setup, ongoing patient acceptance, and continual provider support. Many of the initial challenges in self-management programs involve a changing paradigm in the delivery and economics of health care. The transition to a more consumer-oriented health model with an emphasis on outcomes and patient-reported variables likely will support self-management strategies but is only slowly evolving. Many health care providers, hospitals, and payers may not be familiar with or have proper incentivizes to explore self-management tools even when proven effective.
More specifically, these epilepsy self-management programs are treatment adjuncts well suited to military and veteran health care systems. Self-management closely aligns with the overall VHA mission, vision, and values, including formal Department of Veteran Affairs (VA) goals and the MyVA priorities that collectively embrace improvement in access, a veteran-centric approach, and quality for improvement of the entire VA experience. Self-management platforms in the VA are recognized as empowering veterans and are thought to indirectly improve access to health care.20,21
The barriers of sponsorship and financial support likely will persist in the private health care sector but are less likely to significantly affect the VHA. Self-management programs have been researched and implemented for many health conditions across the VHA. For example, the VA Talent Management System course Patient Self-Management: Skill Building (TMS 6467) offers education and training to all clinical practitioners and managers involved in patient education and self-management activities for a variety of chronic medical conditions. Regarding epilepsy self-management more specifically, a patient brochure on the practice is distributed by the VHA Epilepsy Centers of Excellence (ECoEs) and an associated consortium.22 Last, a national provider educational lecture series has a corresponding patient and caregiver lecture set that emphasizes education and self-management behaviors.
Labor, Time, and Resource Needs
The most time-intensive aspect of designing self-management programs is developing the tool that allows clinicians and patients to work together. From a program perspective, the tool must be available and helpful not only to patients and specialists, but also to primary care providers. Tertiary-care centers usually accept the responsibility for program initiation, including patient recruitment, logistics coordination, and health care professional staffing. For epilepsy, the small pool of relevant specialists and centers limits the number of self-management education sessions that can be hosted and increases the need for complex travel and scheduling tasks. However, ECoE communication lines provide a basic infrastructure for collaboration and for development of tools that can be helpful to all clinicians treating veterans with epilepsy.23
Given the issues with coordinating the logistics of in-person programs at brick-and-mortar sites, this type of program may not be the best option for some patients and facilities. Alternative approaches, such as telehealth and asynchronous digital platforms, could expand access and increase convenience. Even though remotely administered programs may not be as powerful for some patients, the promise of scalable access supports consideration of these approaches.
Patient and Caregiver Logistics
Veterans with epilepsy may also have comorbid traumatic brain injury (TBI) and posttraumatic stress disorder, which can complicate self-managed care. In addition, many veterans live in rural areas and have limited travel options. All these factors challenge the success of epilepsy self-management programs. However, the network of ECoEs and associated consortium facilities can step up to deliver self-management tools and information.
The infrastructure of the VHA patient aligned care team (PACT) also contributes to the integration of self-management training. The PACT model takes a personalized, comprehensive, coordinated approach to promote team-based, veteran-centric care and actively partners with other VHA offices to incorporate alternative care services, including peer support and self-management platforms. The combination represents fertile ground for implementation and promotion of self-management tools in the VHA epilepsy population.
Health Care Economics
Given the uncertainties of the US health care economy, it is not surprising that many experts advocate a fundamental redesign of the health care team relationship and information infrastructure.24 This realignment includes partnering directly with patients and their families to encourage more reliance on self-management practices. Unfortunately, this approach does not lend itself to the well-entrenched business model on which most community medical practices are based. Health system leadership often must be convinced there are potential cost savings or a return on investment for new programs. As there is no consistent, comprehensive reimbursement policy for programs focused on self-management, health care systems must be creative and innovative when appraising the financial consequences of such programs.
Epilepsy remains a huge burden. In 2000, the annual total cost of epilepsy treatment in the US was $362 million for new patients and $2 billion for existing cases.25 Within the VHA, the occurrence of posttraumatic epilepsy among the increasing number of veterans with TBI contributes to the burden, and posttraumatic epilepsy and psychogenic nonepileptic seizures complicate treatment approaches. The incidence of comorbidities, including anxiety and depression, has been as high as 50%.23 Epilepsy health care programs are evaluating ways to validate their ability to minimize cost, improve access, and maintain quality of service. Integration of self-management should be included in these efforts.
The VHA represents a unique health care environment for testing and implementing self-management programs. Although the VHA is not immune to the traditional business models of medicine, it is less dependent on them, and it disproportionately cares for patients for long spans of time. From the health care team perspective, data indicate that ECoE physicians represent a high percentage of VHA epilepsy specialists but directly see only about 20% of veterans with an epilepsy or seizure-associated diagnosis. Therefore, future collaboration and connectivity of consortium sites can have a broader impact on self-management—highlighting the fact that concerted, scaled self-management programs have an important role in the VHA health care delivery system and should be promoted.26
Final Insights and Opportunities
Despite the barriers to adoption, formal epilepsy self-management programs are making gains in maturity and academic credibility. As the health care economy gradually shifts to more outcomes-based models, these offerings likely will become more valued, particularly by health care organizations focused on cost sharing, by large self-insuring employers, or organizations like the VHA where patients maintain a long-term relationship. Nevertheless, for the more resource-intensive, in-person self-management programs, adoption may remain constrained. Digital and mobile platforms should serve as more accessible entry points, with lower costs and more rapid scaling potential. Even though these online platforms may not have the same impact as intensive face-to-face programs, their scalability and constant accessibility should make them attractive, and the relatively modest cost of implementing self-guided programs should reduce barriers to adoption.
Integrated health care systems, such as the VHA and various European health systems, can serve as models for self-management implementation. Incorporating a live clinical implementation into parallel research efforts can continue to produce vital academic information on the real-world impact of these solutions, and this evidence in turn can be used to support policies that foster widespread adoption. More specifically, the ECoE model represents a clear opportunity to promote widespread implementation of self-management. The ECoEs are already publishing self-management materials that health care teams can use in patient counseling,and several self-care studies are being conducted within the network.22 In this model, compared with private sector health systems, ECoEs are well positioned to advance the use of formal self-management strategies.
The proposed epilepsy self-management model for ECoEs would be based on an iterative program that incorporates best practices from each of the research studies discussed earlier. With the publication of new research, successful self-management tools would be incorporated into the programs. From a curriculum perspective, educational platforms on medication adherence, seizure safety, and information/data management should be included. Evidence is increasing that peer support and use of licensed peer navigators should be incorporated as well. Last, flexible and asynchronous digital methods should be added to self-management platforms to maximize patient access. These features build on the growing body of evidence to maximize the likelihood of a successful and sustainable self-management strategy for patients with epilepsy.
Click here to read the digital edition.
1. Fiest KM, Sauro KM, Wiebe S, et al. Prevalence and incidence in epilepsy: a systematic review and meta-analysis of international studies. Neurology. 2017;88(3):296-303.
2. Pugh MJ, Van Cott AC, Amuan M, et al. Epilepsy among Iraq and Afghanistan war veterans—United States, 2002-2015. MMWR. 2016;65(44):1224-1227.
3. Kwan P, Brodie MJ. Effectiveness of first antiepileptic drug. Epilepsia. 2001;42(10):1255-1260.
4. Hesdorffer DC, Beck V, Begley CE, et al. Research implications of the Institute of Medicine report, Epilepsy Across the Spectrum: Promoting Health and Understanding. Epilepsia. 2013;54(2):207-216.
5. Bandura A. Social Foundations of Thought and Action: A Social Cognitive Theory. Englewood Cliffs, NJ: Prentice-Hall; 1986.
6. Bandura A. Social Learning Theory. Englewood Cliffs, NJ: Prentice-Hall; 1977.
7. Clark, NM, Becker MH, Janz NK, Lorig K, Rakowski W, Anderson L. Self-management of chronic disease by older adults. J Aging Health. 1991;3(1):3-27.
8. Ory MG, Ahn SM, Jiang L, et al. Successes of a national study of the Chronic Disease Self-Management Program: meeting the triple aim of health care reform. Med Care. 2013;51(11):992-998.
9. DiIorio C, Shafer PO, Letz R, Henry TR, Schomer DL, Yeager K; Project EASE Study Group. Behavioral, social and affective factors associated with self-efficacy for self-management among people with epilepsy. Epilepsy Behav. 2006;9(1):158-163.
10. Shegog R, Bamps YA, Patel A, et al. Managing Epilepsy Well: emerging e-tools for epilepsy self-management. Epilepsy Behav. 2013;29(1):133-140.
11. DiIorio C, Bamps Y, Walker ER, Escoffery C. Results of a research study evaluating WebEase, an online epilepsy self-management program. Epilepsy Behav. 2011;22(3):469-474.
12. Gallant MP. The influence of social support on chronic illness self-management: a review and directions for research. Health Educ Behav. 2003;30(2):170-195.
13. Helgeson DC, Mittan R, Tan SY, Chayasirisobhon S. Sepulveda Epilepsy Education: the efficacy of a psychoeducational treatment programme in treating medical and psychosocial aspects of epilepsy. Epilepsia. 1990;31(1):75-82.
14. May TW, Pfäfflin M. The efficacy of an educational treatment program for patients with epilepsy (MOSES): results of a controlled, randomized study. Modular Service Package Epilepsy. Epilepsia. 2002;43(5):539-549.
15. Aliasgharpour M, Dehgahn Nayeri N, Yadegary MA, Haghani H. Effects of an educational program on self-management in patients with epilepsy. Seizure. 2013;22(1):48-52.
16. Fraser RT, Johnson EK, Lashley S, et al. PACES in Epilepsy: results of a self-management randomized controlled trial. Epilepsia. 2015;56(8):1264-1274.
17. Laybourne AH, Morgan M, Watkins SH, Lawton R, Ridsdale L, Goldstein LH. Self-management for people with poorly controlled epilepsy: participants’ views of the UK self-management in epilepsy (SMILE) program. Epilepsy Behav. 2015;52(pt A):159-164.
18. Hixson JD, Barnes D, Parko K, et al. Patients optimizing epilepsy management via an online community: the POEM study. Neurology. 2015;85(2):129-136.
19. Bradley PM, Lindsay B, Fleeman N. Care delivery and self-management strategies for adults with epilepsy. Cochrane Database Syst Rev. 2016;2:CD006244.
20. Allicock M, Haynes-Maslow L, Carr C, et al. Training veterans to provide peer support in a weight-management program: MOVE! Prev Chronic Dis. 2013;10:E185.
21. Damush TM, Jackson GL, Powers BJ, et al. Implementing evidence-based patient self-management programs in the Veterans Health Administration: perspectives on delivery system design considerations. J Gen Intern Med. 2010;25(suppl 1):68-71.
22. Caraveo N, Chen S, Evrard C, Ozuna J; Epilepsy Centers of Excellence Nursing Workgroup. Self-management in epilepsy: a guide for healthcare professionals. https://www.epilepsy.va.gov/Library/Self-Management%20In%20Epilepsy.pdf. Published Winter 2015. Accessed February 26, 2018.
23. Rehman R, Kelly PR, Husain AM, Tran TT. Characteristics of veterans diagnosed with seizures within the Veterans Health Administration. J Rehabil Res Dev. 2015;52(7):751-762.
24. Merry MD. Healthcare’s need for revolutionary change. Quality Prog. 2003;36(9):31-35.
25. Halpern M, Rentz A, Murray M. Cost of illness of epilepsy in the US: comparison of patient-based and population-based estimates. Neuroepidemiology. 2000;19(2):87-99.
26. Kelly P, Chinta R. Do centers of excellence excel in patient outcomes?: Evidence from U.S. Veterans Health Administration Centers for Epilepsy. Int J Manage Excellence. 2015;4(3):529-538.
Epilepsy is a chronic neurologic condition defined by recurrent seizures not provoked by an environmental or a reversible trigger. About 1% of the US population has an epilepsy diagnosis, and an even higher percentage of the world’s population has seizures.1 For the many US soldiers who sustain blast-and concussion-related injuries, posttraumatic epilepsy is a potential risk.2 Although the risk of epilepsy remains unknown, the Veterans Health Administration (VHA) prioritizes diagnosis and management of the condition. Fortunately, antiepileptic therapies are effective for most patients. About 65% of patients can be free of seizures with use of a single daily medication.3 Although the other 35% often experience refractory seizures, advanced medication regimens, surgical approaches, and innovative devices can effect improvement in some cases.
Increasingly, patients are urged to practice epilepsy self-management. The idea of self-managing epilepsy, which has existed for decades, is supported primarily by a theory of robust patient education intended to increase disease knowledge and improve decision making. Multiple formal self-management programs have been developed and academically tested for patients with epilepsy. In a 2013 report, the Institute of Medicine emphasized the importance of research on the effects of behavioral self-management interventions on health outcomes and quality of life for people with epilepsy. The report recommended improving and expanding educational opportunities for patients.4 Nevertheless, self-management programs have not found widespread traction in mainstream clinical use.
This article provides a review of chronic disease self-management with a focus on its application and study in epilepsy. The authors discuss self-management, including underlying theory, definitions, and various tools. The principal formal epilepsy programs that have been studied and published are highlighted and summarized. This review also includes a discussion of the potential barriers to successful implementation of these epilepsy programs along with emerging solutions and tools for addressing these barriers.
Self-Management Theory
Disease self-management originated in social cognitive theory, which addresses the cognitive, emotional, and behavioral aspects of behavior change and is relevant to managing chronic illness.5,6 Self-management of chronic illness is defined as the daily actions that people take to keep their illness under control, to minimize its impact on physical health status and functioning, and to cope with psychosocial sequelae.7 These actions include making informed decisions about care, performing activities intended to manage the condition, and applying the necessary skills to maintain adequate psychosocial functioning.7
Related to self-management is self-efficacy, people’s confidence in their ability to engage in these actions.7 Evidence-based self-management and self-efficacy strategies are recognized as central in managing a variety of chronic diseases by improving the medical, emotional, and social role that management demands of chronic conditions.8
Self-management and self-efficacy have been explored in patients with epilepsy for decades, with various approaches being developed, implemented, and tested. Findings of several historical studies discussed in this review indicate that patients with epilepsy and high levels of self-efficacy are more successful in performing self-care tasks.9 This growing body of evidence led to the establishment of the Managing Epilepsy Well network in 2007.10 The Centers for Disease Control and Prevention created the network to expand epilepsy self-management research. Since 2007, more research has been focused on the potential for online and mobile health approaches in supporting epilepsy self-management and on intervention studies evaluating e-tools.
Elements of Epilepsy Self-Management
The first element of an epilepsy-specific self-management program is formal education on the diagnosis, treatment, and psychosocial impact of epilepsy and on strategies for coping with it. This element usually includes tools for evaluating and understanding epilepsy, with the goal of empowering patients to become actively engaged in managing and coping with their epilepsy diagnosis. Medication adherence is key in the optimal management of epilepsy. This point is evident in the development of a validated metric for self-efficacy: the Epilepsy Self-Efficacy Scale (ESES).11 Of the 33 items on the ESES, 14 are devoted to aspects of medication management. Other crucial behavioral elements for epilepsy self-management relate to lifestyle issues, such as safety, diet, exercise, sleep, and stress management.
Various self-management programs have incorporated tracking systems for these lifestyle elements as well as epilepsy-specific measures, such as seizure frequency, duration, and type. In addition, social support is an important factor in chronic illness self-management. Results of several studies support the hypothesis that higher levels of social support, particularly disease- and regimen-specific support, are related to better self-management behaviors.12 An increasing number of formal epilepsy self-management programs include peer support platforms and peer navigator features in their suite of services.
Patient Education and Self-Management Programs
Over the past several decades, multiple research groups have developed, implemented, and tested formal self-management platforms for patients with epilepsy. Designs and results of prominent studies are summarized in the Table.
More recent programs also included a focus on peer-to-peer support and patient-driven content within the educational curriculum.16,17 In 2015, Hixson and colleagues used an entirely patient-driven online platform.18 Unlike the programs described thus far, this platform made educational modules available and did not require that patients complete them. Peer-to-peer support and self-tracking tools were prominently featured, and patients used them. In addition, this intervention focused exclusively on a group of US veterans with epilepsy.
Tools for Improving Self-Management
Self-management programs for patients with epilepsy historically have involved formalized programs conducted face-to-face with other patients, with professional moderators, and perhaps with caregivers. These programs depended entirely on in-person educational sessions and in-person support groups and were found to be very effective in improving self-management skills, though they were labor-intensive and logistically challenging for both practitioners and patients.
Since the advent of the Internet and mobile connectivity, many programs have incorporated the same elements in more accessible form. Educational content appears in live webinars and asynchronous video educational modules; the latter are attractive because patients and caregivers can access them independently at any time. Also readily available are tools for day-to-day self-management of medical conditions. These tools include mobile and online diaries for tracking seizure metrics and medication adherence reminder systems. Last, a variety of online and mobile disease-specific social networking platforms allow patients to connect directly to others without having to travel long distances to meet in-person. Although these digital solutions may not provide the exact experience offered by an in-person support group, the promise of superior accessibility creates an advantage in terms of accessibility and flexibility.
Self-Management in the Literature
In a recent review of care delivery and self-managementstrategies for adults with epilepsy, Bradley and colleagues analyzed 18 different studies of 16 separate interventions and concluded that 2 interventions, the specialist epilepsy nurse and self-management education, had some evidence of benefit. Four studies, detailed next, had the highest quality design, based on a focus on epilepsy self-management specifically, a prospective hypothesis-driven approach, and rigorous methodology.19
In 1990, Helgeson and colleagues evaluated Sepulveda Epilepsy Education, a 2-day in-person program designed to provide medical education and psychosocial therapy to patients with an epilepsy diagnosis.13 The program was based on the theory that having a better understanding of their epilepsy helps people cope with the condition. Medical, social, and emotional topics are covered. Medical topics include epilepsy and how it may change over time, as well as diagnosis, treatment, and first aid; social and emotional topics include coping with the psychological aspects of epilepsy, family, social aspects, and employment. In this small study (38 patients total), compared with the control group (18 patients), the treatment group (20 patients) demonstrated a significant reduction in the level of fear of death and brain damage caused by seizures, a significant decrease in hazardous medical self-management practices, and a significant decrease in misconceptions about epilepsy. The treatment group also increased their medication adherence, as determined by serum drug levels. In addition, statistically nonsignificant trends were shown by the treatment group toward improved emotional, interpersonal, and vocational functioning; improved adjustment to seizures; and improved overall psychosocial functioning.
In 2002, May and Pfäfflin evaluated the efficacy of the Modular Service Package Epilepsy (MOSES) educational program.14 This program was specifically developed to improve patient knowledge about epilepsy and its consequences and diagnostic and therapeutic measures, and to improve patient understanding of psychosocial and occupational problems. It was the first comprehensive program used in German-speaking countries. It had 9 modules: coping with epilepsy, epidemiology, basic knowledge, diagnostics, therapy, self-control, prognosis, psychosocial aspects, and network. To complete the program, patients work through about fourteen 1-hour lessons. The controlled, randomized study by May and Pfäfflin involved 242 patients (113 treatment, 129 control) aged 16 to 80 years. Patients in the treatment (MOSES) group demonstrated significant improvements in 2 of the 9 modules (knowledge, coping with epilepsy), had improved self-reported seizure outcomes, were more satisfied with therapy, experienced better tolerability of antiepileptic drugs with fewer adverse effects (AEs), and were highly satisfied with the program. The researchers concluded that educational programs, such as MOSES, should become a standard service for specialized epilepsy care.
Developed over many years, WebEase is an online epilepsy self-management program that supports education on medication, stress, and sleep management. In 2011, DiIorio and colleagues reported on a WebEase trial in which 194 patients were randomly assigned to either a treatment group (n = 96) or a wait-list control group (n = 96), and 2 were lost to follow up.11 After accounting for study criteria and study drop out, 70 participants completed the treatment arm, and 78 completed the control arm. The study measured the impact of the platform on multiple outcome metrics, including 3 behavioral areas of focus. At follow-up, self-reported levels of medication adherence were higher for patients in the treatment group than for those in the control group. Analyses also compared patients who completed WebEase modules with those who did not. Patients who completed at least some WebEase modules reported higher levels of self-efficacy, and a trend toward significance was found for medication adherence, perceived stress, self-management, and knowledge. The authors concluded that online tools that support epilepsy self-management could be effective.11
In 2015, Fraser and colleagues reported the results of the Program for Active Consumer Engagement in Self-Management in Epilepsy (PACES in Epilepsy), a consumer-generated self-management program.16 In the trial, 83 adults with chronic epilepsy were initially assigned either to an in-person intervention or to treatment as usual. After study drop outs, 38 patients remained in the intervention arm, with 40 in the control arm. In the intervention, 6 to 8 adults met for a 75-minute group session 1 evening per week for 8 weeks; these sessions were co-led by a psychologist and a trained peer with epilepsy. Topics included medical, psychosocial, cognitive, and self-management aspects of epilepsy, in addition to community integration and optimization of epilepsy-related communication. Outcomes were measured with various instruments, including the ESES, the Quality of Life in Epilepsy-31 (QOLIE-31), the Epilepsy Self-Management Scale (ESMS), the Patient Health Questionnaire-9, and the Generalized Anxiety Disorder-7. Each test was administered at baseline and after intervention. Outcomes were assessed immediately after program completion (8 weeks) and at follow-up 6 months later.
Findings suggested a substantial positive impact on epilepsy self-management capacities at program completion. In addition, benefit was sustained, particularly for epilepsy information management, over the 6 months after program completion. On the QOLIE-31 at 6 months, management of medication AEs also remained significantly improved, and fatigue management was improved at the P < .05 level. The researchers concluded that the PACES in Epilepsy program might have a more sustained impact on management of disability than on mood. They also noted that the effect was greater immediately after program completion than at 6 months. Patients gave the PACES program high satisfaction ratings.
Although these programs take slightly different approaches to epilepsy self-management, they have a similar focus: directed patient education. Furthermore, most of these programs are conducted in person, usually in a support group setting. In the WebEase trial, patients seem to have completed the online modules in a study setting, and a peer support component was not included. Overall, all programs successfully demonstrated various benefits for trial patients. These outcomes suggest that despite their subtle differences in approach, formal self-management programs are benefiting patients.
None of these platforms was designed for or specifically tested veterans with epilepsy. Although veterans theoretically would benefit from the same tools used by nonveterans, Iraq and Afghanistan veterans with epilepsy are more likely than are those without epilepsy to have mental and physical comorbidities and significantly higher mortality.2 Therefore, veterans potentially could benefit more from evidence-based chronic disease self-management programs designed to reduce physical and psychiatric comorbidities. Furthermore, programs that incorporate peer-to-peer support and direct links to VA care teams and mental health providers could be valuable.18
One research effort that directly addressed these issues is the Policy for Optimized Epilepsy Management (POEM) study, conducted by Hixson and colleagues in 2015.18 This study, not included in the review by Bradley and colleagues, used a purely online- and mobile-based social networking platform to promote self-management practices.19 Unlike the other programs described here, POEM did not require that patients view or attend formal educational seminars, though these seminars were available through the online platform for patient self-directed viewing. In addition, the intervention heavily promoted peer-to-peer engagement and disease tracking as means of increasing self-knowledge and activation. This study was unlike the other platforms in another way: It specifically focused on veterans with epilepsy, based on the idea that many veterans had a shared experience that would optimize a peer support approach.
The POEM investigators did not use a controlled design but found a significant benefit for both ESES and ESMS metrics on within-subject comparisons. Similar to the PACES in Epilepsy study, the POEM study found the highest benefit on the information management subscale of the ESMS.16 Practically speaking, this means patients were better able to use and manage digital and mobile information resources for controlling epilepsy. The POEM study results further reinforced the idea that epilepsy self-management programs are beneficial and expanded on earlier research to emphasize the value of peer support networks and digital interventions that can be used by patients at their convenience. These features provide greater access to more patients and maintain the crucial elements of peer-to-peer learning and counseling.
Implementation Barriers
Confirming the effectiveness of self-management programs is only the beginning of formal implementation and adoption. The real-world success of patient self-management programs has been documented for a few chronic diseases, including epilepsy. However, there is little research or commentary on lessons learned or on the challenges encountered with wide implementation of these programs.
Initial Setup and Sponsorship
To promote wider adoption, researchers should include commentary on initial setup, ongoing patient acceptance, and continual provider support. Many of the initial challenges in self-management programs involve a changing paradigm in the delivery and economics of health care. The transition to a more consumer-oriented health model with an emphasis on outcomes and patient-reported variables likely will support self-management strategies but is only slowly evolving. Many health care providers, hospitals, and payers may not be familiar with or have proper incentivizes to explore self-management tools even when proven effective.
More specifically, these epilepsy self-management programs are treatment adjuncts well suited to military and veteran health care systems. Self-management closely aligns with the overall VHA mission, vision, and values, including formal Department of Veteran Affairs (VA) goals and the MyVA priorities that collectively embrace improvement in access, a veteran-centric approach, and quality for improvement of the entire VA experience. Self-management platforms in the VA are recognized as empowering veterans and are thought to indirectly improve access to health care.20,21
The barriers of sponsorship and financial support likely will persist in the private health care sector but are less likely to significantly affect the VHA. Self-management programs have been researched and implemented for many health conditions across the VHA. For example, the VA Talent Management System course Patient Self-Management: Skill Building (TMS 6467) offers education and training to all clinical practitioners and managers involved in patient education and self-management activities for a variety of chronic medical conditions. Regarding epilepsy self-management more specifically, a patient brochure on the practice is distributed by the VHA Epilepsy Centers of Excellence (ECoEs) and an associated consortium.22 Last, a national provider educational lecture series has a corresponding patient and caregiver lecture set that emphasizes education and self-management behaviors.
Labor, Time, and Resource Needs
The most time-intensive aspect of designing self-management programs is developing the tool that allows clinicians and patients to work together. From a program perspective, the tool must be available and helpful not only to patients and specialists, but also to primary care providers. Tertiary-care centers usually accept the responsibility for program initiation, including patient recruitment, logistics coordination, and health care professional staffing. For epilepsy, the small pool of relevant specialists and centers limits the number of self-management education sessions that can be hosted and increases the need for complex travel and scheduling tasks. However, ECoE communication lines provide a basic infrastructure for collaboration and for development of tools that can be helpful to all clinicians treating veterans with epilepsy.23
Given the issues with coordinating the logistics of in-person programs at brick-and-mortar sites, this type of program may not be the best option for some patients and facilities. Alternative approaches, such as telehealth and asynchronous digital platforms, could expand access and increase convenience. Even though remotely administered programs may not be as powerful for some patients, the promise of scalable access supports consideration of these approaches.
Patient and Caregiver Logistics
Veterans with epilepsy may also have comorbid traumatic brain injury (TBI) and posttraumatic stress disorder, which can complicate self-managed care. In addition, many veterans live in rural areas and have limited travel options. All these factors challenge the success of epilepsy self-management programs. However, the network of ECoEs and associated consortium facilities can step up to deliver self-management tools and information.
The infrastructure of the VHA patient aligned care team (PACT) also contributes to the integration of self-management training. The PACT model takes a personalized, comprehensive, coordinated approach to promote team-based, veteran-centric care and actively partners with other VHA offices to incorporate alternative care services, including peer support and self-management platforms. The combination represents fertile ground for implementation and promotion of self-management tools in the VHA epilepsy population.
Health Care Economics
Given the uncertainties of the US health care economy, it is not surprising that many experts advocate a fundamental redesign of the health care team relationship and information infrastructure.24 This realignment includes partnering directly with patients and their families to encourage more reliance on self-management practices. Unfortunately, this approach does not lend itself to the well-entrenched business model on which most community medical practices are based. Health system leadership often must be convinced there are potential cost savings or a return on investment for new programs. As there is no consistent, comprehensive reimbursement policy for programs focused on self-management, health care systems must be creative and innovative when appraising the financial consequences of such programs.
Epilepsy remains a huge burden. In 2000, the annual total cost of epilepsy treatment in the US was $362 million for new patients and $2 billion for existing cases.25 Within the VHA, the occurrence of posttraumatic epilepsy among the increasing number of veterans with TBI contributes to the burden, and posttraumatic epilepsy and psychogenic nonepileptic seizures complicate treatment approaches. The incidence of comorbidities, including anxiety and depression, has been as high as 50%.23 Epilepsy health care programs are evaluating ways to validate their ability to minimize cost, improve access, and maintain quality of service. Integration of self-management should be included in these efforts.
The VHA represents a unique health care environment for testing and implementing self-management programs. Although the VHA is not immune to the traditional business models of medicine, it is less dependent on them, and it disproportionately cares for patients for long spans of time. From the health care team perspective, data indicate that ECoE physicians represent a high percentage of VHA epilepsy specialists but directly see only about 20% of veterans with an epilepsy or seizure-associated diagnosis. Therefore, future collaboration and connectivity of consortium sites can have a broader impact on self-management—highlighting the fact that concerted, scaled self-management programs have an important role in the VHA health care delivery system and should be promoted.26
Final Insights and Opportunities
Despite the barriers to adoption, formal epilepsy self-management programs are making gains in maturity and academic credibility. As the health care economy gradually shifts to more outcomes-based models, these offerings likely will become more valued, particularly by health care organizations focused on cost sharing, by large self-insuring employers, or organizations like the VHA where patients maintain a long-term relationship. Nevertheless, for the more resource-intensive, in-person self-management programs, adoption may remain constrained. Digital and mobile platforms should serve as more accessible entry points, with lower costs and more rapid scaling potential. Even though these online platforms may not have the same impact as intensive face-to-face programs, their scalability and constant accessibility should make them attractive, and the relatively modest cost of implementing self-guided programs should reduce barriers to adoption.
Integrated health care systems, such as the VHA and various European health systems, can serve as models for self-management implementation. Incorporating a live clinical implementation into parallel research efforts can continue to produce vital academic information on the real-world impact of these solutions, and this evidence in turn can be used to support policies that foster widespread adoption. More specifically, the ECoE model represents a clear opportunity to promote widespread implementation of self-management. The ECoEs are already publishing self-management materials that health care teams can use in patient counseling,and several self-care studies are being conducted within the network.22 In this model, compared with private sector health systems, ECoEs are well positioned to advance the use of formal self-management strategies.
The proposed epilepsy self-management model for ECoEs would be based on an iterative program that incorporates best practices from each of the research studies discussed earlier. With the publication of new research, successful self-management tools would be incorporated into the programs. From a curriculum perspective, educational platforms on medication adherence, seizure safety, and information/data management should be included. Evidence is increasing that peer support and use of licensed peer navigators should be incorporated as well. Last, flexible and asynchronous digital methods should be added to self-management platforms to maximize patient access. These features build on the growing body of evidence to maximize the likelihood of a successful and sustainable self-management strategy for patients with epilepsy.
Click here to read the digital edition.
1. Fiest KM, Sauro KM, Wiebe S, et al. Prevalence and incidence in epilepsy: a systematic review and meta-analysis of international studies. Neurology. 2017;88(3):296-303.
2. Pugh MJ, Van Cott AC, Amuan M, et al. Epilepsy among Iraq and Afghanistan war veterans—United States, 2002-2015. MMWR. 2016;65(44):1224-1227.
3. Kwan P, Brodie MJ. Effectiveness of first antiepileptic drug. Epilepsia. 2001;42(10):1255-1260.
4. Hesdorffer DC, Beck V, Begley CE, et al. Research implications of the Institute of Medicine report, Epilepsy Across the Spectrum: Promoting Health and Understanding. Epilepsia. 2013;54(2):207-216.
5. Bandura A. Social Foundations of Thought and Action: A Social Cognitive Theory. Englewood Cliffs, NJ: Prentice-Hall; 1986.
6. Bandura A. Social Learning Theory. Englewood Cliffs, NJ: Prentice-Hall; 1977.
7. Clark, NM, Becker MH, Janz NK, Lorig K, Rakowski W, Anderson L. Self-management of chronic disease by older adults. J Aging Health. 1991;3(1):3-27.
8. Ory MG, Ahn SM, Jiang L, et al. Successes of a national study of the Chronic Disease Self-Management Program: meeting the triple aim of health care reform. Med Care. 2013;51(11):992-998.
9. DiIorio C, Shafer PO, Letz R, Henry TR, Schomer DL, Yeager K; Project EASE Study Group. Behavioral, social and affective factors associated with self-efficacy for self-management among people with epilepsy. Epilepsy Behav. 2006;9(1):158-163.
10. Shegog R, Bamps YA, Patel A, et al. Managing Epilepsy Well: emerging e-tools for epilepsy self-management. Epilepsy Behav. 2013;29(1):133-140.
11. DiIorio C, Bamps Y, Walker ER, Escoffery C. Results of a research study evaluating WebEase, an online epilepsy self-management program. Epilepsy Behav. 2011;22(3):469-474.
12. Gallant MP. The influence of social support on chronic illness self-management: a review and directions for research. Health Educ Behav. 2003;30(2):170-195.
13. Helgeson DC, Mittan R, Tan SY, Chayasirisobhon S. Sepulveda Epilepsy Education: the efficacy of a psychoeducational treatment programme in treating medical and psychosocial aspects of epilepsy. Epilepsia. 1990;31(1):75-82.
14. May TW, Pfäfflin M. The efficacy of an educational treatment program for patients with epilepsy (MOSES): results of a controlled, randomized study. Modular Service Package Epilepsy. Epilepsia. 2002;43(5):539-549.
15. Aliasgharpour M, Dehgahn Nayeri N, Yadegary MA, Haghani H. Effects of an educational program on self-management in patients with epilepsy. Seizure. 2013;22(1):48-52.
16. Fraser RT, Johnson EK, Lashley S, et al. PACES in Epilepsy: results of a self-management randomized controlled trial. Epilepsia. 2015;56(8):1264-1274.
17. Laybourne AH, Morgan M, Watkins SH, Lawton R, Ridsdale L, Goldstein LH. Self-management for people with poorly controlled epilepsy: participants’ views of the UK self-management in epilepsy (SMILE) program. Epilepsy Behav. 2015;52(pt A):159-164.
18. Hixson JD, Barnes D, Parko K, et al. Patients optimizing epilepsy management via an online community: the POEM study. Neurology. 2015;85(2):129-136.
19. Bradley PM, Lindsay B, Fleeman N. Care delivery and self-management strategies for adults with epilepsy. Cochrane Database Syst Rev. 2016;2:CD006244.
20. Allicock M, Haynes-Maslow L, Carr C, et al. Training veterans to provide peer support in a weight-management program: MOVE! Prev Chronic Dis. 2013;10:E185.
21. Damush TM, Jackson GL, Powers BJ, et al. Implementing evidence-based patient self-management programs in the Veterans Health Administration: perspectives on delivery system design considerations. J Gen Intern Med. 2010;25(suppl 1):68-71.
22. Caraveo N, Chen S, Evrard C, Ozuna J; Epilepsy Centers of Excellence Nursing Workgroup. Self-management in epilepsy: a guide for healthcare professionals. https://www.epilepsy.va.gov/Library/Self-Management%20In%20Epilepsy.pdf. Published Winter 2015. Accessed February 26, 2018.
23. Rehman R, Kelly PR, Husain AM, Tran TT. Characteristics of veterans diagnosed with seizures within the Veterans Health Administration. J Rehabil Res Dev. 2015;52(7):751-762.
24. Merry MD. Healthcare’s need for revolutionary change. Quality Prog. 2003;36(9):31-35.
25. Halpern M, Rentz A, Murray M. Cost of illness of epilepsy in the US: comparison of patient-based and population-based estimates. Neuroepidemiology. 2000;19(2):87-99.
26. Kelly P, Chinta R. Do centers of excellence excel in patient outcomes?: Evidence from U.S. Veterans Health Administration Centers for Epilepsy. Int J Manage Excellence. 2015;4(3):529-538.
Effects of Process Improvement on Guideline-Concordant Cardiac Enzyme Testing
In recent years, driven by accelerating health care costs and desire for improved health care value, major specialty group guidelines have incorporated resource utilization and value calculations into their recommendations. High-value care has the characteristics of enhancing outcomes, safety, and patient satisfaction at a reasonable cost. As one example, the American College of Cardiology (ACC) recently published a consensus statement on its clinical practice guidelines with a specific focus on cost and value.1 This guideline acknowledges the difficulty in incorporating value into clinical decision making but stresses a need for increased transparency and consistency to boost value in everyday practice.
Chest pain and related symptoms were listed as the second leading principle reasons for emergency department visits in the US in 2011 with 14% of patients undergoing cardiac enzyme testing.2 The ACC guidelines advocate use of troponin as the preferred laboratory test for the initial evaluation of acute coronary syndrome (ACS). Fractionated creatine kinase (CK-MB) is an acceptable alternative only when a cardiac troponin test is not available.3 Furthermore, troponins should be obtained no more than 3 times for the initial evaluation of a single event, and further trending provides no additional benefit or prognostic information.
A recent study from an academic hospital showed that process improvement interventions focused on eliminating unnecessary cardiac enzyme testing led to a 1-year cost savings of $1.25 million while increasing the rate of ACS diagnosis.4 Common clinical practice at Naval Medical Center Portsmouth (NMCP) in Virginia still routinely includes both troponin as well as a CK panel comprised of CK, CK-MB, and a calculated CK-MB/CK index. Our study focuses on the implementation of quality improvement efforts described by Larochelle and colleagues at NMCP.4 The study aimed to determine the impact of implementing interventions designed to improve the ordering practices and reduce the cost of cardiac enzyme testing.
Methods
The primary focus of the intervention was on ordering practices of the emergency medicine department (EMD), internal medicine (IM) inpatient services, and cardiology inpatient services. Specific interventions were: (1) removal of the CK panel from the chest pain order set in the EMD electronic health record (EHR); (2) removal of the CK panel from the inpatient cardiology order set; (3) education of staff on the changes in CK panel utility via direct communication during IM academic seminars; (4) education of nursing staff ordering laboratory results on behalf of physicians on the cardiology service at the morning and evening huddles; and (5) addition of “max of 3 tests indicated” comment to the inpatient EHR ordering page of the troponin test
Data Source
The process improvement interventions were considered exempt from institutional review board (IRB) approval; however, we obtained expedited IRB approval with waiver of consent for the research aspect of the project. We obtained clinical administrative data from the Military Health System Data Repository (MDR). We identified all adult patients aged ≥ 18 years who had a troponin test, CK-MB, or both drawn at NMCP on the following services: the EMD, IM, and cardiology. A troponin or CK-MB test was defined using Current Procedural Terminology (CPT) codes and unique Logical Observation Identifiers Names and Codes (LOINC).
Measures
The study was divided into 3 periods: the preintervention period from August 1, 2013 to July 31, 2014; the intervention period from August 1, 2014 to January 31, 2015; and the postintervention period February 1, 2015 to January 31, 2016.
The primary outcomes measured were the frequency of guideline concordance and total costs for tests ordered per month using the Centers for Medicare and Medicaid Services (CMS) clinical laboratory fee schedule of $13.40 for troponin and $16.17 for CK-MB.5Concordance was defined as ≤ 3 troponin tests and no CK-MB tests ordered during 1 encounter for a patient without an ACS diagnosis in the preceding 7 days. Due to faster cellular release kinetics of CK-MB compared with that of troponin, this test has utility in evaluating new or worsening chest pain in the setting of a recent myocardial infarction (MI). Therefore, we excluded any patient who had a MI within the preceding 7 days of an order for either CK-MB or troponin tests. Additionally, the number of tests, both CK-MB and troponin, ordered per patient encounter (hereafter referred to as an episode) were measured. Finally, we measured the monthly prevalence of ACS diagnosis and percentage of visits having that diagnosis.
Data Analysis
Descriptive statistics were used to calculate population demographics of age group, sex, beneficiary category, sponsor service, and clinical setting. Monthly data were grouped into the preintervention and postintervention periods. The analysis was performed using t tests to compare mean values and CIs before and after the intervention. Simple linear regression with attention to correlation was used to create best fit lines with confidence bands before and after the intervention. Interrupted time series (ITS) regression was used to describe all data points throughout the study. Consistency between these various methods was verified. Mean values and CIs were reported from the t tests. Statistical significance was reported when appropriate. Equations and confidence predictions on the simple linear regressions were produced and reported. These were used to identify values at the start, midpoint, and end of the pre- and postintervention periods.
Results
There were a total of 6,281 patients in the study population. More patients were seen during the postintervention period than in the preintervention period. The mean age of patients was slightly higher during the preintervention period (Table 1). 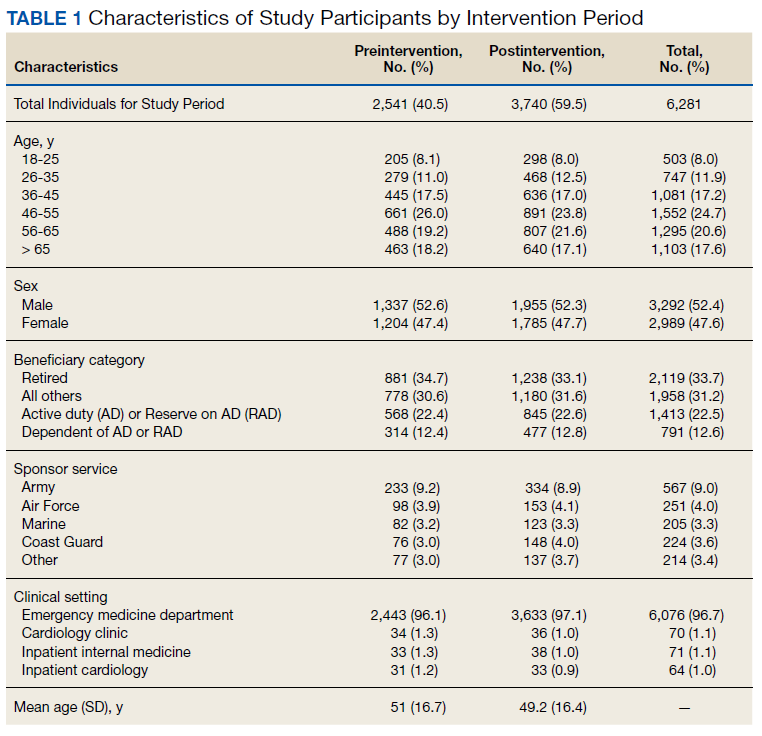
Guideline Concordance
To determine whether ordering practices for cardiac enzyme testing improved, we assessed the changes in the frequency of guideline concordance during the pre- and postintervention period. On average during the preintervention year, the percentage of tests ordered that met guideline concordance was 10.1% (95% CI, 7.4%-12.9%), increasing by 0.80% (95% CI, 0.17%-1.42%) each month. 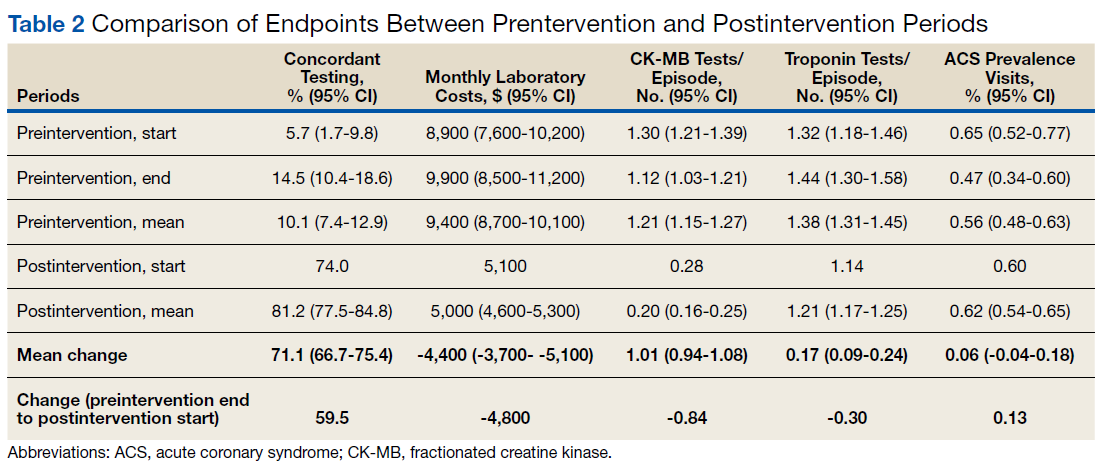
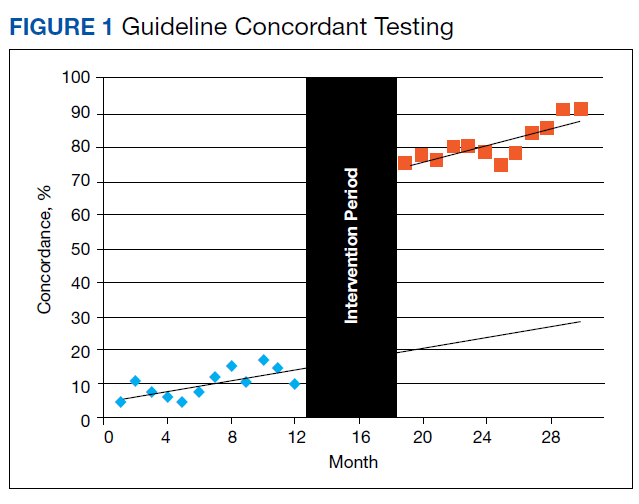
Costs
We assessed changes in total dollars spent on cardiac enzyme testing during the pre- and postintervention periods. During the preintervention year, $9,400 (95% CI, $8,700-$10,100) was spent on average each month, which did not change significantly throughout the period. During the postintervention year, the cost was stable at $5,000 (95% CI, $4,600-$5,300) on average each month, a reduction of $4,400 (95% CI, $3,700-$5,100) (Figure 2). 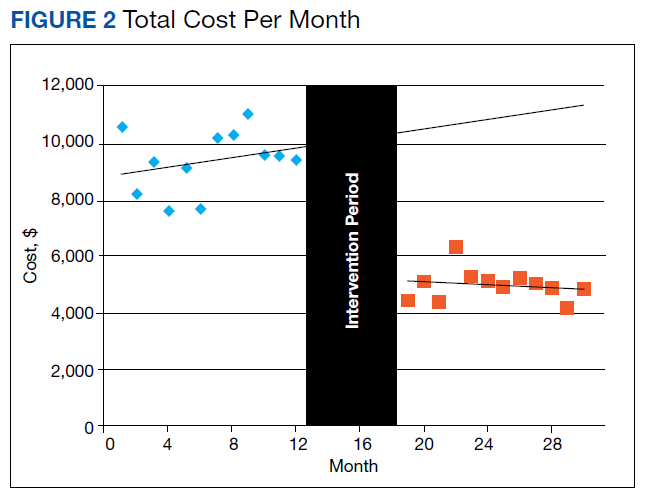
CK-MB and Troponin Tests per Patient
To further assess ordering practices for cardiac enzyme testing, we compared the changes in the monthly number of tests and the average number of CK-MB and troponin tests ordered per episode pre- and postintervention. On average during the preintervention year, 297 tests (95% CI, 278-315) were run per month, with an average of 1.21 CK tests (95% CI, 1.15-1.27) per episode (Table 2, Figure 3). 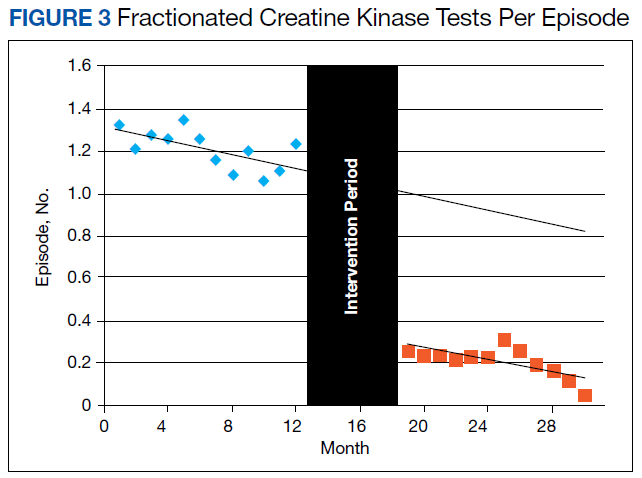
The changes in troponin testing were not as dramatic. The counts of tests each month remained similar, with a preintervention year average of 341 (95% CI, 306-377) and postintervention year average of 310 (95% CI, 287-332), which were not statistically different. However, there was a statistically significant decrease in the number of tests per episode. During the preintervention year, 1.38 troponin tests (95% CI, 1.31-1.45) were ordered per patient on average. This dropped by 0.17 (95% CI, 0.09-0.24) to the postintervention average of 1.21 (95% CI, 1.17-1.25) (Table 2, Figure 4). 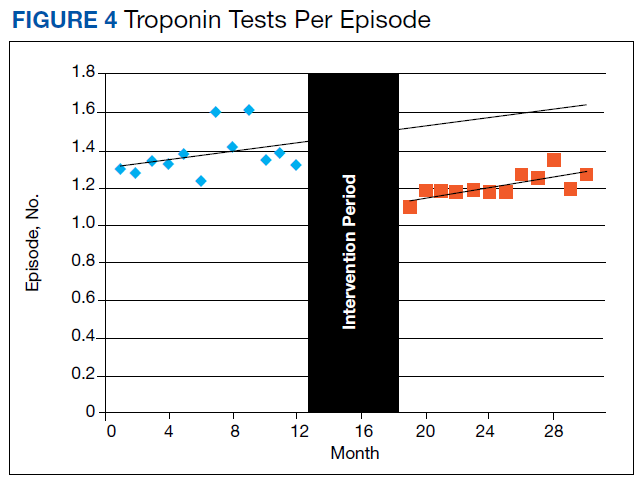
ACS Prevalence
To determine whether there was an impact on ACS diagnoses, we looked at the numbers of ACS diagnoses and their prevalence among visits before and after the intervention. During the preintervention year, the average monthly number of diagnoses was 29.7 (95% CI, 26.1-33.2), and prevalence of ACS was 0.56% (95% CI, 0.48%-0.63%) of all episodes. Although the monthly rate was statistically decreasing by 0.022% (95% CI, 0.003-0.41), this has little meaning since the level of correlation (r2 = 0.2522, not displayed) was poor due to the essentially nonexistent correlation in number of visits each month (r2 = 0.0112, not displayed). During the postintervention year, the average number of diagnoses was 32.2 (95% CI, 27.9-36.6), and the prevalence of ACS was 0.62% (95% CI, 0.54-0.65). Neither of these values changed significantly between the pre- and postintervention period. All ICD-9 and ICD-10 diagnosis codes used for the analysis are available upon request from the authors.
Discussion
Our data demonstrate the ability of simple process improvement interventions to decrease unnecessary testing in the workup of ACS, increasing the rate of guideline concordant testing by > 70% at a single military treatment facility (MTF). In particular, with the now widespread use of EHR, the order set presents a high-yield target for process improvement in an easily implemented, durable fashion. We had expected to see some decrease in the efficacy of the intervention at a time of staff turnover in the summer of 2015 because ongoing dedicated teaching sessions were not performed. Despite that, the intervention remained effective without further dedicated teaching sessions. This outcome was certainly attributable to the hardwired interventions made (mainly via order sets), but possibly indicates an institutional memory that can take hold after an initial concerted effort is made.
We reduced the estimated preintervention annual cost of $113,000 by $53,000 (95% CI, $42,000-$64,000). Although on a much smaller scale than the study by Larochelle, our study represents a nearly 50% reduction in the total cost of initial testing for possible ACS and a > 80% reduction in unnecessary CK-MB testing.4 This result was achieved with no statistical change in the prevalence of ACS. The cost reduction does not account for the labor costs to clinically follow-up and address additional unnecessary lab results. The estimated cost of intervention was limited to the time required to educate residents, interns, and nursing staff as well as the implementation of the automated, reflexive laboratory results ordering process.
Unique to our study, we also demonstrated an intervention that satisfied all the major stakeholders in the ordering of these laboratory results. By instituting the reflexive ordering of CK-MB tests for positive troponins, we obtained the support of the facility’s interventional cardiology department, which finds value in that data. Appreciating the time-sensitive nature of an ACS diagnosis, the reflexive ordering minimized the delay in receiving these data while still greatly reducing the number of tests performed. That being said, if the current trend away from CK-MB in favor of exclusively testing troponin continues, removing the reflexive ordering for positive laboratory results protocol would be an easy follow-on intervention.
Limitations
Our study presented several limitations. First, reporting errors due to improper or insufficient medical coding as well as data entry errors may exist within the MDR; therefore, the results of this analysis may be over- or underestimated. Specifically, CPT codes for troponin and CK-MB were available only in 1 of the 2 data sets used for this study, which primarily contains outpatient patient encounters. For this reason, most of the laboratory testing comes from the EMD rather than from inpatient services. However, because we excluded all patients who eventually had an ACS diagnosis (patients who likely had more inpatient time and better indication for repeat troponin), we feel that our intervention was still thoroughly investigated. Second, the number of tests drawn per patient was significantly < 2, the expected minimum number of tests to rule out ACS in patients with appropriate symptoms.
This study was not designed to answer the source of variation from guidelines. Many patients had only 1 test, which we feel represents an opportunity for future study to identify other ways cardiac enzyme testing is being used clinically. These tests might be used for patients without convincing symptoms and signs of coronary syndromes or for patients with other primary problems. Third, by using the ITS analysis, we assumed that the outcome during each intervention period follows a linear pattern. However, changes may follow a nonlinear pattern over a long period. Finally, our intervention was limited to only a single MTF, which may limit generalizability to other facilities across military medicine. However, we feel this study should serve as a guide for other MTFs as well as US Department of Veterans Affairs facilities that could institute similar process improvements.
Conclusion
We made easily implemented and durable process improvement interventions that changed institution-wide ordering practices. These changes dramatically increased the rate of guideline-concordant testing, decreasing cost and furthering the goal of high-value medical care.
1. Anderson JL, Heidenreich PA, Barnett PG, et al; ACC/AHA Task Force on Performance Measures; ACC/AHA Task Force on Practice Guidelines. ACC/AHA statement on cost/value methodology in clinical practice guidelines and performance measures: a report of the American College of Cardiology/American Heart Association Task Force on Performance Measures and Task Force on Practice Guidelines. Circulation. 2014;129(22):2329-2345.
2. Centers for Disease Control and Prevention, National Center for Health Statistics. National hospital ambulatory medical care survey: 2010 emergency department summary tables. https://www.cdc.gov/nchs/data/ahcd/nhamcs_emergency/2010_ed_web_tables.pdf. Accessed March 15, 2019.
3. Morrow DA, Cannon CP, Jesse RL, et al; National Academy of Clinical Biochemistry. National Academy of Clinical Biochemistry Laboratory Medicine Practice Guidelines: Clinical characteristics and utilization of biochemical markers in acute coronary syndromes. Circulation. 2007;115(13):e356-e375.
4. Larochelle MR, Knight AM, Pantle H, Riedel S, Trost JC. Reducing excess cardiac biomarker testing at an academic medical center. J Gen Intern Med. 2014;29(11):1468-1474.
5. Centers for Medicare and Medicaid Services. 2016 clinical laboratory fee schedule. https://www.cms.gov/Medicare/Medicare-Fee -for-Service-Payment/ClinicalLabFeeSched/Clinical-Laboratory-Fee-Schedule-Files-Items/16CLAB.html?DLPage=1&DLEntries=10&DLSort=2&DLSortDir=descending. Accessed March 15, 2019.
In recent years, driven by accelerating health care costs and desire for improved health care value, major specialty group guidelines have incorporated resource utilization and value calculations into their recommendations. High-value care has the characteristics of enhancing outcomes, safety, and patient satisfaction at a reasonable cost. As one example, the American College of Cardiology (ACC) recently published a consensus statement on its clinical practice guidelines with a specific focus on cost and value.1 This guideline acknowledges the difficulty in incorporating value into clinical decision making but stresses a need for increased transparency and consistency to boost value in everyday practice.
Chest pain and related symptoms were listed as the second leading principle reasons for emergency department visits in the US in 2011 with 14% of patients undergoing cardiac enzyme testing.2 The ACC guidelines advocate use of troponin as the preferred laboratory test for the initial evaluation of acute coronary syndrome (ACS). Fractionated creatine kinase (CK-MB) is an acceptable alternative only when a cardiac troponin test is not available.3 Furthermore, troponins should be obtained no more than 3 times for the initial evaluation of a single event, and further trending provides no additional benefit or prognostic information.
A recent study from an academic hospital showed that process improvement interventions focused on eliminating unnecessary cardiac enzyme testing led to a 1-year cost savings of $1.25 million while increasing the rate of ACS diagnosis.4 Common clinical practice at Naval Medical Center Portsmouth (NMCP) in Virginia still routinely includes both troponin as well as a CK panel comprised of CK, CK-MB, and a calculated CK-MB/CK index. Our study focuses on the implementation of quality improvement efforts described by Larochelle and colleagues at NMCP.4 The study aimed to determine the impact of implementing interventions designed to improve the ordering practices and reduce the cost of cardiac enzyme testing.
Methods
The primary focus of the intervention was on ordering practices of the emergency medicine department (EMD), internal medicine (IM) inpatient services, and cardiology inpatient services. Specific interventions were: (1) removal of the CK panel from the chest pain order set in the EMD electronic health record (EHR); (2) removal of the CK panel from the inpatient cardiology order set; (3) education of staff on the changes in CK panel utility via direct communication during IM academic seminars; (4) education of nursing staff ordering laboratory results on behalf of physicians on the cardiology service at the morning and evening huddles; and (5) addition of “max of 3 tests indicated” comment to the inpatient EHR ordering page of the troponin test
Data Source
The process improvement interventions were considered exempt from institutional review board (IRB) approval; however, we obtained expedited IRB approval with waiver of consent for the research aspect of the project. We obtained clinical administrative data from the Military Health System Data Repository (MDR). We identified all adult patients aged ≥ 18 years who had a troponin test, CK-MB, or both drawn at NMCP on the following services: the EMD, IM, and cardiology. A troponin or CK-MB test was defined using Current Procedural Terminology (CPT) codes and unique Logical Observation Identifiers Names and Codes (LOINC).
Measures
The study was divided into 3 periods: the preintervention period from August 1, 2013 to July 31, 2014; the intervention period from August 1, 2014 to January 31, 2015; and the postintervention period February 1, 2015 to January 31, 2016.
The primary outcomes measured were the frequency of guideline concordance and total costs for tests ordered per month using the Centers for Medicare and Medicaid Services (CMS) clinical laboratory fee schedule of $13.40 for troponin and $16.17 for CK-MB.5Concordance was defined as ≤ 3 troponin tests and no CK-MB tests ordered during 1 encounter for a patient without an ACS diagnosis in the preceding 7 days. Due to faster cellular release kinetics of CK-MB compared with that of troponin, this test has utility in evaluating new or worsening chest pain in the setting of a recent myocardial infarction (MI). Therefore, we excluded any patient who had a MI within the preceding 7 days of an order for either CK-MB or troponin tests. Additionally, the number of tests, both CK-MB and troponin, ordered per patient encounter (hereafter referred to as an episode) were measured. Finally, we measured the monthly prevalence of ACS diagnosis and percentage of visits having that diagnosis.
Data Analysis
Descriptive statistics were used to calculate population demographics of age group, sex, beneficiary category, sponsor service, and clinical setting. Monthly data were grouped into the preintervention and postintervention periods. The analysis was performed using t tests to compare mean values and CIs before and after the intervention. Simple linear regression with attention to correlation was used to create best fit lines with confidence bands before and after the intervention. Interrupted time series (ITS) regression was used to describe all data points throughout the study. Consistency between these various methods was verified. Mean values and CIs were reported from the t tests. Statistical significance was reported when appropriate. Equations and confidence predictions on the simple linear regressions were produced and reported. These were used to identify values at the start, midpoint, and end of the pre- and postintervention periods.
Results
There were a total of 6,281 patients in the study population. More patients were seen during the postintervention period than in the preintervention period. The mean age of patients was slightly higher during the preintervention period (Table 1).
Guideline Concordance
To determine whether ordering practices for cardiac enzyme testing improved, we assessed the changes in the frequency of guideline concordance during the pre- and postintervention period. On average during the preintervention year, the percentage of tests ordered that met guideline concordance was 10.1% (95% CI, 7.4%-12.9%), increasing by 0.80% (95% CI, 0.17%-1.42%) each month.
Costs
We assessed changes in total dollars spent on cardiac enzyme testing during the pre- and postintervention periods. During the preintervention year, $9,400 (95% CI, $8,700-$10,100) was spent on average each month, which did not change significantly throughout the period. During the postintervention year, the cost was stable at $5,000 (95% CI, $4,600-$5,300) on average each month, a reduction of $4,400 (95% CI, $3,700-$5,100) (Figure 2).
CK-MB and Troponin Tests per Patient
To further assess ordering practices for cardiac enzyme testing, we compared the changes in the monthly number of tests and the average number of CK-MB and troponin tests ordered per episode pre- and postintervention. On average during the preintervention year, 297 tests (95% CI, 278-315) were run per month, with an average of 1.21 CK tests (95% CI, 1.15-1.27) per episode (Table 2, Figure 3).
The changes in troponin testing were not as dramatic. The counts of tests each month remained similar, with a preintervention year average of 341 (95% CI, 306-377) and postintervention year average of 310 (95% CI, 287-332), which were not statistically different. However, there was a statistically significant decrease in the number of tests per episode. During the preintervention year, 1.38 troponin tests (95% CI, 1.31-1.45) were ordered per patient on average. This dropped by 0.17 (95% CI, 0.09-0.24) to the postintervention average of 1.21 (95% CI, 1.17-1.25) (Table 2, Figure 4).
ACS Prevalence
To determine whether there was an impact on ACS diagnoses, we looked at the numbers of ACS diagnoses and their prevalence among visits before and after the intervention. During the preintervention year, the average monthly number of diagnoses was 29.7 (95% CI, 26.1-33.2), and prevalence of ACS was 0.56% (95% CI, 0.48%-0.63%) of all episodes. Although the monthly rate was statistically decreasing by 0.022% (95% CI, 0.003-0.41), this has little meaning since the level of correlation (r2 = 0.2522, not displayed) was poor due to the essentially nonexistent correlation in number of visits each month (r2 = 0.0112, not displayed). During the postintervention year, the average number of diagnoses was 32.2 (95% CI, 27.9-36.6), and the prevalence of ACS was 0.62% (95% CI, 0.54-0.65). Neither of these values changed significantly between the pre- and postintervention period. All ICD-9 and ICD-10 diagnosis codes used for the analysis are available upon request from the authors.
Discussion
Our data demonstrate the ability of simple process improvement interventions to decrease unnecessary testing in the workup of ACS, increasing the rate of guideline concordant testing by > 70% at a single military treatment facility (MTF). In particular, with the now widespread use of EHR, the order set presents a high-yield target for process improvement in an easily implemented, durable fashion. We had expected to see some decrease in the efficacy of the intervention at a time of staff turnover in the summer of 2015 because ongoing dedicated teaching sessions were not performed. Despite that, the intervention remained effective without further dedicated teaching sessions. This outcome was certainly attributable to the hardwired interventions made (mainly via order sets), but possibly indicates an institutional memory that can take hold after an initial concerted effort is made.
We reduced the estimated preintervention annual cost of $113,000 by $53,000 (95% CI, $42,000-$64,000). Although on a much smaller scale than the study by Larochelle, our study represents a nearly 50% reduction in the total cost of initial testing for possible ACS and a > 80% reduction in unnecessary CK-MB testing.4 This result was achieved with no statistical change in the prevalence of ACS. The cost reduction does not account for the labor costs to clinically follow-up and address additional unnecessary lab results. The estimated cost of intervention was limited to the time required to educate residents, interns, and nursing staff as well as the implementation of the automated, reflexive laboratory results ordering process.
Unique to our study, we also demonstrated an intervention that satisfied all the major stakeholders in the ordering of these laboratory results. By instituting the reflexive ordering of CK-MB tests for positive troponins, we obtained the support of the facility’s interventional cardiology department, which finds value in that data. Appreciating the time-sensitive nature of an ACS diagnosis, the reflexive ordering minimized the delay in receiving these data while still greatly reducing the number of tests performed. That being said, if the current trend away from CK-MB in favor of exclusively testing troponin continues, removing the reflexive ordering for positive laboratory results protocol would be an easy follow-on intervention.
Limitations
Our study presented several limitations. First, reporting errors due to improper or insufficient medical coding as well as data entry errors may exist within the MDR; therefore, the results of this analysis may be over- or underestimated. Specifically, CPT codes for troponin and CK-MB were available only in 1 of the 2 data sets used for this study, which primarily contains outpatient patient encounters. For this reason, most of the laboratory testing comes from the EMD rather than from inpatient services. However, because we excluded all patients who eventually had an ACS diagnosis (patients who likely had more inpatient time and better indication for repeat troponin), we feel that our intervention was still thoroughly investigated. Second, the number of tests drawn per patient was significantly < 2, the expected minimum number of tests to rule out ACS in patients with appropriate symptoms.
This study was not designed to answer the source of variation from guidelines. Many patients had only 1 test, which we feel represents an opportunity for future study to identify other ways cardiac enzyme testing is being used clinically. These tests might be used for patients without convincing symptoms and signs of coronary syndromes or for patients with other primary problems. Third, by using the ITS analysis, we assumed that the outcome during each intervention period follows a linear pattern. However, changes may follow a nonlinear pattern over a long period. Finally, our intervention was limited to only a single MTF, which may limit generalizability to other facilities across military medicine. However, we feel this study should serve as a guide for other MTFs as well as US Department of Veterans Affairs facilities that could institute similar process improvements.
Conclusion
We made easily implemented and durable process improvement interventions that changed institution-wide ordering practices. These changes dramatically increased the rate of guideline-concordant testing, decreasing cost and furthering the goal of high-value medical care.
1. Anderson JL, Heidenreich PA, Barnett PG, et al; ACC/AHA Task Force on Performance Measures; ACC/AHA Task Force on Practice Guidelines. ACC/AHA statement on cost/value methodology in clinical practice guidelines and performance measures: a report of the American College of Cardiology/American Heart Association Task Force on Performance Measures and Task Force on Practice Guidelines. Circulation. 2014;129(22):2329-2345.
2. Centers for Disease Control and Prevention, National Center for Health Statistics. National hospital ambulatory medical care survey: 2010 emergency department summary tables. https://www.cdc.gov/nchs/data/ahcd/nhamcs_emergency/2010_ed_web_tables.pdf. Accessed March 15, 2019.
3. Morrow DA, Cannon CP, Jesse RL, et al; National Academy of Clinical Biochemistry. National Academy of Clinical Biochemistry Laboratory Medicine Practice Guidelines: Clinical characteristics and utilization of biochemical markers in acute coronary syndromes. Circulation. 2007;115(13):e356-e375.
4. Larochelle MR, Knight AM, Pantle H, Riedel S, Trost JC. Reducing excess cardiac biomarker testing at an academic medical center. J Gen Intern Med. 2014;29(11):1468-1474.
5. Centers for Medicare and Medicaid Services. 2016 clinical laboratory fee schedule. https://www.cms.gov/Medicare/Medicare-Fee -for-Service-Payment/ClinicalLabFeeSched/Clinical-Laboratory-Fee-Schedule-Files-Items/16CLAB.html?DLPage=1&DLEntries=10&DLSort=2&DLSortDir=descending. Accessed March 15, 2019.
The Current State of Advanced Practice Provider Fellowships in Hospital Medicine: A Survey of Program Directors
Postgraduate training for physician assistants (PAs) and nurse practitioners (NPs) is a rapidly evolving field. It has been estimated that the number of these advanced practice providers (APPs) almost doubled between 2000 and 2016 (from 15.3 to 28.2 per 100 physicians) and is expected to double again by 2030.
Historically, postgraduate APP fellowships have functioned to help bridge the gap in clinical practice experience between physicians and APPs.
First described in 2010 by the Mayo Clinic,
METHODS
This was a cross-sectional study of all APP adult and pediatric fellowships in hospital medicine, in the United States, that were identifiable through May 2018. Multiple methods were used to identify all active fellowships. First, all training programs offering a Hospital Medicine Fellowship in the ARC-PA and Association of Postgraduate PA Programs databases were noted. Second, questionnaires were given out at the NP/PA forum at the national SHM conference in 2018 to gather information on existing APP fellowships. Third, similar online requests to identify known programs were posted to the SHM web forum Hospital Medicine Exchange (HMX). Fourth, Internet searches were used to discover additional programs. Once those fellowships were identified, surveys were sent to their program directors (PDs). These surveys not only asked the PDs about their fellowship but also asked them to identify additional APP fellowships beyond those that we had captured. Once additional programs were identified, a second round of surveys was sent to their PDs. This was performed in an iterative fashion until no additional fellowships were discovered.
The survey tool was developed and validated internally in the AAMC Survey Development style18 and was influenced by prior validated surveys of postgraduate medical fellowships.10,
A web-based survey format (Qualtrics) was used to distribute the questionnaire e-mail to the PDs. Follow up e-mail reminders were sent to all nonresponders to encourage full participation. Survey completion was voluntary; no financial incentives or gifts were offered. IRB approval was obtained at Johns Hopkins Bayview (IRB number 00181629). Descriptive statistics (proportions, means, and ranges as appropriate) were calculated for all variables. Stata 13 (StataCorp. 2013. Stata Statistical Software: Release 13. College Station, Texas. StataCorp LP) was used for data analysis.
RESULTS
In total, 11 fellowships were identified using our multimethod approach. We found four (36%) programs by utilizing existing online databases, two (18%) through the SHM questionnaire and HMX forum, three (27%) through internet searches, and the remaining two (18%) were referred to us by the other PDs who were surveyed. Of the programs surveyed, 10 were adult programs and one was a pediatric program. Surveys were sent to the PDs of the 11 fellowships, and all but one of them (10/11, 91%) responded. Respondent programs were given alphabetical designations A through J (Table). 
Fellowship and Individual Characteristics
Most programs have been in existence for five years or fewer. Eighty percent of the programs are about one year in duration; two outlier programs have fellowship lengths of six months and 18 months. The main hospital where training occurs has a mean of 496 beds (range 213 to 900). Ninety percent of the hospitals also have physician residency training programs. Sixty percent of programs enroll two to four fellows per year while 40% enroll five or more. The salary range paid by the programs is $55,000 to >$70,000, and half the programs pay more than $65,000.
The majority of fellows accepted into APP fellowships in hospital medicine are women. Eighty percent of fellows are 26-30 years old, and 90% of fellows have been out of NP or PA school for one year or less. Both NP and PA applicants are accepted in 80% of fellowships.
Program Rationales
All programs reported that training and retaining applicants is the main driver for developing their fellowship, and 50% of them offer financial incentives for retention upon successful completion of the program. Forty percent of PDs stated that there is an implicit or explicit understanding that successful completion of the fellowship would result in further employment. Over the last five years, 89% (range: 71%-100%) of graduates were asked to remain for a full-time position after program completion.
In addition to training and retention, building an interprofessional team (50%), managing patient volume (30%), and reducing overhead (20%) were also reported as rationales for program development. The majority of programs (80%) have fellows bill for clinical services, and five of those eight programs do so after their fellows become more clinically competent.
Curricula
Of the nine adult programs, 67% teach explicitly to SHM core competencies and 33% send their fellows to the SHM NP/PA Boot Camp. Thirty percent of fellowships partner formally with either a physician residency or a local PA program to develop educational content. Six of the nine programs with active physician residencies, including the pediatric fellowship, offer shared educational experiences for the residents and APPs.
There are notable differences in clinical rotations between the programs (Figure 1). No single rotation is universally required, although general hospital internal medicine is required in all adult fellowships. The majority (80%) of programs offer at least one elective. Six programs reported mandatory rotations outside the department of medicine, most commonly neurology or the stroke service (four programs). Only one program reported only general medicine rotations, with no subspecialty electives.
There are also differences between programs with respect to educational experiences and learning formats (Figure 2). Each fellowship takes a unique approach to clinical instruction; teaching rounds and lecture attendance are the only experiences that are mandatory across the board. Grand rounds are available, but not required, in all programs. Ninety percent of programs offer or require fellow presentations, journal clubs, reading assignments, or scholarly projects. Fellow presentations (70%) and journal club attendance (60%) are required in more than half the programs; however, reading assignments (30%) and scholarly projects (20%) are rarely required.
Methods of Fellow Assessment
Each program surveyed has a unique method of fellow assessment. Ninety percent of the programs use more than one method to assess their fellows. Faculty reviews are most commonly used and are conducted in all rotations in 80% of fellowships. Both self-assessment exercises and written examinations are used in some rotations by the majority of programs. Capstone projects are required infrequently (30%).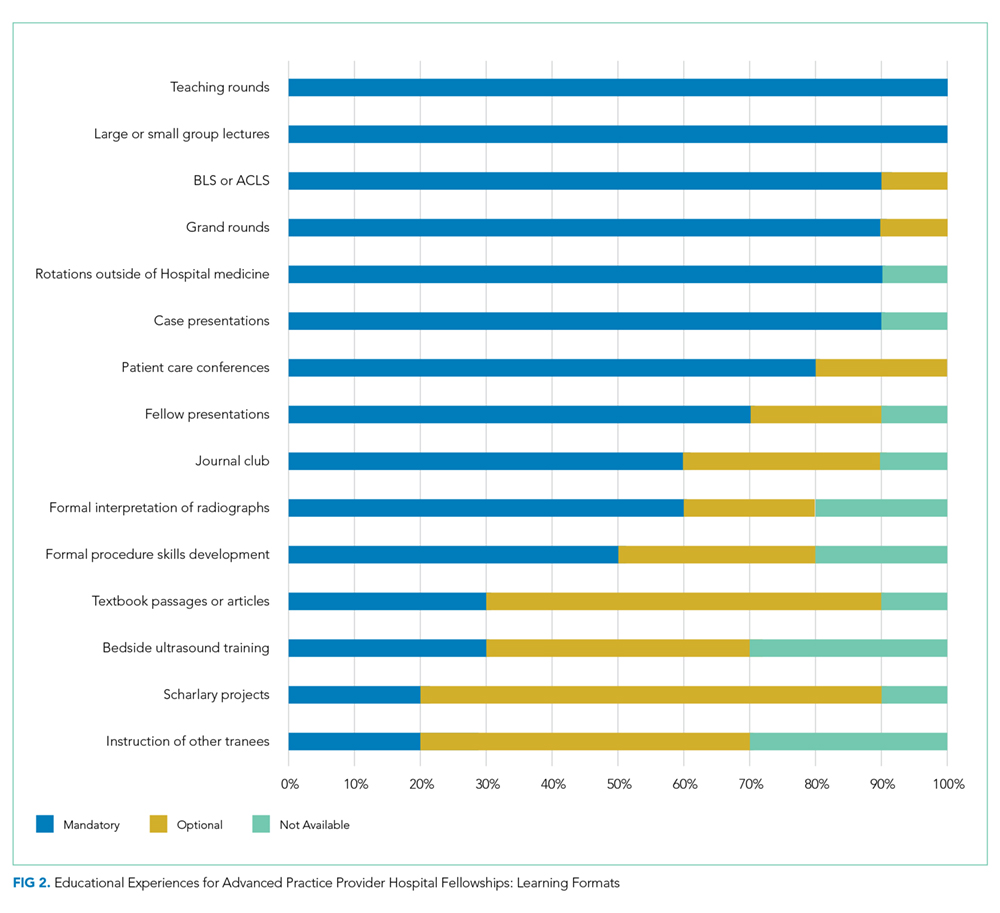
DISCUSSION
We found several commonalities between the fellowships surveyed. Many of the program characteristics, such as years in operation, salary, duration, and lack of accreditation, are quite similar. Most fellowships also have a similar rationale for building their programs and use resources from the SHM to inform their curricula. Fellows, on average, share several demographic characteristics, such as age, gender, and time out of schooling. Conversely, we found wide variability in clinical rotations, the general teaching structure, and methods of fellow evaluation.
There have been several publications detailing successful individual APP fellowships in medical subspecialties,
It is noteworthy that every program surveyed was created with training and retention in mind, rather than other factors like decreasing overhead or managing patient volume. Training one’s own APPs so that they can learn on the job, come to understand expectations within a group, and witness the culture is extremely valuable. From a patient safety standpoint, it has been documented that physician hospitalists straight out of residency have a higher patient mortality compared with more experienced providers.
Several limitations to this study should be considered. While we used multiple strategies to locate as many fellowships as possible, it is unlikely that we successfully captured all existing programs, and new programs are being developed annually. We also relied on self-reported data from PDs. While we would expect PDs to provide accurate data, we could not externally validate their answers. Additionally, although our survey tool was reviewed extensively and validated internally, it was developed de novo for this study.
CONCLUSION
APP fellowships in hospital medicine have experienced marked growth since the first program was described in 2010. The majority of programs are 12 months long, operate in existing teaching centers, and are intended to further enhance the training and retention of newly graduated PAs and NPs. Despite their similarities, fellowships have striking variability in their methods of teaching and assessing their learners. Best practices have yet to be identified, and further study is required to determine how to standardize curricula across the board.
Acknowledgments
Disclosures
The authors report no conflicts of interest.
Funding
This project was supported by the Johns Hopkins School of Medicine Biostatistics, Epidemiology and Data Management (BEAD) Core. Dr. Wright is the Anne Gaines and G. Thomas Miller Professor of Medicine, which is supported through the Johns Hopkins’ Center for Innovative Medicine.
1. Auerbach DI, Staiger DO, Buerhaus PI. Growing ranks of advanced practice clinicians — implications for the physician workforce. N Engl J Med. 2018;378(25):2358-2360. doi: 10.1056/nejmp1801869. PubMed
2. Darves B. Midlevels make a rocky entrance into hospital medicine. Todays Hospitalist. 2007;5(1):28-32.
3. Polansky M. A historical perspective on postgraduate physician assistant education and the association of postgraduate physician assistant programs. J Physician Assist Educ. 2007;18(3):100-108. doi: 10.1097/01367895-200718030-00014.
4. FNP & AGNP Certification Candidate Handbook. The American Academy of Nurse Practitioners National Certification Board, Inc; 2018. https://www.aanpcert.org/resource/documents/AGNP FNP Candidate Handbook.pdf. Accessed December 20, 2018
5. Become a PA: Getting Your Prerequisites and Certification. AAPA. https://www.aapa.org/career-central/become-a-pa/. Accessed December 20, 2018.
6. ACGME Common Program Requirements. ACGME; 2017. https://www.acgme.org/Portals/0/PFAssets/ProgramRequirements/CPRs_2017-07-01.pdf. Accessed December 20, 2018
7. Committee on the Learning Health Care System in America; Institute of Medicine, Smith MD, Smith M, Saunders R, Stuckhardt L, McGinnis JM. Best Care at Lower Cost: The Path to Continuously Learning Health Care in America. Washington, DC: National Academies Press; 2013. PubMed
8. The Future of Nursing LEADING CHANGE, ADVANCING HEALTH. THE NATIONAL ACADEMIES PRESS; 2014. https://www.nap.edu/read/12956/chapter/1. Accessed December 16, 2018.
9. Hussaini SS, Bushardt RL, Gonsalves WC, et al. Accreditation and implications of clinical postgraduate pa training programs. JAAPA. 2016:29:1-7. doi: 10.1097/01.jaa.0000482298.17821.fb. PubMed
10. Polansky M, Garver GJH, Hilton G. Postgraduate clinical education of physician assistants. J Physician Assist Educ. 2012;23(1):39-45. doi: 10.1097/01367895-201223010-00008.
11. Will KK, Budavari AI, Wilkens JA, Mishark K, Hartsell ZC. A hospitalist postgraduate training program for physician assistants. J Hosp Med. 2010;5(2):94-98. doi: 10.1002/jhm.619. PubMed
12. Kartha A, Restuccia JD, Burgess JF, et al. Nurse practitioner and physician assistant scope of practice in 118 acute care hospitals. J Hosp Med. 2014;9(10):615-620. doi: 10.1002/jhm.2231. PubMed
13. Singh S, Fletcher KE, Schapira MM, et al. A comparison of outcomes of general medical inpatient care provided by a hospitalist-physician assistant model vs a traditional resident-based model. J Hosp Med. 2011;6(3):122-130. doi: 10.1002/jhm.826. PubMed
14. Hussaini SS, Bushardt RL, Gonsalves WC, et al. Accreditation and implications of clinical postgraduate PA training programs. JAAPA. 2016;29(5):1-7. doi: 10.1097/01.jaa.0000482298.17821.fb. PubMed
15. Postgraduate Programs. ARC-PA. http://www.arc-pa.org/accreditation/postgraduate-programs. Accessed September 13, 2018.
16. National Nurse Practitioner Residency & Fellowship Training Consortium: Mission. https://www.nppostgradtraining.com/About-Us/Mission. Accessed September 27, 2018.
17. NP/PA Boot Camp. State of Hospital Medicine | Society of Hospital Medicine. http://www.hospitalmedicine.org/events/nppa-boot-camp. Accessed September 13, 2018.
18. Gehlbach H, Artino Jr AR, Durning SJ. AM last page: survey development guidance for medical education researchers. Acad Med. 2010;85(5):925. doi: 10.1097/ACM.0b013e3181dd3e88.” Accessed March 10, 2018. PubMed
19. Kraus C, Carlisle T, Carney D. Emergency Medicine Physician Assistant (EMPA) post-graduate training programs: program characteristics and training curricula. West J Emerg Med. 2018;19(5):803-807. doi: 10.5811/westjem.2018.6.37892.
20. Shah NH, Rhim HJH, Maniscalco J, Wilson K, Rassbach C. The current state of pediatric hospital medicine fellowships: A survey of program directors. J Hosp Med. 2016;11(5):324-328. doi: 10.1002/jhm.2571. PubMed
21. Thompson BM, Searle NS, Gruppen LD, Hatem CJ, Nelson E. A national survey of medical education fellowships. Med Educ Online. 2011;16(1):5642. doi: 10.3402/meo.v16i0.5642. PubMed
22. Hooker R. A physician assistant rheumatology fellowship. JAAPA. 2013;26(6):49-52. doi: 10.1097/01.jaa.0000430346.04435.e4 PubMed
23. Keizer T, Trangle M. the benefits of a physician assistant and/or nurse practitioner psychiatric postgraduate training program. Acad Psychiatry. 2015;39(6):691-694. doi: 10.1007/s40596-015-0331-z. PubMed
24. Miller A, Weiss J, Hill V, Lindaman K, Emory C. Implementation of a postgraduate orthopaedic physician assistant fellowship for improved specialty training. JBJS Journal of Orthopaedics for Physician Assistants. 2017:1. doi: 10.2106/jbjs.jopa.17.00021.
25. Sharma P, Brooks M, Roomiany P, Verma L, Criscione-Schreiber L. physician assistant student training for the inpatient setting. J Physician Assist Educ. 2017;28(4):189-195. doi: 10.1097/jpa.0000000000000174. PubMed
26. Goodwin JS, Salameh H, Zhou J, Singh S, Kuo Y-F, Nattinger AB. Association of hospitalist years of experience with mortality in the hospitalized medicare population. JAMA Intern Med. 2018;178(2):196. doi: 10.1001/jamainternmed.2017.7049. PubMed
27. Barnes H. Exploring the factors that influence nurse practitioner role transition. J Nurse Pract. 2015;11(2):178-183. doi: 10.1016/j.nurpra.2014.11.004. PubMed
28. Will K, Williams J, Hilton G, Wilson L, Geyer H. Perceived efficacy and utility of postgraduate physician assistant training programs. JAAPA. 2016;29(3):46-48. doi: 10.1097/01.jaa.0000480569.39885.c8. PubMed
29. Torok H, Lackner C, Landis R, Wright S. Learning needs of physician assistants working in hospital medicine. J Hosp Med. 2011;7(3):190-194. doi: 10.1002/jhm.1001. PubMed
30. Cate O. Competency-based postgraduate medical education: past, present and future. GMS J Med Educ. 2017:34(5). doi: 10.3205/zma001146. PubMed
31. Exploring the ACGME Core Competencies (Part 1 of 7). NEJM Knowledge. https://knowledgeplus.nejm.org/blog/exploring-acgme-core-competencies/. Accessed October 24, 2018.
32. Core Competencies. Core Competencies | Society of Hospital Medicine. http://www.hospitalmedicine.org/professional-development/core-competencies/. Accessed October 24, 2018.
Postgraduate training for physician assistants (PAs) and nurse practitioners (NPs) is a rapidly evolving field. It has been estimated that the number of these advanced practice providers (APPs) almost doubled between 2000 and 2016 (from 15.3 to 28.2 per 100 physicians) and is expected to double again by 2030.
Historically, postgraduate APP fellowships have functioned to help bridge the gap in clinical practice experience between physicians and APPs.
First described in 2010 by the Mayo Clinic,
METHODS
This was a cross-sectional study of all APP adult and pediatric fellowships in hospital medicine, in the United States, that were identifiable through May 2018. Multiple methods were used to identify all active fellowships. First, all training programs offering a Hospital Medicine Fellowship in the ARC-PA and Association of Postgraduate PA Programs databases were noted. Second, questionnaires were given out at the NP/PA forum at the national SHM conference in 2018 to gather information on existing APP fellowships. Third, similar online requests to identify known programs were posted to the SHM web forum Hospital Medicine Exchange (HMX). Fourth, Internet searches were used to discover additional programs. Once those fellowships were identified, surveys were sent to their program directors (PDs). These surveys not only asked the PDs about their fellowship but also asked them to identify additional APP fellowships beyond those that we had captured. Once additional programs were identified, a second round of surveys was sent to their PDs. This was performed in an iterative fashion until no additional fellowships were discovered.
The survey tool was developed and validated internally in the AAMC Survey Development style18 and was influenced by prior validated surveys of postgraduate medical fellowships.10,
A web-based survey format (Qualtrics) was used to distribute the questionnaire e-mail to the PDs. Follow up e-mail reminders were sent to all nonresponders to encourage full participation. Survey completion was voluntary; no financial incentives or gifts were offered. IRB approval was obtained at Johns Hopkins Bayview (IRB number 00181629). Descriptive statistics (proportions, means, and ranges as appropriate) were calculated for all variables. Stata 13 (StataCorp. 2013. Stata Statistical Software: Release 13. College Station, Texas. StataCorp LP) was used for data analysis.
RESULTS
In total, 11 fellowships were identified using our multimethod approach. We found four (36%) programs by utilizing existing online databases, two (18%) through the SHM questionnaire and HMX forum, three (27%) through internet searches, and the remaining two (18%) were referred to us by the other PDs who were surveyed. Of the programs surveyed, 10 were adult programs and one was a pediatric program. Surveys were sent to the PDs of the 11 fellowships, and all but one of them (10/11, 91%) responded. Respondent programs were given alphabetical designations A through J (Table).
Fellowship and Individual Characteristics
Most programs have been in existence for five years or fewer. Eighty percent of the programs are about one year in duration; two outlier programs have fellowship lengths of six months and 18 months. The main hospital where training occurs has a mean of 496 beds (range 213 to 900). Ninety percent of the hospitals also have physician residency training programs. Sixty percent of programs enroll two to four fellows per year while 40% enroll five or more. The salary range paid by the programs is $55,000 to >$70,000, and half the programs pay more than $65,000.
The majority of fellows accepted into APP fellowships in hospital medicine are women. Eighty percent of fellows are 26-30 years old, and 90% of fellows have been out of NP or PA school for one year or less. Both NP and PA applicants are accepted in 80% of fellowships.
Program Rationales
All programs reported that training and retaining applicants is the main driver for developing their fellowship, and 50% of them offer financial incentives for retention upon successful completion of the program. Forty percent of PDs stated that there is an implicit or explicit understanding that successful completion of the fellowship would result in further employment. Over the last five years, 89% (range: 71%-100%) of graduates were asked to remain for a full-time position after program completion.
In addition to training and retention, building an interprofessional team (50%), managing patient volume (30%), and reducing overhead (20%) were also reported as rationales for program development. The majority of programs (80%) have fellows bill for clinical services, and five of those eight programs do so after their fellows become more clinically competent.
Curricula
Of the nine adult programs, 67% teach explicitly to SHM core competencies and 33% send their fellows to the SHM NP/PA Boot Camp. Thirty percent of fellowships partner formally with either a physician residency or a local PA program to develop educational content. Six of the nine programs with active physician residencies, including the pediatric fellowship, offer shared educational experiences for the residents and APPs.
There are notable differences in clinical rotations between the programs (Figure 1). No single rotation is universally required, although general hospital internal medicine is required in all adult fellowships. The majority (80%) of programs offer at least one elective. Six programs reported mandatory rotations outside the department of medicine, most commonly neurology or the stroke service (four programs). Only one program reported only general medicine rotations, with no subspecialty electives.
There are also differences between programs with respect to educational experiences and learning formats (Figure 2). Each fellowship takes a unique approach to clinical instruction; teaching rounds and lecture attendance are the only experiences that are mandatory across the board. Grand rounds are available, but not required, in all programs. Ninety percent of programs offer or require fellow presentations, journal clubs, reading assignments, or scholarly projects. Fellow presentations (70%) and journal club attendance (60%) are required in more than half the programs; however, reading assignments (30%) and scholarly projects (20%) are rarely required.
Methods of Fellow Assessment
Each program surveyed has a unique method of fellow assessment. Ninety percent of the programs use more than one method to assess their fellows. Faculty reviews are most commonly used and are conducted in all rotations in 80% of fellowships. Both self-assessment exercises and written examinations are used in some rotations by the majority of programs. Capstone projects are required infrequently (30%).
DISCUSSION
We found several commonalities between the fellowships surveyed. Many of the program characteristics, such as years in operation, salary, duration, and lack of accreditation, are quite similar. Most fellowships also have a similar rationale for building their programs and use resources from the SHM to inform their curricula. Fellows, on average, share several demographic characteristics, such as age, gender, and time out of schooling. Conversely, we found wide variability in clinical rotations, the general teaching structure, and methods of fellow evaluation.
There have been several publications detailing successful individual APP fellowships in medical subspecialties,
It is noteworthy that every program surveyed was created with training and retention in mind, rather than other factors like decreasing overhead or managing patient volume. Training one’s own APPs so that they can learn on the job, come to understand expectations within a group, and witness the culture is extremely valuable. From a patient safety standpoint, it has been documented that physician hospitalists straight out of residency have a higher patient mortality compared with more experienced providers.
Several limitations to this study should be considered. While we used multiple strategies to locate as many fellowships as possible, it is unlikely that we successfully captured all existing programs, and new programs are being developed annually. We also relied on self-reported data from PDs. While we would expect PDs to provide accurate data, we could not externally validate their answers. Additionally, although our survey tool was reviewed extensively and validated internally, it was developed de novo for this study.
CONCLUSION
APP fellowships in hospital medicine have experienced marked growth since the first program was described in 2010. The majority of programs are 12 months long, operate in existing teaching centers, and are intended to further enhance the training and retention of newly graduated PAs and NPs. Despite their similarities, fellowships have striking variability in their methods of teaching and assessing their learners. Best practices have yet to be identified, and further study is required to determine how to standardize curricula across the board.
Acknowledgments
Disclosures
The authors report no conflicts of interest.
Funding
This project was supported by the Johns Hopkins School of Medicine Biostatistics, Epidemiology and Data Management (BEAD) Core. Dr. Wright is the Anne Gaines and G. Thomas Miller Professor of Medicine, which is supported through the Johns Hopkins’ Center for Innovative Medicine.
1. Auerbach DI, Staiger DO, Buerhaus PI. Growing ranks of advanced practice clinicians — implications for the physician workforce. N Engl J Med. 2018;378(25):2358-2360. doi: 10.1056/nejmp1801869. PubMed
2. Darves B. Midlevels make a rocky entrance into hospital medicine. Todays Hospitalist. 2007;5(1):28-32.
3. Polansky M. A historical perspective on postgraduate physician assistant education and the association of postgraduate physician assistant programs. J Physician Assist Educ. 2007;18(3):100-108. doi: 10.1097/01367895-200718030-00014.
4. FNP & AGNP Certification Candidate Handbook. The American Academy of Nurse Practitioners National Certification Board, Inc; 2018. https://www.aanpcert.org/resource/documents/AGNP FNP Candidate Handbook.pdf. Accessed December 20, 2018
5. Become a PA: Getting Your Prerequisites and Certification. AAPA. https://www.aapa.org/career-central/become-a-pa/. Accessed December 20, 2018.
6. ACGME Common Program Requirements. ACGME; 2017. https://www.acgme.org/Portals/0/PFAssets/ProgramRequirements/CPRs_2017-07-01.pdf. Accessed December 20, 2018
7. Committee on the Learning Health Care System in America; Institute of Medicine, Smith MD, Smith M, Saunders R, Stuckhardt L, McGinnis JM. Best Care at Lower Cost: The Path to Continuously Learning Health Care in America. Washington, DC: National Academies Press; 2013. PubMed
8. The Future of Nursing LEADING CHANGE, ADVANCING HEALTH. THE NATIONAL ACADEMIES PRESS; 2014. https://www.nap.edu/read/12956/chapter/1. Accessed December 16, 2018.
9. Hussaini SS, Bushardt RL, Gonsalves WC, et al. Accreditation and implications of clinical postgraduate pa training programs. JAAPA. 2016:29:1-7. doi: 10.1097/01.jaa.0000482298.17821.fb. PubMed
10. Polansky M, Garver GJH, Hilton G. Postgraduate clinical education of physician assistants. J Physician Assist Educ. 2012;23(1):39-45. doi: 10.1097/01367895-201223010-00008.
11. Will KK, Budavari AI, Wilkens JA, Mishark K, Hartsell ZC. A hospitalist postgraduate training program for physician assistants. J Hosp Med. 2010;5(2):94-98. doi: 10.1002/jhm.619. PubMed
12. Kartha A, Restuccia JD, Burgess JF, et al. Nurse practitioner and physician assistant scope of practice in 118 acute care hospitals. J Hosp Med. 2014;9(10):615-620. doi: 10.1002/jhm.2231. PubMed
13. Singh S, Fletcher KE, Schapira MM, et al. A comparison of outcomes of general medical inpatient care provided by a hospitalist-physician assistant model vs a traditional resident-based model. J Hosp Med. 2011;6(3):122-130. doi: 10.1002/jhm.826. PubMed
14. Hussaini SS, Bushardt RL, Gonsalves WC, et al. Accreditation and implications of clinical postgraduate PA training programs. JAAPA. 2016;29(5):1-7. doi: 10.1097/01.jaa.0000482298.17821.fb. PubMed
15. Postgraduate Programs. ARC-PA. http://www.arc-pa.org/accreditation/postgraduate-programs. Accessed September 13, 2018.
16. National Nurse Practitioner Residency & Fellowship Training Consortium: Mission. https://www.nppostgradtraining.com/About-Us/Mission. Accessed September 27, 2018.
17. NP/PA Boot Camp. State of Hospital Medicine | Society of Hospital Medicine. http://www.hospitalmedicine.org/events/nppa-boot-camp. Accessed September 13, 2018.
18. Gehlbach H, Artino Jr AR, Durning SJ. AM last page: survey development guidance for medical education researchers. Acad Med. 2010;85(5):925. doi: 10.1097/ACM.0b013e3181dd3e88.” Accessed March 10, 2018. PubMed
19. Kraus C, Carlisle T, Carney D. Emergency Medicine Physician Assistant (EMPA) post-graduate training programs: program characteristics and training curricula. West J Emerg Med. 2018;19(5):803-807. doi: 10.5811/westjem.2018.6.37892.
20. Shah NH, Rhim HJH, Maniscalco J, Wilson K, Rassbach C. The current state of pediatric hospital medicine fellowships: A survey of program directors. J Hosp Med. 2016;11(5):324-328. doi: 10.1002/jhm.2571. PubMed
21. Thompson BM, Searle NS, Gruppen LD, Hatem CJ, Nelson E. A national survey of medical education fellowships. Med Educ Online. 2011;16(1):5642. doi: 10.3402/meo.v16i0.5642. PubMed
22. Hooker R. A physician assistant rheumatology fellowship. JAAPA. 2013;26(6):49-52. doi: 10.1097/01.jaa.0000430346.04435.e4 PubMed
23. Keizer T, Trangle M. the benefits of a physician assistant and/or nurse practitioner psychiatric postgraduate training program. Acad Psychiatry. 2015;39(6):691-694. doi: 10.1007/s40596-015-0331-z. PubMed
24. Miller A, Weiss J, Hill V, Lindaman K, Emory C. Implementation of a postgraduate orthopaedic physician assistant fellowship for improved specialty training. JBJS Journal of Orthopaedics for Physician Assistants. 2017:1. doi: 10.2106/jbjs.jopa.17.00021.
25. Sharma P, Brooks M, Roomiany P, Verma L, Criscione-Schreiber L. physician assistant student training for the inpatient setting. J Physician Assist Educ. 2017;28(4):189-195. doi: 10.1097/jpa.0000000000000174. PubMed
26. Goodwin JS, Salameh H, Zhou J, Singh S, Kuo Y-F, Nattinger AB. Association of hospitalist years of experience with mortality in the hospitalized medicare population. JAMA Intern Med. 2018;178(2):196. doi: 10.1001/jamainternmed.2017.7049. PubMed
27. Barnes H. Exploring the factors that influence nurse practitioner role transition. J Nurse Pract. 2015;11(2):178-183. doi: 10.1016/j.nurpra.2014.11.004. PubMed
28. Will K, Williams J, Hilton G, Wilson L, Geyer H. Perceived efficacy and utility of postgraduate physician assistant training programs. JAAPA. 2016;29(3):46-48. doi: 10.1097/01.jaa.0000480569.39885.c8. PubMed
29. Torok H, Lackner C, Landis R, Wright S. Learning needs of physician assistants working in hospital medicine. J Hosp Med. 2011;7(3):190-194. doi: 10.1002/jhm.1001. PubMed
30. Cate O. Competency-based postgraduate medical education: past, present and future. GMS J Med Educ. 2017:34(5). doi: 10.3205/zma001146. PubMed
31. Exploring the ACGME Core Competencies (Part 1 of 7). NEJM Knowledge. https://knowledgeplus.nejm.org/blog/exploring-acgme-core-competencies/. Accessed October 24, 2018.
32. Core Competencies. Core Competencies | Society of Hospital Medicine. http://www.hospitalmedicine.org/professional-development/core-competencies/. Accessed October 24, 2018.
© 2019 Society of Hospital Medicine
Modifiable Factors Associated with Quality of Bowel Preparation Among Hospitalized Patients Undergoing Colonoscopy
Inadequate bowel preparation (IBP) at the time of inpatient colonoscopy is common and associated with increased length of stay and cost of care.1 The factors that contribute to IBP can be categorized into those that are modifiable and those that are nonmodifiable. While many factors have been associated with IBP, studies have been limited by small sample size or have combined inpatient/outpatient populations, thus limiting generalizability.1-5 Moreover, most factors associated with IBP, such as socioeconomic status, male gender, increased age, and comorbidities, are nonmodifiable. No studies have explicitly focused on modifiable risk factors, such as medication use, colonoscopy timing, or assessed the potential impact of modifying these factors.
In a large, multihospital system, we examine the frequency of IBP among inpatients undergoing colonoscopy along with factors associated with IBP. We attempted to identify
METHODS
Potential Predictors of IBP
Demographic data such as patient age, gender, ethnicity, body mass index (BMI), and insurance/payor status were obtained from the electronic health record (EHR). International Classification of Disease 9th and 10th revision, Clinical Modifications (ICD-9/10-CM) codes were used to obtain patient comorbidities including diabetes, coronary artery disease, heart failure, cirrhosis, gastroparesis, hypothyroidism, inflammatory bowel disease, constipation, stroke, dementia, dysphagia, and nausea/vomiting. Use of opioid medications within three days before colonoscopy was extracted from the medication administration record. These variables were chosen as biologically plausible modifiers of bowel preparation or had previously been assessed in the literature.1-6 The name and volume, classified as 4 L (GoLytely®) and < 4 liters (MoviPrep®) of bowel preparation, time of day when colonoscopy was performed, solid diet the day prior to colonoscopy, type of sedation used (conscious sedation or general anesthesia), and total colonoscopy time (defined as the time from scope insertion to removal) was recorded. Hospitalization-related variables, including the number of hospitalizations in the year before the current hospitalization, the year in which the colonoscopy was performed, and the number of days from admission to colonoscopy, were also obtained from the EHR.
Outcome Measures
An internally validated natural language algorithm, using Structured Queried Language was used to search through colonoscopy reports to identify adequacy of bowel preparation. ProVation® software allows the gastroenterologist to use some terms to describe bowel preparation in a drop-down menu format. In addition to the Aronchik scale (which allows the gastroenterologist to rate bowel preparation on a five-point scale: “excellent,” “good,” “fair,” “poor,” and “inadequate”) it also allows the provider to use terms such as “adequate” or “adequate to detect polyps >5 mm” as well as “unsatisfactory.”7 Mirroring prior literature, bowel preparation quality was classified into “adequate” and “inadequate”; “good” and “excellent” on the Aronchik scale were categorized as adequate as was the term “adequate” in any form; “fair,” “poor,” or “inadequate” on the Aronchik scale were classified as inadequate as was the term “unsatisfactory.” We evaluated the hospital length of stay (LOS) as a secondary outcome measure.
Statistical Analysis
After describing the frequency of IBP, the quality of bowel preparation (adequate vs inadequate) was compared based on the predictors described above. Categorical variables were reported as frequencies with percentages and continuous variables were reported as medians with 25th-75th percentile values. The significance of the difference between the proportion or median values of those who had inadequate versus adequate bowel preparation was assessed. Two-sided chi-square analysis was used to assess the significance of differences between categorical variables and the Wilcoxon Rank-Sum test was used to assess the significance of differences between continuous variables.
Multivariate logistic regression analysis was performed to assess factors associated with hospital predictors and outcomes, after adjusting for all the aforementioned factors and clustering the effect based on the endoscopist. To evaluate the potential impact of modifiable factors on IBP, we performed counterfactual analysis, in which the observed distribution was compared to a hypothetical population in which all the modifiable risk factors were optimal.
RESULTS
Overall, 8,819 patients were included in our study population. They had a median age of 64 [53-76] years; 50.5% were female and 51% had an IBP. Patient characteristics and rates of IBP are presented in Table 1.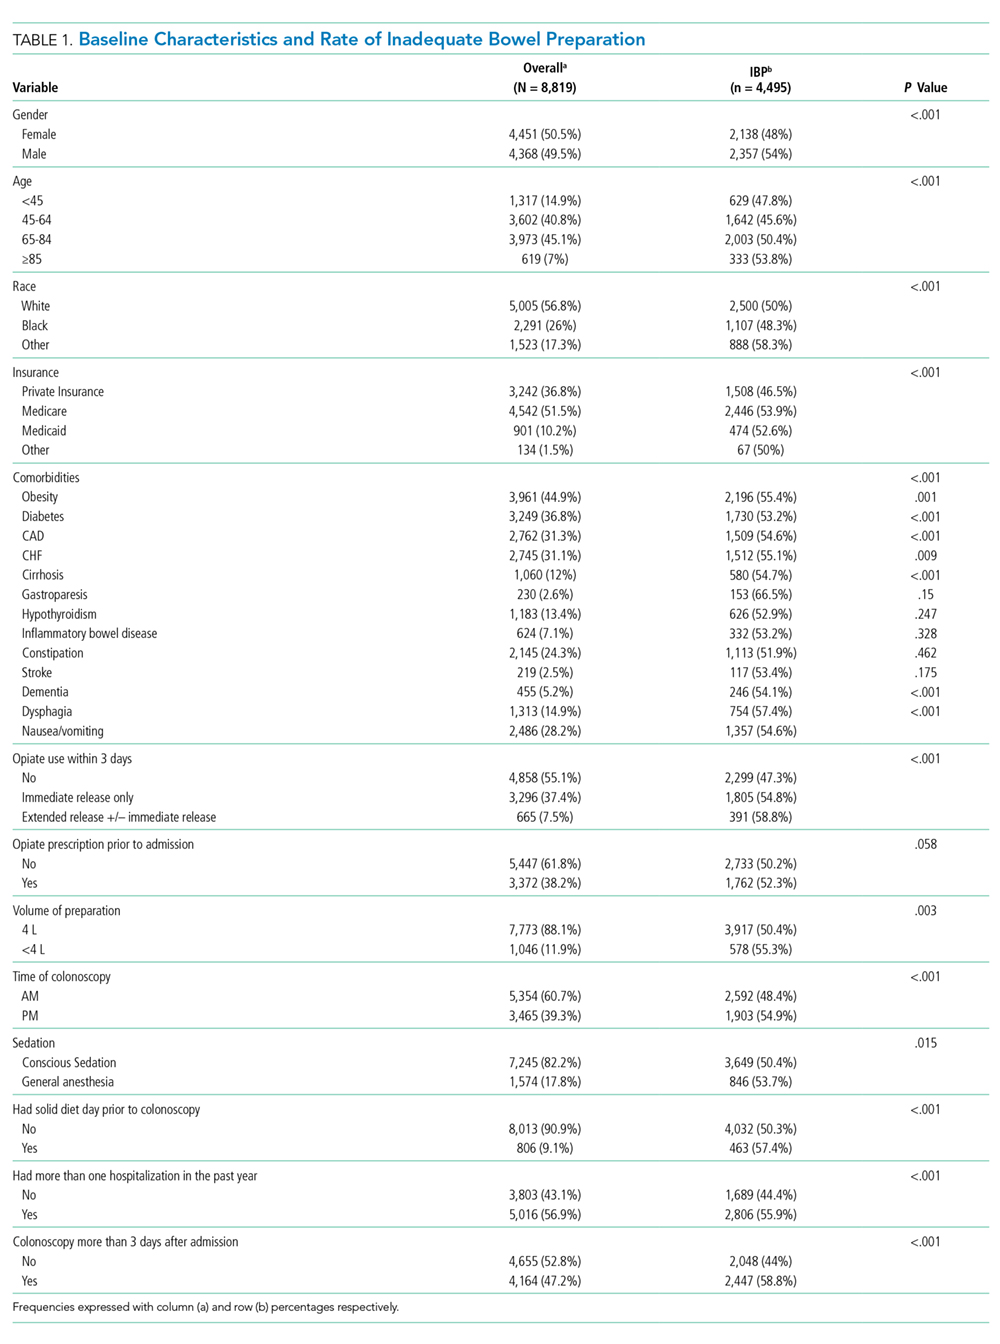
In unadjusted analyses, with regards to modifiable factors, opiate use within three days of colonoscopy was associated with a higher rate of IBP (55.4% vs 47.3%, P <.001), as was a lower volume (<4L) bowel preparation (55.3% vs 50.4%, P = .003). IBP was less frequent when colonoscopy was performed before noon vs afternoon (50.3% vs 57.4%, P < .001), and when patients were documented to receive a clear liquid diet or nil per os vs a solid diet the day prior to colonoscopy (50.3% vs 57.4%, P < .001). Overall bowel preparation quality improved over time (Figure 1). Median LOS was five [3-11] days. Patients who had IBP on their initial colonoscopy had a LOS one day longer than patients without IBP (six days vs five days, P < .001).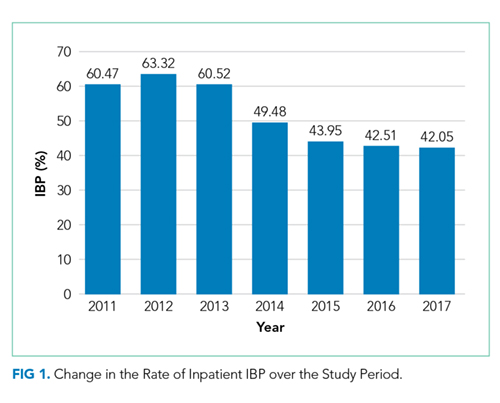
Multivariate Analysis
Table 2 shows the results of the multivariate analysis. The following modifiable factors were associated with IBP: opiate used within three days of the procedure (OR 1.31; 95% CI 1.8, 1.45), having the colonoscopy performed after12:00 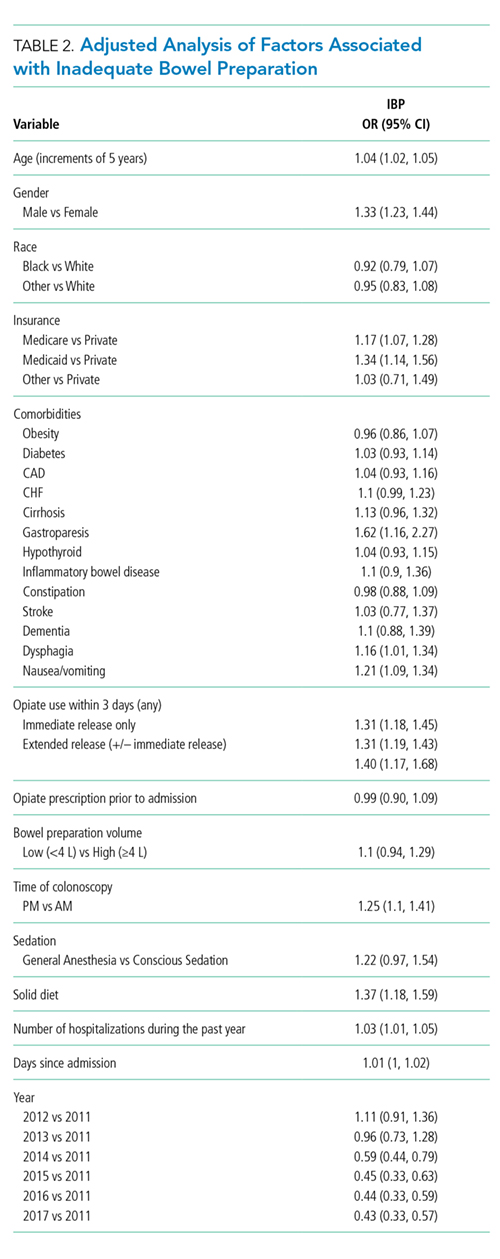
Potential Impact of Modifiable Variables
We conducted a counterfactual analysis based on a multivariate model to assess the impact of each modifiable risk factor on the IBP rate (Figure 1). In the included study population, 44.9% received an opiate, 39.3% had a colonoscopy after 12:00
DISCUSSION
In this large, multihospital cohort, IBP was documented in half (51%) of 8,819 inpatient colonoscopies performed. Nonmodifiable patient characteristics independently associated with IBP were age, male gender, white race, Medicare and Medicaid insurance, nausea/vomiting, dysphagia, and gastroparesis. Modifiable factors included not consuming opiates within three days of colonoscopy, avoidance of a solid diet the day prior to colonoscopy and performing the colonoscopy before noon. The volume of bowel preparation consumed was not associated with IBP. In a counterfactual analysis, we found that if all three modifiable factors were optimized, the predicted rate of IBP would drop to 45%.
Many studies, including our analysis, have shown significant differences between the frequency of IBP in inpatient versus outpatient bowel preparations.8-11 Therefore, it is crucial to study IBP in these settings separately. Three single-institution studies, including a total of 898 patients, have identified risk factors for inpatient IBP. Individual studies ranged in size from 130 to 524 patients with rates of IBP ranging from 22%-57%.1-3 They found IBP to be associated with increasing age, lower income, ASA Grade >3, diabetes, coronary artery disease (CAD), nausea or vomiting, BMI >25, and chronic constipation. Modifiable factors included opiates, afternoon procedures, and runway times >6 hours.
We also found IBP to be associated with increasing age and male gender. However, we found no association with diabetes, chronic constipation, CAD or BMI. As we were able to adjust for a wider variety of variables, it is possible that we were able to account for residual confounding better than previous studies. For example, we found that having nausea/vomiting, dysphagia, and gastroparesis was associated with IBP. Gastroparesis with associated nausea and vomiting may be the mechanism by which diabetes increases the risk for IBP. Further studies are needed to assess if interventions or alternative bowel cleansing in these patients can result in improved IBP. Finally, in contrast to studies with smaller cohorts which found that lower volume bowel preps improved IBP in the right colon,4,12 we found no association between IBP based and volume of bowel preparation consumed. Our impact analysis suggests that avoidance of opiates for at least three days before colonoscopy, avoidance of solid diet on the day before colonoscopy and performing all colonoscopies before noon would
The factors mentioned above may not always be amenable to modification. For example, for patients with active gastrointestinal bleeding, postponing colonoscopy by one day for the sake of maintaining a patient on a clear diet may not be feasible. Similarly, performing colonoscopies in the morning is highly dependent on endoscopy suite availability and hospital logistics. Denying opiates to patients experiencing severe pain is not ethical. In many scenarios, however, these variables could be modified, and institutional efforts to support these practices could yield considerable savings. Future prospective studies are needed to verify the real impact of these changes.
Further discussion is needed to contextualize the finding that colonoscopies scheduled in the afternoon are associated with improved bowel preparation quality. Previous research—albeit in the outpatient setting—has demonstrated 11.8 hours as the maximum upper time limit for the time elapsed between the end of bowel preparation to colonoscopy.14 Another study found an inverse relationship between the quality of bowel preparation and the time after completion of the bowel preparation.15 This makes sense from a physiological perspective as delaying the time between completion of bowel preparation, and the procedure allows chyme from the small intestine to reaccumulate in the colon. Anecdotally, at our institution as well as at many others, the bowel preparations are ordered to start in the evening to allow the consumption of complete bowel preparation by midnight. As a result of this practice, only patients who have their colonoscopies scheduled before noon fall within the optimal period of 11.8 hours. In the outpatient setting, the use of split preparations has led to the obliteration of the difference in the quality of bowel preparation between morning and afternoon colonoscopies.16 Prospective trials are needed to evaluate the use of split preparations to improve the quality of afternoon inpatient colonoscopies.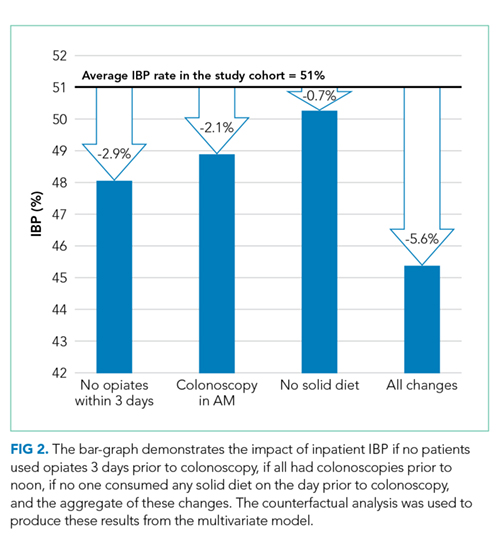
Few other strategies have been shown to mitigate IBP in the inpatient setting. In a small randomized controlled trial, Ergen et al. found that providing an educational booklet improved inpatient bowel preparation as measured by the Boston Bowel Preparation Scale.17 In a quasi-experimental design, Yadlapati et al. found that an automated split-dose bowel preparation resulted in decreased IBP, fewer repeated procedures, shorter LOS, and lower hospital cost.18 Our study adds to these tools by identifying three additional risk factors which could be optimized for inpatients. Because our findings are observational, they should be subjected to prospective trials. Our study also calls into question the impact of bowel preparation volume. We found no difference in the rate of IBP between low and large volume preparations. It is possible that other factors are more important than the specific preparation employed.
Interestingly, we found that IBP declined substantially in 2014 and continued to decline after that. The year was the most influential risk factor for IBP (on par with gastroparesis). The reason for this is unclear, as rates of our modifiable risk factors did not differ substantially by year. Other possibilities include improved access (including weekend access) to endoscopy coinciding with the development of a new endoscopy facility and use of integrated irrigation pump system instead of the use of manual syringes for flushing.
Our study has many strengths. It is by far the most extensive study of bowel preparation quality in inpatients to date and the only one that has included patient, procedural and bowel preparation characteristics. The study also has several significant limitations. This is a single center study, which could limit generalizability. Nonetheless, it was conducted within a health system with multiple hospitals in different parts of the United States (Ohio and Florida) and included a broad population mix with differing levels of acuity. The retrospective nature of the assessment precludes establishing causation. However, we mitigated confounding by adjusting for a wide variety of factors, and there is a plausible physiological mechanism for each of the factors we studied. Also, the retrospective nature of our study predisposes our data to omissions and misrepresentations during the documentation process. This is especially true with the use of ICD codes.19 Inaccuracies in coding are likely to bias toward the null, so observed associations may be an underestimate of the true association.
Our inability to ascertain if a patient completed the prescribed bowel preparation limited our ability to detect what may be a significant risk factor. Lastly, while clinically relevant, the Aronchik scale used to identify adequate from IBP has never been validated though it is frequently utilized and cited in the bowel preparation literature.20
CONCLUSIONS
In this large retrospective study evaluating bowel preparation quality in inpatients undergoing colonoscopy, we found that more than half of the patients have IBP and that IBP was associated with an extra day of hospitalization. Our study identifies those patients at highest risk and identifies modifiable risk factors for IBP. Specifically, we found that abstinence from opiates or solid diet before the colonoscopy, along with performing colonoscopies before noon were associated with improved outcomes. Prospective studies are needed to confirm the effects of these interventions on bowel preparation quality.
Disclosures
Carol A Burke, MD has received research funding from Ferring Pharmaceuticals. Other authors have no conflicts of interest to disclose.
1. Yadlapati R, Johnston ER, Gregory DL, Ciolino JD, Cooper A, Keswani RN. Predictors of inadequate inpatient colonoscopy preparation and its association with hospital length of stay and costs. Dig Dis Sci. 2015;60(11):3482-3490. doi: 10.1007/s10620-015-3761-2. PubMed
2. Jawa H, Mosli M, Alsamadani W, et al. Predictors of inadequate bowel preparation for inpatient colonoscopy. Turk J Gastroenterol. 2017;28(6):460-464. doi: 10.5152/tjg.2017.17196. PubMed
3. Mcnabb-Baltar J, Dorreen A, Dhahab HA, et al. Age is the only predictor of poor bowel preparation in the hospitalized patient. Can J Gastroenterol Hepatol. 2016;2016:1-5. doi: 10.1155/2016/2139264. PubMed
4. Rotondano G, Rispo A, Bottiglieri ME, et al. Tu1503 Quality of bowel cleansing in hospitalized patients is not worse than that of outpatients undergoing colonoscopy: results of a multicenter prospective regional study. Gastrointest Endosc. 2014;79(5):AB564. doi: 10.1016/j.gie.2014.02.949. PubMed
5. Ness R. Predictors of inadequate bowel preparation for colonoscopy. Am J Gastroenterol. 2001;96(6):1797-1802. doi: 10.1016/s0002-9270(01)02437-6. PubMed
6. Johnson DA, Barkun AN, Cohen LB, et al. Optimizing adequacy of bowel cleansing for colonoscopy: recommendations from the us multi-society task force on colorectal cancer. Gastroenterology. 2014;147(4):903-924. doi: 10.1053/j.gastro.2014.07.002. PubMed
7. Aronchick CA, Lipshutz WH, Wright SH, et al. A novel tableted purgative for colonoscopic preparation: efficacy and safety comparisons with Colyte and Fleet Phospho-Soda. Gastrointest Endosc. 2000;52(3):346-352. doi: 10.1067/mge.2000.108480. PubMed
8. Froehlich F, Wietlisbach V, Gonvers J-J, Burnand B, Vader J-P. Impact of colonic cleansing on quality and diagnostic yield of colonoscopy: the European Panel of Appropriateness of Gastrointestinal Endoscopy European multicenter study. Gastrointest Endosc. 2005;61(3):378-384. doi: 10.1016/s0016-5107(04)02776-2. PubMed
9. Sarvepalli S, Garber A, Rizk M, et al. 923 adjusted comparison of commercial bowel preparations based on inadequacy of bowel preparation in outpatient settings. Gastrointest Endosc. 2018;87(6):AB127. doi: 10.1016/j.gie.2018.04.1331.
10. Hendry PO, Jenkins JT, Diament RH. The impact of poor bowel preparation on colonoscopy: a prospective single center study of 10 571 colonoscopies. Colorectal Dis. 2007;9(8):745-748. doi: 10.1111/j.1463-1318.2007.01220.x. PubMed
11. Lebwohl B, Wang TC, Neugut AI. Socioeconomic and other predictors of colonoscopy preparation quality. Dig Dis Sci. 2010;55(7):2014-2020. doi: 10.1007/s10620-009-1079-7. PubMed
12. Chorev N, Chadad B, Segal N, et al. Preparation for colonoscopy in hospitalized patients. Dig Dis Sci. 2007;52(3):835-839. doi: 10.1007/s10620-006-9591-5. PubMed
13. Weiss AJ. Overview of Hospital Stays in the United States, 2012. HCUP Statistical Brief #180. Rockville, MD: Agency for Healthcare Research and Quality; 2014. PubMed
14. Kojecky V, Matous J, Keil R, et al. The optimal bowel preparation intervals before colonoscopy: a randomized study comparing polyethylene glycol and low-volume solutions. Dig Liver Dis. 2018;50(3):271-276. doi: 10.1016/j.dld.2017.10.010. PubMed
15. Siddiqui AA, Yang K, Spechler SJ, et al. Duration of the interval between the completion of bowel preparation and the start of colonoscopy predicts bowel-preparation quality. Gastrointest Endosc. 2009;69(3):700-706. doi: 10.1016/j.gie.2008.09.047. PubMed
16. Eun CS, Han DS, Hyun YS, et al. The timing of bowel preparation is more important than the timing of colonoscopy in determining the quality of bowel cleansing. Dig Dis Sci. 2010;56(2):539-544. doi: 10.1007/s10620-010-1457-1. PubMed
17. Ergen WF, Pasricha T, Hubbard FJ, et al. Providing hospitalized patients with an educational booklet increases the quality of colonoscopy bowel preparation. Clin Gastroenterol Hepatol. 2016;14(6):858-864. doi: 10.1016/j.cgh.2015.11.015. PubMed
18. Yadlapati R, Johnston ER, Gluskin AB, et al. An automated inpatient split-dose bowel preparation system improves colonoscopy quality and reduces repeat procedures. J Clin Gastroenterol. 2018;52(8):709-714. doi: 10.1097/mcg.0000000000000849. PubMed
19. Birman-Deych E, Waterman AD, Yan Y, Nilasena DS, Radford MJ, Gage BF. The accuracy of ICD-9-CM codes for identifying cardiovascular and stroke risk factors. Med Care. 2005;43(5):480-485. doi: 10.1097/01.mlr.0000160417.39497.a9. PubMed
20. Parmar R, Martel M, Rostom A, Barkun AN. Validated scales for colon cleansing: a systematic review. J Clin Gastroenterol. 2016;111(2):197-204. doi: 10.1038/ajg.2015.417. PubMed
Inadequate bowel preparation (IBP) at the time of inpatient colonoscopy is common and associated with increased length of stay and cost of care.1 The factors that contribute to IBP can be categorized into those that are modifiable and those that are nonmodifiable. While many factors have been associated with IBP, studies have been limited by small sample size or have combined inpatient/outpatient populations, thus limiting generalizability.1-5 Moreover, most factors associated with IBP, such as socioeconomic status, male gender, increased age, and comorbidities, are nonmodifiable. No studies have explicitly focused on modifiable risk factors, such as medication use, colonoscopy timing, or assessed the potential impact of modifying these factors.
In a large, multihospital system, we examine the frequency of IBP among inpatients undergoing colonoscopy along with factors associated with IBP. We attempted to identify
METHODS
Potential Predictors of IBP
Demographic data such as patient age, gender, ethnicity, body mass index (BMI), and insurance/payor status were obtained from the electronic health record (EHR). International Classification of Disease 9th and 10th revision, Clinical Modifications (ICD-9/10-CM) codes were used to obtain patient comorbidities including diabetes, coronary artery disease, heart failure, cirrhosis, gastroparesis, hypothyroidism, inflammatory bowel disease, constipation, stroke, dementia, dysphagia, and nausea/vomiting. Use of opioid medications within three days before colonoscopy was extracted from the medication administration record. These variables were chosen as biologically plausible modifiers of bowel preparation or had previously been assessed in the literature.1-6 The name and volume, classified as 4 L (GoLytely®) and < 4 liters (MoviPrep®) of bowel preparation, time of day when colonoscopy was performed, solid diet the day prior to colonoscopy, type of sedation used (conscious sedation or general anesthesia), and total colonoscopy time (defined as the time from scope insertion to removal) was recorded. Hospitalization-related variables, including the number of hospitalizations in the year before the current hospitalization, the year in which the colonoscopy was performed, and the number of days from admission to colonoscopy, were also obtained from the EHR.
Outcome Measures
An internally validated natural language algorithm, using Structured Queried Language was used to search through colonoscopy reports to identify adequacy of bowel preparation. ProVation® software allows the gastroenterologist to use some terms to describe bowel preparation in a drop-down menu format. In addition to the Aronchik scale (which allows the gastroenterologist to rate bowel preparation on a five-point scale: “excellent,” “good,” “fair,” “poor,” and “inadequate”) it also allows the provider to use terms such as “adequate” or “adequate to detect polyps >5 mm” as well as “unsatisfactory.”7 Mirroring prior literature, bowel preparation quality was classified into “adequate” and “inadequate”; “good” and “excellent” on the Aronchik scale were categorized as adequate as was the term “adequate” in any form; “fair,” “poor,” or “inadequate” on the Aronchik scale were classified as inadequate as was the term “unsatisfactory.” We evaluated the hospital length of stay (LOS) as a secondary outcome measure.
Statistical Analysis
After describing the frequency of IBP, the quality of bowel preparation (adequate vs inadequate) was compared based on the predictors described above. Categorical variables were reported as frequencies with percentages and continuous variables were reported as medians with 25th-75th percentile values. The significance of the difference between the proportion or median values of those who had inadequate versus adequate bowel preparation was assessed. Two-sided chi-square analysis was used to assess the significance of differences between categorical variables and the Wilcoxon Rank-Sum test was used to assess the significance of differences between continuous variables.
Multivariate logistic regression analysis was performed to assess factors associated with hospital predictors and outcomes, after adjusting for all the aforementioned factors and clustering the effect based on the endoscopist. To evaluate the potential impact of modifiable factors on IBP, we performed counterfactual analysis, in which the observed distribution was compared to a hypothetical population in which all the modifiable risk factors were optimal.
RESULTS
Overall, 8,819 patients were included in our study population. They had a median age of 64 [53-76] years; 50.5% were female and 51% had an IBP. Patient characteristics and rates of IBP are presented in Table 1.
In unadjusted analyses, with regards to modifiable factors, opiate use within three days of colonoscopy was associated with a higher rate of IBP (55.4% vs 47.3%, P <.001), as was a lower volume (<4L) bowel preparation (55.3% vs 50.4%, P = .003). IBP was less frequent when colonoscopy was performed before noon vs afternoon (50.3% vs 57.4%, P < .001), and when patients were documented to receive a clear liquid diet or nil per os vs a solid diet the day prior to colonoscopy (50.3% vs 57.4%, P < .001). Overall bowel preparation quality improved over time (Figure 1). Median LOS was five [3-11] days. Patients who had IBP on their initial colonoscopy had a LOS one day longer than patients without IBP (six days vs five days, P < .001).
Multivariate Analysis
Table 2 shows the results of the multivariate analysis. The following modifiable factors were associated with IBP: opiate used within three days of the procedure (OR 1.31; 95% CI 1.8, 1.45), having the colonoscopy performed after12:00
Potential Impact of Modifiable Variables
We conducted a counterfactual analysis based on a multivariate model to assess the impact of each modifiable risk factor on the IBP rate (Figure 1). In the included study population, 44.9% received an opiate, 39.3% had a colonoscopy after 12:00
DISCUSSION
In this large, multihospital cohort, IBP was documented in half (51%) of 8,819 inpatient colonoscopies performed. Nonmodifiable patient characteristics independently associated with IBP were age, male gender, white race, Medicare and Medicaid insurance, nausea/vomiting, dysphagia, and gastroparesis. Modifiable factors included not consuming opiates within three days of colonoscopy, avoidance of a solid diet the day prior to colonoscopy and performing the colonoscopy before noon. The volume of bowel preparation consumed was not associated with IBP. In a counterfactual analysis, we found that if all three modifiable factors were optimized, the predicted rate of IBP would drop to 45%.
Many studies, including our analysis, have shown significant differences between the frequency of IBP in inpatient versus outpatient bowel preparations.8-11 Therefore, it is crucial to study IBP in these settings separately. Three single-institution studies, including a total of 898 patients, have identified risk factors for inpatient IBP. Individual studies ranged in size from 130 to 524 patients with rates of IBP ranging from 22%-57%.1-3 They found IBP to be associated with increasing age, lower income, ASA Grade >3, diabetes, coronary artery disease (CAD), nausea or vomiting, BMI >25, and chronic constipation. Modifiable factors included opiates, afternoon procedures, and runway times >6 hours.
We also found IBP to be associated with increasing age and male gender. However, we found no association with diabetes, chronic constipation, CAD or BMI. As we were able to adjust for a wider variety of variables, it is possible that we were able to account for residual confounding better than previous studies. For example, we found that having nausea/vomiting, dysphagia, and gastroparesis was associated with IBP. Gastroparesis with associated nausea and vomiting may be the mechanism by which diabetes increases the risk for IBP. Further studies are needed to assess if interventions or alternative bowel cleansing in these patients can result in improved IBP. Finally, in contrast to studies with smaller cohorts which found that lower volume bowel preps improved IBP in the right colon,4,12 we found no association between IBP based and volume of bowel preparation consumed. Our impact analysis suggests that avoidance of opiates for at least three days before colonoscopy, avoidance of solid diet on the day before colonoscopy and performing all colonoscopies before noon would
The factors mentioned above may not always be amenable to modification. For example, for patients with active gastrointestinal bleeding, postponing colonoscopy by one day for the sake of maintaining a patient on a clear diet may not be feasible. Similarly, performing colonoscopies in the morning is highly dependent on endoscopy suite availability and hospital logistics. Denying opiates to patients experiencing severe pain is not ethical. In many scenarios, however, these variables could be modified, and institutional efforts to support these practices could yield considerable savings. Future prospective studies are needed to verify the real impact of these changes.
Further discussion is needed to contextualize the finding that colonoscopies scheduled in the afternoon are associated with improved bowel preparation quality. Previous research—albeit in the outpatient setting—has demonstrated 11.8 hours as the maximum upper time limit for the time elapsed between the end of bowel preparation to colonoscopy.14 Another study found an inverse relationship between the quality of bowel preparation and the time after completion of the bowel preparation.15 This makes sense from a physiological perspective as delaying the time between completion of bowel preparation, and the procedure allows chyme from the small intestine to reaccumulate in the colon. Anecdotally, at our institution as well as at many others, the bowel preparations are ordered to start in the evening to allow the consumption of complete bowel preparation by midnight. As a result of this practice, only patients who have their colonoscopies scheduled before noon fall within the optimal period of 11.8 hours. In the outpatient setting, the use of split preparations has led to the obliteration of the difference in the quality of bowel preparation between morning and afternoon colonoscopies.16 Prospective trials are needed to evaluate the use of split preparations to improve the quality of afternoon inpatient colonoscopies.
Few other strategies have been shown to mitigate IBP in the inpatient setting. In a small randomized controlled trial, Ergen et al. found that providing an educational booklet improved inpatient bowel preparation as measured by the Boston Bowel Preparation Scale.17 In a quasi-experimental design, Yadlapati et al. found that an automated split-dose bowel preparation resulted in decreased IBP, fewer repeated procedures, shorter LOS, and lower hospital cost.18 Our study adds to these tools by identifying three additional risk factors which could be optimized for inpatients. Because our findings are observational, they should be subjected to prospective trials. Our study also calls into question the impact of bowel preparation volume. We found no difference in the rate of IBP between low and large volume preparations. It is possible that other factors are more important than the specific preparation employed.
Interestingly, we found that IBP declined substantially in 2014 and continued to decline after that. The year was the most influential risk factor for IBP (on par with gastroparesis). The reason for this is unclear, as rates of our modifiable risk factors did not differ substantially by year. Other possibilities include improved access (including weekend access) to endoscopy coinciding with the development of a new endoscopy facility and use of integrated irrigation pump system instead of the use of manual syringes for flushing.
Our study has many strengths. It is by far the most extensive study of bowel preparation quality in inpatients to date and the only one that has included patient, procedural and bowel preparation characteristics. The study also has several significant limitations. This is a single center study, which could limit generalizability. Nonetheless, it was conducted within a health system with multiple hospitals in different parts of the United States (Ohio and Florida) and included a broad population mix with differing levels of acuity. The retrospective nature of the assessment precludes establishing causation. However, we mitigated confounding by adjusting for a wide variety of factors, and there is a plausible physiological mechanism for each of the factors we studied. Also, the retrospective nature of our study predisposes our data to omissions and misrepresentations during the documentation process. This is especially true with the use of ICD codes.19 Inaccuracies in coding are likely to bias toward the null, so observed associations may be an underestimate of the true association.
Our inability to ascertain if a patient completed the prescribed bowel preparation limited our ability to detect what may be a significant risk factor. Lastly, while clinically relevant, the Aronchik scale used to identify adequate from IBP has never been validated though it is frequently utilized and cited in the bowel preparation literature.20
CONCLUSIONS
In this large retrospective study evaluating bowel preparation quality in inpatients undergoing colonoscopy, we found that more than half of the patients have IBP and that IBP was associated with an extra day of hospitalization. Our study identifies those patients at highest risk and identifies modifiable risk factors for IBP. Specifically, we found that abstinence from opiates or solid diet before the colonoscopy, along with performing colonoscopies before noon were associated with improved outcomes. Prospective studies are needed to confirm the effects of these interventions on bowel preparation quality.
Disclosures
Carol A Burke, MD has received research funding from Ferring Pharmaceuticals. Other authors have no conflicts of interest to disclose.
1. Yadlapati R, Johnston ER, Gregory DL, Ciolino JD, Cooper A, Keswani RN. Predictors of inadequate inpatient colonoscopy preparation and its association with hospital length of stay and costs. Dig Dis Sci. 2015;60(11):3482-3490. doi: 10.1007/s10620-015-3761-2. PubMed
2. Jawa H, Mosli M, Alsamadani W, et al. Predictors of inadequate bowel preparation for inpatient colonoscopy. Turk J Gastroenterol. 2017;28(6):460-464. doi: 10.5152/tjg.2017.17196. PubMed
3. Mcnabb-Baltar J, Dorreen A, Dhahab HA, et al. Age is the only predictor of poor bowel preparation in the hospitalized patient. Can J Gastroenterol Hepatol. 2016;2016:1-5. doi: 10.1155/2016/2139264. PubMed
4. Rotondano G, Rispo A, Bottiglieri ME, et al. Tu1503 Quality of bowel cleansing in hospitalized patients is not worse than that of outpatients undergoing colonoscopy: results of a multicenter prospective regional study. Gastrointest Endosc. 2014;79(5):AB564. doi: 10.1016/j.gie.2014.02.949. PubMed
5. Ness R. Predictors of inadequate bowel preparation for colonoscopy. Am J Gastroenterol. 2001;96(6):1797-1802. doi: 10.1016/s0002-9270(01)02437-6. PubMed
6. Johnson DA, Barkun AN, Cohen LB, et al. Optimizing adequacy of bowel cleansing for colonoscopy: recommendations from the us multi-society task force on colorectal cancer. Gastroenterology. 2014;147(4):903-924. doi: 10.1053/j.gastro.2014.07.002. PubMed
7. Aronchick CA, Lipshutz WH, Wright SH, et al. A novel tableted purgative for colonoscopic preparation: efficacy and safety comparisons with Colyte and Fleet Phospho-Soda. Gastrointest Endosc. 2000;52(3):346-352. doi: 10.1067/mge.2000.108480. PubMed
8. Froehlich F, Wietlisbach V, Gonvers J-J, Burnand B, Vader J-P. Impact of colonic cleansing on quality and diagnostic yield of colonoscopy: the European Panel of Appropriateness of Gastrointestinal Endoscopy European multicenter study. Gastrointest Endosc. 2005;61(3):378-384. doi: 10.1016/s0016-5107(04)02776-2. PubMed
9. Sarvepalli S, Garber A, Rizk M, et al. 923 adjusted comparison of commercial bowel preparations based on inadequacy of bowel preparation in outpatient settings. Gastrointest Endosc. 2018;87(6):AB127. doi: 10.1016/j.gie.2018.04.1331.
10. Hendry PO, Jenkins JT, Diament RH. The impact of poor bowel preparation on colonoscopy: a prospective single center study of 10 571 colonoscopies. Colorectal Dis. 2007;9(8):745-748. doi: 10.1111/j.1463-1318.2007.01220.x. PubMed
11. Lebwohl B, Wang TC, Neugut AI. Socioeconomic and other predictors of colonoscopy preparation quality. Dig Dis Sci. 2010;55(7):2014-2020. doi: 10.1007/s10620-009-1079-7. PubMed
12. Chorev N, Chadad B, Segal N, et al. Preparation for colonoscopy in hospitalized patients. Dig Dis Sci. 2007;52(3):835-839. doi: 10.1007/s10620-006-9591-5. PubMed
13. Weiss AJ. Overview of Hospital Stays in the United States, 2012. HCUP Statistical Brief #180. Rockville, MD: Agency for Healthcare Research and Quality; 2014. PubMed
14. Kojecky V, Matous J, Keil R, et al. The optimal bowel preparation intervals before colonoscopy: a randomized study comparing polyethylene glycol and low-volume solutions. Dig Liver Dis. 2018;50(3):271-276. doi: 10.1016/j.dld.2017.10.010. PubMed
15. Siddiqui AA, Yang K, Spechler SJ, et al. Duration of the interval between the completion of bowel preparation and the start of colonoscopy predicts bowel-preparation quality. Gastrointest Endosc. 2009;69(3):700-706. doi: 10.1016/j.gie.2008.09.047. PubMed
16. Eun CS, Han DS, Hyun YS, et al. The timing of bowel preparation is more important than the timing of colonoscopy in determining the quality of bowel cleansing. Dig Dis Sci. 2010;56(2):539-544. doi: 10.1007/s10620-010-1457-1. PubMed
17. Ergen WF, Pasricha T, Hubbard FJ, et al. Providing hospitalized patients with an educational booklet increases the quality of colonoscopy bowel preparation. Clin Gastroenterol Hepatol. 2016;14(6):858-864. doi: 10.1016/j.cgh.2015.11.015. PubMed
18. Yadlapati R, Johnston ER, Gluskin AB, et al. An automated inpatient split-dose bowel preparation system improves colonoscopy quality and reduces repeat procedures. J Clin Gastroenterol. 2018;52(8):709-714. doi: 10.1097/mcg.0000000000000849. PubMed
19. Birman-Deych E, Waterman AD, Yan Y, Nilasena DS, Radford MJ, Gage BF. The accuracy of ICD-9-CM codes for identifying cardiovascular and stroke risk factors. Med Care. 2005;43(5):480-485. doi: 10.1097/01.mlr.0000160417.39497.a9. PubMed
20. Parmar R, Martel M, Rostom A, Barkun AN. Validated scales for colon cleansing: a systematic review. J Clin Gastroenterol. 2016;111(2):197-204. doi: 10.1038/ajg.2015.417. PubMed
© 2019 Society of Hospital Medicine
Sepsis Presenting in Hospitals versus Emergency Departments: Demographic, Resuscitation, and Outcome Patterns in a Multicenter Retrospective Cohort
Sepsis is both the most expensive condition treated and the most common cause of death in hospitals in the United States.1-3 Most sepsis patients (as many as 80% to 90%) meet sepsis criteria on hospital arrival, but mortality and costs are higher when meeting criteria after admission.3-6 Mechanisms of this increased mortality for these distinct populations are not well explored. Patients who present septic in the emergency department (ED) and patients who present as inpatients likely present very different challenges for recognition, treatment, and monitoring.7 Yet, how these groups differ by demographic and clinical characteristics, the etiology and severity of infection, and patterns of resuscitation care are not well described. Literature on sepsis epidemiology on hospital wards is particularly limited.8
This knowledge gap is important. If hospital-presenting sepsis (HPS) contributes disproportionately to disease burdCHFens, it reflects a high-yield population deserving the focus of quality improvement (QI) initiatives. If specific causes of disparities were identified—eg, poor initial resuscitation— they could be specifically targeted for correction. Given that current treatment guidelines are uniform for the two populations,9,10 characterizing phenotypic differences could also have implications for both diagnostic and therapeutic recommendations, particularly if the groups display substantially differing clinical presentations. Our prior work has not probed these effects specifically, but suggested ED versus inpatient setting at the time of initial sepsis presentation might be an effect modifier for the association between several elements of fluid resuscitation and patient outcomes.11,12
We, therefore, conducted a retrospective analysis to ask four sequential questions: (1) Do patients with HPS, compared with EDPS, contribute adverse outcome out of proportion to case prevalence? (2) At the time of initial presentation, how do HPS patients differ from EDPS patients with respect to demographics, comorbidities, infectious etiologies, clinical presentations, and severity of illness (3) If holding observed baseline factors constant, does the physical location of sepsis presentation inherently increase the risk for treatment delays and mortality? (4) To what extent can differences in the likelihood for timely initial treatment between the ED and inpatient settings explain differences in mortality and patient outcomes?
We hypothesized a priori that HPS would reflect chronically sicker patients whom both received less timely resuscitation and who contributed disproportionately frequent bad outcomes. We expected disparities in timely resuscitation care would explain a large proportion of this difference.
METHODS
We performed a retrospective analysis of the Northwell Sepsis Database, a prospectively captured, multisite, real world, consecutive-sample cohort of all “severe sepsis” and septic shock patients treated at nine tertiary and community hospitals in New York from October 1, 2014, to March 31, 2016. We analyzed all patients from a previously published cohort.11
Database Design and Structure
The Northwell Sepsis Database has previously been described in detail.11,13,14 Briefly, all patients met clinical sepsis criteria: (1) infection AND (2) ≥2 (SIRS) criteria AND (3) ≥1 acute organ dysfunction criterion. Organ dysfunction criteria were hypotension, acute kidney injury (AKI), coagulopathy, altered gas exchange, elevated bilirubin (≥2.0 mg/dL), or altered mental status (AMS; clarified in Supplemental Table 1). All organ dysfunction was not otherwise explained by patients’ medical histories; eg, patients on warfarin anticoagulation were not documented to have coagulopathy based on international normalized ratio > 1.5. The time of the sepsis episode (and database inclusion) was the time of the first vital sign measurement or laboratory result where a patient simultaneously met all three inclusion criteria: infection, SIRS, and organ dysfunction. The database excludes patients who were <18 years, declined bundle interventions, had advance directives precluding interventions, or were admitted directly to palliative care or hospice. Abstractors assumed comorbidities were absent if not documented within the medical record and that physiologic abnormalities were absent if not measured by the treatment team. There were no missing data for the variables analyzed. We report analysis in adherence with the STROBE statement guidelines for observational research.
Exposure
The primary exposure was whether patients had EDPS versus HPS. We defined EDPS patients as meeting all objective clinical inclusion criteria while physically in the ED. We defined HPS as first meeting sepsis inclusion criteria outside the ED, regardless of the reason for admission, and regardless of whether patients were admitted through the ED or directly to the hospital. All ED patients were admitted to the hospital.
Outcomes
Process outcomes were full 3-hour bundle compliance, time to antibiotic administration, blood cultures before antibiotics, time to fluid initiation, the volume of administered fluid resuscitation, lactate result time, and whether repeat lactate was obtained (Supplemental Table 2). Treatment times were times of administration (rather than order time). The primary patient outcome was hospital mortality. Secondary patient outcomes were mechanical ventilation, ICU admission, ICU days, hospital length of stay (LOS). We discounted HPS patients’ LOS to include only days after meeting the inclusion criteria. Patients were excluded from the analysis of the ICU admission outcome if they were already in the ICU prior to meeting sepsis criteria.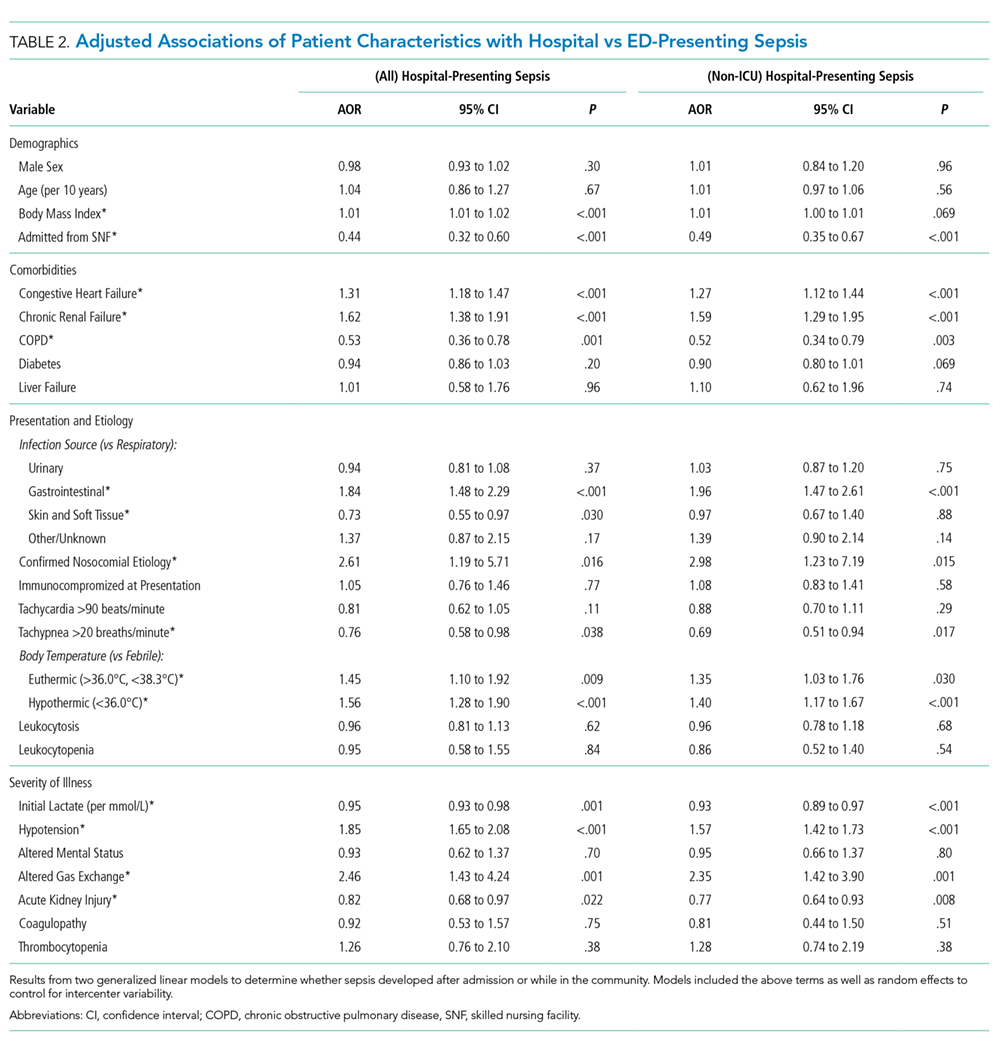
Statistical Analysis
We report continuous variables as means (standard deviation) or medians (interquartile range), and categorical variables as frequencies (proportions), as appropriate. Summative statistics with 95% confidence intervals (CI) describe overall group contributions. We used generalized linear models to determine patient factors associated with EDPS versus HPS, entering random effects for individual study sites to control for intercenter variability.
Next, to generate a propensity-matched cohort, we computed propensity scores adjusted from a priori selected variables: age, sex, tertiary versus community hospital, congestive heart failure (CHF), renal failure, COPD, diabetes, liver failure, immunocompromise, primary source of infection, nosocomial source, temperature, initial lactate, presenting hypotension, altered gas exchange, AMS, AKI, and coagulopathy. We then matched subjects 1:1 without optimization or replacement, imposing a caliper width of 0.01; ie, we required matched pairs to have a <1.0% difference in propensity scores. The macro used to match subjects is publically available.15
We then compared resuscitation and patient outcomes in the matched cohort using generalized linear models, ie, doubly-robust estimation (DRE).16 When assessing patient outcomes corrected for resuscitation, we used mixed DRE/multivariable regression. We did this for two reasons: first, DRE has the advantage of only requiring only one approach (propensity vs covariate adjustments) to be correctly specified.16 Second, computing propensity scores adjusted for resuscitation would be inappropriate given that resuscitation occurs after the exposure allocation (HPS vs EDPS). However, these factors could still impact the outcome and in fact, we hypothesized they were potential mediators of the exposure effect. To interrogate this mediating relationship, we recapitulated the DRE modeling but added covariates for resuscitation factors. Resuscitation-adjusted models controlled for timeliness of antibiotics, fluids, and lactate results; blood cultures before antibiotics; repeat lactate obtained, and fluid volume in the first six hours. Since ICU days and LOS are subject to competing risks bias (LOS could be shorter if patients died earlier), we used proportional hazards models where “the event” was defined as a live discharge to censor for mortality and we report output as inverse hazard ratios. We also tested interaction coefficients for discrete bundle elements and HPS to determine if specific bundle elements were effect modifiers for the association between the presenting location and mortality risk. Finally, we estimated attributable risk differences by comparing adjusted odds ratios of adverse outcome with and without adjustment for resuscitation variables, as described by Sahai et al.17
As sensitivity analyses, we recomputed propensity scores and generated a new matched cohort that excluded HPS patients who met criteria for sepsis while already in the ICU for another reason (ie, excluding ICU-presenting sepsis). We then recapitulated all analyses as above for this cohort. We performed analyses using SAS version 9.4 (SAS Institute, Cary, North Carolina).
RESULTS
Prevalence and Outcome Contributions
Of the 11,182 sepsis patients in the database, we classified 2,509 (22%) as HPS (Figure 1). HPS contributed 785 (35%) of 2,241 sepsis-related mortalities, 1,241 (38%) mechanical ventilations, and 1,762 (34%) ICU admissions. Of 39,263 total ICU days and 127,178 hospital days, HPS contributed 18,104 (46.1%) and 44,412 (34.9%) days, respectively.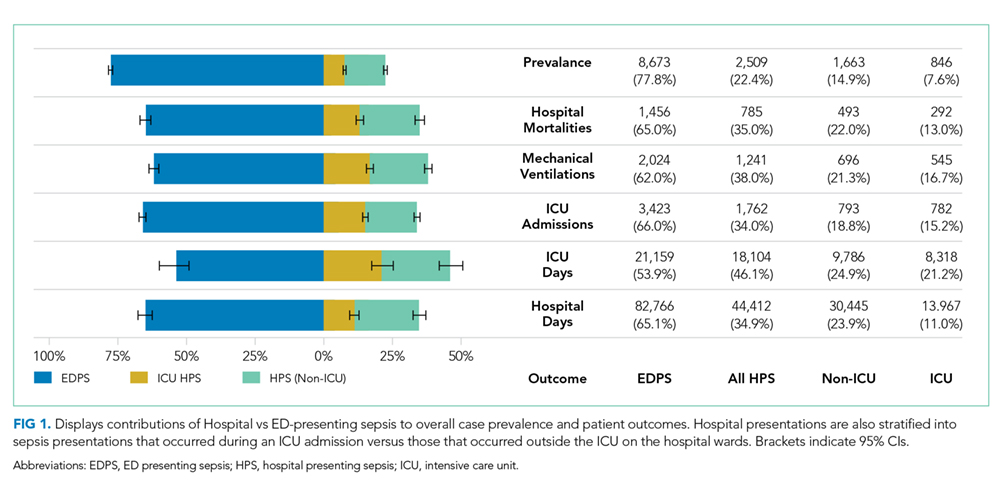
Patient Characteristics
Most HPS presented early in the hospital course, with 1,352 (53.9%) cases meeting study criteria within three days of admission. Median time from admission to meeting study criteria for HPS was two days (interquartile range: one to seven days). We report selected baseline patient characteristics in Table 1 and adjusted associations of baseline variables with HPS versus EDPS in Table 2. The full cohort characterization is available in Supplemental Table 3. Notably, HPS patients more often had CHF (aOR [adjusted odds ratio}: 1.31, CI: 1.18-1.47) or renal failure (aOR: 1.62, CI: 1.38-1.91), gastrointestinal source of infection (aOR: 1.84, CI: 1.48-2.29), hypothermia (aOR: 1.56, CI: 1.28-1.90) hypotension (aOR: 1.85, CI: 1.65-2.08), or altered gas exchange (aOR: 2.46, CI: 1.43-4.24). In contrast, HPS patients less frequently were admitted from skilled nursing facilities (aOR: 0.44, CI: 0.32-0.60), or had COPD (aOR: 0.53, CI: 0.36-0.76), fever (aOR: 0.70, CI: 0.52-0.91), tachypnea (aOR: 0.76, CI: 0.58-0.98), or AKI (aOR: 082, CI: 0.68-0.97). Other baseline variables were similar, including respiratory source, tachycardia, white cell abnormalities, AMS, and coagulopathies. These associations were preserved in the sensitivity analysis excluding ICU-presenting sepsis.
Propensity Matching
Propensity score matching yielded 1,942 matched pairs (n = 3,884, 77% of HPS patients, 22% of EDPS patients). Table 1 and Supplemental Table 3 show patient characteristics after propensity matching. Supplemental Table 4 shows the propensity model. The frequency densities are shown for the cohort as a function of propensity score in Supplemental Figure 1. After matching, frequencies between groups differed by <5% for all categorical variables assessed. In the sensitivity analysis, propensity matching (model in Supplemental Table 5) resulted in 1,233 matched pairs (n = 2,466, 49% of HPS patients, 14% of EDPS patients), with group differences comparable to the primary analysis.
Process Outcomes
We present propensity-matched differences in initial resuscitation in Figure 2A for all HPS patients, as well as non-ICU-presenting HPS, versus EDPS. HPS patients were roughly half as likely to receive fully 3-hour bundle compliant care (17.0% vs 30.3%, aOR: 0.47, CI: 0.40-0.57), to have blood cultures drawn within three hours prior to antibiotics (44.9% vs 67.2%, aOR: 0.40, CI: 0.35-0.46), or to receive fluid resuscitation initiated within two hours (11.1% vs 26.1%, aOR: 0.35, CI: 0.29-0.42). Antibiotic receipt within one hour was comparable (45.3% vs 48.1%, aOR: 0.89, CI: 0.79-1.01). However, differences emerged for antibiotics within three hours (66.2% vs 83.8%, aOR: 0.38, CI: 0.32-0.44) and persisted at six hours (77.0% vs 92.5%, aOR: 0.27, CI: 0.22-33). Excluding ICU-presenting sepsis from propensity matching exaggerated disparities in antibiotic receipt at one hour (43.4% vs 49.1%, aOR: 0.80, CI: 0.68-0.93), three hours (64.2% vs 86.1%, aOR: 0.29, CI: 0.24-0.35), and six hours (75.7% vs 93.0%, aOR: 0.23, CI: 0.18-0.30). HPS patients more frequently had repeat lactate obtained within 24 hours (62.4% vs 54.3%, aOR: 1.40, CI: 1.23-1.59).
Patient Outcomes
HPS patients had higher mortality (31.2% vs19.3%), mechanical ventilation (51.5% vs27.4%), and ICU admission (60.6% vs 46.5%) (Table 1 and Supplemental Table 6). Figure 2b shows propensity-matched and covariate-adjusted differences in patient outcomes before and after adjusting for initial resuscitation. aORs corresponded to approximate relative risk differences18 of 1.38 (CI: 1.28-1.48), 1.68 (CI: 1.57-1.79), and 1.72 (CI: 1.61-1.84) for mortality, mechanical ventilation, and ICU admission, respectively. HPS was associated with 83% longer mortality-censored ICU stays (five vs nine days, HR–1: 1.83, CI: 1.65-2.03), and 108% longer hospital stay (eight vs 17 days, HR–1: 2.08, CI: 1.93-2.24). After adjustment for resuscitation, all effect sizes decreased but persisted. The initial crystalloid volume was a significant negative effect modifier for mortality (Supplemental Table 7). That is, the magnitude of the association between HPS and greater mortality decreased by a factor of 0.89 per 10 mL/kg given (CI: 0.82-0.97). We did not observe significant interaction from other interventions, or overall bundle compliance, meaning these interventions’ association with mortality did not significantly differ between HPS versus EDPS.
The implied attributable risk difference from discrepancies in initial resuscitation was 23.3% for mortality, 35.2% for mechanical ventilation, and 7.6% for ICU admission (Figure 2B). Resuscitation explained 26.5% of longer ICU LOS and 16.7% of longer hospital LOS associated with HPS.
Figure 2C shows sensitivity analysis excluding ICU-presenting sepsis from propensity matching (ie, limiting HPS to hospital ward presentations). Again, HPS was associated with all adverse outcomes, though effect sizes were smaller than in the primary cohort for all outcomes except hospital LOS. In this cohort, resuscitation factors now explained 16.5% of HPS’ association with mortality, and 14.5% of the association with longer ICU LOS. However, they explained a greater proportion (13.0%) of ICU admissions. Attributable risk differences were comparable to the primary cohort for mechanical ventilation (37.6%) and hospital LOS (15.3%).
DISCUSSION
In this analysis of 11,182 sepsis and septic shock patients, HPS contributed 22% of prevalence but >35% of total sepsis mortalities, ICU utilization, and hospital days. HPS patients had higher comorbidity burdens and had clinical presentations less obviously attributable to infection with more severe organ dysfunction. EDPS received antibiotics within three hours about 1.62 times more often than do HPS patients. EDPS patients also receive fluids initiated within two hours about 1.82 times more often than HPS patients do. HPS had nearly 1.5-fold greater mortality and LOS, and nearly two-fold greater mechanical ventilation and ICU utilization. Resuscitation disparities could partially explain these associations. These patterns persisted when comparing only wards presenting HPS with EDPS.
Our analysis revealed several notable findings. First, these data confirm that HPS represents a potentially high-impact target population that contributes adverse outcomes disproportionately frequently with respect to case prevalence.
Our findings, unsurprisingly, revealed HPS and EDPS reflect dramatically different patient populations. We found that the two groups significantly differed by the majority of the baseline factors we compared. It may be worth asking if and how these substantial differences in illness etiology, chronic health, and acute physiology impact what we consider an optimal approach to management. Significant interaction effects of fluid volume on the association between HPS and mortality suggest differential treatment effects may exist between patients. Indeed, patients who newly arrive from the community and those who are several days into admission likely have different volume status. However, no interactions were noted with other bundle elements, such as timeliness of antibiotics or timeliness of initial fluids.
Another potentially concerning observation was that HPS patients were admitted much less frequently from skilled nursing facilities, as it could imply that this poorer-fairing population had a comparatively higher baseline functional status. The fact that 25% of EDPS cases were admitted from these facilities also underscores the need to engage skilled nursing facility providers in future sepsis initiatives.
We found marked disparities in resuscitation. Timely delivery of interventions, such as antibiotics and initial fluid resuscitation, occurred less than half as often for HPS, especially on hospital wards. While evidence supporting the efficacy of specific 3-hour bundle elements remains unsettled,19 a wealth of literature demonstrates a correlation between bundle uptake and decreased sepsis mortality, especially for early antibiotic administration.13,20-26 Some analysis suggests that differing initial resuscitation practices explain different mortality rates in the early goal-directed therapy trials.27 The comparatively poor performance for non-ICU HPS indicates further QI efforts are better focused on inpatient wards, rather than on EDs or ICUs where resuscitation is already delivered with substantially greater fidelity.
While resuscitation differences partially explained outcome discrepancies between groups, they did not account for as much variation as expected. Though resuscitation accounted for >35% of attributable mechanical ventilation risk, it explained only 16.5% of mortality differences for non-ICU HPS vs EDPS. We speculate that several factors may contribute.
First, HPS patients are already hospitalized for another acute insult and may be too physiologically brittle to derive equal benefit from initial resuscitation. Some literature suggests protocolized sepsis resuscitation may paradoxically be more effective in milder/earlier disease.28
Second, clinical information indicating septic organ dysfunction may become available too late in HPS—a possible data limitation where inpatient providers are counterintuitively more likely to miss early signs of patients’ deterioration and a subsequent therapeutic window. Several studies found that fluid resuscitation is associated with improved sepsis outcomes only when it is administered very early.11,29-31 In inpatient wards, decreased monitoring32 and human factors (eg, hospital workflow, provider-to-patient ratios, electronic documentation burdens)33,34 may hinder early diagnosis. In contrast, ED environments are explicitly designed to identify acutely ill patients and deliver intervention rapidly. If HPS patients were sicker when they were identified, this would also explain their more severe organ dysfunctions. Our data seems to support this possibility. HPS patients had tachypnea less frequently but more often had impaired gas exchange. This finding may suggest that early tachypnea was either less often detected or documented, or that it had progressed further by the time of detection.
Third, inpatients with sepsis may more often present with greater diagnostic complexity. We observed that HPS patients were more often euthermic and less often tachypneic. Beyond suggesting a greater diagnostic challenge, this also raises questions as to whether differences reflect patient physiology (response to infection) or iatrogenic factors (eg, prior antipyretics). Higher comorbidity and acute physiological burdens also limit the degree to which new organ dysfunction can be clearly attributed to infection. We note differences in the proportion of patients who received antibiotics increased over time, suggesting that HPS patients who received delayed antibiotics did so much later than their EDPS counterparts. This lag could also arise from diagnostic difficulty.
All three possibilities highlight a potential lead time effect, where the same measured three-hour period on the wards, between meeting sepsis criteria and starting treatment, actually reflects a longer period between (as yet unmeasurable) pathobiologic “time zero” and treatment versus the ED. The time of sepsis detection, as distinct from the time of sepsis onset, therefore proves difficult to evaluate and impossible to account for statistically.
Regardless, our findings suggest additional difficulty in both the recognition and resuscitation of inpatient sepsis. Inpatients, especially with infections, may need closer monitoring. How to cost effectively implement this monitoring is a challenge that deserves attention.
A more rational systems approach to HPS likely combines efforts to improve initial resuscitation with other initiatives aimed at both improving monitoring and preventing infection.
To be clear, we do not imply that timely initial resuscitation does not matter on the wards. Rather, resuscitation-focused QI alone does not appear to be sufficient to overcome differences in outcomes for HPS. The 23.3% attributable mortality risk we observed still implies that resuscitation differences could explain nearly one in four excess HPS mortalities. We previously showed that timely resuscitation is strongly associated with better outcomes.11,13,30 As discussed above, the unclear degree to which better resuscitation is a marker for more obvious presentations is a persistent limitation of prior investigations and the present study.
Taken together, the ultimate question that this study raises but cannot answer is whether the timely recognition of sepsis, rather than any specific treatment, is what truly improves outcomes.
In addition to those above, this study has several limitations. Our study did not differentiate HPS with respect to patients admitted for noninfectious reasons and who subsequently became septic versus nonseptic patients admitted for an infection who subsequently became septic from that infection. Nor could we discriminate between missed ED diagnoses and true delayed presentations. We note distinguishing these entities clinically can be equally challenging. Additionally, this was a propensity-matched retrospective analysis of an existing sepsis cohort, and the many limitations of both retrospective study and propensity matching apply.35,36 We note that randomizing patients to develop sepsis in the community versus hospital is not feasible and that two of our aims intended to describe overall patterns rather than causal effects. We could not ascertain robust measures of severity of illness (eg, SOFA) because a real world setting precludes required data points—eg, urine output is unreliably recorded. We also note incomplete overlap between inclusion criteria and either Sepsis-2 or -3 definitions,1,37 because we designed and populated our database prior to publication of Sepsis-3. Further, we could not account for surgical source control, the appropriateness of antimicrobial therapy, mechanical ventilation before sepsis onset, or most treatments given after initial resuscitation.
In conclusion, hospital-presenting sepsis accounted for adverse patient outcomes disproportionately to prevalence. HPS patients had more complex presentations, received timely antibiotics half as often ED-presenting sepsis, and had nearly twice the mortality odds. Resuscitation disparities explained roughly 25% of this difference.
Disclosures
The authors have no conflicts of interest to disclose.
Funding
This investigation was funded in part by a grant from the Center for Medicare and Medicaid Innovation to the High Value Healthcare Collaborative, of which the study sites’ umbrella health system was a part. This grant helped fund the underlying QI program and database in this study.
1. Singer M, Deutschman CS, Seymour CW, et al. The third international consensus definitions for sepsis and septic shock (Sepsis-3). JAMA. 2016;315(8):801-810. doi: 10.1001/jama.2016.0287. PubMed
2. Torio CMA, Andrews RMA. National inpatient hospital costs: the most expensive conditions by payer, 2011. In. Statistical Brief No. 160. Rockville, MD: Agency for Healthcare Research and Quality; 2013. PubMed
3. Liu V, Escobar GJ, Greene JD, et al. Hospital deaths in patients with sepsis from 2 independent cohorts. JAMA. 2014;312(1):90-92. doi: 10.1001/jama.2014.5804. PubMed
4. Seymour CW, Liu VX, Iwashyna TJ, et al. Assessment of clinical criteria for sepsis: for the third international consensus definitions for sepsis and septic shock (Sepsis-3). JAMA. 2016;315(8):762-774. doi: 10.1001/jama.2016.0288. PubMed
5. Jones SL, Ashton CM, Kiehne LB, et al. Outcomes and resource use of sepsis-associated stays by presence on admission, severity, and hospital type. Med Care. 2016;54(3):303-310. doi: 10.1097/MLR.0000000000000481. PubMed
6. Page DB, Donnelly JP, Wang HE. Community-, healthcare-, and hospital-acquired severe sepsis hospitalizations in the university healthsystem consortium. Crit Care Med. 2015;43(9):1945-1951. doi: 10.1097/CCM.0000000000001164. PubMed
7. Rothman M, Levy M, Dellinger RP, et al. Sepsis as 2 problems: identifying sepsis at admission and predicting onset in the hospital using an electronic medical record-based acuity score. J Crit Care. 2016;38:237-244. doi: 10.1016/j.jcrc.2016.11.037. PubMed
8. Chan P, Peake S, Bellomo R, Jones D. Improving the recognition of, and response to in-hospital sepsis. Curr Infect Dis Rep. 2016;18(7):20. doi: 10.1007/s11908-016-0528-7. PubMed
9. Rhodes A, Evans LE, Alhazzani W, et al. Surviving sepsis campaign: international guidelines for management of sepsis and septic shock: 2016. Crit Care Med. 2017;45(3):486-552. doi: 10.1097/CCM.0000000000002255. PubMed
10. Levy MM, Evans LE, Rhodes A. The Surviving Sepsis Campaign Bundle: 2018 Update. Crit Care Med. 2018;46(6):997-1000. doi: 10.1097/CCM.0000000000003119. PubMed
11. Leisman DE, Goldman C, Doerfler ME, et al. Patterns and outcomes associated with timeliness of initial crystalloid resuscitation in a prospective sepsis and septic shock cohort. Crit Care Med. 2017;45(10):1596-1606. doi: 10.1097/CCM.0000000000002574. PubMed
12. Leisman DE, Doerfler ME, Schneider SM, Masick KD, D’Amore JA, D’Angelo JK. Predictors, prevalence, and outcomes of early crystalloid responsiveness among initially hypotensive patients with sepsis and septic shock. Crit Care Med. 2018;46(2):189-198. doi: 10.1097/CCM.0000000000002834. PubMed
13. Leisman DE, Doerfler ME, Ward MF, et al. Survival benefit and cost savings from compliance with a simplified 3-hour sepsis bundle in a series of prospective, multisite, observational cohorts. Crit Care Med. 2017;45(3):395-406. doi: 10.1097/CCM.0000000000002184. PubMed
14. Doerfler ME, D’Angelo J, Jacobsen D, et al. Methods for reducing sepsis mortality in emergency departments and inpatient units. Jt Comm J Qual Patient Saf. 2015;41(5):205-211. doi: 10.1016/S1553-7250(15)41027-X. PubMed
15. Murphy B, Fraeman KH. A general SAS® macro to implement optimal N:1 propensity score matching within a maximum radius. In: Paper 812-2017. Waltham, MA: Evidera; 2017. https://support.sas.com/resources/papers/proceedings17/0812-2017.pdf. Accessed February 20, 2019.
16. Funk MJ, Westreich D, Wiesen C, Stürmer T, Brookhart MA, Davidian M. Doubly robust estimation of causal effects. Am J Epidemiol. 2011;173(7):761-767. doi: 10.1093/aje/kwq439. PubMed
17. Sahai HK, Khushid A. Statistics in Epidemiology: Methods, Techniques, and Applications. Boca Raton, FL: CRC Press; 1995.
18. VanderWeele TJ. On a square-root transformation of the odds ratio for a common outcome. Epidemiology. 2017;28(6):e58-e60. doi: 10.1097/EDE.0000000000000733. PubMed
19. Pepper DJ, Natanson C, Eichacker PQ. Evidence underpinning the centers for medicare & medicaid services’ severe sepsis and septic shock management bundle (SEP-1). Ann Intern Med. 2018;168(8):610-612. doi: 10.7326/L18-0140. PubMed
20. Levy MM, Rhodes A, Phillips GS, et al. Surviving sepsis campaign: association between performance metrics and outcomes in a 7.5-year study. Crit Care Med. 2015;43(1):3-12. doi: 10.1097/CCM.0000000000000723. PubMed
11. Liu VX, Morehouse JW, Marelich GP, et al. Multicenter Implementation of a Treatment Bundle for Patients with Sepsis and Intermediate Lactate Values. Am J Respir Crit Care Med. 2016;193(11):1264-1270. doi: 10.1164/rccm.201507-1489OC. PubMed
22. Miller RR, Dong L, Nelson NC, et al. Multicenter implementation of a severe sepsis and septic shock treatment bundle. Am J Respir Crit Care Med. 2013;188(1):77-82. doi: 10.1164/rccm.201212-2199OC. PubMed
23. Seymour CW, Gesten F, Prescott HC, et al. Time to treatment and mortality during mandated emergency care for sepsis. N Engl J Med. 2017;376(23):2235-2244. doi: 10.1056/NEJMoa1703058. PubMed
24. Pruinelli L, Westra BL, Yadav P, et al. Delay within the 3-hour surviving sepsis campaign guideline on mortality for patients with severe sepsis and septic shock. Crit Care Med. 2018;46(4):500-505. doi: 10.1097/CCM.0000000000002949. PubMed
25. Kumar A, Roberts D, Wood KE, et al. Duration of hypotension before initiation of effective antimicrobial therapy is the critical determinant of survival in human septic shock. Crit Care Med. 2006;34(6):1589-1596. doi: 10.1097/01.CCM.0000217961.75225.E9. PubMed
26. Liu VX, Fielding-Singh V, Greene JD, et al. The timing of early antibiotics and hospital mortality in sepsis. Am J Respir Crit Care Med. 2017;196(7):856-863. doi: 10.1164/rccm.201609-1848OC. PubMed
27. Kalil AC, Johnson DW, Lisco SJ, Sun J. Early goal-directed therapy for sepsis: a novel solution for discordant survival outcomes in clinical trials. Crit Care Med. 2017;45(4):607-614. doi: 10.1097/CCM.0000000000002235. PubMed
28. Kellum JA, Pike F, Yealy DM, et al. relationship between alternative resuscitation strategies, host response and injury biomarkers, and outcome in septic shock: analysis of the protocol-based care for early septic shock study. Crit Care Med. 2017;45(3):438-445. doi: 10.1097/CCM.0000000000002206. PubMed
29. Seymour CW, Cooke CR, Heckbert SR, et al. Prehospital intravenous access and fluid resuscitation in severe sepsis: an observational cohort study. Crit Care. 2014;18(5):533. doi: 10.1186/s13054-014-0533-x. PubMed
30. Leisman D, Wie B, Doerfler M, et al. Association of fluid resuscitation initiation within 30 minutes of severe sepsis and septic shock recognition with reduced mortality and length of stay. Ann Emerg Med. 2016;68(3):298-311. doi: 10.1016/j.annemergmed.2016.02.044. PubMed
31. Lee SJ, Ramar K, Park JG, Gajic O, Li G, Kashyap R. Increased fluid administration in the first three hours of sepsis resuscitation is associated with reduced mortality: a retrospective cohort study. Chest. 2014;146(4):908-915. doi: 10.1378/chest.13-2702. PubMed
32. Smyth MA, Daniels R, Perkins GD. Identification of sepsis among ward patients. Am J Respir Crit Care Med. 2015;192(8):910-911. doi: 10.1164/rccm.201507-1395ED. PubMed
33. Wenger N, Méan M, Castioni J, Marques-Vidal P, Waeber G, Garnier A. Allocation of internal medicine resident time in a Swiss hospital: a time and motion study of day and evening shifts. Ann Intern Med. 2017;166(8):579-586. doi: 10.7326/M16-2238. PubMed
34. Mamykina L, Vawdrey DK, Hripcsak G. How do residents spend their shift time? A time and motion study with a particular focus on the use of computers. Acad Med. 2016;91(6):827-832. doi: 10.1097/ACM.0000000000001148. PubMed
35. Kaji AH, Schriger D, Green S. Looking through the retrospectoscope: reducing bias in emergency medicine chart review studies. Ann Emerg Med. 2014;64(3):292-298. doi: 10.1016/j.annemergmed.2014.03.025. PubMed
36. Leisman DE. Ten pearls and pitfalls of propensity scores in critical care research: a guide for clinicians and researchers. Crit Care Med. 2019;47(2):176-185. doi: 10.1097/CCM.0000000000003567. PubMed
37. Levy MM, Fink MP, Marshall JC, et al. 2001 SCCM/ESICM/ACCP/ATS/SIS international sepsis definitions conference. Crit Care Med. 2003;31(4):1250-1256. doi: 10.1097/01.CCM.0000050454.01978.3B. PubMed
Sepsis is both the most expensive condition treated and the most common cause of death in hospitals in the United States.1-3 Most sepsis patients (as many as 80% to 90%) meet sepsis criteria on hospital arrival, but mortality and costs are higher when meeting criteria after admission.3-6 Mechanisms of this increased mortality for these distinct populations are not well explored. Patients who present septic in the emergency department (ED) and patients who present as inpatients likely present very different challenges for recognition, treatment, and monitoring.7 Yet, how these groups differ by demographic and clinical characteristics, the etiology and severity of infection, and patterns of resuscitation care are not well described. Literature on sepsis epidemiology on hospital wards is particularly limited.8
This knowledge gap is important. If hospital-presenting sepsis (HPS) contributes disproportionately to disease burdCHFens, it reflects a high-yield population deserving the focus of quality improvement (QI) initiatives. If specific causes of disparities were identified—eg, poor initial resuscitation— they could be specifically targeted for correction. Given that current treatment guidelines are uniform for the two populations,9,10 characterizing phenotypic differences could also have implications for both diagnostic and therapeutic recommendations, particularly if the groups display substantially differing clinical presentations. Our prior work has not probed these effects specifically, but suggested ED versus inpatient setting at the time of initial sepsis presentation might be an effect modifier for the association between several elements of fluid resuscitation and patient outcomes.11,12
We, therefore, conducted a retrospective analysis to ask four sequential questions: (1) Do patients with HPS, compared with EDPS, contribute adverse outcome out of proportion to case prevalence? (2) At the time of initial presentation, how do HPS patients differ from EDPS patients with respect to demographics, comorbidities, infectious etiologies, clinical presentations, and severity of illness (3) If holding observed baseline factors constant, does the physical location of sepsis presentation inherently increase the risk for treatment delays and mortality? (4) To what extent can differences in the likelihood for timely initial treatment between the ED and inpatient settings explain differences in mortality and patient outcomes?
We hypothesized a priori that HPS would reflect chronically sicker patients whom both received less timely resuscitation and who contributed disproportionately frequent bad outcomes. We expected disparities in timely resuscitation care would explain a large proportion of this difference.
METHODS
We performed a retrospective analysis of the Northwell Sepsis Database, a prospectively captured, multisite, real world, consecutive-sample cohort of all “severe sepsis” and septic shock patients treated at nine tertiary and community hospitals in New York from October 1, 2014, to March 31, 2016. We analyzed all patients from a previously published cohort.11
Database Design and Structure
The Northwell Sepsis Database has previously been described in detail.11,13,14 Briefly, all patients met clinical sepsis criteria: (1) infection AND (2) ≥2 (SIRS) criteria AND (3) ≥1 acute organ dysfunction criterion. Organ dysfunction criteria were hypotension, acute kidney injury (AKI), coagulopathy, altered gas exchange, elevated bilirubin (≥2.0 mg/dL), or altered mental status (AMS; clarified in Supplemental Table 1). All organ dysfunction was not otherwise explained by patients’ medical histories; eg, patients on warfarin anticoagulation were not documented to have coagulopathy based on international normalized ratio > 1.5. The time of the sepsis episode (and database inclusion) was the time of the first vital sign measurement or laboratory result where a patient simultaneously met all three inclusion criteria: infection, SIRS, and organ dysfunction. The database excludes patients who were <18 years, declined bundle interventions, had advance directives precluding interventions, or were admitted directly to palliative care or hospice. Abstractors assumed comorbidities were absent if not documented within the medical record and that physiologic abnormalities were absent if not measured by the treatment team. There were no missing data for the variables analyzed. We report analysis in adherence with the STROBE statement guidelines for observational research.
Exposure
The primary exposure was whether patients had EDPS versus HPS. We defined EDPS patients as meeting all objective clinical inclusion criteria while physically in the ED. We defined HPS as first meeting sepsis inclusion criteria outside the ED, regardless of the reason for admission, and regardless of whether patients were admitted through the ED or directly to the hospital. All ED patients were admitted to the hospital.
Outcomes
Process outcomes were full 3-hour bundle compliance, time to antibiotic administration, blood cultures before antibiotics, time to fluid initiation, the volume of administered fluid resuscitation, lactate result time, and whether repeat lactate was obtained (Supplemental Table 2). Treatment times were times of administration (rather than order time). The primary patient outcome was hospital mortality. Secondary patient outcomes were mechanical ventilation, ICU admission, ICU days, hospital length of stay (LOS). We discounted HPS patients’ LOS to include only days after meeting the inclusion criteria. Patients were excluded from the analysis of the ICU admission outcome if they were already in the ICU prior to meeting sepsis criteria.
Statistical Analysis
We report continuous variables as means (standard deviation) or medians (interquartile range), and categorical variables as frequencies (proportions), as appropriate. Summative statistics with 95% confidence intervals (CI) describe overall group contributions. We used generalized linear models to determine patient factors associated with EDPS versus HPS, entering random effects for individual study sites to control for intercenter variability.
Next, to generate a propensity-matched cohort, we computed propensity scores adjusted from a priori selected variables: age, sex, tertiary versus community hospital, congestive heart failure (CHF), renal failure, COPD, diabetes, liver failure, immunocompromise, primary source of infection, nosocomial source, temperature, initial lactate, presenting hypotension, altered gas exchange, AMS, AKI, and coagulopathy. We then matched subjects 1:1 without optimization or replacement, imposing a caliper width of 0.01; ie, we required matched pairs to have a <1.0% difference in propensity scores. The macro used to match subjects is publically available.15
We then compared resuscitation and patient outcomes in the matched cohort using generalized linear models, ie, doubly-robust estimation (DRE).16 When assessing patient outcomes corrected for resuscitation, we used mixed DRE/multivariable regression. We did this for two reasons: first, DRE has the advantage of only requiring only one approach (propensity vs covariate adjustments) to be correctly specified.16 Second, computing propensity scores adjusted for resuscitation would be inappropriate given that resuscitation occurs after the exposure allocation (HPS vs EDPS). However, these factors could still impact the outcome and in fact, we hypothesized they were potential mediators of the exposure effect. To interrogate this mediating relationship, we recapitulated the DRE modeling but added covariates for resuscitation factors. Resuscitation-adjusted models controlled for timeliness of antibiotics, fluids, and lactate results; blood cultures before antibiotics; repeat lactate obtained, and fluid volume in the first six hours. Since ICU days and LOS are subject to competing risks bias (LOS could be shorter if patients died earlier), we used proportional hazards models where “the event” was defined as a live discharge to censor for mortality and we report output as inverse hazard ratios. We also tested interaction coefficients for discrete bundle elements and HPS to determine if specific bundle elements were effect modifiers for the association between the presenting location and mortality risk. Finally, we estimated attributable risk differences by comparing adjusted odds ratios of adverse outcome with and without adjustment for resuscitation variables, as described by Sahai et al.17
As sensitivity analyses, we recomputed propensity scores and generated a new matched cohort that excluded HPS patients who met criteria for sepsis while already in the ICU for another reason (ie, excluding ICU-presenting sepsis). We then recapitulated all analyses as above for this cohort. We performed analyses using SAS version 9.4 (SAS Institute, Cary, North Carolina).
RESULTS
Prevalence and Outcome Contributions
Of the 11,182 sepsis patients in the database, we classified 2,509 (22%) as HPS (Figure 1). HPS contributed 785 (35%) of 2,241 sepsis-related mortalities, 1,241 (38%) mechanical ventilations, and 1,762 (34%) ICU admissions. Of 39,263 total ICU days and 127,178 hospital days, HPS contributed 18,104 (46.1%) and 44,412 (34.9%) days, respectively.
Patient Characteristics
Most HPS presented early in the hospital course, with 1,352 (53.9%) cases meeting study criteria within three days of admission. Median time from admission to meeting study criteria for HPS was two days (interquartile range: one to seven days). We report selected baseline patient characteristics in Table 1 and adjusted associations of baseline variables with HPS versus EDPS in Table 2. The full cohort characterization is available in Supplemental Table 3. Notably, HPS patients more often had CHF (aOR [adjusted odds ratio}: 1.31, CI: 1.18-1.47) or renal failure (aOR: 1.62, CI: 1.38-1.91), gastrointestinal source of infection (aOR: 1.84, CI: 1.48-2.29), hypothermia (aOR: 1.56, CI: 1.28-1.90) hypotension (aOR: 1.85, CI: 1.65-2.08), or altered gas exchange (aOR: 2.46, CI: 1.43-4.24). In contrast, HPS patients less frequently were admitted from skilled nursing facilities (aOR: 0.44, CI: 0.32-0.60), or had COPD (aOR: 0.53, CI: 0.36-0.76), fever (aOR: 0.70, CI: 0.52-0.91), tachypnea (aOR: 0.76, CI: 0.58-0.98), or AKI (aOR: 082, CI: 0.68-0.97). Other baseline variables were similar, including respiratory source, tachycardia, white cell abnormalities, AMS, and coagulopathies. These associations were preserved in the sensitivity analysis excluding ICU-presenting sepsis.
Propensity Matching
Propensity score matching yielded 1,942 matched pairs (n = 3,884, 77% of HPS patients, 22% of EDPS patients). Table 1 and Supplemental Table 3 show patient characteristics after propensity matching. Supplemental Table 4 shows the propensity model. The frequency densities are shown for the cohort as a function of propensity score in Supplemental Figure 1. After matching, frequencies between groups differed by <5% for all categorical variables assessed. In the sensitivity analysis, propensity matching (model in Supplemental Table 5) resulted in 1,233 matched pairs (n = 2,466, 49% of HPS patients, 14% of EDPS patients), with group differences comparable to the primary analysis.
Process Outcomes
We present propensity-matched differences in initial resuscitation in Figure 2A for all HPS patients, as well as non-ICU-presenting HPS, versus EDPS. HPS patients were roughly half as likely to receive fully 3-hour bundle compliant care (17.0% vs 30.3%, aOR: 0.47, CI: 0.40-0.57), to have blood cultures drawn within three hours prior to antibiotics (44.9% vs 67.2%, aOR: 0.40, CI: 0.35-0.46), or to receive fluid resuscitation initiated within two hours (11.1% vs 26.1%, aOR: 0.35, CI: 0.29-0.42). Antibiotic receipt within one hour was comparable (45.3% vs 48.1%, aOR: 0.89, CI: 0.79-1.01). However, differences emerged for antibiotics within three hours (66.2% vs 83.8%, aOR: 0.38, CI: 0.32-0.44) and persisted at six hours (77.0% vs 92.5%, aOR: 0.27, CI: 0.22-33). Excluding ICU-presenting sepsis from propensity matching exaggerated disparities in antibiotic receipt at one hour (43.4% vs 49.1%, aOR: 0.80, CI: 0.68-0.93), three hours (64.2% vs 86.1%, aOR: 0.29, CI: 0.24-0.35), and six hours (75.7% vs 93.0%, aOR: 0.23, CI: 0.18-0.30). HPS patients more frequently had repeat lactate obtained within 24 hours (62.4% vs 54.3%, aOR: 1.40, CI: 1.23-1.59).
Patient Outcomes
HPS patients had higher mortality (31.2% vs19.3%), mechanical ventilation (51.5% vs27.4%), and ICU admission (60.6% vs 46.5%) (Table 1 and Supplemental Table 6). Figure 2b shows propensity-matched and covariate-adjusted differences in patient outcomes before and after adjusting for initial resuscitation. aORs corresponded to approximate relative risk differences18 of 1.38 (CI: 1.28-1.48), 1.68 (CI: 1.57-1.79), and 1.72 (CI: 1.61-1.84) for mortality, mechanical ventilation, and ICU admission, respectively. HPS was associated with 83% longer mortality-censored ICU stays (five vs nine days, HR–1: 1.83, CI: 1.65-2.03), and 108% longer hospital stay (eight vs 17 days, HR–1: 2.08, CI: 1.93-2.24). After adjustment for resuscitation, all effect sizes decreased but persisted. The initial crystalloid volume was a significant negative effect modifier for mortality (Supplemental Table 7). That is, the magnitude of the association between HPS and greater mortality decreased by a factor of 0.89 per 10 mL/kg given (CI: 0.82-0.97). We did not observe significant interaction from other interventions, or overall bundle compliance, meaning these interventions’ association with mortality did not significantly differ between HPS versus EDPS.
The implied attributable risk difference from discrepancies in initial resuscitation was 23.3% for mortality, 35.2% for mechanical ventilation, and 7.6% for ICU admission (Figure 2B). Resuscitation explained 26.5% of longer ICU LOS and 16.7% of longer hospital LOS associated with HPS.
Figure 2C shows sensitivity analysis excluding ICU-presenting sepsis from propensity matching (ie, limiting HPS to hospital ward presentations). Again, HPS was associated with all adverse outcomes, though effect sizes were smaller than in the primary cohort for all outcomes except hospital LOS. In this cohort, resuscitation factors now explained 16.5% of HPS’ association with mortality, and 14.5% of the association with longer ICU LOS. However, they explained a greater proportion (13.0%) of ICU admissions. Attributable risk differences were comparable to the primary cohort for mechanical ventilation (37.6%) and hospital LOS (15.3%).
DISCUSSION
In this analysis of 11,182 sepsis and septic shock patients, HPS contributed 22% of prevalence but >35% of total sepsis mortalities, ICU utilization, and hospital days. HPS patients had higher comorbidity burdens and had clinical presentations less obviously attributable to infection with more severe organ dysfunction. EDPS received antibiotics within three hours about 1.62 times more often than do HPS patients. EDPS patients also receive fluids initiated within two hours about 1.82 times more often than HPS patients do. HPS had nearly 1.5-fold greater mortality and LOS, and nearly two-fold greater mechanical ventilation and ICU utilization. Resuscitation disparities could partially explain these associations. These patterns persisted when comparing only wards presenting HPS with EDPS.
Our analysis revealed several notable findings. First, these data confirm that HPS represents a potentially high-impact target population that contributes adverse outcomes disproportionately frequently with respect to case prevalence.
Our findings, unsurprisingly, revealed HPS and EDPS reflect dramatically different patient populations. We found that the two groups significantly differed by the majority of the baseline factors we compared. It may be worth asking if and how these substantial differences in illness etiology, chronic health, and acute physiology impact what we consider an optimal approach to management. Significant interaction effects of fluid volume on the association between HPS and mortality suggest differential treatment effects may exist between patients. Indeed, patients who newly arrive from the community and those who are several days into admission likely have different volume status. However, no interactions were noted with other bundle elements, such as timeliness of antibiotics or timeliness of initial fluids.
Another potentially concerning observation was that HPS patients were admitted much less frequently from skilled nursing facilities, as it could imply that this poorer-fairing population had a comparatively higher baseline functional status. The fact that 25% of EDPS cases were admitted from these facilities also underscores the need to engage skilled nursing facility providers in future sepsis initiatives.
We found marked disparities in resuscitation. Timely delivery of interventions, such as antibiotics and initial fluid resuscitation, occurred less than half as often for HPS, especially on hospital wards. While evidence supporting the efficacy of specific 3-hour bundle elements remains unsettled,19 a wealth of literature demonstrates a correlation between bundle uptake and decreased sepsis mortality, especially for early antibiotic administration.13,20-26 Some analysis suggests that differing initial resuscitation practices explain different mortality rates in the early goal-directed therapy trials.27 The comparatively poor performance for non-ICU HPS indicates further QI efforts are better focused on inpatient wards, rather than on EDs or ICUs where resuscitation is already delivered with substantially greater fidelity.
While resuscitation differences partially explained outcome discrepancies between groups, they did not account for as much variation as expected. Though resuscitation accounted for >35% of attributable mechanical ventilation risk, it explained only 16.5% of mortality differences for non-ICU HPS vs EDPS. We speculate that several factors may contribute.
First, HPS patients are already hospitalized for another acute insult and may be too physiologically brittle to derive equal benefit from initial resuscitation. Some literature suggests protocolized sepsis resuscitation may paradoxically be more effective in milder/earlier disease.28
Second, clinical information indicating septic organ dysfunction may become available too late in HPS—a possible data limitation where inpatient providers are counterintuitively more likely to miss early signs of patients’ deterioration and a subsequent therapeutic window. Several studies found that fluid resuscitation is associated with improved sepsis outcomes only when it is administered very early.11,29-31 In inpatient wards, decreased monitoring32 and human factors (eg, hospital workflow, provider-to-patient ratios, electronic documentation burdens)33,34 may hinder early diagnosis. In contrast, ED environments are explicitly designed to identify acutely ill patients and deliver intervention rapidly. If HPS patients were sicker when they were identified, this would also explain their more severe organ dysfunctions. Our data seems to support this possibility. HPS patients had tachypnea less frequently but more often had impaired gas exchange. This finding may suggest that early tachypnea was either less often detected or documented, or that it had progressed further by the time of detection.
Third, inpatients with sepsis may more often present with greater diagnostic complexity. We observed that HPS patients were more often euthermic and less often tachypneic. Beyond suggesting a greater diagnostic challenge, this also raises questions as to whether differences reflect patient physiology (response to infection) or iatrogenic factors (eg, prior antipyretics). Higher comorbidity and acute physiological burdens also limit the degree to which new organ dysfunction can be clearly attributed to infection. We note differences in the proportion of patients who received antibiotics increased over time, suggesting that HPS patients who received delayed antibiotics did so much later than their EDPS counterparts. This lag could also arise from diagnostic difficulty.
All three possibilities highlight a potential lead time effect, where the same measured three-hour period on the wards, between meeting sepsis criteria and starting treatment, actually reflects a longer period between (as yet unmeasurable) pathobiologic “time zero” and treatment versus the ED. The time of sepsis detection, as distinct from the time of sepsis onset, therefore proves difficult to evaluate and impossible to account for statistically.
Regardless, our findings suggest additional difficulty in both the recognition and resuscitation of inpatient sepsis. Inpatients, especially with infections, may need closer monitoring. How to cost effectively implement this monitoring is a challenge that deserves attention.
A more rational systems approach to HPS likely combines efforts to improve initial resuscitation with other initiatives aimed at both improving monitoring and preventing infection.
To be clear, we do not imply that timely initial resuscitation does not matter on the wards. Rather, resuscitation-focused QI alone does not appear to be sufficient to overcome differences in outcomes for HPS. The 23.3% attributable mortality risk we observed still implies that resuscitation differences could explain nearly one in four excess HPS mortalities. We previously showed that timely resuscitation is strongly associated with better outcomes.11,13,30 As discussed above, the unclear degree to which better resuscitation is a marker for more obvious presentations is a persistent limitation of prior investigations and the present study.
Taken together, the ultimate question that this study raises but cannot answer is whether the timely recognition of sepsis, rather than any specific treatment, is what truly improves outcomes.
In addition to those above, this study has several limitations. Our study did not differentiate HPS with respect to patients admitted for noninfectious reasons and who subsequently became septic versus nonseptic patients admitted for an infection who subsequently became septic from that infection. Nor could we discriminate between missed ED diagnoses and true delayed presentations. We note distinguishing these entities clinically can be equally challenging. Additionally, this was a propensity-matched retrospective analysis of an existing sepsis cohort, and the many limitations of both retrospective study and propensity matching apply.35,36 We note that randomizing patients to develop sepsis in the community versus hospital is not feasible and that two of our aims intended to describe overall patterns rather than causal effects. We could not ascertain robust measures of severity of illness (eg, SOFA) because a real world setting precludes required data points—eg, urine output is unreliably recorded. We also note incomplete overlap between inclusion criteria and either Sepsis-2 or -3 definitions,1,37 because we designed and populated our database prior to publication of Sepsis-3. Further, we could not account for surgical source control, the appropriateness of antimicrobial therapy, mechanical ventilation before sepsis onset, or most treatments given after initial resuscitation.
In conclusion, hospital-presenting sepsis accounted for adverse patient outcomes disproportionately to prevalence. HPS patients had more complex presentations, received timely antibiotics half as often ED-presenting sepsis, and had nearly twice the mortality odds. Resuscitation disparities explained roughly 25% of this difference.
Disclosures
The authors have no conflicts of interest to disclose.
Funding
This investigation was funded in part by a grant from the Center for Medicare and Medicaid Innovation to the High Value Healthcare Collaborative, of which the study sites’ umbrella health system was a part. This grant helped fund the underlying QI program and database in this study.
1. Singer M, Deutschman CS, Seymour CW, et al. The third international consensus definitions for sepsis and septic shock (Sepsis-3). JAMA. 2016;315(8):801-810. doi: 10.1001/jama.2016.0287. PubMed
2. Torio CMA, Andrews RMA. National inpatient hospital costs: the most expensive conditions by payer, 2011. In. Statistical Brief No. 160. Rockville, MD: Agency for Healthcare Research and Quality; 2013. PubMed
3. Liu V, Escobar GJ, Greene JD, et al. Hospital deaths in patients with sepsis from 2 independent cohorts. JAMA. 2014;312(1):90-92. doi: 10.1001/jama.2014.5804. PubMed
4. Seymour CW, Liu VX, Iwashyna TJ, et al. Assessment of clinical criteria for sepsis: for the third international consensus definitions for sepsis and septic shock (Sepsis-3). JAMA. 2016;315(8):762-774. doi: 10.1001/jama.2016.0288. PubMed
5. Jones SL, Ashton CM, Kiehne LB, et al. Outcomes and resource use of sepsis-associated stays by presence on admission, severity, and hospital type. Med Care. 2016;54(3):303-310. doi: 10.1097/MLR.0000000000000481. PubMed
6. Page DB, Donnelly JP, Wang HE. Community-, healthcare-, and hospital-acquired severe sepsis hospitalizations in the university healthsystem consortium. Crit Care Med. 2015;43(9):1945-1951. doi: 10.1097/CCM.0000000000001164. PubMed
7. Rothman M, Levy M, Dellinger RP, et al. Sepsis as 2 problems: identifying sepsis at admission and predicting onset in the hospital using an electronic medical record-based acuity score. J Crit Care. 2016;38:237-244. doi: 10.1016/j.jcrc.2016.11.037. PubMed
8. Chan P, Peake S, Bellomo R, Jones D. Improving the recognition of, and response to in-hospital sepsis. Curr Infect Dis Rep. 2016;18(7):20. doi: 10.1007/s11908-016-0528-7. PubMed
9. Rhodes A, Evans LE, Alhazzani W, et al. Surviving sepsis campaign: international guidelines for management of sepsis and septic shock: 2016. Crit Care Med. 2017;45(3):486-552. doi: 10.1097/CCM.0000000000002255. PubMed
10. Levy MM, Evans LE, Rhodes A. The Surviving Sepsis Campaign Bundle: 2018 Update. Crit Care Med. 2018;46(6):997-1000. doi: 10.1097/CCM.0000000000003119. PubMed
11. Leisman DE, Goldman C, Doerfler ME, et al. Patterns and outcomes associated with timeliness of initial crystalloid resuscitation in a prospective sepsis and septic shock cohort. Crit Care Med. 2017;45(10):1596-1606. doi: 10.1097/CCM.0000000000002574. PubMed
12. Leisman DE, Doerfler ME, Schneider SM, Masick KD, D’Amore JA, D’Angelo JK. Predictors, prevalence, and outcomes of early crystalloid responsiveness among initially hypotensive patients with sepsis and septic shock. Crit Care Med. 2018;46(2):189-198. doi: 10.1097/CCM.0000000000002834. PubMed
13. Leisman DE, Doerfler ME, Ward MF, et al. Survival benefit and cost savings from compliance with a simplified 3-hour sepsis bundle in a series of prospective, multisite, observational cohorts. Crit Care Med. 2017;45(3):395-406. doi: 10.1097/CCM.0000000000002184. PubMed
14. Doerfler ME, D’Angelo J, Jacobsen D, et al. Methods for reducing sepsis mortality in emergency departments and inpatient units. Jt Comm J Qual Patient Saf. 2015;41(5):205-211. doi: 10.1016/S1553-7250(15)41027-X. PubMed
15. Murphy B, Fraeman KH. A general SAS® macro to implement optimal N:1 propensity score matching within a maximum radius. In: Paper 812-2017. Waltham, MA: Evidera; 2017. https://support.sas.com/resources/papers/proceedings17/0812-2017.pdf. Accessed February 20, 2019.
16. Funk MJ, Westreich D, Wiesen C, Stürmer T, Brookhart MA, Davidian M. Doubly robust estimation of causal effects. Am J Epidemiol. 2011;173(7):761-767. doi: 10.1093/aje/kwq439. PubMed
17. Sahai HK, Khushid A. Statistics in Epidemiology: Methods, Techniques, and Applications. Boca Raton, FL: CRC Press; 1995.
18. VanderWeele TJ. On a square-root transformation of the odds ratio for a common outcome. Epidemiology. 2017;28(6):e58-e60. doi: 10.1097/EDE.0000000000000733. PubMed
19. Pepper DJ, Natanson C, Eichacker PQ. Evidence underpinning the centers for medicare & medicaid services’ severe sepsis and septic shock management bundle (SEP-1). Ann Intern Med. 2018;168(8):610-612. doi: 10.7326/L18-0140. PubMed
20. Levy MM, Rhodes A, Phillips GS, et al. Surviving sepsis campaign: association between performance metrics and outcomes in a 7.5-year study. Crit Care Med. 2015;43(1):3-12. doi: 10.1097/CCM.0000000000000723. PubMed
11. Liu VX, Morehouse JW, Marelich GP, et al. Multicenter Implementation of a Treatment Bundle for Patients with Sepsis and Intermediate Lactate Values. Am J Respir Crit Care Med. 2016;193(11):1264-1270. doi: 10.1164/rccm.201507-1489OC. PubMed
22. Miller RR, Dong L, Nelson NC, et al. Multicenter implementation of a severe sepsis and septic shock treatment bundle. Am J Respir Crit Care Med. 2013;188(1):77-82. doi: 10.1164/rccm.201212-2199OC. PubMed
23. Seymour CW, Gesten F, Prescott HC, et al. Time to treatment and mortality during mandated emergency care for sepsis. N Engl J Med. 2017;376(23):2235-2244. doi: 10.1056/NEJMoa1703058. PubMed
24. Pruinelli L, Westra BL, Yadav P, et al. Delay within the 3-hour surviving sepsis campaign guideline on mortality for patients with severe sepsis and septic shock. Crit Care Med. 2018;46(4):500-505. doi: 10.1097/CCM.0000000000002949. PubMed
25. Kumar A, Roberts D, Wood KE, et al. Duration of hypotension before initiation of effective antimicrobial therapy is the critical determinant of survival in human septic shock. Crit Care Med. 2006;34(6):1589-1596. doi: 10.1097/01.CCM.0000217961.75225.E9. PubMed
26. Liu VX, Fielding-Singh V, Greene JD, et al. The timing of early antibiotics and hospital mortality in sepsis. Am J Respir Crit Care Med. 2017;196(7):856-863. doi: 10.1164/rccm.201609-1848OC. PubMed
27. Kalil AC, Johnson DW, Lisco SJ, Sun J. Early goal-directed therapy for sepsis: a novel solution for discordant survival outcomes in clinical trials. Crit Care Med. 2017;45(4):607-614. doi: 10.1097/CCM.0000000000002235. PubMed
28. Kellum JA, Pike F, Yealy DM, et al. relationship between alternative resuscitation strategies, host response and injury biomarkers, and outcome in septic shock: analysis of the protocol-based care for early septic shock study. Crit Care Med. 2017;45(3):438-445. doi: 10.1097/CCM.0000000000002206. PubMed
29. Seymour CW, Cooke CR, Heckbert SR, et al. Prehospital intravenous access and fluid resuscitation in severe sepsis: an observational cohort study. Crit Care. 2014;18(5):533. doi: 10.1186/s13054-014-0533-x. PubMed
30. Leisman D, Wie B, Doerfler M, et al. Association of fluid resuscitation initiation within 30 minutes of severe sepsis and septic shock recognition with reduced mortality and length of stay. Ann Emerg Med. 2016;68(3):298-311. doi: 10.1016/j.annemergmed.2016.02.044. PubMed
31. Lee SJ, Ramar K, Park JG, Gajic O, Li G, Kashyap R. Increased fluid administration in the first three hours of sepsis resuscitation is associated with reduced mortality: a retrospective cohort study. Chest. 2014;146(4):908-915. doi: 10.1378/chest.13-2702. PubMed
32. Smyth MA, Daniels R, Perkins GD. Identification of sepsis among ward patients. Am J Respir Crit Care Med. 2015;192(8):910-911. doi: 10.1164/rccm.201507-1395ED. PubMed
33. Wenger N, Méan M, Castioni J, Marques-Vidal P, Waeber G, Garnier A. Allocation of internal medicine resident time in a Swiss hospital: a time and motion study of day and evening shifts. Ann Intern Med. 2017;166(8):579-586. doi: 10.7326/M16-2238. PubMed
34. Mamykina L, Vawdrey DK, Hripcsak G. How do residents spend their shift time? A time and motion study with a particular focus on the use of computers. Acad Med. 2016;91(6):827-832. doi: 10.1097/ACM.0000000000001148. PubMed
35. Kaji AH, Schriger D, Green S. Looking through the retrospectoscope: reducing bias in emergency medicine chart review studies. Ann Emerg Med. 2014;64(3):292-298. doi: 10.1016/j.annemergmed.2014.03.025. PubMed
36. Leisman DE. Ten pearls and pitfalls of propensity scores in critical care research: a guide for clinicians and researchers. Crit Care Med. 2019;47(2):176-185. doi: 10.1097/CCM.0000000000003567. PubMed
37. Levy MM, Fink MP, Marshall JC, et al. 2001 SCCM/ESICM/ACCP/ATS/SIS international sepsis definitions conference. Crit Care Med. 2003;31(4):1250-1256. doi: 10.1097/01.CCM.0000050454.01978.3B. PubMed
© 2019 Society of Hospital Medicine
Resuming Anticoagulation following Upper Gastrointestinal Bleeding among Patients with Nonvalvular Atrial Fibrillation—A Microsimulation Analysis
Anticoagulation is commonly used in the management of atrial fibrillation to reduce the risk of ischemic stroke. Warfarin and other anticoagulants increase the risk of hemorrhagic complications, including upper gastrointestinal bleeding (UGIB). Following UGIB, management of anticoagulation is highly variable. Many patients permanently discontinue anticoagulation, while others continue without interruption.1-4 Among patients who resume warfarin, different cohorts have measured median times to resumption ranging from four days to 50 days.1-3 Outcomes data are sparse, and clinical guidelines offer little direction.5
Following UGIB, the balance between the risks and benefits of anticoagulation changes over time. Rebleeding risk is highest immediately after the event and declines quickly; therefore, rapid resumption of anticoagulation causes patient harm.3 Meanwhile, the risk of stroke remains constant, and delay in resumption of anticoagulation is associated with increased risk of stroke and death.1 At some point in time following the initial UGIB, the expected harm from bleeding would equal the expected harm from stroke. This time point would represent the optimal time to restart anticoagulation.
Trial data are unlikely to identify the optimal time for restarting anticoagulation. A randomized trial comparing discrete reinitiation times (eg, two weeks vs six weeks) may easily miss the optimal timing. Moreover, because the daily probability of thromboembolic events is low, large numbers of patients would be required to power such a study. In addition, a number of oral anticoagulants are now approved for prevention of thromboembolic stroke in atrial fibrillation, and each drug may have different optimal timing.
In contrast to randomized trials that would be impracticable for addressing this clinical issue, microsimulation modeling can provide granular information regarding the optimal time to restart anticoagulation. Herein, we set out to estimate the expected benefit of reinitiation of warfarin, the most commonly used oral anticoagulant,6 or apixaban, the direct oral anticoagulant with the most favorable risk profile,7 as a function of days after UGIB.
METHODS
We previously described a microsimulation model of anticoagulation among patients with nonvalvular atrial fibrillation (NVAF; hereafter, we refer to this model as the Personalized Anticoagulation Decision-Making Assistance model, or PADMA).8,9 For this study, we extended this model to incorporate the probability of rebleeding following UGIB and include apixaban as an alternative to warfarin. This model begins with a synthetic population following UGIB, the members of which are at varying risk for thromboembolism, recurrent UGIB, and other hemorrhages. For each patient, the model simulates a number of possible events (eg, thromboembolic stroke, intracranial hemorrhage, rebleeding, and other major extracranial hemorrhages) on each day of an acute period of 90 days after hemostasis. Patients who survive until the end of the acute period enter a simulation with annual, rather than daily, cycles. Our model then estimates total quality-adjusted life-years (QALYs) for each patient, discounted to the present. We report the average discounted QALYs produced by the model for the same population if all individuals in our input population were to resume either warfarin or apixaban on a specific day. Input parameters and ranges are summarized in Table 1, a simplified schematic of our model is shown in the Supplemental Appendix, and additional details regarding model structure and assumptions can be found in earlier work.8,9 We simulated from a health system perspective over a lifelong time horizon. All analyses were performed in version 14 of Stata (StataCorp, LLC, College Station, Texas).
Synthetic Population
To generate a population reflective of the comorbidities and age distribution of the US population with NVAF, we merged relevant variables from the National Health and Nutrition Examination Survey (NHANES; 2011-2012), using multiple imputation to correct for missing variables.10 We then bootstrapped to national population estimates by age and sex to arrive at a hypothetical population of the United States.11 Because NHANES does not include atrial fibrillation, we applied sex- and age-specific prevalence rates from the AnTicoagulation and Risk Factors In Atrial Fibrillation study.12 We then calculated commonly used risk scores (CHA2DS2-Vasc and HAS-BLED) for each patient and limited the population to patients with a CHA2DS2-Vasc score of one or greater.13,14 The population resuming apixaban was further limited to patients whose creatinine clearance was 25 mL/min or greater in keeping with the entry criteria in the phase 3 clinical trial on which the medication’s approval was based.15
To estimate patient-specific probability of rebleeding, we generated a Rockall score for each patient.16 Although the discrimination of the Rockall score is limited for individual patients, as with all other tools used to predict rebleeding following UGIB, the Rockall score has demonstrated reasonable calibration across a threefold risk gradient.17-19 International consensus guidelines recommend the Rockall score as one of two risk prediction tools for clinical use in the management of patients with UGIB.20 In addition, because the Rockall score includes some demographic components (five of a possible 11 points), our estimates of rebleeding risk are covariant with other patient-specific risks. We assumed that the endoscopic components of the Rockall score were present in our cohort at the same frequency as in the original derivation and are independent of known patient risk factors.16 For example, 441 out of 4,025 patients in the original Rockall derivation cohort presented with a systolic blood pressure less than 100 mm Hg. We assumed that an independent and random 10.96% of the cohort would present with shock, which confers two points in the Rockall score.
The population was replicated 60 times, with identical copies of the population resuming anticoagulation on each of days 1-60 (where day zero represents hemostasis). Intermediate data regarding our simulated population can be found in the Supplemental Appendix and in prior work.
Event Type, Severity, and Mortality
Each patient in our simulation could sustain several discrete and independent events: ischemic stroke, intracranial hemorrhage, recurrent UGIB, or extracranial major hemorrhage other than recurrent UGIB. As in prior analyses using the PADMA model, we did not consider minor hemorrhagic events.8
The probability of each event was conditional on the corresponding risk scoring system. Patient-specific probability of ischemic stroke was conditional on CHA2DS2-Vasc score.21,22 Patient-specific probability of intracranial hemorrhage was conditional on HAS-BLED score, with the proportions of intracranial hemorrhage of each considered subtype (intracerebral, subarachnoid, or subdural) bootstrapped from previously-published data.21-24 Patient-specific probability of rebleeding was conditional on Rockall score from the combined Rockall and Vreeburg validation cohorts.17 Patient-specific probability of extracranial major hemorrhage was conditional on HAS-BLED score.21 To avoid double-counting of UGIB, we subtracted the baseline risk of UGIB from the overall rate of extracranial major hemorrhages using previously-published data regarding relative frequency and a bootstrapping approach.25
Probability of Rebleeding Over Time
To estimate the decrease in rebleeding risk over time, we searched the Medline database for systematic reviews of recurrent bleeding following UGIB using the strategy detailed in the Supplemental Appendix. Using the interval rates of rebleeding we identified, we calculated implied daily rates of rebleeding at the midpoint of each interval. For example, 39.5% of rebleeding events occurred within three days of hemostasis, implying a daily rate of approximately 13.2% on day two (32 of 81 events over a three-day period). We repeated this process to estimate daily rates at the midpoint of each reported time interval and fitted an exponential decay function.26 Our exponential fitted these datapoints quite well, but we lacked sufficient data to test other survival functions (eg, Gompertz, lognormal, etc.). Our fitted exponential can be expressed as:
P rebleeding = b 0 *exp(b 1 *day)
where b0 = 0.1843 (SE: 0.0136) and b1 = –0.1563 (SE: 0.0188). For example, a mean of 3.9% of rebleeding episodes will occur on day 10 (0.1843 *exp(–0.1563 *10)).
Relative Risks of Events with Anticoagulation
For patients resuming warfarin, the probabilities of each event were adjusted based on patient-specific daily INR. All INRs were assumed to be 1.0 until the day of warfarin reinitiation, after which interpolated trajectories of postinitiation INR measurements were sampled for each patient from an earlier study of clinical warfarin initiation.27 Relative risks of ischemic stroke and hemorrhagic events were calculated based on each day’s INR.
For patients taking apixaban, we assumed that the medication would reach full therapeutic effect one day after reinitiation. Based on available evidence, we applied the relative risks of each event with apixaban compared with warfarin.25
Future Disability and Mortality
Each event in our simulation resulted in hospitalization. Length of stay was sampled for each diagnosis.28 The disutility of hospitalization was estimated based on length of stay.8 Inpatient mortality and future disability were predicted for each event as previously described.8 We assumed that recurrent episodes of UGIB conferred morbidity and mortality identical to extracranial major hemorrhages more broadly.29,30
Disutilities
We used a multiplicative model for disutility with baseline utilities conditional on age and sex.31 Each day after resumption of anticoagulation carried a disutility of 0.012 for warfarin or 0.002 for apixaban, which we assumed to be equivalent to aspirin in disutility.32 Long-term disutility and life expectancy were conditional on modified Rankin Score (mRS).33,34 We discounted all QALYs to day zero using standard exponential discounting and a discount rate centered at 3%. We then computed the average discounted QALYs among the cohort of patients that resumed anticoagulation on each day following the index UGIB.
Sensitivity Analyses and Metamodel
To assess sensitivity to continuously varying input parameters, such as discount rate, the proportion of extracranial major hemorrhages that are upper GI bleeds, and inpatient mortality from extracranial major hemorrhage, we constructed a metamodel (a regression model of our microsimulation results).35 We tested for interactions among input parameters and dropped parameters that were not statistically significant predictors of discounted QALYs from our metamodel. We then tested for interactions between each parameter and day resuming anticoagulation to determine which factors may impact the optimal day of reinitiation. Finally, we used predicted marginal effects from our metamodel to assess the change in optimal day across the ranges of each input parameter when other parameters were held at their medians.
RESULTS
Resuming warfarin on day zero produced the fewest QALYs. With delay in reinitiation of anticoagulation, expected QALYs increased, peaked, and then declined for all scenarios. In our base-case simulation of warfarin, peak utility was achieved by resumption 41 days after the index UGIB. Resumption between days 32 and 51 produced greater than 99.9% of peak utility. In our base-case simulation of apixaban, peak utility was achieved by resumption 32 days after the index UGIB. Resumption between days 21 and 47 produced greater than 99.9% of peak utility. Results for warfarin and apixaban are shown in Figures 1 and 2, respectively.
The optimal day of warfarin reinitiation was most sensitive to CHA2DS2-Vasc scores and varied by around 11 days between a CHA2DS2-Vasc score of one and a CHA2DS2-Vasc score of six (the 5th and 95th percentiles, respectively) when all other parameters are held at their medians. Results were comparatively insensitive to rebleeding risk. Varying Rockall score from two to seven (the 5th and 95th percentiles, respectively) added three days to optimal warfarin resumption. Varying other parameters from the 5th to the 95th percentile (including HAS-BLED score, sex, age, and discount rate) changed expected QALYs but did not change the optimal day of reinitiation of warfarin. Optimal day of reinitiation for warfarin stratified by CHA2DS2-Vasc score is shown in Table 2.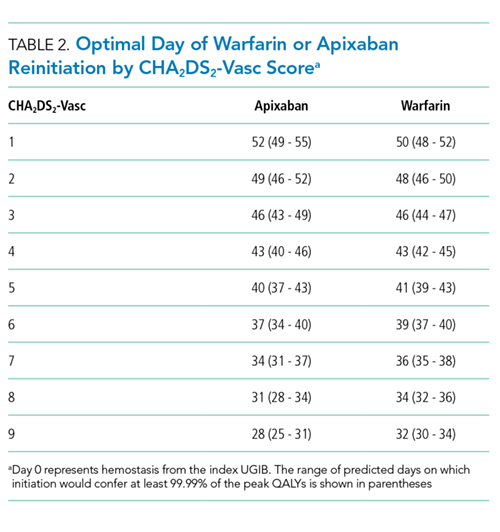
Sensitivity analyses for apixaban produced broadly similar results, but with greater sensitivity to rebleeding risk. Optimal day of reinitiation varied by 15 days over the examined range of CHA2DS2-Vasc scores (Table 2) and by six days over the range of Rockall scores (Supplemental Appendix). Other input parameters, including HAS-BLED score, age, sex, and discount rate, changed expected QALYs and were significant in our metamodel but did not affect the optimal day of reinitiation. Metamodel results for both warfarin and apixaban are included in the Supplemental Appendix.
DISCUSSION
Anticoagulation is frequently prescribed for patients with NVAF, and hemorrhagic complications are common. Although anticoagulants are withheld following hemorrhages, scant evidence to inform the optimal timing of reinitiation is available. In this microsimulation analysis, we found that the optimal time to reinitiate anticoagulation following UGIB is around 41 days for warfarin and around 32 days for apixaban. We have further demonstrated that the optimal timing of reinitiation can vary by nearly two weeks, depending on a patient’s underlying risk of stroke, and that early reinitiation is more sensitive to rebleeding risk than late reinitiation.
Prior work has shown that early reinitiation of anticoagulation leads to higher rates of recurrent hemorrhage while failure to reinitiate anticoagulation is associated with higher rates of stroke and mortality.1-4,36 Our results add to the literature in a number of important ways. First, our model not only confirms that anticoagulation should be restarted but also suggests when this action should be taken. The competing risks of bleeding and stroke have left clinicians with little guidance; we have quantified the clinical reasoning required for the decision to resume anticoagulation. Second, by including the disutility of hospitalization and long-term disability, our model more accurately represents the complex tradeoffs between recurrent hemorrhage and (potentially disabling) stroke than would a comparison of event rates. Third, our model is conditional upon patient risk factors, allowing clinicians to personalize the timing of anticoagulation resumption. Theory would suggest that patients at higher risk of ischemic stroke benefit from earlier resumption of anticoagulation, while patients at higher risk of hemorrhage benefit from delayed reinitiation. We have quantified the extent to which patient-specific risks should change timing. Fourth, we offer a means of improving expected health outcomes that requires little more than appropriate scheduling. Current practice regarding resuming anticoagulation is widely variable. Many patients never resume warfarin, and those that do resume do so after highly varied periods of time.1-5,36 We offer a means of standardizing clinical practice and improving expected patient outcomes.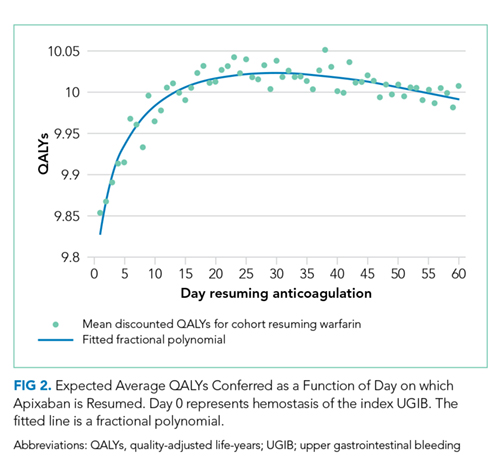
Interestingly, patient-specific risk of rebleeding had little effect on our primary outcome for warfarin, and a greater effect in our simulation of apixaban. It would seem that rebleeding risk, which decreases roughly exponentially, is sufficiently low by the time period at which warfarin should be resumed that patient-specific hemorrhage risk factors have little impact. Meanwhile, at the shorter post-event intervals at which apixaban can be resumed, both stroke risk and patient-specific bleeding risk are worthy considerations.
Our model is subject to several important limitations. First, our predictions of the optimal day as a function of risk scores can only be as well-calibrated as the input scoring systems. It is intuitive that patients with higher risk of rebleeding benefit from delayed reinitiation, while patients with higher risk of thromboembolic stroke benefit from earlier reinitiation. Still, clinicians seeking to operationalize competing risks through these two scores—or, indeed, any score—should be mindful of their limited calibration and shared variance. In other words, while the optimal day of reinitiation is likely in the range we have predicted and varies to the degree demonstrated here, the optimal day we have predicted for each score is likely overly precise. However, while better-calibrated prediction models would improve the accuracy of our model, we believe ours to be the best estimate of timing given available data and this approach to be the most appropriate way to personalize anticoagulation resumption.
Our simulation of apixaban carries an additional source of potential miscalibration. In the clinical trials that led to their approval, apixaban and other direct oral anticoagulants (DOACs) were compared with warfarin over longer periods of time than the acute period simulated in this work. Over a short period of time, patients treated with more rapidly therapeutic medications (in this case, apixaban) would receive more days of effective therapy compared with a slower-onset medication, such as warfarin. Therefore, the relative risks experienced by patients are likely different over the time period we have simulated compared with those measured over longer periods of time (as in phase 3 clinical trials). Our results for apixaban should be viewed as more limited than our estimates for warfarin. More broadly, simulation analyses are intended to predict overall outcomes that are difficult to measure. While other frameworks to assess model credibility exist, the fact remains that no extant datasets can directly validate our predictions.37
Our findings are limited to patients with NVAF. Anticoagulants are prescribed for a variety of indications with widely varied underlying risks and benefits. Models constructed for these conditions would likely produce different timing for resumption of anticoagulation. Unfortunately, large scale cohort studies to inform such models are lacking. Similarly, we simulated UGIB, and our results should not be generalized to populations with other types of bleeding (eg, intracranial hemorrhage). Again, cohort studies of other types of bleeding would be necessary to understand the risks of anticoagulation over time in such populations.
Higher-quality data regarding risk of rebleeding over time would improve our estimates. Our literature search identified only one systematic review that could be used to estimate the risk of recurrent UGIB over time. These data are not adequate to interrogate other forms this survival curve could take, such as Gompertz or Weibull distributions. Recurrence risk almost certainly declines over time, but how quickly it declines carries additional uncertainty.
Despite these limitations, we believe our results to be the best estimates to date of the optimal time of anticoagulation reinitiation following UGIB. Our findings could help inform clinical practice guidelines and reduce variation in care where current practice guidelines are largely silent. Given the potential ease of implementing scheduling changes, our results represent an opportunity to improve patient outcomes with little resource investment.
In conclusion, after UGIB associated with anticoagulation, our model suggests that warfarin is optimally restarted approximately six weeks following hemostasis and that apixaban is optimally restarted approximately one month following hemostasis. Modest changes to this timing based on probability of thromboembolic stroke are reasonable.
Disclosures
The authors have nothing to disclose.
Funding
The authors received no specific funding for this work.
1. Witt DM, Delate T, Garcia DA, et al. Risk of thromboembolism, recurrent hemorrhage, and death after warfarin therapy interruption for gastrointestinal tract bleeding. Arch Intern Med. 2012;172(19):1484-1491. doi: 10.1001/archinternmed.2012.4261. PubMed
2. Sengupta N, Feuerstein JD, Patwardhan VR, et al. The risks of thromboembolism vs recurrent gastrointestinal bleeding after interruption of systemic anticoagulation in hospitalized inpatients with gastrointestinal bleeding: a prospective study. Am J Gastroenterol. 2015;110(2):328-335. doi: 10.1038/ajg.2014.398. PubMed
3. Qureshi W, Mittal C, Patsias I, et al. Restarting anticoagulation and outcomes after major gastrointestinal bleeding in atrial fibrillation. Am J Cardiol. 2014;113(4):662-668. doi: 10.1016/j.amjcard.2013.10.044. PubMed
4. Milling TJ, Spyropoulos AC. Re-initiation of dabigatran and direct factor Xa antagonists after a major bleed. Am J Emerg Med. 2016;34(11):19-25. doi: 10.1016/j.ajem.2016.09.049. PubMed
5. Brotman DJ, Jaffer AK. Resuming anticoagulation in the first week following gastrointestinal tract hemorrhage. Arch Intern Med. 2012;172(19):1492-1493. doi: 10.1001/archinternmed.2012.4309. PubMed
6. Barnes GD, Lucas E, Alexander GC, Goldberger ZD. National trends in ambulatory oral anticoagulant use. Am J Med. 2015;128(12):1300-5. doi: 10.1016/j.amjmed.2015.05.044. PubMed
7. Noseworthy PA, Yao X, Abraham NS, Sangaralingham LR, McBane RD, Shah ND. Direct comparison of dabigatran, rivaroxaban, and apixaban for effectiveness and safety in nonvalvular atrial fibrillation. Chest. 2016;150(6):1302-1312. doi: 10.1016/j.chest.2016.07.013. PubMed
8. Pappas MA, Barnes GD, Vijan S. Personalizing bridging anticoagulation in patients with nonvalvular atrial fibrillation—a microsimulation analysis. J Gen Intern Med. 2017;32(4):464-470. doi: 10.1007/s11606-016-3932-7. PubMed
9. Pappas MA, Vijan S, Rothberg MB, Singer DE. Reducing age bias in decision analyses of anticoagulation for patients with nonvalvular atrial fibrillation – a microsimulation study. PloS One. 2018;13(7):e0199593. doi: 10.1371/journal.pone.0199593. PubMed
10. National Center for Health Statistics. National Health and Nutrition Examination Survey. https://www.cdc.gov/nchs/nhanes/about_nhanes.htm. Accessed August 30, 2018.
11. United States Census Bureau. Age and sex composition in the United States: 2014. https://www.census.gov/data/tables/2014/demo/age-and-sex/2014-age-sex-composition.html. Accessed August 30, 2018.
12. Go AS, Hylek EM, Phillips KA, et al. Prevalence of diagnosed atrial fibrillation in adults: national implications for rhythm management and stroke prevention: the AnTicoagulation and Risk Factors in Atrial Fibrillation (ATRIA) study. JAMA. 2001;285(18):2370-2375. doi: 10.1001/jama.285.18.2370. PubMed
13. Lip GYH, Nieuwlaat R, Pisters R, Lane DA, Crijns HJGM. Refining clinical risk stratification for predicting stroke and thromboembolism in atrial fibrillation using a novel risk factor-based approach: the euro heart survey on atrial fibrillation. Chest. 2010;137(2):263-272. doi: 10.1378/chest.09-1584. PubMed
14. Pisters R, Lane DA, Nieuwlaat R, de Vos CB, Crijns HJGM, Lip GYH. A novel user-friendly score (HAS-BLED) to assess 1-year risk of major bleeding in patients with atrial fibrillation. Chest. 2010;138(5):1093-1100. doi: 10.1378/chest.10-0134. PubMed
15. Granger CB, Alexander JH, McMurray JJV, et al. Apixaban versus warfarin in patients with atrial fibrillation. N Engl J Med. 2011;365(11):981-992. doi: 10.1056/NEJMoa1107039.
16. Rockall TA, Logan RF, Devlin HB, Northfield TC. Risk assessment after acute upper gastrointestinal haemorrhage. Gut. 1996;38(3):316-321. doi: 10.1136/gut.38.3.316. PubMed
17. Vreeburg EM, Terwee CB, Snel P, et al. Validation of the Rockall risk scoring system in upper gastrointestinal bleeding. Gut. 1999;44(3):331-335. doi: 10.1136/gut.44.3.331. PubMed
18. Enns RA, Gagnon YM, Barkun AN, et al. Validation of the Rockall scoring system for outcomes from non-variceal upper gastrointestinal bleeding in a Canadian setting. World J Gastroenterol. 2006;12(48):7779-7785. doi: 10.3748/wjg.v12.i48.7779. PubMed
19. Stanley AJ, Laine L, Dalton HR, et al. Comparison of risk scoring systems for patients presenting with upper gastrointestinal bleeding: international multicentre prospective study. BMJ. 2017;356:i6432. doi: 10.1136/bmj.i6432. PubMed
20. Barkun AN, Bardou M, Kuipers EJ, et al. International consensus recommendations on the management of patients with nonvariceal upper gastrointestinal bleeding. Ann Intern Med. 2010;152(2):101-113. doi: 10.7326/0003-4819-152-2-201001190-00009. PubMed
21. Friberg L, Rosenqvist M, Lip GYH. Evaluation of risk stratification schemes for ischaemic stroke and bleeding in 182 678 patients with atrial fibrillation: the Swedish atrial fibrillation cohort study. Eur Heart J. 2012;33(12):1500-1510. doi: 10.1093/eurheartj/ehr488. PubMed
22. Friberg L, Rosenqvist M, Lip GYH. Net clinical benefit of warfarin in patients with atrial fibrillation: a report from the Swedish atrial fibrillation cohort study. Circulation. 2012;125(19):2298-2307. doi: 10.1161/CIRCULATIONAHA.111.055079. PubMed
23. Hart RG, Diener HC, Yang S, et al. Intracranial hemorrhage in atrial fibrillation patients during anticoagulation with warfarin or dabigatran: the RE-LY trial. Stroke. 2012;43(6):1511-1517. doi: 10.1161/STROKEAHA.112.650614. PubMed
24. Hankey GJ, Stevens SR, Piccini JP, et al. Intracranial hemorrhage among patients with atrial fibrillation anticoagulated with warfarin or rivaroxaban: the rivaroxaban once daily, oral, direct factor Xa inhibition compared with vitamin K antagonism for prevention of stroke and embolism trial in atrial fibrillation. Stroke. 2014;45(5):1304-1312. doi: 10.1161/STROKEAHA.113.004506. PubMed
25. Eikelboom JW, Wallentin L, Connolly SJ, et al. Risk of bleeding with 2 doses of dabigatran compared with warfarin in older and younger patients with atrial fibrillation : an analysis of the randomized evaluation of long-term anticoagulant therapy (RE-LY trial). Circulation. 2011;123(21):2363-2372. doi: 10.1161/CIRCULATIONAHA.110.004747. PubMed
26. El Ouali S, Barkun A, Martel M, Maggio D. Timing of rebleeding in high-risk peptic ulcer bleeding after successful hemostasis: a systematic review. Can J Gastroenterol Hepatol. 2014;28(10):543-548. doi: 0.1016/S0016-5085(14)60738-1. PubMed
27. Kimmel SE, French B, Kasner SE, et al. A pharmacogenetic versus a clinical algorithm for warfarin dosing. N Engl J Med. 2013;369(24):2283-2293. doi: 10.1056/NEJMoa1310669. PubMed
28. Healthcare Cost and Utilization Project (HCUP), Agency for Healthcare Research and Quality. HCUP Databases. https://www.hcup-us.ahrq.gov/nisoverview.jsp. Accessed August 31, 2018.
29. Guerrouij M, Uppal CS, Alklabi A, Douketis JD. The clinical impact of bleeding during oral anticoagulant therapy: assessment of morbidity, mortality and post-bleed anticoagulant management. J Thromb Thrombolysis. 2011;31(4):419-423. doi: 10.1007/s11239-010-0536-7. PubMed
30. Fang MC, Go AS, Chang Y, et al. Death and disability from warfarin-associated intracranial and extracranial hemorrhages. Am J Med. 2007;120(8):700-705. doi: 10.1016/j.amjmed.2006.07.034. PubMed
31. Guertin JR, Feeny D, Tarride JE. Age- and sex-specific Canadian utility norms, based on the 2013-2014 Canadian Community Health Survey. CMAJ. 2018;190(6):E155-E161. doi: 10.1503/cmaj.170317. PubMed
32. Gage BF, Cardinalli AB, Albers GW, Owens DK. Cost-effectiveness of warfarin and aspirin for prophylaxis of stroke in patients with nonvalvular atrial fibrillation. JAMA. 1995;274(23):1839-1845. doi: 10.1001/jama.1995.03530230025025. PubMed
33. Fang MC, Go AS, Chang Y, et al. Long-term survival after ischemic stroke in patients with atrial fibrillation. Neurology. 2014;82(12):1033-1037. doi: 10.1212/WNL.0000000000000248. PubMed
34. Hong KS, Saver JL. Quantifying the value of stroke disability outcomes: WHO global burden of disease project disability weights for each level of the modified Rankin scale * Supplemental Mathematical Appendix. Stroke. 2009;40(12):3828-3833. doi: 10.1161/STROKEAHA.109.561365. PubMed
35. Jalal H, Dowd B, Sainfort F, Kuntz KM. Linear regression metamodeling as a tool to summarize and present simulation model results. Med Decis Mak. 2013;33(7):880-890. doi: 10.1177/0272989X13492014. PubMed
36. Staerk L, Lip GYH, Olesen JB, et al. Stroke and recurrent haemorrhage associated with antithrombotic treatment after gastrointestinal bleeding in patients with atrial fibrillation: nationwide cohort study. BMJ. 2015;351:h5876. doi: 10.1136/bmj.h5876. PubMed
37. Kopec JA, Finès P, Manuel DG, et al. Validation of population-based disease simulation models: a review of concepts and methods. BMC Public Health. 2010;10(1):710. doi: 10.1186/1471-2458-10-710. PubMed
38. Smith EE, Shobha N, Dai D, et al. Risk score for in-hospital ischemic stroke mortality derived and validated within the Get With The Guidelines-Stroke Program. Circulation. 2010;122(15):1496-1504. doi: 10.1161/CIRCULATIONAHA.109.932822. PubMed
39. Smith EE, Shobha N, Dai D, et al. A risk score for in-hospital death in patients admitted with ischemic or hemorrhagic stroke. J Am Heart Assoc. 2013;2(1):e005207. doi: 10.1161/JAHA.112.005207. PubMed
40. Busl KM, Prabhakaran S. Predictors of mortality in nontraumatic subdural hematoma. J Neurosurg. 2013;119(5):1296-1301. doi: 10.3171/2013.4.JNS122236. PubMed
41. Murphy SL, Kochanek KD, Xu J, Heron M. Deaths: final data for 2012. Natl Vital Stat Rep. 2015;63(9):1-117. http://www.ncbi.nlm.nih.gov/pubmed/26759855. Accessed August 31, 2018.
42. Dachs RJ, Burton JH, Joslin J. A user’s guide to the NINDS rt-PA stroke trial database. PLOS Med. 2008;5(5):e113. doi: 10.1371/journal.pmed.0050113. PubMed
43. Ashburner JM, Go AS, Reynolds K, et al. Comparison of frequency and outcome of major gastrointestinal hemorrhage in patients with atrial fibrillation on versus not receiving warfarin therapy (from the ATRIA and ATRIA-CVRN cohorts). Am J Cardiol. 2015;115(1):40-46. doi: 10.1016/j.amjcard.2014.10.006. PubMed
44. Weinstein MC, Siegel JE, Gold MR, Kamlet MS, Russell LB. Recommendations of the panel on cost-effectiveness in health and medicine. JAMA. 1996;276(15):1253-1258. doi: 10.1001/jama.1996.03540150055031. PubMed
Anticoagulation is commonly used in the management of atrial fibrillation to reduce the risk of ischemic stroke. Warfarin and other anticoagulants increase the risk of hemorrhagic complications, including upper gastrointestinal bleeding (UGIB). Following UGIB, management of anticoagulation is highly variable. Many patients permanently discontinue anticoagulation, while others continue without interruption.1-4 Among patients who resume warfarin, different cohorts have measured median times to resumption ranging from four days to 50 days.1-3 Outcomes data are sparse, and clinical guidelines offer little direction.5
Following UGIB, the balance between the risks and benefits of anticoagulation changes over time. Rebleeding risk is highest immediately after the event and declines quickly; therefore, rapid resumption of anticoagulation causes patient harm.3 Meanwhile, the risk of stroke remains constant, and delay in resumption of anticoagulation is associated with increased risk of stroke and death.1 At some point in time following the initial UGIB, the expected harm from bleeding would equal the expected harm from stroke. This time point would represent the optimal time to restart anticoagulation.
Trial data are unlikely to identify the optimal time for restarting anticoagulation. A randomized trial comparing discrete reinitiation times (eg, two weeks vs six weeks) may easily miss the optimal timing. Moreover, because the daily probability of thromboembolic events is low, large numbers of patients would be required to power such a study. In addition, a number of oral anticoagulants are now approved for prevention of thromboembolic stroke in atrial fibrillation, and each drug may have different optimal timing.
In contrast to randomized trials that would be impracticable for addressing this clinical issue, microsimulation modeling can provide granular information regarding the optimal time to restart anticoagulation. Herein, we set out to estimate the expected benefit of reinitiation of warfarin, the most commonly used oral anticoagulant,6 or apixaban, the direct oral anticoagulant with the most favorable risk profile,7 as a function of days after UGIB.
METHODS
We previously described a microsimulation model of anticoagulation among patients with nonvalvular atrial fibrillation (NVAF; hereafter, we refer to this model as the Personalized Anticoagulation Decision-Making Assistance model, or PADMA).8,9 For this study, we extended this model to incorporate the probability of rebleeding following UGIB and include apixaban as an alternative to warfarin. This model begins with a synthetic population following UGIB, the members of which are at varying risk for thromboembolism, recurrent UGIB, and other hemorrhages. For each patient, the model simulates a number of possible events (eg, thromboembolic stroke, intracranial hemorrhage, rebleeding, and other major extracranial hemorrhages) on each day of an acute period of 90 days after hemostasis. Patients who survive until the end of the acute period enter a simulation with annual, rather than daily, cycles. Our model then estimates total quality-adjusted life-years (QALYs) for each patient, discounted to the present. We report the average discounted QALYs produced by the model for the same population if all individuals in our input population were to resume either warfarin or apixaban on a specific day. Input parameters and ranges are summarized in Table 1, a simplified schematic of our model is shown in the Supplemental Appendix, and additional details regarding model structure and assumptions can be found in earlier work.8,9 We simulated from a health system perspective over a lifelong time horizon. All analyses were performed in version 14 of Stata (StataCorp, LLC, College Station, Texas).
Synthetic Population
To generate a population reflective of the comorbidities and age distribution of the US population with NVAF, we merged relevant variables from the National Health and Nutrition Examination Survey (NHANES; 2011-2012), using multiple imputation to correct for missing variables.10 We then bootstrapped to national population estimates by age and sex to arrive at a hypothetical population of the United States.11 Because NHANES does not include atrial fibrillation, we applied sex- and age-specific prevalence rates from the AnTicoagulation and Risk Factors In Atrial Fibrillation study.12 We then calculated commonly used risk scores (CHA2DS2-Vasc and HAS-BLED) for each patient and limited the population to patients with a CHA2DS2-Vasc score of one or greater.13,14 The population resuming apixaban was further limited to patients whose creatinine clearance was 25 mL/min or greater in keeping with the entry criteria in the phase 3 clinical trial on which the medication’s approval was based.15
To estimate patient-specific probability of rebleeding, we generated a Rockall score for each patient.16 Although the discrimination of the Rockall score is limited for individual patients, as with all other tools used to predict rebleeding following UGIB, the Rockall score has demonstrated reasonable calibration across a threefold risk gradient.17-19 International consensus guidelines recommend the Rockall score as one of two risk prediction tools for clinical use in the management of patients with UGIB.20 In addition, because the Rockall score includes some demographic components (five of a possible 11 points), our estimates of rebleeding risk are covariant with other patient-specific risks. We assumed that the endoscopic components of the Rockall score were present in our cohort at the same frequency as in the original derivation and are independent of known patient risk factors.16 For example, 441 out of 4,025 patients in the original Rockall derivation cohort presented with a systolic blood pressure less than 100 mm Hg. We assumed that an independent and random 10.96% of the cohort would present with shock, which confers two points in the Rockall score.
The population was replicated 60 times, with identical copies of the population resuming anticoagulation on each of days 1-60 (where day zero represents hemostasis). Intermediate data regarding our simulated population can be found in the Supplemental Appendix and in prior work.
Event Type, Severity, and Mortality
Each patient in our simulation could sustain several discrete and independent events: ischemic stroke, intracranial hemorrhage, recurrent UGIB, or extracranial major hemorrhage other than recurrent UGIB. As in prior analyses using the PADMA model, we did not consider minor hemorrhagic events.8
The probability of each event was conditional on the corresponding risk scoring system. Patient-specific probability of ischemic stroke was conditional on CHA2DS2-Vasc score.21,22 Patient-specific probability of intracranial hemorrhage was conditional on HAS-BLED score, with the proportions of intracranial hemorrhage of each considered subtype (intracerebral, subarachnoid, or subdural) bootstrapped from previously-published data.21-24 Patient-specific probability of rebleeding was conditional on Rockall score from the combined Rockall and Vreeburg validation cohorts.17 Patient-specific probability of extracranial major hemorrhage was conditional on HAS-BLED score.21 To avoid double-counting of UGIB, we subtracted the baseline risk of UGIB from the overall rate of extracranial major hemorrhages using previously-published data regarding relative frequency and a bootstrapping approach.25
Probability of Rebleeding Over Time
To estimate the decrease in rebleeding risk over time, we searched the Medline database for systematic reviews of recurrent bleeding following UGIB using the strategy detailed in the Supplemental Appendix. Using the interval rates of rebleeding we identified, we calculated implied daily rates of rebleeding at the midpoint of each interval. For example, 39.5% of rebleeding events occurred within three days of hemostasis, implying a daily rate of approximately 13.2% on day two (32 of 81 events over a three-day period). We repeated this process to estimate daily rates at the midpoint of each reported time interval and fitted an exponential decay function.26 Our exponential fitted these datapoints quite well, but we lacked sufficient data to test other survival functions (eg, Gompertz, lognormal, etc.). Our fitted exponential can be expressed as:
P rebleeding = b 0 *exp(b 1 *day)
where b0 = 0.1843 (SE: 0.0136) and b1 = –0.1563 (SE: 0.0188). For example, a mean of 3.9% of rebleeding episodes will occur on day 10 (0.1843 *exp(–0.1563 *10)).
Relative Risks of Events with Anticoagulation
For patients resuming warfarin, the probabilities of each event were adjusted based on patient-specific daily INR. All INRs were assumed to be 1.0 until the day of warfarin reinitiation, after which interpolated trajectories of postinitiation INR measurements were sampled for each patient from an earlier study of clinical warfarin initiation.27 Relative risks of ischemic stroke and hemorrhagic events were calculated based on each day’s INR.
For patients taking apixaban, we assumed that the medication would reach full therapeutic effect one day after reinitiation. Based on available evidence, we applied the relative risks of each event with apixaban compared with warfarin.25
Future Disability and Mortality
Each event in our simulation resulted in hospitalization. Length of stay was sampled for each diagnosis.28 The disutility of hospitalization was estimated based on length of stay.8 Inpatient mortality and future disability were predicted for each event as previously described.8 We assumed that recurrent episodes of UGIB conferred morbidity and mortality identical to extracranial major hemorrhages more broadly.29,30
Disutilities
We used a multiplicative model for disutility with baseline utilities conditional on age and sex.31 Each day after resumption of anticoagulation carried a disutility of 0.012 for warfarin or 0.002 for apixaban, which we assumed to be equivalent to aspirin in disutility.32 Long-term disutility and life expectancy were conditional on modified Rankin Score (mRS).33,34 We discounted all QALYs to day zero using standard exponential discounting and a discount rate centered at 3%. We then computed the average discounted QALYs among the cohort of patients that resumed anticoagulation on each day following the index UGIB.
Sensitivity Analyses and Metamodel
To assess sensitivity to continuously varying input parameters, such as discount rate, the proportion of extracranial major hemorrhages that are upper GI bleeds, and inpatient mortality from extracranial major hemorrhage, we constructed a metamodel (a regression model of our microsimulation results).35 We tested for interactions among input parameters and dropped parameters that were not statistically significant predictors of discounted QALYs from our metamodel. We then tested for interactions between each parameter and day resuming anticoagulation to determine which factors may impact the optimal day of reinitiation. Finally, we used predicted marginal effects from our metamodel to assess the change in optimal day across the ranges of each input parameter when other parameters were held at their medians.
RESULTS
Resuming warfarin on day zero produced the fewest QALYs. With delay in reinitiation of anticoagulation, expected QALYs increased, peaked, and then declined for all scenarios. In our base-case simulation of warfarin, peak utility was achieved by resumption 41 days after the index UGIB. Resumption between days 32 and 51 produced greater than 99.9% of peak utility. In our base-case simulation of apixaban, peak utility was achieved by resumption 32 days after the index UGIB. Resumption between days 21 and 47 produced greater than 99.9% of peak utility. Results for warfarin and apixaban are shown in Figures 1 and 2, respectively.
The optimal day of warfarin reinitiation was most sensitive to CHA2DS2-Vasc scores and varied by around 11 days between a CHA2DS2-Vasc score of one and a CHA2DS2-Vasc score of six (the 5th and 95th percentiles, respectively) when all other parameters are held at their medians. Results were comparatively insensitive to rebleeding risk. Varying Rockall score from two to seven (the 5th and 95th percentiles, respectively) added three days to optimal warfarin resumption. Varying other parameters from the 5th to the 95th percentile (including HAS-BLED score, sex, age, and discount rate) changed expected QALYs but did not change the optimal day of reinitiation of warfarin. Optimal day of reinitiation for warfarin stratified by CHA2DS2-Vasc score is shown in Table 2.
Sensitivity analyses for apixaban produced broadly similar results, but with greater sensitivity to rebleeding risk. Optimal day of reinitiation varied by 15 days over the examined range of CHA2DS2-Vasc scores (Table 2) and by six days over the range of Rockall scores (Supplemental Appendix). Other input parameters, including HAS-BLED score, age, sex, and discount rate, changed expected QALYs and were significant in our metamodel but did not affect the optimal day of reinitiation. Metamodel results for both warfarin and apixaban are included in the Supplemental Appendix.
DISCUSSION
Anticoagulation is frequently prescribed for patients with NVAF, and hemorrhagic complications are common. Although anticoagulants are withheld following hemorrhages, scant evidence to inform the optimal timing of reinitiation is available. In this microsimulation analysis, we found that the optimal time to reinitiate anticoagulation following UGIB is around 41 days for warfarin and around 32 days for apixaban. We have further demonstrated that the optimal timing of reinitiation can vary by nearly two weeks, depending on a patient’s underlying risk of stroke, and that early reinitiation is more sensitive to rebleeding risk than late reinitiation.
Prior work has shown that early reinitiation of anticoagulation leads to higher rates of recurrent hemorrhage while failure to reinitiate anticoagulation is associated with higher rates of stroke and mortality.1-4,36 Our results add to the literature in a number of important ways. First, our model not only confirms that anticoagulation should be restarted but also suggests when this action should be taken. The competing risks of bleeding and stroke have left clinicians with little guidance; we have quantified the clinical reasoning required for the decision to resume anticoagulation. Second, by including the disutility of hospitalization and long-term disability, our model more accurately represents the complex tradeoffs between recurrent hemorrhage and (potentially disabling) stroke than would a comparison of event rates. Third, our model is conditional upon patient risk factors, allowing clinicians to personalize the timing of anticoagulation resumption. Theory would suggest that patients at higher risk of ischemic stroke benefit from earlier resumption of anticoagulation, while patients at higher risk of hemorrhage benefit from delayed reinitiation. We have quantified the extent to which patient-specific risks should change timing. Fourth, we offer a means of improving expected health outcomes that requires little more than appropriate scheduling. Current practice regarding resuming anticoagulation is widely variable. Many patients never resume warfarin, and those that do resume do so after highly varied periods of time.1-5,36 We offer a means of standardizing clinical practice and improving expected patient outcomes.
Interestingly, patient-specific risk of rebleeding had little effect on our primary outcome for warfarin, and a greater effect in our simulation of apixaban. It would seem that rebleeding risk, which decreases roughly exponentially, is sufficiently low by the time period at which warfarin should be resumed that patient-specific hemorrhage risk factors have little impact. Meanwhile, at the shorter post-event intervals at which apixaban can be resumed, both stroke risk and patient-specific bleeding risk are worthy considerations.
Our model is subject to several important limitations. First, our predictions of the optimal day as a function of risk scores can only be as well-calibrated as the input scoring systems. It is intuitive that patients with higher risk of rebleeding benefit from delayed reinitiation, while patients with higher risk of thromboembolic stroke benefit from earlier reinitiation. Still, clinicians seeking to operationalize competing risks through these two scores—or, indeed, any score—should be mindful of their limited calibration and shared variance. In other words, while the optimal day of reinitiation is likely in the range we have predicted and varies to the degree demonstrated here, the optimal day we have predicted for each score is likely overly precise. However, while better-calibrated prediction models would improve the accuracy of our model, we believe ours to be the best estimate of timing given available data and this approach to be the most appropriate way to personalize anticoagulation resumption.
Our simulation of apixaban carries an additional source of potential miscalibration. In the clinical trials that led to their approval, apixaban and other direct oral anticoagulants (DOACs) were compared with warfarin over longer periods of time than the acute period simulated in this work. Over a short period of time, patients treated with more rapidly therapeutic medications (in this case, apixaban) would receive more days of effective therapy compared with a slower-onset medication, such as warfarin. Therefore, the relative risks experienced by patients are likely different over the time period we have simulated compared with those measured over longer periods of time (as in phase 3 clinical trials). Our results for apixaban should be viewed as more limited than our estimates for warfarin. More broadly, simulation analyses are intended to predict overall outcomes that are difficult to measure. While other frameworks to assess model credibility exist, the fact remains that no extant datasets can directly validate our predictions.37
Our findings are limited to patients with NVAF. Anticoagulants are prescribed for a variety of indications with widely varied underlying risks and benefits. Models constructed for these conditions would likely produce different timing for resumption of anticoagulation. Unfortunately, large scale cohort studies to inform such models are lacking. Similarly, we simulated UGIB, and our results should not be generalized to populations with other types of bleeding (eg, intracranial hemorrhage). Again, cohort studies of other types of bleeding would be necessary to understand the risks of anticoagulation over time in such populations.
Higher-quality data regarding risk of rebleeding over time would improve our estimates. Our literature search identified only one systematic review that could be used to estimate the risk of recurrent UGIB over time. These data are not adequate to interrogate other forms this survival curve could take, such as Gompertz or Weibull distributions. Recurrence risk almost certainly declines over time, but how quickly it declines carries additional uncertainty.
Despite these limitations, we believe our results to be the best estimates to date of the optimal time of anticoagulation reinitiation following UGIB. Our findings could help inform clinical practice guidelines and reduce variation in care where current practice guidelines are largely silent. Given the potential ease of implementing scheduling changes, our results represent an opportunity to improve patient outcomes with little resource investment.
In conclusion, after UGIB associated with anticoagulation, our model suggests that warfarin is optimally restarted approximately six weeks following hemostasis and that apixaban is optimally restarted approximately one month following hemostasis. Modest changes to this timing based on probability of thromboembolic stroke are reasonable.
Disclosures
The authors have nothing to disclose.
Funding
The authors received no specific funding for this work.
1. Witt DM, Delate T, Garcia DA, et al. Risk of thromboembolism, recurrent hemorrhage, and death after warfarin therapy interruption for gastrointestinal tract bleeding. Arch Intern Med. 2012;172(19):1484-1491. doi: 10.1001/archinternmed.2012.4261. PubMed
2. Sengupta N, Feuerstein JD, Patwardhan VR, et al. The risks of thromboembolism vs recurrent gastrointestinal bleeding after interruption of systemic anticoagulation in hospitalized inpatients with gastrointestinal bleeding: a prospective study. Am J Gastroenterol. 2015;110(2):328-335. doi: 10.1038/ajg.2014.398. PubMed
3. Qureshi W, Mittal C, Patsias I, et al. Restarting anticoagulation and outcomes after major gastrointestinal bleeding in atrial fibrillation. Am J Cardiol. 2014;113(4):662-668. doi: 10.1016/j.amjcard.2013.10.044. PubMed
4. Milling TJ, Spyropoulos AC. Re-initiation of dabigatran and direct factor Xa antagonists after a major bleed. Am J Emerg Med. 2016;34(11):19-25. doi: 10.1016/j.ajem.2016.09.049. PubMed
5. Brotman DJ, Jaffer AK. Resuming anticoagulation in the first week following gastrointestinal tract hemorrhage. Arch Intern Med. 2012;172(19):1492-1493. doi: 10.1001/archinternmed.2012.4309. PubMed
6. Barnes GD, Lucas E, Alexander GC, Goldberger ZD. National trends in ambulatory oral anticoagulant use. Am J Med. 2015;128(12):1300-5. doi: 10.1016/j.amjmed.2015.05.044. PubMed
7. Noseworthy PA, Yao X, Abraham NS, Sangaralingham LR, McBane RD, Shah ND. Direct comparison of dabigatran, rivaroxaban, and apixaban for effectiveness and safety in nonvalvular atrial fibrillation. Chest. 2016;150(6):1302-1312. doi: 10.1016/j.chest.2016.07.013. PubMed
8. Pappas MA, Barnes GD, Vijan S. Personalizing bridging anticoagulation in patients with nonvalvular atrial fibrillation—a microsimulation analysis. J Gen Intern Med. 2017;32(4):464-470. doi: 10.1007/s11606-016-3932-7. PubMed
9. Pappas MA, Vijan S, Rothberg MB, Singer DE. Reducing age bias in decision analyses of anticoagulation for patients with nonvalvular atrial fibrillation – a microsimulation study. PloS One. 2018;13(7):e0199593. doi: 10.1371/journal.pone.0199593. PubMed
10. National Center for Health Statistics. National Health and Nutrition Examination Survey. https://www.cdc.gov/nchs/nhanes/about_nhanes.htm. Accessed August 30, 2018.
11. United States Census Bureau. Age and sex composition in the United States: 2014. https://www.census.gov/data/tables/2014/demo/age-and-sex/2014-age-sex-composition.html. Accessed August 30, 2018.
12. Go AS, Hylek EM, Phillips KA, et al. Prevalence of diagnosed atrial fibrillation in adults: national implications for rhythm management and stroke prevention: the AnTicoagulation and Risk Factors in Atrial Fibrillation (ATRIA) study. JAMA. 2001;285(18):2370-2375. doi: 10.1001/jama.285.18.2370. PubMed
13. Lip GYH, Nieuwlaat R, Pisters R, Lane DA, Crijns HJGM. Refining clinical risk stratification for predicting stroke and thromboembolism in atrial fibrillation using a novel risk factor-based approach: the euro heart survey on atrial fibrillation. Chest. 2010;137(2):263-272. doi: 10.1378/chest.09-1584. PubMed
14. Pisters R, Lane DA, Nieuwlaat R, de Vos CB, Crijns HJGM, Lip GYH. A novel user-friendly score (HAS-BLED) to assess 1-year risk of major bleeding in patients with atrial fibrillation. Chest. 2010;138(5):1093-1100. doi: 10.1378/chest.10-0134. PubMed
15. Granger CB, Alexander JH, McMurray JJV, et al. Apixaban versus warfarin in patients with atrial fibrillation. N Engl J Med. 2011;365(11):981-992. doi: 10.1056/NEJMoa1107039.
16. Rockall TA, Logan RF, Devlin HB, Northfield TC. Risk assessment after acute upper gastrointestinal haemorrhage. Gut. 1996;38(3):316-321. doi: 10.1136/gut.38.3.316. PubMed
17. Vreeburg EM, Terwee CB, Snel P, et al. Validation of the Rockall risk scoring system in upper gastrointestinal bleeding. Gut. 1999;44(3):331-335. doi: 10.1136/gut.44.3.331. PubMed
18. Enns RA, Gagnon YM, Barkun AN, et al. Validation of the Rockall scoring system for outcomes from non-variceal upper gastrointestinal bleeding in a Canadian setting. World J Gastroenterol. 2006;12(48):7779-7785. doi: 10.3748/wjg.v12.i48.7779. PubMed
19. Stanley AJ, Laine L, Dalton HR, et al. Comparison of risk scoring systems for patients presenting with upper gastrointestinal bleeding: international multicentre prospective study. BMJ. 2017;356:i6432. doi: 10.1136/bmj.i6432. PubMed
20. Barkun AN, Bardou M, Kuipers EJ, et al. International consensus recommendations on the management of patients with nonvariceal upper gastrointestinal bleeding. Ann Intern Med. 2010;152(2):101-113. doi: 10.7326/0003-4819-152-2-201001190-00009. PubMed
21. Friberg L, Rosenqvist M, Lip GYH. Evaluation of risk stratification schemes for ischaemic stroke and bleeding in 182 678 patients with atrial fibrillation: the Swedish atrial fibrillation cohort study. Eur Heart J. 2012;33(12):1500-1510. doi: 10.1093/eurheartj/ehr488. PubMed
22. Friberg L, Rosenqvist M, Lip GYH. Net clinical benefit of warfarin in patients with atrial fibrillation: a report from the Swedish atrial fibrillation cohort study. Circulation. 2012;125(19):2298-2307. doi: 10.1161/CIRCULATIONAHA.111.055079. PubMed
23. Hart RG, Diener HC, Yang S, et al. Intracranial hemorrhage in atrial fibrillation patients during anticoagulation with warfarin or dabigatran: the RE-LY trial. Stroke. 2012;43(6):1511-1517. doi: 10.1161/STROKEAHA.112.650614. PubMed
24. Hankey GJ, Stevens SR, Piccini JP, et al. Intracranial hemorrhage among patients with atrial fibrillation anticoagulated with warfarin or rivaroxaban: the rivaroxaban once daily, oral, direct factor Xa inhibition compared with vitamin K antagonism for prevention of stroke and embolism trial in atrial fibrillation. Stroke. 2014;45(5):1304-1312. doi: 10.1161/STROKEAHA.113.004506. PubMed
25. Eikelboom JW, Wallentin L, Connolly SJ, et al. Risk of bleeding with 2 doses of dabigatran compared with warfarin in older and younger patients with atrial fibrillation : an analysis of the randomized evaluation of long-term anticoagulant therapy (RE-LY trial). Circulation. 2011;123(21):2363-2372. doi: 10.1161/CIRCULATIONAHA.110.004747. PubMed
26. El Ouali S, Barkun A, Martel M, Maggio D. Timing of rebleeding in high-risk peptic ulcer bleeding after successful hemostasis: a systematic review. Can J Gastroenterol Hepatol. 2014;28(10):543-548. doi: 0.1016/S0016-5085(14)60738-1. PubMed
27. Kimmel SE, French B, Kasner SE, et al. A pharmacogenetic versus a clinical algorithm for warfarin dosing. N Engl J Med. 2013;369(24):2283-2293. doi: 10.1056/NEJMoa1310669. PubMed
28. Healthcare Cost and Utilization Project (HCUP), Agency for Healthcare Research and Quality. HCUP Databases. https://www.hcup-us.ahrq.gov/nisoverview.jsp. Accessed August 31, 2018.
29. Guerrouij M, Uppal CS, Alklabi A, Douketis JD. The clinical impact of bleeding during oral anticoagulant therapy: assessment of morbidity, mortality and post-bleed anticoagulant management. J Thromb Thrombolysis. 2011;31(4):419-423. doi: 10.1007/s11239-010-0536-7. PubMed
30. Fang MC, Go AS, Chang Y, et al. Death and disability from warfarin-associated intracranial and extracranial hemorrhages. Am J Med. 2007;120(8):700-705. doi: 10.1016/j.amjmed.2006.07.034. PubMed
31. Guertin JR, Feeny D, Tarride JE. Age- and sex-specific Canadian utility norms, based on the 2013-2014 Canadian Community Health Survey. CMAJ. 2018;190(6):E155-E161. doi: 10.1503/cmaj.170317. PubMed
32. Gage BF, Cardinalli AB, Albers GW, Owens DK. Cost-effectiveness of warfarin and aspirin for prophylaxis of stroke in patients with nonvalvular atrial fibrillation. JAMA. 1995;274(23):1839-1845. doi: 10.1001/jama.1995.03530230025025. PubMed
33. Fang MC, Go AS, Chang Y, et al. Long-term survival after ischemic stroke in patients with atrial fibrillation. Neurology. 2014;82(12):1033-1037. doi: 10.1212/WNL.0000000000000248. PubMed
34. Hong KS, Saver JL. Quantifying the value of stroke disability outcomes: WHO global burden of disease project disability weights for each level of the modified Rankin scale * Supplemental Mathematical Appendix. Stroke. 2009;40(12):3828-3833. doi: 10.1161/STROKEAHA.109.561365. PubMed
35. Jalal H, Dowd B, Sainfort F, Kuntz KM. Linear regression metamodeling as a tool to summarize and present simulation model results. Med Decis Mak. 2013;33(7):880-890. doi: 10.1177/0272989X13492014. PubMed
36. Staerk L, Lip GYH, Olesen JB, et al. Stroke and recurrent haemorrhage associated with antithrombotic treatment after gastrointestinal bleeding in patients with atrial fibrillation: nationwide cohort study. BMJ. 2015;351:h5876. doi: 10.1136/bmj.h5876. PubMed
37. Kopec JA, Finès P, Manuel DG, et al. Validation of population-based disease simulation models: a review of concepts and methods. BMC Public Health. 2010;10(1):710. doi: 10.1186/1471-2458-10-710. PubMed
38. Smith EE, Shobha N, Dai D, et al. Risk score for in-hospital ischemic stroke mortality derived and validated within the Get With The Guidelines-Stroke Program. Circulation. 2010;122(15):1496-1504. doi: 10.1161/CIRCULATIONAHA.109.932822. PubMed
39. Smith EE, Shobha N, Dai D, et al. A risk score for in-hospital death in patients admitted with ischemic or hemorrhagic stroke. J Am Heart Assoc. 2013;2(1):e005207. doi: 10.1161/JAHA.112.005207. PubMed
40. Busl KM, Prabhakaran S. Predictors of mortality in nontraumatic subdural hematoma. J Neurosurg. 2013;119(5):1296-1301. doi: 10.3171/2013.4.JNS122236. PubMed
41. Murphy SL, Kochanek KD, Xu J, Heron M. Deaths: final data for 2012. Natl Vital Stat Rep. 2015;63(9):1-117. http://www.ncbi.nlm.nih.gov/pubmed/26759855. Accessed August 31, 2018.
42. Dachs RJ, Burton JH, Joslin J. A user’s guide to the NINDS rt-PA stroke trial database. PLOS Med. 2008;5(5):e113. doi: 10.1371/journal.pmed.0050113. PubMed
43. Ashburner JM, Go AS, Reynolds K, et al. Comparison of frequency and outcome of major gastrointestinal hemorrhage in patients with atrial fibrillation on versus not receiving warfarin therapy (from the ATRIA and ATRIA-CVRN cohorts). Am J Cardiol. 2015;115(1):40-46. doi: 10.1016/j.amjcard.2014.10.006. PubMed
44. Weinstein MC, Siegel JE, Gold MR, Kamlet MS, Russell LB. Recommendations of the panel on cost-effectiveness in health and medicine. JAMA. 1996;276(15):1253-1258. doi: 10.1001/jama.1996.03540150055031. PubMed
© 2019 Society of Hospital Medicine
An Academic Research Coach: An Innovative Approach to Increasing Scholarly Productivity in Medicine
Historically, academic medicine faculty were predominantly physician-scientists.1 During the past decade, the number of clinician-educators and nontenured clinicians has grown.2 Many academically oriented clinical faculty at our institution would like to participate in and learn how to conduct quality scholarship. While institutional requirements vary, scholarly work is often required for promotion,3 and faculty may also desire to support the scholarly work of residents. Moreover, a core program component of the Accreditation Council of Graduate Medical Education standards requires faculty to “maintain an environment of inquiry and scholarship with an active research component.”4 Yet clinical faculty often find academic projects to be challenging. Similar to residents, clinical academic faculty frequently lack formal training in health services research or quality improvement science, have insufficient mentorship, and typically have limited uncommitted time and resources.5
One approach to this problem has been to pair junior clinicians with traditional physician scientists as mentors.6,7 This type of mentorship for clinical faculty is increasingly difficult to access because of growing pressure on physician-scientist faculty to conduct their own research, seek extramural funding, meet clinical expectations, and mentor fellows and faculty in their own disciplines.8 Moreover, senior research faculty may not be prepared or have the time to teach junior faculty how to deal with common stumbling blocks (eg, institutional review board [IRB] applications, statistically testable hypothesis development, and statistical analysis).8,9 Seminars or works-in-progress sessions are another strategy to bolster scholarly work, but the experience at our institution is that such sessions are often not relevant at the time of delivery and can be intimidating to clinical faculty who lack extensive knowledge about research methods and prior research experience.
Another approach to supporting the research efforts of academic clinicians is to fund a consulting statistician. However, without sufficient content expertise, statisticians may be frustrated in their efforts to assist clinicians who struggle to formulate a testable question or to work directly with data collected. Statisticians may be inexperienced in writing IRB applications or implementing protocols in a clinical or educational setting. Furthermore, statistical consultations are often limited in scope10 and, in our setting, rarely produce a durable improvement in the research skills of the faculty member or the enduring partnership required to complete a longer-term project. Because of these shortcomings, we have found that purely statistical support resources are often underutilized and ineffective.
Other models to facilitate scholarship have been employed, but few focus on facilitating scholarship of clinical faculty. One strategy involved supporting hospitalist’s academic productivity by reducing hospitalists’ full-time equivalent (FTE) and providing mentorship.11 For many, this approach is likely cost-prohibitive. Others have focused primarily on resident and fellow scholarships.5,6
In this report, we describe an educational innovation to educate and support the scholarly work of academic hospitalists and internists by using an academic research coach. We recruited a health researcher with extensive experience in research methods and strong interpersonal skills with the ability to explain and teach research concepts in an accessible manner. We sought an individual who would provide high-yield single consultations, join project teams to provide ongoing mentorship from conception to completion, and consequently, bolster scholarly productivity and learning among nonresearch clinicians in our Division. We anticipated that providing support for multiple aspects of a project would be more likely to help faculty overcome barriers to research and disseminate their project results as scholarly output.
METHODS
The coach initiative was implemented in the Division of General Internal Medicine at the University of Washington. The Division has over 200 members (60 hospitalists), including clinical instructors and acting instructors, who have not yet been appointed to the regular faculty (clinician-educators and physician scientists), and full-time clinical faculty. Division members staff clinical services at four area hospitals and 10 affiliated internal medicine and specialty clinics. Eligible clients were all Division members, although the focus of the initial program targeted hospitalists at our three primary teaching hospitals. Fellows, residents, students, and faculty from within and outside the Division were welcome to participate in a project involving coaching as long as a Division faculty member was engaged in the project.
Program Description
The overall goal of the coach initiative was to support the scholarly work of primarily clinical Division members. Given our focus was on clinical faculty with little training on research methodology, we did not expect the coach to secure grant funding for the position. Instead, we aimed to increase the quality and quantity of scholarship through publications, abstracts, and small grants. We defined scholarly work broadly: clinical research, quality improvement, medical education research, and other forms of scientific inquiry or synthesis. The coach was established as a 0.50 FTE position with a 12-month annually renewable appointment. The role was deemed that of a coach instead of a mentor because the coach was available to all Division members and involved task-oriented consultations with check-ins to facilitate projects, rather than a deeper more developmental relationship that typically exists with mentoring. The Division leadership identified support for scholarly activity as a high priority and mentorship as an unmet need based on faculty feedback. Clinical revenue supported the position.
Necessary qualifications, determined prior to hiring, included a PhD in health services or related field (eg, epidemiology) or a master’s degree with five years of experience in project management, clinical research, and study design. The position also called for expertise in articulating research questions, selecting study designs, navigating the IRB approval process, collecting/managing data, analyzing statistics, and mentoring and teaching clinical faculty in their scholarly endeavors. A track record in generating academic output (manuscripts and abstracts at regional/national meetings) was required. We circulated a description of the position to Division faculty and to leadership in our School of Public Health.
Based on these criteria, an inaugural coach was hired (author C.M.M.). The coach had a PhD in epidemiology, 10 years of research experience, 16 publications, and had recently finished a National Institutes of Health (NIH) career development award. At the time of hiring, she was a Clinical Assistant Professor in the School of Dentistry, which provided additional FTE. She had no extramural funding but was applying for NIH-level grants and had received several small grants.
To ensure uptake of the coach’s services, we realized that it was necessary to delineate the scope of services available, clarify availability of the coach, and define expectations regarding authorship. We used an iterative process that took into consideration the coach’s expertise, services most needed by the Division’s clinicians, and discussions with Division leadership and faculty at faculty meetings across hospitals and clinics. A range of services and authorship expectations were defined. Consensus was reached that the coach should be invited to coauthor projects where design, analysis, and/or substantial intellectual content was provided and for which authorship criteria were met.12 Collegial reviews by the coach of already developed manuscripts and time-limited, low-intensity consultations that did not involve substantial intellectual contributions did not warrant authorship.12 On this basis, we created and distributed a flyer to publicize these guidelines and invite Division members to contact the coach (Figure 1).
The coach attended Division, section, and clinical group meetings to publicize the initiative. The coach also individually met with faculty throughout the Division, explained her role, described services available, and answered questions. The marketing effort was continuous and calibrated with more or less exposure depending on existing projects and the coach’s availability. In addition, the coach coordinated with the director of the Division’s faculty development program to cohost works-in-progress seminars, identify coach clients to present at these meetings, and provide brief presentations on a basic research skill at meetings. Faculty built rapport with the coach through these activities and became more comfortable reaching out for assistance. Because of the large size of the Division, it was decided to roll out the initiative in a stepwise fashion, starting with hospitalists before expanding to the rest of the Division.
Most faculty contacted the coach by e-mail to request a consultation, at which time the coach requested that they complete a preconsultation handout (Figure 2). Initial coaching appointments lasted one hour and were in-person. Coaching entailed an in-depth analysis of the project plan and advice on how to move the project forward. The coach provided tailored scholarly project advice and expertise in research methods. After initial consultations, she would review grant proposals, IRB applications, manuscripts, case report forms, abstracts, and other products. Her efforts typically focused on improving the methods and scientific and technical writing. Assistance with statistical analysis was provided on a case-by-case basis to maintain broad availability. To address statistically complex questions, the coach had five hours of monthly access to a PhD biostatistician via an on-campus consulting service. Follow-up appointments were encouraged and provided as needed by e-mail, phone, or in-person. The coach conducted regular reach outs to facilitate projects. However, execution of the research was generally the responsibility of the faculty member.
Program Evaluation
To characterize the reach and scope of the program, the coach tracked the number of faculty supported, types of services provided, status of initiated projects, numbers of grants generated, and the dissemination of scholarly products including papers and abstracts. We used these metrics to create summary reports to identify successes and areas for improvement. Monthly meetings between the coach and Division leadership were used to fine-tune the approach.
We surveyed coach clients anonymously to assess their satisfaction with the coach initiative. Using Likert scale questions where 1 = completely disagree and 5 = completely agree, we asked (1) if they would recommend the coach to colleagues, (2) if their work was higher quality because of the coach, (3) if they were overall satisfied with the coach, (4) whether the Division should continue to support the coach, and (5) if the coach’s lack of clinical training negatively affected their experience. This work was considered a quality improvement initiative for which IRB approval was not required.
RESULTS
Over 18 months, the coach supported a 49 Division members including 30 hospitalists and 63 projects. Projects included a wide range of scholarship: medical education research, qualitative research, clinical quality improvement projects, observational studies, and a randomized clinical trial. Many clients (n = 16) used the coach for more than one project. The scope of work included limited support projects (identifying research resource and brainstorming project feasibility) lasting one to two sessions (n = 25), projects with a limited scope (collegial reviews of manuscripts and assistance with IRB submissions) but requiring more than two consultations (n = 24), and ongoing in-depth support projects (contributions on design, data collection, analysis, and manuscript writing) that required three consultations or more (n = 14). The majority of Division members (75%) supported did not have master’s level training in a health services-related area, six had NIH or other national-level funding, and two had small grants funded by local sources prior to providing support. The number of Division faculty on a given project ranged from one to four.
The coach directly supported 13 manuscripts with coach authorship, seven manuscripts without authorship, 11 abstracts, and four grant submissions (Appendix). The coach was a coauthor on all the abstracts and a coinvestigator on the grant applications. Of the 13 publications the coach coauthored, 11 publications have been accepted to peer-reviewed journals and two are currently in the submission process. The types of articles published included one medical evaluation report, one qualitative study, one randomized clinical trial, three quality assessment/improvement reports, and five epidemiologic studies. The types of abstracts included one qualitative report, one systematic review, one randomized clinical trial, two quality improvement projects, two epidemiologic studies, and four medical education projects. Three of four small grants submitted to local and national funders were funded.
The coach’s influence extended beyond the Division. Forty-eight university faculty, fellows, or students not affiliated with general internal medicine benefited from coach coaching: 26 were authors on papers and/or abstracts coauthored by the coach, 17 on manuscripts the coach reviewed without authorship, and five participated in consultations.
The coach found the experience rewarding. She enjoyed working on the methodologic aspects of projects and benefited from being included as coauthor on papers.
Twenty-nine of the 43 faculty (67%) still at the institution responded to the program assessment survey. Faculty strongly agreed that they would recommend the coach to colleagues (average ± standard deviation [SD]: 4.7 ± 0.5), that it improved the quality of their work (4.5 ± 0.9), that they were overall satisfied with the coaching (4.6 ± 0.7), and that the Division should continue to support the coach (4.9 ± 0.4). Faculty did not agree that the lack of clinical training of the coach was a barrier (2.0 ± 1.3).
DISCUSSION
The coach program was highly utilized, well regarded, and delivered substantial, tangible, and academic output. We anticipate the coach initiative will continue to be a valuable resource for our Division and could prove to be a valuable model for other institutions seeking to bolster the scholarly work of clinical academicians.
Several lessons emerged through the course of this project. First, we realized it is essential to select a coach who is both knowledgeable and approachable. We found that after meeting the coach, many faculty sought her help who otherwise would not have. An explicit, ongoing marketing strategy with regular contact with faculty at meetings was a key to receiving consult requests.
Second, the lack of a clinical background did not seem to hinder the coach’s ability to coach clinicians. The coach acknowledged her lack of clinical experience and relied on clients to explain the clinical context of projects. We also learned that the coach’s substantial experience with the logistics of research was invaluable. For example, the coach had substantial experience with the IRB process and her pre-reviews of IRB applications made for a short and relatively seamless experience navigating the IRB process. The coach also facilitated collaborations and leveraged existing resources at our institution. For example, for a qualitative research project, the coach helped identify a health services faculty member with this specific expertise, which led to a successful collaboration and publication. Although a more junior coach with less established qualifications may be helpful with research methods and with the research process, our endeavor suggests that having a more highly trained and experienced researcher was extremely valuable. Finally, we learned that for a Division of our size, the 0.50 FTE allotted to the coach is a minimum requirement. The coach spent approximately four hours a week on marketing, attending faculty meetings and conducting brief didactics, two hours per week on administration, and 14 hours per week on consultations. Faculty generally received support soon after their requests, but there were occasional wait times, which may have delayed some projects.
Academic leaders at our institution have noted the success of our coach initiative and have created a demand for coach services. We are exploring funding models that would allow for the expansion of coach services to other departments and divisions. We are in the initial stages of creating an Academic Scholarship Support Core under the supervision of the coach. Within this Core, we envision that various research support services will be triaged to staff with appropriate expertise; for example, a regulatory coordinator would review IRB applications while a master’s level statistician would conduct statistical analyses.
We have also transitioned to a new coach and have continued to experience success with the program. Our initial coach (author C.M.M.) obtained an NIH R01, a foundation grant, and took over a summer program that trains dental faculty in clinical research methods leaving insufficient time for coaching. Our new coach also has a PhD in epidemiology with NIH R01 funding but has more available FTE. Both of our coaches are graduates of our School of Public Health and institutions with such schools may have good access to the expertise needed. Nonclinical PhDs are often almost entirely reliant on grants, and some nongrant support is often attractive to these researchers. Additionally, PhDs who are junior or mid-career faculty that have the needed training are relatively affordable, particularly when the resource is made available to large number of faculty.
A limitation to our assessment of the coach initiative was the lack of pre- and postintervention metrics of scholarly productivity. We cannot definitively say that the Division’s scholarly output has increased because of the coach. Nevertheless, we are confident that the coach’s coaching has enhanced the scholarly work of individual clinicians and provided value to the Division as a whole. The coach program has been a success in our Division. Other institutions facing the challenge of supporting the research efforts of academic clinicians may consider this model as a worthy investment.
Disclosures
The authors have nothing to disclose.
1. Marks AR. Physician-scientist, heal thyself. J Clin Invest. 2007;117(1):2. https://doi.org/10.1172/JCI31031.
2. Bunton SA, Corrice AM. Trends in tenure for clinical M.D. faculty in U.S. medical schools: a 25-year review. Association of American Medical Colleges: Analysis in Brief. 2010;9(9):1-2; https://www.aamc.org/download/139778/data/aibvol9_no9.pdf. Accessed March 7, 2019.
3. Bunton SA, Mallon WT. The continued evolution of faculty appointment and tenure policies at U.S. medical schools. Acad Med. 2007;82(3):281-289. https://doi.org/10.1097/ACM.0b013e3180307e87.
4. Accreditation Council for Graduate Medical Education. ACGME Common Program Requirements. 2017; http://www.acgme.org/What-We-Do/Accreditation/Common-Program-Requirements. Accessed March 7, 2019.
5. Penrose LL, Yeomans ER, Praderio C, Prien SD. An incremental approach to improving scholarly activity. J Grad Med Educ. 2012;4(4):496-499. https://doi.org/10.4300/JGME-D-11-00185.1.
6. Manring MM, Panzo JA, Mayerson JL. A framework for improving resident research participation and scholarly output. J Surg Educ. 2014;71(1):8-13. https://doi.org/10.1016/j.jsurg.2013.07.011.
7. Palacio A, Campbell DT, Moore M, Symes S, Tamariz L. Predictors of scholarly success among internal medicine residents. Am J Med. 2013;126(2):181-185. https:doi.org/10.1016/j.amjmed.2012.10.003.
8. Physician-Scientist Workforce Working Group. Physician-scientist workforce (PSW) report 2014. https://report.nih.gov/Workforce/PSW/challenges.aspx. Accessed December 27, 2018.
9. Straus SE, Johnson MO, Marquez C, Feldman MD. Characteristics of successful and failed mentoring relationships: a qualitative study across two academic health centers. Acad Med. 2013;88(1):82-89. https://doi.org/10.1097/ACM.0b013e31827647a0.
10. Altman DG, Goodman SN, Schroter S. How statistical expertise is used in medical research. JAMA. 2002;287(21):2817-2820. https://doi.org/10.1001/jama.287.21.2817.
11. Howell E, Kravet S, Kisuule F, Wright SM. An innovative approach to supporting hospitalist physicians towards academic success. J Hosp Med. 2008;3(4):314-318. https://doi.org/10.1002/jhm.327.
12. Kripalani S, Williams MV. Author responsibilities and disclosures at the Journal of Hospital Medicine. J Hosp Med. 2010;5(6):320-322. https://doi.org/10.1002/jhm.715.
Historically, academic medicine faculty were predominantly physician-scientists.1 During the past decade, the number of clinician-educators and nontenured clinicians has grown.2 Many academically oriented clinical faculty at our institution would like to participate in and learn how to conduct quality scholarship. While institutional requirements vary, scholarly work is often required for promotion,3 and faculty may also desire to support the scholarly work of residents. Moreover, a core program component of the Accreditation Council of Graduate Medical Education standards requires faculty to “maintain an environment of inquiry and scholarship with an active research component.”4 Yet clinical faculty often find academic projects to be challenging. Similar to residents, clinical academic faculty frequently lack formal training in health services research or quality improvement science, have insufficient mentorship, and typically have limited uncommitted time and resources.5
One approach to this problem has been to pair junior clinicians with traditional physician scientists as mentors.6,7 This type of mentorship for clinical faculty is increasingly difficult to access because of growing pressure on physician-scientist faculty to conduct their own research, seek extramural funding, meet clinical expectations, and mentor fellows and faculty in their own disciplines.8 Moreover, senior research faculty may not be prepared or have the time to teach junior faculty how to deal with common stumbling blocks (eg, institutional review board [IRB] applications, statistically testable hypothesis development, and statistical analysis).8,9 Seminars or works-in-progress sessions are another strategy to bolster scholarly work, but the experience at our institution is that such sessions are often not relevant at the time of delivery and can be intimidating to clinical faculty who lack extensive knowledge about research methods and prior research experience.
Another approach to supporting the research efforts of academic clinicians is to fund a consulting statistician. However, without sufficient content expertise, statisticians may be frustrated in their efforts to assist clinicians who struggle to formulate a testable question or to work directly with data collected. Statisticians may be inexperienced in writing IRB applications or implementing protocols in a clinical or educational setting. Furthermore, statistical consultations are often limited in scope10 and, in our setting, rarely produce a durable improvement in the research skills of the faculty member or the enduring partnership required to complete a longer-term project. Because of these shortcomings, we have found that purely statistical support resources are often underutilized and ineffective.
Other models to facilitate scholarship have been employed, but few focus on facilitating scholarship of clinical faculty. One strategy involved supporting hospitalist’s academic productivity by reducing hospitalists’ full-time equivalent (FTE) and providing mentorship.11 For many, this approach is likely cost-prohibitive. Others have focused primarily on resident and fellow scholarships.5,6
In this report, we describe an educational innovation to educate and support the scholarly work of academic hospitalists and internists by using an academic research coach. We recruited a health researcher with extensive experience in research methods and strong interpersonal skills with the ability to explain and teach research concepts in an accessible manner. We sought an individual who would provide high-yield single consultations, join project teams to provide ongoing mentorship from conception to completion, and consequently, bolster scholarly productivity and learning among nonresearch clinicians in our Division. We anticipated that providing support for multiple aspects of a project would be more likely to help faculty overcome barriers to research and disseminate their project results as scholarly output.
METHODS
The coach initiative was implemented in the Division of General Internal Medicine at the University of Washington. The Division has over 200 members (60 hospitalists), including clinical instructors and acting instructors, who have not yet been appointed to the regular faculty (clinician-educators and physician scientists), and full-time clinical faculty. Division members staff clinical services at four area hospitals and 10 affiliated internal medicine and specialty clinics. Eligible clients were all Division members, although the focus of the initial program targeted hospitalists at our three primary teaching hospitals. Fellows, residents, students, and faculty from within and outside the Division were welcome to participate in a project involving coaching as long as a Division faculty member was engaged in the project.
Program Description
The overall goal of the coach initiative was to support the scholarly work of primarily clinical Division members. Given our focus was on clinical faculty with little training on research methodology, we did not expect the coach to secure grant funding for the position. Instead, we aimed to increase the quality and quantity of scholarship through publications, abstracts, and small grants. We defined scholarly work broadly: clinical research, quality improvement, medical education research, and other forms of scientific inquiry or synthesis. The coach was established as a 0.50 FTE position with a 12-month annually renewable appointment. The role was deemed that of a coach instead of a mentor because the coach was available to all Division members and involved task-oriented consultations with check-ins to facilitate projects, rather than a deeper more developmental relationship that typically exists with mentoring. The Division leadership identified support for scholarly activity as a high priority and mentorship as an unmet need based on faculty feedback. Clinical revenue supported the position.
Necessary qualifications, determined prior to hiring, included a PhD in health services or related field (eg, epidemiology) or a master’s degree with five years of experience in project management, clinical research, and study design. The position also called for expertise in articulating research questions, selecting study designs, navigating the IRB approval process, collecting/managing data, analyzing statistics, and mentoring and teaching clinical faculty in their scholarly endeavors. A track record in generating academic output (manuscripts and abstracts at regional/national meetings) was required. We circulated a description of the position to Division faculty and to leadership in our School of Public Health.
Based on these criteria, an inaugural coach was hired (author C.M.M.). The coach had a PhD in epidemiology, 10 years of research experience, 16 publications, and had recently finished a National Institutes of Health (NIH) career development award. At the time of hiring, she was a Clinical Assistant Professor in the School of Dentistry, which provided additional FTE. She had no extramural funding but was applying for NIH-level grants and had received several small grants.
To ensure uptake of the coach’s services, we realized that it was necessary to delineate the scope of services available, clarify availability of the coach, and define expectations regarding authorship. We used an iterative process that took into consideration the coach’s expertise, services most needed by the Division’s clinicians, and discussions with Division leadership and faculty at faculty meetings across hospitals and clinics. A range of services and authorship expectations were defined. Consensus was reached that the coach should be invited to coauthor projects where design, analysis, and/or substantial intellectual content was provided and for which authorship criteria were met.12 Collegial reviews by the coach of already developed manuscripts and time-limited, low-intensity consultations that did not involve substantial intellectual contributions did not warrant authorship.12 On this basis, we created and distributed a flyer to publicize these guidelines and invite Division members to contact the coach (Figure 1).
The coach attended Division, section, and clinical group meetings to publicize the initiative. The coach also individually met with faculty throughout the Division, explained her role, described services available, and answered questions. The marketing effort was continuous and calibrated with more or less exposure depending on existing projects and the coach’s availability. In addition, the coach coordinated with the director of the Division’s faculty development program to cohost works-in-progress seminars, identify coach clients to present at these meetings, and provide brief presentations on a basic research skill at meetings. Faculty built rapport with the coach through these activities and became more comfortable reaching out for assistance. Because of the large size of the Division, it was decided to roll out the initiative in a stepwise fashion, starting with hospitalists before expanding to the rest of the Division.
Most faculty contacted the coach by e-mail to request a consultation, at which time the coach requested that they complete a preconsultation handout (Figure 2). Initial coaching appointments lasted one hour and were in-person. Coaching entailed an in-depth analysis of the project plan and advice on how to move the project forward. The coach provided tailored scholarly project advice and expertise in research methods. After initial consultations, she would review grant proposals, IRB applications, manuscripts, case report forms, abstracts, and other products. Her efforts typically focused on improving the methods and scientific and technical writing. Assistance with statistical analysis was provided on a case-by-case basis to maintain broad availability. To address statistically complex questions, the coach had five hours of monthly access to a PhD biostatistician via an on-campus consulting service. Follow-up appointments were encouraged and provided as needed by e-mail, phone, or in-person. The coach conducted regular reach outs to facilitate projects. However, execution of the research was generally the responsibility of the faculty member.
Program Evaluation
To characterize the reach and scope of the program, the coach tracked the number of faculty supported, types of services provided, status of initiated projects, numbers of grants generated, and the dissemination of scholarly products including papers and abstracts. We used these metrics to create summary reports to identify successes and areas for improvement. Monthly meetings between the coach and Division leadership were used to fine-tune the approach.
We surveyed coach clients anonymously to assess their satisfaction with the coach initiative. Using Likert scale questions where 1 = completely disagree and 5 = completely agree, we asked (1) if they would recommend the coach to colleagues, (2) if their work was higher quality because of the coach, (3) if they were overall satisfied with the coach, (4) whether the Division should continue to support the coach, and (5) if the coach’s lack of clinical training negatively affected their experience. This work was considered a quality improvement initiative for which IRB approval was not required.
RESULTS
Over 18 months, the coach supported a 49 Division members including 30 hospitalists and 63 projects. Projects included a wide range of scholarship: medical education research, qualitative research, clinical quality improvement projects, observational studies, and a randomized clinical trial. Many clients (n = 16) used the coach for more than one project. The scope of work included limited support projects (identifying research resource and brainstorming project feasibility) lasting one to two sessions (n = 25), projects with a limited scope (collegial reviews of manuscripts and assistance with IRB submissions) but requiring more than two consultations (n = 24), and ongoing in-depth support projects (contributions on design, data collection, analysis, and manuscript writing) that required three consultations or more (n = 14). The majority of Division members (75%) supported did not have master’s level training in a health services-related area, six had NIH or other national-level funding, and two had small grants funded by local sources prior to providing support. The number of Division faculty on a given project ranged from one to four.
The coach directly supported 13 manuscripts with coach authorship, seven manuscripts without authorship, 11 abstracts, and four grant submissions (Appendix). The coach was a coauthor on all the abstracts and a coinvestigator on the grant applications. Of the 13 publications the coach coauthored, 11 publications have been accepted to peer-reviewed journals and two are currently in the submission process. The types of articles published included one medical evaluation report, one qualitative study, one randomized clinical trial, three quality assessment/improvement reports, and five epidemiologic studies. The types of abstracts included one qualitative report, one systematic review, one randomized clinical trial, two quality improvement projects, two epidemiologic studies, and four medical education projects. Three of four small grants submitted to local and national funders were funded.
The coach’s influence extended beyond the Division. Forty-eight university faculty, fellows, or students not affiliated with general internal medicine benefited from coach coaching: 26 were authors on papers and/or abstracts coauthored by the coach, 17 on manuscripts the coach reviewed without authorship, and five participated in consultations.
The coach found the experience rewarding. She enjoyed working on the methodologic aspects of projects and benefited from being included as coauthor on papers.
Twenty-nine of the 43 faculty (67%) still at the institution responded to the program assessment survey. Faculty strongly agreed that they would recommend the coach to colleagues (average ± standard deviation [SD]: 4.7 ± 0.5), that it improved the quality of their work (4.5 ± 0.9), that they were overall satisfied with the coaching (4.6 ± 0.7), and that the Division should continue to support the coach (4.9 ± 0.4). Faculty did not agree that the lack of clinical training of the coach was a barrier (2.0 ± 1.3).
DISCUSSION
The coach program was highly utilized, well regarded, and delivered substantial, tangible, and academic output. We anticipate the coach initiative will continue to be a valuable resource for our Division and could prove to be a valuable model for other institutions seeking to bolster the scholarly work of clinical academicians.
Several lessons emerged through the course of this project. First, we realized it is essential to select a coach who is both knowledgeable and approachable. We found that after meeting the coach, many faculty sought her help who otherwise would not have. An explicit, ongoing marketing strategy with regular contact with faculty at meetings was a key to receiving consult requests.
Second, the lack of a clinical background did not seem to hinder the coach’s ability to coach clinicians. The coach acknowledged her lack of clinical experience and relied on clients to explain the clinical context of projects. We also learned that the coach’s substantial experience with the logistics of research was invaluable. For example, the coach had substantial experience with the IRB process and her pre-reviews of IRB applications made for a short and relatively seamless experience navigating the IRB process. The coach also facilitated collaborations and leveraged existing resources at our institution. For example, for a qualitative research project, the coach helped identify a health services faculty member with this specific expertise, which led to a successful collaboration and publication. Although a more junior coach with less established qualifications may be helpful with research methods and with the research process, our endeavor suggests that having a more highly trained and experienced researcher was extremely valuable. Finally, we learned that for a Division of our size, the 0.50 FTE allotted to the coach is a minimum requirement. The coach spent approximately four hours a week on marketing, attending faculty meetings and conducting brief didactics, two hours per week on administration, and 14 hours per week on consultations. Faculty generally received support soon after their requests, but there were occasional wait times, which may have delayed some projects.
Academic leaders at our institution have noted the success of our coach initiative and have created a demand for coach services. We are exploring funding models that would allow for the expansion of coach services to other departments and divisions. We are in the initial stages of creating an Academic Scholarship Support Core under the supervision of the coach. Within this Core, we envision that various research support services will be triaged to staff with appropriate expertise; for example, a regulatory coordinator would review IRB applications while a master’s level statistician would conduct statistical analyses.
We have also transitioned to a new coach and have continued to experience success with the program. Our initial coach (author C.M.M.) obtained an NIH R01, a foundation grant, and took over a summer program that trains dental faculty in clinical research methods leaving insufficient time for coaching. Our new coach also has a PhD in epidemiology with NIH R01 funding but has more available FTE. Both of our coaches are graduates of our School of Public Health and institutions with such schools may have good access to the expertise needed. Nonclinical PhDs are often almost entirely reliant on grants, and some nongrant support is often attractive to these researchers. Additionally, PhDs who are junior or mid-career faculty that have the needed training are relatively affordable, particularly when the resource is made available to large number of faculty.
A limitation to our assessment of the coach initiative was the lack of pre- and postintervention metrics of scholarly productivity. We cannot definitively say that the Division’s scholarly output has increased because of the coach. Nevertheless, we are confident that the coach’s coaching has enhanced the scholarly work of individual clinicians and provided value to the Division as a whole. The coach program has been a success in our Division. Other institutions facing the challenge of supporting the research efforts of academic clinicians may consider this model as a worthy investment.
Disclosures
The authors have nothing to disclose.
1. Marks AR. Physician-scientist, heal thyself. J Clin Invest. 2007;117(1):2. https://doi.org/10.1172/JCI31031.
2. Bunton SA, Corrice AM. Trends in tenure for clinical M.D. faculty in U.S. medical schools: a 25-year review. Association of American Medical Colleges: Analysis in Brief. 2010;9(9):1-2; https://www.aamc.org/download/139778/data/aibvol9_no9.pdf. Accessed March 7, 2019.
3. Bunton SA, Mallon WT. The continued evolution of faculty appointment and tenure policies at U.S. medical schools. Acad Med. 2007;82(3):281-289. https://doi.org/10.1097/ACM.0b013e3180307e87.
4. Accreditation Council for Graduate Medical Education. ACGME Common Program Requirements. 2017; http://www.acgme.org/What-We-Do/Accreditation/Common-Program-Requirements. Accessed March 7, 2019.
5. Penrose LL, Yeomans ER, Praderio C, Prien SD. An incremental approach to improving scholarly activity. J Grad Med Educ. 2012;4(4):496-499. https://doi.org/10.4300/JGME-D-11-00185.1.
6. Manring MM, Panzo JA, Mayerson JL. A framework for improving resident research participation and scholarly output. J Surg Educ. 2014;71(1):8-13. https://doi.org/10.1016/j.jsurg.2013.07.011.
7. Palacio A, Campbell DT, Moore M, Symes S, Tamariz L. Predictors of scholarly success among internal medicine residents. Am J Med. 2013;126(2):181-185. https:doi.org/10.1016/j.amjmed.2012.10.003.
8. Physician-Scientist Workforce Working Group. Physician-scientist workforce (PSW) report 2014. https://report.nih.gov/Workforce/PSW/challenges.aspx. Accessed December 27, 2018.
9. Straus SE, Johnson MO, Marquez C, Feldman MD. Characteristics of successful and failed mentoring relationships: a qualitative study across two academic health centers. Acad Med. 2013;88(1):82-89. https://doi.org/10.1097/ACM.0b013e31827647a0.
10. Altman DG, Goodman SN, Schroter S. How statistical expertise is used in medical research. JAMA. 2002;287(21):2817-2820. https://doi.org/10.1001/jama.287.21.2817.
11. Howell E, Kravet S, Kisuule F, Wright SM. An innovative approach to supporting hospitalist physicians towards academic success. J Hosp Med. 2008;3(4):314-318. https://doi.org/10.1002/jhm.327.
12. Kripalani S, Williams MV. Author responsibilities and disclosures at the Journal of Hospital Medicine. J Hosp Med. 2010;5(6):320-322. https://doi.org/10.1002/jhm.715.
© 2019 Society of Hospital Medicine