User login
Patient Views of Discharge and a Novel e-Tool to Improve Transition from the Hospital
From the Mayo Clinic, Rochester, MN.
Abstract
- Objective: To elicit patient perceptions of a computer tablet (“e-Board”) used to display information relevant to hospital discharge and to gather patients’ expectations and perceptions regarding hospital discharge.
- Methods: Adult patients discharged from 1 of 3 medical-surgical, noncardiac monitored units of a 1265-bed, academic, tertiary care hospital were interviewed during patient focus groups. Reviewer pairs performed qualitative analysis of focus group transcripts and identified key themes, which were grouped into categories.
- Results: Patients felt a novel e-Board could help with the discharge process. They identified coordination of discharge, communication about discharge, ramifications of unexpected admissions, and interpersonal interactions during admission as the most significant issues around discharge.
- Conclusions: Focus groups elicit actionable information from patients about hospital discharge. Using this information, e-tools may help to design a patient-centered discharge process.
Key words: hospitals; patient satisfaction; focus groups; acute inpatient care.
Transition from the hospital to home represents a critical time for patients after acute illness, and support of patients and their care partners can help decrease consequences of poor care transitions, such as readmissions [1]. Focused discharge planning may improve outcomes and increase patient satisfaction [2], which is a key metric in hospital value-based purchasing programs, which tie Hospital Consumer Assessment of Healthcare Providers and Services (HCAHPS) survey scores to reimbursement. Although patient experience surveys explore several categories of patient satisfaction, HCAHPS may not reveal readily actionable opportunities that would allow clinicians to improve patient experience. Conducting focus groups and interviews can help discern patients’ perceptions and provide patient-centered opportunities to improve hospital discharge processes. Recent studies using these methodologies have revealed patients’ perceptions of barriers to inter-professional collaboration during discharge [3] and their desires and expectations of, as well as suggestions for improvement of, hospitalization [4].
Care transition bundles have been developed to facilitate the process of transitioning home [1,5], but none include e-health tools to help facilitate the discharge process. A study group leveraged available software at our institution to create a bedside “e-Board,” addressing opportunities that surfaced during previous patient focus groups regarding our institution’s discharge process. The software tools were loaded onto a tablet computer (Apple iPad; Cupertino, CA) and included displays of the patient’s physician and nurse, with estimated time of team bedside rounds; day and time of anticipated discharge; display of discharge medications; and a screening tool, I-MOVE, to assess mobility prior to return to independent living [6].
We conducted focus groups to gather patients’ insights for incorporation into a bedside e-health tool for discharge and into our hospital’s current discharge process. The primary objective of the current study was to elicit patient and family perceptions of a bedside e-Board, created to display information regarding discharge. Our secondary objective was to learn about patient expectations and perceptions regarding the hospital discharge process.
Methods
Setting
The study setting was 3 medical-surgical, non-cardiac monitored units of a 1265-bed, academic, tertiary care hospital in Rochester, MN. The study was considered a minimal risk study by the center’s institutional review board.
Participants
Patients aged 18 years or older discharged from 1 of the 3 study units during 2012–2013 were eligible to participate. Patients were excluded if they were not discharged home or to assisted living, were clinic employees, retirees or dependents of clinic employees, were hospitalized longer than 6 months prior to study entry, lived further than 60 miles from the town of Rochester, could not travel, or did not sign research consent.
There were 975 patients who met inclusion criteria. The institution’s survey research center randomly selected 300 eligible patients and contacted them by letter after discharge. The letter was followed up with a telephone call and verbal consent was obtained if the patient expressed interest in participation. Of the 17 patients who gave consent, 12 patients participated in focus group interviews.
E-Board Development
Prior focus group discussions facilitated by our institution’s marketing department (Mr. Kent Seltman, personal communication) explored patients’ perceptions of the discharge process from the institution’s primary hospital. The opportunities for improvement that surfaced during these focus groups included identifying the date of discharge, communication about the time of discharge, and discharging the patient at the identified time, not several hours later. The study group leveraged software available at our institution to create a bedside e-Board that could possibly mitigate these issues by improving communication about discharge. The software tools were loaded onto a tablet computer for patients to use as a resource during their admission. These tools included:
- A photo display of the patient’s nurse and physician, with estimated time of bedside rounds
- A display of the day and time of anticipated discharge. Providing anticipated day and time of discharge has been found to be an achievable goal for internal medicine and surgical services [7].
- A medication display, named the “Durable Display at Discharge,” previously found to improve patient understanding of prescribed medications [8]
- A display of a mobility tool, I-MOVE, designed to screen for debility that could prevent patients’ return to independent living [6].
Focus Groups
Facilitated interviews were conducted on 2 consecutive days in March 2014. Participants were divided into a focus group of 5 to 6 participants if they were functionally independent, or dyads of patient and care partner if they were functionally dependent. Interviews were both video- and audiotaped.
A trained facilitator led 1.5-hour sessions with each focus group. The sessions began with introductions and guidelines by which the focus groups were conducted, including explanations of the video and audio recording equipment, and a request for participants to speak one person at a time to facilitate recording. Discussions were carried out in 2 parts, guided by a facilitator script ( available from the authors). First, participants were asked to share their experiences regarding planning for discharge and the information they received leading up to their planned day and time of hospital discharge. Second, participants were shown a prototype of the e-Board. Participants were asked to reflect as to whether they had received similar information when they had been hospitalized, whether that information was helpful or useful, what information they did not receive that would have been helpful, how information was given, and whether information displayed via an e-Board would be better or worse than the ways they received information while in the hospital.
Data Analysis
Three teams, each comprised of 2 reviewers, met to analyze the video and audio recordings of each focus group. Unfortunately, the video files from the dyad interviews were not recoverable after the recorded sessions, and thus those groups were excluded from the study. Reviewers met prior to analyzing the focus group video and audio recordings to review the qualitative analysis protocol developed by the research team [9] (protocol available froom the authors). The teams then independently reviewed the video recordings and transcripts of the focus groups. The reviewer teams observed the focus group recordings and identified (1) themes regarding perceptions of the bedside e-Board and (2) experiences and perceptions around discharge. The protocol helped reviewer teams create a classification structure by identifying the key themes, which were then combined to create categories. The reviewer teams then compared their classification structures and by incorporating the most frequently identified categories, built a relational model of discharge perceptions.
Results
Eleven patients participated in 2 focus groups, one group of 5 patients and the other of 6 patients. Patient participants included 6 females and 5 males ranging in age from 22 to 84 years. 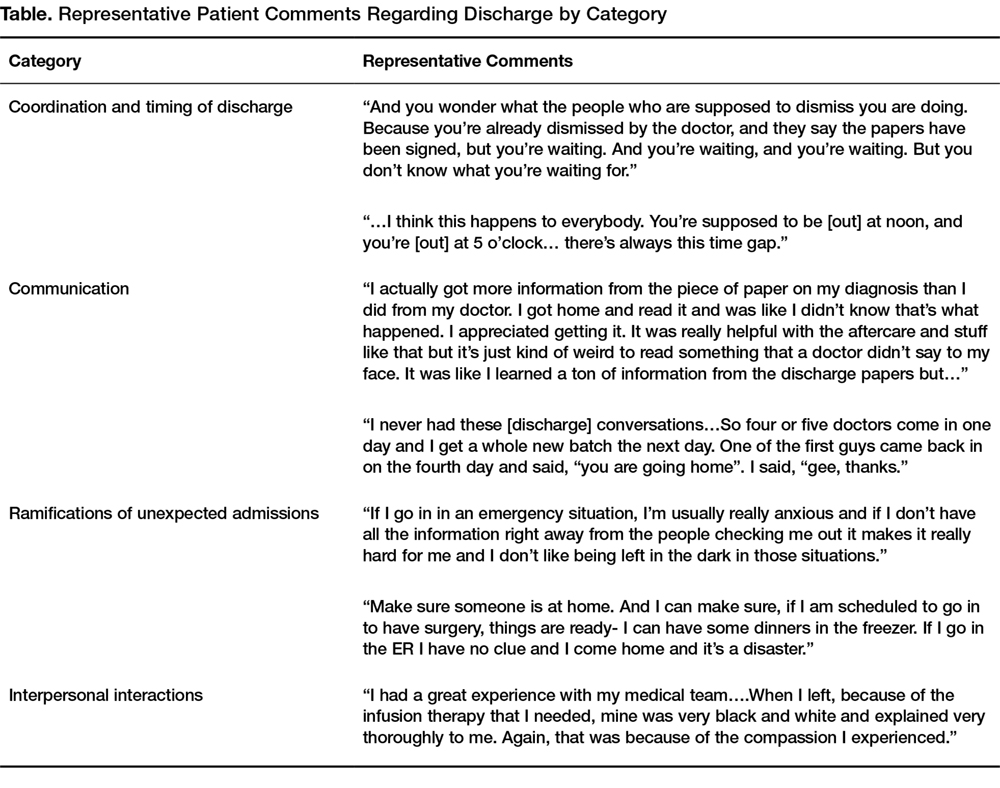
Using the qualitative analysis protocol, review teams grouped key themes from the focus group discussions about discharge into 4 categories. The categories, with themes listed below and representative patient comments in the Table, were
- Coordination and timing of discharge
- Giving patients the opportunity to prepare for discussion with clinician teams
- Communicating the specific time of discharge
- Internal collaboration of inter-professional teams
- Preparing for transition out of the hospital
2. Communication
- Patient inclusion in care discussions
- Discharge summary delay and/or completeness
- Education at the time of discharge
3. Ramifications of the unexpected and unknown
- Increased stress and frustration due to inability to plan, fear of the unknown, and lack of information
4. Interpersonal interactions
- Both favorable and unfavorable interactions caused an emotional response that impacts perceptions of hospitalization and discharge
The reviewers also analyzed patients’ comments regarding the bedside e-Board. The medication display (“Durable Display at Discharge,” Figure 1) was universally considered to be the most relevant and best-liked of the 4 elements tested. The visual display of medications and their purpose were commonly referenced as the most positive aspects of the display, and patients and caregivers were readily able to generate multiple potential uses for the display. Several mentioned that the information on the medication display were so desirable and necessary that if not supplied by the hospital, they hand-crafted such reminder displays at home. 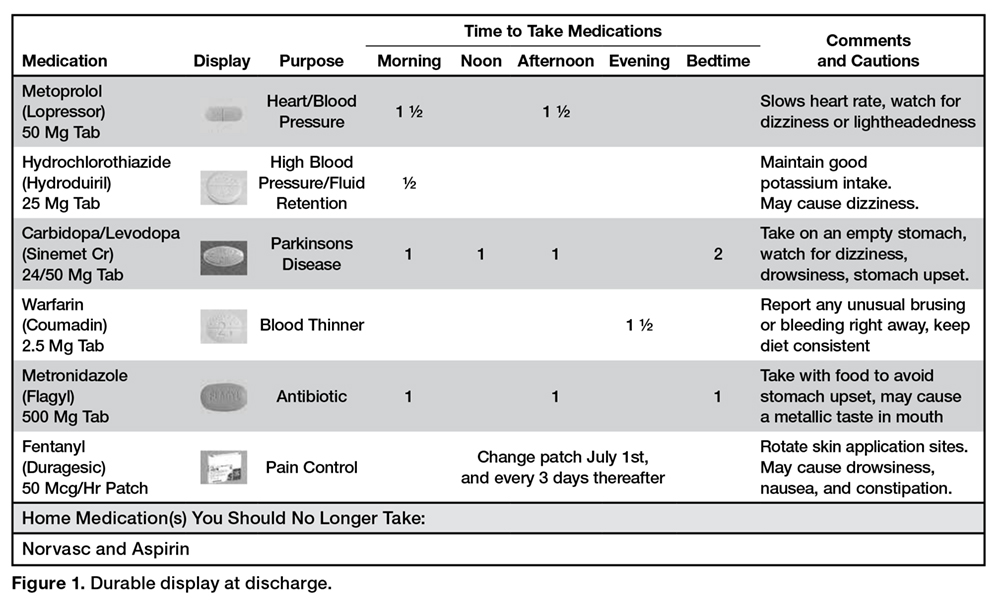
The display of the care team and rounding time was perceived as helpful in allowing patients and family members to coordinate schedules with family members or care partners who may wish to be present during rounds. Patients also favorably reviewed the discharge day and time display, although multiple comments were made that this information is only helpful if it is accurate. Discussion around discharge time evoked the most emotions of topics discussed and patients expressed frustration with the inaccuracy of discharge time communicated to them on the day of discharge. Elaborating on this sentiment, a patient specified, “I prefer they don’t tell me a time at all until they know for sure”, and another shared that, “there is only going to be frustration with that if you say 4 pm and it ends up being 7 pm.”
It was difficult for patients to see how the I-MOVE assessment (Figure 2) would apply to their discharge planning. They perceived I-MOVE as a tool for clinicians. One exception was a patient who had on a previous admission undergone heart surgery. She explained to the other patients that in such debilitated conditions, mobility independence assessments were important and commonly done. 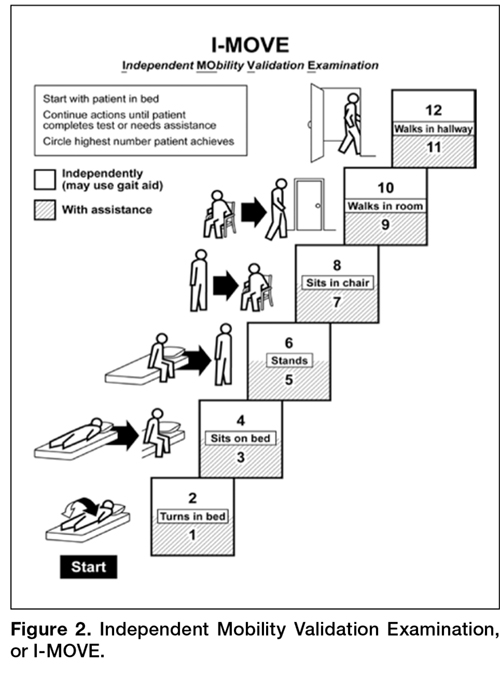
Patients voiced some skepticism and concerns regarding the e-Board, including expense, privacy, security, and cleanliness. One patient observed the tablet was “more current than a printed piece of paper. It’s more up to date.” Other patients, however, questioned the process required to update information and wondered how much electronic displays added compared to the dry-erase board already in each patient’s room with which they were more familiar. They also voiced concern that the tablet would replace face-to-face interactions with their care teams. A patient shared that, “if we don’t have the conversation and we just get it through this, then I would hate that…you want to be able to give your input.”
Discussion
In this study, we used available software to create a bedside e-Board that addressed opportunities for patient-centered improvement in our institution’s discharge process. Patients felt that 3 of 4 software tools on the tablet could enhance the discharge experience. Additionally, we explored patients’ expectations and perceptions of our hospital discharge process.
Key information to inform our current discharge process was divulged by our patients during focus groups. Patients conveyed that the only time that matters to them is the time they get to walk out the door of the hospital, and that general statements (eg, “You’ll probably be going home today.”) create anxiety and dissatisfaction. Since family and care partners need to manage hospital discharge in combination with regular activities of daily life (eg, work schedules, child care), un-communicated changes to the discharge time are very difficult to accommodate and should be discussed in advance. Further, acknowledging the disruption of hospital admission to patients’, their families’, and care partners’ daily lives, as well as being mindful of the impact of interpersonal interactions with patients, remind clinicians of the impact hospitalization has on patients.
Focus group discussions revealed that an ideal patient-centered discharge process would include active patient participation, clear communication regarding the discharge process, especially changes in the specific discharge date and time, and education regarding discharge summary instructions. Further, patients voiced that the unexpected nature of admissions can be very disruptive to patients’ lives and that interpersonal interactions during admission cause emotional responses in patients that influence their perceptions of hospitalization.
Comments regarding poor coordination and communication of internal processes, opportunities to improve collaboration within and across care teams, and need to improve communication with patients regarding timing of discharge and plan of care are consistent with recent studies that used focus groups to explore patient perceptions and expectations around discharge [3,4]. The ramifications of unexpected admissions and the emotional responses patients expressed regarding interpersonal interactions during admission have not been reported by others conducting patient focus groups.
The unexpected nature of many admissions, and the uncertainty of the day-to-day activities during hospitalization, caused patients anxiety and stress. These emotions perhaps heightened their response and memories of both favorable and unfavorable interpersonal interactions. These memories left lasting impressions on patients and care teams may help alleviate anxiety and stress by providing consistency and routine such as rounding at the same time daily, and communicating this time with patients. In this regard, the e-Board was helpful in communicating the patients’ care team and their planned rounding time.
Regarding the ability of e-tools to facilitate information sharing and planning for discharge, patients felt that the display of medications would have been most beneficial when thinking about post-discharge care. They perceived a display of discharge date and time estimate display as very useful to coordinate the activities around physically leaving the hospital, but based on their experiences did not find anticipated discharge times to be believable.
Patients’ perceptions of the tool were assessed after a recent hospitalization, and our data would have been strengthened had patients and their care partners used the e-Board during the actual admission. On the other hand, post-discharge, patients had time to reflect on opportunities for improving their recent admission and had insight into gaps in their discharge that the tool could potentially fill. Because we were unable to access video recordings from our dyad groups, which led us to exclude these participants, we lost care partners’ perceptions of the e-Board and discharge process. Care partners likely have different perceptions of discharge processes compared to patients, and their insight would have augmented our findings.
Several patients observed that the e-Board presented much of the same information that was filled out by care teams on the in-room dry erase boards and questioned whether the tablet was needed. These observations provide future opportunity for studies comparing display of discharge information on in-room dry-erase boards to an electronic tablet display. E-tools have shown some benefit when used for patient self-monitoring [10], to increase patient engagement [11,12], or to improve patient education [12]. Computer tablets may be most useful when used in these manners, compared to information display.
Focus groups provide patient-provided information that is readily actionable, and this work presents patient insight into discharge processes elicited through focus groups. Patients discussed their perceptions of an e-tool that might address patient-identified opportunities to improve the discharge process. Future work in this area will explore e-tools, and how best to leverage their functionality to design a patient-centered discharge process.
Acknowledgments: Our thanks to Mr. Thomas J. (Tripp) Welch for the original suggestion of this study design, and to Ms. Heidi Miller and Ms. Lizann Williams for their invaluable contributions to this work. A special thanks to our exceptional colleagues of the Mayo Clinic Department of Medicine Clinical Research Office Clinical Trials Unit for their efforts in executing this study, and to the study participants who participated in this research, without whom this project would not have been possible.
Corresponding author: Deanne Kashiwagi, MD, MS, 200 First Street SW, Rochester, MN 55902, [email protected].
Financial disclosures: None.
1. Coleman EA, Parry C, Chalmers S, et al. The care transitions intervention: results of a randomized controlled trial. Arch Intern Med 2006;166:1822–8.
2. Goncalves-Bradley DC, Lannin NA, Clemson LM, et al. Discharge planning from hospital. Cochrane Database Syst Rev 2016;1:CD000313.
3. Pinelli V, Stuckey HL, Gonzalo JD. Exploring challenges in the patient’s discharge process from the internal medicine service: A qualitative study of patients’ and providers’ perceptions. J Interprof Care 2017:1–9.
4. Neeman, N, Quinn K, Shoeb M, et al. Postdischarge focus groups to improve the hospital experience. Am J Med Qual 2013;28:536–8.
5. Jack, BW, Chetty VK, Anthony D, et al. A reengineered hospital discharge program to decrease rehospitalization: a randomized trial. Ann Intern Med 2009;150:178–87.
6. Manning, DM, Keller AS, Frank DL. Home alone: assessing mobility independence before discharge. J Hosp Med 2009;4:252–4.
7. Manning, DM, Tammel KJ, Blegen RN, et al. In-room display of day and time patient is anticipated to leave hospital: a “discharge appointment.” J Hosp Med 2007;2:13–6.
8. Manning, DM, O’Meara JG, Williams AR, et al. 3D: a tool for medication discharge education. Qual Saf Health Care 2007;16:71–6.
9. Vaismoradi M, Turunen H, Bondas T. Content analysis and thematic analysis: implications for conducting a qualitative descriptive study. Nurs Health Sci 2013;15:398–405.
10. Kampmeijer, R, Pavlova M, Tambor M, et al. The use of e-health and m-health tools in health promotion and primary prevention among older adults: a systematic literature review. BMC Health Serv Res 2016;16 Suppl 5:290.
11. Vawdrey, DK, Wilcox LG, Collins SA, et al. A tablet computer application for patients to participate in their hospital care. AMIA Annu Symp Proc 2011:1428–35.
12. Greysen, SR, Khanna RR, Jacolbia R, et al. Tablet computers for hospitalized patients: a pilot study to improve inpatient engagement. J Hosp Med 2014;9:396–9.
From the Mayo Clinic, Rochester, MN.
Abstract
- Objective: To elicit patient perceptions of a computer tablet (“e-Board”) used to display information relevant to hospital discharge and to gather patients’ expectations and perceptions regarding hospital discharge.
- Methods: Adult patients discharged from 1 of 3 medical-surgical, noncardiac monitored units of a 1265-bed, academic, tertiary care hospital were interviewed during patient focus groups. Reviewer pairs performed qualitative analysis of focus group transcripts and identified key themes, which were grouped into categories.
- Results: Patients felt a novel e-Board could help with the discharge process. They identified coordination of discharge, communication about discharge, ramifications of unexpected admissions, and interpersonal interactions during admission as the most significant issues around discharge.
- Conclusions: Focus groups elicit actionable information from patients about hospital discharge. Using this information, e-tools may help to design a patient-centered discharge process.
Key words: hospitals; patient satisfaction; focus groups; acute inpatient care.
Transition from the hospital to home represents a critical time for patients after acute illness, and support of patients and their care partners can help decrease consequences of poor care transitions, such as readmissions [1]. Focused discharge planning may improve outcomes and increase patient satisfaction [2], which is a key metric in hospital value-based purchasing programs, which tie Hospital Consumer Assessment of Healthcare Providers and Services (HCAHPS) survey scores to reimbursement. Although patient experience surveys explore several categories of patient satisfaction, HCAHPS may not reveal readily actionable opportunities that would allow clinicians to improve patient experience. Conducting focus groups and interviews can help discern patients’ perceptions and provide patient-centered opportunities to improve hospital discharge processes. Recent studies using these methodologies have revealed patients’ perceptions of barriers to inter-professional collaboration during discharge [3] and their desires and expectations of, as well as suggestions for improvement of, hospitalization [4].
Care transition bundles have been developed to facilitate the process of transitioning home [1,5], but none include e-health tools to help facilitate the discharge process. A study group leveraged available software at our institution to create a bedside “e-Board,” addressing opportunities that surfaced during previous patient focus groups regarding our institution’s discharge process. The software tools were loaded onto a tablet computer (Apple iPad; Cupertino, CA) and included displays of the patient’s physician and nurse, with estimated time of team bedside rounds; day and time of anticipated discharge; display of discharge medications; and a screening tool, I-MOVE, to assess mobility prior to return to independent living [6].
We conducted focus groups to gather patients’ insights for incorporation into a bedside e-health tool for discharge and into our hospital’s current discharge process. The primary objective of the current study was to elicit patient and family perceptions of a bedside e-Board, created to display information regarding discharge. Our secondary objective was to learn about patient expectations and perceptions regarding the hospital discharge process.
Methods
Setting
The study setting was 3 medical-surgical, non-cardiac monitored units of a 1265-bed, academic, tertiary care hospital in Rochester, MN. The study was considered a minimal risk study by the center’s institutional review board.
Participants
Patients aged 18 years or older discharged from 1 of the 3 study units during 2012–2013 were eligible to participate. Patients were excluded if they were not discharged home or to assisted living, were clinic employees, retirees or dependents of clinic employees, were hospitalized longer than 6 months prior to study entry, lived further than 60 miles from the town of Rochester, could not travel, or did not sign research consent.
There were 975 patients who met inclusion criteria. The institution’s survey research center randomly selected 300 eligible patients and contacted them by letter after discharge. The letter was followed up with a telephone call and verbal consent was obtained if the patient expressed interest in participation. Of the 17 patients who gave consent, 12 patients participated in focus group interviews.
E-Board Development
Prior focus group discussions facilitated by our institution’s marketing department (Mr. Kent Seltman, personal communication) explored patients’ perceptions of the discharge process from the institution’s primary hospital. The opportunities for improvement that surfaced during these focus groups included identifying the date of discharge, communication about the time of discharge, and discharging the patient at the identified time, not several hours later. The study group leveraged software available at our institution to create a bedside e-Board that could possibly mitigate these issues by improving communication about discharge. The software tools were loaded onto a tablet computer for patients to use as a resource during their admission. These tools included:
- A photo display of the patient’s nurse and physician, with estimated time of bedside rounds
- A display of the day and time of anticipated discharge. Providing anticipated day and time of discharge has been found to be an achievable goal for internal medicine and surgical services [7].
- A medication display, named the “Durable Display at Discharge,” previously found to improve patient understanding of prescribed medications [8]
- A display of a mobility tool, I-MOVE, designed to screen for debility that could prevent patients’ return to independent living [6].
Focus Groups
Facilitated interviews were conducted on 2 consecutive days in March 2014. Participants were divided into a focus group of 5 to 6 participants if they were functionally independent, or dyads of patient and care partner if they were functionally dependent. Interviews were both video- and audiotaped.
A trained facilitator led 1.5-hour sessions with each focus group. The sessions began with introductions and guidelines by which the focus groups were conducted, including explanations of the video and audio recording equipment, and a request for participants to speak one person at a time to facilitate recording. Discussions were carried out in 2 parts, guided by a facilitator script ( available from the authors). First, participants were asked to share their experiences regarding planning for discharge and the information they received leading up to their planned day and time of hospital discharge. Second, participants were shown a prototype of the e-Board. Participants were asked to reflect as to whether they had received similar information when they had been hospitalized, whether that information was helpful or useful, what information they did not receive that would have been helpful, how information was given, and whether information displayed via an e-Board would be better or worse than the ways they received information while in the hospital.
Data Analysis
Three teams, each comprised of 2 reviewers, met to analyze the video and audio recordings of each focus group. Unfortunately, the video files from the dyad interviews were not recoverable after the recorded sessions, and thus those groups were excluded from the study. Reviewers met prior to analyzing the focus group video and audio recordings to review the qualitative analysis protocol developed by the research team [9] (protocol available froom the authors). The teams then independently reviewed the video recordings and transcripts of the focus groups. The reviewer teams observed the focus group recordings and identified (1) themes regarding perceptions of the bedside e-Board and (2) experiences and perceptions around discharge. The protocol helped reviewer teams create a classification structure by identifying the key themes, which were then combined to create categories. The reviewer teams then compared their classification structures and by incorporating the most frequently identified categories, built a relational model of discharge perceptions.
Results
Eleven patients participated in 2 focus groups, one group of 5 patients and the other of 6 patients. Patient participants included 6 females and 5 males ranging in age from 22 to 84 years.
Using the qualitative analysis protocol, review teams grouped key themes from the focus group discussions about discharge into 4 categories. The categories, with themes listed below and representative patient comments in the Table, were
- Coordination and timing of discharge
- Giving patients the opportunity to prepare for discussion with clinician teams
- Communicating the specific time of discharge
- Internal collaboration of inter-professional teams
- Preparing for transition out of the hospital
2. Communication
- Patient inclusion in care discussions
- Discharge summary delay and/or completeness
- Education at the time of discharge
3. Ramifications of the unexpected and unknown
- Increased stress and frustration due to inability to plan, fear of the unknown, and lack of information
4. Interpersonal interactions
- Both favorable and unfavorable interactions caused an emotional response that impacts perceptions of hospitalization and discharge
The reviewers also analyzed patients’ comments regarding the bedside e-Board. The medication display (“Durable Display at Discharge,” Figure 1) was universally considered to be the most relevant and best-liked of the 4 elements tested. The visual display of medications and their purpose were commonly referenced as the most positive aspects of the display, and patients and caregivers were readily able to generate multiple potential uses for the display. Several mentioned that the information on the medication display were so desirable and necessary that if not supplied by the hospital, they hand-crafted such reminder displays at home.
The display of the care team and rounding time was perceived as helpful in allowing patients and family members to coordinate schedules with family members or care partners who may wish to be present during rounds. Patients also favorably reviewed the discharge day and time display, although multiple comments were made that this information is only helpful if it is accurate. Discussion around discharge time evoked the most emotions of topics discussed and patients expressed frustration with the inaccuracy of discharge time communicated to them on the day of discharge. Elaborating on this sentiment, a patient specified, “I prefer they don’t tell me a time at all until they know for sure”, and another shared that, “there is only going to be frustration with that if you say 4 pm and it ends up being 7 pm.”
It was difficult for patients to see how the I-MOVE assessment (Figure 2) would apply to their discharge planning. They perceived I-MOVE as a tool for clinicians. One exception was a patient who had on a previous admission undergone heart surgery. She explained to the other patients that in such debilitated conditions, mobility independence assessments were important and commonly done.
Patients voiced some skepticism and concerns regarding the e-Board, including expense, privacy, security, and cleanliness. One patient observed the tablet was “more current than a printed piece of paper. It’s more up to date.” Other patients, however, questioned the process required to update information and wondered how much electronic displays added compared to the dry-erase board already in each patient’s room with which they were more familiar. They also voiced concern that the tablet would replace face-to-face interactions with their care teams. A patient shared that, “if we don’t have the conversation and we just get it through this, then I would hate that…you want to be able to give your input.”
Discussion
In this study, we used available software to create a bedside e-Board that addressed opportunities for patient-centered improvement in our institution’s discharge process. Patients felt that 3 of 4 software tools on the tablet could enhance the discharge experience. Additionally, we explored patients’ expectations and perceptions of our hospital discharge process.
Key information to inform our current discharge process was divulged by our patients during focus groups. Patients conveyed that the only time that matters to them is the time they get to walk out the door of the hospital, and that general statements (eg, “You’ll probably be going home today.”) create anxiety and dissatisfaction. Since family and care partners need to manage hospital discharge in combination with regular activities of daily life (eg, work schedules, child care), un-communicated changes to the discharge time are very difficult to accommodate and should be discussed in advance. Further, acknowledging the disruption of hospital admission to patients’, their families’, and care partners’ daily lives, as well as being mindful of the impact of interpersonal interactions with patients, remind clinicians of the impact hospitalization has on patients.
Focus group discussions revealed that an ideal patient-centered discharge process would include active patient participation, clear communication regarding the discharge process, especially changes in the specific discharge date and time, and education regarding discharge summary instructions. Further, patients voiced that the unexpected nature of admissions can be very disruptive to patients’ lives and that interpersonal interactions during admission cause emotional responses in patients that influence their perceptions of hospitalization.
Comments regarding poor coordination and communication of internal processes, opportunities to improve collaboration within and across care teams, and need to improve communication with patients regarding timing of discharge and plan of care are consistent with recent studies that used focus groups to explore patient perceptions and expectations around discharge [3,4]. The ramifications of unexpected admissions and the emotional responses patients expressed regarding interpersonal interactions during admission have not been reported by others conducting patient focus groups.
The unexpected nature of many admissions, and the uncertainty of the day-to-day activities during hospitalization, caused patients anxiety and stress. These emotions perhaps heightened their response and memories of both favorable and unfavorable interpersonal interactions. These memories left lasting impressions on patients and care teams may help alleviate anxiety and stress by providing consistency and routine such as rounding at the same time daily, and communicating this time with patients. In this regard, the e-Board was helpful in communicating the patients’ care team and their planned rounding time.
Regarding the ability of e-tools to facilitate information sharing and planning for discharge, patients felt that the display of medications would have been most beneficial when thinking about post-discharge care. They perceived a display of discharge date and time estimate display as very useful to coordinate the activities around physically leaving the hospital, but based on their experiences did not find anticipated discharge times to be believable.
Patients’ perceptions of the tool were assessed after a recent hospitalization, and our data would have been strengthened had patients and their care partners used the e-Board during the actual admission. On the other hand, post-discharge, patients had time to reflect on opportunities for improving their recent admission and had insight into gaps in their discharge that the tool could potentially fill. Because we were unable to access video recordings from our dyad groups, which led us to exclude these participants, we lost care partners’ perceptions of the e-Board and discharge process. Care partners likely have different perceptions of discharge processes compared to patients, and their insight would have augmented our findings.
Several patients observed that the e-Board presented much of the same information that was filled out by care teams on the in-room dry erase boards and questioned whether the tablet was needed. These observations provide future opportunity for studies comparing display of discharge information on in-room dry-erase boards to an electronic tablet display. E-tools have shown some benefit when used for patient self-monitoring [10], to increase patient engagement [11,12], or to improve patient education [12]. Computer tablets may be most useful when used in these manners, compared to information display.
Focus groups provide patient-provided information that is readily actionable, and this work presents patient insight into discharge processes elicited through focus groups. Patients discussed their perceptions of an e-tool that might address patient-identified opportunities to improve the discharge process. Future work in this area will explore e-tools, and how best to leverage their functionality to design a patient-centered discharge process.
Acknowledgments: Our thanks to Mr. Thomas J. (Tripp) Welch for the original suggestion of this study design, and to Ms. Heidi Miller and Ms. Lizann Williams for their invaluable contributions to this work. A special thanks to our exceptional colleagues of the Mayo Clinic Department of Medicine Clinical Research Office Clinical Trials Unit for their efforts in executing this study, and to the study participants who participated in this research, without whom this project would not have been possible.
Corresponding author: Deanne Kashiwagi, MD, MS, 200 First Street SW, Rochester, MN 55902, [email protected].
Financial disclosures: None.
1. Coleman EA, Parry C, Chalmers S, et al. The care transitions intervention: results of a randomized controlled trial. Arch Intern Med 2006;166:1822–8.
2. Goncalves-Bradley DC, Lannin NA, Clemson LM, et al. Discharge planning from hospital. Cochrane Database Syst Rev 2016;1:CD000313.
3. Pinelli V, Stuckey HL, Gonzalo JD. Exploring challenges in the patient’s discharge process from the internal medicine service: A qualitative study of patients’ and providers’ perceptions. J Interprof Care 2017:1–9.
4. Neeman, N, Quinn K, Shoeb M, et al. Postdischarge focus groups to improve the hospital experience. Am J Med Qual 2013;28:536–8.
5. Jack, BW, Chetty VK, Anthony D, et al. A reengineered hospital discharge program to decrease rehospitalization: a randomized trial. Ann Intern Med 2009;150:178–87.
6. Manning, DM, Keller AS, Frank DL. Home alone: assessing mobility independence before discharge. J Hosp Med 2009;4:252–4.
7. Manning, DM, Tammel KJ, Blegen RN, et al. In-room display of day and time patient is anticipated to leave hospital: a “discharge appointment.” J Hosp Med 2007;2:13–6.
8. Manning, DM, O’Meara JG, Williams AR, et al. 3D: a tool for medication discharge education. Qual Saf Health Care 2007;16:71–6.
9. Vaismoradi M, Turunen H, Bondas T. Content analysis and thematic analysis: implications for conducting a qualitative descriptive study. Nurs Health Sci 2013;15:398–405.
10. Kampmeijer, R, Pavlova M, Tambor M, et al. The use of e-health and m-health tools in health promotion and primary prevention among older adults: a systematic literature review. BMC Health Serv Res 2016;16 Suppl 5:290.
11. Vawdrey, DK, Wilcox LG, Collins SA, et al. A tablet computer application for patients to participate in their hospital care. AMIA Annu Symp Proc 2011:1428–35.
12. Greysen, SR, Khanna RR, Jacolbia R, et al. Tablet computers for hospitalized patients: a pilot study to improve inpatient engagement. J Hosp Med 2014;9:396–9.
Convertible Glenoid Components Facilitate Revisions to Reverse Shoulder Arthroplasty Easier: Retrospective Review of 13 Cases
ABSTRACT
Removal of a cemented glenoid component often leads to massive glenoid bone loss, which makes it difficult to implant a new glenoid baseplate. The purpose of this study was to demonstrate the feasibility of revisions with a completely convertible system and to report clinical and radiographic results of a retrospective review of 13 cases.
Between 2003 and 2011, 104 primary total shoulder arthroplasties (TSAs) were performed with an uncemented glenoid component in our group. Of these patients, 13 (average age, 64 years) were revised to reverse shoulder arthroplasty (RSA) using a modular convertible platform system and were included in this study. Average follow-up after revision was 22 months. Outcome measures included pain, range of motion, Constant-Murley scores, Simple Shoulder Tests, and subjective shoulder values. Active flexion increased significantly from a mean of 93° (range, 30°-120°) to 138° (range, 95°-170°) (P = 0.021), and active external rotation increased significantly from 8° (range, −20°-15°) to 25° (range, −10°-60°). Mean pain scores significantly improved from 4.2 to 13.3 points. The mean Constant Scores improved from 21 (range, 18-32) to 63 (range, 43-90). Subjectively, 12 patients rated their shoulder as better or much better than preoperatively. This retrospective study shows that a complete convertible system facilitates conversion of TSAs to RSAs with excellent pain relief and a significant improvement in shoulder function.
Continue to: Polyethylene glenoid components...
Polyethylene glenoid components are the gold standard in anatomic total shoulder arthroplasty (TSA). However, even though TSA survivorship exceeds 95% at 10-year follow-up,1 glenoid component loosening remains the main complication and the weak link in these implants. This complication accounts for 25% of all complications related to TSA in the literature.2 In most cases, glenoid component loosening is not isolated but combined with a rotator cuff tear, glenohumeral instability, or component malposition.
 Intraoperative image of a right shoulder humeral split osteotomy through a deltopectoral approach and (B) image of the removed humeral stem.")
We hypothesized that a completely convertible platform system on both the humeral and the glenoid side could facilitate the revision of a failed TSA to a RSA. This would enable the surgeon to leave the humeral stem and the glenoid baseplate in place, avoiding the difficulty of stem removal and the reimplantation of a glenoid component, especially in osteoporotic glenoid bone and elderly patients. The revision procedure would then only consist of replacing the humeral head by a metallic tray and polyethylene bearing on the humeral side and by impacting a glenosphere on the glenoid baseplate (Figures 2A, 2B).

The purpose of this study was to demonstrate the feasibility of revisions with this completely convertible system and to report clinical and radiographic results of a retrospective review of 13 cases.
MATERIALS AND METHODS
PATIENT SELECTION
Between 2003 and 2011, 104 primary TSAs were performed with an uncemented glenoid component in our group. Of these patients, 18 underwent revision (17.3%). Among these 18 patients, 13 were revised to RSA using a modular convertible platform system and were included in this study, while 5 patients were revised to another TSA (2 dissociations of the polyethylene glenoid implant, 2 excessively low implantations of the glenoid baseplate, and 1 glenoid loosening). The mean age of the 13 patients (9 women, 4 men) included in this retrospective study at the time of revision was 64 years (range, 50-75 years). The reasons for revision surgery were rotator cuff tear (5, among which 2 were posterosuperior tears, and 3 were tears of the subscapularis), dislocations (5 posterior and 1 anterior, among which 4 had a B2 or C glenoid), suprascapular nerve paralysis (1), and dissociation of the polyethylene (1). The initial TSA was indicated for primary osteoarthritis with a normal cuff (9), primary osteoarthritis with a reparable cuff tear (2), posttraumatic osteoarthritis (1), and chronic dislocation (1). The right dominant shoulder was involved in 10 cases. The mean time interval between the primary TSA and the revision was 15 months (range, 1-61 months).
OPERATIVE TECHNIQUE
PREOPERATIVE PLANNING
Revision of a failed TSA is always a difficult challenge, and evaluation of bone loss on both the humeral and the glenoid sides, as well as the status of the cuff, is mandatory, even with a completely convertible arthroplasty system. The surgeon must be prepared to remove the humeral stem in case reduction of the joint is impossible. We systematically performed standard radiographs (anteroposterior, axillary, and outlet views) and computed tomography (CT) scans in order to assess both the version and positioning, as well as potential signs of loosening of the implants and the status of the cuff (continuity, degree of muscle trophicity, and fatty infiltration). A preoperative leucocyte count, sedimentation rate, and C-reactive protein rates were requested in every revision case, even if a mechanical etiology was strongly suspected.
Continue to: REVISION PROCEDURE
REVISION PROCEDURE
All the implants that had been used in the primary TSAs were Arrow Universal Shoulder Prostheses (FH Orthopedics). All revisions were performed through the previous deltopectoral approach in the beach chair position under general anesthesia with an interscalene block. Adhesions of the deep part of the deltoid were carefully released. The conjoint tendon was released, and the location of the musculocutaneous and axillary nerves was identified before any retractor was placed. In the 10 cases where the subscapularis was intact, it was peeled off the medial border of the bicipital groove to obtain sufficient length for a tension-free reinsertion.
The anatomical head of the humeral implant was disconnected from the stem and removed. All stems were found to be well fixed; there were no cases of loosening or evidence of infection. A circumferential capsular release was systematically carried out. The polyethylene glenoid onlay was then unlocked from the baseplate.
The quality of the fixation of the glenoid baseplate was systematically evaluated; no screw was found to be loose, and the fixation of all baseplates was stable. Therefore, there was no need to revise the glenoid baseplate, even when its position was considered excessively retroverted (Glenoid B2) or high. A glenosphere was impacted on the baseplate, and a polyethylene humeral bearing was then implanted on the humeral stem. The thinnest polyethylene bearing available (number 0) was chosen in all cases, and a size 36 glenosphere was chosen in 12 out of 13 cases. Intraoperative stability of the implant was satisfactory, and no impingement was found posteriorly, anteriorly, or inferiorly.
In one case, the humeral stem was a first-generation humeral implant which was not compatible with the new-generation humeral bearing, and the humeral stem had to be replaced.
In 2 cases, reduction of the RSA was either impossible or felt to be too tight, even after extensive soft-tissue release and resection of the remaining supraspinatus. The main reason for this was an excessively proud humeral stem because of an onlay polyethylene humeral bearing instead of an inlay design. However, removal of the uncemented humeral stem was always possible with no osteotomy or cortical window of the humeral shaft as the humeral stem has been designed with a bone ingrowth surface only on the metaphyseal part with a smooth surface on diaphyseal part. After removal of the stem, a small amount of humeral metaphysis was cut, and a new humeral stem was press-fit in a lower position. This allowed restoration of an appropriate tension of the soft tissue and, therefore, an easier reduction. The subscapularis was medialized and reinserted transosseously when possible with a double-row repair. In 3 cases, the subscapularis was torn and retracted at the level of the glenoid, or impossible to identify to allow its reinsertion.
Continue to: According to our infectious disease department...
According to our infectious disease department, we made a minimum of 5 cultures for each revision case looking for a possible low-grade infection. All cultures in our group are held for 14 days to assess for Propionibacterium acnes.
POSTOPERATIVE MANAGEMENT
A shoulder splint in neutral rotation was used for the first 4 weeks. Passive range of motion (ROM) was started immediately with pendulum exercises and passive anterior elevation. Active assisted and active ROM were allowed after 4 weeks, and physiotherapy was continued for 6 months. Elderly patients were referred to a center of rehabilitation. We found only 1 or 2 positive cultures (Propionibacterium acnes) for 4 patients, and we decided to consider them as a contamination. None of the patients were treated with antibiotics.
CLINICAL AND RADIOLOGICAL ASSESSMENT
Clinical evaluation included pre- and postoperative pain scores (visual analog scale [VAS]), ROM, the Constant-Murley13 score, the Simple Shoulder Test (SST),14 and the subjective shoulder value.15 Subjective satisfaction was assessed by asking the patients at follow-up how they felt compared with before surgery and was graded using a 4-point scale: 1, much better; 2, better; 3, the same; and 4, worse. Radiographic evaluation was performed on pre- and postoperative standard anteroposterior, outlet, and axillary views. Radiographs were reviewed to determine the presence of glenohumeral subluxation, periprosthetic lucency, component shift in position, and scapular notching.
STATISTICAL ANALYSIS
Descriptive statistics are reported as mean (range) for continuous measures and number (percentage) for discrete variables. The Wilcoxon signed-rank test was used for preoperative vs postoperative changes. The alpha level for all tests was set at 0.05 for statistical significance.
RESULTS
CLINICAL OUTCOME
At a mean of 22 months (range, 7-38 months) follow-up after revision, active ROM was significantly improved. Active flexion increased significantly from a mean of 93° (range, 30°-120°) to 138° (range, 95°-170°) (P = 0.021). Active external rotation with the elbow on the side increased significantly from 8° (range, −20°-15°) to 25° (range, −10°-60°) (P = 0.034), and increased with the arm held at 90° abduction from 13° (range, 0°-20°) to 49° (range, 0°-80°) (P = 0.025). Mean pain scores improved from 4.2 to 13.3 points (P < 0.001). VAS improved significantly from 9 to 1 (P < 0.0001). The mean Constant Scores improved from 21 (range, 18-32) to 63 (range, 43-90) (P = 0.006). The final SST was 7 per 12. Subjectively, 4 patients rated their shoulder as much better, 8 as better, and 1 as the same as preoperatively. No intra- or postoperative complications, including infections, were observed. The mean duration of the procedure was 60 minutes (range, 30-75 minutes).
Continue to: RADIOLOGICAL OUTCOME
RADIOLOGICAL OUTCOME
No periprosthetic lucency or shift in component was observed at the last follow-up. There was no scapular notching. No resorption of the tuberosities, and no fractures of the acromion or the scapular spine were observed.
DISCUSSION
In this retrospective study, failure of TSA with a metal-backed glenoid implant was successfully revised to RSA. In 10 patients, the use of a universal platform system allowed an easier conversion without removal of the humeral stem or the glenoid component (Figures 3A-3D). Twelve of the 13 patients were satisfied or very satisfied at the last follow-up. None of the patients were in pain, and the mean Constant score was 63. In all the cases, the glenoid baseplate was not changed. In 3 cases the humeral stem was changed without any fracture of the tuberosities of need for an osteotomy. This greatly simplified the revision procedure, as glenoid revisions can be very challenging. Indeed, it is often difficult to assess precisely preoperatively the remaining glenoid bone stock after removal of the glenoid component and the cement. Many therapeutic options to deal with glenoid loosening have been reported in the literature: glenoid bone reconstruction after glenoid component removal and revision to a hemiarthroplasty (HA),10,16-18 glenoid bone reconstruction after glenoid component removal and revision to a new TSA with a cemented glenoid implant,16,17,19,20 and glenoid reconstruction after glenoid component removal and revision to a RSA.12,21 These authors reported that glenoid reconstruction frequently necessitates an iliac bone graft associated with a special design of the baseplate with a long post fixed into the native glenoid bone. However, sometimes implantation of an uncemented glenoid component can be unstable with a high risk of early mobilization of the implant, and 2 steps may be necessary. Conversion to a HA,10,16-18 or a TSA16,17,19,20 with a new cemented implant have both been associated with poor clinical outcome, with a high rate of recurrent glenoid loosening for the TSAs.

In our retrospective study, we reported no intra- or postoperative complications. Flury and colleagues22 reported a complication rate of 38% in 21 patients after conversion from a TSA to a RSA with a mean follow-up of 46 months. They removed all the components of the prosthesis with a crack or fracture of the humerus and/or the glenoid. Ortmaier and colleagues23 reported a rate of complication of 22.7% during the conversion of TSA to RSA. They did an osteotomy of the humeral diaphysis to extract the stem in 40% of cases and had to remove the glenoid cement in 86% of cases with severe damage of the glenoid bone in 10% of cases. Fewer complications were found in our study, as we did not need any procedure such as humeral osteotomy, cerclage, bone grafting, and/or reconstruction of the glenoid. The short operative time and the absence of extensive soft-tissue dissection, thanks to a standard deltopectoral approach, could explain the absence of infection in our series.
Other authors shared our strategy of a universal convertible system and reported their results in the literature. Castagna and colleagues24 in 2013 reported the clinical and radiological results of conversions of HA or TSA to RSA using a modular, convertible system (SMR Shoulder System, Lima Corporate). In their series, only 8 cases of TSAs were converted to RSA. They preserved, in each case, the humeral stem and the glenoid baseplate. There were no intra- or postoperative complications. The mean VAS score decreased from 8 to 2. Weber-Spickschen and colleague25 reported recently in 2015 the same experience with the same system (SMR Shoulder System). They reviewed 15 conversions of TSAs to RSAs without any removal of the implants at a mean 43-month follow-up. They reported excellent pain relief (VAS decreased from 8 to 1) and improvement in shoulder function with a low rate of complications.
Kany and colleagues26 in 2015 had already reported the advantages of a shoulder platform system for revisions. In their series, the authors included cases of failure of HAs and TSAs with loose cemented glenoids and metal-backed glenoids. The clinical and radiological results were similar, with a final Constant score of 60 (range, 42-85) and a similar rate of humeral stems which had to be changed (24%). These stems were replaced either because they were too proud or because there was not enough space to add an onlay polyethylene socket.
Continue to: Despite the encouraging results...
Despite the encouraging results reported in this study, there are some limitations. Firstly, no control group was used. Attempting to address this issue, we compared our results with the literature. Secondly, the number of patients in our study was small. Finally, the follow-up duration (mean 22 months) did not provide long-term outcomes.
CONCLUSION
This retrospective study shows that a complete convertible system facilitates conversion of TSAs to RSAs with excellent pain relief and a significant improvement in shoulder function. A platform system on both the humeral and the glenoid side reduces the operative time of the conversion with a low risk of complications.
1. Brenner BC, Ferlic DC, Clayton ML, Dennis DA. Survivorship of unconstrained total shoulder arthroplasty. J Bone Joint Surg Am. 1989;71(9):1289-1296.
2. Budge MD, Nolan EM, Heisey MH, Baker K, Wiater JM. Results of total shoulder arthroplasty with a monoblock porous tantalum glenoid component: a prospective minimum 2-year follow-up study. J Shoulder Elbow Surg. 2013;22(4):535-541. doi:10.1016/j.jse.2012.06.001.
3. Chin PY, Sperling JW, Cofield RH, Schleck C. Complications of total shoulder arthroplasty: are they fewer or different? J Shoulder Elbow Surg. 2006;15(1):19-22. doi:10.1016/j.jse.2005.05.005.
4. Torchia ME, Cofield RH, Settergren CR. Total shoulder arthroplasty with the Neer prosthesis: long-term results. J Shoulder Elbow Surg. 1997;6(6):495-505.
5. Wirth MA, Rockwood CA Jr. Complications of total shoulder-replacement surgery. J Bone Joint Surg Am. 1996;78(4):603-616.
6. Gohlke F, Rolf O. Revision of failed fracture hemiarthroplasties to reverse total shoulder prosthesis through the transhumeral approach: method incorporating a pectoralis-major-pedicled bone window. Oper Orthop Traumatol. 2007;19(2):185-208. doi:10.1007/s00064-007-1202-x.
7. Goldberg SH, Cohen MS, Young M, Bradnock B. Thermal tissue damage caused by ultrasonic cement removal from the humerus. J Bone Joint Surg Am. 2005;87(3):583-591. doi:10.2106/JBJS.D.01966.
8. Sperling JW, Cofield RH. Humeral windows in revision shoulder arthroplasty. J Shoulder Elbow Surg. 2005;14(3):258-263. doi:10.1016/j.jse.2004.09.004.
9. Chacon A, Virani N, Shannon R, Levy JC, Pupello D, Frankle M. Revision arthroplasty with use of a reverse shoulder prosthesis-allograft composite. J Bone Joint Surg Am. 2009;91(1):119-127. doi:10.2106/JBJS.H.00094.
10. Iannotti JP, Frangiamore SJ. Fate of large structural allograft for treatment of severe uncontained glenoid bone deficiency. J Shoulder Elbow Surg. 2012;21(6):765-771. doi:10.1016/j.jse.2011.08.069.
11. Kelly JD 2nd, Zhao JX, Hobgood ER, Norris TR. Clinical results of revision shoulder arthroplasty using the reverse prosthesis. J Shoulder Elbow Surg. 2012;21(11):1516-1525. doi:10.1016/j.jse.2011.11.021.
12. Melis B, Bonnevialle N, Neyton L, et al. Glenoid loosening and failure in anatomical total shoulder arthroplasty: is revision with a reverse shoulder arthroplasty a reliable option? J Shoulder Elbow Surg. 2012;21(3):342-349. doi:10.1016/j.jse.2011.05.021.
13. Constant CR, Murley AH. A clinical method of functional assessment of the shoulder. Clin Orthop Relat Res. 1987;(214):160-164.
14. Matsen FA 3rd, Ziegler DW, DeBartolo SE. Patient self-assessment of health status and function in glenohumeral degenerative joint disease. J Shoulder Elbow Surg. 1995;4(5):345-351.
15. Gilbart MK, Gerber C. Comparison of the subjective shoulder value and the Constant score. J Shoulder Elbow Surg. 2007;16(6):717-721. doi:10.1016/j.jse.2007.02.123.
16. Antuna SA, Sperling JW, Cofield RH, Rowland CM. Glenoid revision surgery after total shoulder arthroplasty. J Shoulder Elbow Surg. 2001;10(3):217-224. doi:10.1067/mse.2001.113961.
17. Cofield RH, Edgerton BC. Total shoulder arthroplasty: complications and revision surgery. Instr Course Lect. 1990;39:449-462.
18. Neyton L, Walch G, Nove-Josserand L, Edwards TB. Glenoid corticocancellous bone grafting after glenoid component removal in the treatment of glenoid loosening. J Shoulder Elbow Surg. 2006;15(2):173-179. doi:10.1016/j.jse.2005.07.010.
19. Bonnevialle N, Melis B, Neyton L, et al. Aseptic glenoid loosening or failure in total shoulder arthroplasty: revision with glenoid reimplantation. J Shoulder Elbow Surg. 2013;22(6):745-751. doi:10.1016/j.jse.2012.08.009.
20. Rodosky MW, Bigliani LU. Indications for glenoid resurfacing in shoulder arthroplasty. J Shoulder Elbow Surg. 1996;5(3):231-248.
21. Bateman E, Donald SM. Reconstruction of massive uncontained glenoid defects using a combined autograft-allograft construct with reverse shoulder arthroplasty: preliminary results. J Shoulder Elbow Surg. 2012;21(7):925-934. doi:10.1016/j.jse.2011.07.009.
22. Flury MP, Frey P, Goldhahn J, Schwyzer HK, Simmen BR. Reverse shoulder arthroplasty as a salvage procedure for failed conventional shoulder replacement due to cuff failure--midterm results. Int Orthop. 2011;35(1):53-60. doi:10.1007/s00264-010-0990-z.
23. Ortmaier R, Resch H, Hitzl W, et al. Reverse shoulder arthroplasty combined with latissimus dorsi transfer using the bone-chip technique. Int Orthop. 2013;38(3):1-7. doi:10.1007/s00264-013-2139-3.
24. Castagna A, Delcogliano M, de Caro F, et al. Conversion of shoulder arthroplasty to reverse implants: clinical and radiological results using a modular system. Int Orthop. 2013;37(7):1297-1305. doi:10.1007/s00264-013-1907-4.
25. Weber-Spickschen TS, Alfke D, Agneskirchner JD. The use of a modular system to convert an anatomical total shoulder arthroplasty to a reverse shoulder arthroplasty: Clinical and radiological results. Bone Joint J. 2015;97-B(12):1662-1667. doi:10.1302/0301-620X.97B12.35176.
26. Kany J, Amouyel T, Flamand O, Katz D, Valenti P. A convertible shoulder system: is it useful in total shoulder arthroplasty revisions? Int Orthop. 2015;39(2):299-304. doi:10.1007/s00264-014-2563-z.
ABSTRACT
Removal of a cemented glenoid component often leads to massive glenoid bone loss, which makes it difficult to implant a new glenoid baseplate. The purpose of this study was to demonstrate the feasibility of revisions with a completely convertible system and to report clinical and radiographic results of a retrospective review of 13 cases.
Between 2003 and 2011, 104 primary total shoulder arthroplasties (TSAs) were performed with an uncemented glenoid component in our group. Of these patients, 13 (average age, 64 years) were revised to reverse shoulder arthroplasty (RSA) using a modular convertible platform system and were included in this study. Average follow-up after revision was 22 months. Outcome measures included pain, range of motion, Constant-Murley scores, Simple Shoulder Tests, and subjective shoulder values. Active flexion increased significantly from a mean of 93° (range, 30°-120°) to 138° (range, 95°-170°) (P = 0.021), and active external rotation increased significantly from 8° (range, −20°-15°) to 25° (range, −10°-60°). Mean pain scores significantly improved from 4.2 to 13.3 points. The mean Constant Scores improved from 21 (range, 18-32) to 63 (range, 43-90). Subjectively, 12 patients rated their shoulder as better or much better than preoperatively. This retrospective study shows that a complete convertible system facilitates conversion of TSAs to RSAs with excellent pain relief and a significant improvement in shoulder function.
Continue to: Polyethylene glenoid components...
Polyethylene glenoid components are the gold standard in anatomic total shoulder arthroplasty (TSA). However, even though TSA survivorship exceeds 95% at 10-year follow-up,1 glenoid component loosening remains the main complication and the weak link in these implants. This complication accounts for 25% of all complications related to TSA in the literature.2 In most cases, glenoid component loosening is not isolated but combined with a rotator cuff tear, glenohumeral instability, or component malposition.
We hypothesized that a completely convertible platform system on both the humeral and the glenoid side could facilitate the revision of a failed TSA to a RSA. This would enable the surgeon to leave the humeral stem and the glenoid baseplate in place, avoiding the difficulty of stem removal and the reimplantation of a glenoid component, especially in osteoporotic glenoid bone and elderly patients. The revision procedure would then only consist of replacing the humeral head by a metallic tray and polyethylene bearing on the humeral side and by impacting a glenosphere on the glenoid baseplate (Figures 2A, 2B).
The purpose of this study was to demonstrate the feasibility of revisions with this completely convertible system and to report clinical and radiographic results of a retrospective review of 13 cases.
MATERIALS AND METHODS
PATIENT SELECTION
Between 2003 and 2011, 104 primary TSAs were performed with an uncemented glenoid component in our group. Of these patients, 18 underwent revision (17.3%). Among these 18 patients, 13 were revised to RSA using a modular convertible platform system and were included in this study, while 5 patients were revised to another TSA (2 dissociations of the polyethylene glenoid implant, 2 excessively low implantations of the glenoid baseplate, and 1 glenoid loosening). The mean age of the 13 patients (9 women, 4 men) included in this retrospective study at the time of revision was 64 years (range, 50-75 years). The reasons for revision surgery were rotator cuff tear (5, among which 2 were posterosuperior tears, and 3 were tears of the subscapularis), dislocations (5 posterior and 1 anterior, among which 4 had a B2 or C glenoid), suprascapular nerve paralysis (1), and dissociation of the polyethylene (1). The initial TSA was indicated for primary osteoarthritis with a normal cuff (9), primary osteoarthritis with a reparable cuff tear (2), posttraumatic osteoarthritis (1), and chronic dislocation (1). The right dominant shoulder was involved in 10 cases. The mean time interval between the primary TSA and the revision was 15 months (range, 1-61 months).
OPERATIVE TECHNIQUE
PREOPERATIVE PLANNING
Revision of a failed TSA is always a difficult challenge, and evaluation of bone loss on both the humeral and the glenoid sides, as well as the status of the cuff, is mandatory, even with a completely convertible arthroplasty system. The surgeon must be prepared to remove the humeral stem in case reduction of the joint is impossible. We systematically performed standard radiographs (anteroposterior, axillary, and outlet views) and computed tomography (CT) scans in order to assess both the version and positioning, as well as potential signs of loosening of the implants and the status of the cuff (continuity, degree of muscle trophicity, and fatty infiltration). A preoperative leucocyte count, sedimentation rate, and C-reactive protein rates were requested in every revision case, even if a mechanical etiology was strongly suspected.
Continue to: REVISION PROCEDURE
REVISION PROCEDURE
All the implants that had been used in the primary TSAs were Arrow Universal Shoulder Prostheses (FH Orthopedics). All revisions were performed through the previous deltopectoral approach in the beach chair position under general anesthesia with an interscalene block. Adhesions of the deep part of the deltoid were carefully released. The conjoint tendon was released, and the location of the musculocutaneous and axillary nerves was identified before any retractor was placed. In the 10 cases where the subscapularis was intact, it was peeled off the medial border of the bicipital groove to obtain sufficient length for a tension-free reinsertion.
The anatomical head of the humeral implant was disconnected from the stem and removed. All stems were found to be well fixed; there were no cases of loosening or evidence of infection. A circumferential capsular release was systematically carried out. The polyethylene glenoid onlay was then unlocked from the baseplate.
The quality of the fixation of the glenoid baseplate was systematically evaluated; no screw was found to be loose, and the fixation of all baseplates was stable. Therefore, there was no need to revise the glenoid baseplate, even when its position was considered excessively retroverted (Glenoid B2) or high. A glenosphere was impacted on the baseplate, and a polyethylene humeral bearing was then implanted on the humeral stem. The thinnest polyethylene bearing available (number 0) was chosen in all cases, and a size 36 glenosphere was chosen in 12 out of 13 cases. Intraoperative stability of the implant was satisfactory, and no impingement was found posteriorly, anteriorly, or inferiorly.
In one case, the humeral stem was a first-generation humeral implant which was not compatible with the new-generation humeral bearing, and the humeral stem had to be replaced.
In 2 cases, reduction of the RSA was either impossible or felt to be too tight, even after extensive soft-tissue release and resection of the remaining supraspinatus. The main reason for this was an excessively proud humeral stem because of an onlay polyethylene humeral bearing instead of an inlay design. However, removal of the uncemented humeral stem was always possible with no osteotomy or cortical window of the humeral shaft as the humeral stem has been designed with a bone ingrowth surface only on the metaphyseal part with a smooth surface on diaphyseal part. After removal of the stem, a small amount of humeral metaphysis was cut, and a new humeral stem was press-fit in a lower position. This allowed restoration of an appropriate tension of the soft tissue and, therefore, an easier reduction. The subscapularis was medialized and reinserted transosseously when possible with a double-row repair. In 3 cases, the subscapularis was torn and retracted at the level of the glenoid, or impossible to identify to allow its reinsertion.
Continue to: According to our infectious disease department...
According to our infectious disease department, we made a minimum of 5 cultures for each revision case looking for a possible low-grade infection. All cultures in our group are held for 14 days to assess for Propionibacterium acnes.
POSTOPERATIVE MANAGEMENT
A shoulder splint in neutral rotation was used for the first 4 weeks. Passive range of motion (ROM) was started immediately with pendulum exercises and passive anterior elevation. Active assisted and active ROM were allowed after 4 weeks, and physiotherapy was continued for 6 months. Elderly patients were referred to a center of rehabilitation. We found only 1 or 2 positive cultures (Propionibacterium acnes) for 4 patients, and we decided to consider them as a contamination. None of the patients were treated with antibiotics.
CLINICAL AND RADIOLOGICAL ASSESSMENT
Clinical evaluation included pre- and postoperative pain scores (visual analog scale [VAS]), ROM, the Constant-Murley13 score, the Simple Shoulder Test (SST),14 and the subjective shoulder value.15 Subjective satisfaction was assessed by asking the patients at follow-up how they felt compared with before surgery and was graded using a 4-point scale: 1, much better; 2, better; 3, the same; and 4, worse. Radiographic evaluation was performed on pre- and postoperative standard anteroposterior, outlet, and axillary views. Radiographs were reviewed to determine the presence of glenohumeral subluxation, periprosthetic lucency, component shift in position, and scapular notching.
STATISTICAL ANALYSIS
Descriptive statistics are reported as mean (range) for continuous measures and number (percentage) for discrete variables. The Wilcoxon signed-rank test was used for preoperative vs postoperative changes. The alpha level for all tests was set at 0.05 for statistical significance.
RESULTS
CLINICAL OUTCOME
At a mean of 22 months (range, 7-38 months) follow-up after revision, active ROM was significantly improved. Active flexion increased significantly from a mean of 93° (range, 30°-120°) to 138° (range, 95°-170°) (P = 0.021). Active external rotation with the elbow on the side increased significantly from 8° (range, −20°-15°) to 25° (range, −10°-60°) (P = 0.034), and increased with the arm held at 90° abduction from 13° (range, 0°-20°) to 49° (range, 0°-80°) (P = 0.025). Mean pain scores improved from 4.2 to 13.3 points (P < 0.001). VAS improved significantly from 9 to 1 (P < 0.0001). The mean Constant Scores improved from 21 (range, 18-32) to 63 (range, 43-90) (P = 0.006). The final SST was 7 per 12. Subjectively, 4 patients rated their shoulder as much better, 8 as better, and 1 as the same as preoperatively. No intra- or postoperative complications, including infections, were observed. The mean duration of the procedure was 60 minutes (range, 30-75 minutes).
Continue to: RADIOLOGICAL OUTCOME
RADIOLOGICAL OUTCOME
No periprosthetic lucency or shift in component was observed at the last follow-up. There was no scapular notching. No resorption of the tuberosities, and no fractures of the acromion or the scapular spine were observed.
DISCUSSION
In this retrospective study, failure of TSA with a metal-backed glenoid implant was successfully revised to RSA. In 10 patients, the use of a universal platform system allowed an easier conversion without removal of the humeral stem or the glenoid component (Figures 3A-3D). Twelve of the 13 patients were satisfied or very satisfied at the last follow-up. None of the patients were in pain, and the mean Constant score was 63. In all the cases, the glenoid baseplate was not changed. In 3 cases the humeral stem was changed without any fracture of the tuberosities of need for an osteotomy. This greatly simplified the revision procedure, as glenoid revisions can be very challenging. Indeed, it is often difficult to assess precisely preoperatively the remaining glenoid bone stock after removal of the glenoid component and the cement. Many therapeutic options to deal with glenoid loosening have been reported in the literature: glenoid bone reconstruction after glenoid component removal and revision to a hemiarthroplasty (HA),10,16-18 glenoid bone reconstruction after glenoid component removal and revision to a new TSA with a cemented glenoid implant,16,17,19,20 and glenoid reconstruction after glenoid component removal and revision to a RSA.12,21 These authors reported that glenoid reconstruction frequently necessitates an iliac bone graft associated with a special design of the baseplate with a long post fixed into the native glenoid bone. However, sometimes implantation of an uncemented glenoid component can be unstable with a high risk of early mobilization of the implant, and 2 steps may be necessary. Conversion to a HA,10,16-18 or a TSA16,17,19,20 with a new cemented implant have both been associated with poor clinical outcome, with a high rate of recurrent glenoid loosening for the TSAs.
In our retrospective study, we reported no intra- or postoperative complications. Flury and colleagues22 reported a complication rate of 38% in 21 patients after conversion from a TSA to a RSA with a mean follow-up of 46 months. They removed all the components of the prosthesis with a crack or fracture of the humerus and/or the glenoid. Ortmaier and colleagues23 reported a rate of complication of 22.7% during the conversion of TSA to RSA. They did an osteotomy of the humeral diaphysis to extract the stem in 40% of cases and had to remove the glenoid cement in 86% of cases with severe damage of the glenoid bone in 10% of cases. Fewer complications were found in our study, as we did not need any procedure such as humeral osteotomy, cerclage, bone grafting, and/or reconstruction of the glenoid. The short operative time and the absence of extensive soft-tissue dissection, thanks to a standard deltopectoral approach, could explain the absence of infection in our series.
Other authors shared our strategy of a universal convertible system and reported their results in the literature. Castagna and colleagues24 in 2013 reported the clinical and radiological results of conversions of HA or TSA to RSA using a modular, convertible system (SMR Shoulder System, Lima Corporate). In their series, only 8 cases of TSAs were converted to RSA. They preserved, in each case, the humeral stem and the glenoid baseplate. There were no intra- or postoperative complications. The mean VAS score decreased from 8 to 2. Weber-Spickschen and colleague25 reported recently in 2015 the same experience with the same system (SMR Shoulder System). They reviewed 15 conversions of TSAs to RSAs without any removal of the implants at a mean 43-month follow-up. They reported excellent pain relief (VAS decreased from 8 to 1) and improvement in shoulder function with a low rate of complications.
Kany and colleagues26 in 2015 had already reported the advantages of a shoulder platform system for revisions. In their series, the authors included cases of failure of HAs and TSAs with loose cemented glenoids and metal-backed glenoids. The clinical and radiological results were similar, with a final Constant score of 60 (range, 42-85) and a similar rate of humeral stems which had to be changed (24%). These stems were replaced either because they were too proud or because there was not enough space to add an onlay polyethylene socket.
Continue to: Despite the encouraging results...
Despite the encouraging results reported in this study, there are some limitations. Firstly, no control group was used. Attempting to address this issue, we compared our results with the literature. Secondly, the number of patients in our study was small. Finally, the follow-up duration (mean 22 months) did not provide long-term outcomes.
CONCLUSION
This retrospective study shows that a complete convertible system facilitates conversion of TSAs to RSAs with excellent pain relief and a significant improvement in shoulder function. A platform system on both the humeral and the glenoid side reduces the operative time of the conversion with a low risk of complications.
1. Brenner BC, Ferlic DC, Clayton ML, Dennis DA. Survivorship of unconstrained total shoulder arthroplasty. J Bone Joint Surg Am. 1989;71(9):1289-1296.
2. Budge MD, Nolan EM, Heisey MH, Baker K, Wiater JM. Results of total shoulder arthroplasty with a monoblock porous tantalum glenoid component: a prospective minimum 2-year follow-up study. J Shoulder Elbow Surg. 2013;22(4):535-541. doi:10.1016/j.jse.2012.06.001.
3. Chin PY, Sperling JW, Cofield RH, Schleck C. Complications of total shoulder arthroplasty: are they fewer or different? J Shoulder Elbow Surg. 2006;15(1):19-22. doi:10.1016/j.jse.2005.05.005.
4. Torchia ME, Cofield RH, Settergren CR. Total shoulder arthroplasty with the Neer prosthesis: long-term results. J Shoulder Elbow Surg. 1997;6(6):495-505.
5. Wirth MA, Rockwood CA Jr. Complications of total shoulder-replacement surgery. J Bone Joint Surg Am. 1996;78(4):603-616.
6. Gohlke F, Rolf O. Revision of failed fracture hemiarthroplasties to reverse total shoulder prosthesis through the transhumeral approach: method incorporating a pectoralis-major-pedicled bone window. Oper Orthop Traumatol. 2007;19(2):185-208. doi:10.1007/s00064-007-1202-x.
7. Goldberg SH, Cohen MS, Young M, Bradnock B. Thermal tissue damage caused by ultrasonic cement removal from the humerus. J Bone Joint Surg Am. 2005;87(3):583-591. doi:10.2106/JBJS.D.01966.
8. Sperling JW, Cofield RH. Humeral windows in revision shoulder arthroplasty. J Shoulder Elbow Surg. 2005;14(3):258-263. doi:10.1016/j.jse.2004.09.004.
9. Chacon A, Virani N, Shannon R, Levy JC, Pupello D, Frankle M. Revision arthroplasty with use of a reverse shoulder prosthesis-allograft composite. J Bone Joint Surg Am. 2009;91(1):119-127. doi:10.2106/JBJS.H.00094.
10. Iannotti JP, Frangiamore SJ. Fate of large structural allograft for treatment of severe uncontained glenoid bone deficiency. J Shoulder Elbow Surg. 2012;21(6):765-771. doi:10.1016/j.jse.2011.08.069.
11. Kelly JD 2nd, Zhao JX, Hobgood ER, Norris TR. Clinical results of revision shoulder arthroplasty using the reverse prosthesis. J Shoulder Elbow Surg. 2012;21(11):1516-1525. doi:10.1016/j.jse.2011.11.021.
12. Melis B, Bonnevialle N, Neyton L, et al. Glenoid loosening and failure in anatomical total shoulder arthroplasty: is revision with a reverse shoulder arthroplasty a reliable option? J Shoulder Elbow Surg. 2012;21(3):342-349. doi:10.1016/j.jse.2011.05.021.
13. Constant CR, Murley AH. A clinical method of functional assessment of the shoulder. Clin Orthop Relat Res. 1987;(214):160-164.
14. Matsen FA 3rd, Ziegler DW, DeBartolo SE. Patient self-assessment of health status and function in glenohumeral degenerative joint disease. J Shoulder Elbow Surg. 1995;4(5):345-351.
15. Gilbart MK, Gerber C. Comparison of the subjective shoulder value and the Constant score. J Shoulder Elbow Surg. 2007;16(6):717-721. doi:10.1016/j.jse.2007.02.123.
16. Antuna SA, Sperling JW, Cofield RH, Rowland CM. Glenoid revision surgery after total shoulder arthroplasty. J Shoulder Elbow Surg. 2001;10(3):217-224. doi:10.1067/mse.2001.113961.
17. Cofield RH, Edgerton BC. Total shoulder arthroplasty: complications and revision surgery. Instr Course Lect. 1990;39:449-462.
18. Neyton L, Walch G, Nove-Josserand L, Edwards TB. Glenoid corticocancellous bone grafting after glenoid component removal in the treatment of glenoid loosening. J Shoulder Elbow Surg. 2006;15(2):173-179. doi:10.1016/j.jse.2005.07.010.
19. Bonnevialle N, Melis B, Neyton L, et al. Aseptic glenoid loosening or failure in total shoulder arthroplasty: revision with glenoid reimplantation. J Shoulder Elbow Surg. 2013;22(6):745-751. doi:10.1016/j.jse.2012.08.009.
20. Rodosky MW, Bigliani LU. Indications for glenoid resurfacing in shoulder arthroplasty. J Shoulder Elbow Surg. 1996;5(3):231-248.
21. Bateman E, Donald SM. Reconstruction of massive uncontained glenoid defects using a combined autograft-allograft construct with reverse shoulder arthroplasty: preliminary results. J Shoulder Elbow Surg. 2012;21(7):925-934. doi:10.1016/j.jse.2011.07.009.
22. Flury MP, Frey P, Goldhahn J, Schwyzer HK, Simmen BR. Reverse shoulder arthroplasty as a salvage procedure for failed conventional shoulder replacement due to cuff failure--midterm results. Int Orthop. 2011;35(1):53-60. doi:10.1007/s00264-010-0990-z.
23. Ortmaier R, Resch H, Hitzl W, et al. Reverse shoulder arthroplasty combined with latissimus dorsi transfer using the bone-chip technique. Int Orthop. 2013;38(3):1-7. doi:10.1007/s00264-013-2139-3.
24. Castagna A, Delcogliano M, de Caro F, et al. Conversion of shoulder arthroplasty to reverse implants: clinical and radiological results using a modular system. Int Orthop. 2013;37(7):1297-1305. doi:10.1007/s00264-013-1907-4.
25. Weber-Spickschen TS, Alfke D, Agneskirchner JD. The use of a modular system to convert an anatomical total shoulder arthroplasty to a reverse shoulder arthroplasty: Clinical and radiological results. Bone Joint J. 2015;97-B(12):1662-1667. doi:10.1302/0301-620X.97B12.35176.
26. Kany J, Amouyel T, Flamand O, Katz D, Valenti P. A convertible shoulder system: is it useful in total shoulder arthroplasty revisions? Int Orthop. 2015;39(2):299-304. doi:10.1007/s00264-014-2563-z.
TAKE-HOME POINTS
- Full polyethylene is the gold standard, but the revision of glenoid loosening leads a difficult reconstruction of a glenoid bone.
- A complete convertible system facilitates the revision and decreases the rate of complications.
- The functional and subjective results of the revision are good.
- During the revision, the metalback was well fixed without any sign of loosening.
- In 3 cases the humeral stem was changed; in 2 cases there was no space to reduce (onlay system) and in 1 case it was an older design, nonadapted.

Use of a Small-Bore Needle Arthroscope to Diagnose Intra-Articular Knee Pathology: Comparison With Magnetic Resonance Imaging
ABSTRACT
The use of arthroscopy for purely diagnostic purposes has been largely supplanted by noninvasive technologies, such as magnetic resonance imaging (MRI). The mi-eye+TM (Trice Medical) technology is a small-bore needle unit for in-office arthroscopy. We conducted a pilot study comparing the mi-eye+TM unit with MRI, using surgical arthroscopy as a gold-standard reference. We hypothesized that the mi-eye+TM needle arthroscope, which can be used in an office setting, would be equivalent to MRI for the diagnosis of intra-articular pathology of the knee.
This prospective, multicenter, observational study was approved by the Institutional Review Board. There were 106 patients (53 males, 53 females) in the study. MRIs were interpreted by musculoskeletally trained radiologists. The study was conducted in the operating room using the mi-eye+TM device. The mi-eye+ TM device findings were compared with the MRI findings within individual pathologies, and a “per-patient” analysis was performed to compare the arthroscopic findings with those of the mi-eye+TM and the MRI. Additionally, we identified all mi-eye+TM findings and MRI findings that exactly matched the surgical arthroscopy findings.
The mi-eye+TM demonstrated complete accuracy of all pathologies for 97 (91.5%) of the 106 patients included in the study, whereas MRI demonstrated complete accuracy for 65 patients (61.3%) (P < .0001). All discrepancies between mi-eye+TM and arthroscopy were false-negative mi-eye+TM results, as the mi-eye+TM did not reveal some aspect of the knee’s pathology for 9 patients. The mi-eye+TM was more sensitive than MRI in identifying meniscal tears (92.6% vs 77.8%; P = .0035) and more specific in diagnosing these tears (100% vs 41.7%; P < .0001).
The mi-eye+TM device proved to be more sensitive and specific than MRI for intra-articular findings at time of knee arthroscopy. Certainly there are contraindications to using the mi-eye+TM, and our results do not obviate the need for MRI, but our study did demonstrate that the mi-eye+TM needle arthroscope can safely provide excellent visualization of intra-articular knee pathology.
Continue to: Surgical arthroscopy is the gold standard...
Surgical arthroscopy is the gold standard for the diagnosis of intra-articular knee pathologies. Nevertheless, the use of arthroscopy for purely diagnostic purposes has been largely supplanted by noninvasive technologies, such as magnetic resonance imaging (MRI). Although MRI is considered the standard diagnostic tool for acute and chronic soft-tissue injuries of the knee, its use is not without contraindication and some potential inconveniences. Contraindications to MRI are well documented. In terms of inconvenience, MRI usually requires a separate visit followed by another visit to the prescribing physician. In addition, required interpretation by a radiologist may lead to a delay in care and increase in cost.
In the early 1990s, in-office needle arthroscopy was described as a viable means of diagnosing pathologies and obtaining synovial biopsies from the knee.1-3 Initial results were good, and the procedures had very low complication rates. Nevertheless, in-office arthroscopy of the knee is not yet widely performed, likely given concerns about the technical difficulties of in-office arthroscopy, the potential for patient discomfort, and the cumbersomeness of in-office arthroscopy units. However, significant advances have been made in the resolution capability of small-bore needle arthroscopy, resulting in much less painful procedures. Additionally, the early hardware designs, which mimicked operating room setups using towers, fluid irrigation systems, and larger arthroscopes, have been replaced with small-needle arthroscopes that use syringes for irrigation and tablet computers for visualization (Figures 1A, 1B).
 The mi-eye+TM (Trice Medical) tablet in-office scope. (B) Representative image of a right knee medial meniscus using the mi-eye+TM in-office scope.")
The mi-eye+TM technology (Trice Medical) is a small-bore needle unit for in-office arthroscopy with digital optics that does not need an irrigation tower. We conducted a pilot study of the sensitivity and specificity of the mi-eye+TM unit in comparison with MRI, using surgical arthroscopy as a gold-standard reference. We hypothesized that the mi-eye+TM needle arthroscope, which can be used in an office setting, would be equivalent to the standard of care (MRI) for the diagnosis of intra-articular pathology of the knee.
METHODS
Central regulatory approval for this prospective, multicenter, observational study was obtained from the Western Institutional Review Board for 3 of the sites, and 1 institution required and was granted internal Institutional Review Board approval.
The study was performed by 4 sports medicine orthopedic surgeons experienced in using the mi-eye+TM in-office arthroscope. Patients were enrolled from December 2015 through June 2016. Inclusion criteria were an indication for an arthroscopic procedure of the knee based on history, physical examination, and MRI findings. Patients were excluded from the study if there were any contraindications to completing an MRI. Acute hemarthroses of the knee or active systemic infections were also excluded. Once a patient was identified as meeting the criteria for participation, informed consent was obtained. Of the 113 patients who enrolled, 7 did not have a complete study dataset available, leaving 106 patients (53 males, 53 females) in the study. Mean age was 47 years (range, 18-82 years).
Continue to: A test result form was used...
A test result form was used to record mi-eye+TM, surgical arthroscopy, and MRI results. This form required a “positive” or “negative” result for all of several diagnoses: medial and lateral meniscal tears, intra-articular loose body, osteoarthritis (OA), osteochondritis dissecans (OCD), and tears of the anterior and posterior cruciate ligaments (ACL, PCL). MRI was performed at a variety of imaging facilities, but the images were interpreted by musculoskeletally trained radiologists.
The study was conducted in the operating room. After the patient was appropriately anesthetized, and the extremity prepared and draped, the mi-eye+TM procedure was performed immediately prior to surgical arthroscopy. A tourniquet was not used. At surgeon discretion, medial, lateral, or both approaches were used with the mi-eye+TM, and diagnostic arthroscopy was performed. During the procedure, the mi-eye+TM was advanced into the knee. Once in the synovial compartment, the external 14-gauge needle was retracted, exposing the unit’s optics. Visualization was improved by injecting normal saline through the lure lock in the mi-eye+TM needle arthroscope. An average of 20 mL of saline was used, though the amount varied with surgeon discretion. Subsequently, the surgeon visualized structures in the knee and documented all findings.
At the end of the mi-eye+TM procedure, the scheduled surgical arthroscopy was performed. After the surgical procedure, if there were no issues or complications, the patient was discharged from the study. No follow-up was required for the study, as arthroscopic findings served as the conclusive diagnosis for each patient, and no interventions were being studied. There were no complications related to use of the mi-eye+TM.
The mi-eye+TM device findings were compared with the MRI findings within individual pathologies, and a “per-patient” analysis was performed to compare the arthroscopic findings with those of the mi-eye+TM and the MRI. Additionally, we identified all mi-eye+TM findings and MRI findings that exactly matched the surgical arthroscopy findings. When a test had no false-positive or false-negative findings in comparison with surgical arthroscopy, it was identified as having complete accuracy for all intra-articular knee pathologies. For these methods, the 95% confidence interval was determined based on binomial distribution.
RESULTS
The mi-eye+ TM demonstrated complete accuracy of all pathologies for 97 (91.5%) of the 106 patients included in the study, whereas MRI demonstrated complete accuracy for 65 patients (61.3%) (P < .0001). All discrepancies between mi-eye+TM and surgical arthroscopy were false-negative mi-eye+TM results, as the mi-eye+TM did not reveal some aspect of the knee’s pathology for 9 patients. On the other hand, MRI demonstrated both false-negative and false-positive results, failing to reveal some aspect of the knee’s pathology for 31 patients, and potentially overcalling some aspect of the knee’s pathology among 18 patients.
Continue to: The pathology most frequently...
The pathology most frequently identified in the study was a meniscal tear. The mi-eye+TM was more sensitive than MRI in identifying meniscal tears (92.6% vs 77.8%; P = .0035) and more specific in diagnosing these tears (100% vs 87.5%; P < .0002). The difference in specificity resulted from the false MRI diagnosis of a meniscal tear among 24 patients, who were found to have no tear by both mi-eye+TM and surgical arthroscopy.
Table 1. Raw Data of mi-eye+TM and Magnetic Resonance Imaging Findings
| Data | True-Positive | False-Negative | False-Negative | True-Negative |
| mi-eye+TM | ||||
| Medial meniscal tear | 68 | 3 | 0 | 35 |
| Lateral meniscal tear | 32 | 5 | 0 | 69 |
| Any meniscal tear | 100 | 8 | 0 | 104 |
| Intra-articular loose body | 13 | 2 | 0 | 87 |
| Osteoarthritis | 31 | 2 | 00 | 73 |
| Osteochondritis dissecans | 8 | 2 | 0 | 97 |
| Anterior cruciate ligament tear | 16 | 0 | 0 | 90 |
| Posterior cruciate ligament tear | 0 | 0 | 0 | 106 |
| All pathologies | 168 | 14 | 0 | 557 |
| Magnetic resonance imaging | ||||
| Medial meniscal tear | 62 | 9 | 6 | 29 |
| Lateral meniscal tear | 22 | 15 | 7 | 62 |
| Any meniscal tear | 84 | 24 | 13 | 91 |
| Intra-articular loose body | 3 | 12 | 0 | 87 |
| Osteoarthritis | 26 | 7 | 8 | 65 |
| Osteochondritis dissecans | 5 | 5 | 4 | 93 |
| Anterior cruciate ligament tear | 14 | 2 | 3 | 87 |
| Posterior cruciate ligament tear | 0 | 0 | 2 | 104 |
| All pathologies | 132 | 500 | 30 | 527 |
The second most frequent pathology was an intra-articular loose body. The mi-eye+TM was more sensitive than MRI in identifying loose bodies (86.7% vs 20%; P = .0007). The specificity of the mi-eye+TM and the specificity of MRI were equivalent in diagnosing loose bodies (100%). Table 1 and Table 2 show the complete set of diagnoses and associated diagnostic profiles.
Table 2. Diagnostic Profiles: Sensitivity and Specificity of mi-eye+TM and Magnetic Resonance Imaging
| Patient Group | mi-eye+TM | MRI | |||
| Estimate, % | CI, % | Estimate, % | CI, % | Pa | |
| Sensitivity | |||||
| Medial meniscal tear | 95.77 | 88.1-99.1 | 87.32 | 77.3-94.0 | .0129 |
| Lateral meniscal tear | 86.49 | 71.2-95.5 | 59.46 | 42.1-75.3 | .0172 |
| Any meniscal tear | 92.59 | 85.9-96.8 | 77.78 | 68.8-85.2 | .0035 |
| Intra-articular loose body | 86.70 | 59.5-98.3 | 20 | 4.3-48.1 | .0006789 |
| Osteoarthritis | 93.90 | 79.8-99.3 | 78.80 | 61.1-91.0 | .1487 |
| Osteochondritis dissecans | 80.00 | 44.4-97.5 | 50 | 18.7-81.3 | .3498 |
| Anterior crucitate ligament tear | 100.00 | 79.4-100.0 | 87.50 | 61.7-98.4 | .4839 |
| Posterior cruciate ligament tear | N/A | N/A | N/A | N/A | N/A |
| Specificity | |||||
| Medial meniscal tear | 100.00 | 90.0-100.0 | 82.86 | 66.4-93.4 | .0246 |
| Lateral meniscal tear | 100.00 | 94.8-100.0 | 89.86 | 80.2-95.8 | .0133 |
| Any meniscal tear | 100.00 | 96.5-100.0 | 87.50 | 79.6-93.2 | .0002 |
| Intra-articular loose body | 100.00 | 95.9-100.0 | 100.00 | 95.9-100.0 | 1 |
| Osteoarthritis | 100.00 | 95.1-100.0 | 89.00 | 79.5-95.1 | .006382 |
| Osteochondritis dissecans | 100.00 | 96.3-100.0 | 95.90 | 89.8-98.9 | .1211 |
| Anterior cruciate ligament tear | 100.00 | 96.0-100.0 | 96.70 | 90.6-99.3 | .2458 |
| Posterior crttuciate ligament tear | 100.00 | 96.6-100.0 | 98.10 | 93.4-99.8 | .4976 |
aBold P values are significant. Abbreviations: CI, confidence interval; MRI, magnetic resonance imaging; N/A, not applicable.
DISCUSSION
The overall accuracy of the mi-eye+TM was superior to that of MRI relative to the arthroscopic gold standard in this pilot study. Other studies have demonstrated the accuracy, feasibility, and cost-efficacy of in-office arthroscopy. However, likely because of the cumbersomeness of in-office arthroscopy equipment and the potential for patient discomfort, the technique is not yet standard in the field. Recent advances in small-bore technology, digital optics, and ergonomics have addressed the difficulties associated with in-office arthroscopy, facilitating a faster and more efficient procedure. Our goal in this study was to evaluate the diagnostic capability of the mi-eye+TM in-office arthroscopy unit, which features a small bore, digital optics, and functionality without an irrigation tower.
This study of 106 patients demonstrated equivalent or better accuracy of the mi-eye+TM relative to MRI when compared with the gold standard of surgical arthroscopy. This was not surprising given that both the mi-eye+TM and surgical arthroscopy are based on direct visualization of intra-articular pathology. The mi-eye+TM unit identified more meniscal tears, intra-articular loose bodies, ACL tears, and OCD lesions than MRI did, and with enough power to demonstrate statistically significant improved sensitivity for meniscal tears and loose bodies. Furthermore, MRI demonstrated false-positive meniscal tears, ACL tears, OCD lesions, and OA, whereas the mi-eye+TM did not demonstrate any false-positive results in comparison with surgical arthroscopy. This study demonstrated statistically significant improved specificity of the mi-eye+ compared with MRI in the diagnosis of meniscal tears and OA.
There are several limitations to our study. We refer to it as a pilot study because it was performed in a standard operating room. Before taking the technology to an outpatient setting, we wanted to confirm efficacy and safety in an operating room. However, the techniques used in this study are readily transferable to the outpatient clinic setting and to date have been used in more than 2000 cases.
Continue to: The specificity of MRI...
The specificity of MRI for meniscal tears was unexpectedly low compared with previous studies, which may reflect the multi-institution, multi-surgeon, multi-radiologist involvement in MRI interpretation.4-10 MRI was performed at a variety of institutions without a standardized protocol. This lack of standardization of image capture and interpretation may have contributed to the suboptimal performance of MRI, falsely decreasing the potential ideal specificity for meniscal tears. Although this study may have underestimated the specificity of MRI for meniscal tears, we think the mi-eye+TM and MRI results reported here reflect the findings of standard practice, without the standardization usually applied in studies. For example, a study of 139 knee MRI reports at 14 different institutions confirmed arthroscopic findings and concluded that 37% of the operations supported by a significant MRI finding were unjustified.11 The authors attributed the rate of false-positive MRI findings to the wide variety of places where patients had their MRIs performed, and the subsequent variation in quality of imaging and MRI reader skill level.11
Before inserting the mi-eye+TM needle arthroscope, the surgeons had a working diagnosis of the pathology based on their clinical examination and MRI results. Clearly, this introduced a bias. Further studies will be conducted in a prospective, blinded manner to address this limitation.
Although studies of in-office arthroscopy technology date to the 1990s, there is an overall lack of data comparing in-office arthroscopy with MRI. Halbrecht and Jackson2 conducted a study of 20 knee patients with both MRI and in-office needle arthroscopy. Overall, MRI was poor in detecting cartilage defects, with sensitivity of 34.6%, using the in-office arthroscopy as the confirmatory diagnosis. Although the authors did not compare in-office diagnoses with surgical arthroscopic findings, they concluded that office arthroscopy is an accurate and cost-efficient alternative to MRI in diagnostic evaluation of knee patients. Xerogeanes and colleagues12 studied 110 patients in a prospective, blinded, multicenter trial comparing a minimally invasive office-based arthroscopy with MRI, using surgical arthroscopy as the confirmatory diagnosis. They concluded that the office-based arthroscope was statistically equivalent to diagnostic surgical arthroscopy and that it outperformed MRI in helping make accurate diagnoses. The authors applied a cost analysis to their findings and determined that office-based arthroscopy could result in an annual potential savings of $177 million for the healthcare system.12
Modern imaging sequences on high-Tesla MRI machines provide excellent visualization. Nevertheless, a significant number of patients do not undergo MRI, owing to time constraints, contraindications, body habitus, or anxiety/claustrophobia. Our study results confirmed that doctors treating such patients now have a viable alternative to help diagnose pathology.
CONCLUSION
The mi-eye+TM device proved to be more sensitive and specific than MRI for intra-articular findings at the time of knee arthroscopy. Certainly there are contraindications to using the mi-eye+TM, and our results do not obviate the need for MRI; our study did demonstrate that the mi-eye+TM needle arthroscope can safely provide excellent visualization of intra-articular knee pathology. More studies of the mi-eye+TM device in a clinical setting are warranted.
1. Baeten D, Van den Bosch F, Elewaut D, Stuer A, Veys EM, De Keyser F. Needle arthroscopy of the knee with synovial biopsy sampling: technical experience in 150 patients. Clin Rheumatol. 1999;18(6):434-441.
2. Halbrecht J, Jackson D. Office arthroscopy: a diagnostic alternative. Arthroscopy. 1992;8(3):320-326.
3. Batcheleor R, Henshaw K, Astin P, Emery P, Reece R, Leeds DM. Rheumatological needle arthroscopy: a 5-year follow up of safety and efficacy. Arthritis Rheum Ann Sci Meet Abstr. 2001;(9 suppl).
4. Barronian AD, Zoltan JD, Bucon KA. Magnetic resonance imaging of the knee: correlation with arthroscopy. Arthroscopy. 1989;5(3):187-191.
5. Crues JV 3rd, Ryu R, Morgan FW. Meniscal pathology. The expanding role of magnetic resonance imaging. Clin Orthop Relat Res. 1990;(252):80-87.
6. Raunest J, Oberle K, Leohnert J, Hoetzinger H. The clinical value of magnetic resonance imaging in the evaluation of meniscal disorders. J Bone Joint Surg Am. 1991;73(1):11-16.
7. Spiers AS, Meagher T, Ostlere SJ, Wilson DJ, Dodd CA. Can MRI of the knee affect arthroscopic practice? A prospective study of 58 patients. J Bone Joint Surg Br. 1993;75(1):49-52.
8. O’Shea KJ, Murphy KP, Heekin RD, Herzwurm PJ. The diagnostic accuracy of history, physical examination, and radiographs in the evaluation of traumatic knee disorders. Am J Sports Med. 1996;24(2):164-167.
9. Ben-Galim P, Steinberg EL, Amir H, Ash N, Dekel S, Arbel R. Accuracy of magnetic resonance imaging of the knee and unjustified surgery. Clin Orthop Relat Res. 2006;(447):100-104.
10. Gramas DA, Antounian FS, Peterfy CG, Genant HK, Lane NE. Assessment of needle arthroscopy, standard arthroscopy, physical examination, and magnetic resonance imaging in knee pain: a pilot study. J Clin Rheumatol. 1995;1(1):26-34.
11. Voigt JD, Mosier M, Huber B. In-office diagnostic arthroscopy for knee and shoulder intra-articular injuries: its potential impact on cost savings in the United States. BMC Health Serv Res. 2014;14:203.
12. Xerogeanes JW, Safran MR, Huber B, Mandelbaum BR, Robertson W, Gambardella RA. A prospective multi-center clinical trial to compare efficiency, accuracy and safety of the VisionScope imaging system compared to MRI and diagnostic arthroscopy. Orthop J Sports Med. 2014;2(2 suppl):1.
ABSTRACT
The use of arthroscopy for purely diagnostic purposes has been largely supplanted by noninvasive technologies, such as magnetic resonance imaging (MRI). The mi-eye+TM (Trice Medical) technology is a small-bore needle unit for in-office arthroscopy. We conducted a pilot study comparing the mi-eye+TM unit with MRI, using surgical arthroscopy as a gold-standard reference. We hypothesized that the mi-eye+TM needle arthroscope, which can be used in an office setting, would be equivalent to MRI for the diagnosis of intra-articular pathology of the knee.
This prospective, multicenter, observational study was approved by the Institutional Review Board. There were 106 patients (53 males, 53 females) in the study. MRIs were interpreted by musculoskeletally trained radiologists. The study was conducted in the operating room using the mi-eye+TM device. The mi-eye+ TM device findings were compared with the MRI findings within individual pathologies, and a “per-patient” analysis was performed to compare the arthroscopic findings with those of the mi-eye+TM and the MRI. Additionally, we identified all mi-eye+TM findings and MRI findings that exactly matched the surgical arthroscopy findings.
The mi-eye+TM demonstrated complete accuracy of all pathologies for 97 (91.5%) of the 106 patients included in the study, whereas MRI demonstrated complete accuracy for 65 patients (61.3%) (P < .0001). All discrepancies between mi-eye+TM and arthroscopy were false-negative mi-eye+TM results, as the mi-eye+TM did not reveal some aspect of the knee’s pathology for 9 patients. The mi-eye+TM was more sensitive than MRI in identifying meniscal tears (92.6% vs 77.8%; P = .0035) and more specific in diagnosing these tears (100% vs 41.7%; P < .0001).
The mi-eye+TM device proved to be more sensitive and specific than MRI for intra-articular findings at time of knee arthroscopy. Certainly there are contraindications to using the mi-eye+TM, and our results do not obviate the need for MRI, but our study did demonstrate that the mi-eye+TM needle arthroscope can safely provide excellent visualization of intra-articular knee pathology.
Continue to: Surgical arthroscopy is the gold standard...
Surgical arthroscopy is the gold standard for the diagnosis of intra-articular knee pathologies. Nevertheless, the use of arthroscopy for purely diagnostic purposes has been largely supplanted by noninvasive technologies, such as magnetic resonance imaging (MRI). Although MRI is considered the standard diagnostic tool for acute and chronic soft-tissue injuries of the knee, its use is not without contraindication and some potential inconveniences. Contraindications to MRI are well documented. In terms of inconvenience, MRI usually requires a separate visit followed by another visit to the prescribing physician. In addition, required interpretation by a radiologist may lead to a delay in care and increase in cost.
In the early 1990s, in-office needle arthroscopy was described as a viable means of diagnosing pathologies and obtaining synovial biopsies from the knee.1-3 Initial results were good, and the procedures had very low complication rates. Nevertheless, in-office arthroscopy of the knee is not yet widely performed, likely given concerns about the technical difficulties of in-office arthroscopy, the potential for patient discomfort, and the cumbersomeness of in-office arthroscopy units. However, significant advances have been made in the resolution capability of small-bore needle arthroscopy, resulting in much less painful procedures. Additionally, the early hardware designs, which mimicked operating room setups using towers, fluid irrigation systems, and larger arthroscopes, have been replaced with small-needle arthroscopes that use syringes for irrigation and tablet computers for visualization (Figures 1A, 1B).
The mi-eye+TM technology (Trice Medical) is a small-bore needle unit for in-office arthroscopy with digital optics that does not need an irrigation tower. We conducted a pilot study of the sensitivity and specificity of the mi-eye+TM unit in comparison with MRI, using surgical arthroscopy as a gold-standard reference. We hypothesized that the mi-eye+TM needle arthroscope, which can be used in an office setting, would be equivalent to the standard of care (MRI) for the diagnosis of intra-articular pathology of the knee.
METHODS
Central regulatory approval for this prospective, multicenter, observational study was obtained from the Western Institutional Review Board for 3 of the sites, and 1 institution required and was granted internal Institutional Review Board approval.
The study was performed by 4 sports medicine orthopedic surgeons experienced in using the mi-eye+TM in-office arthroscope. Patients were enrolled from December 2015 through June 2016. Inclusion criteria were an indication for an arthroscopic procedure of the knee based on history, physical examination, and MRI findings. Patients were excluded from the study if there were any contraindications to completing an MRI. Acute hemarthroses of the knee or active systemic infections were also excluded. Once a patient was identified as meeting the criteria for participation, informed consent was obtained. Of the 113 patients who enrolled, 7 did not have a complete study dataset available, leaving 106 patients (53 males, 53 females) in the study. Mean age was 47 years (range, 18-82 years).
Continue to: A test result form was used...
A test result form was used to record mi-eye+TM, surgical arthroscopy, and MRI results. This form required a “positive” or “negative” result for all of several diagnoses: medial and lateral meniscal tears, intra-articular loose body, osteoarthritis (OA), osteochondritis dissecans (OCD), and tears of the anterior and posterior cruciate ligaments (ACL, PCL). MRI was performed at a variety of imaging facilities, but the images were interpreted by musculoskeletally trained radiologists.
The study was conducted in the operating room. After the patient was appropriately anesthetized, and the extremity prepared and draped, the mi-eye+TM procedure was performed immediately prior to surgical arthroscopy. A tourniquet was not used. At surgeon discretion, medial, lateral, or both approaches were used with the mi-eye+TM, and diagnostic arthroscopy was performed. During the procedure, the mi-eye+TM was advanced into the knee. Once in the synovial compartment, the external 14-gauge needle was retracted, exposing the unit’s optics. Visualization was improved by injecting normal saline through the lure lock in the mi-eye+TM needle arthroscope. An average of 20 mL of saline was used, though the amount varied with surgeon discretion. Subsequently, the surgeon visualized structures in the knee and documented all findings.
At the end of the mi-eye+TM procedure, the scheduled surgical arthroscopy was performed. After the surgical procedure, if there were no issues or complications, the patient was discharged from the study. No follow-up was required for the study, as arthroscopic findings served as the conclusive diagnosis for each patient, and no interventions were being studied. There were no complications related to use of the mi-eye+TM.
The mi-eye+TM device findings were compared with the MRI findings within individual pathologies, and a “per-patient” analysis was performed to compare the arthroscopic findings with those of the mi-eye+TM and the MRI. Additionally, we identified all mi-eye+TM findings and MRI findings that exactly matched the surgical arthroscopy findings. When a test had no false-positive or false-negative findings in comparison with surgical arthroscopy, it was identified as having complete accuracy for all intra-articular knee pathologies. For these methods, the 95% confidence interval was determined based on binomial distribution.
RESULTS
The mi-eye+ TM demonstrated complete accuracy of all pathologies for 97 (91.5%) of the 106 patients included in the study, whereas MRI demonstrated complete accuracy for 65 patients (61.3%) (P < .0001). All discrepancies between mi-eye+TM and surgical arthroscopy were false-negative mi-eye+TM results, as the mi-eye+TM did not reveal some aspect of the knee’s pathology for 9 patients. On the other hand, MRI demonstrated both false-negative and false-positive results, failing to reveal some aspect of the knee’s pathology for 31 patients, and potentially overcalling some aspect of the knee’s pathology among 18 patients.
Continue to: The pathology most frequently...
The pathology most frequently identified in the study was a meniscal tear. The mi-eye+TM was more sensitive than MRI in identifying meniscal tears (92.6% vs 77.8%; P = .0035) and more specific in diagnosing these tears (100% vs 87.5%; P < .0002). The difference in specificity resulted from the false MRI diagnosis of a meniscal tear among 24 patients, who were found to have no tear by both mi-eye+TM and surgical arthroscopy.
Table 1. Raw Data of mi-eye+TM and Magnetic Resonance Imaging Findings
| Data | True-Positive | False-Negative | False-Negative | True-Negative |
| mi-eye+TM | ||||
| Medial meniscal tear | 68 | 3 | 0 | 35 |
| Lateral meniscal tear | 32 | 5 | 0 | 69 |
| Any meniscal tear | 100 | 8 | 0 | 104 |
| Intra-articular loose body | 13 | 2 | 0 | 87 |
| Osteoarthritis | 31 | 2 | 00 | 73 |
| Osteochondritis dissecans | 8 | 2 | 0 | 97 |
| Anterior cruciate ligament tear | 16 | 0 | 0 | 90 |
| Posterior cruciate ligament tear | 0 | 0 | 0 | 106 |
| All pathologies | 168 | 14 | 0 | 557 |
| Magnetic resonance imaging | ||||
| Medial meniscal tear | 62 | 9 | 6 | 29 |
| Lateral meniscal tear | 22 | 15 | 7 | 62 |
| Any meniscal tear | 84 | 24 | 13 | 91 |
| Intra-articular loose body | 3 | 12 | 0 | 87 |
| Osteoarthritis | 26 | 7 | 8 | 65 |
| Osteochondritis dissecans | 5 | 5 | 4 | 93 |
| Anterior cruciate ligament tear | 14 | 2 | 3 | 87 |
| Posterior cruciate ligament tear | 0 | 0 | 2 | 104 |
| All pathologies | 132 | 500 | 30 | 527 |
The second most frequent pathology was an intra-articular loose body. The mi-eye+TM was more sensitive than MRI in identifying loose bodies (86.7% vs 20%; P = .0007). The specificity of the mi-eye+TM and the specificity of MRI were equivalent in diagnosing loose bodies (100%). Table 1 and Table 2 show the complete set of diagnoses and associated diagnostic profiles.
Table 2. Diagnostic Profiles: Sensitivity and Specificity of mi-eye+TM and Magnetic Resonance Imaging
| Patient Group | mi-eye+TM | MRI | |||
| Estimate, % | CI, % | Estimate, % | CI, % | Pa | |
| Sensitivity | |||||
| Medial meniscal tear | 95.77 | 88.1-99.1 | 87.32 | 77.3-94.0 | .0129 |
| Lateral meniscal tear | 86.49 | 71.2-95.5 | 59.46 | 42.1-75.3 | .0172 |
| Any meniscal tear | 92.59 | 85.9-96.8 | 77.78 | 68.8-85.2 | .0035 |
| Intra-articular loose body | 86.70 | 59.5-98.3 | 20 | 4.3-48.1 | .0006789 |
| Osteoarthritis | 93.90 | 79.8-99.3 | 78.80 | 61.1-91.0 | .1487 |
| Osteochondritis dissecans | 80.00 | 44.4-97.5 | 50 | 18.7-81.3 | .3498 |
| Anterior crucitate ligament tear | 100.00 | 79.4-100.0 | 87.50 | 61.7-98.4 | .4839 |
| Posterior cruciate ligament tear | N/A | N/A | N/A | N/A | N/A |
| Specificity | |||||
| Medial meniscal tear | 100.00 | 90.0-100.0 | 82.86 | 66.4-93.4 | .0246 |
| Lateral meniscal tear | 100.00 | 94.8-100.0 | 89.86 | 80.2-95.8 | .0133 |
| Any meniscal tear | 100.00 | 96.5-100.0 | 87.50 | 79.6-93.2 | .0002 |
| Intra-articular loose body | 100.00 | 95.9-100.0 | 100.00 | 95.9-100.0 | 1 |
| Osteoarthritis | 100.00 | 95.1-100.0 | 89.00 | 79.5-95.1 | .006382 |
| Osteochondritis dissecans | 100.00 | 96.3-100.0 | 95.90 | 89.8-98.9 | .1211 |
| Anterior cruciate ligament tear | 100.00 | 96.0-100.0 | 96.70 | 90.6-99.3 | .2458 |
| Posterior crttuciate ligament tear | 100.00 | 96.6-100.0 | 98.10 | 93.4-99.8 | .4976 |
aBold P values are significant. Abbreviations: CI, confidence interval; MRI, magnetic resonance imaging; N/A, not applicable.
DISCUSSION
The overall accuracy of the mi-eye+TM was superior to that of MRI relative to the arthroscopic gold standard in this pilot study. Other studies have demonstrated the accuracy, feasibility, and cost-efficacy of in-office arthroscopy. However, likely because of the cumbersomeness of in-office arthroscopy equipment and the potential for patient discomfort, the technique is not yet standard in the field. Recent advances in small-bore technology, digital optics, and ergonomics have addressed the difficulties associated with in-office arthroscopy, facilitating a faster and more efficient procedure. Our goal in this study was to evaluate the diagnostic capability of the mi-eye+TM in-office arthroscopy unit, which features a small bore, digital optics, and functionality without an irrigation tower.
This study of 106 patients demonstrated equivalent or better accuracy of the mi-eye+TM relative to MRI when compared with the gold standard of surgical arthroscopy. This was not surprising given that both the mi-eye+TM and surgical arthroscopy are based on direct visualization of intra-articular pathology. The mi-eye+TM unit identified more meniscal tears, intra-articular loose bodies, ACL tears, and OCD lesions than MRI did, and with enough power to demonstrate statistically significant improved sensitivity for meniscal tears and loose bodies. Furthermore, MRI demonstrated false-positive meniscal tears, ACL tears, OCD lesions, and OA, whereas the mi-eye+TM did not demonstrate any false-positive results in comparison with surgical arthroscopy. This study demonstrated statistically significant improved specificity of the mi-eye+ compared with MRI in the diagnosis of meniscal tears and OA.
There are several limitations to our study. We refer to it as a pilot study because it was performed in a standard operating room. Before taking the technology to an outpatient setting, we wanted to confirm efficacy and safety in an operating room. However, the techniques used in this study are readily transferable to the outpatient clinic setting and to date have been used in more than 2000 cases.
Continue to: The specificity of MRI...
The specificity of MRI for meniscal tears was unexpectedly low compared with previous studies, which may reflect the multi-institution, multi-surgeon, multi-radiologist involvement in MRI interpretation.4-10 MRI was performed at a variety of institutions without a standardized protocol. This lack of standardization of image capture and interpretation may have contributed to the suboptimal performance of MRI, falsely decreasing the potential ideal specificity for meniscal tears. Although this study may have underestimated the specificity of MRI for meniscal tears, we think the mi-eye+TM and MRI results reported here reflect the findings of standard practice, without the standardization usually applied in studies. For example, a study of 139 knee MRI reports at 14 different institutions confirmed arthroscopic findings and concluded that 37% of the operations supported by a significant MRI finding were unjustified.11 The authors attributed the rate of false-positive MRI findings to the wide variety of places where patients had their MRIs performed, and the subsequent variation in quality of imaging and MRI reader skill level.11
Before inserting the mi-eye+TM needle arthroscope, the surgeons had a working diagnosis of the pathology based on their clinical examination and MRI results. Clearly, this introduced a bias. Further studies will be conducted in a prospective, blinded manner to address this limitation.
Although studies of in-office arthroscopy technology date to the 1990s, there is an overall lack of data comparing in-office arthroscopy with MRI. Halbrecht and Jackson2 conducted a study of 20 knee patients with both MRI and in-office needle arthroscopy. Overall, MRI was poor in detecting cartilage defects, with sensitivity of 34.6%, using the in-office arthroscopy as the confirmatory diagnosis. Although the authors did not compare in-office diagnoses with surgical arthroscopic findings, they concluded that office arthroscopy is an accurate and cost-efficient alternative to MRI in diagnostic evaluation of knee patients. Xerogeanes and colleagues12 studied 110 patients in a prospective, blinded, multicenter trial comparing a minimally invasive office-based arthroscopy with MRI, using surgical arthroscopy as the confirmatory diagnosis. They concluded that the office-based arthroscope was statistically equivalent to diagnostic surgical arthroscopy and that it outperformed MRI in helping make accurate diagnoses. The authors applied a cost analysis to their findings and determined that office-based arthroscopy could result in an annual potential savings of $177 million for the healthcare system.12
Modern imaging sequences on high-Tesla MRI machines provide excellent visualization. Nevertheless, a significant number of patients do not undergo MRI, owing to time constraints, contraindications, body habitus, or anxiety/claustrophobia. Our study results confirmed that doctors treating such patients now have a viable alternative to help diagnose pathology.
CONCLUSION
The mi-eye+TM device proved to be more sensitive and specific than MRI for intra-articular findings at the time of knee arthroscopy. Certainly there are contraindications to using the mi-eye+TM, and our results do not obviate the need for MRI; our study did demonstrate that the mi-eye+TM needle arthroscope can safely provide excellent visualization of intra-articular knee pathology. More studies of the mi-eye+TM device in a clinical setting are warranted.
1. Baeten D, Van den Bosch F, Elewaut D, Stuer A, Veys EM, De Keyser F. Needle arthroscopy of the knee with synovial biopsy sampling: technical experience in 150 patients. Clin Rheumatol. 1999;18(6):434-441.
2. Halbrecht J, Jackson D. Office arthroscopy: a diagnostic alternative. Arthroscopy. 1992;8(3):320-326.
3. Batcheleor R, Henshaw K, Astin P, Emery P, Reece R, Leeds DM. Rheumatological needle arthroscopy: a 5-year follow up of safety and efficacy. Arthritis Rheum Ann Sci Meet Abstr. 2001;(9 suppl).
4. Barronian AD, Zoltan JD, Bucon KA. Magnetic resonance imaging of the knee: correlation with arthroscopy. Arthroscopy. 1989;5(3):187-191.
5. Crues JV 3rd, Ryu R, Morgan FW. Meniscal pathology. The expanding role of magnetic resonance imaging. Clin Orthop Relat Res. 1990;(252):80-87.
6. Raunest J, Oberle K, Leohnert J, Hoetzinger H. The clinical value of magnetic resonance imaging in the evaluation of meniscal disorders. J Bone Joint Surg Am. 1991;73(1):11-16.
7. Spiers AS, Meagher T, Ostlere SJ, Wilson DJ, Dodd CA. Can MRI of the knee affect arthroscopic practice? A prospective study of 58 patients. J Bone Joint Surg Br. 1993;75(1):49-52.
8. O’Shea KJ, Murphy KP, Heekin RD, Herzwurm PJ. The diagnostic accuracy of history, physical examination, and radiographs in the evaluation of traumatic knee disorders. Am J Sports Med. 1996;24(2):164-167.
9. Ben-Galim P, Steinberg EL, Amir H, Ash N, Dekel S, Arbel R. Accuracy of magnetic resonance imaging of the knee and unjustified surgery. Clin Orthop Relat Res. 2006;(447):100-104.
10. Gramas DA, Antounian FS, Peterfy CG, Genant HK, Lane NE. Assessment of needle arthroscopy, standard arthroscopy, physical examination, and magnetic resonance imaging in knee pain: a pilot study. J Clin Rheumatol. 1995;1(1):26-34.
11. Voigt JD, Mosier M, Huber B. In-office diagnostic arthroscopy for knee and shoulder intra-articular injuries: its potential impact on cost savings in the United States. BMC Health Serv Res. 2014;14:203.
12. Xerogeanes JW, Safran MR, Huber B, Mandelbaum BR, Robertson W, Gambardella RA. A prospective multi-center clinical trial to compare efficiency, accuracy and safety of the VisionScope imaging system compared to MRI and diagnostic arthroscopy. Orthop J Sports Med. 2014;2(2 suppl):1.
TAKE-HOME POINTS
- Small-bore needle arthroscopy is an effective way to diagnose intra-articular knee pathology.
- Small-bore needle arthroscopy is safe and easy to use with no complications reported in this series.
- Small-bore needle arthroscopy is a useful diagnostic tool in office settings.
- In this series, small-bore needle arthroscopy was more accurate than MRI to diagnose knee meniscal tears.
- In-office diagnostic arthroscopy can be used for other joints such as shoulder, elbow, and ankle.

Mobile Medical Apps for Patient Education: A Graded Review of Available Dermatology Apps
According to industry estimates, roughly 64% of US adults were smartphone users in 2015.1 Smartphones enable users to utilize mobile applications (apps) that can perform a variety of functions in many categories, including business, music, photography, entertainment, education, social networking, travel, and lifestyle. The widespread adoption and use of mobile apps has implications for medical practice. Mobile apps have the capability to serve as information sources for patients, educational tools for students, and diagnostic aids for physicians.2 Consequently, a number of medical and health care–oriented apps have already been developed3 and are increasingly utilized by patients and providers.4
Given its visual nature, dermatology is particularly amenable to the integration of mobile medical apps. A study by Brewer et al5 identified more than 229 dermatology-related apps in categories ranging from general dermatology reference, self-surveillance and diagnosis, disease guides, educational aids, sunscreen and UV recommendations, and teledermatology. Patients served as the target audience and principal consumers of more than half of these dermatology apps.5
Mobile medical and health care apps demonstrate great potential for serving as valuable information sources for patients with dermatologic conditions; however, the content, functions, accuracy, and educational value of dermatology mobile apps are not well characterized, making it difficult for patients and health care providers to select and recommend appropriate apps.6 In this study, we created a rubric to objectively grade 44 publicly available mobile dermatology apps with the primary focus of patient education.
Methods
We conducted a search of dermatology-related educational mobile apps that were publicly available via the App Store (Apple Inc) from January 2016 to November 2016. (The pricing, availability, and other features of these apps may have changed since the study period.) The following search terms were used: dermatology, dermoscopy, melanoma, skin cancer, psoriasis, rosacea, acne, eczema, dermal fillers, and Mohs surgery. We excluded apps that were not in English; had a solely commercial focus; were mobile textbooks or scientific journals; were used to provide teledermatology services with no educational purpose; were solely focused on homeopathic, alternative, and/or complementary medicine; or were intended primarily as a reference for students or health care professionals. Our search yielded 44 apps with patient education as a primary objective. The apps were divided into 6 categories based on their focus: general dermatology, cosmetic dermatology, acne, eczema, psoriasis, and skin cancer.
Each app was reviewed using a quantified grading rubric developed by the researchers. In a prior evaluation, Handel7 reviewed 35 health and wellness mobile apps utilizing the categories of ease of use, reliability, quality, scope of information, and aesthetics.4 These criteria were modified and adapted for the purposes of this study, and a 4-point scale was applied to each criterion. The final criteria were (1) educational objectives, (2) content, (3) accuracy, (4) design, and (5) conflict of interest. The quantified grading rubric is described in Table 1.
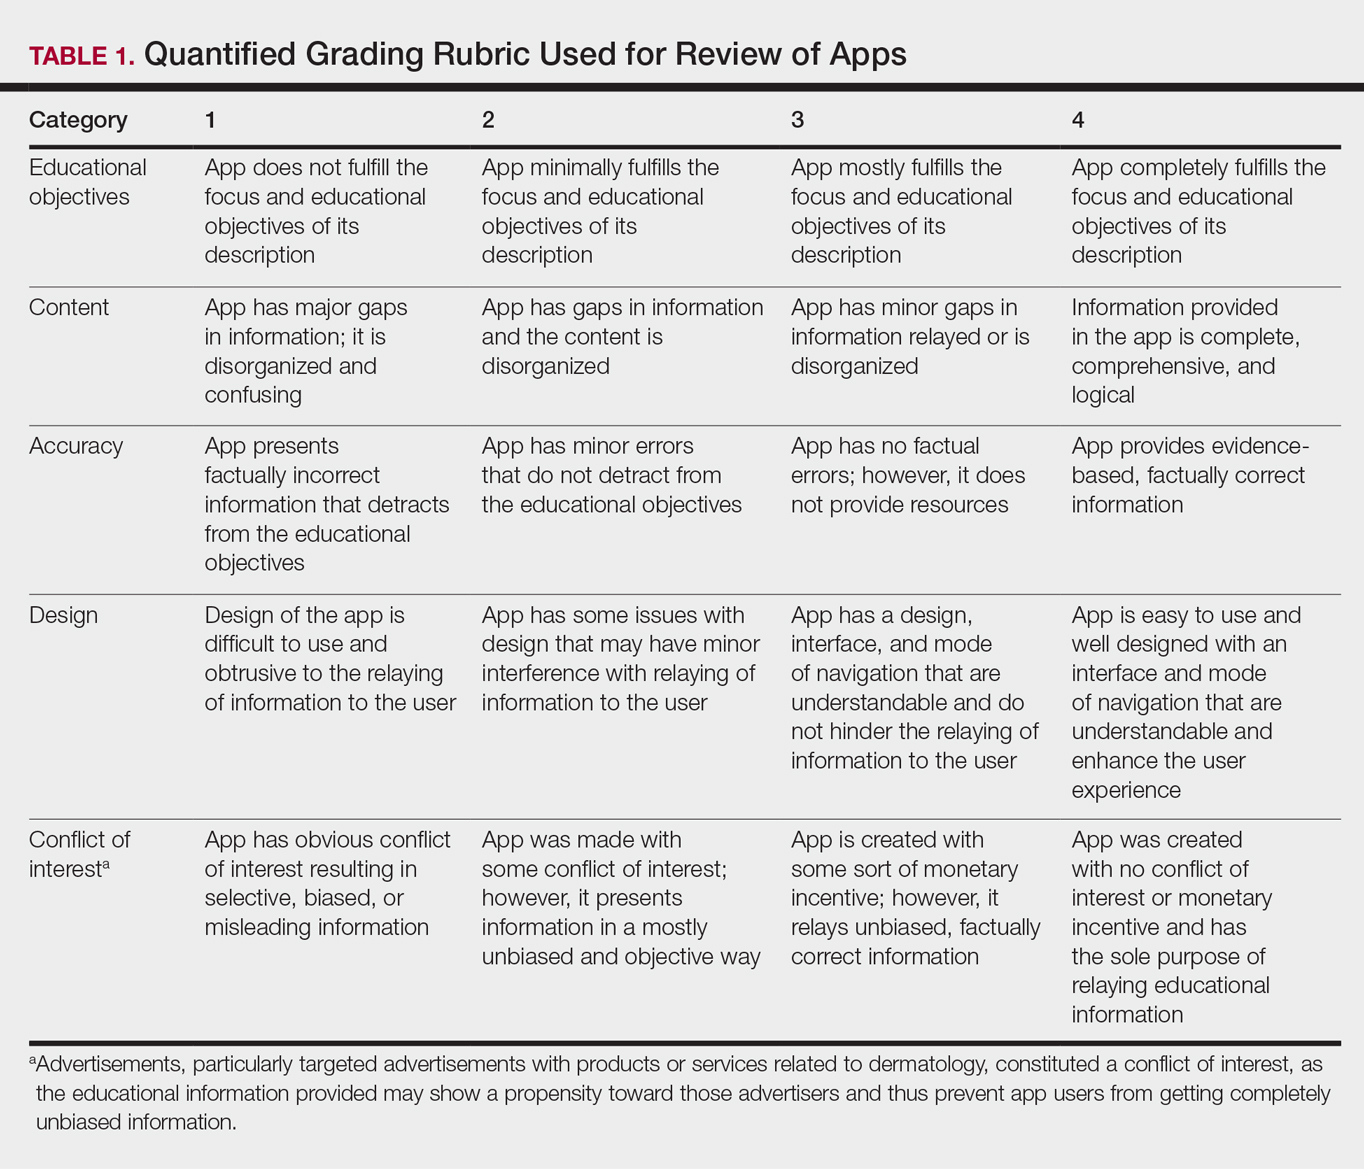
Results
The possible range of scores based on the grading rubric was 5 to 20. The actual range of scores was 8 to 19 (Table 2). The 44 reviewed apps were categorized by topic as acne, cosmetic dermatology, eczema, general dermatology, psoriasis, or skin cancer. A sample of 15 apps selected to represent the distribution of scores and their grading on the rubric are presented in Table 3.
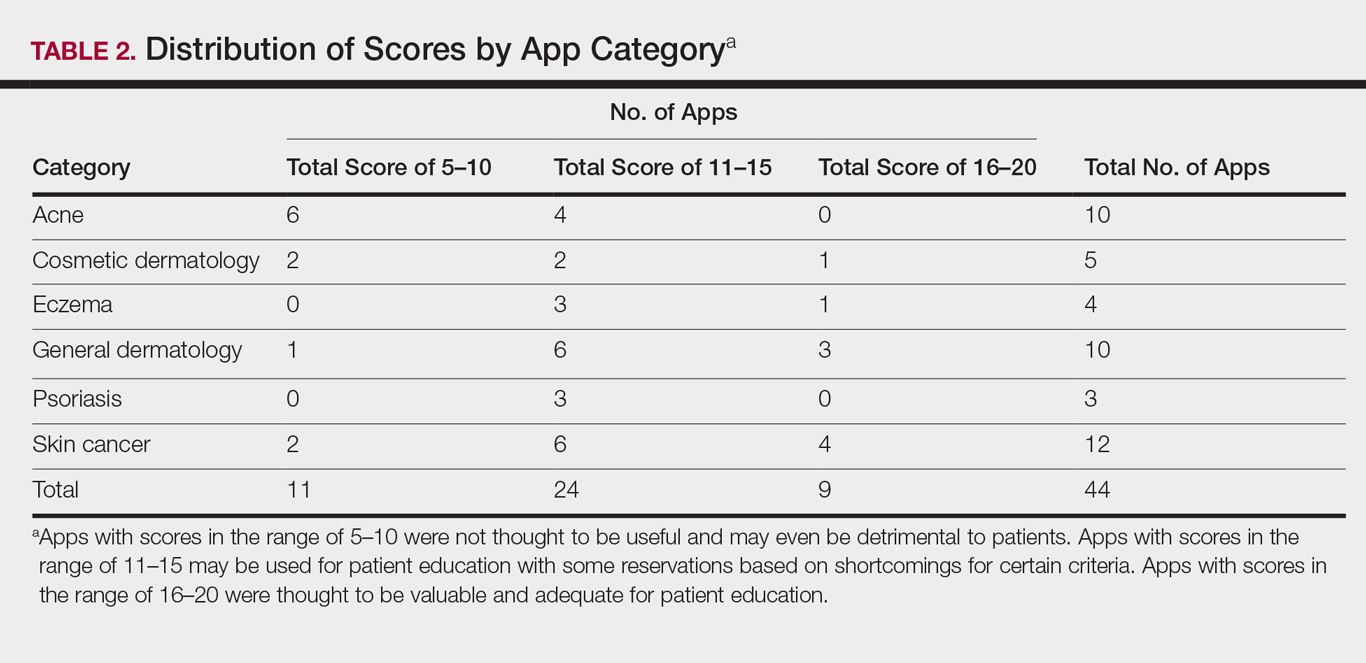
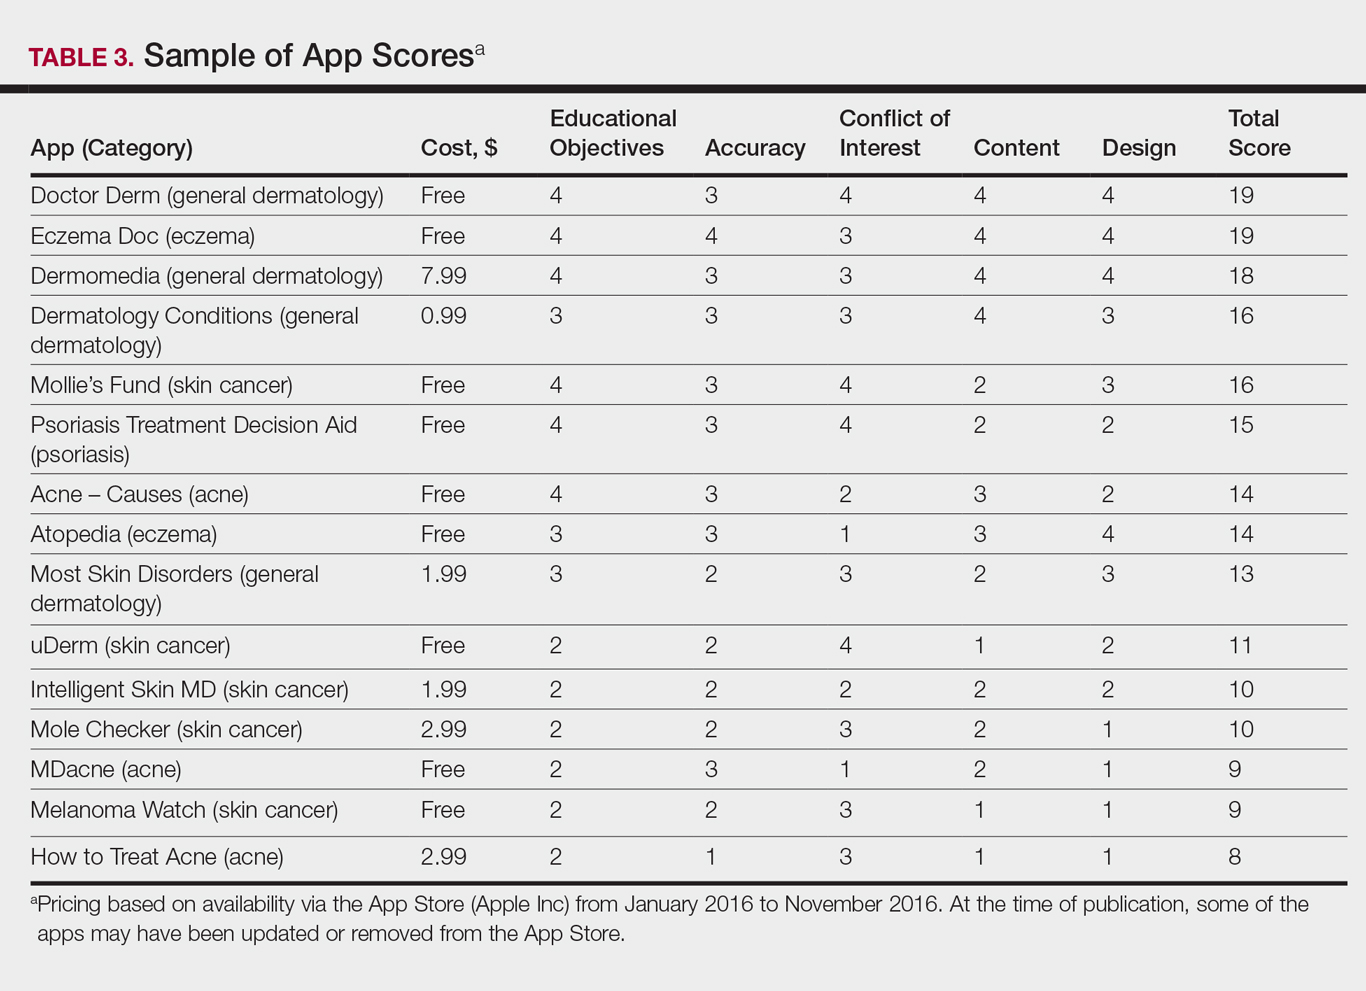
Comment
The number of dermatology-related apps available to mobile users continues to grow at an increasing rate.8 The apps vary in many aspects, including their purpose, scope, intended audience, and goals of the app publisher. In turn, more individuals are turning to mobile apps for medical information,4 especially in dermatology, thus it is necessary to create a systematic way to evaluate the quality and utility of each app to assist users in making informed decisions about which apps will best meet their needs in the midst of a wide array of choices.
For the purpose of this study, an objective rubric was created that can be used to evaluate the quality of medical apps for patient education in dermatology. An app’s adequacy and usefulness for patient education was thought to depend on 3 possible score ranges into which the app could fall based on the grading rubric. An app with a total score in the range of 5 to 10 was not thought to be useful and may even be detrimental to patients. An app with a total score in the range of 11 to 15 may be used for patient education with some reservations based on shortcomings for certain criteria. An app with a score in the range of 16 to 20 was thought to be valuable and adequate for patient education. For example, the How to Treat Acne app received a total score of 8 and therefore would not be recommended to patients based on the grading rubric used in this study. This particular app provided sparse and sometimes inaccurate information, had a confusing user interface, and contained many obstructive advertisements. In contrast, the Eczema Doc app received a total score of 19, which indicates a quality app deemed to be useful for patient information based on the established rubric. This app met all the objectives that it advertised, contained accurate information with verified citation of sources, and was very easy for users to navigate.
Of the 44 graded apps, only 9 (20.5%) received scores in the highest range of 16 to 20, which indicates a need for improvements in mobile dermatology apps intended for patient education. Adopting the grading rubric developed in this study as a standard in the creation of medical apps could have beneficial implications in disseminating accurate, safe, unbiased, and easy-to-understand information to patients.
- Smith A. U.S. smartphone use in 2015. Pew Research Center website. http://www.pewinternet.org/2015/04/01/us-smartphone-use-in-2015. Published April 1, 2015. Accessed August 29, 2017.
- Nilsen W, Kumar S, Shar A, et al. Advancing the science of mHealth. J Health Commun. 2012;17(suppl 1):5-10.
- West DM. How mobile devices are transforming healthcare issues in technology innovation. Issues Technol Innov. 2012;18:1-14.
- Boudreaux ED, Waring ME, Hayes RB, et al. Evaluating and selecting mobile health apps: strategies for healthcare providers and healthcare organizations. Transl Behav Med. 2014;4:363-371.
- Brewer AC, Endly DC, Henley J, et al. Mobile applications in dermatology. JAMA Dermatol. 2013;149:1300-1304.
- Cummings E, Borycki E, Roehrer E. Issues and considerations for healthcare consumers using mobile applications. Stud Health Technol Inform. 2013;183:227-231.
- Handel MJ. mHealth (mobile health)-using apps for health and wellness. Explore. 2011;7:256-261.
- Boulos MN, Brewer AC, Karimkhani C, et al. Mobile medical and health apps: state of the art, concerns, regulatory control and certification. Online J Public Health Inform. 2014;5:229.
According to industry estimates, roughly 64% of US adults were smartphone users in 2015.1 Smartphones enable users to utilize mobile applications (apps) that can perform a variety of functions in many categories, including business, music, photography, entertainment, education, social networking, travel, and lifestyle. The widespread adoption and use of mobile apps has implications for medical practice. Mobile apps have the capability to serve as information sources for patients, educational tools for students, and diagnostic aids for physicians.2 Consequently, a number of medical and health care–oriented apps have already been developed3 and are increasingly utilized by patients and providers.4
Given its visual nature, dermatology is particularly amenable to the integration of mobile medical apps. A study by Brewer et al5 identified more than 229 dermatology-related apps in categories ranging from general dermatology reference, self-surveillance and diagnosis, disease guides, educational aids, sunscreen and UV recommendations, and teledermatology. Patients served as the target audience and principal consumers of more than half of these dermatology apps.5
Mobile medical and health care apps demonstrate great potential for serving as valuable information sources for patients with dermatologic conditions; however, the content, functions, accuracy, and educational value of dermatology mobile apps are not well characterized, making it difficult for patients and health care providers to select and recommend appropriate apps.6 In this study, we created a rubric to objectively grade 44 publicly available mobile dermatology apps with the primary focus of patient education.
Methods
We conducted a search of dermatology-related educational mobile apps that were publicly available via the App Store (Apple Inc) from January 2016 to November 2016. (The pricing, availability, and other features of these apps may have changed since the study period.) The following search terms were used: dermatology, dermoscopy, melanoma, skin cancer, psoriasis, rosacea, acne, eczema, dermal fillers, and Mohs surgery. We excluded apps that were not in English; had a solely commercial focus; were mobile textbooks or scientific journals; were used to provide teledermatology services with no educational purpose; were solely focused on homeopathic, alternative, and/or complementary medicine; or were intended primarily as a reference for students or health care professionals. Our search yielded 44 apps with patient education as a primary objective. The apps were divided into 6 categories based on their focus: general dermatology, cosmetic dermatology, acne, eczema, psoriasis, and skin cancer.
Each app was reviewed using a quantified grading rubric developed by the researchers. In a prior evaluation, Handel7 reviewed 35 health and wellness mobile apps utilizing the categories of ease of use, reliability, quality, scope of information, and aesthetics.4 These criteria were modified and adapted for the purposes of this study, and a 4-point scale was applied to each criterion. The final criteria were (1) educational objectives, (2) content, (3) accuracy, (4) design, and (5) conflict of interest. The quantified grading rubric is described in Table 1.
Results
The possible range of scores based on the grading rubric was 5 to 20. The actual range of scores was 8 to 19 (Table 2). The 44 reviewed apps were categorized by topic as acne, cosmetic dermatology, eczema, general dermatology, psoriasis, or skin cancer. A sample of 15 apps selected to represent the distribution of scores and their grading on the rubric are presented in Table 3.
Comment
The number of dermatology-related apps available to mobile users continues to grow at an increasing rate.8 The apps vary in many aspects, including their purpose, scope, intended audience, and goals of the app publisher. In turn, more individuals are turning to mobile apps for medical information,4 especially in dermatology, thus it is necessary to create a systematic way to evaluate the quality and utility of each app to assist users in making informed decisions about which apps will best meet their needs in the midst of a wide array of choices.
For the purpose of this study, an objective rubric was created that can be used to evaluate the quality of medical apps for patient education in dermatology. An app’s adequacy and usefulness for patient education was thought to depend on 3 possible score ranges into which the app could fall based on the grading rubric. An app with a total score in the range of 5 to 10 was not thought to be useful and may even be detrimental to patients. An app with a total score in the range of 11 to 15 may be used for patient education with some reservations based on shortcomings for certain criteria. An app with a score in the range of 16 to 20 was thought to be valuable and adequate for patient education. For example, the How to Treat Acne app received a total score of 8 and therefore would not be recommended to patients based on the grading rubric used in this study. This particular app provided sparse and sometimes inaccurate information, had a confusing user interface, and contained many obstructive advertisements. In contrast, the Eczema Doc app received a total score of 19, which indicates a quality app deemed to be useful for patient information based on the established rubric. This app met all the objectives that it advertised, contained accurate information with verified citation of sources, and was very easy for users to navigate.
Of the 44 graded apps, only 9 (20.5%) received scores in the highest range of 16 to 20, which indicates a need for improvements in mobile dermatology apps intended for patient education. Adopting the grading rubric developed in this study as a standard in the creation of medical apps could have beneficial implications in disseminating accurate, safe, unbiased, and easy-to-understand information to patients.
- Smith A. U.S. smartphone use in 2015. Pew Research Center website. http://www.pewinternet.org/2015/04/01/us-smartphone-use-in-2015. Published April 1, 2015. Accessed August 29, 2017.
- Nilsen W, Kumar S, Shar A, et al. Advancing the science of mHealth. J Health Commun. 2012;17(suppl 1):5-10.
- West DM. How mobile devices are transforming healthcare issues in technology innovation. Issues Technol Innov. 2012;18:1-14.
- Boudreaux ED, Waring ME, Hayes RB, et al. Evaluating and selecting mobile health apps: strategies for healthcare providers and healthcare organizations. Transl Behav Med. 2014;4:363-371.
- Brewer AC, Endly DC, Henley J, et al. Mobile applications in dermatology. JAMA Dermatol. 2013;149:1300-1304.
- Cummings E, Borycki E, Roehrer E. Issues and considerations for healthcare consumers using mobile applications. Stud Health Technol Inform. 2013;183:227-231.
- Handel MJ. mHealth (mobile health)-using apps for health and wellness. Explore. 2011;7:256-261.
- Boulos MN, Brewer AC, Karimkhani C, et al. Mobile medical and health apps: state of the art, concerns, regulatory control and certification. Online J Public Health Inform. 2014;5:229.
Practice Points
- Mobile dermatology apps for educational purposes should be objectively reviewed before being used by patients.
- In our study, only 9 (20.5%) of the 44 dermatology apps evaluated were considered adequate for patient information based on our grading criteria.
US Dermatology Residency Program Rankings Based on Academic Achievement
Rankings of US residency programs based on academic achievement are a resource for fourth-year medical students applying for residency through the National Resident Matching Program. They also highlight the leading academic training programs in each medical specialty. Currently, the Doximity Residency Navigator (https://residency.doximity.com) provides rankings of US residency programs based on either subjective or objective criteria. The subjective rankings utilize current resident and recent alumni satisfaction surveys as well as nominations from board-certified Doximity members who were asked to nominate up to 5 residency programs in their specialty that offer the best clinical training. The objective rankings are based on measurement of research output, which is calculated from the collective h-index of publications authored by graduating alumni within the last 15 years as well as the amount of research funding awarded.1
Aquino et al2 provided a ranking of US dermatology residency programs using alternative objective data measures (as of December 31, 2008) from the Doximity algorithm, including National Institutes of Health (NIH) and Dermatology Foundation (DF) funding, number of publications by full-time faculty members, number of faculty lectures given at annual meetings of 5 societies, and number of full-time faculty members serving on the editorial boards of 6 dermatology journals. The current study is an update to those rankings utilizing data from 2014.
Methods
The following data for each dermatology residency program were obtained to formulate the rankings: number of full-time faculty members, amount of NIH funding received in 2014 (https://report.nih.gov/), number of publications by full-time faculty members in 2014 (http://www.ncbi.nlm.nih.gov/pubmed/), and the number of faculty lectures given at annual meetings of 5 societies in 2014 (American Academy of Dermatology, the Society for Investigative Dermatology, the American Society of Dermatopathology, the Society for Pediatric Dermatology, and the American Society for Dermatologic Surgery). This study was approved by the institutional review board at Kaiser Permanente Southern California.
The names of all US dermatology residency programs were obtained as of December 31, 2014, from FREIDA Online using the search term dermatology. An email was sent to a representative from each residency program (eg, residency program coordinator, program director, full-time faculty member) requesting confirmation of a list of full-time faculty members in the program, excluding part-time and volunteer faculty. If a response was not obtained or the representative declined to participate, a list was compiled using available information from that residency program’s website.
National Institutes of Health funding for 2014 was obtained for individual faculty members from the NIH Research Portfolio Online Reporting Tools expenditures and reports (https://projectreporter.nih.gov/reporter.cfm) by searching the first and last name of each full-time faculty member along with their affiliated institution. The search results were filtered to only include NIH funding for full-time faculty members listed as principal investigators rather than as coinvestigators. The fiscal year total cost by institute/center for each full-time faculty member’s projects was summated to obtain the total NIH funding for the program.
The total number of publications by full-time faculty members in 2014 was obtained utilizing a PubMed search of articles indexed for MEDLINE using each faculty member’s first and last name. The authors’ affiliations were verified for each publication, and the number of publications was summed for all full-time faculty members at each residency program. If multiple authors from the same program coauthored an article, it was only counted once toward the total number of faculty publications from that program.
Program brochures for the 2014 meetings of the 5 societies were reviewed to quantify the number of lectures given by full-time faculty members in each program.
Each residency program was assigned a score from 0 to 1.0 for each of the 4 factors of academic achievement analyzed. The program with the highest number of faculty publications was assigned a score of 1.0 and the program with the lowest number of publications was assigned a score of 0. The programs in between were subsequently assigned scores from 0 to 1.0 based on the number of publications as a percentage of the number of publications from the program with the most publications.
A weighted ranking scheme was used to rank residency programs based on the relative importance of each factor. There were 3 factors that were deemed to be the most reflective of academic achievement among dermatology residency programs: amount of NIH funding received in 2014, number of publications by full-time faculty members in 2014, and number of faculty lectures given at society meetings in 2014; thus, these factors were given a weight of 1.0. The remaining factor— total number of full-time faculty members—was given a weight of 0.5. Values were totaled and programs were ranked based on the sum of these values. All quantitative analyses were performed using an electronic spreadsheet program.
Results
The overall ranking of the top 20 US dermatology residency programs in 2014 is presented in Table 1. The top 5 programs based on each of the 3 factors most reflective of academic achievement used in the weighted ranking algorithm are presented in Tables 2 through 4.
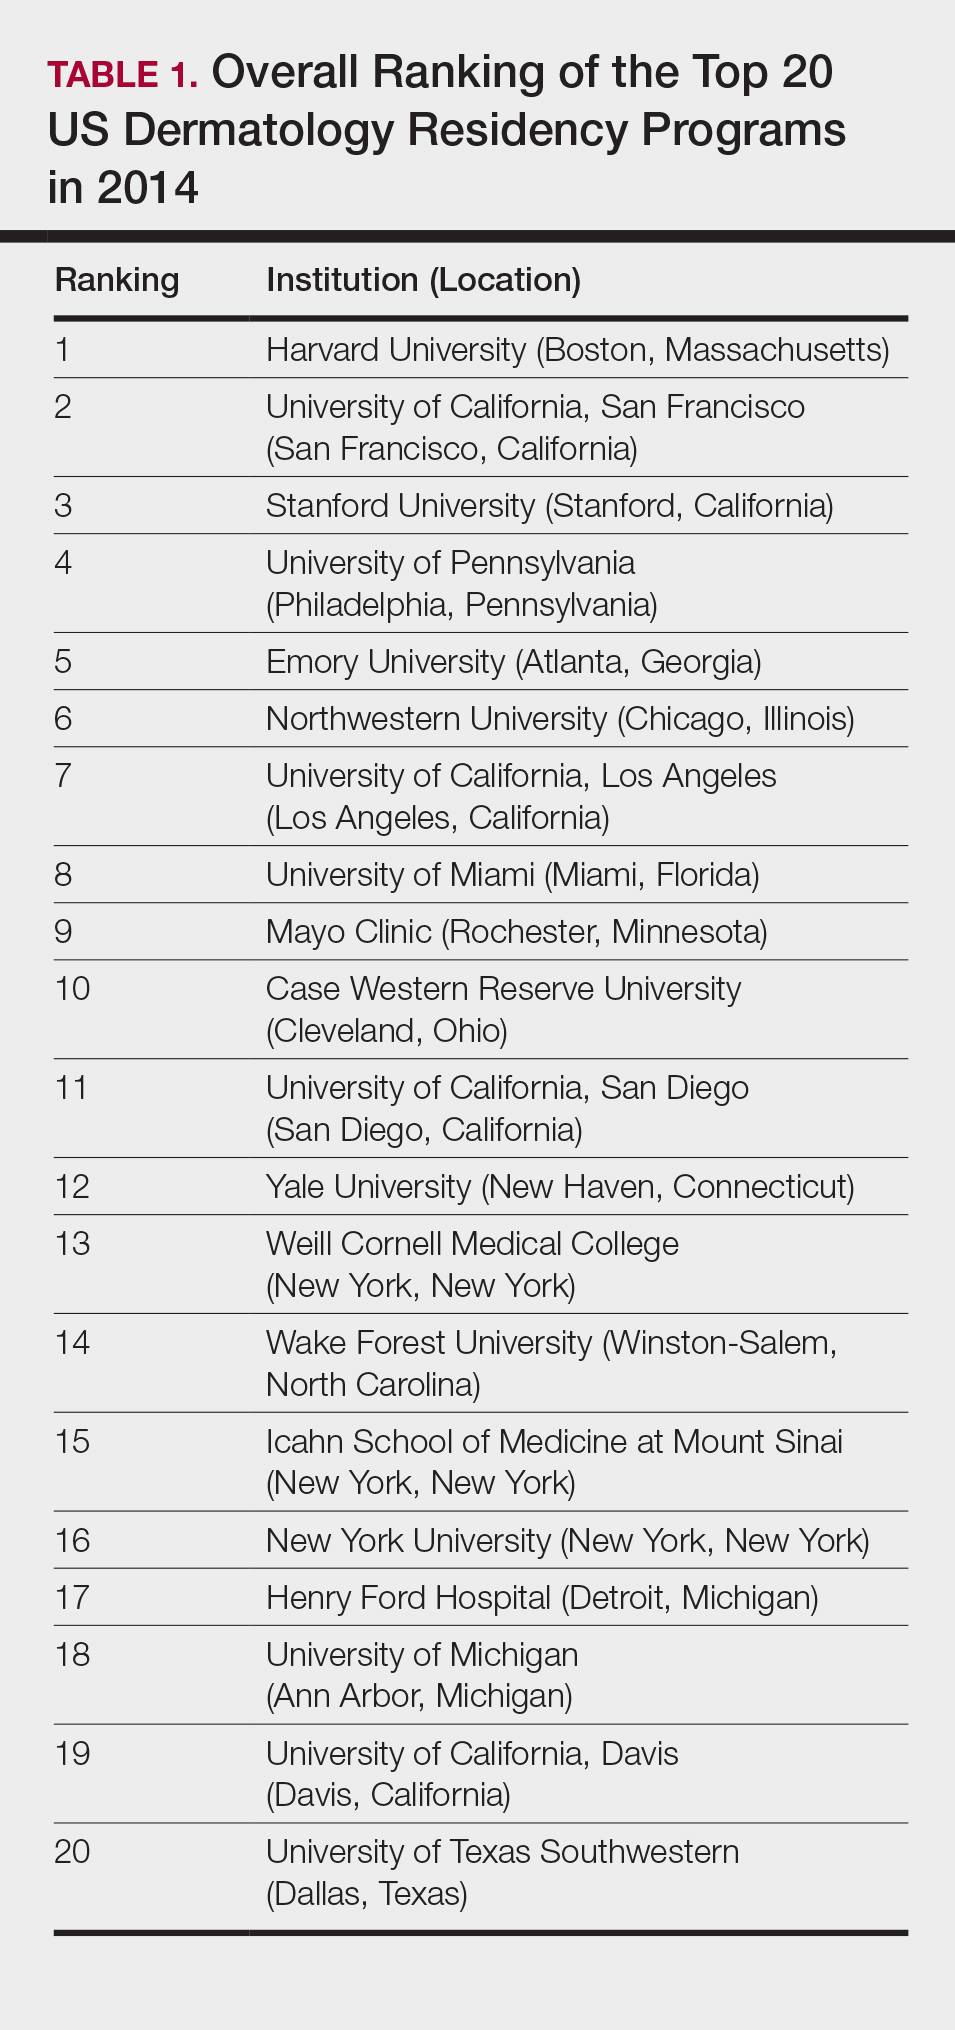
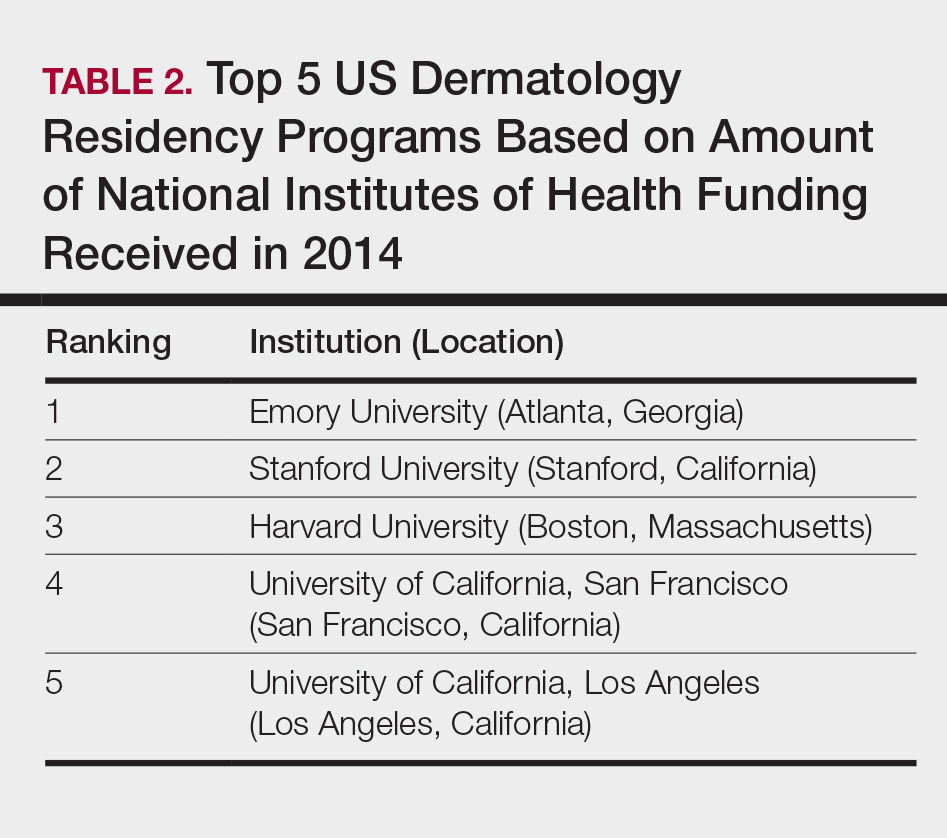
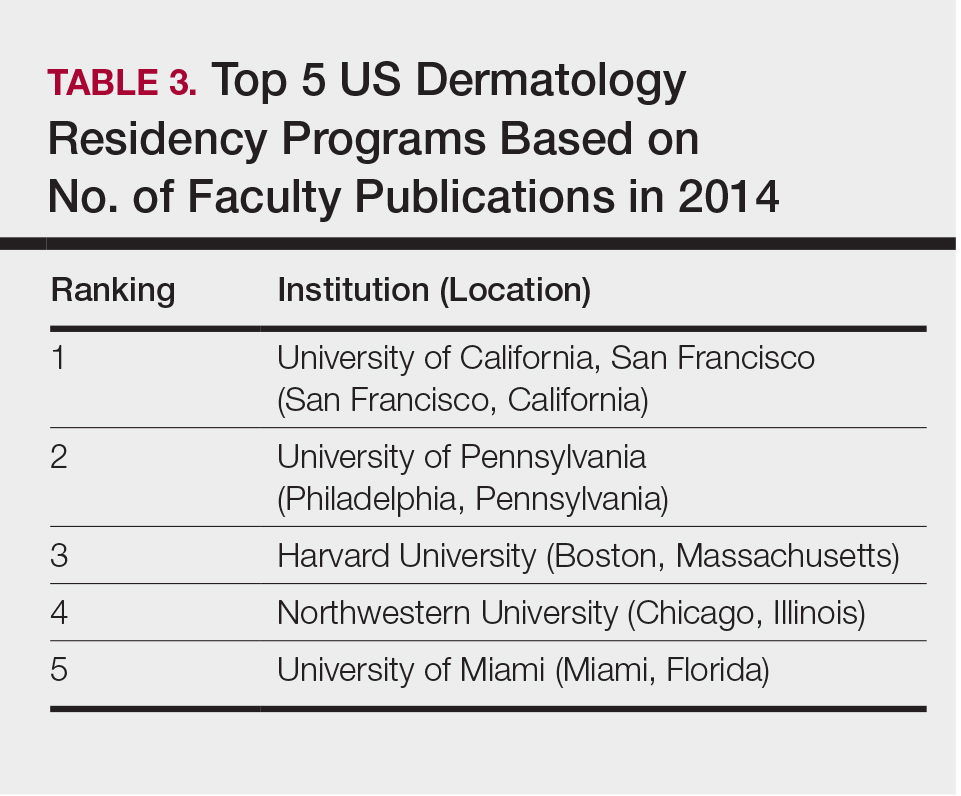
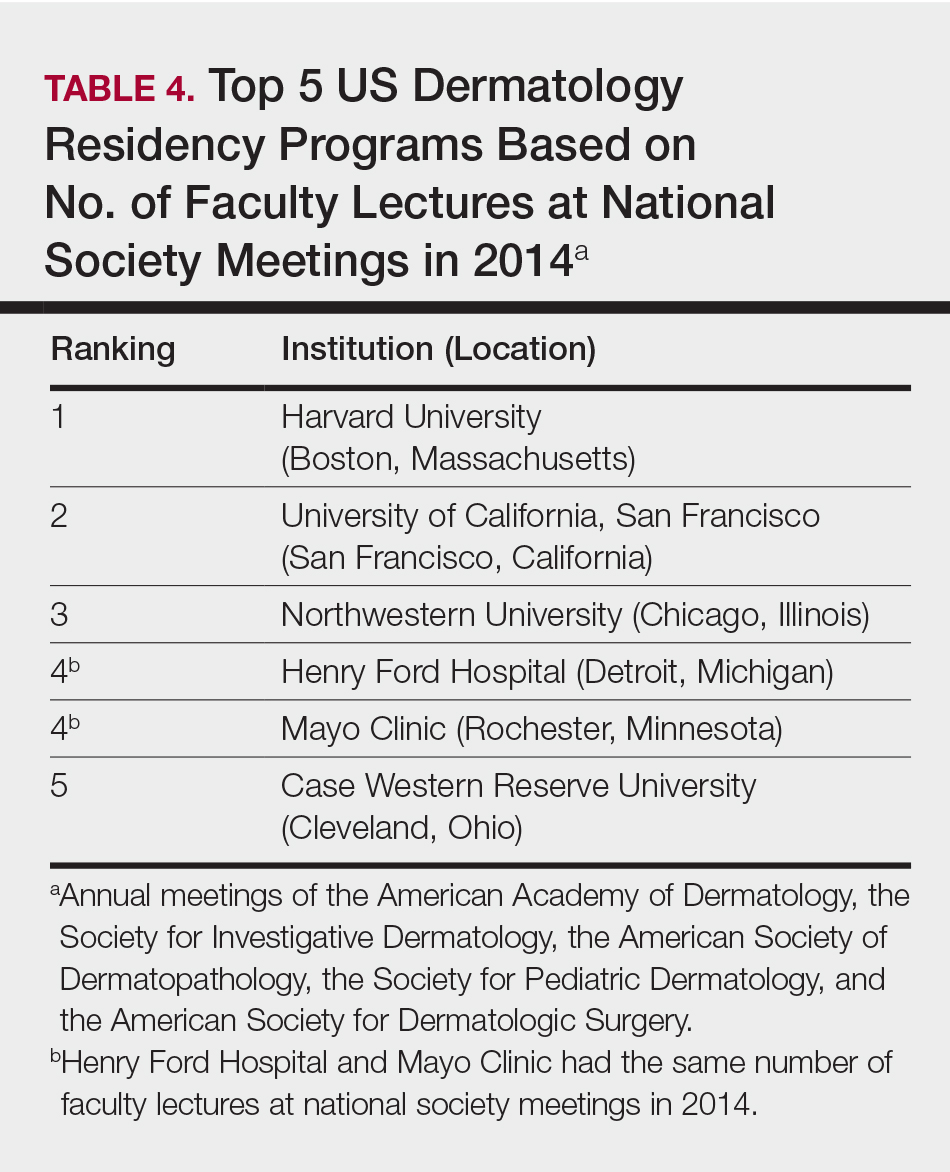
Comment
The ranking of US residency programs involves using data in an unbiased manner while also accounting for important subjective measures. In a 2015 survey of residency applicants (n=6285), the 5 most important factors for applicants in selecting a program were the program’s ability to prepare residents for future training or position, resident esprit de corps, faculty availability and involvement in teaching, depth and breadth of faculty, and variety of patients and clinical resources.3 However, these subjective measures are difficult to quantify in a standardized fashion. In its ranking of residency programs, the Doximity Residency Navigator utilizes surveys of current residents and recent alumni as well as nominations from board-certified Doximity members.1
One of the main issues in utilizing survey data to rank residency programs is the inherent bias that most residents and alumni possess toward their own program. Moreover, the question arises whether most residents, faculty members, or recent alumni of residency programs have sufficient knowledge of other programs to rank them in a well-informed manner.
Wu et al4 used data from 2004 to perform the first algorithmic ranking of US dermatology programs, which was based on publications in 2001 to 2004, the amount of NIH funding in 2004, DF grants in 2001 to 2004, faculty lectures delivered at national conferences in 2004, and number of full-time faculty members on the editorial boards of the top 3 US dermatology journals and the top 4 subspecialty journals. Aquino et al2 provided updated rankings that utilized a weighted algorithm to collect data from 2008 related to a number of factors, including annual amount of NIH and DF funding received, number of publications by full-time faculty members, number of faculty lectures given at 5 annual society meetings, and number of full-time faculty members who were on the editorial boards of 6 dermatology journals with the highest impact factors. The top 5 ranked programs based on the 2008 data were the University of California, San Francisco (San Francisco, California); Northwestern University (Chicago, Illinois); University of Pennsylvania (Philadelphia, Pennsylvania); Yale University (New Haven, Connecticut); and Stanford University (Stanford, California).2
The current ranking algorithm is more indicative of a residency program’s commitment to research and scholarship, with an assumption that successful clinical training is offered. Leading researchers in the field also are usually known to be clinical experts, but the current data does not take into account the frequency, quality, or methodology of teaching provided to residents. Perhaps the most objective measure reflecting the quality of resident education would be American Board of Dermatology examination scores, but these data are not publically available. Additional factors such as the percentage of residents who received fellowship positions; diversity of the patient population; and number and extent of surgical, cosmetic, or laser procedures performed also are not readily available. Doximity provides board pass rates for each residency program, but these data are self-reported and are not taken into account in their rankings.1
The current study aimed to utilize publicly available data to rank US dermatology residency programs based on objective measures of academic achievement. A recent study showed that 531 of 793 applicants (67%) to emergency medicine residency programs were aware of the Doximity residency rankings.One-quarter of these applicants made changes to their rank list based on this data, demonstrating that residency rankings may impact applicant decision-making.5 In the future, the most accurate and unbiased rankings may be performed if each residency program joins a cooperative effort to provide more objective data about the training they provide and utilizes a standardized survey system for current residents and recent graduates to evaluate important subjective measures.
Conclusion
Based on our weighted ranking algorithm, the top 5 dermatology residency programs in 2014 were Harvard University (Boston, Massachusetts); University of California, San Francisco (San Francisco, California); Stanford University (Stanford, California); University of Pennsylvania (Philadelphia, Pennsylvania); and Emory University (Atlanta, Georgia).
Acknowledgments
We thank all of the program coordinators, full-time faculty members, program directors, and chairs who provided responses to our inquiries for additional information about their residency programs.
- Residency navigator 2017-2018. Doximity website. https://residency.doximity.com. Accessed January 19, 2018.
- Aquino LL, Wen G, Wu JJ. US dermatology residency program rankings. Cutis. 2014;94:189-194.
- Phitayakorn R, Macklin EA, Goldsmith J, et al. Applicants’ self-reported priorities in selecting a residency program. J Grad Med Educ. 2015;7:21-26.
- Wu JJ, Ramirez CC, Alonso CA, et al. Ranking the dermatology programs based on measurements of academic achievement. Dermatol Online J. 2007;13:3.
- Peterson WJ, Hopson LR, Khandelwal S. Impact of Doximity residency rankings on emergency medicine applicant rank lists [published online May 5, 2016]. West J Emerg Med. 2016;17:350-354.
Rankings of US residency programs based on academic achievement are a resource for fourth-year medical students applying for residency through the National Resident Matching Program. They also highlight the leading academic training programs in each medical specialty. Currently, the Doximity Residency Navigator (https://residency.doximity.com) provides rankings of US residency programs based on either subjective or objective criteria. The subjective rankings utilize current resident and recent alumni satisfaction surveys as well as nominations from board-certified Doximity members who were asked to nominate up to 5 residency programs in their specialty that offer the best clinical training. The objective rankings are based on measurement of research output, which is calculated from the collective h-index of publications authored by graduating alumni within the last 15 years as well as the amount of research funding awarded.1
Aquino et al2 provided a ranking of US dermatology residency programs using alternative objective data measures (as of December 31, 2008) from the Doximity algorithm, including National Institutes of Health (NIH) and Dermatology Foundation (DF) funding, number of publications by full-time faculty members, number of faculty lectures given at annual meetings of 5 societies, and number of full-time faculty members serving on the editorial boards of 6 dermatology journals. The current study is an update to those rankings utilizing data from 2014.
Methods
The following data for each dermatology residency program were obtained to formulate the rankings: number of full-time faculty members, amount of NIH funding received in 2014 (https://report.nih.gov/), number of publications by full-time faculty members in 2014 (http://www.ncbi.nlm.nih.gov/pubmed/), and the number of faculty lectures given at annual meetings of 5 societies in 2014 (American Academy of Dermatology, the Society for Investigative Dermatology, the American Society of Dermatopathology, the Society for Pediatric Dermatology, and the American Society for Dermatologic Surgery). This study was approved by the institutional review board at Kaiser Permanente Southern California.
The names of all US dermatology residency programs were obtained as of December 31, 2014, from FREIDA Online using the search term dermatology. An email was sent to a representative from each residency program (eg, residency program coordinator, program director, full-time faculty member) requesting confirmation of a list of full-time faculty members in the program, excluding part-time and volunteer faculty. If a response was not obtained or the representative declined to participate, a list was compiled using available information from that residency program’s website.
National Institutes of Health funding for 2014 was obtained for individual faculty members from the NIH Research Portfolio Online Reporting Tools expenditures and reports (https://projectreporter.nih.gov/reporter.cfm) by searching the first and last name of each full-time faculty member along with their affiliated institution. The search results were filtered to only include NIH funding for full-time faculty members listed as principal investigators rather than as coinvestigators. The fiscal year total cost by institute/center for each full-time faculty member’s projects was summated to obtain the total NIH funding for the program.
The total number of publications by full-time faculty members in 2014 was obtained utilizing a PubMed search of articles indexed for MEDLINE using each faculty member’s first and last name. The authors’ affiliations were verified for each publication, and the number of publications was summed for all full-time faculty members at each residency program. If multiple authors from the same program coauthored an article, it was only counted once toward the total number of faculty publications from that program.
Program brochures for the 2014 meetings of the 5 societies were reviewed to quantify the number of lectures given by full-time faculty members in each program.
Each residency program was assigned a score from 0 to 1.0 for each of the 4 factors of academic achievement analyzed. The program with the highest number of faculty publications was assigned a score of 1.0 and the program with the lowest number of publications was assigned a score of 0. The programs in between were subsequently assigned scores from 0 to 1.0 based on the number of publications as a percentage of the number of publications from the program with the most publications.
A weighted ranking scheme was used to rank residency programs based on the relative importance of each factor. There were 3 factors that were deemed to be the most reflective of academic achievement among dermatology residency programs: amount of NIH funding received in 2014, number of publications by full-time faculty members in 2014, and number of faculty lectures given at society meetings in 2014; thus, these factors were given a weight of 1.0. The remaining factor— total number of full-time faculty members—was given a weight of 0.5. Values were totaled and programs were ranked based on the sum of these values. All quantitative analyses were performed using an electronic spreadsheet program.
Results
The overall ranking of the top 20 US dermatology residency programs in 2014 is presented in Table 1. The top 5 programs based on each of the 3 factors most reflective of academic achievement used in the weighted ranking algorithm are presented in Tables 2 through 4.
Comment
The ranking of US residency programs involves using data in an unbiased manner while also accounting for important subjective measures. In a 2015 survey of residency applicants (n=6285), the 5 most important factors for applicants in selecting a program were the program’s ability to prepare residents for future training or position, resident esprit de corps, faculty availability and involvement in teaching, depth and breadth of faculty, and variety of patients and clinical resources.3 However, these subjective measures are difficult to quantify in a standardized fashion. In its ranking of residency programs, the Doximity Residency Navigator utilizes surveys of current residents and recent alumni as well as nominations from board-certified Doximity members.1
One of the main issues in utilizing survey data to rank residency programs is the inherent bias that most residents and alumni possess toward their own program. Moreover, the question arises whether most residents, faculty members, or recent alumni of residency programs have sufficient knowledge of other programs to rank them in a well-informed manner.
Wu et al4 used data from 2004 to perform the first algorithmic ranking of US dermatology programs, which was based on publications in 2001 to 2004, the amount of NIH funding in 2004, DF grants in 2001 to 2004, faculty lectures delivered at national conferences in 2004, and number of full-time faculty members on the editorial boards of the top 3 US dermatology journals and the top 4 subspecialty journals. Aquino et al2 provided updated rankings that utilized a weighted algorithm to collect data from 2008 related to a number of factors, including annual amount of NIH and DF funding received, number of publications by full-time faculty members, number of faculty lectures given at 5 annual society meetings, and number of full-time faculty members who were on the editorial boards of 6 dermatology journals with the highest impact factors. The top 5 ranked programs based on the 2008 data were the University of California, San Francisco (San Francisco, California); Northwestern University (Chicago, Illinois); University of Pennsylvania (Philadelphia, Pennsylvania); Yale University (New Haven, Connecticut); and Stanford University (Stanford, California).2
The current ranking algorithm is more indicative of a residency program’s commitment to research and scholarship, with an assumption that successful clinical training is offered. Leading researchers in the field also are usually known to be clinical experts, but the current data does not take into account the frequency, quality, or methodology of teaching provided to residents. Perhaps the most objective measure reflecting the quality of resident education would be American Board of Dermatology examination scores, but these data are not publically available. Additional factors such as the percentage of residents who received fellowship positions; diversity of the patient population; and number and extent of surgical, cosmetic, or laser procedures performed also are not readily available. Doximity provides board pass rates for each residency program, but these data are self-reported and are not taken into account in their rankings.1
The current study aimed to utilize publicly available data to rank US dermatology residency programs based on objective measures of academic achievement. A recent study showed that 531 of 793 applicants (67%) to emergency medicine residency programs were aware of the Doximity residency rankings.One-quarter of these applicants made changes to their rank list based on this data, demonstrating that residency rankings may impact applicant decision-making.5 In the future, the most accurate and unbiased rankings may be performed if each residency program joins a cooperative effort to provide more objective data about the training they provide and utilizes a standardized survey system for current residents and recent graduates to evaluate important subjective measures.
Conclusion
Based on our weighted ranking algorithm, the top 5 dermatology residency programs in 2014 were Harvard University (Boston, Massachusetts); University of California, San Francisco (San Francisco, California); Stanford University (Stanford, California); University of Pennsylvania (Philadelphia, Pennsylvania); and Emory University (Atlanta, Georgia).
Acknowledgments
We thank all of the program coordinators, full-time faculty members, program directors, and chairs who provided responses to our inquiries for additional information about their residency programs.
- Residency navigator 2017-2018. Doximity website. https://residency.doximity.com. Accessed January 19, 2018.
- Aquino LL, Wen G, Wu JJ. US dermatology residency program rankings. Cutis. 2014;94:189-194.
- Phitayakorn R, Macklin EA, Goldsmith J, et al. Applicants’ self-reported priorities in selecting a residency program. J Grad Med Educ. 2015;7:21-26.
- Wu JJ, Ramirez CC, Alonso CA, et al. Ranking the dermatology programs based on measurements of academic achievement. Dermatol Online J. 2007;13:3.
- Peterson WJ, Hopson LR, Khandelwal S. Impact of Doximity residency rankings on emergency medicine applicant rank lists [published online May 5, 2016]. West J Emerg Med. 2016;17:350-354.
Practice Points
- Dermatology is not among the many hospital-based adult specialties that are routinely ranked annually by US News & World Report.
- In the current study, US dermatology residency programs were ranked based on various academic factors, including the number of full-time faculty members, amount of National Institutes of Health funding received in 2014, number of publications by full-time faculty members in 2014, and the number of faculty lectures given at annual meetings of 5 societies in 2014.

Impact of a Multicenter, Mentored Quality Collaborative on Hospital-Associated Venous Thromboembolism
Deep venous thrombosis and pulmonary embolism, collectively known as venous thromboembolism (VTE), affect up to 600,000 Americans a year.1 Most of these are hospital-associated venous thromboembolisms (HA-VTE).1,2 VTE poses a substantial risk of mortality and long-term morbidity, and its treatment poses a risk of major bleeding.1 As appropriate VTE prophylaxis (“prophylaxis”) can reduce the risk of VTE by 40% to 80% depending on the patient population,3 VTE risk assessment and prophylaxis is endorsed by multiple guidelines4-7 and supported by regulatory agencies.8-10
However, despite extensive study, consensus about the impact of prophylaxis4,11 and the optimal method of risk assessment4,5,7,12 is lacking. Meanwhile, implementation of prophylaxis in real-world settings is poor; only 40% to 60% of at-risk patients receive prophylaxis,13 and as few as <20% receive optimal prophylaxis.14 Both systematic reviews15,16 and experience with VTE prevention collaboratives17,18 found that multifaceted interventions and alerts may be most effective in improving prophylaxis rates, but without proof of improved VTE rates.15 There is limited experience with large-scale VTE prevention. Organizations like The Joint Commission (TJC)8 and the Surgical Care Improvement Project have promoted quality measures but without clear evidence of improvement.19 In addition, an analysis of over 20,000 medical patients at 35 hospitals found no difference in VTE rates between high- and low-performing hospitals,20 suggesting that aggressive prophylaxis efforts may not reduce VTE, at least among medical patients.21 However, a 5-hospital University of California collaborative was associated with improved VTE rates, chiefly among surgical patients.22
In 2011, Dignity Health targeted VTE for improvement after investigations of potentially preventable HA-VTE revealed variable patterns of prophylaxis. In addition, improvement seemed feasible because there is a proven framework for VTE quality improvement (QI) projects17,18 and a record of success with the following 3 specific strategies: quality mentorship,23 use of a simple VTE risk assessment method, and active surveillance (real-time monitoring targeting suboptimal prophylaxis with concurrent intervention). This active surveillance technique has been used successfully in prior improvement efforts, often termed measure-vention.17,18,22,24
METHODS
Setting and Participants
The QI collaborative was performed at 35 Dignity Health community hospitals in California, Arizona, and Nevada. Facilities ranged from 25 to 571 beds in size with a mixture of teaching and nonteaching hospitals. Prior to the initiative, prophylaxis improvement efforts were incomplete and inconsistent at study facilities. All adult acute care inpatients at all facilities were included except rehabilitation, behavioral health, skilled nursing, hospice, other nonacute care, and inpatient deliveries.
Design Overview
We performed a prospective, unblinded, open-intervention study of a QI collaborative in 35 community hospitals and studied the effect on prophylaxis and VTE rates with historical controls. The 35 hospitals were organized into 2 cohorts. In the “pilot” cohort, 9 hospitals (chosen to be representative of the various settings, size, and teaching status within the Dignity system) received funding from the Gordon and Betty Moore Foundation (GBMF) for intensive, individualized QI mentorship from experts as well as active surveillance (see “Interventions”). The pilot sites led the development of the VTE risk assessment and prophylaxis protocol (“VTE protocol”), measures, order sets, implementation tactics, and lessons learned, assisted by the mentor experts. Dissemination to the 26-hospital “spread” cohort was facilitated by the Dignity Health Hospital Engagement Network (HEN) infrastructure.
Timeline
Two of the pilot sites, acting as leads on the development of protocol and order set tools, formed improvement teams in March 2011, 6 to 12 months earlier than other Dignity sites. Planning and design work occurred from March 2011 to September 2012. Most implementation at the 35 hospitals occurred in a staggered fashion during calendar year (CY) 2012 and 2013 (see Figure 1). As few changes were made until mid-2012, we considered CY 2011 the baseline for comparison, CY 2012 to 2013 the implementation years, and CY 2014 the postimplementation period.
The project was reviewed by the Institutional Review Board (IRB) of Dignity Health and determined to be an IRB-exempt QI project.
Interventions
Collaborative Infrastructure

Multidisciplinary Teams
Improvement teams formed between March 2011 and September 2012. Members included a physician champion, frontline nurses and physicians, an administrative liaison, pharmacists, quality and data specialists, clinical informatics staff, and stakeholders from key clinical services. Teams met at least monthly at each site.
Physician Mentors
The 9 pilot sites received individualized mentorship provided by outside experts (IJ or GM) based on a model pioneered by the Society of Hospital Medicine’s (SHM) Mentored Implementation programs.23 Each pilot site completed a self-assessment survey17 (see supplementary Appendix A) about past efforts, team composition, current performance, aims, barriers, and opportunities. The mentors reviewed the completed questionnaire with each hospital and provided advice on the VTE protocol and order set design, measurement, and benchmarking during 3 webinar meetings scheduled at 0, 3, and 9 months, plus as-needed e-mail and phone correspondence. After each webinar, the mentors provided detailed improvement suggestions (see supplementary Appendix B). Several hospitals received mentor site visits, which focused on unit rounding, active surveillance, staff and provider education, and problem-solving sessions with senior leadership, physician leadership, and the improvement team.
VTE Protocol
After a literature review and consultation with the mentors, Dignity Health developed and implemented a VTE protocol, modified from a model used in previous improvement efforts.18,22-24 Its risk assessment method is often referred to as a “3 bucket” model because it assigns patients to high-, moderate-, or low-risk categories based on clinical factors (eg, major orthopedic surgery, prior VTE, and others), and the VTE protocol recommends interventions based on the risk category (see supplementary Appendix C). Dignity Health was transitioning to a single electronic health record (Cerner Corporation, North Kansas City, MO) during the study, and study hospitals were using multiple platforms, necessitating the development of both paper and electronic versions of the VTE protocol. The electronic version required completion of the VTE protocol for all inpatient admissions and transfers. The VTE protocol was completed in November 2011 and disseminated to other sites in a staggered fashion through November 2012. Completed protocols and improvement tips were shared by the project lead and by webinar sessions. Sites were also encouraged to implement a standardized practice that allowed nurses to apply sequential compression devices to at-risk patients without physician orders when indicated by protocol, when contraindications such as vascular disease or ulceration were absent.
Education
Staff were educated about the VTE protocol by local teams, starting between late 2011 and September 2012. The audience (physicians, nurses, pharmacists, etc.) and methods (conferences, fliers, etc.) were determined by local teams, following guidance by mentors and webinar content. Active surveillance provided opportunities for in-the-moment, patient-specific education and protocol reinforcement. Both mentors delivered educational presentations at pilot sites.
Active Surveillance
Sites were encouraged to perform daily review of prophylaxis adequacy for inpatients and correct lapses in real time (both under- and overprophylaxis). Inappropriate prophylaxis orders were addressed by contacting providers to change the order or document the rationale not to. Lapses in adherence to prophylaxis were addressed by nursing correction and education of involved staff. Active surveillance was funded for 10 hours a week at pilot sites. Spread sites received only minimal support from HEN monies. All sites used daily prophylaxis reports, enhanced to include contraindications like thrombocytopenia and coagulopathy, to facilitate efforts. Active surveillance began in May 2012 in the lead pilot hospitals and was implemented in other sites between October 2012 and February 2013.
Metrics
Prophylaxis Rates
Measurement of prophylaxis did not begin until 2012 to 2013; thus, the true baseline rate for prophylaxis was not captured. TJC metrics (VTE-1 and VTE-2)25 were consolidated into a composite TJC prophylaxis rate from January 2012 to December 2014 for both pilot and spread hospitals. These measures assess the percentage of adult inpatients who received VTE prophylaxis or have documentation of why no prophylaxis was given the day of or day after hospital admission (VTE-1) or the day of or day after ICU admission or transfer (VTE-2). These measures are met if any mechanical or pharmacologic prophylaxis was delivered.
In addition to the TJC metric, the 9 pilot hospitals monitored rates of protocol-compliant prophylaxis for 12 to 20 months. Each patient’s prophylaxis was considered protocol compliant if it was consistent with the prophylaxis protocol at the time of the audit or if contraindications were documented (eg, patients eligible for, but with contraindications to, pharmacologic prophylaxis had to have an order for mechanical prophylaxis or documented contraindication to both modalities). As this measure was initiated in a staggered fashion, the rate of protocol-compliant prophylaxis is summarized for consecutive months of measurement rather than consecutive calendar months.
HA-VTE Rates
VTE events were captured by review of electronic coding data for the International Classification of Diseases, 9th Revision (ICD-9) codes 415.11-415.19, 453.2, 453.40-453.42, and 453.8-453.89. HA-VTE was defined as either new VTE not present on admission (NPOA HA-VTE) or new VTE presenting in a readmitted patient within 30 days of discharge (Readmit HA-VTE). Cases were stratified based on whether the patient had undergone a major operation (surgery patients) or not (medical patients) as identified by Medicare Services diagnosis-related group codes.
Control Measures
Potential adverse events were captured by review of electronic coding data for ICD-9 codes 289.84 (heparin-induced thrombocytopenia [HIT]) and E934.2 (adverse effects because of anticoagulants).
Statistical Analysis
Statistical process control charts were used to depict changes in prophylaxis rates over the 3 years for which data was collected. For VTE and safety outcomes, Pearson χ2 value with relative risk (RR) calculations and 95% confidence intervals (CIs) were used to compare proportions between groups at baseline (CY 2011) versus postimplementation (CY 2014). Differences between the means of normally distributed data were calculated, and a 95% CI for the difference between the means was performed to assess statistical difference. Nonparametric characteristics were described by quartiles and interquartile range, and the 2-sided Mann-Whitney U test was performed to assess statistical difference between the CY 2011 and CY 2014 period.
Role of the Funding Source
The GBMF funded the collaborative and supported authorship of the manuscript but had no role in the design or conduct of the intervention, the collection or analysis of data, or the drafting of the manuscript.
RESULTS
Population Demographics
There were 1,155,069 adult inpatient admissions during the 4-year study period (264,280 in the 9 pilot sites, 890,789 in the 26 spread sites). There were no clinically relevant changes in gender distribution, mortality rate, median age, case mix index, or hospital length of stay in 2011 versus 2014. Men comprised 47.1% of the patient population in 2011 and 47.7% in 2014. The mortality rate was 2.7% in both years. Median age was 62 in 2011 and 63 in 2014. The mean case mix index (1.58 vs 1.65) and mean length of stay (4.29 vs 4.33 days) were similar in the 2 time periods.
Prophylaxis Rates
TJC Prophylaxis rates

Rates of Protocol-Compliant Prophylaxis
There were 34,071 active surveillance audits across the 20 months of reporting in the pilot cohort (mean, 1817 audits per month). The rate of protocol-compliant prophylaxis improved from 89% at month 1 of observation to 93% during month 2 and 97% by the last 3 months (Pearson χ2 P < .001 for both comparisons).
HA-VTE
HA-VTE characteristics
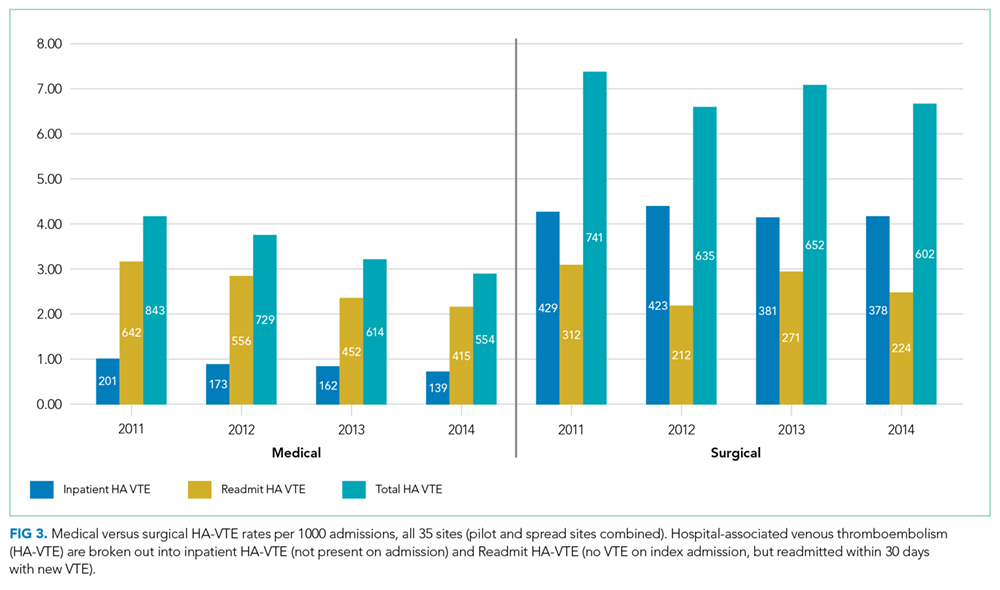
Improved HA-VTE over Time
Four hundred twenty-eight fewer HA-VTEs occurred in 2014 than in 2011 (RR 0.78; 95% CI, 0.73-0.85) (Table and Figure 3). Readmission HA-VTEs were reduced by 315 (RR 0.72; 95% CI, 0.65-0.80), while the reduction in NPOA HA-VTEs was less robust (RR 0.88; 95% CI, 0.79-0.99). Pilot sites enjoyed a more robust reduction in HA-VTEs than spread sites (26% vs 20%), largely because the pilot cohort enjoyed a 34% reduction in NPOA HA-VTEs and a 20% reduction in Readmit HA-VTEs, while the spread cohort only achieved reductions in Readmit HA-VTEs.
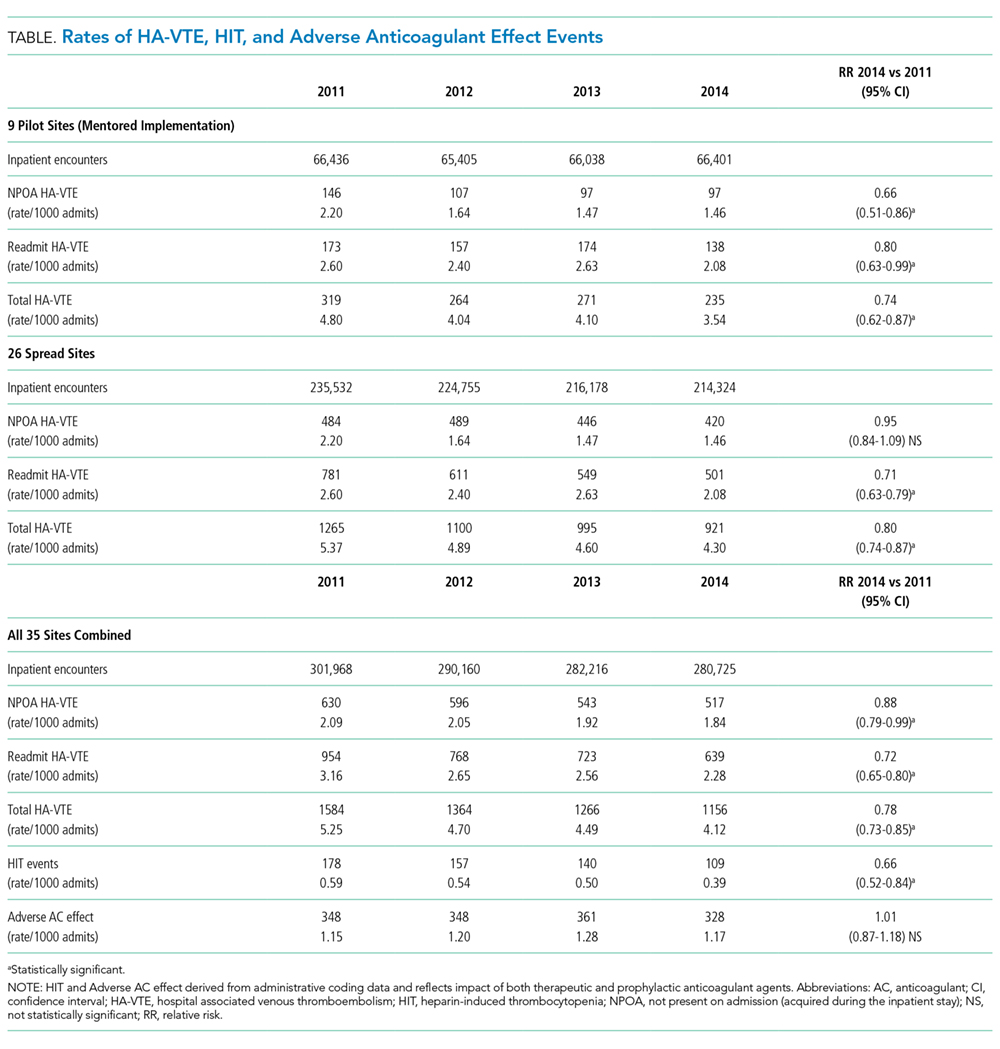
Safety
Rates of HIT and adverse effects because of anticoagulants were low (Table). The rate of HIT declined from 178 events in 2011 to 109 in 2014 (RR 0.66; 95% CI, 0.52-0.84), and the RR of anticoagulant adverse events remained stable (RR 1.01; 95% CI, 0.87-1.15).
DISCUSSION
Our QI project, based on a proven collaborative approach and mentorship,18,22,24 order set redesign, and active surveillance, was associated with 26% less VTEs in the pilot cohort and 20% less VTEs in the spread cohort. These gains, down to a final rate of approximately 4 HA-VTEs per 1000 admissions, occurred despite a low baseline HA-VTE rate. Dignity Health achieved these improvements in 35 hospitals with varied sizes, settings, ordering systems, and teaching statuses, achieving what is to our knowledge the largest VTE QI initiative yet reported.
Implementation experiences were not systematically recorded, and techniques were not compared with a control group. However, we believe that Dignity Health’s organizational commitment to improvement and centralized support were crucial for success. In addition, the pilot sites received grant support from the GBMF for intensive quality mentoring, a strategy with demonstrated value.23 Mentors and team members noted that system-wide revision to the computerized physician order entry system was easiest to implement, while active surveillance represented the most labor-intensive intervention. Other experiences echoed lessons from previous VTE mentorship efforts.17,18
The selection of a VTE protocol conducive to implementation and provider use was a key strategy. The ideal approach to VTE risk assessment is not known,12,26 but guidelines either offer no specific guidance7 or would require implementation of 3 different systems per hospital.4,5 Several of these are point scoring systems, which may have lower clinician acceptance or require programming to improve real-world use18,26,27; the Padua score was derived from a patient population that differs significantly from those in the United States.12 Our study provides more practical experience with a “3-bucket” model, which has previously shown high interobserver reliability, good clinician acceptance, and meaningful reductions of VTE, including in American patient populations.18,22,24
The value of VTE prophylaxis is still disputed in many inpatient groups. The overall rate of HA-VTE is low, so the per-patient benefit of prophylaxis is low, and many patients may be overprophylaxed.4,11,12 Recently, Flanders et al.20 reported that HA-VTE rates among 20,800 medical inpatients in Michigan were low (about 1%) and similar at hospitals in the top (mean prophylaxis rate 86%) or bottom (mean prophylaxis rate 56%) tertiles of performance. Possible explanations for the differences between their multicenter experience and ours include our sample size (55 times larger) and the possibility that targeting prophylaxis to patients at highest need (captured in our protocol-compliant prophylaxis rates) matters more than prophylaxing a percent of the population.
Further research is needed to develop simple, easy-to-implement methods to identify inpatients who do not, or no longer, require prophylaxis.12 Hospital systems also need methods to determine if prophylaxis improvement efforts can lower their HA-VTE rates and in which subpopulations. For example, a collaborative effort at the University of California lowered HA-VTE rates toward a common improved rate of 0.65% to 0.73%,22 while Dignity Health achieved improvement despite starting with an even lower baseline. In the University of California collaborative, benefits were limited chiefly to surgical patients, while Dignity Health achieved most improvement in medical patients, particularly in Readmit HA-VTE. If future research uncovers the reasons for these differences, it could help hospitals decide where to target improvement efforts.
Our study has several limitations. First, we used a nonrandomized time series design, so we cannot exclude other potential explanations for the change in VTE rates. However, there were no major changes in patient populations or concurrent projects likely to have influenced event rates. While we did not collect detailed demographic information on subjects, the broad inclusion criteria and multicenter design suggests a high degree of generalizability. Second, we followed inpatient VTE events and VTE-related readmissions, but not VTE treated in the outpatient setting. This did not change over the study, but the availability of all-oral therapy for VTE could have caused underdetection if clinic or emergency room doctors sent home more patients on oral therapy instead of readmitting them to the hospital. Third, implementation was enhanced by GBMF funds (at 9 sites, with the remainder benefitting from their experience), a shared electronic med
Strengths of our study include reductions in HA-VTE, both with and without access to GBMF funds, by using broadly available QI strategies.17 This real-world success and ease of dissemination are particularly important because the clinical trials of prophylaxis have been criticized for using highly selected patient populations,11 and prophylaxis QI studies show an inconsistent impact on VTE outcomes.15 In previous studies, two of the authors monitored orders for prophylaxis22,24; during this project, delivery for both pharmacologic and mechanical VTE prophylaxis was monitored, confirming that patient care actually changed.
CONCLUSION
Our multicenter VTE prophylaxis initiative, featuring a “3-bucket” VTE protocol, QI mentorship, and active surveillance as key interventions, was associated with improved prophylaxis rates and a reduction in HA-VTE by 22% with no increase in adverse events. This project provides a model for hospital systems seeking to optimize their prophylaxis efforts, and it supports the use of collaborative QI initiatives and SHM’s quality mentorship program as methods to drive improvement across health systems.
Disclosure
None of the authors have any conflicts of interest related to any topics or products discussed in the article. Dignity Health provided a stipend for writing the manuscript to GM and IJ, as noted in the article, but had no role in data analysis, writing, or decision to submit.
1. U.S. Department of Health and Human Services; National Heart, Lung, and Blood Institute. Surgeon General’s Call to Action to Prevent Deep Vein Thrombosis and Pulmonary Embolism. Rockville: Office of the Surgeon General; 2008.
2. Heit JA, Melton LJ, Lohse CM, et al. Incidence of venous thromboembolism in hospitalized patients versus community residents. Mayo Clin Proc. 2001;76(11):1102-1110. PubMed
3. Guyatt GH, Eikelboom JW, Gould MK. Approach to Outcome Measurement in the Prevention of Thrombosis in Surgical and Medical Patients: Antithrombotic Therapy and Prevention of Thrombosis, 9th ed: American College of Chest Physicians Evidence-Based Clinical Practice Guidelines. Chest. 2012;141(2 suppl):e185S-e194S. doi:10.1378/chest.11-2289. PubMed
4. Kahn SR, Lim W, Dunn AS, et al. Prevention of VTE in Nonsurgical Patients: Antithrombotic Therapy and Prevention of Thrombosis, 9th ed: American College of Chest Physicians Evidence-Based Clinical Practice Guidelines. Chest. 2012;141(2 suppl):e195S-e226S. doi:10.1378/chest.11-2296. PubMed
5. Gould MK, Garcia DA, Wren SM, et al. Prevention of VTE in Nonorthopedic Surgical Patients. Chest. 2012;141(2 suppl):e227S-e277S. PubMed
6. Falck-Ytter Y, Francis CW, Johanson NA, et al. Prevention of VTE in Orthopedic Surgery Patients: Antithrombotic Therapy and Prevention of Thrombosis, 9th ed: American College of Chest Physicians Evidence-Based Clinical Practice Guidelines. Chest. 2012;141(2 suppl):e278S-e325S. doi:10.1378/chest.11-2404. PubMed
7. Qaseem A, Chou R, Humphrey LL. Venous Thromboembolism Prophylaxis in Hospitalized Patients: A Clinical Practice Guideline from the American College of Physicians. Ann Intern Med. 2011;155(9):625-632. PubMed
8. The Joint Commission. Performance Measurement Initiatives. http://www.jointcommission.org/PerformanceMeasurement/PerformanceMeasurement. Accessed June 14, 2012.
9. National Quality Forum. National Voluntary Consensus Standards for Prevention and Care of Venous Thromboembolism: Policy, Preferred Practices, and Initial Performance Measures. http://www.qualityforum.org/Publications/2006/12/National_Voluntary_Consensus_Standards_for_Prevention_and_Care_of_Venous_Thromboembolism__Policy,_Preferred_Practices,_and_Initial_Performance_Measures.aspx. Accessed June 14, 2012.
10. Medicare Quality Improvement Committee. SCIP Project Information. Agency for Healthcare Research and Quality. http://www.qualitymeasures.ahrq.gov/content.aspx?id=35538&search=scip. Accessed March 2013.
11. Lederle FA, Zylla D, MacDonald R, Wilt TJ. Venous Thromboembolism Prophylaxis in Hospitalized Medical Patients and Those with Stroke: A Background Review for an American College of Physicians Clinical Practice Guideline. Ann Intern Med. 2011;155(9):602-615. PubMed
12. Rothberg MB. Venous thromboembolism prophylaxis for medical patients: who needs it? JAMA Intern Med. 2014;174(10):1585-1586. PubMed
13. Cohen AT, Tapson VF, Bergmann JF, et al. Venous thromboembolism risk and prophylaxis in the acute hospital care setting (ENDORSE study): A multinational cross-sectional study. Lancet. 2008;371(9610):387-394. PubMed
14. Amin AN, Stemkowski S, Lin J, Yang G. Inpatient thromboprophylaxis use in U.S. hospitals: adherence to the seventh American College of Chest Physician’s recommendations for at-risk medical and surgical patients. J Hosp Med. 2009;4(8):E15-E21. PubMed
15. Kahn SR, Morrison DR, Cohen JM, et al. Interventions for implementation of thromboprophylaxis in hospitalized medical and surgical patients at risk for venous thromboembolism. Cochrane Database Syst Rev. 2013;7:CD008201. doi:10.1002/14651858.CD008201.pub2. PubMed
16. Lau BD, Haut ER. Practices to prevent venous thromboembolism: a brief review. BMJ Qual Saf. 2014;23(3):187-195. PubMed
17. Maynard G. Preventing hospital-associated venous thromboembolism: a guide for effective quality improvement, 2nd ed. Rockville: Agency for Healthcare Research and Quality; 2015. https://www.ahrq.gov/sites/default/files/publications/files/vteguide.pdf. Accessed October 29, 2017.
18. Maynard G, Stein J. Designing and Implementing Effective VTE Prevention Protocols: Lessons from Collaboratives. J Thromb Thrombolysis. 2010;29(2):159-166. PubMed
19. Altom LK, Deierhoi RJ, Grams J, et al. Association between Surgical Care Improvement Program venous thromboembolism measures and postoperative events. Am J Surg. 2012;204(5):591-597. PubMed
20. Flanders SA, Greene MT, Grant P, et al. Hospital performance for pharmacologic venous thromboembolism prophylaxis and rate of venous thromboembolism: a cohort study. JAMA Intern Med. 2014;174(10):1577-1584. PubMed
21. Finn KM, Greenwald JL. Update in Hospital Medicine: Evidence You Should Know. J Hosp Med. 2015;10(12):817-826. PubMed
22. Jenkins IH, White RH, Amin AN, et al. Reducing the incidence of hospital-associated venous thromboembolism within a network of academic hospitals: Findings from five University of California medical centers. J Hosp Med. 2016;11(Suppl 2):S22-S28. PubMed
23. Maynard GA, Budnitz TL, Nickel WK, et al. 2011 John M. Eisenberg Patient Safety and Quality Award. Mentored Implementation: Building Leaders and Achieving Results Through a Collaborative Improvement Model at the National Level. Jt Comm J Qual Patient Saf. 2012;38(7):301-310.
24. Maynard GA, Morris TA, Jenkins IH, et al. Optimizing prevention of hospital-acquired venous thromboembolism (VTE): Prospective validation of a VTE risk assessment model. J Hosp Med. 2010;5(1):10-18. PubMed
25. The Joint Commission. Venous Thromboembolism Quality Measures. https://www.jointcommission.org/venous_thromboembolism/. Accessed October 13, 2017.
26. Maynard GA, Jenkins IH, Merli GJ. Venous thromboembolism prevention guidelines for medical inpatients: Mind the (implementation) Gap. J Hosp Med. 2013;8(10):582-588. PubMed
27. Elias P, Khanna R, Dudley A, et al. Automating Venous Thromboembolism Risk Calculation Using Electronic Health Record Data upon Hospital Admission: The Automated Padua Prediction Score. J Hosp Med. 2017;12(4):231-237. PubMed
Deep venous thrombosis and pulmonary embolism, collectively known as venous thromboembolism (VTE), affect up to 600,000 Americans a year.1 Most of these are hospital-associated venous thromboembolisms (HA-VTE).1,2 VTE poses a substantial risk of mortality and long-term morbidity, and its treatment poses a risk of major bleeding.1 As appropriate VTE prophylaxis (“prophylaxis”) can reduce the risk of VTE by 40% to 80% depending on the patient population,3 VTE risk assessment and prophylaxis is endorsed by multiple guidelines4-7 and supported by regulatory agencies.8-10
However, despite extensive study, consensus about the impact of prophylaxis4,11 and the optimal method of risk assessment4,5,7,12 is lacking. Meanwhile, implementation of prophylaxis in real-world settings is poor; only 40% to 60% of at-risk patients receive prophylaxis,13 and as few as <20% receive optimal prophylaxis.14 Both systematic reviews15,16 and experience with VTE prevention collaboratives17,18 found that multifaceted interventions and alerts may be most effective in improving prophylaxis rates, but without proof of improved VTE rates.15 There is limited experience with large-scale VTE prevention. Organizations like The Joint Commission (TJC)8 and the Surgical Care Improvement Project have promoted quality measures but without clear evidence of improvement.19 In addition, an analysis of over 20,000 medical patients at 35 hospitals found no difference in VTE rates between high- and low-performing hospitals,20 suggesting that aggressive prophylaxis efforts may not reduce VTE, at least among medical patients.21 However, a 5-hospital University of California collaborative was associated with improved VTE rates, chiefly among surgical patients.22
In 2011, Dignity Health targeted VTE for improvement after investigations of potentially preventable HA-VTE revealed variable patterns of prophylaxis. In addition, improvement seemed feasible because there is a proven framework for VTE quality improvement (QI) projects17,18 and a record of success with the following 3 specific strategies: quality mentorship,23 use of a simple VTE risk assessment method, and active surveillance (real-time monitoring targeting suboptimal prophylaxis with concurrent intervention). This active surveillance technique has been used successfully in prior improvement efforts, often termed measure-vention.17,18,22,24
METHODS
Setting and Participants
The QI collaborative was performed at 35 Dignity Health community hospitals in California, Arizona, and Nevada. Facilities ranged from 25 to 571 beds in size with a mixture of teaching and nonteaching hospitals. Prior to the initiative, prophylaxis improvement efforts were incomplete and inconsistent at study facilities. All adult acute care inpatients at all facilities were included except rehabilitation, behavioral health, skilled nursing, hospice, other nonacute care, and inpatient deliveries.
Design Overview
We performed a prospective, unblinded, open-intervention study of a QI collaborative in 35 community hospitals and studied the effect on prophylaxis and VTE rates with historical controls. The 35 hospitals were organized into 2 cohorts. In the “pilot” cohort, 9 hospitals (chosen to be representative of the various settings, size, and teaching status within the Dignity system) received funding from the Gordon and Betty Moore Foundation (GBMF) for intensive, individualized QI mentorship from experts as well as active surveillance (see “Interventions”). The pilot sites led the development of the VTE risk assessment and prophylaxis protocol (“VTE protocol”), measures, order sets, implementation tactics, and lessons learned, assisted by the mentor experts. Dissemination to the 26-hospital “spread” cohort was facilitated by the Dignity Health Hospital Engagement Network (HEN) infrastructure.
Timeline
Two of the pilot sites, acting as leads on the development of protocol and order set tools, formed improvement teams in March 2011, 6 to 12 months earlier than other Dignity sites. Planning and design work occurred from March 2011 to September 2012. Most implementation at the 35 hospitals occurred in a staggered fashion during calendar year (CY) 2012 and 2013 (see Figure 1). As few changes were made until mid-2012, we considered CY 2011 the baseline for comparison, CY 2012 to 2013 the implementation years, and CY 2014 the postimplementation period.
The project was reviewed by the Institutional Review Board (IRB) of Dignity Health and determined to be an IRB-exempt QI project.
Interventions
Collaborative Infrastructure
Multidisciplinary Teams
Improvement teams formed between March 2011 and September 2012. Members included a physician champion, frontline nurses and physicians, an administrative liaison, pharmacists, quality and data specialists, clinical informatics staff, and stakeholders from key clinical services. Teams met at least monthly at each site.
Physician Mentors
The 9 pilot sites received individualized mentorship provided by outside experts (IJ or GM) based on a model pioneered by the Society of Hospital Medicine’s (SHM) Mentored Implementation programs.23 Each pilot site completed a self-assessment survey17 (see supplementary Appendix A) about past efforts, team composition, current performance, aims, barriers, and opportunities. The mentors reviewed the completed questionnaire with each hospital and provided advice on the VTE protocol and order set design, measurement, and benchmarking during 3 webinar meetings scheduled at 0, 3, and 9 months, plus as-needed e-mail and phone correspondence. After each webinar, the mentors provided detailed improvement suggestions (see supplementary Appendix B). Several hospitals received mentor site visits, which focused on unit rounding, active surveillance, staff and provider education, and problem-solving sessions with senior leadership, physician leadership, and the improvement team.
VTE Protocol
After a literature review and consultation with the mentors, Dignity Health developed and implemented a VTE protocol, modified from a model used in previous improvement efforts.18,22-24 Its risk assessment method is often referred to as a “3 bucket” model because it assigns patients to high-, moderate-, or low-risk categories based on clinical factors (eg, major orthopedic surgery, prior VTE, and others), and the VTE protocol recommends interventions based on the risk category (see supplementary Appendix C). Dignity Health was transitioning to a single electronic health record (Cerner Corporation, North Kansas City, MO) during the study, and study hospitals were using multiple platforms, necessitating the development of both paper and electronic versions of the VTE protocol. The electronic version required completion of the VTE protocol for all inpatient admissions and transfers. The VTE protocol was completed in November 2011 and disseminated to other sites in a staggered fashion through November 2012. Completed protocols and improvement tips were shared by the project lead and by webinar sessions. Sites were also encouraged to implement a standardized practice that allowed nurses to apply sequential compression devices to at-risk patients without physician orders when indicated by protocol, when contraindications such as vascular disease or ulceration were absent.
Education
Staff were educated about the VTE protocol by local teams, starting between late 2011 and September 2012. The audience (physicians, nurses, pharmacists, etc.) and methods (conferences, fliers, etc.) were determined by local teams, following guidance by mentors and webinar content. Active surveillance provided opportunities for in-the-moment, patient-specific education and protocol reinforcement. Both mentors delivered educational presentations at pilot sites.
Active Surveillance
Sites were encouraged to perform daily review of prophylaxis adequacy for inpatients and correct lapses in real time (both under- and overprophylaxis). Inappropriate prophylaxis orders were addressed by contacting providers to change the order or document the rationale not to. Lapses in adherence to prophylaxis were addressed by nursing correction and education of involved staff. Active surveillance was funded for 10 hours a week at pilot sites. Spread sites received only minimal support from HEN monies. All sites used daily prophylaxis reports, enhanced to include contraindications like thrombocytopenia and coagulopathy, to facilitate efforts. Active surveillance began in May 2012 in the lead pilot hospitals and was implemented in other sites between October 2012 and February 2013.
Metrics
Prophylaxis Rates
Measurement of prophylaxis did not begin until 2012 to 2013; thus, the true baseline rate for prophylaxis was not captured. TJC metrics (VTE-1 and VTE-2)25 were consolidated into a composite TJC prophylaxis rate from January 2012 to December 2014 for both pilot and spread hospitals. These measures assess the percentage of adult inpatients who received VTE prophylaxis or have documentation of why no prophylaxis was given the day of or day after hospital admission (VTE-1) or the day of or day after ICU admission or transfer (VTE-2). These measures are met if any mechanical or pharmacologic prophylaxis was delivered.
In addition to the TJC metric, the 9 pilot hospitals monitored rates of protocol-compliant prophylaxis for 12 to 20 months. Each patient’s prophylaxis was considered protocol compliant if it was consistent with the prophylaxis protocol at the time of the audit or if contraindications were documented (eg, patients eligible for, but with contraindications to, pharmacologic prophylaxis had to have an order for mechanical prophylaxis or documented contraindication to both modalities). As this measure was initiated in a staggered fashion, the rate of protocol-compliant prophylaxis is summarized for consecutive months of measurement rather than consecutive calendar months.
HA-VTE Rates
VTE events were captured by review of electronic coding data for the International Classification of Diseases, 9th Revision (ICD-9) codes 415.11-415.19, 453.2, 453.40-453.42, and 453.8-453.89. HA-VTE was defined as either new VTE not present on admission (NPOA HA-VTE) or new VTE presenting in a readmitted patient within 30 days of discharge (Readmit HA-VTE). Cases were stratified based on whether the patient had undergone a major operation (surgery patients) or not (medical patients) as identified by Medicare Services diagnosis-related group codes.
Control Measures
Potential adverse events were captured by review of electronic coding data for ICD-9 codes 289.84 (heparin-induced thrombocytopenia [HIT]) and E934.2 (adverse effects because of anticoagulants).
Statistical Analysis
Statistical process control charts were used to depict changes in prophylaxis rates over the 3 years for which data was collected. For VTE and safety outcomes, Pearson χ2 value with relative risk (RR) calculations and 95% confidence intervals (CIs) were used to compare proportions between groups at baseline (CY 2011) versus postimplementation (CY 2014). Differences between the means of normally distributed data were calculated, and a 95% CI for the difference between the means was performed to assess statistical difference. Nonparametric characteristics were described by quartiles and interquartile range, and the 2-sided Mann-Whitney U test was performed to assess statistical difference between the CY 2011 and CY 2014 period.
Role of the Funding Source
The GBMF funded the collaborative and supported authorship of the manuscript but had no role in the design or conduct of the intervention, the collection or analysis of data, or the drafting of the manuscript.
RESULTS
Population Demographics
There were 1,155,069 adult inpatient admissions during the 4-year study period (264,280 in the 9 pilot sites, 890,789 in the 26 spread sites). There were no clinically relevant changes in gender distribution, mortality rate, median age, case mix index, or hospital length of stay in 2011 versus 2014. Men comprised 47.1% of the patient population in 2011 and 47.7% in 2014. The mortality rate was 2.7% in both years. Median age was 62 in 2011 and 63 in 2014. The mean case mix index (1.58 vs 1.65) and mean length of stay (4.29 vs 4.33 days) were similar in the 2 time periods.
Prophylaxis Rates
TJC Prophylaxis rates
Rates of Protocol-Compliant Prophylaxis
There were 34,071 active surveillance audits across the 20 months of reporting in the pilot cohort (mean, 1817 audits per month). The rate of protocol-compliant prophylaxis improved from 89% at month 1 of observation to 93% during month 2 and 97% by the last 3 months (Pearson χ2 P < .001 for both comparisons).
HA-VTE
HA-VTE characteristics
Improved HA-VTE over Time
Four hundred twenty-eight fewer HA-VTEs occurred in 2014 than in 2011 (RR 0.78; 95% CI, 0.73-0.85) (Table and Figure 3). Readmission HA-VTEs were reduced by 315 (RR 0.72; 95% CI, 0.65-0.80), while the reduction in NPOA HA-VTEs was less robust (RR 0.88; 95% CI, 0.79-0.99). Pilot sites enjoyed a more robust reduction in HA-VTEs than spread sites (26% vs 20%), largely because the pilot cohort enjoyed a 34% reduction in NPOA HA-VTEs and a 20% reduction in Readmit HA-VTEs, while the spread cohort only achieved reductions in Readmit HA-VTEs.
Safety
Rates of HIT and adverse effects because of anticoagulants were low (Table). The rate of HIT declined from 178 events in 2011 to 109 in 2014 (RR 0.66; 95% CI, 0.52-0.84), and the RR of anticoagulant adverse events remained stable (RR 1.01; 95% CI, 0.87-1.15).
DISCUSSION
Our QI project, based on a proven collaborative approach and mentorship,18,22,24 order set redesign, and active surveillance, was associated with 26% less VTEs in the pilot cohort and 20% less VTEs in the spread cohort. These gains, down to a final rate of approximately 4 HA-VTEs per 1000 admissions, occurred despite a low baseline HA-VTE rate. Dignity Health achieved these improvements in 35 hospitals with varied sizes, settings, ordering systems, and teaching statuses, achieving what is to our knowledge the largest VTE QI initiative yet reported.
Implementation experiences were not systematically recorded, and techniques were not compared with a control group. However, we believe that Dignity Health’s organizational commitment to improvement and centralized support were crucial for success. In addition, the pilot sites received grant support from the GBMF for intensive quality mentoring, a strategy with demonstrated value.23 Mentors and team members noted that system-wide revision to the computerized physician order entry system was easiest to implement, while active surveillance represented the most labor-intensive intervention. Other experiences echoed lessons from previous VTE mentorship efforts.17,18
The selection of a VTE protocol conducive to implementation and provider use was a key strategy. The ideal approach to VTE risk assessment is not known,12,26 but guidelines either offer no specific guidance7 or would require implementation of 3 different systems per hospital.4,5 Several of these are point scoring systems, which may have lower clinician acceptance or require programming to improve real-world use18,26,27; the Padua score was derived from a patient population that differs significantly from those in the United States.12 Our study provides more practical experience with a “3-bucket” model, which has previously shown high interobserver reliability, good clinician acceptance, and meaningful reductions of VTE, including in American patient populations.18,22,24
The value of VTE prophylaxis is still disputed in many inpatient groups. The overall rate of HA-VTE is low, so the per-patient benefit of prophylaxis is low, and many patients may be overprophylaxed.4,11,12 Recently, Flanders et al.20 reported that HA-VTE rates among 20,800 medical inpatients in Michigan were low (about 1%) and similar at hospitals in the top (mean prophylaxis rate 86%) or bottom (mean prophylaxis rate 56%) tertiles of performance. Possible explanations for the differences between their multicenter experience and ours include our sample size (55 times larger) and the possibility that targeting prophylaxis to patients at highest need (captured in our protocol-compliant prophylaxis rates) matters more than prophylaxing a percent of the population.
Further research is needed to develop simple, easy-to-implement methods to identify inpatients who do not, or no longer, require prophylaxis.12 Hospital systems also need methods to determine if prophylaxis improvement efforts can lower their HA-VTE rates and in which subpopulations. For example, a collaborative effort at the University of California lowered HA-VTE rates toward a common improved rate of 0.65% to 0.73%,22 while Dignity Health achieved improvement despite starting with an even lower baseline. In the University of California collaborative, benefits were limited chiefly to surgical patients, while Dignity Health achieved most improvement in medical patients, particularly in Readmit HA-VTE. If future research uncovers the reasons for these differences, it could help hospitals decide where to target improvement efforts.
Our study has several limitations. First, we used a nonrandomized time series design, so we cannot exclude other potential explanations for the change in VTE rates. However, there were no major changes in patient populations or concurrent projects likely to have influenced event rates. While we did not collect detailed demographic information on subjects, the broad inclusion criteria and multicenter design suggests a high degree of generalizability. Second, we followed inpatient VTE events and VTE-related readmissions, but not VTE treated in the outpatient setting. This did not change over the study, but the availability of all-oral therapy for VTE could have caused underdetection if clinic or emergency room doctors sent home more patients on oral therapy instead of readmitting them to the hospital. Third, implementation was enhanced by GBMF funds (at 9 sites, with the remainder benefitting from their experience), a shared electronic med
Strengths of our study include reductions in HA-VTE, both with and without access to GBMF funds, by using broadly available QI strategies.17 This real-world success and ease of dissemination are particularly important because the clinical trials of prophylaxis have been criticized for using highly selected patient populations,11 and prophylaxis QI studies show an inconsistent impact on VTE outcomes.15 In previous studies, two of the authors monitored orders for prophylaxis22,24; during this project, delivery for both pharmacologic and mechanical VTE prophylaxis was monitored, confirming that patient care actually changed.
CONCLUSION
Our multicenter VTE prophylaxis initiative, featuring a “3-bucket” VTE protocol, QI mentorship, and active surveillance as key interventions, was associated with improved prophylaxis rates and a reduction in HA-VTE by 22% with no increase in adverse events. This project provides a model for hospital systems seeking to optimize their prophylaxis efforts, and it supports the use of collaborative QI initiatives and SHM’s quality mentorship program as methods to drive improvement across health systems.
Disclosure
None of the authors have any conflicts of interest related to any topics or products discussed in the article. Dignity Health provided a stipend for writing the manuscript to GM and IJ, as noted in the article, but had no role in data analysis, writing, or decision to submit.
1. U.S. Department of Health and Human Services; National Heart, Lung, and Blood Institute. Surgeon General’s Call to Action to Prevent Deep Vein Thrombosis and Pulmonary Embolism. Rockville: Office of the Surgeon General; 2008.
2. Heit JA, Melton LJ, Lohse CM, et al. Incidence of venous thromboembolism in hospitalized patients versus community residents. Mayo Clin Proc. 2001;76(11):1102-1110. PubMed
3. Guyatt GH, Eikelboom JW, Gould MK. Approach to Outcome Measurement in the Prevention of Thrombosis in Surgical and Medical Patients: Antithrombotic Therapy and Prevention of Thrombosis, 9th ed: American College of Chest Physicians Evidence-Based Clinical Practice Guidelines. Chest. 2012;141(2 suppl):e185S-e194S. doi:10.1378/chest.11-2289. PubMed
4. Kahn SR, Lim W, Dunn AS, et al. Prevention of VTE in Nonsurgical Patients: Antithrombotic Therapy and Prevention of Thrombosis, 9th ed: American College of Chest Physicians Evidence-Based Clinical Practice Guidelines. Chest. 2012;141(2 suppl):e195S-e226S. doi:10.1378/chest.11-2296. PubMed
5. Gould MK, Garcia DA, Wren SM, et al. Prevention of VTE in Nonorthopedic Surgical Patients. Chest. 2012;141(2 suppl):e227S-e277S. PubMed
6. Falck-Ytter Y, Francis CW, Johanson NA, et al. Prevention of VTE in Orthopedic Surgery Patients: Antithrombotic Therapy and Prevention of Thrombosis, 9th ed: American College of Chest Physicians Evidence-Based Clinical Practice Guidelines. Chest. 2012;141(2 suppl):e278S-e325S. doi:10.1378/chest.11-2404. PubMed
7. Qaseem A, Chou R, Humphrey LL. Venous Thromboembolism Prophylaxis in Hospitalized Patients: A Clinical Practice Guideline from the American College of Physicians. Ann Intern Med. 2011;155(9):625-632. PubMed
8. The Joint Commission. Performance Measurement Initiatives. http://www.jointcommission.org/PerformanceMeasurement/PerformanceMeasurement. Accessed June 14, 2012.
9. National Quality Forum. National Voluntary Consensus Standards for Prevention and Care of Venous Thromboembolism: Policy, Preferred Practices, and Initial Performance Measures. http://www.qualityforum.org/Publications/2006/12/National_Voluntary_Consensus_Standards_for_Prevention_and_Care_of_Venous_Thromboembolism__Policy,_Preferred_Practices,_and_Initial_Performance_Measures.aspx. Accessed June 14, 2012.
10. Medicare Quality Improvement Committee. SCIP Project Information. Agency for Healthcare Research and Quality. http://www.qualitymeasures.ahrq.gov/content.aspx?id=35538&search=scip. Accessed March 2013.
11. Lederle FA, Zylla D, MacDonald R, Wilt TJ. Venous Thromboembolism Prophylaxis in Hospitalized Medical Patients and Those with Stroke: A Background Review for an American College of Physicians Clinical Practice Guideline. Ann Intern Med. 2011;155(9):602-615. PubMed
12. Rothberg MB. Venous thromboembolism prophylaxis for medical patients: who needs it? JAMA Intern Med. 2014;174(10):1585-1586. PubMed
13. Cohen AT, Tapson VF, Bergmann JF, et al. Venous thromboembolism risk and prophylaxis in the acute hospital care setting (ENDORSE study): A multinational cross-sectional study. Lancet. 2008;371(9610):387-394. PubMed
14. Amin AN, Stemkowski S, Lin J, Yang G. Inpatient thromboprophylaxis use in U.S. hospitals: adherence to the seventh American College of Chest Physician’s recommendations for at-risk medical and surgical patients. J Hosp Med. 2009;4(8):E15-E21. PubMed
15. Kahn SR, Morrison DR, Cohen JM, et al. Interventions for implementation of thromboprophylaxis in hospitalized medical and surgical patients at risk for venous thromboembolism. Cochrane Database Syst Rev. 2013;7:CD008201. doi:10.1002/14651858.CD008201.pub2. PubMed
16. Lau BD, Haut ER. Practices to prevent venous thromboembolism: a brief review. BMJ Qual Saf. 2014;23(3):187-195. PubMed
17. Maynard G. Preventing hospital-associated venous thromboembolism: a guide for effective quality improvement, 2nd ed. Rockville: Agency for Healthcare Research and Quality; 2015. https://www.ahrq.gov/sites/default/files/publications/files/vteguide.pdf. Accessed October 29, 2017.
18. Maynard G, Stein J. Designing and Implementing Effective VTE Prevention Protocols: Lessons from Collaboratives. J Thromb Thrombolysis. 2010;29(2):159-166. PubMed
19. Altom LK, Deierhoi RJ, Grams J, et al. Association between Surgical Care Improvement Program venous thromboembolism measures and postoperative events. Am J Surg. 2012;204(5):591-597. PubMed
20. Flanders SA, Greene MT, Grant P, et al. Hospital performance for pharmacologic venous thromboembolism prophylaxis and rate of venous thromboembolism: a cohort study. JAMA Intern Med. 2014;174(10):1577-1584. PubMed
21. Finn KM, Greenwald JL. Update in Hospital Medicine: Evidence You Should Know. J Hosp Med. 2015;10(12):817-826. PubMed
22. Jenkins IH, White RH, Amin AN, et al. Reducing the incidence of hospital-associated venous thromboembolism within a network of academic hospitals: Findings from five University of California medical centers. J Hosp Med. 2016;11(Suppl 2):S22-S28. PubMed
23. Maynard GA, Budnitz TL, Nickel WK, et al. 2011 John M. Eisenberg Patient Safety and Quality Award. Mentored Implementation: Building Leaders and Achieving Results Through a Collaborative Improvement Model at the National Level. Jt Comm J Qual Patient Saf. 2012;38(7):301-310.
24. Maynard GA, Morris TA, Jenkins IH, et al. Optimizing prevention of hospital-acquired venous thromboembolism (VTE): Prospective validation of a VTE risk assessment model. J Hosp Med. 2010;5(1):10-18. PubMed
25. The Joint Commission. Venous Thromboembolism Quality Measures. https://www.jointcommission.org/venous_thromboembolism/. Accessed October 13, 2017.
26. Maynard GA, Jenkins IH, Merli GJ. Venous thromboembolism prevention guidelines for medical inpatients: Mind the (implementation) Gap. J Hosp Med. 2013;8(10):582-588. PubMed
27. Elias P, Khanna R, Dudley A, et al. Automating Venous Thromboembolism Risk Calculation Using Electronic Health Record Data upon Hospital Admission: The Automated Padua Prediction Score. J Hosp Med. 2017;12(4):231-237. PubMed
© 2018 Society of Hospital Medicine
Numeracy, Health Literacy, Cognition, and 30-Day Readmissions among Patients with Heart Failure
Most studies to identify risk factors for readmission among patients with heart failure (HF) have focused on demographic and clinical characteristics.1,2 Although easy to extract from administrative databases, this approach fails to capture the complex psychosocial and cognitive factors that influence the ability of HF patients to manage their disease in the postdischarge period, as depicted in the framework by Meyers et al.3 (2014). To date, studies have found low health literacy, decreased social support, and cognitive impairment to be associated with health behaviors and outcomes among HF patients, including decreased self-care,4 low HF-specific knowledge,5 medication nonadherence,6 hospitalizations,7 and mortality.8-10 Less, however, is known about the effect of numeracy on HF outcomes, such as 30-day readmission.
Numeracy, or quantitative literacy, refers to the ability to access, understand, and apply numerical data to health-related decisions.11 It is estimated that 110 million people in the United States have limited numeracy skills.12 Low numeracy is a risk factor for poor glycemic control among patients with diabetes,13 medication adherence in HIV/AIDS,14 and worse blood pressure control in hypertensives.15 Much like these conditions, HF requires that patients understand, use, and act on numerical information. Maintaining a low-salt diet, monitoring weight, adjusting diuretic doses, and measuring blood pressure are tasks that HF patients are asked to perform on a daily or near-daily basis. These tasks are particularly important in the posthospitalization period and could be complicated by medication changes, which might create additional challenges for patients with inadequate numeracy. Additionally, cognitive impairment, which is a highly prevalent comorbid condition among adults with HF,16,17 might impose additional barriers for those with inadequate numeracy who do not have adequate social support. However, to date, numeracy in the context of HF has not been well described.
Herein, we examined the effects of numeracy, alongside health literacy and cognition, on 30-day readmission risk among patients hospitalized for acute decompensated HF (ADHF).
METHODS
Study Design
The Vanderbilt Inpatient Cohort Study (VICS) is a prospective observational study of patients admitted with cardiovascular disease to Vanderbilt University Medical Center (VUMC), an academic tertiary care hospital. VICS was designed to investigate the impact of social determinants of health on postdischarge health outcomes. A detailed description of the study rationale, design, and methods is described elsewhere.3
Briefly, participants completed a baseline interview while hospitalized, and follow-up phone calls were conducted within 1 week of discharge, at 30 days, and at 90 days. At 30 and 90 days postdischarge, healthcare utilization was ascertained by review of medical records and patient report. Clinical data about the index hospitalization were also abstracted. The Vanderbilt University Institutional Review Board approved the study.
Study Population
Patients hospitalized from 2011 to 2015 with a likely diagnosis of acute coronary syndrome and/or ADHF, as determined by a physician’s review of the medical record, were identified as potentially eligible. Research assistants assessed these patients for the presence of the following exclusion criteria: less than 18 years of age, non-English speaking, unstable psychiatric illness, a low likelihood of follow-up (eg, no reliable telephone number), on hospice, or otherwise too ill to complete an interview. Additionally, those with severe cognitive impairment, as assessed from the medical record (such as seeing a note describing dementia), and those with delirium, as assessed by the brief confusion assessment method, were excluded from enrollment in the study.18,19 Those who died before discharge or during the 30-day follow-up period were excluded. For this analysis, we restricted our sample to only include participants who were hospitalized for ADHF.
Outcome Measure: 30-Day Readmission
The main outcome was all-cause readmission to any hospital within 30 days of discharge, as determined by patient interview, review of electronic medical records from VUMC, and review of outside hospital records.
Main Exposures: Numeracy, Health Literacy, and Cognitive Impairment
Numeracy was assessed with a 3-item version of the Subjective Numeracy Scale (SNS-3), which quantifies the patients perceived quantitative abilities.20 Other authors have shown that the SNS-3 has a correlation coefficient of 0.88 with the full-length SNS-8 and a Cronbach’s alpha of 0.78.20-22 The SNS-3 is reported as the mean on a scale from 1 to 6, with higher scores reflecting higher numeracy.
Subjective health literacy was assessed by using the 3-item Brief Health Literacy Screen (BHLS).23 Scores range from 3 to 15, with higher scores reflecting higher literacy. Objective health literacy was assessed with the short form of the Test of Functional Health Literacy in Adults (sTOFHLA).24,25 Scores may be categorized as inadequate (0-16), marginal (17-22), or adequate (23-36).
We assessed cognition by using the 10-item Short Portable Mental Status Questionnaire (SPMSQ).26 The SPMSQ, which describes a person’s capacity for memory, structured thought, and orientation, has been validated and has demonstrated good reliability and validity.27 Scores of 0 were considered to reflect intact cognition, and scores of 1 or more were considered to reflect any cognitive impairment, a scoring approach employed by other authors.28 We used this approach, rather than the traditional scoring system developed by Pfeiffer et al.26 (1975), because it would be the most sensitive to detect any cognitive impairment in the VICS cohort, which excluded those with severe cognition impairment, dementia, and delirium.
Covariates
During the hospitalization, participants completed an in-person interviewer-administered baseline assessment composed of demographic information, including age, self-reported race (white and nonwhite), educational attainment, home status (married, not married and living with someone, not married and living alone), and household income.
Clinical and diagnostic characteristics abstracted from the medical record included a medical history of HF, HF subtype (classified by left ventricular ejection fraction [LVEF]), coronary artery disease, chronic obstructive pulmonary disease (COPD), diabetes mellitus (DM), and comorbidity burden as summarized by the van Walraven-Elixhauser score.29,30 Depressive symptoms were assessed during the 2 weeks prior to the hospitalization by using the first 8 items of the Patient Health Questionnaire.31 Scores ranged from 0 to 24, with higher scores reflecting more severe depressive symptoms. Laboratory values included estimated glomerular filtration rate (eGFR), hemoglobin (g/dl), sodium (mg/L), and brain natriuretic peptide (BNP) (pg/ml) from the last laboratory draw before discharge. Smoking status was also assessed (current and former/nonsmokers).
Hospitalization characteristics included length of stay in days, number of prior admissions in the last year, and transfer to the intensive care unit during the index admission.
Statistical Analysis
Descriptive statistics were used to summarize patient characteristics. The Kruskal-Wallis test and the Pearson χ2 test were used to determine the association between patient characteristics and levels of numeracy, literacy, and cognition separately. The unadjusted relationship between patient characteristics and 30-day readmission was assessed by using Wilcoxon rank sums tests for continuous variables and Pearson χ2 tests for categorical variables. In addition, a correlation matrix was performed to assess the correlations between numeracy, health literacy, and cognition (supplementary Figure 1).
To examine the association between numeracy, health literacy, and cognition and 30-day readmissions, a series of multivariable Poisson (log-linear) regression models were fit.32 Like other studies, numeracy, health literacy, and cognition were examined as categorical and continuous measures in models.33 Each model was modified with a sandwich estimator for robust standard errors. Log-linear models were chosen over logistic regression models for ease of interpretation because (exponentiated) parameters correspond to risk ratios (RRs) as opposed to odds ratios. Furthermore, the fitting challenges associated with log-linear models when predicted probabilities are near 0 or 1 were not present in these analyses. Redundancy analyses were conducted to ensure that independent variables were not highly correlated with a linear combination of the other independent variables. To avoid case-wise deletion of records with missing covariates, we employed multiple imputation with 10 imputation samples by using predictive mean matching.34,35 All analyses were conducted in R version 3.1.2 (The R Foundation, Vienna, Austria).36
RESULTS
Overall, 883 patients were included in this analysis (supplementary Figure 2). Of the 883 participants, 46% were female and 76% were white (Table 1). Their median age was 60 years (interdecile range [IDR] 39-78) and the median educational attainment was 13.5 years (IDR 11-18).
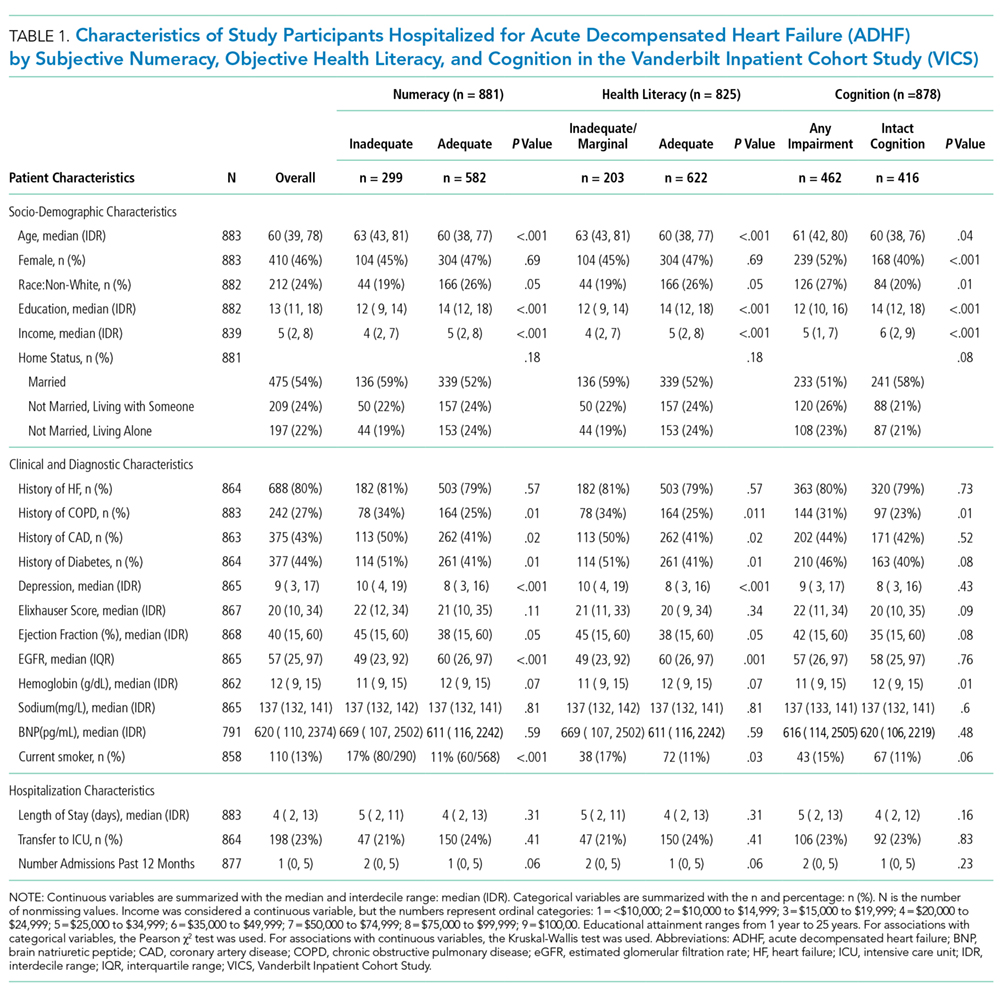
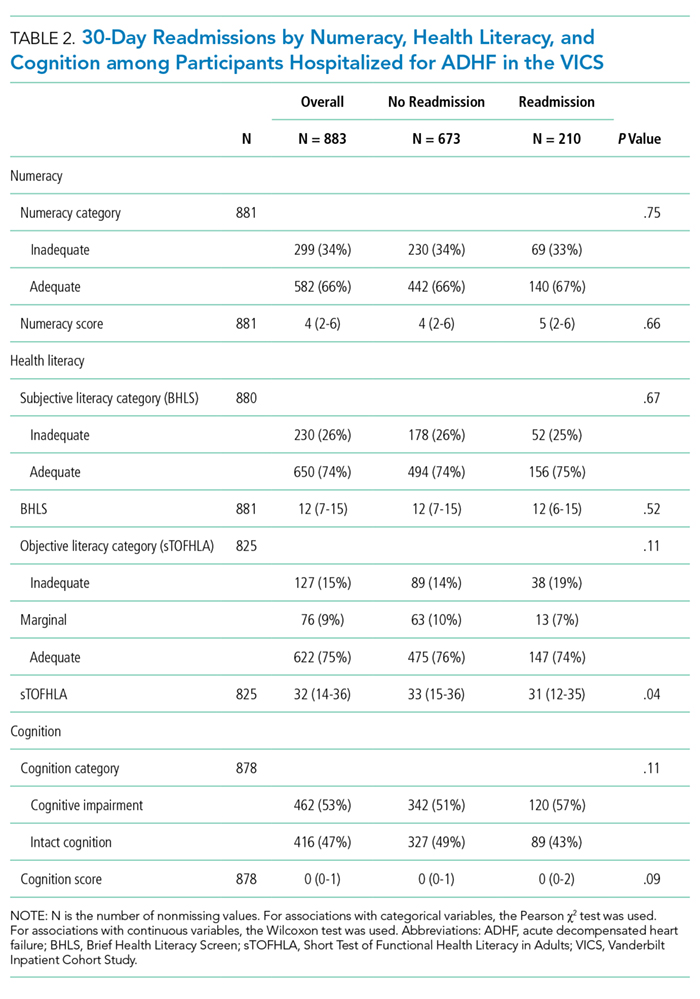
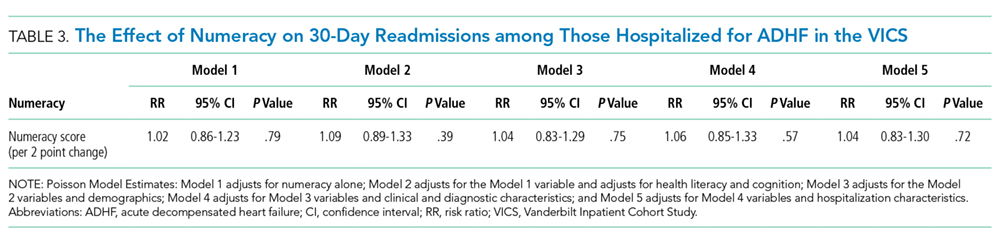
DISCUSSION
This is the first study to examine the effect of numeracy alongside literacy and cognition on 30-day readmission risk among patients hospitalized with ADHF. Overall, we found that 33.9% of participants had inadequate numeracy skills, and 24.6% had inadequate or marginal health literacy. In unadjusted and adjusted models, numeracy was not associated with 30-day readmission. Although (objective) low health literacy was associated with 30-day readmission in unadjusted models, it was not in adjusted models. Additionally, though 53% of participants had any cognitive impairment, readmission did not differ significantly by this factor. Taken together, these findings suggest that other factors may be greater determinants of 30-day readmissions among patients hospitalized for ADHF.
Only 1 other study has examined the effect of numeracy on readmission risk among patients hospitalized for HF. In this multicenter prospective study, McNaughton et al.37 found low numeracy to be associated with higher odds of recidivism to the emergency department (ED) or hospital within 30 days. Our findings may differ from theirs for a few reasons. First, their study had a significantly higher percentage of individuals with low numeracy (55%) compared with ours (33.9%). This may be because they did not exclude individuals with severe cognitive impairment, and their patient population was of lower socioeconomic status (SES) than ours. Low SES is associated with higher 30-day readmissions among HF patients1,10 throughout the literature, and low numeracy is associated with low SES in other diseases.13,38,39 Finally, they studied recidivism, which was defined as any unplanned return to the ED or hospital within 30 days of the index ED visit for acute HF. We only focused on 30-day readmissions, which also may explain why our results differed.
We found that health literacy was not associated with 30-day readmissions, which is consistent with the literature. Although an association between health literacy and mortality exists among adults with HF, several studies have not found an association between health literacy and 30- and 90-day readmission among adults hospitalized for HF.8,9,40 Although we found an association between objective health literacy and 30-day readmission in unadjusted analyses, we did not find one in the multivariable model. This, along with our numeracy finding, suggests that numeracy and literacy may not be driving the 30-day readmission risk among patients hospitalized with ADHF.
We examined cognition alongside numeracy and literacy because it is a prevalent condition among HF patients and because it is associated with adverse outcomes among patients with HF, including readmission.41,42 Studies have shown that HF preferentially affects certain cognitive domains,43 some of which are vital to HF self-care activities. We found that 53% of patients had any cognitive impairment, which is consistent with the literature of adults hospitalized for ADHF.44,45 Cognitive impairment was not, however, associated with 30-day readmissions. There may be a couple reasons for this. First, we measured cognitive impairment with the SPMSQ, which, although widely used and well-validated, does not assess executive function, the domain most commonly affected in HF patients with cognitive impairment.46 Second, patients with severe cognitive impairment and those with delirium were excluded from this study, which may have limited our ability to detect differences in readmission by this factor.
As in prior studies, we found that a history of DM and more hospitalizations in the prior year were independently associated with 30-day readmissions in fully adjusted models. Like other studies, in adjusted models, we found that LVEF and a history of HF were not independently associated with 30-day readmission.47-49 This, however, is not surprising because recent studies have shown that, although HF patients are at risk for multiple hospitalizations, early readmission after a hospitalization for ADHF specifically is often because of reasons unrelated to HF or a non-cardiovascular cause in general.50,51
Although a negative study, several important themes emerged. First, while we were able to assess numeracy, health literacy, and cognition, none of these measures were HF-specific. It is possible that we did not see an effect on readmission because our instruments failed to assess domains specific to HF, such as monitoring weight changes, following a low-salt diet, and interpreting blood pressure. Currently, however, no HF-specific objective numeracy measure exists. With respect to health literacy, only 1 HF-specific measure exists,52 although it was only recently developed and validated. Second, while numeracy may not be a driving influence of all-cause 30-day readmissions, it may be associated with other health behaviors and quality metrics that we did not examine here, such as self-care, medication adherence, and HF-specific readmissions. Third, it is likely that the progression of HF itself, as well as the clinical management of patients following discharge, contribute significantly to 30-day readmissions. Increased attention to predischarge processes for HF patients occurred at VUMC during the study period; close follow-up and evidence-directed therapies may have mitigated some of the expected associations. Finally, we were not able to assess numeracy of participants’ primary caregivers who may help patients at home, especially postdischarge. Though a number of studies have examined the role of family caregivers in the management of HF,53,54 none have examined numeracy levels of caregivers in the context of HF, and this may be worth doing in future studies.
Overall, our study has several strengths. The size of the cohort is large and there were high response rates during the follow-up period. Unlike other HF readmission studies, VICS accounts for readmissions to outside hospitals. Approximately 35% of all hospitalizations in VICS are to outside facilities. Thus, the ascertainment of readmissions to hospitals other than Vanderbilt is more comprehensive than if readmissions to VUMC were only considered. We were able to include a number of clinical comorbidities, laboratory and diagnostic tests from the index admission, and hospitalization characteristics in our analyses. Finally, we performed additional analyses to investigate the correlation between numeracy, literacy, and cognition; ultimately, we found that the majority of these correlations were weak, which supports our ability to study them simultaneously among VICS participants.
Nonetheless, we note some limitations. Although we captured readmissions to outside hospitals, the study took place at a single referral center in Tennessee. Though patients were diverse in age and comorbidities, they were mostly white and of higher SES. Finally, we used home status as a proxy for social support, which may underestimate the support that home care workers provide.
In conclusion, in this prospective longitudinal study of adults hospitalized with ADHF, inadequate numeracy was present in more than a third of patients, and low health literacy was present in roughly a quarter of patients. Neither numeracy nor health literacy, however, were associated with 30-day readmissions in adjusted analyses. Any cognitive impairment, although present in roughly one-half of patients, was not associated with 30-day readmission either. Our findings suggest that other influences may play a more dominant role in determining 30-day readmission rates in patients hospitalized for ADHF than inadequate numeracy, low health literacy, or cognitive impairment as assessed here.
Acknowledgments
This research was supported by the National Heart, Lung, and Blood Institute (R01 HL109388) and in part by the National Center for Advancing Translational Sciences (UL1 TR000445-06). The content is solely the responsibility of the authors and does not necessarily represent official views of the National Institutes of Health. The authors’ funding sources did not participate in the planning, collection, analysis, or interpretation of data or in the decision to submit for publication. Dr. Sterling is supported by T32HS000066 from the Agency for Healthcare Research and Quality. The content is solely the responsibility of the authors and does not necessarily represent the official views of the Agency for Healthcare Research and Quality. Dr. Mixon has a VA Health Services Research and Development Service Career Development Award at the Tennessee Valley Healthcare System, Department of Veterans Affairs (CDA 12-168). This material was presented at the Society of General Internal Medicine Annual Meeting on April 20, 2017, in Washington, DC.
Disclosure
Dr. Kripalani reports personal fees from Verustat, personal fees from SAI Interactive, and equity from Bioscape Digital, all outside of the submitted work. Dr. Rothman and Dr. Wallston report personal fees from EdLogics outside of the submitted work. All of the other authors have nothing to disclose
1. Ross JS, Mulvey GK, Stauffer B, et al. Statistical models and patient predictors of readmission for heart failure: a systematic review. Arch of Intern Med. 2008;168(13):1371-1386. PubMed
33. Bohannon AD, Fillenbaum GG, Pieper CF, Hanlon JT, Blazer DG. Relationship of race/ethnicity and blood pressure to change in cognitive function. J Am Geriatr Soc. 2002;50(3):424-429. PubMed
38. Abdel-Kader K, Dew MA, Bhatnagar M, et al. Numeracy Skills in CKD: Correlates and Outcomes. Clin J Am Soc Nephrol. 2010;5(9):1566-1573. PubMed
Most studies to identify risk factors for readmission among patients with heart failure (HF) have focused on demographic and clinical characteristics.1,2 Although easy to extract from administrative databases, this approach fails to capture the complex psychosocial and cognitive factors that influence the ability of HF patients to manage their disease in the postdischarge period, as depicted in the framework by Meyers et al.3 (2014). To date, studies have found low health literacy, decreased social support, and cognitive impairment to be associated with health behaviors and outcomes among HF patients, including decreased self-care,4 low HF-specific knowledge,5 medication nonadherence,6 hospitalizations,7 and mortality.8-10 Less, however, is known about the effect of numeracy on HF outcomes, such as 30-day readmission.
Numeracy, or quantitative literacy, refers to the ability to access, understand, and apply numerical data to health-related decisions.11 It is estimated that 110 million people in the United States have limited numeracy skills.12 Low numeracy is a risk factor for poor glycemic control among patients with diabetes,13 medication adherence in HIV/AIDS,14 and worse blood pressure control in hypertensives.15 Much like these conditions, HF requires that patients understand, use, and act on numerical information. Maintaining a low-salt diet, monitoring weight, adjusting diuretic doses, and measuring blood pressure are tasks that HF patients are asked to perform on a daily or near-daily basis. These tasks are particularly important in the posthospitalization period and could be complicated by medication changes, which might create additional challenges for patients with inadequate numeracy. Additionally, cognitive impairment, which is a highly prevalent comorbid condition among adults with HF,16,17 might impose additional barriers for those with inadequate numeracy who do not have adequate social support. However, to date, numeracy in the context of HF has not been well described.
Herein, we examined the effects of numeracy, alongside health literacy and cognition, on 30-day readmission risk among patients hospitalized for acute decompensated HF (ADHF).
METHODS
Study Design
The Vanderbilt Inpatient Cohort Study (VICS) is a prospective observational study of patients admitted with cardiovascular disease to Vanderbilt University Medical Center (VUMC), an academic tertiary care hospital. VICS was designed to investigate the impact of social determinants of health on postdischarge health outcomes. A detailed description of the study rationale, design, and methods is described elsewhere.3
Briefly, participants completed a baseline interview while hospitalized, and follow-up phone calls were conducted within 1 week of discharge, at 30 days, and at 90 days. At 30 and 90 days postdischarge, healthcare utilization was ascertained by review of medical records and patient report. Clinical data about the index hospitalization were also abstracted. The Vanderbilt University Institutional Review Board approved the study.
Study Population
Patients hospitalized from 2011 to 2015 with a likely diagnosis of acute coronary syndrome and/or ADHF, as determined by a physician’s review of the medical record, were identified as potentially eligible. Research assistants assessed these patients for the presence of the following exclusion criteria: less than 18 years of age, non-English speaking, unstable psychiatric illness, a low likelihood of follow-up (eg, no reliable telephone number), on hospice, or otherwise too ill to complete an interview. Additionally, those with severe cognitive impairment, as assessed from the medical record (such as seeing a note describing dementia), and those with delirium, as assessed by the brief confusion assessment method, were excluded from enrollment in the study.18,19 Those who died before discharge or during the 30-day follow-up period were excluded. For this analysis, we restricted our sample to only include participants who were hospitalized for ADHF.
Outcome Measure: 30-Day Readmission
The main outcome was all-cause readmission to any hospital within 30 days of discharge, as determined by patient interview, review of electronic medical records from VUMC, and review of outside hospital records.
Main Exposures: Numeracy, Health Literacy, and Cognitive Impairment
Numeracy was assessed with a 3-item version of the Subjective Numeracy Scale (SNS-3), which quantifies the patients perceived quantitative abilities.20 Other authors have shown that the SNS-3 has a correlation coefficient of 0.88 with the full-length SNS-8 and a Cronbach’s alpha of 0.78.20-22 The SNS-3 is reported as the mean on a scale from 1 to 6, with higher scores reflecting higher numeracy.
Subjective health literacy was assessed by using the 3-item Brief Health Literacy Screen (BHLS).23 Scores range from 3 to 15, with higher scores reflecting higher literacy. Objective health literacy was assessed with the short form of the Test of Functional Health Literacy in Adults (sTOFHLA).24,25 Scores may be categorized as inadequate (0-16), marginal (17-22), or adequate (23-36).
We assessed cognition by using the 10-item Short Portable Mental Status Questionnaire (SPMSQ).26 The SPMSQ, which describes a person’s capacity for memory, structured thought, and orientation, has been validated and has demonstrated good reliability and validity.27 Scores of 0 were considered to reflect intact cognition, and scores of 1 or more were considered to reflect any cognitive impairment, a scoring approach employed by other authors.28 We used this approach, rather than the traditional scoring system developed by Pfeiffer et al.26 (1975), because it would be the most sensitive to detect any cognitive impairment in the VICS cohort, which excluded those with severe cognition impairment, dementia, and delirium.
Covariates
During the hospitalization, participants completed an in-person interviewer-administered baseline assessment composed of demographic information, including age, self-reported race (white and nonwhite), educational attainment, home status (married, not married and living with someone, not married and living alone), and household income.
Clinical and diagnostic characteristics abstracted from the medical record included a medical history of HF, HF subtype (classified by left ventricular ejection fraction [LVEF]), coronary artery disease, chronic obstructive pulmonary disease (COPD), diabetes mellitus (DM), and comorbidity burden as summarized by the van Walraven-Elixhauser score.29,30 Depressive symptoms were assessed during the 2 weeks prior to the hospitalization by using the first 8 items of the Patient Health Questionnaire.31 Scores ranged from 0 to 24, with higher scores reflecting more severe depressive symptoms. Laboratory values included estimated glomerular filtration rate (eGFR), hemoglobin (g/dl), sodium (mg/L), and brain natriuretic peptide (BNP) (pg/ml) from the last laboratory draw before discharge. Smoking status was also assessed (current and former/nonsmokers).
Hospitalization characteristics included length of stay in days, number of prior admissions in the last year, and transfer to the intensive care unit during the index admission.
Statistical Analysis
Descriptive statistics were used to summarize patient characteristics. The Kruskal-Wallis test and the Pearson χ2 test were used to determine the association between patient characteristics and levels of numeracy, literacy, and cognition separately. The unadjusted relationship between patient characteristics and 30-day readmission was assessed by using Wilcoxon rank sums tests for continuous variables and Pearson χ2 tests for categorical variables. In addition, a correlation matrix was performed to assess the correlations between numeracy, health literacy, and cognition (supplementary Figure 1).
To examine the association between numeracy, health literacy, and cognition and 30-day readmissions, a series of multivariable Poisson (log-linear) regression models were fit.32 Like other studies, numeracy, health literacy, and cognition were examined as categorical and continuous measures in models.33 Each model was modified with a sandwich estimator for robust standard errors. Log-linear models were chosen over logistic regression models for ease of interpretation because (exponentiated) parameters correspond to risk ratios (RRs) as opposed to odds ratios. Furthermore, the fitting challenges associated with log-linear models when predicted probabilities are near 0 or 1 were not present in these analyses. Redundancy analyses were conducted to ensure that independent variables were not highly correlated with a linear combination of the other independent variables. To avoid case-wise deletion of records with missing covariates, we employed multiple imputation with 10 imputation samples by using predictive mean matching.34,35 All analyses were conducted in R version 3.1.2 (The R Foundation, Vienna, Austria).36
RESULTS
Overall, 883 patients were included in this analysis (supplementary Figure 2). Of the 883 participants, 46% were female and 76% were white (Table 1). Their median age was 60 years (interdecile range [IDR] 39-78) and the median educational attainment was 13.5 years (IDR 11-18).
DISCUSSION
This is the first study to examine the effect of numeracy alongside literacy and cognition on 30-day readmission risk among patients hospitalized with ADHF. Overall, we found that 33.9% of participants had inadequate numeracy skills, and 24.6% had inadequate or marginal health literacy. In unadjusted and adjusted models, numeracy was not associated with 30-day readmission. Although (objective) low health literacy was associated with 30-day readmission in unadjusted models, it was not in adjusted models. Additionally, though 53% of participants had any cognitive impairment, readmission did not differ significantly by this factor. Taken together, these findings suggest that other factors may be greater determinants of 30-day readmissions among patients hospitalized for ADHF.
Only 1 other study has examined the effect of numeracy on readmission risk among patients hospitalized for HF. In this multicenter prospective study, McNaughton et al.37 found low numeracy to be associated with higher odds of recidivism to the emergency department (ED) or hospital within 30 days. Our findings may differ from theirs for a few reasons. First, their study had a significantly higher percentage of individuals with low numeracy (55%) compared with ours (33.9%). This may be because they did not exclude individuals with severe cognitive impairment, and their patient population was of lower socioeconomic status (SES) than ours. Low SES is associated with higher 30-day readmissions among HF patients1,10 throughout the literature, and low numeracy is associated with low SES in other diseases.13,38,39 Finally, they studied recidivism, which was defined as any unplanned return to the ED or hospital within 30 days of the index ED visit for acute HF. We only focused on 30-day readmissions, which also may explain why our results differed.
We found that health literacy was not associated with 30-day readmissions, which is consistent with the literature. Although an association between health literacy and mortality exists among adults with HF, several studies have not found an association between health literacy and 30- and 90-day readmission among adults hospitalized for HF.8,9,40 Although we found an association between objective health literacy and 30-day readmission in unadjusted analyses, we did not find one in the multivariable model. This, along with our numeracy finding, suggests that numeracy and literacy may not be driving the 30-day readmission risk among patients hospitalized with ADHF.
We examined cognition alongside numeracy and literacy because it is a prevalent condition among HF patients and because it is associated with adverse outcomes among patients with HF, including readmission.41,42 Studies have shown that HF preferentially affects certain cognitive domains,43 some of which are vital to HF self-care activities. We found that 53% of patients had any cognitive impairment, which is consistent with the literature of adults hospitalized for ADHF.44,45 Cognitive impairment was not, however, associated with 30-day readmissions. There may be a couple reasons for this. First, we measured cognitive impairment with the SPMSQ, which, although widely used and well-validated, does not assess executive function, the domain most commonly affected in HF patients with cognitive impairment.46 Second, patients with severe cognitive impairment and those with delirium were excluded from this study, which may have limited our ability to detect differences in readmission by this factor.
As in prior studies, we found that a history of DM and more hospitalizations in the prior year were independently associated with 30-day readmissions in fully adjusted models. Like other studies, in adjusted models, we found that LVEF and a history of HF were not independently associated with 30-day readmission.47-49 This, however, is not surprising because recent studies have shown that, although HF patients are at risk for multiple hospitalizations, early readmission after a hospitalization for ADHF specifically is often because of reasons unrelated to HF or a non-cardiovascular cause in general.50,51
Although a negative study, several important themes emerged. First, while we were able to assess numeracy, health literacy, and cognition, none of these measures were HF-specific. It is possible that we did not see an effect on readmission because our instruments failed to assess domains specific to HF, such as monitoring weight changes, following a low-salt diet, and interpreting blood pressure. Currently, however, no HF-specific objective numeracy measure exists. With respect to health literacy, only 1 HF-specific measure exists,52 although it was only recently developed and validated. Second, while numeracy may not be a driving influence of all-cause 30-day readmissions, it may be associated with other health behaviors and quality metrics that we did not examine here, such as self-care, medication adherence, and HF-specific readmissions. Third, it is likely that the progression of HF itself, as well as the clinical management of patients following discharge, contribute significantly to 30-day readmissions. Increased attention to predischarge processes for HF patients occurred at VUMC during the study period; close follow-up and evidence-directed therapies may have mitigated some of the expected associations. Finally, we were not able to assess numeracy of participants’ primary caregivers who may help patients at home, especially postdischarge. Though a number of studies have examined the role of family caregivers in the management of HF,53,54 none have examined numeracy levels of caregivers in the context of HF, and this may be worth doing in future studies.
Overall, our study has several strengths. The size of the cohort is large and there were high response rates during the follow-up period. Unlike other HF readmission studies, VICS accounts for readmissions to outside hospitals. Approximately 35% of all hospitalizations in VICS are to outside facilities. Thus, the ascertainment of readmissions to hospitals other than Vanderbilt is more comprehensive than if readmissions to VUMC were only considered. We were able to include a number of clinical comorbidities, laboratory and diagnostic tests from the index admission, and hospitalization characteristics in our analyses. Finally, we performed additional analyses to investigate the correlation between numeracy, literacy, and cognition; ultimately, we found that the majority of these correlations were weak, which supports our ability to study them simultaneously among VICS participants.
Nonetheless, we note some limitations. Although we captured readmissions to outside hospitals, the study took place at a single referral center in Tennessee. Though patients were diverse in age and comorbidities, they were mostly white and of higher SES. Finally, we used home status as a proxy for social support, which may underestimate the support that home care workers provide.
In conclusion, in this prospective longitudinal study of adults hospitalized with ADHF, inadequate numeracy was present in more than a third of patients, and low health literacy was present in roughly a quarter of patients. Neither numeracy nor health literacy, however, were associated with 30-day readmissions in adjusted analyses. Any cognitive impairment, although present in roughly one-half of patients, was not associated with 30-day readmission either. Our findings suggest that other influences may play a more dominant role in determining 30-day readmission rates in patients hospitalized for ADHF than inadequate numeracy, low health literacy, or cognitive impairment as assessed here.
Acknowledgments
This research was supported by the National Heart, Lung, and Blood Institute (R01 HL109388) and in part by the National Center for Advancing Translational Sciences (UL1 TR000445-06). The content is solely the responsibility of the authors and does not necessarily represent official views of the National Institutes of Health. The authors’ funding sources did not participate in the planning, collection, analysis, or interpretation of data or in the decision to submit for publication. Dr. Sterling is supported by T32HS000066 from the Agency for Healthcare Research and Quality. The content is solely the responsibility of the authors and does not necessarily represent the official views of the Agency for Healthcare Research and Quality. Dr. Mixon has a VA Health Services Research and Development Service Career Development Award at the Tennessee Valley Healthcare System, Department of Veterans Affairs (CDA 12-168). This material was presented at the Society of General Internal Medicine Annual Meeting on April 20, 2017, in Washington, DC.
Disclosure
Dr. Kripalani reports personal fees from Verustat, personal fees from SAI Interactive, and equity from Bioscape Digital, all outside of the submitted work. Dr. Rothman and Dr. Wallston report personal fees from EdLogics outside of the submitted work. All of the other authors have nothing to disclose
1. Ross JS, Mulvey GK, Stauffer B, et al. Statistical models and patient predictors of readmission for heart failure: a systematic review. Arch of Intern Med. 2008;168(13):1371-1386. PubMed
33. Bohannon AD, Fillenbaum GG, Pieper CF, Hanlon JT, Blazer DG. Relationship of race/ethnicity and blood pressure to change in cognitive function. J Am Geriatr Soc. 2002;50(3):424-429. PubMed
38. Abdel-Kader K, Dew MA, Bhatnagar M, et al. Numeracy Skills in CKD: Correlates and Outcomes. Clin J Am Soc Nephrol. 2010;5(9):1566-1573. PubMed
© 2018 Society of Hospital Medicine
Shared Decision-Making During Inpatient Rounds: Opportunities for Improvement in Patient Engagement and Communication
The ethos of medicine has shifted from paternalistic, physician-driven care to patient autonomy and engagement, in which the physician shares information and advises.1-3 Although there are ethical, legal, and practical reasons to respect patient preferences,1-4 patient engagement also fosters quality and safety5 and may improve clinical outcomes.5-8 Patients whose preferences are respected are more likely to trust their doctor, feel empowered, and adhere to treatments.9
Providers may partner with patients through shared decision-making (SDM).10,11 Several SDM models describe the process of providers and patients balancing evidence, preferences and context to arrive at a clinical decision.12-15 The National Academy of Medicine and the American Academy of Pediatrics has called for more SDM,16,17 including when clinical evidence is limited,2 equally beneficial options exist,18 clinical stakes are high,19 and even with deferential patients.20 Despite its value, SDM does not reliably occur21,22 and SDM training is often unavailable.4 Clinical decision tools, patient education aids, and various training interventions have shown promising, although inconsistent results.23, 24
Little is known about SDM in inpatient settings where unique patient, clinician, and environmental factors may influence SDM. This study describes the quality and possible predictors of inpatient SDM during attending rounds in 4 academic training settings. Although SDM may occur anytime during a hospitalization, attending rounds present a valuable opportunity for SDM observation given their centrality to inpatient care and teaching.25,26 Because attending physicians bear ultimate responsibility for patient management, we examined whether SDM performance varies among attendings within each service. In addition, we tested the hypothesis that service-level, team-level, and patient-level features explain variation in SDM quality more than individual attending physicians. Finally, we compared peer-observer perspectives of SDM behaviors with patient and/or guardian perspectives.
METHODS
Study Design and Setting
This cross-sectional, observational study examined the diversity of SDM practice within and between 4 inpatient services during attending rounds, including the internal medicine and pediatrics services at Stanford University and the University of California, San Francisco (UCSF). Both institutions provide quaternary care to diverse patient populations with approximately half enrolled in Medicare and/or Medicaid.
One institution had 42 internal medicine (Med-1) and 15 pediatric hospitalists (Peds-1) compared to 8 internal medicine (Med-2) and 12 pediatric hospitalists (Peds-2) at the second location. Both pediatric services used family-centered rounds that included discussions between the patients’ families and the whole team. One medicine service used a similar rounding model that did not necessarily involve the patients’ families. In contrast, the smaller medicine service typically began rounds by discussing all patients in a conference room and then visiting select patients afterwards.
From August 2014 to November 2014, peer observers gathered data on team SDM behaviors during attending rounds. After the rounding team departed, nonphysician interviewers surveyed consenting patients’ (or guardians’) views of the SDM experience, yielding paired evaluations for a subset of SDM encounters. Institutional review board approval was obtained from Stanford University and UCSF.
Participants and Inclusion Criteria
Attending physicians were hospitalists who supervised rounds at least 1 month per year, and did not include those conducting the study. All provided verbal assent to be observed on 3 days within a 7-day period. While team composition varied as needed (eg, to include the nurse, pharmacist, interpreter, etc), we restricted study observations to those teams with an attending and at least one learner (eg, resident, intern, medical student) to capture the influence of attending physicians in their training role. Because services vary in number of attendings on staff, rounds assigned per attending, and patients per round, it was not possible to enroll equal sample sizes per service in the study.
Nonintensive care unit patients who were deemed medically stable by the team were eligible for peer observation and participation in a subsequent patient interview once during the study period. Pediatric patients were invited for an interview if they were between 13 and 21 years old and had the option of having a parent or guardian present; if the pediatric patients were less than 13 years old or they were not interested in being interviewed, then their parents or guardians were invited to be interviewed. Interpreters were on rounds, and thus, non-English participants were able to participate in the peer observations, but could not participate in patient interviews because interpreters were not available during afternoons for study purposes. Consent was obtained from all participating patients and/or guardians.
Data Collection
Round and Patient Characteristics
Peer observers recorded rounding, team, and patient characteristics using a standardized form. Rounding data included date, attending name, duration of rounds, and patient census. Patient level data included the decision(s) discussed, the seniority of the clinician leading the discussion, team composition, minutes spent discussing the patient (both with the patient and/or guardian and total time), hospitalization week, and patient’s primary language. Additional patient data obtained from electronic health records included age, gender, race, ethnicity, date of admission, and admitting diagnosis.
SDM Measures
Peer-observed SDM behaviors were quantified per patient encounter using the 9-item Rochester Participatory Decision-Making Scale (RPAD), with credit given for SDM behaviors exhibited by anyone on the rounding team (team-level metric).27 Each item was scored on a 3-point scale (0 = absent, 0.5 = partial, and 1 = present) for a maximum of 9 points, with higher scores indicating higher-quality SDM (Peer-RPAD Score). We created semistructured patient interview guides by adapting each RPAD item into layperson language (Patient-RPAD Score) and adding open-ended questions to assess the patient experience.
Peer-Observer Training
Eight peer-observers (7 hospitalists and 1 palliative care physician) were trained to perform RPAD ratings using videos of patient encounters. Initially, raters viewed videos together and discussed ratings for each RPAD item. The observers incorporated behavioral anchors and clinical examples into the development of an RPAD rating guide, which they subsequently used to independently score 4 videos from an online medical communication library.28 These scores were discussed to resolve any differences before 4 additional videos were independently viewed, scored, and compared. Interrater reliability was achieved when the standard deviation of summed SDM scores across raters was less than 1 for all 4 videos.
Patient Interviewers
Interviewers were English-speaking volunteers without formal medical training. They were educated in hospital etiquette by a physician and in administering patient interviews through peer-to-peer role playing and an observation and feedback interview with at least 1 patient.
Data Analysis
The analysis set included every unique patient with whom a medical decision was made by an eligible clinical team. To account for the nested study design (patient-level scores within rounds, rounds within attending, and attendings within service), we used mixed-effects models to estimate mean (summary or item) RPAD score by levels of fixed covariate(s). The models included random effects accounting for attending-level and round-level correlations among scores via variance components, and allowing the attending-level random effect to differ by service. Analyses were performed using SAS version 9.4 (SAS Institute Inc, Cary, NC). We used descriptive statistics to summarize round- and patient-level characteristics.
SDM Variation by Attending and Service
Box plots were used to summarize raw patient-level, Peer-RPAD scores by service and attending. By using the methods described above, we estimated the mean score overall and by service. In both models, we examined the statistical significance of service-specific variation in attending-level random effects by using likelihood-ratio test (LRT) to compare models.
SDM Variation by Round and Patient Characteristics
We used the models described above to identify covariates associated with Peer-RPAD scores. We fit univariate models separately for each covariate, then fit 2 multivariable models, including (1) all covariates and (2) all effects significant in either model at P ≤ .20 according to F tests. For uniformity of presentation, we express continuous covariates categorically; however, we report P values based on continuous versions. Means generated by the multivariable models were calculated at the mean values of all other covariates in model.
Patient-Level RPAD Data
A subsample of patients completed semistructured interviews with analogous RPAD questions. To identify possible selection bias in the full sample, we summarized response rates by service and patient language and modeled Peer-RPAD scores by interview response status. Among responders, we estimated the mean Peer-RPAD and Patient-RPAD scores and their paired differences and correlations, testing for non-zero correlations via the Spearman rank test.
RESULTS
All Patient Encounters
![]()
The median duration of rounding sessions was 1.8 hours, median patient census was 9, and median patient encounter was 13 minutes. The duration of rounds and minutes per patient were longest at Med-2 and shortest at Peds-1. See Table 1 for other team characteristics.
Peer Evaluations of SDM Encounters
Characteristics of Patients
![]()
Teams spent a median of 13 minutes per SDM encounter, which was not higher than the round median. SDM topics discussed included 47% treatment, 15% diagnostic, 30% both treatment and diagnostic, and 7% other.
Variation in SDM Quality Among Attending Physicians
Overall Peer-RPAD Scores were normally distributed. After adjusting for the nested study design, the overall mean (standard error) score was 4.16 (0.11). Score variability among attendings differed significantly by service (LRT P = .0067). For example, raw scores were lower and more variable among attending physicians at Med-2 than other among attendings in other services (see Appendix Figure in Supporting Information). However, when service was included in the model as a fixed effect, mean scores varied significantly, from 3.0 at Med-2 to 4.7 at Med-1 (P < .0001), but the random variation among attendings no longer differed significantly by service (P = .13). This finding supports the hypothesis that service-level influences are stronger than influences of individual attending physicians, that is, that variation between services exceeded variation among attendings within service.
Aspects of SDM That Are More Prevalent on Rounds
![]()
Rounds and Patient Characteristics Associated With Peer-RPAD Scores
![]()
Patient-RPAD Results: Dissimilar Perspectives of Patients and/or Guardians and Physician Observers
![]()
Among responders, mean Patient-RPAD scores were 6.8 to 7.1 for medicine services and 7.6 to 7.8 for pediatric services (P = .01). The overall mean Patient-RPAD score, 7.46, was significantly greater than the paired Peer-RPAD score by 3.5 (P = .011); however, correlations were not statistically significantly different from 0 (by service, each P > .12).
To understand drivers of the differences between Peer-RPAD and Patient-RPAD scores, we analyzed findings by item. Each mean patient-item score exceeded its peer counterpart (P ≤ .01; panel B of Figure). Peer-item scores fell below 33% on 2 items (Items 9 and 4) and only exceeded 67% on 2 items (Items 1 and 6), whereas patient-item scores ranged from 60% (Item 8) to 97% (Item 7). Three paired differences exceeded 50% (Items 9, 4, and 7) and 3 were below 20% (Items 6, 8 and 1), underlying the lack of correlation between peer and patient scores.
DISCUSSION
In this multisite study of SDM during inpatient attending rounds, SDM quality, specific SDM behaviors, and factors contributing to SDM were identified. Our study found an adjusted overall Peer-RPAD Score of 4.4 out of 9, and found the following 3 SDM elements most needing improvement according to trained peer observers: (1) “Checking understanding of the patient’s perspective”, (2) “Examining barriers to follow-through with the treatment plan”, and (3) “Asking if the patient has questions.” Areas of strength included explaining the clinical issue or nature of the decision and matching medical language to the patient’s level of understanding, with each rated highly by both peer-observers and patients. Broadly speaking, physicians were skillful in delivering information to patients but failed to solicit input from patients. Characteristics associated with increased SDM in the multivariate analysis included the following: service, patient gender, timing of rounds during patient’s hospital stay, and amount of time rounding with each patient.
Patients similarly found that physicians could improve their abilities to elicit information from patients and families, noting the 3 lowest patient-rated SDM elements were as follows: (1) asking open-ended questions, (2) discussing alternatives or uncertainties, and (3) discussing barriers to treatment plan follow through. Overall, patients and guardians perceived the quantity and quality of SDM on rounds more favorably than peer observers, which is consistent with other studies of patient perceptions of communication. 29-31 It is possible that patient ratings are more influenced by demand characteristics, fear of negatively impacting their patient-provider relationships, and conflation of overall satisfaction with quality of communication.32 This difference in patient perception of SDM is worthy of further study.
Prior work has revealed that SDM may occur infrequently during inpatient rounds.11 This study further elucidates specific SDM behaviors used along with univariate and multivariate modeling to explore possible contributing factors. The strengths and weaknesses found were similar at all 4 services and the influence of the service was more important than variability across attendings. This study’s findings are similar to a study by Shields et al.,33 in which the findings in a geographically different outpatient setting 10 years earlier suggesting global and enduring challenges to SDM. To our knowledge, this is the first published study to characterize inpatient SDM behaviors and may serve as the basis for future interventions.
Although the item-level components were ranked similarly across services, on average the summary Peer-RPAD score was lowest at Med-2, where we observed high variability within and between attendings, and was highest at Med-1, where variability was low. Med-2 carried the highest caseload and held the longest rounds, while Med-1 carried the lowest caseload, suggesting that modifiable burdens may hamper SDM performance. Prior studies suggest that patients are often selected based on teaching opportunities, immediate medical need and being newly admitted.34 The high scores at Med-1 may reflect that service’s prediscussion of patients during card-flipping rounds or their selection of which patients to round on as a team. Consistent with prior studies29,35 of SDM and the family-centered rounding model, which includes the involvement of nurses, respiratory therapists, pharmacists, case managers, social workers, and interpreters on rounds, both pediatrics services showed higher SDM scores.
In contrast to prior studies,34,36 team size and number of learners did not affect SDM performance, nor did decision type. Despite teams having up to 17 members, 8 learners, and 14 complex patients, SDM scores did not vary significantly by team. Nonetheless, trends were in the directions expected: Scores tended to decrease as the team size or the percentage of trainees grew, and increased with the seniority of the presenting physician. Interestingly, SDM performance decreased with round-average minutes per patient, which may be measuring on-going intensity across cases that leads to exhaustion. Statistically significant patient factors for increased SDM included longer duration of patient encounters, second week of hospital stay, and female patient gender. Although we anticipated that the high number of decisions made early in hospitalization would facilitate higher SDM scores, continuity and stronger patient-provider relationships may enhance SDM.36 We report service-specific team and patient characteristics, in addition to SDM findings in anticipation that some readers will identify with 1 service more than others.
This study has several important limitations. First, our peer observers were not blinded and primarily observed encounters at their own site. To minimize bias, observers periodically rated videos to recalibrate RPAD scoring. Second, additional SDM conversations with a patient and/or guardian may have occurred outside of rounds and were not captured, and poor patient recall may have affected Patient-RPAD scores despite interviewer prompts and timeliness of interviews within 12 hours of rounds. Third, there might have been a selection bias for the one service who selected a smaller number of patients to see, compared with the three other services that performed bedside rounds on all patients. It is possible that attending physicians selected patients who were deemed most able to have SDM conversations, thus affecting RPAD scores on that service. Fourth, study services had fewer patients on average than other academic hospitals (median 9, range 3-14), which might limit its generalizability. Last, as in any observational study, there is always the possibility of the Hawthorne effect. However, neither teams nor patients knew the study objectives.
Nevertheless, important findings emerged through the use of RPAD Scores to evaluate inpatient SDM practices. In particular, we found that to increase SDM quality in inpatient settings, practitioners should (1) check their understanding of the patient’s perspective, (2) examine barriers to follow-through with the treatment plan, and (3) ask if the patient has questions. Variation among services remained very influential after adjusting for team and patient characteristics, which suggests that “climate” or service culture should be targeted by an intervention, rather than individual attendings or subgroups defined by team or patient characteristics. Notably, team size, number of learners, patient census, and type of decision being made did not affect SDM performance, suggesting that even large, busy services can perform SDM if properly trained.
Acknowledgments
The authors thank the patients, families, pediatric and internal medicine residents, and hospitalists at Stanford School of Medicine and University of California, San Francisco School of Medicine for their participation in this study. We would also like to thank the student volunteers who collected patient perspectives on the encounters.
Disclosure
The author(s) declared no potential conflicts of interest with respect to the research, authorship, and/or publication of this article. The author(s) disclosed receipt of the following financial support for the research, authorship, and/or publication of this article: This study was supported by an NIH/NCCIH grant R25 AT006573.
1. Braddock CH. The emerging importance and relevance of shared decision making to clinical practice. Med Decis Mak. 2010;30(5 Suppl):5S-7S. doi:10.1177/0272989X10381344. PubMed
2. Braddock CH. Supporting shared decision making when clinical evidence is low. Med Care Res Rev MCRR. 2013;70(1 Suppl):129S-140S. doi:10.1177/1077558712460280. PubMed
3. Elwyn G, Tilburt J, Montori V. The ethical imperative for shared decision-making. Eur J Pers Centered Healthc. 2013;1(1):129-131. doi:10.5750/ejpch.v1i1.645.
4. Stiggelbout AM, Pieterse AH, De Haes JCJM. Shared decision making: Concepts, evidence, and practice. Patient Educ Couns. 2015;98(10):1172-1179. doi:10.1016/j.pec.2015.06.022. PubMed
5. Stacey D, Légaré F, Col NF, et al. Decision aids for people facing health treatment or screening decisions. Cochrane Database Syst Rev. 2014;(10):CD001431. doi:10.1002/14651858.CD001431.pub4. PubMed
6. Wilson SR, Strub P, Buist AS, et al. Shared treatment decision making improves adherence and outcomes in poorly controlled asthma. Am J Respir Crit Care Med. 2010;181(6):566-577. doi:10.1164/rccm.200906-0907OC. PubMed
7. Parchman ML, Zeber JE, Palmer RF. Participatory decision making, patient activation, medication adherence, and intermediate clinical outcomes in type 2 diabetes: a STARNet study. Ann Fam Med. 2010;8(5):410-417. doi:10.1370/afm.1161. PubMed
8. Weiner SJ, Schwartz A, Sharma G, et al. Patient-centered decision making and health care outcomes: an observational study. Ann Intern Med. 2013;158(8):573-579. doi:10.7326/0003-4819-158-8-201304160-00001. PubMed
9. Butterworth JE, Campbell JL. Older patients and their GPs: shared decision making in enhancing trust. Br J Gen Pract. 2014;64(628):e709-e718. doi:10.3399/bjgp14X682297. PubMed
10. Barry MJ, Edgman-Levitan S. Shared decision making--pinnacle of patient-centered care. N Engl J Med. 2012;366(9):780-781. doi:10.1056/NEJMp1109283. PubMed
11. Satterfield JM, Bereknyei S, Hilton JF, et al. The prevalence of social and behavioral topics and related educational opportunities during attending rounds. Acad Med J Assoc Am Med Coll. 2014;89(11):1548-1557. doi:10.1097/ACM.0000000000000483. PubMed
12. Charles C, Gafni A, Whelan T. Shared decision-making in the medical encounter: what does it mean? (or it takes at least two to tango). Soc Sci Med. 1997;44(5):681-692. PubMed
13. Elwyn G, Frosch D, Thomson R, et al. Shared decision making: a model for clinical practice. J Gen Intern Med. 2012;27(10):1361-1367. doi:10.1007/s11606-012-2077-6. PubMed
14. Légaré F, St-Jacques S, Gagnon S, et al. Prenatal screening for Down syndrome: a survey of willingness in women and family physicians to engage in shared decision-making. Prenat Diagn. 2011;31(4):319-326. doi:10.1002/pd.2624. PubMed
15. Satterfield JM, Spring B, Brownson RC, et al. Toward a Transdisciplinary Model of Evidence-Based Practice. Milbank Q. 2009;87(2):368-390. PubMed
16. National Academy of Medicine. Crossing the quality chasm: a new health system for the 21st century. https://www.nationalacademies.org/hmd/~/media/Files/Report%20Files/2001/Crossing-the-Quality-Chasm/Quality%20Chasm%202001%20%20report%20brief.pdf. Accessed on November 30, 2016.
17. Adams RC, Levy SE, Council on Children with Disabilities. Shared Decision-Making and Children with Disabilities: Pathways to Consensus. Pediatrics. 2017; 139(6):1-9. PubMed
18. Müller-Engelmann M, Keller H, Donner-Banzhoff N, Krones T. Shared decision making in medicine: The influence of situational treatment factors. Patient Educ Couns. 2011;82(2):240-246. doi:10.1016/j.pec.2010.04.028. PubMed
19. Whitney SN. A New Model of Medical Decisions: Exploring the Limits of Shared Decision Making. Med Decis Making. 2003;23(4):275-280. doi:10.1177/0272989X03256006. PubMed
20. Kehl KL, Landrum MB, Arora NK, et al. Association of Actual and Preferred Decision Roles With Patient-Reported Quality of Care: Shared Decision Making in Cancer Care. JAMA Oncol. 2015;1(1):50-58. doi:10.1001/jamaoncol.2014.112. PubMed
21. Couët N, Desroches S, Robitaille H, et al. Assessments of the extent to which health-care providers involve patients in decision making: a systematic review of studies using the OPTION instrument. Health Expect Int J Public Particip Health Care Health Policy. 2015;18(4):542-561. doi:10.1111/hex.12054. PubMed
22. Fowler FJ, Gerstein BS, Barry MJ. How patient centered are medical decisions?: Results of a national survey. JAMA Intern Med. 2013;173(13):1215-1221. doi:10.1001/jamainternmed.2013.6172. PubMed
23. Légaré F, Stacey D, Turcotte S, et al. Interventions for improving the adoption of shared decision making by healthcare professionals. Cochrane Database Syst Rev. 2014;(9):CD006732. doi:10.1002/14651858.CD006732.pub3. PubMed
24. Stacey D, Bennett CL, Barry MJ, et al. Decision aids for people facing health treatment or screening decisions. Cochrane Database Syst Rev. 2011;(10):CD001431. doi:10.1002/14651858.CD001431.pub3. PubMed
25. Di Francesco L, Pistoria MJ, Auerbach AD, Nardino RJ, Holmboe ES. Internal medicine training in the inpatient setting. A review of published educational interventions. J Gen Intern Med. 2005;20(12):1173-1180. doi:10.1111/j.1525-1497.2005.00250.x. PubMed
26. Janicik RW, Fletcher KE. Teaching at the bedside: a new model. Med Teach. 2003;25(2):127-130. PubMed
27. Shields CG, Franks P, Fiscella K, Meldrum S, Epstein RM. Rochester Participatory Decision-Making Scale (RPAD): reliability and validity. Ann Fam Med. 2005;3(5):436-442. doi:10.1370/afm.305. PubMed
28. DocCom - enhancing competence in healthcare communication. https://webcampus.drexelmed.edu/doccom/user/. Accessed on November 30, 2016.
29. Bailey SM, Hendricks-Muñoz KD, Mally P. Parental influence on clinical management during neonatal intensive care: a survey of US neonatologists. J Matern Fetal Neonatal Med. 2013;26(12):1239-1244. doi:10.3109/14767058.2013.776531. PubMed
30. Janz NK, Wren PA, Copeland LA, Lowery JC, Goldfarb SL, Wilkins EG. Patient-physician concordance: preferences, perceptions, and factors influencing the breast cancer surgical decision. J Clin Oncol. 2004;22(15):3091-3098. doi:10.1200/JCO.2004.09.069. PubMed
31. Schoenborn NL, Cayea D, McNabney M, Ray A, Boyd C. Prognosis communication with older patients with multimorbidity: Assessment after an educational intervention. Gerontol Geriatr Educ. 2016;38(4):471-481. doi:10.1080/02701960.2015.1115983. PubMed
32. Lipkin M. Shared decision making. JAMA Intern Med. 2013;173(13):1204-1205. doi:10.1001/jamainternmed.2013.6248. PubMed
33. Gonzalo JD, Heist BS, Duffy BL, et al. The art of bedside rounds: a multi-center qualitative study of strategies used by experienced bedside teachers. J Gen Intern Med. 2013;28(3):412-420. doi:10.1007/s11606-012-2259-2. PubMed
34. Rosen P, Stenger E, Bochkoris M, Hannon MJ, Kwoh CK. Family-centered multidisciplinary rounds enhance the team approach in pediatrics. Pediatrics. 2009;123(4):e603-e608. doi:10.1542/peds.2008-2238. PubMed
35. Harrison R, Allen E. Teaching internal medicine residents in the new era. Inpatient attending with duty-hour regulations. J Gen Intern Med. 2006;21(5):447-452. doi:10.1111/j.1525-1497.2006.00425.x. PubMed
36. Smith SK, Dixon A, Trevena L, Nutbeam D, McCaffery KJ. Exploring patient involvement in healthcare decision making across different education and functional health literacy groups. Soc Sci Med 1982. 2009;69(12):1805-1812. doi:10.1016/j.socscimed.2009.09.056. PubMed
The ethos of medicine has shifted from paternalistic, physician-driven care to patient autonomy and engagement, in which the physician shares information and advises.1-3 Although there are ethical, legal, and practical reasons to respect patient preferences,1-4 patient engagement also fosters quality and safety5 and may improve clinical outcomes.5-8 Patients whose preferences are respected are more likely to trust their doctor, feel empowered, and adhere to treatments.9
Providers may partner with patients through shared decision-making (SDM).10,11 Several SDM models describe the process of providers and patients balancing evidence, preferences and context to arrive at a clinical decision.12-15 The National Academy of Medicine and the American Academy of Pediatrics has called for more SDM,16,17 including when clinical evidence is limited,2 equally beneficial options exist,18 clinical stakes are high,19 and even with deferential patients.20 Despite its value, SDM does not reliably occur21,22 and SDM training is often unavailable.4 Clinical decision tools, patient education aids, and various training interventions have shown promising, although inconsistent results.23, 24
Little is known about SDM in inpatient settings where unique patient, clinician, and environmental factors may influence SDM. This study describes the quality and possible predictors of inpatient SDM during attending rounds in 4 academic training settings. Although SDM may occur anytime during a hospitalization, attending rounds present a valuable opportunity for SDM observation given their centrality to inpatient care and teaching.25,26 Because attending physicians bear ultimate responsibility for patient management, we examined whether SDM performance varies among attendings within each service. In addition, we tested the hypothesis that service-level, team-level, and patient-level features explain variation in SDM quality more than individual attending physicians. Finally, we compared peer-observer perspectives of SDM behaviors with patient and/or guardian perspectives.
METHODS
Study Design and Setting
This cross-sectional, observational study examined the diversity of SDM practice within and between 4 inpatient services during attending rounds, including the internal medicine and pediatrics services at Stanford University and the University of California, San Francisco (UCSF). Both institutions provide quaternary care to diverse patient populations with approximately half enrolled in Medicare and/or Medicaid.
One institution had 42 internal medicine (Med-1) and 15 pediatric hospitalists (Peds-1) compared to 8 internal medicine (Med-2) and 12 pediatric hospitalists (Peds-2) at the second location. Both pediatric services used family-centered rounds that included discussions between the patients’ families and the whole team. One medicine service used a similar rounding model that did not necessarily involve the patients’ families. In contrast, the smaller medicine service typically began rounds by discussing all patients in a conference room and then visiting select patients afterwards.
From August 2014 to November 2014, peer observers gathered data on team SDM behaviors during attending rounds. After the rounding team departed, nonphysician interviewers surveyed consenting patients’ (or guardians’) views of the SDM experience, yielding paired evaluations for a subset of SDM encounters. Institutional review board approval was obtained from Stanford University and UCSF.
Participants and Inclusion Criteria
Attending physicians were hospitalists who supervised rounds at least 1 month per year, and did not include those conducting the study. All provided verbal assent to be observed on 3 days within a 7-day period. While team composition varied as needed (eg, to include the nurse, pharmacist, interpreter, etc), we restricted study observations to those teams with an attending and at least one learner (eg, resident, intern, medical student) to capture the influence of attending physicians in their training role. Because services vary in number of attendings on staff, rounds assigned per attending, and patients per round, it was not possible to enroll equal sample sizes per service in the study.
Nonintensive care unit patients who were deemed medically stable by the team were eligible for peer observation and participation in a subsequent patient interview once during the study period. Pediatric patients were invited for an interview if they were between 13 and 21 years old and had the option of having a parent or guardian present; if the pediatric patients were less than 13 years old or they were not interested in being interviewed, then their parents or guardians were invited to be interviewed. Interpreters were on rounds, and thus, non-English participants were able to participate in the peer observations, but could not participate in patient interviews because interpreters were not available during afternoons for study purposes. Consent was obtained from all participating patients and/or guardians.
Data Collection
Round and Patient Characteristics
Peer observers recorded rounding, team, and patient characteristics using a standardized form. Rounding data included date, attending name, duration of rounds, and patient census. Patient level data included the decision(s) discussed, the seniority of the clinician leading the discussion, team composition, minutes spent discussing the patient (both with the patient and/or guardian and total time), hospitalization week, and patient’s primary language. Additional patient data obtained from electronic health records included age, gender, race, ethnicity, date of admission, and admitting diagnosis.
SDM Measures
Peer-observed SDM behaviors were quantified per patient encounter using the 9-item Rochester Participatory Decision-Making Scale (RPAD), with credit given for SDM behaviors exhibited by anyone on the rounding team (team-level metric).27 Each item was scored on a 3-point scale (0 = absent, 0.5 = partial, and 1 = present) for a maximum of 9 points, with higher scores indicating higher-quality SDM (Peer-RPAD Score). We created semistructured patient interview guides by adapting each RPAD item into layperson language (Patient-RPAD Score) and adding open-ended questions to assess the patient experience.
Peer-Observer Training
Eight peer-observers (7 hospitalists and 1 palliative care physician) were trained to perform RPAD ratings using videos of patient encounters. Initially, raters viewed videos together and discussed ratings for each RPAD item. The observers incorporated behavioral anchors and clinical examples into the development of an RPAD rating guide, which they subsequently used to independently score 4 videos from an online medical communication library.28 These scores were discussed to resolve any differences before 4 additional videos were independently viewed, scored, and compared. Interrater reliability was achieved when the standard deviation of summed SDM scores across raters was less than 1 for all 4 videos.
Patient Interviewers
Interviewers were English-speaking volunteers without formal medical training. They were educated in hospital etiquette by a physician and in administering patient interviews through peer-to-peer role playing and an observation and feedback interview with at least 1 patient.
Data Analysis
The analysis set included every unique patient with whom a medical decision was made by an eligible clinical team. To account for the nested study design (patient-level scores within rounds, rounds within attending, and attendings within service), we used mixed-effects models to estimate mean (summary or item) RPAD score by levels of fixed covariate(s). The models included random effects accounting for attending-level and round-level correlations among scores via variance components, and allowing the attending-level random effect to differ by service. Analyses were performed using SAS version 9.4 (SAS Institute Inc, Cary, NC). We used descriptive statistics to summarize round- and patient-level characteristics.
SDM Variation by Attending and Service
Box plots were used to summarize raw patient-level, Peer-RPAD scores by service and attending. By using the methods described above, we estimated the mean score overall and by service. In both models, we examined the statistical significance of service-specific variation in attending-level random effects by using likelihood-ratio test (LRT) to compare models.
SDM Variation by Round and Patient Characteristics
We used the models described above to identify covariates associated with Peer-RPAD scores. We fit univariate models separately for each covariate, then fit 2 multivariable models, including (1) all covariates and (2) all effects significant in either model at P ≤ .20 according to F tests. For uniformity of presentation, we express continuous covariates categorically; however, we report P values based on continuous versions. Means generated by the multivariable models were calculated at the mean values of all other covariates in model.
Patient-Level RPAD Data
A subsample of patients completed semistructured interviews with analogous RPAD questions. To identify possible selection bias in the full sample, we summarized response rates by service and patient language and modeled Peer-RPAD scores by interview response status. Among responders, we estimated the mean Peer-RPAD and Patient-RPAD scores and their paired differences and correlations, testing for non-zero correlations via the Spearman rank test.
RESULTS
All Patient Encounters
![]()
The median duration of rounding sessions was 1.8 hours, median patient census was 9, and median patient encounter was 13 minutes. The duration of rounds and minutes per patient were longest at Med-2 and shortest at Peds-1. See Table 1 for other team characteristics.
Peer Evaluations of SDM Encounters
Characteristics of Patients
![]()
Teams spent a median of 13 minutes per SDM encounter, which was not higher than the round median. SDM topics discussed included 47% treatment, 15% diagnostic, 30% both treatment and diagnostic, and 7% other.
Variation in SDM Quality Among Attending Physicians
Overall Peer-RPAD Scores were normally distributed. After adjusting for the nested study design, the overall mean (standard error) score was 4.16 (0.11). Score variability among attendings differed significantly by service (LRT P = .0067). For example, raw scores were lower and more variable among attending physicians at Med-2 than other among attendings in other services (see Appendix Figure in Supporting Information). However, when service was included in the model as a fixed effect, mean scores varied significantly, from 3.0 at Med-2 to 4.7 at Med-1 (P < .0001), but the random variation among attendings no longer differed significantly by service (P = .13). This finding supports the hypothesis that service-level influences are stronger than influences of individual attending physicians, that is, that variation between services exceeded variation among attendings within service.
Aspects of SDM That Are More Prevalent on Rounds
![]()
Rounds and Patient Characteristics Associated With Peer-RPAD Scores
![]()
Patient-RPAD Results: Dissimilar Perspectives of Patients and/or Guardians and Physician Observers
![]()
Among responders, mean Patient-RPAD scores were 6.8 to 7.1 for medicine services and 7.6 to 7.8 for pediatric services (P = .01). The overall mean Patient-RPAD score, 7.46, was significantly greater than the paired Peer-RPAD score by 3.5 (P = .011); however, correlations were not statistically significantly different from 0 (by service, each P > .12).
To understand drivers of the differences between Peer-RPAD and Patient-RPAD scores, we analyzed findings by item. Each mean patient-item score exceeded its peer counterpart (P ≤ .01; panel B of Figure). Peer-item scores fell below 33% on 2 items (Items 9 and 4) and only exceeded 67% on 2 items (Items 1 and 6), whereas patient-item scores ranged from 60% (Item 8) to 97% (Item 7). Three paired differences exceeded 50% (Items 9, 4, and 7) and 3 were below 20% (Items 6, 8 and 1), underlying the lack of correlation between peer and patient scores.
DISCUSSION
In this multisite study of SDM during inpatient attending rounds, SDM quality, specific SDM behaviors, and factors contributing to SDM were identified. Our study found an adjusted overall Peer-RPAD Score of 4.4 out of 9, and found the following 3 SDM elements most needing improvement according to trained peer observers: (1) “Checking understanding of the patient’s perspective”, (2) “Examining barriers to follow-through with the treatment plan”, and (3) “Asking if the patient has questions.” Areas of strength included explaining the clinical issue or nature of the decision and matching medical language to the patient’s level of understanding, with each rated highly by both peer-observers and patients. Broadly speaking, physicians were skillful in delivering information to patients but failed to solicit input from patients. Characteristics associated with increased SDM in the multivariate analysis included the following: service, patient gender, timing of rounds during patient’s hospital stay, and amount of time rounding with each patient.
Patients similarly found that physicians could improve their abilities to elicit information from patients and families, noting the 3 lowest patient-rated SDM elements were as follows: (1) asking open-ended questions, (2) discussing alternatives or uncertainties, and (3) discussing barriers to treatment plan follow through. Overall, patients and guardians perceived the quantity and quality of SDM on rounds more favorably than peer observers, which is consistent with other studies of patient perceptions of communication. 29-31 It is possible that patient ratings are more influenced by demand characteristics, fear of negatively impacting their patient-provider relationships, and conflation of overall satisfaction with quality of communication.32 This difference in patient perception of SDM is worthy of further study.
Prior work has revealed that SDM may occur infrequently during inpatient rounds.11 This study further elucidates specific SDM behaviors used along with univariate and multivariate modeling to explore possible contributing factors. The strengths and weaknesses found were similar at all 4 services and the influence of the service was more important than variability across attendings. This study’s findings are similar to a study by Shields et al.,33 in which the findings in a geographically different outpatient setting 10 years earlier suggesting global and enduring challenges to SDM. To our knowledge, this is the first published study to characterize inpatient SDM behaviors and may serve as the basis for future interventions.
Although the item-level components were ranked similarly across services, on average the summary Peer-RPAD score was lowest at Med-2, where we observed high variability within and between attendings, and was highest at Med-1, where variability was low. Med-2 carried the highest caseload and held the longest rounds, while Med-1 carried the lowest caseload, suggesting that modifiable burdens may hamper SDM performance. Prior studies suggest that patients are often selected based on teaching opportunities, immediate medical need and being newly admitted.34 The high scores at Med-1 may reflect that service’s prediscussion of patients during card-flipping rounds or their selection of which patients to round on as a team. Consistent with prior studies29,35 of SDM and the family-centered rounding model, which includes the involvement of nurses, respiratory therapists, pharmacists, case managers, social workers, and interpreters on rounds, both pediatrics services showed higher SDM scores.
In contrast to prior studies,34,36 team size and number of learners did not affect SDM performance, nor did decision type. Despite teams having up to 17 members, 8 learners, and 14 complex patients, SDM scores did not vary significantly by team. Nonetheless, trends were in the directions expected: Scores tended to decrease as the team size or the percentage of trainees grew, and increased with the seniority of the presenting physician. Interestingly, SDM performance decreased with round-average minutes per patient, which may be measuring on-going intensity across cases that leads to exhaustion. Statistically significant patient factors for increased SDM included longer duration of patient encounters, second week of hospital stay, and female patient gender. Although we anticipated that the high number of decisions made early in hospitalization would facilitate higher SDM scores, continuity and stronger patient-provider relationships may enhance SDM.36 We report service-specific team and patient characteristics, in addition to SDM findings in anticipation that some readers will identify with 1 service more than others.
This study has several important limitations. First, our peer observers were not blinded and primarily observed encounters at their own site. To minimize bias, observers periodically rated videos to recalibrate RPAD scoring. Second, additional SDM conversations with a patient and/or guardian may have occurred outside of rounds and were not captured, and poor patient recall may have affected Patient-RPAD scores despite interviewer prompts and timeliness of interviews within 12 hours of rounds. Third, there might have been a selection bias for the one service who selected a smaller number of patients to see, compared with the three other services that performed bedside rounds on all patients. It is possible that attending physicians selected patients who were deemed most able to have SDM conversations, thus affecting RPAD scores on that service. Fourth, study services had fewer patients on average than other academic hospitals (median 9, range 3-14), which might limit its generalizability. Last, as in any observational study, there is always the possibility of the Hawthorne effect. However, neither teams nor patients knew the study objectives.
Nevertheless, important findings emerged through the use of RPAD Scores to evaluate inpatient SDM practices. In particular, we found that to increase SDM quality in inpatient settings, practitioners should (1) check their understanding of the patient’s perspective, (2) examine barriers to follow-through with the treatment plan, and (3) ask if the patient has questions. Variation among services remained very influential after adjusting for team and patient characteristics, which suggests that “climate” or service culture should be targeted by an intervention, rather than individual attendings or subgroups defined by team or patient characteristics. Notably, team size, number of learners, patient census, and type of decision being made did not affect SDM performance, suggesting that even large, busy services can perform SDM if properly trained.
Acknowledgments
The authors thank the patients, families, pediatric and internal medicine residents, and hospitalists at Stanford School of Medicine and University of California, San Francisco School of Medicine for their participation in this study. We would also like to thank the student volunteers who collected patient perspectives on the encounters.
Disclosure
The author(s) declared no potential conflicts of interest with respect to the research, authorship, and/or publication of this article. The author(s) disclosed receipt of the following financial support for the research, authorship, and/or publication of this article: This study was supported by an NIH/NCCIH grant R25 AT006573.
1. Braddock CH. The emerging importance and relevance of shared decision making to clinical practice. Med Decis Mak. 2010;30(5 Suppl):5S-7S. doi:10.1177/0272989X10381344. PubMed
2. Braddock CH. Supporting shared decision making when clinical evidence is low. Med Care Res Rev MCRR. 2013;70(1 Suppl):129S-140S. doi:10.1177/1077558712460280. PubMed
3. Elwyn G, Tilburt J, Montori V. The ethical imperative for shared decision-making. Eur J Pers Centered Healthc. 2013;1(1):129-131. doi:10.5750/ejpch.v1i1.645.
4. Stiggelbout AM, Pieterse AH, De Haes JCJM. Shared decision making: Concepts, evidence, and practice. Patient Educ Couns. 2015;98(10):1172-1179. doi:10.1016/j.pec.2015.06.022. PubMed
5. Stacey D, Légaré F, Col NF, et al. Decision aids for people facing health treatment or screening decisions. Cochrane Database Syst Rev. 2014;(10):CD001431. doi:10.1002/14651858.CD001431.pub4. PubMed
6. Wilson SR, Strub P, Buist AS, et al. Shared treatment decision making improves adherence and outcomes in poorly controlled asthma. Am J Respir Crit Care Med. 2010;181(6):566-577. doi:10.1164/rccm.200906-0907OC. PubMed
7. Parchman ML, Zeber JE, Palmer RF. Participatory decision making, patient activation, medication adherence, and intermediate clinical outcomes in type 2 diabetes: a STARNet study. Ann Fam Med. 2010;8(5):410-417. doi:10.1370/afm.1161. PubMed
8. Weiner SJ, Schwartz A, Sharma G, et al. Patient-centered decision making and health care outcomes: an observational study. Ann Intern Med. 2013;158(8):573-579. doi:10.7326/0003-4819-158-8-201304160-00001. PubMed
9. Butterworth JE, Campbell JL. Older patients and their GPs: shared decision making in enhancing trust. Br J Gen Pract. 2014;64(628):e709-e718. doi:10.3399/bjgp14X682297. PubMed
10. Barry MJ, Edgman-Levitan S. Shared decision making--pinnacle of patient-centered care. N Engl J Med. 2012;366(9):780-781. doi:10.1056/NEJMp1109283. PubMed
11. Satterfield JM, Bereknyei S, Hilton JF, et al. The prevalence of social and behavioral topics and related educational opportunities during attending rounds. Acad Med J Assoc Am Med Coll. 2014;89(11):1548-1557. doi:10.1097/ACM.0000000000000483. PubMed
12. Charles C, Gafni A, Whelan T. Shared decision-making in the medical encounter: what does it mean? (or it takes at least two to tango). Soc Sci Med. 1997;44(5):681-692. PubMed
13. Elwyn G, Frosch D, Thomson R, et al. Shared decision making: a model for clinical practice. J Gen Intern Med. 2012;27(10):1361-1367. doi:10.1007/s11606-012-2077-6. PubMed
14. Légaré F, St-Jacques S, Gagnon S, et al. Prenatal screening for Down syndrome: a survey of willingness in women and family physicians to engage in shared decision-making. Prenat Diagn. 2011;31(4):319-326. doi:10.1002/pd.2624. PubMed
15. Satterfield JM, Spring B, Brownson RC, et al. Toward a Transdisciplinary Model of Evidence-Based Practice. Milbank Q. 2009;87(2):368-390. PubMed
16. National Academy of Medicine. Crossing the quality chasm: a new health system for the 21st century. https://www.nationalacademies.org/hmd/~/media/Files/Report%20Files/2001/Crossing-the-Quality-Chasm/Quality%20Chasm%202001%20%20report%20brief.pdf. Accessed on November 30, 2016.
17. Adams RC, Levy SE, Council on Children with Disabilities. Shared Decision-Making and Children with Disabilities: Pathways to Consensus. Pediatrics. 2017; 139(6):1-9. PubMed
18. Müller-Engelmann M, Keller H, Donner-Banzhoff N, Krones T. Shared decision making in medicine: The influence of situational treatment factors. Patient Educ Couns. 2011;82(2):240-246. doi:10.1016/j.pec.2010.04.028. PubMed
19. Whitney SN. A New Model of Medical Decisions: Exploring the Limits of Shared Decision Making. Med Decis Making. 2003;23(4):275-280. doi:10.1177/0272989X03256006. PubMed
20. Kehl KL, Landrum MB, Arora NK, et al. Association of Actual and Preferred Decision Roles With Patient-Reported Quality of Care: Shared Decision Making in Cancer Care. JAMA Oncol. 2015;1(1):50-58. doi:10.1001/jamaoncol.2014.112. PubMed
21. Couët N, Desroches S, Robitaille H, et al. Assessments of the extent to which health-care providers involve patients in decision making: a systematic review of studies using the OPTION instrument. Health Expect Int J Public Particip Health Care Health Policy. 2015;18(4):542-561. doi:10.1111/hex.12054. PubMed
22. Fowler FJ, Gerstein BS, Barry MJ. How patient centered are medical decisions?: Results of a national survey. JAMA Intern Med. 2013;173(13):1215-1221. doi:10.1001/jamainternmed.2013.6172. PubMed
23. Légaré F, Stacey D, Turcotte S, et al. Interventions for improving the adoption of shared decision making by healthcare professionals. Cochrane Database Syst Rev. 2014;(9):CD006732. doi:10.1002/14651858.CD006732.pub3. PubMed
24. Stacey D, Bennett CL, Barry MJ, et al. Decision aids for people facing health treatment or screening decisions. Cochrane Database Syst Rev. 2011;(10):CD001431. doi:10.1002/14651858.CD001431.pub3. PubMed
25. Di Francesco L, Pistoria MJ, Auerbach AD, Nardino RJ, Holmboe ES. Internal medicine training in the inpatient setting. A review of published educational interventions. J Gen Intern Med. 2005;20(12):1173-1180. doi:10.1111/j.1525-1497.2005.00250.x. PubMed
26. Janicik RW, Fletcher KE. Teaching at the bedside: a new model. Med Teach. 2003;25(2):127-130. PubMed
27. Shields CG, Franks P, Fiscella K, Meldrum S, Epstein RM. Rochester Participatory Decision-Making Scale (RPAD): reliability and validity. Ann Fam Med. 2005;3(5):436-442. doi:10.1370/afm.305. PubMed
28. DocCom - enhancing competence in healthcare communication. https://webcampus.drexelmed.edu/doccom/user/. Accessed on November 30, 2016.
29. Bailey SM, Hendricks-Muñoz KD, Mally P. Parental influence on clinical management during neonatal intensive care: a survey of US neonatologists. J Matern Fetal Neonatal Med. 2013;26(12):1239-1244. doi:10.3109/14767058.2013.776531. PubMed
30. Janz NK, Wren PA, Copeland LA, Lowery JC, Goldfarb SL, Wilkins EG. Patient-physician concordance: preferences, perceptions, and factors influencing the breast cancer surgical decision. J Clin Oncol. 2004;22(15):3091-3098. doi:10.1200/JCO.2004.09.069. PubMed
31. Schoenborn NL, Cayea D, McNabney M, Ray A, Boyd C. Prognosis communication with older patients with multimorbidity: Assessment after an educational intervention. Gerontol Geriatr Educ. 2016;38(4):471-481. doi:10.1080/02701960.2015.1115983. PubMed
32. Lipkin M. Shared decision making. JAMA Intern Med. 2013;173(13):1204-1205. doi:10.1001/jamainternmed.2013.6248. PubMed
33. Gonzalo JD, Heist BS, Duffy BL, et al. The art of bedside rounds: a multi-center qualitative study of strategies used by experienced bedside teachers. J Gen Intern Med. 2013;28(3):412-420. doi:10.1007/s11606-012-2259-2. PubMed
34. Rosen P, Stenger E, Bochkoris M, Hannon MJ, Kwoh CK. Family-centered multidisciplinary rounds enhance the team approach in pediatrics. Pediatrics. 2009;123(4):e603-e608. doi:10.1542/peds.2008-2238. PubMed
35. Harrison R, Allen E. Teaching internal medicine residents in the new era. Inpatient attending with duty-hour regulations. J Gen Intern Med. 2006;21(5):447-452. doi:10.1111/j.1525-1497.2006.00425.x. PubMed
36. Smith SK, Dixon A, Trevena L, Nutbeam D, McCaffery KJ. Exploring patient involvement in healthcare decision making across different education and functional health literacy groups. Soc Sci Med 1982. 2009;69(12):1805-1812. doi:10.1016/j.socscimed.2009.09.056. PubMed
© 2018 Society of Hospital Medicine
Lean-Based Redesign of Multidisciplinary Rounds on General Medicine Service
Given that multiple disciplines are often involved in caring for patients admitted to the hospital, timely communication, collaboration, and coordination amongst various disciplines is necessary for safe and effective patient care.1 With the focus on improving patient satisfaction and throughput in hospitals, it is also important to make more accurate predictions of the discharge date and allow time for patients and their families to prepare for discharge.2-4
Multidisciplinary rounds (MDR) are defined as structured daily communication amongst key members of the patient’s care team (eg, nurses, physicians, case managers, social workers, pharmacists, and rehabilitation services). MDR have shown to be a useful strategy for ensuring that all members of the care team are updated on the plan of care for the patient.5 During MDR, a brief “check-in” discussing the patient’s plan of care, pending needs, and barriers to discharge allows all team members, patients, and families to effectively coordinate care and plan and prepare for discharge.
Multiple studies have reported increased collaboration and improved communication between disciplines with the use of such multidisciplinary rounding.2,5-7 Additionally, MDR have been shown to improve patient outcomes8 and reduce adverse events,9 length of stay (LOS),6,8 cost of care,8 and readmissions.1
We redesigned MDR on the general medicine wards at our institution in October 2014 by using Lean management techniques. Lean is defined as a set of philosophies and methods that aim to create transformation in thinking, behavior, and culture in each process, with the goal of maximizing the value for the patients and providers, adding efficiency, and reducing waste and waits.10
In this study, we evaluate whether this new model of MDR was associated with a decrease in the LOS. We also evaluate whether this new model of MDR was associated with an increase in discharges before noon, documentation of estimated discharge date (EDD) in our electronic health record (EHR), and patient satisfaction.
METHODS
Setting, Design, and Patients
The study was conducted on the teaching general medicine service at our institution, an urban, 484-bed academic hospital. The general medicine service has patients on 4 inpatient units (total of 95 beds) and is managed by 5 teaching service teams.
We performed a pre-post study. The preperiod (in which the old model of MDR was followed) included 4000 patients discharged between September 1, 2013, and October 22, 2014. The postperiod (in which the new model of MDR was followed) included 2085 patients discharged between October 23, 2014, and April 30, 2015. We excluded 139 patients that died in the hospital prior to discharge and patients on the nonteaching and/or private practice service.
All data were provided by our institution’s Digital Solutions Department. Our institutional review board issued a letter of determination exempting this study from further review because it was deemed to be a quality improvement initiative.
Use of Lean Management to Redesign our MDR
Our institution has incorporated the Lean management system to continually add value to services through the elimination of waste, thus simultaneously optimizing the quality of patient care, cost, and patient satisfaction.11 Lean, derived from the Toyota Production System, has long been used in manufacturing and in recent decades has spread to healthcare.12 We leveraged the following 3 key Lean techniques to redesign our MDR: (1) value stream management (VSM), (2) rapid process improvement workshops (RPIW), and (3) active daily management (ADM), as detailed in supplementary Appendix 1.
Interventions
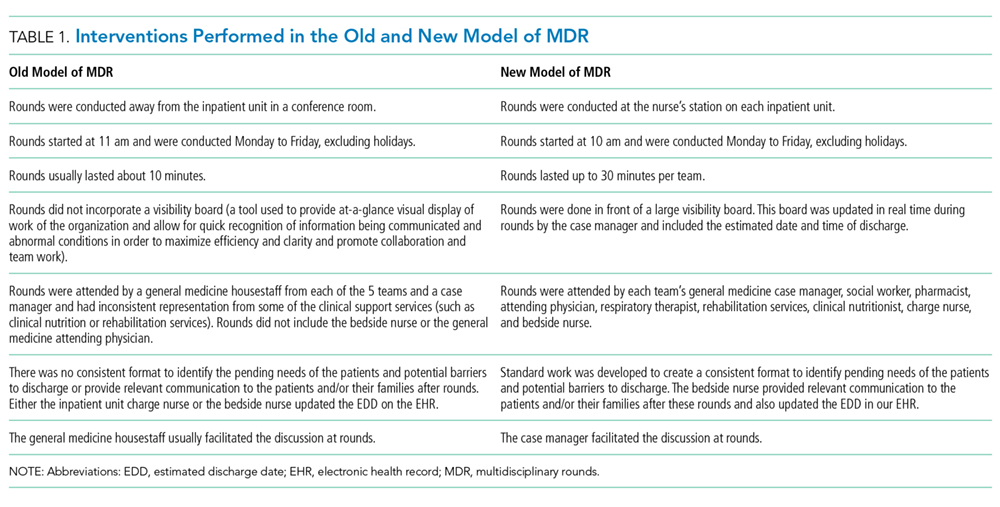
Outcomes
The primary outcome was mean LOS. The secondary outcomes were (1) discharges before noon, (2) recording of the EDD in our EHR within 24 hours of admission (as time stamped on our EHR), and (3) patient satisfaction.
Data for patient satisfaction were obtained using the Press Ganey survey. We used data on patient satisfaction scores for the following 2 relevant questions on this survey: (1) extent to which the patient felt ready to be discharged and (2) how well staff worked together to care for the patient. Proportions of the “top-box” (“very good”) were used for the analysis. These survey data were available on 467 patients (11.7%) in the preperiod and 188 patients (9.0%) in the postperiod.
Data Analysis
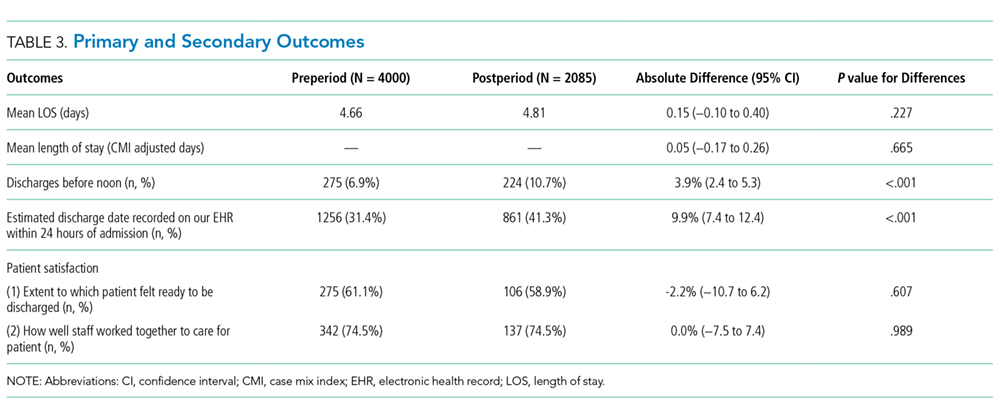
A sensitivity analysis was conducted on a second cohort that included a subset of patients from the preperiod between November 1, 2013, and April 30, 2014, and a subset of patients from the postperiod between November 1, 2014, and April 1, 2015, to control for the calendar period (supplementary Appendix 2).
All analyses were conducted in R version 3.3.0, with the linear mixed-effects model lme4 statistical package.13,14
RESULTS
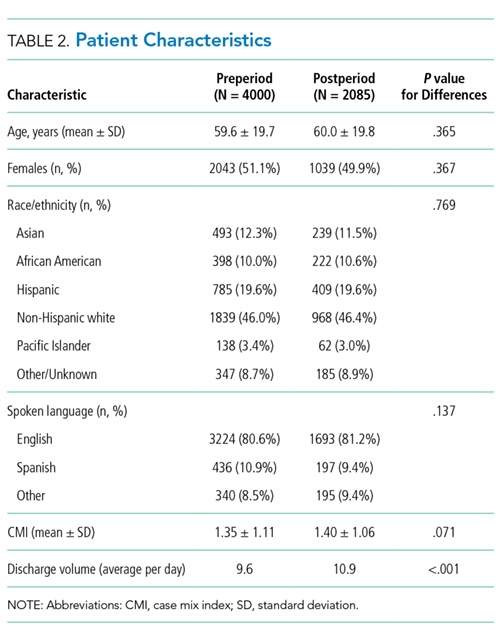
Table 3 shows the differences in the outcomes between the pre- and postperiods. There was no change in the LOS or LOS adjusted for CMI. There was a 3.9% increase in discharges before noon in the postperiod compared with the preperiod (95% CI, 2.4% to 5.3%; P < .001). There was a 9.9% increase in the percentage of patients for whom the EDD was recorded in our EHR within 24 hours of admission (95% CI, 7.4% to 12.4%; P < .001). There was no change in the “top-box” patient satisfaction scores.
There were only marginal differences in the results between the entire cohort and a second subset cohort used for sensitivity analysis (supplementary Appendix 2).
DISCUSSION
In our study, there was no change in the mean LOS with the new model of MDR. There was an increase in discharges before noon and in recording of the EDD in our EHR within 24 hours of admission in the postperiod when the Lean-based new model of MDR was utilized. There was no change in patient satisfaction. With no change in staffing, we were able to accommodate the increase in the discharge volume in the postperiod.
We believe our results are attributable to several factors, including clearly defined roles and responsibilities for all participants of MDR, the inclusion of more experienced general medicine attending physician (compared with housestaff), Lean management techniques to identify gaps in the patient’s journey from emergency department to discharge using VSM, the development of appropriate workflows and standard work on how the multidisciplinary teams would work together at RPIWs, and ADM to ensure sustainability and engagement among frontline members and institutional leaders. In order to sustain this, we planned to continue monitoring data in daily, weekly, and monthly forums with senior physician and administrative leaders. Planning for additional interventions is underway, including moving MDR to the bedside, instituting an afternoon “check-in” that would enable more detailed action planning, and addressing barriers in a timely manner for patients ready to discharge the following day.
Our study has a few limitations. First, this is an observational study that cannot determine causation. Second, this is a single-center study conducted on patients only on the general medicine teaching service. Third, there were several concurrent interventions implemented at our institution to improve LOS, throughput, and patient satisfaction in addition to MDR, thus making it difficult to isolate the impact of our intervention. Fourth, in the new model of MDR, rounds took place only 5 days per week, thereby possibly limiting the potential impact on our outcomes. Fifth, while we showed improvements in the discharges before noon and recording of EDD in the post period, we were not able to achieve our target of 25% discharges before noon or 100% recording of EDD in this time period. We believe the limited amount of time between the pre- and postperiods to allow for adoption and learning of the processes might have contributed to the underestimation of the impact of the new model of MDR, thereby limiting our ability to achieve our targets. Sixth, the response rate on the Press Ganey survey was low, and we did not directly survey patients or families for their satisfaction with MDR.
Our study has several strengths. To our knowledge, this is the first study to embed Lean management techniques in the design of MDR in the inpatient setting. While several studies have demonstrated improvements in discharges before noon through the implementation of MDR, they have not incorporated Lean management techniques, which we believe are critical to ensure the sustainability of results.1,3,5,6,8,15 Second, while it was not measured, there was a high level of provider engagement in the process in the new model of MDR. Third, because the MDR were conducted at the nurse’s station on each inpatient unit in the new model instead of in a conference room, it was well attended by all members of the multidisciplinary team. Fourth, the presence of a visibility board allowed for all team members to have easy access to visual feedback throughout the day, even if they were not present at the MDR. Fifth, we believe that there was also more accurate estimation of the date and time of discharge in the new model of MDR because the discussion was facilitated by the case manager, who is experienced in identifying barriers to discharge (compared with the housestaff in the old model of MDR), and included the more experienced attending physician. Finally, the consistent presence of a multidisciplinary team at MDR allowed for the incorporation of everyone’s concerns at one time, thereby limiting the need for paging multiple disciplines throughout the day, which led to quicker resolution of issues and assignment of pending tasks.
In conclusion, our study shows no change in the mean LOS when the Lean-based model of MDR was utilized. Our study demonstrates an increase in discharges before noon and in recording of EDD on our EHR within 24 hours of admission in the post period when the Lean-based model of MDR was utilized. There was no change in patient satisfaction. While this study was conducted at an academic medical center on the general medicine wards, we believe our new model of MDR, which leveraged Lean management techniques, may successfully impact patient flow in all inpatient clinical services and nonteaching hospitals.
Disclosure
The authors report no financial conflicts of interest and have nothing to disclose.
1. Townsend-Gervis M, Cornell P, Vardaman JM. Interdisciplinary Rounds and Structured Communication Reduce Re-Admissions and Improve Some Patient Outcomes. West J Nurs Res. 2014;36(7):917-928. PubMed
2. Vazirani S, Hays RD, Shapiro MF, Cowan M. Effect of a multidisciplinary intervention on communication and collaboration among physicians and nurses. Am J Crit Care. 2005;14(1):71-77. PubMed
3. Wertheimer B, Jacobs RE, Bailey M, et al. Discharge before noon: an achievable hospital goal. J Hosp Med. 2014;9(4):210-214. PubMed
4. Wertheimer B, Jacobs RE, Iturrate E, Bailey M, Hochman K. Discharge before noon: Effect on throughput and sustainability. J Hosp Med. 2015;10(10):664-669. PubMed
5. Halm MA, Gagner S, Goering M, Sabo J, Smith M, Zaccagnini M. Interdisciplinary rounds: impact on patients, families, and staff. Clin Nurse Spec. 2003;17(3):133-142. PubMed
6. O’Mahony S, Mazur E, Charney P, Wang Y, Fine J. Use of multidisciplinary rounds to simultaneously improve quality outcomes, enhance resident education, and shorten length of stay. J Gen Intern Med. 2007;22(8):1073-1079. PubMed
7. Reimer N, Herbener L. Round and round we go: rounding strategies to impact exemplary professional practice. Clin J Oncol Nurs. 2014;18(6):654-660. PubMed
8. Curley C, McEachern JE, Speroff T. A firm trial of interdisciplinary rounds on the inpatient medical wards: an intervention designed using continuous quality improvement. Med Care. 1998;36(8 Suppl):AS4-AS12. PubMed
9. Baggs JG, Ryan SA, Phelps CE, Richeson JF, Johnson JE. The association between interdisciplinary collaboration and patient outcomes in a medical intensive care unit. Heart Lung. 1992;21(1):18-24. PubMed
10. Lawal AK, Rotter T, Kinsman L, et al. Lean management in health care: definition, concepts, methodology and effects reported (systematic review protocol). Syst Rev. 2014;3:103. PubMed
11. Liker JK. Toyota Way: 14 Management Principles from the World’s Greatest Manufacturer. New York, Chicago, San Francisco, Athens, London, Madrid, Mexico City, Milan, New Delhi, Singapore, Sydney, Toronto: McGraw-Hill Education; 2004.
12. Kane M, Chui K, Rimicci J, et al. Lean Manufacturing Improves Emergency Department Throughput and Patient Satisfaction. J Nurs Adm. 2015;45(9):429-434. PubMed
13. R Core Team. R: A language and environment for statistical computing. R Foundation for Statistical Computing, Vienna, Austria. 2016. http://www.R-project.org/. Accessed November 7, 2017.
14. Bates D, Mächler M, Bolker B, Walker S. Fitting Linear Mixed-Effects Models Using lme4. J Stat Softw. 2015;67(1):1-48.
15. O’Leary KJ, Buck R, Fligiel HM, et al. Structured interdisciplinary rounds in a medical teaching unit: improving patient safety. Arch Intern Med. 2011;171(7):678-684. PubMed
Given that multiple disciplines are often involved in caring for patients admitted to the hospital, timely communication, collaboration, and coordination amongst various disciplines is necessary for safe and effective patient care.1 With the focus on improving patient satisfaction and throughput in hospitals, it is also important to make more accurate predictions of the discharge date and allow time for patients and their families to prepare for discharge.2-4
Multidisciplinary rounds (MDR) are defined as structured daily communication amongst key members of the patient’s care team (eg, nurses, physicians, case managers, social workers, pharmacists, and rehabilitation services). MDR have shown to be a useful strategy for ensuring that all members of the care team are updated on the plan of care for the patient.5 During MDR, a brief “check-in” discussing the patient’s plan of care, pending needs, and barriers to discharge allows all team members, patients, and families to effectively coordinate care and plan and prepare for discharge.
Multiple studies have reported increased collaboration and improved communication between disciplines with the use of such multidisciplinary rounding.2,5-7 Additionally, MDR have been shown to improve patient outcomes8 and reduce adverse events,9 length of stay (LOS),6,8 cost of care,8 and readmissions.1
We redesigned MDR on the general medicine wards at our institution in October 2014 by using Lean management techniques. Lean is defined as a set of philosophies and methods that aim to create transformation in thinking, behavior, and culture in each process, with the goal of maximizing the value for the patients and providers, adding efficiency, and reducing waste and waits.10
In this study, we evaluate whether this new model of MDR was associated with a decrease in the LOS. We also evaluate whether this new model of MDR was associated with an increase in discharges before noon, documentation of estimated discharge date (EDD) in our electronic health record (EHR), and patient satisfaction.
METHODS
Setting, Design, and Patients
The study was conducted on the teaching general medicine service at our institution, an urban, 484-bed academic hospital. The general medicine service has patients on 4 inpatient units (total of 95 beds) and is managed by 5 teaching service teams.
We performed a pre-post study. The preperiod (in which the old model of MDR was followed) included 4000 patients discharged between September 1, 2013, and October 22, 2014. The postperiod (in which the new model of MDR was followed) included 2085 patients discharged between October 23, 2014, and April 30, 2015. We excluded 139 patients that died in the hospital prior to discharge and patients on the nonteaching and/or private practice service.
All data were provided by our institution’s Digital Solutions Department. Our institutional review board issued a letter of determination exempting this study from further review because it was deemed to be a quality improvement initiative.
Use of Lean Management to Redesign our MDR
Our institution has incorporated the Lean management system to continually add value to services through the elimination of waste, thus simultaneously optimizing the quality of patient care, cost, and patient satisfaction.11 Lean, derived from the Toyota Production System, has long been used in manufacturing and in recent decades has spread to healthcare.12 We leveraged the following 3 key Lean techniques to redesign our MDR: (1) value stream management (VSM), (2) rapid process improvement workshops (RPIW), and (3) active daily management (ADM), as detailed in supplementary Appendix 1.
Interventions
Outcomes
The primary outcome was mean LOS. The secondary outcomes were (1) discharges before noon, (2) recording of the EDD in our EHR within 24 hours of admission (as time stamped on our EHR), and (3) patient satisfaction.
Data for patient satisfaction were obtained using the Press Ganey survey. We used data on patient satisfaction scores for the following 2 relevant questions on this survey: (1) extent to which the patient felt ready to be discharged and (2) how well staff worked together to care for the patient. Proportions of the “top-box” (“very good”) were used for the analysis. These survey data were available on 467 patients (11.7%) in the preperiod and 188 patients (9.0%) in the postperiod.
Data Analysis
A sensitivity analysis was conducted on a second cohort that included a subset of patients from the preperiod between November 1, 2013, and April 30, 2014, and a subset of patients from the postperiod between November 1, 2014, and April 1, 2015, to control for the calendar period (supplementary Appendix 2).
All analyses were conducted in R version 3.3.0, with the linear mixed-effects model lme4 statistical package.13,14
RESULTS
Table 3 shows the differences in the outcomes between the pre- and postperiods. There was no change in the LOS or LOS adjusted for CMI. There was a 3.9% increase in discharges before noon in the postperiod compared with the preperiod (95% CI, 2.4% to 5.3%; P < .001). There was a 9.9% increase in the percentage of patients for whom the EDD was recorded in our EHR within 24 hours of admission (95% CI, 7.4% to 12.4%; P < .001). There was no change in the “top-box” patient satisfaction scores.
There were only marginal differences in the results between the entire cohort and a second subset cohort used for sensitivity analysis (supplementary Appendix 2).
DISCUSSION
In our study, there was no change in the mean LOS with the new model of MDR. There was an increase in discharges before noon and in recording of the EDD in our EHR within 24 hours of admission in the postperiod when the Lean-based new model of MDR was utilized. There was no change in patient satisfaction. With no change in staffing, we were able to accommodate the increase in the discharge volume in the postperiod.
We believe our results are attributable to several factors, including clearly defined roles and responsibilities for all participants of MDR, the inclusion of more experienced general medicine attending physician (compared with housestaff), Lean management techniques to identify gaps in the patient’s journey from emergency department to discharge using VSM, the development of appropriate workflows and standard work on how the multidisciplinary teams would work together at RPIWs, and ADM to ensure sustainability and engagement among frontline members and institutional leaders. In order to sustain this, we planned to continue monitoring data in daily, weekly, and monthly forums with senior physician and administrative leaders. Planning for additional interventions is underway, including moving MDR to the bedside, instituting an afternoon “check-in” that would enable more detailed action planning, and addressing barriers in a timely manner for patients ready to discharge the following day.
Our study has a few limitations. First, this is an observational study that cannot determine causation. Second, this is a single-center study conducted on patients only on the general medicine teaching service. Third, there were several concurrent interventions implemented at our institution to improve LOS, throughput, and patient satisfaction in addition to MDR, thus making it difficult to isolate the impact of our intervention. Fourth, in the new model of MDR, rounds took place only 5 days per week, thereby possibly limiting the potential impact on our outcomes. Fifth, while we showed improvements in the discharges before noon and recording of EDD in the post period, we were not able to achieve our target of 25% discharges before noon or 100% recording of EDD in this time period. We believe the limited amount of time between the pre- and postperiods to allow for adoption and learning of the processes might have contributed to the underestimation of the impact of the new model of MDR, thereby limiting our ability to achieve our targets. Sixth, the response rate on the Press Ganey survey was low, and we did not directly survey patients or families for their satisfaction with MDR.
Our study has several strengths. To our knowledge, this is the first study to embed Lean management techniques in the design of MDR in the inpatient setting. While several studies have demonstrated improvements in discharges before noon through the implementation of MDR, they have not incorporated Lean management techniques, which we believe are critical to ensure the sustainability of results.1,3,5,6,8,15 Second, while it was not measured, there was a high level of provider engagement in the process in the new model of MDR. Third, because the MDR were conducted at the nurse’s station on each inpatient unit in the new model instead of in a conference room, it was well attended by all members of the multidisciplinary team. Fourth, the presence of a visibility board allowed for all team members to have easy access to visual feedback throughout the day, even if they were not present at the MDR. Fifth, we believe that there was also more accurate estimation of the date and time of discharge in the new model of MDR because the discussion was facilitated by the case manager, who is experienced in identifying barriers to discharge (compared with the housestaff in the old model of MDR), and included the more experienced attending physician. Finally, the consistent presence of a multidisciplinary team at MDR allowed for the incorporation of everyone’s concerns at one time, thereby limiting the need for paging multiple disciplines throughout the day, which led to quicker resolution of issues and assignment of pending tasks.
In conclusion, our study shows no change in the mean LOS when the Lean-based model of MDR was utilized. Our study demonstrates an increase in discharges before noon and in recording of EDD on our EHR within 24 hours of admission in the post period when the Lean-based model of MDR was utilized. There was no change in patient satisfaction. While this study was conducted at an academic medical center on the general medicine wards, we believe our new model of MDR, which leveraged Lean management techniques, may successfully impact patient flow in all inpatient clinical services and nonteaching hospitals.
Disclosure
The authors report no financial conflicts of interest and have nothing to disclose.
1. Townsend-Gervis M, Cornell P, Vardaman JM. Interdisciplinary Rounds and Structured Communication Reduce Re-Admissions and Improve Some Patient Outcomes. West J Nurs Res. 2014;36(7):917-928. PubMed
2. Vazirani S, Hays RD, Shapiro MF, Cowan M. Effect of a multidisciplinary intervention on communication and collaboration among physicians and nurses. Am J Crit Care. 2005;14(1):71-77. PubMed
3. Wertheimer B, Jacobs RE, Bailey M, et al. Discharge before noon: an achievable hospital goal. J Hosp Med. 2014;9(4):210-214. PubMed
4. Wertheimer B, Jacobs RE, Iturrate E, Bailey M, Hochman K. Discharge before noon: Effect on throughput and sustainability. J Hosp Med. 2015;10(10):664-669. PubMed
5. Halm MA, Gagner S, Goering M, Sabo J, Smith M, Zaccagnini M. Interdisciplinary rounds: impact on patients, families, and staff. Clin Nurse Spec. 2003;17(3):133-142. PubMed
6. O’Mahony S, Mazur E, Charney P, Wang Y, Fine J. Use of multidisciplinary rounds to simultaneously improve quality outcomes, enhance resident education, and shorten length of stay. J Gen Intern Med. 2007;22(8):1073-1079. PubMed
7. Reimer N, Herbener L. Round and round we go: rounding strategies to impact exemplary professional practice. Clin J Oncol Nurs. 2014;18(6):654-660. PubMed
8. Curley C, McEachern JE, Speroff T. A firm trial of interdisciplinary rounds on the inpatient medical wards: an intervention designed using continuous quality improvement. Med Care. 1998;36(8 Suppl):AS4-AS12. PubMed
9. Baggs JG, Ryan SA, Phelps CE, Richeson JF, Johnson JE. The association between interdisciplinary collaboration and patient outcomes in a medical intensive care unit. Heart Lung. 1992;21(1):18-24. PubMed
10. Lawal AK, Rotter T, Kinsman L, et al. Lean management in health care: definition, concepts, methodology and effects reported (systematic review protocol). Syst Rev. 2014;3:103. PubMed
11. Liker JK. Toyota Way: 14 Management Principles from the World’s Greatest Manufacturer. New York, Chicago, San Francisco, Athens, London, Madrid, Mexico City, Milan, New Delhi, Singapore, Sydney, Toronto: McGraw-Hill Education; 2004.
12. Kane M, Chui K, Rimicci J, et al. Lean Manufacturing Improves Emergency Department Throughput and Patient Satisfaction. J Nurs Adm. 2015;45(9):429-434. PubMed
13. R Core Team. R: A language and environment for statistical computing. R Foundation for Statistical Computing, Vienna, Austria. 2016. http://www.R-project.org/. Accessed November 7, 2017.
14. Bates D, Mächler M, Bolker B, Walker S. Fitting Linear Mixed-Effects Models Using lme4. J Stat Softw. 2015;67(1):1-48.
15. O’Leary KJ, Buck R, Fligiel HM, et al. Structured interdisciplinary rounds in a medical teaching unit: improving patient safety. Arch Intern Med. 2011;171(7):678-684. PubMed
© 2018 Society of Hospital Medicine
Issues Identified by Postdischarge Contact after Pediatric Hospitalization: A Multisite Study
Many hospitals are considering or currently employing initiatives to contact patients after discharge. Whether conducted via telephone or other means, the purpose of the contact is to help patients adhere to discharge plans, fulfill discharge needs, and alleviate postdischarge issues (PDIs). The effectiveness of hospital-initiated postdischarge phone calls has been studied in adult patients after hospitalization, and though some studies report positive outcomes,1-3 a 2006 Cochrane review found insufficient evidence to recommend for or against the practice.4
Little is known about follow-up contact after hospitalization for children.5-11 Rates of PDI vary substantially across hospitals. For example, one single-center study of postdischarge telephone contact after hospitalization on a general pediatric ward identified PDIs in ~20% of patients.10 Another study identified PDIs in 84% of patients discharged from a pediatric rehabilitation facility.11 Telephone follow-up has been associated with reduced health resource utilization and improved patient satisfaction for children discharged after an elective surgical procedure6 and for children discharged home from the emergency department.7-9
More information is needed on the clinical experiences of postdischarge contact in hospitalized children to improve the understanding of how the contact is made, who makes it, and which patients are most likely to report a PDI. These experiences are crucial to understand given the expense and time commitment involved in postdischarge contact, as many hospitals may not be positioned to contact all discharged patients. Therefore, we conducted a pragmatic, retrospective, naturalistic study of differing approaches to postdischarge contact occurring in multiple hospitals. Our main objective was to describe the prevalence and types of PDIs identified by the different approaches for follow-up contact across 4 children’s hospitals. We also assessed the characteristics of children who have the highest likelihood of having a PDI identified from the contact within each hospital.
METHODS
Study Design, Setting, and Population
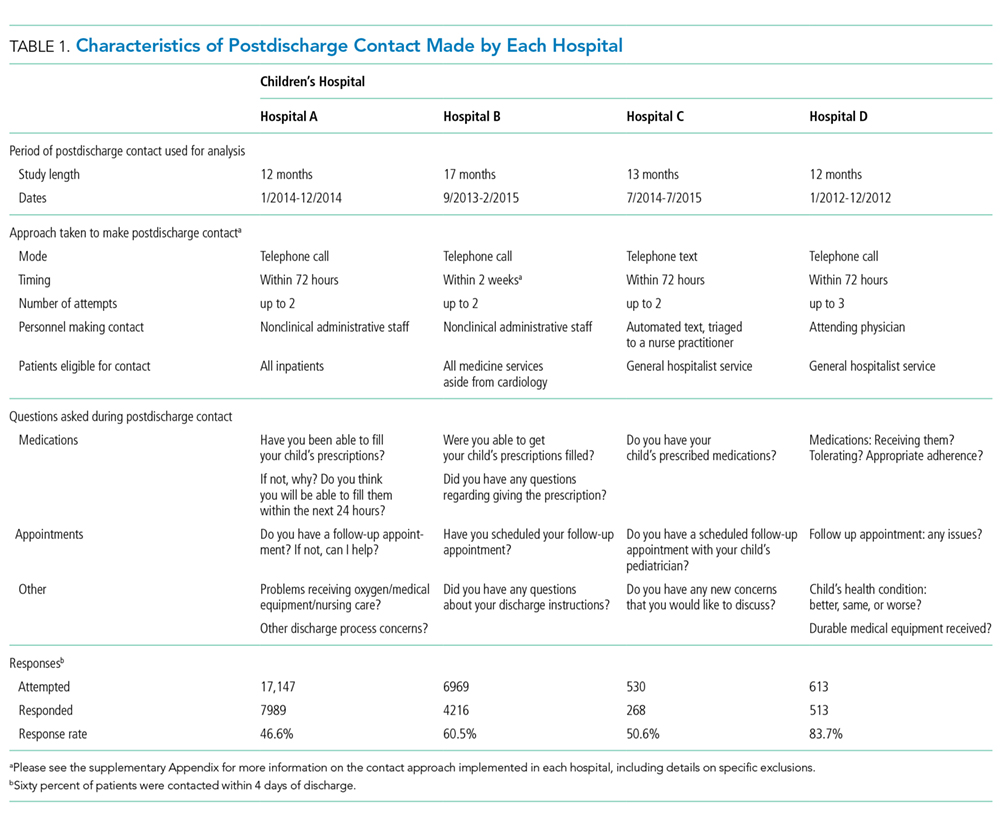
Main Outcome Measures
The main outcome measure was identification of a PDI, defined as a medication, appointment, or other discharge-related issue, that was reported and recorded by the child’s caregiver during conversation from the standardized questions that were asked during follow-up contact as part of routine discharge care (Table 1). Medication PDIs included issues filling prescriptions and tolerating medications. Appointment PDIs included not having a follow-up appointment scheduled. Other PDIs included issues with the child’s health condition, discharge instructions, or any other concerns. All PDIs had been recorded prospectively by hospital contact personnel (hospitals A, B, and D) or through an automated texting system into a database (hospital C). Where available, free text comments that were recorded by contact personnel were reviewed by one of the authors (KB) and categorized via an existing framework of PDI designed by Heath et al.10 in order to further understand the problems that were reported.
Patient Characteristics
Patient hospitalization, demographic, and clinical characteristics were obtained from administrative health data at each institution and compared between children with versus without a PDI. Hospitalization characteristics included length of stay, season of admission, and reason for admission. Reason for admission was categorized by using 3M Health’s All Patient Refined Diagnosis Related Groups (APR-DRG) (3M, Maplewood, MN). Demographic characteristics included age at admission in years, insurance type (eg, public, private, and other), and race/ethnicity (Asian/Pacific Islander, Hispanic, non-Hispanic black, non-Hispanic white, and other).
Clinical characteristics included a count of the different classes of medications (eg, antibiotics, antiepileptic medications, digestive motility medications, etc.) administered to the child during admission, the type and number of chronic conditions, and assistance with medical technology (eg, gastrostomy, tracheostomy, etc.). Except for medications, these characteristics were assessed with International Classification of Diseases, Ninth Revision-Clinical Modification (ICD-9-CM) diagnosis codes.
We used the Agency for Healthcare Research and Quality Chronic Condition Indicator classification system, which categorizes over 14,000 ICD-9-CM diagnosis codes into chronic versus nonchronic conditions to identify the presence and number of chronic conditions.12 Children hospitalized with a chronic condition were further classified as having a complex chronic condition (CCC) by using the ICD-9-CM diagnosis classification scheme of Feudtner et al.13 CCCs represent defined diagnosis groupings of conditions expected to last longer than 12 months and involve either multiple organ systems or a single organ system severely enough to require specialty pediatric care and hospitalization.13,14 Children requiring medical technology were identified by using ICD-9-CM codes indicating their use of a medical device to manage and treat a chronic illness (eg, ventricular shunt to treat hydrocephalus) or to maintain basic body functions necessary for sustaining life (eg a tracheostomy tube for breathing).15,16
Statistical Analysis
Given that the primary purpose for this study was to leverage the natural heterogeneity in the approach to follow-up contact across hospitals, we assessed and reported the prevalence and type of PDIs independently for each hospital. Relatedly, we assessed the relationship between patient characteristics and PDI likelihood independently within each hospital as well rather than pool the data and perform a central analysis across hospitals. Of note, APR-DRG and medication class were not assessed for hospital D, as this information was unavailable. We used χ2 tests for univariable analysis and logistic regression with a backwards elimination derivation process (for variables with P ≥ .05) for multivariable analysis; all patient demographic, clinical, and hospitalization characteristics were entered initially into the models. All statistical analyses were performed using SAS version 9.3 (SAS Institute, Cary, NC), and P < .05 was considered statistically significant. This study was approved by the institutional review board at all hospitals.
RESULTS
Study Population
There were 12,986 (51.4%) of 25,259 patients reached by follow-up contact after discharge across the 4 hospitals. Median age at admission for contacted patients was 4.0 years (interquartile range [IQR] 0-11). Of those contacted, 45.2% were female, 59.9% were non-Hispanic white, 51.0% used Medicaid, and 95.4% were discharged to home. Seventy-one percent had a chronic condition (of any complexity) and 40.8% had a CCC. Eighty percent received a prescribed medication during the hospitalization. Median (IQR) length of stay was 2.0 days (IQR 1-4 days). The top 5 most common reasons for admission were bronchiolitis (6.3%), pneumonia (6.2%), asthma (5.2%), seizure (4.9%), and tonsil and adenoid procedures (4.1%).
PDIs
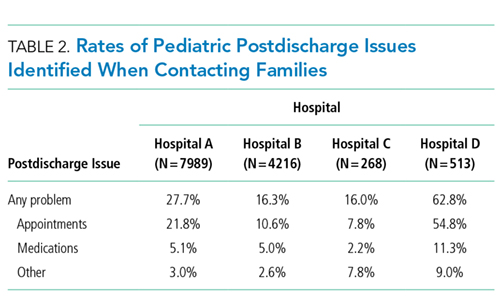
Characteristics Associated with PDIs
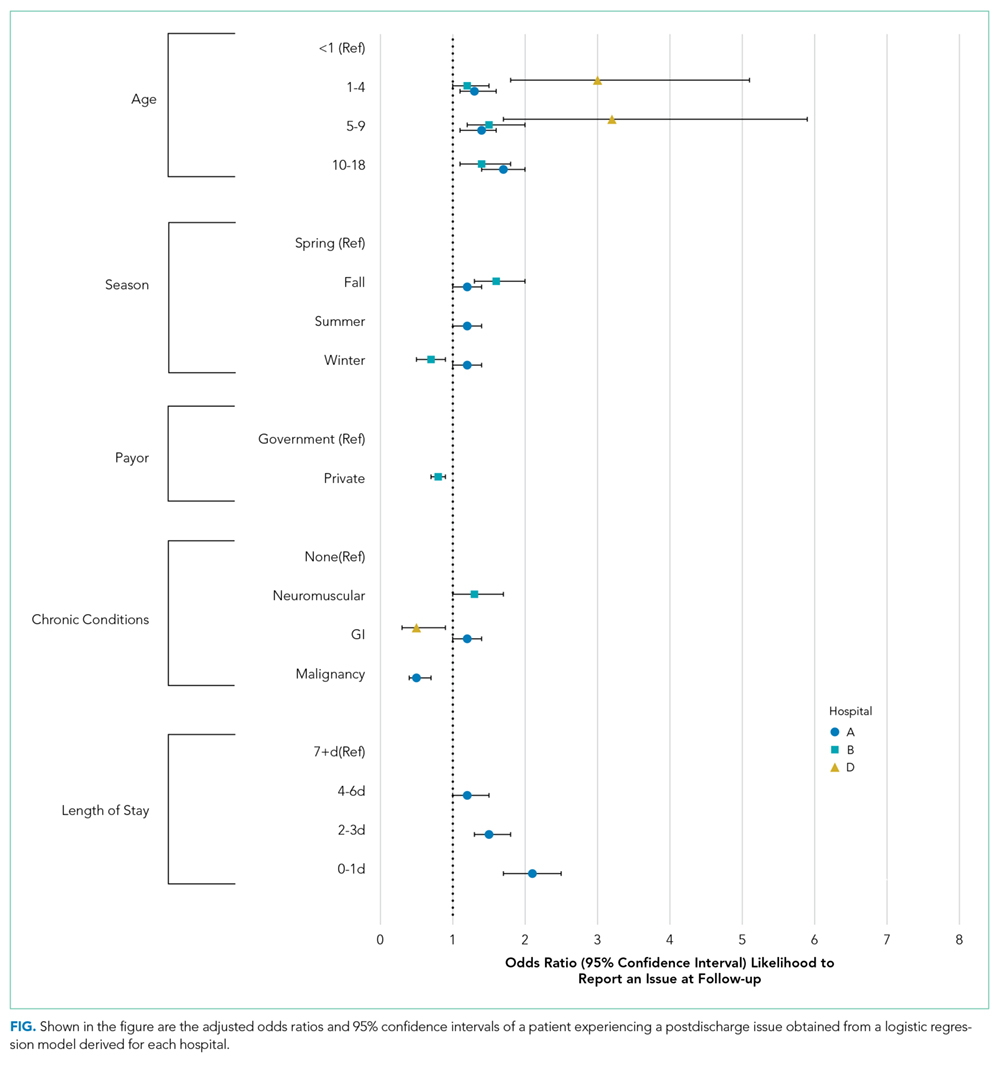
Age
Older age was a consistent characteristic associated with PDIs in 3 hospitals. For example, PDI rates in children 10 to 18 years versus <1 year were 30.8% versus 21.4% (P < .001) in hospital A, 19.4% versus 13.7% (P = .002) in hospital B, and 70.3% versus 62.8% (P < .001) in hospital D. In multivariable analysis, age 10 to 18 years versus <1 year at admission was associated with an increased likelihood of PDI in hospital A (odds ratio [OR] 1.7; 95% CI, 1.4-2.0), hospital B (OR 1.4; 95% CI, 1.1-1.8), and hospital D (OR 1.7; 95% CI, 0.9-3.0) (Table 3 and Figure).
Medications
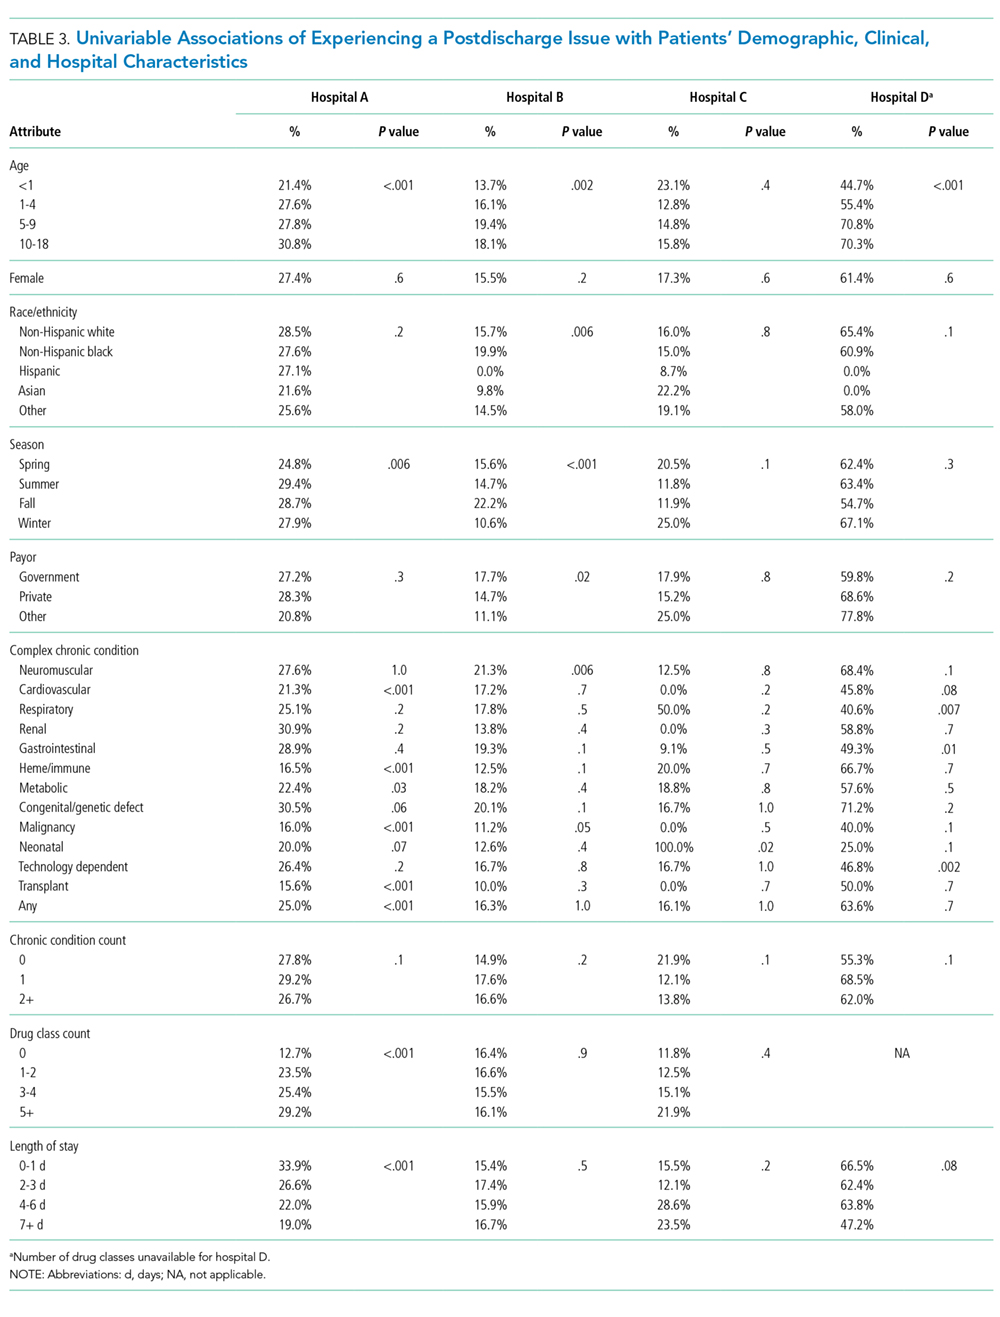
Length of Stay
Shorter length of stay was associated with PDI in 1 hospital. In hospital A, the PDI rate increased significantly (P < .001) from 19.0% to 33.9% as length of stay decreased from ≥7 days to ≤1 day (Table 3). In multivariable analysis, length of stay to ≤1 day versus ≥7 days was associated with increased likelihood of PDI (OR 2.1; 95% CI, 1.7-2.5) in hospital A (Table 3 and Figure).
CCCs
A neuromuscular CCC was associated with PDI in 2 hospitals. In hospital B, the PDI rate was higher in children with a neuromuscular CCC compared with a malignancy CCC (21.3% vs 11.2%). In hospital D, the PDI rates were higher in children with a neuromuscular CCC compared with a respiratory CCC (68.9% vs 40.6%) (Table 3). In multivariable analysis, children with versus without a neuromuscular CCC had an increased likelihood of PDI (OR 1.3; 95% CI, 1.0-1.7) in hospital B (Table 3 and Figure).
DISCUSSION
In this retrospective, pragmatic, multicentered study of follow-up contact with a standardized set of questions asked after discharge for hospitalized children, we found that PDIs were identified often, regardless of who made the contact or how the contact was made. The PDI rates varied substantially across hospitals and were likely influenced by the different follow-up approaches that were used. Most PDIs were related to appointments; fewer PDIs were related to medications and other problems. Older age, shorter length of stay, and neuromuscular CCCs were among the identified risk factors for PDIs.
Our assessment of PDIs was, by design, associated with variation in methods and approach for detection across sites. Further investigation is needed to understand how different approaches for follow-up contact after discharge may influence the identification of PDIs. For example, in the current study, the hospital with the highest PDI rate (hospital D) used hospitalists who provided inpatient care for the patient to make follow-up contact. Although not determined from the current study, this approach could have led the hospitalists to ask questions beyond the standardized ones when assessing for PDIs. Perhaps some of the hospitalists had a better understanding of how to probe for PDIs specific to each patient; this understanding may not have been forthcoming for staff in the other hospitals who were unfamiliar with the patients’ hospitalization course and medical history.
Similar to previous studies in adults, our study reported that appointment PDIs in children may be more common than other types of PDIs.17 Appointment PDIs could have been due to scheduling difficulties, inadequate discharge instructions, lack of adherence to recommended follow-up, or other reasons. Further investigation is needed to elucidate these reasons and to determine how to reduce PDIs related to postdischarge appointments. Some children’s hospitals schedule follow-up appointments prior to discharge to mitigate appointment PDIs that might arise.18 However, doing that for every hospitalized child is challenging, especially for very short admissions or for weekend discharges when many outpatient and community practices are not open to schedule appointments. Additional exploration is necessary to assess whether this might help explain why some children in the current study with a short versus long length of stay had a higher likelihood of PDI.
The rate of medication PDIs (5.2%) observed in the current study is lower than the rate that is reported in prior literature. Dudas et al.1 found that medication PDIs occurred in 21% of hospitalized adult patients. One reason for the lower rate of medication PDIs in children may be that they require the use of postdischarge medications less often than adults. Most medication PDIs in the current study involved problems filling a prescription. There was not enough information in the notes taken from the follow-up contact to distinguish the medication PDI etiologies (eg, a prescription was not sent from the hospital team to the pharmacy, prior authorization from an insurance company for a prescription was not obtained, the pharmacy did not stock the medication). To help overcome medication access barriers, some hospitals fill and deliver discharge medications to the patients’ bedside. One study found that children discharged with medication in hand were less likely to have emergency department revisits within 30 days of discharge.19 Further investigation is needed to assess whether initiatives like these help mitigate medication PDIs in children.
Hospitals may benefit from considering how risk factors for PDIs can be used to prioritize which patients receive follow-up contact, especially in hospitals where contact for all hospitalized patients is not feasible. In the current study, there was variation across hospitals in the profile of risk factors that correlated with increased likelihood of PDI. Some of the risk factors are easier to explain than others. For example, as mentioned above, for some hospitalized children, short length of stay might not permit enough time for hospital staff to set up discharge plans that may sufficiently prevent PDIs. Other risk factors, including older age and neuromuscular CCCs, may require additional assessment (eg, through chart review or in-depth patient and provider interviews) to discover the reasons why they were associated with increased likelihood of PDI. There are additional risk factors that might influence the likelihood of PDI that the current study was not positioned to assess, including health literacy, transportation availability, and language spoken.20-23
This study has several other limitations in addition to the ones already mentioned. Some children may have experienced PDIs that were not reported at contact (eg, the respondent was unaware that an issue was present), which may have led to an undercounting of PDIs. Alternatively, some caregivers may have been more likely to respond to the contact if their child was experiencing a PDI, which may have led to overcounting. PDIs of nonrespondents were not measured. PDIs identified by postdischarge outpatient and community providers or by families outside of contact were not measured. The current study was not positioned to assess the severity of the PDIs or what interventions (including additional health services) were needed to address them. Although we assessed medication use during admission, we were unable to assess the number and type of medications that were prescribed for use postdischarge. Information about the number and type of follow-up visits needed for each child was not assessed. Given the variety of approaches for follow-up contact, the findings may generalize best to individual hospitals by using an approach that best matches to one of them. The current study is not positioned to correlate quality of discharge care with the rate of PDI.
Despite these limitations, the findings from the current study reinforce that PDIs identified through follow-up contact in discharged patients appear to be common. Of PDIs identified, appointment problems were more prevalent than medication or other types of problems. Short length of stay, older age, and other patient and/or hospitalization attributes were associated with an increased likelihood of PDI. Hospitals caring for children may find this information useful as they strive to optimize their processes for follow-up contact after discharge. To help further evaluate the value and importance of contacting patients after discharge, additional study of PDI in children is warranted, including (1) actions taken to resolve PDIs, (2) the impact of identifying and addressing PDIs on hospital readmission, and (3) postdischarge experiences and health outcomes of children who responded versus those who did not respond to the follow-up contact. Moreover, future multisite, comparative effectiveness studies of PDI may wish to consider standardization of follow-up contact procedures with controlled manipulation of key processes (eg, contact by administrator vs nurse vs physician) to assess best practices.
Disclosure
Mr. Blaine, Ms. O’Neill, and Drs. Berry, Brittan, Rehm, and Steiner were supported by the Lucile Packard Foundation for Children’s Health. The authors have no financial relationships relative to this article to disclose. The authors have no conflicts of interest to disclose.
1. Dudas V, Bookwalter T, Kerr KM, Pantilat SZ. The impact of follow-up telephone calls to patients after hospitalization. Dis Mon. 2002;48(4):239-248. PubMed
2. Sanchez GM, Douglass MA, Mancuso MA. Revisiting Project Re-Engineered Discharge (RED): The Impact of a Pharmacist Telephone Intervention on Hospital Readmission Rates. Pharmacotherapy. 2015;35(9):805-812. PubMed
3. Jones J, Clark W, Bradford J, Dougherty J. Efficacy of a telephone follow-up system in the emergency department. J Emerg Med. 1988;6(3):249-254. PubMed
4. Mistiaen P, Poot E. Telephone follow-up, initiated by a hospital-based health professional, for postdischarge problems in patients discharged from hospital to home. Cochrane Database Syst Rev. 2006(4):CD004510. PubMed
5. Lushaj EB, Nelson K, Amond K, Kenny E, Badami A, Anagnostopoulos PV. Timely Post-discharge Telephone Follow-Up is a Useful Tool in Identifying Post-discharge Complications Patients After Congenital Heart Surgery. Pediatr Cardiol. 2016;37(6):1106-1110. PubMed
6. McVay MR, Kelley KR, Mathews DL, Jackson RJ, Kokoska ER, Smith SD. Postoperative follow-up: is a phone call enough? J Pediatr Surg. 2008;43(1):83-86. PubMed
7. Chande VT, Exum V. Follow-up phone calls after an emergency department visit. Pediatrics. 1994;93(3):513-514. PubMed
8. Sutton D, Stanley P, Babl FE, Phillips F. Preventing or accelerating emergency care for children with complex healthcare needs. Arch Dis Child. 2008;93(1):17-22. PubMed
9. Patel PB, Vinson DR. Physician e-mail and telephone contact after emergency department visit improves patient satisfaction: a crossover trial. Ann Emerg Med. 2013;61(6):631-637. PubMed
10. Heath J, Dancel R, Stephens JR. Postdischarge phone calls after pediatric hospitalization: an observational study. Hosp Pediatr. 2015;5(5):241-248. PubMed
11. Biffl SE, Biffl WL. Improving transitions of care for complex pediatric trauma patients from inpatient rehabilitation to home: an observational pilot study. Patient Saf Surg. 2015;9:33-37. PubMed
12. AHRQ. Clinical Classifications Software (CCS) for ICD-9-CM. http://www.hcup-us.ahrq.gov/toolssoftware/ccs/ccs.jsp. Accessed on January 31,2012.
13. Feudtner C, Christakis DA, Connell FA. Pediatric deaths attributable to complex chronic conditions: a population-based study of Washington State, 1980-1997. Pediatrics. 2000;106(1 Pt 2):205-209. PubMed
14. Berry JG, Hall DE, Kuo DZ, et al. Hospital utilization and characteristics of patients experiencing recurrent readmissions within children’s hospitals. JAMA. 2011;305(7):682-690. PubMed
15. Palfrey JS, Walker DK, Haynie M, et al. Technology’s children: report of a statewide census of children dependent on medical supports. Pediatrics. 1991;87(5):611-618. PubMed
16. Feudtner C, Villareale NL, Morray B, Sharp V, Hays RM, Neff JM. Technology-dependency among patients discharged from a children’s hospital: a retrospective cohort study. BMC Pediatr. 2005;5(1):8-15. PubMed
17. Arora VM, Prochaska ML, Farnan JM, et al. Problems after discharge and understanding of communication with their primary care physicians among hospitalized seniors: a mixed methods study. J Hosp Med. 2010;5(7):385-391. PubMed
18. Brittan M, Tyler A, Martin S, et al. A Discharge Planning Template for the Electronic Medical Record Improves Scheduling of Neurology Follow-up for Comanaged Seizure Patients. Hosp Pediatr. 2014;4(6):366-371. PubMed
19. Hatoun J, Bair-Merritt M, Cabral H, Moses J. Increasing Medication Possession at Discharge for Patients With Asthma: The Meds-in-Hand Project. Pediatrics. 2016;137(3):e20150461. doi:10.1542/peds.2015-0461. PubMed
20. Berry JG, Goldmann DA, Mandl KD, et al. Health information management and perceptions of the quality of care for children with tracheotomy: a qualitative study. BMC Health Serv Res. 2011;11:117-125. PubMed
21. Berry JG, Ziniel SI, Freeman L, et al. Hospital readmission and parent perceptions of their child’s hospital discharge. Int J Qual Health Care. 2013;25(5):573-581. PubMed
22. Carusone SC, O’Leary B, McWatt S, Stewart A, Craig S, Brennan DJ. The Lived Experience of the Hospital Discharge “Plan”: A Longitudinal Qualitative Study of Complex Patients. J Hosp Med. 2017;12(1):5-10. PubMed
23. Leyenaar JK, O’Brien ER, Leslie LK, Lindenauer PK, Mangione-Smith RM. Families’ Priorities Regarding Hospital-to-Home Transitions for Children With Medical Complexity. Pediatrics. 2017;139(1):e20161581. doi:10.1542/peds.2016-1581. PubMed
Many hospitals are considering or currently employing initiatives to contact patients after discharge. Whether conducted via telephone or other means, the purpose of the contact is to help patients adhere to discharge plans, fulfill discharge needs, and alleviate postdischarge issues (PDIs). The effectiveness of hospital-initiated postdischarge phone calls has been studied in adult patients after hospitalization, and though some studies report positive outcomes,1-3 a 2006 Cochrane review found insufficient evidence to recommend for or against the practice.4
Little is known about follow-up contact after hospitalization for children.5-11 Rates of PDI vary substantially across hospitals. For example, one single-center study of postdischarge telephone contact after hospitalization on a general pediatric ward identified PDIs in ~20% of patients.10 Another study identified PDIs in 84% of patients discharged from a pediatric rehabilitation facility.11 Telephone follow-up has been associated with reduced health resource utilization and improved patient satisfaction for children discharged after an elective surgical procedure6 and for children discharged home from the emergency department.7-9
More information is needed on the clinical experiences of postdischarge contact in hospitalized children to improve the understanding of how the contact is made, who makes it, and which patients are most likely to report a PDI. These experiences are crucial to understand given the expense and time commitment involved in postdischarge contact, as many hospitals may not be positioned to contact all discharged patients. Therefore, we conducted a pragmatic, retrospective, naturalistic study of differing approaches to postdischarge contact occurring in multiple hospitals. Our main objective was to describe the prevalence and types of PDIs identified by the different approaches for follow-up contact across 4 children’s hospitals. We also assessed the characteristics of children who have the highest likelihood of having a PDI identified from the contact within each hospital.
METHODS
Study Design, Setting, and Population
Main Outcome Measures
The main outcome measure was identification of a PDI, defined as a medication, appointment, or other discharge-related issue, that was reported and recorded by the child’s caregiver during conversation from the standardized questions that were asked during follow-up contact as part of routine discharge care (Table 1). Medication PDIs included issues filling prescriptions and tolerating medications. Appointment PDIs included not having a follow-up appointment scheduled. Other PDIs included issues with the child’s health condition, discharge instructions, or any other concerns. All PDIs had been recorded prospectively by hospital contact personnel (hospitals A, B, and D) or through an automated texting system into a database (hospital C). Where available, free text comments that were recorded by contact personnel were reviewed by one of the authors (KB) and categorized via an existing framework of PDI designed by Heath et al.10 in order to further understand the problems that were reported.
Patient Characteristics
Patient hospitalization, demographic, and clinical characteristics were obtained from administrative health data at each institution and compared between children with versus without a PDI. Hospitalization characteristics included length of stay, season of admission, and reason for admission. Reason for admission was categorized by using 3M Health’s All Patient Refined Diagnosis Related Groups (APR-DRG) (3M, Maplewood, MN). Demographic characteristics included age at admission in years, insurance type (eg, public, private, and other), and race/ethnicity (Asian/Pacific Islander, Hispanic, non-Hispanic black, non-Hispanic white, and other).
Clinical characteristics included a count of the different classes of medications (eg, antibiotics, antiepileptic medications, digestive motility medications, etc.) administered to the child during admission, the type and number of chronic conditions, and assistance with medical technology (eg, gastrostomy, tracheostomy, etc.). Except for medications, these characteristics were assessed with International Classification of Diseases, Ninth Revision-Clinical Modification (ICD-9-CM) diagnosis codes.
We used the Agency for Healthcare Research and Quality Chronic Condition Indicator classification system, which categorizes over 14,000 ICD-9-CM diagnosis codes into chronic versus nonchronic conditions to identify the presence and number of chronic conditions.12 Children hospitalized with a chronic condition were further classified as having a complex chronic condition (CCC) by using the ICD-9-CM diagnosis classification scheme of Feudtner et al.13 CCCs represent defined diagnosis groupings of conditions expected to last longer than 12 months and involve either multiple organ systems or a single organ system severely enough to require specialty pediatric care and hospitalization.13,14 Children requiring medical technology were identified by using ICD-9-CM codes indicating their use of a medical device to manage and treat a chronic illness (eg, ventricular shunt to treat hydrocephalus) or to maintain basic body functions necessary for sustaining life (eg a tracheostomy tube for breathing).15,16
Statistical Analysis
Given that the primary purpose for this study was to leverage the natural heterogeneity in the approach to follow-up contact across hospitals, we assessed and reported the prevalence and type of PDIs independently for each hospital. Relatedly, we assessed the relationship between patient characteristics and PDI likelihood independently within each hospital as well rather than pool the data and perform a central analysis across hospitals. Of note, APR-DRG and medication class were not assessed for hospital D, as this information was unavailable. We used χ2 tests for univariable analysis and logistic regression with a backwards elimination derivation process (for variables with P ≥ .05) for multivariable analysis; all patient demographic, clinical, and hospitalization characteristics were entered initially into the models. All statistical analyses were performed using SAS version 9.3 (SAS Institute, Cary, NC), and P < .05 was considered statistically significant. This study was approved by the institutional review board at all hospitals.
RESULTS
Study Population
There were 12,986 (51.4%) of 25,259 patients reached by follow-up contact after discharge across the 4 hospitals. Median age at admission for contacted patients was 4.0 years (interquartile range [IQR] 0-11). Of those contacted, 45.2% were female, 59.9% were non-Hispanic white, 51.0% used Medicaid, and 95.4% were discharged to home. Seventy-one percent had a chronic condition (of any complexity) and 40.8% had a CCC. Eighty percent received a prescribed medication during the hospitalization. Median (IQR) length of stay was 2.0 days (IQR 1-4 days). The top 5 most common reasons for admission were bronchiolitis (6.3%), pneumonia (6.2%), asthma (5.2%), seizure (4.9%), and tonsil and adenoid procedures (4.1%).
PDIs
Characteristics Associated with PDIs
Age
Older age was a consistent characteristic associated with PDIs in 3 hospitals. For example, PDI rates in children 10 to 18 years versus <1 year were 30.8% versus 21.4% (P < .001) in hospital A, 19.4% versus 13.7% (P = .002) in hospital B, and 70.3% versus 62.8% (P < .001) in hospital D. In multivariable analysis, age 10 to 18 years versus <1 year at admission was associated with an increased likelihood of PDI in hospital A (odds ratio [OR] 1.7; 95% CI, 1.4-2.0), hospital B (OR 1.4; 95% CI, 1.1-1.8), and hospital D (OR 1.7; 95% CI, 0.9-3.0) (Table 3 and Figure).
Medications
Length of Stay
Shorter length of stay was associated with PDI in 1 hospital. In hospital A, the PDI rate increased significantly (P < .001) from 19.0% to 33.9% as length of stay decreased from ≥7 days to ≤1 day (Table 3). In multivariable analysis, length of stay to ≤1 day versus ≥7 days was associated with increased likelihood of PDI (OR 2.1; 95% CI, 1.7-2.5) in hospital A (Table 3 and Figure).
CCCs
A neuromuscular CCC was associated with PDI in 2 hospitals. In hospital B, the PDI rate was higher in children with a neuromuscular CCC compared with a malignancy CCC (21.3% vs 11.2%). In hospital D, the PDI rates were higher in children with a neuromuscular CCC compared with a respiratory CCC (68.9% vs 40.6%) (Table 3). In multivariable analysis, children with versus without a neuromuscular CCC had an increased likelihood of PDI (OR 1.3; 95% CI, 1.0-1.7) in hospital B (Table 3 and Figure).
DISCUSSION
In this retrospective, pragmatic, multicentered study of follow-up contact with a standardized set of questions asked after discharge for hospitalized children, we found that PDIs were identified often, regardless of who made the contact or how the contact was made. The PDI rates varied substantially across hospitals and were likely influenced by the different follow-up approaches that were used. Most PDIs were related to appointments; fewer PDIs were related to medications and other problems. Older age, shorter length of stay, and neuromuscular CCCs were among the identified risk factors for PDIs.
Our assessment of PDIs was, by design, associated with variation in methods and approach for detection across sites. Further investigation is needed to understand how different approaches for follow-up contact after discharge may influence the identification of PDIs. For example, in the current study, the hospital with the highest PDI rate (hospital D) used hospitalists who provided inpatient care for the patient to make follow-up contact. Although not determined from the current study, this approach could have led the hospitalists to ask questions beyond the standardized ones when assessing for PDIs. Perhaps some of the hospitalists had a better understanding of how to probe for PDIs specific to each patient; this understanding may not have been forthcoming for staff in the other hospitals who were unfamiliar with the patients’ hospitalization course and medical history.
Similar to previous studies in adults, our study reported that appointment PDIs in children may be more common than other types of PDIs.17 Appointment PDIs could have been due to scheduling difficulties, inadequate discharge instructions, lack of adherence to recommended follow-up, or other reasons. Further investigation is needed to elucidate these reasons and to determine how to reduce PDIs related to postdischarge appointments. Some children’s hospitals schedule follow-up appointments prior to discharge to mitigate appointment PDIs that might arise.18 However, doing that for every hospitalized child is challenging, especially for very short admissions or for weekend discharges when many outpatient and community practices are not open to schedule appointments. Additional exploration is necessary to assess whether this might help explain why some children in the current study with a short versus long length of stay had a higher likelihood of PDI.
The rate of medication PDIs (5.2%) observed in the current study is lower than the rate that is reported in prior literature. Dudas et al.1 found that medication PDIs occurred in 21% of hospitalized adult patients. One reason for the lower rate of medication PDIs in children may be that they require the use of postdischarge medications less often than adults. Most medication PDIs in the current study involved problems filling a prescription. There was not enough information in the notes taken from the follow-up contact to distinguish the medication PDI etiologies (eg, a prescription was not sent from the hospital team to the pharmacy, prior authorization from an insurance company for a prescription was not obtained, the pharmacy did not stock the medication). To help overcome medication access barriers, some hospitals fill and deliver discharge medications to the patients’ bedside. One study found that children discharged with medication in hand were less likely to have emergency department revisits within 30 days of discharge.19 Further investigation is needed to assess whether initiatives like these help mitigate medication PDIs in children.
Hospitals may benefit from considering how risk factors for PDIs can be used to prioritize which patients receive follow-up contact, especially in hospitals where contact for all hospitalized patients is not feasible. In the current study, there was variation across hospitals in the profile of risk factors that correlated with increased likelihood of PDI. Some of the risk factors are easier to explain than others. For example, as mentioned above, for some hospitalized children, short length of stay might not permit enough time for hospital staff to set up discharge plans that may sufficiently prevent PDIs. Other risk factors, including older age and neuromuscular CCCs, may require additional assessment (eg, through chart review or in-depth patient and provider interviews) to discover the reasons why they were associated with increased likelihood of PDI. There are additional risk factors that might influence the likelihood of PDI that the current study was not positioned to assess, including health literacy, transportation availability, and language spoken.20-23
This study has several other limitations in addition to the ones already mentioned. Some children may have experienced PDIs that were not reported at contact (eg, the respondent was unaware that an issue was present), which may have led to an undercounting of PDIs. Alternatively, some caregivers may have been more likely to respond to the contact if their child was experiencing a PDI, which may have led to overcounting. PDIs of nonrespondents were not measured. PDIs identified by postdischarge outpatient and community providers or by families outside of contact were not measured. The current study was not positioned to assess the severity of the PDIs or what interventions (including additional health services) were needed to address them. Although we assessed medication use during admission, we were unable to assess the number and type of medications that were prescribed for use postdischarge. Information about the number and type of follow-up visits needed for each child was not assessed. Given the variety of approaches for follow-up contact, the findings may generalize best to individual hospitals by using an approach that best matches to one of them. The current study is not positioned to correlate quality of discharge care with the rate of PDI.
Despite these limitations, the findings from the current study reinforce that PDIs identified through follow-up contact in discharged patients appear to be common. Of PDIs identified, appointment problems were more prevalent than medication or other types of problems. Short length of stay, older age, and other patient and/or hospitalization attributes were associated with an increased likelihood of PDI. Hospitals caring for children may find this information useful as they strive to optimize their processes for follow-up contact after discharge. To help further evaluate the value and importance of contacting patients after discharge, additional study of PDI in children is warranted, including (1) actions taken to resolve PDIs, (2) the impact of identifying and addressing PDIs on hospital readmission, and (3) postdischarge experiences and health outcomes of children who responded versus those who did not respond to the follow-up contact. Moreover, future multisite, comparative effectiveness studies of PDI may wish to consider standardization of follow-up contact procedures with controlled manipulation of key processes (eg, contact by administrator vs nurse vs physician) to assess best practices.
Disclosure
Mr. Blaine, Ms. O’Neill, and Drs. Berry, Brittan, Rehm, and Steiner were supported by the Lucile Packard Foundation for Children’s Health. The authors have no financial relationships relative to this article to disclose. The authors have no conflicts of interest to disclose.
1. Dudas V, Bookwalter T, Kerr KM, Pantilat SZ. The impact of follow-up telephone calls to patients after hospitalization. Dis Mon. 2002;48(4):239-248. PubMed
2. Sanchez GM, Douglass MA, Mancuso MA. Revisiting Project Re-Engineered Discharge (RED): The Impact of a Pharmacist Telephone Intervention on Hospital Readmission Rates. Pharmacotherapy. 2015;35(9):805-812. PubMed
3. Jones J, Clark W, Bradford J, Dougherty J. Efficacy of a telephone follow-up system in the emergency department. J Emerg Med. 1988;6(3):249-254. PubMed
4. Mistiaen P, Poot E. Telephone follow-up, initiated by a hospital-based health professional, for postdischarge problems in patients discharged from hospital to home. Cochrane Database Syst Rev. 2006(4):CD004510. PubMed
5. Lushaj EB, Nelson K, Amond K, Kenny E, Badami A, Anagnostopoulos PV. Timely Post-discharge Telephone Follow-Up is a Useful Tool in Identifying Post-discharge Complications Patients After Congenital Heart Surgery. Pediatr Cardiol. 2016;37(6):1106-1110. PubMed
6. McVay MR, Kelley KR, Mathews DL, Jackson RJ, Kokoska ER, Smith SD. Postoperative follow-up: is a phone call enough? J Pediatr Surg. 2008;43(1):83-86. PubMed
7. Chande VT, Exum V. Follow-up phone calls after an emergency department visit. Pediatrics. 1994;93(3):513-514. PubMed
8. Sutton D, Stanley P, Babl FE, Phillips F. Preventing or accelerating emergency care for children with complex healthcare needs. Arch Dis Child. 2008;93(1):17-22. PubMed
9. Patel PB, Vinson DR. Physician e-mail and telephone contact after emergency department visit improves patient satisfaction: a crossover trial. Ann Emerg Med. 2013;61(6):631-637. PubMed
10. Heath J, Dancel R, Stephens JR. Postdischarge phone calls after pediatric hospitalization: an observational study. Hosp Pediatr. 2015;5(5):241-248. PubMed
11. Biffl SE, Biffl WL. Improving transitions of care for complex pediatric trauma patients from inpatient rehabilitation to home: an observational pilot study. Patient Saf Surg. 2015;9:33-37. PubMed
12. AHRQ. Clinical Classifications Software (CCS) for ICD-9-CM. http://www.hcup-us.ahrq.gov/toolssoftware/ccs/ccs.jsp. Accessed on January 31,2012.
13. Feudtner C, Christakis DA, Connell FA. Pediatric deaths attributable to complex chronic conditions: a population-based study of Washington State, 1980-1997. Pediatrics. 2000;106(1 Pt 2):205-209. PubMed
14. Berry JG, Hall DE, Kuo DZ, et al. Hospital utilization and characteristics of patients experiencing recurrent readmissions within children’s hospitals. JAMA. 2011;305(7):682-690. PubMed
15. Palfrey JS, Walker DK, Haynie M, et al. Technology’s children: report of a statewide census of children dependent on medical supports. Pediatrics. 1991;87(5):611-618. PubMed
16. Feudtner C, Villareale NL, Morray B, Sharp V, Hays RM, Neff JM. Technology-dependency among patients discharged from a children’s hospital: a retrospective cohort study. BMC Pediatr. 2005;5(1):8-15. PubMed
17. Arora VM, Prochaska ML, Farnan JM, et al. Problems after discharge and understanding of communication with their primary care physicians among hospitalized seniors: a mixed methods study. J Hosp Med. 2010;5(7):385-391. PubMed
18. Brittan M, Tyler A, Martin S, et al. A Discharge Planning Template for the Electronic Medical Record Improves Scheduling of Neurology Follow-up for Comanaged Seizure Patients. Hosp Pediatr. 2014;4(6):366-371. PubMed
19. Hatoun J, Bair-Merritt M, Cabral H, Moses J. Increasing Medication Possession at Discharge for Patients With Asthma: The Meds-in-Hand Project. Pediatrics. 2016;137(3):e20150461. doi:10.1542/peds.2015-0461. PubMed
20. Berry JG, Goldmann DA, Mandl KD, et al. Health information management and perceptions of the quality of care for children with tracheotomy: a qualitative study. BMC Health Serv Res. 2011;11:117-125. PubMed
21. Berry JG, Ziniel SI, Freeman L, et al. Hospital readmission and parent perceptions of their child’s hospital discharge. Int J Qual Health Care. 2013;25(5):573-581. PubMed
22. Carusone SC, O’Leary B, McWatt S, Stewart A, Craig S, Brennan DJ. The Lived Experience of the Hospital Discharge “Plan”: A Longitudinal Qualitative Study of Complex Patients. J Hosp Med. 2017;12(1):5-10. PubMed
23. Leyenaar JK, O’Brien ER, Leslie LK, Lindenauer PK, Mangione-Smith RM. Families’ Priorities Regarding Hospital-to-Home Transitions for Children With Medical Complexity. Pediatrics. 2017;139(1):e20161581. doi:10.1542/peds.2016-1581. PubMed
© 2018 Society of Hospital Medicine