User login
Incidence and Management of Asymptomatic Hypertensive Urgency at a VA Emergency Department
Hypertension affects more than 65 million individuals in the U.S., accounting for nearly 30% of the adult population.1 Less than 50% of those with hypertension are taking appropriate pharmacotherapy.2 Hypertension contributes to cardiovascular events, including cerebrovascular accident, transient ischemic attack, hypertensive retinopathy, renal failure, myocardial infarction, and heart failure.1 Chronic hypertension mainly is an asymptomatic condition, earning the nickname “the silent killer.”2 An acute, symptomatic elevation in blood pressure (BP) often is referred to as hypertensive emergency. Symptoms of end-organ damage can include headache, blurry vision, chest pain, shortness of breath, altered mental status, epistaxis, and oliguria.2 Although rare, hypertensive emergencies should be treated immediately. The Seventh Report of the Joint National Committee (JNC 7), and the more recent JNC 8, have published guidelines on managing chronic hypertension.3,4 However, neither report provides guidance on hypertensive emergency or the appropriate actions in cases of extremely elevated BP in an asymptomatic patient.3,4
Acute hypertensive episodes—often referred to as hypertensive crises—are responsible for nearly 8 million hospitalizations each year and 20 million visits to the emergency department (ED).5,6 Most of these visits are same-day “treat-and-release” events.5 There is no universally accepted BP value associated with a hypertensive crisis, but most resources state that a BP ≥ 180/110 mm Hg requires attention.2,7 Without other symptoms, elevated BP is not an emergency, yet ED referral for acute management is common.7
Three terms fall under the umbrella of hypertensive crises: hypertensive emergency, hypertensive urgency, and asymptomatic hypertension (AH).2 In a 2007 article, the American College of Chest Physicians defined hypertensive emergency as BP ≥ 180/110 mm Hg with evidence of end-organ damage.2 Symptoms are almost always present in true hypertensive emergencies, and immediate medical intervention is required to halt further organ damage. In the same article, hypertensive urgency is defined as BP ≥ 180/110 mm Hg without end-organ damage.2 The definition of hypertensive urgency could be further refined to include the presence of cardiovascular and renal risk factors, although this additional point is not consistent across the literature. Asymptomatic hypertension is similar to hypertensive urgency; however, there is an absence of signs or symptoms of end-organ damage.2 There is ambiguity in the literature concerning managing hypertensive urgency and AH, but both share a basic tenet: Immediate BP reduction is not essential. Gradual dosage adjustment(s) of oral medications, preferably by a primary care provider (PCP), and follow-up within 7 days are recommended.7
Limited evidence exists to guide ED providers in managing AH. Long-term outcomes and guidelines intended for the primary care setting should not be extrapolated to acute management in the ED. With limited treatment guidelines, providers might be more likely to refer patients with AH to the ED for evaluation. In 2013, the American College of Emergency Physicians (ACEP) created a clinical policy concerning AH in the ED. The ACEP concluded that screening for target organ injury and medical intervention in the ED does not reduce rates of adverse events (AEs) and could lead to overtreatment and acute hypoperfusion.7 More recently, Patel and colleagues published findings on hypertensive urgency in the ambulatory care setting, which similarly found that referral to the ED was associated with increased use of health care resources and no change in short-term major AEs.8 The ACEP recommends that patients presenting with AH be referred to primary care clinics where long-term monitoring and medication adjustments can be achieved more cost-effectively.7
The objective of this retrospective evaluation was to assess the incidence and management of AH within a VA ED. The authors aimed to provide insight into how these patients are managed and discuss alternatives to ED use.
Methods
This retrospective observational study was conducted within the North Florida/South Georgia Veterans Health System (NFSGVHS), which provides patient care at 2 medical centers in Gainesville and Lake City, Florida, as well as 11 outpatient clinics located throughout North Florida and South Georgia. The NFSGVHS serves rural and urban veteran populations. Study approval was granted by the NFSGVHS Institutional Review Board and Research and Development Committee.
Inclusion/Exclusion Criteria
Adult patients who were ordered at least 1 antihypertensive medication in the ED from July 1, 2011 to July 1, 2014, in addition to being asymptomatic with BP ≥ 180/110 mm Hg at ED triage were included. Based on clinical experience, the authors estimated that 3 years would provide a sample size of more than 100 patients. Patients were excluded if they presented with any acute symptoms or were hospitalized for further management.
Data Collection
Baseline demographics were collected for all participants. During the ED encounter, pre- and postintervention vital signs were recorded and prespecified laboratory data obtained. Interrater reliability was accounted for by performing random reviews of previously collected data to ensure consistency during the chart review process. Renal end-organ damage was defined using Acute Kidney Injury Network criteria, a serum creatinine 50% above baseline, or an absolute increase in baseline serum creatinine by 0.3 mg/dL.9 Additional laboratory markers of organ damage included cardiac troponin levels. Urinalysis results also were assessed to determine the presence of hematuria or proteinuria. Patient-reported nonadherence with medications was determined by reviewing ED provider and/or nurse documentation notes for the index ED encounter.
Investigators documented the route (IV or oral) and antihypertensive(s) medication selected for each patient. Adverse effects and any changes to patients’ outpatient medication regimens were noted. Investigators also assessed days to next medical contact after ED discharge to determine whether follow-up occurred according to the recommended standard of 7 days.9 Days to next medical contact was defined as any contact—in person or by telephone—that was documented in the electronic health record after the index ED visit.
Statistical Analysis
Descriptive statistics, including mean, median, and standard deviation, were used to analyze data.
Results
A total of 1,052 patients presented with BP ≥ 180/110 mm Hg and for whom antihypertensive medication was ordered but not necessarily given in the ED. Of the total, 724 patients were excluded because of hospital admission for other primary diagnoses; however, 6 of these patients were admitted for hypertensive urgency. The final analysis included 132 patients who presented with the primary condition of elevated BP without any accompanying symptoms. Among these patients, 2 had repeat ED visits for AH during the specified time frame. 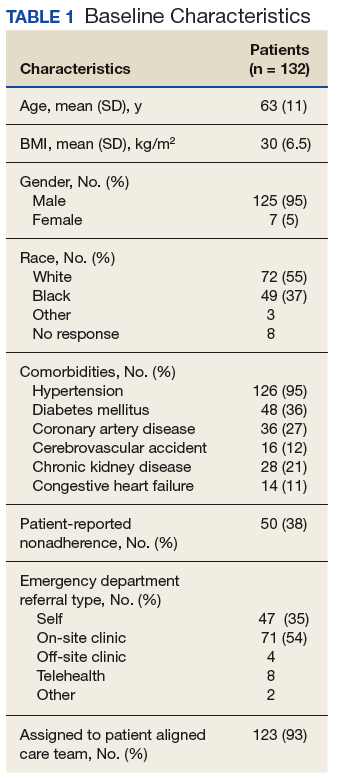
Most patients were male with an average age of 63 years and documented history of hypertension. Nearly all patients had established primary care within the NFSGVHS. The most common comorbidity was diabetes mellitus (36%), followed by coronary artery disease (27%) and chronic kidney disease (CKD) (21%) (Table 1). About one-third of patients presented to the ED on their own volition, and slightly more than half were referred to the ED by primary care or specialty clinics. 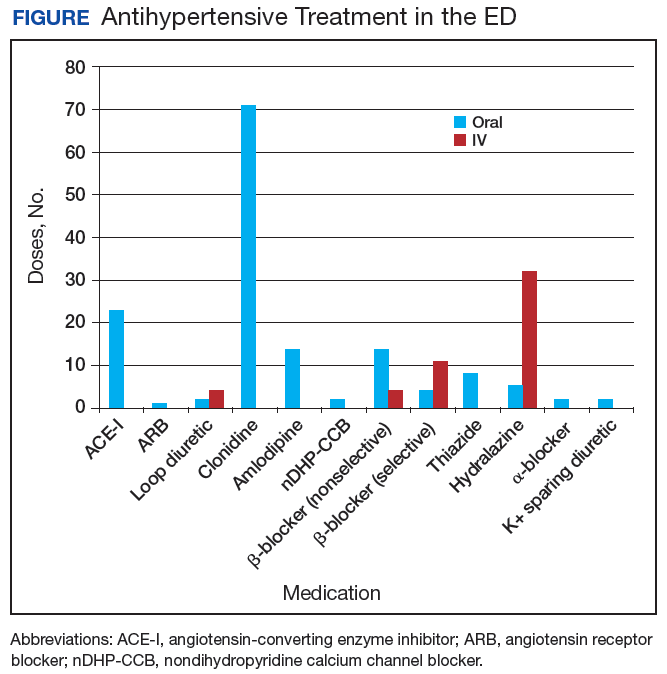
In the ED, 130 patients received BP treatment (Table 2). Medication was ordered for 2 patients who did not receive treatment. In total, 12 different medication classes were used for treating patients with AH in the ED (Figure). 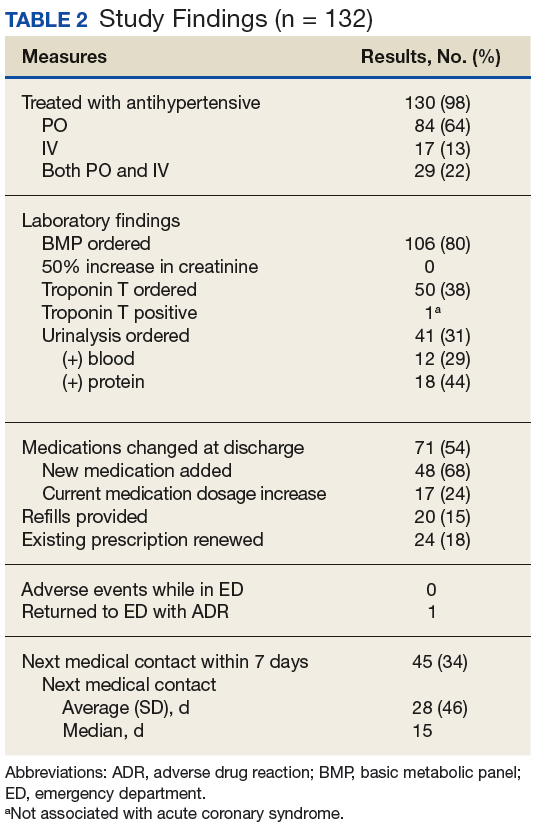
Treatment in the ED resulted in an average BP and heart rate reduction of 27/20 mm Hg and 5 beats per minute, respectively. About 80% of patients had a basic metabolic panel drawn, and there were no instances of acute kidney injury. Of the patients in the study 38% had cardiac enzymes collected, and only 1 patient had a positive result, which was determined to be unrelated to acute coronary syndrome. Forty-one (31%) of patients had a urinalysis; 12 has positive results for hematuria, and 18 revealed proteinuria. Of note, the 6 patients who were hospitalized for hypertensive urgency had neither symptoms at presentation to the ED nor laboratory findings indicating end-organ damage. The reason these patients were admitted is unclear.
At discharge, ED providers made changes to 54% of patients’ outpatient antihypertensive regimens. These changes included adding a new medication (68%), increasing the dosage of an existing medication (24%), or multiple changes (8%). Refills were provided for 18% of prescriptions. Follow-up within 7 days from ED discharge was recorded for 34% of patients. One patient received follow-up outside the NFSGVHS and was not included in this analysis.
Discussion
The aim of this retrospective study was to determine the incidence of AH in a VA ED and describe how these patients were managed. Overall, the rate of patients presenting to the ED with AH during the study period was about 1 patient every 8 days or 45 patients per year. By comparison, more than 30,000 patients are seen at the NFSGVHS ED annually. Although AH seems to be an uncommon occurrence, study findings raise questions about the value of managing the condition in the ED.
This study found several management strategies as well as noteworthy trends. For example, laboratory tests were not ordered routinely for all patients, suggesting that some ED providers question their use for AH. There were no patients with acute elevations in serum creatinine that indicated acute kidney injury, and although hematuria and proteinuria were common findings, neither were specific for acute injury. However, there were findings typical of chronic hypertension, and urinalysis may provide little benefit when testing for acute kidney injury. Only 1 patient showed elevated cardiac enzymes, which was determined to be a result of CKD.
Although not included in the final analysis, the 6 patients who were hospitalized for hypertensive urgency were similar in that they had neither symptoms at presentation to the ED nor laboratory findings indicating end-organ damage. Collectively, these findings support existing literature that questions the utility of laboratory testing of patients with AH in the ED.10
Patients also were treated with a variety of antihypertensive agents in the ED. One explanation might be outpatient nonadherence with medications. In patients with AH, it is common to provide doses of chronic medications that the patient might have missed and should be taking on a regular basis. Therefore, assessing adherence with current medications before modifying chronic therapy is an important initial step when managing AH.
Although oral agents primarily were used, IV antihypertensives were administered to about one-third of patients. Preference for IV administration in the ED might be related to its ability to lower BP quickly. The practice of obtaining IV access for medication in a patient with AH is costly, unnecessary, and potentially harmful.7 The authors theorize that this practice is performed, in many cases, as an attempt to expedite ED discharge after an acceptable BP reading is documented.
Rapid reductions in BP can precipitate hypoperfusion inadvertently and are more likely to occur with IV agents than with oral ones. Therefore, the safety, convenience, and cost savings associated with oral administration make it the preferred route for managing AH. 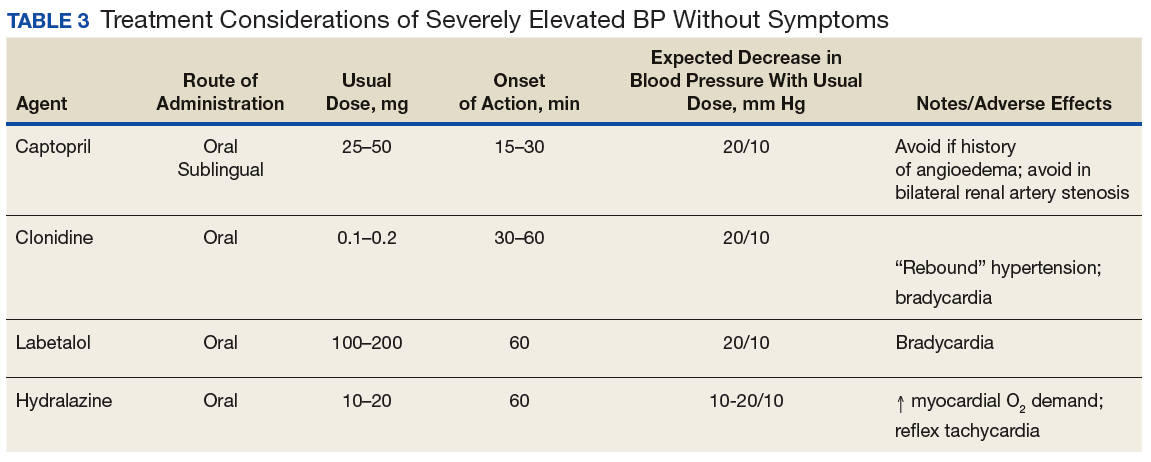
Best Practices
Primary care clinics are best suited to manage AH because medication adjustments and long-term monitoring are easier to perform and at substantially lower costs when compared with that of the ED. Rather than immediately referring a patient to the ED, clinicians should consider factors that could elevate BP, such as medication nonadherence, anxiety, acute pain, recent tobacco or caffeine use, or white coat syndrome. Staff should be well educated on proper BP measurement and instructed to repeat the reading for confirmation. Before measuring BP, allow the patient to sit quietly for 5 minutes with the feet flat on the floor and arm supported.3 Ideally, the measurement used should be the average of 3 BP readings on an automated device.11 If BP readings are high, staff should ask the patient about medication adherence and missed medication(s) should be administered.
It also is reasonable to have the patient rest quietly for up to 30 minutes because rest has been shown to reduce BP in some patients.12 The drawback to the prolonged rest strategy is the potential to cause delays in care for other patients. However, it is important to remember that wait times in the ED often are measured in hours, which causes frustration for patients referred to the ED for AH management. Before completing the office visit, the provider should recheck BP using proper technique and confirm that the patient has antihypertensive medication(s) in his/her possession; a follow-up appointment should be scheduled for no later than 1 week.
Primary care providers might be concerned about taking on additional liability and could favor ED referral, but legislation makes it difficult for EDs to defer nonemergent issues to primary care clinics. The Emergency Medical Treatment and Labor Act states that hospitals are prohibited from denying a patient care during an emergency.13 Despite evidence that AH is not an emergency, many patients continue to be referred to the ED. One-third of patients presented to the ED on their own volition and more than one-half were referred by health care personnel. This strongly suggests that both patients and health care personnel consider AH an emergency medical condition requiring immediate attention. However, patients with AH rarely are found to have any acute end-organ damage; therefore, acute treatment and extensive laboratory or diagnostic testing in the ED provides little, if any, benefit.10 The authors believe the ACEP clinical policy should be adopted into mainstream practice to help reduce health care costs and preserve ED resources for patients with true emergencies.
Another pervasive issue that could contribute to inappropriate AH referrals to the ED is the shortage of PCPs and limited same-day appointments for nonemergent conditions. In a 2017 survey, the average wait time for a PCP appointment ranged between 12 and 109 days, depending on the metropolitan area. The national average wait time conducted by this survey was 29.3 days.14 When primary care appointments are unavailable, triage staff could recommend that patients seek care in the ED. Additionally, patients might choose to seek ED care rather than wait for the next available PCP appointment. Clinic proximity to an ED could influence referral rates. In other words, medical centers or health systems with primary care clinics and ED services under one roof could experience more frequent ED referrals.
A promising strategy to help overcome the challenges of addressing AH and avoiding ED referrals is increasing patient access to and use of qualified, nonphysician providers, such as clinical pharmacists and nurse practitioners. Large health systems such as the VA and Kaiser Permanente have employed clinical pharmacist providers to reduce follow-up times for patients in primary care settings.15 Furthermore, there is substantial evidence that supports the cost-effectiveness and clinical success of pharmacist-driven hypertension clinics.16-18 Nurse-driven efforts to improve hypertension control have been successfully implemented in health systems.19 Both clinical pharmacist and nurse-managed hypertension clinics are effective solutions to manage patients with AH who might otherwise use costly ED services.For example, the average cost of a single ED visit is $740 to $3,437.20 In comparison, a 2010 report from the Agency for Healthcare Research and Quality showed the average annual cost of managing hypertension in ambulatory care clinics was $442 per adult, a cost considerably lower than that of the ED.21
Limitations
The retrospective and observational design of this study are inherent limitations. This study was not designed to evaluate cardiovascular outcomes after ED encounters. The sample size could have been larger if patients with BP < 180/110 mm Hg at ED triage were included; however, the 180/110 mm Hg threshold was chosen because it was the most widely agreed on BP value in the literature. This study did not capture patients who presented with AH and did not receive any acute treatment in the ED.Prescribing patterns based on provider training (eg, emergency medicine, family medicine, or internal medicine) were not tracked and might have accounted for differences in selection of diagnostic tests, laboratory ordering, and route of drug administration preference.
A small subset of patients reported positive pain scores at triage but did not describe acute pain. Pain scores are highly subjective, and few primary literature sources link chronic pain with increased BP.22,23 Nevertheless, patients who reported acute pain and elevated BP were excluded in order to identify truly asymptomatic patients. VA hospitals are unique health systems and data obtained from this study might not be applicable to other public or private facilities. Last, the study did not take into account patients’ psychosocial circumstances that might have fostered a disproportionate reliance on the ED for health care.
Conclusion
Asymptomatic patients with elevated BP are treated in the ED despite no evidence supporting improved outcomes after acute BP lowering in this population. Follow-up after ED encounters for AH did not occur consistently within guideline-recommended 7 days, a trend that also occurs in non-VA systems.8 Clinics and health care systems could establish policies to prevent or minimize management of AH in the ED. Ideally, AH should be managed in a clinic setting by a PCP, but growing clinician workload might lead to increasing wait times and difficultly obtaining same-day appointments. Nurse-led clinics and clinical pharmacists operating under a scope of practice and working closely with a PCP are a cost-effective solution to ensure timely treatment and appropriate follow-up of patients with uncontrolled hypertension.
Acknowledgments
This material is the result of work supported with resources and the use of facilities at the North Florida South Georgia Veterans Health System in Gainesville, Florida.
1. Nwankwo T, Yoon SS, Burt V, Gu Q. Hypertension among adults in the United States: National Health and Nutrition Examination Survey, 2011-2012. NCHS Data Brief. 2013;(133):
1-8.
2. Marik PE, Varon J. Hypertensive crises: challenges and management. Chest. 2007;131(6):1949-1962.
3. Chobanian AV, Bakris GL, Black HR, et al; Joint National Committee on Prevention, Detection, Evaluation, and Treatment of High Blood Pressure. National Heart, Lung, and Blood Institute; National High Blood Pressure Education Program Coordinating Committee. Seventh report of the joint national committee on prevention, detection, evaluation, and treatment of high blood pressure. Hypertension. 2003;42(6):1206-1252.
4. James, PA, Oparil, S, Carter, BL, et al. 2014 Evidence-based guideline for the management of high blood pressure in adults report from the panel members appointed to the Eighth Joint National Committee (JNC 8). JAMA. 2014;311(5):507-520.
5. American Heart Association. High blood pressure ER visits jumped 25 percent in 2006-11. http://newsroom.heart.org/news/high-blood-pressure-er-visits-jumped-25-percent-in-2006-11. Published September 9, 2014. Accessed January 19, 2018.
6. Owens P, Mutter R. Statistical brief #100: emergency department visits for adults in community hospitals. Agency for Healthcare Research and Quality. http://www.hcup-us.ahrq.gov/reports/statbriefs/sb100.pdf. Published November 2010. Accessed January 19, 2018.
7. Wolf SJ, Lo B, Shih RD, Smith MD, Fesmire FM; American College of Emergency Physicians Clinical Policies Committee. Clinical policy: critical issues in the evaluation and management of adult patients in the emergency department with asymptomatic elevated blood pressure. Ann Emerg Med. 2013;62(1):59-68.
8. Patel KK, Young L, Howell EH, et al. Characteristics and outcomes of patients presenting with hypertensive urgency in the office setting. JAMA Intern Med. 2016;176(7):981-988.
9. Acute Kidney Injury Network. AKIN studies. http://www.akinet.org/akinstudies.php. Updated 2017. Accessed January 19, 2018.
10. Karras DJ, Kruus LK, Cienki JJ, et al. Utility of routine testing for patients with asymptomatic severe blood pressure elevation in the emergency department. Ann Emerg Med. 2008;51(3):231-239.
11. The SPRINT Research Group. A Randomized trial of Intensive versus standard blood pressure control. N Engl J Med. 2015;373:2103-2116.
12. Grassi D, O’Flaherty M, Pellizzari M, et al; Group of Investigators of the REHASE Program. Hypertensive urgencies in the emergency department: evaluating blood pressure response to rest and to antihypertensive drugs with different profiles. J Clin Hypertens (Greenwich). 2008;10(9):662-667.
13. Canters for Medicare & Medicaid Services. Emergency medical treatment & labor act (EMTALA). https://www.cms.gov/Regulations-and-Guidance/Legislation/EMTALA/index.html. Updated March 26, 2012. Accessed January 19, 2018.
14. Merritt Hawkins. 2017 Survey of physician appointment wait times and Medicare and Medicaid acceptance rates. https://www.merritthawkins.com/uploadedFiles/Merritt-Hawkins/Pdf/mha2017waittimesurveyPDF.pdf. Published 2017. Accessed January 19, 2018.
15. Galewitz P. VA treats patients’ impatience with clinical pharmacists. USA Today. http://www.usatoday.com/story/news/2016/10/24/kaiser-va-treats-patients-impatience-clinical-pharmacists/92479132/. Published October 24, 2016. Accessed January 19, 2018.
16. Carter BL, Ardery G, Dawson JD, et al. Physician and pharmacist collaboration to improve blood pressure control. Arch Intern Med. 2009;169(21):1996-2002.
17. Borenstein JE, Graber G, Saltiel E, et al. Physician-pharmacist comanagement of hypertension: a randomized comparative trial. Pharmacotherapy. 2003;23(2):209-216.
18. Okamoto MP, Nakahiro RK. Pharmacoeconomic evaluation of a pharmacist-managed hypertension clinic. Pharmacotherapy. 2001;21(11):1337-1344.
19. Brown VM. Managing patients with hypertension in nurse-led clinics. Nursing. 2017;47(4):16-19.
20. Caldwell N, Srebotnjak T, Wang T, Hsia R. “How Much Will I Get Charged for This?” Patient charges for top ten diagnoses in the emergency department. PLoS ONE. 2013;8(2): e55491.
21. Davis KE. Expenditures for hypertension among adults age 18 and older, 2010: estimates for the U.S. civilian noninstitutionalized population. Agency for Healthcare Research and Quality. https://meps.ahrq.gov/data_files/publications/st404/stat404.shtml. Published April 2013. Accessed January 19, 2018.
22. Marco CA, Plewa MC, Buderer N, et al. Self-reported pain scores in the emergency department: lack of association with vital signs. Acad Emerg Med. 2006;13(9):974-979.
23. Wood D, Goodnight S, Haig AJ, Nasari T. Body mass index, but not blood pressure is related to the level of pain in persons with chronic pain. J Back Musculoskelet Rehabil. 2011;24(2):
111-115.
Hypertension affects more than 65 million individuals in the U.S., accounting for nearly 30% of the adult population.1 Less than 50% of those with hypertension are taking appropriate pharmacotherapy.2 Hypertension contributes to cardiovascular events, including cerebrovascular accident, transient ischemic attack, hypertensive retinopathy, renal failure, myocardial infarction, and heart failure.1 Chronic hypertension mainly is an asymptomatic condition, earning the nickname “the silent killer.”2 An acute, symptomatic elevation in blood pressure (BP) often is referred to as hypertensive emergency. Symptoms of end-organ damage can include headache, blurry vision, chest pain, shortness of breath, altered mental status, epistaxis, and oliguria.2 Although rare, hypertensive emergencies should be treated immediately. The Seventh Report of the Joint National Committee (JNC 7), and the more recent JNC 8, have published guidelines on managing chronic hypertension.3,4 However, neither report provides guidance on hypertensive emergency or the appropriate actions in cases of extremely elevated BP in an asymptomatic patient.3,4
Acute hypertensive episodes—often referred to as hypertensive crises—are responsible for nearly 8 million hospitalizations each year and 20 million visits to the emergency department (ED).5,6 Most of these visits are same-day “treat-and-release” events.5 There is no universally accepted BP value associated with a hypertensive crisis, but most resources state that a BP ≥ 180/110 mm Hg requires attention.2,7 Without other symptoms, elevated BP is not an emergency, yet ED referral for acute management is common.7
Three terms fall under the umbrella of hypertensive crises: hypertensive emergency, hypertensive urgency, and asymptomatic hypertension (AH).2 In a 2007 article, the American College of Chest Physicians defined hypertensive emergency as BP ≥ 180/110 mm Hg with evidence of end-organ damage.2 Symptoms are almost always present in true hypertensive emergencies, and immediate medical intervention is required to halt further organ damage. In the same article, hypertensive urgency is defined as BP ≥ 180/110 mm Hg without end-organ damage.2 The definition of hypertensive urgency could be further refined to include the presence of cardiovascular and renal risk factors, although this additional point is not consistent across the literature. Asymptomatic hypertension is similar to hypertensive urgency; however, there is an absence of signs or symptoms of end-organ damage.2 There is ambiguity in the literature concerning managing hypertensive urgency and AH, but both share a basic tenet: Immediate BP reduction is not essential. Gradual dosage adjustment(s) of oral medications, preferably by a primary care provider (PCP), and follow-up within 7 days are recommended.7
Limited evidence exists to guide ED providers in managing AH. Long-term outcomes and guidelines intended for the primary care setting should not be extrapolated to acute management in the ED. With limited treatment guidelines, providers might be more likely to refer patients with AH to the ED for evaluation. In 2013, the American College of Emergency Physicians (ACEP) created a clinical policy concerning AH in the ED. The ACEP concluded that screening for target organ injury and medical intervention in the ED does not reduce rates of adverse events (AEs) and could lead to overtreatment and acute hypoperfusion.7 More recently, Patel and colleagues published findings on hypertensive urgency in the ambulatory care setting, which similarly found that referral to the ED was associated with increased use of health care resources and no change in short-term major AEs.8 The ACEP recommends that patients presenting with AH be referred to primary care clinics where long-term monitoring and medication adjustments can be achieved more cost-effectively.7
The objective of this retrospective evaluation was to assess the incidence and management of AH within a VA ED. The authors aimed to provide insight into how these patients are managed and discuss alternatives to ED use.
Methods
This retrospective observational study was conducted within the North Florida/South Georgia Veterans Health System (NFSGVHS), which provides patient care at 2 medical centers in Gainesville and Lake City, Florida, as well as 11 outpatient clinics located throughout North Florida and South Georgia. The NFSGVHS serves rural and urban veteran populations. Study approval was granted by the NFSGVHS Institutional Review Board and Research and Development Committee.
Inclusion/Exclusion Criteria
Adult patients who were ordered at least 1 antihypertensive medication in the ED from July 1, 2011 to July 1, 2014, in addition to being asymptomatic with BP ≥ 180/110 mm Hg at ED triage were included. Based on clinical experience, the authors estimated that 3 years would provide a sample size of more than 100 patients. Patients were excluded if they presented with any acute symptoms or were hospitalized for further management.
Data Collection
Baseline demographics were collected for all participants. During the ED encounter, pre- and postintervention vital signs were recorded and prespecified laboratory data obtained. Interrater reliability was accounted for by performing random reviews of previously collected data to ensure consistency during the chart review process. Renal end-organ damage was defined using Acute Kidney Injury Network criteria, a serum creatinine 50% above baseline, or an absolute increase in baseline serum creatinine by 0.3 mg/dL.9 Additional laboratory markers of organ damage included cardiac troponin levels. Urinalysis results also were assessed to determine the presence of hematuria or proteinuria. Patient-reported nonadherence with medications was determined by reviewing ED provider and/or nurse documentation notes for the index ED encounter.
Investigators documented the route (IV or oral) and antihypertensive(s) medication selected for each patient. Adverse effects and any changes to patients’ outpatient medication regimens were noted. Investigators also assessed days to next medical contact after ED discharge to determine whether follow-up occurred according to the recommended standard of 7 days.9 Days to next medical contact was defined as any contact—in person or by telephone—that was documented in the electronic health record after the index ED visit.
Statistical Analysis
Descriptive statistics, including mean, median, and standard deviation, were used to analyze data.
Results
A total of 1,052 patients presented with BP ≥ 180/110 mm Hg and for whom antihypertensive medication was ordered but not necessarily given in the ED. Of the total, 724 patients were excluded because of hospital admission for other primary diagnoses; however, 6 of these patients were admitted for hypertensive urgency. The final analysis included 132 patients who presented with the primary condition of elevated BP without any accompanying symptoms. Among these patients, 2 had repeat ED visits for AH during the specified time frame.
Most patients were male with an average age of 63 years and documented history of hypertension. Nearly all patients had established primary care within the NFSGVHS. The most common comorbidity was diabetes mellitus (36%), followed by coronary artery disease (27%) and chronic kidney disease (CKD) (21%) (Table 1). About one-third of patients presented to the ED on their own volition, and slightly more than half were referred to the ED by primary care or specialty clinics.
In the ED, 130 patients received BP treatment (Table 2). Medication was ordered for 2 patients who did not receive treatment. In total, 12 different medication classes were used for treating patients with AH in the ED (Figure).
Treatment in the ED resulted in an average BP and heart rate reduction of 27/20 mm Hg and 5 beats per minute, respectively. About 80% of patients had a basic metabolic panel drawn, and there were no instances of acute kidney injury. Of the patients in the study 38% had cardiac enzymes collected, and only 1 patient had a positive result, which was determined to be unrelated to acute coronary syndrome. Forty-one (31%) of patients had a urinalysis; 12 has positive results for hematuria, and 18 revealed proteinuria. Of note, the 6 patients who were hospitalized for hypertensive urgency had neither symptoms at presentation to the ED nor laboratory findings indicating end-organ damage. The reason these patients were admitted is unclear.
At discharge, ED providers made changes to 54% of patients’ outpatient antihypertensive regimens. These changes included adding a new medication (68%), increasing the dosage of an existing medication (24%), or multiple changes (8%). Refills were provided for 18% of prescriptions. Follow-up within 7 days from ED discharge was recorded for 34% of patients. One patient received follow-up outside the NFSGVHS and was not included in this analysis.
Discussion
The aim of this retrospective study was to determine the incidence of AH in a VA ED and describe how these patients were managed. Overall, the rate of patients presenting to the ED with AH during the study period was about 1 patient every 8 days or 45 patients per year. By comparison, more than 30,000 patients are seen at the NFSGVHS ED annually. Although AH seems to be an uncommon occurrence, study findings raise questions about the value of managing the condition in the ED.
This study found several management strategies as well as noteworthy trends. For example, laboratory tests were not ordered routinely for all patients, suggesting that some ED providers question their use for AH. There were no patients with acute elevations in serum creatinine that indicated acute kidney injury, and although hematuria and proteinuria were common findings, neither were specific for acute injury. However, there were findings typical of chronic hypertension, and urinalysis may provide little benefit when testing for acute kidney injury. Only 1 patient showed elevated cardiac enzymes, which was determined to be a result of CKD.
Although not included in the final analysis, the 6 patients who were hospitalized for hypertensive urgency were similar in that they had neither symptoms at presentation to the ED nor laboratory findings indicating end-organ damage. Collectively, these findings support existing literature that questions the utility of laboratory testing of patients with AH in the ED.10
Patients also were treated with a variety of antihypertensive agents in the ED. One explanation might be outpatient nonadherence with medications. In patients with AH, it is common to provide doses of chronic medications that the patient might have missed and should be taking on a regular basis. Therefore, assessing adherence with current medications before modifying chronic therapy is an important initial step when managing AH.
Although oral agents primarily were used, IV antihypertensives were administered to about one-third of patients. Preference for IV administration in the ED might be related to its ability to lower BP quickly. The practice of obtaining IV access for medication in a patient with AH is costly, unnecessary, and potentially harmful.7 The authors theorize that this practice is performed, in many cases, as an attempt to expedite ED discharge after an acceptable BP reading is documented.
Rapid reductions in BP can precipitate hypoperfusion inadvertently and are more likely to occur with IV agents than with oral ones. Therefore, the safety, convenience, and cost savings associated with oral administration make it the preferred route for managing AH.
Best Practices
Primary care clinics are best suited to manage AH because medication adjustments and long-term monitoring are easier to perform and at substantially lower costs when compared with that of the ED. Rather than immediately referring a patient to the ED, clinicians should consider factors that could elevate BP, such as medication nonadherence, anxiety, acute pain, recent tobacco or caffeine use, or white coat syndrome. Staff should be well educated on proper BP measurement and instructed to repeat the reading for confirmation. Before measuring BP, allow the patient to sit quietly for 5 minutes with the feet flat on the floor and arm supported.3 Ideally, the measurement used should be the average of 3 BP readings on an automated device.11 If BP readings are high, staff should ask the patient about medication adherence and missed medication(s) should be administered.
It also is reasonable to have the patient rest quietly for up to 30 minutes because rest has been shown to reduce BP in some patients.12 The drawback to the prolonged rest strategy is the potential to cause delays in care for other patients. However, it is important to remember that wait times in the ED often are measured in hours, which causes frustration for patients referred to the ED for AH management. Before completing the office visit, the provider should recheck BP using proper technique and confirm that the patient has antihypertensive medication(s) in his/her possession; a follow-up appointment should be scheduled for no later than 1 week.
Primary care providers might be concerned about taking on additional liability and could favor ED referral, but legislation makes it difficult for EDs to defer nonemergent issues to primary care clinics. The Emergency Medical Treatment and Labor Act states that hospitals are prohibited from denying a patient care during an emergency.13 Despite evidence that AH is not an emergency, many patients continue to be referred to the ED. One-third of patients presented to the ED on their own volition and more than one-half were referred by health care personnel. This strongly suggests that both patients and health care personnel consider AH an emergency medical condition requiring immediate attention. However, patients with AH rarely are found to have any acute end-organ damage; therefore, acute treatment and extensive laboratory or diagnostic testing in the ED provides little, if any, benefit.10 The authors believe the ACEP clinical policy should be adopted into mainstream practice to help reduce health care costs and preserve ED resources for patients with true emergencies.
Another pervasive issue that could contribute to inappropriate AH referrals to the ED is the shortage of PCPs and limited same-day appointments for nonemergent conditions. In a 2017 survey, the average wait time for a PCP appointment ranged between 12 and 109 days, depending on the metropolitan area. The national average wait time conducted by this survey was 29.3 days.14 When primary care appointments are unavailable, triage staff could recommend that patients seek care in the ED. Additionally, patients might choose to seek ED care rather than wait for the next available PCP appointment. Clinic proximity to an ED could influence referral rates. In other words, medical centers or health systems with primary care clinics and ED services under one roof could experience more frequent ED referrals.
A promising strategy to help overcome the challenges of addressing AH and avoiding ED referrals is increasing patient access to and use of qualified, nonphysician providers, such as clinical pharmacists and nurse practitioners. Large health systems such as the VA and Kaiser Permanente have employed clinical pharmacist providers to reduce follow-up times for patients in primary care settings.15 Furthermore, there is substantial evidence that supports the cost-effectiveness and clinical success of pharmacist-driven hypertension clinics.16-18 Nurse-driven efforts to improve hypertension control have been successfully implemented in health systems.19 Both clinical pharmacist and nurse-managed hypertension clinics are effective solutions to manage patients with AH who might otherwise use costly ED services.For example, the average cost of a single ED visit is $740 to $3,437.20 In comparison, a 2010 report from the Agency for Healthcare Research and Quality showed the average annual cost of managing hypertension in ambulatory care clinics was $442 per adult, a cost considerably lower than that of the ED.21
Limitations
The retrospective and observational design of this study are inherent limitations. This study was not designed to evaluate cardiovascular outcomes after ED encounters. The sample size could have been larger if patients with BP < 180/110 mm Hg at ED triage were included; however, the 180/110 mm Hg threshold was chosen because it was the most widely agreed on BP value in the literature. This study did not capture patients who presented with AH and did not receive any acute treatment in the ED.Prescribing patterns based on provider training (eg, emergency medicine, family medicine, or internal medicine) were not tracked and might have accounted for differences in selection of diagnostic tests, laboratory ordering, and route of drug administration preference.
A small subset of patients reported positive pain scores at triage but did not describe acute pain. Pain scores are highly subjective, and few primary literature sources link chronic pain with increased BP.22,23 Nevertheless, patients who reported acute pain and elevated BP were excluded in order to identify truly asymptomatic patients. VA hospitals are unique health systems and data obtained from this study might not be applicable to other public or private facilities. Last, the study did not take into account patients’ psychosocial circumstances that might have fostered a disproportionate reliance on the ED for health care.
Conclusion
Asymptomatic patients with elevated BP are treated in the ED despite no evidence supporting improved outcomes after acute BP lowering in this population. Follow-up after ED encounters for AH did not occur consistently within guideline-recommended 7 days, a trend that also occurs in non-VA systems.8 Clinics and health care systems could establish policies to prevent or minimize management of AH in the ED. Ideally, AH should be managed in a clinic setting by a PCP, but growing clinician workload might lead to increasing wait times and difficultly obtaining same-day appointments. Nurse-led clinics and clinical pharmacists operating under a scope of practice and working closely with a PCP are a cost-effective solution to ensure timely treatment and appropriate follow-up of patients with uncontrolled hypertension.
Acknowledgments
This material is the result of work supported with resources and the use of facilities at the North Florida South Georgia Veterans Health System in Gainesville, Florida.
1. Nwankwo T, Yoon SS, Burt V, Gu Q. Hypertension among adults in the United States: National Health and Nutrition Examination Survey, 2011-2012. NCHS Data Brief. 2013;(133):
1-8.
2. Marik PE, Varon J. Hypertensive crises: challenges and management. Chest. 2007;131(6):1949-1962.
3. Chobanian AV, Bakris GL, Black HR, et al; Joint National Committee on Prevention, Detection, Evaluation, and Treatment of High Blood Pressure. National Heart, Lung, and Blood Institute; National High Blood Pressure Education Program Coordinating Committee. Seventh report of the joint national committee on prevention, detection, evaluation, and treatment of high blood pressure. Hypertension. 2003;42(6):1206-1252.
4. James, PA, Oparil, S, Carter, BL, et al. 2014 Evidence-based guideline for the management of high blood pressure in adults report from the panel members appointed to the Eighth Joint National Committee (JNC 8). JAMA. 2014;311(5):507-520.
5. American Heart Association. High blood pressure ER visits jumped 25 percent in 2006-11. http://newsroom.heart.org/news/high-blood-pressure-er-visits-jumped-25-percent-in-2006-11. Published September 9, 2014. Accessed January 19, 2018.
6. Owens P, Mutter R. Statistical brief #100: emergency department visits for adults in community hospitals. Agency for Healthcare Research and Quality. http://www.hcup-us.ahrq.gov/reports/statbriefs/sb100.pdf. Published November 2010. Accessed January 19, 2018.
7. Wolf SJ, Lo B, Shih RD, Smith MD, Fesmire FM; American College of Emergency Physicians Clinical Policies Committee. Clinical policy: critical issues in the evaluation and management of adult patients in the emergency department with asymptomatic elevated blood pressure. Ann Emerg Med. 2013;62(1):59-68.
8. Patel KK, Young L, Howell EH, et al. Characteristics and outcomes of patients presenting with hypertensive urgency in the office setting. JAMA Intern Med. 2016;176(7):981-988.
9. Acute Kidney Injury Network. AKIN studies. http://www.akinet.org/akinstudies.php. Updated 2017. Accessed January 19, 2018.
10. Karras DJ, Kruus LK, Cienki JJ, et al. Utility of routine testing for patients with asymptomatic severe blood pressure elevation in the emergency department. Ann Emerg Med. 2008;51(3):231-239.
11. The SPRINT Research Group. A Randomized trial of Intensive versus standard blood pressure control. N Engl J Med. 2015;373:2103-2116.
12. Grassi D, O’Flaherty M, Pellizzari M, et al; Group of Investigators of the REHASE Program. Hypertensive urgencies in the emergency department: evaluating blood pressure response to rest and to antihypertensive drugs with different profiles. J Clin Hypertens (Greenwich). 2008;10(9):662-667.
13. Canters for Medicare & Medicaid Services. Emergency medical treatment & labor act (EMTALA). https://www.cms.gov/Regulations-and-Guidance/Legislation/EMTALA/index.html. Updated March 26, 2012. Accessed January 19, 2018.
14. Merritt Hawkins. 2017 Survey of physician appointment wait times and Medicare and Medicaid acceptance rates. https://www.merritthawkins.com/uploadedFiles/Merritt-Hawkins/Pdf/mha2017waittimesurveyPDF.pdf. Published 2017. Accessed January 19, 2018.
15. Galewitz P. VA treats patients’ impatience with clinical pharmacists. USA Today. http://www.usatoday.com/story/news/2016/10/24/kaiser-va-treats-patients-impatience-clinical-pharmacists/92479132/. Published October 24, 2016. Accessed January 19, 2018.
16. Carter BL, Ardery G, Dawson JD, et al. Physician and pharmacist collaboration to improve blood pressure control. Arch Intern Med. 2009;169(21):1996-2002.
17. Borenstein JE, Graber G, Saltiel E, et al. Physician-pharmacist comanagement of hypertension: a randomized comparative trial. Pharmacotherapy. 2003;23(2):209-216.
18. Okamoto MP, Nakahiro RK. Pharmacoeconomic evaluation of a pharmacist-managed hypertension clinic. Pharmacotherapy. 2001;21(11):1337-1344.
19. Brown VM. Managing patients with hypertension in nurse-led clinics. Nursing. 2017;47(4):16-19.
20. Caldwell N, Srebotnjak T, Wang T, Hsia R. “How Much Will I Get Charged for This?” Patient charges for top ten diagnoses in the emergency department. PLoS ONE. 2013;8(2): e55491.
21. Davis KE. Expenditures for hypertension among adults age 18 and older, 2010: estimates for the U.S. civilian noninstitutionalized population. Agency for Healthcare Research and Quality. https://meps.ahrq.gov/data_files/publications/st404/stat404.shtml. Published April 2013. Accessed January 19, 2018.
22. Marco CA, Plewa MC, Buderer N, et al. Self-reported pain scores in the emergency department: lack of association with vital signs. Acad Emerg Med. 2006;13(9):974-979.
23. Wood D, Goodnight S, Haig AJ, Nasari T. Body mass index, but not blood pressure is related to the level of pain in persons with chronic pain. J Back Musculoskelet Rehabil. 2011;24(2):
111-115.
Depression and Bipolar Disorders in Patients With Alcohol Use Disorders (FULL)
Co-occurrence of depression and substance abuse often poses diagnostic and therapeutic challenges. This article reviews the prevalence, clinical considerations, and treatment of depression coexisting with alcohol use disorders (AUDs).
Prevalence
Mood and substance use disorders (SUDs) are very common with an estimated lifetime prevalence in the U.S. of 17% for major depression, 4% for bipolar I and II disorders, 13% for alcohol abuse, and 5% for alcohol dependence.1 Almost all of the associations between disorders of mood or anxiety and drug use were positive and statistically significant in the National Epidemiologic Survey, on Alcohol and Related Conditions (NESARC), which included 43,093 noninstitutionalized patients.2
There is a reciprocal relationship between depression and alcoholism. Epidemiologic Catchment Area Survey results indicated that baseline symptoms of depression or alcohol abuse increased the risk of developing alcohol dependence or depression.3 The risk of developing depression were elevated among people with increasing levels of alcohol-induced debility. Conversely, the presence of depressive symptoms increased the chance of developing alcohol dependence. The association between alcohol dependence and depression may be attributable to the depressive effects of ethanol; depression often remits with sobriety. Psychosocial consequences of problem drinking also may contribute to affective illnesses.
Alcohol dependence poses a major depression risk that contributes to higher rates of alcohol use. In people with ethanol dependence, the prevalence of major depressive disorder (MDD) is 21%.4 People who are alcohol dependent are 4 times more likely than are nondependents to have MDD. Forty-one percent of people who seek treatment for current alcohol abuse have a mood disorder.
The NESARC survey revealed strong associations between depression, substance use, and other psychopathologies.5 Compared with MDD alone, SUD combined with MDD conferred high vulnerability to additional psychopathology, depressive episodes that were more severe and greater in number, and more suicide attempts.
Depression Clincal Considerations
Depression linked to recent alcohol abuse may not respond well to an antidepressant drug beyond what is achieved with ethanol abstinence. In one study, depressive symptoms were assessed over the course of alcohol-related hospitalizations.6 Depression was evident in 42% of patients 48 hours after admission, but only 6% remained clinically depressed by week 4 of hospitalization. Therefore, in the treatment of patients hospitalized for alcohol detoxification, it is common to observe them for 1 month before considering antidepressant medication. Mood likely will improve without pharmacotherapy.
However, delaying treatment for depression while a patient is hospitalized for alcohol detoxification presents some difficulties. Many patients do not remain sober during the first month after detoxification. One study found that 65% of patients imbibed alcohol within 2 weeks after discharge.7 Furthermore, 50% relapsed into heavy drinking during the same period. More than 25% of patients who used alcohol and were diagnosed with substance-induced depression at baseline were reclassified with MDD the next year.8
Careful clinical assessment is needed after alcohol detoxification. Depression that persists during ethanol abstinence predisposes a patient to relapse into heavy drinking. Therefore, failure to treat depression after alcohol detoxification poses considerable risk.9 A study of the effect of depression on the return to drinking among patients with alcohol dependence found that depression at entry into inpatient treatment for alcohol dependence predicted a shorter time to first drink.9 The prognosis for a drinking relapse was worse no matter whether the depression came first or was triggered by the alcohol. Depression does not predict drinking outcomes, but it is associated with a more rapid relapse to ethanol consumption.
Similarly, inpatients with premorbid or substanceinduced depression were more likely to meet the criteria for drug dependence during outpatient follow-up.10 In addition, patients who developed depression during the first 26 weeks after hospitalization were 3 times more likely than those without depression to relapse into drug dependence during follow-up.
Alcohol dependence may hasten the progression of depression. A study on the prognostic effect of alcoholism on the 10-year course of depression found a deleterious influence of current alcoholism after recovery from depression.11 Patients with MDD were more likely to transition from being ill to improving if either they were forgoing alcohol or had never abused it. Another investigation verified that alcohol and drug dependence increased perceptions of affective symptomatology.12
Substance-induced depression also increases the risk for suicide. In 602 patients with substance dependence, depression was classified as occurring before dependence, during abstinence, or during substance use.13 Depression increased the risk for suicide in 34% of patients
who had already attempted suicide at least once. Compared with depression absent substance abuse, depression preceding substance use was associated with high vulnerability to additional psychopathology, depressive episodes that were more severe and greater in number, and more suicide attempts. Substance dependence predicted severity of suicidal intent, and abstinence predicted number of attempts.
Psychiatric hospitalizations often involve patients with a history of suicidal thinking or behavior and substance-induced depression. Clinicians can make reliable assessments of the degree to which a presenting psychiatric syndrome is substance-induced.14 These patients require addiction treatment, including outpatient addiction services capable of caring for suicidal persons. These individuals also are more likely to be homeless, unemployed, and uncooperative.15
Taking a psychiatric history and making a detailed inquiry into potential suicidal behavior, recent substance abuse, and current mood symptoms are warranted in persons with depression and/or SUD. Close follow-up is especially important for depressed patients likely to relapse into alcoholism soon after hospital discharge. Failure to recognize MDD or a bipolar disorder in such a patient may result in more relapses, recurrence of mood episodes, and elevated risk of completing suicide.16
Bipolar Clinical Considerations
There is a lack of clarity regarding the effect of moderate-to-excessive alcohol use on the course of bipolar disorders. There is a negative effect on patients with alcohol-induced bipolar depression. In a study of group therapy patients with bipolar disorder co-occurring with substance dependence, data indicated that number of days of alcohol use predicted development of depression a month later.17 These findings were associated with heavy alcohol consumption. In these patients, substantial drinking increased the risk of a depressive episode. In another study, comorbid SUDs were correlated with suboptimal treatment compliance.18 The authors of a 1998 literature review concluded that comorbid SUD makes bipolar symptoms more severe.19
A number of studies have failed to confirm a negative effect of alcohol on bipolar depression.20 There were no differences in 1-year course and outcome between bipolar patients with different alcohol use levels (abstinence, incidental use, moderate abuse, excessive consumption). Other investigators concluded that SUDs were not associated with slower recovery from depression but could contribute to a higher risk of switching to a manic, mixed, or hypomanic state.21
Substance use disorders are associated with increased suicidal behavior in people with a bipolar disorder. The risk of attempted suicide is about double for these patients relative to bipolar patients who do not abuse alcohol.22 Of those who abuse drugs, 14% to 16% complete suicide.23
Psychotherapy
Reportedly, integrated cognitive behavioral therapy (CBT) provided better substance abuse outcomes compared with 12-step programs.24 There also was less substance abuse within the year after CBT. Integrated psychosocial treatment for patients with a mood disorder and substance abuse should involve simultaneous treatment of the 2 conditions. A sequential approach addresses the primary concern and subsequently treats the comorbid disorder, whereas a parallel approach manages both at the same time but in different surroundings. In both approaches, conflicting therapeutic ideologies are a potential difficulty. Given the multiple treatment locations and separate appointments, scheduling problems are an additional difficulty. Coexisting illnesses also are important to consider in the clinical treatment for bipolar patients. As with individual treatments, group therapies take either a sequential approach (more acute disorder treated first) or a parallel approach (disorders treated simultaneously but in separate settings).
Integrated group therapy (IGT) considers patients as having a single diagnosis, focuses on commonalities between relapse and recovery, and reviews the relationship between both conditions. One study compared IGT and treatment as usual in subjects with comorbid bipolar and AUD.25 The IGT group evidenced fewer days of alcohol use. Other research compared IGT with group drug treatment and found that IGT subjects were more likely to remain abstinent.26 This type of psychotherapy showed promise in a meta-analysis of integrated treatment in patients with depression and SUDs.26
Compared with placebo, sertraline/CBT combined treatment reduced alcohol consumption on drinking days.27 This combination was effective in reducing depression, especially in females.
Acceptance and commitment therapy (ACT) combines mindfulness and behavioral change to increase psychological flexibility. The goal in ACT is for patients to become more accepting of their unpleasant feelings. In a study of alcohol abusers with affective disorders, those treated with ACT, compared with controls, had higher abstinence rates and lower depression scores.28
Phamacotherapy and Bipolar Disorder
Even when bipolar symptoms were resolved with use of mood-stabilizing medications, usually some alcohol use continued, though no association was found between bipolar disorder and AUDs.29 With patients’ illness severity and ethanol consumption rated weekly over 7 years, no temporal correlation was found between drinking alcohol and bipolar symptoms.
Similarly, in a study, relief of depressive bipolar symptoms did not result in less frequent alcohol relapse.30 One hundred fifteen outpatients with bipolar disorder and AUD were randomly assigned to either 12 weeks of quetiapine therapy or placebo. Patients in the quetiapine group experienced significant improvement in mood, but sobriety was not enhanced.
Two studies indicated trends of reduced drinking with use of prescribed alcohol-deterrent drugs. An investigation that compared naltrexone with placebo did not reach statistical significance, but naltrexone was reasonably effective in reducing alcohol consumption and craving.31 A report on patients with bipolar disorder treated with acamprosate also did not identify any significant differences in alcohol drinking prognosis.32 Nevertheless, acamprosate was well tolerated and seemed to confer some clinical benefit.
There is a paucity of research focused on patients with bipolar disorder and substance dependence.33 In one trial, patients with bipolar disorder and a diagnosis of alcohol dependence were randomly assigned to receive either valproate or placebo.34 Valproate therapy decreased the number of heavy consumption days and drinks per drinking day in these patients. In a study of 362 patients with bipolar disorder and alcohol dependence treated with lithium or valproic acid, there was no change in drinking days despite adding quetiapine to the regimen.35
Pharmacotherapy and Depression
Lithium is not effective for patients with MDD and AUD. Lithium treatment for depressed patients with alcohol dependence did not improve abstinence, alcohol-related hospitalizations, or severity of either condition.36
Aripiprazole is an antipsychotic that partially agonizes dopamine receptors. Dopamine implicates reward circuitry and has a role in AUDs. Aripiprazole was used as an adjunctive intervention in a randomized trial of 35 patients with comorbid alcohol dependence and depression.37 There was less depression in both the aripiprazole plus escitalopram group and the escitalopram group. Imaging showed a change in activity in the left cingulate gyrus in the patients with comorbid alcohol dependence and MDD. The action of aripiprazole may be mediated through the anterior cingulate cortex.
Research on patients with alcohol dependence treated with fluoxetine found decreased Hamilton Depression Rating Scale (HDRS) scores but no change in alcohol consumption.38
Sertraline diminishes depressive symptoms in abstinent alcoholics. In one study, depressed, recently abstinent alcohol users were randomly assigned to receive sertraline 100 mg daily or placebo.39 Significant improvement was noted in HDRS and Beck Depression Inventory scores at 3- and 6-week intervals.
Citalopram was studied in patients randomly assigned to receive citalopram or placebo for alcohol abuse or dependence.40 Patients in the citalopram group had more days of drinking and showed little change in frequency of alcohol consumption. There was no improvement in depression severity in the citalopram group relative to the placebo group. Citalopram also has been studied in combination with naltrexone.41 Patients with depression and alcohol dependence were randomly assigned to receive either citalopram or placebo, as well as naltrexone. There were no significant differences in depression severity or drinking outcomes.
Treating depression with selective serotonin reuptake inhibitors (SSRIs) had variable results. Most SSRIs improve depression severity but largely have no effect on drinking outcomes.
Antidepressants
A meta-analysis on the efficacy of antidepressant medications in treating patients with depression and substance abuse revealed that the antidepressants had a somewhat advantageous effect.42 That finding was supported by the Sequenced Treatment Alternatives to Relieve Depression (STAR*D) study.43 About 33% of patients with citalopramtreated major depression endorsed concurrent SUD symptoms, 19% reported diagnosable alcohol use, 6% had other drug abuses, and 5% exhibited both alcohol and drug use. The groups did not differ in time needed to attain a better mood or in rate of response to citalopram.
Patients with citalopram-treated MDD and alcohol or drug abuse responded about as well as those without an SUD. However, those with alcohol and/or drug abuse had reduced rates of remission, and their remission was delayed, as compared with those without alcohol or drug abuse. There were more suicide attempts and psychiatric hospitalizations among the cohort with drug abuse.
Selective serotonin reuptake inhibitors have a reported safety advantage in treating patients with a history of excessive alcohol intake.44 Another advantage is that SSRIs are seldom abused and seldom lower seizure thresholds significantly. Deleterious effects of alcohol on motor skills or cognition are not potentiated. Adverse effects are usually mild, and overdoses are rarely dangerous.
Antidepressant medication decreased depression and diminished the amount of drinking in patients with depression who use alcohol.45 In controlled research of patients with comorbid depression and alcohol dependence, fluoxetine reduced the severity of these conditions. Substantial reductions in depressive symptoms occurred during detoxification and washout in both groups. There was a strong relationship between depression and drinking among people with depression and AUD.
Desipramine can produce similar results, with positive antidepressant drug effects on depression and drinking. Therefore, pharmacotherapy is indicated for patients with depression who abuse ethanol. Research found that alcohol-dependent patients with depression responded to desipramine.46 Desipramine yielded prolonged abstinence in patients with depression who were using alcohol but not in alcohol users without depression.
A study of imipramine use in actively drinking outpatients found decreased alcohol consumption only for those whose depression responded to treatment.47 However, there was no influence on drinking outcome. Patients whose mood improved reported decreased alcohol consumption after imipramine therapy.
Conslusion
People with co-occurring depression and alcohol dependence are optimally treated with pharmacotherapies that address each condition. One investigation randomly assigned alcohol-dependent patients with depression to 14 weeks of treatment with sertraline 200 mg/d, naltrexone 100 mg/d, a combination of the drugs, or placebo.48 The combination treatment produced the best rate of abstinence before a heavy drinking relapse. Also, fewer patients tended to be depressed in the final weeks of treatment when prescribed the combined regimen. Pharmacotherapy is the best approach for both depression and AUDs.
Click here to read the digital edition.
1. Kessler RC, Berglund P, Demler O, Jin R, Merikangas KR, Walters EE. Lifetime prevalence and age-of-onset distributions of DSM-IV disorders in the National Comorbidity Survey Replication. Arch Gen Psychiatry. 2005;62(6):593-602.
2. Conway KP, Compton W, Stinson FS, Grant BF. Lifetime comorbidity of DSM-IV mood and anxiety disorders and specific drug use disorders: results from the National Epidemiologic Survey on Alcohol and Related Conditions. J Clin Psychiatry. 2006;67(2):247-257.
3. Gilman SE, Abraham HD. A longitudinal study of the order of onset of alcohol dependence and major depression. Drug Alcohol Depend. 2001;63(3):277-286.
4. Kessler RC, Crum RM, Warner LA, Nelson CB, Schulenberg J, Anthony JC. Lifetime co-occurrence of DSM-III-R alcohol abuse and dependence with other psychiatric disorders in the National Comorbidity Survey. Arch Gen Psychiatry. 1997;54(4):313-321.
5. Blanco C, Alegría AA, Liu SM, et al. Differences among major depressive disorder with and without co-occurring substance use disorders and substance-induced depressive disorder: results from the National Epidemiologic Survey on Alcohol and Related Conditions. J Clin Psychiatry. 2012;73(6):865-873.
6. Brown SA, Schuckit MA. Changes in depression among abstinent alcoholics. J Stud Alcohol. 1988;49(5):412-417.
7. Kiefer F, Jahn H, Tarnaske T, et al. Comparing and combining naltrexone and acamprosate in relapse prevention of alcoholism: a double-blind, placebo-controlled study. Arch Gen Psychiatry. 2003;60(1):92-99.
8. Ramsey SE, Kahler CW, Read JP, Stuart GL, Brown RA. Discriminating between substance-induced and independent depressive episodes in alcohol-dependent patients. J Stud Alcohol. 2004;65(5):672-676.
9. Greenfield SF, Weiss RD, Muenz LR, et al. The effect of depression on return to drinking: a prospective study. Arch Gen Psychiatry. 1998;55(3):259-265.
10. Hasin D, Liu X, Nunes E, McCloud S, Samet S, Endicott J. Effects of major depression on remission and relapse of substance dependence. Arch Gen Psychiatry. 2002;59(4):375-380.
11. Mueller TI, Lavori PW, Martin B, et al. Prognostic effect of the variable course of alcoholism on the 10-year course of depression. Am J Psychiatry. 1994;151(5):701-706.
12. Agosti V, Levin FR. The effects of alcohol and drug dependence on the course of depression. Am J Addict. 2006;15(1):71-75.
13. Aharonovich E, Liu X, Nunes E, Hasin DS. Suicide attempts in substance abusers: effects of major depression in relation to substance use disorders. Am J Psychiatry. 2002;159(9):1600-1602.
14. Ries RK, Demirsoy A, Russo JE, Barrett J, Roy-Byrne PP. Reliability and clinical utility of DSM-IV substance-induced psychiatric disorders in acute psychiatric inpatients. Am J Addict. 2001;10(4):308-318.
15. Ries RK, Yuodelis-Flores C, Comtois KA, Roy-Byrne PP, Russo JE. Substanceinduced suicidal admissions to an acute psychiatric service: characteristics and outcomes. J Subst Abuse Treat. 2008;34(1):72-79.
16. Toliver BK, Anton RF. Assessment and treatment of mood disorders in the context of substance abuse. Dialogues Clin Neurosci. 2015;17(2):181-190.
17. Jaffee WB, Griffin ML, Gallop R, et al. Depression precipitated by alcohol use in patients with co-occurring bipolar and substance use disorders. J Clin Psychiatry. 2009;70(2):171-176.
18. Manwani SG, Szilagyi KA, Zablotsky B, Hennen J, Griffin ML, Weiss RD. Adherence to pharmacotherapy in bipolar disorder patients with and without co-occurring substance use disorders. J Clin Psychiatry. 2007;68(8):1172-1176.
19. Tohen M, Greenfield SF, Weiss RD, Zarate CA Jr, Vagge LM. The effect of comorbid substance disorders on the course of bipolar disorder: a review. Harv Rev Psychiatry. 1998;6(3):133-141.
20. van Zaane J, van den Brink W, Draisma S, Smit JH, Nolen WA. The effect of moderate and excessive alcohol use on the course and outcome of patients with bipolar disorders: a prospective cohort study. J Clin Psychiatry. 2010;71(7):885-893.
21. Ostacher MJ, Perlis RH, Nierenberg AA, et al; STEP-BD Investigators. Impact of substance use disorders on recovery from episodes of depression in bipolar disorder patients: prospective data from the Systematic Treatment Enhancement Program for Bipolar Disorder (STEP-BD). Am J Psychiatry. 2010;167(3):289-297.
22. Oquendo MA, Currier D, Liu SM, Hasin DS, Grant BF, Blanco C. Increased risk for suicidal behavior in comorbid bipolar disorder and alcohol use disorders: results from the National Epidemiologic Survey on Alcohol and Related Conditions (NESARC). J Clin Psychiatry. 2010;71(7):902-909.
23. Yoon YH, Chen CM, Yi HY, Moss HB. Effect of comorbid alcohol and drug use disorders on premature death of unipolar and bipolar decedents in the United States, 1999 to 2006. Compr Psychiatry. 2011;52(5):453-464.
24. Lydecker KP, Tate SR, Cummins KM, McQuaid J, Granholm E, Brown SA. Clinical outcomes of an integrated treatment for depression and substance use disorders. Psychol Addict Behav. 2010;24(3):453-465.
25. Weiss RD, Griffin ML, Kolodziej ME, et al. A randomized trial of integrated group therapy versus group drug counseling for patients with bipolar disorder and substance dependence. Am J Psychiatry. 2007;164(1):100-107.
26. Hesse M. Integrated psychological treatment for substance use and co-morbid anxiety or depression vs. treatment for substance use alone. A systematic review of the published literature. BMC Psychiatry. 2009;9:6.
27. Moak DH, Anton RF, Latham PK, Voronin KE, Waid RL, Durazo-Arvizu R. Sertraline and cognitive behavioral therapy for depressed alcoholics: results of a placebo-controlled trial. J Clin Psychopharmacol. 2003;23(6):553-562.
28. Thekiso TB, Murphy P, Milnes J, Lambe K, Curtin A, Farren CK. Acceptance and commitment therapy in the treatment of alcohol use disorder and comorbid affective disorder: a pilot matched control trial. Behav Ther. 2015;46(6):717-728.
29. Fleck DE, Amdt S, Delbello MP, Strakowski SM. Concurrent tracking of alcohol use and bipolar disorder symptoms. Bipolar Disord. 2006:8(4):338-344.
30. Brown ES, Gaza M, Carmody TJ. A randomized, double-blind, placebo-controlled add-on trial of quetiapine in outpatients with bipolar disorder and alcohol use disorders. J Clin Psychiatry. 2008;69(5):701-705.
31. Brown ES, Carmody TJ, Schmitz JM, et al. A randomized, double-blind, placebocontrolled pilot study of naltrexone in outpatients with bipolar disorder and alcohol dependence. Alcohol Clin Exp Res. 2009;33(11):1863-1869.
32. Tolliver BK, Desantis SM, Brown DG, Prisciandaro JJ, Brady KT. A randomized, double-blind, placebo-controlled clinical trial of acamprosate in alcoholdependent individuals with bipolar disorder: a preliminary report. Bipolar Disord. 2012;14(1):54-63.
33. Pettinati HM, O’Brien CP, Dundon WD. Current status of co-occurring mood and substance use disorders: a new therapeutic target. Am J Psychiatry. 2013;170(1):23-30.
34. Salloum IM, Cornelius JR, Daley DC, Kirisci L, Himmelhoch JM, Thase ME. Efficacy of valproate maintenance in patients with bipolar disorder and alcoholism: a double-blind placebo-controlled study. Arch Gen Psychiatry. 2005;62(1):37-45.
35. Farren CK, Hill KP, Weiss RD. Bipolar disorder and alcohol use disorder: a review. Curr Psychiatry Rep. 2012;14(6):659-666.
36. Dorus W, Ostrow DG, Anton R, et al. Lithium treatment of depressed and nondepressed alcoholics. JAMA. 1989;262(12):1646-1652.
37. Han DH, Kim SM, Choi JE, Min KJ, Renshaw PF. Adjunctive aripiprazole therapy with escitalopram in patients with co-morbid major depressive disorder and alcohol dependence: clinical and neuroimaging evidence. J Psychopharmacol. 2013;27(3):282-291.
38. Kranzler HR, Burleson JA, Korner P, et al. Placebo-controlled trial of fluoxetine as an adjunct to relapse prevention in alcoholics. Am J Psychiatry. 1995;152(3):391-397.
39. Roy A. Placebo-controlled study of sertraline in depressed recently abstinent alcoholics. Biol Psychiatry. 1998;44(7):633-637.
40. Charney DA, Heath LM, Zikos E, Palacios-Boix J, Gill KJ. Poorer drinking outcomes with citalopram treatment for alcohol dependence: a randomized, doubleblind, placebo-controlled trial. Alcohol Clin Exp Res. 2015;39(9):1756-1765.
41. Adamson SJ, Sellman JD, Foulds JA, et al. A randomized trial of combined citalopram and naltrexone for non-abstinent outpatients with co-occurring alcohol dependence and major depression. J Clin Psychopharmacol. 2015;35(2):143-149.
42. Nunes EV, Levin FR. Treatment of depression in patients with alcohol or other drug dependence: a meta-analysis. JAMA. 2004;291(15):1887-1896.
43. Davis LL, Wisniewski SR, Howland RH, et al. Does comorbid substance use disorder impair recovery from major depression with SSRI treatment? An analysis of the STAR*D level one treatment outcomes. Drug Alcohol Depend. 2010;107(2-3):161-170.
44. Pettinati HM. The use of selective reuptake inhibitors in treating alcoholic subtypes. J Clin Psychiatry. 2001;62(suppl 20):26-31.
45. Cornelius JR, Salloum IM, Ehler JG, et al. Fluoxetine in depressed alcoholics. A double-blind, placebo-controlled trial. Arch Gen Psychiatry. 1997;54(8):700-705.
46. Mason BJ, Kocsis JH, Ritvo EC, Cutler RB. A double-blind, placebo-controlled trial of desipramine for primary alcohol dependence stratified on the presence of absence of major depression. JAMA. 1996;275(10):761-767.
47. McGrath PJ, Nunes EV, Stewart JW, et al. Imipramine treatment of alcoholics with primary depression: a placebo-controlled clinical trial. Arch Gen Psychiatry. 1996;53(3):232-240.
48. Pettinati HM, Oslin DW, Kampman KM, et al. A double-blind, placebo-controlled trial combining sertraline and naltrexone for treating co-occurring depression and alcohol dependence. Am J Psychiatry. 2010;167(6):668-675.
Co-occurrence of depression and substance abuse often poses diagnostic and therapeutic challenges. This article reviews the prevalence, clinical considerations, and treatment of depression coexisting with alcohol use disorders (AUDs).
Prevalence
Mood and substance use disorders (SUDs) are very common with an estimated lifetime prevalence in the U.S. of 17% for major depression, 4% for bipolar I and II disorders, 13% for alcohol abuse, and 5% for alcohol dependence.1 Almost all of the associations between disorders of mood or anxiety and drug use were positive and statistically significant in the National Epidemiologic Survey, on Alcohol and Related Conditions (NESARC), which included 43,093 noninstitutionalized patients.2
There is a reciprocal relationship between depression and alcoholism. Epidemiologic Catchment Area Survey results indicated that baseline symptoms of depression or alcohol abuse increased the risk of developing alcohol dependence or depression.3 The risk of developing depression were elevated among people with increasing levels of alcohol-induced debility. Conversely, the presence of depressive symptoms increased the chance of developing alcohol dependence. The association between alcohol dependence and depression may be attributable to the depressive effects of ethanol; depression often remits with sobriety. Psychosocial consequences of problem drinking also may contribute to affective illnesses.
Alcohol dependence poses a major depression risk that contributes to higher rates of alcohol use. In people with ethanol dependence, the prevalence of major depressive disorder (MDD) is 21%.4 People who are alcohol dependent are 4 times more likely than are nondependents to have MDD. Forty-one percent of people who seek treatment for current alcohol abuse have a mood disorder.
The NESARC survey revealed strong associations between depression, substance use, and other psychopathologies.5 Compared with MDD alone, SUD combined with MDD conferred high vulnerability to additional psychopathology, depressive episodes that were more severe and greater in number, and more suicide attempts.
Depression Clincal Considerations
Depression linked to recent alcohol abuse may not respond well to an antidepressant drug beyond what is achieved with ethanol abstinence. In one study, depressive symptoms were assessed over the course of alcohol-related hospitalizations.6 Depression was evident in 42% of patients 48 hours after admission, but only 6% remained clinically depressed by week 4 of hospitalization. Therefore, in the treatment of patients hospitalized for alcohol detoxification, it is common to observe them for 1 month before considering antidepressant medication. Mood likely will improve without pharmacotherapy.
However, delaying treatment for depression while a patient is hospitalized for alcohol detoxification presents some difficulties. Many patients do not remain sober during the first month after detoxification. One study found that 65% of patients imbibed alcohol within 2 weeks after discharge.7 Furthermore, 50% relapsed into heavy drinking during the same period. More than 25% of patients who used alcohol and were diagnosed with substance-induced depression at baseline were reclassified with MDD the next year.8
Careful clinical assessment is needed after alcohol detoxification. Depression that persists during ethanol abstinence predisposes a patient to relapse into heavy drinking. Therefore, failure to treat depression after alcohol detoxification poses considerable risk.9 A study of the effect of depression on the return to drinking among patients with alcohol dependence found that depression at entry into inpatient treatment for alcohol dependence predicted a shorter time to first drink.9 The prognosis for a drinking relapse was worse no matter whether the depression came first or was triggered by the alcohol. Depression does not predict drinking outcomes, but it is associated with a more rapid relapse to ethanol consumption.
Similarly, inpatients with premorbid or substanceinduced depression were more likely to meet the criteria for drug dependence during outpatient follow-up.10 In addition, patients who developed depression during the first 26 weeks after hospitalization were 3 times more likely than those without depression to relapse into drug dependence during follow-up.
Alcohol dependence may hasten the progression of depression. A study on the prognostic effect of alcoholism on the 10-year course of depression found a deleterious influence of current alcoholism after recovery from depression.11 Patients with MDD were more likely to transition from being ill to improving if either they were forgoing alcohol or had never abused it. Another investigation verified that alcohol and drug dependence increased perceptions of affective symptomatology.12
Substance-induced depression also increases the risk for suicide. In 602 patients with substance dependence, depression was classified as occurring before dependence, during abstinence, or during substance use.13 Depression increased the risk for suicide in 34% of patients
who had already attempted suicide at least once. Compared with depression absent substance abuse, depression preceding substance use was associated with high vulnerability to additional psychopathology, depressive episodes that were more severe and greater in number, and more suicide attempts. Substance dependence predicted severity of suicidal intent, and abstinence predicted number of attempts.
Psychiatric hospitalizations often involve patients with a history of suicidal thinking or behavior and substance-induced depression. Clinicians can make reliable assessments of the degree to which a presenting psychiatric syndrome is substance-induced.14 These patients require addiction treatment, including outpatient addiction services capable of caring for suicidal persons. These individuals also are more likely to be homeless, unemployed, and uncooperative.15
Taking a psychiatric history and making a detailed inquiry into potential suicidal behavior, recent substance abuse, and current mood symptoms are warranted in persons with depression and/or SUD. Close follow-up is especially important for depressed patients likely to relapse into alcoholism soon after hospital discharge. Failure to recognize MDD or a bipolar disorder in such a patient may result in more relapses, recurrence of mood episodes, and elevated risk of completing suicide.16
Bipolar Clinical Considerations
There is a lack of clarity regarding the effect of moderate-to-excessive alcohol use on the course of bipolar disorders. There is a negative effect on patients with alcohol-induced bipolar depression. In a study of group therapy patients with bipolar disorder co-occurring with substance dependence, data indicated that number of days of alcohol use predicted development of depression a month later.17 These findings were associated with heavy alcohol consumption. In these patients, substantial drinking increased the risk of a depressive episode. In another study, comorbid SUDs were correlated with suboptimal treatment compliance.18 The authors of a 1998 literature review concluded that comorbid SUD makes bipolar symptoms more severe.19
A number of studies have failed to confirm a negative effect of alcohol on bipolar depression.20 There were no differences in 1-year course and outcome between bipolar patients with different alcohol use levels (abstinence, incidental use, moderate abuse, excessive consumption). Other investigators concluded that SUDs were not associated with slower recovery from depression but could contribute to a higher risk of switching to a manic, mixed, or hypomanic state.21
Substance use disorders are associated with increased suicidal behavior in people with a bipolar disorder. The risk of attempted suicide is about double for these patients relative to bipolar patients who do not abuse alcohol.22 Of those who abuse drugs, 14% to 16% complete suicide.23
Psychotherapy
Reportedly, integrated cognitive behavioral therapy (CBT) provided better substance abuse outcomes compared with 12-step programs.24 There also was less substance abuse within the year after CBT. Integrated psychosocial treatment for patients with a mood disorder and substance abuse should involve simultaneous treatment of the 2 conditions. A sequential approach addresses the primary concern and subsequently treats the comorbid disorder, whereas a parallel approach manages both at the same time but in different surroundings. In both approaches, conflicting therapeutic ideologies are a potential difficulty. Given the multiple treatment locations and separate appointments, scheduling problems are an additional difficulty. Coexisting illnesses also are important to consider in the clinical treatment for bipolar patients. As with individual treatments, group therapies take either a sequential approach (more acute disorder treated first) or a parallel approach (disorders treated simultaneously but in separate settings).
Integrated group therapy (IGT) considers patients as having a single diagnosis, focuses on commonalities between relapse and recovery, and reviews the relationship between both conditions. One study compared IGT and treatment as usual in subjects with comorbid bipolar and AUD.25 The IGT group evidenced fewer days of alcohol use. Other research compared IGT with group drug treatment and found that IGT subjects were more likely to remain abstinent.26 This type of psychotherapy showed promise in a meta-analysis of integrated treatment in patients with depression and SUDs.26
Compared with placebo, sertraline/CBT combined treatment reduced alcohol consumption on drinking days.27 This combination was effective in reducing depression, especially in females.
Acceptance and commitment therapy (ACT) combines mindfulness and behavioral change to increase psychological flexibility. The goal in ACT is for patients to become more accepting of their unpleasant feelings. In a study of alcohol abusers with affective disorders, those treated with ACT, compared with controls, had higher abstinence rates and lower depression scores.28
Phamacotherapy and Bipolar Disorder
Even when bipolar symptoms were resolved with use of mood-stabilizing medications, usually some alcohol use continued, though no association was found between bipolar disorder and AUDs.29 With patients’ illness severity and ethanol consumption rated weekly over 7 years, no temporal correlation was found between drinking alcohol and bipolar symptoms.
Similarly, in a study, relief of depressive bipolar symptoms did not result in less frequent alcohol relapse.30 One hundred fifteen outpatients with bipolar disorder and AUD were randomly assigned to either 12 weeks of quetiapine therapy or placebo. Patients in the quetiapine group experienced significant improvement in mood, but sobriety was not enhanced.
Two studies indicated trends of reduced drinking with use of prescribed alcohol-deterrent drugs. An investigation that compared naltrexone with placebo did not reach statistical significance, but naltrexone was reasonably effective in reducing alcohol consumption and craving.31 A report on patients with bipolar disorder treated with acamprosate also did not identify any significant differences in alcohol drinking prognosis.32 Nevertheless, acamprosate was well tolerated and seemed to confer some clinical benefit.
There is a paucity of research focused on patients with bipolar disorder and substance dependence.33 In one trial, patients with bipolar disorder and a diagnosis of alcohol dependence were randomly assigned to receive either valproate or placebo.34 Valproate therapy decreased the number of heavy consumption days and drinks per drinking day in these patients. In a study of 362 patients with bipolar disorder and alcohol dependence treated with lithium or valproic acid, there was no change in drinking days despite adding quetiapine to the regimen.35
Pharmacotherapy and Depression
Lithium is not effective for patients with MDD and AUD. Lithium treatment for depressed patients with alcohol dependence did not improve abstinence, alcohol-related hospitalizations, or severity of either condition.36
Aripiprazole is an antipsychotic that partially agonizes dopamine receptors. Dopamine implicates reward circuitry and has a role in AUDs. Aripiprazole was used as an adjunctive intervention in a randomized trial of 35 patients with comorbid alcohol dependence and depression.37 There was less depression in both the aripiprazole plus escitalopram group and the escitalopram group. Imaging showed a change in activity in the left cingulate gyrus in the patients with comorbid alcohol dependence and MDD. The action of aripiprazole may be mediated through the anterior cingulate cortex.
Research on patients with alcohol dependence treated with fluoxetine found decreased Hamilton Depression Rating Scale (HDRS) scores but no change in alcohol consumption.38
Sertraline diminishes depressive symptoms in abstinent alcoholics. In one study, depressed, recently abstinent alcohol users were randomly assigned to receive sertraline 100 mg daily or placebo.39 Significant improvement was noted in HDRS and Beck Depression Inventory scores at 3- and 6-week intervals.
Citalopram was studied in patients randomly assigned to receive citalopram or placebo for alcohol abuse or dependence.40 Patients in the citalopram group had more days of drinking and showed little change in frequency of alcohol consumption. There was no improvement in depression severity in the citalopram group relative to the placebo group. Citalopram also has been studied in combination with naltrexone.41 Patients with depression and alcohol dependence were randomly assigned to receive either citalopram or placebo, as well as naltrexone. There were no significant differences in depression severity or drinking outcomes.
Treating depression with selective serotonin reuptake inhibitors (SSRIs) had variable results. Most SSRIs improve depression severity but largely have no effect on drinking outcomes.
Antidepressants
A meta-analysis on the efficacy of antidepressant medications in treating patients with depression and substance abuse revealed that the antidepressants had a somewhat advantageous effect.42 That finding was supported by the Sequenced Treatment Alternatives to Relieve Depression (STAR*D) study.43 About 33% of patients with citalopramtreated major depression endorsed concurrent SUD symptoms, 19% reported diagnosable alcohol use, 6% had other drug abuses, and 5% exhibited both alcohol and drug use. The groups did not differ in time needed to attain a better mood or in rate of response to citalopram.
Patients with citalopram-treated MDD and alcohol or drug abuse responded about as well as those without an SUD. However, those with alcohol and/or drug abuse had reduced rates of remission, and their remission was delayed, as compared with those without alcohol or drug abuse. There were more suicide attempts and psychiatric hospitalizations among the cohort with drug abuse.
Selective serotonin reuptake inhibitors have a reported safety advantage in treating patients with a history of excessive alcohol intake.44 Another advantage is that SSRIs are seldom abused and seldom lower seizure thresholds significantly. Deleterious effects of alcohol on motor skills or cognition are not potentiated. Adverse effects are usually mild, and overdoses are rarely dangerous.
Antidepressant medication decreased depression and diminished the amount of drinking in patients with depression who use alcohol.45 In controlled research of patients with comorbid depression and alcohol dependence, fluoxetine reduced the severity of these conditions. Substantial reductions in depressive symptoms occurred during detoxification and washout in both groups. There was a strong relationship between depression and drinking among people with depression and AUD.
Desipramine can produce similar results, with positive antidepressant drug effects on depression and drinking. Therefore, pharmacotherapy is indicated for patients with depression who abuse ethanol. Research found that alcohol-dependent patients with depression responded to desipramine.46 Desipramine yielded prolonged abstinence in patients with depression who were using alcohol but not in alcohol users without depression.
A study of imipramine use in actively drinking outpatients found decreased alcohol consumption only for those whose depression responded to treatment.47 However, there was no influence on drinking outcome. Patients whose mood improved reported decreased alcohol consumption after imipramine therapy.
Conslusion
People with co-occurring depression and alcohol dependence are optimally treated with pharmacotherapies that address each condition. One investigation randomly assigned alcohol-dependent patients with depression to 14 weeks of treatment with sertraline 200 mg/d, naltrexone 100 mg/d, a combination of the drugs, or placebo.48 The combination treatment produced the best rate of abstinence before a heavy drinking relapse. Also, fewer patients tended to be depressed in the final weeks of treatment when prescribed the combined regimen. Pharmacotherapy is the best approach for both depression and AUDs.
Click here to read the digital edition.
1. Kessler RC, Berglund P, Demler O, Jin R, Merikangas KR, Walters EE. Lifetime prevalence and age-of-onset distributions of DSM-IV disorders in the National Comorbidity Survey Replication. Arch Gen Psychiatry. 2005;62(6):593-602.
2. Conway KP, Compton W, Stinson FS, Grant BF. Lifetime comorbidity of DSM-IV mood and anxiety disorders and specific drug use disorders: results from the National Epidemiologic Survey on Alcohol and Related Conditions. J Clin Psychiatry. 2006;67(2):247-257.
3. Gilman SE, Abraham HD. A longitudinal study of the order of onset of alcohol dependence and major depression. Drug Alcohol Depend. 2001;63(3):277-286.
4. Kessler RC, Crum RM, Warner LA, Nelson CB, Schulenberg J, Anthony JC. Lifetime co-occurrence of DSM-III-R alcohol abuse and dependence with other psychiatric disorders in the National Comorbidity Survey. Arch Gen Psychiatry. 1997;54(4):313-321.
5. Blanco C, Alegría AA, Liu SM, et al. Differences among major depressive disorder with and without co-occurring substance use disorders and substance-induced depressive disorder: results from the National Epidemiologic Survey on Alcohol and Related Conditions. J Clin Psychiatry. 2012;73(6):865-873.
6. Brown SA, Schuckit MA. Changes in depression among abstinent alcoholics. J Stud Alcohol. 1988;49(5):412-417.
7. Kiefer F, Jahn H, Tarnaske T, et al. Comparing and combining naltrexone and acamprosate in relapse prevention of alcoholism: a double-blind, placebo-controlled study. Arch Gen Psychiatry. 2003;60(1):92-99.
8. Ramsey SE, Kahler CW, Read JP, Stuart GL, Brown RA. Discriminating between substance-induced and independent depressive episodes in alcohol-dependent patients. J Stud Alcohol. 2004;65(5):672-676.
9. Greenfield SF, Weiss RD, Muenz LR, et al. The effect of depression on return to drinking: a prospective study. Arch Gen Psychiatry. 1998;55(3):259-265.
10. Hasin D, Liu X, Nunes E, McCloud S, Samet S, Endicott J. Effects of major depression on remission and relapse of substance dependence. Arch Gen Psychiatry. 2002;59(4):375-380.
11. Mueller TI, Lavori PW, Martin B, et al. Prognostic effect of the variable course of alcoholism on the 10-year course of depression. Am J Psychiatry. 1994;151(5):701-706.
12. Agosti V, Levin FR. The effects of alcohol and drug dependence on the course of depression. Am J Addict. 2006;15(1):71-75.
13. Aharonovich E, Liu X, Nunes E, Hasin DS. Suicide attempts in substance abusers: effects of major depression in relation to substance use disorders. Am J Psychiatry. 2002;159(9):1600-1602.
14. Ries RK, Demirsoy A, Russo JE, Barrett J, Roy-Byrne PP. Reliability and clinical utility of DSM-IV substance-induced psychiatric disorders in acute psychiatric inpatients. Am J Addict. 2001;10(4):308-318.
15. Ries RK, Yuodelis-Flores C, Comtois KA, Roy-Byrne PP, Russo JE. Substanceinduced suicidal admissions to an acute psychiatric service: characteristics and outcomes. J Subst Abuse Treat. 2008;34(1):72-79.
16. Toliver BK, Anton RF. Assessment and treatment of mood disorders in the context of substance abuse. Dialogues Clin Neurosci. 2015;17(2):181-190.
17. Jaffee WB, Griffin ML, Gallop R, et al. Depression precipitated by alcohol use in patients with co-occurring bipolar and substance use disorders. J Clin Psychiatry. 2009;70(2):171-176.
18. Manwani SG, Szilagyi KA, Zablotsky B, Hennen J, Griffin ML, Weiss RD. Adherence to pharmacotherapy in bipolar disorder patients with and without co-occurring substance use disorders. J Clin Psychiatry. 2007;68(8):1172-1176.
19. Tohen M, Greenfield SF, Weiss RD, Zarate CA Jr, Vagge LM. The effect of comorbid substance disorders on the course of bipolar disorder: a review. Harv Rev Psychiatry. 1998;6(3):133-141.
20. van Zaane J, van den Brink W, Draisma S, Smit JH, Nolen WA. The effect of moderate and excessive alcohol use on the course and outcome of patients with bipolar disorders: a prospective cohort study. J Clin Psychiatry. 2010;71(7):885-893.
21. Ostacher MJ, Perlis RH, Nierenberg AA, et al; STEP-BD Investigators. Impact of substance use disorders on recovery from episodes of depression in bipolar disorder patients: prospective data from the Systematic Treatment Enhancement Program for Bipolar Disorder (STEP-BD). Am J Psychiatry. 2010;167(3):289-297.
22. Oquendo MA, Currier D, Liu SM, Hasin DS, Grant BF, Blanco C. Increased risk for suicidal behavior in comorbid bipolar disorder and alcohol use disorders: results from the National Epidemiologic Survey on Alcohol and Related Conditions (NESARC). J Clin Psychiatry. 2010;71(7):902-909.
23. Yoon YH, Chen CM, Yi HY, Moss HB. Effect of comorbid alcohol and drug use disorders on premature death of unipolar and bipolar decedents in the United States, 1999 to 2006. Compr Psychiatry. 2011;52(5):453-464.
24. Lydecker KP, Tate SR, Cummins KM, McQuaid J, Granholm E, Brown SA. Clinical outcomes of an integrated treatment for depression and substance use disorders. Psychol Addict Behav. 2010;24(3):453-465.
25. Weiss RD, Griffin ML, Kolodziej ME, et al. A randomized trial of integrated group therapy versus group drug counseling for patients with bipolar disorder and substance dependence. Am J Psychiatry. 2007;164(1):100-107.
26. Hesse M. Integrated psychological treatment for substance use and co-morbid anxiety or depression vs. treatment for substance use alone. A systematic review of the published literature. BMC Psychiatry. 2009;9:6.
27. Moak DH, Anton RF, Latham PK, Voronin KE, Waid RL, Durazo-Arvizu R. Sertraline and cognitive behavioral therapy for depressed alcoholics: results of a placebo-controlled trial. J Clin Psychopharmacol. 2003;23(6):553-562.
28. Thekiso TB, Murphy P, Milnes J, Lambe K, Curtin A, Farren CK. Acceptance and commitment therapy in the treatment of alcohol use disorder and comorbid affective disorder: a pilot matched control trial. Behav Ther. 2015;46(6):717-728.
29. Fleck DE, Amdt S, Delbello MP, Strakowski SM. Concurrent tracking of alcohol use and bipolar disorder symptoms. Bipolar Disord. 2006:8(4):338-344.
30. Brown ES, Gaza M, Carmody TJ. A randomized, double-blind, placebo-controlled add-on trial of quetiapine in outpatients with bipolar disorder and alcohol use disorders. J Clin Psychiatry. 2008;69(5):701-705.
31. Brown ES, Carmody TJ, Schmitz JM, et al. A randomized, double-blind, placebocontrolled pilot study of naltrexone in outpatients with bipolar disorder and alcohol dependence. Alcohol Clin Exp Res. 2009;33(11):1863-1869.
32. Tolliver BK, Desantis SM, Brown DG, Prisciandaro JJ, Brady KT. A randomized, double-blind, placebo-controlled clinical trial of acamprosate in alcoholdependent individuals with bipolar disorder: a preliminary report. Bipolar Disord. 2012;14(1):54-63.
33. Pettinati HM, O’Brien CP, Dundon WD. Current status of co-occurring mood and substance use disorders: a new therapeutic target. Am J Psychiatry. 2013;170(1):23-30.
34. Salloum IM, Cornelius JR, Daley DC, Kirisci L, Himmelhoch JM, Thase ME. Efficacy of valproate maintenance in patients with bipolar disorder and alcoholism: a double-blind placebo-controlled study. Arch Gen Psychiatry. 2005;62(1):37-45.
35. Farren CK, Hill KP, Weiss RD. Bipolar disorder and alcohol use disorder: a review. Curr Psychiatry Rep. 2012;14(6):659-666.
36. Dorus W, Ostrow DG, Anton R, et al. Lithium treatment of depressed and nondepressed alcoholics. JAMA. 1989;262(12):1646-1652.
37. Han DH, Kim SM, Choi JE, Min KJ, Renshaw PF. Adjunctive aripiprazole therapy with escitalopram in patients with co-morbid major depressive disorder and alcohol dependence: clinical and neuroimaging evidence. J Psychopharmacol. 2013;27(3):282-291.
38. Kranzler HR, Burleson JA, Korner P, et al. Placebo-controlled trial of fluoxetine as an adjunct to relapse prevention in alcoholics. Am J Psychiatry. 1995;152(3):391-397.
39. Roy A. Placebo-controlled study of sertraline in depressed recently abstinent alcoholics. Biol Psychiatry. 1998;44(7):633-637.
40. Charney DA, Heath LM, Zikos E, Palacios-Boix J, Gill KJ. Poorer drinking outcomes with citalopram treatment for alcohol dependence: a randomized, doubleblind, placebo-controlled trial. Alcohol Clin Exp Res. 2015;39(9):1756-1765.
41. Adamson SJ, Sellman JD, Foulds JA, et al. A randomized trial of combined citalopram and naltrexone for non-abstinent outpatients with co-occurring alcohol dependence and major depression. J Clin Psychopharmacol. 2015;35(2):143-149.
42. Nunes EV, Levin FR. Treatment of depression in patients with alcohol or other drug dependence: a meta-analysis. JAMA. 2004;291(15):1887-1896.
43. Davis LL, Wisniewski SR, Howland RH, et al. Does comorbid substance use disorder impair recovery from major depression with SSRI treatment? An analysis of the STAR*D level one treatment outcomes. Drug Alcohol Depend. 2010;107(2-3):161-170.
44. Pettinati HM. The use of selective reuptake inhibitors in treating alcoholic subtypes. J Clin Psychiatry. 2001;62(suppl 20):26-31.
45. Cornelius JR, Salloum IM, Ehler JG, et al. Fluoxetine in depressed alcoholics. A double-blind, placebo-controlled trial. Arch Gen Psychiatry. 1997;54(8):700-705.
46. Mason BJ, Kocsis JH, Ritvo EC, Cutler RB. A double-blind, placebo-controlled trial of desipramine for primary alcohol dependence stratified on the presence of absence of major depression. JAMA. 1996;275(10):761-767.
47. McGrath PJ, Nunes EV, Stewart JW, et al. Imipramine treatment of alcoholics with primary depression: a placebo-controlled clinical trial. Arch Gen Psychiatry. 1996;53(3):232-240.
48. Pettinati HM, Oslin DW, Kampman KM, et al. A double-blind, placebo-controlled trial combining sertraline and naltrexone for treating co-occurring depression and alcohol dependence. Am J Psychiatry. 2010;167(6):668-675.
Outcomes After Endoscopic Dilation of Laryngotracheal Stenosis: An Analysis of ACS-NSQIP
From the Northwestern University, Feinberg School of Medicine, Chicago, IL (Mr. Bavishi, Dr. Lavin), the Johns Hopkins University, Baltimore, MD (Dr. Boss), Children’s National Medical Center, Washington, DC (Dr. Shah), and Ann & Robert H. Lurie Children’s Hospital of Chicago, Chicago, IL (Dr. Lavin).
Abstract
- Background: Endoscopic management of pediatric subglottic stenosis is common; however, no multiinstitutional studies have assessed its perioperative outcomes. The American College of Surgeon’s National Surgical Quality Improvement Program – Pediatric (ACS-NSQIP-P) represents a source of such data.
- Objective: To investigate 30-day outcomes of endoscopic dilation of the pediatric airway and to compare these outcomes to those seen with open reconstruction techniques.
- Methods: Current procedural terminology (CPT) codes were queried for endoscopic or open airway reconstruction in the 2015 ACS-NSQIP-P Public Use File (PUF). Demographics and 30-day events were abstracted to compare open to endoscopic techniques and to assess for risk factors for varied outcomes after endoscopic dilation. Outcome measures included length of stay (LOS), 30-day rates of reintubation, readmission, and reoperation.
- Results: 171 endoscopic and 116 open procedures were identified. Mean age at endoscopic and open procedures was 4.1 (SEM = 0.37) and 5.4 years (SEM = 0.40). Mean LOS was shorter after endoscopic procedures (5.5 days, SEM = 1.13 vs. 11.3 days SEM = 1.01, P < 0.001). Open procedures had higher rates of reintubation (OR = 7.41, P = 0.026) and reoperation (OR = 3.09, P = 0.009). In patients undergoing endoscopic dilation, children < 1 year were more likely to require readmission (OR = 4.21, P = 0.03) and reoperation (OR = 4.39, P = 0.03) when compared with older children.
- Conclusion: Open airway reconstruction is associated with longer LOS and increased reintubations and reoperations, suggesting a possible opportunity to improve value in health care in the appropriately selected patient. Reoperations and readmissions following endoscopic dilation are more prevalent in children younger than 1 year.
Keywords: airway stenosis; subglottic stenosis; endoscopic dilation; pediatrics; outcomes.
Historically, pediatric laryngotracheal stenosis was managed using open reconstruction techniques, including laryngoplasty, tracheal resection, and cervical tracheoplasty. Initial reports of endoscopic dilation were described in the 1980s as a means to salvage re-stenosis after open reconstruction [1]. Currently, primary endoscopic dilation has become commonplace in otolaryngology due to its less invasive nature as well as—in cases of balloon dilation—minimization of tissue damage [2]. The advancements made in endoscopic balloon dilation have reduced the frequency with which open reconstruction is performed.
Systematic reviews and case series investigating endoscopic dilation indicate a 70% to 80% success rate in preventing future open surgery or tracheostomy [2–5]. While increased severity of stenosis has been associated with poorer outcomes in endoscopic procedures, few other risk factors that influence surgical success have been identified [4,5]. In a single study in the adult literature, open surgical management of idiopathic subglottic stenosis was associated with improved outcomes when compared to endoscopic techniques [5]. Such findings suggest a need to identify these factors for the purpose of optimizing clinical decision-making.
As laryngotracheal stenosis is rare, postoperative outcomes and risk factors are best identified on a multiinstitutional level. Due to its participation from 80 hospitals and its accurate and reliable reporting of both demographic and risk-stratified 30-day outcomes data, the American College of Surgeon’s National Surgical Quality Improvement Program – Pediatric (ACS NSQIP-P) provides such a platform [6–8]. Thirty-day outcomes and risk factors for open reconstruction utilizing the ACS NSQIP-P database have previously been reported; however, no such outcomes for endoscopic dilation have been described, and no comparison between endoscopic and open procedures has been made [9]. The purpose of this study was to utilize the 2015 ACS-NSQIP-P database to investigate 30-day outcomes of endoscopic dilation of the pediatric airway and to compare these outcomes to open reconstruction techniques. Secondarily, we aimed to determine if any demographic factors or medical comorbidities are associated with varied outcomes in endoscopic reconstruction. While these data reflect safety and quality of this procedure in the United States, findings may potentially be applied across international settings.
Methods
Data Source
Data was obtained from the 2015 ACS-NSQIP-P Public Use File (PUF). Due to the de-identified and public nature of these data, this research was exempt from review by the Ann & Robert H. Lurie Children’s Hospital of Chicago review board. Data collection methods for ACS-NSQIP-P have previously been described [10]. In brief, data was collected from 80 hospitals on approximately 120 preoperative, intraoperative, and postoperative variables. Cases are systematically sampled on an 8-day cycle basis, where the first 35 cases meeting the inclusion criteria in each hospital in each cycle are submitted to ACS-NSQIP-P.
Variables and Outcomes
Airway procedures for endoscopic dilations and open reconstructions were obtained by CPT code. Endoscopic dilations (CPT 31528) were compared to open reconstructions, which included laryngoplasty (31580, 31582), cervical tracheoplasty (31750), cricoid split (31587), and tracheal resection (31780). Demographic variables included age, sex, race, and history of prematurity. Presence of specific comorbid diseases were also collected and tested for significance.
Dependent outcomes of interest were unplanned 30-day postoperative events grouped as reoperation, unplanned readmission, and postoperative reintubation. In the case of endoscopic procedures, the presence of salvage open reconstruction or tracheostomy within 30 days of surgery was also recorded. Length of stay (LOS) after the procedure was collected. Specific postoperative complications and reasons for readmission were recorded within the limitations of data available in the PUF.
Analysis
Analysis was performed using descriptive statistics and frequency analysis where appropriate. Chi-square analysis was used to compare adverse events between open and endoscopic procedures. Logistic regression with calculation of odds ratio (OR) was performed to determine predictive factors for reoperation, readmission, and reintubation in all pediatric airway reconstructive procedures in adjusted and unadjusted models. T-test and linear regression was performed on the continuous outcome of length of stay. For all analyses, a p value of < 0.05 was considered statistically significant. All variable recoding and statistical analyses were performed in SAS/STAT software (Cary, NC).
Results
A total of 84,056 pediatric procedures were extracted from the 2015 NSQIP-P PUFs. Using the above CPT codes, 171 endoscopic dilations and 116 open airway reconstructions were identified, with patient age ranging from 0 days to 17.6 years. Average age of patients undergoing endoscopic dilation and open reconstruction was 4.1 and 5.4 years, respectively (Table 1). 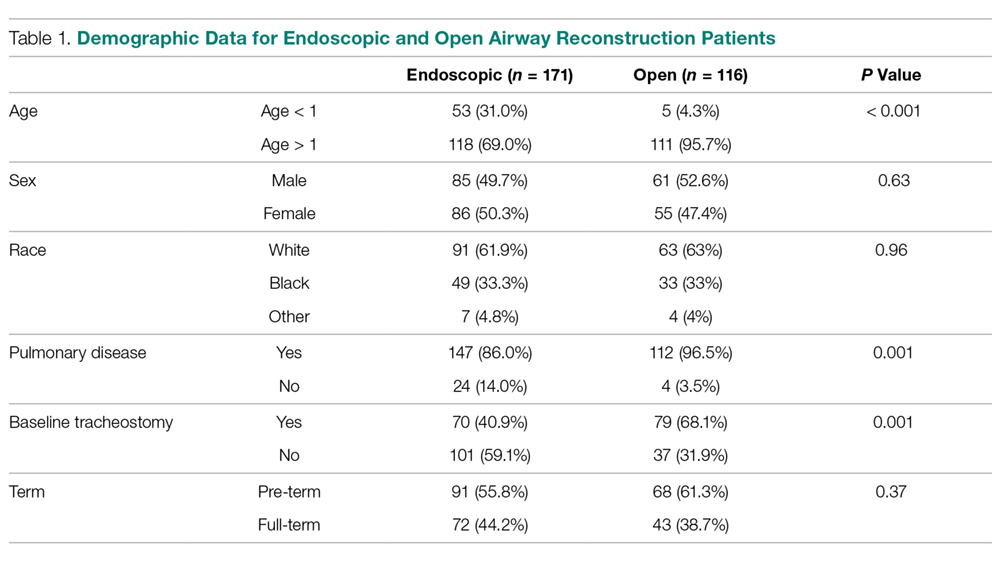
Potential confounders were tested with univariate logistic regression to determine if they had a significant impact on readmission, reintubation, or reoperation rates. These variables (Table 2) 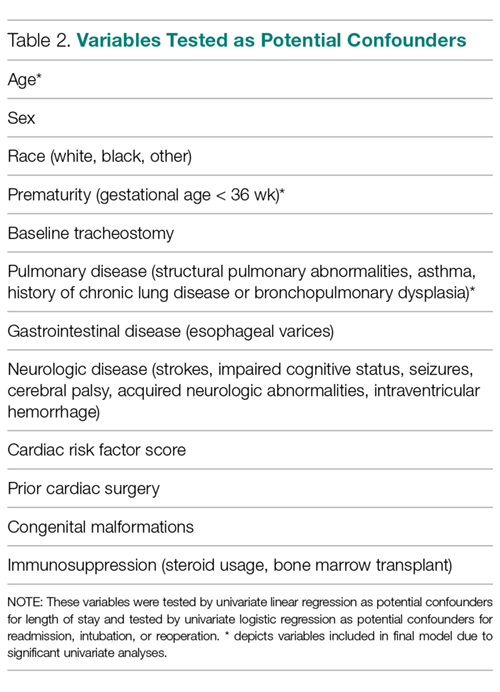
In patients undergoing endoscopic dilation, average length of stay was 5.5 days (SEM = 1.13), with 79 (48.5%) patients having a length of stay of zero days. Of all patients who had endoscopic dilations, 70 (40.1%) had a pre-existing tracheostomy and these accounted for the majority (73%) of patients who had zero days as their LOS. LOS after endoscopic management was significantly shorter than the mean of 11.3 days (SEM = 1.01) reported in those undergoing open reconstruction (P < 0.001).
With respect to 30-day adverse events, 2 patients in the endoscopic group (1.1%) required reintubation. Thirteen endoscopic dilation cases (7.6%) had an unplanned readmission, four (2.3%) of which were associated with reoperation within 30 days of the primary surgical procedure. There were 9 other reoperations unassociated with unplanned readmission. Three of these reoperations were due to failed endoscopic dilations, resulting in 2 tracheostomies and one open airway reconstruction. There was one patient death, in a 0-day old with tetralogy of Fallot, trachea-esophageal fistula, and ventilator dependence who underwent emergent endoscopic dilation and died the same day.
Open procedures were associated with 11 unplanned readmissions (9.5%), 7 re-intubations (6%) and 18 reoperations (15.5%). Of patents undergoing reoperation, one patient undergoing open reconstruction underwent tracheostomy within 30 days of surgery.
When comparing open reconstruction to endoscopic dilation, there was a significant increase in reintubation (OR = 7.41, P = 0.026) and reoperation (OR = 3.09, P = 0.009) for open procedures, even with adjustment for age, tracheostomy status, and pulmonary disease. There was no significant difference between the two for unplanned readmissions (OR = 1.19, P = 0.79) (Figure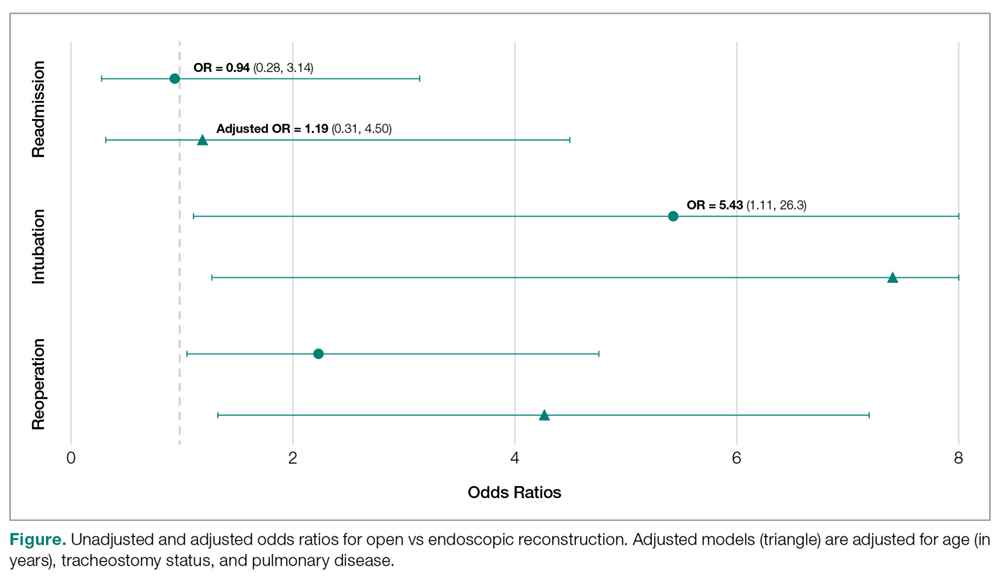
Younger age was also found to be significantly associated with reoperation rates, in an adjusted logistic model that accounted for tracheostomy status, type of surgery, and pulmonary disease. Per year of life, younger children had higher reoperation rates than older children (OR = 1.91, P = 0.017). When endoscopic dilation was individually examined, children younger than 1 year of age were more likely to undergo reoperation after an endoscopic dilation than children older than 1 (OR = 4.39, P = 0.03). Children under age 1 were also more likely to have an unplanned readmission after an endoscopic dilation (OR = 4.21, P = 0.03). The relationship between age and re-intubation was not significant (OR = 0, P = 0.95). For open reconstruction, this age dichotomization was not associated with any increased reoperation (OR = 2.3, P = 0.52), readmission (OR = 0, P = 0.97), or reintubation (OR = 0, P = 0.94).
T-test analysis was performed to determine if children < 1 year old also had significantly longer hospital stays after endoscopic dilation than older children (mean 14.1 days vs 1.9 days, P < 0.001). This relationship held true in a linear regression after adjustment for pulmonary disease and tracheostomy, with length of stay decreasing by 0.48 days per year of life (P = 0.03). For endoscopic dilations, the same relationship held true, where length of stay decreased by 0.75 days per year of life.
Discussion
Endoscopic dilation for primary management of pediatric laryngotracheal stenosis has become commonplace. Despite this, outcomes of this procedure have only been described in case series and meta-analyses [2–5]. The relative rarity of pediatric laryngotracheal stenosis suggests the need for large, multi-institutional data for purposes of patient selection and medical decision-making.
This study utilized the ACS-NSQIP-Pediatric database to highlight 30-day outcomes of endoscopic dilation and to compare these outcomes to those of open airway reconstruction procedures. The ACS-NSQIP database has been endorsed by multiple organizations, including the Center for Medicare and Medicaid Services, the Joint Commission, and the American Medical Association. It has been shown to have higher sensitivity and a lower false-positive rate when compared to administrative data, in part due to data collection from trained personnel [11]. Furthermore, ACS-NSQIP use has the additional benefit of reporting an unplanned admission—a feature unavailable in review of claims data [12].
With respect to adverse events, our study demonstrates that endoscopic dilation is associated with an equally high rate of unplanned readmission when compared to open reconstruction. The high prevalence of comorbid disease such as chronic lung disease (32% of endoscopic dilation and 43% of open reconstruction) can account for some of the morbidity associated with any airway procedures.
Despite high rates of unplanned readmission, patients undergoing endoscopic dilation were less likely to have reoperations within 30 days of initial surgery when compared to those undergoing open reconstruction. While differences in disease severity may be partially responsible for this difference in the reoperation rate, this finding is notable given the health care costs associated with multiple operations as well as safety concerns with multiple anesthetics in the very young [13,14].
The ACS-NSQIP platform does not distinguish unplanned from planned reoperations. In the setting of airway surgery, where multiple planned reoperations are commonplace, this metric is a suboptimal stand-alone indicator of adverse outcomes. Other markers available in the database—such as reintubations and performance of tracheostomy or open airway reconstruction within 30-days of surgery—are more indicative of surgical outcome in the setting of airway surgery. We found that both reintubations and salvage open reconstruction within 30-days were rare. It should be noted that the ACS-NSQIP data does not report any events occurring outside of the 30-day postoperative period, representing potential limitation of the use of this database. As was previously advocated by Roxbury and colleagues, procedure/subspecialty specific outcome data collection would also improve outcome analysis of airway and other otolaryngologic procedures [9]. In the setting of airway reconstruction, this would include data pertaining to Cotton-Meyer grading systems well as postoperative voice and swallow outcomes.
In addition to safety profile, endoscopic procedures were associated with shorter LOS when compared with open reconstruction, representing another potential source of cost savings with this less invasive method. This is especially significant given that open reconstruction patients spend much of their inpatient stay in an ICU setting. In patients who are candidates for endoscopic procedures, this lower-risk, lower-cost profile of endoscopic dilation has the opportunity to improve value in health care and may be the source of future improvement initiatives.
In addition to comparing overall outcomes between endoscopic and open management of laryngotracheal stenosis, our study aimed to identify factors that were associated with varied outcomes in patients undergoing primary endoscopic dilation. We found that children younger than 1 year of age were 5.8 times more likely to undergo an unplanned reoperation after an endoscopic dilation than children over 1 year. A similar finding was reported in open airway surgeries, with increased reoperation rates in children < 3 years old [9]. The justification of a dichotomization at 1 year was made as expert opinion recognizes that the infant airway is less forgiving to intervention given its small size. Young age was also a factor in prolonged LOS as was determined by linear regression. It is likely that this increased LOS may be in part due to associations of young age and the neonatal ICU population. One must balance the increased risk of surgery in the young with that of tracheostomy, which has a published complication rate of 18% to 50% and direct mortality rate of 1% to 2% in the pediatric population [15–18]. Understanding these relative risks may help guide the airway surgeon in preoperative counseling with families and medical decision-making.
As discussed above, the limitation of data to a 30-day period is a relative weakness of ACS-NSQIP database use for studies of airway reconstruction, as the ultimate outcome—a stable, decannulated airway—may occur outside of this time period. As many quality metrics utilize data from the 30-day postoperative period, knowledge of these outcomes remains valuable in surgical decision-making. Ultimately, collection of data in a large, long-term dataset would allow broader generalizations to be made about the differences between open and endoscopic procedures and would also give a more comprehensive picture of the outcomes of endoscopic dilation.
In conclusion, this study is the first to analyze 30-day postoperative outcomes in pediatric endoscopic airway dilations using data aggregated by ACS-NSQIP from institutions across the United States. This data indicates that endoscopic airway dilation is a relatively safe procedure, especially compared with open reconstruction; however, additional data on disease severity and other outcomes is necessary to draw final conclusions of superiority of technique. Future improvement initiatives could be aimed at the impact of this lower-risk, lower-cost procedure in the appropriately selected patient. Outcomes of endoscopic dilation are poorer in those less than 1 year of age, as they are associated with increased reoperation rates and increased length of stay compared to older children. One must balance these risks in the very young with the risks associated with tracheostomy and other alternative airway management modalities.
Note: This work was presented in a paper at the AAO-HNS 2017 meeting, Chicago, IL, 10 Sep 2017.
Corresponding author: Jennifer Lavin, MD, MS, 225 E Chicago Ave., Box 25, Chicago, IL 60611, [email protected].
Financial disclosures: None.
1. Cohen MD, Weber TR, Rao CC. Balloon dilatation of tracheal and bronchial stenosis. AJR Am J Roentgenol 1984;142:477–8.
2. Chueng K, Chadha NK. Primary dilatation as a treatment for pediatric laryngotracheal stenosis: a systematic review. Int J Pediatr Otorhinolaryngol 2013;77:623–8.
3. Hautefort C, Teissier N, Viala P, Van Den Abbeele T. Balloon dilation laryngoplasty for subglottic stenosis in children: eight years’ experience. Arch Otolaryngol Head Neck Surg 2012;138:235–40.
4. Lang M, Brietzke SE. A systematic review and meta-analysis of endoscopic balloon dilation of pediatric subglottic stenosis. Otolaryngol Head Neck Surg 2014;150:174–9.
5. Maresh A, Preciado DA, O’Connell AP, Zalzal GH. A comparative analysis of open surgery vs endoscopic balloon dilation for pediatric subglottic stenosis. JAMA Otolaryngol Head Neck Surg 2014;140:901–5.
6. Gelbard A, Donovan DT, Ongkasuwan J, et al. Disease homogeneity and treatment heterogeneity in idiopathic subglottic stenosis. Laryngoscope 2016;126:1390–6.
7. ACS-NSQIP. ACS National Surgical Quality Improvement Program® (ACS NSQIP®). 2017. Available at: http://site.acsnsqip.org/program-specifics/scr-training-and-resources. Accessed June 2 2017.
8. Shiloach M, Frencher SK Jr, Steeger JE, et al. Toward robust information: data quality and inter-rater reliability in the American College of Surgeons National Surgical Quality Improvement Program. J Am Coll Surg 2010;210:6–16.
9. Roxbury CR, Jatana KR, Shah RK, Boss EF. Safety and postoperative adverse events in pediatric airway reconstruction: Analysis of ACS-NSQIP-P 30-day outcomes. Laryngoscope 2017;127:504–8.
10. Raval MV, Dillon PW, Bruny JL, et al. Pediatric American College of Surgeons National Surgical Quality Improvement Program: feasibility of a novel, prospective assessment of surgical outcomes. J Pediatr Surg 2011;46:115–21.
11. Lawson EH, Louie R, Zingmond DS, et al. A comparison of clinical registry versus administrative claims data for reporting of 30-day surgical complications. Ann Surg 2012;256:973–81.
12. Sellers MM, Merkow RP, Halverson A, et al. Validation of new readmission data in the American College of Surgeons National Surgical Quality Improvement Program. J Am Coll Surg 2013;216:420–7.
13. Jevtovic-Todorovic V, Hartman RE, Izumi Y, et al. Early exposure to common anesthetic agents causes widespread neurodegeneration in the developing rat brain and persistent learning deficits. J Neurosci 2003;23:876–82.
14. Patel P, Sun L. Update on neonatal anesthetic neurotoxicity: insight into molecular mechanisms and relevance to humans. Anesthesiology 2009;110:703–8.
15. Crysdale WS, Feldman RI, Naito K. Tracheotomies: a 10-year experience in 319 children. Ann Otol Rhinol Laryngol 1988;97(5 Pt 1):439–43.
16. Goldenberg D, Ari EG, Golz A, et al. Tracheotomy complications: a retrospective study of 1130 cases. Otolaryngol Head Neck Surg 2000;123:495–500.
17. Mahadevan M, Barber C, Salkeld L, et al N. Pediatric tracheotomy: 17 year review. Int J Pediatr Otorhinolaryngol 2007;71:1829–35.
18. Ozmen S, Ozmen OA, Unal OF. Pediatric tracheotomies: a 37-year experience in 282 children. Int J Pediatr Otorhinolaryngol 2009;73:959–61.
From the Northwestern University, Feinberg School of Medicine, Chicago, IL (Mr. Bavishi, Dr. Lavin), the Johns Hopkins University, Baltimore, MD (Dr. Boss), Children’s National Medical Center, Washington, DC (Dr. Shah), and Ann & Robert H. Lurie Children’s Hospital of Chicago, Chicago, IL (Dr. Lavin).
Abstract
- Background: Endoscopic management of pediatric subglottic stenosis is common; however, no multiinstitutional studies have assessed its perioperative outcomes. The American College of Surgeon’s National Surgical Quality Improvement Program – Pediatric (ACS-NSQIP-P) represents a source of such data.
- Objective: To investigate 30-day outcomes of endoscopic dilation of the pediatric airway and to compare these outcomes to those seen with open reconstruction techniques.
- Methods: Current procedural terminology (CPT) codes were queried for endoscopic or open airway reconstruction in the 2015 ACS-NSQIP-P Public Use File (PUF). Demographics and 30-day events were abstracted to compare open to endoscopic techniques and to assess for risk factors for varied outcomes after endoscopic dilation. Outcome measures included length of stay (LOS), 30-day rates of reintubation, readmission, and reoperation.
- Results: 171 endoscopic and 116 open procedures were identified. Mean age at endoscopic and open procedures was 4.1 (SEM = 0.37) and 5.4 years (SEM = 0.40). Mean LOS was shorter after endoscopic procedures (5.5 days, SEM = 1.13 vs. 11.3 days SEM = 1.01, P < 0.001). Open procedures had higher rates of reintubation (OR = 7.41, P = 0.026) and reoperation (OR = 3.09, P = 0.009). In patients undergoing endoscopic dilation, children < 1 year were more likely to require readmission (OR = 4.21, P = 0.03) and reoperation (OR = 4.39, P = 0.03) when compared with older children.
- Conclusion: Open airway reconstruction is associated with longer LOS and increased reintubations and reoperations, suggesting a possible opportunity to improve value in health care in the appropriately selected patient. Reoperations and readmissions following endoscopic dilation are more prevalent in children younger than 1 year.
Keywords: airway stenosis; subglottic stenosis; endoscopic dilation; pediatrics; outcomes.
Historically, pediatric laryngotracheal stenosis was managed using open reconstruction techniques, including laryngoplasty, tracheal resection, and cervical tracheoplasty. Initial reports of endoscopic dilation were described in the 1980s as a means to salvage re-stenosis after open reconstruction [1]. Currently, primary endoscopic dilation has become commonplace in otolaryngology due to its less invasive nature as well as—in cases of balloon dilation—minimization of tissue damage [2]. The advancements made in endoscopic balloon dilation have reduced the frequency with which open reconstruction is performed.
Systematic reviews and case series investigating endoscopic dilation indicate a 70% to 80% success rate in preventing future open surgery or tracheostomy [2–5]. While increased severity of stenosis has been associated with poorer outcomes in endoscopic procedures, few other risk factors that influence surgical success have been identified [4,5]. In a single study in the adult literature, open surgical management of idiopathic subglottic stenosis was associated with improved outcomes when compared to endoscopic techniques [5]. Such findings suggest a need to identify these factors for the purpose of optimizing clinical decision-making.
As laryngotracheal stenosis is rare, postoperative outcomes and risk factors are best identified on a multiinstitutional level. Due to its participation from 80 hospitals and its accurate and reliable reporting of both demographic and risk-stratified 30-day outcomes data, the American College of Surgeon’s National Surgical Quality Improvement Program – Pediatric (ACS NSQIP-P) provides such a platform [6–8]. Thirty-day outcomes and risk factors for open reconstruction utilizing the ACS NSQIP-P database have previously been reported; however, no such outcomes for endoscopic dilation have been described, and no comparison between endoscopic and open procedures has been made [9]. The purpose of this study was to utilize the 2015 ACS-NSQIP-P database to investigate 30-day outcomes of endoscopic dilation of the pediatric airway and to compare these outcomes to open reconstruction techniques. Secondarily, we aimed to determine if any demographic factors or medical comorbidities are associated with varied outcomes in endoscopic reconstruction. While these data reflect safety and quality of this procedure in the United States, findings may potentially be applied across international settings.
Methods
Data Source
Data was obtained from the 2015 ACS-NSQIP-P Public Use File (PUF). Due to the de-identified and public nature of these data, this research was exempt from review by the Ann & Robert H. Lurie Children’s Hospital of Chicago review board. Data collection methods for ACS-NSQIP-P have previously been described [10]. In brief, data was collected from 80 hospitals on approximately 120 preoperative, intraoperative, and postoperative variables. Cases are systematically sampled on an 8-day cycle basis, where the first 35 cases meeting the inclusion criteria in each hospital in each cycle are submitted to ACS-NSQIP-P.
Variables and Outcomes
Airway procedures for endoscopic dilations and open reconstructions were obtained by CPT code. Endoscopic dilations (CPT 31528) were compared to open reconstructions, which included laryngoplasty (31580, 31582), cervical tracheoplasty (31750), cricoid split (31587), and tracheal resection (31780). Demographic variables included age, sex, race, and history of prematurity. Presence of specific comorbid diseases were also collected and tested for significance.
Dependent outcomes of interest were unplanned 30-day postoperative events grouped as reoperation, unplanned readmission, and postoperative reintubation. In the case of endoscopic procedures, the presence of salvage open reconstruction or tracheostomy within 30 days of surgery was also recorded. Length of stay (LOS) after the procedure was collected. Specific postoperative complications and reasons for readmission were recorded within the limitations of data available in the PUF.
Analysis
Analysis was performed using descriptive statistics and frequency analysis where appropriate. Chi-square analysis was used to compare adverse events between open and endoscopic procedures. Logistic regression with calculation of odds ratio (OR) was performed to determine predictive factors for reoperation, readmission, and reintubation in all pediatric airway reconstructive procedures in adjusted and unadjusted models. T-test and linear regression was performed on the continuous outcome of length of stay. For all analyses, a p value of < 0.05 was considered statistically significant. All variable recoding and statistical analyses were performed in SAS/STAT software (Cary, NC).
Results
A total of 84,056 pediatric procedures were extracted from the 2015 NSQIP-P PUFs. Using the above CPT codes, 171 endoscopic dilations and 116 open airway reconstructions were identified, with patient age ranging from 0 days to 17.6 years. Average age of patients undergoing endoscopic dilation and open reconstruction was 4.1 and 5.4 years, respectively (Table 1).
Potential confounders were tested with univariate logistic regression to determine if they had a significant impact on readmission, reintubation, or reoperation rates. These variables (Table 2)
In patients undergoing endoscopic dilation, average length of stay was 5.5 days (SEM = 1.13), with 79 (48.5%) patients having a length of stay of zero days. Of all patients who had endoscopic dilations, 70 (40.1%) had a pre-existing tracheostomy and these accounted for the majority (73%) of patients who had zero days as their LOS. LOS after endoscopic management was significantly shorter than the mean of 11.3 days (SEM = 1.01) reported in those undergoing open reconstruction (P < 0.001).
With respect to 30-day adverse events, 2 patients in the endoscopic group (1.1%) required reintubation. Thirteen endoscopic dilation cases (7.6%) had an unplanned readmission, four (2.3%) of which were associated with reoperation within 30 days of the primary surgical procedure. There were 9 other reoperations unassociated with unplanned readmission. Three of these reoperations were due to failed endoscopic dilations, resulting in 2 tracheostomies and one open airway reconstruction. There was one patient death, in a 0-day old with tetralogy of Fallot, trachea-esophageal fistula, and ventilator dependence who underwent emergent endoscopic dilation and died the same day.
Open procedures were associated with 11 unplanned readmissions (9.5%), 7 re-intubations (6%) and 18 reoperations (15.5%). Of patents undergoing reoperation, one patient undergoing open reconstruction underwent tracheostomy within 30 days of surgery.
When comparing open reconstruction to endoscopic dilation, there was a significant increase in reintubation (OR = 7.41, P = 0.026) and reoperation (OR = 3.09, P = 0.009) for open procedures, even with adjustment for age, tracheostomy status, and pulmonary disease. There was no significant difference between the two for unplanned readmissions (OR = 1.19, P = 0.79) (Figure
Younger age was also found to be significantly associated with reoperation rates, in an adjusted logistic model that accounted for tracheostomy status, type of surgery, and pulmonary disease. Per year of life, younger children had higher reoperation rates than older children (OR = 1.91, P = 0.017). When endoscopic dilation was individually examined, children younger than 1 year of age were more likely to undergo reoperation after an endoscopic dilation than children older than 1 (OR = 4.39, P = 0.03). Children under age 1 were also more likely to have an unplanned readmission after an endoscopic dilation (OR = 4.21, P = 0.03). The relationship between age and re-intubation was not significant (OR = 0, P = 0.95). For open reconstruction, this age dichotomization was not associated with any increased reoperation (OR = 2.3, P = 0.52), readmission (OR = 0, P = 0.97), or reintubation (OR = 0, P = 0.94).
T-test analysis was performed to determine if children < 1 year old also had significantly longer hospital stays after endoscopic dilation than older children (mean 14.1 days vs 1.9 days, P < 0.001). This relationship held true in a linear regression after adjustment for pulmonary disease and tracheostomy, with length of stay decreasing by 0.48 days per year of life (P = 0.03). For endoscopic dilations, the same relationship held true, where length of stay decreased by 0.75 days per year of life.
Discussion
Endoscopic dilation for primary management of pediatric laryngotracheal stenosis has become commonplace. Despite this, outcomes of this procedure have only been described in case series and meta-analyses [2–5]. The relative rarity of pediatric laryngotracheal stenosis suggests the need for large, multi-institutional data for purposes of patient selection and medical decision-making.
This study utilized the ACS-NSQIP-Pediatric database to highlight 30-day outcomes of endoscopic dilation and to compare these outcomes to those of open airway reconstruction procedures. The ACS-NSQIP database has been endorsed by multiple organizations, including the Center for Medicare and Medicaid Services, the Joint Commission, and the American Medical Association. It has been shown to have higher sensitivity and a lower false-positive rate when compared to administrative data, in part due to data collection from trained personnel [11]. Furthermore, ACS-NSQIP use has the additional benefit of reporting an unplanned admission—a feature unavailable in review of claims data [12].
With respect to adverse events, our study demonstrates that endoscopic dilation is associated with an equally high rate of unplanned readmission when compared to open reconstruction. The high prevalence of comorbid disease such as chronic lung disease (32% of endoscopic dilation and 43% of open reconstruction) can account for some of the morbidity associated with any airway procedures.
Despite high rates of unplanned readmission, patients undergoing endoscopic dilation were less likely to have reoperations within 30 days of initial surgery when compared to those undergoing open reconstruction. While differences in disease severity may be partially responsible for this difference in the reoperation rate, this finding is notable given the health care costs associated with multiple operations as well as safety concerns with multiple anesthetics in the very young [13,14].
The ACS-NSQIP platform does not distinguish unplanned from planned reoperations. In the setting of airway surgery, where multiple planned reoperations are commonplace, this metric is a suboptimal stand-alone indicator of adverse outcomes. Other markers available in the database—such as reintubations and performance of tracheostomy or open airway reconstruction within 30-days of surgery—are more indicative of surgical outcome in the setting of airway surgery. We found that both reintubations and salvage open reconstruction within 30-days were rare. It should be noted that the ACS-NSQIP data does not report any events occurring outside of the 30-day postoperative period, representing potential limitation of the use of this database. As was previously advocated by Roxbury and colleagues, procedure/subspecialty specific outcome data collection would also improve outcome analysis of airway and other otolaryngologic procedures [9]. In the setting of airway reconstruction, this would include data pertaining to Cotton-Meyer grading systems well as postoperative voice and swallow outcomes.
In addition to safety profile, endoscopic procedures were associated with shorter LOS when compared with open reconstruction, representing another potential source of cost savings with this less invasive method. This is especially significant given that open reconstruction patients spend much of their inpatient stay in an ICU setting. In patients who are candidates for endoscopic procedures, this lower-risk, lower-cost profile of endoscopic dilation has the opportunity to improve value in health care and may be the source of future improvement initiatives.
In addition to comparing overall outcomes between endoscopic and open management of laryngotracheal stenosis, our study aimed to identify factors that were associated with varied outcomes in patients undergoing primary endoscopic dilation. We found that children younger than 1 year of age were 5.8 times more likely to undergo an unplanned reoperation after an endoscopic dilation than children over 1 year. A similar finding was reported in open airway surgeries, with increased reoperation rates in children < 3 years old [9]. The justification of a dichotomization at 1 year was made as expert opinion recognizes that the infant airway is less forgiving to intervention given its small size. Young age was also a factor in prolonged LOS as was determined by linear regression. It is likely that this increased LOS may be in part due to associations of young age and the neonatal ICU population. One must balance the increased risk of surgery in the young with that of tracheostomy, which has a published complication rate of 18% to 50% and direct mortality rate of 1% to 2% in the pediatric population [15–18]. Understanding these relative risks may help guide the airway surgeon in preoperative counseling with families and medical decision-making.
As discussed above, the limitation of data to a 30-day period is a relative weakness of ACS-NSQIP database use for studies of airway reconstruction, as the ultimate outcome—a stable, decannulated airway—may occur outside of this time period. As many quality metrics utilize data from the 30-day postoperative period, knowledge of these outcomes remains valuable in surgical decision-making. Ultimately, collection of data in a large, long-term dataset would allow broader generalizations to be made about the differences between open and endoscopic procedures and would also give a more comprehensive picture of the outcomes of endoscopic dilation.
In conclusion, this study is the first to analyze 30-day postoperative outcomes in pediatric endoscopic airway dilations using data aggregated by ACS-NSQIP from institutions across the United States. This data indicates that endoscopic airway dilation is a relatively safe procedure, especially compared with open reconstruction; however, additional data on disease severity and other outcomes is necessary to draw final conclusions of superiority of technique. Future improvement initiatives could be aimed at the impact of this lower-risk, lower-cost procedure in the appropriately selected patient. Outcomes of endoscopic dilation are poorer in those less than 1 year of age, as they are associated with increased reoperation rates and increased length of stay compared to older children. One must balance these risks in the very young with the risks associated with tracheostomy and other alternative airway management modalities.
Note: This work was presented in a paper at the AAO-HNS 2017 meeting, Chicago, IL, 10 Sep 2017.
Corresponding author: Jennifer Lavin, MD, MS, 225 E Chicago Ave., Box 25, Chicago, IL 60611, [email protected].
Financial disclosures: None.
1. Cohen MD, Weber TR, Rao CC. Balloon dilatation of tracheal and bronchial stenosis. AJR Am J Roentgenol 1984;142:477–8.
2. Chueng K, Chadha NK. Primary dilatation as a treatment for pediatric laryngotracheal stenosis: a systematic review. Int J Pediatr Otorhinolaryngol 2013;77:623–8.
3. Hautefort C, Teissier N, Viala P, Van Den Abbeele T. Balloon dilation laryngoplasty for subglottic stenosis in children: eight years’ experience. Arch Otolaryngol Head Neck Surg 2012;138:235–40.
4. Lang M, Brietzke SE. A systematic review and meta-analysis of endoscopic balloon dilation of pediatric subglottic stenosis. Otolaryngol Head Neck Surg 2014;150:174–9.
5. Maresh A, Preciado DA, O’Connell AP, Zalzal GH. A comparative analysis of open surgery vs endoscopic balloon dilation for pediatric subglottic stenosis. JAMA Otolaryngol Head Neck Surg 2014;140:901–5.
6. Gelbard A, Donovan DT, Ongkasuwan J, et al. Disease homogeneity and treatment heterogeneity in idiopathic subglottic stenosis. Laryngoscope 2016;126:1390–6.
7. ACS-NSQIP. ACS National Surgical Quality Improvement Program® (ACS NSQIP®). 2017. Available at: http://site.acsnsqip.org/program-specifics/scr-training-and-resources. Accessed June 2 2017.
8. Shiloach M, Frencher SK Jr, Steeger JE, et al. Toward robust information: data quality and inter-rater reliability in the American College of Surgeons National Surgical Quality Improvement Program. J Am Coll Surg 2010;210:6–16.
9. Roxbury CR, Jatana KR, Shah RK, Boss EF. Safety and postoperative adverse events in pediatric airway reconstruction: Analysis of ACS-NSQIP-P 30-day outcomes. Laryngoscope 2017;127:504–8.
10. Raval MV, Dillon PW, Bruny JL, et al. Pediatric American College of Surgeons National Surgical Quality Improvement Program: feasibility of a novel, prospective assessment of surgical outcomes. J Pediatr Surg 2011;46:115–21.
11. Lawson EH, Louie R, Zingmond DS, et al. A comparison of clinical registry versus administrative claims data for reporting of 30-day surgical complications. Ann Surg 2012;256:973–81.
12. Sellers MM, Merkow RP, Halverson A, et al. Validation of new readmission data in the American College of Surgeons National Surgical Quality Improvement Program. J Am Coll Surg 2013;216:420–7.
13. Jevtovic-Todorovic V, Hartman RE, Izumi Y, et al. Early exposure to common anesthetic agents causes widespread neurodegeneration in the developing rat brain and persistent learning deficits. J Neurosci 2003;23:876–82.
14. Patel P, Sun L. Update on neonatal anesthetic neurotoxicity: insight into molecular mechanisms and relevance to humans. Anesthesiology 2009;110:703–8.
15. Crysdale WS, Feldman RI, Naito K. Tracheotomies: a 10-year experience in 319 children. Ann Otol Rhinol Laryngol 1988;97(5 Pt 1):439–43.
16. Goldenberg D, Ari EG, Golz A, et al. Tracheotomy complications: a retrospective study of 1130 cases. Otolaryngol Head Neck Surg 2000;123:495–500.
17. Mahadevan M, Barber C, Salkeld L, et al N. Pediatric tracheotomy: 17 year review. Int J Pediatr Otorhinolaryngol 2007;71:1829–35.
18. Ozmen S, Ozmen OA, Unal OF. Pediatric tracheotomies: a 37-year experience in 282 children. Int J Pediatr Otorhinolaryngol 2009;73:959–61.
A Nationwide Survey and Needs Assessment of Colonoscopy Quality Assurance Programs
Colorectal cancer (CRC) is an important concern for the VA, and colonoscopy is one primary screening, surveillance, and diagnostic modality used. The observed reductions in CRC incidence and mortality over the past decade largely have been attributed to the widespread use of CRC screening options.1,2 Colonoscopy quality is critical to CRC prevention in veterans. However, endoscopy skills to detect and remove colorectal polyps using colonoscopy vary in practice.3-5
Quality benchmarks, linked to patient outcomes, have been established by specialty societies and proposed by the Centers for Medicare and Medicaid Services as reportable quality metrics.6 Colonoscopy quality metrics have been shown to be associated with patient outcomes, such as the risk of developing CRC after colonoscopy. The adenoma detection rate (ADR), defined as the proportion of average-risk screening colonoscopies in which 1 or more adenomas are detected, has the strongest association to interval or “missed” CRC after screening colonoscopy and has been linked to a risk for fatal CRC despite colonoscopy.3
In a landmark study of 314,872 examinations performed by 136 gastroenterologists, the ADR ranged from 7.4% to 52.5%.3 Among patients with ADRs in the highest quintile compared with patients in the lowest, the adjusted hazard ratios (HRs) for any interval cancer was 0.52 (95% confidence interval [CI], 0.39-0.69) and for fatal interval cancers was 0.38 (95% CI, 0.22-0.65).3 Another pooled analysis from 8 surveillance studies that followed more than 800 participants with adenoma(s) after a baseline colonoscopy showed 52% of incident cancers as probable missed lesions, 19% as possibly related to incomplete resection of an earlier, noninvasive lesion, and only 24% as probable new lesions.7 These interval cancers highlight the current imperfections of colonoscopy and the focus on measurement and reporting of quality indicators for colonoscopy.8-12
According to VHA Directive 1015, in December 2014, colonoscopy quality should be monitored as part of an ongoing quality assurance program.13 A recent report from the VA Office of the Inspector General (OIG) highlighted colonoscopy-quality deficiencies.14 The OIG report strongly recommended that the “Acting Under Secretary for Health require standardized documentation of quality indicators based on professional society guidelines and published literature.”14However, no currently standardized and readily available VHA resource measures, reports, and ensures colonoscopy quality.
The authors hypothesized that colonoscopy quality assurance programs vary widely across VHA sites. The objective of this survey was to assess the measurement and reporting practices for colonoscopy quality and identify both strengths and areas for improvement to facilitate implementation of quality assurance programs across the VA health care system.
Methods
The authors performed an online survey of VA sites to assess current colonoscopy quality assurance practices. The institutional review boards (IRBs) at the University of Utah and VA Salt Lake City Health Care System and University of California, San Francisco and San Francisco VA Health Care System classified the study as a quality improvement project that did not qualify for human subjects’ research requiring IRB review.
The authors iteratively developed and refined the questionnaire with a survey methodologist and 2 clinical domain experts. The National Program Director for Gastroenterology, and the National Gastroenterology Field Advisory Committee reviewed the survey content and pretested the survey instrument prior to final data collection. The National Program Office for Gastroenterology provided an e-mail list of all known VA gastroenterology section chiefs. The authors administered the final survey via e-mail, using the Research Electronic Data Capture (REDCap; Vanderbilt University Medical Center) platform beginning January 9, 2017.15
A follow-up reminder e-mail was sent to nonresponders after 2 weeks. After this second invitation, sites were contacted by telephone to verify that the correct contact information had been captured. Subsequently, 50 contacts were updated if e-mails bounced back or the correct contact was obtained. Points of contact received a total of 3 reminder e-mails until the final closeout of the survey on March 28, 2017; 65 of 89 (73%) of the original contacts completed the survey vs 31 of 50 (62%) of the updated contacts.
Analysis
Descriptive statistics of the responses were calculated to determine the overall proportion of VA sites measuring colonoscopy quality metrics and identification of areas in need of quality improvement. The response rate for the survey was defined as the total number of responses obtained as a proportion of the total number of points of contact. This corresponds to the American Association of Public Opinion Research’s RR1, or minimum response rate, formula.16 All categoric responses are presented as proportions. Statistical analyses were performed using STATA SE12.0 (College Station, TX).
Results
Of the 139 points of contact invited, 96 completed the survey (response rate of 69.0%), representing 93 VA facilities (of 141 possible facilities) in 44 different states. Three sites had 2 responses. Sites used various and often a combination of methods to measure quality (Table 1). 
A majority of sites’ (63.5%) quality reports represented individual provider data, whereas fewer provided quality reports for physician groups (22.9%) or for the entire facility (40.6%). Provider quality information was de-identified in 43.8% of reporting sites’ quality reports and identifiable in 37.5% of reporting sites’ quality reports. A majority of sites (74.0%) reported that the local gastroenterology section chief or quality manager has access to the quality reports. Fewer sites reported providing data to individual endoscopists (44.8% for personal and peer data and 32.3% for personal data only). One site (1%) responded that quality reports were available for public access. Survey respondents also were asked to provide the estimated time (hours required per month) to collect the data for quality metrics. Of 75 respondents providing data for this question, 28 (29.2%) and 17 (17.7%), estimated between 1 to 5 and 6 to 10 hours per month, respectively. Ten sites estimated spending between 11 to 20 hours, and 7 sites estimated spending more than 20 hours per month collecting quality metrics. A total of 13 respondents (13.5%) stated uncertainty about the time burden.
As shown in the Figure, numerous quality metrics were collected across sites with more than 80% of sites collecting information on bowel preparation quality (88.5%), cecal intubation rate (87.5%), and complications (83.3%). A majority of sites also reported collecting data on appropriateness of surveillance intervals (62.5%), colonoscopy withdrawal times (62.5%), and ADRs (61.5%). Seven sites (7.3%) did not collect quality metrics.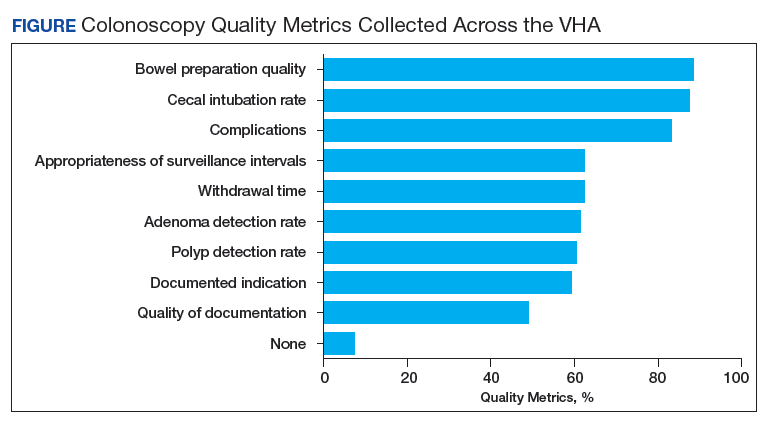
Information also was collected on colonoscopy procedure documentation to inform future efforts at standardization. A small majority (53.1%) of sites reported using endoscopic software to generate colonoscopy procedure documentation. Within these sites, 6 different types of endoscopic note writing software were used to generate procedure notes (Table 2). 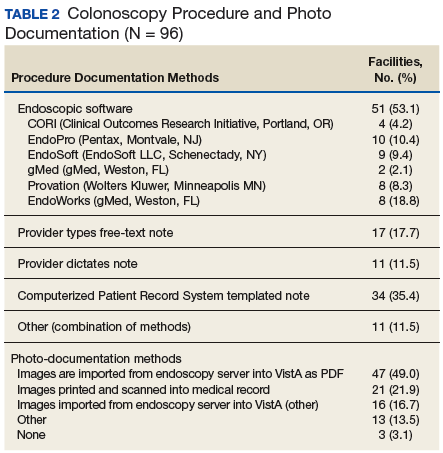
Most sites (85.4%) were aware of VHA Directive 1015 recommendations for colonoscopy quality assurance programs. A significant majority (89.5%) of respondents also indicated interest in a centralized automatic reporting system to measure and report colonoscopy quality in some form, either with aggregate data, provider data, or both (Table 3).
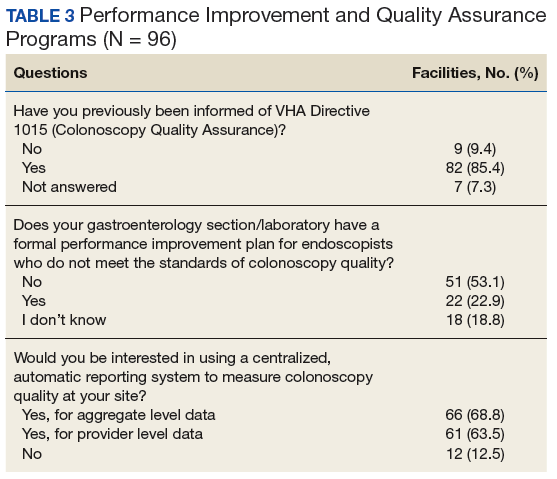
Discussion
This survey on colonoscopy quality assurance programs is the first assessment of the VHA’s efforts to measure and report colonoscopy quality indicators. The findings indicated that the majority of VA sites are measuring and reporting at least some measures of colonoscopy quality. However, the programs are significantly variable in terms of methods used to collect quality metrics, specific quality measures obtained, and how quality is reported.
The authors’ work is novel in that this is the first report of the status of colonoscopy quality assurance programs in a large U.S. health care system. The VA health care system is the largest integrated health system in the U.S., serving more than 9 million veterans annually. This survey’s high response rate further strengthens the findings. Specifically, the survey found that VA sites are making a strong concerted effort to measure and report colonoscopy quality. However, there is significant variability in documentation, measurement, and reporting practices. Moreover, the majority of VA sites do not have formal performance improvement plans in place for endoscopists who do not meet thresholds for colonoscopy quality.
Screening colonoscopy for CRC offers known mortality benefits to patients.1,17-19 Significant prior work has described and validated the importance of colonoscopy quality metrics, including bowel preparation quality, cecal intubation rate, and ADR and their association with interval colorectal cancer and death.20-23 Gastroenterology professional societies, including the American College of Gastroenterology and the American Society for Gastrointestinal Endoscopy, have recommended and endorsed measurement and reporting of colonoscopy metrics.24 There is general agreement among endoscopists that colonoscopy quality is an important aspect of performing the procedure.
The lack of formal performance improvement programs is a key finding of this survey. Recent studies have shown that improvements in quality metrics, such as the ADR, by individual endoscopists result in reductions in interval colorectal cancer and death.25 Kahi and colleagues previously showed that providing a quarterly report card improves colonoscopy quality.26 Keswani and colleagues studied a combination of a report card and implementation of standards of practice with resultant improvement in colonoscopy quality.27 Most recently, in a large prospective cohort study of individuals who underwent a screening colonoscopy, 294 of the screening endoscopists received annual feedback and quality benchmark indicators to improve colonoscopy performance.25 The majority of the endoscopists (74.5%) increased their annual ADR category over the study period. Moreover, patients examined by endoscopists who reached or maintained the highest ADR quintile (> 24.6%) had significantly lower risk of interval CRC and death. The lack of formal performance improvement programs across the VHA is concerning but reveals a significant opportunity to improve veteran health outcomes on a large scale.
This study’s findings also highlight the intense resources necessary to measure and report colonoscopy quality. The ability to measure and report quality metrics requires having adequate documentation and data to obtain quality metrics. Administrative databases from electronic health records offer some potential for routine monitoring of quality metrics.28 However, most administrative databases, including the VA Corporate Data Warehouse (CDW), contain administrative billing codes (ICD and CPT) linked to limited patient data, including demographics and structured medical record data. The actual data required for quality reporting of important metrics (bowel preparation quality, cecal intubation rates, and ADRs) are usually found in clinical text notes or endoscopic note documentation and not available as structured data. Due to this issue, the majority of VA sites (79.2%) are using manual chart review to collect quality metric data, resulting in widely variable estimates on time burden. A minority of sites in this study (39.6%) reported using automated endoscopic software reporting capability that can help with the time burden. However, even in the VA, an integrated health system, a wide variety of software brands, documentation practices, and photo documentation was found.
Future endoscopy budget and purchase decisions for the individual VA sites should take into account how new technology and software can more easily facilitate accurate quality reporting. A specific policy recommendation would be for the VA to consider a uniform endoscopic note writer for procedure notes. Pathology data, which is necessary for the calculation of ADR, also should be available as structured data in the CDW to more easily measure colonoscopy quality. Continuous measurement and reporting of quality also requires ongoing information technology infrastructure and quality control of the measurement process.
Limitations
This survey was a cross-section of VA sites’ points of contact regarding colonoscopy quality assurance programs, so the results are descriptive in nature. However, the instrument was carefully developed, using both subject matter and survey method expertise. The questionnaire also was refined through pretesting prior to data collection. The initial contact list was found to have errors, and the list had to be updated after launching the survey. Updated information for most of the contacts was available.
Another limitation was the inability to survey nongastroenterologist-run endoscopy centers, because many centers use surgeons or other nongastroenterology providers. The authors speculate that quality monitoring may be less likely to be present at these facilities as they may not be aware of the gastroenterology professional society recommendations. The authors did not require or insist that all questions be answered, so some data were missing from sites. However, 93.7% of respondents completed the entire survey.
Conclusion
The authors have described the status of colonoscopy quality assurance programs across the VA health care system. Many sites are making robust efforts to measure and report quality especially of process measures. However, there are significant time and manual workforce efforts required, and this work is likely associated with the variability in programs. Importantly, ADR, which is the quality metric that has been most strongly associated with risk of colon cancer mortality, is not being measured by 38% of sites.
These results reinforce a critical need for a centralized, automated quality reporting infrastructure to standardize colonoscopy quality reporting, reduce workload, and ensure veterans receive high-quality colonoscopy.
Acknowledgments
The authors acknowledge the support and feedback of the National Gastroenterology Program Field Advisory Committee for survey development and testing. The authors coordinated the survey through the Salt Lake City Specialty Care Center of Innovation in partnership with the National Gastroenterology Program Office and the Quality Enhancement Research Initiative: Quality Enhancement Research Initiative, Measurement Science Program, QUE15-283. The work also was partially supported by the National Center for Advancing Translational Sciences of the National Institutes of Health Award UL1TR001067 and Merit Review Award 1 I01 HX001574-01A1 from the United States Department of Veterans Affairs Health Services Research & Development Service of the VA Office of Research and Development.
1. Brenner H, Stock C, Hoffmeister M. Effect of screening sigmoidoscopy and screening colonoscopy on colorectal cancer incidence and mortality: systematic review and meta-analysis of randomised controlled trials and observational studies. BMJ. 2014;348:g2467.
2. Meester RGS, Doubeni CA, Lansdorp-Vogelaar I, et al. Colorectal cancer deaths attributable to nonuse of screening in the United States. Ann Epidemiol. 2015;25(3):208-213.e1.
3. Corley DA, Jensen CD, Marks AR, et al. Adenoma detection rate and risk of colorectal cancer and death. N Engl J Med. 2014;370(26):1298-1306.
4. Meester RGS, Doubeni CA, Lansdorp-Vogelaar I, et al. Variation in adenoma detection rate and the lifetime benefits and cost of colorectal cancer screening: a microsimulation model. JAMA. 2015;313(23):2349-2358.
5. Boroff ES, Gurudu SR, Hentz JG, Leighton JA, Ramirez FC. Polyp and adenoma detection rates in the proximal and distal colon. Am J Gastroenterol. 2013;108(6):993-999.
6. Center for Medicare and Medicaid Services. Quality measures. https://www.cms.gov/Medicare/Quality-Initiatives-Patient-Assessment-Instruments/Qual ityMeasures/index.html. Updated December 19, 2017. Accessed January 17, 2018.
7. Robertson DJ, Lieberman DA, Winawer SJ, et al. Colorectal cancers soon after colonoscopy: a pooled multicohort analysis. Gut. 2014;63(6):949-956.
8. Fayad NF, Kahi CJ. Colonoscopy quality assessment. Gastrointest Endosc Clin N Am. 2015;25(2):373-386.
9. de Jonge V, Sint Nicolaas J, Cahen DL, et al; SCoPE Consortium. Quality evaluation of colonoscopy reporting and colonoscopy performance in daily clinical practice. Gastrointest Endosc. 2012;75(1):98-106.
10. Johnson DA. Quality benchmarking for colonoscopy: how do we pick products from the shelf? Gastrointest Endosc. 2012;75(1):107-109.
11. Anderson JC, Butterly LF. Colonoscopy: quality indicators. Clin Transl Gastroenterol. 2015;6(2):e77.
12. Kaminski MF, Regula J, Kraszewska E, et al. Quality indicators for colonoscopy and the risk of interval cancer. N Engl J Med. 2010;362(19):1795-1803.
13. U.S. Department of Veterans Affairs, Veterans Health Administration. Colorectal cancer screening. VHA Directive 1015. Published December 30, 2014.
14. U.S. Department of Veterans Affairs, VA Office of the Inspector General, Office of Healthcare Inspections. Healthcare inspection: alleged access delays and surgery service concerns, VA Roseburg Healthcare System, Roseburg, Oregon. Report No.15-00506-535. https://www.va.gov/oig /pubs/VAOIG-15-00506-535.pdf. Published July 11, 2017. Accessed January 9, 2018.
15. Harris PA, Taylor R, Thielke R, Payne J, Gonzalez N, Conde JG. Research electronic data capture (REDCap)—a metadata-driven methodology and workflow process for providing translational research informatics support. J Biomed Inform. 2009;42(2):377-381.
16. The American Association for Public Opinion Research. Standard Definitions: Final Dispositions of Case Codes and Outcome Rates for Surveys. 9th edition. http://www.aapor.org/AAPOR_Main/media/publications/Standard-Definitions20169theditionfinal.pdf. Revised 2016. Accessed January 9, 2018.
17. Kahi CJ, Imperiale TF, Juliar BE, Rex DK. Effect of screening colonoscopy on colorectal cancer incidence and mortality. Clin Gastroenterol Hepatol. 2009;7(7):770-775.
18. Manser CN, Bachmann LM, Brunner J, Hunold F, Bauerfeind P, Marbet UA. Colonoscopy screening markedly reduces the occurrence of colon carcinomas and carcinoma-related death: a closed cohort study. Gastrointest Endosc. 2012;76(1):110-117.
19. Nishihara R, Wu K, Lochhead P, et al. Long-term colorectal-cancer incidence and mortality after lower endoscopy. N Engl J Med. 2013;369(12):1095-1105.
20. Harewood GC, Sharma VK, de Garmo P. Impact of colonoscopy preparation quality on detection of suspected colonic neoplasia. Gastrointest Endosc. 2003;58(1):76-79.
21. Hillyer GC, Lebwohl B, Rosenberg RM, et al. Assessing bowel preparation quality using the mean number of adenomas per colonoscopy. Therap Adv Gastroenterol. 2014;7(6):238-246.
22. Clark BT, Rustagi T, Laine L. What level of bowel prep quality requires early repeat colonoscopy: systematic review and meta-analysis of the impact of preparation quality on adenoma detection rate. Am J Gastroenterol. 2014;109(11):1714-1723; quiz 1724.
23. Johnson DA, Barkun AN, Cohen LB, et al; US Multi-Society Task Force on Colorectal Cancer. Optimizing adequacy of bowel cleansing for colonoscopy: recommendations from the US multi-society task force on colorectal cancer. Gastroenterology. 2014;147(4):903-924.
24. Rex DK, Petrini JL, Baron TH, et al; ASGE/ACG Taskforce on Quality in Endoscopy. Quality indicators for colonoscopy. Am J Gastroenterol. 2006;101(4):873-885.
25. Kaminski MF, Wieszczy P, Rupinski M, et al. Increased rate of adenoma detection associates with reduced risk of colorectal cancer and death. Gastroenterology. 2017;153(1):98-105.
26. Kahi CJ, Ballard D, Shah AS, Mears R, Johnson CS. Impact of a quarterly report card on colonoscopy quality measures. Gastrointest. Endosc. 2013;77(6):925-931.
27. Keswani RN, Yadlapati R, Gleason KM, et al. Physician report cards and implementing standards of practice are both significantly associated with improved screening colonoscopy quality. Am J Gastroenterol. 2015;110(8):1134-1139.
28. Logan JR, Lieberman DA. The use of databases and registries to enhance colonoscopy quality. Gastrointest Endosc Clin N Am. 2010;20(4):717-734.
Colorectal cancer (CRC) is an important concern for the VA, and colonoscopy is one primary screening, surveillance, and diagnostic modality used. The observed reductions in CRC incidence and mortality over the past decade largely have been attributed to the widespread use of CRC screening options.1,2 Colonoscopy quality is critical to CRC prevention in veterans. However, endoscopy skills to detect and remove colorectal polyps using colonoscopy vary in practice.3-5
Quality benchmarks, linked to patient outcomes, have been established by specialty societies and proposed by the Centers for Medicare and Medicaid Services as reportable quality metrics.6 Colonoscopy quality metrics have been shown to be associated with patient outcomes, such as the risk of developing CRC after colonoscopy. The adenoma detection rate (ADR), defined as the proportion of average-risk screening colonoscopies in which 1 or more adenomas are detected, has the strongest association to interval or “missed” CRC after screening colonoscopy and has been linked to a risk for fatal CRC despite colonoscopy.3
In a landmark study of 314,872 examinations performed by 136 gastroenterologists, the ADR ranged from 7.4% to 52.5%.3 Among patients with ADRs in the highest quintile compared with patients in the lowest, the adjusted hazard ratios (HRs) for any interval cancer was 0.52 (95% confidence interval [CI], 0.39-0.69) and for fatal interval cancers was 0.38 (95% CI, 0.22-0.65).3 Another pooled analysis from 8 surveillance studies that followed more than 800 participants with adenoma(s) after a baseline colonoscopy showed 52% of incident cancers as probable missed lesions, 19% as possibly related to incomplete resection of an earlier, noninvasive lesion, and only 24% as probable new lesions.7 These interval cancers highlight the current imperfections of colonoscopy and the focus on measurement and reporting of quality indicators for colonoscopy.8-12
According to VHA Directive 1015, in December 2014, colonoscopy quality should be monitored as part of an ongoing quality assurance program.13 A recent report from the VA Office of the Inspector General (OIG) highlighted colonoscopy-quality deficiencies.14 The OIG report strongly recommended that the “Acting Under Secretary for Health require standardized documentation of quality indicators based on professional society guidelines and published literature.”14However, no currently standardized and readily available VHA resource measures, reports, and ensures colonoscopy quality.
The authors hypothesized that colonoscopy quality assurance programs vary widely across VHA sites. The objective of this survey was to assess the measurement and reporting practices for colonoscopy quality and identify both strengths and areas for improvement to facilitate implementation of quality assurance programs across the VA health care system.
Methods
The authors performed an online survey of VA sites to assess current colonoscopy quality assurance practices. The institutional review boards (IRBs) at the University of Utah and VA Salt Lake City Health Care System and University of California, San Francisco and San Francisco VA Health Care System classified the study as a quality improvement project that did not qualify for human subjects’ research requiring IRB review.
The authors iteratively developed and refined the questionnaire with a survey methodologist and 2 clinical domain experts. The National Program Director for Gastroenterology, and the National Gastroenterology Field Advisory Committee reviewed the survey content and pretested the survey instrument prior to final data collection. The National Program Office for Gastroenterology provided an e-mail list of all known VA gastroenterology section chiefs. The authors administered the final survey via e-mail, using the Research Electronic Data Capture (REDCap; Vanderbilt University Medical Center) platform beginning January 9, 2017.15
A follow-up reminder e-mail was sent to nonresponders after 2 weeks. After this second invitation, sites were contacted by telephone to verify that the correct contact information had been captured. Subsequently, 50 contacts were updated if e-mails bounced back or the correct contact was obtained. Points of contact received a total of 3 reminder e-mails until the final closeout of the survey on March 28, 2017; 65 of 89 (73%) of the original contacts completed the survey vs 31 of 50 (62%) of the updated contacts.
Analysis
Descriptive statistics of the responses were calculated to determine the overall proportion of VA sites measuring colonoscopy quality metrics and identification of areas in need of quality improvement. The response rate for the survey was defined as the total number of responses obtained as a proportion of the total number of points of contact. This corresponds to the American Association of Public Opinion Research’s RR1, or minimum response rate, formula.16 All categoric responses are presented as proportions. Statistical analyses were performed using STATA SE12.0 (College Station, TX).
Results
Of the 139 points of contact invited, 96 completed the survey (response rate of 69.0%), representing 93 VA facilities (of 141 possible facilities) in 44 different states. Three sites had 2 responses. Sites used various and often a combination of methods to measure quality (Table 1).
A majority of sites’ (63.5%) quality reports represented individual provider data, whereas fewer provided quality reports for physician groups (22.9%) or for the entire facility (40.6%). Provider quality information was de-identified in 43.8% of reporting sites’ quality reports and identifiable in 37.5% of reporting sites’ quality reports. A majority of sites (74.0%) reported that the local gastroenterology section chief or quality manager has access to the quality reports. Fewer sites reported providing data to individual endoscopists (44.8% for personal and peer data and 32.3% for personal data only). One site (1%) responded that quality reports were available for public access. Survey respondents also were asked to provide the estimated time (hours required per month) to collect the data for quality metrics. Of 75 respondents providing data for this question, 28 (29.2%) and 17 (17.7%), estimated between 1 to 5 and 6 to 10 hours per month, respectively. Ten sites estimated spending between 11 to 20 hours, and 7 sites estimated spending more than 20 hours per month collecting quality metrics. A total of 13 respondents (13.5%) stated uncertainty about the time burden.
As shown in the Figure, numerous quality metrics were collected across sites with more than 80% of sites collecting information on bowel preparation quality (88.5%), cecal intubation rate (87.5%), and complications (83.3%). A majority of sites also reported collecting data on appropriateness of surveillance intervals (62.5%), colonoscopy withdrawal times (62.5%), and ADRs (61.5%). Seven sites (7.3%) did not collect quality metrics.
Information also was collected on colonoscopy procedure documentation to inform future efforts at standardization. A small majority (53.1%) of sites reported using endoscopic software to generate colonoscopy procedure documentation. Within these sites, 6 different types of endoscopic note writing software were used to generate procedure notes (Table 2).
Most sites (85.4%) were aware of VHA Directive 1015 recommendations for colonoscopy quality assurance programs. A significant majority (89.5%) of respondents also indicated interest in a centralized automatic reporting system to measure and report colonoscopy quality in some form, either with aggregate data, provider data, or both (Table 3).
Discussion
This survey on colonoscopy quality assurance programs is the first assessment of the VHA’s efforts to measure and report colonoscopy quality indicators. The findings indicated that the majority of VA sites are measuring and reporting at least some measures of colonoscopy quality. However, the programs are significantly variable in terms of methods used to collect quality metrics, specific quality measures obtained, and how quality is reported.
The authors’ work is novel in that this is the first report of the status of colonoscopy quality assurance programs in a large U.S. health care system. The VA health care system is the largest integrated health system in the U.S., serving more than 9 million veterans annually. This survey’s high response rate further strengthens the findings. Specifically, the survey found that VA sites are making a strong concerted effort to measure and report colonoscopy quality. However, there is significant variability in documentation, measurement, and reporting practices. Moreover, the majority of VA sites do not have formal performance improvement plans in place for endoscopists who do not meet thresholds for colonoscopy quality.
Screening colonoscopy for CRC offers known mortality benefits to patients.1,17-19 Significant prior work has described and validated the importance of colonoscopy quality metrics, including bowel preparation quality, cecal intubation rate, and ADR and their association with interval colorectal cancer and death.20-23 Gastroenterology professional societies, including the American College of Gastroenterology and the American Society for Gastrointestinal Endoscopy, have recommended and endorsed measurement and reporting of colonoscopy metrics.24 There is general agreement among endoscopists that colonoscopy quality is an important aspect of performing the procedure.
The lack of formal performance improvement programs is a key finding of this survey. Recent studies have shown that improvements in quality metrics, such as the ADR, by individual endoscopists result in reductions in interval colorectal cancer and death.25 Kahi and colleagues previously showed that providing a quarterly report card improves colonoscopy quality.26 Keswani and colleagues studied a combination of a report card and implementation of standards of practice with resultant improvement in colonoscopy quality.27 Most recently, in a large prospective cohort study of individuals who underwent a screening colonoscopy, 294 of the screening endoscopists received annual feedback and quality benchmark indicators to improve colonoscopy performance.25 The majority of the endoscopists (74.5%) increased their annual ADR category over the study period. Moreover, patients examined by endoscopists who reached or maintained the highest ADR quintile (> 24.6%) had significantly lower risk of interval CRC and death. The lack of formal performance improvement programs across the VHA is concerning but reveals a significant opportunity to improve veteran health outcomes on a large scale.
This study’s findings also highlight the intense resources necessary to measure and report colonoscopy quality. The ability to measure and report quality metrics requires having adequate documentation and data to obtain quality metrics. Administrative databases from electronic health records offer some potential for routine monitoring of quality metrics.28 However, most administrative databases, including the VA Corporate Data Warehouse (CDW), contain administrative billing codes (ICD and CPT) linked to limited patient data, including demographics and structured medical record data. The actual data required for quality reporting of important metrics (bowel preparation quality, cecal intubation rates, and ADRs) are usually found in clinical text notes or endoscopic note documentation and not available as structured data. Due to this issue, the majority of VA sites (79.2%) are using manual chart review to collect quality metric data, resulting in widely variable estimates on time burden. A minority of sites in this study (39.6%) reported using automated endoscopic software reporting capability that can help with the time burden. However, even in the VA, an integrated health system, a wide variety of software brands, documentation practices, and photo documentation was found.
Future endoscopy budget and purchase decisions for the individual VA sites should take into account how new technology and software can more easily facilitate accurate quality reporting. A specific policy recommendation would be for the VA to consider a uniform endoscopic note writer for procedure notes. Pathology data, which is necessary for the calculation of ADR, also should be available as structured data in the CDW to more easily measure colonoscopy quality. Continuous measurement and reporting of quality also requires ongoing information technology infrastructure and quality control of the measurement process.
Limitations
This survey was a cross-section of VA sites’ points of contact regarding colonoscopy quality assurance programs, so the results are descriptive in nature. However, the instrument was carefully developed, using both subject matter and survey method expertise. The questionnaire also was refined through pretesting prior to data collection. The initial contact list was found to have errors, and the list had to be updated after launching the survey. Updated information for most of the contacts was available.
Another limitation was the inability to survey nongastroenterologist-run endoscopy centers, because many centers use surgeons or other nongastroenterology providers. The authors speculate that quality monitoring may be less likely to be present at these facilities as they may not be aware of the gastroenterology professional society recommendations. The authors did not require or insist that all questions be answered, so some data were missing from sites. However, 93.7% of respondents completed the entire survey.
Conclusion
The authors have described the status of colonoscopy quality assurance programs across the VA health care system. Many sites are making robust efforts to measure and report quality especially of process measures. However, there are significant time and manual workforce efforts required, and this work is likely associated with the variability in programs. Importantly, ADR, which is the quality metric that has been most strongly associated with risk of colon cancer mortality, is not being measured by 38% of sites.
These results reinforce a critical need for a centralized, automated quality reporting infrastructure to standardize colonoscopy quality reporting, reduce workload, and ensure veterans receive high-quality colonoscopy.
Acknowledgments
The authors acknowledge the support and feedback of the National Gastroenterology Program Field Advisory Committee for survey development and testing. The authors coordinated the survey through the Salt Lake City Specialty Care Center of Innovation in partnership with the National Gastroenterology Program Office and the Quality Enhancement Research Initiative: Quality Enhancement Research Initiative, Measurement Science Program, QUE15-283. The work also was partially supported by the National Center for Advancing Translational Sciences of the National Institutes of Health Award UL1TR001067 and Merit Review Award 1 I01 HX001574-01A1 from the United States Department of Veterans Affairs Health Services Research & Development Service of the VA Office of Research and Development.
1. Brenner H, Stock C, Hoffmeister M. Effect of screening sigmoidoscopy and screening colonoscopy on colorectal cancer incidence and mortality: systematic review and meta-analysis of randomised controlled trials and observational studies. BMJ. 2014;348:g2467.
2. Meester RGS, Doubeni CA, Lansdorp-Vogelaar I, et al. Colorectal cancer deaths attributable to nonuse of screening in the United States. Ann Epidemiol. 2015;25(3):208-213.e1.
3. Corley DA, Jensen CD, Marks AR, et al. Adenoma detection rate and risk of colorectal cancer and death. N Engl J Med. 2014;370(26):1298-1306.
4. Meester RGS, Doubeni CA, Lansdorp-Vogelaar I, et al. Variation in adenoma detection rate and the lifetime benefits and cost of colorectal cancer screening: a microsimulation model. JAMA. 2015;313(23):2349-2358.
5. Boroff ES, Gurudu SR, Hentz JG, Leighton JA, Ramirez FC. Polyp and adenoma detection rates in the proximal and distal colon. Am J Gastroenterol. 2013;108(6):993-999.
6. Center for Medicare and Medicaid Services. Quality measures. https://www.cms.gov/Medicare/Quality-Initiatives-Patient-Assessment-Instruments/Qual ityMeasures/index.html. Updated December 19, 2017. Accessed January 17, 2018.
7. Robertson DJ, Lieberman DA, Winawer SJ, et al. Colorectal cancers soon after colonoscopy: a pooled multicohort analysis. Gut. 2014;63(6):949-956.
8. Fayad NF, Kahi CJ. Colonoscopy quality assessment. Gastrointest Endosc Clin N Am. 2015;25(2):373-386.
9. de Jonge V, Sint Nicolaas J, Cahen DL, et al; SCoPE Consortium. Quality evaluation of colonoscopy reporting and colonoscopy performance in daily clinical practice. Gastrointest Endosc. 2012;75(1):98-106.
10. Johnson DA. Quality benchmarking for colonoscopy: how do we pick products from the shelf? Gastrointest Endosc. 2012;75(1):107-109.
11. Anderson JC, Butterly LF. Colonoscopy: quality indicators. Clin Transl Gastroenterol. 2015;6(2):e77.
12. Kaminski MF, Regula J, Kraszewska E, et al. Quality indicators for colonoscopy and the risk of interval cancer. N Engl J Med. 2010;362(19):1795-1803.
13. U.S. Department of Veterans Affairs, Veterans Health Administration. Colorectal cancer screening. VHA Directive 1015. Published December 30, 2014.
14. U.S. Department of Veterans Affairs, VA Office of the Inspector General, Office of Healthcare Inspections. Healthcare inspection: alleged access delays and surgery service concerns, VA Roseburg Healthcare System, Roseburg, Oregon. Report No.15-00506-535. https://www.va.gov/oig /pubs/VAOIG-15-00506-535.pdf. Published July 11, 2017. Accessed January 9, 2018.
15. Harris PA, Taylor R, Thielke R, Payne J, Gonzalez N, Conde JG. Research electronic data capture (REDCap)—a metadata-driven methodology and workflow process for providing translational research informatics support. J Biomed Inform. 2009;42(2):377-381.
16. The American Association for Public Opinion Research. Standard Definitions: Final Dispositions of Case Codes and Outcome Rates for Surveys. 9th edition. http://www.aapor.org/AAPOR_Main/media/publications/Standard-Definitions20169theditionfinal.pdf. Revised 2016. Accessed January 9, 2018.
17. Kahi CJ, Imperiale TF, Juliar BE, Rex DK. Effect of screening colonoscopy on colorectal cancer incidence and mortality. Clin Gastroenterol Hepatol. 2009;7(7):770-775.
18. Manser CN, Bachmann LM, Brunner J, Hunold F, Bauerfeind P, Marbet UA. Colonoscopy screening markedly reduces the occurrence of colon carcinomas and carcinoma-related death: a closed cohort study. Gastrointest Endosc. 2012;76(1):110-117.
19. Nishihara R, Wu K, Lochhead P, et al. Long-term colorectal-cancer incidence and mortality after lower endoscopy. N Engl J Med. 2013;369(12):1095-1105.
20. Harewood GC, Sharma VK, de Garmo P. Impact of colonoscopy preparation quality on detection of suspected colonic neoplasia. Gastrointest Endosc. 2003;58(1):76-79.
21. Hillyer GC, Lebwohl B, Rosenberg RM, et al. Assessing bowel preparation quality using the mean number of adenomas per colonoscopy. Therap Adv Gastroenterol. 2014;7(6):238-246.
22. Clark BT, Rustagi T, Laine L. What level of bowel prep quality requires early repeat colonoscopy: systematic review and meta-analysis of the impact of preparation quality on adenoma detection rate. Am J Gastroenterol. 2014;109(11):1714-1723; quiz 1724.
23. Johnson DA, Barkun AN, Cohen LB, et al; US Multi-Society Task Force on Colorectal Cancer. Optimizing adequacy of bowel cleansing for colonoscopy: recommendations from the US multi-society task force on colorectal cancer. Gastroenterology. 2014;147(4):903-924.
24. Rex DK, Petrini JL, Baron TH, et al; ASGE/ACG Taskforce on Quality in Endoscopy. Quality indicators for colonoscopy. Am J Gastroenterol. 2006;101(4):873-885.
25. Kaminski MF, Wieszczy P, Rupinski M, et al. Increased rate of adenoma detection associates with reduced risk of colorectal cancer and death. Gastroenterology. 2017;153(1):98-105.
26. Kahi CJ, Ballard D, Shah AS, Mears R, Johnson CS. Impact of a quarterly report card on colonoscopy quality measures. Gastrointest. Endosc. 2013;77(6):925-931.
27. Keswani RN, Yadlapati R, Gleason KM, et al. Physician report cards and implementing standards of practice are both significantly associated with improved screening colonoscopy quality. Am J Gastroenterol. 2015;110(8):1134-1139.
28. Logan JR, Lieberman DA. The use of databases and registries to enhance colonoscopy quality. Gastrointest Endosc Clin N Am. 2010;20(4):717-734.

Managing Glenoid Bone Deficiency—The Augment Experience in Anatomic and Reverse Shoulder Arthroplasty
ABSTRACT
Glenoid bone deficiency in the setting of shoulder replacement surgery is far more common than originally reported. The frequency and severity of the glenoid defects are noted to be more common and severe with the advent of computer-assisted surgery. The results of an anatomic total shoulder arthroplasty (aTSA) with glenoid deficiency have been reported to be inferior to aTSA patients without a glenoid deficiency. Options for treating the glenoid deficiency include eccentric reaming, bone grafting, and the use of augmented glenoid components. The purpose of this article is to present the indications, technique, and results of augmented glenoids for both aTSA and reverse TSA (RTSA).
Augments for both aTSA and RTSA are viable options. They preserve subchondral bone at the same time as optimizing the joint line without the need for bone grafts. Complications, revisions and results are as good as compared to shoulder arthroplasties without glenoid wear.
Continue to: Glenoid bone deficiency...
Glenoid bone deficiency in arthritic or cuff-deficient shoulder has been reported in up to 50% of shoulder defect cases.1,2 The type and severity of glenoid deformities vary depending on the underlying pathology and time of manifestation. Osteoarthritis with bone loss typically results in posterior or posterior inferior glenoid wear and is commonly classified as Walch types B1 or B2 (biconcave). In cases of severe erosion, B3 classification has been proposed; in this classification, bone loss becomes extremely severe, progressing to resemble a type C glenoid. Unlike primary osteoarthritis, inflammatory arthropathy more commonly causes central loss of glenoid bone (Walch A2). With the rotator cuff insufficiency, superior migration of the humeral head occurs. As these conditions progress, cuff tear arthropathy (CTA) changes result in superior or posterior-superior bone loss.1 Anterior bone loss (type D) will be rarely encountered due to recurrent anterior instability.3
Classically, with anatomic total shoulder arthroplasty (aTSA), the surgeon considers several options for managing glenoid deficiencies. The most commonly employed technique involves eccentrically reaming the glenoid and correcting the deformity. This procedure is relatively easy but features significant drawbacks, such as sacrificing the subchondral bone, medializing the glenohumeral joint line, and secondarily shrinking the glenoid surface area. Other options include structural bone grafting behind the glenoid component. Most anatomic prosthetic glenoids prove to be unsuitable for fixation of structural bone graft. Therefore, the graft is first internally fixed, followed by placement of the glenoid component. Cement, which is commonly used for glenoid fixation, may potentially inhibit bone-graft healing. Reports using this technique documented high radiographic failure rate of up to 40% at midterm follow-up.4 Although leaving the glenoid component retroverted may be considered, surgeons should develop awareness of the possibility of peg penetration of the anterior glenoid neck. Additionally, retroversion in excess of 5°may increase the risk of recurrent posterior subluxation, resulting in early glenoid loosening.5-7 Results of aTSA under significant glenoid deficiency are inferior to those of aTSA patients without glenoid deficiency.8 Such findings have been extremely inferior in patients with significant glenoid wear, prompting numerous surgeons to abandon aTSA in this population in favor of reverse TSA (RTSA) due to improved bony fixation.
In 2010, augmented anatomic glenoids were first introduced as a wedge (Exactech) and as a step shortly thereafter (DePuy Synthes; Figures 1A-1C). More recently, hemi-wedges have been introduced (Wright Medical Group). Augments have gained popularity due to improved range of motion vs reverse shoulder arthroplasty (RSA). However, debates remain regarding the use of posteriorly augmented components in the setting of posterior glenoid bone loss.8 Augments serve as another viable option for handling glenoid bone deficiency in aTSA.

Glenoid bone loss in RTSA presents similar options to aTSA. However, screw fixation of the glenoid component offers several distinct advantages. Baseplate fixation can readily be used with bone grafting and with a highly anticipated success rate. With multiple screw options, 100% support of the baseplate is not mandatory. Although bony increase offset RSAs (BIO-RSAs) have shown success, augmentation with allograft or autograft increases operative time and relies on osseous integration for long-term implant success.9 Metal augmented baseplates were first introduced in 2011 (Exactech) as a means of managing glenoid bone loss without structural grafting. Although initial results have been encouraging, additional studies are needed to assess the longevity of these implants (Figures 1A-1C).
aTSA AUGMENTS
aTSA augments were introduced as a means of correcting acquired glenoid bone deficiency, restoring native glenoid version, correcting humeral subluxation, and preserving the native subchondral bone. Compared with glenoid bone grafting, augmented glenoid components decrease operative time, allow for a technically easier operation, and require no bone healing for clinical success. Early and midterm results are encouraging, showing similar findings comparable to those of aTSA in non-glenoid deficient shoulders.10-12
Continue to: INDICATIONS
INDICATIONS
Indications and limitations for augmented aTSA glenoids remain incompletely defined. The most common indication for an augmented aTSA is osteoarthritis with a B2 glenoid. We recommend augments in the occurrence of any indication of significant eccentric glenoid wear. With the expertise of surgeons, deformities of up to 20° to 25° of deformity can be readily handled with good predictability. More severe deformities can be managed with augmented aTSA components, but early failure rates may be high. The most severe acquired deformities remain best managed with RTSA. Currently, we prefer RTSA when glenoid bone loss exceeds 25°. With the widespread availability of computed tomography (CT) scans with 3-dimensional (3-D) reconstruction, glenoid bone defects are increasingly recognized. When correcting deformity, surgeons should strive to limit residual retroversion to a maximum of 5°.13 Preoperative planning software and computer-assisted surgery (ExactechGPS) may allow surgeons to better define the limits of augmented glenoid fixation prior to the date of surgery. We routinely utilize computer-guided glenoid preparation to control glenoid version to within 5° of neutral position.
The differences between B3 and a true type C glenoid must be recognized. Although B3 glenoids may still be a candidate for an augmented anatomic glenoid component, type C glenoids are not. Developmental abnormalities of type C glenoid occur simultaneously with humeral deformities, including medialized posterior rotator cuff musculature. Correction of the joint line to neutral version may not replicate the non-diseased state of a dysplastic type shoulder. Davis and colleagues14 have proposed treating these patients by leaving both the humerus and glenoid in their native version without correction.
TECHNIQUE
The implant that we have the most experience with is an 8° full-wedge augmented glenoid component. Such an implant is typically utilized for B2 glenoids. We recommend that a high-quality CT scan be performed for preoperative planning. As a general rule, the starting point often lies close to the ridge of B2 glenoid and more anterior than the apparent glenoid center, which is viewed intraoperatively due to asymmetric posterior wear. Full-wedge component is utilized to ream the ridge separating the neo and paleoglenoids to create a flat surface. This condition is best achieved by drilling a pilot hole at the planned glenoid central peg position to prevent the reamer from sliding anteriorly during reaming. Glenoid preparation begins with the smallest reamer until the ridge has been flattened, and the reamer makes full contact with the glenoid. The reamer diameter is then increased based on glenoid size. Slightly downsizing the glenoid implant will require less reaming to achieve full backside support. Once the glenoid is properly reamed, the central and peripheral peg holes are drilled using the appropriate guides. Holes are then dried, and all-polyethylene or composite glenoid component (either partially or completely cemented) is installed using favored cementing techniques. The advantage of composite glenoid component is that the central cage allows for bone ingrowth and may potentially improve long-term implant survival. Press fit of the central cage requires no waiting time for glenoid cement hardening before proceeding to the humerus. When placing an augmented component, adequate glenoid exposure is imperative to allow in-line placement and appropriate seating of the component without impingement on adjacent retractors.
When using the step-augmented glenoid, the paleoglenoid is prepared in a similar fashion to a standard aTSA. Once the paleoglenoid has been reamed to a neutral position, a protector plate is placed onto the paleoglenoid. and a step-cut saw is used to prepare the posterior stepped bone cut. Peripheral pegs are then drilled, and the component is installed in routine fashion. When using hemi-wedge augments, the paleoglenoid is again prepared in a similar fashion as a standard glenoid component over a cannulated guidewire. The neoglenoid is subsequently prepared using a specialized angled reamer with a positive stop to prevent over-reaming. These glenoid implants improve rotational force neutralization given the absence of flat back against the glenoid. All 3 designs preserve bone when compared with eccentric reaming alone,15 with the half-augmented wedge preserving the most bone.
Table 1. Results of Various Augmented Glenoid Components in Anatomic Total Shoulder
Arthroplasty
| Augment | American Shoulder and Elbow Surgeons Score | Constant Score | Active Forward Flexion | Active External Rotation | ||||||||||||||||
8° cage (N = 21) |
|
|
|
|
| |||||||||||||||
All-polyethylene 8° (N = 45) |
|
|
|
|
| |||||||||||||||
All-polyethylene 16° (N = 7) |
|
|
|
|
|
RESULTS
In our institution, we first used all-polyethylene posteriorly augmented glenoid components in 2010. Between 2010 and 2015, 45 patients received an 8° all-polyethylene posterior augment, and 7 patients received a 16° augment. In 2015, we transitioned to the composite caged posterior augment. All patients in our database who received an augmented glenoid component experienced improvement in active forward elevation, external rotation, American Shoulder and Elbow Surgeons (ASES), and Constant scores (Table 1). Minimum follow-up was 1 year for patients receiving both an 8° cage (mean, 1.48 years) and an 8° all-polyethylene augment (mean, 3.18 years). Figures 2A-2C show a patient with significant posterior glenoid wear and humeral head subluxation treated with an 8° wedge composite posterior augment glenoid 3 years postoperative.

Continue to: COMPLICATIONS
COMPLICATIONS
Two complications developed in the group undergoing composite cage augment. One patient experienced glenoid loosening after a motor vehicle accident. Another patient sustained significant intraoperative tuberosity avulsion during implantation of the humeral component, requiring a change of implant and tuberosity fixation. Although no complications were noted in the 8° all-polyethylene group, 3 patients in the 16° augment group sustained complications. One of these patients suffered a cardiac event that was unrelated to the implant. Two complications in this group were both related to loosening of the glenoid component, requiring subsequent revision.
DISCUSSION
The first report on augmented aTSA was published in 2008, and it involved a 5° augmented, anatomic glenoid.12 One study was based on a small series of augments; the poor results led the reporting surgeons to subsequently abandon the implant.12 This early design produced a correction on the articular side of the implant rather than the pathologic bony side. By performing such correction, the component pegs remained anteriorly oriented, placing the component at risk of perforation through the anterior glenoid neck. All current augment designs feature pegs that are oriented down the glenoid vault, with corrections occurring on the bony surface. This condition requires 2 different axes for reaming the glenoid and drilling the pegs. This approach allows the pegs to be directed down the glenoid neck, and is a far superior solution to neutralizing shear forces when compared with the implants used in the 1990s.
Early to midterm results of modern aTSA augments have been extremely encouraging with low revision rates. The main concern of recurrent posterior subluxation has been rarely reported. The concerns over glenoid loosening due to high shear forces, similarly, have not been described to date. However, surgeons should remain cautious, as longer-term follow-up remains unavailable.
The main advantage of aTSA augments is their capacity to preserve bone compared with eccentric reaming and better long-term stability. Each of the augment designs requires varying amounts of bone removal. Through biomechanics and using finite element analysis, the 3 augment types act differently, with no design demonstrating remarkable biomechanical superiority.6 Favorito and colleagues16 performed a retrospective review of 22 patients who underwent aTSA using an all-polyethylene, posteriorly augmented, and stepped glenoid component for posterior bone loss. At an average follow-up of 36 months, all patients experienced improvements in active forward elevation, external rotation, visual analog scale, Short Form-36 Physical Component Summary, and Western Ontario Osteoarthritis of the Shoulder scores. The authors noted that 2 patients (9%) experienced complications: 1 with an anterior dislocation and the other with recurrent posterior instability requiring revision. Sandow and Schutz17 reported the preliminary results of 10 patients who underwent aTSA using trabecular metal augment with a minimum of 2-year follow-up. All patients received either a 15° or 30° posterior, metal-backed augment for severe glenoid bone loss (Walch grade B2 or C). At a minimum of 2-year follow-up, all patients received correction to within 10° of neutral glenoid version, without any complications nor implant failures.
Regardless of augment design, all current components restore the native glenoid version, improving the length and subsequent tension of rotator cuff musculature. Similarly, re-centering the humeral head decreases the forces on the glenoid and allows for optimal function with decreasing loss of vital subchondral bone.
Continue to: RTSA AUGMENTS
RTSA AUGMENTS
Similar to anatomic augments, metal augments were introduced for use with RTSA in 2011. Unlike anatomic augments, those for RTSA were manufactured with metal. Given the difference in bony wear patterns in patients requiring RTSA, augments were available in a number of configurations. With CTA, wear is most commonly superior. Leaving a superiorly inclined baseplate must be avoided due to risks of notching, loosening, and early failure. However, correcting this tilt will require significant reaming of the inferior glenoid. A superior augment is ideally suited for this bone-loss pattern. If the glenoid is retroverted significantly, difficulty can also arise during glenoid preparation and baseplate placement. Posterior augments may ease this aspect of the procedure. Posterior augments feature the additional benefits of tensioning any remaining posterior rotator cuff, minimizing posterior inferior impingement, and technically easing the operation.18 As we improve our awareness of glenoid orientation using computer navigation, a posterior-superior augmented implant is commonly needed to simultaneously optimize the baseplate position and to minimize reaming (Figure 3). The posterior-superior augmented baseplate has become the most commonly used baseplate augment of choice in 90% of our RTSA cases that require an augment.

INDICATIONS
Augmented RTSA baseplates are indicated when adequate backside contact cannot be achieved with eccentric reaming, thus compromising potential fixation. In our practice, we preferably use augments at <50% contact with the backside of the baseplate. Excessive superior inclination is observed in a CTA setting, commonly indicating the use of superior augments. Similarly, severe primary osteoarthritis may contain elements of posterior bone loss, leading to increased retroversion, which is where we use posterior augments. When patients exhibit combined deformities, or when the surgeon wishes to tension the posterior rotator cuff, a posterior-superior augmented glenoid baseplate is used. For extremely severe defects, we have combined bone grafting and augments. In patients with a highly deficient glenoid but good quality of the remaining bone stock, an augment allows for better contact with less reaming although it is not fully supported when compared with a non-augmented baseplate. Bone grafts can function similarly, but the autograft humeral head is not constantly present in revision situations and requires increased operative time to allow for precision carpentry. Additionally, the success of BIO-RSA requires healing of bone graft on the native glenoid to support the baseplate.19 Jones and colleagues9 compared metal augmented RTSA with BIO-RSA and presented equivalent results.
To minimize reaming and to obtain appropriately inferior inclination, we have discovered preoperative templating and intraoperative, computer-guided glenoid preparation to be extremely valuable (ExactechGPS). These tools allow appropriate assessment of augments and for minimal bone removal when preparing the glenoid.
TECHNIQUE
When using an augment, a fine-cut CT scan is highly recommended to aid in surgery planning. We also find 3-D reconstructions to be helpful. Preoperative planning software also allows surgeons to maximize fixation of implant within the glenoid vault. The starting point for reaming is planned based on CT. Some surgeons using augments perform minimal or no reaming at all, electing to remove the remaining cartilage with a Cobb elevator. Different reaming and drilling axes are used when using augments. In cases of severe glenoid deformity and unavailability of computer assistance, a guide wire with inferior inclination can be installed based on CT scan. Penetration of this wire down the glenoid neck can be palpated and compared with the preoperative plan. We generally prefer at least 24 mm of bone containment for the central cage. Once the surgeon is satisfied with the placement of the wire, the appropriate augment guide is placed, followed by a second guide wire. This second wire acts as the reaming axis. The first wire is removed, and the glenoid is reamed with a cannulated reamer. Once reaming is completed, the original wire is replaced in the same hole and trajectory, and the reaming wire is removed. The first wire is then drilled with a cannulated drill for the central cage. The augmented baseplate is then impacted into place, and screw fixation is performed. Again, intraoperative computer guidance allows for precision screw placement with maximal bone attachment.
Table 2. Results of Reverse Total Shoulder Arthroplasty Augmented Baseplates
| Augment | American Shoulder and Elbow Surgeons Score | Constant Score | Active Forward Flexion | Active External Rotation | ||||||||||||||||
Superior (N = 22) |
|
|
|
|
| |||||||||||||||
Posterior (N = 50) |
|
|
|
|
| |||||||||||||||
Posterosuperior (N = 67) |
|
|
|
|
|
RESULTS
Based on our experience, glenoid augments for RTSA have performed well at short- and mid-term follow-up. From October 2011 to July 2016, 139 patients undergoing RTSA received a posterior, superior, or posterior-superior augmented glenoid baseplate. All groups demonstrated improvements in functional outcome measures, including Constant, ASES, Shoulder Pain and Disability Index, and Simple Shoulder Test scores compared with baseline values (Table 2). The posterior-superior augment group experienced the most significant improvement in active forward flexion and external rotation, whereas the posterior augment group experienced the most significant improvement in ASES and Constant scores. Figures 4A-4C displays the radiographs of a patient with significant glenoid wear treated with a posterior-superior augment RTSA.

Continue to: COMPLICATIONS
COMPLICATIONS
In the superior augment group, 3 patients (13%) sustained 5 complications. One patient sustained 3 separate episodes of instability, eventually requiring revision of prosthesis. In the posterior augment group, 4 patients (8%) sustained complications. Two of the 4 patients presented postoperative humeral fractures related to traumatic events, whereas another patient sustained an intraoperative tuberosity fracture. The last complication in this group involved a postoperative draining wound that was treated with oral antibiotics.
Nine complications developed in the posterior-superior augment group (13%); these complications included aseptic baseplate loosening (5), glenoid fracture (1), humeral fracture (1), acromial stress fracture (1), and cerebrovascular accident (1).
DISCUSSION
As the use of augments in RTSA is relatively new, significantly scarce data exist regarding their outcomes and longevity. A few studies have focused on the short-term outcomes of these augments. Jones and colleagues9 performed a retrospective review of 80 patients who underwent RTSA and required either a structural bone graft or an augmented glenoid baseplate.9 They observed that although all patients showed improvements in pain, range of motion, and functional scores, the structural bone graft group incurred a 14.6% complication rate compared with none observed in the augment group. Additionally, Jones and colleagues9 noted that the augmented baseplate group exhibited a significantly lower rate of scapular notching compared with the bone-graft group (10% vs 18.5%) at similar follow-up intervals. A separate study by Wright and colleagues18 compared posterior vs superior augmented baseplates in RTSA. The posterior augment group demonstrated lower rates of scapular notching (6.3% vs 14.3%) and showed more significant improvements in Constant, ASES, and active forward elevation measures, compared with the superior augment group.
As more manufacturers develop augments for RTSA, and as ExactechGPS uses become more widespread, the use of RTSA baseplate augments will continually grow. Custom implants using massive metal augments are now also being introduced. Although currently too expensive for most cases, as technology drives the cost down, every patient may receive customized augmented implants in the future.
The advantages of augmented baseplate designs include minimized reaming and notching, improved tension of the remaining rotator cuff, and decreased operating room time. The disadvantages include increased cost and lack of mid- or long-term clinical data. The concerns with baseplate loosening with augments in RTSA are much less than those with augments for aTSA due to the outstanding baseplate fixation that can be achieved in RTSA.
Continue to: CONLCLUSION
CONCLUSION
Augments offer an excellent tool for surgeons performing both aTSA and RTSA with glenoid bone loss. Use of augments will become more common as more manufacturers develop them. Although clinical results fall short in full midterm, they have been positive for both augmented RTSA and aTSA. Concerns arise when performing augmented aTSA, as an upper limit of correction has not been defined with regard to component failure. Currently, no data support the maximum amount of correction that can be achieved. In our current practice, we face difficulty in correcting more than 25° of version in young active patients with aTSA augment. Beyond this point, we perform a RTSA with an augment. In older patients or low-demand patients, we only correct minor deformities (<20°) with an aTSA augment, opting instead for an augmented RTSA due to the lower midterm failure rates observed with this implant.
1. Sirveaux F, Favard L, Oudet D, Huquet D, Walch G, Molé D. Grammont inverted total shoulder arthroplasty in the treatment of glenohumeral osteoarthritis with massive rupture of the cuff. J Bone Joint Surg Br. 2004;86(3):388-395. doi:10.1302/0301-620X.86B3.
2. Churchill RS, Spencer Jr EE, Fehringer EV. Quantification of B2 glenoid morphology in total shoulder arthroplasty. J Shoulder Elbow Surg. 2015;24(8):1212-1217. doi:10.1016/j.jse.2015.01.007.
3. Bercik MJ, Kruse K, Yalizis M, Gauci MO, Chaoui J, Walch G. A modification to the Walch classification of the glenoid in primary glenohumeral osteoarthritis using three-dimensional imaging. J Shoulder Elbow Surg. 2016;25(10):1601-1606. doi:10.1016/j.jse.2016.03.010.
4. Klika BJ, Wooten CW, Sperling JW, et al. Structural bone grafting for glenoid deficiency in primary total shoulder arthroplasty. J Shoulder Elbow Surg. 2014;23(7):1066-1072. doi:10.1016/j.jse.2013.09.017.
5. Franklin JL, Barrett WP, Jackins SE, Matsen FA 3rd. Glenoid loosening in total shoulder arthroplasty. Association with rotator cuff deficiency. J Arthroplasty. 1988;3(1):39-46.
6. Hermida JC, Flores-Hernandez C, Hoenecke HR, D’Lima DD. Augmented wedge-shaped glenoid component for the correction of glenoid retroversion: a finite element analysis. J Shoulder Elbow Surg. 2014;23(3):347-354. doi:10.1016/j.jse.2013.06.008.
7. Ho JC, Sabesan VJ, Iannotti JP. Glenoid component retroversion is associated with osteolysis. J Bone Joint Surg Am. 2013;95(12):e82. doi:10.2106/JBJS.L.00336.
8. Denard PJ, Walch G. Current concepts in the surgical management of primary glenohumeral arthritis with a biconcave glenoid. J Shoulder Elbow Surg. 2013;22(11):1589-1598. doi:10.1016/j.jse.2013.06.017.
9. Jones RB, Wright TW, Roche CP. Bone grafting the glenoid versus use of augmented glenoid baseplates with reverse shoulder arthroplasty. Bull Hosp Jt Dis (2013). 2015;73(suppl 1):S129-S135.
10. Hsu JE, Ricchetti ET, Huffman GR, Iannotti JP, Glaser DL. Addressing glenoid bone deficiency and asymmetric posterior erosion in shoulder arthroplasty. J Shoulder Elbow Surg. 2013;22(9):1298-1308. doi:10.1016/j.jse.2013.04.014.
11. Cil A, Sperling JW, Cofield RH. Nonstandard glenoid components for bone deficiencies in shoulder arthroplasty. J Shoulder Elbow Surg. 2014;23(7):e149-e157. doi:10.1016/j.jse.2013.09.023.
12. Rice RS, Sperling JW, Miletti J, Schleck C, Cofield RH. Augmented glenoid component for bone deficiency in shoulder arthroplasty. Clin Orthop Relat Res. 2008;466(3):579-583. doi:10.1007/s11999-007-0104-4.
13. Sabesan V, Callanan M, Sharma V, Iannotti JP. Correction of acquired glenoid bone loss in osteoarthritis with a standard versus an augmented glenoid component. J Shoulder Elbow Surg. 2014;23(7):964-973. doi:10.1016/j.jse.2013.09.019.
14. Davis DE, Acevedo D, Williams A, Williams G. Total shoulder arthroplasty using an inlay mini-glenoid component for glenoid deficiency: a 2-year follow-up of 9 shoulders in 7 patients. J Shoulder Elbow Surg. 2016;25(8):1354-1361. doi:10.1016/j.jse.2015.12.010.
15. Kersten AD, Flores-Hernandez C, Hoenecke HR, D'Lima DD. Posterior augmented glenoid designs preserve more bone in biconcave glenoids. J Shoulder Elbow Surg. 2015;24(7):1135-1141. doi:10.1016/j.jse.2014.12.007.
16. Favorito PJ, Freed RJ, Passanise AM, Brown MJ. Total shoulder arthroplasty for glenohumeral arthritis associated with posterior glenoid bone loss: results of an all-polyethylene, posteriorly augmented glenoid component. J Shoulder Elbow Surg. 2016;25(10):1681-1689. doi:10.1016/j.jse.2016.02.020.
17. Sandow M, Schutz C. Total shoulder arthroplasty using trabecular metal augments to address glenoid retroversion: the preliminary result of 10 patients with minimum 2-year follow-up. J Shoulder Elbow Surg. 2016;25(4):598-607. doi:10.1016/j.jse.2016.01.001.
18. Wright TW, Roche CP, Wright L, Flurin PH, Crosby LA, Zuckerman JD. Reverse shoulder arthroplasty augments for glenoid wear: A comparison of posterior augments to superior augments. Bull Hosp Jt Dis. 2015;73(suppl 1):S124-S128.
19. Boileau P, Morin-Salvo N, Gauci MO, et al. Angled BIO-RSA (bony-increased offset-reverse shoulder arthroplasty): a solution for the management glenoid bone loss and erosion. J Shoulder Elbow Surg. 2017;26(12):2133-2142. doi:10.1016/j.jse.2017.05.024.
ABSTRACT
Glenoid bone deficiency in the setting of shoulder replacement surgery is far more common than originally reported. The frequency and severity of the glenoid defects are noted to be more common and severe with the advent of computer-assisted surgery. The results of an anatomic total shoulder arthroplasty (aTSA) with glenoid deficiency have been reported to be inferior to aTSA patients without a glenoid deficiency. Options for treating the glenoid deficiency include eccentric reaming, bone grafting, and the use of augmented glenoid components. The purpose of this article is to present the indications, technique, and results of augmented glenoids for both aTSA and reverse TSA (RTSA).
Augments for both aTSA and RTSA are viable options. They preserve subchondral bone at the same time as optimizing the joint line without the need for bone grafts. Complications, revisions and results are as good as compared to shoulder arthroplasties without glenoid wear.
Continue to: Glenoid bone deficiency...
Glenoid bone deficiency in arthritic or cuff-deficient shoulder has been reported in up to 50% of shoulder defect cases.1,2 The type and severity of glenoid deformities vary depending on the underlying pathology and time of manifestation. Osteoarthritis with bone loss typically results in posterior or posterior inferior glenoid wear and is commonly classified as Walch types B1 or B2 (biconcave). In cases of severe erosion, B3 classification has been proposed; in this classification, bone loss becomes extremely severe, progressing to resemble a type C glenoid. Unlike primary osteoarthritis, inflammatory arthropathy more commonly causes central loss of glenoid bone (Walch A2). With the rotator cuff insufficiency, superior migration of the humeral head occurs. As these conditions progress, cuff tear arthropathy (CTA) changes result in superior or posterior-superior bone loss.1 Anterior bone loss (type D) will be rarely encountered due to recurrent anterior instability.3
Classically, with anatomic total shoulder arthroplasty (aTSA), the surgeon considers several options for managing glenoid deficiencies. The most commonly employed technique involves eccentrically reaming the glenoid and correcting the deformity. This procedure is relatively easy but features significant drawbacks, such as sacrificing the subchondral bone, medializing the glenohumeral joint line, and secondarily shrinking the glenoid surface area. Other options include structural bone grafting behind the glenoid component. Most anatomic prosthetic glenoids prove to be unsuitable for fixation of structural bone graft. Therefore, the graft is first internally fixed, followed by placement of the glenoid component. Cement, which is commonly used for glenoid fixation, may potentially inhibit bone-graft healing. Reports using this technique documented high radiographic failure rate of up to 40% at midterm follow-up.4 Although leaving the glenoid component retroverted may be considered, surgeons should develop awareness of the possibility of peg penetration of the anterior glenoid neck. Additionally, retroversion in excess of 5°may increase the risk of recurrent posterior subluxation, resulting in early glenoid loosening.5-7 Results of aTSA under significant glenoid deficiency are inferior to those of aTSA patients without glenoid deficiency.8 Such findings have been extremely inferior in patients with significant glenoid wear, prompting numerous surgeons to abandon aTSA in this population in favor of reverse TSA (RTSA) due to improved bony fixation.
In 2010, augmented anatomic glenoids were first introduced as a wedge (Exactech) and as a step shortly thereafter (DePuy Synthes; Figures 1A-1C). More recently, hemi-wedges have been introduced (Wright Medical Group). Augments have gained popularity due to improved range of motion vs reverse shoulder arthroplasty (RSA). However, debates remain regarding the use of posteriorly augmented components in the setting of posterior glenoid bone loss.8 Augments serve as another viable option for handling glenoid bone deficiency in aTSA.
Glenoid bone loss in RTSA presents similar options to aTSA. However, screw fixation of the glenoid component offers several distinct advantages. Baseplate fixation can readily be used with bone grafting and with a highly anticipated success rate. With multiple screw options, 100% support of the baseplate is not mandatory. Although bony increase offset RSAs (BIO-RSAs) have shown success, augmentation with allograft or autograft increases operative time and relies on osseous integration for long-term implant success.9 Metal augmented baseplates were first introduced in 2011 (Exactech) as a means of managing glenoid bone loss without structural grafting. Although initial results have been encouraging, additional studies are needed to assess the longevity of these implants (Figures 1A-1C).
aTSA AUGMENTS
aTSA augments were introduced as a means of correcting acquired glenoid bone deficiency, restoring native glenoid version, correcting humeral subluxation, and preserving the native subchondral bone. Compared with glenoid bone grafting, augmented glenoid components decrease operative time, allow for a technically easier operation, and require no bone healing for clinical success. Early and midterm results are encouraging, showing similar findings comparable to those of aTSA in non-glenoid deficient shoulders.10-12
Continue to: INDICATIONS
INDICATIONS
Indications and limitations for augmented aTSA glenoids remain incompletely defined. The most common indication for an augmented aTSA is osteoarthritis with a B2 glenoid. We recommend augments in the occurrence of any indication of significant eccentric glenoid wear. With the expertise of surgeons, deformities of up to 20° to 25° of deformity can be readily handled with good predictability. More severe deformities can be managed with augmented aTSA components, but early failure rates may be high. The most severe acquired deformities remain best managed with RTSA. Currently, we prefer RTSA when glenoid bone loss exceeds 25°. With the widespread availability of computed tomography (CT) scans with 3-dimensional (3-D) reconstruction, glenoid bone defects are increasingly recognized. When correcting deformity, surgeons should strive to limit residual retroversion to a maximum of 5°.13 Preoperative planning software and computer-assisted surgery (ExactechGPS) may allow surgeons to better define the limits of augmented glenoid fixation prior to the date of surgery. We routinely utilize computer-guided glenoid preparation to control glenoid version to within 5° of neutral position.
The differences between B3 and a true type C glenoid must be recognized. Although B3 glenoids may still be a candidate for an augmented anatomic glenoid component, type C glenoids are not. Developmental abnormalities of type C glenoid occur simultaneously with humeral deformities, including medialized posterior rotator cuff musculature. Correction of the joint line to neutral version may not replicate the non-diseased state of a dysplastic type shoulder. Davis and colleagues14 have proposed treating these patients by leaving both the humerus and glenoid in their native version without correction.
TECHNIQUE
The implant that we have the most experience with is an 8° full-wedge augmented glenoid component. Such an implant is typically utilized for B2 glenoids. We recommend that a high-quality CT scan be performed for preoperative planning. As a general rule, the starting point often lies close to the ridge of B2 glenoid and more anterior than the apparent glenoid center, which is viewed intraoperatively due to asymmetric posterior wear. Full-wedge component is utilized to ream the ridge separating the neo and paleoglenoids to create a flat surface. This condition is best achieved by drilling a pilot hole at the planned glenoid central peg position to prevent the reamer from sliding anteriorly during reaming. Glenoid preparation begins with the smallest reamer until the ridge has been flattened, and the reamer makes full contact with the glenoid. The reamer diameter is then increased based on glenoid size. Slightly downsizing the glenoid implant will require less reaming to achieve full backside support. Once the glenoid is properly reamed, the central and peripheral peg holes are drilled using the appropriate guides. Holes are then dried, and all-polyethylene or composite glenoid component (either partially or completely cemented) is installed using favored cementing techniques. The advantage of composite glenoid component is that the central cage allows for bone ingrowth and may potentially improve long-term implant survival. Press fit of the central cage requires no waiting time for glenoid cement hardening before proceeding to the humerus. When placing an augmented component, adequate glenoid exposure is imperative to allow in-line placement and appropriate seating of the component without impingement on adjacent retractors.
When using the step-augmented glenoid, the paleoglenoid is prepared in a similar fashion to a standard aTSA. Once the paleoglenoid has been reamed to a neutral position, a protector plate is placed onto the paleoglenoid. and a step-cut saw is used to prepare the posterior stepped bone cut. Peripheral pegs are then drilled, and the component is installed in routine fashion. When using hemi-wedge augments, the paleoglenoid is again prepared in a similar fashion as a standard glenoid component over a cannulated guidewire. The neoglenoid is subsequently prepared using a specialized angled reamer with a positive stop to prevent over-reaming. These glenoid implants improve rotational force neutralization given the absence of flat back against the glenoid. All 3 designs preserve bone when compared with eccentric reaming alone,15 with the half-augmented wedge preserving the most bone.
Table 1. Results of Various Augmented Glenoid Components in Anatomic Total Shoulder
Arthroplasty
| Augment | American Shoulder and Elbow Surgeons Score | Constant Score | Active Forward Flexion | Active External Rotation | ||||||||||||||||
8° cage (N = 21) |
|
|
|
|
| |||||||||||||||
All-polyethylene 8° (N = 45) |
|
|
|
|
| |||||||||||||||
All-polyethylene 16° (N = 7) |
|
|
|
|
|
RESULTS
In our institution, we first used all-polyethylene posteriorly augmented glenoid components in 2010. Between 2010 and 2015, 45 patients received an 8° all-polyethylene posterior augment, and 7 patients received a 16° augment. In 2015, we transitioned to the composite caged posterior augment. All patients in our database who received an augmented glenoid component experienced improvement in active forward elevation, external rotation, American Shoulder and Elbow Surgeons (ASES), and Constant scores (Table 1). Minimum follow-up was 1 year for patients receiving both an 8° cage (mean, 1.48 years) and an 8° all-polyethylene augment (mean, 3.18 years). Figures 2A-2C show a patient with significant posterior glenoid wear and humeral head subluxation treated with an 8° wedge composite posterior augment glenoid 3 years postoperative.
Continue to: COMPLICATIONS
COMPLICATIONS
Two complications developed in the group undergoing composite cage augment. One patient experienced glenoid loosening after a motor vehicle accident. Another patient sustained significant intraoperative tuberosity avulsion during implantation of the humeral component, requiring a change of implant and tuberosity fixation. Although no complications were noted in the 8° all-polyethylene group, 3 patients in the 16° augment group sustained complications. One of these patients suffered a cardiac event that was unrelated to the implant. Two complications in this group were both related to loosening of the glenoid component, requiring subsequent revision.
DISCUSSION
The first report on augmented aTSA was published in 2008, and it involved a 5° augmented, anatomic glenoid.12 One study was based on a small series of augments; the poor results led the reporting surgeons to subsequently abandon the implant.12 This early design produced a correction on the articular side of the implant rather than the pathologic bony side. By performing such correction, the component pegs remained anteriorly oriented, placing the component at risk of perforation through the anterior glenoid neck. All current augment designs feature pegs that are oriented down the glenoid vault, with corrections occurring on the bony surface. This condition requires 2 different axes for reaming the glenoid and drilling the pegs. This approach allows the pegs to be directed down the glenoid neck, and is a far superior solution to neutralizing shear forces when compared with the implants used in the 1990s.
Early to midterm results of modern aTSA augments have been extremely encouraging with low revision rates. The main concern of recurrent posterior subluxation has been rarely reported. The concerns over glenoid loosening due to high shear forces, similarly, have not been described to date. However, surgeons should remain cautious, as longer-term follow-up remains unavailable.
The main advantage of aTSA augments is their capacity to preserve bone compared with eccentric reaming and better long-term stability. Each of the augment designs requires varying amounts of bone removal. Through biomechanics and using finite element analysis, the 3 augment types act differently, with no design demonstrating remarkable biomechanical superiority.6 Favorito and colleagues16 performed a retrospective review of 22 patients who underwent aTSA using an all-polyethylene, posteriorly augmented, and stepped glenoid component for posterior bone loss. At an average follow-up of 36 months, all patients experienced improvements in active forward elevation, external rotation, visual analog scale, Short Form-36 Physical Component Summary, and Western Ontario Osteoarthritis of the Shoulder scores. The authors noted that 2 patients (9%) experienced complications: 1 with an anterior dislocation and the other with recurrent posterior instability requiring revision. Sandow and Schutz17 reported the preliminary results of 10 patients who underwent aTSA using trabecular metal augment with a minimum of 2-year follow-up. All patients received either a 15° or 30° posterior, metal-backed augment for severe glenoid bone loss (Walch grade B2 or C). At a minimum of 2-year follow-up, all patients received correction to within 10° of neutral glenoid version, without any complications nor implant failures.
Regardless of augment design, all current components restore the native glenoid version, improving the length and subsequent tension of rotator cuff musculature. Similarly, re-centering the humeral head decreases the forces on the glenoid and allows for optimal function with decreasing loss of vital subchondral bone.
Continue to: RTSA AUGMENTS
RTSA AUGMENTS
Similar to anatomic augments, metal augments were introduced for use with RTSA in 2011. Unlike anatomic augments, those for RTSA were manufactured with metal. Given the difference in bony wear patterns in patients requiring RTSA, augments were available in a number of configurations. With CTA, wear is most commonly superior. Leaving a superiorly inclined baseplate must be avoided due to risks of notching, loosening, and early failure. However, correcting this tilt will require significant reaming of the inferior glenoid. A superior augment is ideally suited for this bone-loss pattern. If the glenoid is retroverted significantly, difficulty can also arise during glenoid preparation and baseplate placement. Posterior augments may ease this aspect of the procedure. Posterior augments feature the additional benefits of tensioning any remaining posterior rotator cuff, minimizing posterior inferior impingement, and technically easing the operation.18 As we improve our awareness of glenoid orientation using computer navigation, a posterior-superior augmented implant is commonly needed to simultaneously optimize the baseplate position and to minimize reaming (Figure 3). The posterior-superior augmented baseplate has become the most commonly used baseplate augment of choice in 90% of our RTSA cases that require an augment.
INDICATIONS
Augmented RTSA baseplates are indicated when adequate backside contact cannot be achieved with eccentric reaming, thus compromising potential fixation. In our practice, we preferably use augments at <50% contact with the backside of the baseplate. Excessive superior inclination is observed in a CTA setting, commonly indicating the use of superior augments. Similarly, severe primary osteoarthritis may contain elements of posterior bone loss, leading to increased retroversion, which is where we use posterior augments. When patients exhibit combined deformities, or when the surgeon wishes to tension the posterior rotator cuff, a posterior-superior augmented glenoid baseplate is used. For extremely severe defects, we have combined bone grafting and augments. In patients with a highly deficient glenoid but good quality of the remaining bone stock, an augment allows for better contact with less reaming although it is not fully supported when compared with a non-augmented baseplate. Bone grafts can function similarly, but the autograft humeral head is not constantly present in revision situations and requires increased operative time to allow for precision carpentry. Additionally, the success of BIO-RSA requires healing of bone graft on the native glenoid to support the baseplate.19 Jones and colleagues9 compared metal augmented RTSA with BIO-RSA and presented equivalent results.
To minimize reaming and to obtain appropriately inferior inclination, we have discovered preoperative templating and intraoperative, computer-guided glenoid preparation to be extremely valuable (ExactechGPS). These tools allow appropriate assessment of augments and for minimal bone removal when preparing the glenoid.
TECHNIQUE
When using an augment, a fine-cut CT scan is highly recommended to aid in surgery planning. We also find 3-D reconstructions to be helpful. Preoperative planning software also allows surgeons to maximize fixation of implant within the glenoid vault. The starting point for reaming is planned based on CT. Some surgeons using augments perform minimal or no reaming at all, electing to remove the remaining cartilage with a Cobb elevator. Different reaming and drilling axes are used when using augments. In cases of severe glenoid deformity and unavailability of computer assistance, a guide wire with inferior inclination can be installed based on CT scan. Penetration of this wire down the glenoid neck can be palpated and compared with the preoperative plan. We generally prefer at least 24 mm of bone containment for the central cage. Once the surgeon is satisfied with the placement of the wire, the appropriate augment guide is placed, followed by a second guide wire. This second wire acts as the reaming axis. The first wire is removed, and the glenoid is reamed with a cannulated reamer. Once reaming is completed, the original wire is replaced in the same hole and trajectory, and the reaming wire is removed. The first wire is then drilled with a cannulated drill for the central cage. The augmented baseplate is then impacted into place, and screw fixation is performed. Again, intraoperative computer guidance allows for precision screw placement with maximal bone attachment.
Table 2. Results of Reverse Total Shoulder Arthroplasty Augmented Baseplates
| Augment | American Shoulder and Elbow Surgeons Score | Constant Score | Active Forward Flexion | Active External Rotation | ||||||||||||||||
Superior (N = 22) |
|
|
|
|
| |||||||||||||||
Posterior (N = 50) |
|
|
|
|
| |||||||||||||||
Posterosuperior (N = 67) |
|
|
|
|
|
RESULTS
Based on our experience, glenoid augments for RTSA have performed well at short- and mid-term follow-up. From October 2011 to July 2016, 139 patients undergoing RTSA received a posterior, superior, or posterior-superior augmented glenoid baseplate. All groups demonstrated improvements in functional outcome measures, including Constant, ASES, Shoulder Pain and Disability Index, and Simple Shoulder Test scores compared with baseline values (Table 2). The posterior-superior augment group experienced the most significant improvement in active forward flexion and external rotation, whereas the posterior augment group experienced the most significant improvement in ASES and Constant scores. Figures 4A-4C displays the radiographs of a patient with significant glenoid wear treated with a posterior-superior augment RTSA.
Continue to: COMPLICATIONS
COMPLICATIONS
In the superior augment group, 3 patients (13%) sustained 5 complications. One patient sustained 3 separate episodes of instability, eventually requiring revision of prosthesis. In the posterior augment group, 4 patients (8%) sustained complications. Two of the 4 patients presented postoperative humeral fractures related to traumatic events, whereas another patient sustained an intraoperative tuberosity fracture. The last complication in this group involved a postoperative draining wound that was treated with oral antibiotics.
Nine complications developed in the posterior-superior augment group (13%); these complications included aseptic baseplate loosening (5), glenoid fracture (1), humeral fracture (1), acromial stress fracture (1), and cerebrovascular accident (1).
DISCUSSION
As the use of augments in RTSA is relatively new, significantly scarce data exist regarding their outcomes and longevity. A few studies have focused on the short-term outcomes of these augments. Jones and colleagues9 performed a retrospective review of 80 patients who underwent RTSA and required either a structural bone graft or an augmented glenoid baseplate.9 They observed that although all patients showed improvements in pain, range of motion, and functional scores, the structural bone graft group incurred a 14.6% complication rate compared with none observed in the augment group. Additionally, Jones and colleagues9 noted that the augmented baseplate group exhibited a significantly lower rate of scapular notching compared with the bone-graft group (10% vs 18.5%) at similar follow-up intervals. A separate study by Wright and colleagues18 compared posterior vs superior augmented baseplates in RTSA. The posterior augment group demonstrated lower rates of scapular notching (6.3% vs 14.3%) and showed more significant improvements in Constant, ASES, and active forward elevation measures, compared with the superior augment group.
As more manufacturers develop augments for RTSA, and as ExactechGPS uses become more widespread, the use of RTSA baseplate augments will continually grow. Custom implants using massive metal augments are now also being introduced. Although currently too expensive for most cases, as technology drives the cost down, every patient may receive customized augmented implants in the future.
The advantages of augmented baseplate designs include minimized reaming and notching, improved tension of the remaining rotator cuff, and decreased operating room time. The disadvantages include increased cost and lack of mid- or long-term clinical data. The concerns with baseplate loosening with augments in RTSA are much less than those with augments for aTSA due to the outstanding baseplate fixation that can be achieved in RTSA.
Continue to: CONLCLUSION
CONCLUSION
Augments offer an excellent tool for surgeons performing both aTSA and RTSA with glenoid bone loss. Use of augments will become more common as more manufacturers develop them. Although clinical results fall short in full midterm, they have been positive for both augmented RTSA and aTSA. Concerns arise when performing augmented aTSA, as an upper limit of correction has not been defined with regard to component failure. Currently, no data support the maximum amount of correction that can be achieved. In our current practice, we face difficulty in correcting more than 25° of version in young active patients with aTSA augment. Beyond this point, we perform a RTSA with an augment. In older patients or low-demand patients, we only correct minor deformities (<20°) with an aTSA augment, opting instead for an augmented RTSA due to the lower midterm failure rates observed with this implant.
1. Sirveaux F, Favard L, Oudet D, Huquet D, Walch G, Molé D. Grammont inverted total shoulder arthroplasty in the treatment of glenohumeral osteoarthritis with massive rupture of the cuff. J Bone Joint Surg Br. 2004;86(3):388-395. doi:10.1302/0301-620X.86B3.
2. Churchill RS, Spencer Jr EE, Fehringer EV. Quantification of B2 glenoid morphology in total shoulder arthroplasty. J Shoulder Elbow Surg. 2015;24(8):1212-1217. doi:10.1016/j.jse.2015.01.007.
3. Bercik MJ, Kruse K, Yalizis M, Gauci MO, Chaoui J, Walch G. A modification to the Walch classification of the glenoid in primary glenohumeral osteoarthritis using three-dimensional imaging. J Shoulder Elbow Surg. 2016;25(10):1601-1606. doi:10.1016/j.jse.2016.03.010.
4. Klika BJ, Wooten CW, Sperling JW, et al. Structural bone grafting for glenoid deficiency in primary total shoulder arthroplasty. J Shoulder Elbow Surg. 2014;23(7):1066-1072. doi:10.1016/j.jse.2013.09.017.
5. Franklin JL, Barrett WP, Jackins SE, Matsen FA 3rd. Glenoid loosening in total shoulder arthroplasty. Association with rotator cuff deficiency. J Arthroplasty. 1988;3(1):39-46.
6. Hermida JC, Flores-Hernandez C, Hoenecke HR, D’Lima DD. Augmented wedge-shaped glenoid component for the correction of glenoid retroversion: a finite element analysis. J Shoulder Elbow Surg. 2014;23(3):347-354. doi:10.1016/j.jse.2013.06.008.
7. Ho JC, Sabesan VJ, Iannotti JP. Glenoid component retroversion is associated with osteolysis. J Bone Joint Surg Am. 2013;95(12):e82. doi:10.2106/JBJS.L.00336.
8. Denard PJ, Walch G. Current concepts in the surgical management of primary glenohumeral arthritis with a biconcave glenoid. J Shoulder Elbow Surg. 2013;22(11):1589-1598. doi:10.1016/j.jse.2013.06.017.
9. Jones RB, Wright TW, Roche CP. Bone grafting the glenoid versus use of augmented glenoid baseplates with reverse shoulder arthroplasty. Bull Hosp Jt Dis (2013). 2015;73(suppl 1):S129-S135.
10. Hsu JE, Ricchetti ET, Huffman GR, Iannotti JP, Glaser DL. Addressing glenoid bone deficiency and asymmetric posterior erosion in shoulder arthroplasty. J Shoulder Elbow Surg. 2013;22(9):1298-1308. doi:10.1016/j.jse.2013.04.014.
11. Cil A, Sperling JW, Cofield RH. Nonstandard glenoid components for bone deficiencies in shoulder arthroplasty. J Shoulder Elbow Surg. 2014;23(7):e149-e157. doi:10.1016/j.jse.2013.09.023.
12. Rice RS, Sperling JW, Miletti J, Schleck C, Cofield RH. Augmented glenoid component for bone deficiency in shoulder arthroplasty. Clin Orthop Relat Res. 2008;466(3):579-583. doi:10.1007/s11999-007-0104-4.
13. Sabesan V, Callanan M, Sharma V, Iannotti JP. Correction of acquired glenoid bone loss in osteoarthritis with a standard versus an augmented glenoid component. J Shoulder Elbow Surg. 2014;23(7):964-973. doi:10.1016/j.jse.2013.09.019.
14. Davis DE, Acevedo D, Williams A, Williams G. Total shoulder arthroplasty using an inlay mini-glenoid component for glenoid deficiency: a 2-year follow-up of 9 shoulders in 7 patients. J Shoulder Elbow Surg. 2016;25(8):1354-1361. doi:10.1016/j.jse.2015.12.010.
15. Kersten AD, Flores-Hernandez C, Hoenecke HR, D'Lima DD. Posterior augmented glenoid designs preserve more bone in biconcave glenoids. J Shoulder Elbow Surg. 2015;24(7):1135-1141. doi:10.1016/j.jse.2014.12.007.
16. Favorito PJ, Freed RJ, Passanise AM, Brown MJ. Total shoulder arthroplasty for glenohumeral arthritis associated with posterior glenoid bone loss: results of an all-polyethylene, posteriorly augmented glenoid component. J Shoulder Elbow Surg. 2016;25(10):1681-1689. doi:10.1016/j.jse.2016.02.020.
17. Sandow M, Schutz C. Total shoulder arthroplasty using trabecular metal augments to address glenoid retroversion: the preliminary result of 10 patients with minimum 2-year follow-up. J Shoulder Elbow Surg. 2016;25(4):598-607. doi:10.1016/j.jse.2016.01.001.
18. Wright TW, Roche CP, Wright L, Flurin PH, Crosby LA, Zuckerman JD. Reverse shoulder arthroplasty augments for glenoid wear: A comparison of posterior augments to superior augments. Bull Hosp Jt Dis. 2015;73(suppl 1):S124-S128.
19. Boileau P, Morin-Salvo N, Gauci MO, et al. Angled BIO-RSA (bony-increased offset-reverse shoulder arthroplasty): a solution for the management glenoid bone loss and erosion. J Shoulder Elbow Surg. 2017;26(12):2133-2142. doi:10.1016/j.jse.2017.05.024.
TAKE-HOME POINTS
- Glenoid defects are very common.
- Options for treating glenoid defects include eccentric reaming, bone grafting, and augmented glenoids.
- As computer-assisted surgery use becomes more widespread the use of augments in both TSA and RTSA will become very common.
- Subchondral bone is precious and cannot be replaced once reamed away. Eccentric glenoids introduce a mechanism to minimize reaming and preserve this precious bone.
- On short-term to midterm follow-up augments perform at least as well if not better than non-augmented glenoid components with complication rate and revisions likewise similar.

Onodera’s Prognostic Nutritional Index in soft tissue sarcoma patients as a predictor of wound complications
Background The ability to predict a wound complication after radiation therapy and surgery for soft tissue sarcomas remains difficult. Preoperative nutritional status, as determined by Onodera’s Prognostic Nutritional Index (OPNI), has been a predictor of complications in patients undergoing gastrointestinal surgery. However, the role OPNI has in predicting wound complications for soft tissue sarcoma remains unknown.
Objective To evaluate the role OPNI has in predicting wound complication in patients treated with radiation and surgery for soft tissue sarcomas.
Methods OPNI was calculated based on the published formula OPNI = (10*albumin level [g/dL]) + (0.005*total lymphocyte count). The albumin level and total lymphocyte counts closest to the index operation were chosen. Major and minor wound complications were identified. A receiver operating curve was calculated to identify a cut-off point value for OPNI and for age based on the best combination of sensitivity and specificity.
Results 44 patients were included in the study. Patients with an OPNI of <45.4 had a 7.5-times increased risk of a wound complication (P = .005; 95% confidence interval [CI], 1.8-31.0). An OPNI of <45.4 had a sensitivity of 62% and specificity of 82% of predicting a wound complication. Being older than 73 years was associated with a 6.8-times increased risk of wound complications (P = .01; 95% CI, 1.6-28.7).
Limitations Small sample size for patients with a rare condition
Conclusion An OPNI of <45.4 and being older than 73 years are strong predictors of which patients will have a wound complication after radiation therapy for soft tissue sarcomas. Preoperative nutritional status could be an important modifiable factor to help decrease wound complications.
Wound complications after pre- or post-operative radiation for soft tissue sarcomas are well established.1 The ability to predict who will have a wound complication remains difficult. Some studies have looked at risk factors such as smoking, and the preoperative nutritional status of patients has been identified as a risk factor for wound complication in patients with elective orthopedic surgical procedures.2 One validated method of measuring preoperative nutritional status in patients with gastrointestinal malignant tumors has been with Onodera’s Prognostic Nutritional Index (OPNI). It uses the patient’s preoperative albumin (g/dL) and absolute lymphocyte values (per mm3). The prognostic value of the OPNI has been demonstrated in patients with colorectal, esophageal, and gastric cancers, and has been shown to be prognostic for postoperative wound healing and overall prognosis.3-5 In this study, we investigate the significance of preoperative nutritional status, measured by OPNI, as a predictor of wound complications in patients treated with pre- or postoperative radiation for soft tissue sarcoma.
Methods
After receiving Institutional Review Board approval for the study, we conducted a retrospective review of consecutive patients treated during July 2012-April 2016 for a soft tissue sarcoma by the orthopedic oncology division at Cooper University Hospital in Camden, New Jersey. Inclusion criteria were patients with biopsy-proven soft tissue sarcoma, who were older than 18 years, had received pre- or postoperative radiation, and who had a recorded preoperative albumin and total lymphocyte count. A minimum follow-up of 3 months was required to assess for postoperative wound complications. Exclusion criteria included patients who had a bone sarcoma, had not received radiation therapy, or had a missing preoperative albumin or total lymphocyte count.
All of the surgeries were performed by 2 fellowshiptrained orthopedic oncologists. Patients received either pre- or postoperative radiation therapy by multiple radiation oncologists.
The OPNI was calculated based on the published formula OPNI = (10*albumin level [g/dL]) + (0.005*total lymphocyte count [per mm3]). The albumin level and total lymphocyte counts closest to the index operation were chosen.
Demographic information including gender, age at diagnosis, height, and weight were recorded. Data related to the patients’ pathologic diagnosis, stage at presentation, radiation therapy, and surgical resection were collected. A minor wound complication was defined as a wound problem that did not require operative intervention. Major wound complication was defined as a complication requiring operative intervention with or without flap reconstruction. Wound complications occurring within the 3-month postoperative period were considered.
Univariate and multiple variable analysis was performed. A P value <.05 was considered significant. A receiver operating curve as well as recursive partitioning was performed for OPNI and age to determine the best cut-off point to use in the analysis. The Sobel test was used to evaluate mediation. All statistical analysis was performed using SAS v9.4 and JMP10. (SAS Institute, Cary, NC).
Results
In all, 44 patients (28 men, 16 women) were included in the study. Their mean age was 61.2 years (range, 19-94). The average size of the tumors was 8.5 cm in greatest dimension (range, 1.2-27.4 cm), and all of the patients had nonmetastatic disease at the time of surgical resection; 37 patients had R0 resections, and 7 patients had a positive margin from an outside hospital, but obtained R0 resections on a subsequent resection (Table 1 and Table 2). In all, 30 patients received preoperative radiation, 14 patients received postoperative radiation, 32 patients received external beam radiation, 8 received Cyberknife treatment, and information for 4 patients was not unavailable. Mean preoperative external beam radiation and Cyberknife dose was 4,931 Gy and 3,750 Gy, respectively. Mean postoperative external beam and Cyberknife radiation dose was 6,077 Gy and 4,000 Gy, respectively. When evaluating radiation dose delivered between those who had wound complications and those who did not, there was no significant difference (Table 3).
Of the total, 13 patients had a wound complication (30%). Ten patients had preoperative radiation, and 3 had postoperative radiation. Ten patients had major wound complications requiring a combined 27 surgeries. Three patients had minor wound complications, which resolved with conservative management. One patient had a major wound complication in the group that had an initial R1 resection.
The OPNI was calculated based on the aforementioned formula. When the univariate analysis was performed, only age and OPNI were statistically significant. Patients older than 72.6 years had a 6.8 times higher risk of a wound complication (P = .01; 95% confidence interval [CI], 1.6-28.7). When the OPNI value of 45.4 was used as the threshold, a patient with a preoperative OPNI value of <45.4 had a 7.5 times increased risk of developing a wound complication (P = .005; 95% CI, 1.8-31.0).
When the receiver operating curve and recursive partitioning was performed, an OPNI value of 45.4 showed a sensitivity of 62% and specificity of 82% in predicting wound complications (Figure 1).
When a multiple variable analysis was performed, OPNI and age were not statistically significant (P = .06 and P = .11, respectively). A test for mediation was performed, and the OPNI seemed to mediate the effect age has on wound complications, accounting for 36% of the total effect (Sobel test statistic, 1.79; P = .07).
Discussion
Wound complications after pre- and postoperative radiation for soft tissue sarcomas are well known. The best study to date to demonstrate that relationship was a randomized controlled trial performed in Canada, which showed that preoperative radiation resulted in 37% wound complications, compared with 17% for postoperative radiation.6 In that study, of the wound complications in both radiation types, more than 50%-60% required a secondary surgical procedure, designating it as a major wound complication. Other variables that have been shown to contribute to wound complications include being older than 40 years and/or having large tumors, diabetes, peripheral vascular disease, and begin a smoker.7-10
In our study, we applied OPNI to orthopedic oncology and showed that the patient’s age and preoperative nutritional status were significant predictors of developing a wound complication. An OPNI of <45.4 increased the chance of a wound complication by 7.5 times. Being older than 73 years increased the risk of a wound complication by 6.8 times. Most of these wound complications were major and required surgical intervention.
In general surgical oncology, the evaluation of nutritional status has had a significant impact on the care of patients, especially for those patients undergoing gastrointestinal surgery. The OPNI was initially designed to assess the nutritional and immunological statuses of patients undergoing gastrointestinal surgery.11 Preoperative OPNI has been shown to be a good predictor of postoperative complications and survival in patients with colorectal cancer, malignant mesothelioma, hepatocellular carcinoma and in patients who undergo total gastrectomy.12-15 Chen and colleagues evaluated the significance of OPNI in patients with colorectal cancer. They found an optimal cut-off value of 45. An OPNI value <45 has a sensitivity and specificity of 85% and 69%, respectively, in predicting 5-year overall survival.16 Hong and colleagues noted that an OPNI cut-off value of 52.6 as a predictor of overall survival.17
Poor preoperative nutritional status has been shown to have a negative impact on wound healing. In patients who underwent emergency laparotomy, a low OPNI had significantly higher rates of wound dehiscence and infection.18 This happens because protein deficiency leads to decreased wound tensile strength, decreased T-cell function, decreased phagocytic activity, which ultimately diminish the patient’s ability to heal and defend against wound infections.19-21
In soft tissue sarcoma patients, poor preoperative nutritional status is further compromised by radiation therapy to the wound. Gu and colleagues showed that radiation to wounds in mice showed early inhibition of the inflammatory phase, injury and inhibition of fibroblasts, and collagen formation, and then prolonged re-epithelialization.22 This “double hit” with radiation onto host tissue that is already nutritionally compromised could be an important cause of why wound complications occur at such high rates in our soft tissue sarcoma patients.
There are several limitations to this study. First, the study has a small sample size, which was a direct result of the number of patients who were excluded because an OPNI value could not be calculated for them. Second, we could not determine if the OPNI was more valuable in patients who underwent pre- or postoperative radiation. This study did not look at other nutritional indices such as prealbumin and vitamin levels. Third, the radiation was provided by different providers, so technique was variable, but the patients received nearly equivalent doses and variability in technique is likely limited. Fourth, we were not able to meaningfully analyze the role of chemotherapy in this patient population because there was a significant heterogeneity of patients receiving pre- and postoperative chemotherapy.
Our findings strongly suggest that a preoperative OPNI of <45.4 and being older than 73 years are strong predictors of patients who will experience a wound complication after radiation therapy for soft tissue sarcomas. This study has led us to start measuring preoperative albumin levels and assess complete metabolic panels. Our goal is to identify patients who are at high risk of wound complication and perform interventions to improve nutrition, then to study whether the interventions help lower the rates of wound complications. TSJ
Correspondence
References
1. Ormsby MV, Hilaris BS, Nori D, Brennan MF. Wound complications of adjuvant radiation therapy in patients with soft-tissue sarcomas. Ann Surg. 1989;210(1):93-99.
2. Greene KA, Wilde AH, Stulberg BN. Preoperative nutritional status of total joint patients: relationship to postoperative wound complications. J Arthroplasty. 1991;6(4):321-325.
3. Nozoe T, Kimura Y, Ishida M, Saeki H, Korenaga D, Sugimachi K. Correlation of pre-operative nutritional condition with post-operative complications in surgical treatment for oesophageal carcinoma. Eur J Surg Oncol. 2002;28(4):396-400.
4. Nozoe T, Kohno M, Iguchi T, et al. The prognostic nutritional index can be a prognostic indicator in colorectal carcinoma. Surg Today. 2012;42(6):532-535.
5. Nozoe T, Ninomiya M, Maeda T, Matsukuma A, Nakashima H, Ezaki T. Prognostic nutritional index: a tool to predict the biological aggressiveness of gastric carcinoma. Surg Today. 2010;40(5):440-443.
6. O’Sullivan B, Davis AM, Turcotte R, Bell R, Catton C, Chabot P, et al. Preoperative versus postoperative radiotherapy in soft-tissue sarcoma of the limbs: a randomised trial. Lancet. 2002;359(9325):2235-2241.
7. Peat BG, Bell RS, Davis A, et al. Wound-healing complications after soft-tissue sarcoma surgery. Plast Reconstr Surg. 1994;93(5):980-987.
8. Kunisada T, Ngan SY, Powell G, Choong PF. Wound complications following pre-operative radiotherapy for soft tissue sarcoma. Eur J Surg Oncol. 2002;28(1):75-79.
9. Saddegh MK, Bauer HC. Wound complication in surgery of soft tissue sarcoma: analysis of 103 consecutive patients managed without adjuvant therapy. Clin Orthop Relat Res. 1993;289:247-253.
10. Tseng JF, Ballo MT, Langstein HN, et al. The effect of preoperative radiotherapy and reconstructive surgery on wound complications after resection of extremity soft-tissue sarcomas. Ann Surg Oncol. 2006;13(9):1209-1215.
11. Smale BF, Mullen JL, Buzby GP, Rosato EF. The efficacy of nutritional assessment and support in cancer surgery. Cancer. 1981;47(10):2375-2381.
12. Mohri Y, Inoue Y, Tanaka K, Hiro J, Uchida K, Kusunoki M. Prognostic nutritional index predicts postoperative outcome in colorectal cancer. World J Surg. 2013;37(11):2688-2692.
13. Jiang N, Deng JY, Ding XW, et al. Prognostic nutritional index predicts postoperative complications and long-term outcomes of gastric cancer. World J Gastroenterol. 2014;20(30):10537-10544.
14. Pinato DJ, North BV, Sharma R. A novel, externally validated inflammation-based prognostic algorithm in hepatocellular carcinoma: the prognostic nutritional index (PNI). Brit J Cancer. 2012;106(8):1439-1445.
15. Yao ZH, Tian GY, Wan YY, et al. Prognostic nutritional index predicts outcomes of malignant pleural mesothelioma. J Cancer Res Clin Oncol. 2013;139(12):2117-2123.
16. Jian-Hui C, Iskandar EA, Cai Sh I, et al. Significance of Onodera’s prognostic nutritional index in patients with colorectal cancer: a large cohort study in a single Chinese institution. Tumour Biol. 2016;37(3):3277-3283.
17. Hong S, Zhou T, Fang W, et al. The prognostic nutritional index (PNI) predicts overall survival of small-cell lung cancer patients. Tumour Biol. 2015;36(5):3389-9337.
18. Mohil RS, Agarwal A, Singh N, Arora J, Bhatnagar D. Does nutritional status play a role in patients undergoing emergency laparotomy? E Spen Eur E J Clin Nutr Metab. 2008;3(5):e226-e231.
19. Kay SP, Moreland JR, Schmitter E. Nutritional status and wound healing in lower extremity amputations. Clin Orthop Relat Res. 1987;(217):253-256.
20. Dickhaut SC, DeLee JC, Page CP. Nutritional status: importance in predicting wound-healing after amputation. J Bone Joint Surg Am. 1984;66(1):71-75.
21. Casey J, Flinn WR, Yao JS, Fahey V, Pawlowski J, Bergan JJ. Correlation of immune and nutritional status with wound complications in patients undergoing vascular operations. Surgery. 1983;93(6):822-827.
22. Gu Q, Wang D, Cui C, Gao Y, Xia G, Cui X. Effects of radiation on wound healing. J Environ Pathol Toxicol Oncol. 1998;17(2):117-123.
Relationship between Hospital 30-Day Mortality Rates for Heart Failure and Patterns of Early Inpatient Comfort Care
In an effort to improve the quality of care delivered to heart failure (HF) patients, the Centers for Medicare & Medicaid Services (CMS) publish hospitals’ 30-day risk-standardized mortality rates (RSMRs) for HF.1 These mortality rates are also used by CMS to determine the financial penalties and bonuses that hospitals receive as part of the national Hospital Value-based Purchasing program.2 Whether or not these efforts effectively direct patients towards high-quality providers or motivate hospitals to provide better care, few would disagree with the overarching goal of decreasing the number of patients who die from HF.
However, for some patients with chronic disease at the end of life, goals of care may change. The quality of days lived may become more important than the quantity of days lived. As a consequence, high-quality care for some patients at the end of life is associated with withdrawing life-sustaining or life-extending therapies. Over time, this therapeutic perspective has become more common, with use of hospice care doubling from 23% to 47% between 2000 and 2012 among Medicare beneficiaries who died.3 For a national cohort of older patients admitted with HF—not just those patients who died in that same year—hospitals’ rates of referral to hospice are considerably lower, averaging 2.9% in 2010 in a national study.4 Nevertheless, it is possible that hospitals that more faithfully follow their dying patients’ wishes and withdraw life-prolonging interventions and provide comfort-focused care at the end of life might be unfairly penalized if such efforts resulted in higher mortality rates than other hospitals.
Therefore, we used Medicare data linked to a national HF registry with information about end-of-life care, to address 3 questions: (1) How much do hospitals vary in their rates of early comfort care and how has this changed over time; (2) What hospital and patient factors are associated with higher early comfort care rates; and (3) Is there a correlation between 30-day risk-adjusted mortality rates for HF with hospital rates of early comfort care?
METHODS
Data Sources
We used data from the American Heart Association’s Get With The Guidelines-Heart Failure (GWTG-HF) registry. GWTG-HF is a voluntary, inpatient, quality improvement registry5-7 that uses web-based tools and standard questionnaires to collect data on patients with HF admitted to participating hospitals nationwide. The data include information from admission (eg, sociodemographic characteristics, symptoms, medical history, and initial laboratory and test results), the inpatient stay (eg, therapies), and discharge (eg, discharge destination, whether and when comfort care was initiated). We linked the GWTG-HF registry data to Medicare claims data in order to obtain information about Medicare eligibility and patient comorbidities. Additionally, we used data from the American Hospital Association (2008) for hospital characteristics. Quintiles Real-World & Late Phase Research (Cambridge, MA) serves as the data coordinating center for GWTG-HF and the Duke Clinical Research Institute (Durham, NC) serves as the statistical analytic center. GWTG-HF participating sites have a waiver of informed consent because the data are de-identified and primarily used for quality improvement. All analyses performed on this data have been approved by the Duke Medical Center Institutional Review Board.
Study Population
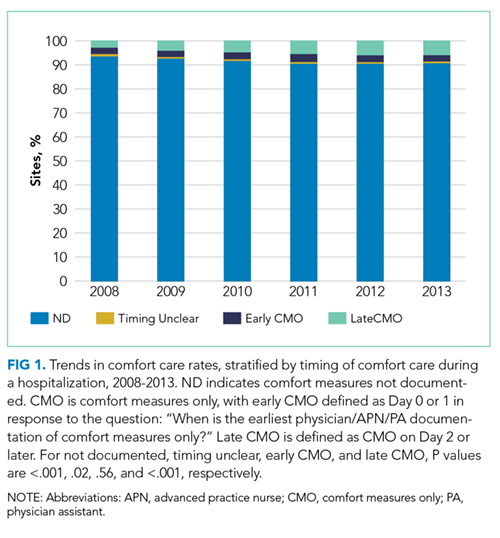
Study Outcomes
Our outcome of interest was the correlation between a hospital’s rate of initiating early CMO for admitted HF patients and a hospital’s 30-day RSMR for HF. The GWTG-HF questionnaire8 asks “When is the earliest physician/advanced practice nurse/physician assistant documentation of comfort measures only?” and permits 4 responses: day 0 or 1, day 2 or after, timing unclear, or not documented/unable to determine. We defined early CMO as CMO on day 0 or 1, and late/no CMO as any other response. We chose to examine early comfort care because many hospitalized patients transition to comfort care before they die if the death is in any way predictable. Thus, if comfort care is measured at any time during the hospitalization, hospitals that have high mortality rates are likely to have high comfort care rates. Therefore, we chose to use the more precise measure of early comfort care. We created hospital-level, risk-standardized early comfort care rates using the same risk-adjustment model used for RSMRs but with the outcome of early comfort care instead of mortality.9,10
RSMRs were calculated using a validated GWTG-HF 30-day risk-standardized mortality model9 with additional variables identified from other GWTG-HF analyses.10 The 30 days are measured as the 30 days after the index admission date.
Statistical Analyses
We described trends in early comfort care rates over time, from February 17, 2008, to February 17, 2014, using the Cochran-Armitage test for trend. We then grouped hospitals into quintiles based on their unadjusted early comfort care rates. We described patient and hospital characteristics for each quintile, using χ2 tests to test for differences across quintiles for categorical variables and Wilcoxon rank sum tests to assess for differences across quintiles for continuous variables. We then examined the Spearman’s rank correlation between hospitals’ RSMR and risk-adjusted comfort care rates. Finally, we compared hospital-level RSMRs before and after adjusting for early comfort care.
We performed risk-adjustment for these last 2 analyses as follows. For each patient, covariates were obtained from the GWTG-HF registry. Clinical data captured for the index admission were utilized in the risk-adjustment model (for both RSMRs and risk-adjusted comfort care rates). Included covariates were as follows: age (per 10 years); race (black vs non-black); systolic blood pressure at admission ≤170 (per 10 mm Hg); respiratory rate (per 5 respirations/min); heart rate ≤105 (per 10 beats/min); weight ≤100 (per 5 kg); weight >100 (per 5 kg); blood urea nitrogen (per 10 mg/dl); brain natriuretic peptide ≤2000 (per 500 pg/ml); hemoglobin 10-14 (per 1 g/dl); troponin abnormal (vs normal); creatinine ≤1 (per 1 mg/dl); sodium 130-140 (per 5 mEq/l); and chronic obstructive pulmonary disease or asthma.
Hierarchical logistic regression modeling was used to calculate the hospital-specific RSMR. A predicted/expected ratio similar to an observed/expected (O/E) ratio was calculated using the following modifications: (1) instead of the observed (crude) number of deaths, the numerator is the number of deaths predicted by the hierarchical model among a hospital’s patients given the patients’ risk factors and the hospital-specific effect; (2) the denominator is the expected number of deaths among the hospital’s patients given the patients’ risk factors and the average of all hospital-specific effects overall; and (3) the ratio of the numerator and denominator are then multiplied by the observed overall mortality rate (same as O/E). This calculation is the method used by CMS to derive RSMRs.11 Multiple imputation was used to handle missing data in the models; 25 imputed datasets using the fully conditional specification method were created. Patients with missing prior comorbidities were assumed to not have those conditions. Hospital characteristics were not imputed; therefore, for analyses that required construction of risk-adjusted comfort care rates or RSMRs, we excluded 18,867 patients cared for at 82 hospitals missing hospital characteristics. We ran 2 sets of models for risk-adjusted comfort care rates and RSMRs: the first adjusted only for patient characteristics, and the second adjusted for both patient and hospital characteristics. Results from the 2 models were similar, so we present only results from the latter. Variance inflation factors were all <2, indicating the collinearity between covariates was not an issue.
All statistical analyses were performed by using SAS version 9.4 (SAS Institute, Cary, NC). We tested for statistical significance by using 2-tailed tests and considered P values <.05 to be statistically significant.
RESULTS
Of the 272 hospitals included in our final study cohort, the observed median overall rate of early comfort care in this study was 1.9% (25th to 75th percentile: 0.9% to 4.0%); hospitals varied widely in unadjusted early comfort care rates (0.00% to 0.46% in the lowest quintile, and 4.60% to 39.91% in the highest quintile; Table 1).
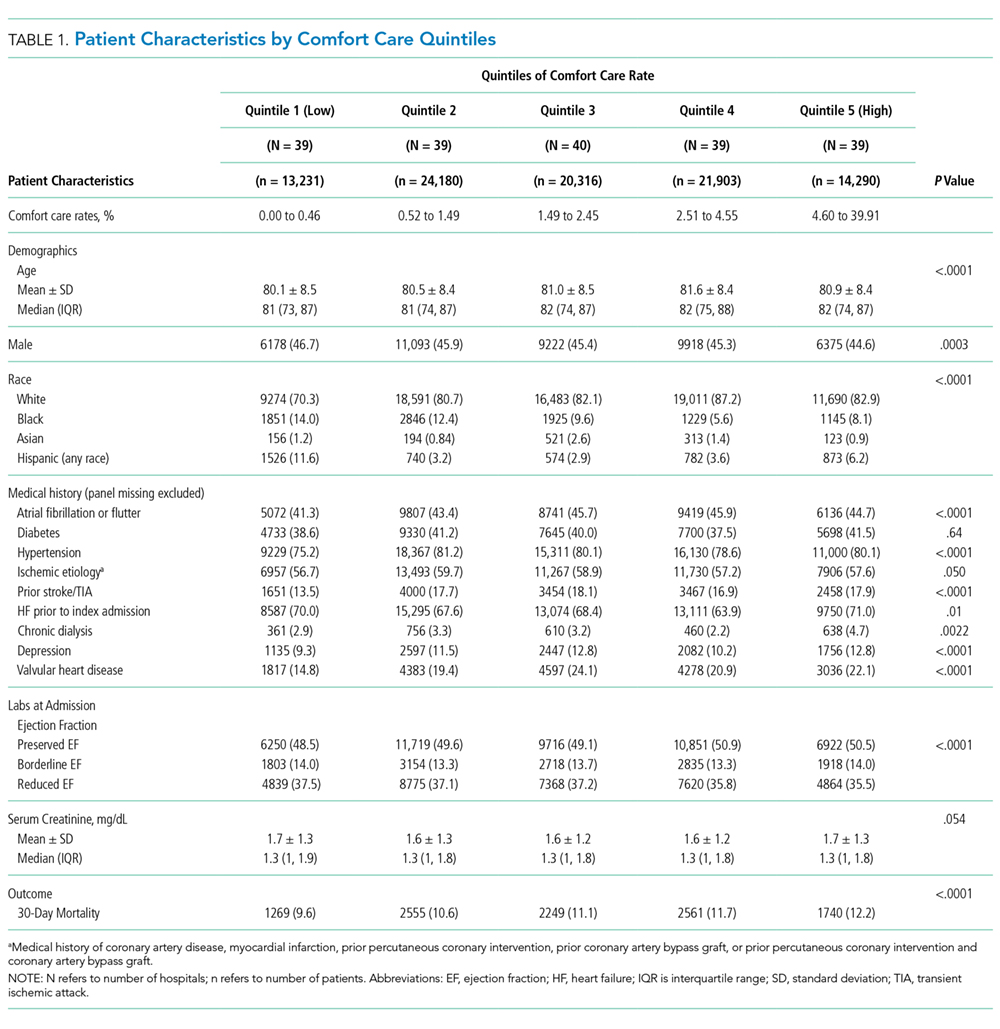
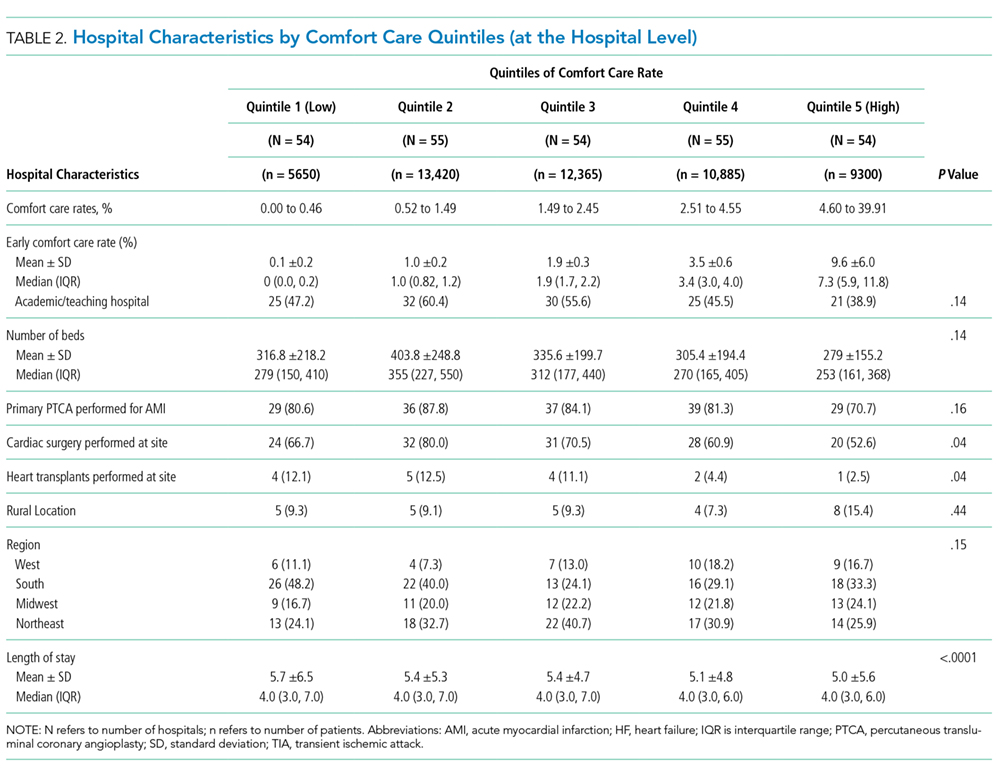
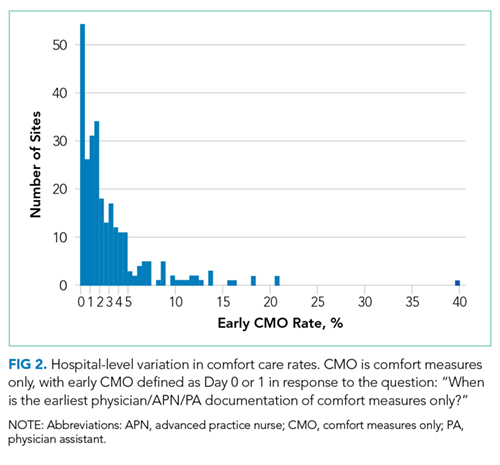
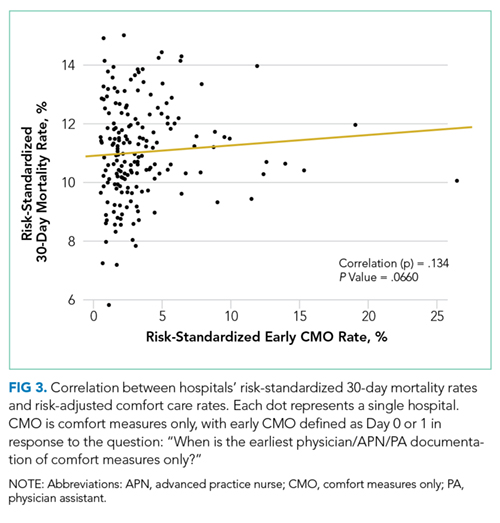
DISCUSSION
Among a national sample of US hospitals, we found wide variation in how frequently health care providers deliver comfort care within the first 2 days of admission for HF. A minority of hospitals reported no early comfort care on any patients throughout the 6-year study period, but hospitals in the highest quintile initiated early comfort care rates for at least 1 in 20 HF patients. Hospitals that were more likely to initiate early comfort care had a higher proportion of female and white patients and were less likely to have the capacity to deliver aggressive surgical interventions such as heart transplants. Hospital-level 30-day RSMRs were not correlated with rates of early comfort care.
While the appropriate rate of early comfort care for patients hospitalized with HF is unknown, given that the average hospital RSMR is approximately 12% for fee-for-service Medicare patients hospitalized with HF,12 it is surprising that some hospitals initiated early comfort care on none or very few of their HF patients. It is quite possible that many of these hospitals initiated comfort care for some of their patients after 48 hours of hospitalization. We were unable to estimate the average period of time patients received comfort care prior to dying, the degree to which this varies across hospitals or why it might vary, and whether the length of time between comfort care initiation and death is related to satisfaction with end-of-life care. Future research on these topics would help inform providers seeking to deliver better end-of-life care. In this study, we also were unable to estimate how often early comfort care was not initiated because patients had a good prognosis. However, prior studies have suggested low rates of comfort care or hospice referral even among patients at very high estimated mortality risk.4 It is also possible that providers and families had concerns about the ability to accurately prognosticate, although several models have been shown to perform acceptably for patients hospitalized with HF.13
We found that comfort care rates did not increase over time, even though use of hospice care doubled among Medicare beneficiaries between 2000 and 2012. By way of context, cancer—the second leading cause of death in the US—was responsible for 38% of hospice admissions in 2013, whereas heart disease (including but not limited to HF)—the leading cause of death— was responsible for 13% of hospice admissions.14 The 2013 American College of Cardiology Foundation and the American Heart Association guidelines for HF recommend consideration of hospice or palliative care for inpatient and transitional care.15 In future work, it would be important to better understand the drivers behind decisions around comfort care for patients hospitalized with HF.
With regards to the policy implications of our study, we found that on average, adjusting 30-day mortality rates for early comfort care was not associated with a change in hospital mortality rankings. For those hospitals with high comfort care rates, adjusting for comfort care did lower mortality rates, but the change was so small as to be clinically insignificant. CMS’ RSMR for HF excludes patients enrolled in hospice during the 12 months prior to index admission, including the first day of the index admission, acknowledging that death may not be an untoward outcome for such patients.16 Fee-for-service Medicare beneficiaries excluded for hospice enrollment comprised 1.29% of HF admissions from July 2012 to June 201516 and are likely a subset of early comfort care patients in our sample, both because of the inclusiveness of chart review (vs claims-based identification) and because we defined early comfort care as comfort care initiated on day 0 or 1 of hospitalization. Nevertheless, with our data we cannot assess to what degree our findings were due solely to hospice patients excluded from CMS’ current estimates.
Prior research has described the underuse of palliative care among patients with HF17 and the association of palliative care with better patient and family experiences at the end of life.18-20 We add to this literature by describing the epidemiology—prevalence, changes over time, and associated factors—of early comfort care for HF in a national sample of hospitals. This serves as a baseline for future work on end-of-life care among patients hospitalized for HF. Our findings also contribute to ongoing discussion about how best to risk-adjust mortality metrics used to assess hospital quality in pay-for-performance programs. Recent research on stroke and pneumonia based on California data suggests that not accounting for do-not-resuscitate (DNR) status biases hospital mortality rates.21,22 Earlier research examined the impact of adjusting hospital mortality rates for DNR for a broader range of conditions.23,24 We expand this line of inquiry by examining the hospital-level association of early comfort care with mortality rates for HF, utilizing a national, contemporary cohort of inpatient stays. In addition, while studies have found that DNR rates within the first 24 hours of admission are relatively high (median 15.8% for pneumonia; 13.3% for stroke),21,22 comfort care is distinct from DNR.
Our findings should be interpreted in the context of several potential limitations. First, we did not have any information about patient or family wishes regarding end-of-life care, or the exact timing of early comfort care (eg, day 0 or day 1). The initiation of comfort care usually follows conversations about end-of-life care involving a patient, his or her family, and the medical team. Thus, we do not know if low early comfort care rates represent the lack of such a conversation (and thus poor-quality care) or the desire by most patients not to initiate early comfort care (and thus high-quality care). This would be an important area for future research. Second, we included only patients admitted to hospitals that participate in GWTG-HF, a voluntary quality improvement initiative. This may limit the generalizability of our findings, but it is unclear how our sample might bias our findings. Hospitals engaged in quality improvement may be more likely to initiate early comfort care aligned with patients’ wishes; on the other hand, hospitals with advanced surgical capabilities are over-represented in our sample and these hospitals are less likely to initiate early comfort care. Third, we examined associations and cannot make conclusions about causality. Residual measured and unmeasured confounding may influence these findings.
In summary, we found that early comfort care rates for fee-for-service Medicare beneficiaries admitted for HF varies widely among hospitals, but median rates of early comfort care have not changed over time. On average, there was no correlation between hospital-level, 30-day, RSMRs and rates of early comfort care. This suggests that current efforts to lower mortality rates have not had unintended consequences for hospitals that institute early comfort care more commonly than their peers.
Acknowledgments
Dr. Chen and Ms. Cox take responsibility for the integrity of the data and the accuracy of the data analysis. Drs. Chen, Levine, and Hayward are responsible for the study concept and design. Drs. Chen and Fonarow acquired the data. Dr. Chen drafted the manuscript. Drs. Chen, Levin, Hayward, Cox, Fonarow, DeVore, Hernandez, Heidenreich, and Yancy revised the manuscript for important intellectual content. Drs. Chen, Hayward, Cox, and Schulte performed the statistical analysis. Drs. Chen and Fonarow obtained funding for the study. Drs. Hayward and Fonarow supervised the study. The authors thank Bailey Green, MPH, for the research assistance she provided. She was compensated for her work.
Disclosure
Dr. Fonarow reports research support from the National Institutes of Health, and consulting for Amgen, Janssen, Novartis, Medtronic, and St Jude Medical. Dr. DeVore reports research support from the American Heart Association, Amgen, and Novartis, and consulting for Amgen. The other authors have no relevant conflicts of interest. Dr. Chen was supported by a Career Development Grant Award (K08HS020671) from the Agency for Healthcare Research and Quality when the manuscript was being prepared. She currently receives support from the Department of Health and Human Services Office of the Assistant Secretary for Planning and Evaluation for her work there. She also receives support from the Blue Cross Blue Shield of Michigan Foundation’s Investigator Initiated Research Program, the Agency for Healthcare Research and Quality (R01 HS024698), and the National Institute on Aging (P01 AG019783). These funding sources had no role in the preparation, review, or approval of the manuscript. The GWTG-HF program is provided by the American Heart Association. GWTG-HF has been funded in the past through support from Amgen, Medtronic, GlaxoSmithKline, Ortho-McNeil, and the American Heart Association Pharmaceutical Roundtable. These sponsors had no role in the study design, data analysis or manuscript preparation and revision.
1. Centers for Medicare & Medicaid Services. Hospital Compare. https://www.medicare.gov/hospitalcompare/. Accessed on November 27, 2016.
2. Centers for Medicare & Medicaid Services. Hospital Value-based Purchasing. https://www.medicare.gov/hospitalcompare/data/hospital-vbp.html. Accessed August 30, 2017.
3. Medicare Payment Advisory Comission. Report to the Congress: Medicare payment policy. 2014. http://www.medpac.gov/docs/default-source/reports/mar14_entirereport.pdf. Accessed August 31, 2017.
4. Whellan DJ, Cox M, Hernandez AF, et al. Utilization of hospice and predicted mortality risk among older patients hospitalized with heart failure: findings from GWTG-HF. J Card Fail. 2012;18(6):471-477. PubMed
5. Hong Y, LaBresh KA. Overview of the American Heart Association “Get with the Guidelines” programs: coronary heart disease, stroke, and heart failure. Crit Pathw Cardiol. 2006;5(4):179-186. PubMed
6. LaBresh KA, Gliklich R, Liljestrand J, Peto R, Ellrodt AG. Using “get with the guidelines” to improve cardiovascular secondary prevention. Jt Comm J Qual Saf. 2003;29(10):539-550. PubMed
7. Hernandez AF, Fonarow GC, Liang L, et al. Sex and racial differences in the use of implantable cardioverter-defibrillators among patients hospitalized with heart failure. JAMA. 2007;298(13):1525-1532. PubMed
8. Get With The Guidelines-Heart Failure. HF Patient Management Tool, October 2016.
9. Eapen ZJ, Liang L, Fonarow GC, et al. Validated, electronic health record deployable prediction models for assessing patient risk of 30-day rehospitalization and mortality in older heart failure patients. JACC Heart Fail. 2013;1(3):245-251. PubMed
10. Peterson PN, Rumsfeld JS, Liang L, et al. A validated risk score for in-hospital mortality in patients with heart failure from the American Heart Association get with the guidelines program. Circ Cardiovasc Qual Outcomes. 2010;3(1):25-32. PubMed
11. Frequently Asked Questions (FAQs): Implementation and Maintenance of CMS Mortality Measures for AMI & HF. 2007. https://www.cms.gov/Medicare/Quality-Initiatives-Patient-Assessment-Instruments/HospitalQualityInits/downloads/HospitalMortalityAboutAMI_HF.pdf. Accessed August 30, 2017.
12. Suter LG, Li SX, Grady JN, et al. National patterns of risk-standardized mortality and readmission after hospitalization for acute myocardial infarction, heart failure, and pneumonia: update on publicly reported outcomes measures based on the 2013 release. J Gen Intern Med. 2014;29(10):1333-1340. PubMed
13. Lagu T, Pekow PS, Shieh MS, et al. Validation and comparison of seven mortality prediction models for hospitalized patients with acute decompensated heart failure. Circ Heart Fail. Aug 2016;9(8):e002912. PubMed
14. National Hospice and Palliative Care Organization. NHPCO’s facts and figures: hospice care in america. 2015. https://www.nhpco.org/sites/default/files/public/Statistics_Research/2015_Facts_Figures.pdf. Accessed August 30, 2017.
15. Yancy CW, Jessup M, Bozkurt B, et al. 2013 ACCF/AHA guideline for the management of heart failure: executive summary: a report of the American College of Cardiology Foundation/American Heart Association Task Force on practice guidelines. Circulation. 2013;128(16):1810-1852. PubMed
16. Centers for Medicare & Medicaid Services. 2016 Condition-Specific Measures Updates and Specifications Report Hospital-Level 30-Day Risk-Standardized Mortality Measures. https://www.qualitynet.org/dcs/ContentServer?c=Page&pagename=QnetPublic%2FPage%2FQnetTier3&cid=1228774398696. Accessed August 30, 2017.
17. Bakitas M, Macmartin M, Trzepkowski K, et al. Palliative care consultations for heart failure patients: how many, when, and why? J Card Fail. 2013;19(3):193-201. PubMed
18. Wachterman MW, Pilver C, Smith D, Ersek M, Lipsitz SR, Keating NL. Quality of End-of-Life Care Provided to Patients With Different Serious Illnesses. JAMA Intern Med. 2016;176(8):1095-1102. PubMed
19. Wright AA, Zhang B, Ray A, et al. Associations between end-of-life discussions, patient mental health, medical care near death, and caregiver bereavement adjustment. JAMA. 2008;300(14):1665-1673. PubMed
20. Rogers JG, Patel CB, Mentz RJ, et al. Palliative care in heart failure: results of a randomized, controlled clinical trial. J Card Fail. 2016;22(11):940. PubMed
21. Kelly AG, Zahuranec DB, Holloway RG, Morgenstern LB, Burke JF. Variation in do-not-resuscitate orders for patients with ischemic stroke: implications for national hospital comparisons. Stroke. 2014;45(3):822-827. PubMed
22. Walkey AJ, Weinberg J, Wiener RS, Cooke CR, Lindenauer PK. Association of Do-Not-Resuscitate Orders and Hospital Mortality Rate Among Patients With Pneumonia. JAMA Intern Med. 2016;176(1):97-104. PubMed
23. Bardach N, Zhao S, Pantilat S, Johnston SC. Adjustment for do-not-resuscitate orders reverses the apparent in-hospital mortality advantage for minorities. Am J Med. 2005;118(4):400-408. PubMed
24. Tabak YP, Johannes RS, Silber JH, Kurtz SG. Should Do-Not-Resuscitate status be included as a mortality risk adjustor? The impact of DNR variations on performance reporting. Med Care. 2005;43(7):658-666. PubMed
In an effort to improve the quality of care delivered to heart failure (HF) patients, the Centers for Medicare & Medicaid Services (CMS) publish hospitals’ 30-day risk-standardized mortality rates (RSMRs) for HF.1 These mortality rates are also used by CMS to determine the financial penalties and bonuses that hospitals receive as part of the national Hospital Value-based Purchasing program.2 Whether or not these efforts effectively direct patients towards high-quality providers or motivate hospitals to provide better care, few would disagree with the overarching goal of decreasing the number of patients who die from HF.
However, for some patients with chronic disease at the end of life, goals of care may change. The quality of days lived may become more important than the quantity of days lived. As a consequence, high-quality care for some patients at the end of life is associated with withdrawing life-sustaining or life-extending therapies. Over time, this therapeutic perspective has become more common, with use of hospice care doubling from 23% to 47% between 2000 and 2012 among Medicare beneficiaries who died.3 For a national cohort of older patients admitted with HF—not just those patients who died in that same year—hospitals’ rates of referral to hospice are considerably lower, averaging 2.9% in 2010 in a national study.4 Nevertheless, it is possible that hospitals that more faithfully follow their dying patients’ wishes and withdraw life-prolonging interventions and provide comfort-focused care at the end of life might be unfairly penalized if such efforts resulted in higher mortality rates than other hospitals.
Therefore, we used Medicare data linked to a national HF registry with information about end-of-life care, to address 3 questions: (1) How much do hospitals vary in their rates of early comfort care and how has this changed over time; (2) What hospital and patient factors are associated with higher early comfort care rates; and (3) Is there a correlation between 30-day risk-adjusted mortality rates for HF with hospital rates of early comfort care?
METHODS
Data Sources
We used data from the American Heart Association’s Get With The Guidelines-Heart Failure (GWTG-HF) registry. GWTG-HF is a voluntary, inpatient, quality improvement registry5-7 that uses web-based tools and standard questionnaires to collect data on patients with HF admitted to participating hospitals nationwide. The data include information from admission (eg, sociodemographic characteristics, symptoms, medical history, and initial laboratory and test results), the inpatient stay (eg, therapies), and discharge (eg, discharge destination, whether and when comfort care was initiated). We linked the GWTG-HF registry data to Medicare claims data in order to obtain information about Medicare eligibility and patient comorbidities. Additionally, we used data from the American Hospital Association (2008) for hospital characteristics. Quintiles Real-World & Late Phase Research (Cambridge, MA) serves as the data coordinating center for GWTG-HF and the Duke Clinical Research Institute (Durham, NC) serves as the statistical analytic center. GWTG-HF participating sites have a waiver of informed consent because the data are de-identified and primarily used for quality improvement. All analyses performed on this data have been approved by the Duke Medical Center Institutional Review Board.
Study Population
Study Outcomes
Our outcome of interest was the correlation between a hospital’s rate of initiating early CMO for admitted HF patients and a hospital’s 30-day RSMR for HF. The GWTG-HF questionnaire8 asks “When is the earliest physician/advanced practice nurse/physician assistant documentation of comfort measures only?” and permits 4 responses: day 0 or 1, day 2 or after, timing unclear, or not documented/unable to determine. We defined early CMO as CMO on day 0 or 1, and late/no CMO as any other response. We chose to examine early comfort care because many hospitalized patients transition to comfort care before they die if the death is in any way predictable. Thus, if comfort care is measured at any time during the hospitalization, hospitals that have high mortality rates are likely to have high comfort care rates. Therefore, we chose to use the more precise measure of early comfort care. We created hospital-level, risk-standardized early comfort care rates using the same risk-adjustment model used for RSMRs but with the outcome of early comfort care instead of mortality.9,10
RSMRs were calculated using a validated GWTG-HF 30-day risk-standardized mortality model9 with additional variables identified from other GWTG-HF analyses.10 The 30 days are measured as the 30 days after the index admission date.
Statistical Analyses
We described trends in early comfort care rates over time, from February 17, 2008, to February 17, 2014, using the Cochran-Armitage test for trend. We then grouped hospitals into quintiles based on their unadjusted early comfort care rates. We described patient and hospital characteristics for each quintile, using χ2 tests to test for differences across quintiles for categorical variables and Wilcoxon rank sum tests to assess for differences across quintiles for continuous variables. We then examined the Spearman’s rank correlation between hospitals’ RSMR and risk-adjusted comfort care rates. Finally, we compared hospital-level RSMRs before and after adjusting for early comfort care.
We performed risk-adjustment for these last 2 analyses as follows. For each patient, covariates were obtained from the GWTG-HF registry. Clinical data captured for the index admission were utilized in the risk-adjustment model (for both RSMRs and risk-adjusted comfort care rates). Included covariates were as follows: age (per 10 years); race (black vs non-black); systolic blood pressure at admission ≤170 (per 10 mm Hg); respiratory rate (per 5 respirations/min); heart rate ≤105 (per 10 beats/min); weight ≤100 (per 5 kg); weight >100 (per 5 kg); blood urea nitrogen (per 10 mg/dl); brain natriuretic peptide ≤2000 (per 500 pg/ml); hemoglobin 10-14 (per 1 g/dl); troponin abnormal (vs normal); creatinine ≤1 (per 1 mg/dl); sodium 130-140 (per 5 mEq/l); and chronic obstructive pulmonary disease or asthma.
Hierarchical logistic regression modeling was used to calculate the hospital-specific RSMR. A predicted/expected ratio similar to an observed/expected (O/E) ratio was calculated using the following modifications: (1) instead of the observed (crude) number of deaths, the numerator is the number of deaths predicted by the hierarchical model among a hospital’s patients given the patients’ risk factors and the hospital-specific effect; (2) the denominator is the expected number of deaths among the hospital’s patients given the patients’ risk factors and the average of all hospital-specific effects overall; and (3) the ratio of the numerator and denominator are then multiplied by the observed overall mortality rate (same as O/E). This calculation is the method used by CMS to derive RSMRs.11 Multiple imputation was used to handle missing data in the models; 25 imputed datasets using the fully conditional specification method were created. Patients with missing prior comorbidities were assumed to not have those conditions. Hospital characteristics were not imputed; therefore, for analyses that required construction of risk-adjusted comfort care rates or RSMRs, we excluded 18,867 patients cared for at 82 hospitals missing hospital characteristics. We ran 2 sets of models for risk-adjusted comfort care rates and RSMRs: the first adjusted only for patient characteristics, and the second adjusted for both patient and hospital characteristics. Results from the 2 models were similar, so we present only results from the latter. Variance inflation factors were all <2, indicating the collinearity between covariates was not an issue.
All statistical analyses were performed by using SAS version 9.4 (SAS Institute, Cary, NC). We tested for statistical significance by using 2-tailed tests and considered P values <.05 to be statistically significant.
RESULTS
Of the 272 hospitals included in our final study cohort, the observed median overall rate of early comfort care in this study was 1.9% (25th to 75th percentile: 0.9% to 4.0%); hospitals varied widely in unadjusted early comfort care rates (0.00% to 0.46% in the lowest quintile, and 4.60% to 39.91% in the highest quintile; Table 1).
DISCUSSION
Among a national sample of US hospitals, we found wide variation in how frequently health care providers deliver comfort care within the first 2 days of admission for HF. A minority of hospitals reported no early comfort care on any patients throughout the 6-year study period, but hospitals in the highest quintile initiated early comfort care rates for at least 1 in 20 HF patients. Hospitals that were more likely to initiate early comfort care had a higher proportion of female and white patients and were less likely to have the capacity to deliver aggressive surgical interventions such as heart transplants. Hospital-level 30-day RSMRs were not correlated with rates of early comfort care.
While the appropriate rate of early comfort care for patients hospitalized with HF is unknown, given that the average hospital RSMR is approximately 12% for fee-for-service Medicare patients hospitalized with HF,12 it is surprising that some hospitals initiated early comfort care on none or very few of their HF patients. It is quite possible that many of these hospitals initiated comfort care for some of their patients after 48 hours of hospitalization. We were unable to estimate the average period of time patients received comfort care prior to dying, the degree to which this varies across hospitals or why it might vary, and whether the length of time between comfort care initiation and death is related to satisfaction with end-of-life care. Future research on these topics would help inform providers seeking to deliver better end-of-life care. In this study, we also were unable to estimate how often early comfort care was not initiated because patients had a good prognosis. However, prior studies have suggested low rates of comfort care or hospice referral even among patients at very high estimated mortality risk.4 It is also possible that providers and families had concerns about the ability to accurately prognosticate, although several models have been shown to perform acceptably for patients hospitalized with HF.13
We found that comfort care rates did not increase over time, even though use of hospice care doubled among Medicare beneficiaries between 2000 and 2012. By way of context, cancer—the second leading cause of death in the US—was responsible for 38% of hospice admissions in 2013, whereas heart disease (including but not limited to HF)—the leading cause of death— was responsible for 13% of hospice admissions.14 The 2013 American College of Cardiology Foundation and the American Heart Association guidelines for HF recommend consideration of hospice or palliative care for inpatient and transitional care.15 In future work, it would be important to better understand the drivers behind decisions around comfort care for patients hospitalized with HF.
With regards to the policy implications of our study, we found that on average, adjusting 30-day mortality rates for early comfort care was not associated with a change in hospital mortality rankings. For those hospitals with high comfort care rates, adjusting for comfort care did lower mortality rates, but the change was so small as to be clinically insignificant. CMS’ RSMR for HF excludes patients enrolled in hospice during the 12 months prior to index admission, including the first day of the index admission, acknowledging that death may not be an untoward outcome for such patients.16 Fee-for-service Medicare beneficiaries excluded for hospice enrollment comprised 1.29% of HF admissions from July 2012 to June 201516 and are likely a subset of early comfort care patients in our sample, both because of the inclusiveness of chart review (vs claims-based identification) and because we defined early comfort care as comfort care initiated on day 0 or 1 of hospitalization. Nevertheless, with our data we cannot assess to what degree our findings were due solely to hospice patients excluded from CMS’ current estimates.
Prior research has described the underuse of palliative care among patients with HF17 and the association of palliative care with better patient and family experiences at the end of life.18-20 We add to this literature by describing the epidemiology—prevalence, changes over time, and associated factors—of early comfort care for HF in a national sample of hospitals. This serves as a baseline for future work on end-of-life care among patients hospitalized for HF. Our findings also contribute to ongoing discussion about how best to risk-adjust mortality metrics used to assess hospital quality in pay-for-performance programs. Recent research on stroke and pneumonia based on California data suggests that not accounting for do-not-resuscitate (DNR) status biases hospital mortality rates.21,22 Earlier research examined the impact of adjusting hospital mortality rates for DNR for a broader range of conditions.23,24 We expand this line of inquiry by examining the hospital-level association of early comfort care with mortality rates for HF, utilizing a national, contemporary cohort of inpatient stays. In addition, while studies have found that DNR rates within the first 24 hours of admission are relatively high (median 15.8% for pneumonia; 13.3% for stroke),21,22 comfort care is distinct from DNR.
Our findings should be interpreted in the context of several potential limitations. First, we did not have any information about patient or family wishes regarding end-of-life care, or the exact timing of early comfort care (eg, day 0 or day 1). The initiation of comfort care usually follows conversations about end-of-life care involving a patient, his or her family, and the medical team. Thus, we do not know if low early comfort care rates represent the lack of such a conversation (and thus poor-quality care) or the desire by most patients not to initiate early comfort care (and thus high-quality care). This would be an important area for future research. Second, we included only patients admitted to hospitals that participate in GWTG-HF, a voluntary quality improvement initiative. This may limit the generalizability of our findings, but it is unclear how our sample might bias our findings. Hospitals engaged in quality improvement may be more likely to initiate early comfort care aligned with patients’ wishes; on the other hand, hospitals with advanced surgical capabilities are over-represented in our sample and these hospitals are less likely to initiate early comfort care. Third, we examined associations and cannot make conclusions about causality. Residual measured and unmeasured confounding may influence these findings.
In summary, we found that early comfort care rates for fee-for-service Medicare beneficiaries admitted for HF varies widely among hospitals, but median rates of early comfort care have not changed over time. On average, there was no correlation between hospital-level, 30-day, RSMRs and rates of early comfort care. This suggests that current efforts to lower mortality rates have not had unintended consequences for hospitals that institute early comfort care more commonly than their peers.
Acknowledgments
Dr. Chen and Ms. Cox take responsibility for the integrity of the data and the accuracy of the data analysis. Drs. Chen, Levine, and Hayward are responsible for the study concept and design. Drs. Chen and Fonarow acquired the data. Dr. Chen drafted the manuscript. Drs. Chen, Levin, Hayward, Cox, Fonarow, DeVore, Hernandez, Heidenreich, and Yancy revised the manuscript for important intellectual content. Drs. Chen, Hayward, Cox, and Schulte performed the statistical analysis. Drs. Chen and Fonarow obtained funding for the study. Drs. Hayward and Fonarow supervised the study. The authors thank Bailey Green, MPH, for the research assistance she provided. She was compensated for her work.
Disclosure
Dr. Fonarow reports research support from the National Institutes of Health, and consulting for Amgen, Janssen, Novartis, Medtronic, and St Jude Medical. Dr. DeVore reports research support from the American Heart Association, Amgen, and Novartis, and consulting for Amgen. The other authors have no relevant conflicts of interest. Dr. Chen was supported by a Career Development Grant Award (K08HS020671) from the Agency for Healthcare Research and Quality when the manuscript was being prepared. She currently receives support from the Department of Health and Human Services Office of the Assistant Secretary for Planning and Evaluation for her work there. She also receives support from the Blue Cross Blue Shield of Michigan Foundation’s Investigator Initiated Research Program, the Agency for Healthcare Research and Quality (R01 HS024698), and the National Institute on Aging (P01 AG019783). These funding sources had no role in the preparation, review, or approval of the manuscript. The GWTG-HF program is provided by the American Heart Association. GWTG-HF has been funded in the past through support from Amgen, Medtronic, GlaxoSmithKline, Ortho-McNeil, and the American Heart Association Pharmaceutical Roundtable. These sponsors had no role in the study design, data analysis or manuscript preparation and revision.
1. Centers for Medicare & Medicaid Services. Hospital Compare. https://www.medicare.gov/hospitalcompare/. Accessed on November 27, 2016.
2. Centers for Medicare & Medicaid Services. Hospital Value-based Purchasing. https://www.medicare.gov/hospitalcompare/data/hospital-vbp.html. Accessed August 30, 2017.
3. Medicare Payment Advisory Comission. Report to the Congress: Medicare payment policy. 2014. http://www.medpac.gov/docs/default-source/reports/mar14_entirereport.pdf. Accessed August 31, 2017.
4. Whellan DJ, Cox M, Hernandez AF, et al. Utilization of hospice and predicted mortality risk among older patients hospitalized with heart failure: findings from GWTG-HF. J Card Fail. 2012;18(6):471-477. PubMed
5. Hong Y, LaBresh KA. Overview of the American Heart Association “Get with the Guidelines” programs: coronary heart disease, stroke, and heart failure. Crit Pathw Cardiol. 2006;5(4):179-186. PubMed
6. LaBresh KA, Gliklich R, Liljestrand J, Peto R, Ellrodt AG. Using “get with the guidelines” to improve cardiovascular secondary prevention. Jt Comm J Qual Saf. 2003;29(10):539-550. PubMed
7. Hernandez AF, Fonarow GC, Liang L, et al. Sex and racial differences in the use of implantable cardioverter-defibrillators among patients hospitalized with heart failure. JAMA. 2007;298(13):1525-1532. PubMed
8. Get With The Guidelines-Heart Failure. HF Patient Management Tool, October 2016.
9. Eapen ZJ, Liang L, Fonarow GC, et al. Validated, electronic health record deployable prediction models for assessing patient risk of 30-day rehospitalization and mortality in older heart failure patients. JACC Heart Fail. 2013;1(3):245-251. PubMed
10. Peterson PN, Rumsfeld JS, Liang L, et al. A validated risk score for in-hospital mortality in patients with heart failure from the American Heart Association get with the guidelines program. Circ Cardiovasc Qual Outcomes. 2010;3(1):25-32. PubMed
11. Frequently Asked Questions (FAQs): Implementation and Maintenance of CMS Mortality Measures for AMI & HF. 2007. https://www.cms.gov/Medicare/Quality-Initiatives-Patient-Assessment-Instruments/HospitalQualityInits/downloads/HospitalMortalityAboutAMI_HF.pdf. Accessed August 30, 2017.
12. Suter LG, Li SX, Grady JN, et al. National patterns of risk-standardized mortality and readmission after hospitalization for acute myocardial infarction, heart failure, and pneumonia: update on publicly reported outcomes measures based on the 2013 release. J Gen Intern Med. 2014;29(10):1333-1340. PubMed
13. Lagu T, Pekow PS, Shieh MS, et al. Validation and comparison of seven mortality prediction models for hospitalized patients with acute decompensated heart failure. Circ Heart Fail. Aug 2016;9(8):e002912. PubMed
14. National Hospice and Palliative Care Organization. NHPCO’s facts and figures: hospice care in america. 2015. https://www.nhpco.org/sites/default/files/public/Statistics_Research/2015_Facts_Figures.pdf. Accessed August 30, 2017.
15. Yancy CW, Jessup M, Bozkurt B, et al. 2013 ACCF/AHA guideline for the management of heart failure: executive summary: a report of the American College of Cardiology Foundation/American Heart Association Task Force on practice guidelines. Circulation. 2013;128(16):1810-1852. PubMed
16. Centers for Medicare & Medicaid Services. 2016 Condition-Specific Measures Updates and Specifications Report Hospital-Level 30-Day Risk-Standardized Mortality Measures. https://www.qualitynet.org/dcs/ContentServer?c=Page&pagename=QnetPublic%2FPage%2FQnetTier3&cid=1228774398696. Accessed August 30, 2017.
17. Bakitas M, Macmartin M, Trzepkowski K, et al. Palliative care consultations for heart failure patients: how many, when, and why? J Card Fail. 2013;19(3):193-201. PubMed
18. Wachterman MW, Pilver C, Smith D, Ersek M, Lipsitz SR, Keating NL. Quality of End-of-Life Care Provided to Patients With Different Serious Illnesses. JAMA Intern Med. 2016;176(8):1095-1102. PubMed
19. Wright AA, Zhang B, Ray A, et al. Associations between end-of-life discussions, patient mental health, medical care near death, and caregiver bereavement adjustment. JAMA. 2008;300(14):1665-1673. PubMed
20. Rogers JG, Patel CB, Mentz RJ, et al. Palliative care in heart failure: results of a randomized, controlled clinical trial. J Card Fail. 2016;22(11):940. PubMed
21. Kelly AG, Zahuranec DB, Holloway RG, Morgenstern LB, Burke JF. Variation in do-not-resuscitate orders for patients with ischemic stroke: implications for national hospital comparisons. Stroke. 2014;45(3):822-827. PubMed
22. Walkey AJ, Weinberg J, Wiener RS, Cooke CR, Lindenauer PK. Association of Do-Not-Resuscitate Orders and Hospital Mortality Rate Among Patients With Pneumonia. JAMA Intern Med. 2016;176(1):97-104. PubMed
23. Bardach N, Zhao S, Pantilat S, Johnston SC. Adjustment for do-not-resuscitate orders reverses the apparent in-hospital mortality advantage for minorities. Am J Med. 2005;118(4):400-408. PubMed
24. Tabak YP, Johannes RS, Silber JH, Kurtz SG. Should Do-Not-Resuscitate status be included as a mortality risk adjustor? The impact of DNR variations on performance reporting. Med Care. 2005;43(7):658-666. PubMed
© 2018 Society of Hospital Medicine
Humeral Bone Loss in Revision Shoulder Arthroplasty
ABSTRACT
Revision shoulder arthroplasty is becoming more prevalent as the rate of primary shoulder arthroplasty in the US continues to increase. The management of proximal humeral bone loss in the revision setting presents a difficult problem without a clear solution. Different preoperative diagnoses often lead to distinctly different patterns of bone loss. Successful management of these cases requires a clear understanding of the normal anatomy of the proximal humerus, as well as structural limitations imposed by significant bone loss and the effect this loss has on component fixation. Our preferred technique differs depending on the pattern of bone loss encountered. The use of allograft-prosthetic composites, the cement-within-cement technique, and combinations of these strategies comprise the mainstay of our treatment algorithm. This article focuses on indications, surgical techniques, and some of the published outcomes using these strategies in the management of proximal humeral bone loss.
Continue to: The demand for shoulder arthroplasty...
The demand for shoulder arthroplasty (SA) has increased significantly over the past decade, with a 200% increase witnessed from 2011 to 2015.1 SA performed in patients younger than 55 years is expected to increase 333% between 2011 to 2030.2 With increasing rates of SA being performed in younger patient populations, rates of revision SA also can be expected to climb. Revision to reverse shoulder arthroplasty (RSA) has arisen as a viable option in these patients, and multiple studies demonstrate excellent outcomes that can be obtained with RSA.3-11
Despite significant improvements obtained in revision SA since the mainstream acceptance of RSA, bone loss remains a problematic issue. Loss of humeral bone stock, in particular, can be a challenging problem to solve with multiple clinical implications. Biomechanical studies have demonstrated that if bone loss is left unaddressed, increased bending and torsional forces on the prosthesis result, which ultimately contribute to increased micromotion and eventual component failure.12 In addition, existing challenges are associated with the lack of attachment sites for both multiple muscles and tendons. Also, there is a loss of the normal lateralized pull of the deltoid, which results in a decreased amount of force generated by this muscle.13,14 Ultimately, the increased loss of bone can lead to a devastating situation where there is not enough bone to provide adequate fixation while maintaining the appropriate humeral length necessary to achieve stability of the articulation, which will inevitably lead to instability.4,15 Therefore, techniques are needed to address proximal humeral bone loss while maintaining as much native humeral bone as possible.
PROXIMAL HUMERUS: ANATOMICAL CONSIDERATIONS
The anatomy of the proximal humerus has been studied in great detail and reported in a number of different studies.16-23 The average humeral head thickness (24 mm in men and 19 mm in women) and offset relative to the humeral shaft (2.1 mm posterior and 6.6 mm medial) act to tension the rotator cuff musculature appropriately and contribute to a wrapping effect that allows the deltoid to function more effectively.13,14 Knowledge regarding the rotator cuff footprint has advanced over the past 10 years, specifically with regard to the supraspinatus and infraspinatus.24 The current belief is that the supraspinatus has a triangular insertion onto the most anterior aspect of the greater tuberosity, with a maximum medial-to-lateral length of 6.9 mm and a maximum anterior-to-posterior width of 12.6 mm. The infraspinatus insertion has a trapezoidal insertion, with a maximum medial-to-lateral length of 10.2 mm and anterior-to-posterior width of 32.7 mm. The subscapularis, by far the largest of all the rotator cuff muscles, has a complex geometry with regard to its insertion on the lesser tuberosity, with 4 different insertion points and an overall lateral footprint measuring 37.6 mm and a medial footprint measuring 40.7 mm.25 Finally, the teres minor, with the smallest volume of all the rotator cuff muscles, inserts immediately inferior to the infraspinatus along the inferior facet of the greater tuberosity.26
Aside from the rotator cuff, there are various other muscles and tendons that insert about the proximal humerus and are essential for normal function. The deltoid, which inserts at a point approximately 6 cm from the greater tuberosity along the length of the humerus, with an insertion length between 5 cm to 7 cm,13,27 is the primary mover of the shoulder and essential for proper function after RSA.28,29 The pectoralis major tendon, which begins inserting at a point approximately 5.6 cm from the humeral head and spans a distance of 7.7 cm along the length of the humerus,30-32 is important not only for function but as an anatomical landmark in reconstruction. Lastly, the latissimus dorsi and teres major, which share a role in extension, adduction, and internal rotation of the glenohumeral joint, insert along the floor and medial lip of the intertubercular groove of the humerus, respectively.33,34 In addition to their role in tendon transfer procedures because of treating irreparable posterosuperior cuff and subscapularis tears,35,36 it has been suggested that these tendons may play some role in glenohumeral joint stability.37
In addition to the loss of muscular attachments, the absence of proximal humeral bone stock, in and of itself, can have deleterious effects on fixation of the humeral component. RSA is a semiconstrained device, which results in increased transmission of forces to the interface between the humeral implant and its surrounding structures, including cement (when present) and the bone itself. When there is the absence of significant amounts of bone, the remaining bone must now account for an even higher proportion of these forces. A previous biomechanical study showed that cemented humeral stems demonstrated significantly increased micromotion in the presence of proximal humeral bone loss, particularly when a modular humeral component was used.12
Continue to: TYPES OF BONE LOSS
TYPES OF BONE LOSS
There are a variety of different etiologies of proximal humeral bone loss that result in distinctly different clinical presentations. These can be fairly mild, as is the case of isolated resorption of the greater tuberosity in a non-united proximal humerus fracture (Figure 1). Alternatively, they can be severe, as seen in a grossly loose cemented long-stemmed component that is freely mobile, creating a windshield-wiper effect throughout the length of the humerus (Figure 2). This can be somewhat deceiving, however, as the amount of bone loss, as well as the pathophysiologic process that led to the bone loss, are important factors to determine ideal reconstructive methods. In the case of a failed open reduction internal fixation, where the tuberosity has failed to unite or has been resected, there is much less of a biologic response in comparison with implant loosening associated with osteolysis. This latter condition will be associated with a much more destructive inflammatory response resulting in poor tissue quality and often dramatic thinning of the cortex. If one simply measured the distance from the most proximal remaining bone stock to the area where the greater tuberosity should be, a loose stem with subsidence and ballooning of the cortices may appear to have a similar amount of bone loss as a failed hemiarthroplasty for fracture with a well-fixed stem. However, intraoperatively, one will find that the bone that appeared to be present radiographically in the case of the loose stem is of such poor quality that it cannot reasonably provide any beneficial fixation. In light of this, different treatment modalities are recommended for different types of bone loss, and the revision surgeon must be able to anticipate this and possess a full armamentarium of options to treat these challenging cases successfully.

INDICATIONS
Our technique to manage proximal humeral bone loss is dependent on both the quantity of bone loss, which can be measured radiographically, as well as the anticipated inflammatory response described above. As both the destructive process and the amount of bone loss increase, the importance of more advanced reconstructive procedures that will sustain implant security and soft-tissue management becomes apparent. In the least destructive cases with <5 cm of bone loss, successful revision can typically be accomplished with stem removal and placement of a new monoblock humeral stem. In cases where more advanced destructive pathology is present, and bone loss is >5 cm, an allograft-prosthetic composite (APC) is typically used. In both scenarios, if the stem being revised is cemented and the cement mantle remains intact, and of reasonable length, consideration is given to the cement-within-cement technique. Finally, in the most destructive cases where bone loss exceeds 10 cm and a large biological response is anticipated (eg, periprosthetic fractures with humeral loosening), the use of a longer diaphyseal-incorporating APC is often necessary. This prosthetic composite can be combined with a cement-within-cement technique as well.

It is important to comment on the implications of using modular stems in this setting. With advanced bone loss, a situation is often encountered where the newly implanted stem geometry and working length may be insufficient to acquire adequate rotational stability. In this setting, if a modular junction is positioned close to the stem and cement/bone interface, it will be exposed to very high stress concentrations which can lead to component fracture38 as well as taper corrosion, also referred to as trunnionosis. This latter phenomenon, which has been well studied in the total hip arthroplasty literature with the use of modular components,39 is especially relevant given the high torsional loads imparted at the modular junction. Ultimately, high torsional loads lead to micromotion and electrochemical ion release via degradation of the passivation layer, initiating the process of mechanically assisted crevice corrosion.40 For these reasons, when a modular stem must be used in the presence of mild to moderate bone loss, using a proximal humeral allograft to protect the junction or to provide additional fixation may be implemented with a lower threshold than when using a monoblock stem.
SURGICAL TECHNIQUE: ALLOGRAFT-PROSTHETIC COMPOSITES
A standard deltopectoral approach is used, taking care to preserve all viable muscular attachments to the proximal humerus. After removal of the prosthetic humeral head, the decision to proceed with removal of the stem at this juncture is based on several factors. If the remaining proximal humeral bone is so compromised that it might not be able to withstand the forces exerted upon it during retraction for glenoid exposure, the component is left in place. Additionally, if there is consideration that the glenoid-sided bone loss may be so severe that a glenoid baseplate cannot be implanted, and the stem remains well fixed, it is retained so that it can be converted to a hemiarthroplasty.
If neither of the above issues is present, the humeral stem is removed. If a well-fixed press-fit stem is in place, it is typically removed using a combination of burrs and osteotomes to disrupt the bone-implant interface, and the stem is then carefully removed using an impactor and mallet. If a cemented stem is present, the stem is removed in a similar manner, and the cement mantle is left in place if stable, in anticipation of a cement-within-cement technique. If the mantle is disrupted, standard cement removal instruments are used to remove all cement from the canal meticulously.
Continue to: Management of the glenoid...
Management of the glenoid can have significant implications with regard to the humerus. Most notably, the size of the glenosphere has direct implications on the fixation of the humeral component. Use of larger diameter glenospheres result in increased contact area between the glenosphere and humerosocket, adding constraint to the articulation and further increasing the stresses at the implant-bone interface. As such, the use of larger glenospheres to prevent instability must be balanced with the resulting implications on humeral component fixation, especially in cases of severe bone loss.

After implanting the appropriate glenosphere, attention is then turned back to the humerus. Trial implants are sequentially used to obtain adequate humeral length and stability. Once this is accomplished, the amount of humeral bone loss is quantified by measuring the distance from the superior aspect of the medial humeral tray to the medial humeral shaft. If this number is >5 cm (Figure 3), the decision is made to proceed with an APC. The allograft humeral head is cut, cancellous bone is removed, and a step-cut is performed, with the medial portion of the allograft measuring the same length as that of bone loss and the lateral plate extending an additional several centimeters distally (Figure 4). Additional soft tissue is removed from the allograft, leaving the subscapularis stump intact for later repair with the patient’s native tissue. The allograft is secured to the patient’s proximal humerus using multiple cerclage wires, and the humeral stem is cemented into place. The final construct is shown in Figure 5.

ADDITIONAL CONSIDERATIONS: CASES OF ADVANCED BONE LOSS
In cases of advanced humeral bone loss, as is often seen when revising loose humeral stems, larger allografts that span a significant length of the diaphysis are often required. This type of bone loss has implications with regard to how the deltoid insertion is managed. Interestingly, even in situations when the vast majority of the remaining diaphysis consists of ectatic egg-shell bone, the deltoid tuberosity remains of fairly substantial quality due to the continued pull of the muscular insertion on this area. This fragment is isolated, carefully mobilized, and subsequently repaired back on top of the allograft using cables.

POSTOPERATIVE CARE
Patients are kept in a shoulder immobilizer for 6 weeks after surgery to facilitate allograft incorporation and subscapularis tendon healing. During this time, pendulum exercises are initiated. Active assisted range of motion (ROM) exercises begin after 6 weeks, consisting of supine forward elevation. A sling is given to be used in public. Light strengthening exercises begin at 3 months postoperatively.
DISCUSSION
In cases of mild to moderate proximal humeral bone loss, RSA using a long-stem humeral component without allograft augmentation is a viable option. Budge and colleagues38 demonstrated excellent results in a population of 15 patients with an average of 38 mm of proximal humeral bone loss without use of allografts. Interestingly, they noted 1 case of component fracture in a modular prosthesis and therefore concluded that monoblock humeral stems should be used in the absence of allograft augmentation.
Continue to: In more advanced cases of bone loss...
In more advanced cases of bone loss, our data shows that use of APCs can result in equally satisfactory results. In a series of 25 patients with an average bone loss of 54 mm, patients were able to achieve statistically significant improvements in pain, ROM, and function with high rates of allograft incorporation.9 Overall, a low rate of complications was noted, including 1 infection. This finding is consistent with an additional study looking specifically at factors associated with infection in revision SA, which found that the use of allografts was not associated with increased risk of infection.41
As stated previously, the size of allograft needed for the APC construct is related to the distinct pathology encountered. In our experience, we have noted that well-fixed stems can be treated with short metaphyseal APCs in 85% of cases. On the other hand, loose stems require long allografts measuring >10 cm in 90% of cases. As such, these cases typically require mobilization of the deltoid insertion as described above, and therefore it is important that the surgeon is prepared for this aspect of the procedure preoperatively.
Finally, the cement-within-cement technique, originally popularized for use in revision total hip arthroplasty, has demonstrated reliable results when utilized in revision SA.42 To date, there are no recommendations regarding the minimal length of existing cement mantle that is needed to perform this technique. In situations in which the length of the cement mantle is questionable, our preference is to combine the cement-within-cement technique with an APC when possible.
1. Day JS, Lau E, Ong KL, Williams GR, Ramsey ML, Kurtz SM. Prevalence and projections of total shoulder and elbow arthroplasty in the United States to 2015. J Shoulder Elbow Surg. 2010;19(8):1115-1120. doi:10.1016/j.jse.2010.02.009.
2. Padegimas EM, Maltenfort M, Lazarus MD, Ramsey ML, Williams GR, Namdari S. Future patient demand for shoulder arthroplasty by younger patients: national projections. Clin Orthop Relat Res. 2015;473(6):1860-1867. doi:10.1007/s11999-015-4231-z.
3. Walker M, Willis MP, Brooks JP, Pupello D, Mulieri PJ, Frankle MA. The use of the reverse shoulder arthroplasty for treatment of failed total shoulder arthroplasty. J Shoulder Elbow Surg. 2012;21(4):514-522. doi:10.1016/j.jse.2011.03.006.
4. Levy JC, Virani N, Pupello D, et al. Use of the reverse shoulder prosthesis for the treatment of failed hemiarthroplasty in patients with glenohumeral arthritis and rotator cuff deficiency. J Bone Joint Surg Br. 2007;89(2):189-195. doi:10.1302/0301-620X.89B2.
5. Melis B, Bonnevialle N, Neyton L, et al. Glenoid loosening and failure in anatomical total shoulder arthroplasty: is revision with a reverse shoulder arthroplasty a reliable option? J Shoulder Elbow Surg. 2012;21(3):342-349. doi:10.1016/j.jse.2011.05.021.
6. Deutsch A, Abboud JA, Kelly J, et al. Clinical results of revision shoulder arthroplasty for glenoid component loosening. J Shoulder Elbow Surg. 2007;16(6):706-716. doi:10.1016/j.jse.2007.01.007.
7. Kelly JD, Zhao JX, Hobgood ER, Norris TR. Clinical results of revision shoulder arthroplasty using the reverse prosthesis. J Shoulder Elbow Surg. 2012;21(11):1516-1525. doi:10.1016/j.jse.2011.11.021.
8. Black EM, Roberts SM, Siegel E, Yannopoulos P, Higgins LD, Warner JJP. Reverse shoulder arthroplasty as salvage for failed prior arthroplasty in patients 65 years of age or younger. J Shoulder Elbow Surg. 2014;23(7):1036-1042. doi:10.1016/j.jse.2014.02.019.
9. Composite P, Chacon BA, Virani N, et al. Revision arthroplasty with use of a reverse shoulder. J Bone Joint Surg. 2009;1:119-127. doi:10.2106/JBJS.H.00094.
10. Klein SM, Dunning P, Mulieri P, Pupello D, Downes K, Frankle MA. Effects of acquired glenoid bone defects on surgical technique and clinical outcomes in reverse shoulder arthroplasty. J Bone Joint Surg Am. 2010;92(5):1144-1154. doi:10.2106/JBJS.I.00778.
11. Patel DN, Young B, Onyekwelu I, Zuckerman JD, Kwon YW. Reverse total shoulder arthroplasty for failed shoulder arthroplasty. J Shoulder Elbow Surg. 2012;21(11):1478-1483. doi:10.1016/j.jse.2011.11.004.
12. Cuff D, Levy JC, Gutiérrez S, Frankle MA. Torsional stability of modular and non-modular reverse shoulder humeral components in a proximal humeral bone loss model. J Shoulder Elbow Surg. 2011;20(4):646-651. doi:10.1016/j.jse.2010.10.026.
13. Morgan SJ, Furry K, Parekh A, Agudelo JF, Smith WR. The deltoid muscle: an anatomic description of the deltoid insertion to the proximal humerus. J Orthop Trauma. 2006;20(1):19-21. doi:10.1097/01.bot.0000187063.43267.18.
14. Gagey O, Hue E. Mechanics of the deltoid muscle. A new approach. Clin Orthop Relat Res. 2000;375:250-257. doi:10.1097/00003086-200006000-00030.
15. De Wilde L, Plasschaert F. Prosthetic treatment and functional recovery of the shoulder after tumor resection 10 years ago: a case report. J Shoulder Elbow Surg. 2005;14(6):645-649. doi:10.1016/j.jse.2004.11.001.
16. Wataru S, Kazuomi S, Yoshikazu N, Hiroaki I, Takaharu Y, Hideki Y. Three-dimensional morphological analysis of humeral heads: a study in cadavers. Acta Orthop. 2005;76(3):392-396. doi:10.1080/00016470510030878.
17. Tillett E, Smith M, Fulcher M, Shanklin J. Anatomic determination of humeral head retroversion: the relationship of the central axis of the humeral head to the bicipital groove. J Shoulder Elbow Surg. 1993;2(5):255-256. doi:10.1016/S1058-2746(09)80085-2.
18. Doyle AJ, Burks RT. Comparison of humeral head retroversion with the humeral axis/biceps groove relationship: a study in live subjects and cadavers. J Shoulder Elbow Surg. 1998;7(5):453-457. doi:10.1016/S1058-2746(98)90193-8.
19. Johnson JW, Thostenson JD, Suva LJ, Hasan SA. Relationship of bicipital groove rotation with humeral head retroversion: a three-dimensional computed tomographic analysis. J Bone Joint Surg Am. 2013;95(8):719-724. doi:10.2106/JBJS.J.00085.
20. Hromádka R, Kuběna AA, Pokorný D, Popelka S, Jahoda D, Sosna A. Lesser tuberosity is more reliable than bicipital groove when determining orientation of humeral head in primary shoulder arthroplasty. Surg Radiol Anat. 2010;32(1):31-37. doi:10.1007/s00276-009-0543-6.
21. Hertel R, Knothe U, Ballmer FT. Geometry of the proximal humerus and implications for prosthetic design. J Shoulder Elbow Surg. 2002;11(4):331-338. doi:10.1067/mse.2002.124429.
22. Pearl ML. Proximal humeral anatomy in shoulder arthroplasty: Implications for prosthetic design and surgical technique. J Shoulder Elbow Surg. 2005;14(suppl 1):99-104. doi:10.1016/j.jse.2004.09.025.
23. Robertson DD, Yuan J, Bigliani LU, Flatow EL, Yamaguchi K. Three-dimensional analysis of the proximal part of the humerus: relevance to arthroplasty. J Bone Joint Surg Am. 2000;82-A(11):1594-1602.
24. Mochizuki T, Sugaya H, Uomizu M, et al. Humeral insertion of the supraspinatus and infraspinatus. J Bone Joint Surg Am. 2008;90(5):962-969. doi:10.2106/JBJS.G.00427.
25. Arai R, Sugaya H, Mochizuki T, Nimura A, Moriishi J, Akita K. Subscapularis tendon tear: an anatomic and clinical investigation. Arthroscopy. 2008;24(9):997-1004. doi:10.1016/j.arthro.2008.04.076.
26. Nimura A, Kato A, Yamaguchi K, et al. The superior capsule of the shoulder joint complements the insertion of the rotator cuff. J Shoulder Elbow Surg. 2012;21(7):867-872. doi:10.1016/j.jse.2011.04.034.
27. Rispoli DM, Athwal GS, Sperling JW, Cofield RH. The anatomy of the deltoid insertion. J Shoulder Elbow Surg. 2009;18(3):386-390. doi:10.1016/j.jse.2008.10.012.
28. Schwartz DG, Kang SH, Lynch TS, et al. The anterior deltoid’s importance in reverse shoulder arthroplasty: a cadaveric biomechanical study. J Shoulder Elbow Surg. 2013;22(3):357-364. doi:10.1016/j.jse.2012.02.002.
29. Walker M, Brooks J, Willis M, Frankle M. How reverse shoulder arthroplasty works. Clinical Orthop Relat Res. 2011;469(9):2440-2451. doi:10.1007/s11999-011-1892-0.
30. Torrens C, Corrales M, Melendo E, Solano A, Rodríguez-Baeza A, Cáceres E. The pectoralis major tendon as a reference for restoring humeral length and retroversion with hemiarthroplasty for fracture. J Shoulder Elbow Surg. 2008;17(6):947-950. doi:10.1016/j.jse.2008.05.041.
31. Ponce BA, Thompson KJ, Rosenzweig SD, et al. Re-evaluation of pectoralis major height as an anatomic reference for humeral height in fracture hemiarthroplasty. J Shoulder Elbow Surg. 2013;22(11):1567-1572. doi:10.1016/j.jse.2013.01.039.
32. LaFrance R, Madsen W, Yaseen Z, Giordano B, Maloney M, Voloshin I. Relevant anatomic landmarks and measurements for biceps tenodesis. Am J Sports Med. 2013;41(6):1395-1399. doi:10.1177/0363546513482297.
33. Beck PA, Hoffer MM. Latissimus dorsi and teres major tendons: separate or conjoint tendons? J Pediatr Orthop. 1989;9(3):308-309.
34. Bhatt CR, Prajapati B, Patil DS, Patel VD, Singh BGP, Mehta CD. Variation in the insertion of the latissimus dorsi & its clinical importance. J Orthop. 2013;10(1):25-28. doi:10.1016/j.jor.2013.01.002.
35. Gerber C, Maquieira G, Espinosa N. Latissimus dorsi transfer for the treatment of irreparable rotator cuff tears. J Bone Joint Surg. 2006;88(1):113-120. doi:10.2106/JBJS.E.00282.
36. Elhassan B, Christensen TJ, Wagner ER. Feasibility of latissimus and teres major transfer to reconstruct irreparable subscapularis tendon tear: an anatomic study. J Shoulder Elbow Surg. 2014;23(4):492-499. doi:10.1016/j.jse.2013.07.046.
37. Pouliart N, Gagey O. Significance of the latissimus dorsi for shoulder instability. II. Its influence on dislocation behavior in a sequential cutting protocol of the glenohumeral capsule. Clin Anat. 2005;18(7):500-509. doi:10.1002/ca.20181.
38. Budge MD, Moravek JE, Zimel MN, Nolan EM, Wiater JM. Reverse total shoulder arthroplasty for the management of failed shoulder arthroplasty with proximal humeral bone loss: is allograft augmentation necessary? J Shoulder Elbow Surg. 2013;22(6):739-744. doi:10.1016/j.jse.2012.08.008.
39. Weiser MC, Lavernia CJ. Trunnionosis in total hip arthroplasty. J Bone Joint Surg Am. 2017;99(17):27-29. doi:10.2106/JBJS.17.00345.
40. Cohen J. Current concepts review. Corrosion of metal orthopaedic implants. J Bone Joint Surg Am. 1998;80(10):1554.
41. Meijer ST, Paulino Pereira NR, Nota SPFT, Ferrone ML, Schwab JH, Lozano Calderón SA. Factors associated with infection after reconstructive shoulder surgery for proximal humerus tumors. J Shoulder Elbow Surg. 2017;26(6):931-938. doi:10.1016/j.jse.2016.10.014.
42. Wagner ER, Houdek MT, Hernandez NM, Cofield RH, Sánchez-Sotelo J, Sperling JW. Cement-within-cement technique in revision reverse shoulder arthroplasty. J Shoulder Elbow Surg. 2017;26(8):1448-1453. doi:10.1016/j.jse.2017.01.013.
ABSTRACT
Revision shoulder arthroplasty is becoming more prevalent as the rate of primary shoulder arthroplasty in the US continues to increase. The management of proximal humeral bone loss in the revision setting presents a difficult problem without a clear solution. Different preoperative diagnoses often lead to distinctly different patterns of bone loss. Successful management of these cases requires a clear understanding of the normal anatomy of the proximal humerus, as well as structural limitations imposed by significant bone loss and the effect this loss has on component fixation. Our preferred technique differs depending on the pattern of bone loss encountered. The use of allograft-prosthetic composites, the cement-within-cement technique, and combinations of these strategies comprise the mainstay of our treatment algorithm. This article focuses on indications, surgical techniques, and some of the published outcomes using these strategies in the management of proximal humeral bone loss.
Continue to: The demand for shoulder arthroplasty...
The demand for shoulder arthroplasty (SA) has increased significantly over the past decade, with a 200% increase witnessed from 2011 to 2015.1 SA performed in patients younger than 55 years is expected to increase 333% between 2011 to 2030.2 With increasing rates of SA being performed in younger patient populations, rates of revision SA also can be expected to climb. Revision to reverse shoulder arthroplasty (RSA) has arisen as a viable option in these patients, and multiple studies demonstrate excellent outcomes that can be obtained with RSA.3-11
Despite significant improvements obtained in revision SA since the mainstream acceptance of RSA, bone loss remains a problematic issue. Loss of humeral bone stock, in particular, can be a challenging problem to solve with multiple clinical implications. Biomechanical studies have demonstrated that if bone loss is left unaddressed, increased bending and torsional forces on the prosthesis result, which ultimately contribute to increased micromotion and eventual component failure.12 In addition, existing challenges are associated with the lack of attachment sites for both multiple muscles and tendons. Also, there is a loss of the normal lateralized pull of the deltoid, which results in a decreased amount of force generated by this muscle.13,14 Ultimately, the increased loss of bone can lead to a devastating situation where there is not enough bone to provide adequate fixation while maintaining the appropriate humeral length necessary to achieve stability of the articulation, which will inevitably lead to instability.4,15 Therefore, techniques are needed to address proximal humeral bone loss while maintaining as much native humeral bone as possible.
PROXIMAL HUMERUS: ANATOMICAL CONSIDERATIONS
The anatomy of the proximal humerus has been studied in great detail and reported in a number of different studies.16-23 The average humeral head thickness (24 mm in men and 19 mm in women) and offset relative to the humeral shaft (2.1 mm posterior and 6.6 mm medial) act to tension the rotator cuff musculature appropriately and contribute to a wrapping effect that allows the deltoid to function more effectively.13,14 Knowledge regarding the rotator cuff footprint has advanced over the past 10 years, specifically with regard to the supraspinatus and infraspinatus.24 The current belief is that the supraspinatus has a triangular insertion onto the most anterior aspect of the greater tuberosity, with a maximum medial-to-lateral length of 6.9 mm and a maximum anterior-to-posterior width of 12.6 mm. The infraspinatus insertion has a trapezoidal insertion, with a maximum medial-to-lateral length of 10.2 mm and anterior-to-posterior width of 32.7 mm. The subscapularis, by far the largest of all the rotator cuff muscles, has a complex geometry with regard to its insertion on the lesser tuberosity, with 4 different insertion points and an overall lateral footprint measuring 37.6 mm and a medial footprint measuring 40.7 mm.25 Finally, the teres minor, with the smallest volume of all the rotator cuff muscles, inserts immediately inferior to the infraspinatus along the inferior facet of the greater tuberosity.26
Aside from the rotator cuff, there are various other muscles and tendons that insert about the proximal humerus and are essential for normal function. The deltoid, which inserts at a point approximately 6 cm from the greater tuberosity along the length of the humerus, with an insertion length between 5 cm to 7 cm,13,27 is the primary mover of the shoulder and essential for proper function after RSA.28,29 The pectoralis major tendon, which begins inserting at a point approximately 5.6 cm from the humeral head and spans a distance of 7.7 cm along the length of the humerus,30-32 is important not only for function but as an anatomical landmark in reconstruction. Lastly, the latissimus dorsi and teres major, which share a role in extension, adduction, and internal rotation of the glenohumeral joint, insert along the floor and medial lip of the intertubercular groove of the humerus, respectively.33,34 In addition to their role in tendon transfer procedures because of treating irreparable posterosuperior cuff and subscapularis tears,35,36 it has been suggested that these tendons may play some role in glenohumeral joint stability.37
In addition to the loss of muscular attachments, the absence of proximal humeral bone stock, in and of itself, can have deleterious effects on fixation of the humeral component. RSA is a semiconstrained device, which results in increased transmission of forces to the interface between the humeral implant and its surrounding structures, including cement (when present) and the bone itself. When there is the absence of significant amounts of bone, the remaining bone must now account for an even higher proportion of these forces. A previous biomechanical study showed that cemented humeral stems demonstrated significantly increased micromotion in the presence of proximal humeral bone loss, particularly when a modular humeral component was used.12
Continue to: TYPES OF BONE LOSS
TYPES OF BONE LOSS
There are a variety of different etiologies of proximal humeral bone loss that result in distinctly different clinical presentations. These can be fairly mild, as is the case of isolated resorption of the greater tuberosity in a non-united proximal humerus fracture (Figure 1). Alternatively, they can be severe, as seen in a grossly loose cemented long-stemmed component that is freely mobile, creating a windshield-wiper effect throughout the length of the humerus (Figure 2). This can be somewhat deceiving, however, as the amount of bone loss, as well as the pathophysiologic process that led to the bone loss, are important factors to determine ideal reconstructive methods. In the case of a failed open reduction internal fixation, where the tuberosity has failed to unite or has been resected, there is much less of a biologic response in comparison with implant loosening associated with osteolysis. This latter condition will be associated with a much more destructive inflammatory response resulting in poor tissue quality and often dramatic thinning of the cortex. If one simply measured the distance from the most proximal remaining bone stock to the area where the greater tuberosity should be, a loose stem with subsidence and ballooning of the cortices may appear to have a similar amount of bone loss as a failed hemiarthroplasty for fracture with a well-fixed stem. However, intraoperatively, one will find that the bone that appeared to be present radiographically in the case of the loose stem is of such poor quality that it cannot reasonably provide any beneficial fixation. In light of this, different treatment modalities are recommended for different types of bone loss, and the revision surgeon must be able to anticipate this and possess a full armamentarium of options to treat these challenging cases successfully.
INDICATIONS
Our technique to manage proximal humeral bone loss is dependent on both the quantity of bone loss, which can be measured radiographically, as well as the anticipated inflammatory response described above. As both the destructive process and the amount of bone loss increase, the importance of more advanced reconstructive procedures that will sustain implant security and soft-tissue management becomes apparent. In the least destructive cases with <5 cm of bone loss, successful revision can typically be accomplished with stem removal and placement of a new monoblock humeral stem. In cases where more advanced destructive pathology is present, and bone loss is >5 cm, an allograft-prosthetic composite (APC) is typically used. In both scenarios, if the stem being revised is cemented and the cement mantle remains intact, and of reasonable length, consideration is given to the cement-within-cement technique. Finally, in the most destructive cases where bone loss exceeds 10 cm and a large biological response is anticipated (eg, periprosthetic fractures with humeral loosening), the use of a longer diaphyseal-incorporating APC is often necessary. This prosthetic composite can be combined with a cement-within-cement technique as well.
It is important to comment on the implications of using modular stems in this setting. With advanced bone loss, a situation is often encountered where the newly implanted stem geometry and working length may be insufficient to acquire adequate rotational stability. In this setting, if a modular junction is positioned close to the stem and cement/bone interface, it will be exposed to very high stress concentrations which can lead to component fracture38 as well as taper corrosion, also referred to as trunnionosis. This latter phenomenon, which has been well studied in the total hip arthroplasty literature with the use of modular components,39 is especially relevant given the high torsional loads imparted at the modular junction. Ultimately, high torsional loads lead to micromotion and electrochemical ion release via degradation of the passivation layer, initiating the process of mechanically assisted crevice corrosion.40 For these reasons, when a modular stem must be used in the presence of mild to moderate bone loss, using a proximal humeral allograft to protect the junction or to provide additional fixation may be implemented with a lower threshold than when using a monoblock stem.
SURGICAL TECHNIQUE: ALLOGRAFT-PROSTHETIC COMPOSITES
A standard deltopectoral approach is used, taking care to preserve all viable muscular attachments to the proximal humerus. After removal of the prosthetic humeral head, the decision to proceed with removal of the stem at this juncture is based on several factors. If the remaining proximal humeral bone is so compromised that it might not be able to withstand the forces exerted upon it during retraction for glenoid exposure, the component is left in place. Additionally, if there is consideration that the glenoid-sided bone loss may be so severe that a glenoid baseplate cannot be implanted, and the stem remains well fixed, it is retained so that it can be converted to a hemiarthroplasty.
If neither of the above issues is present, the humeral stem is removed. If a well-fixed press-fit stem is in place, it is typically removed using a combination of burrs and osteotomes to disrupt the bone-implant interface, and the stem is then carefully removed using an impactor and mallet. If a cemented stem is present, the stem is removed in a similar manner, and the cement mantle is left in place if stable, in anticipation of a cement-within-cement technique. If the mantle is disrupted, standard cement removal instruments are used to remove all cement from the canal meticulously.
Continue to: Management of the glenoid...
Management of the glenoid can have significant implications with regard to the humerus. Most notably, the size of the glenosphere has direct implications on the fixation of the humeral component. Use of larger diameter glenospheres result in increased contact area between the glenosphere and humerosocket, adding constraint to the articulation and further increasing the stresses at the implant-bone interface. As such, the use of larger glenospheres to prevent instability must be balanced with the resulting implications on humeral component fixation, especially in cases of severe bone loss.
After implanting the appropriate glenosphere, attention is then turned back to the humerus. Trial implants are sequentially used to obtain adequate humeral length and stability. Once this is accomplished, the amount of humeral bone loss is quantified by measuring the distance from the superior aspect of the medial humeral tray to the medial humeral shaft. If this number is >5 cm (Figure 3), the decision is made to proceed with an APC. The allograft humeral head is cut, cancellous bone is removed, and a step-cut is performed, with the medial portion of the allograft measuring the same length as that of bone loss and the lateral plate extending an additional several centimeters distally (Figure 4). Additional soft tissue is removed from the allograft, leaving the subscapularis stump intact for later repair with the patient’s native tissue. The allograft is secured to the patient’s proximal humerus using multiple cerclage wires, and the humeral stem is cemented into place. The final construct is shown in Figure 5.
ADDITIONAL CONSIDERATIONS: CASES OF ADVANCED BONE LOSS
In cases of advanced humeral bone loss, as is often seen when revising loose humeral stems, larger allografts that span a significant length of the diaphysis are often required. This type of bone loss has implications with regard to how the deltoid insertion is managed. Interestingly, even in situations when the vast majority of the remaining diaphysis consists of ectatic egg-shell bone, the deltoid tuberosity remains of fairly substantial quality due to the continued pull of the muscular insertion on this area. This fragment is isolated, carefully mobilized, and subsequently repaired back on top of the allograft using cables.
POSTOPERATIVE CARE
Patients are kept in a shoulder immobilizer for 6 weeks after surgery to facilitate allograft incorporation and subscapularis tendon healing. During this time, pendulum exercises are initiated. Active assisted range of motion (ROM) exercises begin after 6 weeks, consisting of supine forward elevation. A sling is given to be used in public. Light strengthening exercises begin at 3 months postoperatively.
DISCUSSION
In cases of mild to moderate proximal humeral bone loss, RSA using a long-stem humeral component without allograft augmentation is a viable option. Budge and colleagues38 demonstrated excellent results in a population of 15 patients with an average of 38 mm of proximal humeral bone loss without use of allografts. Interestingly, they noted 1 case of component fracture in a modular prosthesis and therefore concluded that monoblock humeral stems should be used in the absence of allograft augmentation.
Continue to: In more advanced cases of bone loss...
In more advanced cases of bone loss, our data shows that use of APCs can result in equally satisfactory results. In a series of 25 patients with an average bone loss of 54 mm, patients were able to achieve statistically significant improvements in pain, ROM, and function with high rates of allograft incorporation.9 Overall, a low rate of complications was noted, including 1 infection. This finding is consistent with an additional study looking specifically at factors associated with infection in revision SA, which found that the use of allografts was not associated with increased risk of infection.41
As stated previously, the size of allograft needed for the APC construct is related to the distinct pathology encountered. In our experience, we have noted that well-fixed stems can be treated with short metaphyseal APCs in 85% of cases. On the other hand, loose stems require long allografts measuring >10 cm in 90% of cases. As such, these cases typically require mobilization of the deltoid insertion as described above, and therefore it is important that the surgeon is prepared for this aspect of the procedure preoperatively.
Finally, the cement-within-cement technique, originally popularized for use in revision total hip arthroplasty, has demonstrated reliable results when utilized in revision SA.42 To date, there are no recommendations regarding the minimal length of existing cement mantle that is needed to perform this technique. In situations in which the length of the cement mantle is questionable, our preference is to combine the cement-within-cement technique with an APC when possible.
1. Day JS, Lau E, Ong KL, Williams GR, Ramsey ML, Kurtz SM. Prevalence and projections of total shoulder and elbow arthroplasty in the United States to 2015. J Shoulder Elbow Surg. 2010;19(8):1115-1120. doi:10.1016/j.jse.2010.02.009.
2. Padegimas EM, Maltenfort M, Lazarus MD, Ramsey ML, Williams GR, Namdari S. Future patient demand for shoulder arthroplasty by younger patients: national projections. Clin Orthop Relat Res. 2015;473(6):1860-1867. doi:10.1007/s11999-015-4231-z.
3. Walker M, Willis MP, Brooks JP, Pupello D, Mulieri PJ, Frankle MA. The use of the reverse shoulder arthroplasty for treatment of failed total shoulder arthroplasty. J Shoulder Elbow Surg. 2012;21(4):514-522. doi:10.1016/j.jse.2011.03.006.
4. Levy JC, Virani N, Pupello D, et al. Use of the reverse shoulder prosthesis for the treatment of failed hemiarthroplasty in patients with glenohumeral arthritis and rotator cuff deficiency. J Bone Joint Surg Br. 2007;89(2):189-195. doi:10.1302/0301-620X.89B2.
5. Melis B, Bonnevialle N, Neyton L, et al. Glenoid loosening and failure in anatomical total shoulder arthroplasty: is revision with a reverse shoulder arthroplasty a reliable option? J Shoulder Elbow Surg. 2012;21(3):342-349. doi:10.1016/j.jse.2011.05.021.
6. Deutsch A, Abboud JA, Kelly J, et al. Clinical results of revision shoulder arthroplasty for glenoid component loosening. J Shoulder Elbow Surg. 2007;16(6):706-716. doi:10.1016/j.jse.2007.01.007.
7. Kelly JD, Zhao JX, Hobgood ER, Norris TR. Clinical results of revision shoulder arthroplasty using the reverse prosthesis. J Shoulder Elbow Surg. 2012;21(11):1516-1525. doi:10.1016/j.jse.2011.11.021.
8. Black EM, Roberts SM, Siegel E, Yannopoulos P, Higgins LD, Warner JJP. Reverse shoulder arthroplasty as salvage for failed prior arthroplasty in patients 65 years of age or younger. J Shoulder Elbow Surg. 2014;23(7):1036-1042. doi:10.1016/j.jse.2014.02.019.
9. Composite P, Chacon BA, Virani N, et al. Revision arthroplasty with use of a reverse shoulder. J Bone Joint Surg. 2009;1:119-127. doi:10.2106/JBJS.H.00094.
10. Klein SM, Dunning P, Mulieri P, Pupello D, Downes K, Frankle MA. Effects of acquired glenoid bone defects on surgical technique and clinical outcomes in reverse shoulder arthroplasty. J Bone Joint Surg Am. 2010;92(5):1144-1154. doi:10.2106/JBJS.I.00778.
11. Patel DN, Young B, Onyekwelu I, Zuckerman JD, Kwon YW. Reverse total shoulder arthroplasty for failed shoulder arthroplasty. J Shoulder Elbow Surg. 2012;21(11):1478-1483. doi:10.1016/j.jse.2011.11.004.
12. Cuff D, Levy JC, Gutiérrez S, Frankle MA. Torsional stability of modular and non-modular reverse shoulder humeral components in a proximal humeral bone loss model. J Shoulder Elbow Surg. 2011;20(4):646-651. doi:10.1016/j.jse.2010.10.026.
13. Morgan SJ, Furry K, Parekh A, Agudelo JF, Smith WR. The deltoid muscle: an anatomic description of the deltoid insertion to the proximal humerus. J Orthop Trauma. 2006;20(1):19-21. doi:10.1097/01.bot.0000187063.43267.18.
14. Gagey O, Hue E. Mechanics of the deltoid muscle. A new approach. Clin Orthop Relat Res. 2000;375:250-257. doi:10.1097/00003086-200006000-00030.
15. De Wilde L, Plasschaert F. Prosthetic treatment and functional recovery of the shoulder after tumor resection 10 years ago: a case report. J Shoulder Elbow Surg. 2005;14(6):645-649. doi:10.1016/j.jse.2004.11.001.
16. Wataru S, Kazuomi S, Yoshikazu N, Hiroaki I, Takaharu Y, Hideki Y. Three-dimensional morphological analysis of humeral heads: a study in cadavers. Acta Orthop. 2005;76(3):392-396. doi:10.1080/00016470510030878.
17. Tillett E, Smith M, Fulcher M, Shanklin J. Anatomic determination of humeral head retroversion: the relationship of the central axis of the humeral head to the bicipital groove. J Shoulder Elbow Surg. 1993;2(5):255-256. doi:10.1016/S1058-2746(09)80085-2.
18. Doyle AJ, Burks RT. Comparison of humeral head retroversion with the humeral axis/biceps groove relationship: a study in live subjects and cadavers. J Shoulder Elbow Surg. 1998;7(5):453-457. doi:10.1016/S1058-2746(98)90193-8.
19. Johnson JW, Thostenson JD, Suva LJ, Hasan SA. Relationship of bicipital groove rotation with humeral head retroversion: a three-dimensional computed tomographic analysis. J Bone Joint Surg Am. 2013;95(8):719-724. doi:10.2106/JBJS.J.00085.
20. Hromádka R, Kuběna AA, Pokorný D, Popelka S, Jahoda D, Sosna A. Lesser tuberosity is more reliable than bicipital groove when determining orientation of humeral head in primary shoulder arthroplasty. Surg Radiol Anat. 2010;32(1):31-37. doi:10.1007/s00276-009-0543-6.
21. Hertel R, Knothe U, Ballmer FT. Geometry of the proximal humerus and implications for prosthetic design. J Shoulder Elbow Surg. 2002;11(4):331-338. doi:10.1067/mse.2002.124429.
22. Pearl ML. Proximal humeral anatomy in shoulder arthroplasty: Implications for prosthetic design and surgical technique. J Shoulder Elbow Surg. 2005;14(suppl 1):99-104. doi:10.1016/j.jse.2004.09.025.
23. Robertson DD, Yuan J, Bigliani LU, Flatow EL, Yamaguchi K. Three-dimensional analysis of the proximal part of the humerus: relevance to arthroplasty. J Bone Joint Surg Am. 2000;82-A(11):1594-1602.
24. Mochizuki T, Sugaya H, Uomizu M, et al. Humeral insertion of the supraspinatus and infraspinatus. J Bone Joint Surg Am. 2008;90(5):962-969. doi:10.2106/JBJS.G.00427.
25. Arai R, Sugaya H, Mochizuki T, Nimura A, Moriishi J, Akita K. Subscapularis tendon tear: an anatomic and clinical investigation. Arthroscopy. 2008;24(9):997-1004. doi:10.1016/j.arthro.2008.04.076.
26. Nimura A, Kato A, Yamaguchi K, et al. The superior capsule of the shoulder joint complements the insertion of the rotator cuff. J Shoulder Elbow Surg. 2012;21(7):867-872. doi:10.1016/j.jse.2011.04.034.
27. Rispoli DM, Athwal GS, Sperling JW, Cofield RH. The anatomy of the deltoid insertion. J Shoulder Elbow Surg. 2009;18(3):386-390. doi:10.1016/j.jse.2008.10.012.
28. Schwartz DG, Kang SH, Lynch TS, et al. The anterior deltoid’s importance in reverse shoulder arthroplasty: a cadaveric biomechanical study. J Shoulder Elbow Surg. 2013;22(3):357-364. doi:10.1016/j.jse.2012.02.002.
29. Walker M, Brooks J, Willis M, Frankle M. How reverse shoulder arthroplasty works. Clinical Orthop Relat Res. 2011;469(9):2440-2451. doi:10.1007/s11999-011-1892-0.
30. Torrens C, Corrales M, Melendo E, Solano A, Rodríguez-Baeza A, Cáceres E. The pectoralis major tendon as a reference for restoring humeral length and retroversion with hemiarthroplasty for fracture. J Shoulder Elbow Surg. 2008;17(6):947-950. doi:10.1016/j.jse.2008.05.041.
31. Ponce BA, Thompson KJ, Rosenzweig SD, et al. Re-evaluation of pectoralis major height as an anatomic reference for humeral height in fracture hemiarthroplasty. J Shoulder Elbow Surg. 2013;22(11):1567-1572. doi:10.1016/j.jse.2013.01.039.
32. LaFrance R, Madsen W, Yaseen Z, Giordano B, Maloney M, Voloshin I. Relevant anatomic landmarks and measurements for biceps tenodesis. Am J Sports Med. 2013;41(6):1395-1399. doi:10.1177/0363546513482297.
33. Beck PA, Hoffer MM. Latissimus dorsi and teres major tendons: separate or conjoint tendons? J Pediatr Orthop. 1989;9(3):308-309.
34. Bhatt CR, Prajapati B, Patil DS, Patel VD, Singh BGP, Mehta CD. Variation in the insertion of the latissimus dorsi & its clinical importance. J Orthop. 2013;10(1):25-28. doi:10.1016/j.jor.2013.01.002.
35. Gerber C, Maquieira G, Espinosa N. Latissimus dorsi transfer for the treatment of irreparable rotator cuff tears. J Bone Joint Surg. 2006;88(1):113-120. doi:10.2106/JBJS.E.00282.
36. Elhassan B, Christensen TJ, Wagner ER. Feasibility of latissimus and teres major transfer to reconstruct irreparable subscapularis tendon tear: an anatomic study. J Shoulder Elbow Surg. 2014;23(4):492-499. doi:10.1016/j.jse.2013.07.046.
37. Pouliart N, Gagey O. Significance of the latissimus dorsi for shoulder instability. II. Its influence on dislocation behavior in a sequential cutting protocol of the glenohumeral capsule. Clin Anat. 2005;18(7):500-509. doi:10.1002/ca.20181.
38. Budge MD, Moravek JE, Zimel MN, Nolan EM, Wiater JM. Reverse total shoulder arthroplasty for the management of failed shoulder arthroplasty with proximal humeral bone loss: is allograft augmentation necessary? J Shoulder Elbow Surg. 2013;22(6):739-744. doi:10.1016/j.jse.2012.08.008.
39. Weiser MC, Lavernia CJ. Trunnionosis in total hip arthroplasty. J Bone Joint Surg Am. 2017;99(17):27-29. doi:10.2106/JBJS.17.00345.
40. Cohen J. Current concepts review. Corrosion of metal orthopaedic implants. J Bone Joint Surg Am. 1998;80(10):1554.
41. Meijer ST, Paulino Pereira NR, Nota SPFT, Ferrone ML, Schwab JH, Lozano Calderón SA. Factors associated with infection after reconstructive shoulder surgery for proximal humerus tumors. J Shoulder Elbow Surg. 2017;26(6):931-938. doi:10.1016/j.jse.2016.10.014.
42. Wagner ER, Houdek MT, Hernandez NM, Cofield RH, Sánchez-Sotelo J, Sperling JW. Cement-within-cement technique in revision reverse shoulder arthroplasty. J Shoulder Elbow Surg. 2017;26(8):1448-1453. doi:10.1016/j.jse.2017.01.013.
TAKE-HOME POINTS
- Different preoperative diagnoses lead to distinct patterns of bone loss in revision shoulder arthroplasty.
- A variety of techniques should be utilized to address the specific pathologies encountered.
- Advanced proximal humeral bone loss results in limited substrate available for humeral component fixation.
- Monoblock humeral stems can be used without allografts in cases with mild humeral bone loss.
- The revision of loose humeral stems dictates the use of large diaphyseal allografts in the majority of cases.

Treating Humeral Bone Loss in Shoulder Arthroplasty: Modular Humeral Components or Allografts
ABSTRACT
Reconstructing proximal humeral bone loss in the setting of shoulder arthroplasty can be a daunting task. Proposed techniques include long-stemmed humeral components, allograft-prosthesis composites (APCs), and modular endoprosthetic reconstruction. While unsupported long-stemmed components are at high risk for component loosening, APC reconstruction techniques have been reported with success. However, graft resorption and eventual failure are significant concerns. Modular endoprosthetic systems allow bone deficiencies to be reconstructed with metal, which may allow for a more durable reconstruction.
Continue to: Shoulder arthroplasty is an established procedure...
Shoulder arthroplasty is an established procedure with good results for restoring motion and decreasing pain for a variety of indications, including arthritis, fracture, posttraumatic sequelae, and tumor resection.1-4 As the population ages, the incidence of these shoulder disorders increases, with the incidence of total shoulder arthroplasty (TSA) and reverse total shoulder arthroplasty (RTSA) increasing at faster rates than that of hemiarthroplasty.5,6 These expanding indications will, in turn, result in more revisions that would present challenges for surgeons.1,7,8
The glenoid component is much more commonly revised than the humeral component; however, the humeral component may also require revision or removal to allow exposure of the glenoid component.9 Revision of the humeral stem might be required in cases of infection, periprosthetic fracture, dislocation, or aseptic loosening.10 The survival rate of humeral stems is generally >90% at 10 years and >80% at 20-year follow-up.7 Despite these good survival rates, a revision setting the humeral component requires exchange in about half of all cases.11
Humeral bone loss or deficiency is one of the challenges encountered in both primary and revision TSA. The amount of proximal bone loss can be determined by measuring the distance from the top of the prosthesis laterally to the intact lateral cortex.12 Methods for treating bone loss may involve monoblock revision stems to bypass the deficiency, allografts to rebuild the bone stock, or modular components or endoprostheses to restore the length and stability of the extremity.
Proximal humeral bone loss may make component positioning difficult and may create problems with fixation of the humeral stem. Proper sizing and placement of components are important for improving postoperative function, decreasing component wear and instability, and restoring humeral height and offset. Determining the appropriate center of rotation is important for the function and avoidance of impingement on the acromion, as well as for the restoration of the lever arm of the deltoid without overtensioning. The selection of components with the correct size and the accurate intraoperative placement are important to restore humeral height and offset.13,14 Components must be positioned <4 mm from the height of the greater tuberosity and <8 mm of offset to avoid compromising motion.15 De Wilde and Walch16 described about 3 patients who underwent revision reverse shoulder arthroplasty after failure of the humeral implant because of inadequate proximal humeral bone stock. They concluded that treatment of the bone loss was critical to achieve a successful outcome.
LONG-STEMMED HUMERAL COMPONENTS WITHOUT GRAFTING
There is some evidence indicating that humeral bone loss can be managed without allograft or augmentation. Owens and colleagues17 evaluated the use of intermediate- or long-stemmed humeral components for primary shoulder arthroplasty in 17 patients with severe proximal humeral bone loss and in 18 patients with large humeral canals. The stems were fully cemented, cemented distally only with proximal allografting, and uncemented. Indications for fully cemented stems were loss of proximal bone that could be filled with a proximal cement mantle to ensure a secure fit. Distal cement fixation was applied when there was significant proximal bone loss and was often supplemented with cancellous or structural allograft and/or cancellous autograft. Intraoperative complications included cortical perforation or cement extrusion in 16% of patients. Excellent or satisfactory results were obtained in 21 (60%) of the 35 shoulders, 14 (78%) of the 18 shoulders with large humeral canals, and 7 (41%) of the 17 shoulders with bone loss. All the 17 components implanted in patients with proximal humeral bone loss were stable with no gross loosening at an average 6-year follow-up.
Continue to: Budge and colleagues...
Budge and colleagues12 prospectively enrolled 15 patients with substantial proximal humeral bone loss (38.4 mm) who had conversion to RTSA without allografting after a failed TSA. All patients showed improvements in terms of the American Shoulder and Elbow Surgeons (ASES) score, subjective shoulder value, Constant score, and Visual Analog Scale (VAS) pain score, as well as an improved active range of motion (ROM) and good radiographic outcomes at 2-year follow-up. Although the complication rate was high (7 of 15), most of the complications were minor, with only 2 requiring operative intervention. The only component fracture occurred in a patient with a modular prosthesis that was unsupported by bone proximally. Budge and colleagues12 suggested that concerns about prosthetic fracture can be alleviated using a nonmodular monoblock design. No prosthesis-related complications occurred in their series, leading them to recommend monoblock humeral stems in patients with severe proximal humeral bone loss.
Stephens and colleagues18 reported revision to RTSA in 32 patients with hemiarthroplasties, half of whom had proximal humeral bone loss (average 36.3 mm). Of these 16 patients, 10 were treated with monoblock stems and 6 with modular components, with cement fixation of all implants. At an average 4-year follow-up, patients with proximal bone loss had improved motion and outcomes, and decreased pain compared to their preoperative condition; however, they had lower functional and pain ratings, as well as less ROM compared to those of patients with intact proximal bone stock. Complications occurred in 5 (31%) of those with bone loss and in 1 (0.6%) of those without bone loss. Three of the 16 patients with bone loss had humeral stem loosening, with 2 of the 3 having subsidence. Only 1 patient required return to the operating room for the treatment of a periprosthetic fracture sustained in a fall. Of the 16 patients with bone loss, 14 patients demonstrated scapular notching, which was severe in 5 of them. Because patients with altered humeral length and/or standard length stems had worse outcomes, the authors recommended longer stems to improve fixation and advocated the use of a long-stemmed monoblock prosthesis over an allograft-prosthesis composite (APC).18
However, Werner and colleagues19 reported high rates of loosening and distal migration with the use of long-stemmed humeral implants in 50 patients with revision RTSA. They noted periprosthetic lucency on radiographs in 48% of patients, with more than half of them requiring revision. In 6 patients with subsidence of the humeral shaft, revision was done using custom, modular implants, with the anatomic curve being further stabilized using distal screw and cable fixation to provide rotational stability.
Using a biomechanical model, Cuff and colleagues20 compared 3 RTSA humeral designs, 2 modular designs, and 1 monoblock design in 12 intact models and in 12 models simulating 5 cm of proximal humeral bone loss. They observed that proximal humeral bone loss led to increased humeral component micromotion and rotational instability. The bone loss group had 5 failures compared to 2 in the control group. All failures occurred in those with modular components, whereas those with monoblock implants had no failures.
ALLOGRAFT-PROSTHESIS COMPOSITE
Composite treatment with a humeral stem and a metaphyseal allograft was described by Kassab and colleagues21 in 2005 and Levy and colleagues22 in 2007 (Figures 1A-1C) in patients with tumor resections21 or failed hemiarthroplasties.22 Allograft was used when there was insufficient metaphyseal bone to support the implant, and a graft was fashioned and fixed with cerclage wire before the component was cemented in place. In the 29 patients reported by Levy and colleagues,22 subjective and objective measurements trended toward better results in those with an APC than in those with RTSA alone, but this difference did not reach statistical significance. Several authors have identified a lack of proximal humeral bone support as 1 of the 4 possible causes of failure, and suggested that the allograft provides structural support, serves as an attachment for subscapularis repair, and maximizes deltoid function by increasing lateral offset and setting the moment arm of the deltoid.21-23

Continue to: In a prospective study of RTSA...
In a prospective study of RTSA using structural allografts for failed hemiarthroplasty in 25 patients with an average bone loss of 5 cm, 19 patients (76%) reported good or excellent results, 5 reported satisfactory results, and 1 patient reported an unsatisfactory result.1 Patients had significantly improved forward flexion, abduction, and external rotation and improved outcome scores (ASES and SST). Graft incorporation was good, with 88% and 79% incorporation in the metaphysis and diaphysis, respectively. This technique used a fresh-frozen proximal humeral allograft to fashion a custom proximal block with a lateral step-cut, which was fixed around the stem with cables. A long stem and cement were used. If there was no cement mantle remaining or if the medial portion of the graft was longer than 120 mm, the cement mantle was completely excised. The allograft stump of the subscapularis was used to repair the subscapularis tendon either end-to-end or pants-over-vest. The authors noted that the subscapularis repair provided increased stability; the only dislocation not caused by trauma did not have an identifiable tendon to repair. In this manner, APC reconstruction provided structural and rotational support to the humeral stem as well as bone stock for future revision.1,20
One significant concern with APC reconstruction is the potential for graft resorption, which can lead to humeral stem loosening, loss of contour of the tuberosity, or weakening to the point of fracture.24,25 This may be worsened by stress shielding of the allograft by distal stem cement fixation.26 Other concerns include the cost of the allograft, increased risk of de novo infection, donor-to-host infection, increased operative time and complexity, and failure of allograft incorporation.
The use of a proximal femoral allograft has been described when there is a lack of a proximal humeral allograft.1,27 Kelly and colleagues27 described good results in 2 patients in whom proximal femoral allograft was used along with bone morphogenetic protein, cemented long-stemmed revision implants, and locking plate augmentation.
ENDOPROSTHETIC RECONSTRUCTION
Various forms of prosthetic augmentation have been described to compensate for proximal humeral bone loss, with the majority of reports involving the use of endoprosthetic replacement for tumor procedures.28-31 Use of endoprostheses has also been described for revision procedures in patients with rheumatoid arthritis with massive bone loss, demonstrating modest improvements compared to severe preoperative functional limitations.32
Tumor patients, as well as revision arthroplasty patients, may present difficulties with prosthetic fixation due to massive bone loss. Chao and colleagues29 reported about the long-term outcomes after the use of implants with a porous ongrowth surface and extracortical bridging bone graft in multiple anatomic locations, including the proximal humerus, the proximal and distal femur, and the femoral diaphysis. In 3 patients with proximal humeral reconstruction, the measured ongrowth was only 30%. Given the small number of patients with a proximal humerus, no statistical significance was observed in the prosthesis location and the amount of bony ongrowth, but it was far less than that in the lower extremity.
Continue to: Endoprosthetic reconstruction...
Endoprosthetic reconstruction of the proximal humerus is commonly used for tumor resection that resulted in bone loss. Cannon and colleagues28 reported a 97.6% survival rate at a mean follow-up of 30 months in 83 patients with modular and custom reconstruction with a unipolar head. The ROM was limited, but the prosthesis provided adequate stability to allow elbow and hand function. Proximal migration of the prosthetic head was noticed with increasing frequency as the length of follow-up increased.
Use of an endoprosthesis with compressive osteointegration (Zimmer Biomet) has been described in lower extremities and more recently with follow-up on several cases, including 2 proximal humeral replacements for oncology patients to treat severe bone loss. One case was for a primary sarcoma resection, and the other was for the revision of aseptic loosening of a previous endoprosthesis. Follow-up periods for these 2 patients were 54 and 141 months, respectively. Both these patients had complications, but both retained the endoprosthesis. The authors concluded that this is a salvage operation with high risk.30 In another study, Guven and colleagues31 reported about reverse endoprosthetic reconstruction for tumor resection with bone loss. The ROM was improved, with a mean active forward elevation of 96° (range, 30°-160°), an abduction of 88° (range, 30-160°), and an external rotation of 13° (range, 0°-20°).
Modular endoprostheses have been evaluated as a method for improving bone fixation and restoring soft-tissue tension, while avoiding the complications associated with traditional endoprostheses or allografts (Figures 2A-2D). These systems allow precise adjustments of length using different trial lengths intraoperatively to obtain proper stability and deltoid tension. Of the 12 patients in a 2 center study, 11 had cementless components inserted using a press-fit technique (unpublished data, J. Feldman). At a minimum 2-year follow-up, the patients had an average improvement in forward elevation from 78° to 97°. Excluding 2 patients with loss of the deltoid tuberosity, the forward elevation averaged 109°. There were significant improvements in internal rotation (from 18° to 38°), as well as in the scores of Quick Disabilities of the Arm, Shoulder and Hand (DASH), forward elevation strength, ASES, and VAS pain. However, the overall complication rate was 41%. Therefore, despite these promising early results, longer-term studies are needed.

CONCLUSION
Proximal humeral bone loss remains a significant challenge for the shoulder arthroplasty surgeon. In the setting of a primary or a revision arthroplasty, the bone stock must be thoroughly evaluated during preoperative planning, and a surgical plan for addressing the deficits should be developed. Because proximal humeral bone loss may contribute to prosthetic failure, every effort should be made to reconstitute the bone stock.16 If the bone loss is less extensive, impaction grafting may be considered. Options to address massive proximal humeral bone loss include APCs and endoprosthetic reconstruction. The use of an allograft allows subscapularis repair, which may help stabilize the shoulder and restore the natural lever arm, as well as the tension of the deltoid.1,21-23 In addition, it helps avoid rotational instability and micromotion and provides bone stock for future revisions. However, concern persists regarding allograft resorption over time. More recently, modular endoprosthetic reconstruction systems have been developed to address bone deficiency with metal augmentation. Early clinical results demonstrate a high complication rate in this complex cohort of patients, not unlike those in the series of APCs, but clinical outcomes were improved compared to those in historical series. Nevertheless, longer-term clinical studies are necessary to determine the role of these modular endoprosthetic implant systems.
1. Chacon A, Virani N, Shannon R, Levy JC, Pupello D, Frankle M. Revision arthroplasty with use of a reverse shoulder prosthesis-allograft composite. J Bone Joint Surg Am. 2009;91(1):119-127. doi:10.2106/JBJS.H.00094.
2. Hattrup SJ, Waldrop R, Sanchez-Sotelo J. Reverse total shoulder arthroplasty for posttraumatic sequelae. J Orthop Trauma. 2016;30(2):e41-e47. doi:10.1097/BOT.0000000000000416.
3. Sewell MD, Kang SN, Al-Hadithy N, et al. Management of peri-prosthetic fracture of the humerus with severe bone loss and loosening of the humeral component after total shoulder replacement. J Bone Joint Surg Br. 2012;94(10):1382-1389. doi:10.1302/0301-620X.94B10.29248.
4. Trompeter AJ, Gupta RR. The management of complex periprosthetic humeral fractures: a case series of strut allograft augmentation, and a review of the literature. Strategies Trauma Limb Reconstr. 2013;8(1):43-51. doi:10.1007/s11751-013-0155-x.
5. Khatib O, Onyekwelu I, Yu S, Zuckerman JD. Shoulder arthroplasty in New York State, 1991 to 2010: changing patterns of utilization. J Shoulder Elbow Surg. 2015;24(10):e286-e291. doi:10.1016/j.jse.2015.05.038.
6. Kim SH, Wise BL, Zhang Y, Szabo RM. Increasing incidence of shoulder arthroplasty in the United States. J Bone Joint Surg Am. 2011;93(24):2249-2254. doi:10.2106/JBJS.J.01994.
7. Cil A, Veillette CJ, Sanchez-Sotelo J, Sperling JW, Schleck CD, Cofield RH. Survivorship of the humeral component in shoulder arthroplasty. J Shoulder Elbow Surg. 2010;19(1):143-150. doi:10.1016/j.jse.2009.04.011.
8. Wright TW. Revision of humeral components in shoulder arthroplasty. Bull Hosp Jt Dis. 2013;71(2 suppl):S77-S81.
9. Duquin TR, Sperling JW. Revision shoulder arthroplasty—how to manage the humerus. Oper Tech Orthop. 2011;21(1):44-51. doi:10.1053/j.oto.2010.09.008.
10. Cil A, Veillette CJ, Sanchez-Sotelo J, Sperling JW, Schleck C, Cofield RH. Revision of the humeral component for aseptic loosening in arthroplasty of the shoulder. J Bone Joint Surg Br. 2009;91(1):75-81. doi:10.1302/0301-620X.91B1.21094.
11. Cofield RH. Revision of hemiarthroplasty to total shoulder arthroplasty. In: Zuckerman JD, ed. Advanced Reconstruction: Shoulder. 1st edition. Rosemont, IL: American Academy of Orthopaedic Surgeons; 2007;613-622.
12. Budge MD, Moravek JE, Zimel MN, Nolan EM, Wiater JM. Reverse total shoulder arthroplasty for the management of failed shoulder arthroplasty with proximal humeral bone loss: is allograft augmentation necessary? J Shoulder Elbow Surg. 2013;22(6):739-744. doi:10.1016/j.jse.2012.08.008.
13. Boileau P, Walch G. The three-dimensional geometry of the proximal humerus. Implications for surgical technique and prosthetic design. J Bone Joint Surg Br. 1997;79(5):857-865.
14. Throckmorton TW. Reconstructive procedures of the shoulder and elbow. In: Azar FM, Beaty JH, Canale ST, eds. Campbell’s Operative Orthopaedics. 13th edition. Philadelphia, PA: Elsevier; 2017;570-622.
15. Williams GR Jr, Wong KL, Pepe MD, et al. The effect of articular malposition after total shoulder arthroplasty on glenohumeral translations, range of motion, and subacromial impingement. J Shoulder Elbow Surg. 2001;10(5):399-409. doi:10.1067/mse.2001.116871.
16. De Wilde L, Walch G. Humeral prosthetic failure of reversed total shoulder arthroplasty: a report of three cases. J Shoulder Elbow Surg. 2006;15(2):260-264. doi:10.1016/j.jse.2005.07.014.
17. Owens CJ, Sperling JW, Cofield RH. Utility and complications of long-stem humeral components in revision shoulder arthroplasty. J Shoulder Elbow Surg. 2013;22(7):e7-e12. doi:10.1016/j.jse.2012.10.034.
18. Stephens SP, Paisley KC, Giveans MR, Wirth MA. The effect of proximal humeral bone loss on revision reverse total shoulder arthroplasty. J Shoulder Elbow Surg. 2015;24(10):1519-1526. doi:10.1016/j.jse.2015.02.020.
19. Werner BS, Abdelkawi AF, Boehm D, et al. Long-term analysis of revision reverse shoulder arthroplasty using cemented long stems. J Shoulder Elbow Surg. 2017;26(2):273-278. doi:10.1016/j.jse.2016.05.015.
20. Cuff D, Levy JC, Gutiérrez S, Frankle MA. Torsional stability of modular and non-modular reverse shoulder humeral components in a proximal humeral bone loss model. J Shoulder Elbow Surg. 2011;20(4):646-651. doi:10.1016/j.jse.2010.10.026.
21. Kassab M, Dumaine V, Babinet A, Ouaknine M, Tomeno B, Anract P. Twenty nine shoulder reconstructions after resection of the proximal humerus for neoplasm with mean 7-year follow-up. Rev Chir Orthop Reparatrice Appar Mot. 2005;91(1):15-23.
22. Levy J, Frankle M, Mighell M, Pupello D. The use of the reverse shoulder prosthesis for the treatment of failed hemiarthroplasty for proximal humeral fracture. J Bone Joint Surg. 2007;98(2):292-300. doi:10.2106/JBJS.E.01310.
23. Gagey O, Pourjamasb B, Court C. Revision arthroplasty of the shoulder for painful glenoid loosening: a series of 14 cases with acromial prostheses reviewed at four year follow up. Rev Chir Reparatrice Appar Mot. 2001;87(3):221-228.
24. Abdeen A, Hoang BH, Althanasina EA, Morris CD, Boland PJ, Healey JH. Allograft-prosthesis composite reconstruction of the proximal part of the humerus: functional outcome and survivorship. J Bone Joint Surg Am. 2009;91(10):2406-2415. doi:10.2106/JBJS.H.00815.
25. Getty PJ, Peabody TD. Complications and functional outcomes of reconstruction with an osteoarticular allograft after intra-articular resection of the proximal aspect of the humerus. J Bone Joint Surg Am. 1999;81(8):1138-1146.
26. Chen CF, Chen WM, Cheng YC, Chiang CC, Huang CK, Chen TH. Extracorporeally irradiated autograft-prosthetic composite arthroplasty using AML® extensively porous-coated stem for proximal femur reconstruction: a clinical analysis of 14 patients. J Surg Oncol. 2009;100(5):418-422. doi:10.1002/jso.21351.
27. Kelly JD 2nd, Purchase RJ, Kam G, Norris TR. Alloprosthetic composite reconstruction using the reverse shoulder arthroplasty. Tech Shoulder Elbow Surg. 2009;10(1):5-10.
28. Cannon CP, Paraliticci GU, Lin PP, Lewis VO, Yasko AW. Functional outcome following endoprosthetic reconstruction of the proximal humerus. J Shoulder Elbow Surg. 2009;18(5):705-710. doi:10.1016/j.jse.2008.10.011.
29. Chao EY, Fuchs B, Rowland CM, Ilstrup DM, Pritchard DJ, Sim FH. Long-term results of segmental prosthesis fixation by extracortical bone-bridging and ingrowth. J Bone Joint Surg Am. 2004;86-A(5):948-955.
30. Goulding KA, Schwartz A, Hattrup SJ, et al. Use of compressive osseointegration endoprostheses for massive bone loss from tumor and failed arthroplasty: a viable option in the upper extremity. Clin Orthop Relat Res. 2017;475(6):1702-1711. doi:10.1007/s11999-017-5258-0.
31. Guven MF, Aslan L, Botanlioglu H, Kaynak G, Kesmezacar H, Babacan M. Functional outcome of reverse shoulder tumor prosthesis in the treatment of proximal humeral tumors. J Shoulder Elbow Surg. 2016;25(1):e1-e6. doi:10.1016/j.jse.2015.06.012.
32. Wang ML, Ballard BL, Kulidjian AA, Abrams RA. Upper extremity reconstruction with a humeral tumor endoprosthesis: a novel salvage procedure after multiple revisions of total shoulder and elbow replacement. J Shoulder Elbow Surg. 2011;20(1):e1-e8. doi:10.1016/j.jse.2010.07.018.
ABSTRACT
Reconstructing proximal humeral bone loss in the setting of shoulder arthroplasty can be a daunting task. Proposed techniques include long-stemmed humeral components, allograft-prosthesis composites (APCs), and modular endoprosthetic reconstruction. While unsupported long-stemmed components are at high risk for component loosening, APC reconstruction techniques have been reported with success. However, graft resorption and eventual failure are significant concerns. Modular endoprosthetic systems allow bone deficiencies to be reconstructed with metal, which may allow for a more durable reconstruction.
Continue to: Shoulder arthroplasty is an established procedure...
Shoulder arthroplasty is an established procedure with good results for restoring motion and decreasing pain for a variety of indications, including arthritis, fracture, posttraumatic sequelae, and tumor resection.1-4 As the population ages, the incidence of these shoulder disorders increases, with the incidence of total shoulder arthroplasty (TSA) and reverse total shoulder arthroplasty (RTSA) increasing at faster rates than that of hemiarthroplasty.5,6 These expanding indications will, in turn, result in more revisions that would present challenges for surgeons.1,7,8
The glenoid component is much more commonly revised than the humeral component; however, the humeral component may also require revision or removal to allow exposure of the glenoid component.9 Revision of the humeral stem might be required in cases of infection, periprosthetic fracture, dislocation, or aseptic loosening.10 The survival rate of humeral stems is generally >90% at 10 years and >80% at 20-year follow-up.7 Despite these good survival rates, a revision setting the humeral component requires exchange in about half of all cases.11
Humeral bone loss or deficiency is one of the challenges encountered in both primary and revision TSA. The amount of proximal bone loss can be determined by measuring the distance from the top of the prosthesis laterally to the intact lateral cortex.12 Methods for treating bone loss may involve monoblock revision stems to bypass the deficiency, allografts to rebuild the bone stock, or modular components or endoprostheses to restore the length and stability of the extremity.
Proximal humeral bone loss may make component positioning difficult and may create problems with fixation of the humeral stem. Proper sizing and placement of components are important for improving postoperative function, decreasing component wear and instability, and restoring humeral height and offset. Determining the appropriate center of rotation is important for the function and avoidance of impingement on the acromion, as well as for the restoration of the lever arm of the deltoid without overtensioning. The selection of components with the correct size and the accurate intraoperative placement are important to restore humeral height and offset.13,14 Components must be positioned <4 mm from the height of the greater tuberosity and <8 mm of offset to avoid compromising motion.15 De Wilde and Walch16 described about 3 patients who underwent revision reverse shoulder arthroplasty after failure of the humeral implant because of inadequate proximal humeral bone stock. They concluded that treatment of the bone loss was critical to achieve a successful outcome.
LONG-STEMMED HUMERAL COMPONENTS WITHOUT GRAFTING
There is some evidence indicating that humeral bone loss can be managed without allograft or augmentation. Owens and colleagues17 evaluated the use of intermediate- or long-stemmed humeral components for primary shoulder arthroplasty in 17 patients with severe proximal humeral bone loss and in 18 patients with large humeral canals. The stems were fully cemented, cemented distally only with proximal allografting, and uncemented. Indications for fully cemented stems were loss of proximal bone that could be filled with a proximal cement mantle to ensure a secure fit. Distal cement fixation was applied when there was significant proximal bone loss and was often supplemented with cancellous or structural allograft and/or cancellous autograft. Intraoperative complications included cortical perforation or cement extrusion in 16% of patients. Excellent or satisfactory results were obtained in 21 (60%) of the 35 shoulders, 14 (78%) of the 18 shoulders with large humeral canals, and 7 (41%) of the 17 shoulders with bone loss. All the 17 components implanted in patients with proximal humeral bone loss were stable with no gross loosening at an average 6-year follow-up.
Continue to: Budge and colleagues...
Budge and colleagues12 prospectively enrolled 15 patients with substantial proximal humeral bone loss (38.4 mm) who had conversion to RTSA without allografting after a failed TSA. All patients showed improvements in terms of the American Shoulder and Elbow Surgeons (ASES) score, subjective shoulder value, Constant score, and Visual Analog Scale (VAS) pain score, as well as an improved active range of motion (ROM) and good radiographic outcomes at 2-year follow-up. Although the complication rate was high (7 of 15), most of the complications were minor, with only 2 requiring operative intervention. The only component fracture occurred in a patient with a modular prosthesis that was unsupported by bone proximally. Budge and colleagues12 suggested that concerns about prosthetic fracture can be alleviated using a nonmodular monoblock design. No prosthesis-related complications occurred in their series, leading them to recommend monoblock humeral stems in patients with severe proximal humeral bone loss.
Stephens and colleagues18 reported revision to RTSA in 32 patients with hemiarthroplasties, half of whom had proximal humeral bone loss (average 36.3 mm). Of these 16 patients, 10 were treated with monoblock stems and 6 with modular components, with cement fixation of all implants. At an average 4-year follow-up, patients with proximal bone loss had improved motion and outcomes, and decreased pain compared to their preoperative condition; however, they had lower functional and pain ratings, as well as less ROM compared to those of patients with intact proximal bone stock. Complications occurred in 5 (31%) of those with bone loss and in 1 (0.6%) of those without bone loss. Three of the 16 patients with bone loss had humeral stem loosening, with 2 of the 3 having subsidence. Only 1 patient required return to the operating room for the treatment of a periprosthetic fracture sustained in a fall. Of the 16 patients with bone loss, 14 patients demonstrated scapular notching, which was severe in 5 of them. Because patients with altered humeral length and/or standard length stems had worse outcomes, the authors recommended longer stems to improve fixation and advocated the use of a long-stemmed monoblock prosthesis over an allograft-prosthesis composite (APC).18
However, Werner and colleagues19 reported high rates of loosening and distal migration with the use of long-stemmed humeral implants in 50 patients with revision RTSA. They noted periprosthetic lucency on radiographs in 48% of patients, with more than half of them requiring revision. In 6 patients with subsidence of the humeral shaft, revision was done using custom, modular implants, with the anatomic curve being further stabilized using distal screw and cable fixation to provide rotational stability.
Using a biomechanical model, Cuff and colleagues20 compared 3 RTSA humeral designs, 2 modular designs, and 1 monoblock design in 12 intact models and in 12 models simulating 5 cm of proximal humeral bone loss. They observed that proximal humeral bone loss led to increased humeral component micromotion and rotational instability. The bone loss group had 5 failures compared to 2 in the control group. All failures occurred in those with modular components, whereas those with monoblock implants had no failures.
ALLOGRAFT-PROSTHESIS COMPOSITE
Composite treatment with a humeral stem and a metaphyseal allograft was described by Kassab and colleagues21 in 2005 and Levy and colleagues22 in 2007 (Figures 1A-1C) in patients with tumor resections21 or failed hemiarthroplasties.22 Allograft was used when there was insufficient metaphyseal bone to support the implant, and a graft was fashioned and fixed with cerclage wire before the component was cemented in place. In the 29 patients reported by Levy and colleagues,22 subjective and objective measurements trended toward better results in those with an APC than in those with RTSA alone, but this difference did not reach statistical significance. Several authors have identified a lack of proximal humeral bone support as 1 of the 4 possible causes of failure, and suggested that the allograft provides structural support, serves as an attachment for subscapularis repair, and maximizes deltoid function by increasing lateral offset and setting the moment arm of the deltoid.21-23
Continue to: In a prospective study of RTSA...
In a prospective study of RTSA using structural allografts for failed hemiarthroplasty in 25 patients with an average bone loss of 5 cm, 19 patients (76%) reported good or excellent results, 5 reported satisfactory results, and 1 patient reported an unsatisfactory result.1 Patients had significantly improved forward flexion, abduction, and external rotation and improved outcome scores (ASES and SST). Graft incorporation was good, with 88% and 79% incorporation in the metaphysis and diaphysis, respectively. This technique used a fresh-frozen proximal humeral allograft to fashion a custom proximal block with a lateral step-cut, which was fixed around the stem with cables. A long stem and cement were used. If there was no cement mantle remaining or if the medial portion of the graft was longer than 120 mm, the cement mantle was completely excised. The allograft stump of the subscapularis was used to repair the subscapularis tendon either end-to-end or pants-over-vest. The authors noted that the subscapularis repair provided increased stability; the only dislocation not caused by trauma did not have an identifiable tendon to repair. In this manner, APC reconstruction provided structural and rotational support to the humeral stem as well as bone stock for future revision.1,20
One significant concern with APC reconstruction is the potential for graft resorption, which can lead to humeral stem loosening, loss of contour of the tuberosity, or weakening to the point of fracture.24,25 This may be worsened by stress shielding of the allograft by distal stem cement fixation.26 Other concerns include the cost of the allograft, increased risk of de novo infection, donor-to-host infection, increased operative time and complexity, and failure of allograft incorporation.
The use of a proximal femoral allograft has been described when there is a lack of a proximal humeral allograft.1,27 Kelly and colleagues27 described good results in 2 patients in whom proximal femoral allograft was used along with bone morphogenetic protein, cemented long-stemmed revision implants, and locking plate augmentation.
ENDOPROSTHETIC RECONSTRUCTION
Various forms of prosthetic augmentation have been described to compensate for proximal humeral bone loss, with the majority of reports involving the use of endoprosthetic replacement for tumor procedures.28-31 Use of endoprostheses has also been described for revision procedures in patients with rheumatoid arthritis with massive bone loss, demonstrating modest improvements compared to severe preoperative functional limitations.32
Tumor patients, as well as revision arthroplasty patients, may present difficulties with prosthetic fixation due to massive bone loss. Chao and colleagues29 reported about the long-term outcomes after the use of implants with a porous ongrowth surface and extracortical bridging bone graft in multiple anatomic locations, including the proximal humerus, the proximal and distal femur, and the femoral diaphysis. In 3 patients with proximal humeral reconstruction, the measured ongrowth was only 30%. Given the small number of patients with a proximal humerus, no statistical significance was observed in the prosthesis location and the amount of bony ongrowth, but it was far less than that in the lower extremity.
Continue to: Endoprosthetic reconstruction...
Endoprosthetic reconstruction of the proximal humerus is commonly used for tumor resection that resulted in bone loss. Cannon and colleagues28 reported a 97.6% survival rate at a mean follow-up of 30 months in 83 patients with modular and custom reconstruction with a unipolar head. The ROM was limited, but the prosthesis provided adequate stability to allow elbow and hand function. Proximal migration of the prosthetic head was noticed with increasing frequency as the length of follow-up increased.
Use of an endoprosthesis with compressive osteointegration (Zimmer Biomet) has been described in lower extremities and more recently with follow-up on several cases, including 2 proximal humeral replacements for oncology patients to treat severe bone loss. One case was for a primary sarcoma resection, and the other was for the revision of aseptic loosening of a previous endoprosthesis. Follow-up periods for these 2 patients were 54 and 141 months, respectively. Both these patients had complications, but both retained the endoprosthesis. The authors concluded that this is a salvage operation with high risk.30 In another study, Guven and colleagues31 reported about reverse endoprosthetic reconstruction for tumor resection with bone loss. The ROM was improved, with a mean active forward elevation of 96° (range, 30°-160°), an abduction of 88° (range, 30-160°), and an external rotation of 13° (range, 0°-20°).
Modular endoprostheses have been evaluated as a method for improving bone fixation and restoring soft-tissue tension, while avoiding the complications associated with traditional endoprostheses or allografts (Figures 2A-2D). These systems allow precise adjustments of length using different trial lengths intraoperatively to obtain proper stability and deltoid tension. Of the 12 patients in a 2 center study, 11 had cementless components inserted using a press-fit technique (unpublished data, J. Feldman). At a minimum 2-year follow-up, the patients had an average improvement in forward elevation from 78° to 97°. Excluding 2 patients with loss of the deltoid tuberosity, the forward elevation averaged 109°. There were significant improvements in internal rotation (from 18° to 38°), as well as in the scores of Quick Disabilities of the Arm, Shoulder and Hand (DASH), forward elevation strength, ASES, and VAS pain. However, the overall complication rate was 41%. Therefore, despite these promising early results, longer-term studies are needed.
CONCLUSION
Proximal humeral bone loss remains a significant challenge for the shoulder arthroplasty surgeon. In the setting of a primary or a revision arthroplasty, the bone stock must be thoroughly evaluated during preoperative planning, and a surgical plan for addressing the deficits should be developed. Because proximal humeral bone loss may contribute to prosthetic failure, every effort should be made to reconstitute the bone stock.16 If the bone loss is less extensive, impaction grafting may be considered. Options to address massive proximal humeral bone loss include APCs and endoprosthetic reconstruction. The use of an allograft allows subscapularis repair, which may help stabilize the shoulder and restore the natural lever arm, as well as the tension of the deltoid.1,21-23 In addition, it helps avoid rotational instability and micromotion and provides bone stock for future revisions. However, concern persists regarding allograft resorption over time. More recently, modular endoprosthetic reconstruction systems have been developed to address bone deficiency with metal augmentation. Early clinical results demonstrate a high complication rate in this complex cohort of patients, not unlike those in the series of APCs, but clinical outcomes were improved compared to those in historical series. Nevertheless, longer-term clinical studies are necessary to determine the role of these modular endoprosthetic implant systems.
1. Chacon A, Virani N, Shannon R, Levy JC, Pupello D, Frankle M. Revision arthroplasty with use of a reverse shoulder prosthesis-allograft composite. J Bone Joint Surg Am. 2009;91(1):119-127. doi:10.2106/JBJS.H.00094.
2. Hattrup SJ, Waldrop R, Sanchez-Sotelo J. Reverse total shoulder arthroplasty for posttraumatic sequelae. J Orthop Trauma. 2016;30(2):e41-e47. doi:10.1097/BOT.0000000000000416.
3. Sewell MD, Kang SN, Al-Hadithy N, et al. Management of peri-prosthetic fracture of the humerus with severe bone loss and loosening of the humeral component after total shoulder replacement. J Bone Joint Surg Br. 2012;94(10):1382-1389. doi:10.1302/0301-620X.94B10.29248.
4. Trompeter AJ, Gupta RR. The management of complex periprosthetic humeral fractures: a case series of strut allograft augmentation, and a review of the literature. Strategies Trauma Limb Reconstr. 2013;8(1):43-51. doi:10.1007/s11751-013-0155-x.
5. Khatib O, Onyekwelu I, Yu S, Zuckerman JD. Shoulder arthroplasty in New York State, 1991 to 2010: changing patterns of utilization. J Shoulder Elbow Surg. 2015;24(10):e286-e291. doi:10.1016/j.jse.2015.05.038.
6. Kim SH, Wise BL, Zhang Y, Szabo RM. Increasing incidence of shoulder arthroplasty in the United States. J Bone Joint Surg Am. 2011;93(24):2249-2254. doi:10.2106/JBJS.J.01994.
7. Cil A, Veillette CJ, Sanchez-Sotelo J, Sperling JW, Schleck CD, Cofield RH. Survivorship of the humeral component in shoulder arthroplasty. J Shoulder Elbow Surg. 2010;19(1):143-150. doi:10.1016/j.jse.2009.04.011.
8. Wright TW. Revision of humeral components in shoulder arthroplasty. Bull Hosp Jt Dis. 2013;71(2 suppl):S77-S81.
9. Duquin TR, Sperling JW. Revision shoulder arthroplasty—how to manage the humerus. Oper Tech Orthop. 2011;21(1):44-51. doi:10.1053/j.oto.2010.09.008.
10. Cil A, Veillette CJ, Sanchez-Sotelo J, Sperling JW, Schleck C, Cofield RH. Revision of the humeral component for aseptic loosening in arthroplasty of the shoulder. J Bone Joint Surg Br. 2009;91(1):75-81. doi:10.1302/0301-620X.91B1.21094.
11. Cofield RH. Revision of hemiarthroplasty to total shoulder arthroplasty. In: Zuckerman JD, ed. Advanced Reconstruction: Shoulder. 1st edition. Rosemont, IL: American Academy of Orthopaedic Surgeons; 2007;613-622.
12. Budge MD, Moravek JE, Zimel MN, Nolan EM, Wiater JM. Reverse total shoulder arthroplasty for the management of failed shoulder arthroplasty with proximal humeral bone loss: is allograft augmentation necessary? J Shoulder Elbow Surg. 2013;22(6):739-744. doi:10.1016/j.jse.2012.08.008.
13. Boileau P, Walch G. The three-dimensional geometry of the proximal humerus. Implications for surgical technique and prosthetic design. J Bone Joint Surg Br. 1997;79(5):857-865.
14. Throckmorton TW. Reconstructive procedures of the shoulder and elbow. In: Azar FM, Beaty JH, Canale ST, eds. Campbell’s Operative Orthopaedics. 13th edition. Philadelphia, PA: Elsevier; 2017;570-622.
15. Williams GR Jr, Wong KL, Pepe MD, et al. The effect of articular malposition after total shoulder arthroplasty on glenohumeral translations, range of motion, and subacromial impingement. J Shoulder Elbow Surg. 2001;10(5):399-409. doi:10.1067/mse.2001.116871.
16. De Wilde L, Walch G. Humeral prosthetic failure of reversed total shoulder arthroplasty: a report of three cases. J Shoulder Elbow Surg. 2006;15(2):260-264. doi:10.1016/j.jse.2005.07.014.
17. Owens CJ, Sperling JW, Cofield RH. Utility and complications of long-stem humeral components in revision shoulder arthroplasty. J Shoulder Elbow Surg. 2013;22(7):e7-e12. doi:10.1016/j.jse.2012.10.034.
18. Stephens SP, Paisley KC, Giveans MR, Wirth MA. The effect of proximal humeral bone loss on revision reverse total shoulder arthroplasty. J Shoulder Elbow Surg. 2015;24(10):1519-1526. doi:10.1016/j.jse.2015.02.020.
19. Werner BS, Abdelkawi AF, Boehm D, et al. Long-term analysis of revision reverse shoulder arthroplasty using cemented long stems. J Shoulder Elbow Surg. 2017;26(2):273-278. doi:10.1016/j.jse.2016.05.015.
20. Cuff D, Levy JC, Gutiérrez S, Frankle MA. Torsional stability of modular and non-modular reverse shoulder humeral components in a proximal humeral bone loss model. J Shoulder Elbow Surg. 2011;20(4):646-651. doi:10.1016/j.jse.2010.10.026.
21. Kassab M, Dumaine V, Babinet A, Ouaknine M, Tomeno B, Anract P. Twenty nine shoulder reconstructions after resection of the proximal humerus for neoplasm with mean 7-year follow-up. Rev Chir Orthop Reparatrice Appar Mot. 2005;91(1):15-23.
22. Levy J, Frankle M, Mighell M, Pupello D. The use of the reverse shoulder prosthesis for the treatment of failed hemiarthroplasty for proximal humeral fracture. J Bone Joint Surg. 2007;98(2):292-300. doi:10.2106/JBJS.E.01310.
23. Gagey O, Pourjamasb B, Court C. Revision arthroplasty of the shoulder for painful glenoid loosening: a series of 14 cases with acromial prostheses reviewed at four year follow up. Rev Chir Reparatrice Appar Mot. 2001;87(3):221-228.
24. Abdeen A, Hoang BH, Althanasina EA, Morris CD, Boland PJ, Healey JH. Allograft-prosthesis composite reconstruction of the proximal part of the humerus: functional outcome and survivorship. J Bone Joint Surg Am. 2009;91(10):2406-2415. doi:10.2106/JBJS.H.00815.
25. Getty PJ, Peabody TD. Complications and functional outcomes of reconstruction with an osteoarticular allograft after intra-articular resection of the proximal aspect of the humerus. J Bone Joint Surg Am. 1999;81(8):1138-1146.
26. Chen CF, Chen WM, Cheng YC, Chiang CC, Huang CK, Chen TH. Extracorporeally irradiated autograft-prosthetic composite arthroplasty using AML® extensively porous-coated stem for proximal femur reconstruction: a clinical analysis of 14 patients. J Surg Oncol. 2009;100(5):418-422. doi:10.1002/jso.21351.
27. Kelly JD 2nd, Purchase RJ, Kam G, Norris TR. Alloprosthetic composite reconstruction using the reverse shoulder arthroplasty. Tech Shoulder Elbow Surg. 2009;10(1):5-10.
28. Cannon CP, Paraliticci GU, Lin PP, Lewis VO, Yasko AW. Functional outcome following endoprosthetic reconstruction of the proximal humerus. J Shoulder Elbow Surg. 2009;18(5):705-710. doi:10.1016/j.jse.2008.10.011.
29. Chao EY, Fuchs B, Rowland CM, Ilstrup DM, Pritchard DJ, Sim FH. Long-term results of segmental prosthesis fixation by extracortical bone-bridging and ingrowth. J Bone Joint Surg Am. 2004;86-A(5):948-955.
30. Goulding KA, Schwartz A, Hattrup SJ, et al. Use of compressive osseointegration endoprostheses for massive bone loss from tumor and failed arthroplasty: a viable option in the upper extremity. Clin Orthop Relat Res. 2017;475(6):1702-1711. doi:10.1007/s11999-017-5258-0.
31. Guven MF, Aslan L, Botanlioglu H, Kaynak G, Kesmezacar H, Babacan M. Functional outcome of reverse shoulder tumor prosthesis in the treatment of proximal humeral tumors. J Shoulder Elbow Surg. 2016;25(1):e1-e6. doi:10.1016/j.jse.2015.06.012.
32. Wang ML, Ballard BL, Kulidjian AA, Abrams RA. Upper extremity reconstruction with a humeral tumor endoprosthesis: a novel salvage procedure after multiple revisions of total shoulder and elbow replacement. J Shoulder Elbow Surg. 2011;20(1):e1-e8. doi:10.1016/j.jse.2010.07.018.
TAKE-HOME POINTS
- Proximal humeral bone loss presents a significant challenge for the shoulder arthroplasty surgeon.
- Unsupported long-stemmed humeral components in this setting are prone to early loosening.
- APCs can rebuild proximal humeral bone stock, but have concerns with graft resorption and long-term failure.
- Modular endoprosthetic reconstruction of proximal humeral bone loss potentially allows those deficiencies to be addressed in a more durable fashion.
- Longer-term and larger studies are needed to determine the optimal reconstruction technique for proximal humeral bone loss.

Use of a Novel Magnesium-Based Resorbable Bone Cement for Augmenting Anchor and Tendon Fixation
ABSTRACT
The aim of this study was to assess the efficacy and safety of a novel magnesium-based resorbable bone cement (OsteoCrete, Bone Solutions Incorporated) for anchor and tendon fixation.
Cadaveric humeral testing involved straight pull-to-failure of rotator cuff suture anchors; OsteoCrete was injected through one anchor, and a second anchor served as the uninjected control. Testing was conducted 15 minutes post-injection. A canine preclinical model was used to evaluate the safety of the following parameters: Rotator cuff repair: A double-row technique was used to repair transected infraspinatus tendons; OsteoCrete was injected through both anchors in one limb, and the contralateral limb served as the uninjected control. Biceps tenodesis: The transected biceps tendon was implanted into a proximal humeral socket with a transcortical button; OsteoCrete was injected into the socket of one limb, and a screw was used for final fixation in the contralateral control limb. Nondestructive biomechanical testing and histologic assessment were performed after 12 weeks.
OsteoCrete-augmented anchors showed significantly higher load-to-failure compared to that with uninjected controls. In cadaveric humeri with reduced bone quality, OsteoCrete increased the mean load-to-failure by 99%. Within the preclinical model, there were no complications or statistically significant biomechanical/histologic differences between the techniques.
OsteoCrete has the potential for safely providing improved suture anchor and tissue fixation in patients with poor bone or tissue quality.
Continue to: Calcium phosphate bone void fillers...
Calcium phosphate bone void fillers have been commonly used in orthopedic surgery for several applications, including, but not limited to, a variety of fracture fixation or augmentation procedures.1-8 Continuing research on calcium phosphates has evidenced that the addition of magnesium phosphate to the formulation results in improved reactivity of the bone void filler. An in vitro study demonstrated enhanced attachment and proliferation of MG63 osteoblast-like cells on calcium magnesium phosphate cement (CMPC), in comparison with calcium phosphate cement (CPC), along with increased cellular alkaline phosphatase activity.9 The authors further explored the proliferation rates of MG63 cells by comparing CMPC with CPC and magnesium phosphate cement (MPC), and observed significantly increased proliferation of cells on CMPC. They also compared CMPC and CPC using a rabbit bone void model and observed substantial CMPC resorption with new bone formation at the 3-month time point and further reported that the majority of the defect had filled with new bone at 6 months, whereas CPC resulted in <10% new bone formation after 6 months.10 The authors continued to study the differences between CPC, MPC, and CMPC and identified increased proliferation of bone marrow stromal cells (bMSCs), when the cells were associated with CMPC and MPC, and when compared to that with CPC. The osteogenic differentiation of bMSCs was highest in the CMPC and CPC groups, when compared to that in the MPC group, with no significant difference between the CMPC and CPC groups. The authors also compared these 3 different formulations using a rabbit maxillary sinus floor elevation model, in which CMPC resulted in increased new bone formation and mineralization compared to that with CPC and MPC, which was further enhanced with the addition of bMSCs.11
These studies highlight the importance of having both a magnesium phosphate and a calcium phosphate component for a resorbable cement intended for use as a bone void filler. The rationale behind this strategy is related to the release of magnesium ions from the magnesium phosphate component. Magnesium has been shown to increase the proliferation of bMSCs, improve the attachment and growth of osteoblasts, stimulate the proteins involved in bone regeneration, enhance new bone formation, and boost bone mineralization.12,13
OsteoCrete (Bone Solutions Incorporation) is a novel CMPC composed of magnesium oxide, monopotassium phosphate, monosodium phosphate, hydroxyapatite, and sucrose. OsteoCrete has been demonstrated to significantly increase peak torque-to-failure of stainless-steel cortical bone screw fixation, when compared with screw fixation without augmentation and screw fixation with calcium phosphate augmentation using an in vivo equine model. In the same study, the authors showed that OsteoCrete resulted in an interface toughness that was significantly increased compared to that with no treatment, CPC augmentation, and polymethylmethacrylate (PMMA) augmentation. At 6 months after implantation, woven bone had replaced 69% of the OsteoCrete at the screw interface, compared to 44% of that with CPC.14 An equine study examined the effects of OsteoCrete on bone stability and healing using a metatarsal osteotomy model; the study reported significantly improved radiographic callus formation and a greater amount of new bone formation within the fracture gap when compared to that with CPC augmentation or no augmentation. OsteoCrete also secured the fragment significantly better than the CPC and control groups based on a decreased fracture gap over time.15 Another study using a preclinical anterior cruciate ligament (ACL) reconstruction model reported that OsteoCrete resulted in significantly better new bone formation in the tibial tunnel, a smaller amount of fibrous tissue, more cartilage formation at the tendon-bone interface, and a higher ultimate load-to-failure compared to that with standard ACL reconstruction in the contralateral limb after 6 weeks.16 OsteoCrete and PMMA were evaluated in terms of biomechanical fixation of a stemless humeral prosthesis, with data showing that both groups have higher failure loads, failure displacements, and failure cycles when compared to those with the control, nonaugmented group.17 Another preclinical model evaluated cranial bone flap augmentation with 2 resorbable cements and highlighted faster cement resorption and replacement with bone, along with superior stability within the OsteoCrete group compared to that with CPC.18 In a preclinical bone void study conducted for obtaining US Food and Drug Administration 510(k) clearance, OsteoCrete resulted in 83% greater resorption than that with CPC after 12 weeks and 35% greater resorption at 26 weeks, with 84% of OsteoCrete being resorbed and replaced with woven or lamellar mineralized bone of normal morphology at the 26-week time point (unpublished data provided by Bone Solutions Incorporated [BSI]).
These data indicate that CMPCs such as OsteoCrete appear to have potential benefits for augmenting the healing of bone implants and bone soft tissue. Therefore, the objective of this study was to assess the safety and efficacy of OsteoCrete in applications for the augmentation of anchor and tendon fixation in rotator cuff repair and biceps tenodesis procedures, respectively. Improving healing for these 2 commonly performed procedures would be of great benefit in improving the functional outcomes and mitigating the complications and morbidity.
MATERIALS AND METHODS
IN VITRO STUDY METHODS
Cadaveric humeri (N = 12, six matched pairs) of females (age, 70-75 years) were warmed to 37°C prior to testing. Two 4.75-mm vented anchors (SwiveLock, Arthrex) with FiberTape were implanted into a lateral row position (anterior and posterior anchor positioning) of a double-row rotator cuff repair within the greater tuberosity. One anchor was injected with 1 ml of OsteoCrete–after preparation according to the manufacturer’s instructions–through the cannulation channel after placement, and the other anchor served as the uninjected control for each humerus. For the six matched pairs, the OsteoCrete group and the control group were rotated with respect to anterior vs posterior location within the lateral row position. After 15 minutes of the injection, straight pull-to-failure (12 in/min) was performed. Data were compared between the groups for significant (P < .05) differences using t-tests and Pearson correlation.
Continue to: IN VIVO STUDY METHODS
IN VIVO STUDY METHODS
With Institutional Animal Care and Use Committee approval, adult (age, 2-4 years) purpose-bred dogs (N = 8) underwent aseptic surgery of both forelimbs for rotator cuff (infraspinatus) tendon repair (Figure 1) and biceps tenodesis (Figure 2). For the rotator cuff repair, two 4.75-mm vented anchors (1 medial and 1 lateral) with FiberTape were used in a modified double-row technique to repair the acutely transected infraspinatus tendon. In one limb, 1 ml of OsteoCrete was injected through both anchors; the other limb served as the uninjected control. For the biceps tenodesis procedure, the long head of the biceps tendon was transected at its origin and whip-stitched. The tendon was transposed and inserted into a 7-mm diameter socket drilled into the proximal humerus using a tension-slide technique with a transcortical button for fixation. In one limb, 1 ml of OsteoCrete was injected into the socket prior to final tensioning and tying. In the contralateral limb, a 7-mm interference screw (Bio-Tenodesis™ Screw, Arthrex) was inserted into the socket after tensioning and tying. The dogs were allowed to perform out-of-kennel monitored exercise daily for a period of 12 weeks after surgery and were then sacrificed.
 tendon repair with OsteoCrete (Bone Solutions Incorporated) augmentation")
The infraspinatus and biceps bone-tendon-muscle units were excised en bloc. Custom-designed jigs were used for biomechanical testing of the bone-tendon-muscle units along the anatomical vector of muscle contraction. Optical markers were mounted at standardized anatomical locations. Elongation of the repair site was defined as the change in distance between markers and was measured to 0.01-mm resolution using an optical tracking system (Optotrak Certus, NDI), synchronized with measurement of the applied tension load. The bone-tendon-muscle units were loaded in tension to 3-mm elongation at a displacement controlled rate of 0.01 mm/s. Load at 1-mm, 2-mm, and 3-mm displacement of the tendon-bone junction was extracted from the load vs the displacement curve of each sample. Stiffness was calculated as the slope of the linear portion of the load vs the displacement curve.19,20
 augmentation")
For histologic assessments, sections of each treatment site were obtained using a microsaw and alternated between decalcified and non-decalcified processing. For decalcified bone processing, formalin-fixed tissues were placed in 10% ethylenediaminetetraacetic acid with phosphate-buffered saline for 39 days and then processed routinely for the assessment of sections stained with hematoxylin and eosin (H&E), toluidine blue, and picrosirius red. For non-decalcified bone processing, the tissues were dehydrated through a series of graded ethyl alcohol solutions, embedded in PMMA, sectioned, and stained with toluidine blue and Goldner’s trichrome. Two pathologists who were blinded to the clinical application and the differences between techniques assessed the histologic sections and scored each section using the modified Bonar score that assesses cell morphology, collagen arrangement, cellularity, vascularity, and extracellular matrix using a 15-point scale, where a higher score indicates more pathology.21
Categorical data were compared for detecting statistically significant differences using the rank sum test. Continuous data were compared for identifying statistically significant differences using the t-test or one-way ANOVA. Significance was set at P < .05.
RESULTS
IN VITRO RESULTS
OsteoCrete-augmented anchors (mean = 225 N; range, 158-287 N) had significantly (P < .001) higher pull-out load-to-failure compared to that in the uninjected controls (mean = 161 N; range, 68-202 N), which translated to a 50% mean increase (range, 3%-134%) in load-to-failure (Table 1). For humeri with reduced bone quality (control anchors that failed at <160 N, 4 humeri), the mean increase in load-to-failure for OsteoCrete-augmented anchors was 99% (range, 58%-135%), with the difference between mean values being again significantly different (OsteoCrete mean = 205 N; control mean = 110 N, P < .001). When the control and OsteoCrete load-to-failure values were compared using Pearson correlation, a significantly strong positive correlation (r = 0.66, P = 0.02) was detected. When the control load-to-failure values were compared with its percent increase value when OsteoCrete was used, there was a significantly very strong negative correlation (r = −0.90, P < .001).
Table 1. Cadaveric Lateral Row Rotator Cuff Anchor Pull-To-Failure; Testing Occurred 15 Minutes Post-Injection
| Humerus No. | Control (N) | OsteoCrete (N)a | Percent Increase |
| 1-Right (PA) | 197.28 | 278.73 | 41% |
| 1-Left (AP) | 152.62 | 241.72 | 58% |
| 2-Right (PA) | 178.60 | 196.03 | 10% |
| 2-Left (AP) | 170.10 | 175.57 | 3% |
| 3-Right (PA) | 67.70 | 158.31 | 134% |
| 3-Left (AP) | 74.24 | 173.08 | 133% |
| 4-Right (PA) | 195.81 | 248.12 | 27% |
| 4-Left (AP) | 201.95 | 209.42 | 4% |
| 5-Right (PA) | 173.30 | 220.59 | 27% |
| 5-Left (AP) | 146.61 | 247.37 | 69% |
| 6-Right (PA) | 171.03 | 266.14 | 56% |
| 6-Left (AP) | 199.99 | 286.91 | 43% |
| Average | 160.77 + 45.60 | 225.17 + 43.08 | 50% + 44 |
aOsteoCrete (Bone Solutions Incorporated) resulted in significantly increased (P < 0.001) pull-to-failure. Abbreviations: AP, control anchor located in anterior position, OsteoCrete anchor located in posterior position; PA, control anchor located in posterior position, OsteoCrete anchor located in anterior position.
Continue to: IN VIVO RESULTS
IN VIVO RESULT
No intraoperative or postoperative complications were noted. All repairs were found to be intact based on the gross assessment and the completed biomechanical testing without failure. No statistically significant (P > 0.3) biomechanical differences were found between the techniques (Table 2). Histologic assessments showed low-to-mild pathology scores for all sites with no statistically significant (P > 0.3) differences between the techniques (Table 2). Both control and OsteoCrete rotator cuff repairs demonstrated tendon-to-bone integration via fibrous connective tissue attachment to bone. All anchors were in place with no evidence for loosening, tunnel expansion, or cyst formation. OsteoCrete-augmented anchor repairs were associated with cement remaining within their lumens along with a thin layer of cement interposed between the anchor and the bone interface around their entire periphery. The cement-bone interface was discrete with typical inflammatory cell infiltrate without evidence for infection, membrane or cyst formation, or other untoward pathologic responses. In the OsteoCrete biceps tenodesis group, the tendons filled the tunnels with a thin layer of cement remaining interposed between the tendon and the bone interface around the entire periphery. The tendon-cement-bone interface was discrete with typical inflammatory cell infiltrates and without evidence for infection, membrane or cyst formation, or other untoward pathologic responses. Tendon-to-bone integration was not observed in the control or OsteoCrete biceps tenodesis groups at the 12-week study endpoint. Representative histologic images of the rotator cuff tendon repairs and biceps tenodesis procedures are shown in Figures 3A, 3B and Figures 4A, 4B, respectively.
Table 2. Biomechanical Testing And Histologic Scoring Of Rotator Cuff And Biceps Tendon Repairs In A Preclinical Model
| Procedure | Force (N) at 1 mm | Force (N) at 2 mm | Force (N) at 3 mm | Stiffness (N/mm) | Histologic Score |
| Rotator Cuff - Control | 14.0 + 3.3 | 19.3 + 5.5 | 25.0 + 7.0 | 5.4 + 2.0 | 4.6 + 1.1 |
| Rotator Cuff - OsteoCrete (Bone Solutions Incorporated) | 14.8 + 3.7 | 20.4 + 6.0 | 26.4 + 8.5 | 6.3 + 2.5 | 3.9 + 1.7 |
| Biceps - Control | 23.1 + 6.2 | 35.5 + 8.5 | 52.6 + 15.0 | 17.8 + 6.4 | 3.4 + 1.2 |
| Biceps - OsteoCrete | 22.4 + 7.3 | 36.8 + 10.1 | 57.8 + 16.0 | 21.1 + 8.5 | 3.4 + 0.7 |
There were no significant differences (P < 0.05) between groups. Histologic scoring based on a 15-point scale with higher scores indicating more pathology.
DISCUSSION
The results of this study highlight the safety and efficacy of OsteoCrete in applications for the augmentation of anchor and tendon fixation in rotator cuff repair and biceps tenodesis procedures, respectively. Anchors augmented with OsteoCrete resulted in significantly increased load-to-failure pull-out strength 15 minutes after insertion. In addition, a very strong negative correlation was found between the percentage of improved load-to-failure after OsteoCrete injection and the bone quality of the humerus, which was based on the control load-to-failure values. In the validated preclinical model used in this study, OsteoCrete-based fixation was found to be noninferior to current standard-of-care techniques and was not associated with any untoward pathologic responses of humeral bone, rotator cuff tendon, or biceps tendon based on the biomechanical and histologic analyses. These data highlight the functional efficacy and biocompatibility of OsteoCrete when used for these common indications.
 Control and (B) OsteoCrete (Bone Solutions Incorporated) rotator cuff repair histologic sections stained with Goldner's trichrome.")
More than 270,000 rotator cuff procedures have been reported to be performed in the US annually (average patient age: 61 years for women, 56 years for men).22 Rotator cuff repair procedures have been associated with a 20% failure rate, with one of the causes being related to an inability for the tendon to heal, even with strong initial fixation.23 Rotator cuff repair techniques are being continuously optimized with the goal of improving patient outcomes. This goal is being realized, primarily with respect to re-tear rates.24,25 However, even with advanced techniques, there are still relatively high rates of failure reported, with increasing patient age serving as one of the primary negative prognostic factors.26 An older patient population is associated with decreased bone mass and strength, and postmenopausal females have decreased bone quality; these factors are associated with higher rotator cuff failure rates due to poor tendon healing, with anchor fixation failure also playing a role.27-29 Therefore, it is critically important to develop methods for augmenting implant and tendon fixation to bone to achieve functional healing. The results of this study suggest that OsteoCrete provides a valid method for accomplishing this goal based on the observation that proximal humeral anchor fixation was improved by 50% in load-to-failure 15 minutes post-injection with an even more profound impact on the anchors placed in poor-quality bone (99% increased load-to-failure 15 minutes post-injection). It is probable that the degree of improvement in fixation strength would be even greater 1 day after fixation, since the strength of OsteoCrete continues to increase over the first 30 hours of curing.
 Control and (B) OsteoCrete (Bone Solutions Incorporated) biceps tenodesis histologic sections stained with Goldner's trichrome.")
Based on the preclinical animal model data of this study, OsteoCrete augmentation of rotator cuff anchor fixation had no untoward effects on tendon healing or function and can be considered as safe for use. Previously published data also suggest that OsteoCrete may improve osseous replacement of anchors as a result of magnesium ion release, which can drive adjacent attachment and growth of osteoblasts, leading to enhanced new bone formation.9-16,18 As such, surgeons may consider this means of anchor augmentation in situations of questionable or poor-quality bone and/or when accelerated postoperative rehabilitation protocols are desired.
A very low early incidence failure rate (1.2%) has been reported when a distal biceps tendon rupture is repaired using cortical suspensory fixation in conjunction with an interference screw.30 When an early re-rupture does occur, the most common explanation for failure tends to be a lack of patient compliance, with excessive force being placed on the repair.31 This study was not meant to investigate the methods to increase the strength of a biceps tendon repair using OsteoCrete but instead to replace the interference screw with OsteoCrete in a safe and noninferior manner. Primary fixation was still dependent on cortical suspensory fixation; however, OsteoCrete was used to help aid in stabilization of the tendon without the need for interference screw fixation. Although rare, osteolysis and perianchor cyst formation have been reported adjacent to nonbiodegradable anchors (PEEK), along with several types of biodegradable anchors (PLLA, hydroxyapatite plus PLLA, β-tricalcium phosphate plus PLLA, and polyglycolic acid; the latter of the 3 resulted in the lowest incidence of perianchor cyst formation) in the shoulder and elbow.32-34 Whenever osteolysis or cyst formation occurs around an anchor, it leads to decreased bone volume and potential adjacent bone weakness, which may act as a stress riser, thus increasing the risk for fracture. This potential is probably more of a concern within the proximal radius where there is a decreased amount of bone stock around the anchor.34
Continue to: In this study...
In this study, a short-term 12-week analysis revealed no significant differences in the nondestructive biomechanical testing and histologic analysis results between the use of OsteoCrete and the use of a tenodesis anchor. These results indicate the potential for using OsteoCrete as an anchor replacement. The biceps tendon did not react negatively to the OsteoCrete material, which indicated that OsteoCrete can be used adjacent to tendons without the concern of weakening the tendon due to an inflammatory reaction. This being said, tendon-to-bone integration was not evident at this early time point. It would be helpful to further explore the potential of this technique with a longer-term study investigating tendon-to-bone integration in more detail. Ideally, a long-term study would reveal an increased amount of new bone formation within the socket when compared to that with the anchor comparison, similar to the results reported by Gulotta and colleagues16 when using a tendon for ACL reconstruction with OsteoCrete.
We do note several limitations in this study. The dogs used in this study were healthy with normal bone and tendon morphology, the tendons were transected and repaired during the course of the same surgery, and only 1 early time point was evaluated. Additional investigations continuing the characterization of these clinical applications using an osteopenic or osteoporotic preclinical model with chronic tendon pathology and longer-term evaluation are now warranted based on the positive findings of this initial work.
CONCLUSION
OsteoCrete augmentation significantly improved initial rotator cuff anchor fixation (human in vitro) and was safe and effective for anchor and tendon fixation in rotator cuff tendon repair and biceps tenodesis procedures (canine in vivo), respectively, when compared with the current standard-of-care. Of note, the significant improvements associated with OsteoCrete were the greatest in poor-quality bone. Based on these results and considering the previously discussed limitations, it can be concluded that OsteoCrete has the potential for safely providing improved suture anchor and tissue fixation in patients with poor bone or tissue quality. Further in vivo study toward potential clinical applications is warranted.
1. Russell TA, Leighton RK, Group A-BTPFS. Comparison of autogenous bone graft and endothermic calcium phosphate cement for defect augmentation in tibial plateau fractures. A multicenter, prospective, randomized study. J Bone Joint Surg Am. 2008; 90(10):2057-2061. doi:10.2106/JBJS.G.01191.
2. Egol KA, Sugi MT, Ong CC, Montero N, Davidovitch R, Zuckerman JD. Fracture site augmentation with calcium phosphate cement reduces screw penetration after open reduction-internal fixation of proximal humeral fractures. J Shoulder Elbow Surg. 2012; 21(6):741-748. doi:10.1016/j.jse.2011.09.017.
3. Cassidy C, Jupiter JB, Cohen M, et al. Norian SRS cement compared with conventional fixation in distal radial fractures. A randomized study. J Bone Joint Surg Am. 2003;85-A(11):2127-2137.
4. Mattsson P, Alberts A, Dahlberg G, Sohlman M, Hyldahl HC, Larsson S. Resorbable cement for the augmentation of internally-fixed unstable trochanteric fractures. A prospective, randomised multicentre study. J Bone Joint Surg Br. 2005;87(9):1203-1209.
5. Cohen SB, Sharkey PF. Subchondroplasty for treating bone marrow lesions. J Knee Surg. 2016;29(07):555-563. doi:10.1302/0301-620X.87B9.15792.
6. Guida P, Ragozzino R, Sorrentino B, et al. Three-in-One minimally invasive approach to surgical treatment of pediatric pathological fractures with wide bone loss through bone cysts: ESIN, curettage and packing with injectable HA bone substitute. A retrospective series of 116 cases. Injury. 2016;47(6):1222-1228. doi:10.1016/j.injury.2016.01.006.
7. Maestretti G, Sutter P, Monnard E, et al. A prospective study of percutaneous balloon kyphoplasty with calcium phosphate cement in traumatic vertebral fractures: 10-year results. Eur Spine J. 2014;23(6):1354-1360. doi:10.1007/s00586-014-3206-1.
8. Nakano M, Hirano N, Zukawa M, et al. Vertebroplasty using calcium phosphate cement for osteoporotic vertebral fractures: study of outcomes at a minimum follow-up of two years. Asian Spine J. 2012;6(1):34-42. doi:10.4184/asj.2012.6.1.34.
9. Jia J, Zhou H, Wei J, et al. Development of magnesium calcium phosphate biocement for bone regeneration. J R Soc Interface. 2010;7(49):1171-1180. doi:10.1098/rsif.2009.0559.
10. Wu F, Wei J, Guo H, Chen F, Hong H, Liu C. Self-setting bioactive calcium-magnesium phosphate cement with high strength and degradability for bone regeneration. Acta Biomater. 2008;4(6):1873-1884. doi:10.1016/j.actbio.2008.06.020.
11. Zeng D, Xia L, Zhang W, et al. Maxillary sinus floor elevation using a tissue-engineered bone with calcium-magnesium phosphate cement and bone marrow stromal cells in rabbits. Tissue Eng Part A. 2012;18(7-8):870-881. doi:10.1089/ten.TEA.2011.0379.
12. Yoshizawa S, Brown A, Barchowsky A, Sfeir C. Magnesium ion stimulation of bone marrow stromal cells enhances osteogenic activity, simulating the effect of magnesium alloy degradation. Acta Biomater. 2014;10(6):2834-2842. doi:10.1016/j.actbio.2014.02.002.
13. Liao J, Qu Y, Chu B, Zhang X, Qian Z. Biodegradable CSMA/PECA/Graphene porous hybrid scaffold for cartilage tissue engineering. Sci Rep. 2015;5:9879. doi:10.1038/srep09879.
14. Hirvinen LJ, Litsky AS, Samii VF, Weisbrode SE, Bertone AL. Influence of bone cements on bone-screw interfaces in the third metacarpal and third metatarsal bones of horses. Am J Vet Res. 2009;70(8):964-972. doi:10.2460/ajvr.70.8.964.
15. Waselau M, Samii VF, Weisbrode SE, Litsky AS, Bertone AL. Effects of a magnesium adhesive cement on bone stability and healing following a metatarsal osteotomy in horses. Am J Vet Res. 2007;68(4):370-378. doi:10.2460/ajvr.68.4.370.
16. Gulotta LV, Kovacevic D, Ying L, Ehteshami JR, Montgomery S, Rodeo SA. Augmentation of tendon-to-bone healing with a magnesium-based bone adhesive. Am J Sports Med. 2008;36(7):1290-1297. doi:10.1177/0363546508314396.
17. Kim MS, Kovacevic D, Milks RA, et al. Bone graft substitute provides metaphyseal fixation for a stemless humeral implant. Orthopedics. 2015;38(7):e597-e603. doi:10.3928/01477447-20150701-58.
18. Schendel SA, Peauroi J. Magnesium-based bone cement and bone void filler: preliminary experimental studies. J Craniofac Surg. 2009;20(2):461-464. doi:10.1097/SCS.0b013e31819b9819.
19. Pfeiffer FM, Smith MJ, Cook JL, Kuroki K. The histologic and biomechanical response of two commercially available small glenoid anchors for use in labral repairs. J Shoulder Elbow Surg. 2014;23(8):1156-1161. doi:10.1016/j.jse.2013.12.036.
20. Smith MJ, Cook JL, Kuroki K, et al. Comparison of a novel bone-tendon allograft with a human dermis-derived patch for repair of chronic large rotator cuff tears using a canine model. Arthroscopy. 2012;28(2):169-177. doi:10.1016/j.arthro.2011.08.296.
21. Fearon A, Dahlstrom JE, Twin J, Cook J, Scott A. The Bonar score revisited: region of evaluation significantly influences the standardized assessment of tendon degeneration. J Sci Med Sport. 2014;17(4):346-350. doi:10.1016/j.jsams.2013.07.008.
22. Colvin AC, Egorova N, Harrison AK, Moskowitz A, Flatow EL. National trends in rotator cuff repair. J Bone Joint Surg Am. 2012;94(3):227-233. doi:10.2106/JBJS.J.00739.
23. Lädermann A, Denard PJ, Burkhart SS. Management of failed rotator cuff repair: a systematic review. J ISAKOS. 2016;1(1):32-37. doi:10.1136/jisakos-2015-000027.
24. Franceschi F, Papalia R, Franceschetti E, et al. Double-Row repair lowers the retear risk after accelerated rehabilitation. Am J Sports Med. 2016;44(4):948-956. doi:10.1177/0363546515623031.
25. Wang E, Wang L, Gao P, Li Z, Zhou X, Wang S. Single-versus double-row arthroscopic rotator cuff repair in massive tears. Med Sci Monit. 2015;21:1556-1561. doi:10.12659/MSM.893058.
26. Abtahi AM, Granger EK, Tashjian RZ. Factors affecting healing after arthroscopic rotator cuff repair. World J Orthop. 2015;6(2):211-220. doi:10.5312/wjo.v6.i2.211.
27. Chung SW, Oh JH, Gong HS, Kim JY, Kim SH. Factors affecting rotator cuff healing after arthroscopic repair: osteoporosis as one of the independent risk factors. Am J Sports Med. 2011;39(10):2099-2107. doi:10.1177/0363546511415659.
28. Tsiouri C, Mok DH. Early pullout of lateral row knotless anchor in rotator cuff repair. Int J Shoulder Surg. 2009;3(3):63-65. doi:10.4103/0973-6042.59972.
29. Boskey AL, Coleman R. Aging and bone. J Dent Res. 2010;89(12):1333-1348. doi:10.1177/0022034510377791.
30. Cusick MC, Cottrell BJ, Cain RA, Mighell MA. Low incidence of tendon rerupture after distal biceps repair by cortical button and interference screw. J Shoulder Elbow Surg. 2014;23(10):1532-1536. doi:10.1016/j.jse.2014.04.013.
31. Hinchey JW, Aronowitz JG, Sanchez-Sotelo J, Morrey BF. Re-rupture rate of primarily repaired distal biceps tendon injuries. J Shoulder Elbow Surg. 2014;23(6):850-854. doi:10.1016/j.jse.2014.02.006.
32. Shahrulazua A, Duckworth D, Bokor DJ. Perianchor radiolucency following PEEK suture anchor application associated with recurrent shoulder dislocation: a case report. Clin Ter. 2014;165(1):31-34. doi:10.7471/CT.2014.1658.
33. Kim SH, Kim dY, Kwon JE, Park JS, Oh JH. Perianchor cyst formation around biocomposite biodegradable suture anchors after rotator cuff repair. Am J Sports Med. 2015;43(12):2907-2912. doi:10.1177/0363546515608484
34. Potapov A, Laflamme YG, Gagnon S, Canet F, Rouleau DM. Progressive osteolysis of the radius after distal biceps tendon repair with the bioabsorbable screw. J Shoulder Elbow Surg. 2011;20(5):819-826. doi:10.1016/j.jse.2011.02.021.
ABSTRACT
The aim of this study was to assess the efficacy and safety of a novel magnesium-based resorbable bone cement (OsteoCrete, Bone Solutions Incorporated) for anchor and tendon fixation.
Cadaveric humeral testing involved straight pull-to-failure of rotator cuff suture anchors; OsteoCrete was injected through one anchor, and a second anchor served as the uninjected control. Testing was conducted 15 minutes post-injection. A canine preclinical model was used to evaluate the safety of the following parameters: Rotator cuff repair: A double-row technique was used to repair transected infraspinatus tendons; OsteoCrete was injected through both anchors in one limb, and the contralateral limb served as the uninjected control. Biceps tenodesis: The transected biceps tendon was implanted into a proximal humeral socket with a transcortical button; OsteoCrete was injected into the socket of one limb, and a screw was used for final fixation in the contralateral control limb. Nondestructive biomechanical testing and histologic assessment were performed after 12 weeks.
OsteoCrete-augmented anchors showed significantly higher load-to-failure compared to that with uninjected controls. In cadaveric humeri with reduced bone quality, OsteoCrete increased the mean load-to-failure by 99%. Within the preclinical model, there were no complications or statistically significant biomechanical/histologic differences between the techniques.
OsteoCrete has the potential for safely providing improved suture anchor and tissue fixation in patients with poor bone or tissue quality.
Continue to: Calcium phosphate bone void fillers...
Calcium phosphate bone void fillers have been commonly used in orthopedic surgery for several applications, including, but not limited to, a variety of fracture fixation or augmentation procedures.1-8 Continuing research on calcium phosphates has evidenced that the addition of magnesium phosphate to the formulation results in improved reactivity of the bone void filler. An in vitro study demonstrated enhanced attachment and proliferation of MG63 osteoblast-like cells on calcium magnesium phosphate cement (CMPC), in comparison with calcium phosphate cement (CPC), along with increased cellular alkaline phosphatase activity.9 The authors further explored the proliferation rates of MG63 cells by comparing CMPC with CPC and magnesium phosphate cement (MPC), and observed significantly increased proliferation of cells on CMPC. They also compared CMPC and CPC using a rabbit bone void model and observed substantial CMPC resorption with new bone formation at the 3-month time point and further reported that the majority of the defect had filled with new bone at 6 months, whereas CPC resulted in <10% new bone formation after 6 months.10 The authors continued to study the differences between CPC, MPC, and CMPC and identified increased proliferation of bone marrow stromal cells (bMSCs), when the cells were associated with CMPC and MPC, and when compared to that with CPC. The osteogenic differentiation of bMSCs was highest in the CMPC and CPC groups, when compared to that in the MPC group, with no significant difference between the CMPC and CPC groups. The authors also compared these 3 different formulations using a rabbit maxillary sinus floor elevation model, in which CMPC resulted in increased new bone formation and mineralization compared to that with CPC and MPC, which was further enhanced with the addition of bMSCs.11
These studies highlight the importance of having both a magnesium phosphate and a calcium phosphate component for a resorbable cement intended for use as a bone void filler. The rationale behind this strategy is related to the release of magnesium ions from the magnesium phosphate component. Magnesium has been shown to increase the proliferation of bMSCs, improve the attachment and growth of osteoblasts, stimulate the proteins involved in bone regeneration, enhance new bone formation, and boost bone mineralization.12,13
OsteoCrete (Bone Solutions Incorporation) is a novel CMPC composed of magnesium oxide, monopotassium phosphate, monosodium phosphate, hydroxyapatite, and sucrose. OsteoCrete has been demonstrated to significantly increase peak torque-to-failure of stainless-steel cortical bone screw fixation, when compared with screw fixation without augmentation and screw fixation with calcium phosphate augmentation using an in vivo equine model. In the same study, the authors showed that OsteoCrete resulted in an interface toughness that was significantly increased compared to that with no treatment, CPC augmentation, and polymethylmethacrylate (PMMA) augmentation. At 6 months after implantation, woven bone had replaced 69% of the OsteoCrete at the screw interface, compared to 44% of that with CPC.14 An equine study examined the effects of OsteoCrete on bone stability and healing using a metatarsal osteotomy model; the study reported significantly improved radiographic callus formation and a greater amount of new bone formation within the fracture gap when compared to that with CPC augmentation or no augmentation. OsteoCrete also secured the fragment significantly better than the CPC and control groups based on a decreased fracture gap over time.15 Another study using a preclinical anterior cruciate ligament (ACL) reconstruction model reported that OsteoCrete resulted in significantly better new bone formation in the tibial tunnel, a smaller amount of fibrous tissue, more cartilage formation at the tendon-bone interface, and a higher ultimate load-to-failure compared to that with standard ACL reconstruction in the contralateral limb after 6 weeks.16 OsteoCrete and PMMA were evaluated in terms of biomechanical fixation of a stemless humeral prosthesis, with data showing that both groups have higher failure loads, failure displacements, and failure cycles when compared to those with the control, nonaugmented group.17 Another preclinical model evaluated cranial bone flap augmentation with 2 resorbable cements and highlighted faster cement resorption and replacement with bone, along with superior stability within the OsteoCrete group compared to that with CPC.18 In a preclinical bone void study conducted for obtaining US Food and Drug Administration 510(k) clearance, OsteoCrete resulted in 83% greater resorption than that with CPC after 12 weeks and 35% greater resorption at 26 weeks, with 84% of OsteoCrete being resorbed and replaced with woven or lamellar mineralized bone of normal morphology at the 26-week time point (unpublished data provided by Bone Solutions Incorporated [BSI]).
These data indicate that CMPCs such as OsteoCrete appear to have potential benefits for augmenting the healing of bone implants and bone soft tissue. Therefore, the objective of this study was to assess the safety and efficacy of OsteoCrete in applications for the augmentation of anchor and tendon fixation in rotator cuff repair and biceps tenodesis procedures, respectively. Improving healing for these 2 commonly performed procedures would be of great benefit in improving the functional outcomes and mitigating the complications and morbidity.
MATERIALS AND METHODS
IN VITRO STUDY METHODS
Cadaveric humeri (N = 12, six matched pairs) of females (age, 70-75 years) were warmed to 37°C prior to testing. Two 4.75-mm vented anchors (SwiveLock, Arthrex) with FiberTape were implanted into a lateral row position (anterior and posterior anchor positioning) of a double-row rotator cuff repair within the greater tuberosity. One anchor was injected with 1 ml of OsteoCrete–after preparation according to the manufacturer’s instructions–through the cannulation channel after placement, and the other anchor served as the uninjected control for each humerus. For the six matched pairs, the OsteoCrete group and the control group were rotated with respect to anterior vs posterior location within the lateral row position. After 15 minutes of the injection, straight pull-to-failure (12 in/min) was performed. Data were compared between the groups for significant (P < .05) differences using t-tests and Pearson correlation.
Continue to: IN VIVO STUDY METHODS
IN VIVO STUDY METHODS
With Institutional Animal Care and Use Committee approval, adult (age, 2-4 years) purpose-bred dogs (N = 8) underwent aseptic surgery of both forelimbs for rotator cuff (infraspinatus) tendon repair (Figure 1) and biceps tenodesis (Figure 2). For the rotator cuff repair, two 4.75-mm vented anchors (1 medial and 1 lateral) with FiberTape were used in a modified double-row technique to repair the acutely transected infraspinatus tendon. In one limb, 1 ml of OsteoCrete was injected through both anchors; the other limb served as the uninjected control. For the biceps tenodesis procedure, the long head of the biceps tendon was transected at its origin and whip-stitched. The tendon was transposed and inserted into a 7-mm diameter socket drilled into the proximal humerus using a tension-slide technique with a transcortical button for fixation. In one limb, 1 ml of OsteoCrete was injected into the socket prior to final tensioning and tying. In the contralateral limb, a 7-mm interference screw (Bio-Tenodesis™ Screw, Arthrex) was inserted into the socket after tensioning and tying. The dogs were allowed to perform out-of-kennel monitored exercise daily for a period of 12 weeks after surgery and were then sacrificed.
The infraspinatus and biceps bone-tendon-muscle units were excised en bloc. Custom-designed jigs were used for biomechanical testing of the bone-tendon-muscle units along the anatomical vector of muscle contraction. Optical markers were mounted at standardized anatomical locations. Elongation of the repair site was defined as the change in distance between markers and was measured to 0.01-mm resolution using an optical tracking system (Optotrak Certus, NDI), synchronized with measurement of the applied tension load. The bone-tendon-muscle units were loaded in tension to 3-mm elongation at a displacement controlled rate of 0.01 mm/s. Load at 1-mm, 2-mm, and 3-mm displacement of the tendon-bone junction was extracted from the load vs the displacement curve of each sample. Stiffness was calculated as the slope of the linear portion of the load vs the displacement curve.19,20
For histologic assessments, sections of each treatment site were obtained using a microsaw and alternated between decalcified and non-decalcified processing. For decalcified bone processing, formalin-fixed tissues were placed in 10% ethylenediaminetetraacetic acid with phosphate-buffered saline for 39 days and then processed routinely for the assessment of sections stained with hematoxylin and eosin (H&E), toluidine blue, and picrosirius red. For non-decalcified bone processing, the tissues were dehydrated through a series of graded ethyl alcohol solutions, embedded in PMMA, sectioned, and stained with toluidine blue and Goldner’s trichrome. Two pathologists who were blinded to the clinical application and the differences between techniques assessed the histologic sections and scored each section using the modified Bonar score that assesses cell morphology, collagen arrangement, cellularity, vascularity, and extracellular matrix using a 15-point scale, where a higher score indicates more pathology.21
Categorical data were compared for detecting statistically significant differences using the rank sum test. Continuous data were compared for identifying statistically significant differences using the t-test or one-way ANOVA. Significance was set at P < .05.
RESULTS
IN VITRO RESULTS
OsteoCrete-augmented anchors (mean = 225 N; range, 158-287 N) had significantly (P < .001) higher pull-out load-to-failure compared to that in the uninjected controls (mean = 161 N; range, 68-202 N), which translated to a 50% mean increase (range, 3%-134%) in load-to-failure (Table 1). For humeri with reduced bone quality (control anchors that failed at <160 N, 4 humeri), the mean increase in load-to-failure for OsteoCrete-augmented anchors was 99% (range, 58%-135%), with the difference between mean values being again significantly different (OsteoCrete mean = 205 N; control mean = 110 N, P < .001). When the control and OsteoCrete load-to-failure values were compared using Pearson correlation, a significantly strong positive correlation (r = 0.66, P = 0.02) was detected. When the control load-to-failure values were compared with its percent increase value when OsteoCrete was used, there was a significantly very strong negative correlation (r = −0.90, P < .001).
Table 1. Cadaveric Lateral Row Rotator Cuff Anchor Pull-To-Failure; Testing Occurred 15 Minutes Post-Injection
| Humerus No. | Control (N) | OsteoCrete (N)a | Percent Increase |
| 1-Right (PA) | 197.28 | 278.73 | 41% |
| 1-Left (AP) | 152.62 | 241.72 | 58% |
| 2-Right (PA) | 178.60 | 196.03 | 10% |
| 2-Left (AP) | 170.10 | 175.57 | 3% |
| 3-Right (PA) | 67.70 | 158.31 | 134% |
| 3-Left (AP) | 74.24 | 173.08 | 133% |
| 4-Right (PA) | 195.81 | 248.12 | 27% |
| 4-Left (AP) | 201.95 | 209.42 | 4% |
| 5-Right (PA) | 173.30 | 220.59 | 27% |
| 5-Left (AP) | 146.61 | 247.37 | 69% |
| 6-Right (PA) | 171.03 | 266.14 | 56% |
| 6-Left (AP) | 199.99 | 286.91 | 43% |
| Average | 160.77 + 45.60 | 225.17 + 43.08 | 50% + 44 |
aOsteoCrete (Bone Solutions Incorporated) resulted in significantly increased (P < 0.001) pull-to-failure. Abbreviations: AP, control anchor located in anterior position, OsteoCrete anchor located in posterior position; PA, control anchor located in posterior position, OsteoCrete anchor located in anterior position.
Continue to: IN VIVO RESULTS
IN VIVO RESULT
No intraoperative or postoperative complications were noted. All repairs were found to be intact based on the gross assessment and the completed biomechanical testing without failure. No statistically significant (P > 0.3) biomechanical differences were found between the techniques (Table 2). Histologic assessments showed low-to-mild pathology scores for all sites with no statistically significant (P > 0.3) differences between the techniques (Table 2). Both control and OsteoCrete rotator cuff repairs demonstrated tendon-to-bone integration via fibrous connective tissue attachment to bone. All anchors were in place with no evidence for loosening, tunnel expansion, or cyst formation. OsteoCrete-augmented anchor repairs were associated with cement remaining within their lumens along with a thin layer of cement interposed between the anchor and the bone interface around their entire periphery. The cement-bone interface was discrete with typical inflammatory cell infiltrate without evidence for infection, membrane or cyst formation, or other untoward pathologic responses. In the OsteoCrete biceps tenodesis group, the tendons filled the tunnels with a thin layer of cement remaining interposed between the tendon and the bone interface around the entire periphery. The tendon-cement-bone interface was discrete with typical inflammatory cell infiltrates and without evidence for infection, membrane or cyst formation, or other untoward pathologic responses. Tendon-to-bone integration was not observed in the control or OsteoCrete biceps tenodesis groups at the 12-week study endpoint. Representative histologic images of the rotator cuff tendon repairs and biceps tenodesis procedures are shown in Figures 3A, 3B and Figures 4A, 4B, respectively.
Table 2. Biomechanical Testing And Histologic Scoring Of Rotator Cuff And Biceps Tendon Repairs In A Preclinical Model
| Procedure | Force (N) at 1 mm | Force (N) at 2 mm | Force (N) at 3 mm | Stiffness (N/mm) | Histologic Score |
| Rotator Cuff - Control | 14.0 + 3.3 | 19.3 + 5.5 | 25.0 + 7.0 | 5.4 + 2.0 | 4.6 + 1.1 |
| Rotator Cuff - OsteoCrete (Bone Solutions Incorporated) | 14.8 + 3.7 | 20.4 + 6.0 | 26.4 + 8.5 | 6.3 + 2.5 | 3.9 + 1.7 |
| Biceps - Control | 23.1 + 6.2 | 35.5 + 8.5 | 52.6 + 15.0 | 17.8 + 6.4 | 3.4 + 1.2 |
| Biceps - OsteoCrete | 22.4 + 7.3 | 36.8 + 10.1 | 57.8 + 16.0 | 21.1 + 8.5 | 3.4 + 0.7 |
There were no significant differences (P < 0.05) between groups. Histologic scoring based on a 15-point scale with higher scores indicating more pathology.
DISCUSSION
The results of this study highlight the safety and efficacy of OsteoCrete in applications for the augmentation of anchor and tendon fixation in rotator cuff repair and biceps tenodesis procedures, respectively. Anchors augmented with OsteoCrete resulted in significantly increased load-to-failure pull-out strength 15 minutes after insertion. In addition, a very strong negative correlation was found between the percentage of improved load-to-failure after OsteoCrete injection and the bone quality of the humerus, which was based on the control load-to-failure values. In the validated preclinical model used in this study, OsteoCrete-based fixation was found to be noninferior to current standard-of-care techniques and was not associated with any untoward pathologic responses of humeral bone, rotator cuff tendon, or biceps tendon based on the biomechanical and histologic analyses. These data highlight the functional efficacy and biocompatibility of OsteoCrete when used for these common indications.
More than 270,000 rotator cuff procedures have been reported to be performed in the US annually (average patient age: 61 years for women, 56 years for men).22 Rotator cuff repair procedures have been associated with a 20% failure rate, with one of the causes being related to an inability for the tendon to heal, even with strong initial fixation.23 Rotator cuff repair techniques are being continuously optimized with the goal of improving patient outcomes. This goal is being realized, primarily with respect to re-tear rates.24,25 However, even with advanced techniques, there are still relatively high rates of failure reported, with increasing patient age serving as one of the primary negative prognostic factors.26 An older patient population is associated with decreased bone mass and strength, and postmenopausal females have decreased bone quality; these factors are associated with higher rotator cuff failure rates due to poor tendon healing, with anchor fixation failure also playing a role.27-29 Therefore, it is critically important to develop methods for augmenting implant and tendon fixation to bone to achieve functional healing. The results of this study suggest that OsteoCrete provides a valid method for accomplishing this goal based on the observation that proximal humeral anchor fixation was improved by 50% in load-to-failure 15 minutes post-injection with an even more profound impact on the anchors placed in poor-quality bone (99% increased load-to-failure 15 minutes post-injection). It is probable that the degree of improvement in fixation strength would be even greater 1 day after fixation, since the strength of OsteoCrete continues to increase over the first 30 hours of curing.
Based on the preclinical animal model data of this study, OsteoCrete augmentation of rotator cuff anchor fixation had no untoward effects on tendon healing or function and can be considered as safe for use. Previously published data also suggest that OsteoCrete may improve osseous replacement of anchors as a result of magnesium ion release, which can drive adjacent attachment and growth of osteoblasts, leading to enhanced new bone formation.9-16,18 As such, surgeons may consider this means of anchor augmentation in situations of questionable or poor-quality bone and/or when accelerated postoperative rehabilitation protocols are desired.
A very low early incidence failure rate (1.2%) has been reported when a distal biceps tendon rupture is repaired using cortical suspensory fixation in conjunction with an interference screw.30 When an early re-rupture does occur, the most common explanation for failure tends to be a lack of patient compliance, with excessive force being placed on the repair.31 This study was not meant to investigate the methods to increase the strength of a biceps tendon repair using OsteoCrete but instead to replace the interference screw with OsteoCrete in a safe and noninferior manner. Primary fixation was still dependent on cortical suspensory fixation; however, OsteoCrete was used to help aid in stabilization of the tendon without the need for interference screw fixation. Although rare, osteolysis and perianchor cyst formation have been reported adjacent to nonbiodegradable anchors (PEEK), along with several types of biodegradable anchors (PLLA, hydroxyapatite plus PLLA, β-tricalcium phosphate plus PLLA, and polyglycolic acid; the latter of the 3 resulted in the lowest incidence of perianchor cyst formation) in the shoulder and elbow.32-34 Whenever osteolysis or cyst formation occurs around an anchor, it leads to decreased bone volume and potential adjacent bone weakness, which may act as a stress riser, thus increasing the risk for fracture. This potential is probably more of a concern within the proximal radius where there is a decreased amount of bone stock around the anchor.34
Continue to: In this study...
In this study, a short-term 12-week analysis revealed no significant differences in the nondestructive biomechanical testing and histologic analysis results between the use of OsteoCrete and the use of a tenodesis anchor. These results indicate the potential for using OsteoCrete as an anchor replacement. The biceps tendon did not react negatively to the OsteoCrete material, which indicated that OsteoCrete can be used adjacent to tendons without the concern of weakening the tendon due to an inflammatory reaction. This being said, tendon-to-bone integration was not evident at this early time point. It would be helpful to further explore the potential of this technique with a longer-term study investigating tendon-to-bone integration in more detail. Ideally, a long-term study would reveal an increased amount of new bone formation within the socket when compared to that with the anchor comparison, similar to the results reported by Gulotta and colleagues16 when using a tendon for ACL reconstruction with OsteoCrete.
We do note several limitations in this study. The dogs used in this study were healthy with normal bone and tendon morphology, the tendons were transected and repaired during the course of the same surgery, and only 1 early time point was evaluated. Additional investigations continuing the characterization of these clinical applications using an osteopenic or osteoporotic preclinical model with chronic tendon pathology and longer-term evaluation are now warranted based on the positive findings of this initial work.
CONCLUSION
OsteoCrete augmentation significantly improved initial rotator cuff anchor fixation (human in vitro) and was safe and effective for anchor and tendon fixation in rotator cuff tendon repair and biceps tenodesis procedures (canine in vivo), respectively, when compared with the current standard-of-care. Of note, the significant improvements associated with OsteoCrete were the greatest in poor-quality bone. Based on these results and considering the previously discussed limitations, it can be concluded that OsteoCrete has the potential for safely providing improved suture anchor and tissue fixation in patients with poor bone or tissue quality. Further in vivo study toward potential clinical applications is warranted.
1. Russell TA, Leighton RK, Group A-BTPFS. Comparison of autogenous bone graft and endothermic calcium phosphate cement for defect augmentation in tibial plateau fractures. A multicenter, prospective, randomized study. J Bone Joint Surg Am. 2008; 90(10):2057-2061. doi:10.2106/JBJS.G.01191.
2. Egol KA, Sugi MT, Ong CC, Montero N, Davidovitch R, Zuckerman JD. Fracture site augmentation with calcium phosphate cement reduces screw penetration after open reduction-internal fixation of proximal humeral fractures. J Shoulder Elbow Surg. 2012; 21(6):741-748. doi:10.1016/j.jse.2011.09.017.
3. Cassidy C, Jupiter JB, Cohen M, et al. Norian SRS cement compared with conventional fixation in distal radial fractures. A randomized study. J Bone Joint Surg Am. 2003;85-A(11):2127-2137.
4. Mattsson P, Alberts A, Dahlberg G, Sohlman M, Hyldahl HC, Larsson S. Resorbable cement for the augmentation of internally-fixed unstable trochanteric fractures. A prospective, randomised multicentre study. J Bone Joint Surg Br. 2005;87(9):1203-1209.
5. Cohen SB, Sharkey PF. Subchondroplasty for treating bone marrow lesions. J Knee Surg. 2016;29(07):555-563. doi:10.1302/0301-620X.87B9.15792.
6. Guida P, Ragozzino R, Sorrentino B, et al. Three-in-One minimally invasive approach to surgical treatment of pediatric pathological fractures with wide bone loss through bone cysts: ESIN, curettage and packing with injectable HA bone substitute. A retrospective series of 116 cases. Injury. 2016;47(6):1222-1228. doi:10.1016/j.injury.2016.01.006.
7. Maestretti G, Sutter P, Monnard E, et al. A prospective study of percutaneous balloon kyphoplasty with calcium phosphate cement in traumatic vertebral fractures: 10-year results. Eur Spine J. 2014;23(6):1354-1360. doi:10.1007/s00586-014-3206-1.
8. Nakano M, Hirano N, Zukawa M, et al. Vertebroplasty using calcium phosphate cement for osteoporotic vertebral fractures: study of outcomes at a minimum follow-up of two years. Asian Spine J. 2012;6(1):34-42. doi:10.4184/asj.2012.6.1.34.
9. Jia J, Zhou H, Wei J, et al. Development of magnesium calcium phosphate biocement for bone regeneration. J R Soc Interface. 2010;7(49):1171-1180. doi:10.1098/rsif.2009.0559.
10. Wu F, Wei J, Guo H, Chen F, Hong H, Liu C. Self-setting bioactive calcium-magnesium phosphate cement with high strength and degradability for bone regeneration. Acta Biomater. 2008;4(6):1873-1884. doi:10.1016/j.actbio.2008.06.020.
11. Zeng D, Xia L, Zhang W, et al. Maxillary sinus floor elevation using a tissue-engineered bone with calcium-magnesium phosphate cement and bone marrow stromal cells in rabbits. Tissue Eng Part A. 2012;18(7-8):870-881. doi:10.1089/ten.TEA.2011.0379.
12. Yoshizawa S, Brown A, Barchowsky A, Sfeir C. Magnesium ion stimulation of bone marrow stromal cells enhances osteogenic activity, simulating the effect of magnesium alloy degradation. Acta Biomater. 2014;10(6):2834-2842. doi:10.1016/j.actbio.2014.02.002.
13. Liao J, Qu Y, Chu B, Zhang X, Qian Z. Biodegradable CSMA/PECA/Graphene porous hybrid scaffold for cartilage tissue engineering. Sci Rep. 2015;5:9879. doi:10.1038/srep09879.
14. Hirvinen LJ, Litsky AS, Samii VF, Weisbrode SE, Bertone AL. Influence of bone cements on bone-screw interfaces in the third metacarpal and third metatarsal bones of horses. Am J Vet Res. 2009;70(8):964-972. doi:10.2460/ajvr.70.8.964.
15. Waselau M, Samii VF, Weisbrode SE, Litsky AS, Bertone AL. Effects of a magnesium adhesive cement on bone stability and healing following a metatarsal osteotomy in horses. Am J Vet Res. 2007;68(4):370-378. doi:10.2460/ajvr.68.4.370.
16. Gulotta LV, Kovacevic D, Ying L, Ehteshami JR, Montgomery S, Rodeo SA. Augmentation of tendon-to-bone healing with a magnesium-based bone adhesive. Am J Sports Med. 2008;36(7):1290-1297. doi:10.1177/0363546508314396.
17. Kim MS, Kovacevic D, Milks RA, et al. Bone graft substitute provides metaphyseal fixation for a stemless humeral implant. Orthopedics. 2015;38(7):e597-e603. doi:10.3928/01477447-20150701-58.
18. Schendel SA, Peauroi J. Magnesium-based bone cement and bone void filler: preliminary experimental studies. J Craniofac Surg. 2009;20(2):461-464. doi:10.1097/SCS.0b013e31819b9819.
19. Pfeiffer FM, Smith MJ, Cook JL, Kuroki K. The histologic and biomechanical response of two commercially available small glenoid anchors for use in labral repairs. J Shoulder Elbow Surg. 2014;23(8):1156-1161. doi:10.1016/j.jse.2013.12.036.
20. Smith MJ, Cook JL, Kuroki K, et al. Comparison of a novel bone-tendon allograft with a human dermis-derived patch for repair of chronic large rotator cuff tears using a canine model. Arthroscopy. 2012;28(2):169-177. doi:10.1016/j.arthro.2011.08.296.
21. Fearon A, Dahlstrom JE, Twin J, Cook J, Scott A. The Bonar score revisited: region of evaluation significantly influences the standardized assessment of tendon degeneration. J Sci Med Sport. 2014;17(4):346-350. doi:10.1016/j.jsams.2013.07.008.
22. Colvin AC, Egorova N, Harrison AK, Moskowitz A, Flatow EL. National trends in rotator cuff repair. J Bone Joint Surg Am. 2012;94(3):227-233. doi:10.2106/JBJS.J.00739.
23. Lädermann A, Denard PJ, Burkhart SS. Management of failed rotator cuff repair: a systematic review. J ISAKOS. 2016;1(1):32-37. doi:10.1136/jisakos-2015-000027.
24. Franceschi F, Papalia R, Franceschetti E, et al. Double-Row repair lowers the retear risk after accelerated rehabilitation. Am J Sports Med. 2016;44(4):948-956. doi:10.1177/0363546515623031.
25. Wang E, Wang L, Gao P, Li Z, Zhou X, Wang S. Single-versus double-row arthroscopic rotator cuff repair in massive tears. Med Sci Monit. 2015;21:1556-1561. doi:10.12659/MSM.893058.
26. Abtahi AM, Granger EK, Tashjian RZ. Factors affecting healing after arthroscopic rotator cuff repair. World J Orthop. 2015;6(2):211-220. doi:10.5312/wjo.v6.i2.211.
27. Chung SW, Oh JH, Gong HS, Kim JY, Kim SH. Factors affecting rotator cuff healing after arthroscopic repair: osteoporosis as one of the independent risk factors. Am J Sports Med. 2011;39(10):2099-2107. doi:10.1177/0363546511415659.
28. Tsiouri C, Mok DH. Early pullout of lateral row knotless anchor in rotator cuff repair. Int J Shoulder Surg. 2009;3(3):63-65. doi:10.4103/0973-6042.59972.
29. Boskey AL, Coleman R. Aging and bone. J Dent Res. 2010;89(12):1333-1348. doi:10.1177/0022034510377791.
30. Cusick MC, Cottrell BJ, Cain RA, Mighell MA. Low incidence of tendon rerupture after distal biceps repair by cortical button and interference screw. J Shoulder Elbow Surg. 2014;23(10):1532-1536. doi:10.1016/j.jse.2014.04.013.
31. Hinchey JW, Aronowitz JG, Sanchez-Sotelo J, Morrey BF. Re-rupture rate of primarily repaired distal biceps tendon injuries. J Shoulder Elbow Surg. 2014;23(6):850-854. doi:10.1016/j.jse.2014.02.006.
32. Shahrulazua A, Duckworth D, Bokor DJ. Perianchor radiolucency following PEEK suture anchor application associated with recurrent shoulder dislocation: a case report. Clin Ter. 2014;165(1):31-34. doi:10.7471/CT.2014.1658.
33. Kim SH, Kim dY, Kwon JE, Park JS, Oh JH. Perianchor cyst formation around biocomposite biodegradable suture anchors after rotator cuff repair. Am J Sports Med. 2015;43(12):2907-2912. doi:10.1177/0363546515608484
34. Potapov A, Laflamme YG, Gagnon S, Canet F, Rouleau DM. Progressive osteolysis of the radius after distal biceps tendon repair with the bioabsorbable screw. J Shoulder Elbow Surg. 2011;20(5):819-826. doi:10.1016/j.jse.2011.02.021.
TAKE-HOME POINTS
- OsteoCrete, a magnesium-based resorbable bone cement, has potential to safely and effectively augment suture anchor fixation.
- OsteoCrete increases anchor pull-out strength within 15 minutes of injection.
- OsteoCrete has a more profound impact on anchors when used within bone of decreased density and quality.
- OsteoCrete does not result in any untoward effect when placed near, or in contact with, rotator cuff or biceps tendons during fixation procedures.
- OsteoCrete can potentially be used to replace the anchor within tenodesis procedures that utilize transcortical button fixation in addition to anchor fixation.
