User login
Stigma in dementia: It’s time to talk about it
Dementia is a family of disorders characterized by a decline in multiple cognitive abilities that significantly interferes with an individual’s functioning. An estimated 50 million people are living with a dementia worldwide.1 Alzheimer’s disease (AD) is the leading cause of dementia, accounting for approximately two-thirds of dementia cases.1 These numbers are expected to increase dramatically in the upcoming decades.
Sociologist Erving Goffman defined stigma as “an attribute, behaviour, or reputation which is socially discrediting in a particular way: it causes an individual to be mentally classified by others in an undesirable, rejected stereotype rather than in an accepted, normal one.”2 Goffman2 defined 3 broad categories of stigma: public, self, and courtesy (Table 12).

Considerable evidence shows that the combined impact of having dementia and the negative response to the diagnosis significantly undermines an individual’s psychosocial well-being and quality of life.3 Persons with dementia (PwD) commonly report a loss of identity and self-worth, and stigma appears to deepen this distress.3 Stigma also negatively affects individuals associated with PwD, including family members and professionals. In this article, we discuss the impact of dementia-related stigma, and steps you can take to address it, including implementing person-centered clinical practices, promoting anti-stigma messaging campaigns, and advocating for public policy action to improve the lives of PwD and their families.
A pervasive problem
Although the Alzheimer’s Society International and the World Health Organization acknowledge that stigma has a central role in defining the experience of AD, how stigma may present, how clinicians and researchers can recognize and measure stigma, and how to best combat it have been understudied.3-5 A recent systematic literature review examined worldwide evidence on dementia-related stigma over the past decade.6 Hermann et al6 found that health care providers and the general public may hold stigmatizing attitudes toward PwD, and that stigma may be particularly harsh among racial and ethnic minorities, although the literature is scarce in this area. Cultural factors may also worsen stigma, and stigma may be associated with reduced awareness of dementia services and reduced help-seeking among minority groups.7,8 Studies show that stigmatizing attitudes are more pronounced in people with limited knowledge of dementia, in those with little contact with PwD, in men, in younger individuals, and in the context of cultural interpretations of dementia.6 Health care providers can also sometimes contribute to the perpetuation of stigma.6
In terms of standardized scales or instruments for evaluating dementia-related stigma, there is no uniformly accepted “gold standard” measure, which makes it difficult to compare studies.6 In order to effectively study efforts to reduce stigma, researchers need to identify and establish a consensus on rating scales for evaluating stigma among PwD, caregivers, and the general public. Three instruments that may be used for this purpose are the Family Stigma in Alzheimer’s Disease Scale (FS-ADS),9 the Stigma Scale for Chronic Illness (SSCI),10 and the Perceptions Regarding Investigational Screening for Memory in Primary Care (PRISM-PC).11
The detrimental effects of stigma
Burgener et al12 reported that personal stigma impacted functioning and quality of life in PwD. Higher levels of stigma were associated with higher anxiety, depression, and behavioral symptoms and lower self-esteem, social support, participation in activities, personal control, and physical health.12 Personal characteristics that may affect stigma include gender, location (rural vs urban), ethnicity, education level, and living arrangements (alone vs with family).12
In a subset of PwD with early-stage memory loss (n = 22), Burgener and Buckwalter13 found that 42% of participants were reluctant to reveal their diagnosis to others, with some fearing they would no longer be allowed to live alone and would be “sent to a facility.” In addition, 46% indicated they did not want “to be talked about like they were not there.” More than 50% of participants reported changes in their social network after receiving the diagnosis, including reducing activities and limiting types of contacts (ie, telephone only) or interacting only when “people come to me.” Participants were most comfortable with good friends “who understand” and persons within their faith communities. When asked about how they were treated by family members, >50% of participants described being treated differently, including loss of financial independence, more limited contact, and being “treated like a baby” by their children, who in general were uncomfortable talking about the diagnosis.
Continue to: In a recent study...
In a recent study by Harper et al,14 stigma was prevalent in the experience of PwD. One participant disclosed:
“I think there is [are] people I know who don’t ask me to go places or do things ’cause I have a dementia…I think lots of people don’t know what dementia is and I think it scares them ’cause they think of it as crazy. It hurts…”
Another participant said:
“I have had friends for over thirty years. They have turned their backs on me…we used to go for walks and they would phone me and go for coffee. Now I don’t hear from any of them…those aren’t true friends…true friends will stand behind you, not in front of you. That’s why I am not happy.”
Overall, quantitative and qualitative findings indicate multiple, detrimental effects of personal stigma on PwD. These effects fit well with measures of self-stigma, including social rejection (eg, being treated differently, participating in fewer activities, and having fewer friends), internalized shame (eg, being treated like a child, having fewer responsibilities, others acting as if dementia is “contagious”), and social isolation (eg, being less outgoing, feeling more comfortable in small groups, having limited social contacts).15
Continue to: Receiving a diagnosis of dementia...
Receiving a diagnosis of dementia presents patients and their families with psychological and social challenges.16 Many of these challenges are the consequence of stigma. A broad range of efforts are underway worldwide to reduce dementia-related stigma. These efforts include programs to promote public awareness and education, campaigns to develop inclusive social policies, and skills-based training initiatives to promote delivery of patient-centered care by clinicians and educators.3,17,18 Many of these efforts share a common focus on promoting the “dignity” and “personhood” of PwD in order to disrupt stereotypes or fixed, oversimplified beliefs associated with dementia.
Implementing person-centered clinical care
In clinical practice, direct discussion that encourages reflection and the use of effective and sensitive communication can help to limit passing on stigmatizing beliefs and to reduce negative stereotypes associated with the disease. Health care communications that call attention to stereotypes may allow PwD to identify stereotypes as well as inaccuracies in those stereotypes. Interventions that validate the value of diversity can help PwD accept the ways in which they may not conform to social norms. This could include language such as “There is no one way to have Alzheimer’s disease. A person’s experience can differ from what others might experience or expect, and that’s okay.” In addition, the use of language that is accurate, respectful, inclusive, and empowering can support PwD and their caregivers.19,20 For example, referring to PwD as “individuals living with dementia” rather than “those who are demented” conveys respect and appreciation for personhood. Other clinicians have provided additional practical suggestions.21
Anti-stigma messaging campaigns
The mass media is a common source of stereotypes about AD and other dementias. They typically present a “worst-case” scenario that promotes ageism, gerontophobia, and negative emotions, which may worsen stigma and discrimination towards PwD and the people who care for them. However, public messaging campaigns are emerging to counter negative messages and stereotypes in the mass media. Projects such as Typical Day, People with Dementia, and other online anti-stigma messaging campaigns allow a broad audience to gain a more nuanced understanding of the lives of PwD and their caregivers. These projects are rich resources that offer education and personal stories that can counter common stereotypes about dementia.
Typical Day is a photography project developed and maintained by clinicians and researchers at the University of Pennsylvania. Since early 2017, the project has provided a forum for individuals with mild cognitive impairment or dementia to document their lives and show what it means to them to live with dementia. Participants in the project photo-document the people, places, and objects that define their daily lives. They review and explain these photos with researchers at Penn Memory Center, who help them tell their stories. The participants’ stories, the photos they capture, and their portraits are available at www.mytypicalday.org.
People of Dementia. Storytelling is a powerful way to raise awareness of and reduce the stigma associated with dementia. For PwD, telling their stories can be an effective and therapeutic way to communicate their emotions and deliver an important message. In the blog People of Dementia (www.peopleofdementia.com),22,23 PwD highlight who they were before the disease and how things have changed, with family members highlighting the challenges of caring for a person with dementia.
Continue to: The common thread is...
The common thread is the enduring “person” behind the exterior that is obscured by dementia. By allowing the audience to form a connection with who the individual was prior to the disease, and understanding the changes that have come as a result of dementia to both PwD and their support network, readers gain a greater appreciation of those affected by dementia. Between May 1, 2017 and May 31, 2019, the blog had more than 3,860 visitors. In an accompanying online survey (N = 57), 79% of respondents agreed/strongly agreed that after visiting the People of Dementia blog, they had a better understanding of the changes that occur as a result of cognitive impairment/dementia (Figure 1). Almost two-thirds of respondents (65%) agreed/strongly agreed that they felt more comfortable interacting with PwD (Figure 2). Additionally, 60% of respondents agreed/strongly agreed that they were more encouraged to work with PwD, and 90% agreed/strongly agreed that they had a greater appreciation of the challenges of being a caregiver for PwD. Overall, these findings suggest that the People of Dementia blog is useful for engaging the public and promoting a better understanding of dementia.

Work for policy changes
Clinicians can support public policy through education and advocacy both in the delivery of care and as spokespersons and stakeholders in their local communities. Public policies are important for providing access to medical and social services to meet the needs of PwD and their caregivers. The absence—real or perceived—of sufficient resources exacerbates dementia-related stigma. In addition to facilitating access to resources, national dementia strategies or legal frameworks, such as the National Alzheimer’s Project Act in the United States, include policy initiatives to identify and promote communication approaches that are effective and sensitive with respect to people living with dementia and their caregivers.

State and local legislators and patient advocates are leading policy efforts to reduce dementia-related stigma. For example, Colorado recently changed statutory references from being specific to diseases that cause dementia to the broader, more inclusive phrase “dementia diseases and related disabilities.”18 In addition to making funds available to support caregiving services for PwD, this legislative change added training for first responders to better meet the needs of missing PwD, and shifted the terminology used to diagnose and communicate about diseases causing dementia. The shift in language added new terminology that was chosen for being more person-centered to replace prior references to “senior senility,” “senility,” and other terms with pejorative meanings.
In Canada, a National Dementia Strategy will commit the Canadian government to action with definitive timelines, targets, reporting structures, and measurable outcomes.24
Table 2 summarizes approaches to a

Continue to: An open discussion
An open discussion
Larger studies and testing of diverse approaches are needed to better understand whether intergenerational initiatives or other approaches can genuinely modify stigmatizing attitudes in various dementia populations, especially considering language, health literacy, cultural preferences, and other needs. The identified effects on physical and mental health, quality of life, self-esteem, and behavioral symptoms further support the extensive, negative effects of self-stigma on PwD, and emphasize the need to develop and test interventions to ameliorate these effects.
We presented at a Stigma Symposium at the 2018 Gerontological Society of America Annual Scientific Meeting in Boston, Massachusetts.25 Attendees of this conference shared our concerns about the detrimental effects of stigma. The main question we were asked was “What can we do to reduce stigma?” Perhaps the most immediate response is that in order to move the stigma dial, clinicians need to recognize that stigma has multiple, broad-reaching, and negative effects on PwD and their families.6 Bringing the discussion into the open and targeting stigma at multiple levels needs to be addressed by clinicians, researchers, administrators, and society at large.
Bottom Line
Stigma has multiple, broad-reaching, and negative effects on persons with dementia and their families. In clinical practice, direct discussion that encourages reflection and the use of effective and sensitive communication can help to limit passing on stigmatizing beliefs and to reduce negative stereotypes associated with the disease. Anti-stigma messaging campaigns and public policy changes also can be used to address societal and social inequities of patients with dementia and their caregivers.
Related Resources
- Khoury R, Shach R, Nair A, et al. Can lifestyle modifications delay or prevent Alzheimer’s disease? Current Psychiatry. 2019;18(1):29-36,38.
- Burke AD, Burke WJ. Antipsychotics for patients with dementia: The road less traveled. Current Psychiatry. 2018;17(10):26-32,35-37.
1. World Health Organization. Towards a dementia plan: a WHO guide. https://www.who.int/mental_health/neurology/dementia/policy_guidance/en/. Published 2018. Accessed May 28, 2019.
2. Goffman E. Stigma. New York, NY: Prentice-Hall; 1963:1-123.
3. Alzheimer’s Disease International. World Alzheimer Report 2012: overcoming the stigma of dementia. https://www.alz.co.uk/research/WorldAlzheimerReport2012.pdf. Published 2012. Accessed May 28, 2019.
4. Blay SL, Peluso ETP. Public stigma: the community’s tolerance of Alzheimer disease. Am J Geriatr Psychiatry. 2010;18(2):163-171.
5. Piver LC, Nubukpo P, Faure A, et al. Describing perceived stigma against Alzheimer’s disease in a general population in France: the STIG-MA survey. Int J Geriatr Psychiatry. 2013;28(9):933-938.
6. Herrmann LK, Welter E, Leverenz J, et al. A systematic review of dementia-related stigma research: can we move the stigma dial? Am J Geriatr Psychiatry. 2018;26(3):316-331.
7. Eng KJ, Woo BKP. Knowledge of dementia community resources and stigma among Chinese American immigrants. Gen Hosp Psychiatry. 2015;37(1):e3-e4. doi:10.1016/j.genhosppsych.2014.11.003.
8. Jang Y, Kim G, Chiriboga D. Knowledge of Alzheimer’s disease, feelings of shame, and awareness of services among Korean American elders. J Aging Health. 2010;22(4):419-433.
9. Werner P, Goldstein D, Heinik J. Development and validity of the Family Stigma in Alzheimer’s disease scale (FS-ADS). Alzheimer Disease & Associated Disorders. 2011;25(1):42-48.
10. Rao D, Choi SW, Victorson D, et al. Measuring stigma across neurological conditions: the development of the stigma scale for chronic illness (SSCI). Qual Life Res. 2009;18(5):585-595.
11. Boustani M, Perkins AJ, Monahan P, et al. Measuring primary care patients’ attitudes about dementia screening. Int J Geriatr Psychiatry. 2008;23(8):812-820.
12. Burgener SC, Buckwalter K, Perkounkova Y, et al. Perceived stigma in persons with early-stage dementia: longitudinal findings: Part 2. Dementia. 2015;14(5):609-632.
13. Burgener SC, Buckwalter K. The effects of perceived stigma on persons with dementia and their family caregivers. In: Symposium on Stigma: It’s time to talk about it. Boston, MA: Gerontological Society of America 2018 Annual Scientific Meeting; 2018. Session 2805.
14. Harper L, Dobbs B, Royan H, et al. The experience of stigma in care partners of people with dementia – results from an exploratory study. In Symposium on stigma: it’s time to talk about it. Boston, MA: Gerontological Society of America 2018 Annual Scientific Meeting; 2018. Session 2805.
15. Burgener S, Berger B. Measuring perceived stigma in persons with progressive neurological disease: Alzheimer’s dementia and Parkinson disease. Dementia. 2008;7(1):31-53.
16. Stites SD, Milne R, Karlawish J. Advances in Alzheimer’s imaging are changing the experience of Alzheimer’s disease. Alzheimer’s & Dementia. 2018;10;285-300.
17. Anderson LA, Egge R. Expanding efforts to address Alzheimer’s disease: the Healthy Brain Initiative. Alzheimer’s Dement. 2014;10(50):S453-S456.
18. Alzheimer’s Association National Plan Milestone Workgroup. Report on the milestones for the US National plan to address Alzheimer’s disease. Alzheimer’s Dementia. 2014;10(Suppl 5);S430-S452. doi:10.1016/j/jalz.2014.08.103.
19. Kirkman AM. Dementia in the news: the media coverage of Alzheimer’s disease. Australasian Journal on Ageing. 2006;25(2):74-79.
20. Swaffer, K. Dementia: stigma, language, and dementia-friendly. Dementia. 2014;13(6):709-716.
21. Stites SD, Karlawish J. Stigma of Alzheimer’s disease dementia: considerations for practice. Practical Neurology. https://practicalneurology.com/articles/2018-june/stigma-of-alzheimers-disease-dementia. Published June 2018. Accessed May 28, 2019.
22. Jamieson J, Dobbs B, Charles L, et al. Forgetful, but not forgotten people of dementia: a novel, technology focused project with a humanistic touch. Geriatric Grand Rounds; October 10, 2017. Edmonton, Alberta, Canada.
23. Dobbs B, Charles L, Chan K, et al. People of Dementia. CGS 37th Annual Scientific Meeting: Integrating Care, Making an Impact. Can Geriatr J. 2017;20(3):220.
24. Government of Canada. Conference report: National Dementia Conference. https://www.canada.ca/en/services/health/publications/diseases-conditions/national-dementia-conference-report.html. Government of Canada. Published August 2018. Accessed May 28, 2019.
25. The Gerontological Society of America. Program Abstracts from the GSA 2018 Annual Scientific Meeting “The Purposes of Longer Lives.” Innovation in Aging. 2018;2(Suppl 1):143.
Dementia is a family of disorders characterized by a decline in multiple cognitive abilities that significantly interferes with an individual’s functioning. An estimated 50 million people are living with a dementia worldwide.1 Alzheimer’s disease (AD) is the leading cause of dementia, accounting for approximately two-thirds of dementia cases.1 These numbers are expected to increase dramatically in the upcoming decades.
Sociologist Erving Goffman defined stigma as “an attribute, behaviour, or reputation which is socially discrediting in a particular way: it causes an individual to be mentally classified by others in an undesirable, rejected stereotype rather than in an accepted, normal one.”2 Goffman2 defined 3 broad categories of stigma: public, self, and courtesy (Table 12).
Considerable evidence shows that the combined impact of having dementia and the negative response to the diagnosis significantly undermines an individual’s psychosocial well-being and quality of life.3 Persons with dementia (PwD) commonly report a loss of identity and self-worth, and stigma appears to deepen this distress.3 Stigma also negatively affects individuals associated with PwD, including family members and professionals. In this article, we discuss the impact of dementia-related stigma, and steps you can take to address it, including implementing person-centered clinical practices, promoting anti-stigma messaging campaigns, and advocating for public policy action to improve the lives of PwD and their families.
A pervasive problem
Although the Alzheimer’s Society International and the World Health Organization acknowledge that stigma has a central role in defining the experience of AD, how stigma may present, how clinicians and researchers can recognize and measure stigma, and how to best combat it have been understudied.3-5 A recent systematic literature review examined worldwide evidence on dementia-related stigma over the past decade.6 Hermann et al6 found that health care providers and the general public may hold stigmatizing attitudes toward PwD, and that stigma may be particularly harsh among racial and ethnic minorities, although the literature is scarce in this area. Cultural factors may also worsen stigma, and stigma may be associated with reduced awareness of dementia services and reduced help-seeking among minority groups.7,8 Studies show that stigmatizing attitudes are more pronounced in people with limited knowledge of dementia, in those with little contact with PwD, in men, in younger individuals, and in the context of cultural interpretations of dementia.6 Health care providers can also sometimes contribute to the perpetuation of stigma.6
In terms of standardized scales or instruments for evaluating dementia-related stigma, there is no uniformly accepted “gold standard” measure, which makes it difficult to compare studies.6 In order to effectively study efforts to reduce stigma, researchers need to identify and establish a consensus on rating scales for evaluating stigma among PwD, caregivers, and the general public. Three instruments that may be used for this purpose are the Family Stigma in Alzheimer’s Disease Scale (FS-ADS),9 the Stigma Scale for Chronic Illness (SSCI),10 and the Perceptions Regarding Investigational Screening for Memory in Primary Care (PRISM-PC).11
The detrimental effects of stigma
Burgener et al12 reported that personal stigma impacted functioning and quality of life in PwD. Higher levels of stigma were associated with higher anxiety, depression, and behavioral symptoms and lower self-esteem, social support, participation in activities, personal control, and physical health.12 Personal characteristics that may affect stigma include gender, location (rural vs urban), ethnicity, education level, and living arrangements (alone vs with family).12
In a subset of PwD with early-stage memory loss (n = 22), Burgener and Buckwalter13 found that 42% of participants were reluctant to reveal their diagnosis to others, with some fearing they would no longer be allowed to live alone and would be “sent to a facility.” In addition, 46% indicated they did not want “to be talked about like they were not there.” More than 50% of participants reported changes in their social network after receiving the diagnosis, including reducing activities and limiting types of contacts (ie, telephone only) or interacting only when “people come to me.” Participants were most comfortable with good friends “who understand” and persons within their faith communities. When asked about how they were treated by family members, >50% of participants described being treated differently, including loss of financial independence, more limited contact, and being “treated like a baby” by their children, who in general were uncomfortable talking about the diagnosis.
Continue to: In a recent study...
In a recent study by Harper et al,14 stigma was prevalent in the experience of PwD. One participant disclosed:
“I think there is [are] people I know who don’t ask me to go places or do things ’cause I have a dementia…I think lots of people don’t know what dementia is and I think it scares them ’cause they think of it as crazy. It hurts…”
Another participant said:
“I have had friends for over thirty years. They have turned their backs on me…we used to go for walks and they would phone me and go for coffee. Now I don’t hear from any of them…those aren’t true friends…true friends will stand behind you, not in front of you. That’s why I am not happy.”
Overall, quantitative and qualitative findings indicate multiple, detrimental effects of personal stigma on PwD. These effects fit well with measures of self-stigma, including social rejection (eg, being treated differently, participating in fewer activities, and having fewer friends), internalized shame (eg, being treated like a child, having fewer responsibilities, others acting as if dementia is “contagious”), and social isolation (eg, being less outgoing, feeling more comfortable in small groups, having limited social contacts).15
Continue to: Receiving a diagnosis of dementia...
Receiving a diagnosis of dementia presents patients and their families with psychological and social challenges.16 Many of these challenges are the consequence of stigma. A broad range of efforts are underway worldwide to reduce dementia-related stigma. These efforts include programs to promote public awareness and education, campaigns to develop inclusive social policies, and skills-based training initiatives to promote delivery of patient-centered care by clinicians and educators.3,17,18 Many of these efforts share a common focus on promoting the “dignity” and “personhood” of PwD in order to disrupt stereotypes or fixed, oversimplified beliefs associated with dementia.
Implementing person-centered clinical care
In clinical practice, direct discussion that encourages reflection and the use of effective and sensitive communication can help to limit passing on stigmatizing beliefs and to reduce negative stereotypes associated with the disease. Health care communications that call attention to stereotypes may allow PwD to identify stereotypes as well as inaccuracies in those stereotypes. Interventions that validate the value of diversity can help PwD accept the ways in which they may not conform to social norms. This could include language such as “There is no one way to have Alzheimer’s disease. A person’s experience can differ from what others might experience or expect, and that’s okay.” In addition, the use of language that is accurate, respectful, inclusive, and empowering can support PwD and their caregivers.19,20 For example, referring to PwD as “individuals living with dementia” rather than “those who are demented” conveys respect and appreciation for personhood. Other clinicians have provided additional practical suggestions.21
Anti-stigma messaging campaigns
The mass media is a common source of stereotypes about AD and other dementias. They typically present a “worst-case” scenario that promotes ageism, gerontophobia, and negative emotions, which may worsen stigma and discrimination towards PwD and the people who care for them. However, public messaging campaigns are emerging to counter negative messages and stereotypes in the mass media. Projects such as Typical Day, People with Dementia, and other online anti-stigma messaging campaigns allow a broad audience to gain a more nuanced understanding of the lives of PwD and their caregivers. These projects are rich resources that offer education and personal stories that can counter common stereotypes about dementia.
Typical Day is a photography project developed and maintained by clinicians and researchers at the University of Pennsylvania. Since early 2017, the project has provided a forum for individuals with mild cognitive impairment or dementia to document their lives and show what it means to them to live with dementia. Participants in the project photo-document the people, places, and objects that define their daily lives. They review and explain these photos with researchers at Penn Memory Center, who help them tell their stories. The participants’ stories, the photos they capture, and their portraits are available at www.mytypicalday.org.
People of Dementia. Storytelling is a powerful way to raise awareness of and reduce the stigma associated with dementia. For PwD, telling their stories can be an effective and therapeutic way to communicate their emotions and deliver an important message. In the blog People of Dementia (www.peopleofdementia.com),22,23 PwD highlight who they were before the disease and how things have changed, with family members highlighting the challenges of caring for a person with dementia.
Continue to: The common thread is...
The common thread is the enduring “person” behind the exterior that is obscured by dementia. By allowing the audience to form a connection with who the individual was prior to the disease, and understanding the changes that have come as a result of dementia to both PwD and their support network, readers gain a greater appreciation of those affected by dementia. Between May 1, 2017 and May 31, 2019, the blog had more than 3,860 visitors. In an accompanying online survey (N = 57), 79% of respondents agreed/strongly agreed that after visiting the People of Dementia blog, they had a better understanding of the changes that occur as a result of cognitive impairment/dementia (Figure 1). Almost two-thirds of respondents (65%) agreed/strongly agreed that they felt more comfortable interacting with PwD (Figure 2). Additionally, 60% of respondents agreed/strongly agreed that they were more encouraged to work with PwD, and 90% agreed/strongly agreed that they had a greater appreciation of the challenges of being a caregiver for PwD. Overall, these findings suggest that the People of Dementia blog is useful for engaging the public and promoting a better understanding of dementia.
Work for policy changes
Clinicians can support public policy through education and advocacy both in the delivery of care and as spokespersons and stakeholders in their local communities. Public policies are important for providing access to medical and social services to meet the needs of PwD and their caregivers. The absence—real or perceived—of sufficient resources exacerbates dementia-related stigma. In addition to facilitating access to resources, national dementia strategies or legal frameworks, such as the National Alzheimer’s Project Act in the United States, include policy initiatives to identify and promote communication approaches that are effective and sensitive with respect to people living with dementia and their caregivers.
State and local legislators and patient advocates are leading policy efforts to reduce dementia-related stigma. For example, Colorado recently changed statutory references from being specific to diseases that cause dementia to the broader, more inclusive phrase “dementia diseases and related disabilities.”18 In addition to making funds available to support caregiving services for PwD, this legislative change added training for first responders to better meet the needs of missing PwD, and shifted the terminology used to diagnose and communicate about diseases causing dementia. The shift in language added new terminology that was chosen for being more person-centered to replace prior references to “senior senility,” “senility,” and other terms with pejorative meanings.
In Canada, a National Dementia Strategy will commit the Canadian government to action with definitive timelines, targets, reporting structures, and measurable outcomes.24
Table 2 summarizes approaches to a
Continue to: An open discussion
An open discussion
Larger studies and testing of diverse approaches are needed to better understand whether intergenerational initiatives or other approaches can genuinely modify stigmatizing attitudes in various dementia populations, especially considering language, health literacy, cultural preferences, and other needs. The identified effects on physical and mental health, quality of life, self-esteem, and behavioral symptoms further support the extensive, negative effects of self-stigma on PwD, and emphasize the need to develop and test interventions to ameliorate these effects.
We presented at a Stigma Symposium at the 2018 Gerontological Society of America Annual Scientific Meeting in Boston, Massachusetts.25 Attendees of this conference shared our concerns about the detrimental effects of stigma. The main question we were asked was “What can we do to reduce stigma?” Perhaps the most immediate response is that in order to move the stigma dial, clinicians need to recognize that stigma has multiple, broad-reaching, and negative effects on PwD and their families.6 Bringing the discussion into the open and targeting stigma at multiple levels needs to be addressed by clinicians, researchers, administrators, and society at large.
Bottom Line
Stigma has multiple, broad-reaching, and negative effects on persons with dementia and their families. In clinical practice, direct discussion that encourages reflection and the use of effective and sensitive communication can help to limit passing on stigmatizing beliefs and to reduce negative stereotypes associated with the disease. Anti-stigma messaging campaigns and public policy changes also can be used to address societal and social inequities of patients with dementia and their caregivers.
Related Resources
- Khoury R, Shach R, Nair A, et al. Can lifestyle modifications delay or prevent Alzheimer’s disease? Current Psychiatry. 2019;18(1):29-36,38.
- Burke AD, Burke WJ. Antipsychotics for patients with dementia: The road less traveled. Current Psychiatry. 2018;17(10):26-32,35-37.
1. World Health Organization. Towards a dementia plan: a WHO guide. https://www.who.int/mental_health/neurology/dementia/policy_guidance/en/. Published 2018. Accessed May 28, 2019.
2. Goffman E. Stigma. New York, NY: Prentice-Hall; 1963:1-123.
3. Alzheimer’s Disease International. World Alzheimer Report 2012: overcoming the stigma of dementia. https://www.alz.co.uk/research/WorldAlzheimerReport2012.pdf. Published 2012. Accessed May 28, 2019.
4. Blay SL, Peluso ETP. Public stigma: the community’s tolerance of Alzheimer disease. Am J Geriatr Psychiatry. 2010;18(2):163-171.
5. Piver LC, Nubukpo P, Faure A, et al. Describing perceived stigma against Alzheimer’s disease in a general population in France: the STIG-MA survey. Int J Geriatr Psychiatry. 2013;28(9):933-938.
6. Herrmann LK, Welter E, Leverenz J, et al. A systematic review of dementia-related stigma research: can we move the stigma dial? Am J Geriatr Psychiatry. 2018;26(3):316-331.
7. Eng KJ, Woo BKP. Knowledge of dementia community resources and stigma among Chinese American immigrants. Gen Hosp Psychiatry. 2015;37(1):e3-e4. doi:10.1016/j.genhosppsych.2014.11.003.
8. Jang Y, Kim G, Chiriboga D. Knowledge of Alzheimer’s disease, feelings of shame, and awareness of services among Korean American elders. J Aging Health. 2010;22(4):419-433.
9. Werner P, Goldstein D, Heinik J. Development and validity of the Family Stigma in Alzheimer’s disease scale (FS-ADS). Alzheimer Disease & Associated Disorders. 2011;25(1):42-48.
10. Rao D, Choi SW, Victorson D, et al. Measuring stigma across neurological conditions: the development of the stigma scale for chronic illness (SSCI). Qual Life Res. 2009;18(5):585-595.
11. Boustani M, Perkins AJ, Monahan P, et al. Measuring primary care patients’ attitudes about dementia screening. Int J Geriatr Psychiatry. 2008;23(8):812-820.
12. Burgener SC, Buckwalter K, Perkounkova Y, et al. Perceived stigma in persons with early-stage dementia: longitudinal findings: Part 2. Dementia. 2015;14(5):609-632.
13. Burgener SC, Buckwalter K. The effects of perceived stigma on persons with dementia and their family caregivers. In: Symposium on Stigma: It’s time to talk about it. Boston, MA: Gerontological Society of America 2018 Annual Scientific Meeting; 2018. Session 2805.
14. Harper L, Dobbs B, Royan H, et al. The experience of stigma in care partners of people with dementia – results from an exploratory study. In Symposium on stigma: it’s time to talk about it. Boston, MA: Gerontological Society of America 2018 Annual Scientific Meeting; 2018. Session 2805.
15. Burgener S, Berger B. Measuring perceived stigma in persons with progressive neurological disease: Alzheimer’s dementia and Parkinson disease. Dementia. 2008;7(1):31-53.
16. Stites SD, Milne R, Karlawish J. Advances in Alzheimer’s imaging are changing the experience of Alzheimer’s disease. Alzheimer’s & Dementia. 2018;10;285-300.
17. Anderson LA, Egge R. Expanding efforts to address Alzheimer’s disease: the Healthy Brain Initiative. Alzheimer’s Dement. 2014;10(50):S453-S456.
18. Alzheimer’s Association National Plan Milestone Workgroup. Report on the milestones for the US National plan to address Alzheimer’s disease. Alzheimer’s Dementia. 2014;10(Suppl 5);S430-S452. doi:10.1016/j/jalz.2014.08.103.
19. Kirkman AM. Dementia in the news: the media coverage of Alzheimer’s disease. Australasian Journal on Ageing. 2006;25(2):74-79.
20. Swaffer, K. Dementia: stigma, language, and dementia-friendly. Dementia. 2014;13(6):709-716.
21. Stites SD, Karlawish J. Stigma of Alzheimer’s disease dementia: considerations for practice. Practical Neurology. https://practicalneurology.com/articles/2018-june/stigma-of-alzheimers-disease-dementia. Published June 2018. Accessed May 28, 2019.
22. Jamieson J, Dobbs B, Charles L, et al. Forgetful, but not forgotten people of dementia: a novel, technology focused project with a humanistic touch. Geriatric Grand Rounds; October 10, 2017. Edmonton, Alberta, Canada.
23. Dobbs B, Charles L, Chan K, et al. People of Dementia. CGS 37th Annual Scientific Meeting: Integrating Care, Making an Impact. Can Geriatr J. 2017;20(3):220.
24. Government of Canada. Conference report: National Dementia Conference. https://www.canada.ca/en/services/health/publications/diseases-conditions/national-dementia-conference-report.html. Government of Canada. Published August 2018. Accessed May 28, 2019.
25. The Gerontological Society of America. Program Abstracts from the GSA 2018 Annual Scientific Meeting “The Purposes of Longer Lives.” Innovation in Aging. 2018;2(Suppl 1):143.

Diversion of Controlled Drugs in Hospitals: A Scoping Review of Contributors and Safeguards
The United States (US) and Canada are the two highest per-capita consumers of opioids in the world;1 both are struggling with unprecedented opioid-related mortality.2,3 The nonmedical use of opioids is facilitated by diversion and defined as the transfer of drugs from lawful to unlawful channels of use4,5 (eg, sharing legitimate prescriptions with family and friends6). Opioids and other controlled drugs are also diverted from healthcare facilities;4,5,7,8 Canadian data suggest these incidents may be increasing (controlled-drug loss reports have doubled each year since 20159).
The diversion of controlled drugs from hospitals affects patients, healthcare workers (HCWs), hospitals, and the public. Patients suffer insufficient analgesia or anesthesia, experience substandard care from impaired HCWs, and are at risk of infections from compromised syringes.4,10,11 HCWs that divert are at risk of overdose and death; they also face regulatory censure, criminal prosecution, and civil malpractice suits.12,13 Hospitals bear the cost of diverted drugs,14,15 internal investigations,4 and follow-up care for affected patients,4,13 and can be fined in excess of $4 million dollars for inadequate safeguards.16 Negative publicity highlights hospitals failing to self-regulate and report when diversion occurs, compromising public trust.17-19 Finally, diverted drugs impact population health by contributing to drug misuse.
Hospitals face a critical problem: how does a hospital prevent the diversion of controlled drugs? Hospitals have not yet implemented safeguards needed to detect or understand how diversion occurs. For example, 79% of Canadian hospital controlled-drug loss reports are “unexplained losses,”9 demonstrating a lack of traceability needed to understand the root causes of the loss. A single US endoscopy clinic showed that $10,000 of propofol was unaccounted for over a four-week period.14 Although transactional discrepancies do not equate to diversion, they are a potential signal of diversion and highlight areas for improvement.15 The hospital medication-use process (MUP; eg, procurement, storage, preparation, prescription, dispensing, administration, waste, return, and removal) has multiple vulnerabilities that have been exploited. Published accounts of diversion include falsification of clinical documents, substitution of saline for medication, and theft.4,20-23 Hospitals require guidance to assess their drug processes against known vulnerabilities and identify safeguards that may improve their capacity to prevent or detect diversion.
In this work, we provide a scoping review on the emerging topic of drug diversion to support hospitals. Scoping reviews can be a “preliminary attempt to provide an overview of existing literature that identifies areas where more research might be required.”24 Past literature has identified sources of drugs for nonmedical use,6,25,26 provided partial data on the quantities of stolen drug,7,8 and estimated the rate of HCW diversion.5,27-29 However, no reviews have focused on system gaps specific to hospital MUPs and diversion. Our review remedies this knowledge gap by consolidating known weaknesses and safeguards from peer- and nonpeer-reviewed articles. Drug diversion has been discussed at conferences and in news articles, case studies, and legal reports; excluding such discussion ignores substantive work that informs diversion practices in hospitals. Early indications suggest that hospitals have not yet implemented safeguards to properly identify when diversion has occurred, and consequently, lack the evidence to contribute to peer-reviewed literature. This article summarizes (1) clinical units, health professions, and stages of the MUP discussed, (2) contributors to diversion in hospitals, and (3) safeguards to prevent or detect diversion in hospitals.
METHODS
Scoping Review
We followed Arksey and O’Malley’s six-step framework for scoping reviews,30 with the exception of the optional consultation phase (step 6). We addressed three questions (step 1): what clinical units, health professions, or stages of the medication-use process are commonly discussed; what are the identified contributors to diversion in hospitals; and what safeguards have been described for prevention or detection of diversion in hospitals? We then identified relevant studies (step 2) by searching records published from January 2005 to June 2018 in MEDLINE, Embase, PsycINFO, CINAHL, Scopus, and Web of Science; the gray literature was also searched (see supplementary material for search terms).
All study designs were considered, including quantitative and qualitative methods, such as experiments, chart reviews and audit reports, surveys, focus groups, outbreak investigations, and literature reviews. Records were included (step 3) if abstracts met the Boolean logic criteria outlined in Appendix 1. If no abstract was available, then the full-text article was assessed. Prior to abstract screening, four reviewers (including R.R.) independently screened batches of 50 abstracts at a time to iteratively assess interrater reliability (IRR). Disagreements were resolved by consensus and the eligibility criteria were refined until IRR was achieved (Fleiss kappa > 0.65). Once IRR was achieved, the reviewers applied the criteria independently. For each eligible abstract, the full text was retrieved and assigned to a reviewer for independent assessment of eligibility. The abstract was reviewed if the full-text article was not available. Only articles published in English were included.
Reviewers charted findings from the full-text records (steps 4 and 5) by using themes defined a priori, specifically literature characteristics (eg, authors, year of publication), characteristics related to study method (eg, article type), variables related to our research questions (eg, variations by clinical unit, health profession), contributors to diversion, and safeguards to detect or prevent diversion. Inductive additions or modifications to the themes were proposed during the full-text review (eg, reviewers added a theme “name of drugs diverted” to identify drugs frequently reported as diverted) and accepted by consensus among the reviewers.
RESULTS
Scoping Review
The literature search generated 4,733 records of which 307 were duplicates and 4,009 were excluded on the basis of the eligibility criteria. The reviewers achieved 100% interrater agreement on the fourth round of abstract screening. Upon full-text review, 312 articles were included for data abstraction (Figure).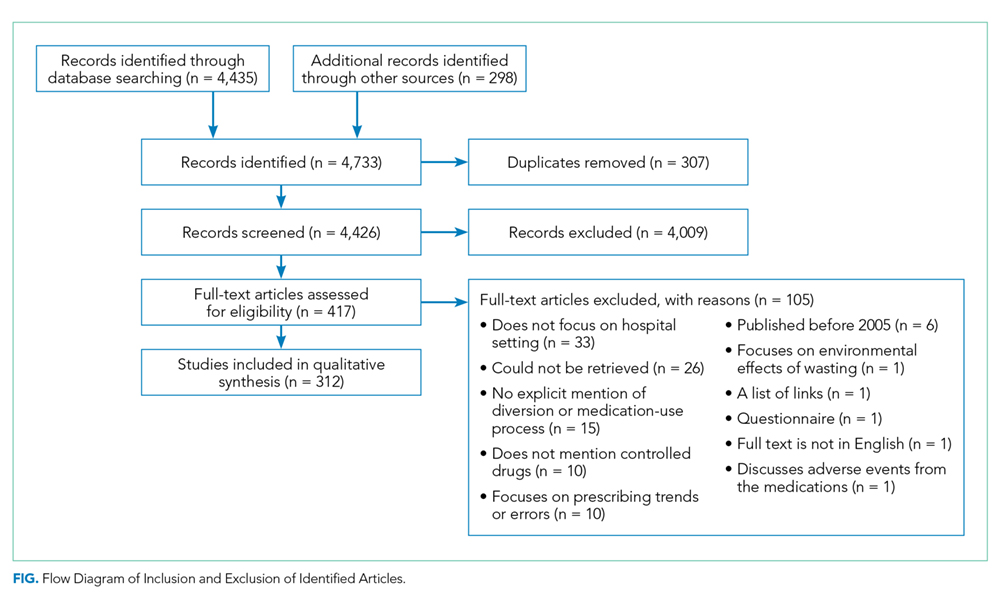
Literature Characteristics
Table 1 summarizes the characteristics of the included literature. The articles were published in a mix of peer-reviewed (137, 44%) and nonpeer-reviewed (175, 56%) sources. Some peer-reviewed articles did not use research methods, and some nonpeer-reviewed articles used research methods (eg, doctoral theses). Therefore, Table 1 categorizes the articles by research method (if applicable) and by peer-review status. The articles primarily originated in the United States (211, 68%) followed by Canada (79, 25%) and other countries (22, 7%). Most articles were commentaries, editorials, reports or news media, rather than formal studies presenting original data.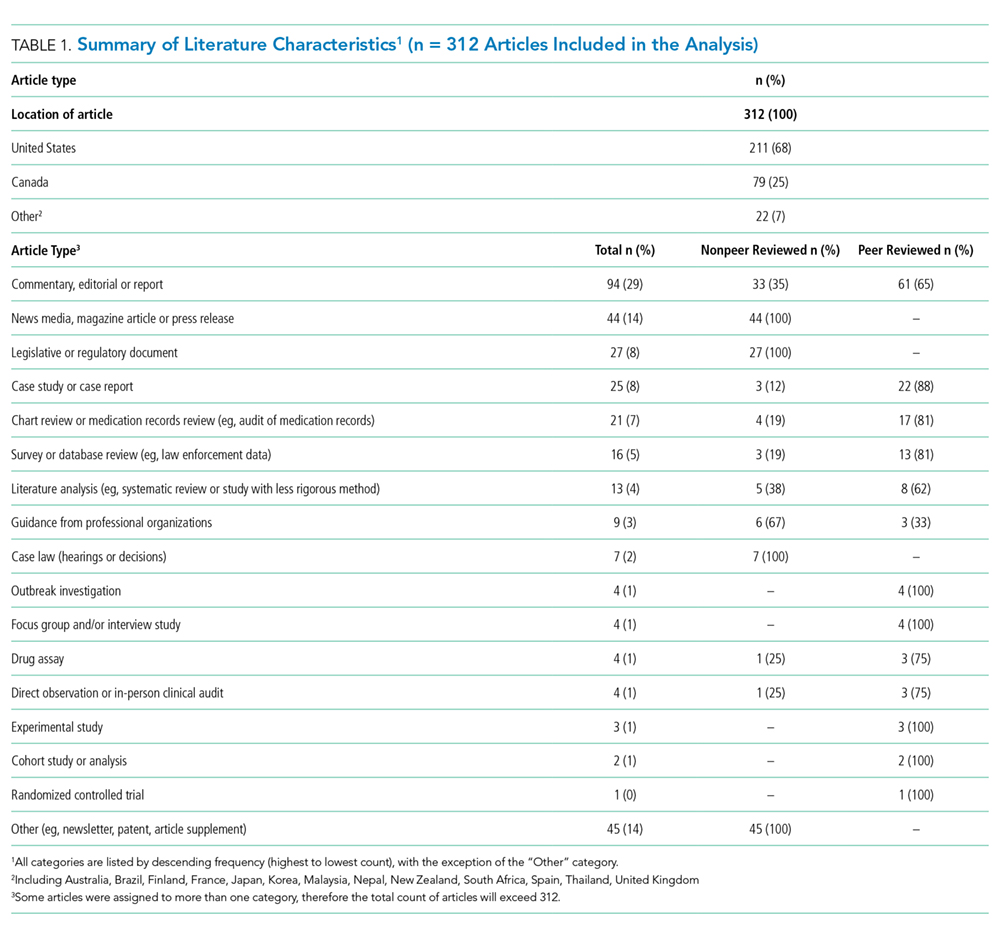
Literature Focus by Clinical Unit, Health Profession, and Stage of Medication-Use Process
Most articles did not focus the discussion on any one clinical unit, health profession, or stage of the MUP. Of the articles that made explicit mention of clinical units, hospital pharmacies and operating rooms were discussed most often, nurses were the most frequently highlighted health profession, and most stages of the MUP were discussed equally, with the exception of prescribing which was mentioned the least (Supplementary Table).
Contributors to Diversion
The literature describes a variety of contributors to drug diversion. Table 2 organizes these contributors by stage of the MUP and provides references for further discussion.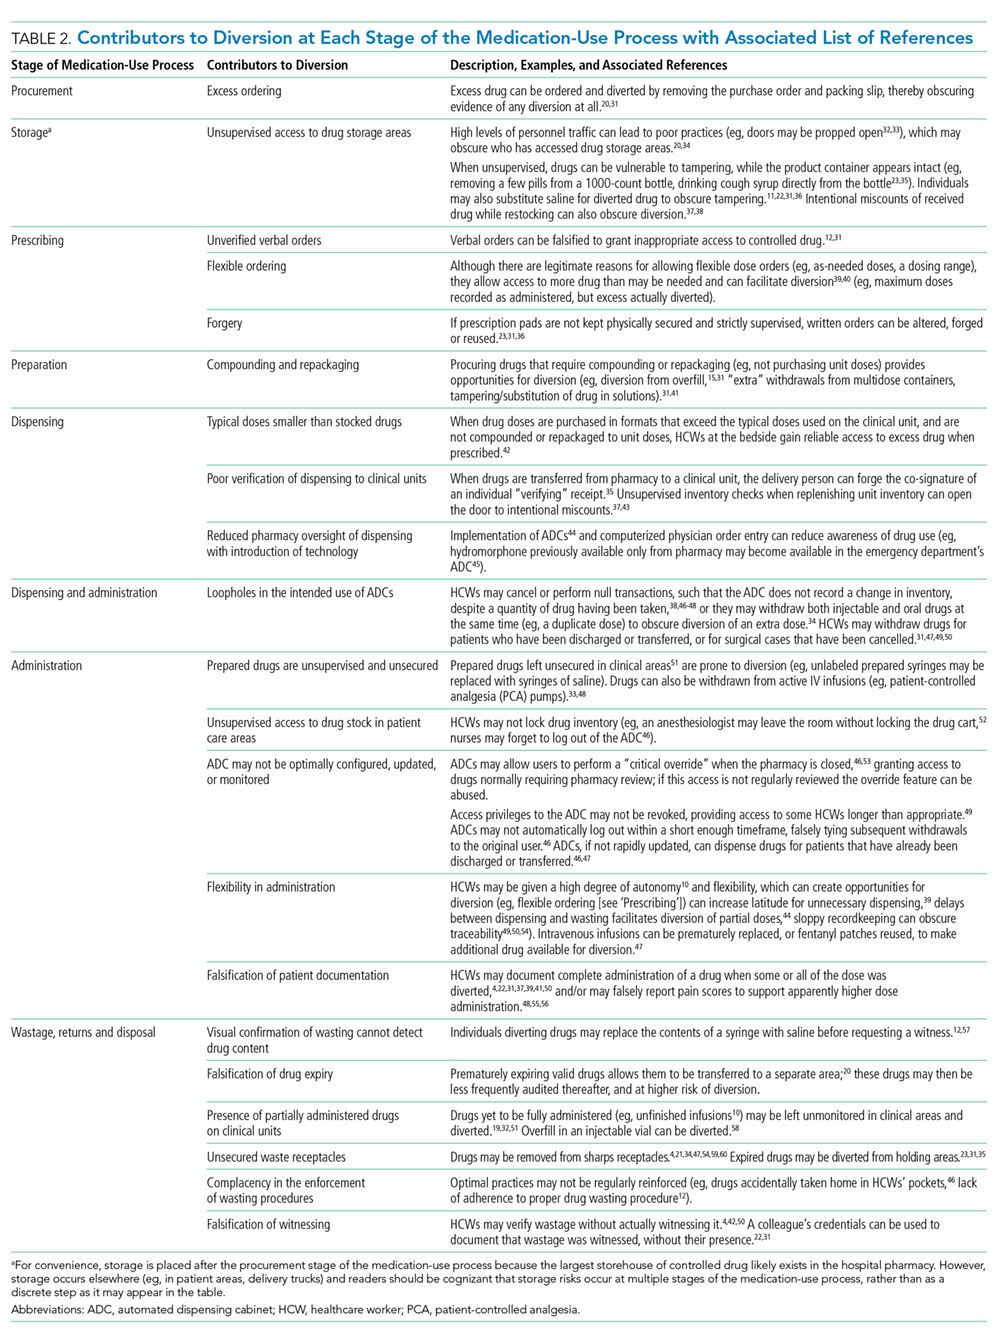
The diverse and system-wide contributors to diversion described in Table 2 support inappropriate access to controlled drugs and can delay the detection of diversion after it occurred. These contributors are more likely to occur in organizations that fail to adhere to drug-handling practices or to carefully review practices.34,44
Diversion Safeguards in Hospitals
Table 3 summarizes published recommendations to mitigate the risk of diversion by stage of the MUP.
DISCUSSION
This review synthesizes a broad sample of peer- and nonpeer-reviewed literature to produce a consolidated list of known contributors (Table 2) and safeguards against (Table 3) controlled-drug diversion in hospitals. The literature describes an extensive list of ways drugs have been diverted in all stages of the MUP and can be exploited by all health professions in any clinical unit. Hospitals should be aware that nonclinical HCWs may also be at risk (eg, shipping and receiving personnel may handle drug shipments or returns, housekeeping may encounter partially filled vials in patient rooms). Patients and their families may also use some of the methods described in Table 2 (eg, acquiring fentanyl patches from unsecured waste receptacles and tampering with unsecured intravenous infusions).
Given the established presence of drug diversion in the literature,5,7-9,96,97 hospitals should assess their clinical practices against these findings, review the associated references, and refer to existing guidance to better understand the intricacies of the topic.7,31,51,53,60,79 To accommodate variability in practice between hospitals, we suggest considering two underlying issues that recur in Tables 2 and 3 that will allow hospitals to systematically analyze their unique practices for each stage of the MUP.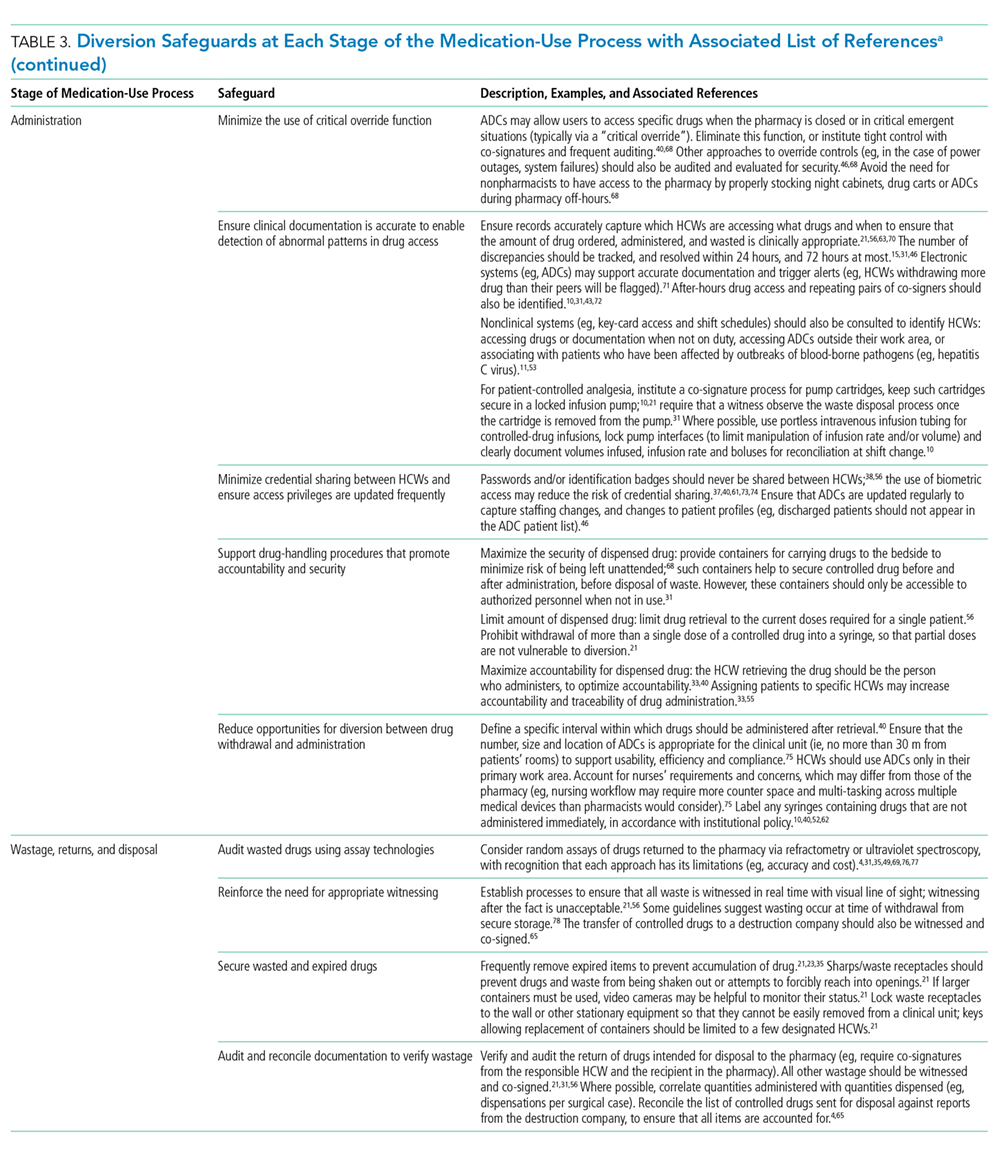
The first issue is falsification of clinical or inventory documentation. Falsified documents give the opportunity and appearance of legitimate drug transactions, obscure drug diversion, or create opportunities to collect additional drugs. Clinical documentation can be falsified actively (eg, deliberately falsifying verbal orders, falsifying drug amounts administered or wasted, and artificially increasing patients’ pain scores) or passively (eg, profiled automated dispensing cabinets [ADC] allow drug withdrawals for a patient that has been discharged or transferred over 72 hours ago because the system has not yet been updated). 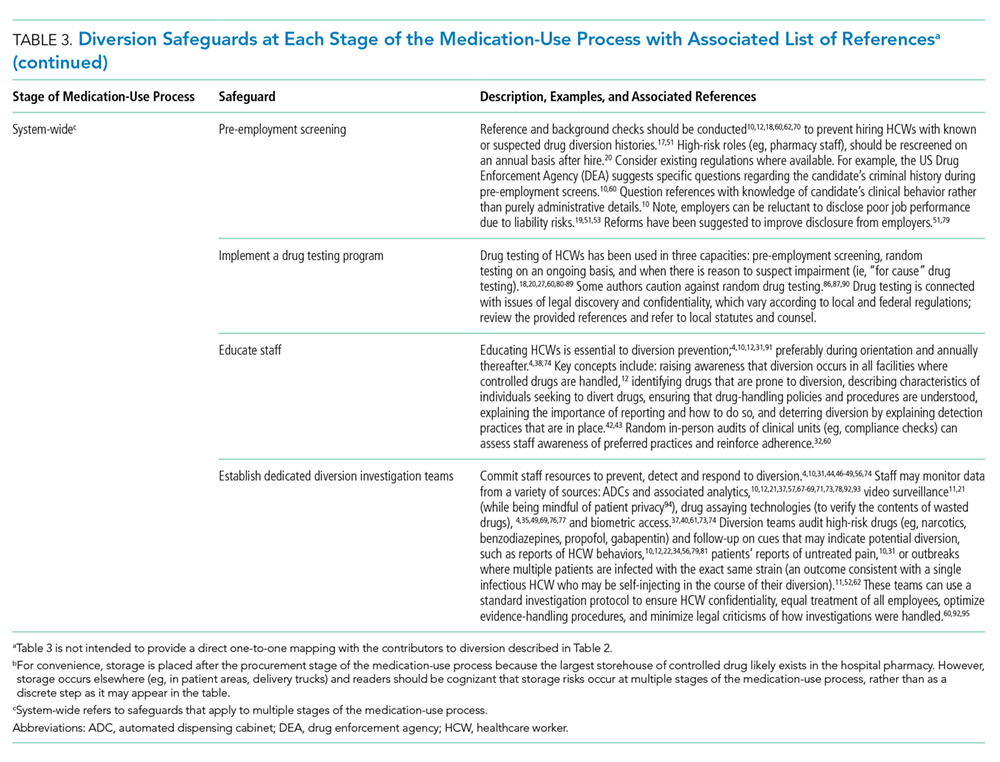
The second issue involves failure to maintain the physical security of controlled drugs, thereby allowing unauthorized access. This issue includes failing to physically secure drug stock (eg, propping doors open to controlled-drug areas; failing to log out of ADCs, thereby facilitating unauthorized access; and leaving prepared drugs unsupervised in patient care areas) or failing to maintain accurate access credentials (eg, staff no longer working on the care unit still have access to the ADC or other secure areas). Prevention safeguards require adherence to existing security protocols (eg, locked doors and staff access frequently updated) and limiting the amount of controlled drugs that can be accessed (eg, supply on care unit should be minimized to what is needed and purchase smallest unit doses to minimize excess drug available to HCWs). Hospitals may need to consider if security measures are actually feasible for HCWs. For example, syringes of prepared drugs should not be left unsupervised to prevent risk of substitution or tampering; however, if the responsible HCW is also expected to collect supplies from outside the care area, they cannot be expected to maintain constant supervision. Detection safeguards include the use of tamper-evident packaging to support detection of compromised controlled drugs or assaying drug waste or other suspicious drug containers to detect dilution or tampering. Hospitals may also consider monitoring whether staff access controlled-drug areas when they are not scheduled to work to detect security breaches.
Safeguards for both issues benefit from an organizational culture reinforced through training at orientation and annually thereafter. Staff should be aware of reporting mechanisms (eg, anonymous hotlines), employee and professional assistance programs, self-reporting protocols, and treatment and rehabilitation options.10,12,29,47,72,91 Other system-wide safeguards described in Table 3 should also be considered. Detection of transactional discrepancies does not automatically indicate diversion, but recurrent discrepancies indicate a weakness in controlled-drug management and should be rectified; diversion prevention is a responsibility of all departments, not just the pharmacy.
Hospitals have several motivations to actively invest in safeguards. Drug diversion is a patient safety issue, a patient privacy issue (eg, patient records are inappropriately accessed to identify opportunities for diversion), an occupational health issue given the higher risks of opioid-related SUD faced by HCWs, a regulatory compliance issue, and a legal issue.31,41,46,59,78,98,99 Although individuals are accountable for drug diversion itself, hospitals should take adequate measures to prevent or detect diversion and protect patients and staff from associated harms. Hospitals should pay careful attention to the configuration of healthcare technologies, environments, and processes in their institution to reduce the opportunity for diversion.
Our study has several limitations. We did not include articles prior to 2005 because we captured a sizable amount of literature with the current search terms and wanted the majority of the studies to reflect workflow based on electronic health records and medication ordering, which only came into wide use in the past 15 years. Other possible contributors and safeguards against drug diversion may not be captured in our review. Nevertheless, thorough consideration of the two underlying issues described will help protect hospitals against new and emerging methods of diversion. The literature search yielded a paucity of controlled trials formally evaluating the effectiveness of these interventions, so safeguards identified in our review may not represent optimal strategies for responding to drug diversion. Lastly, not all suggestions may be applicable or effective in every institution.
CONCLUSION
Drug diversion in hospitals is a serious and urgent concern that requires immediate attention to mitigate harms. Past incidents of diversion have shown that hospitals have not yet implemented safeguards to fully account for drug losses, with resultant harms to patients, HCWs, hospitals themselves, and the general public. Further research is needed to identify system factors relevant to drug diversion, identify new safeguards, evaluate the effectiveness of known safeguards, and support adoption of best practices by hospitals and regulatory bodies.
Acknowledgments
The authors wish to thank Iveta Lewis and members of the HumanEra team (Carly Warren, Jessica Tomasi, Devika Jain, Maaike deVries, and Betty Chang) for screening and data extraction of the literature and to Peggy Robinson, Sylvia Hyland, and Sonia Pinkney for editing and commentary.
Disclosures
Ms. Reding and Ms. Hyland were employees of North York General Hospital at the time of this work. Dr. Hamilton and Ms. Tscheng are employees of ISMP Canada, a subcontractor to NYGH, during the conduct of the study. Mark Fan and Patricia Trbovich have received honoraria from BD Canada for presenting preliminary study findings at BD sponsored events.
Funding
This work was supported by Becton Dickinson (BD) Canada Inc. (grant #ROR2017-04260JH-NYGH). BD Canada had no involvement in study design; in the collection, analysis or interpretation of data; in the writing of the report; or in the decision to submit the article for publication.
1. International Narcotics Control Board. Narcotic drugs: estimated world requirements for 2017 - statistics for 2015. https://www.incb.org/documents/Narcotic-Drugs/Technical-Publications/2016/Narcotic_Drugs_Publication_2016.pdf. Accessed February 2, 2018.
2. Gomes T, Tadrous M, Mamdani MM, Paterson JM, Juurlink DN. The burden of opioid-related mortality in the United States. JAMA Netw Open. 2018;1(2):e180217. doi: 10.1001/jamanetworkopen.2018.0217. PubMed
3. Special Advisory Committee on the Epidemic of Opioid Overdoses. National report: apparent opioid-related deaths in Canada (December 2017). https://www.canada.ca/en/public-health/services/publications/healthy-living/apparent-opioid-related-deaths-report-2016-2017-december.html. Accessed June 5, 2018.
4. Berge KH, Dillon KR, Sikkink KM, Taylor TK, Lanier WL. Diversion of drugs within health care facilities, a multiple-victim crime: patterns of diversion, scope, consequences, detection, and prevention. Mayo Clin Proc. 2012;87(7):674-682. doi: 10.1016/j.mayocp.2012.03.013. PubMed
5. Inciardi JA, Surratt HL, Kurtz SP, Burke JJ. The diversion of prescription drugs by health care workers in Cincinnati, Ohio. Subst Use Misuse. 2006;41(2):255-264. doi: 10.1080/10826080500391829. PubMed
6. Hulme S, Bright D, Nielsen S. The source and diversion of pharmaceutical drugs for non-medical use: A systematic review and meta-analysis. Drug Alcohol Depend. 2018;186:242-256. doi: 10.1016/j.drugalcdep.2018.02.010. PubMed
7. Minnesota Hospital Association. Minnesota controlled substance diversion prevention coalition: final report. https://www.mnhospitals.org/Portals/0/Documents/ptsafety/diversion/drug-diversion-final-report-March2012.pdf. Accessed July 21, 2017.
8. Joranson DE, Gilson AM. Drug crime is a source of abused pain medications in the United States. J Pain Symptom Manag. 2005;30(4):299-301. doi: 10.1016/j.jpainsymman.2005.09.001. PubMed
9. Carman T. Analysis of Health Canada missing controlled substances and precursors data (2017). Github. https://github.com/taracarman/drug_losses. Accessed July 1, 2018.
10. New K. Preventing, detecting, and investigating drug diversion in health care facilities. Mo State Board Nurs Newsl. 2014;5(4):11-14.
11. Schuppener LM, Pop-Vicas AE, Brooks EG, et al. Serratia marcescens Bacteremia: Nosocomial Clustercluster following narcotic diversion. Infect Control Hosp Epidemiol. 2017;38(9):1027-1031. doi: 10.1017/ice.2017.137. PubMed
12. New K. Investigating institutional drug diversion. J Leg Nurse Consult. 2015;26(4):15-18. doi: https://doi.org/10.1016/S2155-8256(15)30095-8
13. Berge KH, Lanier WL. Bloodstream infection outbreaks related to opioid-diverting health care workers: a cost-benefit analysis of prevention and detection programs. Mayo Clin Proc. 2014;89(7):866-868. doi: 10.1016/j.mayocp.2014.04.010. PubMed
14. Horvath C. Implementation of a new method to track propofol in an endoscopy unit. Int J Evid Based Healthc. 2017;15(3):102-110. doi: 10.1097/XEB.0000000000000112. PubMed
15. Pontore KM. The Epidemic of Controlled Substance Diversion Related to Healthcare Professionals. Graduate School of Public Health, University of Pittsburgh; 2015.
16. Knowles M. Georgia health system to pay $4.1M settlement over thousands of unaccounted opioids. Becker’s Hospital Review. https://www.beckershospitalreview.com/opioids/georgia-health-system-to-pay-4-1m-settlement-over-thousands-of-unaccounted-opioids.html. Accessed September 11, 2018.
17. Olinger D, Osher CN. Drug-addicted, dangerous and licensed for the operating room. The Denver Post. https://www.denverpost.com/2016/04/23/drug-addicted-dangerous-and-licensed-for-the-operating-room. Accessed August 2, 2017.
18. Levinson DR, Broadhurst ET. Why aren’t doctors drug tested? The New York Times. https://www.nytimes.com/2014/03/13/opinion/why-arent-doctors-drug-tested.html. Accessed July 21, 2017.
19. Eichenwald K. When Drug Addicts Work in Hospitals, No One is Safe. Newsweek. https://www.newsweek.com/2015/06/26/traveler-one-junkies-harrowing-journey-across-america-344125.html. Accessed August 2, 2017.
20. Martin ES, Dzierba SH, Jones DM. Preventing large-scale controlled substance diversion from within the pharmacy. Hosp Pharm. 2013;48(5):406-412. doi: 10.1310/hpj4805-406. PubMed
21. Institute for Safe Medication Practices. Partially filled vials and syringes in sharps containers are a key source of drugs for diversion. Medication safety alerts. https://www.ismp.org/resources/partially-filled-vials-and-syringes-sharps-containers-are-key-source-drugs-diversion?id=1132. Accessed June 29, 2017.
22. Fleming K, Boyle D, Lent WJB, Carpenter J, Linck C. A novel approach to monitoring the diversion of controlled substances: the role of the pharmacy compliance officer. Hosp Pharm. 2007;42(3):200-209. doi: 10.1310/hpj4203-200.
23. Merlo LJ, Cummings SM, Cottler LB. Prescription drug diversion among substance-impaired pharmacists. Am J Addict. 2014;23(2):123-128. doi: 10.1111/j.1521-0391.2013.12078.x. PubMed
24. O’Malley L, Croucher K. Housing and dementia care-a scoping review of the literature. Health Soc Care Commun. 2005;13(6):570-577. doi: 10.1111/j.1365-2524.2005.00588.x. PubMed
25. Fischer B, Bibby M, Bouchard M. The global diversion of pharmaceutical drugs non-medical use and diversion of psychotropic prescription drugs in North America: a review of sourcing routes and control measures. Addiction. 2010;105(12):2062-2070. doi: 10.1111/j.1360-0443.2010.03092.x. PubMed
26. Inciardi JA, Surratt HL, Cicero TJ, et al. The “black box” of prescription drug diversion. J Addict Dis. 2009;28(4):332-347. doi: 10.1080/10550880903182986. PubMed
27. Boulis S, Khanduja PK, Downey K, Friedman Z. Substance abuse: a national survey of Canadian residency program directors and site chiefs at university-affiliated anesthesia departments. Can J Anesth. 2015;62(9):964-971. doi: 10.1007/s12630-015-0404-1. PubMed
28. Warner DO, Berge K, Sun H et al. Substance use disorder among anesthesiology residents, 1975-2009. JAMA. 2013;310(21):2289-2296. doi: 10.1001/jama.2013.281954. PubMed
29. Kunyk D. Substance use disorders among registered nurses: prevalence, risks and perceptions in a disciplinary jurisdiction. J Nurs Manag. 2015;23(1):54-64. doi: 10.1111/jonm.12081. PubMed
30. Arksey H, O’Malley L. Scoping studies: towards a methodological framework. Int J Soc Res Methodol. 2005;8(1):19-32. doi: 10.1080/1364557032000119616. PubMed
31. Brummond PW, Chen DF, Churchill WW, et al. ASHP guidelines on preventing diversion of controlled substances. Am J Health System Pharm. 2017;74(5):325-348. doi: 10.2146/ajhp160919. PubMed
32. New K. Diversion risk rounds: a reality check on your drug-handling policies. http://www.diversionspecialists.com/wp-content/uploads/Diversion-Risk-Rounds-A-Reality-Check-on-Your-Drug-Handling-Policies.pdf. Accessed July 13, 2017.
33. New K. Uncovering Diversion: 6 case studies on Diversion. https://www.pppmag.com/article/2162. Accessed January 30, 2018.
34. New KS. Undertaking a System Wide Diversion Risk Assessment [PowerPoint]. International Health Facility Diversion Association Conference; 2016. Accessed July 14, 2016.
35. O’Neal B, Siegel J. Diversion in the pharmacy. Hosp Pharm. 2007;42(2):145-148. doi: 10.1310/hpj4202-145.
36. Holleran RS. What is wrong With this picture? J Emerg Nurs. 2010;36(5):396-397. doi: 10.1016/j.jen.2010.08.005. PubMed
37. Vrabel R. Identifying and dealing with drug diversion. How hospitals can stay one step ahead. https://www.hcinnovationgropu.com/home/article/13003330/identifying-and-dealing-with-drug-diversion. Accessed September 18, 2017.
38. Mentler P. Preventing diversion in the ED. https://www.pppmag.com/article/1778. Accessed July 19, 2017.
39. Fernandez J. Hospitals wage battle against drug diversion. https://www.drugtopics.com/top-news/hospitals-wage-battle-against-drug-diversion. Accessed August 17, 2017.
40. Minnesota Hospital Association. Road map to controlled substance diversion Prevention 2.0. https://www.mnhospitals.org/Portals/0/Documents/ptsafety/diversion/Road Map to Controlled Substance Diversion Prevention 2.0.pdf. Accessed June 30, 2017.
41. Bryson EO, Silverstein JH. Addiction and substance abuse in anesthesiology. Anesthesiology. 2008;109(5):905-917. doi: 10.1097/ALN.0b013e3181895bc1. PubMed
42. McCammon C. Diversion: a quiet threat in the healthcare setting. https://www.acep.org/Content.aspx?ID=94932. Accessed August 17, 2017.
43. Minnesota Hospital Association. Identifying potentially impaired practitioners [PowerPoint]. https://www.mnhospitals.org/Portals/0/Documents/ptsafety/diversion/potentially-impaired-practitioners.pdf. Accessed July 21, 2017.
44. Burger G, Burger M. Drug diversion: new approaches to an old problem. Am J Pharm Benefits. 2016;8(1):30-33.
45. Greenall J, Santora P, Koczmara C, Hyland S. Enhancing safe medication use for pediatric patients in the emergency department. Can J Hosp Pharm. 2009;62(2):150-153. doi: 10.4212/cjhp.v62i2.445. PubMed
46. New K. Avoid diversion practices that prompt DEA investigations. https://www.pppmag.com/article/1818. Accessed October 4, 2017.
47. New K. Detecting and responding to drug diversion. https://rxdiversion.com/detecting-and-responding-to-drug-diversion. Accessed July 13, 2017.
48. New KS. Institutional Diversion Prevention, Detection and Response [PowerPoint]. https://www.ncsbn.org/0613_DISC_Kim_New.pdf. Accessed August 25, 2017.
49. Siegel J, Forrey RA. Four case studies on diversion prevention. https://www.pppmag.com/article/1469/March_2014/Four_Case_Studies_on_Diversion_Prevention. Accessed July 31, 2017.
50. Copp MAB. Drug addiction among nurses: confronting a quiet epidemic-Many RNs fall prey to this hidden, potentially deadly disease. http://www.modernmedicine.com/modern-medicine/news/modernmedicine/modern-medicine-feature-articles/drug-addiction-among-nurses-con. Accessed September 8, 2017.
51. Maryland Department of Health and Mental Hygiene. Public health vulnerability review: drug diversion, infection risk, and David Kwiatkowski’s employment as a healthcare worker in Maryland. https://health.maryland.gov/pdf/Public Health Vulnerability Review.pdf. Accessed July 21, 2017.
52. Warner AE, Schaefer MK, Patel PR, et al. Outbreak of hepatitis C virus infection associated with narcotics diversion by an hepatitis C virus-infected surgical technician. Am J Infect Control. 2015;43(1):53-58. doi: 10.1016/j.ajic.2014.09.012. PubMed
53. New Hampshire Department of Health and Human Services-Division of Public Health Services. Hepatitis C outbreak investigation Exeter Hospital public report. https://www.dhhs.nh.gov/dphs/cdcs/hepatitisc/documents/hepc-outbreak-rpt.pdf . Accessed July 21, 2017.
54. Paparella SF. A tale of waste and loss: lessons learned. J Emerg Nurs. 2016;42(4):352-354. doi: 10.1016/j.jen.2016.03.025. PubMed
55. Ramer LM. Using servant leadership to facilitate healing after a drug diversion experience. AORN J. 2008;88(2):253-258. doi: 10.1016/j.aorn.2008.05.002. PubMed
56. Siegel J, O’Neal B, Code N. Prevention of controlled substance diversion-Code N: multidisciplinary approach to proactive drug diversion prevention. Hosp Pharm. 2007;42(3):244-248. doi: 10.1310/hpj4203-244.
57. Saver C. Drug diversion in the OR: how can you keep it from happening? https://pdfs.semanticscholar.org/f066/32113de065ca628a1f37218d18c654c15671.pdf. Accessed September 21, 2017.
58. Peterson DM. New DEA rules expand options for controlled substance disposal. J Pain Palliat Care Pharmacother. 2015;29(1):22-26. doi: 10.3109/15360288.2014.1002964. PubMed
59. Lefebvre LG, Kaufmann IM. The identification and management of substance use disorders in anesthesiologists. Can J Anesth J Can Anesth. 2017;64(2):211-218. doi: 10.1007/s12630-016-0775-y. PubMed
60. Missouri Bureau of Narcotics & Dangerous Drugs. Drug diversion in hospitals-A guide to preventing and investigating diversion issues. https://health.mo.gov/safety/bndd/doc/drugdiversion.doc. Accessed July 21, 2017.
61. Hayes S. Pharmacy diversion: prevention, detection and monitoring: a pharmacy fraud investigator’s perspective. International Health Facility Diversion Association Conference 2016. Accessed July 5, 2017.
62. Schaefer MK, Perz JF. Outbreaks of infections associated with drug diversion by US health care personnel. Mayo Clin Proc. 2014;89(7):878-887. doi: 10.1016/j.mayocp.2014.04.007. PubMed
63. Vigoda MM, Gencorelli FJ, Lubarsky DA. Discrepancies in medication entries between anesthetic and pharmacy records using electronic databases. Anesth Analg. 2007;105(4):1061-1065. doi: 10.1213/01.ane.0000282021.74832.5e. PubMed
64. Goodine C. Safety audit of automated dispensing cabinets. https://www.ncbi.nlm.nih.gov/pmc/articles/PMC2832564/. Accessed September 25, 2017.
65. Ontario College of Pharmacists. Hospital assessment criteria. http://www.ocpinfo.com/library/practice-related/download/library/practice-related/download/Hospital-Assessment-Criteria.pdf. Accessed August 30, 2017.
66. Lizza BD, Jagow B, Hensler D, et al. Impact of multiple daily clinical pharmacist-enforced assessments on time in target sedation range. J Pharm Pract. 2018;31(5):445-449. doi: 10.1177/0897190017729522. PubMed
67. Landro L. Hospitals address a drug problem: software and Robosts help secure and monitor medications. The Wall Street Journal. https://www.wsj.com/articles/hospitals-address-a-drug-problem-1392762765. Accessed June 29, 2017.
68. Hyland S, Koczmara C, Salsman B, Musing ELS, Greenall J. Optimizing the use of automated dispensing cabinets. Can J Hosp Pharm. 2007;60(5):332-334. doi: http://dx.doi.org/10.4212/cjhp.v60i5.205
69. O’Neal B, Bass K, Siegel J. Diversion in the operating room. Hosp Pharm. 2007;42(4):359-363. doi: 10.1310/hpj4204-359.
70. White C, Malida J. Large pill theft shows challenge of securing hospital drugs. https://www.matrixhomecare.com/downloads/HRM060110.pdf. Accessed August 18, 2017.
71. Crowson K, Monk-Tutor M. Use of automated controlled substance cabinets for detection of diversion in US hospitals: a national study. Hosp Pharm. 2005;40(11):977-983. doi: 10.1177/001857870504001107.
72. National Council of State Boards of Nursing Inc. Substance use disorder in the workplace [chapter 6]. In: Substance Use Disorder in Nursing. Chicago: National Council of State Boards of Nursing Inc. https://www.ncsbn.org/SUDN_11.pdf. Accessed. July 21, 2017.
73. Swanson B-M. Preventing prescription drug diversions at your hospital. Campus Safety. http://www.campussafetymagazine.com/cs/preventing-prescription-drug-diversions-at-your-hospital. Accessed June 30, 2017.
74. O’Neal B, Siegel J. Prevention of controlled substance diversion—scope, strategy, and tactics: Code N: the intervention process. Hosp Pharm. 2007;42(7):633-656. doi: 10.1310/hpj4207-653
75. Mandrack M, Cohen MR, Featherling J, et al. Nursing best practices using automated dispensing cabinets: nurses’ key role in improving medication safety. Medsurg Nurs. 2012;21(3):134-139. PubMed
76. Berge KH, Seppala MD, Lanier WL. The anesthesiology community’s approach to opioid- and anesthetic-abusing personnel: time to change course. Anesthesiology. 2008;109(5):762-764. doi: 10.1097/ALN.0b013e31818a3814. PubMed
77. Gemensky J. The pharmacist’s role in surgery: the indispensable asset. US Pharm. 2015;40(3):HS8-HS12.
78. New K. Drug diversion: regulatory requirements and best practices. http://www.hospitalsafetycenter.com/content/328646/topic/ws_hsc_hsc.html. Accessed September 21, 2017.
79. Lahey T, Nelson WA. A proposed nationwide reporting system to satisfy the ethical obligation to prevent drug diversion-related transmission of hepatitis C in healthcare facilities. Clin Infect Dis. 2015;60(12):1816-1820. doi: 10.1093/cid/civ203. PubMed
80. Gavin KG
81. Tetzlaff J, Collins GB, Brown DL, et al. A strategy to prevent substance abuse in an academic anesthesiology department. J Clin Anesth. 2010;22(2):143-150. doi: 10.1016/j.jclinane.2008.12.030. PubMed
82. Kintz P, Villain M, Dumestre V, Cirimele V. Evidence of addiction by anesthesiologists as documented by hair analysis. Forensic Sci Int. 2005;153(1):81-84. doi: 10.1016/j.forsciint.2005.04.033. PubMed
83. Wolf CE, Poklis A. A rapid HPLC procedure for analysis of analgesic pharmaceutical mixtures for quality assurance and drug diversion testing. J Anal Toxicol. 2005;29(7):711-714. doi: 10.1093/jat/29.7.711. PubMed
84. Poklis JL, Mohs AJ, Wolf CE, Poklis A, Peace MR. Identification of drugs in parenteral pharmaceutical preparations from a quality assurance and a diversion program by direct analysis in real-time AccuTOF(TM)-mass spectrometry (Dart-MS). J Anal Toxicol. 2016;40(8):608-616. doi: 10.1093/jat/bkw065. PubMed
85. Pham JC, Pronovost PJ, Skipper GE. Identification of physician impairment. JAMA. 2013;309(20):2101-2102. doi: 10.1001/jama.2013.4635. PubMed
86. Stolbach A, Nelson LS, Hoffman RS. Protection of patients from physician substance misuse. JAMA. 2013;310(13):1402-1403. doi: 10.1001/jama.2013.277948. PubMed
87. Berge KH, McGlinch BP. The law of unintended consequences can never be repealed: the hazards of random urine drug screening of anesthesia providers. Anesth Analg. 2017;124(5):1397-1399. doi: 10.1213/ANE.0000000000001972. PubMed
88. Oreskovich MR, Caldeiro RM. Anesthesiologists recovering from chemical dependency: can they safely return to the operating room? Mayo Clin Proc. 2009;84(7):576-580. doi: 10.1016/S0025-6196(11)60745-3. PubMed
89. Di Costanzo M. Road to recovery. http://rnao.ca/sites/rnao-ca/files-RNJ-JanFeb2015.pdf. Accessed September 28, 2017.
90. Selzer J. Protection of patients from physician substance misuse. JAMA. 2013;310(13):1402-1403. doi: 10.1001/jama.2013.277948. PubMed
91. Wright RL. Drug diversion in nursing practice a call for professional accountability to recognize and respond. J Assoc Occup Health Prof Healthc. 2013;33(1):27-30. PubMed
92. Siegel J, O’Neal B, Wierwille C. The investigative process. Hosp Pharm. 2007;42(5):466-469. doi: 10.1310/hpj4205-466.
93. Brenn BR, Kim MA, Hilmas E. Development of a computerized monitoring program to identify narcotic diversion in a pediatric anesthesia practice. Am J Health System Pharm. 2015;72(16):1365-1372. doi: 10.2146/ajhp140691. PubMed
94. Drug diversion sting goes wrong and privacy is questioned. http://www.reliasmedia.com/articles/138142-drug-diversion-sting-goes-wrong-and-privacy-is-questioned. Accessed September 21, 2017.
95. New K. Drug diversion defined: steps to prevent, detect, and respond to drug diversion in facilities. CDC’s healthcare blog. https://blogs.cdc.gov/safehealthcare/drug-diversion-defined-steps-to-prevent-detect-and-respond-to-drug-diversion-in-facilities. Accessed July 21, 2017.
96. Howorun C. ‘Unexplained losses’ of opioids on the rise in Canadian hospitals. Maclean’s. http://www.macleans.ca/society/health/unexplained-losses-of-opioids-on-the-rise-in-canadian-hospitals. Accessed December 5, 2017.
97. Carman T. When prescription opioids run out, users look for the supply on the streets. CBC News. https://www.cbc.ca/news/canada/when-prescription-opioids-run-out-users-look-for-the-supply-on-the-streets-1.4720952. Accessed July 1, 2018.
98. Tanga HY. Nurse drug diversion and nursing leader’s responsibilities: legal, regulatory, ethical, humanistic, and practical considerations. JONAs Healthc Law Eth Regul. 2011;13(1):13-16. doi: 10.1097/NHL.0b013e31820bd9e6. PubMed
99. Scholze AR, Martins JT, Galdino MJQ, Ribeiro RP. Occupational environment and psychoactive substance consumption among nurses. Acta Paul Enferm. 2017;30(4):404-411. doi: 10.1590/1982-0194201700060.
The United States (US) and Canada are the two highest per-capita consumers of opioids in the world;1 both are struggling with unprecedented opioid-related mortality.2,3 The nonmedical use of opioids is facilitated by diversion and defined as the transfer of drugs from lawful to unlawful channels of use4,5 (eg, sharing legitimate prescriptions with family and friends6). Opioids and other controlled drugs are also diverted from healthcare facilities;4,5,7,8 Canadian data suggest these incidents may be increasing (controlled-drug loss reports have doubled each year since 20159).
The diversion of controlled drugs from hospitals affects patients, healthcare workers (HCWs), hospitals, and the public. Patients suffer insufficient analgesia or anesthesia, experience substandard care from impaired HCWs, and are at risk of infections from compromised syringes.4,10,11 HCWs that divert are at risk of overdose and death; they also face regulatory censure, criminal prosecution, and civil malpractice suits.12,13 Hospitals bear the cost of diverted drugs,14,15 internal investigations,4 and follow-up care for affected patients,4,13 and can be fined in excess of $4 million dollars for inadequate safeguards.16 Negative publicity highlights hospitals failing to self-regulate and report when diversion occurs, compromising public trust.17-19 Finally, diverted drugs impact population health by contributing to drug misuse.
Hospitals face a critical problem: how does a hospital prevent the diversion of controlled drugs? Hospitals have not yet implemented safeguards needed to detect or understand how diversion occurs. For example, 79% of Canadian hospital controlled-drug loss reports are “unexplained losses,”9 demonstrating a lack of traceability needed to understand the root causes of the loss. A single US endoscopy clinic showed that $10,000 of propofol was unaccounted for over a four-week period.14 Although transactional discrepancies do not equate to diversion, they are a potential signal of diversion and highlight areas for improvement.15 The hospital medication-use process (MUP; eg, procurement, storage, preparation, prescription, dispensing, administration, waste, return, and removal) has multiple vulnerabilities that have been exploited. Published accounts of diversion include falsification of clinical documents, substitution of saline for medication, and theft.4,20-23 Hospitals require guidance to assess their drug processes against known vulnerabilities and identify safeguards that may improve their capacity to prevent or detect diversion.
In this work, we provide a scoping review on the emerging topic of drug diversion to support hospitals. Scoping reviews can be a “preliminary attempt to provide an overview of existing literature that identifies areas where more research might be required.”24 Past literature has identified sources of drugs for nonmedical use,6,25,26 provided partial data on the quantities of stolen drug,7,8 and estimated the rate of HCW diversion.5,27-29 However, no reviews have focused on system gaps specific to hospital MUPs and diversion. Our review remedies this knowledge gap by consolidating known weaknesses and safeguards from peer- and nonpeer-reviewed articles. Drug diversion has been discussed at conferences and in news articles, case studies, and legal reports; excluding such discussion ignores substantive work that informs diversion practices in hospitals. Early indications suggest that hospitals have not yet implemented safeguards to properly identify when diversion has occurred, and consequently, lack the evidence to contribute to peer-reviewed literature. This article summarizes (1) clinical units, health professions, and stages of the MUP discussed, (2) contributors to diversion in hospitals, and (3) safeguards to prevent or detect diversion in hospitals.
METHODS
Scoping Review
We followed Arksey and O’Malley’s six-step framework for scoping reviews,30 with the exception of the optional consultation phase (step 6). We addressed three questions (step 1): what clinical units, health professions, or stages of the medication-use process are commonly discussed; what are the identified contributors to diversion in hospitals; and what safeguards have been described for prevention or detection of diversion in hospitals? We then identified relevant studies (step 2) by searching records published from January 2005 to June 2018 in MEDLINE, Embase, PsycINFO, CINAHL, Scopus, and Web of Science; the gray literature was also searched (see supplementary material for search terms).
All study designs were considered, including quantitative and qualitative methods, such as experiments, chart reviews and audit reports, surveys, focus groups, outbreak investigations, and literature reviews. Records were included (step 3) if abstracts met the Boolean logic criteria outlined in Appendix 1. If no abstract was available, then the full-text article was assessed. Prior to abstract screening, four reviewers (including R.R.) independently screened batches of 50 abstracts at a time to iteratively assess interrater reliability (IRR). Disagreements were resolved by consensus and the eligibility criteria were refined until IRR was achieved (Fleiss kappa > 0.65). Once IRR was achieved, the reviewers applied the criteria independently. For each eligible abstract, the full text was retrieved and assigned to a reviewer for independent assessment of eligibility. The abstract was reviewed if the full-text article was not available. Only articles published in English were included.
Reviewers charted findings from the full-text records (steps 4 and 5) by using themes defined a priori, specifically literature characteristics (eg, authors, year of publication), characteristics related to study method (eg, article type), variables related to our research questions (eg, variations by clinical unit, health profession), contributors to diversion, and safeguards to detect or prevent diversion. Inductive additions or modifications to the themes were proposed during the full-text review (eg, reviewers added a theme “name of drugs diverted” to identify drugs frequently reported as diverted) and accepted by consensus among the reviewers.
RESULTS
Scoping Review
The literature search generated 4,733 records of which 307 were duplicates and 4,009 were excluded on the basis of the eligibility criteria. The reviewers achieved 100% interrater agreement on the fourth round of abstract screening. Upon full-text review, 312 articles were included for data abstraction (Figure).
Literature Characteristics
Table 1 summarizes the characteristics of the included literature. The articles were published in a mix of peer-reviewed (137, 44%) and nonpeer-reviewed (175, 56%) sources. Some peer-reviewed articles did not use research methods, and some nonpeer-reviewed articles used research methods (eg, doctoral theses). Therefore, Table 1 categorizes the articles by research method (if applicable) and by peer-review status. The articles primarily originated in the United States (211, 68%) followed by Canada (79, 25%) and other countries (22, 7%). Most articles were commentaries, editorials, reports or news media, rather than formal studies presenting original data.
Literature Focus by Clinical Unit, Health Profession, and Stage of Medication-Use Process
Most articles did not focus the discussion on any one clinical unit, health profession, or stage of the MUP. Of the articles that made explicit mention of clinical units, hospital pharmacies and operating rooms were discussed most often, nurses were the most frequently highlighted health profession, and most stages of the MUP were discussed equally, with the exception of prescribing which was mentioned the least (Supplementary Table).
Contributors to Diversion
The literature describes a variety of contributors to drug diversion. Table 2 organizes these contributors by stage of the MUP and provides references for further discussion.
The diverse and system-wide contributors to diversion described in Table 2 support inappropriate access to controlled drugs and can delay the detection of diversion after it occurred. These contributors are more likely to occur in organizations that fail to adhere to drug-handling practices or to carefully review practices.34,44
Diversion Safeguards in Hospitals
Table 3 summarizes published recommendations to mitigate the risk of diversion by stage of the MUP.
DISCUSSION
This review synthesizes a broad sample of peer- and nonpeer-reviewed literature to produce a consolidated list of known contributors (Table 2) and safeguards against (Table 3) controlled-drug diversion in hospitals. The literature describes an extensive list of ways drugs have been diverted in all stages of the MUP and can be exploited by all health professions in any clinical unit. Hospitals should be aware that nonclinical HCWs may also be at risk (eg, shipping and receiving personnel may handle drug shipments or returns, housekeeping may encounter partially filled vials in patient rooms). Patients and their families may also use some of the methods described in Table 2 (eg, acquiring fentanyl patches from unsecured waste receptacles and tampering with unsecured intravenous infusions).
Given the established presence of drug diversion in the literature,5,7-9,96,97 hospitals should assess their clinical practices against these findings, review the associated references, and refer to existing guidance to better understand the intricacies of the topic.7,31,51,53,60,79 To accommodate variability in practice between hospitals, we suggest considering two underlying issues that recur in Tables 2 and 3 that will allow hospitals to systematically analyze their unique practices for each stage of the MUP.
The first issue is falsification of clinical or inventory documentation. Falsified documents give the opportunity and appearance of legitimate drug transactions, obscure drug diversion, or create opportunities to collect additional drugs. Clinical documentation can be falsified actively (eg, deliberately falsifying verbal orders, falsifying drug amounts administered or wasted, and artificially increasing patients’ pain scores) or passively (eg, profiled automated dispensing cabinets [ADC] allow drug withdrawals for a patient that has been discharged or transferred over 72 hours ago because the system has not yet been updated).
The second issue involves failure to maintain the physical security of controlled drugs, thereby allowing unauthorized access. This issue includes failing to physically secure drug stock (eg, propping doors open to controlled-drug areas; failing to log out of ADCs, thereby facilitating unauthorized access; and leaving prepared drugs unsupervised in patient care areas) or failing to maintain accurate access credentials (eg, staff no longer working on the care unit still have access to the ADC or other secure areas). Prevention safeguards require adherence to existing security protocols (eg, locked doors and staff access frequently updated) and limiting the amount of controlled drugs that can be accessed (eg, supply on care unit should be minimized to what is needed and purchase smallest unit doses to minimize excess drug available to HCWs). Hospitals may need to consider if security measures are actually feasible for HCWs. For example, syringes of prepared drugs should not be left unsupervised to prevent risk of substitution or tampering; however, if the responsible HCW is also expected to collect supplies from outside the care area, they cannot be expected to maintain constant supervision. Detection safeguards include the use of tamper-evident packaging to support detection of compromised controlled drugs or assaying drug waste or other suspicious drug containers to detect dilution or tampering. Hospitals may also consider monitoring whether staff access controlled-drug areas when they are not scheduled to work to detect security breaches.
Safeguards for both issues benefit from an organizational culture reinforced through training at orientation and annually thereafter. Staff should be aware of reporting mechanisms (eg, anonymous hotlines), employee and professional assistance programs, self-reporting protocols, and treatment and rehabilitation options.10,12,29,47,72,91 Other system-wide safeguards described in Table 3 should also be considered. Detection of transactional discrepancies does not automatically indicate diversion, but recurrent discrepancies indicate a weakness in controlled-drug management and should be rectified; diversion prevention is a responsibility of all departments, not just the pharmacy.
Hospitals have several motivations to actively invest in safeguards. Drug diversion is a patient safety issue, a patient privacy issue (eg, patient records are inappropriately accessed to identify opportunities for diversion), an occupational health issue given the higher risks of opioid-related SUD faced by HCWs, a regulatory compliance issue, and a legal issue.31,41,46,59,78,98,99 Although individuals are accountable for drug diversion itself, hospitals should take adequate measures to prevent or detect diversion and protect patients and staff from associated harms. Hospitals should pay careful attention to the configuration of healthcare technologies, environments, and processes in their institution to reduce the opportunity for diversion.
Our study has several limitations. We did not include articles prior to 2005 because we captured a sizable amount of literature with the current search terms and wanted the majority of the studies to reflect workflow based on electronic health records and medication ordering, which only came into wide use in the past 15 years. Other possible contributors and safeguards against drug diversion may not be captured in our review. Nevertheless, thorough consideration of the two underlying issues described will help protect hospitals against new and emerging methods of diversion. The literature search yielded a paucity of controlled trials formally evaluating the effectiveness of these interventions, so safeguards identified in our review may not represent optimal strategies for responding to drug diversion. Lastly, not all suggestions may be applicable or effective in every institution.
CONCLUSION
Drug diversion in hospitals is a serious and urgent concern that requires immediate attention to mitigate harms. Past incidents of diversion have shown that hospitals have not yet implemented safeguards to fully account for drug losses, with resultant harms to patients, HCWs, hospitals themselves, and the general public. Further research is needed to identify system factors relevant to drug diversion, identify new safeguards, evaluate the effectiveness of known safeguards, and support adoption of best practices by hospitals and regulatory bodies.
Acknowledgments
The authors wish to thank Iveta Lewis and members of the HumanEra team (Carly Warren, Jessica Tomasi, Devika Jain, Maaike deVries, and Betty Chang) for screening and data extraction of the literature and to Peggy Robinson, Sylvia Hyland, and Sonia Pinkney for editing and commentary.
Disclosures
Ms. Reding and Ms. Hyland were employees of North York General Hospital at the time of this work. Dr. Hamilton and Ms. Tscheng are employees of ISMP Canada, a subcontractor to NYGH, during the conduct of the study. Mark Fan and Patricia Trbovich have received honoraria from BD Canada for presenting preliminary study findings at BD sponsored events.
Funding
This work was supported by Becton Dickinson (BD) Canada Inc. (grant #ROR2017-04260JH-NYGH). BD Canada had no involvement in study design; in the collection, analysis or interpretation of data; in the writing of the report; or in the decision to submit the article for publication.
1. International Narcotics Control Board. Narcotic drugs: estimated world requirements for 2017 - statistics for 2015. https://www.incb.org/documents/Narcotic-Drugs/Technical-Publications/2016/Narcotic_Drugs_Publication_2016.pdf. Accessed February 2, 2018.
2. Gomes T, Tadrous M, Mamdani MM, Paterson JM, Juurlink DN. The burden of opioid-related mortality in the United States. JAMA Netw Open. 2018;1(2):e180217. doi: 10.1001/jamanetworkopen.2018.0217. PubMed
3. Special Advisory Committee on the Epidemic of Opioid Overdoses. National report: apparent opioid-related deaths in Canada (December 2017). https://www.canada.ca/en/public-health/services/publications/healthy-living/apparent-opioid-related-deaths-report-2016-2017-december.html. Accessed June 5, 2018.
4. Berge KH, Dillon KR, Sikkink KM, Taylor TK, Lanier WL. Diversion of drugs within health care facilities, a multiple-victim crime: patterns of diversion, scope, consequences, detection, and prevention. Mayo Clin Proc. 2012;87(7):674-682. doi: 10.1016/j.mayocp.2012.03.013. PubMed
5. Inciardi JA, Surratt HL, Kurtz SP, Burke JJ. The diversion of prescription drugs by health care workers in Cincinnati, Ohio. Subst Use Misuse. 2006;41(2):255-264. doi: 10.1080/10826080500391829. PubMed
6. Hulme S, Bright D, Nielsen S. The source and diversion of pharmaceutical drugs for non-medical use: A systematic review and meta-analysis. Drug Alcohol Depend. 2018;186:242-256. doi: 10.1016/j.drugalcdep.2018.02.010. PubMed
7. Minnesota Hospital Association. Minnesota controlled substance diversion prevention coalition: final report. https://www.mnhospitals.org/Portals/0/Documents/ptsafety/diversion/drug-diversion-final-report-March2012.pdf. Accessed July 21, 2017.
8. Joranson DE, Gilson AM. Drug crime is a source of abused pain medications in the United States. J Pain Symptom Manag. 2005;30(4):299-301. doi: 10.1016/j.jpainsymman.2005.09.001. PubMed
9. Carman T. Analysis of Health Canada missing controlled substances and precursors data (2017). Github. https://github.com/taracarman/drug_losses. Accessed July 1, 2018.
10. New K. Preventing, detecting, and investigating drug diversion in health care facilities. Mo State Board Nurs Newsl. 2014;5(4):11-14.
11. Schuppener LM, Pop-Vicas AE, Brooks EG, et al. Serratia marcescens Bacteremia: Nosocomial Clustercluster following narcotic diversion. Infect Control Hosp Epidemiol. 2017;38(9):1027-1031. doi: 10.1017/ice.2017.137. PubMed
12. New K. Investigating institutional drug diversion. J Leg Nurse Consult. 2015;26(4):15-18. doi: https://doi.org/10.1016/S2155-8256(15)30095-8
13. Berge KH, Lanier WL. Bloodstream infection outbreaks related to opioid-diverting health care workers: a cost-benefit analysis of prevention and detection programs. Mayo Clin Proc. 2014;89(7):866-868. doi: 10.1016/j.mayocp.2014.04.010. PubMed
14. Horvath C. Implementation of a new method to track propofol in an endoscopy unit. Int J Evid Based Healthc. 2017;15(3):102-110. doi: 10.1097/XEB.0000000000000112. PubMed
15. Pontore KM. The Epidemic of Controlled Substance Diversion Related to Healthcare Professionals. Graduate School of Public Health, University of Pittsburgh; 2015.
16. Knowles M. Georgia health system to pay $4.1M settlement over thousands of unaccounted opioids. Becker’s Hospital Review. https://www.beckershospitalreview.com/opioids/georgia-health-system-to-pay-4-1m-settlement-over-thousands-of-unaccounted-opioids.html. Accessed September 11, 2018.
17. Olinger D, Osher CN. Drug-addicted, dangerous and licensed for the operating room. The Denver Post. https://www.denverpost.com/2016/04/23/drug-addicted-dangerous-and-licensed-for-the-operating-room. Accessed August 2, 2017.
18. Levinson DR, Broadhurst ET. Why aren’t doctors drug tested? The New York Times. https://www.nytimes.com/2014/03/13/opinion/why-arent-doctors-drug-tested.html. Accessed July 21, 2017.
19. Eichenwald K. When Drug Addicts Work in Hospitals, No One is Safe. Newsweek. https://www.newsweek.com/2015/06/26/traveler-one-junkies-harrowing-journey-across-america-344125.html. Accessed August 2, 2017.
20. Martin ES, Dzierba SH, Jones DM. Preventing large-scale controlled substance diversion from within the pharmacy. Hosp Pharm. 2013;48(5):406-412. doi: 10.1310/hpj4805-406. PubMed
21. Institute for Safe Medication Practices. Partially filled vials and syringes in sharps containers are a key source of drugs for diversion. Medication safety alerts. https://www.ismp.org/resources/partially-filled-vials-and-syringes-sharps-containers-are-key-source-drugs-diversion?id=1132. Accessed June 29, 2017.
22. Fleming K, Boyle D, Lent WJB, Carpenter J, Linck C. A novel approach to monitoring the diversion of controlled substances: the role of the pharmacy compliance officer. Hosp Pharm. 2007;42(3):200-209. doi: 10.1310/hpj4203-200.
23. Merlo LJ, Cummings SM, Cottler LB. Prescription drug diversion among substance-impaired pharmacists. Am J Addict. 2014;23(2):123-128. doi: 10.1111/j.1521-0391.2013.12078.x. PubMed
24. O’Malley L, Croucher K. Housing and dementia care-a scoping review of the literature. Health Soc Care Commun. 2005;13(6):570-577. doi: 10.1111/j.1365-2524.2005.00588.x. PubMed
25. Fischer B, Bibby M, Bouchard M. The global diversion of pharmaceutical drugs non-medical use and diversion of psychotropic prescription drugs in North America: a review of sourcing routes and control measures. Addiction. 2010;105(12):2062-2070. doi: 10.1111/j.1360-0443.2010.03092.x. PubMed
26. Inciardi JA, Surratt HL, Cicero TJ, et al. The “black box” of prescription drug diversion. J Addict Dis. 2009;28(4):332-347. doi: 10.1080/10550880903182986. PubMed
27. Boulis S, Khanduja PK, Downey K, Friedman Z. Substance abuse: a national survey of Canadian residency program directors and site chiefs at university-affiliated anesthesia departments. Can J Anesth. 2015;62(9):964-971. doi: 10.1007/s12630-015-0404-1. PubMed
28. Warner DO, Berge K, Sun H et al. Substance use disorder among anesthesiology residents, 1975-2009. JAMA. 2013;310(21):2289-2296. doi: 10.1001/jama.2013.281954. PubMed
29. Kunyk D. Substance use disorders among registered nurses: prevalence, risks and perceptions in a disciplinary jurisdiction. J Nurs Manag. 2015;23(1):54-64. doi: 10.1111/jonm.12081. PubMed
30. Arksey H, O’Malley L. Scoping studies: towards a methodological framework. Int J Soc Res Methodol. 2005;8(1):19-32. doi: 10.1080/1364557032000119616. PubMed
31. Brummond PW, Chen DF, Churchill WW, et al. ASHP guidelines on preventing diversion of controlled substances. Am J Health System Pharm. 2017;74(5):325-348. doi: 10.2146/ajhp160919. PubMed
32. New K. Diversion risk rounds: a reality check on your drug-handling policies. http://www.diversionspecialists.com/wp-content/uploads/Diversion-Risk-Rounds-A-Reality-Check-on-Your-Drug-Handling-Policies.pdf. Accessed July 13, 2017.
33. New K. Uncovering Diversion: 6 case studies on Diversion. https://www.pppmag.com/article/2162. Accessed January 30, 2018.
34. New KS. Undertaking a System Wide Diversion Risk Assessment [PowerPoint]. International Health Facility Diversion Association Conference; 2016. Accessed July 14, 2016.
35. O’Neal B, Siegel J. Diversion in the pharmacy. Hosp Pharm. 2007;42(2):145-148. doi: 10.1310/hpj4202-145.
36. Holleran RS. What is wrong With this picture? J Emerg Nurs. 2010;36(5):396-397. doi: 10.1016/j.jen.2010.08.005. PubMed
37. Vrabel R. Identifying and dealing with drug diversion. How hospitals can stay one step ahead. https://www.hcinnovationgropu.com/home/article/13003330/identifying-and-dealing-with-drug-diversion. Accessed September 18, 2017.
38. Mentler P. Preventing diversion in the ED. https://www.pppmag.com/article/1778. Accessed July 19, 2017.
39. Fernandez J. Hospitals wage battle against drug diversion. https://www.drugtopics.com/top-news/hospitals-wage-battle-against-drug-diversion. Accessed August 17, 2017.
40. Minnesota Hospital Association. Road map to controlled substance diversion Prevention 2.0. https://www.mnhospitals.org/Portals/0/Documents/ptsafety/diversion/Road Map to Controlled Substance Diversion Prevention 2.0.pdf. Accessed June 30, 2017.
41. Bryson EO, Silverstein JH. Addiction and substance abuse in anesthesiology. Anesthesiology. 2008;109(5):905-917. doi: 10.1097/ALN.0b013e3181895bc1. PubMed
42. McCammon C. Diversion: a quiet threat in the healthcare setting. https://www.acep.org/Content.aspx?ID=94932. Accessed August 17, 2017.
43. Minnesota Hospital Association. Identifying potentially impaired practitioners [PowerPoint]. https://www.mnhospitals.org/Portals/0/Documents/ptsafety/diversion/potentially-impaired-practitioners.pdf. Accessed July 21, 2017.
44. Burger G, Burger M. Drug diversion: new approaches to an old problem. Am J Pharm Benefits. 2016;8(1):30-33.
45. Greenall J, Santora P, Koczmara C, Hyland S. Enhancing safe medication use for pediatric patients in the emergency department. Can J Hosp Pharm. 2009;62(2):150-153. doi: 10.4212/cjhp.v62i2.445. PubMed
46. New K. Avoid diversion practices that prompt DEA investigations. https://www.pppmag.com/article/1818. Accessed October 4, 2017.
47. New K. Detecting and responding to drug diversion. https://rxdiversion.com/detecting-and-responding-to-drug-diversion. Accessed July 13, 2017.
48. New KS. Institutional Diversion Prevention, Detection and Response [PowerPoint]. https://www.ncsbn.org/0613_DISC_Kim_New.pdf. Accessed August 25, 2017.
49. Siegel J, Forrey RA. Four case studies on diversion prevention. https://www.pppmag.com/article/1469/March_2014/Four_Case_Studies_on_Diversion_Prevention. Accessed July 31, 2017.
50. Copp MAB. Drug addiction among nurses: confronting a quiet epidemic-Many RNs fall prey to this hidden, potentially deadly disease. http://www.modernmedicine.com/modern-medicine/news/modernmedicine/modern-medicine-feature-articles/drug-addiction-among-nurses-con. Accessed September 8, 2017.
51. Maryland Department of Health and Mental Hygiene. Public health vulnerability review: drug diversion, infection risk, and David Kwiatkowski’s employment as a healthcare worker in Maryland. https://health.maryland.gov/pdf/Public Health Vulnerability Review.pdf. Accessed July 21, 2017.
52. Warner AE, Schaefer MK, Patel PR, et al. Outbreak of hepatitis C virus infection associated with narcotics diversion by an hepatitis C virus-infected surgical technician. Am J Infect Control. 2015;43(1):53-58. doi: 10.1016/j.ajic.2014.09.012. PubMed
53. New Hampshire Department of Health and Human Services-Division of Public Health Services. Hepatitis C outbreak investigation Exeter Hospital public report. https://www.dhhs.nh.gov/dphs/cdcs/hepatitisc/documents/hepc-outbreak-rpt.pdf . Accessed July 21, 2017.
54. Paparella SF. A tale of waste and loss: lessons learned. J Emerg Nurs. 2016;42(4):352-354. doi: 10.1016/j.jen.2016.03.025. PubMed
55. Ramer LM. Using servant leadership to facilitate healing after a drug diversion experience. AORN J. 2008;88(2):253-258. doi: 10.1016/j.aorn.2008.05.002. PubMed
56. Siegel J, O’Neal B, Code N. Prevention of controlled substance diversion-Code N: multidisciplinary approach to proactive drug diversion prevention. Hosp Pharm. 2007;42(3):244-248. doi: 10.1310/hpj4203-244.
57. Saver C. Drug diversion in the OR: how can you keep it from happening? https://pdfs.semanticscholar.org/f066/32113de065ca628a1f37218d18c654c15671.pdf. Accessed September 21, 2017.
58. Peterson DM. New DEA rules expand options for controlled substance disposal. J Pain Palliat Care Pharmacother. 2015;29(1):22-26. doi: 10.3109/15360288.2014.1002964. PubMed
59. Lefebvre LG, Kaufmann IM. The identification and management of substance use disorders in anesthesiologists. Can J Anesth J Can Anesth. 2017;64(2):211-218. doi: 10.1007/s12630-016-0775-y. PubMed
60. Missouri Bureau of Narcotics & Dangerous Drugs. Drug diversion in hospitals-A guide to preventing and investigating diversion issues. https://health.mo.gov/safety/bndd/doc/drugdiversion.doc. Accessed July 21, 2017.
61. Hayes S. Pharmacy diversion: prevention, detection and monitoring: a pharmacy fraud investigator’s perspective. International Health Facility Diversion Association Conference 2016. Accessed July 5, 2017.
62. Schaefer MK, Perz JF. Outbreaks of infections associated with drug diversion by US health care personnel. Mayo Clin Proc. 2014;89(7):878-887. doi: 10.1016/j.mayocp.2014.04.007. PubMed
63. Vigoda MM, Gencorelli FJ, Lubarsky DA. Discrepancies in medication entries between anesthetic and pharmacy records using electronic databases. Anesth Analg. 2007;105(4):1061-1065. doi: 10.1213/01.ane.0000282021.74832.5e. PubMed
64. Goodine C. Safety audit of automated dispensing cabinets. https://www.ncbi.nlm.nih.gov/pmc/articles/PMC2832564/. Accessed September 25, 2017.
65. Ontario College of Pharmacists. Hospital assessment criteria. http://www.ocpinfo.com/library/practice-related/download/library/practice-related/download/Hospital-Assessment-Criteria.pdf. Accessed August 30, 2017.
66. Lizza BD, Jagow B, Hensler D, et al. Impact of multiple daily clinical pharmacist-enforced assessments on time in target sedation range. J Pharm Pract. 2018;31(5):445-449. doi: 10.1177/0897190017729522. PubMed
67. Landro L. Hospitals address a drug problem: software and Robosts help secure and monitor medications. The Wall Street Journal. https://www.wsj.com/articles/hospitals-address-a-drug-problem-1392762765. Accessed June 29, 2017.
68. Hyland S, Koczmara C, Salsman B, Musing ELS, Greenall J. Optimizing the use of automated dispensing cabinets. Can J Hosp Pharm. 2007;60(5):332-334. doi: http://dx.doi.org/10.4212/cjhp.v60i5.205
69. O’Neal B, Bass K, Siegel J. Diversion in the operating room. Hosp Pharm. 2007;42(4):359-363. doi: 10.1310/hpj4204-359.
70. White C, Malida J. Large pill theft shows challenge of securing hospital drugs. https://www.matrixhomecare.com/downloads/HRM060110.pdf. Accessed August 18, 2017.
71. Crowson K, Monk-Tutor M. Use of automated controlled substance cabinets for detection of diversion in US hospitals: a national study. Hosp Pharm. 2005;40(11):977-983. doi: 10.1177/001857870504001107.
72. National Council of State Boards of Nursing Inc. Substance use disorder in the workplace [chapter 6]. In: Substance Use Disorder in Nursing. Chicago: National Council of State Boards of Nursing Inc. https://www.ncsbn.org/SUDN_11.pdf. Accessed. July 21, 2017.
73. Swanson B-M. Preventing prescription drug diversions at your hospital. Campus Safety. http://www.campussafetymagazine.com/cs/preventing-prescription-drug-diversions-at-your-hospital. Accessed June 30, 2017.
74. O’Neal B, Siegel J. Prevention of controlled substance diversion—scope, strategy, and tactics: Code N: the intervention process. Hosp Pharm. 2007;42(7):633-656. doi: 10.1310/hpj4207-653
75. Mandrack M, Cohen MR, Featherling J, et al. Nursing best practices using automated dispensing cabinets: nurses’ key role in improving medication safety. Medsurg Nurs. 2012;21(3):134-139. PubMed
76. Berge KH, Seppala MD, Lanier WL. The anesthesiology community’s approach to opioid- and anesthetic-abusing personnel: time to change course. Anesthesiology. 2008;109(5):762-764. doi: 10.1097/ALN.0b013e31818a3814. PubMed
77. Gemensky J. The pharmacist’s role in surgery: the indispensable asset. US Pharm. 2015;40(3):HS8-HS12.
78. New K. Drug diversion: regulatory requirements and best practices. http://www.hospitalsafetycenter.com/content/328646/topic/ws_hsc_hsc.html. Accessed September 21, 2017.
79. Lahey T, Nelson WA. A proposed nationwide reporting system to satisfy the ethical obligation to prevent drug diversion-related transmission of hepatitis C in healthcare facilities. Clin Infect Dis. 2015;60(12):1816-1820. doi: 10.1093/cid/civ203. PubMed
80. Gavin KG
81. Tetzlaff J, Collins GB, Brown DL, et al. A strategy to prevent substance abuse in an academic anesthesiology department. J Clin Anesth. 2010;22(2):143-150. doi: 10.1016/j.jclinane.2008.12.030. PubMed
82. Kintz P, Villain M, Dumestre V, Cirimele V. Evidence of addiction by anesthesiologists as documented by hair analysis. Forensic Sci Int. 2005;153(1):81-84. doi: 10.1016/j.forsciint.2005.04.033. PubMed
83. Wolf CE, Poklis A. A rapid HPLC procedure for analysis of analgesic pharmaceutical mixtures for quality assurance and drug diversion testing. J Anal Toxicol. 2005;29(7):711-714. doi: 10.1093/jat/29.7.711. PubMed
84. Poklis JL, Mohs AJ, Wolf CE, Poklis A, Peace MR. Identification of drugs in parenteral pharmaceutical preparations from a quality assurance and a diversion program by direct analysis in real-time AccuTOF(TM)-mass spectrometry (Dart-MS). J Anal Toxicol. 2016;40(8):608-616. doi: 10.1093/jat/bkw065. PubMed
85. Pham JC, Pronovost PJ, Skipper GE. Identification of physician impairment. JAMA. 2013;309(20):2101-2102. doi: 10.1001/jama.2013.4635. PubMed
86. Stolbach A, Nelson LS, Hoffman RS. Protection of patients from physician substance misuse. JAMA. 2013;310(13):1402-1403. doi: 10.1001/jama.2013.277948. PubMed
87. Berge KH, McGlinch BP. The law of unintended consequences can never be repealed: the hazards of random urine drug screening of anesthesia providers. Anesth Analg. 2017;124(5):1397-1399. doi: 10.1213/ANE.0000000000001972. PubMed
88. Oreskovich MR, Caldeiro RM. Anesthesiologists recovering from chemical dependency: can they safely return to the operating room? Mayo Clin Proc. 2009;84(7):576-580. doi: 10.1016/S0025-6196(11)60745-3. PubMed
89. Di Costanzo M. Road to recovery. http://rnao.ca/sites/rnao-ca/files-RNJ-JanFeb2015.pdf. Accessed September 28, 2017.
90. Selzer J. Protection of patients from physician substance misuse. JAMA. 2013;310(13):1402-1403. doi: 10.1001/jama.2013.277948. PubMed
91. Wright RL. Drug diversion in nursing practice a call for professional accountability to recognize and respond. J Assoc Occup Health Prof Healthc. 2013;33(1):27-30. PubMed
92. Siegel J, O’Neal B, Wierwille C. The investigative process. Hosp Pharm. 2007;42(5):466-469. doi: 10.1310/hpj4205-466.
93. Brenn BR, Kim MA, Hilmas E. Development of a computerized monitoring program to identify narcotic diversion in a pediatric anesthesia practice. Am J Health System Pharm. 2015;72(16):1365-1372. doi: 10.2146/ajhp140691. PubMed
94. Drug diversion sting goes wrong and privacy is questioned. http://www.reliasmedia.com/articles/138142-drug-diversion-sting-goes-wrong-and-privacy-is-questioned. Accessed September 21, 2017.
95. New K. Drug diversion defined: steps to prevent, detect, and respond to drug diversion in facilities. CDC’s healthcare blog. https://blogs.cdc.gov/safehealthcare/drug-diversion-defined-steps-to-prevent-detect-and-respond-to-drug-diversion-in-facilities. Accessed July 21, 2017.
96. Howorun C. ‘Unexplained losses’ of opioids on the rise in Canadian hospitals. Maclean’s. http://www.macleans.ca/society/health/unexplained-losses-of-opioids-on-the-rise-in-canadian-hospitals. Accessed December 5, 2017.
97. Carman T. When prescription opioids run out, users look for the supply on the streets. CBC News. https://www.cbc.ca/news/canada/when-prescription-opioids-run-out-users-look-for-the-supply-on-the-streets-1.4720952. Accessed July 1, 2018.
98. Tanga HY. Nurse drug diversion and nursing leader’s responsibilities: legal, regulatory, ethical, humanistic, and practical considerations. JONAs Healthc Law Eth Regul. 2011;13(1):13-16. doi: 10.1097/NHL.0b013e31820bd9e6. PubMed
99. Scholze AR, Martins JT, Galdino MJQ, Ribeiro RP. Occupational environment and psychoactive substance consumption among nurses. Acta Paul Enferm. 2017;30(4):404-411. doi: 10.1590/1982-0194201700060.
© 2019 Society of Hospital Medicine
Updates in Pediatric Hospital Medicine: Six Practical Ways to Improve the Care of Hospitalized Children
The field of pediatric hospital medicine has seen tremendous growth in scholarship in the past decade. To obtain a wide view of advancements in the field from the current literature, the authors selected 18 English-language journals (Table 1) across four domains believed to be relevant to the practice of pediatric hospital medicine, including hospital medicine, pediatrics, emergency care, and medical education. The median Hirsch index (h-index) of the selected journals was 131. A goal of 10, a number that could maximally benefit consumers of the finished product, was set as the final number of articles to be selected.
Guiding principles for the initial selection included novelty of hypotheses, study design, significance of results, and likelihood to change pediatric hospital medicine practice from both the community and academic hospital perspectives. Journals were assigned randomly to each author for review and assignments were switched after six months to limit potential bias in coverage. A three-stage review process was employed. The authors initially independently reviewed titles and abstracts from 13,296 articles published between January 2018 and December 2018 and rated them according to their likelihood to be included in the final set of 10 articles and their broad applicability to pediatric hospital medicine. This resulted in 99 studies that were selected for further review. Next, the authors were assigned a subset of the 99 articles for further review; each author rated the articles independently based on their likelihood of inclusion in the final 10-article set. At this stage, 75 articles were excluded. Finally, all remaining 24 articles were reviewed independently and in depth by both authors.
Ten articles were selected by consensus formation, and the authors presented their findings at the 2019 Society for Hospital Medicine annual meeting. From these 10 articles, six were determined to be most impactful to current practice; these articles are presented below. After discussing the study background, an overview, key results, limitations of the study, important findings (Table 2), and implications for practice and future research are presented.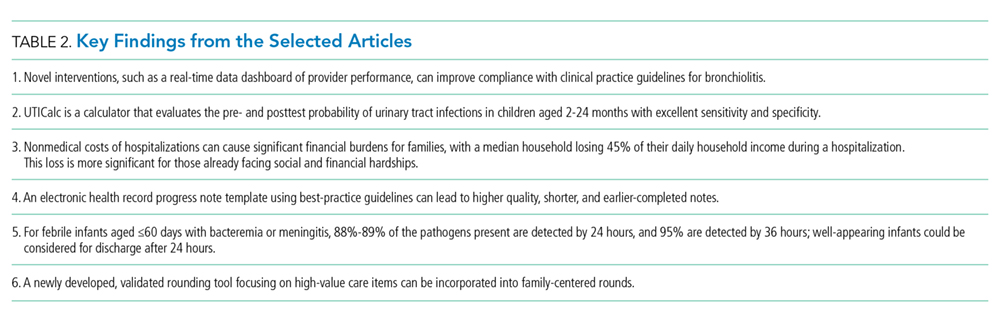
SELECTED PUBLICATIONS
Interventions to Reduce Over-Utilized Tests and Treatments in Bronchiolitis. Tyler A, et al. Pediatrics. 2018;141(6):e20170485. 1
Background
The American Academy of Pediatrics (AAP) published clinical practice guidelines (CPG) for bronchiolitis in 2014.2 However, unnecessary tests and interventions continue to be ordered and used on children with bronchiolitis that are not recommended by the guidelines. In this quality improvement project, the authors sought to increase compliance with the AAP CPG for bronchiolitis by reducing chest x-rays (CXR) to <20%, respiratory viral testing (RVT) to <15%, and use of bronchodilators to <20%.
Study Overview and Results
This project took place at a free-standing children’s hospital and included urgent care locations. Authors obtained pre-intervention data through two bronchiolitis seasons in 2013 and 2014 for patients aged 1-23 months with a primary or secondary diagnosis of bronchiolitis and who did not require admission to the Intensive Care Unit (ICU). The intervention period was from December 2015 to April 2016. All sites simultaneously implemented their interventions, which included education of care team members and families, updated order sets, and electronic health record (EHR)-generated e-mails that provided data looking at peer ranking statistics for each intervention, CXR, RVT, and bronchodilator usage. A data dashboard was created to display real-time utilization of the studied interventions. Providers were also asked to sign a pledge that they would reduce unnecessary testing and treatment. As balancing measures, the numbers of patients presenting to the Emergency Room (ER) or readmitted within seven days of an ED visit or admission for bronchiolitis were tracked; patients who required ICU levels of care during their first admission or on readmission were also tracked. Statistically significant decreases in CXR ordering from 39.5% to 27.2%, RVT ordering from 31.9% to 26.3%, and any bronchodilator usage from 34.2% to 21.5% were noted. No difference pre- and postintervention in patients readmitted to the ICU was found, and length of stay (LOS) between groups was not statistically significant.
Limitations
As all interventions were initiated simultaneously, identifying which individual or subset of interventions was responsible for changing provider behavior was impossible. More patients postintervention were admitted under observation status and under a milder All Patient Refined Diagnosis Related Groups (APR DRGs) severity index, which may indicate a less-sick cohort of patients in this group. Since the LOS and number of patients readmitted to the ICU were similar in both groups, it is unlikely that the postintervention group represented a less-sick cohort.
Important Findings and Implications
This QI project highlighted novel ways to implement and emphasize the importance of compliance to CPG. A provider pledge may be helpful in reinforcing to all providers the idea that the institution is committed to guideline implementation. Comparing individual provider data and having a real-time dashboard with group performance can help reinforce goals and progress toward them at the group, site, and individual patient population levels.
Development and Validation of a Calculator for Estimating the Probability of Urinary Tract Infection in Young Febrile Children. Shaikh N, et al. JAMA Pediatrics. 2018;172(6):550-556.3
Background
The prevalence of urinary tract infections (UTIs) in children under 2 years of age that present to the emergency department (ED) with fever is about 7%.4 After clinical examination, providers obtaining a urinalysis must then determine if empirical antibiotics are warranted for a suspected UTI. This study describes the development of a novel calculator, UTICalc that estimates the pretest probability of a UTI based on clinical findings and the posttest probability of a UTI based on laboratory results.
Study Overview and Results
This study features a single center, nested, case-control design that looked retrospectively at 542 children aged 2-24 months who presented to the ED from January 2007 to April 2013 with fever and had a catheterized urinalysis obtained. Patients were then matched with randomly selected children without a UTI to create a training database. Five models using different variables were developed, including one with only clinical characteristics and four that combined clinical characteristics with differing laboratory values. The area under the curve of the “clinical model” was 0.80, while those of the remaining four models ranged from 0.97 to 0.98. The clinical model showed a sensitivity of 95% and specificity of 35% in the training database, while the four other models showed sensitivities ranging from 93% to 96% and specificities ranging from 91% to 93%. The models were then validated using a cohort of children aged 2-24 months who presented to the ED with fever from July 2015 to December 2016; the UTI prevalence in this cohort was 7.8%. Finally, using a hypothetical cohort of 1,000 children being evaluated for a UTI, the authors showed that UTICalc reduced the numbers of urine samples obtained by 8.1% and missed UTIs from 3 to 0 compared with following AAP guidelines.5
Limitations
The training database was created retrospectively at a single institution and is subject to local practice patterns. The proposed calculator creates an algorithm that is meant to be used in a setting where the pretest probability for a UTI is reasonably high based on criteria from the AAP UTI guidelines.
Important Findings and Implications
UTICalc could be a great tool for providers to guide testing for UTIs in children aged 2-24 months presenting with a fever. Given further study at multiple sites and settings, including outpatient clinics, UTICalc could have significant implications for reducing unnecessary testing and treatment in febrile children.
Lost Earnings and Nonmedical Expenses of Pediatric Hospitalizations. Chang LV, et al. Pediatrics. 2018;142(3):e20180195.6
Background
Although medical expenses related to hospitalization can be significant for many families, nonmedical costs, such as transportation, parking, meals, and lost earnings from missed days at work, are also important to consider. These hardships can lead to challenges in postdischarge follow-up and adherence to discharge instructions, both of which lead to hospital readmissions. This article presents a cross-sectional analysis at a large, free-standing children’s hospital that participated in the Hospital-to-Home Outcomes Study (H2O). The authors sought to determine whether families with more financial or social hardships are affected disproportionately by nonmedical costs related to hospitalizations.
Study Overview and Results
A total of 1,372 children were included and children with lengths of stay >13 days were excluded. Face-to-face parental surveys were conducted and included questions on parental education, employment status, sick leave flexibility, and measures of financial and social hardship. The study authors calculated a total cost burden (TCB) based on nonmedical costs estimated at the time of the survey, including lost wages and expenses during the hospitalization. A daily cost burden (DCB) based on length of hospital stay and daily cost burden as a percentage of daily income (DCBi) were also calculated. The median TCB was $112.80, and the median DCB was $51.40. The median DCBi showed that the median household had 45% of their daily income depleted by nonmedical expenses related to their hospitalization. Those who reported more financial or social hardships had a higher median DCBi; if ≥3 financial hardships were reported, 86% of the daily household income was depleted.
Limitations
The study was conducted at a single institution with a number of existing support systems in place to help unburden families of hospitalized children. Non-English-speaking families were excluded. A face-to-face survey may have influenced parental responses regarding social and financial hardships.
Important Findings and Implications
Nonmedical costs of hospitalized children can be quantified and disproportionately affect those experiencing financial and social hardships. Hospitalists should be aware of these findings and find ways within their hospital systems to provide support for families both during and after hospitalizations.
A Prescription for Note Bloat: An Effective Progress Note Template. Kahn D, et al. Journal of Hospital Medicine. 2018;13(6):378-382.7
Background
Although electronic health records (EHRs) have improved the speed and legibility of documentation, the harm of “note bloat,” defined as multiple pages of nonessential information which leaves key aspects buried or lost, is prevalent. In this prospective, quality improvement study across four internal medicine residency programs, the authors investigated a bundled intervention consisting of didactic teaching and an electronic progress note template on note quality, length, and timeliness.
Study overview and results
Notes pre- and postintervention were graded using a tool that considered the general impression of the note, its score on the validated Physician Documentation Quality Instrument (PDQI-9),8 and a questionnaire based on the Accreditation Council for Graduate Medical Education competency note checklist.9 Analyzing 200 preintervention and 199 postintervention notes, significant improvement was seen in general impression scores, all PDQI-9 domains, and 6 of 13 note competency questionnaire items. The mean number of lines in the note decreased by 25%, and the mean completion time when the note was signed was 1 hour and 15 minutes earlier. The greatest impact on shortening notes involved a reduction in the auto-population of laboratory and imaging studies.
Limitations
The study was unblinded. The authors attempted to minimize bias with an objective questionnaire and employed multiple graders per note; however, poor interrater reliability was obtained. Postintervention, 70% of all residents used the template. At one of the four institutions, evidence of note quality improvement despite low template use was found. At another institution, no improvement in note quality was reported despite relatively high template uptake. Local culture and institutional buy-in may be factors affecting these results. In addition, pre- and postintervention notes were examined in the same academic year; thus, the effects seen may be due, in part, to resident maturation. Generalizability to nonacademic institutions and the durability of the intervention are additional concerns.
Important Findings and Implications
Resident education on documentation and an EHR progress note template incorporating best practices can effectively combat “note bloat” and lead to higher quality and shorter notes that are completed earlier in the day. This solution has significant implications for improving transitions of care, handoffs, and patient safety.
Time to Pathogen Detection for Non-Ill Versus Ill-Appearing Infants ≤60 Days Old with Bacteremia and Meningitis. Aronson PL, et al. Hospital Pediatrics 2018;8 (7):379-384.10
Background
The routine evaluation of febrile infants aged ≤60 days old often involves blood and cerebrospinal (CSF) fluid evaluations, and many infants are hospitalized while waiting for culture results. A previous study of febrile infants showed that 91% of the pathogenic organisms could be identified on blood culture within 24 hours and that 96% could be identified within 36 hours; 81% of the bacterial pathogens present were detected on CSF culture within 36 hours.11
Study Overview and Results
In this large, multicenter study of infants presenting to the Emergency Departments (EDs) of 10 children’s hospitals over a five-year study period, the authors investigated the time to pathogen detection in blood and CSF for infants aged ≤60 days with bacteremia and/or bacterial meningitis; whether the time to detection differed for non-ill and ill infants was also examined. Ill- versus non-ill-appearance was determined by a medical record review of the physical exam looking for one of 13 key words (eg, “ill-appearing,” “toxic,” “lethargic,” etc.). A total of 381 infants were included. Overall, 88% of the pathogens present were detected in blood culture within 24 hours and 95% were detected within 36 hours. In CSF, 89% of the pathogens present were detected within 24 hours, and 95% were detected within 36 hours. In infants with bacteremia who were non-ill-appearing, 85% of the blood pathogens were detected within 24 hours.
Limitations
The median time to detection for blood culture pathogens for ill-appearing versus non-ill-appearing infants was shorter by just one hour, but 15% of the non-ill infants had a positive blood culture after 24 hours. However, the prevalence of bacteremia and meningitis in non-ill-appearing infants is likely low; the authors did not report the total number of febrile infants evaluated by EDs in the study.
Important Findings and Implications
Most positive blood and/or CSF cultures for infants aged ≤60 days will yield results by 24 hours; 95% of the pathogens present could be detected within 36 hours. Sending a non-ill-appearing febrile infant home at 24 hours may miss 15% of the instances of bacteremia, but the overall low prevalence of invasive bacterial infection in infants should be considered.
The High-Value Care Rounding Tool: Development and Validity Evidence. McDaniel CE, et al. Academic Medicine. 2018;93(2):199-206.12
Background
Providing high-value care (HVC) to patients is a struggle for physicians and healthcare systems. Although physicians teaching trainees HVC practices could be an effective way to increase cost-conscious care, the best practices for teaching HVC remain unknown. To fill this gap, the authors developed a tool to measure the frequency and content of observable HVC teaching and evaluated the validity of the tool within a pediatric inpatient setting.
Study Overview and Results
The HVC rounding tool was developed through several phases from conception to validation. The research group used a modified Delphi method to construct the tool using a consensus building process based on opinions from content experts in the field of HVC, from a variety of specialties, experience levels, and geographic areas of the United States. Each item of the HVC instrument was rated by these experts, and, from their evaluations and surveys, an 11-item HVC tool was constructed. A pilot of the tool was performed to establish internal validity and interrater reliability based on observations of 148 patient encounters. From this process, a final 10-item HVC rounding tool emerged, including domains in quality, cost, and patient values. A few items included giving positive feedback for not doing an unnecessary test, discussing whether a patient needs to stay inpatient or meets discharge criteria, and customizing a care plan to align with family values and goals. The final iteration of the tool had no rater disagreements within the quality and patient values domain and only one disagreement within the cost domain.
Limitations
This tool was validated at a single pediatric institution, and, thus, the generalizability of the tool has not been established. The authors note that the Delphi panelists used for the construction of the tool were from a medical subspecialty background and not surgical backgrounds, which limits its applicability from a surgical perspective. The tool does not allow for differentiation between lengthy discussions or brief comments presented during rounds.
Important Findings and Implications
The HVC rounding tool is both innovative and timely. Pediatric hospitalists are leaders in family-centered care, and this tool allows assessment of whether important concepts of high-value care are discussed at the bedside. A multisite educational study using this tool would be welcome.
Disclosures
The authors have
1. Tyler A, Krack P, Bakel LA, et al. Interventions to reduce over-utilized tests and treatments in bronchiolitis. Pediatrics. 2018;141(6):e20170485. doi: 10.1542/peds.2017-0485. PubMed
2. Ralston SL, Lieberthal AS, Meissner HC, et al. Clinical practice guideline: the diagnosis, management, and prevention of bronchiolitis. Pediatrics. 2014;134(5):e1474-502. doi: 10.1542/peds.2014-2742. PubMed
3. Shaikh N, Hoberman A, Hum SW, et al. Development and validation of a calculator for estimating the probability of urinary tract infection in young febrile children. JAMA Pediatr. 2018;172(6):550-556. doi:10.1001/jamapediatrics.2018.0217. PubMed
4. Shaikh N, Morone NE, Bost JE, Farrell MH. Prevalence of urinary tract infections in childhood: a meta-analysis. Pediatr Infect Dis J. 2008;27(4):302-8. doi: 10.1097/INF.0b013e31815e4122. PubMed
5. Roberts KB. Urinary tract infection: clinical practice guideline for the diagnosis and management of the initial UTI in febrile infants and children 2 to 24 months. Pediatrics. 2011;128(3):595-610. doi: 10.1542/peds.2011-1330. PubMed
6. Chang LV, Shah AN, Hoefgen ER, et al. Lost earnings and nonmedical expenses of pediatric hospitalizations. Pediatrics. 2018;142(3):e20180195. doi: 10.1542/peds.2018-0195. PubMed
7. Kahn D, Stewart E, Duncan M, et al. A prescription for note bloat: an effective progress note template. J Hosp Med. 2018;13(6):378-382. doi: 10.12788/jhm.2898. PubMed
8. Stetson PD, Bakken S, Wrenn JO, Siegler EL. Assessing electronic note quality using the Physician Documentation Quality Instrument (PDQI-9). Appl Clin Inform. 2012;3(2):164-174. doi: 10.4338/ACI-2011-11-RA-0070. PubMed
9. Aylor M, Campbell EM, Winter C, Phillipi CA. Resident notes in an electronic health record: a mixed-methods study using a standardized intervention with qualitative analysis. Clin Pediatr (Phila). 2016;6(3):257-262. doi: 10.1177/0009922816658651.
10. Aronson PL, Wang ME, Nigrovic LE, et al. Time to pathogen detection for non-ill versus ill-appearing infants ≤60 days old with bacteremia and meningitis. Hosp Pediatr. 2018;8(7):379-384. doi: 10.1542/hpeds.2018-0002. PubMed
11. Biondi EA, Mischler M, Jerardi KE, et al. Blood culture time to positivity in febrile infants with bacteremia. JAMA Pediatr. 2014;168(9):844-849. doi: 10.1001/jamapediatrics.2014.895. PubMed
12. McDaniel CE, White AA, Bradford MC, et al. The high-value care rounding tool: development and validity evidence. Acad Med. 2018;93(2):199-206. doi: 10.1097/ACM.0000000000001873. PubMed
The field of pediatric hospital medicine has seen tremendous growth in scholarship in the past decade. To obtain a wide view of advancements in the field from the current literature, the authors selected 18 English-language journals (Table 1) across four domains believed to be relevant to the practice of pediatric hospital medicine, including hospital medicine, pediatrics, emergency care, and medical education. The median Hirsch index (h-index) of the selected journals was 131. A goal of 10, a number that could maximally benefit consumers of the finished product, was set as the final number of articles to be selected.
Guiding principles for the initial selection included novelty of hypotheses, study design, significance of results, and likelihood to change pediatric hospital medicine practice from both the community and academic hospital perspectives. Journals were assigned randomly to each author for review and assignments were switched after six months to limit potential bias in coverage. A three-stage review process was employed. The authors initially independently reviewed titles and abstracts from 13,296 articles published between January 2018 and December 2018 and rated them according to their likelihood to be included in the final set of 10 articles and their broad applicability to pediatric hospital medicine. This resulted in 99 studies that were selected for further review. Next, the authors were assigned a subset of the 99 articles for further review; each author rated the articles independently based on their likelihood of inclusion in the final 10-article set. At this stage, 75 articles were excluded. Finally, all remaining 24 articles were reviewed independently and in depth by both authors.
Ten articles were selected by consensus formation, and the authors presented their findings at the 2019 Society for Hospital Medicine annual meeting. From these 10 articles, six were determined to be most impactful to current practice; these articles are presented below. After discussing the study background, an overview, key results, limitations of the study, important findings (Table 2), and implications for practice and future research are presented.
SELECTED PUBLICATIONS
Interventions to Reduce Over-Utilized Tests and Treatments in Bronchiolitis. Tyler A, et al. Pediatrics. 2018;141(6):e20170485. 1
Background
The American Academy of Pediatrics (AAP) published clinical practice guidelines (CPG) for bronchiolitis in 2014.2 However, unnecessary tests and interventions continue to be ordered and used on children with bronchiolitis that are not recommended by the guidelines. In this quality improvement project, the authors sought to increase compliance with the AAP CPG for bronchiolitis by reducing chest x-rays (CXR) to <20%, respiratory viral testing (RVT) to <15%, and use of bronchodilators to <20%.
Study Overview and Results
This project took place at a free-standing children’s hospital and included urgent care locations. Authors obtained pre-intervention data through two bronchiolitis seasons in 2013 and 2014 for patients aged 1-23 months with a primary or secondary diagnosis of bronchiolitis and who did not require admission to the Intensive Care Unit (ICU). The intervention period was from December 2015 to April 2016. All sites simultaneously implemented their interventions, which included education of care team members and families, updated order sets, and electronic health record (EHR)-generated e-mails that provided data looking at peer ranking statistics for each intervention, CXR, RVT, and bronchodilator usage. A data dashboard was created to display real-time utilization of the studied interventions. Providers were also asked to sign a pledge that they would reduce unnecessary testing and treatment. As balancing measures, the numbers of patients presenting to the Emergency Room (ER) or readmitted within seven days of an ED visit or admission for bronchiolitis were tracked; patients who required ICU levels of care during their first admission or on readmission were also tracked. Statistically significant decreases in CXR ordering from 39.5% to 27.2%, RVT ordering from 31.9% to 26.3%, and any bronchodilator usage from 34.2% to 21.5% were noted. No difference pre- and postintervention in patients readmitted to the ICU was found, and length of stay (LOS) between groups was not statistically significant.
Limitations
As all interventions were initiated simultaneously, identifying which individual or subset of interventions was responsible for changing provider behavior was impossible. More patients postintervention were admitted under observation status and under a milder All Patient Refined Diagnosis Related Groups (APR DRGs) severity index, which may indicate a less-sick cohort of patients in this group. Since the LOS and number of patients readmitted to the ICU were similar in both groups, it is unlikely that the postintervention group represented a less-sick cohort.
Important Findings and Implications
This QI project highlighted novel ways to implement and emphasize the importance of compliance to CPG. A provider pledge may be helpful in reinforcing to all providers the idea that the institution is committed to guideline implementation. Comparing individual provider data and having a real-time dashboard with group performance can help reinforce goals and progress toward them at the group, site, and individual patient population levels.
Development and Validation of a Calculator for Estimating the Probability of Urinary Tract Infection in Young Febrile Children. Shaikh N, et al. JAMA Pediatrics. 2018;172(6):550-556.3
Background
The prevalence of urinary tract infections (UTIs) in children under 2 years of age that present to the emergency department (ED) with fever is about 7%.4 After clinical examination, providers obtaining a urinalysis must then determine if empirical antibiotics are warranted for a suspected UTI. This study describes the development of a novel calculator, UTICalc that estimates the pretest probability of a UTI based on clinical findings and the posttest probability of a UTI based on laboratory results.
Study Overview and Results
This study features a single center, nested, case-control design that looked retrospectively at 542 children aged 2-24 months who presented to the ED from January 2007 to April 2013 with fever and had a catheterized urinalysis obtained. Patients were then matched with randomly selected children without a UTI to create a training database. Five models using different variables were developed, including one with only clinical characteristics and four that combined clinical characteristics with differing laboratory values. The area under the curve of the “clinical model” was 0.80, while those of the remaining four models ranged from 0.97 to 0.98. The clinical model showed a sensitivity of 95% and specificity of 35% in the training database, while the four other models showed sensitivities ranging from 93% to 96% and specificities ranging from 91% to 93%. The models were then validated using a cohort of children aged 2-24 months who presented to the ED with fever from July 2015 to December 2016; the UTI prevalence in this cohort was 7.8%. Finally, using a hypothetical cohort of 1,000 children being evaluated for a UTI, the authors showed that UTICalc reduced the numbers of urine samples obtained by 8.1% and missed UTIs from 3 to 0 compared with following AAP guidelines.5
Limitations
The training database was created retrospectively at a single institution and is subject to local practice patterns. The proposed calculator creates an algorithm that is meant to be used in a setting where the pretest probability for a UTI is reasonably high based on criteria from the AAP UTI guidelines.
Important Findings and Implications
UTICalc could be a great tool for providers to guide testing for UTIs in children aged 2-24 months presenting with a fever. Given further study at multiple sites and settings, including outpatient clinics, UTICalc could have significant implications for reducing unnecessary testing and treatment in febrile children.
Lost Earnings and Nonmedical Expenses of Pediatric Hospitalizations. Chang LV, et al. Pediatrics. 2018;142(3):e20180195.6
Background
Although medical expenses related to hospitalization can be significant for many families, nonmedical costs, such as transportation, parking, meals, and lost earnings from missed days at work, are also important to consider. These hardships can lead to challenges in postdischarge follow-up and adherence to discharge instructions, both of which lead to hospital readmissions. This article presents a cross-sectional analysis at a large, free-standing children’s hospital that participated in the Hospital-to-Home Outcomes Study (H2O). The authors sought to determine whether families with more financial or social hardships are affected disproportionately by nonmedical costs related to hospitalizations.
Study Overview and Results
A total of 1,372 children were included and children with lengths of stay >13 days were excluded. Face-to-face parental surveys were conducted and included questions on parental education, employment status, sick leave flexibility, and measures of financial and social hardship. The study authors calculated a total cost burden (TCB) based on nonmedical costs estimated at the time of the survey, including lost wages and expenses during the hospitalization. A daily cost burden (DCB) based on length of hospital stay and daily cost burden as a percentage of daily income (DCBi) were also calculated. The median TCB was $112.80, and the median DCB was $51.40. The median DCBi showed that the median household had 45% of their daily income depleted by nonmedical expenses related to their hospitalization. Those who reported more financial or social hardships had a higher median DCBi; if ≥3 financial hardships were reported, 86% of the daily household income was depleted.
Limitations
The study was conducted at a single institution with a number of existing support systems in place to help unburden families of hospitalized children. Non-English-speaking families were excluded. A face-to-face survey may have influenced parental responses regarding social and financial hardships.
Important Findings and Implications
Nonmedical costs of hospitalized children can be quantified and disproportionately affect those experiencing financial and social hardships. Hospitalists should be aware of these findings and find ways within their hospital systems to provide support for families both during and after hospitalizations.
A Prescription for Note Bloat: An Effective Progress Note Template. Kahn D, et al. Journal of Hospital Medicine. 2018;13(6):378-382.7
Background
Although electronic health records (EHRs) have improved the speed and legibility of documentation, the harm of “note bloat,” defined as multiple pages of nonessential information which leaves key aspects buried or lost, is prevalent. In this prospective, quality improvement study across four internal medicine residency programs, the authors investigated a bundled intervention consisting of didactic teaching and an electronic progress note template on note quality, length, and timeliness.
Study overview and results
Notes pre- and postintervention were graded using a tool that considered the general impression of the note, its score on the validated Physician Documentation Quality Instrument (PDQI-9),8 and a questionnaire based on the Accreditation Council for Graduate Medical Education competency note checklist.9 Analyzing 200 preintervention and 199 postintervention notes, significant improvement was seen in general impression scores, all PDQI-9 domains, and 6 of 13 note competency questionnaire items. The mean number of lines in the note decreased by 25%, and the mean completion time when the note was signed was 1 hour and 15 minutes earlier. The greatest impact on shortening notes involved a reduction in the auto-population of laboratory and imaging studies.
Limitations
The study was unblinded. The authors attempted to minimize bias with an objective questionnaire and employed multiple graders per note; however, poor interrater reliability was obtained. Postintervention, 70% of all residents used the template. At one of the four institutions, evidence of note quality improvement despite low template use was found. At another institution, no improvement in note quality was reported despite relatively high template uptake. Local culture and institutional buy-in may be factors affecting these results. In addition, pre- and postintervention notes were examined in the same academic year; thus, the effects seen may be due, in part, to resident maturation. Generalizability to nonacademic institutions and the durability of the intervention are additional concerns.
Important Findings and Implications
Resident education on documentation and an EHR progress note template incorporating best practices can effectively combat “note bloat” and lead to higher quality and shorter notes that are completed earlier in the day. This solution has significant implications for improving transitions of care, handoffs, and patient safety.
Time to Pathogen Detection for Non-Ill Versus Ill-Appearing Infants ≤60 Days Old with Bacteremia and Meningitis. Aronson PL, et al. Hospital Pediatrics 2018;8 (7):379-384.10
Background
The routine evaluation of febrile infants aged ≤60 days old often involves blood and cerebrospinal (CSF) fluid evaluations, and many infants are hospitalized while waiting for culture results. A previous study of febrile infants showed that 91% of the pathogenic organisms could be identified on blood culture within 24 hours and that 96% could be identified within 36 hours; 81% of the bacterial pathogens present were detected on CSF culture within 36 hours.11
Study Overview and Results
In this large, multicenter study of infants presenting to the Emergency Departments (EDs) of 10 children’s hospitals over a five-year study period, the authors investigated the time to pathogen detection in blood and CSF for infants aged ≤60 days with bacteremia and/or bacterial meningitis; whether the time to detection differed for non-ill and ill infants was also examined. Ill- versus non-ill-appearance was determined by a medical record review of the physical exam looking for one of 13 key words (eg, “ill-appearing,” “toxic,” “lethargic,” etc.). A total of 381 infants were included. Overall, 88% of the pathogens present were detected in blood culture within 24 hours and 95% were detected within 36 hours. In CSF, 89% of the pathogens present were detected within 24 hours, and 95% were detected within 36 hours. In infants with bacteremia who were non-ill-appearing, 85% of the blood pathogens were detected within 24 hours.
Limitations
The median time to detection for blood culture pathogens for ill-appearing versus non-ill-appearing infants was shorter by just one hour, but 15% of the non-ill infants had a positive blood culture after 24 hours. However, the prevalence of bacteremia and meningitis in non-ill-appearing infants is likely low; the authors did not report the total number of febrile infants evaluated by EDs in the study.
Important Findings and Implications
Most positive blood and/or CSF cultures for infants aged ≤60 days will yield results by 24 hours; 95% of the pathogens present could be detected within 36 hours. Sending a non-ill-appearing febrile infant home at 24 hours may miss 15% of the instances of bacteremia, but the overall low prevalence of invasive bacterial infection in infants should be considered.
The High-Value Care Rounding Tool: Development and Validity Evidence. McDaniel CE, et al. Academic Medicine. 2018;93(2):199-206.12
Background
Providing high-value care (HVC) to patients is a struggle for physicians and healthcare systems. Although physicians teaching trainees HVC practices could be an effective way to increase cost-conscious care, the best practices for teaching HVC remain unknown. To fill this gap, the authors developed a tool to measure the frequency and content of observable HVC teaching and evaluated the validity of the tool within a pediatric inpatient setting.
Study Overview and Results
The HVC rounding tool was developed through several phases from conception to validation. The research group used a modified Delphi method to construct the tool using a consensus building process based on opinions from content experts in the field of HVC, from a variety of specialties, experience levels, and geographic areas of the United States. Each item of the HVC instrument was rated by these experts, and, from their evaluations and surveys, an 11-item HVC tool was constructed. A pilot of the tool was performed to establish internal validity and interrater reliability based on observations of 148 patient encounters. From this process, a final 10-item HVC rounding tool emerged, including domains in quality, cost, and patient values. A few items included giving positive feedback for not doing an unnecessary test, discussing whether a patient needs to stay inpatient or meets discharge criteria, and customizing a care plan to align with family values and goals. The final iteration of the tool had no rater disagreements within the quality and patient values domain and only one disagreement within the cost domain.
Limitations
This tool was validated at a single pediatric institution, and, thus, the generalizability of the tool has not been established. The authors note that the Delphi panelists used for the construction of the tool were from a medical subspecialty background and not surgical backgrounds, which limits its applicability from a surgical perspective. The tool does not allow for differentiation between lengthy discussions or brief comments presented during rounds.
Important Findings and Implications
The HVC rounding tool is both innovative and timely. Pediatric hospitalists are leaders in family-centered care, and this tool allows assessment of whether important concepts of high-value care are discussed at the bedside. A multisite educational study using this tool would be welcome.
Disclosures
The authors have
1. Tyler A, Krack P, Bakel LA, et al. Interventions to reduce over-utilized tests and treatments in bronchiolitis. Pediatrics. 2018;141(6):e20170485. doi: 10.1542/peds.2017-0485. PubMed
2. Ralston SL, Lieberthal AS, Meissner HC, et al. Clinical practice guideline: the diagnosis, management, and prevention of bronchiolitis. Pediatrics. 2014;134(5):e1474-502. doi: 10.1542/peds.2014-2742. PubMed
3. Shaikh N, Hoberman A, Hum SW, et al. Development and validation of a calculator for estimating the probability of urinary tract infection in young febrile children. JAMA Pediatr. 2018;172(6):550-556. doi:10.1001/jamapediatrics.2018.0217. PubMed
4. Shaikh N, Morone NE, Bost JE, Farrell MH. Prevalence of urinary tract infections in childhood: a meta-analysis. Pediatr Infect Dis J. 2008;27(4):302-8. doi: 10.1097/INF.0b013e31815e4122. PubMed
5. Roberts KB. Urinary tract infection: clinical practice guideline for the diagnosis and management of the initial UTI in febrile infants and children 2 to 24 months. Pediatrics. 2011;128(3):595-610. doi: 10.1542/peds.2011-1330. PubMed
6. Chang LV, Shah AN, Hoefgen ER, et al. Lost earnings and nonmedical expenses of pediatric hospitalizations. Pediatrics. 2018;142(3):e20180195. doi: 10.1542/peds.2018-0195. PubMed
7. Kahn D, Stewart E, Duncan M, et al. A prescription for note bloat: an effective progress note template. J Hosp Med. 2018;13(6):378-382. doi: 10.12788/jhm.2898. PubMed
8. Stetson PD, Bakken S, Wrenn JO, Siegler EL. Assessing electronic note quality using the Physician Documentation Quality Instrument (PDQI-9). Appl Clin Inform. 2012;3(2):164-174. doi: 10.4338/ACI-2011-11-RA-0070. PubMed
9. Aylor M, Campbell EM, Winter C, Phillipi CA. Resident notes in an electronic health record: a mixed-methods study using a standardized intervention with qualitative analysis. Clin Pediatr (Phila). 2016;6(3):257-262. doi: 10.1177/0009922816658651.
10. Aronson PL, Wang ME, Nigrovic LE, et al. Time to pathogen detection for non-ill versus ill-appearing infants ≤60 days old with bacteremia and meningitis. Hosp Pediatr. 2018;8(7):379-384. doi: 10.1542/hpeds.2018-0002. PubMed
11. Biondi EA, Mischler M, Jerardi KE, et al. Blood culture time to positivity in febrile infants with bacteremia. JAMA Pediatr. 2014;168(9):844-849. doi: 10.1001/jamapediatrics.2014.895. PubMed
12. McDaniel CE, White AA, Bradford MC, et al. The high-value care rounding tool: development and validity evidence. Acad Med. 2018;93(2):199-206. doi: 10.1097/ACM.0000000000001873. PubMed
© 2019 Society of Hospital Medicine
Measles: A dangerous vaccine-preventable disease returns
Measles, an ancient, highly contagious disease with a history of successful control by vaccination, is now threatening to have an epidemic resurgence. Until recently, measles vaccination largely controlled outbreaks in the United States. The Global Vaccine Action Plan under the World Health Organization aimed to eliminate measles worldwide. Nonetheless, the vaccine refusal movement and slow rollout of vaccine programs globally have interfered with control of the virus. A record number of measles cases have emerged in recent months: more than 700 since January 2019.1 Approximately 70% of recent cases were in unvaccinated patients, and almost all were in US residents.
This update reviews the history, presentation and diagnosis, complications, management, contagion control, and emerging threat of a measles epidemic. It concludes with recommendations for clinical practice in the context of the current measles outbreaks.
FROM UBIQUITOUS TO ERADICATED—AND BACK
Before the measles vaccine was developed and became available in the 1960s, outbreaks of measles occurred predictably every year in the United States and other temperate regions. During yearly outbreaks, measles was so contagious that household contacts had attack rates above 95%. Most cases occurred in very young children, and because infection with the virus causes lifelong immunity, it could be safely assumed that by adulthood, everyone was immune. In an outbreak in the Faroe Islands in 1846, no one who had been alive in the last major outbreak 65 years earlier became ill, but everyone under age 65 was at high risk with “high attack rates,” estimated as 99% from other outbreaks (reviewed by Krugman et al2).
In isolated regions previously free of measles, adults did not have immunity, and when exposed, they often developed severe disease. When European settlers brought measles and smallpox to the Americas beginning in the late 15th century, these diseases decimated whole populations of native peoples who had never been exposed to them.

That was premature. A number of outbreaks have occurred since then; the largest in the United States (before 2019) was in 2000. Over half of the 667 cases reported during that outbreak were in an underimmunized Amish community in Ohio.3
Now it emerges again.
PRESENTATION CAN VARY


The presentation varies somewhat among certain groups.
Nonimmune pregnant women have an especially severe course, likely related to the relative immune suppression of pregnancy.
In immune-suppressed states, measles is not only more severe, it is also difficult to diagnose because the rash can be absent.
In partially vaccinated children and adults, the disease may present atypically, without cough, conjunctivitis, and coryza, and it may be milder, lacking some of the extreme malaise typical of measles and with a shortened course. Measles infection in people who received the inactivated measles vaccine that was briefly available from 1963 to 1967 is also associated with atypical measles syndrome, a severe hypersensitivity reaction to the measles virus. Atypical measles can be prevented by revaccination with a live-virus vaccine.
DIAGNOSIS MAY NEED TO BE CONFIRMED
The diagnosis of measles is straightforward when all of the signs and symptoms are present. In partially vaccinated populations, however, the diagnosis may need to be confirmed by serologic or polymerase chain reaction (PCR) testing.
Differential diagnosis
The differential diagnosis of the fever and a rash typical of measles in children, especially when accompanied by severe malaise, includes the following:
Kawasaki disease. However, the red eyes of Kawasaki are an injection of the bulbar conjunctivae with sparing of the limbus. No eye exudate is present, and respiratory illness is not part of the disease.
Drug eruptions can present with a morbilliform rash and sometimes fever, but not the other signs of measles in either adults or children.
Scarlet fever has a different rash, the sandpaper rash typical of toxin-mediated disease.
Rubella tends to cause mild respiratory symptoms and illness rather than the severe disease of measles and other rash-causing viral infections in children and infants.
Confirmation in confusing cases
To confirm a diagnosis of measles, samples from throat, nasal, and posterior nasopharyngeal swabs should be collected with a blood specimen for serology and sent to the state public health laboratory.4 The US Centers for Disease Control and Prevention gives instructions on who should be tested and with which tests.4
Most testing now uses PCR for viral RNA, as viral culture is more costly and takes longer. For accurate diagnosis, samples for PCR must be obtained during the acute illness.
The serologic gold standard for diagnosis is a 4-fold rise or fall in immunoglobulin G (IgG) titer of paired serum samples sent 10 days to 2 weeks apart around the illness. The IgM test may be negative initially, and a negative test cannot be used to rule out the diagnosis. Confirmed cases should be reported to public health authorities.
COMPLICATIONS: EARLY AND LATE
Frequent complications of measles infection include those related to the primary viral infection of respiratory tract mucosal surfaces, as well as bacterial superinfections. Complications are most likely in children under age 5, nonimmune adults, pregnant women, and immunocompromised people. Typical complications include otitis media, laryngotracheobronchitis (presenting as a croupy cough), pneumonia, and diarrhea.
Late sequelae of measles infection are related in part to serious mucosal damage and generalized immune suppression caused by the virus. Even after recovery from acute infection, children can have persistent diarrhea and failure to thrive, with increased mortality risk in the months after infection. Tuberculosis can reactivate in patients already infected, and new tuberculosis infection can be especially severe. Further, tuberculosis skin tests become less reliable immediately after measles infection. Severe disease and fatalities are increased in populations that have baseline vitamin A deficiency and malnutrition.
Death from measles is most often caused by viral pneumonia, secondary bacterial pneumonia, and postviral encephalitis. Before the vaccine era, measles encephalitis occurred in the United States in about 1 in 1,000 measles cases.
Subacute sclerosing panencephalitis is a rare, late, and often fatal complication of measles that presents 7 to 10 years after acute measles infection, usually in adolescence. Beginning with myoclonic jerks, stiffening, and slow mental deterioration, it progresses over 1 to 3 years, with a relentless degenerative course leading to death. Since the introduction of the measles vaccine in 1957, this disease has essentially disappeared in the United States.
SUPPORTIVE CARE, INFECTION CONTROL
Management of measles and its complications is primarily supportive.

Preventing contagion
Measles infection has an incubation period of 8 to 12 days. Individuals are contagious 4 days before to 4 days after rash onset in the normal host but longer in those lacking immune function. Cases can occur up to 21 days after exposure during the contagious period.
The disease is highly contagious, so hospitalized patients should be cared for with airborne precautions. It is crucial that caretakers be vaccinated properly, so that they can care for patients safely. Recommendations for preventing secondary cases by prompt vaccination and giving immune globulin are detailed below, including specific recommendations for individuals with immune system suppression.
The current US public health policy regarding measles vaccine booster doses began in response to the widespread measles outbreak in the United States from 1989 to 1991. Cases occurred more commonly in unvaccinated individuals and in young adults who had received only 1 dose of vaccine.
Today, the policy in areas where measles has been controlled is to vaccinate between 12 and 15 months of age and to boost with a second dose before starting kindergarten. In outbreak situations, the first dose should be given at 6 months of age, with a repeat dose at 12 to 15 months of age and the usual booster before starting kindergarten.


Those born before 1957 can be presumed to have had natural measles, which confers lifelong immunity (Table 3).7
CURRENT THREAT
In 2000, measles was considered controlled in the United States, thanks to the national vaccination policy. But despite overall control, small numbers of cases continued to occur each year, related to exposure to cases imported from areas of the world endemic with measles.
Within the last year, however, major outbreaks have emerged. Incompletely vaccinated populations and unvaccinated individuals are the reason for the progression of current outbreaks.8
Until there is broader acceptance of the vaccine and better adherence to vaccine policies nationally and globally, measles cannot be completely eradicated. But with high vaccination rates, it is predicted that this infection can be controlled and ultimately eradicated.
RECOMMENDATIONS
In the midst of an outbreak and with rising public awareness of the threat of measles, it is important to recognize that MMR vaccination is the most effective way to prevent spread of the virus and maintain measles elimination in the United States. With this in mind, there are several key facts and recommendations regarding vaccination:
Recommendations on vaccination
- In measles-controlled populations, all children should be vaccinated between 12 and 15 months of age and again before kindergarten.
- In outbreak settings, children should receive a first vaccine dose at 6 months of age, a second at 12 to 15 months of age, and a third before kindergarten.
- Children who have received 2 measles vaccine doses can be assumed to be fully vaccinated and thus protected as long as the first dose was after 12 months of age. If the first dose was before 12 months of age, a child needs 3 doses.
- Adults born before 1957 can be assumed to have had measles infection and to be immune.
- Adults who were immunized with the inactivated measles vaccine available between 1963 and 1967 should receive 1 dose of live virus vaccine.
- Boosters are recommended for young adults who did not receive a second dose of vaccine and for adults with an uncertain history of immunization. There is no need to check titers before giving a booster, but if a positive titer is available in an adult, a booster is not needed.
- Heathcare providers should vaccinate unvaccinated or undervaccinated US residents traveling internationally (as long as they do not have contraindications) or traveling within the country to areas with outbreaks of measles.
Recommendations on vaccination after exposure to measles
- Vaccine is recommended for a nonimmune contact, including anyone with a history of only a single dose of vaccine.
- If a child got a first dose of vaccine before 12 months of age, give the second dose as soon as he or she turns 1 year old, or at least 28 days after the first dose.
- Vaccine must be given within 72 hours of exposure to confer protection (or at least decrease disease severity).
- The second dose of vaccine should be given at least 28 days after the first dose.
Recommendations on immune globulin after exposure to measles
- Immune globulin is recommended for anyone with exposure and no history of vaccination or immunity.
- Immune globulin can be given up to 6 days after exposure to prevent or decrease the severity of measles in immunocompromised hosts who have not been previously vaccinated. It is best to give it as early as possible.
- Immune globulin is given intramuscularly at 0.5 mL/kg, up to a to maximum dose of 15 mL.
- Pregnant women and immunocompromised hosts without immunity should receive immunoglobulin intravenously. Children and adults who have had a recent bone marrow transplant and likely do not yet have a reconstituted immune system should be treated with immune globulin to prevent infection, as vaccine cannot be given immediately after transplant. This is also true for other immunocompromised individuals who have not been vaccinated and who are not candidates for vaccine because of the severity of their immune suppression.
- Children with human immunodeficiency virus infection are routinely vaccinated. As long as they have evidence of serologic immunity, they do not need additional treatment.
- Kimberlin DW, Brady MT, Jackson MA, Long SS, editors. Measles. In Red Book: 2018 Report of the Committee on Infectious Diseases. American Academy of Pediatrics 2018; 537–550.
- Krugman S, Giles JP, Friedman H, Stone S. Studies on immunity to measles. J Pediatr 1965; 66:471–488. pmid:14264306.
- Gastañaduy PA, Budd J, Fisher N, et al. A measles outbreak in an underimmunized Amish community in Ohio. N Engl J Med 2016; 375(14):1343–1354. doi:10.1056/NEJMoa1602295
- Centers for Disease Control and Prevention. Measles (rubeola). www.cdc.gov/measles/index.html. Accessed May 16, 2019.
- World Health Organization. Measles vaccines: WHO position paper—April 2017. Wkly Epidemiol Rec 2017; 92(17):205–227. pmid:28459148
- McLean HQ, Fiebelkorn AP, Temte JL, Wallace GS; Centers for Disease Control and Prevention. Prevention of measles, rubella, congenital rubella syndrome and mumps, 2013; summary: recommendations of the Advisory Committee on Immunization Practices ACIP. MMWR Recomm Rep 2013 Jun 14; 62(RR-4)1–34. pmid:23760231
- Advisory Committee on Immunization Practices; Centers for Disease Control and Prevention. Immunization for health-care personnel: recommendations of the Advisory Committee on Immunization Practices (ACIP). MMWR Recomm Rep 2011 Nov 25; 60(RR-7)1–45. pmid:22108587
- Patel M, Lee AD, Redd SB, et al. Increase in measles cases—United States, January 1–April 26, 2019. MMWR Morb Mortal Wkly Rep 2019; May 3; 68(17):402–404. doi:10.15585/mmwr.mm6817e1
Measles, an ancient, highly contagious disease with a history of successful control by vaccination, is now threatening to have an epidemic resurgence. Until recently, measles vaccination largely controlled outbreaks in the United States. The Global Vaccine Action Plan under the World Health Organization aimed to eliminate measles worldwide. Nonetheless, the vaccine refusal movement and slow rollout of vaccine programs globally have interfered with control of the virus. A record number of measles cases have emerged in recent months: more than 700 since January 2019.1 Approximately 70% of recent cases were in unvaccinated patients, and almost all were in US residents.
This update reviews the history, presentation and diagnosis, complications, management, contagion control, and emerging threat of a measles epidemic. It concludes with recommendations for clinical practice in the context of the current measles outbreaks.
FROM UBIQUITOUS TO ERADICATED—AND BACK
Before the measles vaccine was developed and became available in the 1960s, outbreaks of measles occurred predictably every year in the United States and other temperate regions. During yearly outbreaks, measles was so contagious that household contacts had attack rates above 95%. Most cases occurred in very young children, and because infection with the virus causes lifelong immunity, it could be safely assumed that by adulthood, everyone was immune. In an outbreak in the Faroe Islands in 1846, no one who had been alive in the last major outbreak 65 years earlier became ill, but everyone under age 65 was at high risk with “high attack rates,” estimated as 99% from other outbreaks (reviewed by Krugman et al2).
In isolated regions previously free of measles, adults did not have immunity, and when exposed, they often developed severe disease. When European settlers brought measles and smallpox to the Americas beginning in the late 15th century, these diseases decimated whole populations of native peoples who had never been exposed to them.
That was premature. A number of outbreaks have occurred since then; the largest in the United States (before 2019) was in 2000. Over half of the 667 cases reported during that outbreak were in an underimmunized Amish community in Ohio.3
Now it emerges again.
PRESENTATION CAN VARY
The presentation varies somewhat among certain groups.
Nonimmune pregnant women have an especially severe course, likely related to the relative immune suppression of pregnancy.
In immune-suppressed states, measles is not only more severe, it is also difficult to diagnose because the rash can be absent.
In partially vaccinated children and adults, the disease may present atypically, without cough, conjunctivitis, and coryza, and it may be milder, lacking some of the extreme malaise typical of measles and with a shortened course. Measles infection in people who received the inactivated measles vaccine that was briefly available from 1963 to 1967 is also associated with atypical measles syndrome, a severe hypersensitivity reaction to the measles virus. Atypical measles can be prevented by revaccination with a live-virus vaccine.
DIAGNOSIS MAY NEED TO BE CONFIRMED
The diagnosis of measles is straightforward when all of the signs and symptoms are present. In partially vaccinated populations, however, the diagnosis may need to be confirmed by serologic or polymerase chain reaction (PCR) testing.
Differential diagnosis
The differential diagnosis of the fever and a rash typical of measles in children, especially when accompanied by severe malaise, includes the following:
Kawasaki disease. However, the red eyes of Kawasaki are an injection of the bulbar conjunctivae with sparing of the limbus. No eye exudate is present, and respiratory illness is not part of the disease.
Drug eruptions can present with a morbilliform rash and sometimes fever, but not the other signs of measles in either adults or children.
Scarlet fever has a different rash, the sandpaper rash typical of toxin-mediated disease.
Rubella tends to cause mild respiratory symptoms and illness rather than the severe disease of measles and other rash-causing viral infections in children and infants.
Confirmation in confusing cases
To confirm a diagnosis of measles, samples from throat, nasal, and posterior nasopharyngeal swabs should be collected with a blood specimen for serology and sent to the state public health laboratory.4 The US Centers for Disease Control and Prevention gives instructions on who should be tested and with which tests.4
Most testing now uses PCR for viral RNA, as viral culture is more costly and takes longer. For accurate diagnosis, samples for PCR must be obtained during the acute illness.
The serologic gold standard for diagnosis is a 4-fold rise or fall in immunoglobulin G (IgG) titer of paired serum samples sent 10 days to 2 weeks apart around the illness. The IgM test may be negative initially, and a negative test cannot be used to rule out the diagnosis. Confirmed cases should be reported to public health authorities.
COMPLICATIONS: EARLY AND LATE
Frequent complications of measles infection include those related to the primary viral infection of respiratory tract mucosal surfaces, as well as bacterial superinfections. Complications are most likely in children under age 5, nonimmune adults, pregnant women, and immunocompromised people. Typical complications include otitis media, laryngotracheobronchitis (presenting as a croupy cough), pneumonia, and diarrhea.
Late sequelae of measles infection are related in part to serious mucosal damage and generalized immune suppression caused by the virus. Even after recovery from acute infection, children can have persistent diarrhea and failure to thrive, with increased mortality risk in the months after infection. Tuberculosis can reactivate in patients already infected, and new tuberculosis infection can be especially severe. Further, tuberculosis skin tests become less reliable immediately after measles infection. Severe disease and fatalities are increased in populations that have baseline vitamin A deficiency and malnutrition.
Death from measles is most often caused by viral pneumonia, secondary bacterial pneumonia, and postviral encephalitis. Before the vaccine era, measles encephalitis occurred in the United States in about 1 in 1,000 measles cases.
Subacute sclerosing panencephalitis is a rare, late, and often fatal complication of measles that presents 7 to 10 years after acute measles infection, usually in adolescence. Beginning with myoclonic jerks, stiffening, and slow mental deterioration, it progresses over 1 to 3 years, with a relentless degenerative course leading to death. Since the introduction of the measles vaccine in 1957, this disease has essentially disappeared in the United States.
SUPPORTIVE CARE, INFECTION CONTROL
Management of measles and its complications is primarily supportive.
Preventing contagion
Measles infection has an incubation period of 8 to 12 days. Individuals are contagious 4 days before to 4 days after rash onset in the normal host but longer in those lacking immune function. Cases can occur up to 21 days after exposure during the contagious period.
The disease is highly contagious, so hospitalized patients should be cared for with airborne precautions. It is crucial that caretakers be vaccinated properly, so that they can care for patients safely. Recommendations for preventing secondary cases by prompt vaccination and giving immune globulin are detailed below, including specific recommendations for individuals with immune system suppression.
The current US public health policy regarding measles vaccine booster doses began in response to the widespread measles outbreak in the United States from 1989 to 1991. Cases occurred more commonly in unvaccinated individuals and in young adults who had received only 1 dose of vaccine.
Today, the policy in areas where measles has been controlled is to vaccinate between 12 and 15 months of age and to boost with a second dose before starting kindergarten. In outbreak situations, the first dose should be given at 6 months of age, with a repeat dose at 12 to 15 months of age and the usual booster before starting kindergarten.
Those born before 1957 can be presumed to have had natural measles, which confers lifelong immunity (Table 3).7
CURRENT THREAT
In 2000, measles was considered controlled in the United States, thanks to the national vaccination policy. But despite overall control, small numbers of cases continued to occur each year, related to exposure to cases imported from areas of the world endemic with measles.
Within the last year, however, major outbreaks have emerged. Incompletely vaccinated populations and unvaccinated individuals are the reason for the progression of current outbreaks.8
Until there is broader acceptance of the vaccine and better adherence to vaccine policies nationally and globally, measles cannot be completely eradicated. But with high vaccination rates, it is predicted that this infection can be controlled and ultimately eradicated.
RECOMMENDATIONS
In the midst of an outbreak and with rising public awareness of the threat of measles, it is important to recognize that MMR vaccination is the most effective way to prevent spread of the virus and maintain measles elimination in the United States. With this in mind, there are several key facts and recommendations regarding vaccination:
Recommendations on vaccination
- In measles-controlled populations, all children should be vaccinated between 12 and 15 months of age and again before kindergarten.
- In outbreak settings, children should receive a first vaccine dose at 6 months of age, a second at 12 to 15 months of age, and a third before kindergarten.
- Children who have received 2 measles vaccine doses can be assumed to be fully vaccinated and thus protected as long as the first dose was after 12 months of age. If the first dose was before 12 months of age, a child needs 3 doses.
- Adults born before 1957 can be assumed to have had measles infection and to be immune.
- Adults who were immunized with the inactivated measles vaccine available between 1963 and 1967 should receive 1 dose of live virus vaccine.
- Boosters are recommended for young adults who did not receive a second dose of vaccine and for adults with an uncertain history of immunization. There is no need to check titers before giving a booster, but if a positive titer is available in an adult, a booster is not needed.
- Heathcare providers should vaccinate unvaccinated or undervaccinated US residents traveling internationally (as long as they do not have contraindications) or traveling within the country to areas with outbreaks of measles.
Recommendations on vaccination after exposure to measles
- Vaccine is recommended for a nonimmune contact, including anyone with a history of only a single dose of vaccine.
- If a child got a first dose of vaccine before 12 months of age, give the second dose as soon as he or she turns 1 year old, or at least 28 days after the first dose.
- Vaccine must be given within 72 hours of exposure to confer protection (or at least decrease disease severity).
- The second dose of vaccine should be given at least 28 days after the first dose.
Recommendations on immune globulin after exposure to measles
- Immune globulin is recommended for anyone with exposure and no history of vaccination or immunity.
- Immune globulin can be given up to 6 days after exposure to prevent or decrease the severity of measles in immunocompromised hosts who have not been previously vaccinated. It is best to give it as early as possible.
- Immune globulin is given intramuscularly at 0.5 mL/kg, up to a to maximum dose of 15 mL.
- Pregnant women and immunocompromised hosts without immunity should receive immunoglobulin intravenously. Children and adults who have had a recent bone marrow transplant and likely do not yet have a reconstituted immune system should be treated with immune globulin to prevent infection, as vaccine cannot be given immediately after transplant. This is also true for other immunocompromised individuals who have not been vaccinated and who are not candidates for vaccine because of the severity of their immune suppression.
- Children with human immunodeficiency virus infection are routinely vaccinated. As long as they have evidence of serologic immunity, they do not need additional treatment.
- Kimberlin DW, Brady MT, Jackson MA, Long SS, editors. Measles. In Red Book: 2018 Report of the Committee on Infectious Diseases. American Academy of Pediatrics 2018; 537–550.
- Krugman S, Giles JP, Friedman H, Stone S. Studies on immunity to measles. J Pediatr 1965; 66:471–488. pmid:14264306.
- Gastañaduy PA, Budd J, Fisher N, et al. A measles outbreak in an underimmunized Amish community in Ohio. N Engl J Med 2016; 375(14):1343–1354. doi:10.1056/NEJMoa1602295
- Centers for Disease Control and Prevention. Measles (rubeola). www.cdc.gov/measles/index.html. Accessed May 16, 2019.
- World Health Organization. Measles vaccines: WHO position paper—April 2017. Wkly Epidemiol Rec 2017; 92(17):205–227. pmid:28459148
- McLean HQ, Fiebelkorn AP, Temte JL, Wallace GS; Centers for Disease Control and Prevention. Prevention of measles, rubella, congenital rubella syndrome and mumps, 2013; summary: recommendations of the Advisory Committee on Immunization Practices ACIP. MMWR Recomm Rep 2013 Jun 14; 62(RR-4)1–34. pmid:23760231
- Advisory Committee on Immunization Practices; Centers for Disease Control and Prevention. Immunization for health-care personnel: recommendations of the Advisory Committee on Immunization Practices (ACIP). MMWR Recomm Rep 2011 Nov 25; 60(RR-7)1–45. pmid:22108587
- Patel M, Lee AD, Redd SB, et al. Increase in measles cases—United States, January 1–April 26, 2019. MMWR Morb Mortal Wkly Rep 2019; May 3; 68(17):402–404. doi:10.15585/mmwr.mm6817e1
KEY POINTS
- Measles is highly contagious and can have serious complications, including death.
- Measles vaccine is given in a 2-dose series. People who have received only 1 dose should receive either 1 or 2 more doses, depending on the situation, so that they are protected.
- The diagnosis of measles is straightforward when classic signs and symptoms are present—fever, cough, conjunctivitis, runny nose, and rash—especially after a known exposure or in the setting of outbreak. On the other hand, in partially vaccinated or immunosuppressed people, the illness presents atypically, and confirmation of diagnosis requires laboratory testing.
- Management is mostly supportive. Children—and probably also adults—should receive vitamin A.
- Since disease can be severe in the unvaccinated, immune globulin and vaccine are given to the normal host with an exposure and no history of vaccine or immunity.

Colorectal cancer screening: Choosing the right test
Screening can help prevent colorectal cancer. The United States has seen a steady decline in colorectal cancer incidence and mortality, thanks in large part to screening. Screening rates can be increased with good patient-physician dialogue and by choosing a method the patient prefers and is most likely to complete.
In this article, we review a general approach to screening, focusing on the most commonly used methods in the United States, ie, the guaiac-based fecal occult blood test (FOBT), the fecal immunochemical test (FIT), and colonoscopy. We discuss current colorectal cancer incidence rates, screening recommendations, and how to choose the appropriate screening test.
This article does not discuss patients at high risk of polyps or cancer due to hereditary colon cancer syndromes, a personal history of colorectal neoplasia, inflammatory bowel disease, or primary sclerosing cholangitis.
TRENDS IN INCIDENCE
Colorectal cancer is the second most common type of cancer and cause of cancer-related deaths in the United States, responsible for an estimated 50,000 deaths in 2017. The lifetime risk of its occurrence is estimated to be 1 in 21 men and 1 in 23 women.1 Encouragingly, the incidence has declined by 24% over the last 30 years,2 and by 3% per year from 2004 to 2013.1 Also, as a result of screening and advances in treatment, 5-year survival rates for patients with colorectal cancer have increased, from 48.6% in 1975 to 66.4% in 2009.2
When detected at a localized stage, the 5-year survival rate in colorectal cancer is greater than 90%. Unfortunately, it is diagnosed early in only 39% of patients. And despite advances in treatment and a doubling of the 5-year survival rate in patients with advanced cancers since 1990,3 the latter is only 14%. In most patients, cancer is diagnosed when it has spread to the lymph nodes (36%) or to distant organs (22%), and the survival rate declines to 71% after lymph-node spread, and 14% after metastasis to distant organs.
It is essential to screen people who have no symptoms, as symptoms such as gastrointestinal bleeding, unexplained abdominal pain or weight loss, a persistent change in bowel movements, and bowel obstruction typically do not arise until the disease is advanced and less amenable to cure.
Increasing prevalence in younger adults
Curiously, the incidence of colorectal cancer is increasing in white US adults under age 50. Over the last 30 years, incidence rates have increased from 1.0% to 2.4% annually in adults ages 20 to 39.4 Based on current trends, colon cancer rates are expected to increase by 90% for patients ages 20 to 34 and by 28% for patients 35 to 49 by 2030.5
Although recommendations vary for colorectal cancer screening in patients under age 50, clinicians should investigate symptoms such as rectal bleeding, unexplained iron deficiency anemia, progressive abdominal pain, and persistent changes in bowel movements.
Other challenges
Despite the benefits of screening, it is underutilized. Although rates of compliance with screening recommendations have increased 10% over the last 10 years, only 65% of eligible adults currently comply.1,6
Additionally, certain areas of the country such as Appalachia and the Mississippi Delta have not benefited from the decline in the national rate of colorectal cancer.7
SCREENING GUIDELINES
Most guidelines say that colorectal cancer screening should begin at age 50 in people at average risk with no symptoms. However, the American College of Gastroenterology (ACG) recommends beginning screening at age 45 in African Americans, as this group has higher incidence and mortality rates of colorectal cancer.8 Also, the American Cancer Society recently recommended beginning screening at age 45 for all individuals.9
Screening can stop at age 75 for most patients, according to the ACG,8 the US Multi-Society Task Force on Colorectal Cancer,10 and the US Preventive Services Task Force (USPSTF).11 However, the decision should be individualized for patients ages 76 to 85. Patients within that age group who are in good health and have not previously been screened are more likely to benefit than those who have previously been screened and had a negative screening test. Patients over age 85 should not begin or continue screening, because of diminished benefit of screening in this age group, shorter life expectancy, advanced comorbid conditions, and the risks of colonoscopy and cancer treatment.
Patients and clinicians are encouraged to collaborate in deciding which screening method is appropriate. Patients adhere better when they are given a choice in the matter.12–14 And adherence is the key to effective colorectal cancer screening.
Familiarity with the key characteristics of currently available colorectal cancer screening tests will facilitate discussion with patients.
Opportunistic vs programmatic screening
Screening can be classified according to the approach to the patient or population and the intent of the test. Most screening in the United States is opportunistic rather than programmatic—that is, the physician offers the patient screening at the point of service without systematic follow-up or patient re-engagement.
In a programmatic approach, the patient is offered screening through an organized program that streamlines services, reduces overscreening, and provides systematic follow-up of testing.
DISCUSSING THE OPTIONS

Stool studies such as FOBT and FIT do not reliably detect cancer precursors such as adenomas and serrated neoplasms. If an FOBT is positive, follow-up diagnostic colonoscopy is required. Unlike screening colonoscopy, diagnostic colonoscopy requires a copayment for Medicare patients, and this should be explained to the patient.
FIT and FOBT detect hemolyzed blood within a stool sample, FOBT by a chemical reaction, and FIT by detecting a globin-specific antibody. Colorectal cancer and some large adenomatous polyps may intermittently bleed and result in occult blood in the stool, iron deficiency anemia, or hematochezia.15
Fecal occult blood testing
Historically, FOBT was the stool test of choice for screening. It uses an indirect enzymatic reaction to detect hemolyzed blood in the stool. When a specimen containing hemoglobin is added to guaiac paper and a drop of hydrogen peroxide is added to “develop” it, the peroxidase activity of hemoglobin turns the guaiac blue.
Screening with FOBT involves annual testing of 3 consecutively passed stools from different days; FOBT should not be performed at the time of digital rectal examination or if the patient is having overt rectal, urinary, or menstrual bleeding.
Dietary and medication restrictions before and during the testing period are critical, as red meat contains hemoglobin, and certain vegetables (eg, radishes, turnips, cauliflower, cucumbers) contain peroxidase, all of which can cause a false-positive result. Waiting 3 days after the stool sample is collected to develop it can mitigate the peroxidase activity of vegetables.16 Vitamin C inhibits heme peroxidase activity and leads to false-negative results. Aspirin and high-dose nonsteroidal anti-inflammatory drugs can promote bleeding throughout the intestinal tract.17
In randomized controlled trials,18–21 screening with FOBT reduced colorectal cancer mortality rates by 15% to 33%. The 30-year follow-up of a large US trial22 found a 32% relative reduction in mortality rates in patients randomized to annual screening, and a 22% relative reduction in those randomized to screening every 2 years. Despite the many possibilities for false-positive results, the specificity for detecting cancer has ranged from 86.7% to 97.3%, and the sensitivity from 37.1% to 79.4%, highlighting the benefit of colorectal cancer screening programs in unscreened populations.23–26
FIT vs FOBT in current practice
FIT should replace FOBT as the preferred stool screening method. Instead of an enzymatic reaction that can be altered by food or medication, FIT utilizes an antibody specific to human globin to directly detect hemolyzed blood, thus eliminating the need to modify the diet or medications.27 Additionally, only 1 stool specimen is needed, which may explain why the adherence rate was about 20% higher with FIT than with FOBT in most studies.28–30
FIT has a sensitivity of 69% to 86% for colorectal cancer and a specificity of 92% to 95%.31 The sensitivity can be improved by lowering the threshold value for a positive test, but this is associated with a decrease in specificity. A single FIT has the same sensitivity and specificity as several samples.32
In a large retrospective US cohort study of programmatic screening with FIT, Jensen et al33 reported that 48% of 670,841 people who were offered testing actually did the test. Of the 48% who participated in the first round and remained eligible, 75% to 86% participated in subsequent rounds over 4 years. Those who had a positive result on FIT were supposed to undergo colonoscopy, but 22% did not.
The US Multi-Society Task Force on Colorectal Cancer34 suggests that FIT-based screening programs aim for a target FIT completion rate of more than 60% and a target colonoscopy completion rate of more than 80% of patients with positive FITs. These benchmarks were derived from adherence rates in international FIT screening studies in average-risk populations.35–39 (Note that the large US cohort described above33 did not meet these goals.) Ideally, every patient with a positive FIT should undergo diagnostic colonoscopy, but in reality only 50% to 83% actually do. Methods shown to improve adherence include structured screening programs with routine performance reports, provider feedback, and involvement of patient navigators.40–42
Accordingly, several aspects of stool-based testing need to be stressed with patients. Understanding that FOBT is recommended yearly is integral for optimal impact on colorectal cancer incidence and mortality rates.
Additionally, patients should be advised to undergo colonoscopy soon after a positive FIT, because delaying colonoscopy could give precancerous lesions time to progress in stage. The acceptable time between a positive FIT and colonoscopy has yet to be determined. However, a retrospective cohort study of 1.26 million screened patients with 107,000 positive FIT results demonstrated that the rates of cancer discovered on colonoscopy were similar when performed within 30 days or up to 10 months after a positive test. Detection rates increased from 3% to 4.8% at 10 months and to 7.9% at 12 months.43
In modeling studies, Meester et al44 showed the estimated lifetime risk and mortality rates from colorectal cancer and life-years gained from screening are significantly better when colonoscopy is completed within 2 weeks rather than 1 year after a positive FIT. Each additional month after 2 weeks incrementally affected these outcomes, with a 1.4% increase in cancer mortality. These data suggest that colonoscopy should be done soon after a positive FIT result and at a maximum of 10 months.43,44
Screening with FOBT is a multistep process for patients that includes receiving the test kit, collecting the sample, preparing it, returning it, undergoing colonoscopy after a positive test, and repeating in 1 year if negative. The screening program should identify patients at average risk in whom screening is appropriate, ensure delivery of the test, verify the quality of collected samples for laboratory testing against the manufacturer’s recommendations, and report results. Report of a positive FOBT result should provide recommendations for follow-up.
Though evidence clearly supports screening annually or biennially (every 2 years) with FOBT, the ideal interval for FIT is undetermined. Modeling studies utilized by the USPSTF and Multi-Society Task Force demonstrate that colonoscopy and annual FIT result in similar life-years gained, while 2 population-based screening programs have demonstrated that a 2- or 3-year interval may be equally efficacious by lowering the threshold for a positive test.38,45
Randomized controlled trials of screening colonoscopy vs annual and biennial FIT are currently under way. Cost-effectiveness analysis has shown that offering single-sample FITs at more frequent (annual) intervals performs better than multisample testing at less frequent intervals.45–47
Colonoscopy
Compared with stool-based screening, colonoscopy has advantages, including a 10-year screening interval if bowel preparation is adequate and the examination shows no neoplasia, the ability to inspect the entire colon, and the ability to diagnose and treat lesions in the same session.
Screening colonoscopy visualizes the entire colon in more than 98% of cases, although it requires adequate bowel preparation for maximal polyp detection. It can be done safely with or without sedation.48
While there are no available randomized controlled trial data on the impact of screening colonoscopy on cancer incidence or mortality, extensive case-control and cohort studies consistently show that screening colonoscopy reduces cancer incidence and mortality rates.49–54 A US Veterans Administration study of more than 32,000 patients reported a 50% reduction in overall colorectal cancer mortality.55 In a microsimulation modeling study that assumed 100% adherence, colonoscopy every 10 years and annual FIT in individuals ages 50 to 75 provided similar life-years gained per 1,000 people screened (270 for colonoscopy, 244 for FIT).56

Well-established metrics for maximizing the effectiveness and quality of colonoscopy have been established (Table 2). The most important include the mucosa inspection time (withdrawal time) and adenoma detection rate.57 Withdrawal time is directly correlated with adenoma detection, and a 6-minute minimum withdrawal time is recommended in screening colonoscopy examinations of patients at average risk when no polyps are found.58 The adenoma detection rate is the strongest evidence-based metric, as each 1% increase in the adenoma detection rate over 19% is associated with a 3% decrease in the risk of colorectal cancer and a 5% decrease in death rate.59 The average-risk screening adenoma detection rate differs based on sex: the rate is greater than 20% for women and greater than 30% for men.
Complications from screening, diagnostic, or therapeutic colonoscopy are infrequent but include perforation (4/10,000) and significant intestinal bleeding (8/10,000).56–62
Patients with a first-degree relative under age 60 with advanced adenomas or colorectal cancer are considered at high risk and should begin screening colonoscopy at age 40, with repeat colonoscopy at 5-year intervals, given a trend toward advanced neoplasia detection compared with FIT.63
Guidelines recently published by the Canadian Association of Gastroenterology and endorsed by the American Gastroenterological Association also support starting screening in high-risk individuals at age 40, with a surveillance interval of 5 to 10 years based on the number of first-degree relatives with colorectal cancer or adenomas.64 Consensus statements were based on retrospective cohort, prospective case-controlled, and cross-sectional studies comparing the risk of colorectal cancer in individuals with a family history against those without a family history.
Randomized clinical trials comparing colonoscopy and FIT are under way. Interim analysis of a European trial in which asymptomatic adults ages 50 to 69 were randomized to 1-time colonoscopy (26,703 patients) vs FIT every 2 years (26,599 patients) found significantly higher participation rates in the FIT arm (34.2% vs 24.6%) but higher rates of nonadvanced adenomas (4.2% vs 0.4%) and advanced neoplasia (1.9% vs 0.9%) in the colonoscopy arm.65 Cancer was detected in 0.1% in each arm. These findings correlate with those of another study showing higher participation with FIT but higher advanced neoplasia detection rates with colonoscopy.66
Detection of precursor lesions is vital, as removing neoplasms is the main strategy to reduce colorectal cancer incidence. Accordingly, the advantage of colonoscopy was illustrated by a study that determined that 53 patients would need to undergo screening colonoscopy to detect 1 advanced adenoma or cancerous lesion, compared with 264 for FIT.67
STARTING SCREEING AT AGE 45
The American Cancer Society recently provided a qualified recommendation to start colorectal cancer screening in all individuals at age 45 rather than 50.9 This recommendation was based on modeling studies demonstrating that starting screening at age 45 with colonoscopy every 10 years resulted in 25 life-years gained at the cost of 610 colonoscopies per 1,000 individuals. Alternative strategies included FIT, which resulted in an additional 26 life-years gained per 1,000 individuals screened, flexible sigmoidoscopy (23 life-years gained), and computed tomographic colonoscopy (22 life-years gained).
Rates of colorectal cancer are rising in adults under age 50, and 10,000 new cases are anticipated this year.2,3 Currently, 22 million US adults are between the ages of 45 and 50. The system and support needed to perform screening in all adults over age 45 and a lack of direct evidence to support its benefits in the young population need to be considered before widespread acceptance of the American Cancer Society recommendations. However, if screening is considered, FIT with or without sigmoidoscopy may be appropriate, given that most cancers diagnosed in individuals under age 50 are left-sided.4,5
Screening has not been proven to reduce all-cause mortality. Randomized controlled trials of FOBT and observational studies of colonoscopy show that screening reduces cancer incidence and mortality. Until the currently ongoing randomized controlled trials comparing colonoscopy with FIT are completed, their comparative impact on colorectal cancer end points is unknown.
PATIENT ADHERENCE IS KEY
FIT and colonoscopy are the most prevalent screening methods in the United States. Careful attention should be given to offer the screening option the patient is most likely to complete, as adherence is key to the benefit from colorectal cancer screening.
The National Colorectal Cancer Roundtable (nccrt.org), established in 1997 by the American Cancer Society and the US Centers for Disease Control and Prevention, is a national coalition of public and private organizations dedicated to reducing colorectal cancer incidence and mortality. The Roundtable waged a national campaign to achieve a colorectal cancer screening rate of 80% in eligible adults by 2018, a goal that was not met. Still, the potential for a substantial impact is a compelling reason to endorse adherence to colorectal cancer screening. The Roundtable provides many resources for physicians to enhance screening in their practice.
The United States has seen a steady decline in colorectal cancer incidence and mortality, mainly as a result of screening. Colorectal cancer is preventable with ensuring patients’ adherence to screening. Screening rates have been shown to increase with patient-provider dialogue and with selection of a screening program the patient prefers and is most likely to complete.
- American Cancer Society. Colorectal Cancer Facts & Figures 2017–2019. Atlanta: American Cancer Society; 2017. https://www.cancer.org/content/dam/cancer-org/research/cancer-facts-and-statistics/colorectal-cancer-facts-and-figures/colorectal-cancer-facts-and-figures-2017-2019.pdf. Accessed April 1, 2019.
- Siegel RL, Miller KD, Fedewa SA, et al. Colorectal cancer statistics, 2017. CA Cancer J Clin 2017; 67(3):177–193. doi:10.3322/caac.21395
- Kopetz S, Chang GJ, Overman MJ, et al. Improved survival in metastatic colorectal cancer is associated with adoption of hepatic resection and improved chemotherapy. J Clin Oncol 2009; 27(22):3677–3683. doi:10.1200/JCO.2008.20.5278
- Siegel RL, Jemal A, Ward EM. Increase in incidence of colorectal cancer among young men and women in the United States. Cancer Epidemiol Biomarkers Prev 2009; 18(6):1695–1698. doi:10.1158/1055-9965.EPI-09-0186
- Bailey CE, Hu CY, You YN, et al. Increasing disparities in the age-related incidences of colon and rectal cancers in the United States, 1975-2010. JAMA Surg 2015; 150(1):17–22. doi:10.1001/jamasurg.2014.1756
- Centers for Disease Control and Prevention (CDC). Vital signs: colorectal cancer screening test use—United States, 2012. MMWR Morb Mortal Wkly Rep 2013; 62(44):881–888. pmid:24196665
- Siegel RL, Sahar L, Robbins A, Jemal A. Where can colorectal cancer screening interventions have the most impact? Cancer Epidemiol Biomarkers Prev 2015; 24(8):1151–1156. doi:10.1158/1055-9965.EPI-15-0082
- Agrawal S, Bhupinderjit A, Bhutani MS, et al; Committee of Minority Affairs and Cultural Diversity, American College of Gastroenterology. Colorectal cancer in African Americans. Am J Gastroenterol 2005; 100(3):515–523. doi:10.1111/j.1572-0241.2005.41829.x
- Wolf AMD, Fontham ETH, Church TR, et al. Colorectal cancer screening for average-risk adults: 2018 guideline update from the American Cancer Society. CA Cancer J Clin 2018; 68(4):250–281. doi:10.3322/caac.21457
- Rex DK, Boland CR, Dominitz JA, et al. Colorectal cancer screening: recommendations for physicians and patients from the US Multi-Society Task Force on Colorectal Cancer. Am J Gastroenterol 2017; 112(7):1016–1030. doi:10.1038/ajg.2017.174
- US Preventive Services Task Force; Bibbins-Domingo K, Grossman DC, Curry SJ, et al. Screening for colorectal cancer: US Preventive Services Task Force Recommendation Statement. JAMA 2016; 315(23):2564–2575. doi:10.1001/jama.2016.5989
- Inadomi JM, Vijan S, Janz NK, et al. Adherence to colorectal cancer screening: a randomized clinical trial of competing strategies. Arch Intern Med 2012; 172(7):575–582. doi:10.1001/archinternmed.2012.332
- Steinwachs D, Allen JD, Barlow WE, et al. National Institutes of Health state-of-the-science conference statement: enhancing use and quality of colorectal cancer screening. Ann Intern Med 2010; 152(10):663–667. doi:10.7326/0003-4819-152-10-201005180-00237
- Subramanian S, Klosterman M, Amonkar MM, Hunt TL. Adherence with colorectal cancer screening guidelines: a review. Prev Med 2004; 38(5):536–550. doi:10.1016/j.ypmed.2003.12.011
- Levin B, Lieberman DA, McFarland B, et al; American Cancer Society Colorectal Cancer Advisory Group; US Multi-Society Task Force; American College of Radiology Colon Cancer Committee. Screening and surveillance for the early detection of colorectal cancer and adenomatous polyps, 2008: a joint guideline from the American Cancer Society, the US Multi-Society Task Force on Colorectal Cancer, and the American College of Radiology. CA Cancer J Clin 2008; 58(3):130–160. doi:10.3322/CA.2007.0018
- Sinatra MA, St John DJ, Young GP. Interference of plant peroxidases with guaiac-based fecal occult blood tests is avoidable. Clin Chem 1999; 45(1):123–126. pmid:9895348
- Allison JE, Sakoda LC, Levin TR, et al. Screening for colorectal neoplasms with new fecal occult blood tests: update on performance characteristics. J Natl Cancer Inst 2007; 99(19):1462–1470. doi:10.1093/jnci/djm150
- Mandel JS, Bond JH, Church TR, et al. Reducing mortality from colorectal cancer by screening for fecal occult blood. Minnesota Colon Cancer Control Study. N Engl J Med 1993; 328(19):1365–1371. doi:10.1056/NEJM199305133281901
- Hardcastle JD, Chamberlain JO, Robinson MH, et al. Randomised controlled trial of faecal-occult-blood screening for colorectal cancer. Lancet 1996; 348(9040):1472–1477. doi:10.1016/S0140-6736(96)03386-7
- Kronborg O, Fenger C, Olsen J, Jørgensen OD, Søndergaard O. Randomised study of screening for colorectal cancer with faecal-occult-blood test. Lancet 1996; 348(9040):1467–1471. doi:10.1016/S0140-6736(96)03430-7
- Wilson JMG, Junger G. Principles and practice of screening for disease. Geneva, Switzerland: World Health Organization; 1968. http://apps.who.int/iris/bitstream/handle/10665/37650/WHO_PHP_34.pdf?sequence=17. Accessed April 1, 2019.
- Shaukat A, Mongin SJ, Geisser MS, et al. Long-term mortality after screening for colorectal cancer. N Engl J Med 2013; 369(12):1106–1114. doi:10.1056/NEJMoa1300720
- Allison JE, Tekawa IS, Ransom LJ, Adrain AL. A comparison of fecal occult-blood tests for colorectal-cancer screening. N Engl J Med 1996; 334(3):155–159. doi:10.1056/NEJM199601183340304
- Shapiro JA, Bobo JK, Church TR, et al. A comparison of fecal immunochemical and high-sensitivity guaiac tests for colorectal cancer screening. Am J Gastroenterol 2017; 112(11):1728–1735. doi:10.1038/ajg.2017.285
- Smith A, Young GP, Cole SR, Bampton P. Comparison of a brush-sampling fecal immunochemical test for hemoglobin with a sensitive guaiac-based fecal occult blood test in detection of colorectal neoplasia. Cancer 2006; 107(9):2152–2159. doi:10.1002/cncr.22230
- Brenner H, Tao S. Superior diagnostic performance of faecal immunochemical tests for haemoglobin in a head-to-head comparison with guaiac based faecal occult blood test among 2235 participants of screening colonoscopy. Eur J Cancer 2013; 49(14):3049–3054. doi:10.1016/j.ejca.2013.04.023
- Young GP, Cole S. New stool screening tests for colorectal cancer. Digestion 2007; 76(1):26–33. doi:10.1159/000108391
- van Rossum LG, van Rijn AF, Laheij RJ, et al. Random comparison of guaiac and immunochemical fecal occult blood tests for colorectal cancer in a screening population. Gastroenterology 2008; 135(1):82–90. doi:10.1053/j.gastro.2008.03.040
- Hassan C, Giorgi Rossi P, Camilloni L, et al. Meta-analysis: adherence to colorectal cancer screening and the detection rate for advanced neoplasia, according to the type of screening test. Aliment Pharmacol Ther 2012; 36(10):929–940. doi:10.1111/apt.12071
- Vart G, Banzi R, Minozzi S. Comparing participation rates between immunochemical and guaiac faecal occult blood tests: a systematic review and meta-analysis. Prev Med 2012; 55(2):87–92. doi:10.1016/j.ypmed.2012.05.006
- Imperiale TF, Ransohoff DF, Itzkowitz SH, et al. Multitarget stool DNA testing for colorectal-cancer screening. N Engl J Med 2014; 370(14):1287–1297. doi:10.1056/NEJMoa1311194
- Lee JK, Liles EG, Bent S, Levin TR, Corley DA. Accuracy of fecal immunochemical tests for colorectal cancer: systematic review and meta-analysis. Ann Intern Med 2014; 160(3):171. doi:10.7326/M13-1484
- Jensen CD, Corley DA, Quinn VP, et al. Fecal immunochemical test program performance over 4 rounds of annual screening: a retrospective cohort study. Ann Intern Med 2016; 164(7):456–463. doi:10.7326/M15-0983
- Robertson DJ, Lee JK, Boland CR, et al. Recommendations on fecal immunochemical testing to screen for colorectal neoplasia: a consensus statement by the US Multi-Society Task Force on Colorectal Cancer. Gastroenterology 2017; 152(5):1217–1237.e3. doi:10.1053/j.gastro.2016.08.053
- Rabeneck L, Rumble RB, Thompson F, et al. Fecal immunochemical tests compared with guaiac fecal occult blood tests for population-based colorectal cancer screening. Can J Gastroenterol 2012; 26(3):131–147. pmid:22408764
- Logan RF, Patnick J, Nickerson C, Coleman L, Rutter MD, von Wagner C; English Bowel Cancer Screening Evaluation Committee. Outcomes of the Bowel Cancer Screening Programme (BCSP) in England after the first 1 million tests. Gut 2012; 61(10):1439–1446. doi:10.1136/gutjnl-2011-300843
- Malila N, Oivanen T, Malminiemi O, Hakama M. Test, episode, and programme sensitivities of screening for colorectal cancer as a public health policy in Finland: experimental design. BMJ 2008; 337:a2261. doi:10.1136/bmj.a2261
- Denters MJ, Deutekom M, Bossuyt PM, Stroobants AK, Fockens P, Dekker E. Lower risk of advanced neoplasia among patients with a previous negative result from a fecal test for colorectal cancer. Gastroenterology 2012; 142(3):497–504. doi:10.1053/j.gastro.2011.11.024
- van Roon AH, Goede SL, van Ballegooijen M, et al. Random comparison of repeated faecal immunochemical testing at different intervals for population-based colorectal cancer screening. Gut 2013; 62(3):409–415. doi:10.1136/gutjnl-2011-301583
- Chubak J, Garcia MP, Burnett-Hartman AN, et al; PROSPR consortium. Time to colonoscopy after positive fecal blood test in four US health care systems. Cancer Epidemiol Biomarkers Prev 2016; 25(2):344–350. doi:10.1158/1055-9965.EPI-15-0470
- Carlson CM, Kirby KA, Casadei MA, Partin MR, Kistler CE, Walter LC. Lack of follow-up after fecal occult blood testing in older adults: inappropriate screening or failure to follow up? Arch Intern Med 2011; 171(3):249–256. doi:10.1001/archinternmed.2010.372
- Selby K, Baumgartner C, Levin TR, et al. Interventions to improve follow-up of positive results on fecal blood tests: a systematic review. Ann Intern Med 2017; 167(8):565–575. doi:10.7326/M17-1361
- Corley DA, Jensen CD, Quinn VP, et al. Association between time to colonoscopy after a positive fecal test result and risk of colorectal cancer and cancer stage at diagnosis. JAMA 2017; 317(16):1631–1641. doi:10.1001/jama.2017.3634
- Meester RG, Zauber AG, Doubeni CA, et al. Consequences of increasing time to colonoscopy examination after positive result from fecal colorectal cancer screening test. Clin Gastroenterol Hepatol 2016; 14(10):1445–1451.e8. doi:10.1016/j.cgh.2016.05.017
- Haug U, Grobbee EJ, Lansdorp-Vogelaar I, Spaander MCW, Kuipers EJ. Immunochemical faecal occult blood testing to screen for colorectal cancer: can the screening interval be extended? Gut 2017; 66(7):1262–1267. doi:10.1136/gutjnl-2015-310102
- Goede SL, van Roon AH, Reijerink JC, et al. Cost-effectiveness of one versus two sample faecal immunochemical testing for colorectal cancer screening. Gut 2013; 62(5):727–734. doi:10.1136/gutjnl-2011-301917
- Digby J, Fraser CG, Carey FA, Steele RJC. Can the performance of a quantitative FIT-based colorectal cancer screening programme be enhanced by lowering the threshold and increasing the interval? Gut 2018; 67(5):993–994. doi:10.1136/gutjnl-2017-314862
- Hoffman MS, Butler TW, Shaver T. Colonoscopy without sedation. J Clin Gastroenterol 1998; 26(4):279–282. pmid:9649011
- Zauber AG, Winawer SJ, O’Brien MJ, et al. Colonoscopic polypectomy and long-term prevention of colorectal-cancer deaths. N Engl J Med 2012; 366(8):687–696. doi:10.1056/NEJMoa1100370
- Nishihara R, Wu K, Lochhead P, et al. Long-term colorectal-cancer incidence and mortality after lower endoscopy. N Engl J Med 2013; 369(12):1095–1105. doi:10.1056/NEJMoa1301969
- Løberg M, Kalager M, Holme Ø, Hoff G, Adami HO, Bretthauer M. Long-term colorectal-cancer mortality after adenoma removal. N Engl J Med 2014; 371(9):799–807. doi:10.1056/NEJMoa1315870
- Manser CN, Bachmann LM, Brunner J, Hunold F, Bauerfeind P, Marbet UA. Colonoscopy screening markedly reduces the occurrence of colon carcinomas and carcinoma-related death: a closed cohort study. Gastrointest Endosc 2012; 76(1):110–117. doi:10.1016/j.gie.2012.02.040
- Winawer SJ, Zauber AG, Ho MN, et al. Prevention of colorectal cancer by colonoscopic polypectomy. The National Polyp Study Workgroup. N Engl J Med 1993; 329(27):1977–1981. doi:10.1056/NEJM199312303292701
- Citarda F, Tomaselli G, Capocaccia R, Barcherini S, Crespi M; Italian Multicentre Study Group. Efficacy in standard clinical practice of colonoscopic polypectomy in reducing colorectal cancer incidence. Gut 2001; 48(6):812–815. pmid:11358901
- Muller AD, Sonnenberg A. Prevention of colorectal cancer by flexible endoscopy and polypectomy. A case-control study of 32,702 veterans. Ann Intern Med 1995; 123(12):904–910. pmid:7486484
- Knudsen AB, Zauber AG, Rutter CM, et al. Estimation of benefits, burden, and harms of colorectal cancer screening strategies: modeling study for the US Preventive Services Task Force. JAMA 2016; 315(23):2595–2609. doi:10.1001/jama.2016.6828
- Rex DK, Schoenfeld PS, Cohen J, et al. Quality indicators for colonoscopy. Gastrointest Endosc 2015; 81(1):31–53. doi:10.1016/j.gie.2014.07.058
- Barclay RL, Vicari JJ, Doughty AS, Johanson JF, Greenlaw RL. Colonoscopic withdrawal times and adenoma detection during screening colonoscopy. N Engl J Med 2006; 355(24):2533–2541. doi:10.1056/NEJMoa055498
- Corley DA, Levin TR, Doubeni CA. Adenoma detection rate and risk of colorectal cancer and death. N Engl J Med 2014; 370(26):2541. doi:10.1056/NEJMc1405329
- Lin JS, Piper MA, Perdue LA, et al. Screening for colorectal cancer: updated evidence report and systematic review for the US Preventive Services Task Force. JAMA 2016; 315(23):2576–2594. doi:10.1001/jama.2016.3332
- Gatto NM, Frucht H, Sundararajan V, Jacobson JS, Grann VR, Neugut AI. Risk of perforation after colonoscopy and sigmoidoscopy: a population-based study. J Natl Cancer Inst 2003; 95(3):230–236. pmid:12569145
- Warren JL, Klabunde CN, Mariotto AB, et al. Adverse events after outpatient colonoscopy in the Medicare population. Ann Intern Med 2009; 150(12):849–857, W152. pmid:19528563
- Quintero E, Carrillo M, Gimeno-García AZ, et al. Equivalency of fecal immunochemical tests and colonoscopy in familial colorectal cancer screening. Gastroenterology 2014; 147(5):1021–130.e1. doi:10.1053/j.gastro.2014.08.004
- Leddin D, Lieberman DA, Tse F, et al. Clinical practice guideline on screening for colorectal cancer in individuals with a family history of nonhereditary colorectal cancer or adenoma: the Canadian Association of Gastroenterology Banff Consensus. Gastroenterology 2018; 155(5):1325–1347.e3. doi:10.1053/j.gastro.2018.08.017
- Quintero E, Castells A, Bujanda L, et al; COLONPREV Study Investigators. Colonoscopy versus fecal immunochemical testing in colorectal-cancer screening. N Engl J Med 2012; 366(8):697–706. doi:10.1056/NEJMoa1108895
- Gupta S, Halm EA, Rockey DC, et al. Comparative effectiveness of fecal immunochemical test outreach, colonoscopy outreach, and usual care for boosting colorectal cancer screening among the underserved: a randomized clinical trial. JAMA Intern Med 2013; 173(18):1725–1732. doi:10.1001/jamainternmed.2013.9294
- Segnan N, Senore C, Andreoni B, et al; SCORE3 Working Group-Italy. Comparing attendance and detection rate of colonoscopy with sigmoidoscopy and FIT for colorectal cancer screening. Gastroenterology 2007; 132(7):2304–2312. doi:10.1053/j.gastro.2007.03.030
Screening can help prevent colorectal cancer. The United States has seen a steady decline in colorectal cancer incidence and mortality, thanks in large part to screening. Screening rates can be increased with good patient-physician dialogue and by choosing a method the patient prefers and is most likely to complete.
In this article, we review a general approach to screening, focusing on the most commonly used methods in the United States, ie, the guaiac-based fecal occult blood test (FOBT), the fecal immunochemical test (FIT), and colonoscopy. We discuss current colorectal cancer incidence rates, screening recommendations, and how to choose the appropriate screening test.
This article does not discuss patients at high risk of polyps or cancer due to hereditary colon cancer syndromes, a personal history of colorectal neoplasia, inflammatory bowel disease, or primary sclerosing cholangitis.
TRENDS IN INCIDENCE
Colorectal cancer is the second most common type of cancer and cause of cancer-related deaths in the United States, responsible for an estimated 50,000 deaths in 2017. The lifetime risk of its occurrence is estimated to be 1 in 21 men and 1 in 23 women.1 Encouragingly, the incidence has declined by 24% over the last 30 years,2 and by 3% per year from 2004 to 2013.1 Also, as a result of screening and advances in treatment, 5-year survival rates for patients with colorectal cancer have increased, from 48.6% in 1975 to 66.4% in 2009.2
When detected at a localized stage, the 5-year survival rate in colorectal cancer is greater than 90%. Unfortunately, it is diagnosed early in only 39% of patients. And despite advances in treatment and a doubling of the 5-year survival rate in patients with advanced cancers since 1990,3 the latter is only 14%. In most patients, cancer is diagnosed when it has spread to the lymph nodes (36%) or to distant organs (22%), and the survival rate declines to 71% after lymph-node spread, and 14% after metastasis to distant organs.
It is essential to screen people who have no symptoms, as symptoms such as gastrointestinal bleeding, unexplained abdominal pain or weight loss, a persistent change in bowel movements, and bowel obstruction typically do not arise until the disease is advanced and less amenable to cure.
Increasing prevalence in younger adults
Curiously, the incidence of colorectal cancer is increasing in white US adults under age 50. Over the last 30 years, incidence rates have increased from 1.0% to 2.4% annually in adults ages 20 to 39.4 Based on current trends, colon cancer rates are expected to increase by 90% for patients ages 20 to 34 and by 28% for patients 35 to 49 by 2030.5
Although recommendations vary for colorectal cancer screening in patients under age 50, clinicians should investigate symptoms such as rectal bleeding, unexplained iron deficiency anemia, progressive abdominal pain, and persistent changes in bowel movements.
Other challenges
Despite the benefits of screening, it is underutilized. Although rates of compliance with screening recommendations have increased 10% over the last 10 years, only 65% of eligible adults currently comply.1,6
Additionally, certain areas of the country such as Appalachia and the Mississippi Delta have not benefited from the decline in the national rate of colorectal cancer.7
SCREENING GUIDELINES
Most guidelines say that colorectal cancer screening should begin at age 50 in people at average risk with no symptoms. However, the American College of Gastroenterology (ACG) recommends beginning screening at age 45 in African Americans, as this group has higher incidence and mortality rates of colorectal cancer.8 Also, the American Cancer Society recently recommended beginning screening at age 45 for all individuals.9
Screening can stop at age 75 for most patients, according to the ACG,8 the US Multi-Society Task Force on Colorectal Cancer,10 and the US Preventive Services Task Force (USPSTF).11 However, the decision should be individualized for patients ages 76 to 85. Patients within that age group who are in good health and have not previously been screened are more likely to benefit than those who have previously been screened and had a negative screening test. Patients over age 85 should not begin or continue screening, because of diminished benefit of screening in this age group, shorter life expectancy, advanced comorbid conditions, and the risks of colonoscopy and cancer treatment.
Patients and clinicians are encouraged to collaborate in deciding which screening method is appropriate. Patients adhere better when they are given a choice in the matter.12–14 And adherence is the key to effective colorectal cancer screening.
Familiarity with the key characteristics of currently available colorectal cancer screening tests will facilitate discussion with patients.
Opportunistic vs programmatic screening
Screening can be classified according to the approach to the patient or population and the intent of the test. Most screening in the United States is opportunistic rather than programmatic—that is, the physician offers the patient screening at the point of service without systematic follow-up or patient re-engagement.
In a programmatic approach, the patient is offered screening through an organized program that streamlines services, reduces overscreening, and provides systematic follow-up of testing.
DISCUSSING THE OPTIONS
Stool studies such as FOBT and FIT do not reliably detect cancer precursors such as adenomas and serrated neoplasms. If an FOBT is positive, follow-up diagnostic colonoscopy is required. Unlike screening colonoscopy, diagnostic colonoscopy requires a copayment for Medicare patients, and this should be explained to the patient.
FIT and FOBT detect hemolyzed blood within a stool sample, FOBT by a chemical reaction, and FIT by detecting a globin-specific antibody. Colorectal cancer and some large adenomatous polyps may intermittently bleed and result in occult blood in the stool, iron deficiency anemia, or hematochezia.15
Fecal occult blood testing
Historically, FOBT was the stool test of choice for screening. It uses an indirect enzymatic reaction to detect hemolyzed blood in the stool. When a specimen containing hemoglobin is added to guaiac paper and a drop of hydrogen peroxide is added to “develop” it, the peroxidase activity of hemoglobin turns the guaiac blue.
Screening with FOBT involves annual testing of 3 consecutively passed stools from different days; FOBT should not be performed at the time of digital rectal examination or if the patient is having overt rectal, urinary, or menstrual bleeding.
Dietary and medication restrictions before and during the testing period are critical, as red meat contains hemoglobin, and certain vegetables (eg, radishes, turnips, cauliflower, cucumbers) contain peroxidase, all of which can cause a false-positive result. Waiting 3 days after the stool sample is collected to develop it can mitigate the peroxidase activity of vegetables.16 Vitamin C inhibits heme peroxidase activity and leads to false-negative results. Aspirin and high-dose nonsteroidal anti-inflammatory drugs can promote bleeding throughout the intestinal tract.17
In randomized controlled trials,18–21 screening with FOBT reduced colorectal cancer mortality rates by 15% to 33%. The 30-year follow-up of a large US trial22 found a 32% relative reduction in mortality rates in patients randomized to annual screening, and a 22% relative reduction in those randomized to screening every 2 years. Despite the many possibilities for false-positive results, the specificity for detecting cancer has ranged from 86.7% to 97.3%, and the sensitivity from 37.1% to 79.4%, highlighting the benefit of colorectal cancer screening programs in unscreened populations.23–26
FIT vs FOBT in current practice
FIT should replace FOBT as the preferred stool screening method. Instead of an enzymatic reaction that can be altered by food or medication, FIT utilizes an antibody specific to human globin to directly detect hemolyzed blood, thus eliminating the need to modify the diet or medications.27 Additionally, only 1 stool specimen is needed, which may explain why the adherence rate was about 20% higher with FIT than with FOBT in most studies.28–30
FIT has a sensitivity of 69% to 86% for colorectal cancer and a specificity of 92% to 95%.31 The sensitivity can be improved by lowering the threshold value for a positive test, but this is associated with a decrease in specificity. A single FIT has the same sensitivity and specificity as several samples.32
In a large retrospective US cohort study of programmatic screening with FIT, Jensen et al33 reported that 48% of 670,841 people who were offered testing actually did the test. Of the 48% who participated in the first round and remained eligible, 75% to 86% participated in subsequent rounds over 4 years. Those who had a positive result on FIT were supposed to undergo colonoscopy, but 22% did not.
The US Multi-Society Task Force on Colorectal Cancer34 suggests that FIT-based screening programs aim for a target FIT completion rate of more than 60% and a target colonoscopy completion rate of more than 80% of patients with positive FITs. These benchmarks were derived from adherence rates in international FIT screening studies in average-risk populations.35–39 (Note that the large US cohort described above33 did not meet these goals.) Ideally, every patient with a positive FIT should undergo diagnostic colonoscopy, but in reality only 50% to 83% actually do. Methods shown to improve adherence include structured screening programs with routine performance reports, provider feedback, and involvement of patient navigators.40–42
Accordingly, several aspects of stool-based testing need to be stressed with patients. Understanding that FOBT is recommended yearly is integral for optimal impact on colorectal cancer incidence and mortality rates.
Additionally, patients should be advised to undergo colonoscopy soon after a positive FIT, because delaying colonoscopy could give precancerous lesions time to progress in stage. The acceptable time between a positive FIT and colonoscopy has yet to be determined. However, a retrospective cohort study of 1.26 million screened patients with 107,000 positive FIT results demonstrated that the rates of cancer discovered on colonoscopy were similar when performed within 30 days or up to 10 months after a positive test. Detection rates increased from 3% to 4.8% at 10 months and to 7.9% at 12 months.43
In modeling studies, Meester et al44 showed the estimated lifetime risk and mortality rates from colorectal cancer and life-years gained from screening are significantly better when colonoscopy is completed within 2 weeks rather than 1 year after a positive FIT. Each additional month after 2 weeks incrementally affected these outcomes, with a 1.4% increase in cancer mortality. These data suggest that colonoscopy should be done soon after a positive FIT result and at a maximum of 10 months.43,44
Screening with FOBT is a multistep process for patients that includes receiving the test kit, collecting the sample, preparing it, returning it, undergoing colonoscopy after a positive test, and repeating in 1 year if negative. The screening program should identify patients at average risk in whom screening is appropriate, ensure delivery of the test, verify the quality of collected samples for laboratory testing against the manufacturer’s recommendations, and report results. Report of a positive FOBT result should provide recommendations for follow-up.
Though evidence clearly supports screening annually or biennially (every 2 years) with FOBT, the ideal interval for FIT is undetermined. Modeling studies utilized by the USPSTF and Multi-Society Task Force demonstrate that colonoscopy and annual FIT result in similar life-years gained, while 2 population-based screening programs have demonstrated that a 2- or 3-year interval may be equally efficacious by lowering the threshold for a positive test.38,45
Randomized controlled trials of screening colonoscopy vs annual and biennial FIT are currently under way. Cost-effectiveness analysis has shown that offering single-sample FITs at more frequent (annual) intervals performs better than multisample testing at less frequent intervals.45–47
Colonoscopy
Compared with stool-based screening, colonoscopy has advantages, including a 10-year screening interval if bowel preparation is adequate and the examination shows no neoplasia, the ability to inspect the entire colon, and the ability to diagnose and treat lesions in the same session.
Screening colonoscopy visualizes the entire colon in more than 98% of cases, although it requires adequate bowel preparation for maximal polyp detection. It can be done safely with or without sedation.48
While there are no available randomized controlled trial data on the impact of screening colonoscopy on cancer incidence or mortality, extensive case-control and cohort studies consistently show that screening colonoscopy reduces cancer incidence and mortality rates.49–54 A US Veterans Administration study of more than 32,000 patients reported a 50% reduction in overall colorectal cancer mortality.55 In a microsimulation modeling study that assumed 100% adherence, colonoscopy every 10 years and annual FIT in individuals ages 50 to 75 provided similar life-years gained per 1,000 people screened (270 for colonoscopy, 244 for FIT).56
Well-established metrics for maximizing the effectiveness and quality of colonoscopy have been established (Table 2). The most important include the mucosa inspection time (withdrawal time) and adenoma detection rate.57 Withdrawal time is directly correlated with adenoma detection, and a 6-minute minimum withdrawal time is recommended in screening colonoscopy examinations of patients at average risk when no polyps are found.58 The adenoma detection rate is the strongest evidence-based metric, as each 1% increase in the adenoma detection rate over 19% is associated with a 3% decrease in the risk of colorectal cancer and a 5% decrease in death rate.59 The average-risk screening adenoma detection rate differs based on sex: the rate is greater than 20% for women and greater than 30% for men.
Complications from screening, diagnostic, or therapeutic colonoscopy are infrequent but include perforation (4/10,000) and significant intestinal bleeding (8/10,000).56–62
Patients with a first-degree relative under age 60 with advanced adenomas or colorectal cancer are considered at high risk and should begin screening colonoscopy at age 40, with repeat colonoscopy at 5-year intervals, given a trend toward advanced neoplasia detection compared with FIT.63
Guidelines recently published by the Canadian Association of Gastroenterology and endorsed by the American Gastroenterological Association also support starting screening in high-risk individuals at age 40, with a surveillance interval of 5 to 10 years based on the number of first-degree relatives with colorectal cancer or adenomas.64 Consensus statements were based on retrospective cohort, prospective case-controlled, and cross-sectional studies comparing the risk of colorectal cancer in individuals with a family history against those without a family history.
Randomized clinical trials comparing colonoscopy and FIT are under way. Interim analysis of a European trial in which asymptomatic adults ages 50 to 69 were randomized to 1-time colonoscopy (26,703 patients) vs FIT every 2 years (26,599 patients) found significantly higher participation rates in the FIT arm (34.2% vs 24.6%) but higher rates of nonadvanced adenomas (4.2% vs 0.4%) and advanced neoplasia (1.9% vs 0.9%) in the colonoscopy arm.65 Cancer was detected in 0.1% in each arm. These findings correlate with those of another study showing higher participation with FIT but higher advanced neoplasia detection rates with colonoscopy.66
Detection of precursor lesions is vital, as removing neoplasms is the main strategy to reduce colorectal cancer incidence. Accordingly, the advantage of colonoscopy was illustrated by a study that determined that 53 patients would need to undergo screening colonoscopy to detect 1 advanced adenoma or cancerous lesion, compared with 264 for FIT.67
STARTING SCREEING AT AGE 45
The American Cancer Society recently provided a qualified recommendation to start colorectal cancer screening in all individuals at age 45 rather than 50.9 This recommendation was based on modeling studies demonstrating that starting screening at age 45 with colonoscopy every 10 years resulted in 25 life-years gained at the cost of 610 colonoscopies per 1,000 individuals. Alternative strategies included FIT, which resulted in an additional 26 life-years gained per 1,000 individuals screened, flexible sigmoidoscopy (23 life-years gained), and computed tomographic colonoscopy (22 life-years gained).
Rates of colorectal cancer are rising in adults under age 50, and 10,000 new cases are anticipated this year.2,3 Currently, 22 million US adults are between the ages of 45 and 50. The system and support needed to perform screening in all adults over age 45 and a lack of direct evidence to support its benefits in the young population need to be considered before widespread acceptance of the American Cancer Society recommendations. However, if screening is considered, FIT with or without sigmoidoscopy may be appropriate, given that most cancers diagnosed in individuals under age 50 are left-sided.4,5
Screening has not been proven to reduce all-cause mortality. Randomized controlled trials of FOBT and observational studies of colonoscopy show that screening reduces cancer incidence and mortality. Until the currently ongoing randomized controlled trials comparing colonoscopy with FIT are completed, their comparative impact on colorectal cancer end points is unknown.
PATIENT ADHERENCE IS KEY
FIT and colonoscopy are the most prevalent screening methods in the United States. Careful attention should be given to offer the screening option the patient is most likely to complete, as adherence is key to the benefit from colorectal cancer screening.
The National Colorectal Cancer Roundtable (nccrt.org), established in 1997 by the American Cancer Society and the US Centers for Disease Control and Prevention, is a national coalition of public and private organizations dedicated to reducing colorectal cancer incidence and mortality. The Roundtable waged a national campaign to achieve a colorectal cancer screening rate of 80% in eligible adults by 2018, a goal that was not met. Still, the potential for a substantial impact is a compelling reason to endorse adherence to colorectal cancer screening. The Roundtable provides many resources for physicians to enhance screening in their practice.
The United States has seen a steady decline in colorectal cancer incidence and mortality, mainly as a result of screening. Colorectal cancer is preventable with ensuring patients’ adherence to screening. Screening rates have been shown to increase with patient-provider dialogue and with selection of a screening program the patient prefers and is most likely to complete.
- American Cancer Society. Colorectal Cancer Facts & Figures 2017–2019. Atlanta: American Cancer Society; 2017. https://www.cancer.org/content/dam/cancer-org/research/cancer-facts-and-statistics/colorectal-cancer-facts-and-figures/colorectal-cancer-facts-and-figures-2017-2019.pdf. Accessed April 1, 2019.
- Siegel RL, Miller KD, Fedewa SA, et al. Colorectal cancer statistics, 2017. CA Cancer J Clin 2017; 67(3):177–193. doi:10.3322/caac.21395
- Kopetz S, Chang GJ, Overman MJ, et al. Improved survival in metastatic colorectal cancer is associated with adoption of hepatic resection and improved chemotherapy. J Clin Oncol 2009; 27(22):3677–3683. doi:10.1200/JCO.2008.20.5278
- Siegel RL, Jemal A, Ward EM. Increase in incidence of colorectal cancer among young men and women in the United States. Cancer Epidemiol Biomarkers Prev 2009; 18(6):1695–1698. doi:10.1158/1055-9965.EPI-09-0186
- Bailey CE, Hu CY, You YN, et al. Increasing disparities in the age-related incidences of colon and rectal cancers in the United States, 1975-2010. JAMA Surg 2015; 150(1):17–22. doi:10.1001/jamasurg.2014.1756
- Centers for Disease Control and Prevention (CDC). Vital signs: colorectal cancer screening test use—United States, 2012. MMWR Morb Mortal Wkly Rep 2013; 62(44):881–888. pmid:24196665
- Siegel RL, Sahar L, Robbins A, Jemal A. Where can colorectal cancer screening interventions have the most impact? Cancer Epidemiol Biomarkers Prev 2015; 24(8):1151–1156. doi:10.1158/1055-9965.EPI-15-0082
- Agrawal S, Bhupinderjit A, Bhutani MS, et al; Committee of Minority Affairs and Cultural Diversity, American College of Gastroenterology. Colorectal cancer in African Americans. Am J Gastroenterol 2005; 100(3):515–523. doi:10.1111/j.1572-0241.2005.41829.x
- Wolf AMD, Fontham ETH, Church TR, et al. Colorectal cancer screening for average-risk adults: 2018 guideline update from the American Cancer Society. CA Cancer J Clin 2018; 68(4):250–281. doi:10.3322/caac.21457
- Rex DK, Boland CR, Dominitz JA, et al. Colorectal cancer screening: recommendations for physicians and patients from the US Multi-Society Task Force on Colorectal Cancer. Am J Gastroenterol 2017; 112(7):1016–1030. doi:10.1038/ajg.2017.174
- US Preventive Services Task Force; Bibbins-Domingo K, Grossman DC, Curry SJ, et al. Screening for colorectal cancer: US Preventive Services Task Force Recommendation Statement. JAMA 2016; 315(23):2564–2575. doi:10.1001/jama.2016.5989
- Inadomi JM, Vijan S, Janz NK, et al. Adherence to colorectal cancer screening: a randomized clinical trial of competing strategies. Arch Intern Med 2012; 172(7):575–582. doi:10.1001/archinternmed.2012.332
- Steinwachs D, Allen JD, Barlow WE, et al. National Institutes of Health state-of-the-science conference statement: enhancing use and quality of colorectal cancer screening. Ann Intern Med 2010; 152(10):663–667. doi:10.7326/0003-4819-152-10-201005180-00237
- Subramanian S, Klosterman M, Amonkar MM, Hunt TL. Adherence with colorectal cancer screening guidelines: a review. Prev Med 2004; 38(5):536–550. doi:10.1016/j.ypmed.2003.12.011
- Levin B, Lieberman DA, McFarland B, et al; American Cancer Society Colorectal Cancer Advisory Group; US Multi-Society Task Force; American College of Radiology Colon Cancer Committee. Screening and surveillance for the early detection of colorectal cancer and adenomatous polyps, 2008: a joint guideline from the American Cancer Society, the US Multi-Society Task Force on Colorectal Cancer, and the American College of Radiology. CA Cancer J Clin 2008; 58(3):130–160. doi:10.3322/CA.2007.0018
- Sinatra MA, St John DJ, Young GP. Interference of plant peroxidases with guaiac-based fecal occult blood tests is avoidable. Clin Chem 1999; 45(1):123–126. pmid:9895348
- Allison JE, Sakoda LC, Levin TR, et al. Screening for colorectal neoplasms with new fecal occult blood tests: update on performance characteristics. J Natl Cancer Inst 2007; 99(19):1462–1470. doi:10.1093/jnci/djm150
- Mandel JS, Bond JH, Church TR, et al. Reducing mortality from colorectal cancer by screening for fecal occult blood. Minnesota Colon Cancer Control Study. N Engl J Med 1993; 328(19):1365–1371. doi:10.1056/NEJM199305133281901
- Hardcastle JD, Chamberlain JO, Robinson MH, et al. Randomised controlled trial of faecal-occult-blood screening for colorectal cancer. Lancet 1996; 348(9040):1472–1477. doi:10.1016/S0140-6736(96)03386-7
- Kronborg O, Fenger C, Olsen J, Jørgensen OD, Søndergaard O. Randomised study of screening for colorectal cancer with faecal-occult-blood test. Lancet 1996; 348(9040):1467–1471. doi:10.1016/S0140-6736(96)03430-7
- Wilson JMG, Junger G. Principles and practice of screening for disease. Geneva, Switzerland: World Health Organization; 1968. http://apps.who.int/iris/bitstream/handle/10665/37650/WHO_PHP_34.pdf?sequence=17. Accessed April 1, 2019.
- Shaukat A, Mongin SJ, Geisser MS, et al. Long-term mortality after screening for colorectal cancer. N Engl J Med 2013; 369(12):1106–1114. doi:10.1056/NEJMoa1300720
- Allison JE, Tekawa IS, Ransom LJ, Adrain AL. A comparison of fecal occult-blood tests for colorectal-cancer screening. N Engl J Med 1996; 334(3):155–159. doi:10.1056/NEJM199601183340304
- Shapiro JA, Bobo JK, Church TR, et al. A comparison of fecal immunochemical and high-sensitivity guaiac tests for colorectal cancer screening. Am J Gastroenterol 2017; 112(11):1728–1735. doi:10.1038/ajg.2017.285
- Smith A, Young GP, Cole SR, Bampton P. Comparison of a brush-sampling fecal immunochemical test for hemoglobin with a sensitive guaiac-based fecal occult blood test in detection of colorectal neoplasia. Cancer 2006; 107(9):2152–2159. doi:10.1002/cncr.22230
- Brenner H, Tao S. Superior diagnostic performance of faecal immunochemical tests for haemoglobin in a head-to-head comparison with guaiac based faecal occult blood test among 2235 participants of screening colonoscopy. Eur J Cancer 2013; 49(14):3049–3054. doi:10.1016/j.ejca.2013.04.023
- Young GP, Cole S. New stool screening tests for colorectal cancer. Digestion 2007; 76(1):26–33. doi:10.1159/000108391
- van Rossum LG, van Rijn AF, Laheij RJ, et al. Random comparison of guaiac and immunochemical fecal occult blood tests for colorectal cancer in a screening population. Gastroenterology 2008; 135(1):82–90. doi:10.1053/j.gastro.2008.03.040
- Hassan C, Giorgi Rossi P, Camilloni L, et al. Meta-analysis: adherence to colorectal cancer screening and the detection rate for advanced neoplasia, according to the type of screening test. Aliment Pharmacol Ther 2012; 36(10):929–940. doi:10.1111/apt.12071
- Vart G, Banzi R, Minozzi S. Comparing participation rates between immunochemical and guaiac faecal occult blood tests: a systematic review and meta-analysis. Prev Med 2012; 55(2):87–92. doi:10.1016/j.ypmed.2012.05.006
- Imperiale TF, Ransohoff DF, Itzkowitz SH, et al. Multitarget stool DNA testing for colorectal-cancer screening. N Engl J Med 2014; 370(14):1287–1297. doi:10.1056/NEJMoa1311194
- Lee JK, Liles EG, Bent S, Levin TR, Corley DA. Accuracy of fecal immunochemical tests for colorectal cancer: systematic review and meta-analysis. Ann Intern Med 2014; 160(3):171. doi:10.7326/M13-1484
- Jensen CD, Corley DA, Quinn VP, et al. Fecal immunochemical test program performance over 4 rounds of annual screening: a retrospective cohort study. Ann Intern Med 2016; 164(7):456–463. doi:10.7326/M15-0983
- Robertson DJ, Lee JK, Boland CR, et al. Recommendations on fecal immunochemical testing to screen for colorectal neoplasia: a consensus statement by the US Multi-Society Task Force on Colorectal Cancer. Gastroenterology 2017; 152(5):1217–1237.e3. doi:10.1053/j.gastro.2016.08.053
- Rabeneck L, Rumble RB, Thompson F, et al. Fecal immunochemical tests compared with guaiac fecal occult blood tests for population-based colorectal cancer screening. Can J Gastroenterol 2012; 26(3):131–147. pmid:22408764
- Logan RF, Patnick J, Nickerson C, Coleman L, Rutter MD, von Wagner C; English Bowel Cancer Screening Evaluation Committee. Outcomes of the Bowel Cancer Screening Programme (BCSP) in England after the first 1 million tests. Gut 2012; 61(10):1439–1446. doi:10.1136/gutjnl-2011-300843
- Malila N, Oivanen T, Malminiemi O, Hakama M. Test, episode, and programme sensitivities of screening for colorectal cancer as a public health policy in Finland: experimental design. BMJ 2008; 337:a2261. doi:10.1136/bmj.a2261
- Denters MJ, Deutekom M, Bossuyt PM, Stroobants AK, Fockens P, Dekker E. Lower risk of advanced neoplasia among patients with a previous negative result from a fecal test for colorectal cancer. Gastroenterology 2012; 142(3):497–504. doi:10.1053/j.gastro.2011.11.024
- van Roon AH, Goede SL, van Ballegooijen M, et al. Random comparison of repeated faecal immunochemical testing at different intervals for population-based colorectal cancer screening. Gut 2013; 62(3):409–415. doi:10.1136/gutjnl-2011-301583
- Chubak J, Garcia MP, Burnett-Hartman AN, et al; PROSPR consortium. Time to colonoscopy after positive fecal blood test in four US health care systems. Cancer Epidemiol Biomarkers Prev 2016; 25(2):344–350. doi:10.1158/1055-9965.EPI-15-0470
- Carlson CM, Kirby KA, Casadei MA, Partin MR, Kistler CE, Walter LC. Lack of follow-up after fecal occult blood testing in older adults: inappropriate screening or failure to follow up? Arch Intern Med 2011; 171(3):249–256. doi:10.1001/archinternmed.2010.372
- Selby K, Baumgartner C, Levin TR, et al. Interventions to improve follow-up of positive results on fecal blood tests: a systematic review. Ann Intern Med 2017; 167(8):565–575. doi:10.7326/M17-1361
- Corley DA, Jensen CD, Quinn VP, et al. Association between time to colonoscopy after a positive fecal test result and risk of colorectal cancer and cancer stage at diagnosis. JAMA 2017; 317(16):1631–1641. doi:10.1001/jama.2017.3634
- Meester RG, Zauber AG, Doubeni CA, et al. Consequences of increasing time to colonoscopy examination after positive result from fecal colorectal cancer screening test. Clin Gastroenterol Hepatol 2016; 14(10):1445–1451.e8. doi:10.1016/j.cgh.2016.05.017
- Haug U, Grobbee EJ, Lansdorp-Vogelaar I, Spaander MCW, Kuipers EJ. Immunochemical faecal occult blood testing to screen for colorectal cancer: can the screening interval be extended? Gut 2017; 66(7):1262–1267. doi:10.1136/gutjnl-2015-310102
- Goede SL, van Roon AH, Reijerink JC, et al. Cost-effectiveness of one versus two sample faecal immunochemical testing for colorectal cancer screening. Gut 2013; 62(5):727–734. doi:10.1136/gutjnl-2011-301917
- Digby J, Fraser CG, Carey FA, Steele RJC. Can the performance of a quantitative FIT-based colorectal cancer screening programme be enhanced by lowering the threshold and increasing the interval? Gut 2018; 67(5):993–994. doi:10.1136/gutjnl-2017-314862
- Hoffman MS, Butler TW, Shaver T. Colonoscopy without sedation. J Clin Gastroenterol 1998; 26(4):279–282. pmid:9649011
- Zauber AG, Winawer SJ, O’Brien MJ, et al. Colonoscopic polypectomy and long-term prevention of colorectal-cancer deaths. N Engl J Med 2012; 366(8):687–696. doi:10.1056/NEJMoa1100370
- Nishihara R, Wu K, Lochhead P, et al. Long-term colorectal-cancer incidence and mortality after lower endoscopy. N Engl J Med 2013; 369(12):1095–1105. doi:10.1056/NEJMoa1301969
- Løberg M, Kalager M, Holme Ø, Hoff G, Adami HO, Bretthauer M. Long-term colorectal-cancer mortality after adenoma removal. N Engl J Med 2014; 371(9):799–807. doi:10.1056/NEJMoa1315870
- Manser CN, Bachmann LM, Brunner J, Hunold F, Bauerfeind P, Marbet UA. Colonoscopy screening markedly reduces the occurrence of colon carcinomas and carcinoma-related death: a closed cohort study. Gastrointest Endosc 2012; 76(1):110–117. doi:10.1016/j.gie.2012.02.040
- Winawer SJ, Zauber AG, Ho MN, et al. Prevention of colorectal cancer by colonoscopic polypectomy. The National Polyp Study Workgroup. N Engl J Med 1993; 329(27):1977–1981. doi:10.1056/NEJM199312303292701
- Citarda F, Tomaselli G, Capocaccia R, Barcherini S, Crespi M; Italian Multicentre Study Group. Efficacy in standard clinical practice of colonoscopic polypectomy in reducing colorectal cancer incidence. Gut 2001; 48(6):812–815. pmid:11358901
- Muller AD, Sonnenberg A. Prevention of colorectal cancer by flexible endoscopy and polypectomy. A case-control study of 32,702 veterans. Ann Intern Med 1995; 123(12):904–910. pmid:7486484
- Knudsen AB, Zauber AG, Rutter CM, et al. Estimation of benefits, burden, and harms of colorectal cancer screening strategies: modeling study for the US Preventive Services Task Force. JAMA 2016; 315(23):2595–2609. doi:10.1001/jama.2016.6828
- Rex DK, Schoenfeld PS, Cohen J, et al. Quality indicators for colonoscopy. Gastrointest Endosc 2015; 81(1):31–53. doi:10.1016/j.gie.2014.07.058
- Barclay RL, Vicari JJ, Doughty AS, Johanson JF, Greenlaw RL. Colonoscopic withdrawal times and adenoma detection during screening colonoscopy. N Engl J Med 2006; 355(24):2533–2541. doi:10.1056/NEJMoa055498
- Corley DA, Levin TR, Doubeni CA. Adenoma detection rate and risk of colorectal cancer and death. N Engl J Med 2014; 370(26):2541. doi:10.1056/NEJMc1405329
- Lin JS, Piper MA, Perdue LA, et al. Screening for colorectal cancer: updated evidence report and systematic review for the US Preventive Services Task Force. JAMA 2016; 315(23):2576–2594. doi:10.1001/jama.2016.3332
- Gatto NM, Frucht H, Sundararajan V, Jacobson JS, Grann VR, Neugut AI. Risk of perforation after colonoscopy and sigmoidoscopy: a population-based study. J Natl Cancer Inst 2003; 95(3):230–236. pmid:12569145
- Warren JL, Klabunde CN, Mariotto AB, et al. Adverse events after outpatient colonoscopy in the Medicare population. Ann Intern Med 2009; 150(12):849–857, W152. pmid:19528563
- Quintero E, Carrillo M, Gimeno-García AZ, et al. Equivalency of fecal immunochemical tests and colonoscopy in familial colorectal cancer screening. Gastroenterology 2014; 147(5):1021–130.e1. doi:10.1053/j.gastro.2014.08.004
- Leddin D, Lieberman DA, Tse F, et al. Clinical practice guideline on screening for colorectal cancer in individuals with a family history of nonhereditary colorectal cancer or adenoma: the Canadian Association of Gastroenterology Banff Consensus. Gastroenterology 2018; 155(5):1325–1347.e3. doi:10.1053/j.gastro.2018.08.017
- Quintero E, Castells A, Bujanda L, et al; COLONPREV Study Investigators. Colonoscopy versus fecal immunochemical testing in colorectal-cancer screening. N Engl J Med 2012; 366(8):697–706. doi:10.1056/NEJMoa1108895
- Gupta S, Halm EA, Rockey DC, et al. Comparative effectiveness of fecal immunochemical test outreach, colonoscopy outreach, and usual care for boosting colorectal cancer screening among the underserved: a randomized clinical trial. JAMA Intern Med 2013; 173(18):1725–1732. doi:10.1001/jamainternmed.2013.9294
- Segnan N, Senore C, Andreoni B, et al; SCORE3 Working Group-Italy. Comparing attendance and detection rate of colonoscopy with sigmoidoscopy and FIT for colorectal cancer screening. Gastroenterology 2007; 132(7):2304–2312. doi:10.1053/j.gastro.2007.03.030
KEY POINTS
- Colorectal cancer rates are increasing in young individuals, with 10,000 new cases reported in 2017 in people ages 20 to 49. The evidence to support screening at ages 45 to 50 is not well established.
- FIT is noninvasive but requires high patient adherence and the ability to follow a multistep process. Preliminary results from one trial showed it inferior to colonoscopy for detecting colorectal cancer precursors.
- Colonoscopy allows visualization and removal of precursor lesions. A positive FIT result requires follow-up colonoscopy within 10 months.

Women’s health 2019: Osteoporosis, breast cancer, contraception, and hormone therapy
Keeping up with current evidence-based healthcare practices is key to providing good clinical care to patients. This review presents 5 vignettes that highlight key issues in women’s health: osteoporosis screening, hormonal contraceptive interactions with antibiotics, hormone replacement therapy in carriers of the BRCA1 gene mutation, risks associated with hormonal contraception, and breast cancer diagnosis using digital tomosynthesis in addition to digital mammography. Supporting articles, all published in 2017 and 2018, were selected from high-impact medical and women’s health journals.
OSTEOPOROSIS SCREENING FOR FRACTURE PREVENTION
A 60-year-old woman reports that her last menstrual period was 7 years ago. She has no history of falls or fractures, and she takes no medications. She smokes 10 cigarettes per day and drinks 3 to 4 alcoholic beverages on most days of the week. She is 5 feet 6 inches (170 cm) tall and weighs 107 lb. Should she be screened for osteoporosis?
Osteoporosis is underdiagnosed
It is estimated that, in the United States, 12.3 million individuals older than 50 will develop osteoporosis by 2020. Missed opportunities to screen high-risk individuals can lead to fractures, including fractures of the hip.1
Updated screening recommendations
In 2018, the US Preventive Services Task Force (USPSTF) developed and published evidence-based recommendations for osteoporosis screening to help providers identify and treat osteoporosis early to prevent fractures.2 Available evidence on screening and treatment in women and men were reviewed with the intention of updating the 2011 USPSTF recommendations. The review also evaluated risk assessment tools, screening intervals, and efficacy of screening and treatment in various subpopulations.
Since the 2011 recommendations, more data have become available on fracture risk assessment with or without bone mineral density measurements. In its 2018 report, the USPSTF recommends that postmenopausal women younger than 65 should undergo screening with a bone density test if their 10-year risk of major osteoporotic fracture is more than 8.4%. This is equivalent to the fracture risk of a 65-year-old white woman with no major risk factors for fracture (grade B recommendation—high certainty that the benefit is moderate, or moderate certainty that the benefit is moderate to substantial).2
Assessment of fracture risk
For postmenopausal women who are under age 65 and who have at least 1 risk factor for fracture, it is reasonable to use a clinical risk assessment tool to determine who should undergo screening with bone mineral density measurement. Risk factors associated with an increased risk of osteoporotic fractures include a parental history of hip fracture, smoking, intake of 3 or more alcoholic drinks per day, low body weight, malabsorption, rheumatoid arthritis, diabetes, and postmenopausal status (not using estrogen replacement). Medications should be carefully reviewed for those that can increase the risk of fractures, including steroids and antiestrogen treatments.
The 10-year risk of a major osteoporotic or hip fracture can be assessed using the Fractional Risk Assessment Tool (FRAX), available at www.sheffield.ac.uk/FRAX/. Other acceptable tools that perform similarly to FRAX include the Osteoporosis Risk Assessment Instrument (ORAI) (10 studies; N = 16,780), Osteoporosis Index of Risk (OSIRIS) (5 studies; N = 5,649), Osteoporosis Self-Assessment Tool (OST) (13 studies; N = 44,323), and Simple Calculated Osteoporosis Risk Estimation (SCORE) (8 studies; N = 15,362).
Should this patient be screened for osteoporosis?
Based on the FRAX, this patient’s 10-year risk of major osteoporosis fracture is 9.2%. She would benefit from osteoporosis screening with a bone density test.
DO ANTIBIOTICS REDUCE EFFECTIVENESS OF HORMONAL CONTRACEPTION?
A 27-year-old woman presents with a dog bite on her right hand and is started on oral antibiotics. She takes an oral contraceptive that contains 35 µg of ethinyl estradiol and 0.25 mg of norgestimate. She asks if she should use condoms while taking antibiotics.
The antibiotics rifampin and rifabutin are known inducers of the hepatic enzymes required for contraceptive steroid metabolism, whereas other antibiotics are not. Despite the lack of compelling evidence that broad-spectrum antibiotics interfere with the efficacy of hormonal contraception, most pharmacists recommend backup contraception for women who use concomitant antibiotics.3 This practice could lead to poor compliance with the contraceptive regimen, the antibiotic regimen, or both.3
Simmons et al3 conducted a systematic review of randomized and nonrandomized studies that assessed pregnancy rates, breakthrough bleeding, ovulation suppression, and hormone pharmacokinetics in women taking oral or vaginal hormonal contraceptives in combination with nonrifamycin antibiotics, including oral, intramuscular, and intravenous forms. Oral contraceptives used in the studies included a range of doses and progestins, but lowest-dose pills, such as those containing less than 30 µg ethinyl estradiol or less than 150 µg levonorgestrel, were not included.
The contraceptive formulations in this systematic review3 included oral contraceptive pills, emergency contraception pills, and the contraceptive vaginal ring. The effect of antibiotics on other nonoral contraceptives, such as the transdermal patch, injectables, and progestin implants was not studied.
Four observational studies3 evaluated pregnancy rates or hormonal contraception failure with any antibiotic use. In 2 of these 4 studies, there was no difference in pregnancy rates in women who used oral contraceptives with and without nonrifamycin antibiotics. However, ethinyl estradiol was shown to have increased clearance when administered with dirithromycin (a macrolide).3 Twenty-five of the studies reported measures of contraceptive effectiveness (ovulation) and pharmacokinetic outcomes.
There were no observed differences in ovulation suppression or breakthrough bleeding in any study that combined hormonal contraceptives with an antibiotic. Furthermore, there was no significant decrease in progestin pharmacokinetic parameters during coadministration with an antibiotic.3 Study limitations included small sample sizes and the observational nature of the data.
How would you counsel this patient?
Available evidence suggests that nonrifamycin antibiotics do not diminish the effectiveness of the vaginal contraceptive ring or an oral hormonal contraceptive that contains at least 30 µg of ethinyl estradiol or 150 µg of levonorgestrel. Current guidelines do not recommend the use of additional backup contraception, regardless of hormonal contraception dose or formulation.4 Likewise, the most recent guidance for dental practitioners (ie, from 2012) no longer advises women to use additional contraceptive protection when taking nonrifamycin antibiotics.5
In our practice, we discuss the option of additional protection when prescribing formulations with lower estrogen doses (< 30 µg), not only because of the limitations of the available data, but also because of the high rates of unintended pregnancy with typical use of combined hormonal contraceptives (9% per year, unrelated to use of antibiotics).4 However, if our patient would rather not use additional barrier methods, she can be reassured that concomitant nonrifamycin antibiotic use is unlikely to affect contraceptive effectiveness.
HORMONE REPLACEMENT THERAPY IN CARRIERS OF THE BRCA1 MUTATION
A 41-year-old healthy mother of 3 was recently found to be a carrier of the BRCA1 mutation. She is planning to undergo prophylactic bilateral salpingo-oophorectomy for ovarian cancer prevention. However, she is apprehensive about undergoing surgical menopause. Should she be started on hormone replacement therapy after oophorectomy? How would hormone replacement therapy affect her risk of breast cancer?
In females who carry the BRCA1 mutation, the cumulative risk of both ovarian and breast cancer approaches 44% (95% confidence interval [CI] 36%–53%) and 72% (95% CI 65%–79%) by age 80.6 Prophylactic salpingo-oophorectomy reduces the risk of breast cancer by 50% and the risk of ovarian cancer by 90%. Unfortunately, premature withdrawal of ovarian hormones has been associated with long-term adverse effects including significant vasomotor symptoms, decreased quality of life, sexual dysfunction, early mortality, bone loss, decline in mood and cognition, and poor cardiovascular outcomes.7 Many of these effects can be avoided or lessened with hormone replacement therapy.
Kotsopoulos et al8 conducted a longitudinal, prospective analysis of BRCA1 mutation carriers in a multicenter study between 1995 and 2017. The mean follow-up period was 7.6 years (range 0.4–22.1). The study assessed associations between the use of hormone replacement therapy and breast cancer risk in carriers of the BRCA1 mutation who underwent prophylactic salpingo-oophorectomy. Study participants did not have a personal history of cancer. Those with a history of prophylactic mastectomy were excluded.
Participants completed a series of questionnaires every 2 years, disclosing updates in personal medical, cancer, and reproductive history. The questionnaires also inquired about the use of hormone replacement therapy, including the type used (estrogen only, progestin only, estrogen plus progestin, other), brand name, duration of use, and dose and route of administration (pill, patch, suppository).
Of the 13,087 BRCA1 mutation carriers identified, 872 met the study criteria. Of those, 377 (43%) reported using some form of hormone replacement therapy after salpingo-oophorectomy, and 495 (57%) did not. The average duration of use was 3.9 years (range 0.5–19), with most (69%) using estrogen alone; 18% used other regimens, including estrogen plus progestin and progestin only. A small percentage of participants did not indicate which formulation they used. On average, women using hormone replacement therapy underwent prophylactic oophorectomy earlier than nonusers (age 43.0 vs 48.4; absolute difference 5.5 years, P < .001).
During follow-up, there was no significant difference noted in the proportion of women diagnosed with breast cancer between hormone replacement therapy users and nonusers (10.3 vs 10.7%; absolute difference 0.4%; P = .86). In fact, for each year of estrogen-containing hormone replacement therapy, there was an 18% reduction in breast cancer risk when oophorectomy was performed before age 45 (95% CI 0.69–0.97). The authors also noted a nonsignificant 14% trend toward an increase in breast cancer risk for each year of progestin use after oophorectomy when surgery was performed before age 45 (95% CI 0.9–1.46).
Although prophylactic hysterectomy was not recommended, the authors noted that hysterectomy would eliminate the need for progestin-containing hormone replacement therapy. For those who underwent oophorectomy after age 45, hormone replacement therapy did not increase or decrease the risk of breast cancer.7
A meta-analysis by Marchetti et al9 also supports the safety of hormone replacement therapy after risk-reducing salpingo-oophorectomy. Three studies that included 1,100 patients were analyzed (including the Kotsopoulos study8 noted above). There was a nonsignificant decrease in breast cancer risk in women on estrogen-only hormone replacement therapy compared with women on estrogen-plus-progestin therapy (odds ratio 0.53, 95% CI 0.25–1.15). Overall, the authors regarded hormone replacement therapy as a safe therapeutic option after prophylactic salpingo-oophorectomy in carriers of the BRCA1 and BRCA2 mutations.9
In a case-control study published in 2016,10 hormone replacement therapy was assessed in 432 postmenopausal BRCA1 mutation carriers with invasive breast cancer (cases) and in 432 BRCA1 mutation carriers without a history of breast cancer (controls). Results showed no difference in breast cancer risk between hormone replacement therapy users and nonusers.10
Rebbeck et al11 evaluated short-term hormone replacement therapy in BRCA1 and BRCA2 gene-mutation carriers after they underwent prophylactic salpingo-oophorectomy. The results showed that hormone replacement did not affect the breast cancer risk-reduction conferred with prophylactic bilateral salpingo-oophorectomy.
Johansen et al12 evaluated hormone replacement therapy in premenopausal women after prophylactic salpingo-oophorectomy. They studied 324 carriers of BRCA gene mutations after they underwent prophylactic salpingo-oophorectomy and a subset of 950 controls who had bilateral salpingo-oophorectomy for reasons unrelated to cancer. In both groups, hormone replacement therapy was underutilized. The authors recommended using it when clinically indicated.
Should your patient start hormone replacement therapy?
This patient is healthy, and in the absence of contraindications, systemic hormone replacement therapy after prophylactic oophorectomy could mitigate the potential adverse effects of surgically induced menopause. The patient can be reassured that estrogen-containing short-term hormone replacement therapy is unlikely to increase her breast cancer risk.
HORMONAL CONTRACEPTION AND THE RISK OF BREAST CANCER
A 44-year-old woman presents to your office for an annual visit. She is sexually active but does not wish to become pregnant. She has a family history of breast cancer: her mother was diagnosed at age 53. She is interested in an oral contraceptive to prevent pregnancy and acne. However, she is nervous about being on any contraceptive that may increase her risk of breast cancer.
To date, studies assessing the effect of hormonal contraception on the risk of breast cancer have produced inconsistent results. Although most studies have shown no associated risk, a few have shown a temporary 20% to 30% increased risk of breast cancer during use.13,14 Case-controlled studies that reported an association between hormonal contraception and breast cancer included populations taking higher-dose combination pills, which are no longer prescribed. Most studies do not evaluate specific formulations of hormonal contraception, and little is known about effects associated with intrauterine devices or progestin-only contraception.
A prospective study performed by Mørch et al13 followed more than 1 million reproductive-aged women for a mean of 10.9 years. The Danish Cancer Registry was used to identify cases of invasive breast cancer. Women who used hormonal contraceptives had a relative risk of breast cancer of 1.20 compared with women not on hormonal contraception (95% CI 1.14–1.26). The study suggested that those who had been on contraceptive agents for more than 5 years had an increased risk and that this risk remained for 5 years after the agents were discontinued. Conversely, no increased risk of cancer was noted in those who used hormonal contraception for less than 5 years. No notable differences were seen among various formulations.
For women using the levonorgestrel-containing intrauterine device, the relative risk of breast cancer was 1.21 (95% CI 1.11–1.33). A few cancers were noted in those who used the progestin-only implant or those using depot medroxyprogesterone acetate. While the study showed an increased relative risk of breast cancer, the absolute risk was low—13 cases per 100,000, or approximately 1 additional case of breast cancer per 7,690 per year.13
This study had several important limitations. The authors did not adjust for common breast cancer risk factors including age at menarche, alcohol use, or breastfeeding. Additionally, the study did not account for the use of hormonal contraception before the study period and conversely, did not account for women who may have stopped taking their contraceptive despite their prescribed duration. The frequency of mammography was not explicitly noted, which could have shifted results for women who had more aggressive screening.
It is also noteworthy that the use of high-dose systemic progestins was not associated with an increased risk, whereas the levonorgestrel intrauterine device, which contains only 1/20th the dose of a low-dose oral contraceptive pill, was associated with an increased risk. This discrepancy in risk warrants further investigation, and clinicians should be aware that this inconsistency needs validation before changing clinical practice.
In an observational cohort study,15 more than 100,000 women ages 50 to 71 were followed prospectively for 15 years to evaluate the association between hormonal contraceptive use and the risk of gynecologic and breast cancers. In this study, the duration of hormonal contraceptive use, smoking status, alcohol use, body mass index, physical activity, and family history of cancer were recorded. Long-term hormonal contraceptive use reduced ovarian and endometrial cancer risks by 40% and 34%, respectively, with no increase in breast cancer risk regardless of family history.
How would you counsel the patient?
The patient should be educated on the benefits of hormonal contraception that extend beyond pregnancy prevention, including regulation of menses, improved acne, decreased risk of endometrial and ovarian cancer, and likely reductions in colorectal cancer and overall mortality risk.13–16 Further, after their own systematic review of the data assessing risk of breast cancer with hormonal contraception, the US Centers for Disease Control and Prevention state in their guidelines that all contraceptives may be used without limitation in those who have a family history of breast cancer.4 Any potential increased risk of breast cancer in women using hormonal contraception is small and would not outweigh the benefits associated with use.
One must consider the impact of an unintended pregnancy in such women, including effects on the health of the fetus and mother. Recent reports on the increasing rates of maternal death in the US (23.8 of 100,000 live births) serve as a reminder of the complications that can arise with pregnancy, especially if a mother’s health is not optimized before conception.17
MAMMOGRAPHY PLUS TOMOSYNTHESIS VS MAMMOGRAPHY ALONE
The same 44-year-old patient now inquires about screening for breast cancer. She is curious about 3-dimensional mammography and whether it would be a better screening test for her.
Digital breast tomosynthesis (DBT) is a newer imaging modality that provides a 3-dimensional reconstruction of the breast using low-dose x-ray imaging. Some studies have shown that combining DBT with digital mammography may be superior to digital mammography alone in detecting cancers.18 However, digital mammography is currently the gold standard for breast cancer screening and is the only test proven to reduce mortality.18,19
In a retrospective US study of 13 medical centers,20 breast cancer detection rates increased by 41% the year after DBT was introduced, from 2.9 to 4.1 per 1,000 cases. DBT was associated with 16 fewer patients recalled for repeat imaging out of 1,000 women screened (as opposed to mammography alone). Two European studies similarly suggested an increase in cancer detection with lower recall rates.21,22
Is 3-D mammography a better option?
In a 2-arm study by Pattacini et al,18 nearly 20,000 women ages 45 to 70 were randomized to undergo either digital mammography or digital mammography plus DBT for primary breast cancer screening. Women were enrolled over a 2-year period and were followed for 4.5 years, and the development of a primary invasive cancer was the primary end point. Recall rates, reading times, and radiation doses were also compared between the 2 groups.
Overall, the cancer detection rate was higher in the digital mammography plus DBT arm compared with digital mammography alone (8.6 vs 4.5 per 1,000). The detection rates were higher in the combined screening group among all age subgroups, with relative risks ranging from 1.83 to 2.04 (P = .93). The recall rate was 3.5% in the 2 arms, with relative risks ranging from 0.93 to 1.11 (P = .52). There was a reduction in the number of false positives seen in women undergoing digital mammography plus DBT when compared with digital mammography alone, from 30 per 1,000 to 27 per 1,000.
Detection of ductal carcinoma in situ increased in the experimental arm (relative detection 2.80, 95% CI 1.01–7.65) compared with invasive cancers. Comparing radiation, the dose was 2.3 times higher in those who underwent digital mammography plus DBT. The average reading times for digital mammography alone were 20 to 85 seconds; adding DBT added 35 to 81 seconds.19
Should you advise 3-D mammography?
The patient should be educated on the benefits of both digital mammography alone and digital mammography plus DBT. The use of digital mammography plus DBT has been supported in various studies and has been shown to increase cancer detection rates, although data are still conflicting regarding recall rates.19,20 More studies are needed to determine its effect on breast cancer morality.
Routine use of DBT in women with or without dense breast tissue has not been recommended by organizations such as the USPSTF and the American College of Obstetricians and Gynecologists.23,24 While there is an increased dose of radiation, it still falls below the US Food and Drug Administration limits and should not be the sole barrier to use.
- Cauley JA. Screening for osteoporosis. JAMA 2018; 319(24):2483–2485. doi:10.1001/jama.2018.5722
- US Preventive Services Task Force, Curry SJ, Krist AH, Owens DK, et al. Screening for osteoporosis to prevent fractures: US Preventive Services Task Force recommendation statement. JAMA 2018; 319(24):2521–2531. doi:10.1001/jama.2018.7498
- Simmons KB, Haddad LB, Nanda K, Curtis KM. Drug interactions between non-rifamycin antibiotics and hormonal contraception: a systematic review. Am J Obstet Gynecol 2018; 218(1):88–97.e14. doi:10.1016/j.ajog.2017.07.003
- Curtis KM, Tepper NK, Jatlaoui TC, et al. US Medical eligibility criteria for contraceptive use, 2016. MMWR Recomm Rep 2016; 65(3):1–103. doi:10.15585/mmwr.rr6503a1
- Taylor J, Pemberton MN. Antibiotics and oral contraceptives: new considerations for dental practice. Br Dent J 2012; 212(10):481–483. doi:10.1038/sj.bdj.2012.414
- Kuchenbaecker KB, Hopper JL, Barnes DR, et al. Risks of breast, ovarian, and contralateral breast cancer for BRCA1 and BRCA2 mutation carriers. JAMA 2017; 317(23):2402–2416. doi:10.1001/jama.2017.7112
- Faubion SS, Kuhle CL, Shuster LT, Rocca WA. Long-term health consequences of premature or early menopause and considerations for management. Climacteric 2015; 18(4):483–491. doi:10.3109/13697137.2015.1020484
- Kotsopoulos J, Gronwald J, Karlan BY, et al; Hereditary Breast Cancer Clinical Study Group. Hormone replacement therapy after oophorectomy and breast cancer risk among BRCA1 mutation carriers. JAMA Oncol 2018; 4(8):1059–1065. doi:10.1001/jamaoncol.2018.0211
- Marchetti C, De Felice F, Boccia S, et al. Hormone replacement therapy after prophylactic risk reducing salpingo-oophorectomy and breast cancer risk in BRCA1 and BRCA2 mutation carriers: a meta-analysis. Crit Rev Oncol Hematol 2018; 132:111–115. doi:10.1016/j.critrevonc.2018.09.018
- Kotsopoulos J, Huzarski T, Gronwald J, et al. Hormone replacement therapy after menopause and risk of breast cancer in BRCA1 mutation carriers: a case-control study. Breast Cancer Res Treat 2016; 155(2):365–373. doi:10.1007/s10549-016-3685-3
- Rebbeck TR, Friebel T, Wagner T, et al; PROSE Study Group. Effect of short-term hormone replacement therapy on breast cancer risk reduction after bilateral prophylactic oophorectomy in BRCA1 and BRCA2 mutation carriers: the PROSE Study Group. J Clin Oncol 2005; 23(31):7804–7810. doi:10.1200/JCO.2004.00.8151
- Johansen N, Liavaag AH, Iversen OE, Dørum A, Braaten T, Michelsen TM. Use of hormone replacement therapy after risk-reducing salpingo-oophorectomy. Acta Obstet Gynecol Scand 2017; 96(5):547–555. doi:10.1111/aogs.13120
- Mørch LS, Skovlund CW, Hannaford PC, Iversen L, Fielding S, Lidegaard Ø. Contemporary hormonal contraception and the risk of breast cancer. N Engl J Med 2017; 377(23):2228–2239. doi:10.1056/NEJMoa1700732
- Batur P, Sikka S, McNamara M. Contraception update: extended use of long acting methods, hormonal contraception risks, and over the counter access. J Womens Health (Larchmt) 2018. doi:10.1089/jwh.2018.7391. [Epub ahead of print]
- Michels KA, Pfeiffer RM, Brinton LA, Trabert B. Modification of the associations between duration of oral contraceptive use and ovarian, endometrial, breast, and colorectal cancers. JAMA Oncol 2018; 4(4):516–521. doi:10.1001/jamaoncol.2017.4942
- Iversen L, Fielding S, Lidegaard Ø, Mørch LS, Skovlund CW, Hannaford PC. Association between contemporary hormonal contraception and ovarian cancer in women of reproductive age in Denmark: prospective, nationwide cohort study. BMJ 2018; 362:k3609. doi:10.1136/bmj.k3609
- MacDorman MF, Declercq E, Cabral H, Morton C. Recent increases in the US maternal mortality rate: disentangling trends from measurement issues. Obstet Gynecol 2016; 128(3):447–455. doi:10.1097/AOG.0000000000001556
- Pattacini P, Nitrosi A, Giorgi Rossi P, et al; RETomo Working Group. Digital mammography versus digital mammography plus tomosynthesis for breast cancer screening: the Reggio Emilia tomosynthesis randomized trial. Radiology 2018; 288(2):375–385. doi:10.1148/radiol.2018172119
- Pace L, Keating NL. A systematic assessment of benefits and risks to guide breast cancer screening decisions. JAMA 2014; 311(13):1327–1335. doi:10.1001/jama.2014.1398
- Friedewald SM, Rafferty EA, Rose SL, et al. Breast cancer screening using tomosynthesis in combination with digital mammography. JAMA 2014; 311(24):2499–2507. doi:10.1001/jama.2014.6095
- Skaane P, Bandos AI, Gullien R, et al. Comparison of digital mammography alone and digital mammography plus tomosynthesis in a population-based screening program. Radiology 2013; 267(1):47–56. doi:10.1148/radiol.12121373
- Ciatto S, Houssami N, Bernardi D, et al. Integration of 3D digital mammography with tomosynthesis for population breast-cancer screening (STORM): a prospective comparison study. Lancet Oncol 2013; 14(7):583–589. doi:10.1016/S1470-2045(13)70134-7
- US Preventive Services Task Force. Final recommendation statement: breast cancer: screening. www.uspreventiveservicestaskforce.org/Page/Document/RecommendationStatementFinal/breast-cancer-screening1. Accessed May 13, 2019.
- American College of Obstetricians and Gynecologists. Breast cancer risk assessment and screening in average-risk women. www.acog.org/Clinical-Guidance-and-Publications/Practice-Bulletins/Committee-on-Practice-Bulletins-Gynecology/Breast-Cancer-Risk-Assessment-and-Screening-in-Average-Risk-Women?IsMobileSet=false#5. Accessed May 13, 2019.
Keeping up with current evidence-based healthcare practices is key to providing good clinical care to patients. This review presents 5 vignettes that highlight key issues in women’s health: osteoporosis screening, hormonal contraceptive interactions with antibiotics, hormone replacement therapy in carriers of the BRCA1 gene mutation, risks associated with hormonal contraception, and breast cancer diagnosis using digital tomosynthesis in addition to digital mammography. Supporting articles, all published in 2017 and 2018, were selected from high-impact medical and women’s health journals.
OSTEOPOROSIS SCREENING FOR FRACTURE PREVENTION
A 60-year-old woman reports that her last menstrual period was 7 years ago. She has no history of falls or fractures, and she takes no medications. She smokes 10 cigarettes per day and drinks 3 to 4 alcoholic beverages on most days of the week. She is 5 feet 6 inches (170 cm) tall and weighs 107 lb. Should she be screened for osteoporosis?
Osteoporosis is underdiagnosed
It is estimated that, in the United States, 12.3 million individuals older than 50 will develop osteoporosis by 2020. Missed opportunities to screen high-risk individuals can lead to fractures, including fractures of the hip.1
Updated screening recommendations
In 2018, the US Preventive Services Task Force (USPSTF) developed and published evidence-based recommendations for osteoporosis screening to help providers identify and treat osteoporosis early to prevent fractures.2 Available evidence on screening and treatment in women and men were reviewed with the intention of updating the 2011 USPSTF recommendations. The review also evaluated risk assessment tools, screening intervals, and efficacy of screening and treatment in various subpopulations.
Since the 2011 recommendations, more data have become available on fracture risk assessment with or without bone mineral density measurements. In its 2018 report, the USPSTF recommends that postmenopausal women younger than 65 should undergo screening with a bone density test if their 10-year risk of major osteoporotic fracture is more than 8.4%. This is equivalent to the fracture risk of a 65-year-old white woman with no major risk factors for fracture (grade B recommendation—high certainty that the benefit is moderate, or moderate certainty that the benefit is moderate to substantial).2
Assessment of fracture risk
For postmenopausal women who are under age 65 and who have at least 1 risk factor for fracture, it is reasonable to use a clinical risk assessment tool to determine who should undergo screening with bone mineral density measurement. Risk factors associated with an increased risk of osteoporotic fractures include a parental history of hip fracture, smoking, intake of 3 or more alcoholic drinks per day, low body weight, malabsorption, rheumatoid arthritis, diabetes, and postmenopausal status (not using estrogen replacement). Medications should be carefully reviewed for those that can increase the risk of fractures, including steroids and antiestrogen treatments.
The 10-year risk of a major osteoporotic or hip fracture can be assessed using the Fractional Risk Assessment Tool (FRAX), available at www.sheffield.ac.uk/FRAX/. Other acceptable tools that perform similarly to FRAX include the Osteoporosis Risk Assessment Instrument (ORAI) (10 studies; N = 16,780), Osteoporosis Index of Risk (OSIRIS) (5 studies; N = 5,649), Osteoporosis Self-Assessment Tool (OST) (13 studies; N = 44,323), and Simple Calculated Osteoporosis Risk Estimation (SCORE) (8 studies; N = 15,362).
Should this patient be screened for osteoporosis?
Based on the FRAX, this patient’s 10-year risk of major osteoporosis fracture is 9.2%. She would benefit from osteoporosis screening with a bone density test.
DO ANTIBIOTICS REDUCE EFFECTIVENESS OF HORMONAL CONTRACEPTION?
A 27-year-old woman presents with a dog bite on her right hand and is started on oral antibiotics. She takes an oral contraceptive that contains 35 µg of ethinyl estradiol and 0.25 mg of norgestimate. She asks if she should use condoms while taking antibiotics.
The antibiotics rifampin and rifabutin are known inducers of the hepatic enzymes required for contraceptive steroid metabolism, whereas other antibiotics are not. Despite the lack of compelling evidence that broad-spectrum antibiotics interfere with the efficacy of hormonal contraception, most pharmacists recommend backup contraception for women who use concomitant antibiotics.3 This practice could lead to poor compliance with the contraceptive regimen, the antibiotic regimen, or both.3
Simmons et al3 conducted a systematic review of randomized and nonrandomized studies that assessed pregnancy rates, breakthrough bleeding, ovulation suppression, and hormone pharmacokinetics in women taking oral or vaginal hormonal contraceptives in combination with nonrifamycin antibiotics, including oral, intramuscular, and intravenous forms. Oral contraceptives used in the studies included a range of doses and progestins, but lowest-dose pills, such as those containing less than 30 µg ethinyl estradiol or less than 150 µg levonorgestrel, were not included.
The contraceptive formulations in this systematic review3 included oral contraceptive pills, emergency contraception pills, and the contraceptive vaginal ring. The effect of antibiotics on other nonoral contraceptives, such as the transdermal patch, injectables, and progestin implants was not studied.
Four observational studies3 evaluated pregnancy rates or hormonal contraception failure with any antibiotic use. In 2 of these 4 studies, there was no difference in pregnancy rates in women who used oral contraceptives with and without nonrifamycin antibiotics. However, ethinyl estradiol was shown to have increased clearance when administered with dirithromycin (a macrolide).3 Twenty-five of the studies reported measures of contraceptive effectiveness (ovulation) and pharmacokinetic outcomes.
There were no observed differences in ovulation suppression or breakthrough bleeding in any study that combined hormonal contraceptives with an antibiotic. Furthermore, there was no significant decrease in progestin pharmacokinetic parameters during coadministration with an antibiotic.3 Study limitations included small sample sizes and the observational nature of the data.
How would you counsel this patient?
Available evidence suggests that nonrifamycin antibiotics do not diminish the effectiveness of the vaginal contraceptive ring or an oral hormonal contraceptive that contains at least 30 µg of ethinyl estradiol or 150 µg of levonorgestrel. Current guidelines do not recommend the use of additional backup contraception, regardless of hormonal contraception dose or formulation.4 Likewise, the most recent guidance for dental practitioners (ie, from 2012) no longer advises women to use additional contraceptive protection when taking nonrifamycin antibiotics.5
In our practice, we discuss the option of additional protection when prescribing formulations with lower estrogen doses (< 30 µg), not only because of the limitations of the available data, but also because of the high rates of unintended pregnancy with typical use of combined hormonal contraceptives (9% per year, unrelated to use of antibiotics).4 However, if our patient would rather not use additional barrier methods, she can be reassured that concomitant nonrifamycin antibiotic use is unlikely to affect contraceptive effectiveness.
HORMONE REPLACEMENT THERAPY IN CARRIERS OF THE BRCA1 MUTATION
A 41-year-old healthy mother of 3 was recently found to be a carrier of the BRCA1 mutation. She is planning to undergo prophylactic bilateral salpingo-oophorectomy for ovarian cancer prevention. However, she is apprehensive about undergoing surgical menopause. Should she be started on hormone replacement therapy after oophorectomy? How would hormone replacement therapy affect her risk of breast cancer?
In females who carry the BRCA1 mutation, the cumulative risk of both ovarian and breast cancer approaches 44% (95% confidence interval [CI] 36%–53%) and 72% (95% CI 65%–79%) by age 80.6 Prophylactic salpingo-oophorectomy reduces the risk of breast cancer by 50% and the risk of ovarian cancer by 90%. Unfortunately, premature withdrawal of ovarian hormones has been associated with long-term adverse effects including significant vasomotor symptoms, decreased quality of life, sexual dysfunction, early mortality, bone loss, decline in mood and cognition, and poor cardiovascular outcomes.7 Many of these effects can be avoided or lessened with hormone replacement therapy.
Kotsopoulos et al8 conducted a longitudinal, prospective analysis of BRCA1 mutation carriers in a multicenter study between 1995 and 2017. The mean follow-up period was 7.6 years (range 0.4–22.1). The study assessed associations between the use of hormone replacement therapy and breast cancer risk in carriers of the BRCA1 mutation who underwent prophylactic salpingo-oophorectomy. Study participants did not have a personal history of cancer. Those with a history of prophylactic mastectomy were excluded.
Participants completed a series of questionnaires every 2 years, disclosing updates in personal medical, cancer, and reproductive history. The questionnaires also inquired about the use of hormone replacement therapy, including the type used (estrogen only, progestin only, estrogen plus progestin, other), brand name, duration of use, and dose and route of administration (pill, patch, suppository).
Of the 13,087 BRCA1 mutation carriers identified, 872 met the study criteria. Of those, 377 (43%) reported using some form of hormone replacement therapy after salpingo-oophorectomy, and 495 (57%) did not. The average duration of use was 3.9 years (range 0.5–19), with most (69%) using estrogen alone; 18% used other regimens, including estrogen plus progestin and progestin only. A small percentage of participants did not indicate which formulation they used. On average, women using hormone replacement therapy underwent prophylactic oophorectomy earlier than nonusers (age 43.0 vs 48.4; absolute difference 5.5 years, P < .001).
During follow-up, there was no significant difference noted in the proportion of women diagnosed with breast cancer between hormone replacement therapy users and nonusers (10.3 vs 10.7%; absolute difference 0.4%; P = .86). In fact, for each year of estrogen-containing hormone replacement therapy, there was an 18% reduction in breast cancer risk when oophorectomy was performed before age 45 (95% CI 0.69–0.97). The authors also noted a nonsignificant 14% trend toward an increase in breast cancer risk for each year of progestin use after oophorectomy when surgery was performed before age 45 (95% CI 0.9–1.46).
Although prophylactic hysterectomy was not recommended, the authors noted that hysterectomy would eliminate the need for progestin-containing hormone replacement therapy. For those who underwent oophorectomy after age 45, hormone replacement therapy did not increase or decrease the risk of breast cancer.7
A meta-analysis by Marchetti et al9 also supports the safety of hormone replacement therapy after risk-reducing salpingo-oophorectomy. Three studies that included 1,100 patients were analyzed (including the Kotsopoulos study8 noted above). There was a nonsignificant decrease in breast cancer risk in women on estrogen-only hormone replacement therapy compared with women on estrogen-plus-progestin therapy (odds ratio 0.53, 95% CI 0.25–1.15). Overall, the authors regarded hormone replacement therapy as a safe therapeutic option after prophylactic salpingo-oophorectomy in carriers of the BRCA1 and BRCA2 mutations.9
In a case-control study published in 2016,10 hormone replacement therapy was assessed in 432 postmenopausal BRCA1 mutation carriers with invasive breast cancer (cases) and in 432 BRCA1 mutation carriers without a history of breast cancer (controls). Results showed no difference in breast cancer risk between hormone replacement therapy users and nonusers.10
Rebbeck et al11 evaluated short-term hormone replacement therapy in BRCA1 and BRCA2 gene-mutation carriers after they underwent prophylactic salpingo-oophorectomy. The results showed that hormone replacement did not affect the breast cancer risk-reduction conferred with prophylactic bilateral salpingo-oophorectomy.
Johansen et al12 evaluated hormone replacement therapy in premenopausal women after prophylactic salpingo-oophorectomy. They studied 324 carriers of BRCA gene mutations after they underwent prophylactic salpingo-oophorectomy and a subset of 950 controls who had bilateral salpingo-oophorectomy for reasons unrelated to cancer. In both groups, hormone replacement therapy was underutilized. The authors recommended using it when clinically indicated.
Should your patient start hormone replacement therapy?
This patient is healthy, and in the absence of contraindications, systemic hormone replacement therapy after prophylactic oophorectomy could mitigate the potential adverse effects of surgically induced menopause. The patient can be reassured that estrogen-containing short-term hormone replacement therapy is unlikely to increase her breast cancer risk.
HORMONAL CONTRACEPTION AND THE RISK OF BREAST CANCER
A 44-year-old woman presents to your office for an annual visit. She is sexually active but does not wish to become pregnant. She has a family history of breast cancer: her mother was diagnosed at age 53. She is interested in an oral contraceptive to prevent pregnancy and acne. However, she is nervous about being on any contraceptive that may increase her risk of breast cancer.
To date, studies assessing the effect of hormonal contraception on the risk of breast cancer have produced inconsistent results. Although most studies have shown no associated risk, a few have shown a temporary 20% to 30% increased risk of breast cancer during use.13,14 Case-controlled studies that reported an association between hormonal contraception and breast cancer included populations taking higher-dose combination pills, which are no longer prescribed. Most studies do not evaluate specific formulations of hormonal contraception, and little is known about effects associated with intrauterine devices or progestin-only contraception.
A prospective study performed by Mørch et al13 followed more than 1 million reproductive-aged women for a mean of 10.9 years. The Danish Cancer Registry was used to identify cases of invasive breast cancer. Women who used hormonal contraceptives had a relative risk of breast cancer of 1.20 compared with women not on hormonal contraception (95% CI 1.14–1.26). The study suggested that those who had been on contraceptive agents for more than 5 years had an increased risk and that this risk remained for 5 years after the agents were discontinued. Conversely, no increased risk of cancer was noted in those who used hormonal contraception for less than 5 years. No notable differences were seen among various formulations.
For women using the levonorgestrel-containing intrauterine device, the relative risk of breast cancer was 1.21 (95% CI 1.11–1.33). A few cancers were noted in those who used the progestin-only implant or those using depot medroxyprogesterone acetate. While the study showed an increased relative risk of breast cancer, the absolute risk was low—13 cases per 100,000, or approximately 1 additional case of breast cancer per 7,690 per year.13
This study had several important limitations. The authors did not adjust for common breast cancer risk factors including age at menarche, alcohol use, or breastfeeding. Additionally, the study did not account for the use of hormonal contraception before the study period and conversely, did not account for women who may have stopped taking their contraceptive despite their prescribed duration. The frequency of mammography was not explicitly noted, which could have shifted results for women who had more aggressive screening.
It is also noteworthy that the use of high-dose systemic progestins was not associated with an increased risk, whereas the levonorgestrel intrauterine device, which contains only 1/20th the dose of a low-dose oral contraceptive pill, was associated with an increased risk. This discrepancy in risk warrants further investigation, and clinicians should be aware that this inconsistency needs validation before changing clinical practice.
In an observational cohort study,15 more than 100,000 women ages 50 to 71 were followed prospectively for 15 years to evaluate the association between hormonal contraceptive use and the risk of gynecologic and breast cancers. In this study, the duration of hormonal contraceptive use, smoking status, alcohol use, body mass index, physical activity, and family history of cancer were recorded. Long-term hormonal contraceptive use reduced ovarian and endometrial cancer risks by 40% and 34%, respectively, with no increase in breast cancer risk regardless of family history.
How would you counsel the patient?
The patient should be educated on the benefits of hormonal contraception that extend beyond pregnancy prevention, including regulation of menses, improved acne, decreased risk of endometrial and ovarian cancer, and likely reductions in colorectal cancer and overall mortality risk.13–16 Further, after their own systematic review of the data assessing risk of breast cancer with hormonal contraception, the US Centers for Disease Control and Prevention state in their guidelines that all contraceptives may be used without limitation in those who have a family history of breast cancer.4 Any potential increased risk of breast cancer in women using hormonal contraception is small and would not outweigh the benefits associated with use.
One must consider the impact of an unintended pregnancy in such women, including effects on the health of the fetus and mother. Recent reports on the increasing rates of maternal death in the US (23.8 of 100,000 live births) serve as a reminder of the complications that can arise with pregnancy, especially if a mother’s health is not optimized before conception.17
MAMMOGRAPHY PLUS TOMOSYNTHESIS VS MAMMOGRAPHY ALONE
The same 44-year-old patient now inquires about screening for breast cancer. She is curious about 3-dimensional mammography and whether it would be a better screening test for her.
Digital breast tomosynthesis (DBT) is a newer imaging modality that provides a 3-dimensional reconstruction of the breast using low-dose x-ray imaging. Some studies have shown that combining DBT with digital mammography may be superior to digital mammography alone in detecting cancers.18 However, digital mammography is currently the gold standard for breast cancer screening and is the only test proven to reduce mortality.18,19
In a retrospective US study of 13 medical centers,20 breast cancer detection rates increased by 41% the year after DBT was introduced, from 2.9 to 4.1 per 1,000 cases. DBT was associated with 16 fewer patients recalled for repeat imaging out of 1,000 women screened (as opposed to mammography alone). Two European studies similarly suggested an increase in cancer detection with lower recall rates.21,22
Is 3-D mammography a better option?
In a 2-arm study by Pattacini et al,18 nearly 20,000 women ages 45 to 70 were randomized to undergo either digital mammography or digital mammography plus DBT for primary breast cancer screening. Women were enrolled over a 2-year period and were followed for 4.5 years, and the development of a primary invasive cancer was the primary end point. Recall rates, reading times, and radiation doses were also compared between the 2 groups.
Overall, the cancer detection rate was higher in the digital mammography plus DBT arm compared with digital mammography alone (8.6 vs 4.5 per 1,000). The detection rates were higher in the combined screening group among all age subgroups, with relative risks ranging from 1.83 to 2.04 (P = .93). The recall rate was 3.5% in the 2 arms, with relative risks ranging from 0.93 to 1.11 (P = .52). There was a reduction in the number of false positives seen in women undergoing digital mammography plus DBT when compared with digital mammography alone, from 30 per 1,000 to 27 per 1,000.
Detection of ductal carcinoma in situ increased in the experimental arm (relative detection 2.80, 95% CI 1.01–7.65) compared with invasive cancers. Comparing radiation, the dose was 2.3 times higher in those who underwent digital mammography plus DBT. The average reading times for digital mammography alone were 20 to 85 seconds; adding DBT added 35 to 81 seconds.19
Should you advise 3-D mammography?
The patient should be educated on the benefits of both digital mammography alone and digital mammography plus DBT. The use of digital mammography plus DBT has been supported in various studies and has been shown to increase cancer detection rates, although data are still conflicting regarding recall rates.19,20 More studies are needed to determine its effect on breast cancer morality.
Routine use of DBT in women with or without dense breast tissue has not been recommended by organizations such as the USPSTF and the American College of Obstetricians and Gynecologists.23,24 While there is an increased dose of radiation, it still falls below the US Food and Drug Administration limits and should not be the sole barrier to use.
- Cauley JA. Screening for osteoporosis. JAMA 2018; 319(24):2483–2485. doi:10.1001/jama.2018.5722
- US Preventive Services Task Force, Curry SJ, Krist AH, Owens DK, et al. Screening for osteoporosis to prevent fractures: US Preventive Services Task Force recommendation statement. JAMA 2018; 319(24):2521–2531. doi:10.1001/jama.2018.7498
- Simmons KB, Haddad LB, Nanda K, Curtis KM. Drug interactions between non-rifamycin antibiotics and hormonal contraception: a systematic review. Am J Obstet Gynecol 2018; 218(1):88–97.e14. doi:10.1016/j.ajog.2017.07.003
- Curtis KM, Tepper NK, Jatlaoui TC, et al. US Medical eligibility criteria for contraceptive use, 2016. MMWR Recomm Rep 2016; 65(3):1–103. doi:10.15585/mmwr.rr6503a1
- Taylor J, Pemberton MN. Antibiotics and oral contraceptives: new considerations for dental practice. Br Dent J 2012; 212(10):481–483. doi:10.1038/sj.bdj.2012.414
- Kuchenbaecker KB, Hopper JL, Barnes DR, et al. Risks of breast, ovarian, and contralateral breast cancer for BRCA1 and BRCA2 mutation carriers. JAMA 2017; 317(23):2402–2416. doi:10.1001/jama.2017.7112
- Faubion SS, Kuhle CL, Shuster LT, Rocca WA. Long-term health consequences of premature or early menopause and considerations for management. Climacteric 2015; 18(4):483–491. doi:10.3109/13697137.2015.1020484
- Kotsopoulos J, Gronwald J, Karlan BY, et al; Hereditary Breast Cancer Clinical Study Group. Hormone replacement therapy after oophorectomy and breast cancer risk among BRCA1 mutation carriers. JAMA Oncol 2018; 4(8):1059–1065. doi:10.1001/jamaoncol.2018.0211
- Marchetti C, De Felice F, Boccia S, et al. Hormone replacement therapy after prophylactic risk reducing salpingo-oophorectomy and breast cancer risk in BRCA1 and BRCA2 mutation carriers: a meta-analysis. Crit Rev Oncol Hematol 2018; 132:111–115. doi:10.1016/j.critrevonc.2018.09.018
- Kotsopoulos J, Huzarski T, Gronwald J, et al. Hormone replacement therapy after menopause and risk of breast cancer in BRCA1 mutation carriers: a case-control study. Breast Cancer Res Treat 2016; 155(2):365–373. doi:10.1007/s10549-016-3685-3
- Rebbeck TR, Friebel T, Wagner T, et al; PROSE Study Group. Effect of short-term hormone replacement therapy on breast cancer risk reduction after bilateral prophylactic oophorectomy in BRCA1 and BRCA2 mutation carriers: the PROSE Study Group. J Clin Oncol 2005; 23(31):7804–7810. doi:10.1200/JCO.2004.00.8151
- Johansen N, Liavaag AH, Iversen OE, Dørum A, Braaten T, Michelsen TM. Use of hormone replacement therapy after risk-reducing salpingo-oophorectomy. Acta Obstet Gynecol Scand 2017; 96(5):547–555. doi:10.1111/aogs.13120
- Mørch LS, Skovlund CW, Hannaford PC, Iversen L, Fielding S, Lidegaard Ø. Contemporary hormonal contraception and the risk of breast cancer. N Engl J Med 2017; 377(23):2228–2239. doi:10.1056/NEJMoa1700732
- Batur P, Sikka S, McNamara M. Contraception update: extended use of long acting methods, hormonal contraception risks, and over the counter access. J Womens Health (Larchmt) 2018. doi:10.1089/jwh.2018.7391. [Epub ahead of print]
- Michels KA, Pfeiffer RM, Brinton LA, Trabert B. Modification of the associations between duration of oral contraceptive use and ovarian, endometrial, breast, and colorectal cancers. JAMA Oncol 2018; 4(4):516–521. doi:10.1001/jamaoncol.2017.4942
- Iversen L, Fielding S, Lidegaard Ø, Mørch LS, Skovlund CW, Hannaford PC. Association between contemporary hormonal contraception and ovarian cancer in women of reproductive age in Denmark: prospective, nationwide cohort study. BMJ 2018; 362:k3609. doi:10.1136/bmj.k3609
- MacDorman MF, Declercq E, Cabral H, Morton C. Recent increases in the US maternal mortality rate: disentangling trends from measurement issues. Obstet Gynecol 2016; 128(3):447–455. doi:10.1097/AOG.0000000000001556
- Pattacini P, Nitrosi A, Giorgi Rossi P, et al; RETomo Working Group. Digital mammography versus digital mammography plus tomosynthesis for breast cancer screening: the Reggio Emilia tomosynthesis randomized trial. Radiology 2018; 288(2):375–385. doi:10.1148/radiol.2018172119
- Pace L, Keating NL. A systematic assessment of benefits and risks to guide breast cancer screening decisions. JAMA 2014; 311(13):1327–1335. doi:10.1001/jama.2014.1398
- Friedewald SM, Rafferty EA, Rose SL, et al. Breast cancer screening using tomosynthesis in combination with digital mammography. JAMA 2014; 311(24):2499–2507. doi:10.1001/jama.2014.6095
- Skaane P, Bandos AI, Gullien R, et al. Comparison of digital mammography alone and digital mammography plus tomosynthesis in a population-based screening program. Radiology 2013; 267(1):47–56. doi:10.1148/radiol.12121373
- Ciatto S, Houssami N, Bernardi D, et al. Integration of 3D digital mammography with tomosynthesis for population breast-cancer screening (STORM): a prospective comparison study. Lancet Oncol 2013; 14(7):583–589. doi:10.1016/S1470-2045(13)70134-7
- US Preventive Services Task Force. Final recommendation statement: breast cancer: screening. www.uspreventiveservicestaskforce.org/Page/Document/RecommendationStatementFinal/breast-cancer-screening1. Accessed May 13, 2019.
- American College of Obstetricians and Gynecologists. Breast cancer risk assessment and screening in average-risk women. www.acog.org/Clinical-Guidance-and-Publications/Practice-Bulletins/Committee-on-Practice-Bulletins-Gynecology/Breast-Cancer-Risk-Assessment-and-Screening-in-Average-Risk-Women?IsMobileSet=false#5. Accessed May 13, 2019.
KEY POINTS
- The US Preventive Services Task Force recommends screening bone density when the 10-year risk of major osteoporotic fracture is more than 8.4%.
- Women can be reassured that nonrifamycin antibiotics are unlikely to reduce efficacy of hormonal contraception.
- Hormone replacement therapy after prophylactic bilateral salpingo-oophorectomy does not increase breast cancer risk in women who carry the BRCA1 gene mutation.
- Hormonal contraception may increase the risk of breast cancer by 1 extra case per 7,690 women, although most studies suggest there is no increased risk.
- The use of digital breast tomosynthesis along with digital mammography can increase cancer detection in women with dense breast tissue, but it is not yet routinely recommended by most professional societies.

A sleeping beast: Obstructive sleep apnea and stroke
Obstructive sleep apnea (OSA) is an independent risk factor for ischemic stroke and may also, infrequently, be a consequence of stroke. It is significantly underdiagnosed in the general population and is highly prevalent in patients who have had a stroke. Many patients likely had their stroke because of this chronic untreated condition.
This review focuses on OSA and its prevalence, consequences, and treatment in patients after a stroke.
DEFINING AND QUANTIFYING OSA
OSA is the most common type of sleep-disordered breathing.1,2 It involves repeated narrowing or complete collapse of the upper airway despite ongoing respiratory effort.3,4 Apneic episodes are terminated by arousals from hypoxemia or efforts to breathe.5 In contrast, central sleep apnea is characterized by a patent airway but lack of airflow due to absent respiratory effort.5
In OSA, the number of episodes of apnea (absent airflow) and hypopnea (reduced airflow) are added together and divided by hours of sleep to calculate the apnea-hypopnea index (AHI). OSA is diagnosed by either of the following3,4:
- AHI of 5 or higher, with clinical symptoms related to OSA (described below)
- AHI of 15 or higher, regardless of symptoms.
The AHI also defines OSA severity, as follows3:
- Mild: AHI 5 to 15
- Moderate: AHI 15 to 30
- Severe: AHI greater than 30.
Diagnostic criteria (eg, definition of hypopnea, testing methods, and AHI thresholds) have varied over time, an important consideration when reviewing the literature.
OSA IS MORE COMMON THAN EXPECTED AFTER STROKE
In the most methodologically sound and generalizable study of this topic to date, the Wisconsin Sleep Cohort Study6 reported in 2013 that about 14% of men and 5% of women ages 30 to 70 have an AHI greater than 5 (using 4% desaturation to score hypopneic episodes) with daytime sleepiness. Other studies suggest that 80% to 90% of people with OSA are undiagnosed and untreated.1,7
The prevalence of OSA in patients who have had a stroke is much higher, ranging from 30% to 96% depending on the study methods and population.1,8–12 A 2010 meta-analysis11 of 29 studies reported that 72% of patients who had a stroke had an AHI greater than 5, and 29% had severe OSA. In this analysis, 7% of those with sleep-disordered breathing had central sleep apnea; still, these data indicate that the prevalence of OSA in these patients is about 5 times higher than in the general population.
RISK FACTORS MAY DIFFER IN STROKE POPULATION
Several risk factors for OSA have been identified.
Obesity is one of the strongest risk factors, with increasing body mass index (BMI) associated with increased OSA prevalence.4,6,13 However, obesity appears to be a less significant risk factor in patients who have had a stroke than in the general population. In the 2010 meta-analysis11 of OSA after stroke, the average BMI was only 26.4 kg/m2 (with obesity defined as a BMI > 30.0 kg/m2), and increasing BMI was not associated with increasing AHI.
Male sex and advanced age are also OSA risk factors.4,5 They remain significant in patients after a stroke; about 65% of poststroke patients who have OSA are men, and the older the patient, the more likely the AHI is greater than 10.11
Ethnicity and genetics may also play important roles in OSA risk, with roughly 25% of OSA prevalence estimated to have a genetic basis.14,15 Some risk factors for OSA such as craniofacial shape, upper airway anatomy, upper airway muscle dysfunction, increased respiratory chemosensitivity, and poor arousal threshold during sleep are likely determined by genetics and ethnicity.14,15 Compared with people of European origin, Asians have a similar prevalence of OSA, but at a much lower average BMI, suggesting that other factors are significant.14 Possible genetically determined anatomic risk factors have not been specifically studied in the poststroke population, but it can be assumed they remain relevant.
Several studies have tried to find an association between OSA and type, location, etiology, or pattern of stroke.10,11,16–19 Although some suggest links between cardioembolic stroke and OSA,16,20 or thrombolysis and OSA,10 most have found no association between OSA and stroke features.11,12,21,22
HOW DOES OSA INCREASE STROKE RISK?
Untreated severe OSA is associated with increased cardiovascular mortality,21,22 and OSA is an independent risk factor for incident stroke.23 A number of mechanisms may explain these relationships.
Intermittent hypoxemia and recurrent sympathetic arousals resulting from OSA are thought to lead to many of the comorbid conditions with which it is associated: hypertension, coronary artery disease, heart failure, arrhythmias, pulmonary hypertension, and stroke. Repetitive decreases in ventilation lead to oxygen desaturations that result in cycles of increased sympathetic outflow and eventual sustained nocturnal hypertension and daytime chronic hypertension.1,5,9,13 Also implicated are various changes in vasodilator and vasoconstrictor substances due to endothelial dysfunction and inflammation, which are thought to play a role in the atherogenic and prothrombotic states induced by OSA.1,5,13
Cerebral circulation is altered primarily by the changes in partial pressure of carbon dioxide (Pco2). During apnea, the Pco2 rises, causing vasodilation and increased blood flow. After the apnea resolves, there is hyperpnea with resultant decreased Pco2, and vasoconstriction. In a patient who already has vascular disease, the enhanced vasoconstriction could lead to ischemia.1,5
Changes in intrathoracic pressure result in distortion of cardiac architecture. When the patient tries to breathe against an occluded airway, the intrathoracic pressure becomes more and more negative, increasing preload and afterload. When this happens repeatedly every night for years, it leads to remodeling of the heart such as left and right ventricular hypertrophy, with reduced stroke volume, myocardial ischemia, and increased risk of arrhythmia.1,5,13
Untreated OSA is believed to predispose patients to develop atrial fibrillation through sympathetic overactivity, vascular inflammation, heart rate variability, and cardiac remodeling.24 As atrial fibrillation is a major risk factor for stroke, particularly cardioembolic stroke, it may be another pathway of increased stroke risk in OSA.16,20,25
CLINICAL MANIFESTATIONS OF OSA NOT OBVIOUS AFTER STROKE
OSA typically causes both daytime symptoms (excessive sleepiness, poor concentration, morning headache, depressive symptoms) and nighttime signs and symptoms (snoring, choking, gasping, night sweats, insomnia, nocturia, witnessed episodes of apnea).3,4,26 Unfortunately, because these are nonspecific, OSA is often underdiagnosed.4,26
Identifying OSA after a stroke may be a particular challenge, as patients often do not report classic symptoms, and the typical picture of OSA may have less predictive validity in these patients.1,27,28 Within the first 24 hours after a stroke, hypersomnia, snoring history, and age are not predictive of OSA.1 Patients found to have OSA after a stroke frequently do not have the traditional symptoms (sleepiness, snoring) seen in usual OSA patients. And they have higher rates of OSA at a younger age than the usual OSA patients, so age is not a predictive risk factor. In addition, daytime sleepiness and obesity are often absent or less prominent.1,9,27,28 Finally, typical OSA signs and symptoms may be attributed to the stroke itself or to comorbidities affecting the patient, lowering suspicion for OSA.
OSA MAY HINDER STROKE RECOVERY, WORSEN OUTCOMES
OSA, particularly when moderate to severe, is linked to pathophysiologic changes that can hinder recovery from a stroke.
Intermittent hypoxemia during sleep can worsen vascular damage of at-risk tissue: nocturnal hypoxemia correlates with white matter hyperintensities on magnetic resonance imaging, a marker of ischemic demyelination.29 Oxidative stress and release of inflammatory mediators associated with intermittent hypoxemia may impair vascular blood flow to brain tissue attempting to repair itself.30 In addition, sympathetic overactivity and Pco2 fluctuations associated with OSA may impede cerebral circulation.
Taken together, such ongoing nocturnal insults can lead to clinical consequences during this vulnerable period.
A 1996 study31 of patients recovering from a stroke found that an oxygen desaturation index (number of times that the blood oxygen level drops below a certain threshold, as measured by overnight oximetry) of more than 10 per hour was associated with worse functional recovery at discharge and at 3 and 12 months after discharge. This study also noted an association between time spent with oxygen saturations below 90% and the rate of death at 1 year.
A 2003 study32 reported that patients with an AHI greater than 10 by polysomnography spent an average of 13 days longer on the rehabilitation service and had worse functional and cognitive status on discharge, even after controlling for multiple confounders. Several subsequent studies have confirmed these and similar findings.8,33,34
OSA has also been linked to depression,35 which is common after stroke and may worsen outcomes.36 The interaction between OSA, depression, and poststroke outcomes warrants further study.
In the general population, OSA has been independently associated with increased risk of stroke or death from any cause.21,22,37 These associations have also been reported in the poststroke population: a 2014 meta-analysis found that OSA increased the risk of a repeat stroke (relative risk [RR] 1.8, 95% confidence interval [CI] 1.2–2.6) and all-cause mortality (RR 1.69, 95% CI 1.4–2.1).38
TESTING FOR OSA AFTER STROKE
Because of the high prevalence of OSA in patients who have had a stroke and the potential for worse outcomes associated with untreated OSA, there should be a low threshold for evaluating for OSA soon after stroke. Objective testing is required to qualify for therapy, and the gold standard for diagnosis of OSA is formal polysomnography conducted in a sleep laboratory.2–4 Unfortunately, polysomnography may be unacceptable to some patients, is costly, and is resource-intensive, particularly in an inpatient or rehabilitation setting.28 Ideally, to optimize testing efficiency, patients should be screened for the likelihood of OSA before polysomnography is ordered.
Questionnaires can help determine the need for further testing
Questionnaires developed to assess OSA risk39 include the following:
The Berlin questionnaire, developed in 1999, has 10 questions assessing daytime and nighttime signs and symptoms and presence of hypertension.
The STOP questionnaire, developed in 2008, assesses snoring, tiredness, observed apneic episodes, and elevated blood pressure.
The STOP-BANG questionnaire, published in 2010, includes the STOP questions plus BMI over 35 kg/m2, age over 50, neck circumference over 41 cm, and male gender.
A 2017 meta-analysis39 of 108 studies with nearly 50,000 people found that the STOP-BANG questionnaire performed best with regard to sensitivity and diagnostic odds ratio, but with poor specificity.
These screening tools and modified versions of them have also been evaluated in patients who have had a stroke.
In 2015, Boulos et al28 found that the STOP-BAG (a version of STOP-BANG that excludes neck circumference) and the 4-variable (4V) questionnaire (sex, BMI, blood pressure, snoring) had moderate predictive value for OSA within 6 months after sroke.
In 2016, Katzan et al40 found that the STOP-BAG2 (STOP-BAG criteria plus continuous variables for BMI and age) had a high sensitivity for polysomnographically diagnosed OSA within the first year after a stroke. The specificity was significantly better than the STOP-BANG or the STOP-BAG questionnaire, although it remained suboptimal at 60.5%.
In 2017, Sico et al41 developed and assessed the SLEEP Inventory (sex, left heart failure, Epworth Sleepiness Scale, enlarged neck, weight in pounds, insulin resistance or diabetes, and National Institutes of Health Stroke Scale) and found that it outperformed the Berlin and STOP-BANG questionnaires in the poststroke setting. The SLEEP Inventory had the best specificity and negative predictive value, and a slightly better ability to correctly classify patients as having OSA or not, classifying 80% of patients correctly.
These newer screening tools (eg, STOP-BAG, STOP-BAG2, SLEEP) can be used to identify with reasonable accuracy which patients need definitive testing after stroke.
Pulse oximetry is another possible screening tool
Overnight pulse oximetry may also help screen for sleep apnea and stratify risk after a stroke. A 2012 study42 of overnight oximetry to screen patients before surgery found that the oxygen desaturation index was significantly associated with the AHI measured by polysomnography. However, oximetry testing cannot distinguish between OSA and central sleep apnea, so it is insufficient to diagnose OSA or qualify patients for therapy. Further study is needed to examine the ability of overnight pulse oximetry to screen or to stratify risk for OSA after stroke.
Polysomnography vs home testing
Polysomnography is the gold standard for diagnosing OSA. Benefits include technical support and trouble-shooting, determining relationships between OSA, body position, and sleep stage, and the ability to intervene with treatment.2 However, polysomnography can be cumbersome, costly, and resource-intensive.
A home sleep apnea test, ie, an unattended, limited-channel sleep study, may be an acceptable alternative.2–4,43,44 Home testing does not require a sleep technologist to be present during testing, uses fewer sensors, and is less expensive than overnight polysomnography, but its utility can be limited: it fails to accurately discriminate between episodes of OSA and central sleep apnea, there is potential for false-negative results, and it can underestimate sleep apnea burden because it does not measure sleep.2
Institutional resources and logistics may influence the choice of diagnostic modality. No data exist on outcomes from different diagnostic testing methods in poststroke patients. Further research is needed.
POSITIVE AIRWAY PRESSURE THERAPY: BENEFITS, CHALLENGES, ALTERNATIVES
The first-line treatment for OSA is positive airway pressure (PAP).3 For most patients, this is continuous PAP (CPAP) or autoadjusting PAP (APAP). In some instances, particularly for those who cannot tolerate CPAP or who have comorbid hypoventilation, bilevel PAP (BPAP) may be indicated. More advanced PAP therapies are unlikely to be used after stroke.
PAP therapy is associated with reduced daytime sleepiness, improved mood, normalization of sleep architecture, improved systemic and pulmonary artery blood pressure, reduced rates of atrial fibrillation after ablation, and improved insulin sensitivity.45–49 Whether it reduces the risk of cardiovascular events, including stroke, remains controversial; most data suggest that it does not.50,51 However, when adherence to PAP therapy is considered rather than intention to treat, treatment has been found to lead to improved cardiovascular outcomes.52
Mixed evidence of benefits after stroke
Observational studies provide evidence that CPAP may help patients with OSA after stroke, although results are mixed.53–58 The studies ranged in size from 14 to 105 patients, enrolled patients with mostly moderate to severe OSA, and followed patients from 10 days to 7 years. Adherence to therapy was generally good in the short term (50%–70%), but only 15% to 30% of patients remained adherent at 5 to 7 years. Variable outcomes were reported, with some studies finding improved symptoms in the near term and mixed evidence of cardiovascular benefit in the longer ones. However, as these studies lacked randomization, drawing definitive conclusions on CPAP efficacy is difficult.

Patients were enrolled in the index admission or when starting a rehabilitation service—generally 2 to 3 weeks after their stroke. No clear association was found between the timing of initiating PAP therapy and outcomes. All patients had ischemic strokes, but few details were provided regarding stroke location, size, and severity. Exclusion criteria included severe underlying cardiopulmonary disease, confusion, severe stroke with marked impairment, and inability to cooperate. Almost all patients had moderate to severe OSA, and patients with central sleep apnea were excluded.
The major outcomes examined were drop-out rates, PAP adherence, and neurologic improvement based on neurologic functional scales (National Institutes of Health Stroke Scale and Canadian Neurologic Scale). As expected, dropout rates were higher in patients randomized to CPAP (OR 1.83, 95% CI 1.05–3.21, P = .03), although overall adherence was better than anticipated, with mean CPAP use across trials of 4.5 hours per night (95% CI 3.97–5.08) and with about 50% to 60% of patients adhering to therapy for at least 4 hours nightly.
Improvement in neurologic outcomes favored CPAP (standard mean difference 0.54, 95% CI 0.026–1.05), although considerable heterogeneity was seen. Improved sleepiness outcomes were inconsistent. Major cardiovascular outcomes were reported in only 2 studies (using the same data set) and showed delayed time to the next cardiovascular event for those treated with CPAP but no difference in cardiovascular event-free survival.
PAP poses more challenges after stroke
The primary limitation to PAP therapy is poor acceptance and adherence to therapy.59 High rates of refusal of therapy and difficulty complying with treatment have been noted in the poststroke population, although recent studies have reported better adherence rates. How rates of adherence play out in real-world settings, outside of the controlled environment of a research study, has yet to be determined.
In general, CPAP adherence is affected by claustrophobia, difficulty tolerating a mask, problems with pressure intolerance, irritating air leaks, nasal congestion, and naso-oral dryness. Many such barriers can be overcome with use of a properly fitted mask, an appropriate pressure setting, heated humidification, nasal sprays (eg, saline, inhaled steroids), and education, encouragement, and reassurance.
After a stroke, additional obstacles may impede the ability to use PAP therapy.68 Facial paresis (hemi- or bifacial) may make fitting of the mask problematic. Paralysis or weakness of the extremities may limit the ability to adjust or remove a mask. Aphasia can impair communication and understanding of the need to use PAP therapy, and upper-airway problems related to stroke, including dysphagia, may lead to pressure intolerance or risk of aspiration. Finally, a lack of perceived benefit, particularly if the patient does not have daytime sleepiness, may limit motivation.
Consider alternatives
For patients unlikely to succeed with PAP therapy, there are alternatives. Surgery and oral appliances are not usually realistic options in the setting of recent stroke, but positional therapy, including the use of body positioners to prevent supine sleep, as well as elevating the head of the bed, may be of some benefit.69,70 A nasopharyngeal airway stenting device (nasal trumpet) may also be tolerated by some patients.

A proposed algorithm for screening, diagnosing, and treating OSA in patients after stroke is presented in Figure 1.
- Selim B, Roux FJ. Stroke and sleep disorders. Sleep Med Clin 2012; 7(4):597–607. doi:10.1016/j.jsmc.2012.08.007
- Kapur VK, Auckley DH, Chowdhuri S, et al. Clinical practice guideline for diagnostic testing for adult obstructive sleep apnea: an American Academy of Sleep Medicine Clinical Practice Guideline. J Clin Sleep Med 2017; 13(3):479–504. doi:10.5664/jcsm.6506
- Epstein LJ, Kristo D, Strollo PJ Jr, et al; Adult Obstructive Sleep Apnea Task Force of the American Academy of Sleep Medicine. Clinical guideline for the evaluation, management, and long-term care of obstructive sleep apnea in adults. J Clin Sleep Med 2009; 5(3):263–276. pmid:19960649
- Patil SP, Schneider H, Schwartz AR, Smith PL. Adult obstructive sleep apnea: pathophysiology and diagnosis. Chest 2007; 132(1):325–337. doi:10.1378/chest.07-0040
- Dempsey JA, Veasey SC, Morgan BJ, O’Donnell CP. Pathophysiology of sleep apnea. Physiol Rev 2010; 90(1):47–112. doi:10.1152/physrev.00043.2008
- Peppard PE, Young T, Barnet JH, Palta M, Hagen EW, Hla KM. Increased prevalence of sleep-disordered breathing in adults. Am J Epidemiol 2013; 177(9):1006–1014. doi:10.1093/aje/kws342
- Redline S, Sotres-Alvarez D, Loredo J, et al. Sleep-disordered breathing in Hispanic/Latino individuals of diverse backgrounds. The Hispanic Community Health Study/Study of Latinos. Am J Resp Crit Care Med 2014; 189(3):335–344. doi:10.1164/rccm.201309-1735OC
- Aaronson JA, van Bennekom CA, Hofman WF, et al. Obstructive sleep apnea is related to impaired cognitive and functional status after stroke. Sleep 2015; 38(9):1431–1437. doi:10.5665/sleep.4984
- Sharma S, Culebras A. Sleep apnoea and stroke. Stroke Vasc Neurol 2016; 1(4):185–191. doi:10.1136/svn-2016-000038
- Huhtakangas JK, Huhtakangas J, Bloigu R, Saaresranta T. Prevalence of sleep apnea at the acute phase of ischemic stroke with or without thrombolysis. Sleep Med 2017; 40:40–46. doi:10.1016/j.sleep.2017.08.018
- Johnson KG, Johnson DC. Frequency of sleep apnea in stroke and TIA patients: a meta-analysis. J Clin Sleep Med 2010; 6(2):131–137. pmid:20411688
- Iranzo A, Santamaria J, Berenguer J, Sanchez M, Chamorro A. Prevalence and clinical importance of sleep apnea in the first night after cerebral infarction. Neurology 2002; 58:911–916. pmid:11914407
- Javaheri S, Barbe F, Campos-Rodriguez F, et al. Sleep apnea: types, mechanisms, and clinical cardiovascular consequences. J Am Coll Cardiol 2017; 69(7):841–858. doi:10.1016/j.jacc.2016.11.069
- Dudley KA, Patel SR. Disparities and genetic risk factors in obstructive sleep apnea. Sleep Med 2016; 18:96–102. doi:10.1016/j.sleep.2015.01.015
- Redline S, Tishler PV. The genetics of sleep apnea. Sleep Med Rev 2000; 4(6):583–602. doi:10.1053/smrv.2000.0120
- Lipford MC, Flemming KD, Calvin AD, et al. Associations between cardioembolic stroke and obstructive sleep apnea. Sleep 2015; 38(11):1699–1705. doi:10.5665/sleep.5146
- Wang Y, Wang Y, Chen J, Yi X, Dong S, Cao L. Stroke patterns, topography, and etiology in patients with obstructive sleep apnea hypopnea syndrome. Int J Clin Exp Med 2017; 10(4):7137–7143.
- Fisse AL, Kemmling A, Teuber A, et al. The association of lesion location and sleep related breathing disorder in patients with acute ischemic stroke. PLoS One 2017; 12(1):e0171243. doi:10.1371/journal.pone.0171243
- Brown DL, Mowla A, McDermott M, et al. Ischemic stroke subtype and presence of sleep-disordered breathing: the BASIC sleep apnea study. J Stroke Cerebrovasc Dis 2015; 24(2):388–393. doi:10.1016/j.jstrokecerebrovasdis.2014.09.007
- Poli M, Philip P, Taillard J, et al. Atrial fibrillation as a major cause of stroke in apneic patients: a prospective study. Sleep Med 2017; 30:251–254. doi:10.1016/j.sleep.2015.07.031
- Young T, Finn L, Peppard PE, et al. Sleep disordered breathing and mortality: eighteen-year follow-up of the Wisconsin Sleep Cohort. Sleep 2008; 31(8):1071–1078. pmid:18714778
- Molnar MZ, Mucsi I, Novak M, et al. Association of incident obstructive sleep apnoea with outcomes in a large cohort of US veterans. Thorax 2015; 70(9):888–895. doi:10.1136/thoraxjnl-2015-206970
- Redline S, Yenokyan G, Gottlieb DJ, et al. Obstructive sleep apnea-hypopnea and incident stroke: the sleep heart health study. Am J Respir Crit Care Med 2010; 182(2):269–277. doi:10.1164/rccm.200911-1746OC
- Marulanda-Londono E, Chaturvedi S. The interplay between obstructive sleep apnea and atrial fibrillation. Fron Neurol 2017; 8:668. doi:10.3389/fneur.2017.00668
- Szymanski FM, Filipiak KJ, Platek AE, Hrynkiewicz-Szymanska A, Karpinski G, Opolski G. Assessment of CHADS2 and CHA 2DS 2-VASc scores in obstructive sleep apnea patients with atrial fibrillation. Sleep Breath 2015; 19(2):531–537. doi:10.1007/s11325-014-1042-5
- Stansbury RC, Strollo PJ. Clinical manifestations of sleep apnea. J Thoracic Dis 2015; 7(9):E298–E310. doi:10.3978/j.issn.2072-1439.2015.09.13
- Chan W, Coutts SB, Hanly P. Sleep apnea in patients with transient ischemic attack and minor stroke: opportunity for risk reduction of recurrent stroke? Stroke 2010; 41(12):2973–2975. doi:10.1161/STROKEAHA.110.596759
- Boulos MI, Wan A, Im J, et al. Identifying obstructive sleep apnea after stroke/TIA: evaluating four simple screening tools. Sleep Med 2016; 21:133–139. doi:10.1016/j.sleep.2015.12.013
- Patel SK, Hanly PJ, Smith EE, Chan W, Coutts SB. Nocturnal hypoxemia is associated with white matter hyperintensities in patients with a minor stroke or transient ischemic attack. J Clin Sleep Med 2015; 11(12):1417–1424. doi:10.5664/jcsm.5278
- McCarty MF, DiNicolantonio JJ, O’Keefe JH. NADPH oxidase, uncoupled endothelial nitric oxide synthase, and NF-KappaB are key mediators of the pathogenic impact of obstructive sleep apnea—therapeutic implications. J Integr Cardiol 2016; 2(5):367–374. doi:10.15761/JIC.1000177
- Good DC, Henkle JQ, Gelber D, Welsh J, Verhulst S. Sleep-disordered breathing and poor functional outcome after stroke. Stroke 1996; 27(2):252–259. pmid:8571419
- Kaneko Y, Hajek VE, Zivanovic V, Raboud J, Bradley TD. Relationship of sleep apnea to functional capacity and length of hospitalization following stroke. Sleep 2003; 26(3):293–297. pmid:12749548
- Yan-fang S, Yu-ping W. Sleep-disordered breathing: impact on functional outcome of ischemic stroke patients. Sleep Med 2009; 10(7):717–719. doi:10.1016/j.sleep.2008.08.006
- Kumar R, Suri JC, Manocha R. Study of association of severity of sleep disordered breathing and functional outcome in stroke patients. Sleep Med 2017; 34:50–56. doi:10.1016/j.sleep.2017.02.025
- Kerner NA, Roose SP. Obstructive sleep apnea is linked to depression and cognitive impairment: evidence and potential mechanisms. Am J Geriatr Psychiatry 2016; 24(6):496–508. doi:10.1016/j.jagp.2016.01.134
- Bartoli F, Lillia N, Lax A, et al. Depression after stroke and risk of mortality: a systematic review and meta-analysis. Stroke Res Treat 2013; 2013:862978. doi:10.1155/2013/862978
- Yaggi HK, Concato J, Kernan WN, Lichtman JH, Brass LM, Mohsenin V. Obstructive sleep apnea as a risk factor for stroke and death. N Engl J Med 2005; 353(19):2034–2041. doi:10.1056/NEJMoa043104
- Xie W, Zheng F, Song X. Obstructive sleep apnea and serious adverse outcomes in patients with cardiovascular or cerebrovascular disease: a PRISMA-compliant systematic review and meta-analysis. Medicine (Baltimore) 2014; 93(29):e336. doi:10.1097/MD.0000000000000336
- Chiu HY, Chen PY, Chuang LP, et al. Diagnostic accuracy of the Berlin questionnaire, STOP-BANG, STOP, and Epworth sleepiness scale in detecting obstructive sleep apnea: a bivariate meta-analysis. Sleep Med Rev 2017; 36:57–70. doi:10.1016/j.smrv.2016.10.004
- Katzan IL, Thompson NR, Uchino K, Foldvary-Schaefer N. A screening tool for obstructive sleep apnea in cerebrovascular patients. Sleep Med 2016; 21:70–76. doi:10.1016/j.sleep.2016.02.001
- Sico JJ, Yaggi HK, Ofner S, et al. Development, validation, and assessment of an ischemic stroke or transient ischemic attack-specific prediction tool for obstructive sleep apnea. J Stroke Cerebrovasc Dis 2017; 26(8):1745–1754. doi:10.1016/j.jstrokecerebrovasdis.2017.03.042
- Chung F, Liao P, Elsaid H, Islam S, Shapiro CM, Sun Y. Oxygen desaturation index from nocturnal oximetry: a sensitive and specific tool to detect sleep-disordered breathing in surgical patients. Anesth Analg 2012; 114(5):993–1000. doi:10.1213/ANE.0b013e318248f4f5
- Boulos MI, Elias S, Wan A, et al. Unattended hospital and home sleep apnea testing following cerebrovascular events. J Stroke Cerebrovasc Dis 2017; 26(1):143–149. doi:10.1016/j.jstrokecerebrovasdis.2016.09.001
- Saletu MT, Kotzian ST, Schwarzinger A, Haider S, Spatt J, Saletu B. Home sleep apnea testing is a feasible and accurate method to diagnose obstructive sleep apnea in stroke patients during in-hospital rehabilitation. J Clin Sleep Med 2018; 14(9):1495–1501. doi:10.5664/jcsm.7322
- Giles TL, Lasserson TJ, Smith BH, White J, Wright J, Cates CJ. Continuous positive airways pressure for obstructive sleep apnoea in adults. Cochrane Database Syst Rev 2006; (3):CD001106. doi:10.1002/14651858.CD001106.pub3
- Fatureto-Borges F, Lorenzi-Filho G, Drager LF. Effectiveness of continuous positive airway pressure in lowering blood pressure in patients with obstructive sleep apnea: a critical review of the literature. Integr Blood Press Control 2016; 9:43–47. doi:10.2147/IBPC.S70402
- Imran TF, Gharzipura M, Liu S, et al. Effect of continuous positive airway pressure treatment on pulmonary artery pressure in patients with isolated obstructive sleep apnea: a meta-analysis. Heart Fail Rev 2016; 21(5):591–598. doi:10.1007/s10741-016-9548-5
- Deng F, Raza A, Guo J. Treating obstructive sleep apnea with continuous positive airway pressure reduces risk of recurrent atrial fibrillation after catheter ablation: a meta-analysis. Sleep Med 2018; 46:5–11. doi:10.1016/j.sleep.2018.02.013
- Seetho IW, Wilding JPH. Sleep-disordered breathing, type 2 diabetes, and the metabolic syndrome. Chronic Resp Dis 2014; 11(4):257–275. doi:10.1177/1479972314552806
- Kim Y, Koo YS, Lee HY, Lee SY. Can continuous positive airway pressure reduce the risk of stroke in obstructive sleep apnea patients? A systematic review and meta-analysis. PloS ONE 2016; 11(1):e0146317. doi:10.1371/journal.pone.0146317
- Yu J, Zhou Z, McEvoy RD, et al. Association of positive airway pressure with cardiovascular events and death in adults with sleep apnea: a systematic review and meta-analysis. JAMA 2017; 318(2):156–166. doi:10.1001/jama.2017.7967
- Peker Y, Glantz H, Eulenburg C, Wegscheider K, Herlitz J, Thunström E. Effect of positive airway pressure on cardiovascular outcomes in coronary artery disease patients with nonsleepy obstructive sleep apnea. The RICCADSA randomized controlled trial. Am J Respir Crit Care Med 2016; 194(5):613–620. doi:10.1164/rccm.201601-0088OC
- Martinez-Garcia MA, Soler-Cataluna JJ, Ejarque-Martinez L, et al. Continuous positive airway pressure treatment reduces mortality in patients with ischemic stroke and obstructive sleep apnea: a 5-year follow-up study. Am J Respir Crit Care Med 2009; 180(1):36–41. doi:10.1164/rccm.200808-1341OC
- Broadley SA, Jorgensen L, Cheek A, et al. Early investigation and treatment of obstructive sleep apnoea after acute stroke. J Clin Neurosci 2007; 14(4):328–333. doi:10.1016/j.jocn.2006.01.017
- Wessendorf TE, Wang YM, Thilmann AF, Sorgenfrei U, Konietzko N, Teschler H. Treatment of obstructive sleep apnoea with nasal continuous positive airway pressure in stroke. Eur Respir J 2001; 18(4):623–629. pmid:11716165
- Bassetti CL, Milanova M, Gugger M. Sleep-disordered breathing and acute ischemic stroke: diagnosis, risk factors, treatment, evolution, and long-term clinical outcome. Stroke 2006; 37(4):967–972. doi:10.1161/01.STR.0000208215.49243.c3
- Palombini L, Guilleminault C. Stroke and treatment with nasal CPAP. Eur J Neurol 2006; 13(2):198–200. doi:10.1111/j.1468-1331.2006.01169.x
- Martínez-García MA, Campos-Rodríguez F, Soler-Cataluña JJ, Catalán-Serra P, Román-Sánchez P, Montserrat JM. Increased incidence of nonfatal cardiovascular events in stroke patients with sleep apnoea: effect of CPAP treatment. Eur Respir J 2012; 39(4):906–912. doi:10.1183/09031936.00011311
- Brill AK, Horvath T, Seiler A, et al. CPAP as treatment of sleep apnea after stroke: a meta-analysis of randomized trials. Neurology 2018; 90(14):e1222–e1230. doi:10.1212/WNL.0000000000005262
- Hsu C, Vennelle M, Li H, Engleman HM, Dennis MS, Douglas NJ. Sleep-disordered breathing after stroke: a randomised controlled trial of continuous positive airway pressure. J Neurol Neurosurg Psychiatry 2006; 77(10):1143–1149. doi:10.1136/jnnp.2005.086686
- Parra O, Sanchez-Armengol A, Bonnin M, et al. Early treatment of obstructive apnoea and stroke outcome: a randomised controlled trial. Eur Resp J 2011; 37(5):1128–1136. doi:10.1183/09031936.00034410
- Ryan CM, Bayley M, Green R, Murray BJ, Bradley TD. Influence of continuous positive airway pressure on outcomes of rehabilitation in stroke patients with obstructive sleep apnea. Stroke 2011; 42(4):1062–1067. doi:10.1161/STROKEAHA.110.597468
- Bravata DM, Concato J, Fried T, et al. Continuous positive airway pressure: evaluation of a novel therapy for patients with acute ischemic stroke. Sleep 2011; 34(9):1271–1277. doi:10.5665/SLEEP.1254
- Parra O, Sanchez-Armengol A, Capote F, et al. Efficacy of continuous positive airway pressure treatment on 5-year survival in patients with ischaemic stroke and obstructive sleep apnea: a randomized controlled trial. J Sleep Res 2015; 24(1):47–53. doi:10.1111/jsr.12181
- Khot SP, Davis AP, Crane DA, et al. Effect of continuous positive airway pressure on stroke rehabilitation: a pilot randomized sham-controlled trial. J Clin Sleep Med 2016; 12(7):1019–1026. doi:10.5664/jcsm.5940
- Aaronson JA, Hofman WF, van Bennekom CA, et al. Effects of continuous positive airway pressure on cognitive and functional outcome of stroke patients with obstructive sleep apnea: a randomized controlled trial. J Clin Sleep Med 2016; 12(4):533–541. doi:10.5664/jcsm.5684
- Gupta A, Shukla G, Afsar M, et al. Role of positive airway pressure therapy for obstructive sleep apnea in patients with stroke: a randomized controlled trial. J Clin Sleep Med 2018; 14(4):511–521. doi:10.5664/jcsm.7034
- Mello-Fujita L, Kim LJ, Palombini Lde O, et al. Treatment of obstructive sleep apnea syndrome associated with stroke. Sleep Med 2015; 16(6):691–696. doi:10.1016/j.sleep.2014.12.017
- Svatikova A, Chervin RD, Wing JJ, Sanchez BN, Migda EM, Brown DL. Positional therapy in ischemic stroke patients with obstructive sleep apnea. Sleep Med 2011; 12(3):262–266. doi:10.1016/j.sleep.2010.12.008
- Souza FJ, Genta PR, de Souza Filho AJ, Wellman A, Lorenzi-Filho G. The influence of head-of-bed elevation in patients with obstructive sleep apnea. Sleep Breath 2017; 21(4):815–820. doi:10.1007/s11325-017-1524-3
Obstructive sleep apnea (OSA) is an independent risk factor for ischemic stroke and may also, infrequently, be a consequence of stroke. It is significantly underdiagnosed in the general population and is highly prevalent in patients who have had a stroke. Many patients likely had their stroke because of this chronic untreated condition.
This review focuses on OSA and its prevalence, consequences, and treatment in patients after a stroke.
DEFINING AND QUANTIFYING OSA
OSA is the most common type of sleep-disordered breathing.1,2 It involves repeated narrowing or complete collapse of the upper airway despite ongoing respiratory effort.3,4 Apneic episodes are terminated by arousals from hypoxemia or efforts to breathe.5 In contrast, central sleep apnea is characterized by a patent airway but lack of airflow due to absent respiratory effort.5
In OSA, the number of episodes of apnea (absent airflow) and hypopnea (reduced airflow) are added together and divided by hours of sleep to calculate the apnea-hypopnea index (AHI). OSA is diagnosed by either of the following3,4:
- AHI of 5 or higher, with clinical symptoms related to OSA (described below)
- AHI of 15 or higher, regardless of symptoms.
The AHI also defines OSA severity, as follows3:
- Mild: AHI 5 to 15
- Moderate: AHI 15 to 30
- Severe: AHI greater than 30.
Diagnostic criteria (eg, definition of hypopnea, testing methods, and AHI thresholds) have varied over time, an important consideration when reviewing the literature.
OSA IS MORE COMMON THAN EXPECTED AFTER STROKE
In the most methodologically sound and generalizable study of this topic to date, the Wisconsin Sleep Cohort Study6 reported in 2013 that about 14% of men and 5% of women ages 30 to 70 have an AHI greater than 5 (using 4% desaturation to score hypopneic episodes) with daytime sleepiness. Other studies suggest that 80% to 90% of people with OSA are undiagnosed and untreated.1,7
The prevalence of OSA in patients who have had a stroke is much higher, ranging from 30% to 96% depending on the study methods and population.1,8–12 A 2010 meta-analysis11 of 29 studies reported that 72% of patients who had a stroke had an AHI greater than 5, and 29% had severe OSA. In this analysis, 7% of those with sleep-disordered breathing had central sleep apnea; still, these data indicate that the prevalence of OSA in these patients is about 5 times higher than in the general population.
RISK FACTORS MAY DIFFER IN STROKE POPULATION
Several risk factors for OSA have been identified.
Obesity is one of the strongest risk factors, with increasing body mass index (BMI) associated with increased OSA prevalence.4,6,13 However, obesity appears to be a less significant risk factor in patients who have had a stroke than in the general population. In the 2010 meta-analysis11 of OSA after stroke, the average BMI was only 26.4 kg/m2 (with obesity defined as a BMI > 30.0 kg/m2), and increasing BMI was not associated with increasing AHI.
Male sex and advanced age are also OSA risk factors.4,5 They remain significant in patients after a stroke; about 65% of poststroke patients who have OSA are men, and the older the patient, the more likely the AHI is greater than 10.11
Ethnicity and genetics may also play important roles in OSA risk, with roughly 25% of OSA prevalence estimated to have a genetic basis.14,15 Some risk factors for OSA such as craniofacial shape, upper airway anatomy, upper airway muscle dysfunction, increased respiratory chemosensitivity, and poor arousal threshold during sleep are likely determined by genetics and ethnicity.14,15 Compared with people of European origin, Asians have a similar prevalence of OSA, but at a much lower average BMI, suggesting that other factors are significant.14 Possible genetically determined anatomic risk factors have not been specifically studied in the poststroke population, but it can be assumed they remain relevant.
Several studies have tried to find an association between OSA and type, location, etiology, or pattern of stroke.10,11,16–19 Although some suggest links between cardioembolic stroke and OSA,16,20 or thrombolysis and OSA,10 most have found no association between OSA and stroke features.11,12,21,22
HOW DOES OSA INCREASE STROKE RISK?
Untreated severe OSA is associated with increased cardiovascular mortality,21,22 and OSA is an independent risk factor for incident stroke.23 A number of mechanisms may explain these relationships.
Intermittent hypoxemia and recurrent sympathetic arousals resulting from OSA are thought to lead to many of the comorbid conditions with which it is associated: hypertension, coronary artery disease, heart failure, arrhythmias, pulmonary hypertension, and stroke. Repetitive decreases in ventilation lead to oxygen desaturations that result in cycles of increased sympathetic outflow and eventual sustained nocturnal hypertension and daytime chronic hypertension.1,5,9,13 Also implicated are various changes in vasodilator and vasoconstrictor substances due to endothelial dysfunction and inflammation, which are thought to play a role in the atherogenic and prothrombotic states induced by OSA.1,5,13
Cerebral circulation is altered primarily by the changes in partial pressure of carbon dioxide (Pco2). During apnea, the Pco2 rises, causing vasodilation and increased blood flow. After the apnea resolves, there is hyperpnea with resultant decreased Pco2, and vasoconstriction. In a patient who already has vascular disease, the enhanced vasoconstriction could lead to ischemia.1,5
Changes in intrathoracic pressure result in distortion of cardiac architecture. When the patient tries to breathe against an occluded airway, the intrathoracic pressure becomes more and more negative, increasing preload and afterload. When this happens repeatedly every night for years, it leads to remodeling of the heart such as left and right ventricular hypertrophy, with reduced stroke volume, myocardial ischemia, and increased risk of arrhythmia.1,5,13
Untreated OSA is believed to predispose patients to develop atrial fibrillation through sympathetic overactivity, vascular inflammation, heart rate variability, and cardiac remodeling.24 As atrial fibrillation is a major risk factor for stroke, particularly cardioembolic stroke, it may be another pathway of increased stroke risk in OSA.16,20,25
CLINICAL MANIFESTATIONS OF OSA NOT OBVIOUS AFTER STROKE
OSA typically causes both daytime symptoms (excessive sleepiness, poor concentration, morning headache, depressive symptoms) and nighttime signs and symptoms (snoring, choking, gasping, night sweats, insomnia, nocturia, witnessed episodes of apnea).3,4,26 Unfortunately, because these are nonspecific, OSA is often underdiagnosed.4,26
Identifying OSA after a stroke may be a particular challenge, as patients often do not report classic symptoms, and the typical picture of OSA may have less predictive validity in these patients.1,27,28 Within the first 24 hours after a stroke, hypersomnia, snoring history, and age are not predictive of OSA.1 Patients found to have OSA after a stroke frequently do not have the traditional symptoms (sleepiness, snoring) seen in usual OSA patients. And they have higher rates of OSA at a younger age than the usual OSA patients, so age is not a predictive risk factor. In addition, daytime sleepiness and obesity are often absent or less prominent.1,9,27,28 Finally, typical OSA signs and symptoms may be attributed to the stroke itself or to comorbidities affecting the patient, lowering suspicion for OSA.
OSA MAY HINDER STROKE RECOVERY, WORSEN OUTCOMES
OSA, particularly when moderate to severe, is linked to pathophysiologic changes that can hinder recovery from a stroke.
Intermittent hypoxemia during sleep can worsen vascular damage of at-risk tissue: nocturnal hypoxemia correlates with white matter hyperintensities on magnetic resonance imaging, a marker of ischemic demyelination.29 Oxidative stress and release of inflammatory mediators associated with intermittent hypoxemia may impair vascular blood flow to brain tissue attempting to repair itself.30 In addition, sympathetic overactivity and Pco2 fluctuations associated with OSA may impede cerebral circulation.
Taken together, such ongoing nocturnal insults can lead to clinical consequences during this vulnerable period.
A 1996 study31 of patients recovering from a stroke found that an oxygen desaturation index (number of times that the blood oxygen level drops below a certain threshold, as measured by overnight oximetry) of more than 10 per hour was associated with worse functional recovery at discharge and at 3 and 12 months after discharge. This study also noted an association between time spent with oxygen saturations below 90% and the rate of death at 1 year.
A 2003 study32 reported that patients with an AHI greater than 10 by polysomnography spent an average of 13 days longer on the rehabilitation service and had worse functional and cognitive status on discharge, even after controlling for multiple confounders. Several subsequent studies have confirmed these and similar findings.8,33,34
OSA has also been linked to depression,35 which is common after stroke and may worsen outcomes.36 The interaction between OSA, depression, and poststroke outcomes warrants further study.
In the general population, OSA has been independently associated with increased risk of stroke or death from any cause.21,22,37 These associations have also been reported in the poststroke population: a 2014 meta-analysis found that OSA increased the risk of a repeat stroke (relative risk [RR] 1.8, 95% confidence interval [CI] 1.2–2.6) and all-cause mortality (RR 1.69, 95% CI 1.4–2.1).38
TESTING FOR OSA AFTER STROKE
Because of the high prevalence of OSA in patients who have had a stroke and the potential for worse outcomes associated with untreated OSA, there should be a low threshold for evaluating for OSA soon after stroke. Objective testing is required to qualify for therapy, and the gold standard for diagnosis of OSA is formal polysomnography conducted in a sleep laboratory.2–4 Unfortunately, polysomnography may be unacceptable to some patients, is costly, and is resource-intensive, particularly in an inpatient or rehabilitation setting.28 Ideally, to optimize testing efficiency, patients should be screened for the likelihood of OSA before polysomnography is ordered.
Questionnaires can help determine the need for further testing
Questionnaires developed to assess OSA risk39 include the following:
The Berlin questionnaire, developed in 1999, has 10 questions assessing daytime and nighttime signs and symptoms and presence of hypertension.
The STOP questionnaire, developed in 2008, assesses snoring, tiredness, observed apneic episodes, and elevated blood pressure.
The STOP-BANG questionnaire, published in 2010, includes the STOP questions plus BMI over 35 kg/m2, age over 50, neck circumference over 41 cm, and male gender.
A 2017 meta-analysis39 of 108 studies with nearly 50,000 people found that the STOP-BANG questionnaire performed best with regard to sensitivity and diagnostic odds ratio, but with poor specificity.
These screening tools and modified versions of them have also been evaluated in patients who have had a stroke.
In 2015, Boulos et al28 found that the STOP-BAG (a version of STOP-BANG that excludes neck circumference) and the 4-variable (4V) questionnaire (sex, BMI, blood pressure, snoring) had moderate predictive value for OSA within 6 months after sroke.
In 2016, Katzan et al40 found that the STOP-BAG2 (STOP-BAG criteria plus continuous variables for BMI and age) had a high sensitivity for polysomnographically diagnosed OSA within the first year after a stroke. The specificity was significantly better than the STOP-BANG or the STOP-BAG questionnaire, although it remained suboptimal at 60.5%.
In 2017, Sico et al41 developed and assessed the SLEEP Inventory (sex, left heart failure, Epworth Sleepiness Scale, enlarged neck, weight in pounds, insulin resistance or diabetes, and National Institutes of Health Stroke Scale) and found that it outperformed the Berlin and STOP-BANG questionnaires in the poststroke setting. The SLEEP Inventory had the best specificity and negative predictive value, and a slightly better ability to correctly classify patients as having OSA or not, classifying 80% of patients correctly.
These newer screening tools (eg, STOP-BAG, STOP-BAG2, SLEEP) can be used to identify with reasonable accuracy which patients need definitive testing after stroke.
Pulse oximetry is another possible screening tool
Overnight pulse oximetry may also help screen for sleep apnea and stratify risk after a stroke. A 2012 study42 of overnight oximetry to screen patients before surgery found that the oxygen desaturation index was significantly associated with the AHI measured by polysomnography. However, oximetry testing cannot distinguish between OSA and central sleep apnea, so it is insufficient to diagnose OSA or qualify patients for therapy. Further study is needed to examine the ability of overnight pulse oximetry to screen or to stratify risk for OSA after stroke.
Polysomnography vs home testing
Polysomnography is the gold standard for diagnosing OSA. Benefits include technical support and trouble-shooting, determining relationships between OSA, body position, and sleep stage, and the ability to intervene with treatment.2 However, polysomnography can be cumbersome, costly, and resource-intensive.
A home sleep apnea test, ie, an unattended, limited-channel sleep study, may be an acceptable alternative.2–4,43,44 Home testing does not require a sleep technologist to be present during testing, uses fewer sensors, and is less expensive than overnight polysomnography, but its utility can be limited: it fails to accurately discriminate between episodes of OSA and central sleep apnea, there is potential for false-negative results, and it can underestimate sleep apnea burden because it does not measure sleep.2
Institutional resources and logistics may influence the choice of diagnostic modality. No data exist on outcomes from different diagnostic testing methods in poststroke patients. Further research is needed.
POSITIVE AIRWAY PRESSURE THERAPY: BENEFITS, CHALLENGES, ALTERNATIVES
The first-line treatment for OSA is positive airway pressure (PAP).3 For most patients, this is continuous PAP (CPAP) or autoadjusting PAP (APAP). In some instances, particularly for those who cannot tolerate CPAP or who have comorbid hypoventilation, bilevel PAP (BPAP) may be indicated. More advanced PAP therapies are unlikely to be used after stroke.
PAP therapy is associated with reduced daytime sleepiness, improved mood, normalization of sleep architecture, improved systemic and pulmonary artery blood pressure, reduced rates of atrial fibrillation after ablation, and improved insulin sensitivity.45–49 Whether it reduces the risk of cardiovascular events, including stroke, remains controversial; most data suggest that it does not.50,51 However, when adherence to PAP therapy is considered rather than intention to treat, treatment has been found to lead to improved cardiovascular outcomes.52
Mixed evidence of benefits after stroke
Observational studies provide evidence that CPAP may help patients with OSA after stroke, although results are mixed.53–58 The studies ranged in size from 14 to 105 patients, enrolled patients with mostly moderate to severe OSA, and followed patients from 10 days to 7 years. Adherence to therapy was generally good in the short term (50%–70%), but only 15% to 30% of patients remained adherent at 5 to 7 years. Variable outcomes were reported, with some studies finding improved symptoms in the near term and mixed evidence of cardiovascular benefit in the longer ones. However, as these studies lacked randomization, drawing definitive conclusions on CPAP efficacy is difficult.
Patients were enrolled in the index admission or when starting a rehabilitation service—generally 2 to 3 weeks after their stroke. No clear association was found between the timing of initiating PAP therapy and outcomes. All patients had ischemic strokes, but few details were provided regarding stroke location, size, and severity. Exclusion criteria included severe underlying cardiopulmonary disease, confusion, severe stroke with marked impairment, and inability to cooperate. Almost all patients had moderate to severe OSA, and patients with central sleep apnea were excluded.
The major outcomes examined were drop-out rates, PAP adherence, and neurologic improvement based on neurologic functional scales (National Institutes of Health Stroke Scale and Canadian Neurologic Scale). As expected, dropout rates were higher in patients randomized to CPAP (OR 1.83, 95% CI 1.05–3.21, P = .03), although overall adherence was better than anticipated, with mean CPAP use across trials of 4.5 hours per night (95% CI 3.97–5.08) and with about 50% to 60% of patients adhering to therapy for at least 4 hours nightly.
Improvement in neurologic outcomes favored CPAP (standard mean difference 0.54, 95% CI 0.026–1.05), although considerable heterogeneity was seen. Improved sleepiness outcomes were inconsistent. Major cardiovascular outcomes were reported in only 2 studies (using the same data set) and showed delayed time to the next cardiovascular event for those treated with CPAP but no difference in cardiovascular event-free survival.
PAP poses more challenges after stroke
The primary limitation to PAP therapy is poor acceptance and adherence to therapy.59 High rates of refusal of therapy and difficulty complying with treatment have been noted in the poststroke population, although recent studies have reported better adherence rates. How rates of adherence play out in real-world settings, outside of the controlled environment of a research study, has yet to be determined.
In general, CPAP adherence is affected by claustrophobia, difficulty tolerating a mask, problems with pressure intolerance, irritating air leaks, nasal congestion, and naso-oral dryness. Many such barriers can be overcome with use of a properly fitted mask, an appropriate pressure setting, heated humidification, nasal sprays (eg, saline, inhaled steroids), and education, encouragement, and reassurance.
After a stroke, additional obstacles may impede the ability to use PAP therapy.68 Facial paresis (hemi- or bifacial) may make fitting of the mask problematic. Paralysis or weakness of the extremities may limit the ability to adjust or remove a mask. Aphasia can impair communication and understanding of the need to use PAP therapy, and upper-airway problems related to stroke, including dysphagia, may lead to pressure intolerance or risk of aspiration. Finally, a lack of perceived benefit, particularly if the patient does not have daytime sleepiness, may limit motivation.
Consider alternatives
For patients unlikely to succeed with PAP therapy, there are alternatives. Surgery and oral appliances are not usually realistic options in the setting of recent stroke, but positional therapy, including the use of body positioners to prevent supine sleep, as well as elevating the head of the bed, may be of some benefit.69,70 A nasopharyngeal airway stenting device (nasal trumpet) may also be tolerated by some patients.
A proposed algorithm for screening, diagnosing, and treating OSA in patients after stroke is presented in Figure 1.
- Selim B, Roux FJ. Stroke and sleep disorders. Sleep Med Clin 2012; 7(4):597–607. doi:10.1016/j.jsmc.2012.08.007
- Kapur VK, Auckley DH, Chowdhuri S, et al. Clinical practice guideline for diagnostic testing for adult obstructive sleep apnea: an American Academy of Sleep Medicine Clinical Practice Guideline. J Clin Sleep Med 2017; 13(3):479–504. doi:10.5664/jcsm.6506
- Epstein LJ, Kristo D, Strollo PJ Jr, et al; Adult Obstructive Sleep Apnea Task Force of the American Academy of Sleep Medicine. Clinical guideline for the evaluation, management, and long-term care of obstructive sleep apnea in adults. J Clin Sleep Med 2009; 5(3):263–276. pmid:19960649
- Patil SP, Schneider H, Schwartz AR, Smith PL. Adult obstructive sleep apnea: pathophysiology and diagnosis. Chest 2007; 132(1):325–337. doi:10.1378/chest.07-0040
- Dempsey JA, Veasey SC, Morgan BJ, O’Donnell CP. Pathophysiology of sleep apnea. Physiol Rev 2010; 90(1):47–112. doi:10.1152/physrev.00043.2008
- Peppard PE, Young T, Barnet JH, Palta M, Hagen EW, Hla KM. Increased prevalence of sleep-disordered breathing in adults. Am J Epidemiol 2013; 177(9):1006–1014. doi:10.1093/aje/kws342
- Redline S, Sotres-Alvarez D, Loredo J, et al. Sleep-disordered breathing in Hispanic/Latino individuals of diverse backgrounds. The Hispanic Community Health Study/Study of Latinos. Am J Resp Crit Care Med 2014; 189(3):335–344. doi:10.1164/rccm.201309-1735OC
- Aaronson JA, van Bennekom CA, Hofman WF, et al. Obstructive sleep apnea is related to impaired cognitive and functional status after stroke. Sleep 2015; 38(9):1431–1437. doi:10.5665/sleep.4984
- Sharma S, Culebras A. Sleep apnoea and stroke. Stroke Vasc Neurol 2016; 1(4):185–191. doi:10.1136/svn-2016-000038
- Huhtakangas JK, Huhtakangas J, Bloigu R, Saaresranta T. Prevalence of sleep apnea at the acute phase of ischemic stroke with or without thrombolysis. Sleep Med 2017; 40:40–46. doi:10.1016/j.sleep.2017.08.018
- Johnson KG, Johnson DC. Frequency of sleep apnea in stroke and TIA patients: a meta-analysis. J Clin Sleep Med 2010; 6(2):131–137. pmid:20411688
- Iranzo A, Santamaria J, Berenguer J, Sanchez M, Chamorro A. Prevalence and clinical importance of sleep apnea in the first night after cerebral infarction. Neurology 2002; 58:911–916. pmid:11914407
- Javaheri S, Barbe F, Campos-Rodriguez F, et al. Sleep apnea: types, mechanisms, and clinical cardiovascular consequences. J Am Coll Cardiol 2017; 69(7):841–858. doi:10.1016/j.jacc.2016.11.069
- Dudley KA, Patel SR. Disparities and genetic risk factors in obstructive sleep apnea. Sleep Med 2016; 18:96–102. doi:10.1016/j.sleep.2015.01.015
- Redline S, Tishler PV. The genetics of sleep apnea. Sleep Med Rev 2000; 4(6):583–602. doi:10.1053/smrv.2000.0120
- Lipford MC, Flemming KD, Calvin AD, et al. Associations between cardioembolic stroke and obstructive sleep apnea. Sleep 2015; 38(11):1699–1705. doi:10.5665/sleep.5146
- Wang Y, Wang Y, Chen J, Yi X, Dong S, Cao L. Stroke patterns, topography, and etiology in patients with obstructive sleep apnea hypopnea syndrome. Int J Clin Exp Med 2017; 10(4):7137–7143.
- Fisse AL, Kemmling A, Teuber A, et al. The association of lesion location and sleep related breathing disorder in patients with acute ischemic stroke. PLoS One 2017; 12(1):e0171243. doi:10.1371/journal.pone.0171243
- Brown DL, Mowla A, McDermott M, et al. Ischemic stroke subtype and presence of sleep-disordered breathing: the BASIC sleep apnea study. J Stroke Cerebrovasc Dis 2015; 24(2):388–393. doi:10.1016/j.jstrokecerebrovasdis.2014.09.007
- Poli M, Philip P, Taillard J, et al. Atrial fibrillation as a major cause of stroke in apneic patients: a prospective study. Sleep Med 2017; 30:251–254. doi:10.1016/j.sleep.2015.07.031
- Young T, Finn L, Peppard PE, et al. Sleep disordered breathing and mortality: eighteen-year follow-up of the Wisconsin Sleep Cohort. Sleep 2008; 31(8):1071–1078. pmid:18714778
- Molnar MZ, Mucsi I, Novak M, et al. Association of incident obstructive sleep apnoea with outcomes in a large cohort of US veterans. Thorax 2015; 70(9):888–895. doi:10.1136/thoraxjnl-2015-206970
- Redline S, Yenokyan G, Gottlieb DJ, et al. Obstructive sleep apnea-hypopnea and incident stroke: the sleep heart health study. Am J Respir Crit Care Med 2010; 182(2):269–277. doi:10.1164/rccm.200911-1746OC
- Marulanda-Londono E, Chaturvedi S. The interplay between obstructive sleep apnea and atrial fibrillation. Fron Neurol 2017; 8:668. doi:10.3389/fneur.2017.00668
- Szymanski FM, Filipiak KJ, Platek AE, Hrynkiewicz-Szymanska A, Karpinski G, Opolski G. Assessment of CHADS2 and CHA 2DS 2-VASc scores in obstructive sleep apnea patients with atrial fibrillation. Sleep Breath 2015; 19(2):531–537. doi:10.1007/s11325-014-1042-5
- Stansbury RC, Strollo PJ. Clinical manifestations of sleep apnea. J Thoracic Dis 2015; 7(9):E298–E310. doi:10.3978/j.issn.2072-1439.2015.09.13
- Chan W, Coutts SB, Hanly P. Sleep apnea in patients with transient ischemic attack and minor stroke: opportunity for risk reduction of recurrent stroke? Stroke 2010; 41(12):2973–2975. doi:10.1161/STROKEAHA.110.596759
- Boulos MI, Wan A, Im J, et al. Identifying obstructive sleep apnea after stroke/TIA: evaluating four simple screening tools. Sleep Med 2016; 21:133–139. doi:10.1016/j.sleep.2015.12.013
- Patel SK, Hanly PJ, Smith EE, Chan W, Coutts SB. Nocturnal hypoxemia is associated with white matter hyperintensities in patients with a minor stroke or transient ischemic attack. J Clin Sleep Med 2015; 11(12):1417–1424. doi:10.5664/jcsm.5278
- McCarty MF, DiNicolantonio JJ, O’Keefe JH. NADPH oxidase, uncoupled endothelial nitric oxide synthase, and NF-KappaB are key mediators of the pathogenic impact of obstructive sleep apnea—therapeutic implications. J Integr Cardiol 2016; 2(5):367–374. doi:10.15761/JIC.1000177
- Good DC, Henkle JQ, Gelber D, Welsh J, Verhulst S. Sleep-disordered breathing and poor functional outcome after stroke. Stroke 1996; 27(2):252–259. pmid:8571419
- Kaneko Y, Hajek VE, Zivanovic V, Raboud J, Bradley TD. Relationship of sleep apnea to functional capacity and length of hospitalization following stroke. Sleep 2003; 26(3):293–297. pmid:12749548
- Yan-fang S, Yu-ping W. Sleep-disordered breathing: impact on functional outcome of ischemic stroke patients. Sleep Med 2009; 10(7):717–719. doi:10.1016/j.sleep.2008.08.006
- Kumar R, Suri JC, Manocha R. Study of association of severity of sleep disordered breathing and functional outcome in stroke patients. Sleep Med 2017; 34:50–56. doi:10.1016/j.sleep.2017.02.025
- Kerner NA, Roose SP. Obstructive sleep apnea is linked to depression and cognitive impairment: evidence and potential mechanisms. Am J Geriatr Psychiatry 2016; 24(6):496–508. doi:10.1016/j.jagp.2016.01.134
- Bartoli F, Lillia N, Lax A, et al. Depression after stroke and risk of mortality: a systematic review and meta-analysis. Stroke Res Treat 2013; 2013:862978. doi:10.1155/2013/862978
- Yaggi HK, Concato J, Kernan WN, Lichtman JH, Brass LM, Mohsenin V. Obstructive sleep apnea as a risk factor for stroke and death. N Engl J Med 2005; 353(19):2034–2041. doi:10.1056/NEJMoa043104
- Xie W, Zheng F, Song X. Obstructive sleep apnea and serious adverse outcomes in patients with cardiovascular or cerebrovascular disease: a PRISMA-compliant systematic review and meta-analysis. Medicine (Baltimore) 2014; 93(29):e336. doi:10.1097/MD.0000000000000336
- Chiu HY, Chen PY, Chuang LP, et al. Diagnostic accuracy of the Berlin questionnaire, STOP-BANG, STOP, and Epworth sleepiness scale in detecting obstructive sleep apnea: a bivariate meta-analysis. Sleep Med Rev 2017; 36:57–70. doi:10.1016/j.smrv.2016.10.004
- Katzan IL, Thompson NR, Uchino K, Foldvary-Schaefer N. A screening tool for obstructive sleep apnea in cerebrovascular patients. Sleep Med 2016; 21:70–76. doi:10.1016/j.sleep.2016.02.001
- Sico JJ, Yaggi HK, Ofner S, et al. Development, validation, and assessment of an ischemic stroke or transient ischemic attack-specific prediction tool for obstructive sleep apnea. J Stroke Cerebrovasc Dis 2017; 26(8):1745–1754. doi:10.1016/j.jstrokecerebrovasdis.2017.03.042
- Chung F, Liao P, Elsaid H, Islam S, Shapiro CM, Sun Y. Oxygen desaturation index from nocturnal oximetry: a sensitive and specific tool to detect sleep-disordered breathing in surgical patients. Anesth Analg 2012; 114(5):993–1000. doi:10.1213/ANE.0b013e318248f4f5
- Boulos MI, Elias S, Wan A, et al. Unattended hospital and home sleep apnea testing following cerebrovascular events. J Stroke Cerebrovasc Dis 2017; 26(1):143–149. doi:10.1016/j.jstrokecerebrovasdis.2016.09.001
- Saletu MT, Kotzian ST, Schwarzinger A, Haider S, Spatt J, Saletu B. Home sleep apnea testing is a feasible and accurate method to diagnose obstructive sleep apnea in stroke patients during in-hospital rehabilitation. J Clin Sleep Med 2018; 14(9):1495–1501. doi:10.5664/jcsm.7322
- Giles TL, Lasserson TJ, Smith BH, White J, Wright J, Cates CJ. Continuous positive airways pressure for obstructive sleep apnoea in adults. Cochrane Database Syst Rev 2006; (3):CD001106. doi:10.1002/14651858.CD001106.pub3
- Fatureto-Borges F, Lorenzi-Filho G, Drager LF. Effectiveness of continuous positive airway pressure in lowering blood pressure in patients with obstructive sleep apnea: a critical review of the literature. Integr Blood Press Control 2016; 9:43–47. doi:10.2147/IBPC.S70402
- Imran TF, Gharzipura M, Liu S, et al. Effect of continuous positive airway pressure treatment on pulmonary artery pressure in patients with isolated obstructive sleep apnea: a meta-analysis. Heart Fail Rev 2016; 21(5):591–598. doi:10.1007/s10741-016-9548-5
- Deng F, Raza A, Guo J. Treating obstructive sleep apnea with continuous positive airway pressure reduces risk of recurrent atrial fibrillation after catheter ablation: a meta-analysis. Sleep Med 2018; 46:5–11. doi:10.1016/j.sleep.2018.02.013
- Seetho IW, Wilding JPH. Sleep-disordered breathing, type 2 diabetes, and the metabolic syndrome. Chronic Resp Dis 2014; 11(4):257–275. doi:10.1177/1479972314552806
- Kim Y, Koo YS, Lee HY, Lee SY. Can continuous positive airway pressure reduce the risk of stroke in obstructive sleep apnea patients? A systematic review and meta-analysis. PloS ONE 2016; 11(1):e0146317. doi:10.1371/journal.pone.0146317
- Yu J, Zhou Z, McEvoy RD, et al. Association of positive airway pressure with cardiovascular events and death in adults with sleep apnea: a systematic review and meta-analysis. JAMA 2017; 318(2):156–166. doi:10.1001/jama.2017.7967
- Peker Y, Glantz H, Eulenburg C, Wegscheider K, Herlitz J, Thunström E. Effect of positive airway pressure on cardiovascular outcomes in coronary artery disease patients with nonsleepy obstructive sleep apnea. The RICCADSA randomized controlled trial. Am J Respir Crit Care Med 2016; 194(5):613–620. doi:10.1164/rccm.201601-0088OC
- Martinez-Garcia MA, Soler-Cataluna JJ, Ejarque-Martinez L, et al. Continuous positive airway pressure treatment reduces mortality in patients with ischemic stroke and obstructive sleep apnea: a 5-year follow-up study. Am J Respir Crit Care Med 2009; 180(1):36–41. doi:10.1164/rccm.200808-1341OC
- Broadley SA, Jorgensen L, Cheek A, et al. Early investigation and treatment of obstructive sleep apnoea after acute stroke. J Clin Neurosci 2007; 14(4):328–333. doi:10.1016/j.jocn.2006.01.017
- Wessendorf TE, Wang YM, Thilmann AF, Sorgenfrei U, Konietzko N, Teschler H. Treatment of obstructive sleep apnoea with nasal continuous positive airway pressure in stroke. Eur Respir J 2001; 18(4):623–629. pmid:11716165
- Bassetti CL, Milanova M, Gugger M. Sleep-disordered breathing and acute ischemic stroke: diagnosis, risk factors, treatment, evolution, and long-term clinical outcome. Stroke 2006; 37(4):967–972. doi:10.1161/01.STR.0000208215.49243.c3
- Palombini L, Guilleminault C. Stroke and treatment with nasal CPAP. Eur J Neurol 2006; 13(2):198–200. doi:10.1111/j.1468-1331.2006.01169.x
- Martínez-García MA, Campos-Rodríguez F, Soler-Cataluña JJ, Catalán-Serra P, Román-Sánchez P, Montserrat JM. Increased incidence of nonfatal cardiovascular events in stroke patients with sleep apnoea: effect of CPAP treatment. Eur Respir J 2012; 39(4):906–912. doi:10.1183/09031936.00011311
- Brill AK, Horvath T, Seiler A, et al. CPAP as treatment of sleep apnea after stroke: a meta-analysis of randomized trials. Neurology 2018; 90(14):e1222–e1230. doi:10.1212/WNL.0000000000005262
- Hsu C, Vennelle M, Li H, Engleman HM, Dennis MS, Douglas NJ. Sleep-disordered breathing after stroke: a randomised controlled trial of continuous positive airway pressure. J Neurol Neurosurg Psychiatry 2006; 77(10):1143–1149. doi:10.1136/jnnp.2005.086686
- Parra O, Sanchez-Armengol A, Bonnin M, et al. Early treatment of obstructive apnoea and stroke outcome: a randomised controlled trial. Eur Resp J 2011; 37(5):1128–1136. doi:10.1183/09031936.00034410
- Ryan CM, Bayley M, Green R, Murray BJ, Bradley TD. Influence of continuous positive airway pressure on outcomes of rehabilitation in stroke patients with obstructive sleep apnea. Stroke 2011; 42(4):1062–1067. doi:10.1161/STROKEAHA.110.597468
- Bravata DM, Concato J, Fried T, et al. Continuous positive airway pressure: evaluation of a novel therapy for patients with acute ischemic stroke. Sleep 2011; 34(9):1271–1277. doi:10.5665/SLEEP.1254
- Parra O, Sanchez-Armengol A, Capote F, et al. Efficacy of continuous positive airway pressure treatment on 5-year survival in patients with ischaemic stroke and obstructive sleep apnea: a randomized controlled trial. J Sleep Res 2015; 24(1):47–53. doi:10.1111/jsr.12181
- Khot SP, Davis AP, Crane DA, et al. Effect of continuous positive airway pressure on stroke rehabilitation: a pilot randomized sham-controlled trial. J Clin Sleep Med 2016; 12(7):1019–1026. doi:10.5664/jcsm.5940
- Aaronson JA, Hofman WF, van Bennekom CA, et al. Effects of continuous positive airway pressure on cognitive and functional outcome of stroke patients with obstructive sleep apnea: a randomized controlled trial. J Clin Sleep Med 2016; 12(4):533–541. doi:10.5664/jcsm.5684
- Gupta A, Shukla G, Afsar M, et al. Role of positive airway pressure therapy for obstructive sleep apnea in patients with stroke: a randomized controlled trial. J Clin Sleep Med 2018; 14(4):511–521. doi:10.5664/jcsm.7034
- Mello-Fujita L, Kim LJ, Palombini Lde O, et al. Treatment of obstructive sleep apnea syndrome associated with stroke. Sleep Med 2015; 16(6):691–696. doi:10.1016/j.sleep.2014.12.017
- Svatikova A, Chervin RD, Wing JJ, Sanchez BN, Migda EM, Brown DL. Positional therapy in ischemic stroke patients with obstructive sleep apnea. Sleep Med 2011; 12(3):262–266. doi:10.1016/j.sleep.2010.12.008
- Souza FJ, Genta PR, de Souza Filho AJ, Wellman A, Lorenzi-Filho G. The influence of head-of-bed elevation in patients with obstructive sleep apnea. Sleep Breath 2017; 21(4):815–820. doi:10.1007/s11325-017-1524-3
KEY POINTS
- A low threshold for evaluating for OSA after a stroke is warranted: the prevalence is high in this population, and risk factors for OSA and its typical clinical picture may not be present.
- Questionnaires can help screen for the likelihood of OSA and the need for more definitive assessment with polysomnography or home sleep apnea testing, tests that pose additional challenges after stroke.
- Positive airway pressure (PAP) therapy remains the first-line treatment for OSA after stroke; it may improve recovery and reduce long-term sequelae of untreated OSA.
- Acceptance of and adherence to PAP therapy can be especially problematic in this population, and alternatives should be considered if needed.
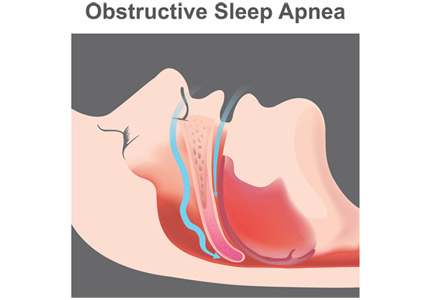
Anti-Xa assays: What is their role today in antithrombotic therapy?
Should clinicians abandon the activated partial thromboplastin time (aPTT) for monitoring heparin therapy in favor of tests that measure the activity of the patient’s plasma against activated factor X (anti-Xa assays)?
Although other anticoagulants are now available for preventing and treating arterial and venous thromboembolism, unfractionated heparin—which requires laboratory monitoring of therapy—is still widely used. And this monitoring can be challenging. Despite its wide use, the aPTT lacks standardization, and the role of alternative monitoring assays such as the anti-Xa assay is not well defined.
This article reviews the advantages, limitations, and clinical applicability of anti-Xa assays for monitoring therapy with unfractionated heparin and other anticoagulants.
UNFRACTIONATED HEPARIN AND WARFARIN ARE STILL WIDELY USED
Until the mid-1990s, unfractionated heparin and oral vitamin K antagonists (eg, warfarin) were the only anticoagulants widely available for clinical use. These agents have complex pharmacokinetic and pharmacodynamic properties, resulting in highly variable dosing requirements (both between patients and in individual patients) and narrow therapeutic windows, making frequent laboratory monitoring and dose adjustments mandatory.
Over the past 3 decades, other anticoagulants have been approved, including low-molecular-weight heparins, fondaparinux, parenteral direct thrombin inhibitors, and direct oral anticoagulants. While these agents have expanded the options for preventing and treating thromboembolism, unfractionated heparin and warfarin are still the most appropriate choices for many patients, eg, those with stage 4 chronic kidney disease and end-stage renal disease on dialysis, and those with mechanical heart valves.
In addition, unfractionated heparin remains the anticoagulant of choice during procedures such as hemodialysis, percutaneous transluminal angioplasty, and cardiopulmonary bypass, as well as in hospitalized and critically ill patients, who often have acute kidney injury or require frequent interruptions of therapy for invasive procedures. In these scenarios, unfractionated heparin is typically preferred because of its short plasma half-life, complete reversibility by protamine, safety regardless of renal function, and low cost compared with parenteral direct thrombin inhibitors.
As long as unfractionated heparin and warfarin remain important therapies, the need for their laboratory monitoring continues. For warfarin monitoring, the prothrombin time and international normalized ratio are validated and widely reproducible methods. But monitoring unfractionated heparin therapy remains a challenge.
UNFRACTIONATED HEPARIN’S EFFECT IS UNPREDICTABLE
Unfractionated heparin, a negatively charged mucopolysaccharide, inhibits coagulation by binding to antithrombin through the high-affinity pentasaccharide sequence.1–6 Such binding induces a conformational change in the antithrombin molecule, converting it to a rapid inhibitor of several coagulation proteins, especially factors IIa and Xa.2–4
Unfractionated heparin inhibits factors IIa and Xa in a 1:1 ratio, but low-molecular-weight heparins inhibit factor Xa more than factor IIa, with IIa-Xa inhibition ratios ranging from 1:2 to 1:4, owing to their smaller molecular size.7
One of the most important reasons for the unpredictable and highly variable individual responses to unfractionated heparin is that, infused into the blood, the large and negatively charged unfractionated heparin molecules bind nonspecifically to positively charged plasma proteins.7 In patients who are critically ill, have acute infections or inflammatory states, or have undergone major surgery, unfractionated heparin binds to acute-phase proteins that are elevated, particularly factor VIII. This results in fewer free heparin molecules and a variable anticoagulant effect.8
In contrast, low-molecular-weight heparins have longer half-lives and bind less to plasma proteins, resulting in more predictable plasma levels following subcutaneous injection.9
MONITORING UNFRACTIONATED HEPARIN IMPROVES OUTCOMES
In 1960, Barritt and Jordan10 conducted a small but landmark trial that established the clinical importance of unfractionated heparin for treating venous thromboembolism. None of the patients who received unfractionated heparin for acute pulmonary embolism developed a recurrence during the subsequent 2 weeks, while 50% of those who did not receive it had recurrent pulmonary embolism, fatal in half of the cases.
The importance of achieving a specific aPTT therapeutic target was not demonstrated until a 1972 study by Basu et al,11 in which 162 patients with venous thromboembolism were treated with heparin with a target aPTT of 1.5 to 2.5 times the control value. Patients who suffered recurrent events had subtherapeutic aPTT values on 71% of treatment days, while the rest of the patients, with no recurrences, had subtherapeutic aPTT values only 28% of treatment days. The different outcomes could not be explained by the average daily dose of unfractionated heparin, which was similar in the patients regardless of recurrence.
Subsequent studies showed that the best outcomes occur when unfractionated heparin is given in doses high enough to rapidly achieve a therapeutic prolongation of the aPTT,12–14 and that the total daily dose is also important in preventing recurrences.15,16 Failure to achieve a target aPTT within 24 hours of starting unfractionated heparin is associated with increased risk of recurrent venous thromboembolism.13,17
Raschke et al17 found that patients prospectively randomized to weight-based doses of intravenous unfractionated heparin (bolus plus infusion) achieved significantly higher rates of therapeutic aPTT within 6 hours and 24 hours after starting the infusion, and had significantly lower rates of recurrent venous thromboembolism than those randomized to a fixed unfractionated heparin protocol, without an increase in major bleeding.
Smith et al,18 in a study of 400 consecutive patients with acute pulmonary embolism treated with unfractionated heparin, found that patients who achieved a therapeutic aPTT within 24 hours had lower in-hospital and 30-day mortality rates than those who did not achieve the first therapeutic aPTT until more than 24 hours after starting unfractionated heparin infusion.
Such data lend support to the widely accepted practice and current guideline recommendation8 of using laboratory assays to adjust the dose of unfractionated heparin to achieve and maintain a therapeutic target. The use of dosing nomograms significantly reduces the time to achieve a therapeutic aPTT while minimizing subtherapeutic and supratherapeutic unfractionated heparin levels.19,20
THE aPTT REFLECTS THROMBIN INHIBITION
The aPTT has a log-linear relationship with plasma concentrations of unfractionated heparin,21 but it was not developed specifically for monitoring unfractionated heparin therapy. Originally described in 1953 as a screening tool for hemophilia,22–24 the aPTT is prolonged in the setting of factor deficiencies (typically with levels < 45%, except for factors VII and XIII), as well as lupus anticoagulants and therapy with parenteral direct thrombin inhibitors.8,25,26
Because thrombin (factor IIa) is 10 times more sensitive than factor Xa to inhibition by the heparin-antithrombin complex,4,7 thrombin inhibition appears to be the most likely mechanism by which unfractionated heparin prolongs the aPTT. In contrast, aPTT is minimally or not at all prolonged by low-molecular-weight heparins, which are predominantly factor Xa inhibitors.7
HEPARIN ASSAYS MEASURE UNFRACTIONATED HEPARIN ACTIVITY
While the aPTT is a surrogate marker of unfractionated heparin activity in plasma, unfractionated heparin activity can be measured more precisely by so-called heparin assays, which are typically not direct measures of the plasma concentration of heparins, but rather functional assays that provide indirect estimates. They include protamine sulfate titration assays and anti-Xa assays.
Protamine sulfate titration assays measure the amount of protamine sulfate required to neutralize heparin: the more protamine required, the greater the estimated concentration of unfractionated heparin in plasma.8,27–29 Protamine titration assays are technically demanding, so they are rarely used clinically.
Anti-Xa assays provide a measure of the functional level of heparins in plasma.29–33 Chromogenic anti-Xa assays are available on automated analyzers with standardized kits29,33,34 and may be faster to perform than the aPTT.35
Experiments in rabbits show that unfractionated heparin inhibits thrombus formation and extension at concentrations of 0.2 to 0.4 U/mL as measured by the protamine titration assay,27 which correlated with an anti-Xa activity of 0.35 to 0.67 U/mL in a randomized controlled trial.32
Assays that directly measure the plasma concentration of heparin exist but are not clinically relevant because they also measure heparin molecules lacking the pentasaccharide sequence, which have no anticoagulant activity.36
ANTI-Xa ASSAY VS THE aPTT
Anti-Xa assays are more expensive than the aPTT and are not available in all hospitals. For these reasons, the aPTT remains the most commonly used laboratory assay for monitoring unfractionated heparin therapy.
However, the aPTT correlates poorly with the activity level of unfractionated heparin in plasma. In one study, an anti-Xa level of 0.3 U/mL corresponded to aPTT results ranging from 47 to 108 seconds.31 Furthermore, in studies that used a heparin therapeutic target based on an aPTT ratio 1.5 to 2.5 times the control aPTT value, the lower end of that target range was often associated with subtherapeutic plasma unfractionated heparin activity measured by anti-Xa and protamine titration assays.28,31
Because of these limitations, individual laboratories should determine their own aPTT therapeutic target ranges for unfractionated heparin based on the response curves obtained with the reagent and coagulometer used. The optimal therapeutic aPTT range for treating acute venous thromboembolism should be defined as the aPTT range (in seconds) that correlates with a plasma activity level of unfractionated heparin of 0.3 to 0.7 U/mL based on a chromogenic anti-Xa assay, or 0.2 to 0.4 U/mL based on a protamine titration assay.32,34–36
Nevertheless, the anticoagulant effect of unfractionated heparin as measured by the aPTT can be unpredictable and can vary widely among individuals and in the same patient.7 This wide variability can be explained by a number of technical and biologic variables. Different commercial aPTT reagents, different lots of the same reagent, and different reagent and instrument combinations have different sensitivities to unfractionated heparin, which can lead to variable aPTT results.37 Moreover, high plasma levels of acute-phase proteins, low plasma antithrombin levels, consumptive coagulopathies, liver failure, and lupus anticoagulants may also affect the aPTT.7,25,32,36–41 These variables account for the poor correlation—ranging from 25% to 66%—reported between aPTT and anti-Xa assays.32,42–48
Such discrepancies may have serious clinical implications: if a patient’s aPTT is low (subtherapeutic) or high (supratherapeutic) but the anti-Xa assay result is within the therapeutic range (0.3–0.7 units/mL), changing the dose of unfractionated heparin (guided by an aPTT nomogram) may increase the risk of bleeding or of recurrent thromboembolism.
CLINICAL APPLICABILITY OF THE ANTI-Xa ASSAY
Neither anti-Xa nor protamine titration assays are standardized across reference laboratories, but chromogenic anti-Xa assays have better interlaboratory correlation than the aPTT49,50 and can be calibrated specifically for unfractionated or low-molecular-weight heparins.29,33
Although reagent costs are higher for chromogenic anti-Xa assays than for the aPTT, some technical variables (described below) may partially offset the cost difference.29,33,41 In addition, unlike the aPTT, anti-Xa assays do not need local calibration; the therapeutic range for unfractionated heparin is the same (0.3–0.7 U/mL) regardless of instrument or reagent.33,41
Most important, studies have found that patients monitored by anti-Xa assay achieve significantly higher rates of therapeutic anticoagulation within 24 and 48 hours after starting unfractionated heparin infusion than those monitored by the aPTT. Fewer dose adjustments and repeat tests are required, which may also result in lower cost.32,51–55
While these studies found chromogenic anti-Xa assays better for achieving laboratory end points, data regarding relevant clinical outcomes are more limited. In a retrospective, observational cohort study,51 the rate of venous thromboembolism or bleeding-related death was 2% in patients receiving unfractionated heparin therapy monitored by anti-Xa assay and 6% in patients monitored by aPTT (P = .62). Rates of major hemorrhage were also not significantly different.
In a randomized controlled trial32 in 131 patients with acute venous thromboembolism and heparin resistance, rates of recurrent venous thromboembolism were 4.6% and 6.1% in the groups randomized to anti-Xa and aPTT monitoring, respectively, whereas overall bleeding rates were 1.5% and 6.1%, respectively. Again, the differences were not statistically significant.

Heparin resistance. Some patients require unusually high doses of unfractionated heparin to achieve a therapeutic aPTT: typically, more than 35,000 U over 24 hours,7,8,32 or total daily doses that exceed their estimated weight-based requirements. Heparin resistance has been observed in various clinical settings.7,8,32,37–40,59–61 Patients with heparin resistance monitored by anti-Xa had similar rates of recurrent venous thromboembolism while receiving significantly lower doses of unfractionated heparin than those monitored by the aPTT.32
Lupus anticoagulant. Patients with the specific antiphospholipid antibody known as lupus anticoagulant frequently have a prolonged baseline aPTT,25 making it an unreliable marker of anticoagulant effect for intravenous unfractionated heparin therapy.
Critically ill infants and children. Arachchillage et al35 found that infants (< 1 year old) treated with intravenous unfractionated heparin in an intensive care department had only a 32.4% correlation between aPTT and anti-Xa levels, which was lower than that found in children ages 1 to 15 (66%) and adults (52%). In two-thirds of cases of discordant aPTT and anti-Xa levels, the aPTT was elevated (supratherapeutic) while the anti-Xa assay was within the therapeutic range (0.3–0.7 U/mL). Despite the lack of data on clinical outcomes (eg, rates of thrombosis and bleeding) with the use of an anti-Xa assay, it has been considered the method of choice for unfractionated heparin monitoring in critically ill children, and especially in those under age 1.41,44,62–64
While anti-Xa assays may also be better for unfractionated heparin monitoring in critically ill adults, the lack of clinical outcome data from large-scale randomized trials has precluded evidence-based recommendations favoring them over the aPTT.8,34
LIMITATIONS OF ANTI-Xa ASSAYS
Anti-Xa assays are hampered by some technical limitations:
Samples must be processed within 1 hour to avoid heparin neutralization.34
Samples must be clear. Hemolyzed or opaque samples (eg, due to bilirubin levels > 6.6 mg/dL or triglyceride levels > 360 mg/dL) cannot be processed, as they can cause falsely low levels.
Exposure to other anticoagulants can interfere with the results. The anti-Xa assay may be unreliable for unfractionated heparin monitoring in patients who are transitioned from low-molecular-weight heparins, fondaparinux, or an oral factor Xa inhibitor (apixaban, betrixaban, edoxaban, rivaroxaban) to intravenous unfractionated heparin, eg, due to hospitalization or acute kidney injury.65,66 Different reports have found that anti-Xa assays may be elevated for as long as 63 to 96 hours after the last dose of oral Xa inhibitors,67–69 potentially resulting in underdosing of unfractionated heparin. In such settings, unfractionated heparin therapy should be monitored by the aPTT.
ANTI-Xa ASSAYS AND LOW-MOLECULAR-WEIGHT HEPARINS
Most patients receiving low-molecular-weight heparins do not need laboratory monitoring.8 Alhenc-Gelas et al70 randomized patients to receive dalteparin in doses either based on weight or guided by anti-Xa assay results, and found that dose adjustments were rare and lacked clinical benefit.

The suggested therapeutic anti-Xa levels for low-molecular-weight heparins are:
- 0.5–1.2 U/mL for twice-daily enoxaparin
- 1.0–2.0 U/mL for once-daily enoxaparin or dalteparin.
Levels should be measured at peak plasma level (ie, 3–4 hours after subcutaneous injection, except during pregnancy, when it is 4–6 hours), and only after at least 3 doses of low-molecular-weight heparin.8,71 Unlike the anti-Xa therapeutic range recommended for unfractionated heparin therapy, these ranges are not based on prospective data, and if the assay result is outside the suggested therapeutic target range, current guidelines offer no advice on safely adjusting the dose.8,71
Measuring anti-Xa activity is particularly important for pregnant women with a mechanical prosthetic heart valve who are treated with low-molecular-weight heparins. In this setting, valve thrombosis and cardioembolic events have been reported in patients with peak low-molecular-weight heparin anti-Xa assay levels below or even at the lower end of the therapeutic range, and increased bleeding risk has been reported with elevated anti-Xa levels.71–74 Measuring trough low-molecular-weight heparin anti-Xa levels has been suggested to guide dose adjustments during pregnancy.75
Clearance of low-molecular-weight heparins as measured by the anti-Xa assay is highly correlated with creatinine clearance.76,77 A strong linear correlation has been demonstrated between creatine clearance and anti-Xa levels of enoxaparin after multiple therapeutic doses, and low-molecular-weight heparins accumulate in the plasma, especially in patients with creatine clearance less than 30 mL/min.78 The risk of major bleeding is significantly increased in patients with severe renal insufficiency (creatinine clearance < 30 mL/min) not on dialysis who are treated with either prophylactic or therapeutic doses of low-molecular-weight heparin.79–81 In a meta-analysis, the risk of bleeding with therapeutic-intensity doses of enoxaparin was 4 times higher than with prophylactic-intensity doses.79 Although bleeding risk appears to be reduced when the enoxaparin dose is reduced by 50%,8 the efficacy and safety of this strategy has not been determined by prospective trials.
ANTI-Xa ASSAYS IN PATIENTS RECEIVING DIRECT ORAL ANTICOAGULANTS
Direct oral factor Xa inhibitors cannot be measured accurately by heparin anti-Xa assays. Nevertheless, such assays may be useful to assess whether clinically relevant plasma levels are present in cases of major bleeding, suspected anticoagulant failure, or patient noncompliance.82
Intense research has focused on developing drug-specific chromogenic anti-Xa assays using calibrators and standards for apixaban, edoxaban, and rivaroxaban,82,83 and good linear correlation has been shown with some assays.82,84 In patients treated with oral factor Xa inhibitors who need to undergo an urgent invasive procedure associated with high bleeding risk, use of a specific reversal agent may be considered with drug concentrations more than 30 ng/mL measured by a drug-specific anti-Xa assay. A similar suggestion has been made for drug concentrations more than 50 ng/mL in the setting of major bleeding.85 Unfortunately, such assays are not widely available at this time.82,86
While drug-specific anti-Xa assays could become clinically important to guide reversal strategies, their relevance for drug monitoring remains uncertain. This is because no therapeutic target ranges have been established for any of the direct oral anticoagulants, which were approved on the basis of favorable clinical trial outcomes that neither measured nor were correlated with specific drug levels in plasma. Therefore, a specific anti-Xa level cannot yet be used as a marker of clinical efficacy for any specific oral direct Xa inhibitor.
- Abildgaard U. Highly purified antithrombin 3 with heparin cofactor activity prepared by disc electrophoresis. Scand J Clin Lab Invest 1968; 21(1):89–91. pmid:5637480
- Rosenberg RD, Lam L. Correlation between structure and function of heparin. Proc Natl Acad Sci USA 1979; 76(3):1218–1222. pmid:286307
- Lindahl U, Bäckström G, Höök M, Thunberg L, Fransson LA, Linker A. Structure of the antithrombin-binding site of heparin. Proc Natl Acad Sci USA 1979; 76(7):3198–3202. pmid:226960
- Rosenberg RD, Rosenberg JS. Natural anticoagulant mechanisms. J Clin Invest 1984; 74(1):1–6. doi:10.1172/JCI111389
- Casu B, Oreste P, Torri G, et al. The structure of heparin oligosaccharide fragments with high anti-(factor Xa) activity containing the minimal antithrombin III-binding sequence. Chemical and 13C nuclear-magnetic-resonance studies. Biochem J 1981; 197(3):599–609. pmid:7325974
- Choay J, Lormeau JC, Petitou M, Sinaÿ P, Fareed J. Structural studies on a biologically active hexasaccharide obtained from heparin. Ann NY Acad Sci 1981; 370: 644–649. pmid:6943974
- Hirsh J, Warkentin TE, Shaughnessy SG, et al. Heparin and low-molecular-weight heparin: mechanisms of action, pharmacokinetics, dosing, monitoring, efficacy, and safety. Chest 2001; 119(suppl 1):64S–94S. pmid:11157643
- Garcia DA, Baglin TP, Weitz JI, Samama MM. Parenteral anticoagulants: antithrombotic therapy and prevention of thrombosis, 9th ed: American College of Chest Physicians Evidence-Based Clinical Practice Guidelines. Chest 2012; 141(suppl 2):e24S–e43S. doi:10.1378/chest.11-2291
- Hirsh J, Levine M. Low-molecular weight heparin. Blood 1992; 79(1):1–17. pmid:1309422
- Barritt DW, Jordan SC. Anticoagulant drugs in the treatment of pulmonary embolism. A controlled trial. Lancet 1960; 1(7138):1309–1312. pmid:13797091
- Basu D, Gallus A, Hirsh J, Cade J. A prospective study of the value of monitoring heparin treatment with the activated partial thromboplastin time. N Engl J Med 1972; 287(7):324–327. doi:10.1056/NEJM197208172870703
- Hull RD, Raskob GE, Hirsh J, et al. Continuous intravenous heparin compared with intermittent subcutaneous heparin in the initial treatment of proximal-vein thrombosis. N Engl J Med 1986; 315(18):1109–1114. doi:10.1056/NEJM198610303151801
- Hull RD, Raskob GE, Brant RF, Pineo GF, Valentine KA. Relation between the time to achieve the lower limit of the APTT therapeutic range and recurrent venous thromboembolism during heparin treatment for deep vein thrombosis. Arch Intern Med 1997; 157(22):2562–2568. pmid:9531224
- Hull RD, Raskob GE, Brant RF, Pineo GF, Valentine KA. The importance of initial heparin treatment on long-term clinical outcomes of antithrombotic therapy. The emerging theme of delayed recurrence. Arch Intern Med 1997; 157(20):2317–2321. pmid:9361572
- Anand S, Ginsberg JS, Kearon C, Gent M, Hirsh J. The relation between the activated partial thromboplastin time response and recurrence in patients with venous thrombosis treated with continuous intravenous heparin. Arch Intern Med 1996; 156(15):1677–1681. pmid:8694666
- Anand SS, Bates S, Ginsberg JS, et al. Recurrent venous thrombosis and heparin therapy: an evaluation of the importance of early activated partial thromboplastin times. Arch Intern Med 1999; 159(17):2029–2032. pmid:10510988
- Raschke RA, Reilly BM, Guidry JR, Fontana JR, Srinivas S. The weight-based heparin dosing nomogram compared with a “standard care” nomogram. A randomized controlled trial. Ann Intern Med 1993; 119(9):874–881. pmid:8214998
- Smith SB, Geske JB, Maguire JM, Zane NA, Carter RE, Morgenthaler TI. Early anticoagulation is associated with reduced mortality for acute pulmonary embolism. Chest 2010; 137(6):1382–1390. doi:10.1378/chest.09-0959
- Cruickshank MK, Levine MN, Hirsh J, Roberts R, Siguenza M. A standard heparin nomogram for the management of heparin therapy. Arch Intern Med 1991; 151(2):333–337. pmid:1789820
- Raschke RA, Gollihare B, Peirce J. The effectiveness of implementing the weight-based heparin nomogram as a practice guideline. Arch Intern Med 1996; 156(15):1645–1649. pmid:8694662
- Simko RJ, Tsung FF, Stanek EJ. Activated clotting time versus activated partial thromboplastin time for therapeutic monitoring of heparin. Ann Pharmacother 1995; 29(10):1015–1021. doi:10.1177/106002809502901012
- Langdell RD, Wagner RH, Brinkhous KM. Effect of antihemophilic factor on one-stage clotting tests; a presumptive test for hemophilia and a simple one-stage antihemophilic factor assy procedure. J Lab Clin Med 1953; 41(4):637–647.
- White GC 2nd. The partial thromboplastin time: defining an era in coagulation. J Thromb Haemost 2003; 1(11):2267–2270. pmid:14629454
- Proctor RR, Rapaport SI. The partial thromboplastin time with kaolin. A simple screening test for first stage plasma clotting factor deficiencies. Am J Clin Pathol 1961; 36:212–219. pmid:13738153
- Brandt JT, Triplett DA, Rock WA, Bovill EG, Arkin CF. Effect of lupus anticoagulants on the activated partial thromboplastin time. Results of the College of American Pathologists survey program. Arch Pathol Lab Med 1991; 115(2):109–114. pmid:1899555
- Tripodi A, Mannucci PM. Activated partial thromboplastin time (APTT). New indications for an old test? J Thromb Haemost 2006; 4(4):750–751. doi:10.1111/j.1538-7836.2006.01857.x
- Chiu HM, Hirsh J, Yung WL, Regoeczi E, Gent M. Relationship between the anticoagulant and antithrombotic effects of heparin in experimental venous thrombosis. Blood 1977; 49(2):171–184. pmid:831872
- Brill-Edwards P, Ginsberg JS, Johnston M, Hirsh J. Establishing a therapeutic range for heparin therapy. Ann Intern Med 1993; 119(2):104–109. pmid:8512158
- Vandiver JW, Vondracek TG. Antifactor Xa levels versus activated partial thromboplastin time for monitoring unfractionated heparin. Pharmacotherapy 2012; 32(6):546–558. doi:10.1002/j.1875-9114.2011.01049.x
- Newall F. Anti-factor Xa (anti-Xa). In: Monagle P, ed. Haemostasis: Methods and Protocols. New York, NY: Springer-Verlag; 2013.
- Bates SM, Weitz JI, Johnston M, Hirsh J, Ginsberg JS. Use of a fixed activated partial thromboplastin time ratio to establish a therapeutic range for unfractionated heparin. Arch Intern Med 2001; 161(3):385–391. pmid:11176764
- Levine MN, Hirsh J, Gent M, et al. A randomized trial comparing activated thromboplastin time with heparin assay in patients with acute venous thromboembolism requiring large doses of heparin. Arch Intern Med 1994; 154(1):49–56. pmid:8267489
- Wool GD, Lu CM; Education Committee of the Academy of Clinical Laboratory Physicians and Scientists. Pathology consultation on anticoagulation monitoring: factor X-related assays. Am J Clin Pathol 2013; 140(5):623–634. doi:10.1309/AJCPR3JTOK7NKDBJ
- Lehman CM, Frank EL. Laboratory monitoring of heparin therapy: partial thromboplastin time or anti-Xa assay? Lab Med 2009; 40(1):47–51. doi:10.1309/LM9NJGW2ZIOLPHY6
- Arachchillage DR, Kamani F, Deplano S, Banya W, Laffan M. Should we abandon the aPTT for monitoring unfractionated heparin? Thromb Res 2017; 157:157–161. doi:10.1016/j.thromres.2017.07.006
- Olson JD, Arkin CA, Brandt JT, et al. College of American Pathologists Conference XXXI on Laboratory Monitoring of Anticoagulant Therapy: laboratory monitoring of unfractionated heparin therapy. Arch Pathol Lab Med 1998; 122(9):782–798. pmid:9740136
- Eikelboom JW, Hirsh J. Monitoring unfractionated heparin with the aPTT: time for a fresh look. Thromb Haemost 2006; 96(5):547–552. pmid:17080209
- Young E, Prins M, Levine MN, Hirsh J. Heparin binding to plasma proteins, an important mechanism of heparin resistance. Thromb Haemost 1992; 67(6):639–643. pmid:1509402
- Edson JR, Krivit W, White JG. Kaolin partial thromboplastin time: high levels of procoagulants producing short clotting times or masking deficiencies of other procoagulants or low concentrations of anticoagulants. J Lab Clin Med 1967; 70(3):463–470. pmid:6072020
- Whitfield LR, Lele AS, Levy G. Effect of pregnancy on the relationship between concentration and anticoagulant action of heparin. Clin Pharmacol Ther 1983; 34(1):23–28. pmid:6861435
- Marci CD, Prager D. A review of the clinical indications for the plasma heparin assay. Am J Clin Pathol 1993; 99(5):546–550.
- Takemoto CM, Streiff MB, Shermock KM, et al. Activated partial thromboplastin time and anti-Xa measurements in heparin monitoring: biochemical basis of discordance. Am J Clin Pathol 2013; 139(4):450–456. doi:10.1309/AJCPS6OW6DYNOGNH
- Adatya S, Uriel N, Yarmohammadi H, et al. Anti-factor Xa and activated partial thromboplastin time measurements for heparin monitoring in mechanical circulatory support. JACC Heart Fail 2015; 3(4):314–322. doi:10.1016/j.jchf.2014.11.009
- Kuhle S, Eulmesekian P, Kavanagh B, et al. Lack of correlation between heparin dose and standard clinical monitoring tests in treatment with unfractionated heparin in critically ill children. Haematologica 2007; 92(4):554–557. pmid:17488668
- Price EA, Jin J, Nguyen HM, Krishnan G, Bowen R, Zehnder JL. Discordant aPTT and anti-Xa values and outcomes in hospitalized patients treated with intravenous unfractionated heparin. Ann Pharmacother 2013; 47(2):151–158. doi:10.1345/aph.1R635
- Baker BA, Adelman MD, Smith PA, Osborn JC. Inability of the activated partial thromboplastin time to predict heparin levels. Arch Intern Med 1997; 157(21):2475–2479. pmid:9385299
- Koerber JM, Smythe MA, Begle RL, Mattson JC, Kershaw BP, Westley SJ. Correlation of activated clotting time and activated partial thromboplastin time to plasma heparin concentration. Pharmacotherapy 1999; 19(8):922–931. pmid:10453963
- Smythe MA, Mattson JC, Koerber JM. The heparin anti-Xa therapeutic range: are we there yet? Chest 2002; 121(1):303–304. pmid:11796474
- Cuker A, Ptashkin B, Konkle A, et al. Interlaboratory agreement in the monitoring of unfractionated heparin using the anti-factor Xa-correlated activated partial thromboplastin time. J Thromb Haemost 2009; 7(1):80–86. doi:10.1111/j.1538-7836.2008.03224.x
- Taylor CT, Petros WP, Ortel TL. Two instruments to determine activated partial thromboplastin time: implications for heparin monitoring. Pharmacotherapy 1999; 19(4):383–387. pmid:10212007
- Guervil DJ, Rosenberg AF, Winterstein AG, Harris NS, Johns TE, Zumberg MS. Activated partial thromboplastin time versus antifactor Xa heparin assay in monitoring unfractionated heparin by continuous intravenous infusion. Ann Pharmacother 2011; 45(7–8):861–868. doi:10.1345/aph.1Q161
- Fruge KS, Lee YR. Comparison of unfractionated heparin protocols using antifactor Xa monitoring or activated partial thrombin time monitoring. Am J Health Syst Pharm 2015; 72(17 suppl 2):S90–S97. doi:10.2146/sp150016
- Rosborough TK. Monitoring unfractionated heparin therapy with antifactor Xa activity results in fewer monitoring tests and dosage changes than monitoring with activated partial thromboplastin time. Pharmacotherapy 1999; 19(6):760–766. pmid:10391423
- Rosborough TK, Shepherd MF. Achieving target antifactor Xa activity with a heparin protocol based on sex, age, height, and weight. Pharmacotherapy 2004; 24(6):713–719. doi:10.1592/phco.24.8.713.36067
- Smith ML, Wheeler KE. Weight-based heparin protocol using antifactor Xa monitoring. Am J Health Syst Pharm 2010; 67(5):371–374. doi:10.2146/ajhp090123
- Bartholomew JR, Kottke-Marchant K. Monitoring anticoagulation therapy in patients with the lupus anticoagulant. J Clin Rheumatol 1998; 4(6):307–312. pmid:19078327
- Wool GD, Lu CM; Education Committee of the Academy of Clinical Laboratory Physicians and Scientists. Pathology consultation on anticoagulation monitoring: factor X-related assays. Am J Clin Pathol 2013; 140(5):623–634. doi:10.1309/AJCPR3JTOK7NKDBJ
- Mehta TP, Smythe MA, Mattson JC. Strategies for managing heparin therapy in patients with antiphospholipid antibody syndrome. Pharmacotherapy 2011; 31(12):1221–1231. doi:10.1592/phco.31.12.1221
- Levine SP, Sorenson RR, Harris MA, Knieriem LK. The effect of platelet factor 4 (PF4) on assays of plasma heparin. Br J Haematol 1984; 57(4):585–596. pmid:6743573
- Fisher AR, Bailey CR, Shannon CN, Wielogorski AK. Heparin resistance after aprotinin. Lancet 1992; 340(8829):1230–1231. pmid:1279335
- Becker RC, Corrao JM, Bovill EG, et al. Intravenous nitroglycerin-induced heparin resistance: a qualitative antithrombin III abnormality. Am Heart J 1990; 119(6):1254–1261. pmid:2112878
- Monagle P, Chan AK, Goldenberg NA, et al. Antithrombotic therapy in neonates and children: Antithrombotic Therapy and Prevention of Thrombosis, 9th ed: American College of Chest Physicians Evidence-Based Clinical Practice Guidelines. Chest 2012; 141(suppl 2):e737S–e801S. doi:10.1378/chest.11-2308
- Long E, Pitfield AF, Kissoon N. Anticoagulation therapy: indications, monitoring, and complications. Pediatr Emerg Care 2011; 27(1):55–61. doi:10.1097/PEC.0b013e31820461b1
- Andrew M, Schmidt B. Use of heparin in newborn infants. Semin Thromb Hemost 1988; 14(1):28–32. doi:10.1055/s-2007-1002752
- Teien AN, Lie M, Abildgaard U. Assay of heparin in plasma using a chromogenic substrate for activated factor X. Thromb Res 1976; 8(3):413–416. pmid:1265712
- Vera-Aguillera J, Yousef H, Beltran-Melgarejo D, et al. Clinical scenarios for discordant anti-Xa. Adv Hematol 2016; 2016:4054806. doi:10.1155/2016/4054806
- Macedo KA, Tatarian P, Eugenio KR. Influence of direct oral anticoagulants on anti-factor Xa measurements utilized for monitoring heparin. Ann Pharmacother 2018; 52(2):154–159. doi:10.1177/1060028017729481
- Wendte J, Voss G, Van Overschelde B. Influence of apixaban on antifactor Xa levels in a patient with acute kidney injury. Am J Health Syst Pharm 2016; 73(8):563–567. doi:10.2146/ajhp150360
- Faust AC, Kanyer D, Wittkowsky AK. Managing transitions from oral factor Xa inhibitors to unfractionated heparin infusions. Am J Health Syst Pharm 2016; 73(24):2037–2041. doi:10.2146/ajhp150596
- Alhenc-Gelas M, Jestin-Le Guernic C, Vitoux JF, Kher A, Aiach M, Fiessinger JN. Adjusted versus fixed doses of the low-molecular-weight heparin fragmin in the treatment of deep vein thrombosis. Fragmin-Study Group. Thromb Haemost 1994; 71(6):698–702. pmid:7974334
- Bates SM, Greer IA, Middeldorp S, Veenstra DL, Prabulos AM, Vandvik PO. VTE, thrombophilia, antithrombotic therapy, and pregnancy: Antithrombotic Therapy and Prevention of Thrombosis, 9th ed: American College of Chest Physicians Evidence-Based Clinical Practice Guidelines. Chest 2012; 141(suppl 2):e691S–e736S. doi:10.1378/chest.11-2300
- Bara L, Leizorovicz A, Picolet H, Samama M. Correlation between anti-Xa and occurrence of thrombosis and haemorrhage in post-surgical patients treated with either Logiparin (LMWH) or unfractionated heparin. Post-surgery Logiparin Study Group. Thromb Res 1992; 65(4–5):641–650. pmid:1319619
- Prandoni P, Lensing AW, Büller HR, et al. Comparison of subcutaneous low-molecular-weight heparin with intravenous standard heparin in proximal deep-vein thrombosis. Lancet 1992; 339(8791):441–445. pmid:1346817
- Walenga JM, Hoppensteadt D, Fareed J. Laboratory monitoring of the clinical effects of low molecular weight heparins. Thromb Res Suppl 1991;14:49–62. pmid:1658970
- Elkayam U. Anticoagulation therapy for pregnant women with mechanical prosthetic heart valves: how to improve safety? J Am Coll Cardiol 2017; 69(22):2692–2695. doi:10.1016/j.jacc.2017.04.034
- Brophy DF, Wazny LD, Gehr TW, Comstock TJ, Venitz J. The pharmacokinetics of subcutaneous enoxaparin in end-stage renal disease. Pharmacotherapy 2001; 21(2):169–174. pmid:11213853
- Becker RC, Spencer FA, Gibson M, et al; TIMI 11A Investigators. Influence of patient characteristics and renal function on factor Xa inhibition pharmacokinetics and pharmacodynamics after enoxaparin administration in non-ST-segment elevation acute coronary syndromes. Am Heart J 2002; 143(5):753–759. pmid:12040334
- Chow SL, Zammit K, West K, Dannenhoffer M, Lopez-Candales A. Correlation of antifactor Xa concentrations with renal function in patients on enoxaparin. J Clin Pharmacol 2003; 43(6):586–590. pmid:12817521
- Lim W, Dentali F, Eikelboom JW, Crowther MA. Meta-analysis: low-molecular-weight heparin and bleeding in patients with severe renal insufficiency. Ann Intern Med 2006; 144(9):673–684. pmid:16670137
- Spinler SA, Inverso SM, Cohen M, Goodman SG, Stringer KA, Antman EM; ESSENCE and TIMI 11B Investigators. Safety and efficacy of unfractionated heparin versus enoxaparin in patients who are obese and patients with severe renal impairment: analysis from the ESSENCE and TIMI 11B studies. Am Heart J 2003; 146(1):33–41. doi:10.1016/S0002-8703(03)00121-2
- Cestac P, Bagheri H, Lapeyre-Mestre M, et al. Utilisation and safety of low molecular weight heparins: prospective observational study in medical inpatients. Drug Saf 2003; 26(3):197–207. doi:10.2165/00002018-200326030-00005
- Douxfils J, Ageno W, Samama CM, et al. Laboratory testing in patients treated with direct oral anticoagulants: a practical guide for clinicians. J Thromb Haemost 2018; 16(2):209–219. doi:10.1111/jth.13912
- Samuelson BT, Cuker A, Siegal DM, Crowther M, Garcia DA. Laboratory assessment of the anticoagulant activity of direct oral anticoagulants: a systematic review. Chest 2017; 151(1):127–138. doi:10.1016/j.chest.2016.08.1462
- Gosselin RC, Francart SJ, Hawes EM, Moll S, Dager WE, Adcock DM. Heparin-calibrated chromogenic anti-Xa activity measurements in patients receiving rivaroxaban: can this test be used to quantify drug level? Ann Pharmacother 2015; 49(7):777–783. doi:10.1177/1060028015578451
- Levy JH, Ageno W, Chan NC, Crowther M, Verhamme P, Weitz JI; Subcommittee on Control of Anticoagulation. When and how to use antidotes for the reversal of direct oral anticoagulants: guidance from the SSC of the ISTH. J Thromb Haemost 2016; 14(3):623–627. doi:10.1111/jth.13227
- Cuker A, Siegal D. Monitoring and reversal of direct oral anticoagulants. Hematology Am Soc Hematol Educ Program 2015; 2015:117–124. doi:10.1182/asheducation-2015.1.117
Should clinicians abandon the activated partial thromboplastin time (aPTT) for monitoring heparin therapy in favor of tests that measure the activity of the patient’s plasma against activated factor X (anti-Xa assays)?
Although other anticoagulants are now available for preventing and treating arterial and venous thromboembolism, unfractionated heparin—which requires laboratory monitoring of therapy—is still widely used. And this monitoring can be challenging. Despite its wide use, the aPTT lacks standardization, and the role of alternative monitoring assays such as the anti-Xa assay is not well defined.
This article reviews the advantages, limitations, and clinical applicability of anti-Xa assays for monitoring therapy with unfractionated heparin and other anticoagulants.
UNFRACTIONATED HEPARIN AND WARFARIN ARE STILL WIDELY USED
Until the mid-1990s, unfractionated heparin and oral vitamin K antagonists (eg, warfarin) were the only anticoagulants widely available for clinical use. These agents have complex pharmacokinetic and pharmacodynamic properties, resulting in highly variable dosing requirements (both between patients and in individual patients) and narrow therapeutic windows, making frequent laboratory monitoring and dose adjustments mandatory.
Over the past 3 decades, other anticoagulants have been approved, including low-molecular-weight heparins, fondaparinux, parenteral direct thrombin inhibitors, and direct oral anticoagulants. While these agents have expanded the options for preventing and treating thromboembolism, unfractionated heparin and warfarin are still the most appropriate choices for many patients, eg, those with stage 4 chronic kidney disease and end-stage renal disease on dialysis, and those with mechanical heart valves.
In addition, unfractionated heparin remains the anticoagulant of choice during procedures such as hemodialysis, percutaneous transluminal angioplasty, and cardiopulmonary bypass, as well as in hospitalized and critically ill patients, who often have acute kidney injury or require frequent interruptions of therapy for invasive procedures. In these scenarios, unfractionated heparin is typically preferred because of its short plasma half-life, complete reversibility by protamine, safety regardless of renal function, and low cost compared with parenteral direct thrombin inhibitors.
As long as unfractionated heparin and warfarin remain important therapies, the need for their laboratory monitoring continues. For warfarin monitoring, the prothrombin time and international normalized ratio are validated and widely reproducible methods. But monitoring unfractionated heparin therapy remains a challenge.
UNFRACTIONATED HEPARIN’S EFFECT IS UNPREDICTABLE
Unfractionated heparin, a negatively charged mucopolysaccharide, inhibits coagulation by binding to antithrombin through the high-affinity pentasaccharide sequence.1–6 Such binding induces a conformational change in the antithrombin molecule, converting it to a rapid inhibitor of several coagulation proteins, especially factors IIa and Xa.2–4
Unfractionated heparin inhibits factors IIa and Xa in a 1:1 ratio, but low-molecular-weight heparins inhibit factor Xa more than factor IIa, with IIa-Xa inhibition ratios ranging from 1:2 to 1:4, owing to their smaller molecular size.7
One of the most important reasons for the unpredictable and highly variable individual responses to unfractionated heparin is that, infused into the blood, the large and negatively charged unfractionated heparin molecules bind nonspecifically to positively charged plasma proteins.7 In patients who are critically ill, have acute infections or inflammatory states, or have undergone major surgery, unfractionated heparin binds to acute-phase proteins that are elevated, particularly factor VIII. This results in fewer free heparin molecules and a variable anticoagulant effect.8
In contrast, low-molecular-weight heparins have longer half-lives and bind less to plasma proteins, resulting in more predictable plasma levels following subcutaneous injection.9
MONITORING UNFRACTIONATED HEPARIN IMPROVES OUTCOMES
In 1960, Barritt and Jordan10 conducted a small but landmark trial that established the clinical importance of unfractionated heparin for treating venous thromboembolism. None of the patients who received unfractionated heparin for acute pulmonary embolism developed a recurrence during the subsequent 2 weeks, while 50% of those who did not receive it had recurrent pulmonary embolism, fatal in half of the cases.
The importance of achieving a specific aPTT therapeutic target was not demonstrated until a 1972 study by Basu et al,11 in which 162 patients with venous thromboembolism were treated with heparin with a target aPTT of 1.5 to 2.5 times the control value. Patients who suffered recurrent events had subtherapeutic aPTT values on 71% of treatment days, while the rest of the patients, with no recurrences, had subtherapeutic aPTT values only 28% of treatment days. The different outcomes could not be explained by the average daily dose of unfractionated heparin, which was similar in the patients regardless of recurrence.
Subsequent studies showed that the best outcomes occur when unfractionated heparin is given in doses high enough to rapidly achieve a therapeutic prolongation of the aPTT,12–14 and that the total daily dose is also important in preventing recurrences.15,16 Failure to achieve a target aPTT within 24 hours of starting unfractionated heparin is associated with increased risk of recurrent venous thromboembolism.13,17
Raschke et al17 found that patients prospectively randomized to weight-based doses of intravenous unfractionated heparin (bolus plus infusion) achieved significantly higher rates of therapeutic aPTT within 6 hours and 24 hours after starting the infusion, and had significantly lower rates of recurrent venous thromboembolism than those randomized to a fixed unfractionated heparin protocol, without an increase in major bleeding.
Smith et al,18 in a study of 400 consecutive patients with acute pulmonary embolism treated with unfractionated heparin, found that patients who achieved a therapeutic aPTT within 24 hours had lower in-hospital and 30-day mortality rates than those who did not achieve the first therapeutic aPTT until more than 24 hours after starting unfractionated heparin infusion.
Such data lend support to the widely accepted practice and current guideline recommendation8 of using laboratory assays to adjust the dose of unfractionated heparin to achieve and maintain a therapeutic target. The use of dosing nomograms significantly reduces the time to achieve a therapeutic aPTT while minimizing subtherapeutic and supratherapeutic unfractionated heparin levels.19,20
THE aPTT REFLECTS THROMBIN INHIBITION
The aPTT has a log-linear relationship with plasma concentrations of unfractionated heparin,21 but it was not developed specifically for monitoring unfractionated heparin therapy. Originally described in 1953 as a screening tool for hemophilia,22–24 the aPTT is prolonged in the setting of factor deficiencies (typically with levels < 45%, except for factors VII and XIII), as well as lupus anticoagulants and therapy with parenteral direct thrombin inhibitors.8,25,26
Because thrombin (factor IIa) is 10 times more sensitive than factor Xa to inhibition by the heparin-antithrombin complex,4,7 thrombin inhibition appears to be the most likely mechanism by which unfractionated heparin prolongs the aPTT. In contrast, aPTT is minimally or not at all prolonged by low-molecular-weight heparins, which are predominantly factor Xa inhibitors.7
HEPARIN ASSAYS MEASURE UNFRACTIONATED HEPARIN ACTIVITY
While the aPTT is a surrogate marker of unfractionated heparin activity in plasma, unfractionated heparin activity can be measured more precisely by so-called heparin assays, which are typically not direct measures of the plasma concentration of heparins, but rather functional assays that provide indirect estimates. They include protamine sulfate titration assays and anti-Xa assays.
Protamine sulfate titration assays measure the amount of protamine sulfate required to neutralize heparin: the more protamine required, the greater the estimated concentration of unfractionated heparin in plasma.8,27–29 Protamine titration assays are technically demanding, so they are rarely used clinically.
Anti-Xa assays provide a measure of the functional level of heparins in plasma.29–33 Chromogenic anti-Xa assays are available on automated analyzers with standardized kits29,33,34 and may be faster to perform than the aPTT.35
Experiments in rabbits show that unfractionated heparin inhibits thrombus formation and extension at concentrations of 0.2 to 0.4 U/mL as measured by the protamine titration assay,27 which correlated with an anti-Xa activity of 0.35 to 0.67 U/mL in a randomized controlled trial.32
Assays that directly measure the plasma concentration of heparin exist but are not clinically relevant because they also measure heparin molecules lacking the pentasaccharide sequence, which have no anticoagulant activity.36
ANTI-Xa ASSAY VS THE aPTT
Anti-Xa assays are more expensive than the aPTT and are not available in all hospitals. For these reasons, the aPTT remains the most commonly used laboratory assay for monitoring unfractionated heparin therapy.
However, the aPTT correlates poorly with the activity level of unfractionated heparin in plasma. In one study, an anti-Xa level of 0.3 U/mL corresponded to aPTT results ranging from 47 to 108 seconds.31 Furthermore, in studies that used a heparin therapeutic target based on an aPTT ratio 1.5 to 2.5 times the control aPTT value, the lower end of that target range was often associated with subtherapeutic plasma unfractionated heparin activity measured by anti-Xa and protamine titration assays.28,31
Because of these limitations, individual laboratories should determine their own aPTT therapeutic target ranges for unfractionated heparin based on the response curves obtained with the reagent and coagulometer used. The optimal therapeutic aPTT range for treating acute venous thromboembolism should be defined as the aPTT range (in seconds) that correlates with a plasma activity level of unfractionated heparin of 0.3 to 0.7 U/mL based on a chromogenic anti-Xa assay, or 0.2 to 0.4 U/mL based on a protamine titration assay.32,34–36
Nevertheless, the anticoagulant effect of unfractionated heparin as measured by the aPTT can be unpredictable and can vary widely among individuals and in the same patient.7 This wide variability can be explained by a number of technical and biologic variables. Different commercial aPTT reagents, different lots of the same reagent, and different reagent and instrument combinations have different sensitivities to unfractionated heparin, which can lead to variable aPTT results.37 Moreover, high plasma levels of acute-phase proteins, low plasma antithrombin levels, consumptive coagulopathies, liver failure, and lupus anticoagulants may also affect the aPTT.7,25,32,36–41 These variables account for the poor correlation—ranging from 25% to 66%—reported between aPTT and anti-Xa assays.32,42–48
Such discrepancies may have serious clinical implications: if a patient’s aPTT is low (subtherapeutic) or high (supratherapeutic) but the anti-Xa assay result is within the therapeutic range (0.3–0.7 units/mL), changing the dose of unfractionated heparin (guided by an aPTT nomogram) may increase the risk of bleeding or of recurrent thromboembolism.
CLINICAL APPLICABILITY OF THE ANTI-Xa ASSAY
Neither anti-Xa nor protamine titration assays are standardized across reference laboratories, but chromogenic anti-Xa assays have better interlaboratory correlation than the aPTT49,50 and can be calibrated specifically for unfractionated or low-molecular-weight heparins.29,33
Although reagent costs are higher for chromogenic anti-Xa assays than for the aPTT, some technical variables (described below) may partially offset the cost difference.29,33,41 In addition, unlike the aPTT, anti-Xa assays do not need local calibration; the therapeutic range for unfractionated heparin is the same (0.3–0.7 U/mL) regardless of instrument or reagent.33,41
Most important, studies have found that patients monitored by anti-Xa assay achieve significantly higher rates of therapeutic anticoagulation within 24 and 48 hours after starting unfractionated heparin infusion than those monitored by the aPTT. Fewer dose adjustments and repeat tests are required, which may also result in lower cost.32,51–55
While these studies found chromogenic anti-Xa assays better for achieving laboratory end points, data regarding relevant clinical outcomes are more limited. In a retrospective, observational cohort study,51 the rate of venous thromboembolism or bleeding-related death was 2% in patients receiving unfractionated heparin therapy monitored by anti-Xa assay and 6% in patients monitored by aPTT (P = .62). Rates of major hemorrhage were also not significantly different.
In a randomized controlled trial32 in 131 patients with acute venous thromboembolism and heparin resistance, rates of recurrent venous thromboembolism were 4.6% and 6.1% in the groups randomized to anti-Xa and aPTT monitoring, respectively, whereas overall bleeding rates were 1.5% and 6.1%, respectively. Again, the differences were not statistically significant.
Heparin resistance. Some patients require unusually high doses of unfractionated heparin to achieve a therapeutic aPTT: typically, more than 35,000 U over 24 hours,7,8,32 or total daily doses that exceed their estimated weight-based requirements. Heparin resistance has been observed in various clinical settings.7,8,32,37–40,59–61 Patients with heparin resistance monitored by anti-Xa had similar rates of recurrent venous thromboembolism while receiving significantly lower doses of unfractionated heparin than those monitored by the aPTT.32
Lupus anticoagulant. Patients with the specific antiphospholipid antibody known as lupus anticoagulant frequently have a prolonged baseline aPTT,25 making it an unreliable marker of anticoagulant effect for intravenous unfractionated heparin therapy.
Critically ill infants and children. Arachchillage et al35 found that infants (< 1 year old) treated with intravenous unfractionated heparin in an intensive care department had only a 32.4% correlation between aPTT and anti-Xa levels, which was lower than that found in children ages 1 to 15 (66%) and adults (52%). In two-thirds of cases of discordant aPTT and anti-Xa levels, the aPTT was elevated (supratherapeutic) while the anti-Xa assay was within the therapeutic range (0.3–0.7 U/mL). Despite the lack of data on clinical outcomes (eg, rates of thrombosis and bleeding) with the use of an anti-Xa assay, it has been considered the method of choice for unfractionated heparin monitoring in critically ill children, and especially in those under age 1.41,44,62–64
While anti-Xa assays may also be better for unfractionated heparin monitoring in critically ill adults, the lack of clinical outcome data from large-scale randomized trials has precluded evidence-based recommendations favoring them over the aPTT.8,34
LIMITATIONS OF ANTI-Xa ASSAYS
Anti-Xa assays are hampered by some technical limitations:
Samples must be processed within 1 hour to avoid heparin neutralization.34
Samples must be clear. Hemolyzed or opaque samples (eg, due to bilirubin levels > 6.6 mg/dL or triglyceride levels > 360 mg/dL) cannot be processed, as they can cause falsely low levels.
Exposure to other anticoagulants can interfere with the results. The anti-Xa assay may be unreliable for unfractionated heparin monitoring in patients who are transitioned from low-molecular-weight heparins, fondaparinux, or an oral factor Xa inhibitor (apixaban, betrixaban, edoxaban, rivaroxaban) to intravenous unfractionated heparin, eg, due to hospitalization or acute kidney injury.65,66 Different reports have found that anti-Xa assays may be elevated for as long as 63 to 96 hours after the last dose of oral Xa inhibitors,67–69 potentially resulting in underdosing of unfractionated heparin. In such settings, unfractionated heparin therapy should be monitored by the aPTT.
ANTI-Xa ASSAYS AND LOW-MOLECULAR-WEIGHT HEPARINS
Most patients receiving low-molecular-weight heparins do not need laboratory monitoring.8 Alhenc-Gelas et al70 randomized patients to receive dalteparin in doses either based on weight or guided by anti-Xa assay results, and found that dose adjustments were rare and lacked clinical benefit.
The suggested therapeutic anti-Xa levels for low-molecular-weight heparins are:
- 0.5–1.2 U/mL for twice-daily enoxaparin
- 1.0–2.0 U/mL for once-daily enoxaparin or dalteparin.
Levels should be measured at peak plasma level (ie, 3–4 hours after subcutaneous injection, except during pregnancy, when it is 4–6 hours), and only after at least 3 doses of low-molecular-weight heparin.8,71 Unlike the anti-Xa therapeutic range recommended for unfractionated heparin therapy, these ranges are not based on prospective data, and if the assay result is outside the suggested therapeutic target range, current guidelines offer no advice on safely adjusting the dose.8,71
Measuring anti-Xa activity is particularly important for pregnant women with a mechanical prosthetic heart valve who are treated with low-molecular-weight heparins. In this setting, valve thrombosis and cardioembolic events have been reported in patients with peak low-molecular-weight heparin anti-Xa assay levels below or even at the lower end of the therapeutic range, and increased bleeding risk has been reported with elevated anti-Xa levels.71–74 Measuring trough low-molecular-weight heparin anti-Xa levels has been suggested to guide dose adjustments during pregnancy.75
Clearance of low-molecular-weight heparins as measured by the anti-Xa assay is highly correlated with creatinine clearance.76,77 A strong linear correlation has been demonstrated between creatine clearance and anti-Xa levels of enoxaparin after multiple therapeutic doses, and low-molecular-weight heparins accumulate in the plasma, especially in patients with creatine clearance less than 30 mL/min.78 The risk of major bleeding is significantly increased in patients with severe renal insufficiency (creatinine clearance < 30 mL/min) not on dialysis who are treated with either prophylactic or therapeutic doses of low-molecular-weight heparin.79–81 In a meta-analysis, the risk of bleeding with therapeutic-intensity doses of enoxaparin was 4 times higher than with prophylactic-intensity doses.79 Although bleeding risk appears to be reduced when the enoxaparin dose is reduced by 50%,8 the efficacy and safety of this strategy has not been determined by prospective trials.
ANTI-Xa ASSAYS IN PATIENTS RECEIVING DIRECT ORAL ANTICOAGULANTS
Direct oral factor Xa inhibitors cannot be measured accurately by heparin anti-Xa assays. Nevertheless, such assays may be useful to assess whether clinically relevant plasma levels are present in cases of major bleeding, suspected anticoagulant failure, or patient noncompliance.82
Intense research has focused on developing drug-specific chromogenic anti-Xa assays using calibrators and standards for apixaban, edoxaban, and rivaroxaban,82,83 and good linear correlation has been shown with some assays.82,84 In patients treated with oral factor Xa inhibitors who need to undergo an urgent invasive procedure associated with high bleeding risk, use of a specific reversal agent may be considered with drug concentrations more than 30 ng/mL measured by a drug-specific anti-Xa assay. A similar suggestion has been made for drug concentrations more than 50 ng/mL in the setting of major bleeding.85 Unfortunately, such assays are not widely available at this time.82,86
While drug-specific anti-Xa assays could become clinically important to guide reversal strategies, their relevance for drug monitoring remains uncertain. This is because no therapeutic target ranges have been established for any of the direct oral anticoagulants, which were approved on the basis of favorable clinical trial outcomes that neither measured nor were correlated with specific drug levels in plasma. Therefore, a specific anti-Xa level cannot yet be used as a marker of clinical efficacy for any specific oral direct Xa inhibitor.
- Abildgaard U. Highly purified antithrombin 3 with heparin cofactor activity prepared by disc electrophoresis. Scand J Clin Lab Invest 1968; 21(1):89–91. pmid:5637480
- Rosenberg RD, Lam L. Correlation between structure and function of heparin. Proc Natl Acad Sci USA 1979; 76(3):1218–1222. pmid:286307
- Lindahl U, Bäckström G, Höök M, Thunberg L, Fransson LA, Linker A. Structure of the antithrombin-binding site of heparin. Proc Natl Acad Sci USA 1979; 76(7):3198–3202. pmid:226960
- Rosenberg RD, Rosenberg JS. Natural anticoagulant mechanisms. J Clin Invest 1984; 74(1):1–6. doi:10.1172/JCI111389
- Casu B, Oreste P, Torri G, et al. The structure of heparin oligosaccharide fragments with high anti-(factor Xa) activity containing the minimal antithrombin III-binding sequence. Chemical and 13C nuclear-magnetic-resonance studies. Biochem J 1981; 197(3):599–609. pmid:7325974
- Choay J, Lormeau JC, Petitou M, Sinaÿ P, Fareed J. Structural studies on a biologically active hexasaccharide obtained from heparin. Ann NY Acad Sci 1981; 370: 644–649. pmid:6943974
- Hirsh J, Warkentin TE, Shaughnessy SG, et al. Heparin and low-molecular-weight heparin: mechanisms of action, pharmacokinetics, dosing, monitoring, efficacy, and safety. Chest 2001; 119(suppl 1):64S–94S. pmid:11157643
- Garcia DA, Baglin TP, Weitz JI, Samama MM. Parenteral anticoagulants: antithrombotic therapy and prevention of thrombosis, 9th ed: American College of Chest Physicians Evidence-Based Clinical Practice Guidelines. Chest 2012; 141(suppl 2):e24S–e43S. doi:10.1378/chest.11-2291
- Hirsh J, Levine M. Low-molecular weight heparin. Blood 1992; 79(1):1–17. pmid:1309422
- Barritt DW, Jordan SC. Anticoagulant drugs in the treatment of pulmonary embolism. A controlled trial. Lancet 1960; 1(7138):1309–1312. pmid:13797091
- Basu D, Gallus A, Hirsh J, Cade J. A prospective study of the value of monitoring heparin treatment with the activated partial thromboplastin time. N Engl J Med 1972; 287(7):324–327. doi:10.1056/NEJM197208172870703
- Hull RD, Raskob GE, Hirsh J, et al. Continuous intravenous heparin compared with intermittent subcutaneous heparin in the initial treatment of proximal-vein thrombosis. N Engl J Med 1986; 315(18):1109–1114. doi:10.1056/NEJM198610303151801
- Hull RD, Raskob GE, Brant RF, Pineo GF, Valentine KA. Relation between the time to achieve the lower limit of the APTT therapeutic range and recurrent venous thromboembolism during heparin treatment for deep vein thrombosis. Arch Intern Med 1997; 157(22):2562–2568. pmid:9531224
- Hull RD, Raskob GE, Brant RF, Pineo GF, Valentine KA. The importance of initial heparin treatment on long-term clinical outcomes of antithrombotic therapy. The emerging theme of delayed recurrence. Arch Intern Med 1997; 157(20):2317–2321. pmid:9361572
- Anand S, Ginsberg JS, Kearon C, Gent M, Hirsh J. The relation between the activated partial thromboplastin time response and recurrence in patients with venous thrombosis treated with continuous intravenous heparin. Arch Intern Med 1996; 156(15):1677–1681. pmid:8694666
- Anand SS, Bates S, Ginsberg JS, et al. Recurrent venous thrombosis and heparin therapy: an evaluation of the importance of early activated partial thromboplastin times. Arch Intern Med 1999; 159(17):2029–2032. pmid:10510988
- Raschke RA, Reilly BM, Guidry JR, Fontana JR, Srinivas S. The weight-based heparin dosing nomogram compared with a “standard care” nomogram. A randomized controlled trial. Ann Intern Med 1993; 119(9):874–881. pmid:8214998
- Smith SB, Geske JB, Maguire JM, Zane NA, Carter RE, Morgenthaler TI. Early anticoagulation is associated with reduced mortality for acute pulmonary embolism. Chest 2010; 137(6):1382–1390. doi:10.1378/chest.09-0959
- Cruickshank MK, Levine MN, Hirsh J, Roberts R, Siguenza M. A standard heparin nomogram for the management of heparin therapy. Arch Intern Med 1991; 151(2):333–337. pmid:1789820
- Raschke RA, Gollihare B, Peirce J. The effectiveness of implementing the weight-based heparin nomogram as a practice guideline. Arch Intern Med 1996; 156(15):1645–1649. pmid:8694662
- Simko RJ, Tsung FF, Stanek EJ. Activated clotting time versus activated partial thromboplastin time for therapeutic monitoring of heparin. Ann Pharmacother 1995; 29(10):1015–1021. doi:10.1177/106002809502901012
- Langdell RD, Wagner RH, Brinkhous KM. Effect of antihemophilic factor on one-stage clotting tests; a presumptive test for hemophilia and a simple one-stage antihemophilic factor assy procedure. J Lab Clin Med 1953; 41(4):637–647.
- White GC 2nd. The partial thromboplastin time: defining an era in coagulation. J Thromb Haemost 2003; 1(11):2267–2270. pmid:14629454
- Proctor RR, Rapaport SI. The partial thromboplastin time with kaolin. A simple screening test for first stage plasma clotting factor deficiencies. Am J Clin Pathol 1961; 36:212–219. pmid:13738153
- Brandt JT, Triplett DA, Rock WA, Bovill EG, Arkin CF. Effect of lupus anticoagulants on the activated partial thromboplastin time. Results of the College of American Pathologists survey program. Arch Pathol Lab Med 1991; 115(2):109–114. pmid:1899555
- Tripodi A, Mannucci PM. Activated partial thromboplastin time (APTT). New indications for an old test? J Thromb Haemost 2006; 4(4):750–751. doi:10.1111/j.1538-7836.2006.01857.x
- Chiu HM, Hirsh J, Yung WL, Regoeczi E, Gent M. Relationship between the anticoagulant and antithrombotic effects of heparin in experimental venous thrombosis. Blood 1977; 49(2):171–184. pmid:831872
- Brill-Edwards P, Ginsberg JS, Johnston M, Hirsh J. Establishing a therapeutic range for heparin therapy. Ann Intern Med 1993; 119(2):104–109. pmid:8512158
- Vandiver JW, Vondracek TG. Antifactor Xa levels versus activated partial thromboplastin time for monitoring unfractionated heparin. Pharmacotherapy 2012; 32(6):546–558. doi:10.1002/j.1875-9114.2011.01049.x
- Newall F. Anti-factor Xa (anti-Xa). In: Monagle P, ed. Haemostasis: Methods and Protocols. New York, NY: Springer-Verlag; 2013.
- Bates SM, Weitz JI, Johnston M, Hirsh J, Ginsberg JS. Use of a fixed activated partial thromboplastin time ratio to establish a therapeutic range for unfractionated heparin. Arch Intern Med 2001; 161(3):385–391. pmid:11176764
- Levine MN, Hirsh J, Gent M, et al. A randomized trial comparing activated thromboplastin time with heparin assay in patients with acute venous thromboembolism requiring large doses of heparin. Arch Intern Med 1994; 154(1):49–56. pmid:8267489
- Wool GD, Lu CM; Education Committee of the Academy of Clinical Laboratory Physicians and Scientists. Pathology consultation on anticoagulation monitoring: factor X-related assays. Am J Clin Pathol 2013; 140(5):623–634. doi:10.1309/AJCPR3JTOK7NKDBJ
- Lehman CM, Frank EL. Laboratory monitoring of heparin therapy: partial thromboplastin time or anti-Xa assay? Lab Med 2009; 40(1):47–51. doi:10.1309/LM9NJGW2ZIOLPHY6
- Arachchillage DR, Kamani F, Deplano S, Banya W, Laffan M. Should we abandon the aPTT for monitoring unfractionated heparin? Thromb Res 2017; 157:157–161. doi:10.1016/j.thromres.2017.07.006
- Olson JD, Arkin CA, Brandt JT, et al. College of American Pathologists Conference XXXI on Laboratory Monitoring of Anticoagulant Therapy: laboratory monitoring of unfractionated heparin therapy. Arch Pathol Lab Med 1998; 122(9):782–798. pmid:9740136
- Eikelboom JW, Hirsh J. Monitoring unfractionated heparin with the aPTT: time for a fresh look. Thromb Haemost 2006; 96(5):547–552. pmid:17080209
- Young E, Prins M, Levine MN, Hirsh J. Heparin binding to plasma proteins, an important mechanism of heparin resistance. Thromb Haemost 1992; 67(6):639–643. pmid:1509402
- Edson JR, Krivit W, White JG. Kaolin partial thromboplastin time: high levels of procoagulants producing short clotting times or masking deficiencies of other procoagulants or low concentrations of anticoagulants. J Lab Clin Med 1967; 70(3):463–470. pmid:6072020
- Whitfield LR, Lele AS, Levy G. Effect of pregnancy on the relationship between concentration and anticoagulant action of heparin. Clin Pharmacol Ther 1983; 34(1):23–28. pmid:6861435
- Marci CD, Prager D. A review of the clinical indications for the plasma heparin assay. Am J Clin Pathol 1993; 99(5):546–550.
- Takemoto CM, Streiff MB, Shermock KM, et al. Activated partial thromboplastin time and anti-Xa measurements in heparin monitoring: biochemical basis of discordance. Am J Clin Pathol 2013; 139(4):450–456. doi:10.1309/AJCPS6OW6DYNOGNH
- Adatya S, Uriel N, Yarmohammadi H, et al. Anti-factor Xa and activated partial thromboplastin time measurements for heparin monitoring in mechanical circulatory support. JACC Heart Fail 2015; 3(4):314–322. doi:10.1016/j.jchf.2014.11.009
- Kuhle S, Eulmesekian P, Kavanagh B, et al. Lack of correlation between heparin dose and standard clinical monitoring tests in treatment with unfractionated heparin in critically ill children. Haematologica 2007; 92(4):554–557. pmid:17488668
- Price EA, Jin J, Nguyen HM, Krishnan G, Bowen R, Zehnder JL. Discordant aPTT and anti-Xa values and outcomes in hospitalized patients treated with intravenous unfractionated heparin. Ann Pharmacother 2013; 47(2):151–158. doi:10.1345/aph.1R635
- Baker BA, Adelman MD, Smith PA, Osborn JC. Inability of the activated partial thromboplastin time to predict heparin levels. Arch Intern Med 1997; 157(21):2475–2479. pmid:9385299
- Koerber JM, Smythe MA, Begle RL, Mattson JC, Kershaw BP, Westley SJ. Correlation of activated clotting time and activated partial thromboplastin time to plasma heparin concentration. Pharmacotherapy 1999; 19(8):922–931. pmid:10453963
- Smythe MA, Mattson JC, Koerber JM. The heparin anti-Xa therapeutic range: are we there yet? Chest 2002; 121(1):303–304. pmid:11796474
- Cuker A, Ptashkin B, Konkle A, et al. Interlaboratory agreement in the monitoring of unfractionated heparin using the anti-factor Xa-correlated activated partial thromboplastin time. J Thromb Haemost 2009; 7(1):80–86. doi:10.1111/j.1538-7836.2008.03224.x
- Taylor CT, Petros WP, Ortel TL. Two instruments to determine activated partial thromboplastin time: implications for heparin monitoring. Pharmacotherapy 1999; 19(4):383–387. pmid:10212007
- Guervil DJ, Rosenberg AF, Winterstein AG, Harris NS, Johns TE, Zumberg MS. Activated partial thromboplastin time versus antifactor Xa heparin assay in monitoring unfractionated heparin by continuous intravenous infusion. Ann Pharmacother 2011; 45(7–8):861–868. doi:10.1345/aph.1Q161
- Fruge KS, Lee YR. Comparison of unfractionated heparin protocols using antifactor Xa monitoring or activated partial thrombin time monitoring. Am J Health Syst Pharm 2015; 72(17 suppl 2):S90–S97. doi:10.2146/sp150016
- Rosborough TK. Monitoring unfractionated heparin therapy with antifactor Xa activity results in fewer monitoring tests and dosage changes than monitoring with activated partial thromboplastin time. Pharmacotherapy 1999; 19(6):760–766. pmid:10391423
- Rosborough TK, Shepherd MF. Achieving target antifactor Xa activity with a heparin protocol based on sex, age, height, and weight. Pharmacotherapy 2004; 24(6):713–719. doi:10.1592/phco.24.8.713.36067
- Smith ML, Wheeler KE. Weight-based heparin protocol using antifactor Xa monitoring. Am J Health Syst Pharm 2010; 67(5):371–374. doi:10.2146/ajhp090123
- Bartholomew JR, Kottke-Marchant K. Monitoring anticoagulation therapy in patients with the lupus anticoagulant. J Clin Rheumatol 1998; 4(6):307–312. pmid:19078327
- Wool GD, Lu CM; Education Committee of the Academy of Clinical Laboratory Physicians and Scientists. Pathology consultation on anticoagulation monitoring: factor X-related assays. Am J Clin Pathol 2013; 140(5):623–634. doi:10.1309/AJCPR3JTOK7NKDBJ
- Mehta TP, Smythe MA, Mattson JC. Strategies for managing heparin therapy in patients with antiphospholipid antibody syndrome. Pharmacotherapy 2011; 31(12):1221–1231. doi:10.1592/phco.31.12.1221
- Levine SP, Sorenson RR, Harris MA, Knieriem LK. The effect of platelet factor 4 (PF4) on assays of plasma heparin. Br J Haematol 1984; 57(4):585–596. pmid:6743573
- Fisher AR, Bailey CR, Shannon CN, Wielogorski AK. Heparin resistance after aprotinin. Lancet 1992; 340(8829):1230–1231. pmid:1279335
- Becker RC, Corrao JM, Bovill EG, et al. Intravenous nitroglycerin-induced heparin resistance: a qualitative antithrombin III abnormality. Am Heart J 1990; 119(6):1254–1261. pmid:2112878
- Monagle P, Chan AK, Goldenberg NA, et al. Antithrombotic therapy in neonates and children: Antithrombotic Therapy and Prevention of Thrombosis, 9th ed: American College of Chest Physicians Evidence-Based Clinical Practice Guidelines. Chest 2012; 141(suppl 2):e737S–e801S. doi:10.1378/chest.11-2308
- Long E, Pitfield AF, Kissoon N. Anticoagulation therapy: indications, monitoring, and complications. Pediatr Emerg Care 2011; 27(1):55–61. doi:10.1097/PEC.0b013e31820461b1
- Andrew M, Schmidt B. Use of heparin in newborn infants. Semin Thromb Hemost 1988; 14(1):28–32. doi:10.1055/s-2007-1002752
- Teien AN, Lie M, Abildgaard U. Assay of heparin in plasma using a chromogenic substrate for activated factor X. Thromb Res 1976; 8(3):413–416. pmid:1265712
- Vera-Aguillera J, Yousef H, Beltran-Melgarejo D, et al. Clinical scenarios for discordant anti-Xa. Adv Hematol 2016; 2016:4054806. doi:10.1155/2016/4054806
- Macedo KA, Tatarian P, Eugenio KR. Influence of direct oral anticoagulants on anti-factor Xa measurements utilized for monitoring heparin. Ann Pharmacother 2018; 52(2):154–159. doi:10.1177/1060028017729481
- Wendte J, Voss G, Van Overschelde B. Influence of apixaban on antifactor Xa levels in a patient with acute kidney injury. Am J Health Syst Pharm 2016; 73(8):563–567. doi:10.2146/ajhp150360
- Faust AC, Kanyer D, Wittkowsky AK. Managing transitions from oral factor Xa inhibitors to unfractionated heparin infusions. Am J Health Syst Pharm 2016; 73(24):2037–2041. doi:10.2146/ajhp150596
- Alhenc-Gelas M, Jestin-Le Guernic C, Vitoux JF, Kher A, Aiach M, Fiessinger JN. Adjusted versus fixed doses of the low-molecular-weight heparin fragmin in the treatment of deep vein thrombosis. Fragmin-Study Group. Thromb Haemost 1994; 71(6):698–702. pmid:7974334
- Bates SM, Greer IA, Middeldorp S, Veenstra DL, Prabulos AM, Vandvik PO. VTE, thrombophilia, antithrombotic therapy, and pregnancy: Antithrombotic Therapy and Prevention of Thrombosis, 9th ed: American College of Chest Physicians Evidence-Based Clinical Practice Guidelines. Chest 2012; 141(suppl 2):e691S–e736S. doi:10.1378/chest.11-2300
- Bara L, Leizorovicz A, Picolet H, Samama M. Correlation between anti-Xa and occurrence of thrombosis and haemorrhage in post-surgical patients treated with either Logiparin (LMWH) or unfractionated heparin. Post-surgery Logiparin Study Group. Thromb Res 1992; 65(4–5):641–650. pmid:1319619
- Prandoni P, Lensing AW, Büller HR, et al. Comparison of subcutaneous low-molecular-weight heparin with intravenous standard heparin in proximal deep-vein thrombosis. Lancet 1992; 339(8791):441–445. pmid:1346817
- Walenga JM, Hoppensteadt D, Fareed J. Laboratory monitoring of the clinical effects of low molecular weight heparins. Thromb Res Suppl 1991;14:49–62. pmid:1658970
- Elkayam U. Anticoagulation therapy for pregnant women with mechanical prosthetic heart valves: how to improve safety? J Am Coll Cardiol 2017; 69(22):2692–2695. doi:10.1016/j.jacc.2017.04.034
- Brophy DF, Wazny LD, Gehr TW, Comstock TJ, Venitz J. The pharmacokinetics of subcutaneous enoxaparin in end-stage renal disease. Pharmacotherapy 2001; 21(2):169–174. pmid:11213853
- Becker RC, Spencer FA, Gibson M, et al; TIMI 11A Investigators. Influence of patient characteristics and renal function on factor Xa inhibition pharmacokinetics and pharmacodynamics after enoxaparin administration in non-ST-segment elevation acute coronary syndromes. Am Heart J 2002; 143(5):753–759. pmid:12040334
- Chow SL, Zammit K, West K, Dannenhoffer M, Lopez-Candales A. Correlation of antifactor Xa concentrations with renal function in patients on enoxaparin. J Clin Pharmacol 2003; 43(6):586–590. pmid:12817521
- Lim W, Dentali F, Eikelboom JW, Crowther MA. Meta-analysis: low-molecular-weight heparin and bleeding in patients with severe renal insufficiency. Ann Intern Med 2006; 144(9):673–684. pmid:16670137
- Spinler SA, Inverso SM, Cohen M, Goodman SG, Stringer KA, Antman EM; ESSENCE and TIMI 11B Investigators. Safety and efficacy of unfractionated heparin versus enoxaparin in patients who are obese and patients with severe renal impairment: analysis from the ESSENCE and TIMI 11B studies. Am Heart J 2003; 146(1):33–41. doi:10.1016/S0002-8703(03)00121-2
- Cestac P, Bagheri H, Lapeyre-Mestre M, et al. Utilisation and safety of low molecular weight heparins: prospective observational study in medical inpatients. Drug Saf 2003; 26(3):197–207. doi:10.2165/00002018-200326030-00005
- Douxfils J, Ageno W, Samama CM, et al. Laboratory testing in patients treated with direct oral anticoagulants: a practical guide for clinicians. J Thromb Haemost 2018; 16(2):209–219. doi:10.1111/jth.13912
- Samuelson BT, Cuker A, Siegal DM, Crowther M, Garcia DA. Laboratory assessment of the anticoagulant activity of direct oral anticoagulants: a systematic review. Chest 2017; 151(1):127–138. doi:10.1016/j.chest.2016.08.1462
- Gosselin RC, Francart SJ, Hawes EM, Moll S, Dager WE, Adcock DM. Heparin-calibrated chromogenic anti-Xa activity measurements in patients receiving rivaroxaban: can this test be used to quantify drug level? Ann Pharmacother 2015; 49(7):777–783. doi:10.1177/1060028015578451
- Levy JH, Ageno W, Chan NC, Crowther M, Verhamme P, Weitz JI; Subcommittee on Control of Anticoagulation. When and how to use antidotes for the reversal of direct oral anticoagulants: guidance from the SSC of the ISTH. J Thromb Haemost 2016; 14(3):623–627. doi:10.1111/jth.13227
- Cuker A, Siegal D. Monitoring and reversal of direct oral anticoagulants. Hematology Am Soc Hematol Educ Program 2015; 2015:117–124. doi:10.1182/asheducation-2015.1.117
KEY POINTS
- Intravenous unfractionated heparin treatment is typically monitored by the activated partial thromboplastin time (aPTT), with a therapeutic target defined as the range that corresponds to an anti-Xa level of 0.3 to 0.7 U/mL.
- Monitoring unfractionated heparin is important to achieve a therapeutic target within the first 24 hours and to maintain therapeutic levels thereafter.
- The heparin anti-Xa assay is unreliable for unfractionated heparin monitoring when switching from oral factor Xa inhibitor therapy to intravenous unfractionated heparin. In such cases, the aPTT is preferred.
- Most patients receiving low-molecular-weight heparin do not need monitoring, but monitoring should be considered for pregnant women with prosthetic heart valves, using an anti-Xa assay specific for low-molecular-weight heparin.