User login
NAFLD may predict arrhythmia recurrence post-AFib ablation
Increasingly recognized as an independent risk factor for new-onset atrial fibrillation (AFib), new research suggests for the first time that nonalcoholic fatty liver disease (NAFLD) also confers a higher risk for arrhythmia recurrence after AFib ablation.
Over 29 months of postablation follow-up, 56% of patients with NAFLD suffered bouts of arrhythmia, compared with 31% of patients without NAFLD, matched on the basis of age, sex, body mass index (BMI), ejection fraction within 5%, and AFib type (P < .0001).
The presence of NAFLD was an independent predictor of arrhythmia recurrence in multivariable analyses adjusted for several confounders, including hemoglobin A1c, BMI, and AFib type (hazard ratio, 3.0; 95% confidence interval, 1.94-4.68).
The association is concerning given that one in four adults in the United States has NAFLD, and up to 6.1 million Americans are estimated to have Afib. Previous studies, such as ARREST-AF and LEGACY, however, have demonstrated the benefits of aggressive preablation cardiometabolic risk factor modification on long-term AFib ablation success.
Indeed, none of the NAFLD patients in the present study who lost at least 10% of their body weight had recurrent arrhythmia, compared with 31% who lost less than 10%, and 91% who gained weight prior to ablation (P < .0001).
All 22 patients whose A1c increased during the 12 months prior to ablation had recurrent arrhythmia, compared with 36% of patients whose A1c improved (P < .0001).
“I don’t think the findings of the study were particularly surprising, given what we know. It’s just further reinforcement of the essential role of risk-factor modification,” lead author Eoin Donnellan, MD, Cleveland Clinic, said in an interview.
The results were published Augus 12 in JACC Clinical Electrophysiology.
For the study, the researchers examined data from 267 consecutive patients with a mean BMI of 32.7 kg/m2 who underwent radiofrequency ablation (98%) or cryoablation (2%) at the Cleveland Clinic between January 2013 and December 2017.
All patients were followed for at least 12 months after ablation and had scheduled clinic visits at 3, 6, and 12 months after pulmonary vein isolation, and annually thereafter.
NAFLD was diagnosed in 89 patients prior to ablation on the basis of CT imaging and abdominal ultrasound or MRI. On the basis of NAFLD-Fibrosis Score (NAFLD-FS), 13 patients had a low probability of liver fibrosis (F0-F2), 54 had an indeterminate probability, and 22 a high probability of fibrosis (F3-F4).
Compared with patients with no or early fibrosis (F0-F2), patients with advanced liver fibrosis (F3-F4) had almost a threefold increase in AFib recurrence (82% vs. 31%; P = .003).
“Cardiologists should make an effort to risk-stratify NAFLD patients either by NAFLD-FS or [an] alternative option, such as transient elastography or MR elastography, given these observations, rather than viewing it as either present or absence [sic] and involve expert multidisciplinary team care early in the clinical course of NAFLD patients with evidence of advanced fibrosis,” Dr. Donnellan and colleagues wrote.
Coauthor Thomas G. Cotter, MD, department of gastroenterology and hepatology, University of Chicago, said in an interview that cardiologists could use just the NAFLD-FS as part of an algorithm for an AFib.
“Because if it shows low risk, then it’s very, very likely the patient will be fine,” he said. “To use more advanced noninvasive testing, there are subtleties in the interpretation that would require referral to a liver doctor or a gastroenterologist and the cost of referring might bulk up the costs. But the NAFLD-FS is freely available and is a validated tool.”
Although it hasn’t specifically been validated in patients with AFib, the NAFLD-FS has been shown to correlate with the development of coronary artery disease (CAD) and was recommended for clinical use in U.S. multisociety guidelines for NAFLD.
The score is calculated using six readily available clinical variables (age, BMI, hyperglycemia or diabetes, AST/ALT, platelets, and albumin). It does not include family history or alcohol consumption, which should be carefully detailed given the large overlap between NAFLD and alcohol-related liver disease, Dr. Cotter observed.
Of note, the study excluded patients with alcohol consumption of more than 30 g/day in men and more than 20 g/day in women, chronic viral hepatitis, Wilson’s disease, and hereditary hemochromatosis.
Finally, CT imaging revealed that epicardial fat volume (EFV) was greater in patients with NAFLD than in those without NAFLD (248 vs. 223 mL; P = .01).
Although increased amounts of epicardial fat have been associated with CAD, there was no significant difference in EFV between patients who did and did not develop recurrent arrhythmia (238 vs. 229 mL; P = .5). Nor was EFV associated with arrhythmia recurrence on Cox proportional hazards analysis (HR, 1.001; P = .17).
“We hypothesized that the increased risk of arrhythmia recurrence may be mediated in part by an increased epicardial fat volume,” Dr. Donnellan said. “The existing literature exploring the link between epicardial fat volume and A[Fib] burden and recurrence is conflicting. But in both this study and our bariatric surgery study, epicardial fat volume was not a significant predictor of arrhythmia recurrence on multivariable analysis.”
It’s likely that the increased recurrence risk is caused by several mechanisms, including NAFLD’s deleterious impact on cardiac structure and function, the bidirectional relationship between NAFLD and sleep apnea, and transcription of proinflammatory cytokines and low-grade systemic inflammation, he suggested.
“Patients with NAFLD represent a particularly high-risk population for arrhythmia recurrence. NAFLD is a reversible disease, and a multidisciplinary approach incorporating dietary and lifestyle interventions should by instituted prior to ablation,” Dr. Donnellan and colleagues concluded.
They noted that serial abdominal imaging to assess for preablation changes in NAFLD was limited in patients and that only 56% of control subjects underwent dedicated abdominal imaging to rule out hepatic steatosis. Also, the heterogeneity of imaging modalities used to diagnose NAFLD may have influenced the results and the study’s single-center, retrospective design limits their generalizability.
The authors reported having no relevant financial relationships.
A version of this article originally appeared on Medscape.com.
A ‘foolproof’ way to diagnose narrow complex tachycardias on EKGs
A hospitalist looking at an EKG showing a narrow complex tachycardia needs to be able to come up with an accurate diagnosis of the rhythm pronto. And hospitalist Meghan Mary Walsh, MD, MPH, has developed a simple and efficient method for doing so within a minute or two that she’s used with great success on the wards and in teaching medical students and residents for nearly a decade.
she promised at HM20 Virtual, hosted by the Society of Hospital Medicine.
Her method involves asking three questions about the 12-lead EKG:
1) What’s the rate?
A narrow complex tachycardia by definition needs to be both narrow and fast, with a QRS complex of less than 0.12 seconds and a heart rate above 100 bpm. Knowing how far above 100 bpm the rate is will help with the differential diagnosis.
2) Is the rhythm regular or irregular?
“If I put the EKG 10 feet away from you, you should still be able to look at it and say the QRS is either systematically marching out – boom, boom, boom – or there is an irregular sea of QRS complexes where the RR intervals are variable and inconsistent,” said Dr. Walsh, a hospitalist at the University of Minnesota, Minneapolis, and chief academic officer at Hennepin Healthcare, where she oversees all medical students and residents training in the health system.
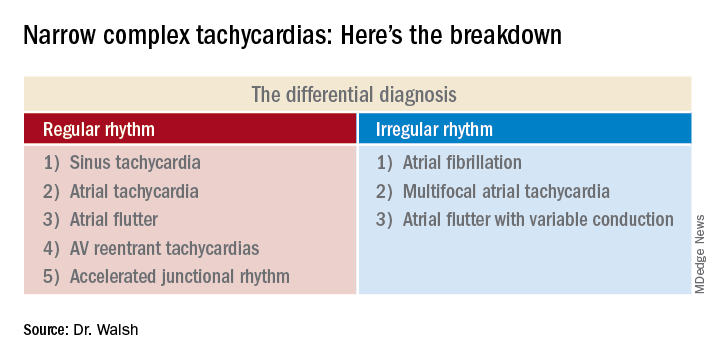
This distinction between a regular and irregular rhythm immediately narrows the differential by dividing the diagnostic possibilities into two columns (See chart). She urged her audience to commit the list to memory or keep it handy on their cell phone or in a notebook.
“If it’s irregular I’m going down the right column; if it’s regular I’m going down the left. And then I’m systematically running the drill,” she explained.
3) Are upright p waves present before each QRS complex in leads II and V1?
This information rules out some of the eight items in the differential diagnosis and rules in others.
Narrow complex tachycardias with an irregular rhythm
There are only three:
Atrial fibrillation: The heart rate is typically 110-160 bpm, although it can occasionally go higher. The rhythm is irregularly irregular: No two RR intervals on the EKG are exactly the same. And there are no p waves.
“If it’s faster than 100 bpm, irregularly irregular, and no p waves, the conclusion is very simple: It’s AFib,” Dr. Walsh said.
Multifocal atrial tachycardia (MAT): The heart rate is generally 100-150 bpm but can sometimes climb to about 180 bpm. The PP, PR, and RR intervals are varied, inconsistent, and don’t repeat. Most importantly, there are three or more different p wave morphologies in the same lead. One p wave might look like a tall mountain peak, another could be short and flat, and perhaps the next is big and broad.
MAT often occurs in patients with a structurally abnormal atrium – for example, in the setting of pulmonary hypertension leading to right atrial enlargement, with resultant depolarization occurring all over the atrium.
“Don’t confuse MAT with AFib: One has p waves, one does not. Otherwise they can look very similar,” she said.
Atrial flutter with variable conduction: A hallmark of this reentrant tachycardia is the atrial flutter waves occurring at about 300 bpm between each QRS complex.
“On board renewal exams, the question is often asked, ‘Which leads are the best identifiers of atrial flutter?’ And the answer is the inferior leads II, III, and aVF,” she said.
Another classic feature of atrial flutter with variable conduction is cluster beating attributable to a varied ventricular response. This results in a repeated pattern of irregular RR intervals: There might be a 2:1 block in AV conduction for several beats, then maybe a 4:1 block for several more, with resultant lengthening of the RR interval, then 3:1, with shortening of RR. This regularly irregular sequence is repeated throughout the EKG.
“Look for a pattern amidst the chaos,” the hospitalist advised.
The heart rate might be roughly 150 bpm with a 2:1 block, or 100 bpm with a 3:1 block. The p waves in atrial flutter with variable conduction can be either negatively or positively deflected.
Narrow complex tachycardias with a regular rhythm*
Sinus tachycardia: The heart rate is typically less than 160 bpm, the QRS complexes show a regular pattern, and upright p waves are clearly visible in leads II and V1.
The distinguishing feature of this arrhythmia is the ramping up and ramping down of the heart rate. The tachycardia is typically less than 160 bpm. But the rate doesn’t suddenly jump from, say, 70 to140 bpm in a flash while the patient is lying in the hospital bed. A trip to the telemetry room for a look at the telemetry strip will tell the tale: The heart rate will have progressively ramped up from 70, to 80, then 90, then 100, 110, 120, 130, to perhaps 140 bpm. And then it will similarly ramp back down in stages, with the up/down pattern being repeated.
Sinus tachycardia is generally a reflection of underlying significant systemic illness, such as sepsis, hypotension, or anemia.
Atrial tachycardia: The heart rate is generally 100-140 bpm, and p waves are present. But unlike in sinus tachycardia, the patient with atrial tachycardia lying in bed with a heart rate of 140 bpm is not in a state of profound neurohormonal activation and is not all that sick.
Another diagnostic clue is provided by a look at the telemonitoring strip. Unlike in sinus tachycardia, where the heart rate ramps up and then back down repeatedly, in atrial tachycardia the heart rate very quickly ramps up in stages to, say, 140 bpm, and then hangs there.
Atrial flutter: This is the only narrow complex tachycardia that appears in both the regular and irregular rhythm columns. It belongs in the irregular rhythm column when there is variable conduction and cluster beating, with a regularly irregular pattern of RR intervals. In contrast, when atrial flutter is in the regular rhythm column, it’s because the atrioventricular node is steadily conducting the atrial depolarizations at a rate of about 300 bpm. So there’s no cluster beating. As in atrial flutter with variable conduction, the flutter waves are visible most often in leads II, III, and aVF, where they can be either positively or negatively deflected.
AV reentrant tachycardias: These reentrant tachycardias can take two forms. In atrioventricular nodal reentrant tachycardia (AVnRT), the aberrant pathway is found entirely within the AV node, whereas in atrioventricular reentrant tachycardia (AVRT) the aberrant pathway is found outside the AV node. AVnRT is more common than AVRT. As in atrial flutter, there is no ramp up in heart rate. Patients will be lying in their hospital bed with a heart rate of, say, 80 bpm, and then suddenly it jumps to 180, 200, or even as high as 240 bpm “almost in a split second,” Dr. Walsh said.
No other narrow complex tachycardia reaches so high a heart rate. In both of these reentrant tachycardias the p waves are often buried in the QRS complex and can be tough to see. It’s very difficult to differentiate AVnRT from AVRT except by an electrophysiologic study.
Accelerated junctional tachycardia: This is most commonly the slowest of the narrow complex tachycardias, with a heart rate of less than 120 bpm.
“In the case of accelerated junctional tachycardia, think slow, think ‘regular,’ think of a rate often just over 100, usually with p waves after the QRS that are inverted because there’s retrograde conduction,” she advised.
She reported having no financial conflicts of interest regarding her presentation.
Correction, 8/19/20: An earlier version of this article mischaracterized the type of rhythm noted in this subhead.
A hospitalist looking at an EKG showing a narrow complex tachycardia needs to be able to come up with an accurate diagnosis of the rhythm pronto. And hospitalist Meghan Mary Walsh, MD, MPH, has developed a simple and efficient method for doing so within a minute or two that she’s used with great success on the wards and in teaching medical students and residents for nearly a decade.
she promised at HM20 Virtual, hosted by the Society of Hospital Medicine.
Her method involves asking three questions about the 12-lead EKG:
1) What’s the rate?
A narrow complex tachycardia by definition needs to be both narrow and fast, with a QRS complex of less than 0.12 seconds and a heart rate above 100 bpm. Knowing how far above 100 bpm the rate is will help with the differential diagnosis.
2) Is the rhythm regular or irregular?
“If I put the EKG 10 feet away from you, you should still be able to look at it and say the QRS is either systematically marching out – boom, boom, boom – or there is an irregular sea of QRS complexes where the RR intervals are variable and inconsistent,” said Dr. Walsh, a hospitalist at the University of Minnesota, Minneapolis, and chief academic officer at Hennepin Healthcare, where she oversees all medical students and residents training in the health system.
This distinction between a regular and irregular rhythm immediately narrows the differential by dividing the diagnostic possibilities into two columns (See chart). She urged her audience to commit the list to memory or keep it handy on their cell phone or in a notebook.
“If it’s irregular I’m going down the right column; if it’s regular I’m going down the left. And then I’m systematically running the drill,” she explained.
3) Are upright p waves present before each QRS complex in leads II and V1?
This information rules out some of the eight items in the differential diagnosis and rules in others.
Narrow complex tachycardias with an irregular rhythm
There are only three:
Atrial fibrillation: The heart rate is typically 110-160 bpm, although it can occasionally go higher. The rhythm is irregularly irregular: No two RR intervals on the EKG are exactly the same. And there are no p waves.
“If it’s faster than 100 bpm, irregularly irregular, and no p waves, the conclusion is very simple: It’s AFib,” Dr. Walsh said.
Multifocal atrial tachycardia (MAT): The heart rate is generally 100-150 bpm but can sometimes climb to about 180 bpm. The PP, PR, and RR intervals are varied, inconsistent, and don’t repeat. Most importantly, there are three or more different p wave morphologies in the same lead. One p wave might look like a tall mountain peak, another could be short and flat, and perhaps the next is big and broad.
MAT often occurs in patients with a structurally abnormal atrium – for example, in the setting of pulmonary hypertension leading to right atrial enlargement, with resultant depolarization occurring all over the atrium.
“Don’t confuse MAT with AFib: One has p waves, one does not. Otherwise they can look very similar,” she said.
Atrial flutter with variable conduction: A hallmark of this reentrant tachycardia is the atrial flutter waves occurring at about 300 bpm between each QRS complex.
“On board renewal exams, the question is often asked, ‘Which leads are the best identifiers of atrial flutter?’ And the answer is the inferior leads II, III, and aVF,” she said.
Another classic feature of atrial flutter with variable conduction is cluster beating attributable to a varied ventricular response. This results in a repeated pattern of irregular RR intervals: There might be a 2:1 block in AV conduction for several beats, then maybe a 4:1 block for several more, with resultant lengthening of the RR interval, then 3:1, with shortening of RR. This regularly irregular sequence is repeated throughout the EKG.
“Look for a pattern amidst the chaos,” the hospitalist advised.
The heart rate might be roughly 150 bpm with a 2:1 block, or 100 bpm with a 3:1 block. The p waves in atrial flutter with variable conduction can be either negatively or positively deflected.
Narrow complex tachycardias with a regular rhythm*
Sinus tachycardia: The heart rate is typically less than 160 bpm, the QRS complexes show a regular pattern, and upright p waves are clearly visible in leads II and V1.
The distinguishing feature of this arrhythmia is the ramping up and ramping down of the heart rate. The tachycardia is typically less than 160 bpm. But the rate doesn’t suddenly jump from, say, 70 to140 bpm in a flash while the patient is lying in the hospital bed. A trip to the telemetry room for a look at the telemetry strip will tell the tale: The heart rate will have progressively ramped up from 70, to 80, then 90, then 100, 110, 120, 130, to perhaps 140 bpm. And then it will similarly ramp back down in stages, with the up/down pattern being repeated.
Sinus tachycardia is generally a reflection of underlying significant systemic illness, such as sepsis, hypotension, or anemia.
Atrial tachycardia: The heart rate is generally 100-140 bpm, and p waves are present. But unlike in sinus tachycardia, the patient with atrial tachycardia lying in bed with a heart rate of 140 bpm is not in a state of profound neurohormonal activation and is not all that sick.
Another diagnostic clue is provided by a look at the telemonitoring strip. Unlike in sinus tachycardia, where the heart rate ramps up and then back down repeatedly, in atrial tachycardia the heart rate very quickly ramps up in stages to, say, 140 bpm, and then hangs there.
Atrial flutter: This is the only narrow complex tachycardia that appears in both the regular and irregular rhythm columns. It belongs in the irregular rhythm column when there is variable conduction and cluster beating, with a regularly irregular pattern of RR intervals. In contrast, when atrial flutter is in the regular rhythm column, it’s because the atrioventricular node is steadily conducting the atrial depolarizations at a rate of about 300 bpm. So there’s no cluster beating. As in atrial flutter with variable conduction, the flutter waves are visible most often in leads II, III, and aVF, where they can be either positively or negatively deflected.
AV reentrant tachycardias: These reentrant tachycardias can take two forms. In atrioventricular nodal reentrant tachycardia (AVnRT), the aberrant pathway is found entirely within the AV node, whereas in atrioventricular reentrant tachycardia (AVRT) the aberrant pathway is found outside the AV node. AVnRT is more common than AVRT. As in atrial flutter, there is no ramp up in heart rate. Patients will be lying in their hospital bed with a heart rate of, say, 80 bpm, and then suddenly it jumps to 180, 200, or even as high as 240 bpm “almost in a split second,” Dr. Walsh said.
No other narrow complex tachycardia reaches so high a heart rate. In both of these reentrant tachycardias the p waves are often buried in the QRS complex and can be tough to see. It’s very difficult to differentiate AVnRT from AVRT except by an electrophysiologic study.
Accelerated junctional tachycardia: This is most commonly the slowest of the narrow complex tachycardias, with a heart rate of less than 120 bpm.
“In the case of accelerated junctional tachycardia, think slow, think ‘regular,’ think of a rate often just over 100, usually with p waves after the QRS that are inverted because there’s retrograde conduction,” she advised.
She reported having no financial conflicts of interest regarding her presentation.
Correction, 8/19/20: An earlier version of this article mischaracterized the type of rhythm noted in this subhead.
FROM HM20 VIRTUAL
Pan-Pseudothrombocytopenia in COVID-19: A Harbinger for Lethal Arterial Thrombosis?
In late 2019 a new pandemic started in Wuhan, China, caused by the severe acute respiratory syndrome coronavirus 2 (SARS-CoV-2) due to its similarities with the virus responsible for the SARS outbreak of 2003. The disease manifestations are named coronavirus disease 2019 (COVID-19).1
Pseudothrombocytopenia, or platelet clumping, visualized on the peripheral blood smear, is a common cause for artificial thrombocytopenia laboratory reporting and is frequently attributed to laboratory artifact. In this case presentation, a critically ill patient with COVID-19 developed pan-pseudothrombocytopenia (ethylenediaminetetraacetic acid [EDTA], sodium citrate, and heparin tubes) just prior to his death from a ST-segment elevation myocardial infarction (STEMI) in the setting of therapeutic anticoagulation during a prolonged hospitalization. This case raises the possibility that pseudothrombocytopenia in the setting of COVID-19 critical illness may represent an ominous feature of COVID-19-associated coagulopathy (CAC). Furthermore, it prompts the question whether pseudothrombocytopenia in this setting is representative of increased platelet aggregation activity in vivo.
Case Presentation
A 50-year-old African American man who was diagnosed with COVID-19 3 days prior to admission presented to the emergency department of the W.G. (Bill) Hefner VA Medical Center in Salisbury, North Carolina, with worsening dyspnea and fever. His primary chronic medical problems included obesity (body mass index, 33), type 2 diabetes mellitus (hemoglobin A1c 2 months prior of 6.6%), migraine headaches, and obstructive sleep apnea. Shortly after presentation, his respiratory status declined, requiring intubation. He was admitted to the medical intensive care unit for further management.
Notable findings at admission included > 20 mcg/mL FEU D-dimer (normal range, 0-0.56 mcg/mL FEU), 20.4 mg/dL C-reactive protein (normal range, < 1 mg/dL), 30 mm/h erythrocyte sedimentation rate (normal range, 0-25 mm/h), and 3.56 ng/mL procalcitonin (normal range, 0.05-1.99 ng/mL). Patient’s hemoglobin and platelet counts were normal. Empiric antimicrobial therapy was initiated with ceftriaxone (2 g IV daily) and doxycycline (100 mg IV twice daily) due to concern of superimposed infection in the setting of an elevated procalcitonin.
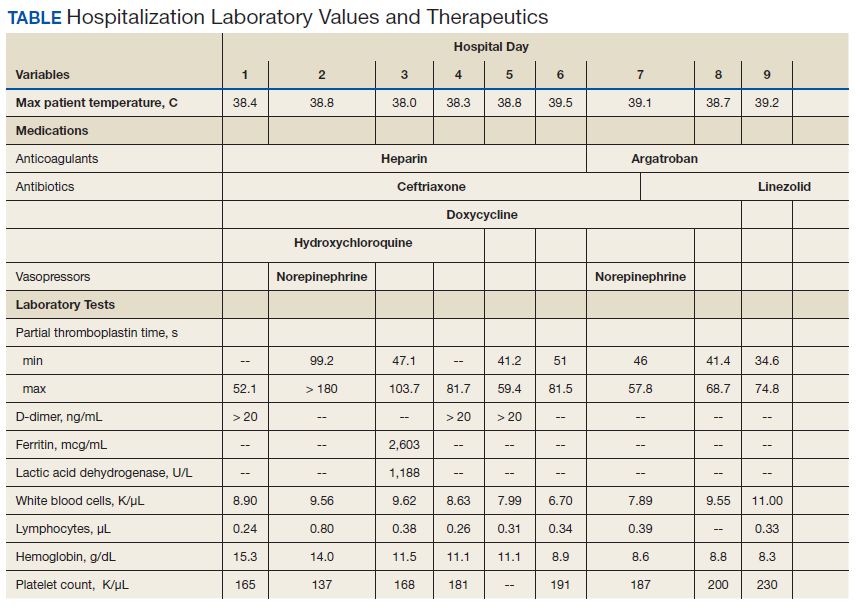
A heparin infusion was initiated (5,000 U IV bolus followed by continuous infusion with goal partial thromboplastin time [PTT] of 1.5x the upper limit of normal) on admission to treat CAC. Renal function worsened requiring intermittent renal replacement therapy on day 3. His lactate dehydrogenase was elevated to 1,188 U/L (normal range: 100-240 U/L) and ferritin was elevated to 2,603 ng/mL (normal range: 25-350 ng/mL) (Table). Initial neuromuscular blockade and prone positioning maneuvers were instituted to optimize oxygenation based on the latest literature for respiratory distress in the COVID-19 management.2
Intermittent norepinephrine infusion (5 mcg/min with a 2 mcg/min titration every 5 minutes as needed to maintain mean arterial pressure of > 65 mm Hg) was required for hemodynamic support throughout the patient’s course. Several therapies for COVID-19 were considered and were a reflection of the rapidly evolving literature during the care of patients with this disease. The patient originally received hydroxychloroquine (200 mg by mouth twice daily) in accordance with the US Department of Veterans Affairs (VA) institutional protocol between day 2 and day 4; however, hydroxychloroquine was stopped due to concerns of QTc prolongation. The patient also received 1 unit of convalescent plasma on day 6 after being enrolled in the expanded access program.3 The patient was not a candidate for remdesivir due to his unstable renal function and need for vasopressors. Finally, interleukin-6 inhibitors also were considered; however, the risk of superimposed infection precluded its use.
On day 7 antimicrobial therapy was transitioned to linezolid (600 mg IV twice daily) due to the persistence of fever and a portable chest radiograph revealing diffuse infiltrates throughout the bilateral lungs, worse compared with prior radiograph on day 5, suggesting a worsening of pneumonia. On day 12, the patient was transitioned to cefepime (1 gram IV daily) to broaden antimicrobial coverage and was continued thereafter. Blood cultures were negative throughout his hospitalization.
Given his worsening clinical scenario there was a question about whether or not the patient was still shedding virus for prognostic and therapeutic implications. Therefore, his SARS-CoV-2 test by polymerase chain reaction nasopharyngeal was positive again on day 18. On day 20, the patient developed leukocytosis, his fever persisted, and a portable chest radiograph revealed extensive bilateral pulmonary opacities with focal worsening in left lower base. Due to this constellation of findings, a vancomycin IV (1,500 mg once) was started for empirical treatment of hospital-acquired pneumonia. Sputum samples obtained on day 20 revealed Staphylococcus aureus on subsequent days.
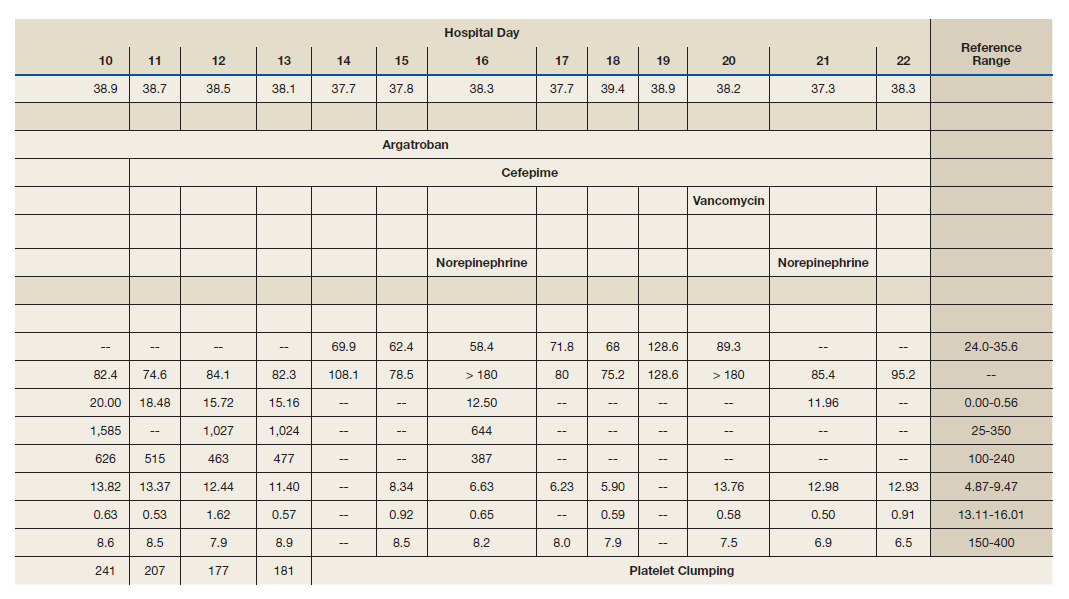
From a hematologic perspective, on day 9 due to challenges to maintain a therapeutic level of anticoagulation with heparin infusion thought to be related to antithrombin deficiency, anticoagulation was changed to argatroban infusion (0.5 mcg/kg/min targeting a PTT of 70-105 seconds) for ongoing management of CAC. Although D-dimer was > 20 mcg/mL FEU on admission and on days 4 and 5, D-dimer trended down to 12.5 mcg/mL FEU on day 16.
Throughout the patient’s hospital stay, no significant bleeding was seen. Hemoglobin was 15.2 g/dL on admission, but anemia developed with a nadir of 6.5 g/dL, warranting transfusion of red blood cells on day 22. Platelet count was 165,000 per microliter on admission and remained within normal limits until platelet clumping was noted on day 15 laboratory collection.
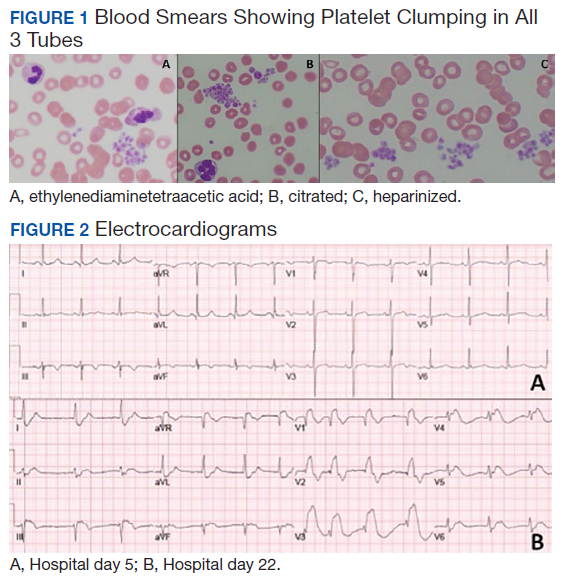
Hematology was consulted on day 20 to obtain an accurate platelet count. A peripheral blood smear from a sodium citrate containing tube was remarkable for prominent platelet clumping, particularly at the periphery of the slide (Figure 1). Platelet clumping was reproduced in samples containing EDTA and heparin. Other features of the peripheral blood smear included the presence of echinocytes with rare schistocytes. To investigate for presence of disseminated intravascular coagulation on day 22, fibrinogen was found to be mildly elevated at 538 mg/dL (normal range: 243-517 mg/dL) and a D-dimer value of 11.96 mcg/mL FEU.
On day 22, the patient’s ventilator requirements escalated to requiring 100% FiO2 and 10 cm H20 of positive end-expiratory pressure with mean arterial pressures in the 50 to 60 mm Hg range. Within 30 minutes an electrocardiogram (EKG) obtained revealed a STEMI (Figure 2). Troponin was measured at 0.65 ng/mL (normal range: 0.02-0.06 ng/mL). Just after an EKG was performed, the patient developed a ventricular fibrillation arrest and was unable to obtain return of spontaneous circulation. The patient was pronounced dead. The family declined an autopsy.
Discussion
Pseudothrombocytopenia, or platelet clumping (agglutination), is estimated to be present in up to 2% of hospitalized patients.4 Pseudothrombocytopenia was found to be the root cause of thrombocytopenia hematology consultations in up to 4% of hospitalized patients.5 The etiology is commonly ascribed to EDTA inducing a conformational change in the GpIIb-IIIa platelet complex, rendering it susceptible to binding of autoantibodies, which cause subsequent platelet agglutination.6 In most cases (83%), the use of a non-EDTA anticoagulant, such as sodium citrate, resolves the platelet agglutination and allows for accurate platelet count reporting.4 Pseudothrombocytopenia in most cases is considered an in vitro finding without clinical relevance.7 However, in this patient’s case, his pan-pseudothrombocytopenia was temporally associated with an arterial occlusive event (STEMI) leading to his demise despite therapeutic anticoagulation in the setting of CAC. This temporal association raises the possibility that pseudothrombocytopenia seen on the peripheral blood smear is an accurate representation of in vivo activity.
Pseudothrombocytopenia has been associated with sepsis from bacterial and viral causes as well as autoimmune and medication effect.4,8-10 Li and colleagues reported transient EDTA-dependent pseudothrombocytopenia in a patient with COVID-19 infection; however, platelet clumping resolved with use of a citrate tube, and the EDTA-dependent pseudothrombocytopenia phenomenon resolved with patient recovery.11 The frequency of COVID-19-related pseudothrombocytopenia is currently unknown.
Although the understanding of COVID-19-associated CAC continues to evolve, it seems that initial reports support the idea that hemostatic dysfunction tends to more thrombosis than to bleeding.12 Rather than overt disseminated intravascular coagulation with reduced fibrinogen and bleeding, CAC is more closely associated with blood clotting, as demonstrated by autopsy studies revealing microvascular thrombosis in the lungs.13 The D-dimer test has been identified as the most useful biomarker by the International Society of Thrombosis and Hemostasis to screen for CAC and stratify patients who warrant admission or closer monitoring.12 Other identified features of CAC include prolonged prothrombin time and thrombocytopenia.12
There have been varying clinical approaches to CAC management. A retrospective review found that prophylactic heparin doses were associated with improved mortality in those with elevated D-dimer > 3.0 mg/L.14 There continues to be a diversity of varying clinical approaches with many medical centers advocating for an intensified prophylactic twice daily low molecular-weight heparin compared with others advocating for full therapeutic dose anticoagulation for patients with elevated D-dimer.15 This patient was treated aggressively with full-dose anticoagulation, and despite his having a down-trend in D-dimer, he suffered a lethal arterial thrombosis in the form of a STEMI.
Varatharajah and Rajah
Conclusions
This patient’s case highlights the presence of pan-pseudothrombocytopenia despite the use of a sodium citrate and heparin containing tube in a COVID-19 infection with multiorgan dysfunction. This developed 1 week prior to the patient suffering a STEMI despite therapeutic anticoagulation. Although the exact nature of CAC remains to be worked out, it is possible that platelet agglutination/clumping seen on the peripheral blood smear is representative of in vivo activity and serves as a harbinger for worsening thrombosis. The frequency of such phenomenon and efficacy of further interventions has yet to be explored.
1. World Health Organization. Naming the coronavirus disease (COVID-19) and the virus that causes it. https://www.who.int/emergencies/diseases/novel-coronavirus-2019/technical-guidance/naming-the-coronavirus-disease-(COVID-2019)-and-the-virus-that-causes-it. Accessed July 15, 2020.
2. Ghelichkhani P, Esmaeili M. Prone position in management of COVID-19 patients; a commentary. Arch Acad Emerg Med. 2020;8(1):e48. Published 2020 April 11.
3. National Library of Medicine, Clinicaltrials.gov. Expanded access to convalescent plasma for the treatment of patients with COVID-19. NCT04338360. https://clinicaltrials.gov/ct2/show/nct04338360. Update April 20, 2020. Accessed July 15, 2020.
4. Tan GC, Stalling M, Dennis G, Nunez M, Kahwash SB. Pseudothrombocytopenia due to platelet clumping: a case report and brief review of the literature. Case Rep Hematol. 2016;2016:3036476. doi:10.1155/2016/3036476
5. Boxer M, Biuso TJ. Etiologies of thrombocytopenia in the community hospital: the experience of 1 hematologist. Am J Med. 2020;133(5):e183-e186. doi:10.1016/j.amjmed.2019.10.027
6. Fiorin F, Steffan A, Pradella P, Bizzaro N, Potenza R, De Angelis V. IgG platelet antibodies in EDTA-dependent pseudothrombocytopenia bind to platelet membrane glycoprotein IIb. Am J Clin Pathol. 1998;110(2):178-183. doi:10.1093/ajcp/110.2.178
7. Nagler M, Keller P, Siegrist S, Alberio L. A case of EDTA-Dependent pseudothrombocytopenia: simple recognition of an underdiagnosed and misleading phenomenon. BMC Clin Pathol. 2014;14:19. doi:10.1186/1472-6890-14-19
8. Mori M, Kudo H, Yoshitake S, Ito K, Shinguu C, Noguchi T. Transient EDTA-dependent pseudothrombocytopenia in a patient with sepsis. Intensive Care Med. 2000;26(2):218-220. doi:10.1007/s001340050050.
9. Choe W-H, Cho Y-U, Chae J-D, Kim S-H. 2013. Pseudothrombocytopenia or platelet clumping as a possible cause of low platelet count in patients with viral infection: a case series from single institution focusing on hepatitis A virus infection. Int J Lab Hematol. 2013;35(1):70-76. doi:10.1111/j.1751-553x.2012.01466.
10. Hsieh AT, Chao TY, Chen YC. Pseudothrombocytopenia associated with infectious mononucleosis. Arch Pathol Lab Med. 2003;127(1):e17-e18. doi:10.1043/0003-9985(2003)1272.0.CO;2
11. Li H, Wang B, Ning L, Luo Y, Xiang S. Transient appearance of EDTA dependent pseudothrombocytopenia in a patient with 2019 novel coronavirus pneumonia [published online ahead of print, 2020 May 5]. Platelets. 2020;1-2. doi:10.1080/09537104.2020.1760231
12. Thachil J, Tang N, Gando S, et al. ISTH interim guidance on recognition and management of coagulopathy in COVID-19. J Thromb Haemost. 2020;18(5):1023-1026. doi:10.1111/jth.14810
13. Magro C, Mulvey JJ, Berlin D, et al. Complement associated microvascular injury and thrombosis in the pathogenesis of severe COVID-19 infection: a report of five cases. Transl Res. 2020;220:1-13. doi:10.1016/j.trsl.2020.04.007
14. Tang N, Bai H, Chen X, Gong J, Li D, Sun Z. Anticoagulant treatment is associated with decreased mortality in severe coronavirus disease 2019 patients with coagulopathy. J Thromb Haemost. 2020;18(5):1094-1099. doi:10.1111/jth.14817
15. Connors JM, Levy JH. COVID-19 and its implications for thrombosis and anticoagulation. Blood. 2020;125(23):2033-2040. doi.org/10.1182/blood.2020006000.
16. Varatharajah N, Rajah S. Microthrombotic complications of COVID-19 are likely due to embolism of circulating endothelial derived ultralarge von Willebrand factor (eULVWF) Decorated-Platelet Strings. Fed Pract. 2020;37(6):258-259. doi:10.12788/fp.0001
17. Bernardo A, Ball C, Nolasco L, Choi H, Moake JL, Dong JF. Platelets adhered to endothelial cell-bound ultra-large von Willebrand factor strings support leukocyte tethering and rolling under high shear stress. J Thromb Haemost. 2005;3(3):562-570. doi:10.1111/j.1538-7836.2005.01122.x
In late 2019 a new pandemic started in Wuhan, China, caused by the severe acute respiratory syndrome coronavirus 2 (SARS-CoV-2) due to its similarities with the virus responsible for the SARS outbreak of 2003. The disease manifestations are named coronavirus disease 2019 (COVID-19).1
Pseudothrombocytopenia, or platelet clumping, visualized on the peripheral blood smear, is a common cause for artificial thrombocytopenia laboratory reporting and is frequently attributed to laboratory artifact. In this case presentation, a critically ill patient with COVID-19 developed pan-pseudothrombocytopenia (ethylenediaminetetraacetic acid [EDTA], sodium citrate, and heparin tubes) just prior to his death from a ST-segment elevation myocardial infarction (STEMI) in the setting of therapeutic anticoagulation during a prolonged hospitalization. This case raises the possibility that pseudothrombocytopenia in the setting of COVID-19 critical illness may represent an ominous feature of COVID-19-associated coagulopathy (CAC). Furthermore, it prompts the question whether pseudothrombocytopenia in this setting is representative of increased platelet aggregation activity in vivo.
Case Presentation
A 50-year-old African American man who was diagnosed with COVID-19 3 days prior to admission presented to the emergency department of the W.G. (Bill) Hefner VA Medical Center in Salisbury, North Carolina, with worsening dyspnea and fever. His primary chronic medical problems included obesity (body mass index, 33), type 2 diabetes mellitus (hemoglobin A1c 2 months prior of 6.6%), migraine headaches, and obstructive sleep apnea. Shortly after presentation, his respiratory status declined, requiring intubation. He was admitted to the medical intensive care unit for further management.
Notable findings at admission included > 20 mcg/mL FEU D-dimer (normal range, 0-0.56 mcg/mL FEU), 20.4 mg/dL C-reactive protein (normal range, < 1 mg/dL), 30 mm/h erythrocyte sedimentation rate (normal range, 0-25 mm/h), and 3.56 ng/mL procalcitonin (normal range, 0.05-1.99 ng/mL). Patient’s hemoglobin and platelet counts were normal. Empiric antimicrobial therapy was initiated with ceftriaxone (2 g IV daily) and doxycycline (100 mg IV twice daily) due to concern of superimposed infection in the setting of an elevated procalcitonin.
A heparin infusion was initiated (5,000 U IV bolus followed by continuous infusion with goal partial thromboplastin time [PTT] of 1.5x the upper limit of normal) on admission to treat CAC. Renal function worsened requiring intermittent renal replacement therapy on day 3. His lactate dehydrogenase was elevated to 1,188 U/L (normal range: 100-240 U/L) and ferritin was elevated to 2,603 ng/mL (normal range: 25-350 ng/mL) (Table). Initial neuromuscular blockade and prone positioning maneuvers were instituted to optimize oxygenation based on the latest literature for respiratory distress in the COVID-19 management.2
Intermittent norepinephrine infusion (5 mcg/min with a 2 mcg/min titration every 5 minutes as needed to maintain mean arterial pressure of > 65 mm Hg) was required for hemodynamic support throughout the patient’s course. Several therapies for COVID-19 were considered and were a reflection of the rapidly evolving literature during the care of patients with this disease. The patient originally received hydroxychloroquine (200 mg by mouth twice daily) in accordance with the US Department of Veterans Affairs (VA) institutional protocol between day 2 and day 4; however, hydroxychloroquine was stopped due to concerns of QTc prolongation. The patient also received 1 unit of convalescent plasma on day 6 after being enrolled in the expanded access program.3 The patient was not a candidate for remdesivir due to his unstable renal function and need for vasopressors. Finally, interleukin-6 inhibitors also were considered; however, the risk of superimposed infection precluded its use.
On day 7 antimicrobial therapy was transitioned to linezolid (600 mg IV twice daily) due to the persistence of fever and a portable chest radiograph revealing diffuse infiltrates throughout the bilateral lungs, worse compared with prior radiograph on day 5, suggesting a worsening of pneumonia. On day 12, the patient was transitioned to cefepime (1 gram IV daily) to broaden antimicrobial coverage and was continued thereafter. Blood cultures were negative throughout his hospitalization.
Given his worsening clinical scenario there was a question about whether or not the patient was still shedding virus for prognostic and therapeutic implications. Therefore, his SARS-CoV-2 test by polymerase chain reaction nasopharyngeal was positive again on day 18. On day 20, the patient developed leukocytosis, his fever persisted, and a portable chest radiograph revealed extensive bilateral pulmonary opacities with focal worsening in left lower base. Due to this constellation of findings, a vancomycin IV (1,500 mg once) was started for empirical treatment of hospital-acquired pneumonia. Sputum samples obtained on day 20 revealed Staphylococcus aureus on subsequent days.
From a hematologic perspective, on day 9 due to challenges to maintain a therapeutic level of anticoagulation with heparin infusion thought to be related to antithrombin deficiency, anticoagulation was changed to argatroban infusion (0.5 mcg/kg/min targeting a PTT of 70-105 seconds) for ongoing management of CAC. Although D-dimer was > 20 mcg/mL FEU on admission and on days 4 and 5, D-dimer trended down to 12.5 mcg/mL FEU on day 16.
Throughout the patient’s hospital stay, no significant bleeding was seen. Hemoglobin was 15.2 g/dL on admission, but anemia developed with a nadir of 6.5 g/dL, warranting transfusion of red blood cells on day 22. Platelet count was 165,000 per microliter on admission and remained within normal limits until platelet clumping was noted on day 15 laboratory collection.
Hematology was consulted on day 20 to obtain an accurate platelet count. A peripheral blood smear from a sodium citrate containing tube was remarkable for prominent platelet clumping, particularly at the periphery of the slide (Figure 1). Platelet clumping was reproduced in samples containing EDTA and heparin. Other features of the peripheral blood smear included the presence of echinocytes with rare schistocytes. To investigate for presence of disseminated intravascular coagulation on day 22, fibrinogen was found to be mildly elevated at 538 mg/dL (normal range: 243-517 mg/dL) and a D-dimer value of 11.96 mcg/mL FEU.
On day 22, the patient’s ventilator requirements escalated to requiring 100% FiO2 and 10 cm H20 of positive end-expiratory pressure with mean arterial pressures in the 50 to 60 mm Hg range. Within 30 minutes an electrocardiogram (EKG) obtained revealed a STEMI (Figure 2). Troponin was measured at 0.65 ng/mL (normal range: 0.02-0.06 ng/mL). Just after an EKG was performed, the patient developed a ventricular fibrillation arrest and was unable to obtain return of spontaneous circulation. The patient was pronounced dead. The family declined an autopsy.
Discussion
Pseudothrombocytopenia, or platelet clumping (agglutination), is estimated to be present in up to 2% of hospitalized patients.4 Pseudothrombocytopenia was found to be the root cause of thrombocytopenia hematology consultations in up to 4% of hospitalized patients.5 The etiology is commonly ascribed to EDTA inducing a conformational change in the GpIIb-IIIa platelet complex, rendering it susceptible to binding of autoantibodies, which cause subsequent platelet agglutination.6 In most cases (83%), the use of a non-EDTA anticoagulant, such as sodium citrate, resolves the platelet agglutination and allows for accurate platelet count reporting.4 Pseudothrombocytopenia in most cases is considered an in vitro finding without clinical relevance.7 However, in this patient’s case, his pan-pseudothrombocytopenia was temporally associated with an arterial occlusive event (STEMI) leading to his demise despite therapeutic anticoagulation in the setting of CAC. This temporal association raises the possibility that pseudothrombocytopenia seen on the peripheral blood smear is an accurate representation of in vivo activity.
Pseudothrombocytopenia has been associated with sepsis from bacterial and viral causes as well as autoimmune and medication effect.4,8-10 Li and colleagues reported transient EDTA-dependent pseudothrombocytopenia in a patient with COVID-19 infection; however, platelet clumping resolved with use of a citrate tube, and the EDTA-dependent pseudothrombocytopenia phenomenon resolved with patient recovery.11 The frequency of COVID-19-related pseudothrombocytopenia is currently unknown.
Although the understanding of COVID-19-associated CAC continues to evolve, it seems that initial reports support the idea that hemostatic dysfunction tends to more thrombosis than to bleeding.12 Rather than overt disseminated intravascular coagulation with reduced fibrinogen and bleeding, CAC is more closely associated with blood clotting, as demonstrated by autopsy studies revealing microvascular thrombosis in the lungs.13 The D-dimer test has been identified as the most useful biomarker by the International Society of Thrombosis and Hemostasis to screen for CAC and stratify patients who warrant admission or closer monitoring.12 Other identified features of CAC include prolonged prothrombin time and thrombocytopenia.12
There have been varying clinical approaches to CAC management. A retrospective review found that prophylactic heparin doses were associated with improved mortality in those with elevated D-dimer > 3.0 mg/L.14 There continues to be a diversity of varying clinical approaches with many medical centers advocating for an intensified prophylactic twice daily low molecular-weight heparin compared with others advocating for full therapeutic dose anticoagulation for patients with elevated D-dimer.15 This patient was treated aggressively with full-dose anticoagulation, and despite his having a down-trend in D-dimer, he suffered a lethal arterial thrombosis in the form of a STEMI.
Varatharajah and Rajah
Conclusions
This patient’s case highlights the presence of pan-pseudothrombocytopenia despite the use of a sodium citrate and heparin containing tube in a COVID-19 infection with multiorgan dysfunction. This developed 1 week prior to the patient suffering a STEMI despite therapeutic anticoagulation. Although the exact nature of CAC remains to be worked out, it is possible that platelet agglutination/clumping seen on the peripheral blood smear is representative of in vivo activity and serves as a harbinger for worsening thrombosis. The frequency of such phenomenon and efficacy of further interventions has yet to be explored.
1. World Health Organization. Naming the coronavirus disease (COVID-19) and the virus that causes it. https://www.who.int/emergencies/diseases/novel-coronavirus-2019/technical-guidance/naming-the-coronavirus-disease-(COVID-2019)-and-the-virus-that-causes-it. Accessed July 15, 2020.
2. Ghelichkhani P, Esmaeili M. Prone position in management of COVID-19 patients; a commentary. Arch Acad Emerg Med. 2020;8(1):e48. Published 2020 April 11.
3. National Library of Medicine, Clinicaltrials.gov. Expanded access to convalescent plasma for the treatment of patients with COVID-19. NCT04338360. https://clinicaltrials.gov/ct2/show/nct04338360. Update April 20, 2020. Accessed July 15, 2020.
4. Tan GC, Stalling M, Dennis G, Nunez M, Kahwash SB. Pseudothrombocytopenia due to platelet clumping: a case report and brief review of the literature. Case Rep Hematol. 2016;2016:3036476. doi:10.1155/2016/3036476
5. Boxer M, Biuso TJ. Etiologies of thrombocytopenia in the community hospital: the experience of 1 hematologist. Am J Med. 2020;133(5):e183-e186. doi:10.1016/j.amjmed.2019.10.027
6. Fiorin F, Steffan A, Pradella P, Bizzaro N, Potenza R, De Angelis V. IgG platelet antibodies in EDTA-dependent pseudothrombocytopenia bind to platelet membrane glycoprotein IIb. Am J Clin Pathol. 1998;110(2):178-183. doi:10.1093/ajcp/110.2.178
7. Nagler M, Keller P, Siegrist S, Alberio L. A case of EDTA-Dependent pseudothrombocytopenia: simple recognition of an underdiagnosed and misleading phenomenon. BMC Clin Pathol. 2014;14:19. doi:10.1186/1472-6890-14-19
8. Mori M, Kudo H, Yoshitake S, Ito K, Shinguu C, Noguchi T. Transient EDTA-dependent pseudothrombocytopenia in a patient with sepsis. Intensive Care Med. 2000;26(2):218-220. doi:10.1007/s001340050050.
9. Choe W-H, Cho Y-U, Chae J-D, Kim S-H. 2013. Pseudothrombocytopenia or platelet clumping as a possible cause of low platelet count in patients with viral infection: a case series from single institution focusing on hepatitis A virus infection. Int J Lab Hematol. 2013;35(1):70-76. doi:10.1111/j.1751-553x.2012.01466.
10. Hsieh AT, Chao TY, Chen YC. Pseudothrombocytopenia associated with infectious mononucleosis. Arch Pathol Lab Med. 2003;127(1):e17-e18. doi:10.1043/0003-9985(2003)1272.0.CO;2
11. Li H, Wang B, Ning L, Luo Y, Xiang S. Transient appearance of EDTA dependent pseudothrombocytopenia in a patient with 2019 novel coronavirus pneumonia [published online ahead of print, 2020 May 5]. Platelets. 2020;1-2. doi:10.1080/09537104.2020.1760231
12. Thachil J, Tang N, Gando S, et al. ISTH interim guidance on recognition and management of coagulopathy in COVID-19. J Thromb Haemost. 2020;18(5):1023-1026. doi:10.1111/jth.14810
13. Magro C, Mulvey JJ, Berlin D, et al. Complement associated microvascular injury and thrombosis in the pathogenesis of severe COVID-19 infection: a report of five cases. Transl Res. 2020;220:1-13. doi:10.1016/j.trsl.2020.04.007
14. Tang N, Bai H, Chen X, Gong J, Li D, Sun Z. Anticoagulant treatment is associated with decreased mortality in severe coronavirus disease 2019 patients with coagulopathy. J Thromb Haemost. 2020;18(5):1094-1099. doi:10.1111/jth.14817
15. Connors JM, Levy JH. COVID-19 and its implications for thrombosis and anticoagulation. Blood. 2020;125(23):2033-2040. doi.org/10.1182/blood.2020006000.
16. Varatharajah N, Rajah S. Microthrombotic complications of COVID-19 are likely due to embolism of circulating endothelial derived ultralarge von Willebrand factor (eULVWF) Decorated-Platelet Strings. Fed Pract. 2020;37(6):258-259. doi:10.12788/fp.0001
17. Bernardo A, Ball C, Nolasco L, Choi H, Moake JL, Dong JF. Platelets adhered to endothelial cell-bound ultra-large von Willebrand factor strings support leukocyte tethering and rolling under high shear stress. J Thromb Haemost. 2005;3(3):562-570. doi:10.1111/j.1538-7836.2005.01122.x
Since COVID-19 onset, admissions for MI are down, mortality rates are up
A substantial decrease in hospital admissions for acute MI was accompanied by a rise in mortality, particularly for ST-segment elevation MI (STEMI), following the onset of the COVID-19 pandemic, according to a cross-sectional retrospective study.

Although it can’t be confirmed from these results that the observed increase in in-hospital acute MI (AMI) mortality are related to delays in seeking treatment, this is a reasonable working hypothesis until more is known, commented Harlan Krumholz, MD, who was not involved in the study.
The analysis, derived from data collected at 49 centers in a hospital system spread across six states, supports previous reports that patients with AMI were avoiding hospitalization, according to the investigators, who were led by Tyler J. Gluckman, MD, medical director of the Center for Cardiovascular Analytics, Providence Heart Institute, Portland, Ore.
When compared with a nearly 14-month period that preceded the COVID-19 pandemic, the rate of AMI-associated hospitalization fell by 19 cases per week (95% confidence interval, –29.0 to –9.0 cases) in the early COVID-19 period, which was defined by the investigators as spanning from Feb. 23, 2020 to March 28, 2020.
The case rate per week then increased by 10.5 (95% CI, 4.6-16.5 cases) in a subsequent 8-week period spanning between March 29, 2020, and May 16, 2020. Although a substantial increase from the early COVID-19 period, the case rate remained below the baseline established before COVID-19.
The analysis looked at 15,244 AMI hospitalizations among 14,724 patients treated in the Providence St. Joseph Hospital System, which has facilities in Alaska, California, Montana, Oregon, Texas, and Washington. The 1,915 AMI cases captured from Feb. 23, 2020, represented 13% of the total.
Differences in mortality, patients, treatment
In the early period, the ratio of observed-to-expected (O/E) mortality relative to the pre–COVID-19 baseline increased by 27% (odds ratio, 1.27; 95% CI, 1.07-1.48). When STEMI was analyzed separately, the O/E mortality was nearly double that of the baseline period (OR, 1.96; 95% CI, 1.22-2.70). In the latter post–COVID-19 period of observation, the overall increase in AMI-associated mortality on the basis of an O/E ratio was no longer significant relative to the baseline period (OR, 1.23; 95% CI, 0.98-1.47). However, the relative increase in STEMI-associated mortality on an O/E basis was even greater (OR, 2.40; 95% CI, 1.65-3.16) in the second COVID-19 period analyzed. Even after risk adjustment, the OR for STEMI mortality remained significantly elevated relative to baseline (1.52; 95% CI, 1.02-2.26).
The differences in AMI patients treated before the onset of the COVID-19 pandemic and those treated afterwards might be relevant, according to the investigators. Specifically, patients hospitalized after Feb. 23, 2020 were 1-3 years younger (P < .001) depending on type of AMI, and more likely to be Asian (P = .01).
The length of stay was 6 hours shorter in the early COVID-19 period and 7 hours shorter in the latter period relative to baseline, but an analysis of treatment approaches to non-STEMI and STEMI during the COVID-19 pandemic were not found to be significantly different from baseline.
Prior to the COVID-19 pandemic, 79% of STEMI patients and 77% of non-STEMI patients were discharged home, which was significantly lower than in the early COVID-19 period, when 83% (P = .02) of STEMI and 81% (P = .006) of non-STEMI patients were discharged home. In the latter period, discharge to home care was also significantly higher than in the baseline period.
More than fear of COVID-19?
One theory to account for the reduction in AMI hospitalizations and the increase in AMI-related mortality is the possibility that patients were slow to seek care at acute care hospitals because of concern about COVID-19 infection, according to Dr. Gluckman and coinvestigators.
“Given the time-sensitive nature of STEMI, any delay by patients, emergency medical services, the emergency department, or cardiac catheterization laboratory may have played a role,” they suggested.
In an interview, Dr. Gluckman said that further effort to identify the reasons for the increased AMI-related mortality is planned. Pulling data from the electronic medical records of the patients included in this retrospective analysis might be a “challenge,” but Dr. Gluckman reported that he and his coinvestigators plan to look at a different set of registry data that might provide information on sources of delay, particularly in the STEMI population.
“This includes looking at a number of time factors, such as symptom onset to first medical contact, first medical contact to device, and door-in-door-out times,” Dr. Gluckman said. The goal is to “better understand if delays [in treatment] occurred during the pandemic and, if so, how they may have contributed to increases in risk adjusted mortality.”
Dr. Krumholz, director of the Yale Center for Outcomes Research and Evaluation, New Haven, Conn., called this study a “useful” confirmation of changes in AMI-related care with the onset of the COVID-19 pandemic. As reported anecdotally, the study “indicates marked decreases in hospitalizations of patients with AMI even in areas that were not experiencing big outbreaks but did have some restrictions to limit spread,” he noted.
More data gathered by other centers might provide information about what it all means.
“There remain so many questions about what happened and what consequences accrued,” Dr. Krumholz observed. “In the meantime, we need to continue to send the message that people with symptoms that suggest a heart attack need to rapidly seek care.”
The investigators reported having no financial conflicts of interest.
SOURCE: Gluckman TJ et al. JAMA Cardiol. 2020 Aug 7. doi: 10.1001/jamacardio.2020.3629.
A substantial decrease in hospital admissions for acute MI was accompanied by a rise in mortality, particularly for ST-segment elevation MI (STEMI), following the onset of the COVID-19 pandemic, according to a cross-sectional retrospective study.
Although it can’t be confirmed from these results that the observed increase in in-hospital acute MI (AMI) mortality are related to delays in seeking treatment, this is a reasonable working hypothesis until more is known, commented Harlan Krumholz, MD, who was not involved in the study.
The analysis, derived from data collected at 49 centers in a hospital system spread across six states, supports previous reports that patients with AMI were avoiding hospitalization, according to the investigators, who were led by Tyler J. Gluckman, MD, medical director of the Center for Cardiovascular Analytics, Providence Heart Institute, Portland, Ore.
When compared with a nearly 14-month period that preceded the COVID-19 pandemic, the rate of AMI-associated hospitalization fell by 19 cases per week (95% confidence interval, –29.0 to –9.0 cases) in the early COVID-19 period, which was defined by the investigators as spanning from Feb. 23, 2020 to March 28, 2020.
The case rate per week then increased by 10.5 (95% CI, 4.6-16.5 cases) in a subsequent 8-week period spanning between March 29, 2020, and May 16, 2020. Although a substantial increase from the early COVID-19 period, the case rate remained below the baseline established before COVID-19.
The analysis looked at 15,244 AMI hospitalizations among 14,724 patients treated in the Providence St. Joseph Hospital System, which has facilities in Alaska, California, Montana, Oregon, Texas, and Washington. The 1,915 AMI cases captured from Feb. 23, 2020, represented 13% of the total.
Differences in mortality, patients, treatment
In the early period, the ratio of observed-to-expected (O/E) mortality relative to the pre–COVID-19 baseline increased by 27% (odds ratio, 1.27; 95% CI, 1.07-1.48). When STEMI was analyzed separately, the O/E mortality was nearly double that of the baseline period (OR, 1.96; 95% CI, 1.22-2.70). In the latter post–COVID-19 period of observation, the overall increase in AMI-associated mortality on the basis of an O/E ratio was no longer significant relative to the baseline period (OR, 1.23; 95% CI, 0.98-1.47). However, the relative increase in STEMI-associated mortality on an O/E basis was even greater (OR, 2.40; 95% CI, 1.65-3.16) in the second COVID-19 period analyzed. Even after risk adjustment, the OR for STEMI mortality remained significantly elevated relative to baseline (1.52; 95% CI, 1.02-2.26).
The differences in AMI patients treated before the onset of the COVID-19 pandemic and those treated afterwards might be relevant, according to the investigators. Specifically, patients hospitalized after Feb. 23, 2020 were 1-3 years younger (P < .001) depending on type of AMI, and more likely to be Asian (P = .01).
The length of stay was 6 hours shorter in the early COVID-19 period and 7 hours shorter in the latter period relative to baseline, but an analysis of treatment approaches to non-STEMI and STEMI during the COVID-19 pandemic were not found to be significantly different from baseline.
Prior to the COVID-19 pandemic, 79% of STEMI patients and 77% of non-STEMI patients were discharged home, which was significantly lower than in the early COVID-19 period, when 83% (P = .02) of STEMI and 81% (P = .006) of non-STEMI patients were discharged home. In the latter period, discharge to home care was also significantly higher than in the baseline period.
More than fear of COVID-19?
One theory to account for the reduction in AMI hospitalizations and the increase in AMI-related mortality is the possibility that patients were slow to seek care at acute care hospitals because of concern about COVID-19 infection, according to Dr. Gluckman and coinvestigators.
“Given the time-sensitive nature of STEMI, any delay by patients, emergency medical services, the emergency department, or cardiac catheterization laboratory may have played a role,” they suggested.
In an interview, Dr. Gluckman said that further effort to identify the reasons for the increased AMI-related mortality is planned. Pulling data from the electronic medical records of the patients included in this retrospective analysis might be a “challenge,” but Dr. Gluckman reported that he and his coinvestigators plan to look at a different set of registry data that might provide information on sources of delay, particularly in the STEMI population.
“This includes looking at a number of time factors, such as symptom onset to first medical contact, first medical contact to device, and door-in-door-out times,” Dr. Gluckman said. The goal is to “better understand if delays [in treatment] occurred during the pandemic and, if so, how they may have contributed to increases in risk adjusted mortality.”
Dr. Krumholz, director of the Yale Center for Outcomes Research and Evaluation, New Haven, Conn., called this study a “useful” confirmation of changes in AMI-related care with the onset of the COVID-19 pandemic. As reported anecdotally, the study “indicates marked decreases in hospitalizations of patients with AMI even in areas that were not experiencing big outbreaks but did have some restrictions to limit spread,” he noted.
More data gathered by other centers might provide information about what it all means.
“There remain so many questions about what happened and what consequences accrued,” Dr. Krumholz observed. “In the meantime, we need to continue to send the message that people with symptoms that suggest a heart attack need to rapidly seek care.”
The investigators reported having no financial conflicts of interest.
SOURCE: Gluckman TJ et al. JAMA Cardiol. 2020 Aug 7. doi: 10.1001/jamacardio.2020.3629.
FROM JAMA CARDIOLOGY
COVID-19/heart connection: What hospitalists need to know
The heart-related manifestations of COVID-19 are a serious matter, but no one should make the mistake of thinking of COVID-19 as primarily a cardiac disease, according to Jeffrey C. Trost, MD, a cardiologist at Johns Hopkins University, Baltimore.
he said in offering a preview of his upcoming clinical update at HM20 Virtual, hosted by the Society of Hospital Medicine.
For this reason, in his clinical update talk, titled “COVID-19 and the Heart: What Every Hospitalist Should Know,” he’ll urge hospitalists to be conservative in ordering cardiac biomarker tests such troponin and natriuretic peptide levels. The focus should appropriately be on the subset of COVID-19 patients having the same symptoms suggestive of acute coronary syndrome, heart failure, or new-onset cardiomyopathy that would trigger laboratory testing in non–COVID-19 patients.
“Be more selective. Definitely do not routinely monitor troponin or [N-terminal of the prohormone brain natriuretic peptide] in patients just because they have COVID-19. A lot of patients with COVID-19 have these labs drawn, especially in the emergency department. We see a high signal-to-noise ratio: not infrequently the values are abnormal, and yet we don’t really know what that means,” said Dr. Trost, who is also director of the cardiac catheterization laboratory at Johns Hopkins Bayview Medical Center.
COVID-19 patients with preexisting heart disease are clearly at increased risk of severe forms of the infectious illness. In his talk, Dr. Trost will review the epidemiology of this association. He’ll also discuss the varied cardiac manifestations of COVID-19, consisting of myocarditis or other forms of new-onset cardiomyopathy, acute coronary syndrome, heart failure, and arrhythmias.
Many questions regarding COVID-19 and the heart remain unanswered for now, such as the mechanism and long-term implications of the phenomenon of ST-elevation acute coronary syndrome with chest pain in the presence of unobstructed coronary arteries, which Dr. Trost and others have encountered. Or the extent to which COVID-19–associated myocarditis is directly virus mediated as opposed to an autoimmune process.
“We’re relying completely on case reports at this point,” according to the cardiologist.
But one major issue has, thankfully, been put to rest on the basis of persuasive evidence which Dr. Trost plans to highlight: Millions of patients on ACE inhibitors or angiotensin receptor blockers can now rest assured that taking those medications doesn’t place them at increased risk of becoming infected with the novel coronavirus or, if infected, developing severe complications of COVID-19. Earlier in the pandemic that had been a legitimate theoretic concern based upon a plausible mechanism.
“I think we as physicians can now confidently say that we don’t need to stop these medicines in folks,” Dr. Trost said.
COVID-19 and the Heart: What Every Hospitalist Should Know
Live Q&A: Wednesday, Aug. 19, 3:30 p.m. to 4:30 p.m. ET
‘Doubling down’ on hydroxychloroquine QT prolongation in COVID-19
A new analysis from Michigan’s largest health system provides sobering verification of the risks for QT interval prolongation in COVID-19 patients treated with hydroxychloroquine and azithromycin (HCQ/AZM).
One in five patients (21%) had a corrected QT (QTc) interval of at least 500 msec, a value that increases the risk for torsade de pointes in the general population and at which cardiovascular leaders have suggested withholding HCQ/AZM in COVID-19 patients.
“One of the most striking findings was when we looked at the other drugs being administered to these patients; 61% were being administered drugs that had QT-prolonging effects concomitantly with the HCQ and AZM therapy. So they were inadvertently doubling down on the QT-prolonging effects of these drugs,” senior author David E. Haines, MD, director of the Heart Rhythm Center at William Beaumont Hospital, Royal Oak, Mich., said in an interview.
A total of 34 medications overlapped with HCQ/AZM therapy are known or suspected to increase the risk for torsade de pointes, a potentially life-threatening ventricular tachycardia. The most common of these were propofol coadministered in 123 patients, ondansetron in 114, dexmedetomidine in 54, haloperidol in 44, amiodarone in 43, and tramadol in 26.
“This speaks to the medical complexity of this patient population, but also suggests inadequate awareness of the QT-prolonging effects of many common medications,” the researchers say.
The study was published Aug. 5 in JACC Clinical Electrophysiology.
Both hydroxychloroquine and azithromycin increase the risk for QTc-interval prolongation by blocking the KCHN2-encoded hERG potassium channel. Several reports have linked the drugs to a triggering of QT prolongation in patients with COVID-19.
For the present study, Dr. Haines and colleagues examined data from 586 consecutive patients admitted with COVID-19 to the Beaumont Hospitals in Royal Oak and Troy, Mich., between March 13 and April 6. A baseline QTc interval was measured with 12-lead ECG prior to treatment initiation with hydroxychloroquine 400 mg twice daily for two doses, then 200 mg twice daily for 4 days, and azithromycin 500 mg once followed by 250 mg daily for 4 days.
Because of limited availability at the time, lead II ECG telemetry monitoring over the 5-day course of HCQ/AZM was recommended only in patients with baseline QTc intervals of at least 440 msec.
Patients without an interpretable baseline ECG or available telemetry/ECG monitoring for at least 1 day were also excluded, leaving 415 patients (mean age, 64 years; 45% female) in the study population. More than half (52%) were Black, 52% had hypertension, 30% had diabetes, and 14% had cancer.
As seen in previous studies, the QTc interval increased progressively and significantly after the administration of HCQ/AZM, from 443 msec to 473 msec.
The average time to maximum QTc was 2.9 days in a subset of 135 patients with QTc measurements prior to starting therapy and on days 1 through 5.
In multivariate analysis, independent predictors of a potentially hazardous QTc interval of at least 500 msec were:
- Age older than 65 years (odds ratio, 3.0; 95% confidence interval, 1.62-5.54).
- History of (OR, 4.65; 95% CI, 2.01-10.74).
- Admission of at least 1.5 mg/dL (OR, 2.22; 95% CI, 1.28-3.84).
- Peak troponin I level above 0.04 mg/mL (OR, 3.89; 95% CI, 2.22-6.83).
- Body mass index below 30 kg/m2 (OR for a BMI of 30 kg/m2 or higher, 0.45; 95% CI, 0.26-0.78).
Concomitant use of drugs with known risk for torsade de pointes was a significant risk factor in univariate analysis (OR, 1.73; P = .036), but fell out in the multivariate model.
No patients experienced high-grade arrhythmias during the study. In all, 112 of the 586 patients died during hospitalization, including 85 (21%) of the 415 study patients.
The change in QTc interval from baseline was greater in patients who died. Despite this, the only independent predictor of mortality was older age. One possible explanation is that the decision to monitor patients with baseline QTc intervals of at least 440 msec may have skewed the study population toward people with moderate or slightly long QTc intervals prior to the initiation of HCQ/AZM, Dr. Haines suggested. Monitoring and treatment duration were short, and clinicians also likely adjusted medications when excess QTc prolongation was observed.
Although it’s been months since data collection was completed in April, and the paper was written in record-breaking time, the study “is still very relevant because the drug is still out there,” observed Dr. Haines. “Even though it may not be used in as widespread a fashion as it had been when we first submitted the paper, it is still being used routinely by many hospitals and many practitioners.”

The use of hydroxychloroquine is “going through the roof” because of COVID-19, commented Dhanunjaya Lakkireddy, MD, medical director for the Kansas City Heart Rhythm Institute, HCA Midwest Health, Overland Park, Kan., who was not involved in the study.
“This study is very relevant, and I’m glad they shared their experience, and it’s pretty consistent with the data presented by other people. The question of whether hydroxychloroquine helps people with COVID is up for debate, but there is more evidence today that it is not as helpful as it was 3 months ago,” said Dr. Lakkireddy, who is also chair of the American College of Cardiology Electrophysiology Council.
He expressed concern for patients who may be taking HCQ with other medications that have QT-prolonging effects, and for the lack of long-term protocols in place for the drug.
In the coming weeks, however, the ACC and rheumatology leaders will be publishing an expert consensus statement that addresses key issues, such as how to best to use HCQ, maintenance HCQ, electrolyte monitoring, the optimal timing of electrocardiography and cardiac magnetic imaging, and symptoms to look for if cardiac involvement is suspected, Dr. Lakkireddy said.
Asked whether HCQ and AZM should be used in COVID-19 patients, Dr. Haines said in an interview that the “QT-prolonging effects are real, the arrhythmogenic potential is real, and the benefit to patients is nil or marginal. So I think that use of these drugs is appropriate and reasonable if it is done in a setting of a controlled trial, and I support that. But the routine use of these drugs probably is not warranted based on the data that we have available.”
Still, hydroxychloroquine continues to be dragged into the spotlight in recent days as an effective treatment for COVID-19, despite discredited research and the U.S. Food and Drug Administration’s June 15 revocation of its emergency-use authorization to allow use of HCQ and chloroquine to treat certain hospitalized COVID-19 patients.
“The unfortunate politicization of this issue has really muddied the waters because the general public doesn’t know what to believe or who to believe. The fact that treatment for a disease as serious as COVID should be modulated by political affiliation is just crazy to me,” said Dr. Haines. “We should be using the best science and taking careful observations, and whatever the recommendations derived from that should be uniformly adopted by everybody, irrespective of your political affiliation.”
Dr. Haines has received honoraria from Biosense Webster, Farapulse, and Sagentia, and is a consultant for Affera, Boston Scientific, Integer, Medtronic, Philips Healthcare, and Zoll. Dr. Lakkireddy has served as a consultant to Abbott, Biosense Webster, Biotronik, Boston Scientific, and Medtronic.
A version of this article originally appeared on Medscape.com.
A new analysis from Michigan’s largest health system provides sobering verification of the risks for QT interval prolongation in COVID-19 patients treated with hydroxychloroquine and azithromycin (HCQ/AZM).
One in five patients (21%) had a corrected QT (QTc) interval of at least 500 msec, a value that increases the risk for torsade de pointes in the general population and at which cardiovascular leaders have suggested withholding HCQ/AZM in COVID-19 patients.
“One of the most striking findings was when we looked at the other drugs being administered to these patients; 61% were being administered drugs that had QT-prolonging effects concomitantly with the HCQ and AZM therapy. So they were inadvertently doubling down on the QT-prolonging effects of these drugs,” senior author David E. Haines, MD, director of the Heart Rhythm Center at William Beaumont Hospital, Royal Oak, Mich., said in an interview.
A total of 34 medications overlapped with HCQ/AZM therapy are known or suspected to increase the risk for torsade de pointes, a potentially life-threatening ventricular tachycardia. The most common of these were propofol coadministered in 123 patients, ondansetron in 114, dexmedetomidine in 54, haloperidol in 44, amiodarone in 43, and tramadol in 26.
“This speaks to the medical complexity of this patient population, but also suggests inadequate awareness of the QT-prolonging effects of many common medications,” the researchers say.
The study was published Aug. 5 in JACC Clinical Electrophysiology.
Both hydroxychloroquine and azithromycin increase the risk for QTc-interval prolongation by blocking the KCHN2-encoded hERG potassium channel. Several reports have linked the drugs to a triggering of QT prolongation in patients with COVID-19.
For the present study, Dr. Haines and colleagues examined data from 586 consecutive patients admitted with COVID-19 to the Beaumont Hospitals in Royal Oak and Troy, Mich., between March 13 and April 6. A baseline QTc interval was measured with 12-lead ECG prior to treatment initiation with hydroxychloroquine 400 mg twice daily for two doses, then 200 mg twice daily for 4 days, and azithromycin 500 mg once followed by 250 mg daily for 4 days.
Because of limited availability at the time, lead II ECG telemetry monitoring over the 5-day course of HCQ/AZM was recommended only in patients with baseline QTc intervals of at least 440 msec.
Patients without an interpretable baseline ECG or available telemetry/ECG monitoring for at least 1 day were also excluded, leaving 415 patients (mean age, 64 years; 45% female) in the study population. More than half (52%) were Black, 52% had hypertension, 30% had diabetes, and 14% had cancer.
As seen in previous studies, the QTc interval increased progressively and significantly after the administration of HCQ/AZM, from 443 msec to 473 msec.
The average time to maximum QTc was 2.9 days in a subset of 135 patients with QTc measurements prior to starting therapy and on days 1 through 5.
In multivariate analysis, independent predictors of a potentially hazardous QTc interval of at least 500 msec were:
- Age older than 65 years (odds ratio, 3.0; 95% confidence interval, 1.62-5.54).
- History of (OR, 4.65; 95% CI, 2.01-10.74).
- Admission of at least 1.5 mg/dL (OR, 2.22; 95% CI, 1.28-3.84).
- Peak troponin I level above 0.04 mg/mL (OR, 3.89; 95% CI, 2.22-6.83).
- Body mass index below 30 kg/m2 (OR for a BMI of 30 kg/m2 or higher, 0.45; 95% CI, 0.26-0.78).
Concomitant use of drugs with known risk for torsade de pointes was a significant risk factor in univariate analysis (OR, 1.73; P = .036), but fell out in the multivariate model.
No patients experienced high-grade arrhythmias during the study. In all, 112 of the 586 patients died during hospitalization, including 85 (21%) of the 415 study patients.
The change in QTc interval from baseline was greater in patients who died. Despite this, the only independent predictor of mortality was older age. One possible explanation is that the decision to monitor patients with baseline QTc intervals of at least 440 msec may have skewed the study population toward people with moderate or slightly long QTc intervals prior to the initiation of HCQ/AZM, Dr. Haines suggested. Monitoring and treatment duration were short, and clinicians also likely adjusted medications when excess QTc prolongation was observed.
Although it’s been months since data collection was completed in April, and the paper was written in record-breaking time, the study “is still very relevant because the drug is still out there,” observed Dr. Haines. “Even though it may not be used in as widespread a fashion as it had been when we first submitted the paper, it is still being used routinely by many hospitals and many practitioners.”
The use of hydroxychloroquine is “going through the roof” because of COVID-19, commented Dhanunjaya Lakkireddy, MD, medical director for the Kansas City Heart Rhythm Institute, HCA Midwest Health, Overland Park, Kan., who was not involved in the study.
“This study is very relevant, and I’m glad they shared their experience, and it’s pretty consistent with the data presented by other people. The question of whether hydroxychloroquine helps people with COVID is up for debate, but there is more evidence today that it is not as helpful as it was 3 months ago,” said Dr. Lakkireddy, who is also chair of the American College of Cardiology Electrophysiology Council.
He expressed concern for patients who may be taking HCQ with other medications that have QT-prolonging effects, and for the lack of long-term protocols in place for the drug.
In the coming weeks, however, the ACC and rheumatology leaders will be publishing an expert consensus statement that addresses key issues, such as how to best to use HCQ, maintenance HCQ, electrolyte monitoring, the optimal timing of electrocardiography and cardiac magnetic imaging, and symptoms to look for if cardiac involvement is suspected, Dr. Lakkireddy said.
Asked whether HCQ and AZM should be used in COVID-19 patients, Dr. Haines said in an interview that the “QT-prolonging effects are real, the arrhythmogenic potential is real, and the benefit to patients is nil or marginal. So I think that use of these drugs is appropriate and reasonable if it is done in a setting of a controlled trial, and I support that. But the routine use of these drugs probably is not warranted based on the data that we have available.”
Still, hydroxychloroquine continues to be dragged into the spotlight in recent days as an effective treatment for COVID-19, despite discredited research and the U.S. Food and Drug Administration’s June 15 revocation of its emergency-use authorization to allow use of HCQ and chloroquine to treat certain hospitalized COVID-19 patients.
“The unfortunate politicization of this issue has really muddied the waters because the general public doesn’t know what to believe or who to believe. The fact that treatment for a disease as serious as COVID should be modulated by political affiliation is just crazy to me,” said Dr. Haines. “We should be using the best science and taking careful observations, and whatever the recommendations derived from that should be uniformly adopted by everybody, irrespective of your political affiliation.”
Dr. Haines has received honoraria from Biosense Webster, Farapulse, and Sagentia, and is a consultant for Affera, Boston Scientific, Integer, Medtronic, Philips Healthcare, and Zoll. Dr. Lakkireddy has served as a consultant to Abbott, Biosense Webster, Biotronik, Boston Scientific, and Medtronic.
A version of this article originally appeared on Medscape.com.
CT-FFR offers a noninvasive ‘one-stop shop’ for pre-TAVR assessment
Fractional flow reserve derived noninvasively from coronary CT angiography is a safe and accurate method for assessing the significance of coronary artery disease in patients with severe aortic stenosis who are headed for transcatheter aortic valve replacement (TAVR), according to results of the CAST-FFR prospective study.
Indeed, utilization of coronary CT angiography–derived fractional flow reserve (CT-FFR) for this purpose offers the advantage of using a single noninvasive imaging method to replace two invasive procedures: coronary angiography to assess the anatomy of coronary lesions, and conventional FFR using a pressure wire to determine the functional significance of a given coronary stenosis as a cause of ischemia, Michael Michail, MBBS, explained in reporting the results at the virtual annual meeting of the European Association of Percutaneous Cardiovascular Interventions.
“Because up to 50% of patients with severe aortic stenosis undergoing TAVR have coexisting coronary artery disease, it remains common practice to perform prior invasive coronary angiography. However, this is associated with inherent risks, particularly in an elderly cohort with comorbidities. Additionally, coronary angiography provides no information on the functional impact of coronary stenoses, which may be important in guiding revascularization decisions prior to TAVR,” noted Dr. Michail, a cardiologist at Monash University, Melbourne.
Simulating FFR: ‘A one-stop shop cardiac CT’
Dr. Michail presented the results of the prospective CAST-FFR study, the first evaluation of CT-FFR for assessment of coronary arteries in patients with severe symptomatic aortic stenosis. This method uses computational fluid dynamics to transform data obtained noninvasively from a standard coronary CT angiography acquisition into a simulated FFR. And it offers the potential to streamline patient care.
“In current practice we see elderly patients with a long pre-TAVR assessment period, with numerous appointments and invasive procedures. Our vision is a one-stop shop cardiac CT that will provide the cardiologist with a complete assessment of the annular measurements, peripheral vasculature, and the coronary arteries ahead of their procedure,” according to Dr. Michail.
“We believe the ability to perform the requisite coronary assessment using CT-FFR will translate to improved patient care in several ways,” he continued. “Firstly, this will shorten the number of tests and overall diagnostic journey for patients. It will reduce the risk from unnecessary invasive procedures, and this will also reduce discomfort for the patient. Based on emerging evidence on the adverse prognostic impact of functionally significant coronary disease in aortic stenosis, this data has the potential to improve procedural risk stratification. And finally, contingent on further data, this may improve lesion selection for upfront revascularization.”
The CAST-FFR study was a small, single-center, proof-of-concept study in which 42 patients with severe aortic stenosis underwent both coronary CT angiography and conventional FFR with a pressure wire. The CT data was sent to a core laboratory for conversion into CT-FFR by evaluators blinded to the conventional FFR values.
Of the 42 participants, 39 (93%) had usable CT-FFR data on 60 coronary vessels. Dr. Michail and coinvestigators found a strong correlation between the conventional pressure wire FFR and CT-FFR findings, with a receiver operating characteristic area under the curve of 0.83 per vessel. CT-FFR had a diagnostic sensitivity and specificity of 73.9% and 78.4%, respectively, with a positive predictive value of 68%, a negative predictive value of 82.9%, and a diagnostic accuracy of 76.7%.
He cited as study limitations the small size, the fact that patients with previous revascularization or significant left ventricular impairment were excluded, and the study cohort’s relative youth.
“With a mean age of 76.2 years, it’s unclear whether these results can be extrapolated to very elderly patients with more calcified arteries undergoing TAVR. Encouragingly, though, a subgroup analysis based on calcium score showed no effect on accuracy,” according to the cardiologist.
CT-FFR may ‘shorten the diagnostic journey’ for fragile patients
Discussant Daniele Andreini, MD, PhD, praised the investigators’ concept of integrating the functional assessment provided by CT-FFR into a one-stop shop examination by cardiac CT angiography for TAVR planning.
“I would like to underline one of Dr. Michail’s messages: It’s really important to shorten the diagnostic journey for these fragile, older patients with aortic stenosis in order to improve safety, use less contrast, and avoid complications,” said Dr. Andreini, a cardiologist at the University of Milan and director of the cardiovascular CT and radiology unit at Monzino Cardiology Center, also in Milan.
Both Dr. Michail and Dr. Andreini reported having no financial conflicts of interest.
REPORTING FROM EUROPCR 2020
Stress-induced brain activity linked to chest pain in CAD patients
The brain’s reaction to stress may be an important contributor to chest pain in patients with coronary artery disease (CAD), according to results of a cohort study.

“Although more research is needed, these results may potentially shift the paradigm by which angina is evaluated by refocusing clinical evaluation and management of psychological stress as adjunct to traditional cardiac evaluations,” wrote Kasra Moazzami, MD, MPH, of Emory University in Atlanta, and his coauthors in Circulation: Cardiovascular Imaging.
To determine if an association exists between stress-induced frontal lobe activity and angina, the researchers launched a study of 148 patients with stable CAD. Their mean age was 62, 69% were male, and roughly 36% were Black. Angina symptoms were assessed at baseline and also after 2 years through the Seattle Angina Questionnaire’s angina frequency subscale.
As the patients underwent stress testing that included both speech and arithmetic stressors, they also received eight brain scans via high-resolution positron emission tomography (HR-PET) brain imaging. Two scans occurred during each of the two control and two stress conditions. Subsequent analysis of these images evaluated regional blood flow relative to total brain flow. Each patient also underwent myocardial perfusion imaging (MPI) at rest, under stress conditions, and during conventional stress testing.
At baseline, patients who reported experiencing angina monthly (35) or daily/weekly (19) had higher rates of mental stress–induced ischemia, more common symptoms of depression and anxiety, and more use of antidepressants and nitrates. Patients reporting angina during stress testing with MPI had higher inferior frontal lobe activation (1.43), compared with patients without active chest pain (1.19; P = 0.03). Patients reporting angina during stress testing also had fewer years of education, higher Beck Depression Inventory scores, and higher posttraumatic stress disorder (PTSD) checklist scores.
More angina correlates with more mental stress
At 2-year-follow-up, 28 (24%) of the 112 returning patients reported an increase in angina episodes. Those patients had a higher mean inferior frontal lobe activation with mental stress at baseline, compared with returning patients who reported a decrease in chest pain frequency (1.82 versus 0.92; P = .01).
After adjustment for sociodemographic and lifestyle variables, any doubling in inferior frontal lobe activation led to an increase in angina frequency by 13.7 units at baseline (95% confidence interval, 6.3-21.7; P = .008) and 11.6 units during follow-up (95% CI, 4.1-19.2; P = .01). After relative importance analysis, the most important correlate of angina was found to be inferior frontal lobe activation at 36.5%, followed by Beck Depression Inventory score and PTSD checklist score.
‘It shows that the heart and brain are connected’
“Previous studies have linked mental stress with ischemia using nuclear stress testing. This study is unique in that it looked at brain activity associated with mental stress and was able to correlate that activity with angina,” said cardiologist Nieca Goldberg, MD, of NYU Langone in New York City in an interview. “It shows that the heart and brain are connected.”
The authors acknowledged their study’s limitations, including using standard stress-inducing protocols that did not account for or reflect any real-life stressors. In addition, although their methods are still considered clinically relevant, retrospectively collecting angina symptoms via questionnaire rather than a prospective diary could have led to incomplete responses.
Dr. Goldberg noted that additional research should include a more diverse population – women in particular were underrepresented in this study – while focusing on how interventions for stress can play a role in angina symptoms and brain activity.
That said, she added, “until there are more studies, it is important to consider mental stress in assessing angina symptoms in patients.”
The study was supported by grants from the National Institutes of Health. The authors reported no potential conflicts of interest.
SOURCE: Moazzami K et al. Circ Cardiovasc Imaging. 2020 Aug 10. doi: 10.1161/circimaging.120.010710.
The brain’s reaction to stress may be an important contributor to chest pain in patients with coronary artery disease (CAD), according to results of a cohort study.
“Although more research is needed, these results may potentially shift the paradigm by which angina is evaluated by refocusing clinical evaluation and management of psychological stress as adjunct to traditional cardiac evaluations,” wrote Kasra Moazzami, MD, MPH, of Emory University in Atlanta, and his coauthors in Circulation: Cardiovascular Imaging.
To determine if an association exists between stress-induced frontal lobe activity and angina, the researchers launched a study of 148 patients with stable CAD. Their mean age was 62, 69% were male, and roughly 36% were Black. Angina symptoms were assessed at baseline and also after 2 years through the Seattle Angina Questionnaire’s angina frequency subscale.
As the patients underwent stress testing that included both speech and arithmetic stressors, they also received eight brain scans via high-resolution positron emission tomography (HR-PET) brain imaging. Two scans occurred during each of the two control and two stress conditions. Subsequent analysis of these images evaluated regional blood flow relative to total brain flow. Each patient also underwent myocardial perfusion imaging (MPI) at rest, under stress conditions, and during conventional stress testing.
At baseline, patients who reported experiencing angina monthly (35) or daily/weekly (19) had higher rates of mental stress–induced ischemia, more common symptoms of depression and anxiety, and more use of antidepressants and nitrates. Patients reporting angina during stress testing with MPI had higher inferior frontal lobe activation (1.43), compared with patients without active chest pain (1.19; P = 0.03). Patients reporting angina during stress testing also had fewer years of education, higher Beck Depression Inventory scores, and higher posttraumatic stress disorder (PTSD) checklist scores.
More angina correlates with more mental stress
At 2-year-follow-up, 28 (24%) of the 112 returning patients reported an increase in angina episodes. Those patients had a higher mean inferior frontal lobe activation with mental stress at baseline, compared with returning patients who reported a decrease in chest pain frequency (1.82 versus 0.92; P = .01).
After adjustment for sociodemographic and lifestyle variables, any doubling in inferior frontal lobe activation led to an increase in angina frequency by 13.7 units at baseline (95% confidence interval, 6.3-21.7; P = .008) and 11.6 units during follow-up (95% CI, 4.1-19.2; P = .01). After relative importance analysis, the most important correlate of angina was found to be inferior frontal lobe activation at 36.5%, followed by Beck Depression Inventory score and PTSD checklist score.
‘It shows that the heart and brain are connected’
“Previous studies have linked mental stress with ischemia using nuclear stress testing. This study is unique in that it looked at brain activity associated with mental stress and was able to correlate that activity with angina,” said cardiologist Nieca Goldberg, MD, of NYU Langone in New York City in an interview. “It shows that the heart and brain are connected.”
The authors acknowledged their study’s limitations, including using standard stress-inducing protocols that did not account for or reflect any real-life stressors. In addition, although their methods are still considered clinically relevant, retrospectively collecting angina symptoms via questionnaire rather than a prospective diary could have led to incomplete responses.
Dr. Goldberg noted that additional research should include a more diverse population – women in particular were underrepresented in this study – while focusing on how interventions for stress can play a role in angina symptoms and brain activity.
That said, she added, “until there are more studies, it is important to consider mental stress in assessing angina symptoms in patients.”
The study was supported by grants from the National Institutes of Health. The authors reported no potential conflicts of interest.
SOURCE: Moazzami K et al. Circ Cardiovasc Imaging. 2020 Aug 10. doi: 10.1161/circimaging.120.010710.
FROM CIRCULATION: CARDIOVASCULAR IMAGING
Vast underdiagnosis of monogenic CV disease seen in cath referrals
Monogenic disorders with heart and vascular effects are each pretty rare in clinical practice but collectively can make up a fair proportion of the patients cardiologists see. Still, the diagnosis is missed more often than not, even when the clinical signs are there, suggests an observational study, supporting broader genetic testing in cardiovascular patients.
In a cohort of more than 8,000 patients referred for cardiac catheterization, diagnosis of such a monogenic cardiovascular disease (MCVD) was made in only 35% of those with one related gene variant and signs of phenotypic expression in the electronic health record.
The findings are novel for measuring the field’s “burden of missed diagnoses” in patients with MCVD, which “represent a missed opportunity that could be addressed by genetic screening,” contended the study report, published in the Aug. 18 issue of the Journal of the American College of Cardiology.
“The underrecognition of these diseases underscores the importance of including monogenic diseases in the treating physician’s differential diagnosis,” say the authors, led by Jawan W. Abdulrahim, MD, Duke University, Durham, N.C.
Diagnosis of MCVDs can be important, the group wrote, because many, including familial transthyretin amyloidosis (TTR) and other disorders that pose an increased risk for sudden death, have evidence-based treatment modalities available or are clinically actionable. “Identification of patients with MCVD variants” is also “important for cascade screening of family members who are at risk of inheriting the pathogenic mutations.”
“We tend to ignore these monogenic diseases because they are so rare individually but, in aggregate, monogenic diseases are actually quite common,” senior author Svati H. Shah, MD, MHS, also of Duke University, said in an interview.
The results “support that the cardiology community over time adopt a genotype-forward approach,” one in which every patient presenting to a cardiovascular clinic is genotyped, she said.
One implication of such an approach, Dr. Shah agreed, is that “we would be able to pick these people up earlier in their disease, especially in the context of therapies that could improve certainly their progression, but even their survival.”
For now, she said, the study suggests that “these disorders are more frequent than perhaps all cardiologists are aware of, and we just need to keep our eyes open and know when to refer patients to a cardiovascular genetics clinic, which maybe has more time and can deal with all the nuances that go along with genetic testing.”
In the total cohort, 4.5% were found to carry a gene variant known or believed to cause such diseases. The most frequently represented conditions were familial TTR, hereditary hemochromatosis, heterozygous familial hypercholesterolemia, and various cardiomyopathies.
Of those patients, 52 received a clinical diagnosis of the monogenic disorder after an EHR review. Of the 290 without such a diagnosis, two-thirds showed no evidence in their EHR of the variant’s phenotypic signs. But the records of the other third featured at least some signs that the disease had manifested clinically.
“These data serve as a reminder that monogenic Mendelian disease, including heart and vascular disease, varies in penetrance from individual to individual and may not always present with clinically detectable phenotypes,” noted an editorial accompanying the report.
They also “provide a compelling basis for expanding the role of targeted genetic testing in patients with more traditional forms of heart and vascular disease,” wrote Scott M. Damrauer, MD, University of Pennsylvania, Philadelphia, and William S. Weintraub, MD, Medstar Washington Hospital Center and Georgetown University, Washington.
“Based on the current report, the number needed to screen in a complex cardiovascular patient population to detect 1 case of undiagnosed monogenic cardiovascular disease is 85,” they wrote. “This places targeted genetic testing well within what is considered to be efficacious for most screening programs and in the range of that of other common cardiovascular diseases and cancers.”
Among the 342 patients with a variant predicting a single MCVD – in addition to the 52 who received a diagnosis – 193 had records with no indication of phenotypic expression and so did not receive a diagnosis.
But the 97 patients without a diagnosis who nevertheless had documented signs of some phenotypic expression were deemed, on the basis of extent of expression, to represent a possibly, probably, or definitely missed diagnosis.
Familial TTR made up about 45% of such potentially missed diagnoses, the report noted.
Broader screening of patients with cardiovascular disease, Dr. Shah speculated, “might actually be not only a clinically useful endeavor, but – when we think about the aggregate burden of these monogenic disorders – potentially even cost-effective.”
As the price of genetic sequencing drops, she said, “I think we’ll start to see even more health systems wanting to incorporate the genotype-forward approach.”
Dr. Shah reports serving as primary investigator for research sponsored by Verily Life Sciences and AstraZeneca. Dr. Abdulrahim reports no relevant relationships. Disclosures for the other authors are in the report. Dr. Damrauer discloses receiving research support from RenalytixAI and consulting fees from Calico Labs. Dr. Weintraub had no relevant disclosures.
A version of this article originally appeared on Medscape.com.
AHA statement recommends dietary screening at routine checkups
A new scientific statement from the American Heart Association recommends incorporating a rapid diet-screening tool into routine primary care visits to inform dietary counseling and integrating the tool into patients’ electronic health record platforms across all healthcare settings.

The statement authors evaluated 15 existing screening tools and, although they did not recommend a specific tool, they did present advantages and disadvantages of some of the tools and encouraged “critical conversations” among clinicians and other specialists to arrive at a tool that would be most appropriate for use in a particular health care setting.
“The key takeaway is for clinicians to incorporate discussion of dietary patterns into routine preventive care appointments because a suboptimal diet is the No. 1 risk factor for cardiovascular disease,” Maya Vadiveloo, PhD, RD, chair of the statement group, said in an interview.
“We also wanted to touch on the fact the screening tool could be incorporated into the EHR and then used for clinical support and for tracking and monitoring the patient’s dietary patterns over time,” said Dr. Vadiveloo, assistant professor of nutrition and food sciences in the College of Health Science, University of Rhode Island, Kingston.
The statement was published online Aug. 7 in Circulation: Cardiovascular Quality and Outcomes.
Competing demands
Poor dietary quality has “surpassed all other mortality risk factors, accounting for 11 million deaths and about 50% of cardiovascular disease (CVD) deaths globally,” the authors wrote.
Diets deficient in fruits, vegetables, and whole grains and high in red and processed meat, added sugars, sodium, and total energy are the “leading determinants” of the risks for CVD and other conditions, so “strategies that promote holistically healthier dietary patterns to reduce chronic disease risk are of contemporary importance.”
Most clinicians and other members of health care teams “do not currently assess or counsel patients about their food and beverage intake during routine clinical care,” the authors observed.
Reasons for this may include lack of training and knowledge, insufficient time, insufficient integration of nutrition services into health care settings, insufficient reimbursement, and “competing demands during the visit,” they noted.
Dr. Vadiveloo said that an evidence-based rapid screening tool can go a long way toward helping to overcome these barriers.
“Research shows that when primary care practitioners discuss diet with patients, the patients are receptive, but we also know that clinical workloads are already very compressed, and adding another thing to a routine preventive care appointment is challenging,” she said. “So we wanted to look and see if there were already screening tools that showed promise as valid, reliable, reflective of the best science, and easy to incorporate into various types of practice settings.”
Top picks
The authors established “theoretical and practice-based criteria” for an optimal diet screening tool for use in the adult population (aged 20 to 75 years). The tool had to:
- Be developed or used within clinical practice in the past 10 years.
- Be evidence-based, reliable, and valid.
- Assess total dietary pattern rather than focusing on a single food or nutrient.
- Be able to be completed and scored at administration without special knowledge or software.
- Give actionable next steps and support to patients.
- Be able track and monitor dietary change over time.
- Be brief.
- Be useful for chronic disease management.
Of the 15 tools reviewed, the three that met the most theoretical and practice-based validity criteria were the Mediterranean Diet Adherence Screener (MEDAS) and its variations; the modified, shortened Rapid Eating Assessment for Participants (REAP), and the modified version of the Starting the Conversation Tool. However, the authors noted that the Powell and Greenberg Screening Tool was the “least time-intensive.”
One size does not fit all
No single tool will be appropriate for all practice settings, so “we would like clinicians to discuss what will work in their particular setting,” Dr. Vadiveloo emphasized.
For example, should the screening tool be completed by the clinician, a member of the health care team, or the patient? Advantages of a tool completed by clinicians or team members include collection of the information in real time, where it can be used in shared decision-making during the encounter and increased reliability because the screen has been completed by a clinician. On the other hand, the clinician might not be able to prioritize administering the screening tool during a short clinical encounter.
Advantages of a tool completed by the patient via an EHR portal is that the patient may feel less risk of judgment by the clinician or health care professional and patients can complete the screen at their convenience. Disadvantages are limited reach into underserved populations and, potentially, less reliability than clinician-administered tools.
“It is advantageous to have tools that can be administered by multiple members of health care teams to ease the demand on clinicians, if such staff is available, but in other settings, self-administration might be better, so we tried to leave it open-ended,” Dr. Vadiveloo explained.
‘Ideal platform’
“The EHR is the ideal platform to prompt clinicians and other members of the health care team to capture dietary data and deliver dietary advice to patients,” the authors observed.
EHRs allow secure storage of data and also enable access to these data when needed at the point of care. They are also important for documentation purposes.
The authors noted that the use of “myriad EHR platforms and versions of platforms” have created “technical challenges.” They recommended “standardized approaches” for transmitting health data that will “more seamlessly allow rapid diet screeners to be implemented in the EHR.”
They also recommended that the prototypes of rapid diet screeners be tested by end users prior to implementation within particular clinics. “Gathering these data ahead of time can improve the uptake of the application in the real world,” they stated.
Dr. Vadiveloo added that dietary counseling can be conducted by several members of a health care team, such as a dietitian, not just by the physician. Or the patient may need to be referred to a dietitian for counseling and follow-up.
The authors concluded by characterizing the AHA statement as “a call to action ... designed to accelerate efforts to make diet quality assessment an integral part of office-based care delivery by encouraging critical conversations among clinicians, individuals with diet/lifestyle expertise, and specialists in information technology.”
Dr. Vadiveloo has disclosed no relevant financial relationships. The other authors’ disclosures are listed in the original paper.
A version of this article originally appeared on Medscape.com.
A new scientific statement from the American Heart Association recommends incorporating a rapid diet-screening tool into routine primary care visits to inform dietary counseling and integrating the tool into patients’ electronic health record platforms across all healthcare settings.
The statement authors evaluated 15 existing screening tools and, although they did not recommend a specific tool, they did present advantages and disadvantages of some of the tools and encouraged “critical conversations” among clinicians and other specialists to arrive at a tool that would be most appropriate for use in a particular health care setting.
“The key takeaway is for clinicians to incorporate discussion of dietary patterns into routine preventive care appointments because a suboptimal diet is the No. 1 risk factor for cardiovascular disease,” Maya Vadiveloo, PhD, RD, chair of the statement group, said in an interview.
“We also wanted to touch on the fact the screening tool could be incorporated into the EHR and then used for clinical support and for tracking and monitoring the patient’s dietary patterns over time,” said Dr. Vadiveloo, assistant professor of nutrition and food sciences in the College of Health Science, University of Rhode Island, Kingston.
The statement was published online Aug. 7 in Circulation: Cardiovascular Quality and Outcomes.
Competing demands
Poor dietary quality has “surpassed all other mortality risk factors, accounting for 11 million deaths and about 50% of cardiovascular disease (CVD) deaths globally,” the authors wrote.
Diets deficient in fruits, vegetables, and whole grains and high in red and processed meat, added sugars, sodium, and total energy are the “leading determinants” of the risks for CVD and other conditions, so “strategies that promote holistically healthier dietary patterns to reduce chronic disease risk are of contemporary importance.”
Most clinicians and other members of health care teams “do not currently assess or counsel patients about their food and beverage intake during routine clinical care,” the authors observed.
Reasons for this may include lack of training and knowledge, insufficient time, insufficient integration of nutrition services into health care settings, insufficient reimbursement, and “competing demands during the visit,” they noted.
Dr. Vadiveloo said that an evidence-based rapid screening tool can go a long way toward helping to overcome these barriers.
“Research shows that when primary care practitioners discuss diet with patients, the patients are receptive, but we also know that clinical workloads are already very compressed, and adding another thing to a routine preventive care appointment is challenging,” she said. “So we wanted to look and see if there were already screening tools that showed promise as valid, reliable, reflective of the best science, and easy to incorporate into various types of practice settings.”
Top picks
The authors established “theoretical and practice-based criteria” for an optimal diet screening tool for use in the adult population (aged 20 to 75 years). The tool had to:
- Be developed or used within clinical practice in the past 10 years.
- Be evidence-based, reliable, and valid.
- Assess total dietary pattern rather than focusing on a single food or nutrient.
- Be able to be completed and scored at administration without special knowledge or software.
- Give actionable next steps and support to patients.
- Be able track and monitor dietary change over time.
- Be brief.
- Be useful for chronic disease management.
Of the 15 tools reviewed, the three that met the most theoretical and practice-based validity criteria were the Mediterranean Diet Adherence Screener (MEDAS) and its variations; the modified, shortened Rapid Eating Assessment for Participants (REAP), and the modified version of the Starting the Conversation Tool. However, the authors noted that the Powell and Greenberg Screening Tool was the “least time-intensive.”
One size does not fit all
No single tool will be appropriate for all practice settings, so “we would like clinicians to discuss what will work in their particular setting,” Dr. Vadiveloo emphasized.
For example, should the screening tool be completed by the clinician, a member of the health care team, or the patient? Advantages of a tool completed by clinicians or team members include collection of the information in real time, where it can be used in shared decision-making during the encounter and increased reliability because the screen has been completed by a clinician. On the other hand, the clinician might not be able to prioritize administering the screening tool during a short clinical encounter.
Advantages of a tool completed by the patient via an EHR portal is that the patient may feel less risk of judgment by the clinician or health care professional and patients can complete the screen at their convenience. Disadvantages are limited reach into underserved populations and, potentially, less reliability than clinician-administered tools.
“It is advantageous to have tools that can be administered by multiple members of health care teams to ease the demand on clinicians, if such staff is available, but in other settings, self-administration might be better, so we tried to leave it open-ended,” Dr. Vadiveloo explained.
‘Ideal platform’
“The EHR is the ideal platform to prompt clinicians and other members of the health care team to capture dietary data and deliver dietary advice to patients,” the authors observed.
EHRs allow secure storage of data and also enable access to these data when needed at the point of care. They are also important for documentation purposes.
The authors noted that the use of “myriad EHR platforms and versions of platforms” have created “technical challenges.” They recommended “standardized approaches” for transmitting health data that will “more seamlessly allow rapid diet screeners to be implemented in the EHR.”
They also recommended that the prototypes of rapid diet screeners be tested by end users prior to implementation within particular clinics. “Gathering these data ahead of time can improve the uptake of the application in the real world,” they stated.
Dr. Vadiveloo added that dietary counseling can be conducted by several members of a health care team, such as a dietitian, not just by the physician. Or the patient may need to be referred to a dietitian for counseling and follow-up.
The authors concluded by characterizing the AHA statement as “a call to action ... designed to accelerate efforts to make diet quality assessment an integral part of office-based care delivery by encouraging critical conversations among clinicians, individuals with diet/lifestyle expertise, and specialists in information technology.”
Dr. Vadiveloo has disclosed no relevant financial relationships. The other authors’ disclosures are listed in the original paper.
A version of this article originally appeared on Medscape.com.