User login
Improving Nephropathy Screening in Appalachian Patients With Diabetes Using Practice-Wide Outreach
From West Virginia University, Morgantown, WV.
Abstract
Objective: To describe the strategies a family medicine clinic in Appalachia utilized to increase nephropathy screening rates as well as to explore the factors predictive of nephropathy screening in patients with diabetes.
Design: This quality improvement project targeted the points in the care process when patients are lost to follow-up for nephropathy screening.
Setting and participants: Patients with diabetes cared for by a primary care provider (PCP) at an academic family medicine practice in Appalachia from January 2018 to November 2018.
Interventions: Bulk orders for albumin-to-creatinine (ACR) testing and urine collection during clinic visit, enhanced patient communication through bulk communication reminders and individual patient outreach, and education of clinic providers.
Measurements: Demographic data and monthly nephropathy screening rates.
Results: The nephropathy screening rate increased by 6.2% during the project. Older patients living closer to the clinic who visited their PCP 3 or more times per year were the most likely to be screened.
Conclusion: Combining team-based interventions with quality control monitoring can significantly improve compliance with recommended nephropathy treatment and screening in rural patients with diabetes at a family medicine clinic.
Keywords: rural; kidney disease; albumin-to-creatinine ratio; electronic health record.
According to the Centers for Disease Control and Prevention (CDC), an estimated 30.3 million people in the United States—about 9.4% of the population—have been diagnosed with diabetes.1 Diabetes is the seventh leading cause of death in the United States, and it contributes to other leading causes of death: heart disease and stroke.1 Diabetes also is related to high morbidity risk and is a leading cause of chronic kidney disease.1 The total cost of diagnosed diabetes was estimated at $327 billion in direct medical costs and reduced productivity.2
Residents of Appalachia bear a disproportionate burden of diabetes and other related negative health outcomes; these outcomes are influenced by a number of factors, including socioeconomic status, poverty, rurality, and health care access. Rates of chronic disease, such as diabetes, are most pronounced in Appalachia’s most economically distressed counties.3-5 In 2011, the CDC labeled a 644-county area the “diabetes belt,” which included most of Appalachia.6 As a result of this elevated prevalence of diabetes in Appalachia as compared to the rest of the country, complications directly associated with diabetes are more commonly observed in Appalachian residents. One of the most damaging complications is diabetic nephropathy.
Diabetic nephropathy results from damage to the microvasculature of the kidney due to inadequately controlled blood glucose. This, in turn, leads to decreased renal function, eventually leading to clinically significant renal disease. The long-term complications associated with nephropathy can include many comorbid conditions, the most serious of which are progression to end-stage renal disease, dialysis requirement, and early mortality. Diabetic nephropathy affects approximately 40% of patients with type 1 and type 2 diabetes.7,8
One way to prevent complications of diabetic nephropathy, in addition to good glycemic control in patients with diabetes, is early and regular screening. Currently, the American Diabetes Association (ADA) recommends yearly screening for diabetic nephropathy in the form of a urine albumin-to-creatinine ratio (ACR) for patients 18 to 75 years of age.2 This screening to detect diabetic nephropathy is recognized as a marker of quality care by many public and private insurance agencies and medical specialty associations, such as the Centers for Medicare and Medicaid Services.
Many patients with diabetes are cared for by primary care providers (PCP), and these PCP appointments provide an opportune time to screen and appropriately treat nephropathy. Screening opportunities are often missed, however, due to time constraints and competing health priorities. There are also a number of other factors specific to the Appalachian region that reduce the likelihood of screening for diabetic nephropathy, such as a lack of health insurance, the need to travel long distances to see a PCP, work and household responsibilities, low levels of education and health literacy, and a mistrust of outsiders regarding personal matters, including health.9-11 While nephropathy can have a detrimental impact on patients across populations, it is of particular concern for a state located in the heart of Appalachia, such as West Virginia.
Given the disproportionate burden of diabetes in this region and the potentially severe consequences of undetected nephropathy, clinicians from an academic family medicine clinic in West Virginia undertook a quality improvement project to increase the rate of nephropathy screening and treatment among patients with diabetes. This article describes the intervention strategies the team utilized to increase nephropathy screening and treatment in patients 18 to 75 years of age who met quality measures for nephropathy screening or treatment in the previous 12 months and explores the factors most predictive of nephropathy screening in Appalachian patients in this age group. It also reports the challenges and opportunities encountered and offers suggestions for other providers and clinics attempting to increase their nephropathy screening rates.
Methods
Setting and Study Population
The study population included patients ages 18 to 75 years under the care of providers in an academic family medicine practice in West Virginia who had been diagnosed with diabetes mellitus. The study focused on those patients overdue for diabetic nephropathy screening (ie, had not been screened in previous 12 months). The project began in January 2018 with a screening rate of 83.8%. The goal of this project was to increase this compliance metric by at least 5%. The project protocol was submitted to the West Virginia University Institutional Review Board, and, because it is a quality improvement project, permission was given to proceed without a board review.
Interventions
The team identified and implemented several interventions intended to reduce screening barriers and increase the screening rate.
Bulk orders for ACR and urine collection during clinic visits. Prior to initiation of this project, it was left to individual clinic providers to order nephropathy screening for patients with diabetes during a clinic visit; after receiving the order for “random urine microalbumin/creatinine ratio,” patients then had to travel to a lab to provide a urine sample. For this project and moving forward, the team changed to the procedure of initiating bulk ACR orders and collecting urine samples during clinic visits from all patients ages 18 to 75 years who have diabetes.
Bulk communication reminders. Since many patients with diabetes may not have realized they were overdue for nephropathy screening, the team began sending out bulk communication reminders through either the institution’s electronic health record (EHR; MyChart) or postal service–delivered physical letters (according to patient communication preferences) to remind patients that they were due for screening and to encourage them to schedule an appointment or keep a previously scheduled appointment with their PCP.
Individual patient outreach. A team of pharmacy students led by a licensed pharmacist in the family medicine clinic contacted patients overdue for screening even after bulk communication reminders went out. The students telephoned patients 2 to 3 months following the bulk communication. The students obtained an updated list of patients with diabetes ages 18 to 75 years from an EHR quality report. They began by prescreening the patients on the overdue list for potential candidacy for an angiotensin-converting enzyme (ACE) inhibitor or an angiotensin II receptor blocker (ARB). Screening for candidacy included evaluation of recent blood pressure readings, electrolytes (ie, basic metabolic panel), and ACR. If the students determined a patient was a candidate, they presented the patient to the preceptor for verification and then reached out to the provider with a recommendation. If the provider agreed, the student contacted the patient by telephone for medication counseling and education. The remaining patients determined not to be candidates for ACE inhibitors or ARBs were contacted by the pharmacy students by telephone to remind them that laboratory work was pending. Up to 3 phone call attempts were made before patients were determined to be unreachable. Students left voice mails with generic reminders if a patient could not be reached. If a patient answered, the student provided a reminder but also reviewed indications for lab work, the reason why the provider wished for follow-up, and updated lab hours. Students also followed up with the results of the work-up, as appropriate. During this outreach process, the student team encountered a number of patients who had moved or changed to a PCP outside of the family medicine clinic. In these cases, the EHR was updated and those patients were removed from the list of patients altogether.
Education of clinic providers. Clinic providers were educated during faculty and resident meetings and didactic learning sessions on identifying patients within the EHR who are due for nephropathy screening. They also received instruction on how to update the EHR to reflect completed screenings.
Data Analysis
All analyses in this study were conducted using SAS (version 9.4, 2013, SAS Institute Inc., Cary, NC). Descriptive analyses were conducted to summarize basic patient demographic information. To compare patients screened within the previous 12 months to those patients overdue for screening, 2-sample t-tests were used to examine differences in patients’ age, HbA1c, ACR, and creatinine level and the distance (in miles) between the patient’s home and the clinic. Chi-square analyses were used to examine the relationship between whether a patient was recently screened for nephropathy and the patient’s insurance, number of patient visits in the previous 12 months, and provider level. Logistic regression analyses were conducted to control for covariates and to explore which factors were most predictive of nephropathy screening. All tests were 2-tailed, and P values less than 0.05 were considered statistically significant.
Results
Patient Characteristics
There were 1676 family medicine clinic patients with diabetes between 18 and 75 years of age (Table 1 and Table 2). Of the total sample, 1489 (88.8%) had completed screening for nephropathy in the 12 months prior to evaluation, and 67.5%, 23.7%, and 8.8% of patients had private insurance, Medicare, and Medicaid, respectively. ")
The mean (SD) age of the patients was 56.3 (11.9) years. The mean distance between the patient’s home and the clinic was 26.6 (76.8) miles. The mean number of visits was 3.6 (2.9) per year, and 43.0% of the patientvisited the clinic more than 3 times in a year. The mean values for HbA1c (%), creatinine (g/mol), and ACR (mg/g) were 7.7 (1.9), 1.0 (0.7), and 9.4 (31.4), respectively.")
Screening of Patients for Nephropathy
Patients with Medicare and private insurance were more likely to have completed the nephropathy screening than those with Medicaid (92.5% versus 88.8% versus 82.8%, P = 0.004; Table 3 and Table 4). 

Changes in Screening Rate
The practice-wide screening rate was 83.8% at the start of this project in January 2018. The screening rate steadily increased throughout 2018, reaching 90.3% in August 2018, and then leveled off around 90% when the project was concluded at the end of November 2018 (Figure). As an added benefit of the increased screening rates, a number of patients were initiated on an ACE inhibitor or ARB based on the team’s screening efforts.

Predictors of Nephropathy Screening
A logistic regression analysis was conducted with nephropathy screening (screened or not screened) as the outcome and 7 patient characteristics as predictors: type of insurance (private, Medicare, or Medicaid), PCP visits in the past 12 months (≤ 3 or > 3), distance in miles of the patient’s residence from the clinic, age, last HbA1c value, last ACR value, and last creatinine value. A test of the full model with all 7 predictors was statistically significant (χ2 (8) = 57.77, P < 0.001). Table 5 shows regression coefficients, Wald statistics, and 95% confidence intervals for odds ratios for each of the 7 predictors. According to the Wald criterion, 3 patient characteristics were significant predictors of nephropathy screening: age, distance between the patient’s home and clinic, and number of PCP visits in the past 12 months. After adjusting for the covariates, there were still significant associations between the nephropathy screening status and age ( χ2(1) = 9.64, P < 0.01); distance between the patient’s home and the clinic (χ2(1) = 3.98, P < 0.05); and the number of PCP visits in the previous year (χ2(1) = 21.74, P < 0.001). With each 1-year increment in age, the odds of completing the nephropathy screening increased by 3.2%. With each 1-mile increase in the distance between the patient’s home and clinic, the odds of completing the nephropathy screening decreased by 0.2%. Patients who visited the clinic more than 3 times in a year were 3.9 times (95% confidence interval, 2.2-7.0) more likely to complete the nephropathy screening than their counterparts who visited fewer than 3 times per year.
In summary, older patients living within about 164 miles of the clinic (ie, within 1 standard deviation from the average miles between patient’s homes and the clinic) who visited their PCP 3 or more times per year were the most likely to be screened.

Discussion
Diabetic nephropathy is a critical issue facing family medicine providers and patients. The morbidity and mortality costs are significant, as diabetic nephropathy is the leading cause of end-stage renal disease. While the ADA recommends annual ACR screening in patients with diabetes and prescription of ACE inhibitors or ARBs in patients who qualify, many patients do not receive these interventions, despite following up with a provider.12-15 There is no current literature that indicates the compliance rates in the rural setting. Due to health disparities in the rural setting noted in the literature, it could be hypothesized that these individuals are at high risk of not meeting these screening and treatment recommendations.16,17 Limited access to care and resources, gaps in insurance coverage, and lower health literacy are a few barriers identified in the rural population that may influence whether these measures are met.17
Considering the disease burden of diabetes and its related complications, including nephropathy, consistent screening is necessary to reduce diabetes-related burdens and cost, while also increasing the quality of life for patients with diabetes. All parties must be involved to ensure appropriate compliance and treatment. Our institution’s implementation of quality improvement strategies has key implications for nephropathy screening and treatment efforts in rural settings.
An additional step of having a health care provider (other than the PCP) screen all patients who are not meeting the standard allows for identification of gaps in care. In our quality improvement workflow, the clinical pharmacist screened all patients for candidacy for ACE inhibitor/ARB therapy. While only a small percentage of patients qualified, many of these patients had previously been on therapy and were discontinued for an unknown reason or were stopped due to an acute condition (eg, acute kidney injury) and never restarted after recovery. Other patients required additional education that therapy would be utilized for nephroprotection versus blood pressure management (secondary to an elevated ACR). This highlights the importance of transitions of care and ongoing, intensive education, not only during initial diagnosis but also throughout the disease-state progression.
Utilization of EHRs and telephone outreach are additional aspects of care that can be provided. Our improved rates of compliance with these care interventions parallel findings from previous studies.15,18 Optimization of an institution’s EHR can aid in standardization of care, workflow management, and communication with patients, as well as alert nursing or support staff of screening needs. Techniques such as best practice reminders, patient chart messages, and nursing-entered physician alerts on daily schedules have been shown to increase rates of compliance with nephropathy standards. These findings underscore an additional opportunity for nursing and support staff to be better integrated into care.
Despite the success of this quality improvement initiative, there remain some limitations. The processes we used in this project may not be applicable to every institution and may have limited external validity. Primarily, while these processes may be implemented at some sites, without additional support staff (ie, extra nursing staff, pharmacists) and students to aid in patient outreach, success may be limited due to provider time constraints. Additionally, our workflow process demonstrates significant incorporation of an EHR system for patient outreach. Institutions and/or clinics that heavily rely on paper charts and paper outreach may face barriers with bulk orders (eg, ACR) and messages, interventions that streamlined our population health management. Finally, this project focuses on only 1 aspect of population health management for patients with diabetes. While nephropathy is a critical aspect of caring for individuals with diabetes, this patient outreach does not address retinopathy screening, HbA1c control, or vaccination rates, which are other components of care.
Conclusion
Although this evaluation does not provide insight into why patients were not treated or screened, it demonstrates processes to improve compliance in patients with diabetic nephropathy. Rural health care facilities require an ongoing program of change and evaluation, with the aim to improve the provision of services, increase screening, and encourage team member involvement in health promotion. This study demonstrates that combining team-based interventions with quality control monitoring can significantly improve compliance with recommended nephropathy screening and treatment in rural patients with diabetes at a family medicine clinic.
Corresponding author: Amie M. Ashcraft, West Virginia University, Department of Family Medicine, 1 Medical Center Drive, Box 9152, Morgantown, WV 26506; [email protected].
Financial disclosures: None.
Acknowledgment: The authors thank the faculty, residents, nurses, and clinic staff for their hard work and dedication to this effort: Umama Sadia, Michelle Prestoza, Richard Dattola, Greg Doyle, Dana King, Mike Maroon, Kendra Under, Judy Siebert, Christine Snyder, Rachel Burge, Meagan Gribble, Lisa Metts, Kelsey Samek, Sarah Deavers, Amber Kitzmiller, Angela Lamp, Tina Waldeck, and Andrea Sukeruksa.
1. Centers for Disease Control and Prevention (CDC). National diabetes statistics report. Estimates of diabetes and its burden in the United States. Atlanta, GA: CDC; 2017www.cdc.gov/diabetes/pdfs/data/statistics/national-diabetes-statistics-report.pdf. Accessed December 20, 2020.
2. American Diabetes Association (ADA). Economic costs of diabetes in the U.S. in 2017. Diabetes Care. 2018;41:917-928.
3. Wood L. Trends in national and regional economic distress, 1960-2000. Washington, DC: Appalachian Regional Commission; 2005.
4. Barker L, Crespo R, Gerzoff RB, et al. Residence in a distressed county in Appalachia as a risk factor for diabetes, Behavioral Risk Factor Surveillance System, 2006-2007. Prev Chronic Dis. 2010;7:A104.
5. Barker L, Kirtland KA, Gregg E, et al. Geographic distribution of diagnosed diabetes in the United States: A diabetes belt. Am J Prev Med. 2011;40:434-439.
6. Gross JL, de Azevedo MJ, Silveiro SP, et al. Diabetic nephropathy: Diagnosis, prevention, and treatment. Diabetes Care. 2005;28:164-176.
7. United States Renal Data System (USRDS). Annual data report. Ann Arbor, MI: USRDS; 2018. www.usrds.org/2018/view/Default.aspx. Accessed December 20, 2020.
8. Halverson JA, Bichak G. Underlying socioeconomic factors influencing health disparities in the Appalachian region. Washington, DC: Appalachian Regional Commission; 2008.
9. Shell R, Tudiver F. Barriers to cancer screening by rural Appalachian primary care providers. J Rural Health. 2004;20:368-373.
10. Hatcher J, Dignan MB, Schoenberg N. How do rural health care providers and patients view barriers to colorectal cancer screening? Insights from Appalachian Kentucky. Nurs Clin North Am. 2011;46:181-192.
11. Scott S, McSpirit S. The suspicious, untrusting hillbilly in political-economic contexts: Stereotypes and social trust in the Appalachian coalfields. Pract Anthropol. 2014;36:42-46.
12. Kirkman MS, Williams SR, Caffrey HH, Marrero DG. Impact of a program to improve adherence to diabetes guidelines by primary care physicians. Diabetes Care. 2002;25:1946-1951.
13. Byun SH, Ma SH, Jun JK, et al. Screening for diabetic retinopathy and nephropathy in patients with diabetes: A nationwide survey in Korea. PLoS One. 2013;8:e62991.
14. Flood D, Garcia P, Douglas K, et al. Screening for chronic kidney disease in a community-based diabetes cohort in rural Guatemala: A cross-sectional study. BMJ Open. 2018;8:e019778.
15. Anabtawi A, Mathew LM. Improving compliance with screening of diabetic patients for microalbuminuria in primary care practice. ISRN Endocrinology. 2013:893913.
16. Tonks SA, Makwana S, Salanitro AH, et al. Quality of diabetes mellitus care by rural primary care physicians. J Rural Health. 2012;28:364-371.
17. Douthit N, Kiv S, Dwolatzky T, Biswas S. Exposing some important barriers to health care access in the rural USA. Public Health. 2015;129:611-620.
18. Weber V, Bloom F, Pierdon S, Wood C. Employing the electronic health record to improve diabetes care: a multifaceted intervention in an integrated delivery system. J Gen Intern Med. 2008;23:379-382.
From West Virginia University, Morgantown, WV.
Abstract
Objective: To describe the strategies a family medicine clinic in Appalachia utilized to increase nephropathy screening rates as well as to explore the factors predictive of nephropathy screening in patients with diabetes.
Design: This quality improvement project targeted the points in the care process when patients are lost to follow-up for nephropathy screening.
Setting and participants: Patients with diabetes cared for by a primary care provider (PCP) at an academic family medicine practice in Appalachia from January 2018 to November 2018.
Interventions: Bulk orders for albumin-to-creatinine (ACR) testing and urine collection during clinic visit, enhanced patient communication through bulk communication reminders and individual patient outreach, and education of clinic providers.
Measurements: Demographic data and monthly nephropathy screening rates.
Results: The nephropathy screening rate increased by 6.2% during the project. Older patients living closer to the clinic who visited their PCP 3 or more times per year were the most likely to be screened.
Conclusion: Combining team-based interventions with quality control monitoring can significantly improve compliance with recommended nephropathy treatment and screening in rural patients with diabetes at a family medicine clinic.
Keywords: rural; kidney disease; albumin-to-creatinine ratio; electronic health record.
According to the Centers for Disease Control and Prevention (CDC), an estimated 30.3 million people in the United States—about 9.4% of the population—have been diagnosed with diabetes.1 Diabetes is the seventh leading cause of death in the United States, and it contributes to other leading causes of death: heart disease and stroke.1 Diabetes also is related to high morbidity risk and is a leading cause of chronic kidney disease.1 The total cost of diagnosed diabetes was estimated at $327 billion in direct medical costs and reduced productivity.2
Residents of Appalachia bear a disproportionate burden of diabetes and other related negative health outcomes; these outcomes are influenced by a number of factors, including socioeconomic status, poverty, rurality, and health care access. Rates of chronic disease, such as diabetes, are most pronounced in Appalachia’s most economically distressed counties.3-5 In 2011, the CDC labeled a 644-county area the “diabetes belt,” which included most of Appalachia.6 As a result of this elevated prevalence of diabetes in Appalachia as compared to the rest of the country, complications directly associated with diabetes are more commonly observed in Appalachian residents. One of the most damaging complications is diabetic nephropathy.
Diabetic nephropathy results from damage to the microvasculature of the kidney due to inadequately controlled blood glucose. This, in turn, leads to decreased renal function, eventually leading to clinically significant renal disease. The long-term complications associated with nephropathy can include many comorbid conditions, the most serious of which are progression to end-stage renal disease, dialysis requirement, and early mortality. Diabetic nephropathy affects approximately 40% of patients with type 1 and type 2 diabetes.7,8
One way to prevent complications of diabetic nephropathy, in addition to good glycemic control in patients with diabetes, is early and regular screening. Currently, the American Diabetes Association (ADA) recommends yearly screening for diabetic nephropathy in the form of a urine albumin-to-creatinine ratio (ACR) for patients 18 to 75 years of age.2 This screening to detect diabetic nephropathy is recognized as a marker of quality care by many public and private insurance agencies and medical specialty associations, such as the Centers for Medicare and Medicaid Services.
Many patients with diabetes are cared for by primary care providers (PCP), and these PCP appointments provide an opportune time to screen and appropriately treat nephropathy. Screening opportunities are often missed, however, due to time constraints and competing health priorities. There are also a number of other factors specific to the Appalachian region that reduce the likelihood of screening for diabetic nephropathy, such as a lack of health insurance, the need to travel long distances to see a PCP, work and household responsibilities, low levels of education and health literacy, and a mistrust of outsiders regarding personal matters, including health.9-11 While nephropathy can have a detrimental impact on patients across populations, it is of particular concern for a state located in the heart of Appalachia, such as West Virginia.
Given the disproportionate burden of diabetes in this region and the potentially severe consequences of undetected nephropathy, clinicians from an academic family medicine clinic in West Virginia undertook a quality improvement project to increase the rate of nephropathy screening and treatment among patients with diabetes. This article describes the intervention strategies the team utilized to increase nephropathy screening and treatment in patients 18 to 75 years of age who met quality measures for nephropathy screening or treatment in the previous 12 months and explores the factors most predictive of nephropathy screening in Appalachian patients in this age group. It also reports the challenges and opportunities encountered and offers suggestions for other providers and clinics attempting to increase their nephropathy screening rates.
Methods
Setting and Study Population
The study population included patients ages 18 to 75 years under the care of providers in an academic family medicine practice in West Virginia who had been diagnosed with diabetes mellitus. The study focused on those patients overdue for diabetic nephropathy screening (ie, had not been screened in previous 12 months). The project began in January 2018 with a screening rate of 83.8%. The goal of this project was to increase this compliance metric by at least 5%. The project protocol was submitted to the West Virginia University Institutional Review Board, and, because it is a quality improvement project, permission was given to proceed without a board review.
Interventions
The team identified and implemented several interventions intended to reduce screening barriers and increase the screening rate.
Bulk orders for ACR and urine collection during clinic visits. Prior to initiation of this project, it was left to individual clinic providers to order nephropathy screening for patients with diabetes during a clinic visit; after receiving the order for “random urine microalbumin/creatinine ratio,” patients then had to travel to a lab to provide a urine sample. For this project and moving forward, the team changed to the procedure of initiating bulk ACR orders and collecting urine samples during clinic visits from all patients ages 18 to 75 years who have diabetes.
Bulk communication reminders. Since many patients with diabetes may not have realized they were overdue for nephropathy screening, the team began sending out bulk communication reminders through either the institution’s electronic health record (EHR; MyChart) or postal service–delivered physical letters (according to patient communication preferences) to remind patients that they were due for screening and to encourage them to schedule an appointment or keep a previously scheduled appointment with their PCP.
Individual patient outreach. A team of pharmacy students led by a licensed pharmacist in the family medicine clinic contacted patients overdue for screening even after bulk communication reminders went out. The students telephoned patients 2 to 3 months following the bulk communication. The students obtained an updated list of patients with diabetes ages 18 to 75 years from an EHR quality report. They began by prescreening the patients on the overdue list for potential candidacy for an angiotensin-converting enzyme (ACE) inhibitor or an angiotensin II receptor blocker (ARB). Screening for candidacy included evaluation of recent blood pressure readings, electrolytes (ie, basic metabolic panel), and ACR. If the students determined a patient was a candidate, they presented the patient to the preceptor for verification and then reached out to the provider with a recommendation. If the provider agreed, the student contacted the patient by telephone for medication counseling and education. The remaining patients determined not to be candidates for ACE inhibitors or ARBs were contacted by the pharmacy students by telephone to remind them that laboratory work was pending. Up to 3 phone call attempts were made before patients were determined to be unreachable. Students left voice mails with generic reminders if a patient could not be reached. If a patient answered, the student provided a reminder but also reviewed indications for lab work, the reason why the provider wished for follow-up, and updated lab hours. Students also followed up with the results of the work-up, as appropriate. During this outreach process, the student team encountered a number of patients who had moved or changed to a PCP outside of the family medicine clinic. In these cases, the EHR was updated and those patients were removed from the list of patients altogether.
Education of clinic providers. Clinic providers were educated during faculty and resident meetings and didactic learning sessions on identifying patients within the EHR who are due for nephropathy screening. They also received instruction on how to update the EHR to reflect completed screenings.
Data Analysis
All analyses in this study were conducted using SAS (version 9.4, 2013, SAS Institute Inc., Cary, NC). Descriptive analyses were conducted to summarize basic patient demographic information. To compare patients screened within the previous 12 months to those patients overdue for screening, 2-sample t-tests were used to examine differences in patients’ age, HbA1c, ACR, and creatinine level and the distance (in miles) between the patient’s home and the clinic. Chi-square analyses were used to examine the relationship between whether a patient was recently screened for nephropathy and the patient’s insurance, number of patient visits in the previous 12 months, and provider level. Logistic regression analyses were conducted to control for covariates and to explore which factors were most predictive of nephropathy screening. All tests were 2-tailed, and P values less than 0.05 were considered statistically significant.
Results
Patient Characteristics
There were 1676 family medicine clinic patients with diabetes between 18 and 75 years of age (Table 1 and Table 2). Of the total sample, 1489 (88.8%) had completed screening for nephropathy in the 12 months prior to evaluation, and 67.5%, 23.7%, and 8.8% of patients had private insurance, Medicare, and Medicaid, respectively.
The mean (SD) age of the patients was 56.3 (11.9) years. The mean distance between the patient’s home and the clinic was 26.6 (76.8) miles. The mean number of visits was 3.6 (2.9) per year, and 43.0% of the patientvisited the clinic more than 3 times in a year. The mean values for HbA1c (%), creatinine (g/mol), and ACR (mg/g) were 7.7 (1.9), 1.0 (0.7), and 9.4 (31.4), respectively.
Screening of Patients for Nephropathy
Patients with Medicare and private insurance were more likely to have completed the nephropathy screening than those with Medicaid (92.5% versus 88.8% versus 82.8%, P = 0.004; Table 3 and Table 4).
Changes in Screening Rate
The practice-wide screening rate was 83.8% at the start of this project in January 2018. The screening rate steadily increased throughout 2018, reaching 90.3% in August 2018, and then leveled off around 90% when the project was concluded at the end of November 2018 (Figure). As an added benefit of the increased screening rates, a number of patients were initiated on an ACE inhibitor or ARB based on the team’s screening efforts.
Predictors of Nephropathy Screening
A logistic regression analysis was conducted with nephropathy screening (screened or not screened) as the outcome and 7 patient characteristics as predictors: type of insurance (private, Medicare, or Medicaid), PCP visits in the past 12 months (≤ 3 or > 3), distance in miles of the patient’s residence from the clinic, age, last HbA1c value, last ACR value, and last creatinine value. A test of the full model with all 7 predictors was statistically significant (χ2 (8) = 57.77, P < 0.001). Table 5 shows regression coefficients, Wald statistics, and 95% confidence intervals for odds ratios for each of the 7 predictors. According to the Wald criterion, 3 patient characteristics were significant predictors of nephropathy screening: age, distance between the patient’s home and clinic, and number of PCP visits in the past 12 months. After adjusting for the covariates, there were still significant associations between the nephropathy screening status and age ( χ2(1) = 9.64, P < 0.01); distance between the patient’s home and the clinic (χ2(1) = 3.98, P < 0.05); and the number of PCP visits in the previous year (χ2(1) = 21.74, P < 0.001). With each 1-year increment in age, the odds of completing the nephropathy screening increased by 3.2%. With each 1-mile increase in the distance between the patient’s home and clinic, the odds of completing the nephropathy screening decreased by 0.2%. Patients who visited the clinic more than 3 times in a year were 3.9 times (95% confidence interval, 2.2-7.0) more likely to complete the nephropathy screening than their counterparts who visited fewer than 3 times per year.
In summary, older patients living within about 164 miles of the clinic (ie, within 1 standard deviation from the average miles between patient’s homes and the clinic) who visited their PCP 3 or more times per year were the most likely to be screened.
Discussion
Diabetic nephropathy is a critical issue facing family medicine providers and patients. The morbidity and mortality costs are significant, as diabetic nephropathy is the leading cause of end-stage renal disease. While the ADA recommends annual ACR screening in patients with diabetes and prescription of ACE inhibitors or ARBs in patients who qualify, many patients do not receive these interventions, despite following up with a provider.12-15 There is no current literature that indicates the compliance rates in the rural setting. Due to health disparities in the rural setting noted in the literature, it could be hypothesized that these individuals are at high risk of not meeting these screening and treatment recommendations.16,17 Limited access to care and resources, gaps in insurance coverage, and lower health literacy are a few barriers identified in the rural population that may influence whether these measures are met.17
Considering the disease burden of diabetes and its related complications, including nephropathy, consistent screening is necessary to reduce diabetes-related burdens and cost, while also increasing the quality of life for patients with diabetes. All parties must be involved to ensure appropriate compliance and treatment. Our institution’s implementation of quality improvement strategies has key implications for nephropathy screening and treatment efforts in rural settings.
An additional step of having a health care provider (other than the PCP) screen all patients who are not meeting the standard allows for identification of gaps in care. In our quality improvement workflow, the clinical pharmacist screened all patients for candidacy for ACE inhibitor/ARB therapy. While only a small percentage of patients qualified, many of these patients had previously been on therapy and were discontinued for an unknown reason or were stopped due to an acute condition (eg, acute kidney injury) and never restarted after recovery. Other patients required additional education that therapy would be utilized for nephroprotection versus blood pressure management (secondary to an elevated ACR). This highlights the importance of transitions of care and ongoing, intensive education, not only during initial diagnosis but also throughout the disease-state progression.
Utilization of EHRs and telephone outreach are additional aspects of care that can be provided. Our improved rates of compliance with these care interventions parallel findings from previous studies.15,18 Optimization of an institution’s EHR can aid in standardization of care, workflow management, and communication with patients, as well as alert nursing or support staff of screening needs. Techniques such as best practice reminders, patient chart messages, and nursing-entered physician alerts on daily schedules have been shown to increase rates of compliance with nephropathy standards. These findings underscore an additional opportunity for nursing and support staff to be better integrated into care.
Despite the success of this quality improvement initiative, there remain some limitations. The processes we used in this project may not be applicable to every institution and may have limited external validity. Primarily, while these processes may be implemented at some sites, without additional support staff (ie, extra nursing staff, pharmacists) and students to aid in patient outreach, success may be limited due to provider time constraints. Additionally, our workflow process demonstrates significant incorporation of an EHR system for patient outreach. Institutions and/or clinics that heavily rely on paper charts and paper outreach may face barriers with bulk orders (eg, ACR) and messages, interventions that streamlined our population health management. Finally, this project focuses on only 1 aspect of population health management for patients with diabetes. While nephropathy is a critical aspect of caring for individuals with diabetes, this patient outreach does not address retinopathy screening, HbA1c control, or vaccination rates, which are other components of care.
Conclusion
Although this evaluation does not provide insight into why patients were not treated or screened, it demonstrates processes to improve compliance in patients with diabetic nephropathy. Rural health care facilities require an ongoing program of change and evaluation, with the aim to improve the provision of services, increase screening, and encourage team member involvement in health promotion. This study demonstrates that combining team-based interventions with quality control monitoring can significantly improve compliance with recommended nephropathy screening and treatment in rural patients with diabetes at a family medicine clinic.
Corresponding author: Amie M. Ashcraft, West Virginia University, Department of Family Medicine, 1 Medical Center Drive, Box 9152, Morgantown, WV 26506; [email protected].
Financial disclosures: None.
Acknowledgment: The authors thank the faculty, residents, nurses, and clinic staff for their hard work and dedication to this effort: Umama Sadia, Michelle Prestoza, Richard Dattola, Greg Doyle, Dana King, Mike Maroon, Kendra Under, Judy Siebert, Christine Snyder, Rachel Burge, Meagan Gribble, Lisa Metts, Kelsey Samek, Sarah Deavers, Amber Kitzmiller, Angela Lamp, Tina Waldeck, and Andrea Sukeruksa.
1. Centers for Disease Control and Prevention (CDC). National diabetes statistics report. Estimates of diabetes and its burden in the United States. Atlanta, GA: CDC; 2017www.cdc.gov/diabetes/pdfs/data/statistics/national-diabetes-statistics-report.pdf. Accessed December 20, 2020.
2. American Diabetes Association (ADA). Economic costs of diabetes in the U.S. in 2017. Diabetes Care. 2018;41:917-928.
3. Wood L. Trends in national and regional economic distress, 1960-2000. Washington, DC: Appalachian Regional Commission; 2005.
4. Barker L, Crespo R, Gerzoff RB, et al. Residence in a distressed county in Appalachia as a risk factor for diabetes, Behavioral Risk Factor Surveillance System, 2006-2007. Prev Chronic Dis. 2010;7:A104.
5. Barker L, Kirtland KA, Gregg E, et al. Geographic distribution of diagnosed diabetes in the United States: A diabetes belt. Am J Prev Med. 2011;40:434-439.
6. Gross JL, de Azevedo MJ, Silveiro SP, et al. Diabetic nephropathy: Diagnosis, prevention, and treatment. Diabetes Care. 2005;28:164-176.
7. United States Renal Data System (USRDS). Annual data report. Ann Arbor, MI: USRDS; 2018. www.usrds.org/2018/view/Default.aspx. Accessed December 20, 2020.
8. Halverson JA, Bichak G. Underlying socioeconomic factors influencing health disparities in the Appalachian region. Washington, DC: Appalachian Regional Commission; 2008.
9. Shell R, Tudiver F. Barriers to cancer screening by rural Appalachian primary care providers. J Rural Health. 2004;20:368-373.
10. Hatcher J, Dignan MB, Schoenberg N. How do rural health care providers and patients view barriers to colorectal cancer screening? Insights from Appalachian Kentucky. Nurs Clin North Am. 2011;46:181-192.
11. Scott S, McSpirit S. The suspicious, untrusting hillbilly in political-economic contexts: Stereotypes and social trust in the Appalachian coalfields. Pract Anthropol. 2014;36:42-46.
12. Kirkman MS, Williams SR, Caffrey HH, Marrero DG. Impact of a program to improve adherence to diabetes guidelines by primary care physicians. Diabetes Care. 2002;25:1946-1951.
13. Byun SH, Ma SH, Jun JK, et al. Screening for diabetic retinopathy and nephropathy in patients with diabetes: A nationwide survey in Korea. PLoS One. 2013;8:e62991.
14. Flood D, Garcia P, Douglas K, et al. Screening for chronic kidney disease in a community-based diabetes cohort in rural Guatemala: A cross-sectional study. BMJ Open. 2018;8:e019778.
15. Anabtawi A, Mathew LM. Improving compliance with screening of diabetic patients for microalbuminuria in primary care practice. ISRN Endocrinology. 2013:893913.
16. Tonks SA, Makwana S, Salanitro AH, et al. Quality of diabetes mellitus care by rural primary care physicians. J Rural Health. 2012;28:364-371.
17. Douthit N, Kiv S, Dwolatzky T, Biswas S. Exposing some important barriers to health care access in the rural USA. Public Health. 2015;129:611-620.
18. Weber V, Bloom F, Pierdon S, Wood C. Employing the electronic health record to improve diabetes care: a multifaceted intervention in an integrated delivery system. J Gen Intern Med. 2008;23:379-382.
Noninjectable modes of insulin delivery coming of age
LOS ANGELES – Injections may be the most common way for patients with diabetes to take insulin, but other modes of delivery are coming of age.

George Grunberger, MD, chairman of the Grunberger Diabetes Institute in Bloomfield Township, Mich., said that at least seven different agents that are being studied for the oral delivery of biologics for diabetes.
He outlined several at the World Congress on Insulin Resistance, Diabetes & Cardiovascular Disease.
Oral insulin
ORMD-0801 from Oramed is an oral insulin capsule that prevents enzyme degradation and enhances intestinal absorption. Top-line, unpublished findings from a phase 2 study, which the company announced in November 2019, showed that ORMD-0801 significantly reduced hemoglobin A1c levels in patients with type 2 diabetes who were inadequately controlled on other standard-of-care drugs. ORMD-0801 dosed once daily reduced HbA1c by 0.60%, compared with 0.06% by placebo. “We’ll see when it’s going to wind up in the clinic,” Dr. Grunberger said. Oramed is also developing an oral glucagonlike peptide–1 analogue capsule, ORMD-0901, which has potential to be the first orally ingestible GLP-1 analogue.
Inhaled and absorbed insulin
Technosphere insulin (Affreza) is a novel inhalation powder for the treatment of diabetes that was developed by MannKind and approved by the Food and Drug Administration in 2014. Clinical studies have shown that Technosphere insulin delivers insulin with an ultrarapid pharmacokinetic profile that is different from all other insulin products, but similar to natural insulin release. “The idea was to develop a more patient-friendly device to deliver insulin directly into the lungs,” said Dr. Grunberger, who is also a clinical professor of internal medicine and molecular medicine and genetics at Wayne State University, Detroit. “When you inhale this into the lungs, there is one cell layer between the air sac and the circulation, so it works very quickly. The idea is to try to avoid injecting insulin to see if it helps. This is a prandial insulin – you inhale it before meals. The whole idea is that hopefully, you can reduce any fear of delayed postprandial hyperglycemia.”
In a randomized trial of 353 patients with inadequately controlled type 2 diabetes, those in the Technosphere insulin arm significantly reduced HbA1c by 0.8% from a baseline of 8.3%, compared with the placebo arm, which was reduced by 0.4% (P less than .0001; Diabetes Care. 2015;38[12]:2274-81). A greater number of patients treated with Technosphere insulin achieved an HbA1c of 7.0% or less, compared with placebo (38% vs. 19%; P = .0005). Dr. Grunberger noted that, in clinical trials lasting up to 2 years, patients treated with Technosphere insulin had a 40-mL greater decline from baseline in forced expiratory volume in 1 second (FEV1 ), compared with patients treated with comparator antidiabetes treatments. “But once you stop using the drug, FEV1 reverts to normal,” he said. “So, there does not appear to be lasting damage to your lungs and respiratory ability.”
In another development, Oral-Lyn from Generex Biotechnology, which delivers insulin through the oral mucosa, is being evaluated as a potential treatment option. In 2015, Generex partnered with the University of Toronto’s Center for Molecular Design and Preformulations to increase the bioavailability of insulin in the product and to reduce the number of sprays required to achieve effective prandial glucose control. In 2019, the company formed the NuGenerex Diabetes Research Center, which intended to accelerate the development of the reformulated Oral-Lyn-2, for type 2 diabetes, and Altsulin, for the treatment of type 1 diabetes. The programs are expected to initiate in the first quarter of 2020.
In the meantime, studies of intranasally delivered insulin continue to advance. “It works. It lowers glucose, but there is a whole slew of knowledge now about how it can also improve neurocognitive function,” Dr. Grunberger said.
Oral GLP-1 receptor agonists
Oral versions of glucagonlike peptide–1 (GLP-1) receptor agonists are also emerging as a treatment option. The FDA recently approved the first oral GLP-1 receptor agonist, semaglutide bound in the absorption enhancer sodium N‐(8‐[2‐hydroxybenzoyl] amino) caprylate (SNAC). According to data from manufacturer Novo Nordisk, SNAC facilitates local increase of pH, which leads to a higher solubility. SNAC interacts with cell membranes of gastric mucosa, facilitating absorption within 30 minutes, “so the drug can penetrate the mucosa without lasting damage,” Dr. Grunberger said. The SNAC effect is size dependent and fully reversible.
In PIONEER 3, researchers found that, in adults with type 2 diabetes uncontrolled with metformin with or without sulfonylurea, oral semaglutide at dosages of 7 and 14 mg/day resulted in significantly greater reductions in HbA1c over 26 weeks, compared with sitagliptin, but there was no significant benefit with the 3-mg/d dosage (JAMA. 2019;321[15]:1466-80). In PIONEER 4, researchers compared the efficacy and safety of oral semaglutide with subcutaneous liraglutide (Lancet. 2019;394[10192]:P39-50). “There was no difference in HbA1c effect between the two groups, but oral semaglutide beat out sitagliptin in terms of weight loss,” Dr. Grunberger said. “It’s going to be interesting to see what’s going to happen in the marketplace as the drug gets widely launched.”
Nasal glucagon
He closed out his presentation by discussing the July 2019 FDA approval of Eli Lilly’s nasal glucagon for severe hypoglycemia – the first such treatment that can be administered without an injection. The nasally administered dry powder, known as Baqsimi, is a welcome alternative to current glucagon kits, “which contain multiple components,” said Dr. Grunberger, who is also a past president of the American Association of Clinical Endocrinologists. An adult pivotal study showed that supraphysiologic levels of glucagon were achieved within 5 minutes with both nasal and intramuscular glucagon (Diabetes Care. 2016;39[2]:264-70). Headache and nasal symptoms occurred more frequently with nasal glucagon, but most were resolved within 1 day. In addition, nausea and vomiting occurred at similar frequencies with nasal and intramuscular glucacon, and most cases were resolved within 1 day.
Similar results were observed in a pediatric study of 48 patients with type 1 diabetes who were older than 4 years, (Diabetes Care. 2016;39[4]:555-62).
Dr. Grunberger disclosed that has research contracts with Medtronic and Eli Lilly, and that he serves on speakers bureaus of Eli Lilly, Janssen, Novo Nordisk, and Sanofi.
LOS ANGELES – Injections may be the most common way for patients with diabetes to take insulin, but other modes of delivery are coming of age.
George Grunberger, MD, chairman of the Grunberger Diabetes Institute in Bloomfield Township, Mich., said that at least seven different agents that are being studied for the oral delivery of biologics for diabetes.
He outlined several at the World Congress on Insulin Resistance, Diabetes & Cardiovascular Disease.
Oral insulin
ORMD-0801 from Oramed is an oral insulin capsule that prevents enzyme degradation and enhances intestinal absorption. Top-line, unpublished findings from a phase 2 study, which the company announced in November 2019, showed that ORMD-0801 significantly reduced hemoglobin A1c levels in patients with type 2 diabetes who were inadequately controlled on other standard-of-care drugs. ORMD-0801 dosed once daily reduced HbA1c by 0.60%, compared with 0.06% by placebo. “We’ll see when it’s going to wind up in the clinic,” Dr. Grunberger said. Oramed is also developing an oral glucagonlike peptide–1 analogue capsule, ORMD-0901, which has potential to be the first orally ingestible GLP-1 analogue.
Inhaled and absorbed insulin
Technosphere insulin (Affreza) is a novel inhalation powder for the treatment of diabetes that was developed by MannKind and approved by the Food and Drug Administration in 2014. Clinical studies have shown that Technosphere insulin delivers insulin with an ultrarapid pharmacokinetic profile that is different from all other insulin products, but similar to natural insulin release. “The idea was to develop a more patient-friendly device to deliver insulin directly into the lungs,” said Dr. Grunberger, who is also a clinical professor of internal medicine and molecular medicine and genetics at Wayne State University, Detroit. “When you inhale this into the lungs, there is one cell layer between the air sac and the circulation, so it works very quickly. The idea is to try to avoid injecting insulin to see if it helps. This is a prandial insulin – you inhale it before meals. The whole idea is that hopefully, you can reduce any fear of delayed postprandial hyperglycemia.”
In a randomized trial of 353 patients with inadequately controlled type 2 diabetes, those in the Technosphere insulin arm significantly reduced HbA1c by 0.8% from a baseline of 8.3%, compared with the placebo arm, which was reduced by 0.4% (P less than .0001; Diabetes Care. 2015;38[12]:2274-81). A greater number of patients treated with Technosphere insulin achieved an HbA1c of 7.0% or less, compared with placebo (38% vs. 19%; P = .0005). Dr. Grunberger noted that, in clinical trials lasting up to 2 years, patients treated with Technosphere insulin had a 40-mL greater decline from baseline in forced expiratory volume in 1 second (FEV1 ), compared with patients treated with comparator antidiabetes treatments. “But once you stop using the drug, FEV1 reverts to normal,” he said. “So, there does not appear to be lasting damage to your lungs and respiratory ability.”
In another development, Oral-Lyn from Generex Biotechnology, which delivers insulin through the oral mucosa, is being evaluated as a potential treatment option. In 2015, Generex partnered with the University of Toronto’s Center for Molecular Design and Preformulations to increase the bioavailability of insulin in the product and to reduce the number of sprays required to achieve effective prandial glucose control. In 2019, the company formed the NuGenerex Diabetes Research Center, which intended to accelerate the development of the reformulated Oral-Lyn-2, for type 2 diabetes, and Altsulin, for the treatment of type 1 diabetes. The programs are expected to initiate in the first quarter of 2020.
In the meantime, studies of intranasally delivered insulin continue to advance. “It works. It lowers glucose, but there is a whole slew of knowledge now about how it can also improve neurocognitive function,” Dr. Grunberger said.
Oral GLP-1 receptor agonists
Oral versions of glucagonlike peptide–1 (GLP-1) receptor agonists are also emerging as a treatment option. The FDA recently approved the first oral GLP-1 receptor agonist, semaglutide bound in the absorption enhancer sodium N‐(8‐[2‐hydroxybenzoyl] amino) caprylate (SNAC). According to data from manufacturer Novo Nordisk, SNAC facilitates local increase of pH, which leads to a higher solubility. SNAC interacts with cell membranes of gastric mucosa, facilitating absorption within 30 minutes, “so the drug can penetrate the mucosa without lasting damage,” Dr. Grunberger said. The SNAC effect is size dependent and fully reversible.
In PIONEER 3, researchers found that, in adults with type 2 diabetes uncontrolled with metformin with or without sulfonylurea, oral semaglutide at dosages of 7 and 14 mg/day resulted in significantly greater reductions in HbA1c over 26 weeks, compared with sitagliptin, but there was no significant benefit with the 3-mg/d dosage (JAMA. 2019;321[15]:1466-80). In PIONEER 4, researchers compared the efficacy and safety of oral semaglutide with subcutaneous liraglutide (Lancet. 2019;394[10192]:P39-50). “There was no difference in HbA1c effect between the two groups, but oral semaglutide beat out sitagliptin in terms of weight loss,” Dr. Grunberger said. “It’s going to be interesting to see what’s going to happen in the marketplace as the drug gets widely launched.”
Nasal glucagon
He closed out his presentation by discussing the July 2019 FDA approval of Eli Lilly’s nasal glucagon for severe hypoglycemia – the first such treatment that can be administered without an injection. The nasally administered dry powder, known as Baqsimi, is a welcome alternative to current glucagon kits, “which contain multiple components,” said Dr. Grunberger, who is also a past president of the American Association of Clinical Endocrinologists. An adult pivotal study showed that supraphysiologic levels of glucagon were achieved within 5 minutes with both nasal and intramuscular glucagon (Diabetes Care. 2016;39[2]:264-70). Headache and nasal symptoms occurred more frequently with nasal glucagon, but most were resolved within 1 day. In addition, nausea and vomiting occurred at similar frequencies with nasal and intramuscular glucacon, and most cases were resolved within 1 day.
Similar results were observed in a pediatric study of 48 patients with type 1 diabetes who were older than 4 years, (Diabetes Care. 2016;39[4]:555-62).
Dr. Grunberger disclosed that has research contracts with Medtronic and Eli Lilly, and that he serves on speakers bureaus of Eli Lilly, Janssen, Novo Nordisk, and Sanofi.
EXPERT ANALYSIS FROM WCIRDC 2019
Streamlining the transition from pediatric to adult care
Diabetes is a complex disease with a range of nuanced therapy options and a plethora of risk factors that could significantly affect patient quality of life and long-term outcomes. From the outset, after diagnosis, a selected regimen has to be meticulously tailored to a patient’s clinical needs and monitored over time, and many other nonclinical variables, such as patient preference, social history, access to care, and support systems, as well as the cost of the drugs and its impact on the patient, must also be considered.
The increase in the incidence of youth-onset diabetes means that more young adults are making the transition from pediatric to adult care, and careful care coordination is paramount at the handover point to ensure that a full and complete account of the history gets transferred to the adult-care provider.
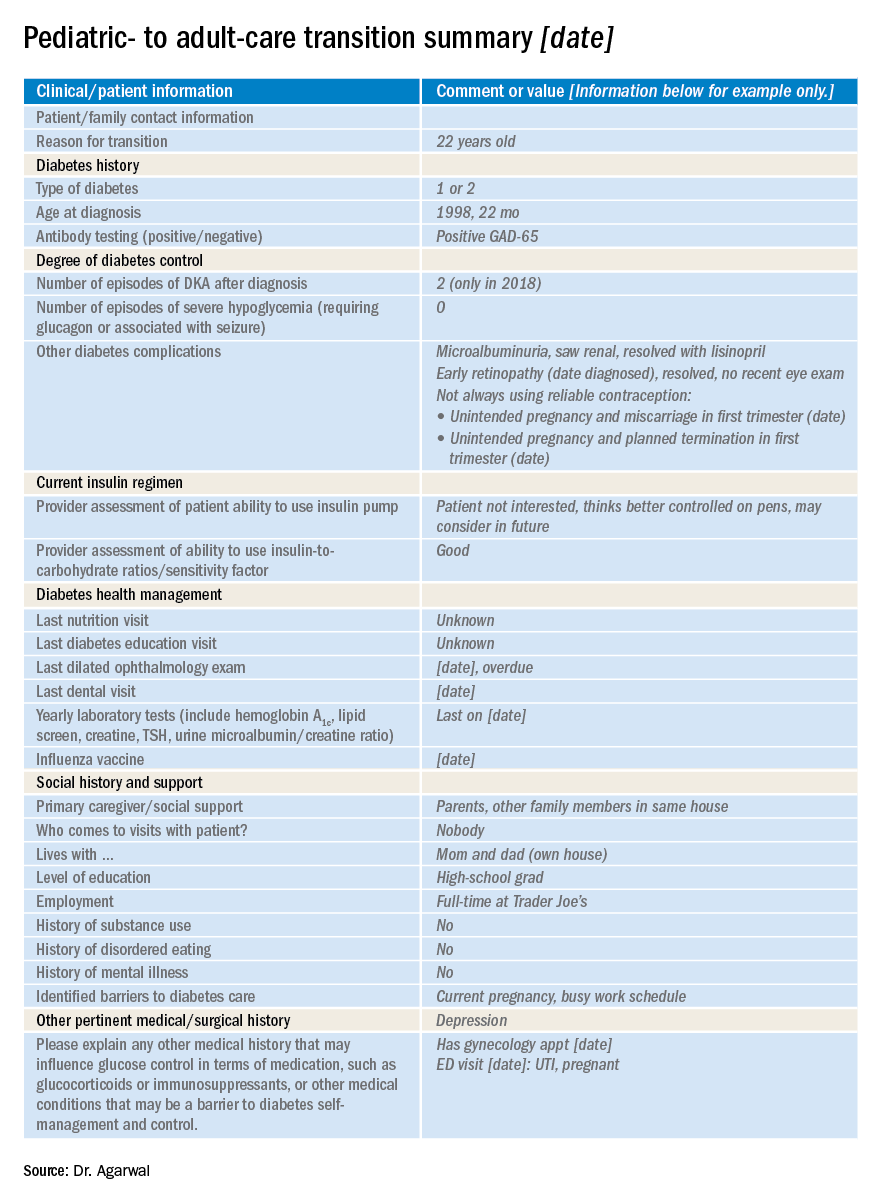
So how do you distill the information from all those records (on paper and online) that you’ve accumulated during the time you’ve been treating a young adult who is now transitioning to adult care?
Transition summary
One resource that can facilitate this handover is the transition summary. It effectively consolidates and packages the aforementioned aspects of care and patient history so that the adult-care provider does not have to collect the patient’s history from the start. The transition summary should not be confused with the discharge or medical summary, which focuses only on the preceding clinical care.
It is important to stress at this stage that collaboration between the pediatric- and adult-care providers is crucial to the success of such a summary, from its creation, to its implementation, and through the subsequent and inevitable revisions and updates.
Benefits all around
After we introduced the transition summary at my institution, we found that the average initial patient visit with the new adult-care provider decreased by 12 minutes (with a range of 6-19 min). The adult-care providers welcomed receiving such detailed, important patient information packaged in a concise and readily accessible format. It helped them identify the preceding care team members, which facilitated continuity of care, and it also helped them forge a better therapeutic relationship with the patient earlier on in their engagement.

We also learned that patients were more comfortable with the transition, and the referring providers were relieved and reassured that their patients would continue to receive personalized care with the new adult-care provider.
At a personal level, I found I was less stressed as I could spend better-quality clinical time with patients. And I got to eliminate those unwieldy stacks of medical records since getting buy-in from divisional and IT leadership enabled us to automate the entire process of information transfer.
It is important to note that the patient has to consent to release of medical records to other institutions.
Setting up the summary
At our clinic, I started out by adapting the transition summary from guidelines provided by the Endocrine Society to make a template. Then, in collaboration with my pediatric colleagues, I removed and added information so that the revised document would contain information that is vitally important and not readily available in the chart and would be feasible to fill out. For example, we included details such as the patient’s psychosocial history, an estimation of the patient barriers to diabetes management, family relationship issues, and the patient’s reasons for not adopting advanced diabetes technology (see accompanying example of a transition summary) .
I kept the summary brief, at two pages, and piloted it with referring providers who were interested in using the summary and with related supporting services. I also sought buy-in from my institution. This meant that I needed pediatric and adult divisional leadership support, which offered me information technology, resources, and expertise to automate the summary within the electronic health record. Once I had feedback from would-be users, we revised and updated the summary. We set up training for staff, including pediatric providers, nurse practitioners, social workers, and nurses who could fill out the summary, and ultimately succeeded in making it mandatory that the adult-care provider receive a summary before scheduling or seeing the transfer patient.
I started out with a paper version, and once we’d refined the questions, we incorporated it into the electronic medical record.
The information we use in our summary is grouped under the following headings:
- Reason for transition.
- Diabetes type.
- Degree of diabetes control.
- Type of insulin therapy and supplies.
- Current and former insulin regimen: reasons for discontinuation of any therapies or reluctance to start any therapies.
- Diabetes health maintenance.
- Social history and support, including living situation, main social support network, child protective services involvement.
- Other pertinent medical surgical history, including psychiatric disease.
Tips and takeaways
Top of the list of takeaways is that you should make the final document work for you, your colleagues, and ultimately, your patients – customize it as you see fit, but be sure to keep it short and easy to fill out. Make a note as you start using it in practice of what you think might be missing from the chart and whether updates are needed. If you can, it’s a great idea to fold the transfer summary into the electronic medical record, though it’s not imperative. Care coordination is key to successful transfer of patients, whether from pediatric to adult care or hospital to home. A small change to work flow can result in a huge change in patient and provider satisfaction, as well as a reduction in visit times.
Dr. Agarwal is director of the Supporting Emerging Adults With Diabetes (SEAD) program at Montefiore Medical Center and assistant professor of medicine at Albert Einstein College of Medicine, New York. She reports no disclosures or financial conflicts of interest. Write to her at [email protected].
Diabetes is a complex disease with a range of nuanced therapy options and a plethora of risk factors that could significantly affect patient quality of life and long-term outcomes. From the outset, after diagnosis, a selected regimen has to be meticulously tailored to a patient’s clinical needs and monitored over time, and many other nonclinical variables, such as patient preference, social history, access to care, and support systems, as well as the cost of the drugs and its impact on the patient, must also be considered.
The increase in the incidence of youth-onset diabetes means that more young adults are making the transition from pediatric to adult care, and careful care coordination is paramount at the handover point to ensure that a full and complete account of the history gets transferred to the adult-care provider.
So how do you distill the information from all those records (on paper and online) that you’ve accumulated during the time you’ve been treating a young adult who is now transitioning to adult care?
Transition summary
One resource that can facilitate this handover is the transition summary. It effectively consolidates and packages the aforementioned aspects of care and patient history so that the adult-care provider does not have to collect the patient’s history from the start. The transition summary should not be confused with the discharge or medical summary, which focuses only on the preceding clinical care.
It is important to stress at this stage that collaboration between the pediatric- and adult-care providers is crucial to the success of such a summary, from its creation, to its implementation, and through the subsequent and inevitable revisions and updates.
Benefits all around
After we introduced the transition summary at my institution, we found that the average initial patient visit with the new adult-care provider decreased by 12 minutes (with a range of 6-19 min). The adult-care providers welcomed receiving such detailed, important patient information packaged in a concise and readily accessible format. It helped them identify the preceding care team members, which facilitated continuity of care, and it also helped them forge a better therapeutic relationship with the patient earlier on in their engagement.
We also learned that patients were more comfortable with the transition, and the referring providers were relieved and reassured that their patients would continue to receive personalized care with the new adult-care provider.
At a personal level, I found I was less stressed as I could spend better-quality clinical time with patients. And I got to eliminate those unwieldy stacks of medical records since getting buy-in from divisional and IT leadership enabled us to automate the entire process of information transfer.
It is important to note that the patient has to consent to release of medical records to other institutions.
Setting up the summary
At our clinic, I started out by adapting the transition summary from guidelines provided by the Endocrine Society to make a template. Then, in collaboration with my pediatric colleagues, I removed and added information so that the revised document would contain information that is vitally important and not readily available in the chart and would be feasible to fill out. For example, we included details such as the patient’s psychosocial history, an estimation of the patient barriers to diabetes management, family relationship issues, and the patient’s reasons for not adopting advanced diabetes technology (see accompanying example of a transition summary) .
I kept the summary brief, at two pages, and piloted it with referring providers who were interested in using the summary and with related supporting services. I also sought buy-in from my institution. This meant that I needed pediatric and adult divisional leadership support, which offered me information technology, resources, and expertise to automate the summary within the electronic health record. Once I had feedback from would-be users, we revised and updated the summary. We set up training for staff, including pediatric providers, nurse practitioners, social workers, and nurses who could fill out the summary, and ultimately succeeded in making it mandatory that the adult-care provider receive a summary before scheduling or seeing the transfer patient.
I started out with a paper version, and once we’d refined the questions, we incorporated it into the electronic medical record.
The information we use in our summary is grouped under the following headings:
- Reason for transition.
- Diabetes type.
- Degree of diabetes control.
- Type of insulin therapy and supplies.
- Current and former insulin regimen: reasons for discontinuation of any therapies or reluctance to start any therapies.
- Diabetes health maintenance.
- Social history and support, including living situation, main social support network, child protective services involvement.
- Other pertinent medical surgical history, including psychiatric disease.
Tips and takeaways
Top of the list of takeaways is that you should make the final document work for you, your colleagues, and ultimately, your patients – customize it as you see fit, but be sure to keep it short and easy to fill out. Make a note as you start using it in practice of what you think might be missing from the chart and whether updates are needed. If you can, it’s a great idea to fold the transfer summary into the electronic medical record, though it’s not imperative. Care coordination is key to successful transfer of patients, whether from pediatric to adult care or hospital to home. A small change to work flow can result in a huge change in patient and provider satisfaction, as well as a reduction in visit times.
Dr. Agarwal is director of the Supporting Emerging Adults With Diabetes (SEAD) program at Montefiore Medical Center and assistant professor of medicine at Albert Einstein College of Medicine, New York. She reports no disclosures or financial conflicts of interest. Write to her at [email protected].
Menopause hormone therapy found to delay type 2 diabetes
LOS ANGELES – Although menopausal hormone therapy is not approved for the prevention of type 2 diabetes because of its complex balance of risks and benefits, it should not be withheld from women with increased risk of type 2 diabetes who seek treatment for menopausal symptoms, according to Franck Mauvais-Jarvis, MD.

“During the menopause transition, women accumulate metabolic disturbances, including visceral obesity, systemic inflammation, insulin resistance, dyslipidemia, and hypertension,” Dr. Mauvais-Jarvis, director of the Tulane Diabetes Research Program at Tulane University Health Sciences Center, New Orleans, said at the Annual World Congress on Insulin Resistance, Diabetes & Cardiovascular Disease. “They also lose muscle mass. Some of these abnormalities are partially explained by chronological aging, but they are also caused by estrogen deficiency. There’s a synergism between aging and estrogen deficiency.”
The best evidence of this synergy comes from older trials. Nearly 30 years ago, researchers examined the association between postmenopausal hormone use and the subsequent incidence of non–insulin dependent diabetes in a prospective cohort of 21,028 postmenopausal U.S. women aged 30-55 years, who were enrolled in the Nurse’s Health Study and followed for 12 years (Ann Epidemiol. 1992;2[5]:665-73). They found that study participants on hormone therapy experienced a 20% reduction in the incidence of type 2 diabetes. In a more recent trial, researchers examined the association between use of hormone therapy and new-onset diabetes in 63,624 postmenopausal women who were enrolled in the prospective French cohort of the Etude Epidemiologique de Femmes de la Mutuelle Générale de l’Education Nationale (E3N) and followed for 15 years (Diabetologia. 2009;52[10]:2092-100). It found that study participants on hormone therapy experienced a 20% reduction in the incidence of type 2 diabetes.
In the Heart and Estrogen/Progestin Replacement Study, researchers evaluated the effect of hormone therapy on fasting glucose level and incident diabetes in 2,763 postmenopausal women with coronary heart disease (Ann Intern Med. 2003;138[1]:1-9). At 20 U.S. centers, the study participants received 0.625 mg of conjugated estrogen plus 2.5 mg of medroxyprogesterone, or placebo, and were followed for 4 years. The researchers found that the use of hormone therapy reduced the incidence of diabetes by 35%.
According to Dr. Mauvais-Jarvis, the strongest data come from the Women’s Health Initiative (WHI), a randomized, double-blind trial that compared the effect of daily 0.625 mg conjugated estrogen plus 2.5 mg medroxyprogesterone acetate with that of placebo during 5.6 years of follow-up (Diabetologia. 2004; 47[7]:1175-87). It showed a 20% decrease in the incidence of diabetes at 5 years. More recently, researchers found that, whether WHI participants took estrogen plus medroxyprogesterone or estrogen alone, the protection from diabetes was present (N Engl J Med. 2016;374:803-6).
In 2006, researchers published results from a meta-analysis of 107 trials in an effort to quantify the effects of hormone therapy on components of metabolic syndrome in postmenopausal women (Diabetes Obes Metab. 2006;8[5]:538-54). In women without diabetes, hormone therapy reduced the HOMA-IR (Homeostatic Model Assessment for Insulin Resistance) score by 13% and incidence of type 2 diabetes by 30%. In women with diabetes, hormone therapy reduced fasting glucose by 11% and HOMA-IR by 36%.
The mechanisms by which estrogens improve glucose homeostasis are yet to be fully understood. “One of the most important [mechanisms] is a decrease in abdominal fat, which improves insulin resistance and systemic inflammation,” Dr. Mauvais-Jarvis said. “However, in the WHI, it was clear that the improvement in HOMA-IR was independent from the body weight and fat. Estrogen has also been found to increase insulin clearance and sensitivity, increase glucose disposal and effectiveness and decrease sarcopenia. There are fewer than 20 studies looking at beta-cell function. Half of them have shown that estrogen improves insulin secretion.”
Route of estrogen administration also comes into play. For example, oral estrogens increase liver exposure to estrogen, increase triglycerides, and increase clotting factors. “That is why oral estrogens are not indicated in women with risk of deep venous thrombosis,” Dr. Mauvais-Jarvis said. “They also increase inflammatory factors like C-reactive protein. Advantages are that they decrease LDL cholesterol levels and increase HDL cholesterol levels more than transdermal estrogen does.”
The main advantage with transdermal delivery of estrogen, he continued, is that it does not raise triglycerides, clotting factors, or inflammatory factors, and it confers less exposure to the liver. “That’s why it’s the preferred way of administration in women who are obese, who have a risk of DVT, or who have cardiovascular risk factors,” he said. “It has a lower suppression of hepatic glucose production, it increases circulating estradiol, and the delivery to nonhepatic tissue is increased. The oral form of estrogen is cheaper, compared with the transdermal form, though. This is a factor that is always taken into account.”
Dr. Mauvais-Jarvis and colleagues were first to evaluate the effect of conjugated estrogens plus bazedoxifene in mice (Mol Metab. 2014;3[2]:177-90). “The idea was that by combining estrogen and bazedoxifene, you have the beneficial effect of estrogen in the tissues but you block estrogen in the breast and in the uterus, and therefore, you prevent the risk of cancer,” he said. “We found that tissue-selective estrogen complexes with bazedoxifene prevent metabolic dysfunction in female mice. It increased energy expenditure and decreased fatty liver.”
In a subsequent pilot study, he and his colleagues assessed the effect of 12 weeks’ treatment with bazedoxifene/conjugated estrogens, compared with placebo, on glucose homeostasis and body composition in 12 postmenopausal women (NCT02237079). “We did not find any significant alterations in the IVGTT [Intravenous Glucose Tolerance Test] but we observed improved fasting beta-cell function and serum glucose in menopausal women with obesity,” Dr. Mauvais-Jarvis said (J Endocr Soc. 2019;3[8]:1583-94).
In a separate, randomized, double-blind, placebo-controlled, crossover trial that he and his colleagues performed in eight postmenopausal women with obesity, the primary endpoint was insulin action as measured by a two-step hyperinsulinemic-euglycemic clamp. Secondary endpoints were body composition, basal metabolic rate, ectopic fat, and metabolome. “We did not find any difference in systemic insulin action, ectopic fat, or energy expenditure,” he said. “But we found something very interesting. We did a metabolic analysis and found that oral estrogens increase hepatic de novo lipogenesis and liver triacylglycerol production. In other words, the oral estrogens were increasing [triacylglycerol] synthesis from glucose, but it does not accumulate in the liver.”
Dr. Mauvais-Jarvis disclosed that he has received research support from the National Institutes of Health, the American Diabetes Association, the Department of Veterans Affairs, and Pfizer.
LOS ANGELES – Although menopausal hormone therapy is not approved for the prevention of type 2 diabetes because of its complex balance of risks and benefits, it should not be withheld from women with increased risk of type 2 diabetes who seek treatment for menopausal symptoms, according to Franck Mauvais-Jarvis, MD.
“During the menopause transition, women accumulate metabolic disturbances, including visceral obesity, systemic inflammation, insulin resistance, dyslipidemia, and hypertension,” Dr. Mauvais-Jarvis, director of the Tulane Diabetes Research Program at Tulane University Health Sciences Center, New Orleans, said at the Annual World Congress on Insulin Resistance, Diabetes & Cardiovascular Disease. “They also lose muscle mass. Some of these abnormalities are partially explained by chronological aging, but they are also caused by estrogen deficiency. There’s a synergism between aging and estrogen deficiency.”
The best evidence of this synergy comes from older trials. Nearly 30 years ago, researchers examined the association between postmenopausal hormone use and the subsequent incidence of non–insulin dependent diabetes in a prospective cohort of 21,028 postmenopausal U.S. women aged 30-55 years, who were enrolled in the Nurse’s Health Study and followed for 12 years (Ann Epidemiol. 1992;2[5]:665-73). They found that study participants on hormone therapy experienced a 20% reduction in the incidence of type 2 diabetes. In a more recent trial, researchers examined the association between use of hormone therapy and new-onset diabetes in 63,624 postmenopausal women who were enrolled in the prospective French cohort of the Etude Epidemiologique de Femmes de la Mutuelle Générale de l’Education Nationale (E3N) and followed for 15 years (Diabetologia. 2009;52[10]:2092-100). It found that study participants on hormone therapy experienced a 20% reduction in the incidence of type 2 diabetes.
In the Heart and Estrogen/Progestin Replacement Study, researchers evaluated the effect of hormone therapy on fasting glucose level and incident diabetes in 2,763 postmenopausal women with coronary heart disease (Ann Intern Med. 2003;138[1]:1-9). At 20 U.S. centers, the study participants received 0.625 mg of conjugated estrogen plus 2.5 mg of medroxyprogesterone, or placebo, and were followed for 4 years. The researchers found that the use of hormone therapy reduced the incidence of diabetes by 35%.
According to Dr. Mauvais-Jarvis, the strongest data come from the Women’s Health Initiative (WHI), a randomized, double-blind trial that compared the effect of daily 0.625 mg conjugated estrogen plus 2.5 mg medroxyprogesterone acetate with that of placebo during 5.6 years of follow-up (Diabetologia. 2004; 47[7]:1175-87). It showed a 20% decrease in the incidence of diabetes at 5 years. More recently, researchers found that, whether WHI participants took estrogen plus medroxyprogesterone or estrogen alone, the protection from diabetes was present (N Engl J Med. 2016;374:803-6).
In 2006, researchers published results from a meta-analysis of 107 trials in an effort to quantify the effects of hormone therapy on components of metabolic syndrome in postmenopausal women (Diabetes Obes Metab. 2006;8[5]:538-54). In women without diabetes, hormone therapy reduced the HOMA-IR (Homeostatic Model Assessment for Insulin Resistance) score by 13% and incidence of type 2 diabetes by 30%. In women with diabetes, hormone therapy reduced fasting glucose by 11% and HOMA-IR by 36%.
The mechanisms by which estrogens improve glucose homeostasis are yet to be fully understood. “One of the most important [mechanisms] is a decrease in abdominal fat, which improves insulin resistance and systemic inflammation,” Dr. Mauvais-Jarvis said. “However, in the WHI, it was clear that the improvement in HOMA-IR was independent from the body weight and fat. Estrogen has also been found to increase insulin clearance and sensitivity, increase glucose disposal and effectiveness and decrease sarcopenia. There are fewer than 20 studies looking at beta-cell function. Half of them have shown that estrogen improves insulin secretion.”
Route of estrogen administration also comes into play. For example, oral estrogens increase liver exposure to estrogen, increase triglycerides, and increase clotting factors. “That is why oral estrogens are not indicated in women with risk of deep venous thrombosis,” Dr. Mauvais-Jarvis said. “They also increase inflammatory factors like C-reactive protein. Advantages are that they decrease LDL cholesterol levels and increase HDL cholesterol levels more than transdermal estrogen does.”
The main advantage with transdermal delivery of estrogen, he continued, is that it does not raise triglycerides, clotting factors, or inflammatory factors, and it confers less exposure to the liver. “That’s why it’s the preferred way of administration in women who are obese, who have a risk of DVT, or who have cardiovascular risk factors,” he said. “It has a lower suppression of hepatic glucose production, it increases circulating estradiol, and the delivery to nonhepatic tissue is increased. The oral form of estrogen is cheaper, compared with the transdermal form, though. This is a factor that is always taken into account.”
Dr. Mauvais-Jarvis and colleagues were first to evaluate the effect of conjugated estrogens plus bazedoxifene in mice (Mol Metab. 2014;3[2]:177-90). “The idea was that by combining estrogen and bazedoxifene, you have the beneficial effect of estrogen in the tissues but you block estrogen in the breast and in the uterus, and therefore, you prevent the risk of cancer,” he said. “We found that tissue-selective estrogen complexes with bazedoxifene prevent metabolic dysfunction in female mice. It increased energy expenditure and decreased fatty liver.”
In a subsequent pilot study, he and his colleagues assessed the effect of 12 weeks’ treatment with bazedoxifene/conjugated estrogens, compared with placebo, on glucose homeostasis and body composition in 12 postmenopausal women (NCT02237079). “We did not find any significant alterations in the IVGTT [Intravenous Glucose Tolerance Test] but we observed improved fasting beta-cell function and serum glucose in menopausal women with obesity,” Dr. Mauvais-Jarvis said (J Endocr Soc. 2019;3[8]:1583-94).
In a separate, randomized, double-blind, placebo-controlled, crossover trial that he and his colleagues performed in eight postmenopausal women with obesity, the primary endpoint was insulin action as measured by a two-step hyperinsulinemic-euglycemic clamp. Secondary endpoints were body composition, basal metabolic rate, ectopic fat, and metabolome. “We did not find any difference in systemic insulin action, ectopic fat, or energy expenditure,” he said. “But we found something very interesting. We did a metabolic analysis and found that oral estrogens increase hepatic de novo lipogenesis and liver triacylglycerol production. In other words, the oral estrogens were increasing [triacylglycerol] synthesis from glucose, but it does not accumulate in the liver.”
Dr. Mauvais-Jarvis disclosed that he has received research support from the National Institutes of Health, the American Diabetes Association, the Department of Veterans Affairs, and Pfizer.
EXPERT ANALYSIS FROM THE WCIRDC 2019
Gestational diabetes: Treatment controversy rages on
WASHINGTON – Pharmacologic treatment of gestational diabetes remains controversial, with the American College of Obstetricians and Gynecologists and the American Diabetes Association firmly recommending insulin as the preferred first-line pharmacologic therapy, and the Society of Maternal-Fetal Medicine more accepting of metformin as a “reasonable and safe first-line” alternative to insulin and stating that there are no strong data supporting metformin over the sulfonylurea glyburide.
If there’s one main take-away, Mark B. Landon, MD, said at the biennial meeting of the Diabetes in Pregnancy Study Group of North America, it was that “the primary concern” about the use of oral agents for treating gestational diabetes mellitus (GDM) is that there is limited long-term follow-up of exposed offspring.
“The claim that long-term safety data are not available for any oral agent is probably the most valid warning [of any of the concerns voiced by professional organizations],” said Dr. Landon, Richard L. Meiling professor and chair of the department of obstetrics and gynecology at The Ohio State University Wexner Medical Center, Columbus.
Otherwise, he said, there are not enough data to firmly prioritize the drugs most commonly used for GDM, and “the superiority of insulin over oral agents simply remains questionable.”
ACOG’s 2017 level A recommendation for insulin as the first-line option when pharmacologic treatment is needed for treating GDM (Obstet Gynecol. 2017;130[1]:e17-37) was followed in 2018 by another updated practice bulletin on GDM (Obstet Gynecol. 2018;131[2]:e49-64) that considered several meta-analyses published in 2017 and reiterated a preference for insulin.
Those recent meta-analyses of pharmacologic treatment of GDM show that the available literature is generally of “poor trial quality,” and that studies are small and not designed to assess equivalence or noninferiority, Mark Turrentine, MD, chair of ACOG’s committee on practice bulletins, said in an interview. “Taking that into account and [considering] that oral antidiabetic medications are not approved by the Food and Drug Administration [for the treatment of GDM], that they cross the placenta, and that we currently lack long-term neonatal safety data ... we felt that insulin is the preferred treatment.”
In its 2017 and 2018 bulletins, ACOG said that metformin is a “reasonable alternative choice” for women who decline insulin therapy or who may be unable to safely administer it (a level B recommendation). The 2018 practice bulletin mentions one additional factor: affordability. “Insurance companies aren’t always covering [insulin],” said Dr. Turrentine, of the department of obstetrics and gynecology, Baylor College of Medicine, Houston. “It’s a challenge – no question.”
ACOG says glyburide should not be recommended as a first-line pharmacologic treatment, “because, in most studies, it does not yield outcomes equivalent to insulin or metformin,” Dr. Turrentine emphasized.
Glyburide’s role
Dr. Landon took issue with ACOG’s stance on the sulfonylurea. “Frankly, I think this [conclusion] is debatable,” he said. The trend in the United States – “at least after the 2017 ACOG document came out”– has been toward use of metformin over glyburide when an oral agent is [used], but “I think glyburide has been unfairly trashed. It probably still has a place.”
As Dr. Landon sees it, research published in 2015 put a damper on the use of glyburide, which “had become the number one agent” after an earlier, seminal trial, led by Oded Langer, MD, had shown equivalent glycemic control in about 400 women with GDM who were randomized to receive either insulin or glyburide (N Engl J Med. 2000;343;1134-8). The trial was not powered to evaluate other outcomes, but there were no significant differences in neonatal complications, Dr. Landon said.
One of the 2015 studies – a large, retrospective, population-based study of more than 9,000 women with GDM treated with glyburide or insulin – showed a higher risk of admission to the neonatal intensive care unit (relative risk, 1.41), hypoglycemia in the newborn (RR, 1.40), and large-for-gestational age (RR, 1.43) with glyburide, compared with insulin (JAMA Pediatr. 2015;169[5]:452-8).
A meta-analysis of glyburide, metformin, and insulin showed significant differences between glyburide and insulin in birth weight, macrosomia (RR, 2.62), and neonatal hypoglycemia (RR, 2.04; BMJ. 2015;350;h102). However, “this was basically a conglomeration of studies with about 50 [individuals] in each arm, and in which entry criteria for the diagnosis of GDM were rather heterogeneous,” said Dr. Landon. “There are real problems with this and other meta-analyses.”
The authors of a 2018 multicenter, noninferiority, randomized, controlled trial of about 900 women concluded that their study failed to show that the use of glyburide, compared with insulin, does not result in a greater frequency of perinatal complications. The authors also wrote, however, that the “increase in perinatal complications [with glyburide] may be no more than 10.5%, compared with insulin” (JAMA. 2018;319[17]:1773-80).
That increase, Dr. Landon said, was “not an absolute 10%, but 10% of the complication rate, which probably translates to about 2%.” The only component of a composite outcome (including macrosomia, hypoglycemia, and hyperbilirubinemia) that was significantly different, he noted, was hypoglycemia, which affected 12.2% of neonates in the glyburide group and 7.2% in the insulin group.
Glyburide’s role may well be substantiated in the future, Dr. Landon said during a discussion period at the meeting, through research underway at the University of Pittsburgh aimed at tailoring treatment to the underlying pathophysiology of a patient’s GDM.
The MATCh-GDM study (Metabolic Analysis for Treatment Choice in GDM) is randomizing women to receive usual, unmatched treatment or treatment matched to GDM mechanism – metformin for predominant insulin resistance, glyburide or insulin for predominant insulin secretion defects, and one of the three for combined mechanisms. The study’s principal investigator, Maisa Feghali, MD, of the department of obstetrics, gynecology, and reproductive sciences at the University of Pittsburgh, stressed in a presentation on the study that GDM is a heterogeneous condition and that research is needed to understand the impact of GDM subtypes on treatment response.
Metformin outcomes
Concerns about the impact of metformin on short-term perinatal outcomes focus on preterm birth, Dr. Landon said. The only study to date that has shown an increased rate of prematurity, however, is the “seminal” Metformin in Gestational Diabetes (MiG) trial led by Janet A. Rowan, MBChB, that randomized 751 women with GDM in Australia and New Zealand to treatment with metformin or insulin. The researchers found no significant differences between a composite of neonatal complications but did establish that severe hypoglycemia was less common in the metformin group and preterm birth was more common (N Engl J Med. 2008;358:2003-15).
A 2016 systematic review and meta-analysis of short- and long-term outcomes of metformin, compared with insulin, found that metformin did not increase preterm delivery (Diabet Med. 2017;34[1]:27-36). And while the 2015 BMJ meta-analysis found that metformin was associated with higher rates of preterm birth (RR, 1.50), the increased risk “was all driven by the Rowan study,” Dr. Landon said. The 2015 meta-analysis also found that metformin was associated with less maternal weight gain and fewer infants who were large for gestational age.
Metformin is also tainted by high rates of failure in GDM. In the 2008 Rowan study, 46% of patients on metformin failed to achieve glycemic control. “But this is a classic half-full, half-empty [phenomena],” Dr. Landon said. “Some people say this isn’t good, but on the other hand, 54% avoided insulin.”
Indeed, the Society of Maternal-Fetal Medicine (SMFM), in its 2018 statement on the pharmacologic treatment of GDM, said that oral hypoglycemic agents that are used as monotherapy work in “more than half” of GDM pregnancies. The need for adjunctive insulin to achieve glycemic control ranges between 26% and 46% for women using metformin, and 4% and 16% for women using glyburide, it says.
In the society’s view, recent meta-analyses and systemic reviews “support the efficacy and safety of oral agents,” and “although concerns have been raised for more frequent adverse neonatal outcomes with glyburide, including macrosomia and hypoglycemia, the evidence of benefit of one oral agent over the other remains limited.”
The society says that the difference between its statement and the ACOG recommendations is “based on the values placed by different experts and providers on the available evidence,” and it adds that more long-term data are needed.
But as Dr. Landon said, the SMFM is “a little more forgiving” in its interpretation of a limited body of literature. And clinicians, in the meantime, have to navigate the controversy. “The professional organizations don’t make it easy for [us],” he said. At this point, “insulin does not cross the placenta, and the oral agents do cross it. Informed consent is absolutely necessary when choosing oral agents for treating GDM.”
Offspring well-being
Of greater concern than neonatal outcomes are the potential long-term issues for offspring, Dr. Landon said. On the one hand, it is theorized that metformin may protect beta-cell function in offspring and thereby reduce the cross-generational effects of obesity and type 2 diabetes. On the other hand, it is theorized that the drug may cause a decrease in cell-cycle proliferation, which could have “unknown fetal programming effects,” and it may inhibit the mTOR signaling pathway, thus restricting the transport of glucose and amino acids across the placenta, he said. (Findings from in vitro research have suggested that glyburide treatment in GDM might be associated with enhanced transport across the placenta, he noted.)
Long-term follow-up studies of offspring are “clearly needed,” Dr. Landon said. At this point, in regard to long-term safety, he and other experts are concerned primarily about the potential for obesity and metabolic dysfunction in offspring who are exposed to metformin in utero. They are watching follow-up from Dr. Rowan’s MiG trial, as well as elsewhere in the literature, on metformin-exposed offspring from mothers with polycystic ovary syndrome.
A follow-up analysis of offspring from the MiG trial found that children of women with GDM who were exposed to metformin had larger measures of subcutaneous fat at age 2 years, compared with children of mothers treated with insulin alone, but that overall body fat was the same, Dr. Landon noted. The investigators postulated that these children may have less visceral fat and a more favorable pattern of fat distribution (Diab Care. 2011;34:2279-84).
A recently published follow-up analysis of two randomized, controlled trials of women with polycystic ovary syndrome is cause for more concern, he said. That analysis showed that offspring exposed to metformin in utero had a higher body mass index and an increased prevalence of obesity or overweight at age 4 years, compared with placebo groups (J Clin Endocrinol Metab. 2018;103[4]:1612-21).
That analysis of metformin-exposed offspring in the context of polycystic ovary syndrome was published after the SMFM statement, as was another follow-up analysis of MiG trial offspring – this one, at ages 7-9 years – that showed an increase in weight, size, and fat mass in one of two subsets analyzed, despite no difference in large-for-gestational age rates between the metformin- and insulin-exposed offspring (BMJ Open Diabetes Res Care. 2018;6[1]: e000456).
In 2018, a group of 17 prominent diabetes and maternal-fetal medicine researchers cited these findings in a response to the SMFM statement and cautioned against the widespread adoption of metformin use during pregnancy, writing that, based on “both pharmacologic and randomized trial evidence that metformin may create an atypical intrauterine environment ... we believe it is premature to embrace metformin as equivalent to insulin or as superior to glyburide, and that patients should be counseled on the limited long-term safety data and potential for adverse childhood metabolic effects” (Am J Obstet Gynecol. 2018;219[4]:367.e1-7).
EXPERT ANALYSIS FROM DPSG-NA 2019
How to help patients become successful diabetes self-managers
Through the years, I have had the privilege of educating clinicians about scientific advances in diabetes care. Prior to displaying the first slide of my presentation, I ask the audience, “How many of you have seen a ‘noncompliant’ patient with diabetes within the past month?” Without fail, 99% of the attendees will raise their hand and start laughing, as if to say, “Well, of course they’re noncompliant. They just don’t get it! How incompetent can these people be?”
Blaming patients for failing to achieve metabolic control is inappropriate and misguided. How many physicians would be able or willing to monitor their blood glucose levels 4 times a day? Based on the premeal glucose level, how many physicians know how much insulin to inject in order to keep the postprandial excursions below 180 mg/dL? How many would remember to take 8 other medications daily without missing a dose? And how many physicians exercise daily; have actually looked at their feet in the past month; and have gained no weight in the past year?
Diabetes self-management is time-consuming and difficult for many patients, especially those with health illiteracy, financial restraints, or social barriers. Any patient who presents to the doctor is, in fact, “compliant.” These individuals expect to receive the safest and most effective treatments for their diabetes while learning as much as possible about lifestyle and behavioral interventions.
I challenge each of you to ask your patients: “What concerns you the most about having diabetes?” Initially, patients will express guilt and remorse about having diabetes. They will hang their heads in shame, admit to not going to the gym as often as they could, and promise to eat smaller portions. They will then look you in the eye and say, “I am worried about losing my eye, my leg, and my kidney to this life-threatening disease. I’m scared I won’t be able to see my daughter walk down the aisle at her wedding or my son graduate from college.”
These patients are terrified because they are unfamiliar with the advances in clinical science that aid our ability to improve the lives of all patients with diabetes. After hearing patients’ concerns about dying prematurely or losing an extremity to diabetes, I assure them that, “Nothing is going to happen to you on my watch. You are safe with me, and I will always have your back.” This level of trust is vitally important to the patient as well as to the treating physician. We all want our patients to achieve treatment success, just as any teacher would want their students to excel and graduate to the next grade level. Diabetes cannot be cured, yet we, as physicians, are able to heal with reassurance and expert guidance.
So, how do we help our patients achieve better adherence to their chronic disease state interventions? Here are 9 techniques that I have learned in my years helping patients manage their diabetes (all of which are more broadly applicable to any chronic disease state):
- Explain the disease state you are comanaging with the patient to the best of your ability. The more the patient understands, the easier your job as the “drug police” becomes.
- Remind the patient that he/she is the captain of the disease management team. You, the physician, serve as the personal coach. You can help the patient win the game, but he/she is ultimately responsible for achieving successful metabolic targets.
- Explain the risks, benefits, and any expected adverse effects that are likely to occur. Do this prior to initiating any medication.
- Discuss when metabolic change might be expected after initiating a given medication. Patients who observe rapid improvement in their glucose levels will be encouraged to adhere to their prescribed treatment regimen.
- Make certain that any and all screening tests are performed prior to initiating a medication. For example, renal function should be assessed prior to beginning most diabetes medications.
- Use shared decision-making to negotiate acceptable metabolic targets with each patient. Discuss the urgency and importance of achieving these goals.
- Assess the A1C reduction from baseline at 4 weeks after therapy initiation, rather than at 3 months. About 50% of the total A1C is reflective of the preceding 4 weeks of treatment.1 Thus, if the baseline A1C drops from 8.2% to 7.8%, the patient is moving in the right direction. However, if the A1C increases from 8.2% to 8.5%, the patient is not taking the prescribed medications.
- Recommend that the patient use a continuous glucose monitor; this newer technology is now readily available for patients who are covered by private insurance or Medicare. These devices allow patients to observe their glucose levels every 5 minutes of every day without fingersticks and actually cost less than self-monitoring one’s blood glucose.
- Find a reason to praise the patient at each visit. Patients who receive a powerful compliment, such as “I am so very proud of your efforts at improving your diabetes control,” will do their absolute best to remain adherent to their prescribed medication regimen. The response might be different if a patient is told, “Once again, your blood sugars are too high. At this rate, you are probably going to die, just like your father did 20 years ago. Now come back in 6 months and show me what you’re really made of!”
With more than 30 million Americans living with diabetes and another 84 million with prediabetes, the burden of preventive and intensive care lies squarely with family physicians.2 Rather than complain about our patients’ lack of metabolic control, we should provide them with the knowledge, skills, tools, and encouragement that they need to become successful diabetes self-managers.
1. Berard LD, Siemens R, Woo V; Diabetes Canada Clinical Practice Guidelines Expert Committee. Monitoring glycemic control. Can J Diabetes. 2018;42(suppl 1):S47-S325.
2. Centers for Disease Control and Prevention. New CDC report: More than 100 million Americans have diabetes or prediabetes. July 18, 2017. www.cdc.gov/media/releases/2017/p0718-diabetes-report.html. Accessed January 15, 2020.

Director, Unger Primary Care Concierge Medical Group, Rancho Cucamonga, CA. Dr. Unger is a former member of the JFP editorial board. He reported that he receives grant/research support and/or is a consultant to Novo Nordisk, Abbott Diabetes Care, Sanofi, Eli Lilly and Company, Ictarcia Therapeutics, and Bayer Corporation.
Director, Unger Primary Care Concierge Medical Group, Rancho Cucamonga, CA. Dr. Unger is a former member of the JFP editorial board. He reported that he receives grant/research support and/or is a consultant to Novo Nordisk, Abbott Diabetes Care, Sanofi, Eli Lilly and Company, Ictarcia Therapeutics, and Bayer Corporation.
Director, Unger Primary Care Concierge Medical Group, Rancho Cucamonga, CA. Dr. Unger is a former member of the JFP editorial board. He reported that he receives grant/research support and/or is a consultant to Novo Nordisk, Abbott Diabetes Care, Sanofi, Eli Lilly and Company, Ictarcia Therapeutics, and Bayer Corporation.
Through the years, I have had the privilege of educating clinicians about scientific advances in diabetes care. Prior to displaying the first slide of my presentation, I ask the audience, “How many of you have seen a ‘noncompliant’ patient with diabetes within the past month?” Without fail, 99% of the attendees will raise their hand and start laughing, as if to say, “Well, of course they’re noncompliant. They just don’t get it! How incompetent can these people be?”
Blaming patients for failing to achieve metabolic control is inappropriate and misguided. How many physicians would be able or willing to monitor their blood glucose levels 4 times a day? Based on the premeal glucose level, how many physicians know how much insulin to inject in order to keep the postprandial excursions below 180 mg/dL? How many would remember to take 8 other medications daily without missing a dose? And how many physicians exercise daily; have actually looked at their feet in the past month; and have gained no weight in the past year?
Diabetes self-management is time-consuming and difficult for many patients, especially those with health illiteracy, financial restraints, or social barriers. Any patient who presents to the doctor is, in fact, “compliant.” These individuals expect to receive the safest and most effective treatments for their diabetes while learning as much as possible about lifestyle and behavioral interventions.
I challenge each of you to ask your patients: “What concerns you the most about having diabetes?” Initially, patients will express guilt and remorse about having diabetes. They will hang their heads in shame, admit to not going to the gym as often as they could, and promise to eat smaller portions. They will then look you in the eye and say, “I am worried about losing my eye, my leg, and my kidney to this life-threatening disease. I’m scared I won’t be able to see my daughter walk down the aisle at her wedding or my son graduate from college.”
These patients are terrified because they are unfamiliar with the advances in clinical science that aid our ability to improve the lives of all patients with diabetes. After hearing patients’ concerns about dying prematurely or losing an extremity to diabetes, I assure them that, “Nothing is going to happen to you on my watch. You are safe with me, and I will always have your back.” This level of trust is vitally important to the patient as well as to the treating physician. We all want our patients to achieve treatment success, just as any teacher would want their students to excel and graduate to the next grade level. Diabetes cannot be cured, yet we, as physicians, are able to heal with reassurance and expert guidance.
So, how do we help our patients achieve better adherence to their chronic disease state interventions? Here are 9 techniques that I have learned in my years helping patients manage their diabetes (all of which are more broadly applicable to any chronic disease state):
- Explain the disease state you are comanaging with the patient to the best of your ability. The more the patient understands, the easier your job as the “drug police” becomes.
- Remind the patient that he/she is the captain of the disease management team. You, the physician, serve as the personal coach. You can help the patient win the game, but he/she is ultimately responsible for achieving successful metabolic targets.
- Explain the risks, benefits, and any expected adverse effects that are likely to occur. Do this prior to initiating any medication.
- Discuss when metabolic change might be expected after initiating a given medication. Patients who observe rapid improvement in their glucose levels will be encouraged to adhere to their prescribed treatment regimen.
- Make certain that any and all screening tests are performed prior to initiating a medication. For example, renal function should be assessed prior to beginning most diabetes medications.
- Use shared decision-making to negotiate acceptable metabolic targets with each patient. Discuss the urgency and importance of achieving these goals.
- Assess the A1C reduction from baseline at 4 weeks after therapy initiation, rather than at 3 months. About 50% of the total A1C is reflective of the preceding 4 weeks of treatment.1 Thus, if the baseline A1C drops from 8.2% to 7.8%, the patient is moving in the right direction. However, if the A1C increases from 8.2% to 8.5%, the patient is not taking the prescribed medications.
- Recommend that the patient use a continuous glucose monitor; this newer technology is now readily available for patients who are covered by private insurance or Medicare. These devices allow patients to observe their glucose levels every 5 minutes of every day without fingersticks and actually cost less than self-monitoring one’s blood glucose.
- Find a reason to praise the patient at each visit. Patients who receive a powerful compliment, such as “I am so very proud of your efforts at improving your diabetes control,” will do their absolute best to remain adherent to their prescribed medication regimen. The response might be different if a patient is told, “Once again, your blood sugars are too high. At this rate, you are probably going to die, just like your father did 20 years ago. Now come back in 6 months and show me what you’re really made of!”
With more than 30 million Americans living with diabetes and another 84 million with prediabetes, the burden of preventive and intensive care lies squarely with family physicians.2 Rather than complain about our patients’ lack of metabolic control, we should provide them with the knowledge, skills, tools, and encouragement that they need to become successful diabetes self-managers.
1. Berard LD, Siemens R, Woo V; Diabetes Canada Clinical Practice Guidelines Expert Committee. Monitoring glycemic control. Can J Diabetes. 2018;42(suppl 1):S47-S325.
2. Centers for Disease Control and Prevention. New CDC report: More than 100 million Americans have diabetes or prediabetes. July 18, 2017. www.cdc.gov/media/releases/2017/p0718-diabetes-report.html. Accessed January 15, 2020.
Do group visits improve HbA1c more than individual visits in patients with T2DM?
EVIDENCE SUMMARY
A 2012 systematic review of 21 RCTs examined the effect of group-based diabetes education on HbA1c in 2833 adults with T2DM.1 Intervention groups participated in at least 1 group session lasting an hour led by a health professional or team (eg, physician, nurse, diabetes educator); controls received usual care. Most trials involved 6 to 20 hours of group-based education delivered over 1 to 10 months, although some trials continued the intervention for as long as 24 months. The mean HbA1c at baseline across all patients was 8.23%.
Professional-led group visitsimprove HbA1c
Group education resulted in a significant reduction in HbA1c compared with controls at 6 months (13 trials; 1883 patients; mean difference [MD]=−0.44%; 95% confidence interval [CI], −0.69 to −0.19), 12 months (11 studies; 1503 patients; MD=−0.46%; 95% CI, −0.74 to −0.18), and 24 months (3 studies; 397 patients; MD=−0.87%; 95% CI, −1.25 to −0.49). The trials had high heterogeneity, except for the 3 trials with a 24-month end-point (I2 = 0). Most studies had a moderate or high risk of bias.
A larger 2017 meta-analysis enrolling 8533 adults with T2DM came to similar conclusions, although it included a small number of nonrandomized trials (40 RCTs, 3 cluster RCTs, and 4 controlled clinical trials).2 Thirteen of the RCTs overlapped with the previously described systematic review.1 Interventions had to include at least 1 group session with 4 or more adult patients lasting at least 1 hour. In most studies, interventions continued between 4 and 12 months, although some ran 60 months. Controls received usual care. The mean HbA1c at baseline across all patients was 8.3%.
Group-based education compared with controls reduced HbA1c at 6 to 10 months (30 trials, N not given; MD=−0.3%; 95% CI, −0.48 to −0.15), 12 to 14 months (27 trials, N not given; MD=−0.3%; 95% CI, −0.49 to −0.17), and 36 to 48 months (5 trials, N not given; MD=−0.9%; 95% CI, −1.52 to −0.34). In a subgroup analysis, peer-led group visits had no effect (5 trials, 1066 patients; MD=−0.02%; 95% CI, −0.12 to 0.16).
Patients on oral agents alone showed a larger benefit than patients using insulin (38 trials, 5871 patients; −0.81 vs −0.19; P < .0001). Authors of the meta-analysis classified most studies as having a moderate to high risk of bias, with only 4 having low risk.
Duration of intervention: Longer is better for HbA1c values
Another systematic review analyzed 13 RCTs with 4652 patients 16 years and older with T2DM or type 1 diabetes to assess the effect of group visits on HbA1c.3 The review excluded studies that didn’t include a health care provider who could prescribe, diagnose, assess, and refer patients when appropriate.
Most interventions ran 3 to 12 months, although one lasted 36 months. (Two RCTs overlapped with the 2012 review, and 2 others with the 2017 review.) Group medical visits resulted in a significant decrease in HbA1c at the end of the intervention period (MD=−0.46%; 95% CI, −0.80 to −0.13) compared with controls. A meta-regression analysis suggested that ongoing treatment (for as long as 3 years) decreased HbA1c more than a shorter treatment duration (by 0.25% per year of treatment), whereas the frequency of treatments didn’t alter the effect. Overall, the trials were heterogenous and most had a high risk of bias.
Continue to: RECOMMENDATIONS
RECOMMENDATIONS
The 2015 National Institute for Health and Care Excellence guideline for the management of T2DM in adults calls group education programs “the preferred option” for diabetes education, suggesting that clinicians reserve individual education for patients unable or unwilling to participate in group programs.4
The 2017 diabetes self-management education and support policy endorsed by the American Diabetes Association recommends using interprofessional teams and “creative solutions” to increase patient engagement and endorses group meetings as an effective option for patients who choose them.5
Editor’s takeaway
Moderate-quality evidence demonstrates that group visits can significantly reduce HbA1c levels. We should consider them for our patients with diabetes who are willing to attend group sessions.
1. Steinsbekk A, Rygg LO, Lisulo M, et al. Group based diabetes self-management education compared to routine treatment for people with type 2 diabetes mellitus. a systematic review with meta-analysis. BMC Health Serv Res. 2012;12:213.
2. Odgers-Jewell K, Ball LE, Kelly JT, et al. Effectiveness of group-based self-management education for individuals with Type 2 diabetes: a systematic review with meta-analyses and meta-regression. Diabet Med. 2017;34:1027-1039.
3. Housden L, Wong ST, Dawes M. Effectiveness of group medical visits for improving diabetes care: a systematic review and meta-analysis. CMAJ. 2013;185:e635–e644.
4. National Institute for Health and Care Excellence. Type 2 diabetes in adults: management. NICE guideline [NG 28]. December 2015. Updated May 2017. https://www.nice.org.uk/guidance/ng28/chapter/1-Recommendations#individualised-care. Accessed January 24, 2020.
5. Beck J, Greenwood DA, Blanton L. et al. 2017 National standards for diabetes self-management, education and support. Diabetes Care. 2017; 40:1409–1419.
EVIDENCE SUMMARY
A 2012 systematic review of 21 RCTs examined the effect of group-based diabetes education on HbA1c in 2833 adults with T2DM.1 Intervention groups participated in at least 1 group session lasting an hour led by a health professional or team (eg, physician, nurse, diabetes educator); controls received usual care. Most trials involved 6 to 20 hours of group-based education delivered over 1 to 10 months, although some trials continued the intervention for as long as 24 months. The mean HbA1c at baseline across all patients was 8.23%.
Professional-led group visitsimprove HbA1c
Group education resulted in a significant reduction in HbA1c compared with controls at 6 months (13 trials; 1883 patients; mean difference [MD]=−0.44%; 95% confidence interval [CI], −0.69 to −0.19), 12 months (11 studies; 1503 patients; MD=−0.46%; 95% CI, −0.74 to −0.18), and 24 months (3 studies; 397 patients; MD=−0.87%; 95% CI, −1.25 to −0.49). The trials had high heterogeneity, except for the 3 trials with a 24-month end-point (I2 = 0). Most studies had a moderate or high risk of bias.
A larger 2017 meta-analysis enrolling 8533 adults with T2DM came to similar conclusions, although it included a small number of nonrandomized trials (40 RCTs, 3 cluster RCTs, and 4 controlled clinical trials).2 Thirteen of the RCTs overlapped with the previously described systematic review.1 Interventions had to include at least 1 group session with 4 or more adult patients lasting at least 1 hour. In most studies, interventions continued between 4 and 12 months, although some ran 60 months. Controls received usual care. The mean HbA1c at baseline across all patients was 8.3%.
Group-based education compared with controls reduced HbA1c at 6 to 10 months (30 trials, N not given; MD=−0.3%; 95% CI, −0.48 to −0.15), 12 to 14 months (27 trials, N not given; MD=−0.3%; 95% CI, −0.49 to −0.17), and 36 to 48 months (5 trials, N not given; MD=−0.9%; 95% CI, −1.52 to −0.34). In a subgroup analysis, peer-led group visits had no effect (5 trials, 1066 patients; MD=−0.02%; 95% CI, −0.12 to 0.16).
Patients on oral agents alone showed a larger benefit than patients using insulin (38 trials, 5871 patients; −0.81 vs −0.19; P < .0001). Authors of the meta-analysis classified most studies as having a moderate to high risk of bias, with only 4 having low risk.
Duration of intervention: Longer is better for HbA1c values
Another systematic review analyzed 13 RCTs with 4652 patients 16 years and older with T2DM or type 1 diabetes to assess the effect of group visits on HbA1c.3 The review excluded studies that didn’t include a health care provider who could prescribe, diagnose, assess, and refer patients when appropriate.
Most interventions ran 3 to 12 months, although one lasted 36 months. (Two RCTs overlapped with the 2012 review, and 2 others with the 2017 review.) Group medical visits resulted in a significant decrease in HbA1c at the end of the intervention period (MD=−0.46%; 95% CI, −0.80 to −0.13) compared with controls. A meta-regression analysis suggested that ongoing treatment (for as long as 3 years) decreased HbA1c more than a shorter treatment duration (by 0.25% per year of treatment), whereas the frequency of treatments didn’t alter the effect. Overall, the trials were heterogenous and most had a high risk of bias.
Continue to: RECOMMENDATIONS
RECOMMENDATIONS
The 2015 National Institute for Health and Care Excellence guideline for the management of T2DM in adults calls group education programs “the preferred option” for diabetes education, suggesting that clinicians reserve individual education for patients unable or unwilling to participate in group programs.4
The 2017 diabetes self-management education and support policy endorsed by the American Diabetes Association recommends using interprofessional teams and “creative solutions” to increase patient engagement and endorses group meetings as an effective option for patients who choose them.5
Editor’s takeaway
Moderate-quality evidence demonstrates that group visits can significantly reduce HbA1c levels. We should consider them for our patients with diabetes who are willing to attend group sessions.
1. Steinsbekk A, Rygg LO, Lisulo M, et al. Group based diabetes self-management education compared to routine treatment for people with type 2 diabetes mellitus. a systematic review with meta-analysis. BMC Health Serv Res. 2012;12:213.
2. Odgers-Jewell K, Ball LE, Kelly JT, et al. Effectiveness of group-based self-management education for individuals with Type 2 diabetes: a systematic review with meta-analyses and meta-regression. Diabet Med. 2017;34:1027-1039.
3. Housden L, Wong ST, Dawes M. Effectiveness of group medical visits for improving diabetes care: a systematic review and meta-analysis. CMAJ. 2013;185:e635–e644.
4. National Institute for Health and Care Excellence. Type 2 diabetes in adults: management. NICE guideline [NG 28]. December 2015. Updated May 2017. https://www.nice.org.uk/guidance/ng28/chapter/1-Recommendations#individualised-care. Accessed January 24, 2020.
5. Beck J, Greenwood DA, Blanton L. et al. 2017 National standards for diabetes self-management, education and support. Diabetes Care. 2017; 40:1409–1419.
EVIDENCE-BASED ANSWER:
Yes. In patients with type 2 diabetes mellitus (T2DM), group visits led by health professionals or teams improved glycosylated hemoglobin (HbA1c) by 0.3% to 0.9% over usual care (strength of recommendation [SOR]: B, meta-analyses of randomized clinical trials [RCTs] with moderate to high risk of bias).
Patients taking oral antidiabetic agents alone appear to benefit more than patients on insulin. Peer-led group visits likely have no effect (SOR: B, subgroup analysis within a meta-analysis).
Treatment durations as long as 3 years are associated with larger decreases in HbA1c (by 0.25% per year) than treatment lasting less than a year (SOR: B, meta-analysis of RCTs involving patents with type 1 diabetes and T2DM).
Patients with T2DM should be offered group visits for diabetes education when available (SOR: C, expert opinion).

FDA okays triple-combo pill for type 2 diabetes
Trijardy XR will be available in four different dosages and is indicated as a once-daily treatment, together with diet and exercise, for adults who are already on treatment for type 2 disease but require additional agents to attain healthy hemoglobin A1c targets, according to a statement released by Eli Lilly, which will market the newly approved treatment together with Boehringer Ingelheim.
“Type 2 diabetes is a complex disease that often requires the use of multiple antidiabetic medications to improve glycemic control. Having three different diabetes medications in a single tablet is an important advance in diabetes treatment,” Ralph DeFronzo, MD, professor and diabetes division chief at the University of Texas Health San Antonio, said in the release.
All three drugs are separately well-established therapies for type 2 diabetes. Metformin is the most commonly prescribed treatment for type 2. Empagliflozin, a sodium-glucose transporter 2 inhibitor, and linagliptin, a single-dose dipeptidyl peptidase–4 inhibitor, are approved for the reduction of blood sugar in patients with type 2 disease, and empagliflozin is also approved for lowering the risk of cardiovascular death in adults with type 2 and established cardiovascular disease, according to the statement. (In 2015, the FDA approved a combination of empagliflozin and linagliptin, Glyxambi, as an adjunct to diet and exercise to improve glycemic control in adults with type 2 diabetes.)
The approval of the triple-combination treatment was based on findings from two randomized, open-label trials that assessed the bioequivalence of empagliflozin, linagliptin, and extended-release metformin hydrochloride fixed-dose combination tablets, as well as their individual components. In addition, the trials established that the safety profile of the combination therapy was similar to the safety profiles of the components, the statement said.
Lactic acidosis, pancreatitis, and heart failure are among the side effects associated with the combination therapy, with upper respiratory tract infection and gastroenteritis among the most common. Serious side effects include dehydration, ketoacidosis, kidney problems, urinary tract and vaginal yeast infections, and hypoglycemia.
As with empagliflozin and linagliptin alone, the combination therapy is not recommended for individuals with type 1 diabetes or diabetic ketoacidosis, and it has not been tested in patients with a history of pancreatitis. The combination also has a warning for lactic acidosis, a rare, but serious, condition that can arise with metformin accumulation.
The combination product is contraindicated for people with kidney problems and end-stage renal disease or who are on dialysis; have metabolic acidosis or diabetic ketoacidosis; or are allergic to empagliflozin, linagliptin, or metformin.
Barbers have role in encouraging diabetes screening in black men
Shave and a haircut … and a blood glucose test? A study shows that barbershops owned by black proprietors can play a role in encouraging black men to get screened for diabetes.
In research letter published in the Jan. 27 edition of JAMA Internal Medicine, Marcela Osorio, BA, from New York University and coauthors wrote that black men with diabetes have disproportionately high rates of diabetes complications and lower survival rates. Their diagnosis is often delayed, particularly among men without regular primary health care.
“In barbershops, which are places of trust among black men, community-based interventions have been successful in identifying and treating men with hypertension,” they wrote.
In this study, the researchers approached customers in eight barbershops in Brooklyn, in areas associated with a high prevalence of individuals with poor glycemic control, to encourage them to get tested for diabetes. All barbershops were owned by black individuals.
Around one-third of the 895 black men who were asked to participate in the study agreed to be screened, and 290 (32.4%) were successfully tested using point-of-care hemoglobin A1c testing.
The screening revealed that 9% of those tested had an HbA1c level of 6.5% or higher, and 16 of these individuals were obese. Three men had an HbA1c level of 7.5% or higher. The investigators noted that this prevalence of undiagnosed diabetes was much higher than the 3.6% estimated prevalence among New York City residents.
The highest HbA1c level recorded during testing was 7.8%, and 28.3% of those tested had a level between 5.7% and 6.4%, which meets the criteria for a diagnosis of prediabetes.
“We also found that barbers were important health advocates; although we do not have exact numbers, some customers (who initially declined testing) agreed after encouragement from their barber,” the authors wrote.
Of the 583 men who declined to participate, around one-quarter did so on the grounds that they already knew their health status or had been checked by their doctor, one-third (35.3%) said they were healthy or didn’t have the time or interest, or didn’t want to know the results. There were also 26 individuals who reported being scared of needles.
“Black men who live in urban areas of the United States may face socioeconomic barriers to good health, including poor food environments and difficulty in obtaining primary care,” the authors wrote. “Our findings suggest that community-based diabetes screening in barbershops owned by black individuals may play a role in the timely diagnosis of diabetes and may help to identify black men who need appropriate care for their newly diagnosed diabetes.”
The study was supported by the National Institute of Diabetes and Digestive and Kidney Diseases. Two authors declared grants from the institute during the study, and one also reported grants from other research foundations outside the study.
SOURCE: Osorio M et al. JAMA Intern Med. 2020 Jan 27. doi: 10.1001/jamainternmed.2019.6867.
FROM JAMA INTERNAL MEDICINE
Key clinical point: Barbershops could offer a way to encourage diabetes screening among black men.
Major finding: HbA1c testing in barbershops identified a significant number of individuals with undiagnosed diabetes.
Study details: Study involving 895 black men attending eight barbershops in Brooklyn.
Disclosures: The study was supported by the National Institute of Diabetes and Digestive and Kidney Diseases. Two authors declared grants from the institute during the study, and one also reported grants from other research foundations outside the study.
Source: Osorio M et al. JAMA Intern Med. 2020 Jan 27. doi: 10.1001/jamainternmed.2019.6867.
Antimalarial adherence is important for diabetes prevention in lupus
Adhering to antimalarial treatment offers some protection to patients with systemic lupus erythematosus (SLE) from developing type 2 diabetes mellitus (T2DM), according to new research.
Patients who took at least 90% of their prescribed antimalarial doses were 39% less likely to develop T2DM than patients who discontinued antimalarial therapy. Patients who took less than 90% of their prescribed doses but didn’t discontinue treatment were 22% less likely to develop T2DM.
“[O]ur study provides further support for the importance of adherence to antimalarials in SLE by demonstrating protective impacts on T2DM,” Shahrzad Salmasi, PhD, of the University of British Columbia, Vancouver, and colleagues wrote in Arthritis Care & Research.
Dr. Salmasi and colleagues conducted this retrospective study using administrative health data on patients in British Columbia. The researchers analyzed 1,498 patients with SLE. Their mean age was about 44 years, and 91% were women.
The researchers used data on prescription dates and days’ supply to establish antimalarial drug courses and gaps in treatment. A new treatment course occurred when a 90-day gap was exceeded between refills. The researchers calculated the proportion of days covered (PDC) – the total number of days with antimalarials divided by the length of the course – and separated patients into three categories:
- Adherent to treatment – PDC of 0.90 or greater
- Nonadherent – PDC greater than 0 but less than 0.90
- Discontinuer – PDC of 0
The patients had a mean of about 23 antimalarial prescriptions and a mean of about two courses. The mean course duration was 554 days.
At a median follow-up of 4.6 years, there were 140 incident cases of T2DM. The researchers calculated the risk of T2DM among adherent and nonadherent patients, comparing these groups with the discontinuers and adjusting for age, sex, comorbidities, and concomitant medications.
The adjusted hazard ratio for developing T2DM was 0.61 among adherent patients and 0.78 among nonadherent patients.
“This population-based study highlighted that taking less than 90% of the prescribed antimalarials compromises their effect in preventing T2DM in SLE patients,” Dr. Salmasi and colleagues wrote. “Our findings should be used to emphasize the importance of medication adherence in not only treating SLE but also preventing its complications.”
The researchers reported having no conflicts of interest.
SOURCE: Salmasi S et al. Arthritis Care Res. 2020 Jan 21. doi: 10.1002/acr.24147.
FROM ARTHRITIS CARE & RESEARCH