User login
Bevacizumab first matches aflibercept for diabetic macular edema
A cost-saving, stepwise approach to treating diabetic macular edema was as effective and at least as safe as what’s been the standard approach, which jumps straight to the costlier treatment, in a head-to-head, multicenter, U.S. randomized trial of the two regimens that included 312 eyes in 270 adults with type 1 or type 2 diabetes.
The findings validate a treatment regimen for diabetic macular edema that’s already common in U.S. practice based on requirements by many health insurance providers because of the money it saves.
The step-therapy approach studied involves starting off-label treatment with the relatively inexpensive agent bevacizumab (Avastin), followed by a switch to the much pricier aflibercept (Eylea) when patients don’t adequately respond, following a prespecified algorithm that applies four criteria to determine when patients need to change agents.
These new findings build on a 2016 study that compared aflibercept monotherapy with bevacizumab monotherapy and showed that after 2 years of treatment aflibercept produced clearly better outcomes.
The new trial findings “are particularly relevant given the increasing frequency of insurers mandating step therapy with bevacizumab before the use of other drugs” such as aflibercept, noted Chirag D. Jhaveri, MD, and colleagues in the study published online in the New England Journal of Medicine.
Opportunity for ‘substantial cost reductions’
Jhaveri, a retina surgeon in Austin, Texas, and associates note that, based on Medicare reimbursement rates of $1,830 for a single dose of aflibercept and $70 for one dose of bevacizumab, starting treatment with bevacizumab could produce “substantial cost reductions for the health care system.”
The authors of an accompanying editorial agree. Step therapy that starts with bevacizumab would probably result in “substantial” cost savings, and the findings document “similar outcomes” from the two tested regimens based on improvements in visual acuity and changes in the thickness measurement of the central retina during the 2-year trial, write David C. Musch, PhD, and Emily Y. Chew, MD.
Dr. Musch, a professor and ophthalmology epidemiologist at the University of Michigan in Ann Arbor, and Dr. Chew, director of the Division of Epidemiology and Clinical Applications at the National Eye Institute in Bethesda, Md., also laud the “rigorous” study for its design and conduct that was “beyond reproach,” and for producing evidence that “applies well to clinical practice.”
The only potential drawback to the step-therapy approach, they write, is that people with diabetes often have “numerous coexisting conditions that make it more difficult for them to adhere to frequent follow-up visits,” a key element of the tested step-care protocol, which mandated follow-up visits every 4 weeks during the first year and every 4-16 weeks during the second year.
312 eyes of 270 patients
The new trial, organized by the DRCR Retinal Network and the Jaeb Center for Health Research in Tampa, Fla., ran at 54 U.S. sites from December 2017 to November 2019. The study randomized 158 eyes in 137 patients to aflibercept monotherapy, and 154 eyes in 133 patients to the step-care regimen (both eyes were treated in several patients in each group, with each eye receiving a different regimen). Participants were around 60 years old, 48% were women, and 95% had type 2 diabetes.
To be eligible for enrollment, patients had at least one eye with a best-corrected visual-acuity letter score of 24-69 on an Electronic Early Treatment Diabetic Retinopathy Study chart (ranges from 0 to 100, with higher values indicating better visual acuity), which corresponds to Snellen chart values of 20/320-20/50, readings that encompass most patients with diabetic macular edema, noted study authors Adam R. Glassman and Jennifer K. Sun, MD, in an interview.
“Very few patients with diabetic macular edema have vision due to this alone that is worse than 20/320, which meets criteria for legal blindness,” said Dr. Glassman, who is executive director of the Jaeb Center for Health Research, and Dr. Sun, who is chief of the center for clinical eye research and trials at the Joslin Diabetes Center in Boston and chair of the DRCR Retinal Network.
The primary outcome was time-averaged change in visual-acuity letter score from baseline to 2 years, which improved by an average of 15.0 letters in the aflibercept monotherapy group and an average of 14.0 letters in the step-therapy group, an adjusted difference of 0.8 letters, which was not significant. An improvement from baseline of at least 15 letters occurred in 53% of the eyes in the aflibercept monotherapy group and in 58% of those who had step therapy, and 77% of eyes in both groups had improvements of at least 10 letters.
Central retinal thickness dropped from baseline by an average of 192 mcm with aflibercept monotherapy and 198 mcm with step therapy. The average number of total treatments (by intravitreous injection) was 14.6 in the aflibercept monotherapy group and 16.1 in the step-therapy group. After the first 24 weeks of the study, 39% of eyes in the step-therapy group had switched from bevacizumab to aflibercept injections; after 1 year, 60% of eyes had switched; and by study end, after 2 years, 70% had changed.
The bevacizumab-first group also showed at least comparable if not better safety, with similar rates of prespecified ocular events in both groups, but with a significantly lower rate of serious systemic adverse events, which occurred in 52% of the eyes treated with aflibercept only and 36% of eyes that began treatment on bevacizumab. Serious systemic adverse events occurred in 43% of patients who had two eyes treated as part of the trial.
‘Bevacizumab first was noninferior’
The team that designed the trial opted for a superiority design rather than a noninferiority trial and powered the study based on the presumption that aflibercept monotherapy would prove superior, said Dr. Glassman and Dr. Sun. “We feel that the clinical interpretation of these results will be similar to the interpretation if we had conducted a noninferiority study, and we found that bevacizumab first was noninferior to aflibercept monotherapy,” they maintained in an interview.
Dr. Glassman and Dr. Sun said they and their coauthors are now analyzing the results to try to find patient characteristics that could identify eyes most likely to respond to the bevacizumab-first approach. “It would be clinically valuable” to use the results to identify characteristics that could help guide clinicians’ treatment approach and enhance patient counseling, they said.
The study received funding from the National Institutes of Health. Dr. Jhaveri has reported being a consultant for Genentech, Novartis, and Regenxbio. Dr. Glassman has reported receiving grants from Genentech and Regeneron. Dr. Sun has reported receiving grants from Boehringer Ingelheim, Janssen Biotech, KalVista, Optovue, and Physical Sciences, grants and travel support from Novartis and Novo Nordisk, travel support from Merck, writing support from Genentech, and equipment supplied by Adaptive Sensory and Boston Micromachines. Dr. Musch and Dr. Chew have reported no relevant financial relationships.
A version of this article first appeared on Medscape.com.
FROM NEW ENGLAND JOURNAL OF MEDICINE
In the quest for a cure for type 1 diabetes, two companies merge
The $320 million cash purchase “will accelerate our goal of transforming, if not curing, type 1 diabetes by expanding our capabilities and bringing additional tools, technologies, and assets to our current stem cell-based programs,” said Vertex Chief Executive Officer and President Reshma Kewalramani, MD, in a company statement.
Last month, Vertex reported on a phase 1/2 multicenter clinical trial for two patients with type 1 diabetes who experienced improved blood glucose control with half doses of the company’s investigational allogeneic stem cell-derived islets (VX-880).
The first person to receive the product remained completely insulin-independent at 9 months post-transplant. A third patient has received the full targeted dose, but the data for this participant have yet to be reported.
For Viacyte’s part, last week the company announced that a clinical hold placed by the U.S. Food and Drug Administration on the trial has been lifted, allowing it to move forward with a planned total enrollment of 17 patients.
“The FDA requested additional information on the program, which we provided expeditiously. We are pleased that the hold has been lifted and look forward to continuing the Phase 1/2 trial in the U.S.,” a Vertex spokesperson told this news organization.
And a company official for ViaCyte presented results for three patients who received pancreatic precursor (PEC-01) cells derived from the company’s proprietary pluripotent stem cell line at the annual meeting of the Endocrine Society held in June. The cells are housed in an open delivery device implanted into a patient’s forearm. All three participants experienced improved blood glucose levels.
That presentation followed ViaCyte’s announcement in February that the first patient with type 1 diabetes had been dosed in a Phase 1 clinical trial of its investigational allogeneic, gene-edited, stem cell-derived product, VCTX210, developed in collaboration with CRISPR Therapeutics’ gene-editing technology. The aim is to generate islet cells that will produce insulin while avoiding recognition by the immune system, thus rendering immunosuppressive drugs unnecessary.
According to Vertex’s announcement, “The acquisition of ViaCyte provides Vertex with complementary assets, capabilities, and technologies, including additional human stem cell lines, intellectual property around stem cell differentiation, and Good Manufacturing Practice ... facilities for cell-based therapies that could accelerate Vertex’s ongoing type 1 diabetes programs. The acquisition also provides access to novel hypoimmune stem cell assets via the ViaCyte collaboration with CRISPR Therapeutics.”
In response to the announcement, the type 1 diabetes advocacy organization JDRF, which has funded the work of both companies, said in a statement that the acquisition “represents a significant stride in cures research for the type 1 diabetes community.”
“The coming together of two leaders in the cell-derived therapies field will undoubtedly accelerate the development of VX-880 by combining their resources, technologies, intellectual property, and more,” it added.
A third company developing stem cell–derived islet cell therapies, Sernova, said in a statement provided to this news organization: “We are very confident that bringing important game-changing technologies together, as we are seeing across the industry, will result in several viable technologies for the millions of people with type 1 diabetes ... We are thrilled that there are several technologies under development using different approaches that have the potential to provide a ‘functional cure’ for this disease.”
Vertex anticipates the acquisition will close later in 2022.
A version of this article first appeared on Medscape.com.
Cutting dietary simple sugars may relieve GERD symptoms
Minimizing dietary consumption of simple sugars may help alleviate symptoms of gastroesophageal reflux disease (GERD), new data suggest.
People who consumed lower quantities of simple sugars experienced significant improvement in total acid exposure time, number of reflux episodes, and subjective reports of heartburn and reflux symptoms, compared with those consuming higher amounts of simple sugars, the authors report.
The authors call their study the first randomized controlled diet intervention trial to investigate both the amount and type of carbohydrate on symptomatic GERD and one of only a few to investigate any type of dietary intervention for GERD.
“There’s really almost no rigorous scientific evidence on any of the foods or ingredients or nutrients that are often recommended to avoid if you have GERD,” corresponding author Heidi J. Silver, RD, PhD, told this news organization. Dr. Silver is research professor of medicine at Vanderbilt University School of Medicine and director of the Vanderbilt Diet, Body Composition, and Human Metabolism Core in Nashville, Tenn.
Even the avoidance of fatty foods, which has been long promoted as part of GERD management, has little evidence to support it.
“With fat, there’s some belief that it may slow down gastric emptying. Therefore, if you had slower gastric emptying, you would have a longer time for the food to put pressure on the lower esophageal sphincter and create an environment for reflux. So, it’s kind of conceptually what is thought but not really tested,” she notes.
The findings were published online in the American Journal of Gastroenterology.
Greatest symptom reduction with low simple carb intake
To test the role of dietary carbohydrates, Dr. Silver and her colleagues randomly assigned 98 U.S. veterans with symptomatic GERD to intake of one of four diets with varying carbohydrate types and amounts for 9 weeks: high total/high simple (the control group), high total/low simple, low total/high simple, or low total/low simple. The total caloric intake was approximately the same for all groups.
At baseline, the average total carbohydrate consumption was 43.7% of calories, and the average simple sugar intake was 116.5 g/d. The two “low-total” groups averaged about a 10% reduction in carbohydrate calories. The “low-simple” groups reduced simple sugars by about half.
There were no changes in body weight in the control group, whereas all three of the other groups lost some weight, ranging from 1.5-2.0 kg (3.3-4.4 lb) despite calorie totals designed for weight maintenance.
There was a significant effect of diet on the two primary outcomes, total esophageal acid exposure time, and total number of reflux episodes, as measured by 24-hour ambulatory pH monitoring. The change in total acid exposure time was significantly greater for the high total/low simple group, compared with the high total/high simple group.
The participants’ ratings of symptoms assessed by the Gastroesophageal Reflux Disease Questionnaire and the GERD Symptom Assessment Scale, including heartburn frequency and severity, pain in throat/chest, and sleep disturbance, improved in all modified diet groups, compared with the control group. The mean degree of improvement in heartburn and regurgitation was twice as great for the modified diets, compared with the controls, and was greatest for the two “low-simple” carb groups.
Dr. Silver and colleagues hypothesize that the differential effects of the diets may relate to the way that dietary carbohydrates are sensed in the gastrointestinal tract after being enzymatically degraded into monosaccharides, possibly affecting lower esophageal tone via the effects of gut-derived hormones including ghrelin and glucagon-like peptide 1 that are secreted in response to macronutrient intake.
Although more data are needed about the effects of carbohydrates in GERD, Dr. Silver advised, “I do think it would be smart for clinicians, when they’re discussing diet, that they bring up the simple sugars. There’s no potential harm in reducing simple sugars. You’re only benefiting yourself in multiple ways. We know that the consumption of simple sugars is extremely excessive, not just in America but worldwide.”
Asked to comment, Philip O. Katz, MD, professor of medicine and director of the GI Function Laboratories at Weill Cornell Medicine, New York, told this news organization that “this is one of the better-designed studies with a lot of care looking at a lot of endpoints that are intriguing and useful.”
“What it says to me is there is potential for nonpharmacologic interventions for GERD that include diet change for helping patients,” he said. “This shows promise for a diet that doesn’t just concentrate on fat or acidic products and is a possible way of augmenting reflux treatment.”
However, Dr. Katz cautioned, “I don’t think anybody should do more with a 9-week study than look at it as good potential.”
“I would tell patients that this is something that they might try, but I wouldn’t make it a rigid requirement based on these data,” he added. “If I were involved in this study, the next thing I would do is transition it to real life and look at compliance to see if results were sustained at 18 weeks or 6 months.”
Diet part of an ‘overall reflux program’
Overall, Dr. Katz, who was the first author of the American College of Gastroenterology’s Clinical Guideline for the Diagnosis and Management of Gastroesophageal Reflux Disease, pointed out that the main nonpharmacologic advice for GERD management includes “Eat smaller meals, don’t eat before bed, don’t lie down after you eat, and reduce any individually known trigger foods.”
Essentially, he views dietary interventions as complementary to medication and other interventions.
“When people really have GERD – not just heartburn – dietary change is an adjunct,” Dr. Katz said. “GERD is a real disease, like diabetes. For some with GERD, maybe this is the only thing they need to do. But, in general, this will be an adjunct to augment an overall reflux program.”
And that program, both Dr. Silver and Dr. Katz said, should include referral to a dietitian or nutritionist.
“If you’re going to invest time in getting your patients to change their diet, it should be done with professional help, a qualified nutritionist who can work with the patient. This should not be a fad,” Dr. Katz said.
Dr. Silver noted, “In contrast to a physician, the dietitian looks at everything the person is eating. If they’re consuming a lot of simple sugars, I certainly would make that recommendation to reduce, along with other recommendations for GERD. It could be easily incorporated. We included examples in the paper of what we did to achieve that reduction and some things clinicians could focus on.”
One obvious approach, she said, is to advise patients to cut the amount of sugared soda they’re drinking, if not eliminate it entirely.
The study was funded by a VA Merit Award. Dr. Silver has no further disclosures. Dr. Katz is a consultant for Phathom Pharmaceuticals and Sebella Pharmaceuticals and serves on an advisory board for AstraZeneca.
A version of this article first appeared on Medscape.com.
Childhood type 1 diabetes tests suggested at ages 2 and 6
, new data suggest.
Both genetic screening and islet-cell autoantibody screening for type 1 diabetes risk have become less expensive in recent years. Nonetheless, as of now, most children who receive such screening do so through programs that screen relatives of people who already have the condition, such as the global TrialNet program.
Some in the type 1 diabetes field have urged wider screening, with the rationale that knowledge of increased risk can prepare families to recognize the early signs of hyperglycemia and seek medical help to prevent the onset of diabetic ketoacidosis.
Moreover, potential therapies to prevent or delay type 1 diabetes are currently in development, including the anti-CD3 monoclonal antibody teplizumab (Tzield, Provention Bio).
However, given that the incidence of type 1 diabetes is about 1 in 300 children, any population-wide screening program would need to be implemented in the most efficient and cost-effective way possible with limited numbers of tests, say Mohamed Ghalwash, PhD, of the Center for Computational Health, IBM Research, Yorktown Heights, N.Y., and colleagues.
Results from their analysis of nearly 25,000 children from five prospective cohorts in Europe and the United States were published online in Lancet Diabetes & Endocrinology.
Screening in kids feasible, but may need geographic tweaking
“Our results show that initial screening for islet autoantibodies at two ages (2 years and 6 years) is sensitive and efficient for public health translation but might require adjustment by country on the basis of population-specific disease characteristics,” Dr. Ghalwash and colleagues write.
In an accompanying editorial, pediatric endocrinologist Maria J. Redondo, MD, PhD, writes: “This study is timely because recent successes in preventing type 1 diabetes highlight the need to identify the best candidates for intervention ... This paper constitutes an important contribution to the literature.”
However, Dr. Redondo, of Baylor College of Medicine and Texas Children’s Hospital, Houston, also cautioned: “It remains to be seen whether Dr. Ghalwash and colleagues’ strategy could work in the general population, because all the participants in the combined dataset had genetic risk factors for the disease or a relative with type 1 diabetes, in whom performance is expected to be higher.”
She also noted that most participants were of northern European ancestry and that it is unknown whether the same or a similar screening strategy could be applied to individuals older than 15 years, in whom preclinical type 1 diabetes progresses more slowly.
Two-time childhood screening yielded high sensitivity, specificity
The data from a total of 24,662 participants were pooled from five prospective cohorts from Finland (DIPP), Germany (BABYDIAB), Sweden (DiPiS), and the United States (DAISY and DEW-IT).
All were at elevated risk for type 1 diabetes based on human leukocyte antigen (HLA) genotyping, and some had first-degree relatives with the condition. Participants were screened annually for three type 1 diabetes–associated autoantibodies up to age 15 years or the onset of type 1 diabetes.
During follow-up, 672 children developed type 1 diabetes by age 15 years and 6,050 did not. (The rest hadn’t yet reached age 15 years or type 1 diabetes onset.) The median age at first appearance of islet autoantibodies was 4.5 years.
A two-age screening strategy at 2 years and 6 years was more sensitive than screening at just one age, with a sensitivity of 82% and a positive predictive value of 79% for the development of type 1 diabetes by age 15 years.
The predictive value increased with the number of autoantibodies tested. For example, a single islet autoantibody at age 2 years indicated a 4-year risk of developing type 1 diabetes by age 5.99 years of 31%, while multiple antibody positivity at age 2 years carried a 4-year risk of 55%.
By age 6 years, the risk over the next 9 years was 39% if the test had been negative at age 2 years and 70% if the test had been positive at 2 years. But overall, a 6-year-old with multiple autoantibodies had an overall 83% risk of type 1 diabetes regardless of the test result at 2 years.
The predictive performance of sensitivity by age differed by country, suggesting that the optimal ages for autoantibody testing might differ by geographic region, Dr. Ghalwash and colleagues say.
Dr. Redondo commented, “The model might require adaptation to local factors that affect the progression and prevalence of type 1 diabetes.” And, she added, “important aspects, such as screening cost, global access, acceptability, and follow-up support will need to be addressed for this strategy to be a viable public health option.”
The study was funded by JDRF. Dr. Ghalwash and another author are employees of IBM. A third author was a JDRF employee when the research was done and is now an employee of Janssen Research and Development. Dr. Redondo has reported no relevant financial relationships.
A version of this article first appeared on Medscape.com.
FROM LANCET DIABETES & ENDOCRINOLOGY
California will make low-cost insulin, Gov. Newsom says
On July 7, he said he had just signed a state budget that includes $50 million for development of the insulin and another $50 million for a place to make it.
“Nothing, nothing epitomizes market failures more than the cost of insulin,” Gov. Newsom said in a video posted on the governor’s Twitter page. He noted that many Americans have out-of-pocket costs ranging from $300 to $500 per month for insulin, which is used to treat diabetes.
“In California, we know people should not go into debt to receive lifesaving medication,” he said.
Gov. Newsom said that when he first took office, he signed an executive order to launch California’s own prescription drug system and that the insulin initiative is the first step toward making that happen.
People who take insulin have long complained about its high price. A November 2021 report from The Lancet said 25% of the insulin patients in the United States struggle to pay for it.
The cost of insulin for patients with insurance ranges from $334 to $1,000 a month, ABC News said, citing the Kaiser Family Foundation.
Legislation in Congress would bring down the cost of insulin if passed, with one bill capping costs at $35 per month for patients with health insurance. But The Hill reported that some Republicans oppose the legislation because it would interfere with free markets and raise costs for drug companies.
The CDC says 37.3 million people in the United States – about 11.3% of the population – have diabetes, with 8.5 million of them undiagnosed.
A version of this article first appeared on WebMD.com.
Insulin Injection-Site Acanthosis Nigricans: Skin Reactions and Clinical Implications
Insulin injection therapy is one of the most widely used health care interventions to manage both type 1 and type 2 diabetes mellitus (T1DM/T2DM). Globally, more than 150 to 200 million people inject insulin into their upper posterior arms, buttocks, anterior and lateral thighs, or abdomen.1,2 In an ideal world, every patient would be using the correct site and rotating their insulin injection sites in accordance with health care professional (HCP) recommendations—systematic injections in one general body location, at least 1 cm away from the previous injection.2 Unfortunately, same-site insulin injection (repeatedly in the same region within 1 cm of previous injections) is a common mistake made by patients with DM—in one study, 63% of participants either did not rotate sites correctly or failed to do so at all.
Insulin-resistant cutaneous complications may occur as a result of same-site insulin injections. The most common is lipohypertrophy, reported in some studies in nearly 50% of patients with DM on insulin therapy.4 Other common cutaneous complications include lipoatrophy and amyloidosis. Injection-site acanthosis nigricans, although uncommon, has been reported in 18 cases in the literature.
Most articles suggest that same-site insulin injections decrease local insulin sensitivity and result in tissue hypertrophy because of the anabolic properties of insulin and increase in insulin binding to insulin-like growth factor-1 (IGF-1) receptor.5-20 The hyperkeratotic growth and varying insulin absorption rates associated with these cutaneous complications increase chances of either hyper- or hypoglycemic episodes in patients.10,11,13 It is the responsibility of the DM care professional to provide proper insulin-injection technique education and perform routine inspection of injection sites to reduce cutaneous complications of insulin therapy. The purpose of this article is to (1) describe a case of acanthosis nigricans resulting from insulin injection at the same site; (2) review case reports
Case Presentation
A 75-year-old patient with an 8-year history of T2DM, as well as stable coronary artery disease, atrial fibrillation, hypertension, hyperlipidemia, chronic obstructive pulmonary disease, and stage 3 chronic kidney disease, presented with 2 discrete abdominal hyperpigmented plaques. At the time of the initial clinic visit, the patient was taking metformin 1000 mg twice daily and insulin glargine 40 units once daily. When insulin was initiated 7 years prior, the patient received
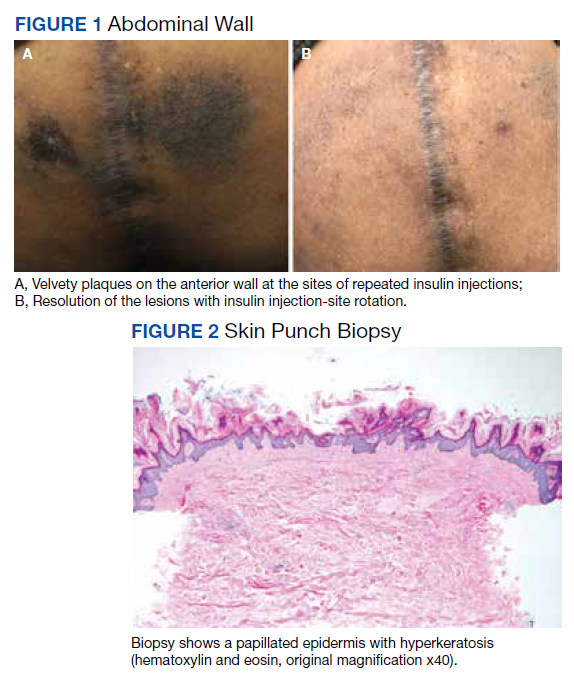
The patient reported 5 years of progressive, asymptomatic hyperpigmentation of the skin surrounding his insulin glargine injection sites and injecting in these same sites daily without rotation. He reported no additional skin changes or symptoms. He had noticed no skin changes while using NPH insulin during his first year of insulin therapy. On examination, the abdominal wall skin demonstrated 2 well-demarcated, nearly black, soft, velvety plaques, measuring 9 × 8 cm on the left side and 4 × 3.5 cm on the right, suggesting acanthosis nigricans (Figure 1A). The remainder of the skin examination, including the flexures, was normal. Of note, the patient received biweekly intramuscular testosterone injections in the gluteal region for secondary hypogonadism with no adverse dermatologic effects. A skin punch biopsy was performed and revealed epidermal papillomatosis and hyperkeratosis, confirming the clinical diagnosis of acanthosis nigricans (Figure 2).
After a review of insulin-injection technique at his clinic visit, the patient started rotating insulin injection sites over his entire abdomen, and the acanthosis nigricans partially improved. A few months later, the patient stopped rotating the insulin injection site, and the acanthosis nigricans worsened again. Because of worsening glycemic control, the patient was then started on insulin aspart. He did not develop any skin changes at the insulin aspart injection site, although he was not rotating its site of injection.
Subsequently, with reeducation and proper injection-site rotation, the patient had resolution of his acanthosis nigricans (Figure 1b).
Discussion
A review of the literature revealed 18 reported cases of acanthosis nigricans at sites of repeated insulin injection (Table).5-20 Acanthosis nigricans at the site of insulin injection afflicts patients of any age, with cases observed in patients aged 14 to 75 years. Sixteen (84%) of 19 cases were male. Fourteen cases (73%) had T2DM; the rest of the patients had T1DM. The duration of insulin injection therapy prior to onset ranged from immediate to 13 years (median 4 years). Fourteen cases (73%) were reported on the abdomen; however, other sites, such as thighs and upper arm, also were reported. Lesions size varied from 12 to 360 cm2. Two cases had associated amyloidosis. The average HbA1c reported at presentation was 10%. Following insulin injection-site rotation, most of the cases reported improvement of both glycemic control and acanthosis nigricans appearance.
In the case described by Kudo and colleagues, a 59-year-old male patient with T2DM had been injecting insulin into the same spot on his abdomen for 10 years. He developed acanthosis nigricans and an amyloidoma so large and firm that it bent the needle when he injected insulin.11
Most of the cases we found in the literature were after 2005 and associated with the use of human or analog insulin. These cases may be related to a bias, as cases may be easier to find in digital archives in the later years, when human or analog insulins have been in common use. Also noteworthy, in cases that reported dosage, most were not very high, and the highest daily dose was 240 IU/d. Ten reports of injection-site acanthosis nigricans were in dermatology journals; only 5 reports were in endocrinology journals and 3 in general medical journals, indicating possible less awareness of this phenomenon in other HCPs who care for patients with DM.
Complications of Same-Site Injections
Acanthosis nigricans. Commonly found in the armpits, neck folds, and groin, acanthosis nigricans is known as one of the calling cards for insulin resistance, obesity, and hyperinsulinemia.21 Acanthosis nigricans can be seen in people with or without DM and is not limited to those on insulin therapy. However, same-site insulin injections for 4 to 6 years also may result in injection-site acanthosis nigricans–like lesions because of factors such as insulin exposure at the local tissue level.16
Acanthosis nigricans development is characterized by hyperpigmented, hyperkeratotic, velvety, and sometimes verrucous plaques.6 Acanthosis nigricans surrounding repeated injection sites is hypothesized to develop as a result of localized hyperinsulinemia secondary to insulin resistance, which increases the stimulation of IGF, thereby causing epidermal hypertrophy.5-20 If insulin injection therapy continues to be administered through the acanthosis nigricans lesion, it results in decreased insulin absorption, leading to poor glycemic control.13
Acanthosis nigricans associated with insulin injection is reversible. After rotation of injection sites, lesions either decrease in size or severity of appearance.5-8,11 Also, by avoiding injection into the hyperkeratotic plaques and using normal subcutaneous tissue for injection, patients’ response to insulin improves, as measured by HbA1c and by decreased daily insulin requirement.6-8,10,12,18-20
Lipohypertrophy. This is characterized by an increase in localized adipose tissue and is the most common cutaneous complication of insulin therapy.2 Lipohypertrophy presents as a firm, rubbery mass in the location of same-site insulin injections.22 Development of lipohypertrophy is suspected to be the result of either (1) anabolic effect of insulin on local adipocytes, promoting fat and protein synthesis; (2) an autoimmune response by immunoglobulin (Ig) G or IgE antibodies to insulin, immune response to insulin of different species, or to insulin injection techniques; or (3) repeated trauma to the injection site from repeated needle usage.4,23
In a study assessing the prevalence of lipohypertrophy and its relation to insulin technique, 49.1% of participants with
Primary prevention measures include injection site inspection and patient education about rotation and abstaining from needle reuse.22 If a patient already has signs of lipohypertrophy, data supports education and insulin injection technique practice as simple and effective means to reduce insulin action variability and increase glycemic control.24
Lipoatrophy. Lipoatrophy is described as a local loss of subcutaneous adipose tissue often in the face, buttocks, legs and arm regions and can be rooted in genetic, immune, or drug-associated etiologies.25 Insulin-induced lipoatrophy is suspected to be the result of tumor necrosis factor-α hyperproduction in reaction to insulin crystal presence at the injection site.26,27 Overall, lipoatrophy development has decreased since the use of recombinant human insulin and analog insulin therapy.28 The decrease is hypothesized to be due to increased subcutaneous tissue absorption rate of human insulin and its analog, decreasing overall adipocyte exposure to localized high insulin concentration.27 Treatments for same-site insulin-derived lipoatrophy include changing injection sites and preparation of insulin.26 When injection into the lipoatrophic site was avoided, glycemic control and lipoatrophy appearance improved.26
Amyloidosis. Amyloidosis indicates the presence of an extracellular bundle of insoluble polymeric protein fibrils in tissues and organs.29 Insulin-induced amyloidosis presents as a hard mass or ball near the injection site.29 Insulin is one of many hormones that can form amyloid fibrils, and there have been several dozen cases reported of amyloid formation at the site of insulin injection.29-31 Although insulin-derived amyloidosis is rare, it may be misdiagnosed as lipohypertrophy due to a lack of histopathologic testing or general awareness of the complication.29
In a case series of 7 patients with amyloidosis, all patients had a mean HbA1c of 9.3% (range, 8.5-10.2%) and averaged 1 IU/kg bodyweight before intervention.30 After the discovery of the mass, participants were instructed to avoid injection into the amyloidoma, and average insulin requirements decreased to 0.48 IU/kg body weight (P = .40).30 Patients with amyloidosis who rotated their injection sites experienced better glycemic control and decreased insulin requirements.30
Pathophysiology of Localized Insulin Resistance
Insulin regulates glucose homeostasis in skeletal muscle and adipose tissue, increases hepatic and adipocyte lipid synthesis, and decreases adipocyte fatty acid release.32 Generalized insulin resistance occurs when target tissues have decreased glucose uptake in response to circulating insulin.32 Insulin resistance increases the amount of free insulin in surrounding tissues. At high concentrations, insulin fosters tissue growth by binding to IGF-1 receptors, stimulating hypertrophy and reproduction of keratinocytes and fibroblasts.33 This pathophysiology helps explain the origin of localized acanthosis nigricans at same-site insulin injections.
Conclusions
Cutaneous complications are a local adverse effect of long-term failure to rotate insulin injection sites. Our case serves as a call to action for HCPs to improve education regarding insulin injection-site rotation, conduct routine injection-site inspection, and actively document cases as they occur to increase public awareness of these important complications.
If a patient with DM presents with unexplained poor glycemic control, consider questioning the patient about injection-site location and how often they are rotating the insulin injection site. Inspect the site for cutaneous complications. Of note, if a patient has a cutaneous complication due to insulin injection, adjust or decrease the insulin dosage when rotating sites to mitigate the risk of hypoglycemic episodes.
Improvement of glycemic control, cosmetic appearance of injection site, and insulin use all begin with skin inspection, injection technique education, and periodic review by a HCP.
1. Foster NC, Beck RW, Miller KM, et al. State of type 1 diabetes management and outcomes from the T1D exchange in 2016-2018. Diabetes Technol Ther. 2019;21(2):66-72. doi:10.1089/dia.2018.0384
2. Frid AH, Kreugel G, Grassi G, et al. New insulin delivery recommendations. Mayo Clin Proc. 2016;91(9):1231-1255. doi:10.1016/j.mayocp.2016.06.010
3. Blanco M, Hernández MT, Strauss KW, Amaya M. Prevalence and risk factors of lipohypertrophy in insulin-injecting patients with diabetes. Diabetes Metab. 2013;39(5):445-453. doi:10.1016/j.diabet.2013.05.006
4. Johansson UB, Amsberg S, Hannerz L, et al. Impaired absorption of insulin aspart from lipohypertrophic injection sites. Diabetes Care. 2005;28(8):2025-2027. doi:10.2337/diacare.28.8.2025
5. Erickson L, Lipschutz DE, Wrigley W, Kearse WO. A peculiar cutaneous reaction to repeated injections of insulin. JAMA. 1969;209(6):934-935. doi:10.1001/jama.1969.03160190056019
6. Fleming MG, Simon SI. Cutaneous insulin reaction resembling acanthosis nigricans. Arch Dermatol. 1986;122(9):1054-1056. doi:10.1001/archderm.1986.01660210104028 7. Gannon D, Ross MW, Mahajan T. Acanthosis nigricans-like plaque and lipohypertrophy in type 1 diabetes. Pract Diabetes International. 2005;22(6).
8. Mailler-Savage EA, Adams BB. Exogenous insulin-derived acanthosis nigricans. Arch Dermatol. 2008;144(1):126-127. doi:10.1001/archdermatol.2007.27
9. Pachón Burgos A, Chan Aguilar MP. Visual vignette. Hyperpigmented hyperkeratotic cutaneous insulin reaction that resembles acanthosis nigricans with lipohypertrophy. Endocr Pract. 2008;14(4):514. doi:10.4158/EP.14.4.514
10. Buzási K, Sápi Z, Jermendy G. Acanthosis nigricans as a local cutaneous side effect of repeated human insulin injections. Diabetes Res Clin Pract. 2011;94(2):e34-e36. doi:10.1016/j.diabres.2011.07.023
11. Kudo-Watanuki S, Kurihara E, Yamamoto K, Mukai K, Chen KR. Coexistence of insulin-derived amyloidosis and an overlying acanthosis nigricans-like lesion at the site of insulin injection. Clin Exp Dermatol. 2012;38(1):25-29. doi:10.1111/j.1365-2230.2012.04373.x
12. Brodell JD Jr, Cannella JD, Helms SE. Case report: acanthosis nigricans resulting from repetitive same-site insulin injections. J Drugs Dermatol. 2012;11(12):e85-e87.
13. Kanwar A, Sawatkar G, Dogra S, Bhadada S. Acanthosis nigricans—an uncommon cutaneous adverse effect of a common medication: report of two cases. Indian J Dermatol Venereol Leprol. 2013;79(4):553. doi:10.4103/0378-6323.113112
14. Dhingra M, Garg G, Gupta M, Khurana U, Thami GP. Exogenous insulin-derived acanthosis nigricans: could it be a cause of increased insulin requirement? Dermatol Online J. 2013;19(1):9. Published 2013 Jan 15.
15. Nandeesh BN, Rajalakshmi T, Shubha B. Cutaneous amyloidosis and insulin with coexistence of acanthosis nigricans. Indian J Pathol Microbiol. 2014;57(1):127-129. doi:10.4103/0377-4929.130920
16. Yahagi E, Mabuchi T, Nuruki H, et al. Case of exogenous insulin-derived acanthosis nigricans caused by insulin injections. Tokai J Exp Clin Med. 2014;39(1):5-9.
17. Chapman SE, Bandino JP. A verrucous plaque on the abdomen: challenge. Am J Dermatopathol. 2017;39(12):e163. doi:10.1097/DAD.0000000000000659
18. Huang Y, Hessami-Booshehri M. Acanthosis nigricans at sites of insulin injection in a man with diabetes. CMAJ. 2018;190(47):E1390. doi:10.1503/cmaj.180705
19. Pal R, Bhattacharjee R, Chatterjee D, Bhadada SK, Bhansali A, Dutta P. Exogenous insulin-induced localized acanthosis nigricans: a rare injection site complication. Can J Diabetes. 2020;44(3):219-221. doi:10.1016/j.jcjd.2019.08.010
20. Bomar L, Lewallen R, Jorizzo J. Localized acanthosis nigricans at the site of repetitive insulin injections. Cutis. 2020;105(2);E20-E22.
21. Karadağ AS, You Y, Danarti R, Al-Khuzaei S, Chen W. Acanthosis nigricans and the metabolic syndrome. Clin Dermatol. 2018;36(1):48-53. doi:10.1016/j.clindermatol.2017.09.008
22. Kalra S, Kumar A, Gupta Y. Prevention of lipohypertrophy. J Pak Med Assoc. 2016;66(7):910-911.
23. Singha A, Bhattarcharjee R, Ghosh S, Chakrabarti SK, Baidya A, Chowdhury S. Concurrence of lipoatrophy and lipohypertrophy in children with type 1 diabetes using recombinant human insulin: two case reports. Clin Diabetes. 2016;34(1):51-53. doi:10.2337/diaclin.34.1.51
24. Famulla S, Hövelmann U, Fischer A, et al. Insulin injection into lipohypertrophic tissue: blunted and more variable insulin absorption and action and impaired postprandial glucose control. Diabetes Care. 2016;39(9):1486-1492. doi:10.2337/dc16-0610.
25. Reitman ML, Arioglu E, Gavrilova O, Taylor SI. Lipoatrophy revisited. Trends Endocrinol Metab. 2000;11(10):410-416. doi:10.1016/s1043-2760(00)00309-x
26. Kondo A, Nakamura A, Takeuchi J, Miyoshi H, Atsumi T. Insulin-Induced Distant Site Lipoatrophy. Diabetes Care. 2017;40(6):e67-e68. doi:10.2337/dc16-2385
27. Jermendy G, Nádas J, Sápi Z. “Lipoblastoma-like” lipoatrophy induced by human insulin: morphological evidence for local dedifferentiation of adipocytes?. Diabetologia. 2000;43(7):955-956. doi:10.1007/s001250051476
28. Mokta JK, Mokta KK, Panda P. Insulin lipodystrophy and lipohypertrophy. Indian J Endocrinol Metab. 2013;17(4):773-774. doi:10.4103/2230-8210.113788
29. Gupta Y, Singla G, Singla R. Insulin-derived amyloidosis. Indian J Endocrinol Metab. 2015;19(1):174-177. doi:10.4103/2230-8210.146879
30. Nagase T, Iwaya K, Iwaki Y, et al. Insulin-derived amyloidosis and poor glycemic control: a case series. Am J Med. 2014;127(5):450-454. doi:10.1016/j.amjmed.2013.10.029
31. Swift B. Examination of insulin injection sites: an unexpected finding of localized amyloidosis. Diabet Med. 2002;19(10):881-882. doi:10.1046/j.1464-5491.2002.07581.x
32. Sesti G. Pathophysiology of insulin resistance. Best Pract Res Clin Endocrinol Metab. 2006;20(4):665-679. doi:10.1016/j.beem.2006.09.007
33. Phiske MM. An approach to acanthosis nigricans. Indian Dermatol Online J. 2014;5(3):239-249. doi:10.4103/2229-5178.137765
Insulin injection therapy is one of the most widely used health care interventions to manage both type 1 and type 2 diabetes mellitus (T1DM/T2DM). Globally, more than 150 to 200 million people inject insulin into their upper posterior arms, buttocks, anterior and lateral thighs, or abdomen.1,2 In an ideal world, every patient would be using the correct site and rotating their insulin injection sites in accordance with health care professional (HCP) recommendations—systematic injections in one general body location, at least 1 cm away from the previous injection.2 Unfortunately, same-site insulin injection (repeatedly in the same region within 1 cm of previous injections) is a common mistake made by patients with DM—in one study, 63% of participants either did not rotate sites correctly or failed to do so at all.
Insulin-resistant cutaneous complications may occur as a result of same-site insulin injections. The most common is lipohypertrophy, reported in some studies in nearly 50% of patients with DM on insulin therapy.4 Other common cutaneous complications include lipoatrophy and amyloidosis. Injection-site acanthosis nigricans, although uncommon, has been reported in 18 cases in the literature.
Most articles suggest that same-site insulin injections decrease local insulin sensitivity and result in tissue hypertrophy because of the anabolic properties of insulin and increase in insulin binding to insulin-like growth factor-1 (IGF-1) receptor.5-20 The hyperkeratotic growth and varying insulin absorption rates associated with these cutaneous complications increase chances of either hyper- or hypoglycemic episodes in patients.10,11,13 It is the responsibility of the DM care professional to provide proper insulin-injection technique education and perform routine inspection of injection sites to reduce cutaneous complications of insulin therapy. The purpose of this article is to (1) describe a case of acanthosis nigricans resulting from insulin injection at the same site; (2) review case reports
Case Presentation
A 75-year-old patient with an 8-year history of T2DM, as well as stable coronary artery disease, atrial fibrillation, hypertension, hyperlipidemia, chronic obstructive pulmonary disease, and stage 3 chronic kidney disease, presented with 2 discrete abdominal hyperpigmented plaques. At the time of the initial clinic visit, the patient was taking metformin 1000 mg twice daily and insulin glargine 40 units once daily. When insulin was initiated 7 years prior, the patient received
The patient reported 5 years of progressive, asymptomatic hyperpigmentation of the skin surrounding his insulin glargine injection sites and injecting in these same sites daily without rotation. He reported no additional skin changes or symptoms. He had noticed no skin changes while using NPH insulin during his first year of insulin therapy. On examination, the abdominal wall skin demonstrated 2 well-demarcated, nearly black, soft, velvety plaques, measuring 9 × 8 cm on the left side and 4 × 3.5 cm on the right, suggesting acanthosis nigricans (Figure 1A). The remainder of the skin examination, including the flexures, was normal. Of note, the patient received biweekly intramuscular testosterone injections in the gluteal region for secondary hypogonadism with no adverse dermatologic effects. A skin punch biopsy was performed and revealed epidermal papillomatosis and hyperkeratosis, confirming the clinical diagnosis of acanthosis nigricans (Figure 2).
After a review of insulin-injection technique at his clinic visit, the patient started rotating insulin injection sites over his entire abdomen, and the acanthosis nigricans partially improved. A few months later, the patient stopped rotating the insulin injection site, and the acanthosis nigricans worsened again. Because of worsening glycemic control, the patient was then started on insulin aspart. He did not develop any skin changes at the insulin aspart injection site, although he was not rotating its site of injection.
Subsequently, with reeducation and proper injection-site rotation, the patient had resolution of his acanthosis nigricans (Figure 1b).
Discussion
A review of the literature revealed 18 reported cases of acanthosis nigricans at sites of repeated insulin injection (Table).5-20 Acanthosis nigricans at the site of insulin injection afflicts patients of any age, with cases observed in patients aged 14 to 75 years. Sixteen (84%) of 19 cases were male. Fourteen cases (73%) had T2DM; the rest of the patients had T1DM. The duration of insulin injection therapy prior to onset ranged from immediate to 13 years (median 4 years). Fourteen cases (73%) were reported on the abdomen; however, other sites, such as thighs and upper arm, also were reported. Lesions size varied from 12 to 360 cm2. Two cases had associated amyloidosis. The average HbA1c reported at presentation was 10%. Following insulin injection-site rotation, most of the cases reported improvement of both glycemic control and acanthosis nigricans appearance.
In the case described by Kudo and colleagues, a 59-year-old male patient with T2DM had been injecting insulin into the same spot on his abdomen for 10 years. He developed acanthosis nigricans and an amyloidoma so large and firm that it bent the needle when he injected insulin.11
Most of the cases we found in the literature were after 2005 and associated with the use of human or analog insulin. These cases may be related to a bias, as cases may be easier to find in digital archives in the later years, when human or analog insulins have been in common use. Also noteworthy, in cases that reported dosage, most were not very high, and the highest daily dose was 240 IU/d. Ten reports of injection-site acanthosis nigricans were in dermatology journals; only 5 reports were in endocrinology journals and 3 in general medical journals, indicating possible less awareness of this phenomenon in other HCPs who care for patients with DM.
Complications of Same-Site Injections
Acanthosis nigricans. Commonly found in the armpits, neck folds, and groin, acanthosis nigricans is known as one of the calling cards for insulin resistance, obesity, and hyperinsulinemia.21 Acanthosis nigricans can be seen in people with or without DM and is not limited to those on insulin therapy. However, same-site insulin injections for 4 to 6 years also may result in injection-site acanthosis nigricans–like lesions because of factors such as insulin exposure at the local tissue level.16
Acanthosis nigricans development is characterized by hyperpigmented, hyperkeratotic, velvety, and sometimes verrucous plaques.6 Acanthosis nigricans surrounding repeated injection sites is hypothesized to develop as a result of localized hyperinsulinemia secondary to insulin resistance, which increases the stimulation of IGF, thereby causing epidermal hypertrophy.5-20 If insulin injection therapy continues to be administered through the acanthosis nigricans lesion, it results in decreased insulin absorption, leading to poor glycemic control.13
Acanthosis nigricans associated with insulin injection is reversible. After rotation of injection sites, lesions either decrease in size or severity of appearance.5-8,11 Also, by avoiding injection into the hyperkeratotic plaques and using normal subcutaneous tissue for injection, patients’ response to insulin improves, as measured by HbA1c and by decreased daily insulin requirement.6-8,10,12,18-20
Lipohypertrophy. This is characterized by an increase in localized adipose tissue and is the most common cutaneous complication of insulin therapy.2 Lipohypertrophy presents as a firm, rubbery mass in the location of same-site insulin injections.22 Development of lipohypertrophy is suspected to be the result of either (1) anabolic effect of insulin on local adipocytes, promoting fat and protein synthesis; (2) an autoimmune response by immunoglobulin (Ig) G or IgE antibodies to insulin, immune response to insulin of different species, or to insulin injection techniques; or (3) repeated trauma to the injection site from repeated needle usage.4,23
In a study assessing the prevalence of lipohypertrophy and its relation to insulin technique, 49.1% of participants with
Primary prevention measures include injection site inspection and patient education about rotation and abstaining from needle reuse.22 If a patient already has signs of lipohypertrophy, data supports education and insulin injection technique practice as simple and effective means to reduce insulin action variability and increase glycemic control.24
Lipoatrophy. Lipoatrophy is described as a local loss of subcutaneous adipose tissue often in the face, buttocks, legs and arm regions and can be rooted in genetic, immune, or drug-associated etiologies.25 Insulin-induced lipoatrophy is suspected to be the result of tumor necrosis factor-α hyperproduction in reaction to insulin crystal presence at the injection site.26,27 Overall, lipoatrophy development has decreased since the use of recombinant human insulin and analog insulin therapy.28 The decrease is hypothesized to be due to increased subcutaneous tissue absorption rate of human insulin and its analog, decreasing overall adipocyte exposure to localized high insulin concentration.27 Treatments for same-site insulin-derived lipoatrophy include changing injection sites and preparation of insulin.26 When injection into the lipoatrophic site was avoided, glycemic control and lipoatrophy appearance improved.26
Amyloidosis. Amyloidosis indicates the presence of an extracellular bundle of insoluble polymeric protein fibrils in tissues and organs.29 Insulin-induced amyloidosis presents as a hard mass or ball near the injection site.29 Insulin is one of many hormones that can form amyloid fibrils, and there have been several dozen cases reported of amyloid formation at the site of insulin injection.29-31 Although insulin-derived amyloidosis is rare, it may be misdiagnosed as lipohypertrophy due to a lack of histopathologic testing or general awareness of the complication.29
In a case series of 7 patients with amyloidosis, all patients had a mean HbA1c of 9.3% (range, 8.5-10.2%) and averaged 1 IU/kg bodyweight before intervention.30 After the discovery of the mass, participants were instructed to avoid injection into the amyloidoma, and average insulin requirements decreased to 0.48 IU/kg body weight (P = .40).30 Patients with amyloidosis who rotated their injection sites experienced better glycemic control and decreased insulin requirements.30
Pathophysiology of Localized Insulin Resistance
Insulin regulates glucose homeostasis in skeletal muscle and adipose tissue, increases hepatic and adipocyte lipid synthesis, and decreases adipocyte fatty acid release.32 Generalized insulin resistance occurs when target tissues have decreased glucose uptake in response to circulating insulin.32 Insulin resistance increases the amount of free insulin in surrounding tissues. At high concentrations, insulin fosters tissue growth by binding to IGF-1 receptors, stimulating hypertrophy and reproduction of keratinocytes and fibroblasts.33 This pathophysiology helps explain the origin of localized acanthosis nigricans at same-site insulin injections.
Conclusions
Cutaneous complications are a local adverse effect of long-term failure to rotate insulin injection sites. Our case serves as a call to action for HCPs to improve education regarding insulin injection-site rotation, conduct routine injection-site inspection, and actively document cases as they occur to increase public awareness of these important complications.
If a patient with DM presents with unexplained poor glycemic control, consider questioning the patient about injection-site location and how often they are rotating the insulin injection site. Inspect the site for cutaneous complications. Of note, if a patient has a cutaneous complication due to insulin injection, adjust or decrease the insulin dosage when rotating sites to mitigate the risk of hypoglycemic episodes.
Improvement of glycemic control, cosmetic appearance of injection site, and insulin use all begin with skin inspection, injection technique education, and periodic review by a HCP.
1. Foster NC, Beck RW, Miller KM, et al. State of type 1 diabetes management and outcomes from the T1D exchange in 2016-2018. Diabetes Technol Ther. 2019;21(2):66-72. doi:10.1089/dia.2018.0384
2. Frid AH, Kreugel G, Grassi G, et al. New insulin delivery recommendations. Mayo Clin Proc. 2016;91(9):1231-1255. doi:10.1016/j.mayocp.2016.06.010
3. Blanco M, Hernández MT, Strauss KW, Amaya M. Prevalence and risk factors of lipohypertrophy in insulin-injecting patients with diabetes. Diabetes Metab. 2013;39(5):445-453. doi:10.1016/j.diabet.2013.05.006
4. Johansson UB, Amsberg S, Hannerz L, et al. Impaired absorption of insulin aspart from lipohypertrophic injection sites. Diabetes Care. 2005;28(8):2025-2027. doi:10.2337/diacare.28.8.2025
5. Erickson L, Lipschutz DE, Wrigley W, Kearse WO. A peculiar cutaneous reaction to repeated injections of insulin. JAMA. 1969;209(6):934-935. doi:10.1001/jama.1969.03160190056019
6. Fleming MG, Simon SI. Cutaneous insulin reaction resembling acanthosis nigricans. Arch Dermatol. 1986;122(9):1054-1056. doi:10.1001/archderm.1986.01660210104028 7. Gannon D, Ross MW, Mahajan T. Acanthosis nigricans-like plaque and lipohypertrophy in type 1 diabetes. Pract Diabetes International. 2005;22(6).
8. Mailler-Savage EA, Adams BB. Exogenous insulin-derived acanthosis nigricans. Arch Dermatol. 2008;144(1):126-127. doi:10.1001/archdermatol.2007.27
9. Pachón Burgos A, Chan Aguilar MP. Visual vignette. Hyperpigmented hyperkeratotic cutaneous insulin reaction that resembles acanthosis nigricans with lipohypertrophy. Endocr Pract. 2008;14(4):514. doi:10.4158/EP.14.4.514
10. Buzási K, Sápi Z, Jermendy G. Acanthosis nigricans as a local cutaneous side effect of repeated human insulin injections. Diabetes Res Clin Pract. 2011;94(2):e34-e36. doi:10.1016/j.diabres.2011.07.023
11. Kudo-Watanuki S, Kurihara E, Yamamoto K, Mukai K, Chen KR. Coexistence of insulin-derived amyloidosis and an overlying acanthosis nigricans-like lesion at the site of insulin injection. Clin Exp Dermatol. 2012;38(1):25-29. doi:10.1111/j.1365-2230.2012.04373.x
12. Brodell JD Jr, Cannella JD, Helms SE. Case report: acanthosis nigricans resulting from repetitive same-site insulin injections. J Drugs Dermatol. 2012;11(12):e85-e87.
13. Kanwar A, Sawatkar G, Dogra S, Bhadada S. Acanthosis nigricans—an uncommon cutaneous adverse effect of a common medication: report of two cases. Indian J Dermatol Venereol Leprol. 2013;79(4):553. doi:10.4103/0378-6323.113112
14. Dhingra M, Garg G, Gupta M, Khurana U, Thami GP. Exogenous insulin-derived acanthosis nigricans: could it be a cause of increased insulin requirement? Dermatol Online J. 2013;19(1):9. Published 2013 Jan 15.
15. Nandeesh BN, Rajalakshmi T, Shubha B. Cutaneous amyloidosis and insulin with coexistence of acanthosis nigricans. Indian J Pathol Microbiol. 2014;57(1):127-129. doi:10.4103/0377-4929.130920
16. Yahagi E, Mabuchi T, Nuruki H, et al. Case of exogenous insulin-derived acanthosis nigricans caused by insulin injections. Tokai J Exp Clin Med. 2014;39(1):5-9.
17. Chapman SE, Bandino JP. A verrucous plaque on the abdomen: challenge. Am J Dermatopathol. 2017;39(12):e163. doi:10.1097/DAD.0000000000000659
18. Huang Y, Hessami-Booshehri M. Acanthosis nigricans at sites of insulin injection in a man with diabetes. CMAJ. 2018;190(47):E1390. doi:10.1503/cmaj.180705
19. Pal R, Bhattacharjee R, Chatterjee D, Bhadada SK, Bhansali A, Dutta P. Exogenous insulin-induced localized acanthosis nigricans: a rare injection site complication. Can J Diabetes. 2020;44(3):219-221. doi:10.1016/j.jcjd.2019.08.010
20. Bomar L, Lewallen R, Jorizzo J. Localized acanthosis nigricans at the site of repetitive insulin injections. Cutis. 2020;105(2);E20-E22.
21. Karadağ AS, You Y, Danarti R, Al-Khuzaei S, Chen W. Acanthosis nigricans and the metabolic syndrome. Clin Dermatol. 2018;36(1):48-53. doi:10.1016/j.clindermatol.2017.09.008
22. Kalra S, Kumar A, Gupta Y. Prevention of lipohypertrophy. J Pak Med Assoc. 2016;66(7):910-911.
23. Singha A, Bhattarcharjee R, Ghosh S, Chakrabarti SK, Baidya A, Chowdhury S. Concurrence of lipoatrophy and lipohypertrophy in children with type 1 diabetes using recombinant human insulin: two case reports. Clin Diabetes. 2016;34(1):51-53. doi:10.2337/diaclin.34.1.51
24. Famulla S, Hövelmann U, Fischer A, et al. Insulin injection into lipohypertrophic tissue: blunted and more variable insulin absorption and action and impaired postprandial glucose control. Diabetes Care. 2016;39(9):1486-1492. doi:10.2337/dc16-0610.
25. Reitman ML, Arioglu E, Gavrilova O, Taylor SI. Lipoatrophy revisited. Trends Endocrinol Metab. 2000;11(10):410-416. doi:10.1016/s1043-2760(00)00309-x
26. Kondo A, Nakamura A, Takeuchi J, Miyoshi H, Atsumi T. Insulin-Induced Distant Site Lipoatrophy. Diabetes Care. 2017;40(6):e67-e68. doi:10.2337/dc16-2385
27. Jermendy G, Nádas J, Sápi Z. “Lipoblastoma-like” lipoatrophy induced by human insulin: morphological evidence for local dedifferentiation of adipocytes?. Diabetologia. 2000;43(7):955-956. doi:10.1007/s001250051476
28. Mokta JK, Mokta KK, Panda P. Insulin lipodystrophy and lipohypertrophy. Indian J Endocrinol Metab. 2013;17(4):773-774. doi:10.4103/2230-8210.113788
29. Gupta Y, Singla G, Singla R. Insulin-derived amyloidosis. Indian J Endocrinol Metab. 2015;19(1):174-177. doi:10.4103/2230-8210.146879
30. Nagase T, Iwaya K, Iwaki Y, et al. Insulin-derived amyloidosis and poor glycemic control: a case series. Am J Med. 2014;127(5):450-454. doi:10.1016/j.amjmed.2013.10.029
31. Swift B. Examination of insulin injection sites: an unexpected finding of localized amyloidosis. Diabet Med. 2002;19(10):881-882. doi:10.1046/j.1464-5491.2002.07581.x
32. Sesti G. Pathophysiology of insulin resistance. Best Pract Res Clin Endocrinol Metab. 2006;20(4):665-679. doi:10.1016/j.beem.2006.09.007
33. Phiske MM. An approach to acanthosis nigricans. Indian Dermatol Online J. 2014;5(3):239-249. doi:10.4103/2229-5178.137765
‘Not their fault:’ Obesity warrants long-term management
This transcript has been edited for clarity.
It’s important to remember and to think about the first time when patients with obesity come to see us: What have they faced? What have been their struggles? What shame and blame and bias have they faced?
One of the first things that I do when a patient comes to see me is invite them to share their weight journey with me. I ask them to tell me about their struggles, about what’s worked and what hasn’t worked, what they would like, and what their health goals are.
As they share their stories, I look for the opportunity to share with them that obesity is not their fault, but that it’s biology driving their body to carry extra weight and their body is super smart. Neither their body nor their brain want them to starve.
Our bodies evolved during a time where there was food scarcity and the potential of famine. We have a complex system that was designed to make sure that we always held on to extra weight, specifically extra fat, because that’s how we store energy. In the current obesogenic environment, what happens is our bodies carry extra weight, or specifically, extra fat.
Again, I say to them, this is biology. Your body’s doing exactly what it was designed to do. Your body’s very smart, but now we have to figure out how to help your body want to carry less fat because it is impacting your health. This is not your fault. Having obesity is not your fault any more than having diabetes or hypertension is anyone’s fault. Now it’s time for all of us to use highly effective tools that target the pathophysiology of obesity.
When a patient comes to me for weight management or to help them treat their obesity, I listen to them, and I look for clues as to what might help that specific patient. Every patient deserves to have individualized treatment. One medicine may be right for one person, another medicine may be right for another, and surgery may be right for another patient. I really try to listen and hear what that patient is telling me.
What we as providers really need is tools – different options – to be able to provide for our patients and basically present them with different options, and then guide them toward the best therapy for them. Whether it’s semaglutide or tirzepatide potentially in the future, these types of medications are excellent options for our patients. They’re highly effective tools with safe profiles.
A question that I often get from providers or patients is, “Well, Doctor, I’ve lost the weight now. How long should I take this medicine? Can I stop it now?”
Then, we have a conversation, and we actually usually have this conversation even before we start the medicine. Basically, we talk about the fact that obesity is a chronic disease. There’s no cure for obesity. Because it’s a chronic disease, we need to treat it like we would treat any other chronic disease.
The example that I often use is, if you have a patient who has hypertension and you start them on an antihypertensive medication, what happens? Their blood pressure goes down. It improves. Now, if their blood pressure is improved with a specific antihypertensive, would you stop that medicine? What would happen if you stopped that antihypertensive? Well, their blood pressure would go up, and we wouldn’t be surprised.
In the same way, if you have a patient who has obesity and you start that patient on an antiobesity medication, and their weight decreases, and their body fat mass at that point decreases, what would happen if you stop that medicine? They lost the weight, but you stop the medicine. Well, their weight gain comes back. They regain the weight.
We should not be surprised that weight gain occurs when we stop the treatment. That really underscores the fact that treatment needs to be continued. If a patient is started on an antiobesity medication and they lose weight, that medication needs to be continued to maintain that weight loss.
Basically, we eat food and our body responds by releasing these hormones. The hormones are made in our gut and in our pancreas and these hormones inform our brain. Are we hungry? Are we full? Where are we with our homeostatic set point of fat mass? Based on that, our brain is like the sensor or the thermostat.
Obesity is a chronic, treatable disease. We should treat obesity as we treat any other chronic disease, with effective and safe approaches that target underlying disease mechanisms. These results in the SURMOUNT-1 trial underscore that tirzepatide may be doing just that. Remarkably, 9 in 10 individuals with obesity lost weight while taking tirzepatide. These results are impressive. They’re an important step forward in potentially expanding effective therapeutic options for people with obesity.
Dr. Jastreboff is an associate professor of medicine and pediatrics at Yale University, New Haven, Conn., and director of weight management and obesity prevention at Yale Stress Center. She reported conducting trials with Eli Lilly, Novo Nordisk, and Rhythm Pharmaceuticals; serving on scientific advisory boards for Ely Lilly, Intellihealth, Novo Nordisk, Pfizer, Rhythm Pharmaceuticals, and WW; and consulting for Boehringer Ingelheim and Scholar Rock.
A version of this article first appeared on Medscape.com.

Menstrual phase impacts exercise effects in type 1 diabetes
Women with type 1 diabetes may need additional glucose after exercise during the luteal phase of the menstrual cycle, compared with other times, according to a study in nine women.
“We know that exercise is very beneficial for people with type 1 diabetes; we also know that fear of hypoglycemia is a major barrier to exercise in this population,” said Jane E. Yardley, PhD, in a presentation at the annual scientific sessions of the American Diabetes Association, New Orleans. Women with type 1 diabetes (T1D) perceive more barriers, compared with men, she added.
The menstrual cycle could be an additional barrier to exercise for women with T1D because it increases glucose fluctuations that have not been well documented in the literature to date, said Dr. Yardley, of the University of Alberta, Augustana.
The follicular phase of the menstrual cycle lasts from menses to the midcycle, about 14 days later. This is followed by the luteal phase, which lasts until approximately day 28, Dr. Yardley explained. Data on insulin sensitivity have shown that the late luteal phase is associated with “a little less insulin sensitivity” in women with T1D, she noted.
To assess the relationship between menstrual cycle, glucose control, and exercise, Dr. Yardley and colleagues compared the effects of a moderate aerobic exercise on glycemic responses between the early follicular and late luteal phases of the menstrual cycle in nine female participants with T1D.
The exercise involved 45 minutes of aerobic cycling at 50% of predetermined peak oxygen uptake (VO2peak) for 45 min. The mean age of the participants was 30.2 years, the mean hemoglobin A1C was 7.4%, and the mean VO2peak was 32.5 mL/kg per min. The women reported regular menstrual cycles, and none were using oral contraceptives.
Blood samples were collected before and immediately after exercise and after an hour of recovery. Participants wore continuous glucose monitors for at least 1 hour before and after exercise.
Menstrual cycle was confirmed via estrogen, estradiol, and progesterone.
Insulin levels varied greatly among the study participants, but the differences were not significant, Dr. Yardley said. Glucose levels consistently decreased during exercise and increased after exercise, she noted.
No significant difference in glucose was observed between the follicular and luteal phases.
However, “this needs to be interpreted in the context of the safety profiles that are in place in our lab,” which include carbohydrate supplements for individuals whose blood glucose levels drop below 4.5 mmol/L, she said.
In the current study, 6 of 9 participants required additional carbohydrates during the luteal phase, but only 1 participant needed additional carbohydrates during the follicular phase, she noted. For this reason, no differences were noted. “We actually prevented changes,” she said.
No significant differences were noted in mean glucose levels or number of hypoglycemic episodes at any of the time points between the two phases.
“One place where we did see a difference was in hyperglycemia 24 hours after exercise,” Dr. Yardley said. Level 1 hyperglycemia 24 hours after exercise was significantly more frequent in the follicular phase, compared with the luteal phase (P = .028).
The study findings were limited by the small sample size and homogenous population, and more research is needed to interpret the data, said Dr. Yardley.
However, the need for more glucose supplementation to prevent hypoglycemia during the luteal phase suggests a higher hypoglycemic risk associated with aerobic exercise during this time, she said.
In addition, the results suggest that the menstrual cycle should be taken into consideration when female participants are involved in exercise studies, she noted.
Study supports personalized exercise plans
“It is important to evaluate effects of exercise in people with type 1 diabetes and evaluate whether there is a difference those effects in men and women,” said Helena W. Rodbard, MD, an endocrinologist in private practice in Rockville, Md., in an interview. “There is also a need to evaluate to what extent the changes in blood glucose patterns in women in response to exercise differ depending on the phase of the ovarian cycle,” said Dr. Rodbard, who was not involved in the study.

In the current study, “the researchers observed a decline in glucose during a 45-minute period of moderate aerobic exercise, cycling at 50% VO2peak followed by an increase during a 60-minute recovery period. There was a suggestive finding, in the nine subjects, that more carbohydrate supplementation was needed during the late luteal phase of the menstrual cycle than during the follicular phase,” Dr. Rodbard noted. “In contrast, the authors reported a significantly increased degree of hyperglycemia during the recovery phase for subjects during the follicular phase. These findings are consistent with and extend several recent studies from Dr. Yardley and coworkers, who have been focused on this area of research,” she said.
“This study provides provocative evidence that glucose responses to aerobic exercise in women may depend on the timing in relationship to their ovarian cycle,” said Dr. Rodbard. “These findings are based on a small group of subjects and were present in some but not all subjects. Clinicians should encourage women to evaluate and record their experiences during and after exercise in terms of need for carbohydrate supplementation for documented or symptomatic hypoglycemia and in terms of glucose changes as recorded using continuous glucose monitoring (CGM), both in relation to type of exercise and in relation to time in the menstrual cycle,” she said.
The findings also highlight the importance of individualized therapy that is “based on subjective inputs combined with analysis of CGM data during and following exercise,” said Dr. Rodbard. “It is likely that use of Automated Insulin Delivery (AID) will be helpful in achieving this level of individualization in view of the wide range of types, intensity, and duration of physical activity and exercise in which people with T1D engage and the myriad factors that can influence the glycemic response,” she said.
Looking ahead, “the authors and others should expand the present series of subjects using aerobic exercise and examine other types of exercise as well,” Dr. Rodbard noted. “It will be important to evaluate the consistency of these changes in glucose patterns within individuals on multiple occasions, and it would be helpful to repeat the studies in women using oral contraceptives.”
Dr. Yardley disclosed research support from Abbott, Dexcom, and LifeScan and disclosed serving on the speaker’s bureau for Abbott Diabetes. Dr. Rodbard had no financial conflicts to disclose. She serves on the Editorial Advisory Board of Clinical Endocrinology News.
Women with type 1 diabetes may need additional glucose after exercise during the luteal phase of the menstrual cycle, compared with other times, according to a study in nine women.
“We know that exercise is very beneficial for people with type 1 diabetes; we also know that fear of hypoglycemia is a major barrier to exercise in this population,” said Jane E. Yardley, PhD, in a presentation at the annual scientific sessions of the American Diabetes Association, New Orleans. Women with type 1 diabetes (T1D) perceive more barriers, compared with men, she added.
The menstrual cycle could be an additional barrier to exercise for women with T1D because it increases glucose fluctuations that have not been well documented in the literature to date, said Dr. Yardley, of the University of Alberta, Augustana.
The follicular phase of the menstrual cycle lasts from menses to the midcycle, about 14 days later. This is followed by the luteal phase, which lasts until approximately day 28, Dr. Yardley explained. Data on insulin sensitivity have shown that the late luteal phase is associated with “a little less insulin sensitivity” in women with T1D, she noted.
To assess the relationship between menstrual cycle, glucose control, and exercise, Dr. Yardley and colleagues compared the effects of a moderate aerobic exercise on glycemic responses between the early follicular and late luteal phases of the menstrual cycle in nine female participants with T1D.
The exercise involved 45 minutes of aerobic cycling at 50% of predetermined peak oxygen uptake (VO2peak) for 45 min. The mean age of the participants was 30.2 years, the mean hemoglobin A1C was 7.4%, and the mean VO2peak was 32.5 mL/kg per min. The women reported regular menstrual cycles, and none were using oral contraceptives.
Blood samples were collected before and immediately after exercise and after an hour of recovery. Participants wore continuous glucose monitors for at least 1 hour before and after exercise.
Menstrual cycle was confirmed via estrogen, estradiol, and progesterone.
Insulin levels varied greatly among the study participants, but the differences were not significant, Dr. Yardley said. Glucose levels consistently decreased during exercise and increased after exercise, she noted.
No significant difference in glucose was observed between the follicular and luteal phases.
However, “this needs to be interpreted in the context of the safety profiles that are in place in our lab,” which include carbohydrate supplements for individuals whose blood glucose levels drop below 4.5 mmol/L, she said.
In the current study, 6 of 9 participants required additional carbohydrates during the luteal phase, but only 1 participant needed additional carbohydrates during the follicular phase, she noted. For this reason, no differences were noted. “We actually prevented changes,” she said.
No significant differences were noted in mean glucose levels or number of hypoglycemic episodes at any of the time points between the two phases.
“One place where we did see a difference was in hyperglycemia 24 hours after exercise,” Dr. Yardley said. Level 1 hyperglycemia 24 hours after exercise was significantly more frequent in the follicular phase, compared with the luteal phase (P = .028).
The study findings were limited by the small sample size and homogenous population, and more research is needed to interpret the data, said Dr. Yardley.
However, the need for more glucose supplementation to prevent hypoglycemia during the luteal phase suggests a higher hypoglycemic risk associated with aerobic exercise during this time, she said.
In addition, the results suggest that the menstrual cycle should be taken into consideration when female participants are involved in exercise studies, she noted.
Study supports personalized exercise plans
“It is important to evaluate effects of exercise in people with type 1 diabetes and evaluate whether there is a difference those effects in men and women,” said Helena W. Rodbard, MD, an endocrinologist in private practice in Rockville, Md., in an interview. “There is also a need to evaluate to what extent the changes in blood glucose patterns in women in response to exercise differ depending on the phase of the ovarian cycle,” said Dr. Rodbard, who was not involved in the study.
In the current study, “the researchers observed a decline in glucose during a 45-minute period of moderate aerobic exercise, cycling at 50% VO2peak followed by an increase during a 60-minute recovery period. There was a suggestive finding, in the nine subjects, that more carbohydrate supplementation was needed during the late luteal phase of the menstrual cycle than during the follicular phase,” Dr. Rodbard noted. “In contrast, the authors reported a significantly increased degree of hyperglycemia during the recovery phase for subjects during the follicular phase. These findings are consistent with and extend several recent studies from Dr. Yardley and coworkers, who have been focused on this area of research,” she said.
“This study provides provocative evidence that glucose responses to aerobic exercise in women may depend on the timing in relationship to their ovarian cycle,” said Dr. Rodbard. “These findings are based on a small group of subjects and were present in some but not all subjects. Clinicians should encourage women to evaluate and record their experiences during and after exercise in terms of need for carbohydrate supplementation for documented or symptomatic hypoglycemia and in terms of glucose changes as recorded using continuous glucose monitoring (CGM), both in relation to type of exercise and in relation to time in the menstrual cycle,” she said.
The findings also highlight the importance of individualized therapy that is “based on subjective inputs combined with analysis of CGM data during and following exercise,” said Dr. Rodbard. “It is likely that use of Automated Insulin Delivery (AID) will be helpful in achieving this level of individualization in view of the wide range of types, intensity, and duration of physical activity and exercise in which people with T1D engage and the myriad factors that can influence the glycemic response,” she said.
Looking ahead, “the authors and others should expand the present series of subjects using aerobic exercise and examine other types of exercise as well,” Dr. Rodbard noted. “It will be important to evaluate the consistency of these changes in glucose patterns within individuals on multiple occasions, and it would be helpful to repeat the studies in women using oral contraceptives.”
Dr. Yardley disclosed research support from Abbott, Dexcom, and LifeScan and disclosed serving on the speaker’s bureau for Abbott Diabetes. Dr. Rodbard had no financial conflicts to disclose. She serves on the Editorial Advisory Board of Clinical Endocrinology News.
FROM ADA 2022
Commentary: Benefits of GLP-1 Receptor Agonists and Studies of Continuous Glucose Monitoring, July 2022

Research continues to demonstrate the benefits of glucagon-like peptide-1 receptor (GLP-1R) agonists or co-agonists for type 2 diabetes (T2D). Arslanian and the AWARD-PEDS investigators have published the results of a randomized controlled trial comparing once-weekly dulaglutide vs.placebo in youths between 10 and17 years of age with T2D. A1c was reduced by 1.2% with 0.75 mg dulaglutide and by 1.5% with a 1.5 mg dose, compared with placebo. Of note, there was no significant weight difference between dulaglutide and placebo, similar to what has been found with liraglutide and extended-release exenatide in similar populations. This is also contrary to the weight loss that is found with GLP-1R agonists in adult studies. While the GLP-1R agonist class provides a nice glycemic benefit in youth with T2D, it remains perplexing as to why weight loss has not been demonstrated in clinical trials.
In the SURPASS trials of the GLP-1/gastric inhibitory polypeptide (GIP) receptor co-agonist tirzepatide, there was robust A1c lowering and weight loss among individuals with T2D. A meta-analysis published by Karagiannis and colleagues of seven tirzepatide trials has shown dose-dependent superiority for A1c and weight compared withplacebo, GLP-1R agonists, and basal insulin. Gastrointestinal side effects were similar to what we have come to expect with GLP-1R agonist–based therapies. Tirzepatide, recently approved by the US Food and Drug Administration (FDA) for the treatment of T2D, is a welcome addition to the pharmacotherapy toolkit.
In the SURPASS-2 study, all doses of tirzepatide were superior to 1 mg semaglutide for both A1c and body weight reduction. Following the recent approval of 2 mg semaglutide by the FDA for the management of T2D, Vadher and colleagues explored how tirzepatide compares with 2 mg semaglutide via an indirect treatment comparison. Using data from the SUSTAIN-FORTE and SURPASS-2 trials, these authors found that A1c and weight reductions were significantly greater for 10 and 15 mg tirzepatide vs 2 mg semaglutide and similar for 5 mg tirzepatide vs 2 mg semaglutide. In the absence of a head-to-head trial, this analysis suggests greater efficacy with tirzepatide compared with high-dose semaglutide in T2D.
Continuous glucose monitoring (CGM) provides information about glycemia that is not available with A1c and capillary glucose monitoring. The coefficient of variation (CV) calculated from CGM is a good measure of glycemic variability, with a goal of ≤36%. There are inconsistent data for the association of CV with microvascular or macrovascular complications and very little study of the relationship between CV and long-term mortality. Mo and colleagues investigated the association between short-term glycemic variability measured by CV and all-cause mortality in a prospective study of 1839 individuals with T2D and a well-controlled glucose profile monitored by CGM. After about 7 years of follow-up, a greater baseline CV was associated with an increased risk for all-cause mortality, with a greater than twofold risk fo rmortality with a baseline CV of >35% compared witha baseline CV of ≤20%. This study suggests that clinicians should pay attention when CV is high, even with otherwise good glycemic control. With the expanding use of CGM, long-term intervention studies are needed to determine the role of glycemic variability(CV) in the development of complications and hard outcomes.
Cancer may increase risk of type 2 diabetes
most notably pancreatic malignancies.
“Our study demonstrates that there is an elevated risk of developing diabetes if a person is affected by lung, pancreatic, breast, brain, urinary tract, or uterine cancers,” said Lykke Sylow, PhD, associate professor in the Molecular Metabolism in Cancer and Ageing Group at the University of Copenhagen, in a statement.
“It is great to see such a large, well-designed study confirm the findings of previous smaller studies and observations,” said Elias S. Siraj, MD, the David L. Bernd Distinguished Chair for EVMS-Sentara Cardiovascular Diabetes Program at Eastern Virginia Medical School in Norfolk, when asked for comment by this news organization. Dr. Siraj also noted that “in clinical care we do observe that many patients develop diabetes after being diagnosed with cancer although one needs a well-designed study to confirm that observation.”
Diabetes risk highest with pancreatic cancer
Type 2 diabetes at the time of cancer diagnosis is known to increase cancer-specific and all-cause mortality, but not much is known about whether cancer is a risk factor for type 2 diabetes, the researchers state in their study, published in Diabetes Care.
Dr. Sylow and colleagues from the Steno Diabetes Center Copenhagen, Rigshospitalet, analyzed a database consisting of 112 million blood samples from 1.3 million Danes from 2000 to 2015. They looked at cancer cases with an incidence of more than 1,000 and excluded individuals with diabetes prior to cancer diagnosis.
They found an increased risk of new-onset type 2 diabetes for all cancers (hazard ratio, 1.09; 95% confidence interval, 1.03-1.14). For pancreatic cancer, the hazard ratio rose to 5.0 (95% CI, 3.62-6.90), for brain and nervous system cancers the hazard ratio was 1.54 (95% CI, 1.22-1.95), and for uterine cancer the hazard ratio was 1.41 (95% CI, 1.10-1.84).
The link with pancreatic cancer was not surprising, said Dr. Sylow.
Dr. Siraj agreed, noting that a few studies have shown a strong association. “It has also been observed for years that many patients with pancreatic cancer may present with new-onset diabetes,” he said. “The mechanism is not clearly understood but could include a direct damage of the beta cells by the pancreatic cancer or could be due to a paraneoplastic secretion of special factors by the cancer that can affect beta-cell function or insulin resistance,” said Dr. Siraj, who is also professor and chief of endocrinology and director of the Strelitz Diabetes Center at Eastern Virginia Medical School.
The higher diabetes risk associated with brain and nervous system cancers has not been previously described and is “an intriguing finding,” he said.
In their statement, the Danish investigators said there is nothing in their research to suggest why some cancers are associated with a higher risk of new-onset type 2 diabetes, but they offered some theories, including that chemotherapeutics and perhaps the cancer, itself, may contribute.
“We know that cancer cells are able to secrete substances that can affect organs and possibility contribute to an increased incidence of diabetes,” said Dr. Sylow in the statement.
Increased mortality risk in those with cancer and type 2 diabetes
Dr. Sylow and colleagues also analyzed mortality in a subset of 28,308 patients with cancer who were still alive 2 years after diagnosis. They documented a 21% higher rate of all-cause mortality in these patients compared with those who did not have new-onset type 2 diabetes.
“We do not know enough about the patients who were diagnosed with type 2 diabetes, but we think our findings illustrate a potential new area of intervention in the cancer clinic,” Dr. Sylow said. However, the findings still require replication before drawing any definite conclusions, she added.
Christoffer Johansen, MD, PhD, DMSc, of Rigshospitalet, said in the statement that it might be prudent to screen patients with lung, breast, brain, uterine, and urinary tract cancers for diabetes. “Early intervention could have an impact on certain cancer patients,” said Dr. Johansen.
Dr. Siraj said he would urge oncologists to routinely monitor blood glucose levels during cancer treatment and as part of long-term surveillance, and to consider the potential risk of new-onset diabetes when choosing a cancer therapy. If diabetes is diagnosed, clinicians should be sure that it’s managed by a primary care physician or endocrinologist, “as proper treatment may contribute to better outcomes of the cancer,” said Dr. Siraj.
Endocrinologists should consider the possibility of pancreatic cancer if someone with few risk factors for type 2 diabetes has a new-onset diagnosis, he said. And they should aim for good glycemic control in those with new-onset type 2 diabetes, as it may lead to better cancer outcomes, he said.
Dr. Sylow has reported grant support from the Novo Nordisk Foundation and Independent Research Fund Denmark. Dr. Johansen has reported serving as an educator for Janssen and Pfizer. Coauthors have received grant support from the Danish Cancer Society and served as consultants, on advisory boards, or as educators for Amgen, AstraZeneca, Bayer, Boehringer Ingelheim, Incyte, GSK, MSD, Mundipharma, Novartis, Novo Nordisk, Pfizer, and Sanofi.
A version of this article first appeared on Medscape.com.
FROM DIABETES CARE