User login
Community genetic testing prompts behavior change in patients
that could decrease an individual’s likelihood of developing chronic kidney disease (CKD) and end-stage renal failure (ESRF), a new pilot study suggests.
“Disclosing APOL1 genetic testing results to patients of African ancestry with hypertension and their clinicians was associated with a greater reduction in systolic blood pressure [SBP], increased kidney disease screening, and positive self-reported behavior change in those with high-risk genotypes,” Girish Nadkarni, MD, MPH, Icahn Mount Sinai School of Medicine, New York, and colleagues reported.
“These two measurements – the change in blood pressure and increased kidney function tests – act as hallmarks for detecting beneficial lifestyle change,” Dr. Nadkarni noted in a statement from his institution.
“For many years, researchers have wondered whether reporting APOL1 genetic test results would help improve clinical management. This is the first pragmatic randomized clinical trial to test this out [and] these results suggest we are headed in the right direction,” he added.
The study was published online March 4, 2022, in JAMA Network Open.
A quarter of those with high-risk genotype changed medication behavior
High-risk APOL1 genotypes confer a 5- to 10-fold increased risk for CKD and ESRF caused by hypertension and are found in one out of seven individuals of African ancestry. People of African ancestry also have the highest age-adjusted prevalence of high BP and the lowest rates of BP control, Dr. Nadkarni and colleagues wrote.
They studied a total of 2,050 patients of African ancestry with hypertension but without CKD who were randomized to undergo either immediate APOL1 testing (intervention group) or delayed APOL1 testing (control group).
“Patients randomly assigned to the intervention group received APOL1 genetic testing results from trained staff [while] their clinicians received results through clinical decision support in electronic health records,” the investigators explained.
Control patients received results after 12 months of follow-up. The mean age of the cohort was 53 years and almost two-thirds were female. Mean baseline SBP was significantly higher in patients with high-risk APOL1 genotypes, at 137 mm Hg, compared with those with low-risk APOL1 genotypes, at 134 mm Hg (P = .003), and controls, at 133 mm Hg (P = .001), the authors reported.
At 3 months, “all groups had some decrease in SBP,” Dr. Nadkarni and colleagues observed.
However, patients with high-risk APOL1 genotypes had a significantly greater decrease in SBP, at 6 mm Hg, compared with a mean decrease of 3 mm Hg for those with low-risk APOL1 genotypes (P = .004) as well as controls (P = .01). At 12 months, there was no significant difference in SBP or change in SBP from baseline to 12 months between the three groups.
“All three groups showed a significant increase in the rate of urine protein testing over time,” the authors added.
Again, however, the most significant increase in urine protein testing over time was seen in patients with high-risk APOL1 genotypes, with a 12% increase from baseline, compared with a 6% increase for patients with low-risk APOL1 genotypes and a 7% increase among controls. The difference was significant only between patients with high-risk APOL1 genotypes and controls (P = .01).
Significantly more patients with high-risk APOL1 genotypes, at 59%, reported making positive lifestyle changes as reflected in better dietary and exercise habits after receiving their test results than did those with low-risk APOL1 genotypes, at 37% (P < .001).
Moreover, 24% of those with high-risk genotypes reported that receiving test results changed how they take their BP medication, compared with only 10% of those with low-risk genotypes.
More high-risk genotype carriers also reported taking their medications more often, at 10%, compared with 5% of low-risk genotype carriers (P = .005).
On the other hand, more patients with the high-risk genotype, at 27%, worried that they would develop kidney problems than low-risk carriers, at 17% (P < .001). Although investigators did offer patients the opportunity to speak with a genetic counselor at no cost, none chose to do so, the authors noted.
Small improvements
As the investigators emphasized, the magnitude of BP improvement seen in high-risk APOL1 carriers was small. However, they did not provide specific BP target recommendations or BP-lowering strategies, which, had they done so, may have brought BP down to a greater degree.
Health behavior changes were similarly small and may not have been clinically that meaningful.
Still, “results suggest that the trial clearly influenced those who received positive results and may have had some positive effects on other patients,” Dr. Nadkarni concluded.
Dr. Nadkarni is a cofounder of and has equity in Renalytx, and has been a member of the scientific advisory board and received personal fees from the company. He is also a cofounder of Pensieve Health.
A version of this article first appeared on Medscape.com.
FROM JAMA NETWORK OPEN
Home blood pressure testing better than at clinics: Study
Everyone’s been there. Which one’s right?
The answer: Perhaps neither. Individual measures of blood pressure are not as accurate as taking multiple readings over a day and averaging them.
Blood pressure varies throughout the day – by about 30 points for systolic pressure, or the pressure when the heart beats – and one or two measurements in a doctor’s office may not accurately reflect the average figure, said Beverly B. Green, MD, a senior investigator at Kaiser Permanente Washington Health Research Institute in Seattle.
Average blood pressure reading is the only measurement on which a doctor can accurately diagnose and treat high blood pressure, she said. A new study by Dr. Green and other researchers at Kaiser Permanente showed that giving patients the chance to monitor their blood pressure at home could help get more reliable measurements.
Nearly one in four adults in the United States with high blood pressure are unaware they have the condition and are not getting treatment to control it. Without treatment, the condition can cause heart attacks, strokes, kidney damage, and other potentially life-threatening health problems.
Current guidelines for diagnosing high blood pressure recommend that patients whose pressure is high in the clinic get tested again to confirm the results. While the guidelines recommend home monitoring before diagnosing high blood pressure, research shows that doctors continue to measure blood pressure in their clinics for the second reading.
In their study, Dr. Green and colleagues found that home readings were more accurate than measurements taken in clinics or at pharmacy kiosks.
“Home blood pressure monitoring was a better option, because it was more accurate” than clinic blood pressure readings, Green said. A companion study found that patients preferred taking their blood pressure at home.
For their study, Dr. Green’s group used Kaiser’s electronic health record system to identify people at high risk for high blood pressure based on a recent clinic visit. They then randomly assigned the participants to get their follow-up blood pressure readings in the clinic, at home, or at kiosks in clinics or pharmacies.
Each participant also received a 24-hour ambulatory blood pressure monitor (ABPM). These devices, which people must wear continuously for 24 hours, have cuffs that inflate every 20-0 minutes during the day and every 30-60 minutes at night. Although ABPMs are the preferred test for accurately diagnosing high blood pressure, they aren’t available for widespread use.
The Kaiser researchers found that people’s systolic BP readings at clinics were generally lower than their ABPM measurements, leading to undiagnosed high BP in more than 50% of cases. Kiosk readings were much higher than the ABPM measurements and tended to overdiagnose high BP.
The value of home monitoring
Branden Villavaso, a 48-year-old attorney in New Orleans who was diagnosed with high BP at age 32, attributes his condition to genetics. He says an at-home monitor plus the occasional use of an ABPM finally provided his doctor with an accurate assessment of his condition.
Thanks to this aggressive approach, over the past 3 years, Mr. Villavaso’s diastolic reading has dropped from a previous range of between 90 and 100 to a healthier but not quite ideal value of about 80. Meanwhile, his systolic pressure has dropped to about 120, well below the goal of 130.
Mr. Villavaso said his doctor has relied on the averages of the BP readings to tailor his medication, and he also credited his wife, Chloe, a clinical nurse specialist, for monitoring his progress.
While previous studies have found similar benefits for measuring BP at home, Dr. Green said the latest study may offer the most powerful evidence to date because of the large number of people who took part, the involvement of primary care clinics, and the use of real-world health care professionals to take measurements instead of people who usually do health research. She said this study is the first to compare kiosk and ABPM results.
“The study indicates that assisting patients with getting access to valid blood pressure readings so they can measure their blood pressure at home will give a better picture of the true burden of [high BP],” said Keith C. Ferdinand, MD, a cardiologist at Tulane University, New Orleans.
He recommended patients select a home monitoring device from www.validatebp.org, a noncommercial website that lists home BP systems that have proven to be accurate.
“We know that [high blood pressure] is the most common and powerful cause of heart disease and death,” Dr. Ferdinand said. “Patients are pleased to participate in shared decision-making and actively assist in the control of a potentially deadly disease.”
A version of this article first appeared on WebMD.com.
FROM THE JOURNAL OF GENERAL INTERNAL MEDICINE
Early menopause, early dementia risk, study suggests
Earlier menopause appears to be associated with a higher risk of dementia, and earlier onset of dementia, compared with menopause at normal age or later, according to a large study.
“Being aware of this increased risk can help women practice strategies to prevent dementia and to work with their physicians to closely monitor their cognitive status as they age,” study investigator Wenting Hao, MD, with Shandong University, Jinan, China, says in a news release.
The findings were presented in an e-poster March 1 at the Epidemiology, Prevention, Lifestyle & Cardiometabolic Health (EPI|Lifestyle) 2022 conference sponsored by the American Heart Association.
UK Biobank data
Dr. Hao and colleagues examined health data for 153,291 women who were 60 years old on average when they became participants in the UK Biobank.
Age at menopause was categorized as premature (younger than age 40), early (40 to 44 years), reference (45 to 51), 52 to 55 years, and 55+ years.
Compared with women who entered menopause around age 50 years (reference), women who experienced premature menopause were 35% more likely to develop some type of dementia later in life (hazard ratio, 1.35; 95% confidence interval, 1.22 to 1.91).
Women with early menopause were also more likely to develop early-onset dementia, that is, before age 65 (HR, 1.31; 95% confidence interval, 1.07 to 1.72).
Women who entered menopause later (at age 52+) had dementia risk similar to women who entered menopause at the average age of 50 to 51 years.
The results were adjusted for relevant cofactors, including age at last exam, race, educational level, cigarette and alcohol use, body mass index, cardiovascular disease, diabetes, income, and leisure and physical activities.
Blame it on estrogen?
Reduced estrogen levels may be a factor in the possible connection between early menopause and dementia, Dr. Hao and her colleagues say.
Estradiol plays a key role in a range of neurological functions, so the reduction of endogenous estrogen at menopause may aggravate brain changes related to neurodegenerative disease and speed up progression of dementia, they explain.
“We know that the lack of estrogen over the long term enhances oxidative stress, which may increase brain aging and lead to cognitive impairment,” Dr. Hao adds.
Limitations of the study include reliance on self-reported information about age at menopause onset.
Also, the researchers did not evaluate dementia rates in women who had a naturally occurring early menopause separate from the women with surgery-induced menopause, which may affect the results.
Finally, the data used for this study included mostly White women living in the U.K. and may not generalize to other populations.
Supportive evidence, critical area of research
The U.K. study supports results of a previously reported Kaiser Permanente study, which showed women who entered menopause at age 45 or younger were at 28% greater dementia risk, compared with women who experienced menopause after age 45.
Reached for comment, Heather Snyder, PhD, Alzheimer’s Association vice president of medical and scientific relations, noted that nearly two-thirds of Americans with Alzheimer’s are women.
“We know Alzheimer’s and other dementias impact a greater number of women than men, but we don’t know why,” she told this news organization.
“Lifelong differences in women may affect their risk or affect what is contributing to their underlying biology of the disease, and we need more research to better understand what may be these contributing factors,” said Dr. Snyder.
“Reproductive history is one critical area being studied. The physical and hormonal changes that occur during menopause – as well as other hormonal changes throughout life – are considerable, and it’s important to understand what impact, if any, these changes may have on the brain,” Dr. Snyder added.
“The potential link between reproduction history and brain health is intriguing, but much more research in this area is needed to understand these links,” she said.
The study was funded by the Start-up Foundation for Scientific Research at Shandong University. Dr. Hao and Dr. Snyder have disclosed no relevant financial relationships.
A version of this article first appeared on Medscape.com.
One-third of psoriatic arthritis patients could have metabolic syndrome, data analysis finds
of 724 individuals, as did approximately 23%-63% of patients across multiple studies, investigators from Spain report.
Previous studies of people with PsA in particular suggest they are at an increased risk of cardiovascular disease and have a higher prevalence of metabolic syndrome, prompting recommendations on cardiovascular risk management for patients with PsA, wrote the authors, Ana Urruticoechea-Arana, MD, of the department of rheumatology, Hospital Can Misses, Ibiza, Spain, and colleagues.
However, assessing the prevalence of metabolic syndrome remains a challenge because the definition varies across studies, they noted.
For a more thorough assessment of the prevalence of metabolic syndrome in this population, the researchers conducted a study using two sources: a systematic literature review of 18 studies published up to March 2019, and data on patients with PsA enrolled in the CARMA (Spanish Cardiovascular in Rheumatology) project, a longitudinal cohort observational study of adults with inflammatory diseases in Spain. The findings were published March 1 in the Journal of Clinical Rheumatology.
The literature review included a total of a total of 2,452 patients with PsA, with a mean age between 42 and 59 years, and a mean disease duration ranging from 3 to 14 years.
The definitions of metabolic syndrome varied; the most common was the definition from the National Cholesterol Education Program (NECP ATP III). Other definitions used in the studies included those issued by the International Diabetes Federation, the World Health Organization, and the American Heart Association.
Across these studies, the rate of metabolic syndrome ranged from 23.5% to 62.9%. Prevalence was similar between men and women. One study that included patients with a PsA disease duration of only 3 years showed a prevalence of 38%, similar to the average prevalence overall. Another study showed a significantly higher prevalence of metabolic syndrome in patients with PsA and cutaneous psoriasis, compared with those without psoriasis (40.8% vs. 13.16%; P = .006).
The CARMA study included 724 patients with PsA; 45.4% were women and 21.8% were smokers. The mean age of the population in this study was 51 years, and the mean disease duration was 9 years. Overall, 222 patients (30.7%) met at least three criteria for metabolic syndrome, based on the NCEP ATP III definition. The most common abnormal findings for traditional cardiovascular risk factors in the CARMA cohort were high blood pressure (66.8%), hyperglycemia (42.6%), and hypertriglyceridemia (30.6%).
Despite the variation in prevalence of metabolic syndrome, depending on the definition used, the authors wrote, “It can be stated that the rate of [metabolic syndrome] in patients with PsA is in general very high, especially if we take into account the mean age of patients included in the studies.”
“These findings support the hypotheses that this increase in the inflammatory pathway in PsA may contribute a higher risk of cardiovascular events and [metabolic syndrome] in patients with PsA than patients with psoriasis alone, the risk being even higher in severe PsA,” and that insulin resistance, metabolic syndrome, and atherosclerotic events “may have a common inflammatory basis,” the researchers wrote in their discussion of the results.
The study findings were limited by several factors, most importantly the variation in definitions of metabolic syndrome in the literature review, which limits the generalizability of the results, the researchers said. Limitations of the CARMA study include the focus only on patients who were being cared for in hospitals, which might yield an overestimation of metabolic syndrome, they added.
However, the results support findings from previous studies and highlight the need for proper assessment of body weight and cardiovascular risk factors in patients with PsA at the onset of disease, they said.
“Furthermore, it is necessary to conduct more research to standardize (and modify as appropriate) the definition of [metabolic syndrome] and establish the best strategy for managing it in these patients,” they concluded.
The study was funded by an independent grant from UCB Pharma. One author disclosed receiving grants from Pfizer, Abbvie, Novartis, Roche, UCB, Sanofi, BMS, Lilly, MSD, and Janssen. Lead author Dr. Urruticoechea-Arana and the other authors had no disclosures.
FROM JOURNAL OF CLINICAL RHEUMATOLOGY
ARBs and cancer risk: New meta-analysis raises questions again
The debate on whether the popular class of antihypertensive drugs, angiotensin receptor blockers (ARBs), may be associated with an increased risk for cancer has been reopened with the publication of a new meta-analysis.
The analysis found an increasing risk for cancer, and specifically lung cancer, with increasing cumulative exposure to these drugs.
The findings are reported in a study published online in PLOS ONE.
The author of this new meta-analysis is Ilke Sipahi, MD, a cardiologist from Acibadem University Medical School, Istanbul, who previously raised this issue in an initial meta-analysis published in 2010.
“The new meta-analysis is important because it is the first study to investigate whether there is a dose response in the association between ARBs and cancer,” Dr. Sipahi told this news organization.
“I found a clear signal of increased risk of cancer as exposure to ARBs increased, and the association started to become significant when the maximum dose was taken for 3 years,” he added.
Dr. Sipahi explained that in the first meta-analysis published in Lancet Oncology, he and his colleagues reported an increased cancer risk with ARBs based on observations from high-exposure trials – those that included higher doses of ARBs with a long duration of follow-up.
Following this publication, an investigation by the U.S. Food and Drug Administration refuted the risk, and a collaboration of ARB trial investigators also performed an analysis published in the Journal of Hypertension (2011. doi: 10.1097/HJH.0b013e328344a7de), which again did not show an increased risk for cancer with use of ARBs.
Dr. Sipahi claims that those analyses by the FDA and the ARB Trialists Collaboration, which were all trial-level meta-analyses, diluted the “high exposure” data (including higher doses taken for longer periods of time) with a large amount of other data on much lower exposures (lower doses and/or shorter time periods).
“The overall risk would then inevitably become nonsignificant. These analyses also did not look at different exposure levels,” he says.
“For cancer, the degree of exposure is obviously very important. The risk associated with smoking 2 or 3 cigarettes a day for a year is very different from that of smoking 2 packs a day for 40 years. The same principle applies to taking a medication,” Dr. Sipahi asserts.
From these latest data, he estimates that 120 patients needed to be treated with the maximal daily dose of an ARB for 4.7 years for one excess cancer diagnosis, and 464 patients needed to be treated for one excess lung cancer.
“Given that at least 200 million individuals are being treated with an ARB globally, approximately 1.7 million excess cancers (and 430,000 lung cancers) in 4.6 years could be potentially caused by this class of drugs,” he suggests.
For the current analysis, Dr. Sipahi used trial-level data taken from the paper by the ARB Trialists Collaboration and investigated the effect of exposure to ARBs – including both the dose taken and the length of treatment – on risk for cancer. He performed metaregression analyses that he says has not been done before.
“I mathematically quantitated the degree of exposure in each trial. And when the degree of exposure was correlated with risk of cancer, there was a significant association.”
The new meta-analysis includes 15 randomized controlled trials. The two coprimary outcomes were the relationship between cumulative exposure to ARBs and risk for all cancers combined and the relationship between cumulative exposure and risk for lung cancer.
In the trials, 74,021 patients were randomly assigned to an ARB, resulting in a total cumulative exposure of 172,389 person-years of exposure to daily high dose (or equivalent), and 61,197 patients were randomly assigned to control.
Results showed a highly significant correlation between the degree of cumulative exposure to ARBs and risk for all cancers combined (slope = 0.07; 95% confidence interval, 0.03-0.11; P < .001) and also lung cancer (slope = 0.16; 95% CI, 0.05-0.27; P = .003).
In trials where the cumulative exposure was greater than 3 years of exposure to daily high dose, there was a statistically significant increase in risk for all cancers combined (risk ratio, 1.11; 95% CI, 1.03-1.19; P = .006).
There was also a statistically significant increase in risk for lung cancers in trials where the cumulative exposure was greater than 2.5 years (RR, 1.21; 95% CI, 1.02-1.44; P = .03).
In trials with lower cumulative exposure to ARBs, there was no increased risk either for all cancers combined or lung cancer.
Dr. Sipahi reports that the cumulative exposure-risk relationship with ARBs was independent of background angiotensin-converting enzyme (ACE) inhibitor treatment or the type of control (placebo or nonplacebo control).
But he acknowledges that since this is a trial-level analysis, the effects of patient characteristics such as age and smoking status could not be examined because of lack of patient-level data.
Dr. Sipahi says he does not know the mechanism behind these findings, but he draws attention to the recent withdrawal of several thousand lots of ARB formulations because of the presence of potentially carcinogenic impurities that have been suggested to be a byproduct of ARB synthesis.
He also claims that unlike some other classes of antihypertensives, ARBs have not been shown to reduce the risk for MI, leading him to conclude that “other classes of antihypertensives with good safety and efficacy data (such as ACE-inhibitors, calcium-channel blockers or others) should become the preferred first-line agents in the treatment of hypertension.”
Dr. Sipahi wants the FDA to reinvestigate the issue of ARBs and cancer risk using individual patient data. “They already have the patient-level data from the trials. They should look at it more carefully and look at exposure levels and how they relate to cancer risk,” he said. “And the fact that there have been studies linking high ARB exposure levels to increased cancer risk should at least get a warning on the drug labels.”
A ‘clear increase’ in risk
Dr. Sipahi also points out that a link between ARBs and cancer has been found in another meta-analysis performed in 2013 by senior FDA analyst Thomas Marciniak, MD.
“Because he worked at the FDA, [Dr.] Marciniak had access to individual patent data. This is the best type of analysis and generally produces more accurate results than a trial-level meta-analysis,” Dr. Sipahi commented.
Dr. Marciniak’s analysis, which is available on the FDA website as part of another document, was not officially published elsewhere, and no further action has been taken on the issue.
Contacted by this news organization, Dr. Marciniak, who has now retired from the FDA, said he not only conducted a patient-level meta-analysis but also followed up adverse effects reported in the trials that could have been a symptom of cancer to establish further whether the patient was later diagnosed with cancer or not.
“I used every scrap of information sent in, including serious adverse event reports. I saw a clear increase in lung cancer risk with the ARBs,” Dr. Marciniak said. He did not, however, perform a dose-response relationship analysis.
Asked why his analysis and those from Dr. Sipahi reach different conclusions to those from the ARB Trialists Collaboration and the official FDA investigations, Dr. Marciniak said: “It may be that there were too many low-exposure trials that just washed out the difference. But trial data generally do not capture adverse events such as cancer, which takes a long time to develop, very well, and if you’re not really looking for it, you’re probably not going to find it.”
Dr. Marciniak said that Dr. Sipahi’s current findings are in line with his results. “Finding a dose response, to me, is extremely compelling, and I think the signal here is real,” he commented. “I think this new paper from Dr. Sipahi verifies what I found. I think the FDA should now release all individual patient data it has.”
Contacted for comment, an FDA spokesperson said, “Generally the FDA does not comment on specific studies but evaluates them as part of the body of evidence to further our understanding about a particular issue and assist in our mission to protect public health.”
They added: “The FDA has ongoing assessment, surveillance, compliance, and pharmaceutical quality efforts across every product area, and we will continue to work with drug manufacturers to ensure safe, effective, and high-quality drugs for the American public. When we identify new and previously unrecognized risks to safety and quality, we react swiftly to resolve the problem, as we have done in responding to the recent findings of nitrosamines in certain medicines.”
Analysis ‘should be taken seriously’
Commenting on this new study, Steve Nissen, MD, a key figure in analyzing such complex data and who has himself uncovered problems with high-profile drugs in the past, says the current analysis should be taken seriously.
Dr. Nissen, who was Dr. Sipahi’s senior during his post-doc position at the Cleveland Clinic, wrote an editorial accompanying Dr. Sipahi’s first paper and calling for urgent regulatory review of the evidence.
He says the new findings add to previous evidence suggesting a possible risk for cancer with ARBs.
“[Dr.] Sipahi is a capable researcher, and this analysis needs to be taken seriously, but it needs to be verified. It is not possible to draw a strong conclusion on this analysis, as it is not based on individual patient data, but I don’t think it should be ignored,” Dr. Nissen stated.
“I will say again what I said 12 years ago – that the regulatory agencies need to carefully review all their data in a very detailed way. The FDA and EMA have access to the individual patient data and are both very capable of doing the required analyses.”
Limitations of trial-level analysis
Asked to evaluate the statistics in the current paper, Andrew Althouse, PhD, an assistant professor of medicine at the University of Pittsburgh, and a clinical trial statistician, explained that the best way to do a thorough analysis of the relationship between ARB exposure and risk for incident cancer would involve the use of patient-level data.
“As such data were not available to Dr. Sipahi, I believe he is doing as well as he can. But without full access to individual patient-level data from the respective trials, it is difficult to support any firm conclusions,” Dr. Althouse said in an interview.
He suggested that the meta-regression analyses used in the paper were unable to properly estimate the relationship between ARB exposure and risk for incident cancer.
“Taken at face value, the current analysis suggests that [in] trials with longer follow-up duration (and therefore greater cumulative exposure to ARB for the treatment group), the risk of developing cancer for patients in the ARB group versus the non-ARB group was progressively higher. But this study doesn’t take into account the actual amount of follow-up time for individual patients or potential differences in the amount of follow-up time between the two groups in each trial,” he noted.
Dr. Althouse says this raises the possibility of “competing risks” or the idea that if ARBs reduce cardiovascular disease and cardiovascular death, then there would be more patients remaining in that arm who could go on to develop cancer. “So a crude count of the number of cancer cases may look as though patients receiving ARBs are ‘more likely’ to develop cancer, but this is a mirage.”
He added: “When there are some patients dying during the study, the only way to tell whether the intervention actually increased the risk of other health-related complications is to have an analysis that properly accounts for each patient’s time-at-risk of the outcome. Unfortunately, properly analyzing this requires the use of patient-level data.”
Cardiologists skeptical?
Cardiology experts asked for thoughts on the new meta-analysis were also cautious to read too much into the findings.
Franz Messerli, MD, professor of medicine at the University of Bern, Switzerland, commented: “Perhaps one would simply ignore this rambling, cherrypicking-based condemnation of ARBs if it were not for the powerful negative connotation of the word cancer. Thus, the meta-analysis of Dr. Sipahi purporting that ARBs could be increasing the development of cancers in a cumulative way is of concern to both physicians and patients.”
But, raising a similar point to Dr. Althouse about competing risks, Dr. Messerli said: “We have to consider that as one gets older, the cardiovascular disease state and cancer state will compete with each other for the outcome of death. The better that therapies protect against cardiovascular death, the more they will increase life expectancy and thus the risk of cancer.”
He also added that “in head-to-head comparisons with ACE inhibitors, ARBs showed similar efficacy in terms of death, CV mortality, MI, stroke, and end-stage kidney disease, so can we agree that the attempt of Dr. Sipahi to disparage ARBs as a class is much ado about nothing?”
Dr. Nissen, however, said he views the idea of competing risk as “a bit of a stretch” in this case. “Although ARBs are effective antihypertensive drugs, I would say there is very little evidence that they would prolong survival versus other antihypertensives.”
Dr. Sipahi also claims that this argument is not relevant to the current analysis. “ARBs did not increase survival in any of the high-exposure trials that showed an excess in cancers. Therefore, competing outcomes, or ‘survival bias’ to be more specific, is not a possibility here,” he says.
George Bakris, MD, professor of medicine at the University of Chicago Medicine, noted that while the current study shows a slight increase in cancer incidence, especially lung cancer, among those taking ARBs for more than 3 years, it “totally ignores the overwhelming cardiovascular risk reduction seen in the trials.”
“Moreover,” he adds, “the author notes that the findings were independent of ACE-inhibitors, but he can’t rule out smoking and age as factors, two major risk factors for cancer and lung cancer, specifically. Thus, as typical of these types of analyses, the associations are probably true/true unrelated or, at best, partially related.”
Dr. Bakris referred to the potentially carcinogenic nitrosamine and azido compounds found in several ARB formulations that have resulted in recalls.
“At any stage of drug synthesis throughout each product’s lifetime, these impurities may evolve if an amine reacts with a nitrosating agent coexisting under appropriate conditions,” he said. “Drug regulatory authorities worldwide have established stringent guidelines on nitrosamine contamination for all drug products. The studies noted in the author’s analysis were done well before these guidelines were implemented. Hence, many of the issues raised by the authors using trials from 10-20 years ago are not of significant concern.”
Still, the cardiology experts all agreed on one thing – that patients should continue to take ARBs as prescribed.
Noting that worldwide authorities are now addressing the issue of possible carcinogen contamination, Dr. Bakris stressed that patients “should not panic and should not stop their meds.”
Dr. Nissen added: “What we don’t want is for patents who are taking ARBs to stop taking these medications – hypertension is a deadly disorder, and these drugs have proven cardiovascular benefits.”
Dr. Sipahi received no specific funding for this work. He reports receiving lecture honoraria from Novartis, Boehringer Ingelheim, Sanofi, Sandoz, Bristol-Myers Squibb, Bayer, Pfizer, Ranbaxy, Servier, and ARIS and served on advisory boards for Novartis, Sanofi, Servier, Bristol-Myers Squibb, Pfizer, Bayer and I.E. Ulagay. The other commenters do not report any relevant disclosures.
A version of this article first appeared on Medscape.com.
‘Striking’ differences in BP when wrong cuff size is used
Strong new evidence on the need to use an appropriately sized cuff in blood pressure measurement has come from the cross-sectional randomized trial Cuff(SZ).
The study found that in people in whom a small adult cuff was appropriate, systolic BP readings were on average 3.6 mm Hg lower when a regular adult size cuff was used.
However, systolic readings were on average 4.8 mm Hg higher when a regular cuff was used in people who required a large adult cuff and 19.5 mm Hg higher in those needing an extra-large cuff based on their mid-arm circumference.
The diastolic readings followed a similar pattern (-1.3 mm Hg, 1.8 mm Hg, and 7.4 mm Hg, respectively).
“We found that using the regular adult cuff in all individuals had striking differences in blood pressure,” lead author Tammy M. Brady, MD, PhD, Johns Hopkins University School of Medicine, Baltimore, told this news organization. “And that has a lot of clinical implications.”

She noted, for example, that people who required an extra-large cuff and were measured with a regular cuff had an average BP of 144/86.7 mm Hg, which is in the stage 2 hypertension range. But when the correct size cuff was used, the average BP was 124.5/79.3 mm Hg, or in the prehypertensive range.
Overall, the overestimation of BP due to using too small a cuff misclassified 39% of people as being hypertensive, while the underestimation of BP due to using a cuff that was too large missed 22% of people with hypertension.
“So, I think clinicians really need to have a renewed emphasis on cuff size, especially in populations where obesity is highly prevalent and many of their patients require extra-large cuffs, because those are the populations that are most impacted by mis-cuffing,” Dr. Brady said.
The findings were presented in an E-poster at the Epidemiology and Prevention/Lifestyle and Cardiometabolic Health (EPI/Lifestyle) 2022 conference sponsored by the American Heart Association.
Willie Lawrence, MD, chair of the AHA’s National Hypertension Control Initiative Advisory Committee, said in an interview that the magnitude of inaccuracy observed by the researchers “makes this a very, very important study.”
“Is it the first of its kind, no, but it’s incredibly important because it was so well done, and it comes at a time when people are once again dealing with issues around equity, and this study can have a significant impact on the state of hypertension in diverse communities,” said Dr. Lawrence, a cardiologist with Spectrum Health Lakeland, Benton Harbor, Michigan.
Previous studies examining the issue were older, had few participants, and used mercury sphygmomanometers instead of automated devices, which are typically recommended by professional societies for screening hypertension in adults, Dr. Brady explained.
For the Cuff Size Blood Pressure Measurement trial, 195 adults recruited from the community underwent 2 to 3 sets of 3 BP readings, 30 seconds apart, with an automated and validated device (Welch Allyn ProB 2000) using a BP cuff that was appropriated sized, one size lower, and one size higher. The order of cuff sizes was randomized. Before each set, patients walked for 2 minutes, followed by 5 minutes of rest to eliminate the potential effect of longer resting periods between tests on the results. The room was also kept quiet and participants were asked not to speak or use a smart phone.
Participants had a mean age of 54 years, 34% were male, 68% were Black, and 36% had a body mass index of at least 30 kg/m2, meeting the criteria for obesity.
Roughly one-half had a self-reported hypertension diagnosis, 31% had a systolic BP of 130 mm Hg or greater, and 26% had a diastolic BP of 80 mm Hg or greater.
Based on arm circumference (mean, 34 cm), the appropriate adult cuff size was small (20-25 cm) in 18%, regular (25.1-32 cm) in 28%, large (32.1-40 cm) in 34%, and extra-large (40.1-55 cm) in 21%.
Dr. Brady pointed out that the most recent hypertension guidelines detail sources of inaccuracy in BP measurement and say that if too small a cuff size is used, the blood pressure could be different by 2 to 11 mm Hg. “And what we show, is it can be anywhere from 5 to 20 mm Hg. So, I think that’s a significant difference from what studies have shown so far and is going to be very surprising to clinicians.”
A 2019 AHA scientific statement on the measurement of blood pressure stresses the importance of cuff size, and last year, the American Medical Association launched a new initiative to standardize training in BP measurement for future physicians and health care professionals.
Previous work also showed that children as young as 3 to 5 years of age often require an adult cuff size, and those in the 12- to 15-year age group may need an extra-large cuff, or what is often referred to as a thigh cuff, said Dr. Brady, who is also the medical director of the pediatric hypertension program at Johns Hopkins Children’s Center.
“Part of the problem is that many physicians aren’t often the one doing the measurement and that others may not be as in tune with some of these data and initiatives,” she said.
Other barriers are cost and availability. Offices and clinics don’t routinely stock multiple cuff sizes in exam rooms, and devices sold over the counter typically come with a regular adult cuff, Dr. Brady said. An extra cuff could add $25 to $50 on top of the $25 to $50 for the device for the growing number of patients measuring BP remotely.
“During the pandemic, I was trying to do telemedicine with my hypertensive patients, but the children who had significant obesity couldn’t afford or find blood pressure devices that had a cuff that was big enough for them,” she said. “It just wasn’t something that they could get. So I think people just don’t recognize how important this is.”
A version of this article first appeared on Medscape.com.
Strong new evidence on the need to use an appropriately sized cuff in blood pressure measurement has come from the cross-sectional randomized trial Cuff(SZ).
The study found that in people in whom a small adult cuff was appropriate, systolic BP readings were on average 3.6 mm Hg lower when a regular adult size cuff was used.
However, systolic readings were on average 4.8 mm Hg higher when a regular cuff was used in people who required a large adult cuff and 19.5 mm Hg higher in those needing an extra-large cuff based on their mid-arm circumference.
The diastolic readings followed a similar pattern (-1.3 mm Hg, 1.8 mm Hg, and 7.4 mm Hg, respectively).
“We found that using the regular adult cuff in all individuals had striking differences in blood pressure,” lead author Tammy M. Brady, MD, PhD, Johns Hopkins University School of Medicine, Baltimore, told this news organization. “And that has a lot of clinical implications.”
She noted, for example, that people who required an extra-large cuff and were measured with a regular cuff had an average BP of 144/86.7 mm Hg, which is in the stage 2 hypertension range. But when the correct size cuff was used, the average BP was 124.5/79.3 mm Hg, or in the prehypertensive range.
Overall, the overestimation of BP due to using too small a cuff misclassified 39% of people as being hypertensive, while the underestimation of BP due to using a cuff that was too large missed 22% of people with hypertension.
“So, I think clinicians really need to have a renewed emphasis on cuff size, especially in populations where obesity is highly prevalent and many of their patients require extra-large cuffs, because those are the populations that are most impacted by mis-cuffing,” Dr. Brady said.
The findings were presented in an E-poster at the Epidemiology and Prevention/Lifestyle and Cardiometabolic Health (EPI/Lifestyle) 2022 conference sponsored by the American Heart Association.
Willie Lawrence, MD, chair of the AHA’s National Hypertension Control Initiative Advisory Committee, said in an interview that the magnitude of inaccuracy observed by the researchers “makes this a very, very important study.”
“Is it the first of its kind, no, but it’s incredibly important because it was so well done, and it comes at a time when people are once again dealing with issues around equity, and this study can have a significant impact on the state of hypertension in diverse communities,” said Dr. Lawrence, a cardiologist with Spectrum Health Lakeland, Benton Harbor, Michigan.
Previous studies examining the issue were older, had few participants, and used mercury sphygmomanometers instead of automated devices, which are typically recommended by professional societies for screening hypertension in adults, Dr. Brady explained.
For the Cuff Size Blood Pressure Measurement trial, 195 adults recruited from the community underwent 2 to 3 sets of 3 BP readings, 30 seconds apart, with an automated and validated device (Welch Allyn ProB 2000) using a BP cuff that was appropriated sized, one size lower, and one size higher. The order of cuff sizes was randomized. Before each set, patients walked for 2 minutes, followed by 5 minutes of rest to eliminate the potential effect of longer resting periods between tests on the results. The room was also kept quiet and participants were asked not to speak or use a smart phone.
Participants had a mean age of 54 years, 34% were male, 68% were Black, and 36% had a body mass index of at least 30 kg/m2, meeting the criteria for obesity.
Roughly one-half had a self-reported hypertension diagnosis, 31% had a systolic BP of 130 mm Hg or greater, and 26% had a diastolic BP of 80 mm Hg or greater.
Based on arm circumference (mean, 34 cm), the appropriate adult cuff size was small (20-25 cm) in 18%, regular (25.1-32 cm) in 28%, large (32.1-40 cm) in 34%, and extra-large (40.1-55 cm) in 21%.
Dr. Brady pointed out that the most recent hypertension guidelines detail sources of inaccuracy in BP measurement and say that if too small a cuff size is used, the blood pressure could be different by 2 to 11 mm Hg. “And what we show, is it can be anywhere from 5 to 20 mm Hg. So, I think that’s a significant difference from what studies have shown so far and is going to be very surprising to clinicians.”
A 2019 AHA scientific statement on the measurement of blood pressure stresses the importance of cuff size, and last year, the American Medical Association launched a new initiative to standardize training in BP measurement for future physicians and health care professionals.
Previous work also showed that children as young as 3 to 5 years of age often require an adult cuff size, and those in the 12- to 15-year age group may need an extra-large cuff, or what is often referred to as a thigh cuff, said Dr. Brady, who is also the medical director of the pediatric hypertension program at Johns Hopkins Children’s Center.
“Part of the problem is that many physicians aren’t often the one doing the measurement and that others may not be as in tune with some of these data and initiatives,” she said.
Other barriers are cost and availability. Offices and clinics don’t routinely stock multiple cuff sizes in exam rooms, and devices sold over the counter typically come with a regular adult cuff, Dr. Brady said. An extra cuff could add $25 to $50 on top of the $25 to $50 for the device for the growing number of patients measuring BP remotely.
“During the pandemic, I was trying to do telemedicine with my hypertensive patients, but the children who had significant obesity couldn’t afford or find blood pressure devices that had a cuff that was big enough for them,” she said. “It just wasn’t something that they could get. So I think people just don’t recognize how important this is.”
A version of this article first appeared on Medscape.com.
How Lp(a) can help improve ASCVD risk assessment
A look back at a pair of large cohort studies suggests a telling relation between two distinct predictors of atherosclerotic cardiovascular disease (ASCVD) risk and may offer guidance on how to interpret them together.
Elevated levels of lipoprotein(a), or Lp(a), and high coronary artery calcium (CAC) scores were both predictive of ASCVD risk over 10 years, but independent of each other and a host of more traditional cardiovascular risk factors, for example, in the analysis of data from the MESA (Multi-Ethnic Study of Atherosclerosis) and DHS (Dallas Heart Study) longitudinal cohorts.
Notably, the risk when both Lp(a) and CAC scores were high far exceeded that associated with either marker alone. But when CAC scores were less than 100 Agatston units, predicted ASCVD risk wasn’t influenced by levels of Lp(a). Indeed, a CAC score of 0 predicted the lowest levels of ASCVD risk, even with elevated Lp(a).
That is, the findings suggest, the addition of Lp(a) makes a difference to the risk assessment only when CAC scores are high, at least 100 units, and elevated Lp(a) doesn’t mean increased ASCVD risk in the absence of coronary calcium.
“Our novel findings indicate that elevated Lp(a) drives ASCVD risk independent of the subclinical coronary atherosclerosis burden captured by CAC score,” concluded a report on the analysis, published in the Journal of the American College of Cardiology, with lead author Anurag Mehta, MD, Emory University, Atlanta.
There are no formal recommendations on how to interpret Lp(a) and CAC scores together, but the current findings “provide impetus for measuring Lp(a) in more individuals as part of the shared decision-making process,” the authors contended.
“Really, the calcium score carries the majority of the information in terms of risk, except in the highest CAC score group. That is, if you have a high Lp(a) and a high burden of calcium, your risk is significantly higher than if you just have the high calcium score and the normal Lp(a),” senior author Parag H. Joshi, MD, MHS, said in an interview.
“We thought we would see that the group with higher Lp(a) would have more events over 10 years, even among those who didn’t have coronary calcium,” said Dr. Joshi, of the University of Texas Southwestern Medical Center, Dallas. “But we really don’t see that, at least in a statistically significant way.”
A CAC score of 0 would at least support a more conservative approach in a patient with elevated Lp(a) “who is hesitant to be on a statin or to be more aggressive managing their risk,” Dr. Joshi said.
“This study should be very reassuring for a patient like that,” Ron Blankstein, MD, director of cardiac computed tomography at Brigham and Women’s Hospital, Boston, said in an interview.
“If you have a high Lp(a) and you’re concerned, I think this study really supports the role of calcium scoring for further risk assessment,” said Dr. Blankstein, who is not associated with the new report. “We often check Lp(a) in individuals who perhaps have a family history or who come to see us in a preventive cardiology clinic. If it is high and there is concern, a calcium score can be very helpful. If it’s zero, that really means a very low risk of events. And if it’s elevated, I think we’re going to be more concerned about that patient.”
The current analysis suggests “that, when a patient without clinical cardiovascular disease is identified with either CAC ≥100 or Lp(a) >50 mg/dL, the next step in the risk evaluation should be to measure either Lp(a) or CAC, respectively – if not already performed – to identify the patients at highest risk,” Sotirios Tsimikas, MD, director of vascular medicine at University of California, San Diego, wrote in an accompanying editorial.
“Both Lp(a) and CAC should be more broadly applied in clinical care settings in patients without prior ASCVD to identify those that most likely will benefit from more aggressive therapy and, in the future, from Lp(a)-lowering therapies,” he wrote.
The analyses were conducted separately on data from 4,512 initially asymptomatic patients in MESA and 2,078 from the DHS cohort, who were followed for ASCVD events an average of 13 years and 11 years, respectively. Such events included coronary heart disease–related death, nonfatal MI, and fatal or nonfatal stroke.
In the MESA cohort – 52% women, 36.8% White, 29.3% Black, 22.2% Hispanic, and 11.7% Chinese – elevated Lp(a) (quintile 5 vs. quintiles 1-4) and CAC scores of 1-99 and above 100 (both compared with 0) were each independently associated with increased risk for ASCVD events. The hazard ratio was 1.29 (P = .02) for elevated Lp(a), 1.68 (P < .01) for a CAC score of 1-99, and 2.66 (P < .01) for a CAC score of at least 100.
The corresponding HRs in the DHS cohort were 1.54 (P = .07) for Lp(a), 3.32 (P < .01) for a CAC score of 1-99, and 5.21 (P < .01) for a CAC score of at least 100.
Of note, the authors wrote, ASCVD risk among MESA participants with a CAC score of 0 was not significantly different in those with normal and elevated Lp(a).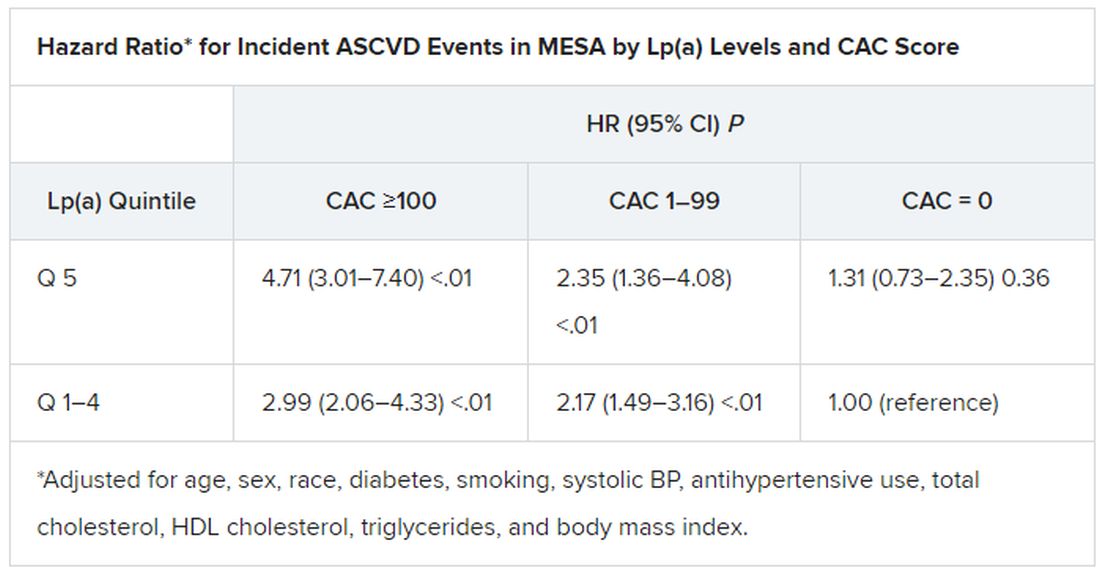
The findings were similar in the corresponding DHS analysis, the authors noted.
When both Lp(a) and CAC scores are considered as dichotomous variables, the highest 10-year ASCVD incidence in MESA was in participants with both elevated Lp(a) (≥50 mg/dL) and a high CAC score (≥100). The lowest risk was seen when Lp(a) was normal (<50 mg/dL) and the CAC score was no more than moderately high (<100).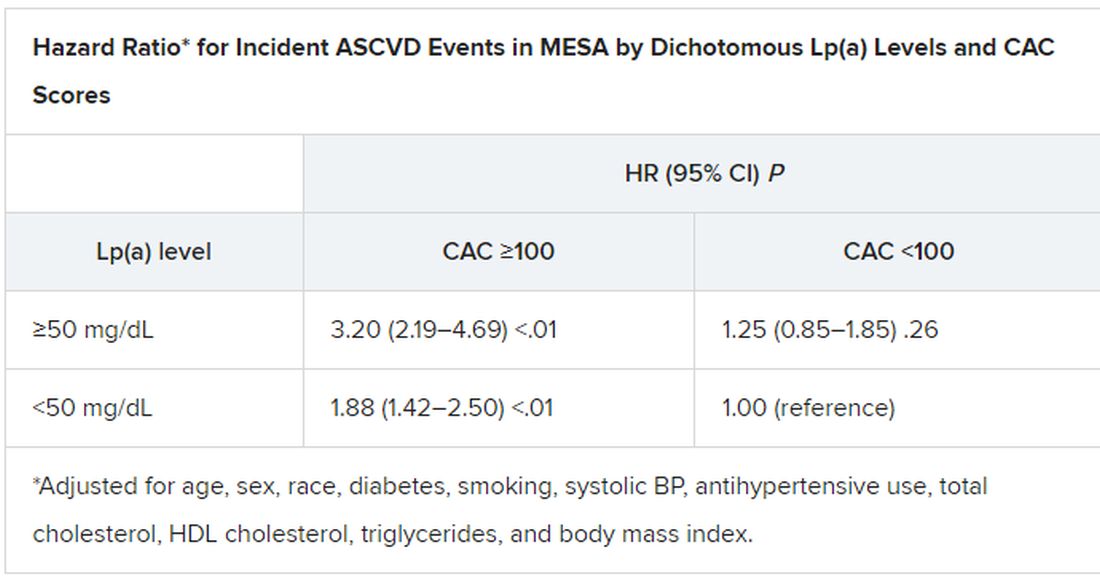
The results in the corresponding DHS analysis, according to the report, again mirrored those from MESA.
“This study has important implications for our patients and also potentially for future clinical trial design,” Dr. Blankstein noted. “A big part of developing a trial in this space is identifying the patients who are at higher risk,” and the current analysis supports CAC scores for identifying the highest-risk patient among those with elevated Lp(a).
Current wisdom is that, for the most part, Lp(a) levels are genetically mediated and are mostly unaffected by interventions such as diet management or exercise. It’s unknown whether reducing elevated Lp(a) levels pharmacologically will cut ASCVD risk, but there are a number of clinical trial programs currently aimed at learning just that. They include the Novartis-sponsored phase 3 HORIZON trial of the antisense agent pelacarsen (TQJ230), with an estimated enrollment of almost 7,700; a randomized, controlled dose-finding study of the small interfering RNA agent olpasiran (AMG890), with 290 patients and funded by Amgen; and an 88-patient phase 1 study of another siRNA agent, SLN360, supported by Silence Therapeutics.
Dr. Mehta reported no relevant relationships. Dr. Joshi has received grant support from Novo Nordisk and consulting income from Bayer and Regeneron; holds equity in G3 Therapeutics; and has served as site investigator for GlaxoSmithKline, Sanofi, AstraZeneca, and Novartis. Dr. Blankstein reported serving as a consultant to Amgen, Novartis, and Silence Therapeutics.
A version of this article first appeared on Medscape.com.
FROM THE JOURNAL OF THE AMERICAN COLLEGE OF CARDIOLOGY
What is the healthiest salt for you?
When we refer to “regular table salt,” it is most commonly in the form of sodium chloride, which is also a major constituent of packaged and ultraprocessed foods.
The best approach to finding the “healthiest salt” – which really means the lowest in sodium – is to look for the amount on the label. “Sodium-free” usually indicates less than 5 mg of sodium per serving, and “low-sodium” usually means 140 mg or less per serving. In contrast, regular table salt can contain as much as 560 mg of sodium in one serving.
Other en vogue salts, such as pink Himalayan salt, sea salt, and kosher salt, are high in sodium content – like regular table salt – but because of their larger crystal size, less sodium is delivered per serving.

Most salt substitutes are reduced in sodium, with the addition of potassium chloride instead.
FDA issues guidance on reducing salt
Currently, the U.S. sodium dietary guidelines for persons older than 14 stipulate 2,300 mg/d, which is equivalent to 1 teaspoon a day. However it is estimated that the average person in the United States consumes more than this – around 3,400 mg of sodium daily.
In October 2021, the U.S. Food and Drug Administration published guidance on voluntary sodium limitations in commercially processed, packaged, and prepared food. The FDA’s short-term approach is to slowly reduce exposure to sodium in processed and restaurant food by 2025, on the basis that people will eventually get used to less salt, as has happened in the United Kingdom and other countries.
Such strategies to reduce salt intake are now being used in national programs in several countries. Many of these successful initiatives include active engagement with the food industry to reduce the amount of sodium added to processed food, as well as public awareness campaigns to alert consumers to the dangers of eating too much salt. This includes increasing potassium in manufactured foods, primarily to target hypertension and heart disease, as described by Clare Farrand, MSc, BSc, and colleagues, in the Journal of Clinical Hypertension. The authors also make several recommendations regarding salt reduction policies:
- Food manufacturers should gradually reduce sodium in food to the lowest possible levels and explore the use of potassium-based sodium replacers to reduce sodium levels even further.
- Governments should continue to monitor sodium and potassium levels in processed foods.
- Further consideration may need to be given to how best to label salt substitutes (namely potassium) in processed foods to ensure that people who may be adversely affected are aware.
- Governments should systematically monitor potassium intake at the population level, including for specific susceptible groups.
- Governments should continue to systematically monitor sodium (salt) intake and iodine intake at the population level to adjust salt iodization over time as necessary, depending on observed salt intake in specific targeted groups, to ensure that they have sufficient but not excessive iodine intakes as salt intakes are reduced.
- Governments should consider opportunities for promoting and subsidizing salt substitutes, particularly in countries where salt added during cooking or at the table is the major source of salt in the diet.
The new FDA document includes 163 subcategories of foods in its voluntary salt reduction strategy.
Salt substitutes, high blood pressure, and mortality
Lowering sodium intake is almost certainly beneficial for persons with high blood pressure. In 2020, a review in Hypertension highlighted the benefit of salt substitutes in reducing hypertension, reporting that they lower systolic blood pressure by 5.58 mm Hg and diastolic blood pressure by 2.88 mm Hg.
And changes to dietary sodium intake can potentially reduce or obviate the need for medications for essential hypertension in some individuals. Although there are only a few studies on this topic, a study by Bruce Neal, MB, ChB, PhD, and colleagues, revealed a reduction in stroke, cardiovascular events, and deaths with the use of potassium-based salt substitutes.
Salt substitutes and sodium and potassium handling in the kidneys
Many studies have shown that potassium-rich salt substitutes are safe in individuals with normal kidney function, but are they safe and beneficial for people with chronic kidney disease (CKD)?
For anyone who is on a renal diet, potassium and sodium intake goals are limited according to their absolute level of kidney function.
There have been case reports of life-threatening blood potassium levels (hyperkalemia) due to potassium-rich salt substitutes in people with CKD, but no larger published studies on this topic can be found.
A diet modeling study by Rebecca Morrison and colleagues evaluated varying degrees of potassium-enriched salt substituted bread products and their impact on dietary intake in persons with CKD. They used dietary data from the National Nutrition and Physical Activity Survey 2011-2012 in Australia for 12,152 participants, 154 of whom had CKD. Replacing the sodium in bread with varying amounts of potassium chloride (20%, 30%, and 40%) would result in one-third of people with CKD exceeding the safe limits for dietary potassium consumption (31.8%, 32.6%, and 33%, respectively), they found.
“Potassium chloride substitution in staple foods such as bread and bread products have serious and potentially fatal consequences for people who need to restrict dietary potassium. Improved food labelling is required for consumers to avoid excessive consumption,” Ms. Morrison and colleagues concluded. They added that more studies are needed to further understand the risks of potassium dietary intake and hyperkalemia in CKD from potassium-based salt substitutes.
The American Heart Association recommends no more than 1,500 mg of sodium intake daily for persons with CKD, diabetes, or high blood pressure; those older than 51; and African American persons of any age.
The recommended daily intake of potassium in persons with CKD can range from 2,000 mg to 4,000 mg, depending on the individual and their degree of CKD. The potassium content in some salt substitutes varies from 440 mg to 2,800 mg per teaspoon.
The best recommendation for individuals with CKD and a goal to reduce their sodium intake is to use herbs and lower-sodium seasonings as a substitute, but these should always be reviewed with their physician and renal nutritionist.
Dr. Brookins is a board-certified nephrologist and internist practicing in Georgia. She is the founder and owner of Remote Renal Care, a telehealth kidney practice. She reported no relevant conflicts of interest.
A version of this article first appeared on Medscape.com.
When we refer to “regular table salt,” it is most commonly in the form of sodium chloride, which is also a major constituent of packaged and ultraprocessed foods.
The best approach to finding the “healthiest salt” – which really means the lowest in sodium – is to look for the amount on the label. “Sodium-free” usually indicates less than 5 mg of sodium per serving, and “low-sodium” usually means 140 mg or less per serving. In contrast, regular table salt can contain as much as 560 mg of sodium in one serving.
Other en vogue salts, such as pink Himalayan salt, sea salt, and kosher salt, are high in sodium content – like regular table salt – but because of their larger crystal size, less sodium is delivered per serving.
Most salt substitutes are reduced in sodium, with the addition of potassium chloride instead.
FDA issues guidance on reducing salt
Currently, the U.S. sodium dietary guidelines for persons older than 14 stipulate 2,300 mg/d, which is equivalent to 1 teaspoon a day. However it is estimated that the average person in the United States consumes more than this – around 3,400 mg of sodium daily.
In October 2021, the U.S. Food and Drug Administration published guidance on voluntary sodium limitations in commercially processed, packaged, and prepared food. The FDA’s short-term approach is to slowly reduce exposure to sodium in processed and restaurant food by 2025, on the basis that people will eventually get used to less salt, as has happened in the United Kingdom and other countries.
Such strategies to reduce salt intake are now being used in national programs in several countries. Many of these successful initiatives include active engagement with the food industry to reduce the amount of sodium added to processed food, as well as public awareness campaigns to alert consumers to the dangers of eating too much salt. This includes increasing potassium in manufactured foods, primarily to target hypertension and heart disease, as described by Clare Farrand, MSc, BSc, and colleagues, in the Journal of Clinical Hypertension. The authors also make several recommendations regarding salt reduction policies:
- Food manufacturers should gradually reduce sodium in food to the lowest possible levels and explore the use of potassium-based sodium replacers to reduce sodium levels even further.
- Governments should continue to monitor sodium and potassium levels in processed foods.
- Further consideration may need to be given to how best to label salt substitutes (namely potassium) in processed foods to ensure that people who may be adversely affected are aware.
- Governments should systematically monitor potassium intake at the population level, including for specific susceptible groups.
- Governments should continue to systematically monitor sodium (salt) intake and iodine intake at the population level to adjust salt iodization over time as necessary, depending on observed salt intake in specific targeted groups, to ensure that they have sufficient but not excessive iodine intakes as salt intakes are reduced.
- Governments should consider opportunities for promoting and subsidizing salt substitutes, particularly in countries where salt added during cooking or at the table is the major source of salt in the diet.
The new FDA document includes 163 subcategories of foods in its voluntary salt reduction strategy.
Salt substitutes, high blood pressure, and mortality
Lowering sodium intake is almost certainly beneficial for persons with high blood pressure. In 2020, a review in Hypertension highlighted the benefit of salt substitutes in reducing hypertension, reporting that they lower systolic blood pressure by 5.58 mm Hg and diastolic blood pressure by 2.88 mm Hg.
And changes to dietary sodium intake can potentially reduce or obviate the need for medications for essential hypertension in some individuals. Although there are only a few studies on this topic, a study by Bruce Neal, MB, ChB, PhD, and colleagues, revealed a reduction in stroke, cardiovascular events, and deaths with the use of potassium-based salt substitutes.
Salt substitutes and sodium and potassium handling in the kidneys
Many studies have shown that potassium-rich salt substitutes are safe in individuals with normal kidney function, but are they safe and beneficial for people with chronic kidney disease (CKD)?
For anyone who is on a renal diet, potassium and sodium intake goals are limited according to their absolute level of kidney function.
There have been case reports of life-threatening blood potassium levels (hyperkalemia) due to potassium-rich salt substitutes in people with CKD, but no larger published studies on this topic can be found.
A diet modeling study by Rebecca Morrison and colleagues evaluated varying degrees of potassium-enriched salt substituted bread products and their impact on dietary intake in persons with CKD. They used dietary data from the National Nutrition and Physical Activity Survey 2011-2012 in Australia for 12,152 participants, 154 of whom had CKD. Replacing the sodium in bread with varying amounts of potassium chloride (20%, 30%, and 40%) would result in one-third of people with CKD exceeding the safe limits for dietary potassium consumption (31.8%, 32.6%, and 33%, respectively), they found.
“Potassium chloride substitution in staple foods such as bread and bread products have serious and potentially fatal consequences for people who need to restrict dietary potassium. Improved food labelling is required for consumers to avoid excessive consumption,” Ms. Morrison and colleagues concluded. They added that more studies are needed to further understand the risks of potassium dietary intake and hyperkalemia in CKD from potassium-based salt substitutes.
The American Heart Association recommends no more than 1,500 mg of sodium intake daily for persons with CKD, diabetes, or high blood pressure; those older than 51; and African American persons of any age.
The recommended daily intake of potassium in persons with CKD can range from 2,000 mg to 4,000 mg, depending on the individual and their degree of CKD. The potassium content in some salt substitutes varies from 440 mg to 2,800 mg per teaspoon.
The best recommendation for individuals with CKD and a goal to reduce their sodium intake is to use herbs and lower-sodium seasonings as a substitute, but these should always be reviewed with their physician and renal nutritionist.
Dr. Brookins is a board-certified nephrologist and internist practicing in Georgia. She is the founder and owner of Remote Renal Care, a telehealth kidney practice. She reported no relevant conflicts of interest.
A version of this article first appeared on Medscape.com.
Oil spill cleanup work tied to hypertension risk years later
Workers who had the highest exposure to hydrocarbons during the Deepwater Horizon oil spill disaster had a higher risk of having a hypertension diagnosis in the years following the event, a new study suggests.
Results showed that the highest exposure to total petroleum hydrocarbons during the cleanup operation was associated with a 31% higher risk of new hypertension 1-3 years later.
“What is remarkable is that we still found an increased risk of hypertension a couple of years after the cleanup had been completed. This suggests working in this environment even for a short period could have long-term health consequences,” lead author Richard Kwok, PhD, told this news organization.
The study was published online in JAMA Network Open.
For the study, Dr. Kwok, a scientist at the U.S. National Institute of Environmental Health Sciences, and colleagues estimated the levels of exposure to toxic hydrocarbons in 6,846 adults who had worked on the oil spill cleanup after the Deepwater Horizon disaster in 2010, during which 200 million gallons of oil spilled into the Gulf of Mexico. They then investigated whether there was an association with the development of hypertension 1-3 years later.
“Clean-up efforts started almost immediately and lasted over a year,” Dr. Kwok noted. “In the first few months, oil flowed freely into the Gulf of Mexico which released high levels of volatile organic compounds into the air that the workers could have been exposed to. The exposures change over time because the oil becomes weathered and starts to decompose and harden. This is associated with a lower level of volatile organic compounds but can still cause damage.”
Workers involved in the cleanup may have been there for just a few days or could have spent many months at the site and would have had different exposures depending on what types of jobs they were doing, Dr. Kwok reported.
“The highest levels of exposure to total hydrocarbons would have been to those involved in the early months of the oil spill response and cleanup when the oil was flowing freely, and those who were skimming oil off the water, burning oil, handling dispersants, or involved in the decontamination of the vessels. Others who were involved in the cleanup on land or support functions would have had lower exposures,” he said.
Each worker was interviewed and asked about their activities during the cleanup operation, the location of work, and period of work. Their level of exposure to total petroleum hydrocarbons (THCs) was estimated based on their self-reported activities, and when and where they worked.
Two measures of estimated cumulative THC were calculated: cumulative maximum daily exposure, which summed the maximum daily THC exposure level, and cumulative mean exposure, which summed the mean daily exposure levels. These THC values were categorized into quintiles based on the exposure distribution among workers.
Systolic and diastolic blood pressure measurements were collected for the workers during home exams from 2011 to 2013 using automated oscillometric monitors. Newly detected hypertension was defined as either antihypertensive medication use or elevated blood pressure since the spill.
Results showed a clear dose relationship between the level of THC exposure and the development of hypertension at follow-up.
Similar results were seen for the relationship between cumulative mean THC exposure levels and the development of hypertension.
Despite the limitations of accurately estimating THC exposure, Dr. Kwok believes the results are real. “We looked at many different covariates including smoking, education, gender, race, ethnicity, and body mass index, but even after controlling for all these we still saw an association between the amount of exposure to THC and risk of hypertension.”
But the risk of developing hypertension did appear to be greater in those individuals with other risk factors for hypertension such as high body mass index or smokers. “There seems to be a combined effect,” Dr. Kwok said.
He pointed out that, while previous studies have shown possible health effects related to THC exposure on an acute basis, in this study, the effect on blood pressure was still evident years after the exposure had ended.
Other occupational studies have looked at people in jobs that have had longer exposures to volatile organic compounds such as taxi drivers, but this is one of the first to look at the long-term effect of a more limited period of exposure, he added.
“Our results suggest that the damage caused by THCs is not just an acute effect, but is still there several years later,” Dr. Kwok commented.
He says he hoped this study will raise awareness of the health hazards to workers involved in future oil spills. “Our results suggest that we need better protective equipment and monitoring of workers and the local community with longer-term follow up for health outcomes.”
Another analysis showed no clear differences in hypertension risk between individuals who worked on the oil spill cleanup (workers) and others who had completed required safety training but did not participate in the clean-up operation (nonworkers). Dr. Kwok suggested this may have been a result of the “healthy worker effect,” which is based on the premise that individuals able to work are healthier than those unable to work.
This study was funded by the Intramural Research Program of the National Institutes of Health, National Institute of Environmental Health Sciences. The authors reported no disclosures.
A version of this article first appeared on Medscape.com.
FROM JAMA NETWORK OPEN
More than half of U.S. women enter pregnancy at higher CVD risk
Less than half of women in the United States enter pregnancy in favorable cardiovascular health, new research suggests.
In 2019, among women aged 20 to 44 years with live births in the United States, only 40.2% were in favorable cardiovascular health prior to pregnancy, defined as normal weight, no diabetes, and no hypertension.
Although all regions and states showed a decline in prepregnancy favorable cardiometabolic health, there were significant differences among geographic regions in the country, the authors report. “These data reveal critical deficiencies and geographic disparities in prepregnancy cardiometabolic health,” they conclude.
“One of the things that we know in the U.S. is that the maternal mortality rate has been increasing, and there are significant differences at the state level in both adverse maternal outcomes, such as maternal mortality, as well as adverse pregnancy outcomes,” corresponding author Sadiya S. Khan, MD, MS, FACC, Northwestern University Feinberg School of Medicine, Chicago, told this news organization.
“These outcomes are often related to health factors that predate pregnancy,” Dr. Khan explained, “and the processes that begin at the very, very beginning of conception are informed by health factors prior to pregnancy, in particular cardiometabolic factors like body mass index or obesity, high blood pressure, and diabetes.”
The results were published online on Feb. 14 in a special “Go Red for Women” spotlight issue of Circulation.
Cardiometabolic health factors
Using maternal birth records from live births in the Centers for Disease Control and Prevention Natality Database between 2016 and 2019, the authors analyzed data on 14,174,625 women with live births aged 20 to 44 years. The majority (81.4%) were 20 to 34 years of age, 22.7% were Hispanic or Latina, and 52.7% were non-Hispanic White.
Favorable cardiometabolic health was defined as a BMI of 18 to 24.9 kg/m2, absence of diabetes, and absence of hypertension.
Although all regions and states experienced a decline in favorable cardiometabolic health during the study period of 2016 to 2019, with a drop overall of 3.2% – from 43.5 to 40.2 per 100 live births – it was especially true of the South and Midwest regions.
In 2019, favorable prepregnancy cardiometabolic health was lowest in the South (38.1%) and Midwest (38.8%) and highest in the West (42.2%) and Northeast (43.6%).
State by state, the lowest prevalence of favorable cardiometabolic health was found in Mississippi, at 31.2%, and highest in Utah, at 47.2%.
They also found a correlation between favorable cardiometabolic health and state-level percentages of high-school education or less and enrollment in Medicaid in 2019.
Similar to what has been seen with cardiovascular disease, “we observe that the states with the lowest prevalence of favorable cardiometabolic health were in the Southeast United States,” said Dr. Khan, “and similar geographic variation was observed with some more patterns in education and Medicaid coverage for birth, and these were used as proxies for socioeconomic status in those areas.”
Although Dr. Khan notes that the relationships cannot be determined to be causal from this analysis, she said that “it does suggest that upstream social determinants of health are important determinants of cardiometabolic health.”
Socioeconomic intervention
Dr. Khan noted that policies at the federal and state level can identify ways to “ensure that individuals who are thinking about pregnancy have access to health care and have access to resources, too, from a broad range of health determinants, including housing stability, food security, as well as access to health care be optimized prior to pregnancy.”
The authors note that this analysis may actually overestimate the prevalence of favorable cardiometabolic health, and data on cholesterol, diet, a distinction between type 1 and type 2 diabetes, and physical activity were not available.
Only individuals with live births were included, which could result in the elimination of a potentially high-risk group; however, late pregnancy losses represent less than 0.3% of all pregnancies, they say.
The authors conclude that “future research is needed to equitably improve health prior to pregnancy and quantify the potential benefits in cardiovascular disease outcomes for birthing individuals and their offspring.”
This work was supported by grants from the National Heart, Lung, and Blood Institute and American Heart Association Transformational Project Award awarded to Sadiya S. Khan.
A version of this article first appeared on Medscape.com.