User login
Interventions significantly improve NICU immunization rates
according to a study in Pediatrics.

Investigators led by Raymond C. Stetson, MD, of the Mayo Clinic in Rochester, Minn., identified three root causes of underimmunization in a NICU at Mayo Clinic: providers’ lack of knowledge about recommended immunization schedules; immunizations not being ordered when they were due; and parental hesitancy toward vaccination. They addressed these causes with the following five phases of intervention: an intranet resource educating providers about vaccine schedules and dosing intervals; a spreadsheet-based checklist to track and flag immunization status; an intranet resource aimed at discussion with vaccine-hesitant parents; education about safety in providing immunization and review of material from the first three interventions; and education about documentation, including parental consent.
Over the project period, 1,242 infants were discharged or transferred from the NICU. The study included a 6-month “improve phase,” during which interventions were implemented, and a “control phase,” during which the ongoing effects after implementation were observed. At baseline, the rate of fully immunized infants in the NICU was only 56% by time of discharge or transfer, but during the combined improve and control phases, it was 93% with a P value of less than .001.
One of the limitations of the study is that the first three interventions were introduced simultaneously, which makes it hard to determine how much effect each might have had.
“Infants treated in NICUs represent a vulnerable population with the potential for high morbidity and mortality from vaccine-preventable infections,” the investigators wrote. “Our [quality improvement] effort, and others, demonstrate that this population is at risk for underimmunization and that immunization rates can be improved with a small number of interventions. Additionally, we were able to significantly decrease the number of days that immunizations were delayed compared to the routine infant vaccination schedule.”
There was no external funding for the study. One of the coauthors is on safety committees of vaccine studies for Merck. The other authors have no relevant financial disclosures.
SOURCE: Stetson R et al. Pediatr. 2019. doi: 10.1542/peds.2019-0337.
according to a study in Pediatrics.
Investigators led by Raymond C. Stetson, MD, of the Mayo Clinic in Rochester, Minn., identified three root causes of underimmunization in a NICU at Mayo Clinic: providers’ lack of knowledge about recommended immunization schedules; immunizations not being ordered when they were due; and parental hesitancy toward vaccination. They addressed these causes with the following five phases of intervention: an intranet resource educating providers about vaccine schedules and dosing intervals; a spreadsheet-based checklist to track and flag immunization status; an intranet resource aimed at discussion with vaccine-hesitant parents; education about safety in providing immunization and review of material from the first three interventions; and education about documentation, including parental consent.
Over the project period, 1,242 infants were discharged or transferred from the NICU. The study included a 6-month “improve phase,” during which interventions were implemented, and a “control phase,” during which the ongoing effects after implementation were observed. At baseline, the rate of fully immunized infants in the NICU was only 56% by time of discharge or transfer, but during the combined improve and control phases, it was 93% with a P value of less than .001.
One of the limitations of the study is that the first three interventions were introduced simultaneously, which makes it hard to determine how much effect each might have had.
“Infants treated in NICUs represent a vulnerable population with the potential for high morbidity and mortality from vaccine-preventable infections,” the investigators wrote. “Our [quality improvement] effort, and others, demonstrate that this population is at risk for underimmunization and that immunization rates can be improved with a small number of interventions. Additionally, we were able to significantly decrease the number of days that immunizations were delayed compared to the routine infant vaccination schedule.”
There was no external funding for the study. One of the coauthors is on safety committees of vaccine studies for Merck. The other authors have no relevant financial disclosures.
SOURCE: Stetson R et al. Pediatr. 2019. doi: 10.1542/peds.2019-0337.
FROM PEDIATRICS
Twin births down among women 30 and older
according to the National Center for Health Statistics.
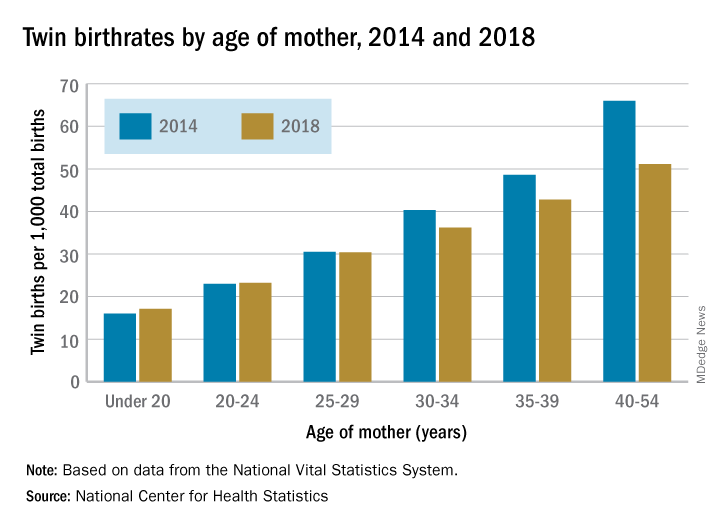
The twin birthrate, which had increased by 79% during 1980-2014, fell by 4% during 2014-2018, but that decline was “not universal across maternal age and race and Hispanic-origin groups,” the NCHS investigators said.
Twin birthrates fell by at least 10% for mothers aged 30 years and older from 2014 to 2018 but held steady for women in their twenties. Over that same period, the twin birthrate fell by a significant 7% among non-Hispanic white women (36.7 to 34.3 per 1,000 total births) but increased just slightly for non-Hispanic black women (40.0 to 40.5 per 1,000) and Hispanic women (24.1 to 24.4), the investigators reported.
For women 30 years and older, the drops in twin births got larger as age increased and were significant for each age group. The rate for women aged 30-34 years fell 10% as it went from 40.3 per 1,000 total births in 2014 to 36.2 per 1,000. The decrease was 12% (from 48.6 per 1,000 to 42.8) for women aged 35-39 and 23% (from 66.0 to 51.1) for those aged 40 years and older, they said based on data from the National Vital Statistics System.
The rates were basically unchanged for women in their 20s, from 23.0 to 23.2 in 20- to 24-year-olds and 30.5 to 30.4 in 25- to 29-year-olds – but there was a significant increase for the youngest group with rates among those younger than 20 years going from 16.0 to 17.1 per 1,000, the report showed.
according to the National Center for Health Statistics.
The twin birthrate, which had increased by 79% during 1980-2014, fell by 4% during 2014-2018, but that decline was “not universal across maternal age and race and Hispanic-origin groups,” the NCHS investigators said.
Twin birthrates fell by at least 10% for mothers aged 30 years and older from 2014 to 2018 but held steady for women in their twenties. Over that same period, the twin birthrate fell by a significant 7% among non-Hispanic white women (36.7 to 34.3 per 1,000 total births) but increased just slightly for non-Hispanic black women (40.0 to 40.5 per 1,000) and Hispanic women (24.1 to 24.4), the investigators reported.
For women 30 years and older, the drops in twin births got larger as age increased and were significant for each age group. The rate for women aged 30-34 years fell 10% as it went from 40.3 per 1,000 total births in 2014 to 36.2 per 1,000. The decrease was 12% (from 48.6 per 1,000 to 42.8) for women aged 35-39 and 23% (from 66.0 to 51.1) for those aged 40 years and older, they said based on data from the National Vital Statistics System.
The rates were basically unchanged for women in their 20s, from 23.0 to 23.2 in 20- to 24-year-olds and 30.5 to 30.4 in 25- to 29-year-olds – but there was a significant increase for the youngest group with rates among those younger than 20 years going from 16.0 to 17.1 per 1,000, the report showed.
NICUs admitting more normal-weight newborns
Almost half of the newborns admitted to U.S. neonatal intensive care units in 2017 were of normal birth weight, according to a new report from the Dartmouth Institute for Health Policy & Clinical Practice.
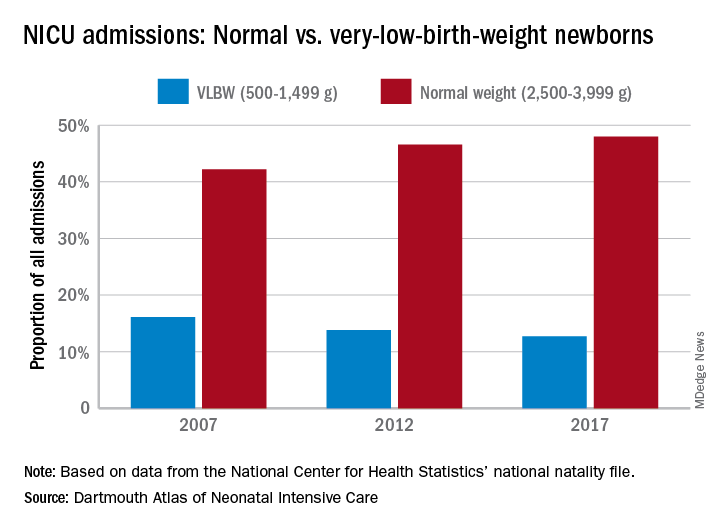
The proportion of NICU admissions involving normal-weight (2,500-3,999 g) newborns increased from 42% in 2007 to 48% in 2017, investigators said in the Dartmouth Atlas of Neonatal Intensive Care. Over that same period, admissions of very-low-birth-weight (500-1,499 g) babies dropped from 16% to 13% of the total.
Those changes were part of a larger, longer-term trend. “The expansion of NICUs and beds in recent decades has been associated with changes in the newborn population receiving NICU care,” the investigators said in the report.
The number of NICU beds increased by 65% from 1995 to 2013, and the number of neonatologists rose by 75% from 1996 to 2013. “At the same time, ” they said in a written statement.
The increases in NICU and neonatologist supply, however, did not always follow the need for such care. Areas of the country with high rates of newborn prematurity, or of risk factors such as low maternal education levels or high cesarean section rates, do not have higher supplies of NICU beds or neonatologists, the researchers noted.
“We should not spare a dollar in providing the best care for newborns. But spending more doesn’t help infants if they could receive the care they need in a maternity unit or home with their mothers. It is very troubling that such a valuable and expensive health care resource is not distributed where it is needed,” said principal author David C. Goodman, MD, of the Dartmouth Institute for Health Policy & Clinical Practice in Lebanon, N.H.
Almost half of the newborns admitted to U.S. neonatal intensive care units in 2017 were of normal birth weight, according to a new report from the Dartmouth Institute for Health Policy & Clinical Practice.
The proportion of NICU admissions involving normal-weight (2,500-3,999 g) newborns increased from 42% in 2007 to 48% in 2017, investigators said in the Dartmouth Atlas of Neonatal Intensive Care. Over that same period, admissions of very-low-birth-weight (500-1,499 g) babies dropped from 16% to 13% of the total.
Those changes were part of a larger, longer-term trend. “The expansion of NICUs and beds in recent decades has been associated with changes in the newborn population receiving NICU care,” the investigators said in the report.
The number of NICU beds increased by 65% from 1995 to 2013, and the number of neonatologists rose by 75% from 1996 to 2013. “At the same time, ” they said in a written statement.
The increases in NICU and neonatologist supply, however, did not always follow the need for such care. Areas of the country with high rates of newborn prematurity, or of risk factors such as low maternal education levels or high cesarean section rates, do not have higher supplies of NICU beds or neonatologists, the researchers noted.
“We should not spare a dollar in providing the best care for newborns. But spending more doesn’t help infants if they could receive the care they need in a maternity unit or home with their mothers. It is very troubling that such a valuable and expensive health care resource is not distributed where it is needed,” said principal author David C. Goodman, MD, of the Dartmouth Institute for Health Policy & Clinical Practice in Lebanon, N.H.
Procalcitonin advocated to help rule out bacterial infections
SEATTLE – Procalcitonin, a marker of bacterial infection, rises and peaks sooner than C-reactive protein (CRP), and is especially useful to help rule out invasive bacterial infections in young infants and pediatric community acquired pneumonia due to typical bacteria, according to a presentation at the 2019 Pediatric Hospital Medicine Conference.

It’s “excellent for identifying low risk patients” and has the potential to decrease lumbar punctures and antibiotic exposure, but “the specificity isn’t great,” so there’s the potential for false positives, said Russell McCulloh, MD, a pediatric infectious disease specialist at the University of Nebraska Medical Center, Omaha.
There was great interest in procalcitonin at the meeting; the presentation room was packed, with a line out the door. It’s used mostly in Europe at this point. Testing is available in many U.S. hospitals, but a large majority of audience members, when polled, said they don’t currently use it in clinical practice, and that it’s not a part of diagnostic algorithms at their institutions.
Levels of procalcitonin, a calcitonin precursor normally produced by the thyroid, are low or undetectable in healthy people, but inflammation, be it from infectious or noninfectious causes, triggers production by parenchymal cells throughout the body.
Levels began to rise as early as 2.5 hours after healthy subjects in one study were injected with bacterial endotoxins, and peaked as early as 6 hours; CRP, in contrast, started to rise after 12 hours, and peaked at 30 hours. Procalcitonin levels also seem to correlate with bacterial load and severity of infection, said Nivedita Srinivas, MD, a pediatric infectious disease specialist at Stanford (Calif.) University (J Pediatr Intensive Care. 2016 Dec;5[4]:162-71).
Due to time, the presenters focused their talk on community acquired pneumonia (CAP) and invasive bacterial infections (IBI) in young infants, meaning essentially bacteremia and meningitis.
Different studies use different cutoffs, but a procalcitonin below, for instance, 0.5 ng/mL is “certainly more sensitive [for IBI] than any single biomarker we currently use,” including CRP, white blood cells, and absolute neutrophil count (ANC). “If it’s negative, you’re really confident it’s negative,” but “a positive test does not necessarily indicate the presence of IBI,” Dr. McCulloh said (Pediatrics. 2012 Nov;130[5]:815-22).
“Procalcitonin works really well as part of a validated step-wise rule” that includes, for instance, CRP and ANC; “I think that’s where its utility is. On its own, it is not a substitute for you examining the patient and doing your basic risk stratification, but it may enhance your decision making incrementally above what we currently have,” he said.
Meanwhile, in a study of 532 children a median age of 2.4 years with radiographically confirmed CAP, procalcitonin levels were a median of 6.1 ng/mL in children whose pneumonia was caused by Streptococcus pneumoniae or other typical bacteria, and no child infected with typical bacteria had a level under 0.1 ng/mL. Below that level, “you can be very sure you do not have typical bacteria pneumonia,” said Marie Wang, MD, also a pediatric infectious disease specialist at Stanford (J Pediatric Infect Dis Soc. 2018 Feb 19;7[1]:46-53).
As procalcitonin levels went up, the likelihood of having bacterial pneumonia increased; at 2 ng/mL, 26% of subjects were infected with typical bacteria, “but even in that group, 58% still had viral infection, so you are still detecting a lot of viral” disease, she said.
Prolcalcitonin-guided therapy – antibiotics until patients fall below a level of 0.25 ng/ml, for instance – has also been associated with decreased antibiotic exposure (Respir Med. 2011 Dec;105[12]:1939-45).
The speakers had no disclosures. The meeting was sponsored by the Society of Hospital Medicine, the American Academy of Pediatrics, and the Academic Pediatric Association.
SEATTLE – Procalcitonin, a marker of bacterial infection, rises and peaks sooner than C-reactive protein (CRP), and is especially useful to help rule out invasive bacterial infections in young infants and pediatric community acquired pneumonia due to typical bacteria, according to a presentation at the 2019 Pediatric Hospital Medicine Conference.
It’s “excellent for identifying low risk patients” and has the potential to decrease lumbar punctures and antibiotic exposure, but “the specificity isn’t great,” so there’s the potential for false positives, said Russell McCulloh, MD, a pediatric infectious disease specialist at the University of Nebraska Medical Center, Omaha.
There was great interest in procalcitonin at the meeting; the presentation room was packed, with a line out the door. It’s used mostly in Europe at this point. Testing is available in many U.S. hospitals, but a large majority of audience members, when polled, said they don’t currently use it in clinical practice, and that it’s not a part of diagnostic algorithms at their institutions.
Levels of procalcitonin, a calcitonin precursor normally produced by the thyroid, are low or undetectable in healthy people, but inflammation, be it from infectious or noninfectious causes, triggers production by parenchymal cells throughout the body.
Levels began to rise as early as 2.5 hours after healthy subjects in one study were injected with bacterial endotoxins, and peaked as early as 6 hours; CRP, in contrast, started to rise after 12 hours, and peaked at 30 hours. Procalcitonin levels also seem to correlate with bacterial load and severity of infection, said Nivedita Srinivas, MD, a pediatric infectious disease specialist at Stanford (Calif.) University (J Pediatr Intensive Care. 2016 Dec;5[4]:162-71).
Due to time, the presenters focused their talk on community acquired pneumonia (CAP) and invasive bacterial infections (IBI) in young infants, meaning essentially bacteremia and meningitis.
Different studies use different cutoffs, but a procalcitonin below, for instance, 0.5 ng/mL is “certainly more sensitive [for IBI] than any single biomarker we currently use,” including CRP, white blood cells, and absolute neutrophil count (ANC). “If it’s negative, you’re really confident it’s negative,” but “a positive test does not necessarily indicate the presence of IBI,” Dr. McCulloh said (Pediatrics. 2012 Nov;130[5]:815-22).
“Procalcitonin works really well as part of a validated step-wise rule” that includes, for instance, CRP and ANC; “I think that’s where its utility is. On its own, it is not a substitute for you examining the patient and doing your basic risk stratification, but it may enhance your decision making incrementally above what we currently have,” he said.
Meanwhile, in a study of 532 children a median age of 2.4 years with radiographically confirmed CAP, procalcitonin levels were a median of 6.1 ng/mL in children whose pneumonia was caused by Streptococcus pneumoniae or other typical bacteria, and no child infected with typical bacteria had a level under 0.1 ng/mL. Below that level, “you can be very sure you do not have typical bacteria pneumonia,” said Marie Wang, MD, also a pediatric infectious disease specialist at Stanford (J Pediatric Infect Dis Soc. 2018 Feb 19;7[1]:46-53).
As procalcitonin levels went up, the likelihood of having bacterial pneumonia increased; at 2 ng/mL, 26% of subjects were infected with typical bacteria, “but even in that group, 58% still had viral infection, so you are still detecting a lot of viral” disease, she said.
Prolcalcitonin-guided therapy – antibiotics until patients fall below a level of 0.25 ng/ml, for instance – has also been associated with decreased antibiotic exposure (Respir Med. 2011 Dec;105[12]:1939-45).
The speakers had no disclosures. The meeting was sponsored by the Society of Hospital Medicine, the American Academy of Pediatrics, and the Academic Pediatric Association.
EXPERT ANALYSIS FROM PHM 2019
In newborns, concentrated urine helps rule out UTI
SEATTLE – according to investigators at the University of Texas Health Science Center, Houston.

The researchers found that urine testing negative for nitrites with a specific gravity above 1.015 in children up to 2 months old had a sensitivity of 53% for ruling out UTIs, but that urine with a specific gravity below that mark had a sensitivity of just 14%. The finding “should be taken into account when interpreting nitrite results ... in this high-risk population,” they concluded.
Bacteria in the bladder convert nitrates to nitrites, so positive results are pretty much pathognomonic for UTIs, with a specificity of nearly 100%, according to the researchers.
Negative results, however, don’t reliably rule out infection, and are even less reliable in infants because they urinate frequently, which means they usually flush out bacteria before they have enough time to make the conversion, which takes several hours, they said.
The lead investigator Raymond Parlar-Chun, MD, an assistant professor of pediatrics at the University of Texas McGovern Medical School in Houston, said he had a hunch that negative results might be more reliable when newborns urinate less frequently and have more concentrated urine.
He and his team reviewed data collected on 413 infants up to 2 months old who were admitted for fever workup and treated for UTIs both in the hospital and after discharge. Nitrite results were stratified by urine concentration. A specific gravity of 1.015 was used as the cutoff between concentrated and dilute urine, which was “midway between the parameters reported” in every urinalysis, Dr. Parlar-Chun said.
Although the sensitivity of concentrated urine was only 53%, “it’s a stark difference from” the 14% in dilute urine, he said.“You should take a look at specific gravity to interpret nitrites. If urine is concentrated, you have [more confidence] that you don’t have a UTI if you’re negative. It’s better than taking [nitrites] at face value.”
The subjects were 31 days old, on average, and 62% were boys; 112 had a specific gravity above 1.015, and 301 below.
There was no external funding, and Dr. Parlar-Chun didn’t have any disclosures.
SEATTLE – according to investigators at the University of Texas Health Science Center, Houston.
The researchers found that urine testing negative for nitrites with a specific gravity above 1.015 in children up to 2 months old had a sensitivity of 53% for ruling out UTIs, but that urine with a specific gravity below that mark had a sensitivity of just 14%. The finding “should be taken into account when interpreting nitrite results ... in this high-risk population,” they concluded.
Bacteria in the bladder convert nitrates to nitrites, so positive results are pretty much pathognomonic for UTIs, with a specificity of nearly 100%, according to the researchers.
Negative results, however, don’t reliably rule out infection, and are even less reliable in infants because they urinate frequently, which means they usually flush out bacteria before they have enough time to make the conversion, which takes several hours, they said.
The lead investigator Raymond Parlar-Chun, MD, an assistant professor of pediatrics at the University of Texas McGovern Medical School in Houston, said he had a hunch that negative results might be more reliable when newborns urinate less frequently and have more concentrated urine.
He and his team reviewed data collected on 413 infants up to 2 months old who were admitted for fever workup and treated for UTIs both in the hospital and after discharge. Nitrite results were stratified by urine concentration. A specific gravity of 1.015 was used as the cutoff between concentrated and dilute urine, which was “midway between the parameters reported” in every urinalysis, Dr. Parlar-Chun said.
Although the sensitivity of concentrated urine was only 53%, “it’s a stark difference from” the 14% in dilute urine, he said.“You should take a look at specific gravity to interpret nitrites. If urine is concentrated, you have [more confidence] that you don’t have a UTI if you’re negative. It’s better than taking [nitrites] at face value.”
The subjects were 31 days old, on average, and 62% were boys; 112 had a specific gravity above 1.015, and 301 below.
There was no external funding, and Dr. Parlar-Chun didn’t have any disclosures.
REPORTING FROM PHM 2019

U.S. fertility rate, teen births are on the decline
The general fertility rate in the United States decreased 2% between 2017 and 2018, according to a report from the Centers for Disease Control and Prevention.
Fertility rates, defined as births per 1,000 women aged 15-44 years, declined for all racial/ethnic groups studied.
Teen birth rates, or births among girls aged 15-19 years, declined from 2017 to 2018 as well.
These data come from the National Vital Statistics System’s Natality Data File, which includes information from birth certificates for all births in the United States.
The data show a decline in the general fertility rate from 60.3 per 1,000 women in 2017 to 59.1 per 1,000 women in 2018, a significant decrease (P less than .05).
Fertility rates declined across the three largest racial/ethnic groups studied, decreasing:
- 3% in Hispanic women, from 67.6 to 65.9 per 1,000.
- 2% in non-Hispanic black women, from 63.1 to 62.0 per 1,000.
- 2% in non-Hispanic white women, from 57.2 to 56.3 per 1,000.
Similarly, teen birth rates declined 7% from 2017 to 2018, decreasing from 18.8 to 17.4 births per 1,000 girls aged 15-19 years (P less than .05). Rates decreased:
- 8% in Hispanic teens, from 28.9 to 26.7 per 1,000.
- 4% in non-Hispanic black teens, from 27.5 to 26.3 per 1,000.
- 8% in non-Hispanic white teens, from 13.2 to 12.1 per 1,000.
The data also show an increase in the rate of vaginal births after previous cesarean (VBAC) delivery. The percentage of VBAC deliveries increased from 12.8% in 2017 to 13.3% in 2018 (P less than .05).
VBAC delivery rates increased across all racial/ethnic groups studied, although the increase among non-Hispanic back women was not significant.
Finally, the report shows an increase in preterm and early term births from 2017 to 2018. Preterm deliveries (less than 37 weeks of gestation) increased from 9.93% to 10.02%, and early term deliveries (37-38 weeks) increased from 26.00% to 26.53% (P less than .05).
At the same time, full-term births (39-40 weeks) decreased from 57.49% to 57.24%, and late- and post-term births (41 weeks or more) decreased from 6.58 % to 6.20% (P less than .05). These findings were consistent across the racial/ethnic groups studied.
SOURCE: Martin JA et al. NCHS Data Brief. 2019 July; no 346.
Mothers, migraine, colic ... and sleep
In a recent article on this website, Jake Remaly reports on a study suggesting that maternal migraine is associated with infant colic. In a presentation at the annual meeting of the American Headache Society, Amy Gelfand, MD, a neurologist at the University of California, San Francisco, reported the results of a national survey of more than 1,400 parents (827 mothers, 592 fathers) collected via social media. She and her colleagues found that mothers with migraine were more likely to have an infant with colic, with an odds ratio of 1.7 that increased to 2.5 for mothers with more frequent migraine. Fathers with migraine were no more likely to have an infant with colic.

In a video clip included in the article, Dr. Gelfand discusses the possibilities that she and her group considered as they attempted to explain the study’s findings. Are there such things as “migraine genes?” If so, the failure to discover a paternal association might suggest that these would be mitochondrial genes. The researchers wondered if a substance in breast milk was acting as trigger, but they found that the association between colic and migraine was unrelated to whether the baby was fed by breast or bottle.
In full disclosure, I was not one of the investigators. Neither my wife nor I have migraine, and although our children cried as infants, they wouldn’t have qualified as having colic. However, I spent more than 40 years immersed in more than 300,000 patient encounters and can claim membership in the International Brother/Sisterhood of Anecdotal Observers. And, as such will offer up my explanation for Dr. Gelfand’s findings.
It is clear to me that most, if not all, children with migraine have their headaches when they are sleep deprived. While my sample size is smaller, I believe the same association also is true for many of the adults I know who have migraine. At least in children, restorative sleep ends the migraine much as it does for an epileptic seizure.
Traditionally, colic has been thought to be somehow related to a gastrointestinal phenomenon by many extended family members and some physicians. However, in my experience, it is usually a symptom of sleep deprivation compounded by the failure of those around the children to realize the obvious and take appropriate action. Of course, some babies are reacting to sore tummies, but my guess is that most are having headaches. We may never know. Dr. Gelfand also shares my observation that colicky crying is more likely to occur “at the end of the day,” a time when we are tired and are less tolerant of overstimulation.
However, the presentation varies depending on the age of the patients. Remember, infants can’t talk. It already has been shown that adults with migraine often were more likely to have been colicky infants. (Dr. Gelfand mentions this as well.) These unfortunate individuals probably have inherited a vulnerability to sleep deprivation that manifests itself as a headache. I hope to live long enough to be around when someone discovers the wrinkle in the genome that creates this vulnerability.

So, why did the researchers fail to find an association between fathers and colic? The answer is simple. We fathers are beginning to take on a larger role in parenting of infants and like to complain about how difficult it is. However, it is mothers who still have the lioness’ share of the work. They lose the most sleep and are starting off parenthood with 9 months of less than optimal sleep followed by who knows how many hours of energy-sapping labor. It’s surprising they all don’t have migraines.
Dr. Wilkoff practiced primary care pediatrics in Brunswick, Maine for nearly 40 years. He has authored several books on behavioral pediatrics, including “How to Say No to Your Toddler.” Email him at [email protected].
In a recent article on this website, Jake Remaly reports on a study suggesting that maternal migraine is associated with infant colic. In a presentation at the annual meeting of the American Headache Society, Amy Gelfand, MD, a neurologist at the University of California, San Francisco, reported the results of a national survey of more than 1,400 parents (827 mothers, 592 fathers) collected via social media. She and her colleagues found that mothers with migraine were more likely to have an infant with colic, with an odds ratio of 1.7 that increased to 2.5 for mothers with more frequent migraine. Fathers with migraine were no more likely to have an infant with colic.
In a video clip included in the article, Dr. Gelfand discusses the possibilities that she and her group considered as they attempted to explain the study’s findings. Are there such things as “migraine genes?” If so, the failure to discover a paternal association might suggest that these would be mitochondrial genes. The researchers wondered if a substance in breast milk was acting as trigger, but they found that the association between colic and migraine was unrelated to whether the baby was fed by breast or bottle.
In full disclosure, I was not one of the investigators. Neither my wife nor I have migraine, and although our children cried as infants, they wouldn’t have qualified as having colic. However, I spent more than 40 years immersed in more than 300,000 patient encounters and can claim membership in the International Brother/Sisterhood of Anecdotal Observers. And, as such will offer up my explanation for Dr. Gelfand’s findings.
It is clear to me that most, if not all, children with migraine have their headaches when they are sleep deprived. While my sample size is smaller, I believe the same association also is true for many of the adults I know who have migraine. At least in children, restorative sleep ends the migraine much as it does for an epileptic seizure.
Traditionally, colic has been thought to be somehow related to a gastrointestinal phenomenon by many extended family members and some physicians. However, in my experience, it is usually a symptom of sleep deprivation compounded by the failure of those around the children to realize the obvious and take appropriate action. Of course, some babies are reacting to sore tummies, but my guess is that most are having headaches. We may never know. Dr. Gelfand also shares my observation that colicky crying is more likely to occur “at the end of the day,” a time when we are tired and are less tolerant of overstimulation.
However, the presentation varies depending on the age of the patients. Remember, infants can’t talk. It already has been shown that adults with migraine often were more likely to have been colicky infants. (Dr. Gelfand mentions this as well.) These unfortunate individuals probably have inherited a vulnerability to sleep deprivation that manifests itself as a headache. I hope to live long enough to be around when someone discovers the wrinkle in the genome that creates this vulnerability.
So, why did the researchers fail to find an association between fathers and colic? The answer is simple. We fathers are beginning to take on a larger role in parenting of infants and like to complain about how difficult it is. However, it is mothers who still have the lioness’ share of the work. They lose the most sleep and are starting off parenthood with 9 months of less than optimal sleep followed by who knows how many hours of energy-sapping labor. It’s surprising they all don’t have migraines.
Dr. Wilkoff practiced primary care pediatrics in Brunswick, Maine for nearly 40 years. He has authored several books on behavioral pediatrics, including “How to Say No to Your Toddler.” Email him at [email protected].

First-time fathers at risk of postnatal depressive symptoms
First-time fathers may be at risk of experiencing depressive symptoms as they transition to parenthood – especially if risk factors such as poor sleep are present, results of a prospective study of more than 600 new fathers show.

“Strategies to promote better sleep, mobilize social support, and strengthen the couple relationship may be important to address in innovative interventions tailored to new fathers at risk for depression during the perinatal period,” wrote Deborah Da Costa, PhD, of McGill University, Montreal, and colleagues. The study was published in the Journal of Affective Disorders.
To determine the prevalence of depressive symptoms in first-time fathers and identify notable risk factors, the researchers surveyed 622 Canadian men during their partner’s third trimester. The same group was surveyed again at 2 and 6 months postpartum. Depression was assessed via the Edinburgh Postnatal Depression Scale (EPDS), and additional variables such as sleep quality, social support, and stress were gathered as well.
Of the initial 622 men surveyed, 487 (78.3%) and 375 (60.3%) completed the questionnaires at 2 and 6 months postpartum, respectively. The prevalence of paternal depressive symptoms was 13.76% (95% confidence interval, 10.70-16.82) at 2 months and 13.6% (95% CI, 10.13-17.07) at 6 months. Of the men who reported depressive symptoms at 2 months postpartum, 40.3% also experienced symptoms during the third trimester. Of the men who reported depressive symptoms at 6 months postpartum, 24% experienced symptoms during the third trimester and after 2 months.
At 2 months, the risk of depressive symptoms increased for men with worse sleep quality (odds ratio, 1.25; 95% CI, 1.10-1.42), poorer couple relationship adjustment (OR, 0.97; 95% CI, 0.94-0.99), and higher parenting stress (OR, 1.07; 95% CI, 1.02-1.11). At 6 months, there was a significant association between paternal depressive symptoms and unemployment (OR, 3.75; 95% CI, 1.00-13.72), poorer sleep quality (OR, 1.37; 95% CI, 1.16-1.65), lower social support (OR, 0.92; 95% CI, 0.84-1.00), poorer couple relationship adjustment (OR, 0.95; 95% CI, 0.92-0.98), and higher financial stress (OR, 1.21; 95% CI, 1.04-1.42).
The authors acknowledged their study’s limitations, including a middling response rate that could affect the accuracy of prevalence estimates and a well-educated, largely middle-class sample that could limit generalizability. In addition, they assessed depressive symptoms by self-report and not diagnostic clinical interviews. However, they also noted that “the EPDS is the most widely used tool to assess depressive symptoms in parents during the perinatal period and was validated in expectant and new fathers.”
The study was funded by the Canadian Institutes of Health Research. No conflicts of interest were reported.
SOURCE: Da Costa D et al. J Affect Disord. 2019 Apr 15;249:371-7.
First-time fathers may be at risk of experiencing depressive symptoms as they transition to parenthood – especially if risk factors such as poor sleep are present, results of a prospective study of more than 600 new fathers show.
“Strategies to promote better sleep, mobilize social support, and strengthen the couple relationship may be important to address in innovative interventions tailored to new fathers at risk for depression during the perinatal period,” wrote Deborah Da Costa, PhD, of McGill University, Montreal, and colleagues. The study was published in the Journal of Affective Disorders.
To determine the prevalence of depressive symptoms in first-time fathers and identify notable risk factors, the researchers surveyed 622 Canadian men during their partner’s third trimester. The same group was surveyed again at 2 and 6 months postpartum. Depression was assessed via the Edinburgh Postnatal Depression Scale (EPDS), and additional variables such as sleep quality, social support, and stress were gathered as well.
Of the initial 622 men surveyed, 487 (78.3%) and 375 (60.3%) completed the questionnaires at 2 and 6 months postpartum, respectively. The prevalence of paternal depressive symptoms was 13.76% (95% confidence interval, 10.70-16.82) at 2 months and 13.6% (95% CI, 10.13-17.07) at 6 months. Of the men who reported depressive symptoms at 2 months postpartum, 40.3% also experienced symptoms during the third trimester. Of the men who reported depressive symptoms at 6 months postpartum, 24% experienced symptoms during the third trimester and after 2 months.
At 2 months, the risk of depressive symptoms increased for men with worse sleep quality (odds ratio, 1.25; 95% CI, 1.10-1.42), poorer couple relationship adjustment (OR, 0.97; 95% CI, 0.94-0.99), and higher parenting stress (OR, 1.07; 95% CI, 1.02-1.11). At 6 months, there was a significant association between paternal depressive symptoms and unemployment (OR, 3.75; 95% CI, 1.00-13.72), poorer sleep quality (OR, 1.37; 95% CI, 1.16-1.65), lower social support (OR, 0.92; 95% CI, 0.84-1.00), poorer couple relationship adjustment (OR, 0.95; 95% CI, 0.92-0.98), and higher financial stress (OR, 1.21; 95% CI, 1.04-1.42).
The authors acknowledged their study’s limitations, including a middling response rate that could affect the accuracy of prevalence estimates and a well-educated, largely middle-class sample that could limit generalizability. In addition, they assessed depressive symptoms by self-report and not diagnostic clinical interviews. However, they also noted that “the EPDS is the most widely used tool to assess depressive symptoms in parents during the perinatal period and was validated in expectant and new fathers.”
The study was funded by the Canadian Institutes of Health Research. No conflicts of interest were reported.
SOURCE: Da Costa D et al. J Affect Disord. 2019 Apr 15;249:371-7.
FROM THE JOURNAL OF AFFECTIVE DISORDERS
Maternal migraine is associated with infant colic
PHILADELPHIA – , according to research presented at the annual meeting of the American Headache Society. Fathers with migraine are not more likely to have children with colic, however. These findings may have implications for the care of mothers with migraine and their children, said Amy Gelfand, MD, associate professor of neurology at the University of California, San Francisco.
Smaller studies have suggested associations between migraine and colic. To examine this relationship in a large, national sample, Dr. Gelfand and her research colleagues conducted a cross-sectional survey of biological parents of 4- to 8-week-olds in the United States. The researchers analyzed data from 1,419 participants – 827 mothers and 592 fathers – who completed online surveys in 2017 and 2018.
Parents provided information about their and their infants’ health. The investigators identified migraineurs using modified International Classification of Headache Disorders 3rd edition criteria and determined infant colic by response to the question, “Has your baby cried for at least 3 hours on at least 3 days in the last week?”
In all, 33.5% of the mothers had migraine or probable migraine, and 20.8% of the fathers had migraine or probable migraine. Maternal migraine was associated with increased odds of infant colic (odds ratio, 1.7). Among mothers with migraine and headache frequency of 15 or more days per month, the likelihood of having an infant with colic was even greater (OR, 2.5).
“The cause of colic is unknown, yet colic is common, and these frequent bouts of intense crying or fussiness can be particularly frustrating for parents, creating family stress and anxiety,” Dr. Gelfand said in a news release. “New moms who are armed with knowledge of the connection between their own history of migraine and infant colic can be better prepared for these often difficult first months of a baby and new mother’s journey.”
EXPERT ANALYSIS FROM AHS 2019

Neonatal ICU stay found ‘protective’ against risk for developing atopic dermatitis
AUSTIN – The

“While more time in the NICU is associated with a lesser risk of developing atopic dermatitis, we certainly do not want to keep infants in the NICU longer in order to lower their risk of atopic dermatitis,” the study’s first author, Jennifer J. Schoch, MD, said in an interview prior to the annual meeting of the Society for Pediatric Dermatology. “Instead, we need to work on understanding the mechanisms behind this relationship. For example, are there certain exposures in the NICU that influence the cutaneous immunity to ultimately reduce the risk of atopic dermatitis?”
According to Dr. Schoch, a pediatric dermatologist at the University of Florida, Gainesville, the medical literature has been conflicted regarding the relationship between prematurity and eczema. A recent meta-analysis of 18 studies found an association between very preterm birth and a decreased risk of eczema, yet the risk became insignificant among children born moderately preterm (J Am Acad Dermatol. 2018;78[6]:1142-8). However, the factors contributing to this relationship are not well understood.
In an effort to explore the infant, maternal, and environmental factors of infants who developed AD, compared with infants who did not, Dr. Schoch and colleagues evaluated infants who were born at University of Florida Health from June 1, 2011, to April 30, 2017; had at least two well-child visits; and had at least one visit at 300 days old or later. The researchers included 4,016 mother-infant dyads in the study. Atopic dermatitis was diagnosed in 26.5% of the infants. Factors significantly associated with the incidence of AD were delivery mode (P = .0127), NICU stay (P = .0001), gestational age (P = .0006), and birth weight (P = .0020). Specifically, infants had a higher risk of developing AD if they were delivered vaginally, did not stay in the NICU, had a higher gestational age, or had a higher birth weight. Extremely preterm (less than 28 weeks’ gestation) and very preterm (28 to less than 32 weeks’ gestation) infants had the lowest rates of AD, at 10.9% and 19%, respectively.
When the researchers adjusted for other variables to their model, only length of stay in the NICU was related to the development of AD. Specifically, infants who spent more time in the NICU had a lower risk of developing atopic dermatitis (P = .0039).
“We were surprised to find that the length of stay in the neonatal intensive care unit was the strongest protective factor against the future development of eczema,” Dr. Schoch said. “Instead of this relationship being mediated by gestational age or birth weight, it was how much time the infants spent in the NICU that seemed to ‘protect’ from future eczema.”
She acknowledged certain limitations of the study, including its retrospective design with data gathered from electronic medical records. Also, “diagnosis was determined by ICD-9 or ICD-10 code, and not confirmed by dermatologists,” she said.
In their abstract, the researchers wrote that the finding highlights “the importance of early life interactions between the microbiome, developing cutaneous immunity, and the evolving skin barrier of the preterm infant. The skin microbiome of premature infants differs from full-term infants, in that the premature infant cutaneous microbiome is dominated by Staphylococcus species” (Microbiome. 2018;6[1]:98). They added that “the early presence of Staphylococcus on the skin may confer protection.”
Dr. Schoch reported having no relevant financial disclosures.
SOURCE: Schoch J et al. SPD 2019, Poster 2.
AUSTIN – The
“While more time in the NICU is associated with a lesser risk of developing atopic dermatitis, we certainly do not want to keep infants in the NICU longer in order to lower their risk of atopic dermatitis,” the study’s first author, Jennifer J. Schoch, MD, said in an interview prior to the annual meeting of the Society for Pediatric Dermatology. “Instead, we need to work on understanding the mechanisms behind this relationship. For example, are there certain exposures in the NICU that influence the cutaneous immunity to ultimately reduce the risk of atopic dermatitis?”
According to Dr. Schoch, a pediatric dermatologist at the University of Florida, Gainesville, the medical literature has been conflicted regarding the relationship between prematurity and eczema. A recent meta-analysis of 18 studies found an association between very preterm birth and a decreased risk of eczema, yet the risk became insignificant among children born moderately preterm (J Am Acad Dermatol. 2018;78[6]:1142-8). However, the factors contributing to this relationship are not well understood.
In an effort to explore the infant, maternal, and environmental factors of infants who developed AD, compared with infants who did not, Dr. Schoch and colleagues evaluated infants who were born at University of Florida Health from June 1, 2011, to April 30, 2017; had at least two well-child visits; and had at least one visit at 300 days old or later. The researchers included 4,016 mother-infant dyads in the study. Atopic dermatitis was diagnosed in 26.5% of the infants. Factors significantly associated with the incidence of AD were delivery mode (P = .0127), NICU stay (P = .0001), gestational age (P = .0006), and birth weight (P = .0020). Specifically, infants had a higher risk of developing AD if they were delivered vaginally, did not stay in the NICU, had a higher gestational age, or had a higher birth weight. Extremely preterm (less than 28 weeks’ gestation) and very preterm (28 to less than 32 weeks’ gestation) infants had the lowest rates of AD, at 10.9% and 19%, respectively.
When the researchers adjusted for other variables to their model, only length of stay in the NICU was related to the development of AD. Specifically, infants who spent more time in the NICU had a lower risk of developing atopic dermatitis (P = .0039).
“We were surprised to find that the length of stay in the neonatal intensive care unit was the strongest protective factor against the future development of eczema,” Dr. Schoch said. “Instead of this relationship being mediated by gestational age or birth weight, it was how much time the infants spent in the NICU that seemed to ‘protect’ from future eczema.”
She acknowledged certain limitations of the study, including its retrospective design with data gathered from electronic medical records. Also, “diagnosis was determined by ICD-9 or ICD-10 code, and not confirmed by dermatologists,” she said.
In their abstract, the researchers wrote that the finding highlights “the importance of early life interactions between the microbiome, developing cutaneous immunity, and the evolving skin barrier of the preterm infant. The skin microbiome of premature infants differs from full-term infants, in that the premature infant cutaneous microbiome is dominated by Staphylococcus species” (Microbiome. 2018;6[1]:98). They added that “the early presence of Staphylococcus on the skin may confer protection.”
Dr. Schoch reported having no relevant financial disclosures.
SOURCE: Schoch J et al. SPD 2019, Poster 2.
REPORTING FROM SPD 2019
Key clinical point: Preterm infants develop atopic dermatitis less often than full term infants.
Major finding: Infants that spent more time in the neonatal ICU had a lower risk of developing atopic dermatitis (P = .0039).
Study details: A single-center study of 4,016 mother-infant dyads.
Disclosures: Dr. Schoch reported having no relevant financial disclosures.
Source: Schoch J et al. SPD 2019, Poster 2.