User login
Optimal gestational age for cell-free DNA sampling in obese women
cfDNA screening failures occur in 1% to 12% of samples, a rate that has an inverse relationship to gestational age. Recent studies have shown an increased risk for screening failures among obese women. To determine the optimal gestational age for cfDNA testing among obese women, Mary C. Livergood, MD, and colleagues at the Mercy Hospital in St. Louis, Missouri, performed a retrospective cohort study of those undergoing cfDNA testing at one center from 2011 through 2016. Study results recently were published online in the American Journal of Obstetrics and Gynecology.1
Details of the study
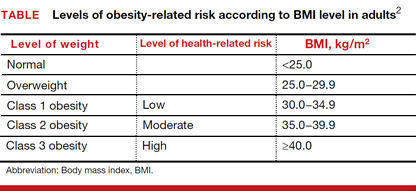
Adjusted odds ratios (aORs) with 95% confidence interval (CI) for a cfDNA screening failure (referred to as a “no call” in the study) were determined for each body mass index (BMI) weight class (TABLE). Each BMI weight class also was compared with the aOR of normal-weight women (BMI <25.0 kg/m2). The predicted probability of a no call was determined for each week of gestational age for normal weight and obese women and the results were compared.1
Among the 2,385 patients meeting inclusion criteria, 4.4% (n = 105) received a no call. Compared with normal weight women, the aOR of no call increased as weight increased from overweight (aOR, 2.31 [95% CI, 1.21–4.42]) to obesity class III (aOR, 8.55 [95% CI, 4.16–17.56]).1
At 21 weeks’ gestation, a cut-point was identified for obesity class II/III women (ie, there was no longer a significant difference in the probability of no call when compared with normal-weight women). From 8 to 16 weeks’ gestation, there was a 4.5% reduction in the probability of a no call for obesity class II/III women (aOR, 14.9; 95% CI, 8.95–20.78 and aOR, 10.4; 95% CI, 7.20–13.61; Ptrend<.01).1
Although the authors conclude that a cut-point of 21 weeks’ gestation allowed for optimal sampling of cfDNA in obese women, they also acknowledge that this cut-point limits a woman’s reproductive choices. However, they say that delaying cfDNA testing in obese women is a reasonable strategy to reduce the probability of screening failure.1
- Livergood MC, Lechien KA, Trudell AS. Obesity and cell-free DNA “no calls”: is there an optimal gestational age at time of sampling? [published online ahead of print January 28, 2017]. Am J Obstet Gynecol. doi:10.1016/j.ajog.2017.01.011.
- Health risks of obesity. MedlinePlus website. https://medlineplus.gov/ency/patientinstructions/000348.htm. Updated February 7, 2017. Accessed March 10, 2017.
cfDNA screening failures occur in 1% to 12% of samples, a rate that has an inverse relationship to gestational age. Recent studies have shown an increased risk for screening failures among obese women. To determine the optimal gestational age for cfDNA testing among obese women, Mary C. Livergood, MD, and colleagues at the Mercy Hospital in St. Louis, Missouri, performed a retrospective cohort study of those undergoing cfDNA testing at one center from 2011 through 2016. Study results recently were published online in the American Journal of Obstetrics and Gynecology.1
Details of the study
Adjusted odds ratios (aORs) with 95% confidence interval (CI) for a cfDNA screening failure (referred to as a “no call” in the study) were determined for each body mass index (BMI) weight class (TABLE). Each BMI weight class also was compared with the aOR of normal-weight women (BMI <25.0 kg/m2). The predicted probability of a no call was determined for each week of gestational age for normal weight and obese women and the results were compared.1
Among the 2,385 patients meeting inclusion criteria, 4.4% (n = 105) received a no call. Compared with normal weight women, the aOR of no call increased as weight increased from overweight (aOR, 2.31 [95% CI, 1.21–4.42]) to obesity class III (aOR, 8.55 [95% CI, 4.16–17.56]).1
At 21 weeks’ gestation, a cut-point was identified for obesity class II/III women (ie, there was no longer a significant difference in the probability of no call when compared with normal-weight women). From 8 to 16 weeks’ gestation, there was a 4.5% reduction in the probability of a no call for obesity class II/III women (aOR, 14.9; 95% CI, 8.95–20.78 and aOR, 10.4; 95% CI, 7.20–13.61; Ptrend<.01).1
Although the authors conclude that a cut-point of 21 weeks’ gestation allowed for optimal sampling of cfDNA in obese women, they also acknowledge that this cut-point limits a woman’s reproductive choices. However, they say that delaying cfDNA testing in obese women is a reasonable strategy to reduce the probability of screening failure.1
- Livergood MC, Lechien KA, Trudell AS. Obesity and cell-free DNA “no calls”: is there an optimal gestational age at time of sampling? [published online ahead of print January 28, 2017]. Am J Obstet Gynecol. doi:10.1016/j.ajog.2017.01.011.
- Health risks of obesity. MedlinePlus website. https://medlineplus.gov/ency/patientinstructions/000348.htm. Updated February 7, 2017. Accessed March 10, 2017.

Early elective deliveries occur in less than 2% of births
Early elective delivery in the United States is at an all-time low of 1.9%, down from 17% in 2010, according to a report by a nonprofit group that monitors safety and care quality in hospitals.
Early elective delivery comprises Cesarean deliveries or inductions performed before 39 weeks without medical necessity, and higher rates are considered a barometer of poor labor management in hospitals. For its annual report on maternity practices, published Feb. 28, the Leapfrog Group, a Washington, D.C.–based nonprofit, collected voluntarily reported data from 1,859 hospitals, or about half of the nation’s hospitals, in 2016.
The rate of Cesarean deliveries among first-time mothers at 37 or more weeks of gestation with babies in the head-down position (NTSV C-section) was 25.8% of deliveries in 2016, with little change from the previous year. Leapfrog’s target rate for NTSV C-section is 23.9% or lower. The group reported considerable geographic variation in C-section rates, with 32.1% for Louisiana, the highest seen in the survey, and 17.1% for New Mexico, the lowest.
The group did not note significant differences across hospital type, finding that urban, rural, teaching and nonteaching hospitals saw similar likelihoods of meeting the organization’s target standards for early elective delivery, episiotomy, and NTSV C-section.
“This year’s Leapfrog data underscores that many of the conventional assumptions for how to pick a ‘good hospital’ do not bear out – rates among teaching hospitals that may care for ‘sicker’ patients are similar to those at nonteaching hospitals. Rates at urban hospitals are similar to those at rural hospitals,” Neel Shah, MD, of Harvard Medical School, Boston, wrote in the report.

Cervicovaginal microbiota correlates with preterm birth rate
LAS VEGAS – Certain cervicovaginal microbiota predispose women to spontaneous preterm birth, according to a new study, while other microbiota were found to be protective against preterm delivery.
The findings stand in contrast to previous clinical trials that “targeted uterine activity and/or uterine infection,” said Michal Elovitz, MD, the first author of a study presented at the annual Pregnancy Meeting sponsored by the Society for Maternal-Fetal Medicine.

To answer the question, Dr. Elovitz and her colleagues conducted a large prospective cohort and validation study, testing the hypothesis that cervicovaginal microbial communities in women “destined to have a preterm birth” would differ from those of control patients.
The Motherhood and the Microbiome study enrolled 1,500 women aged 13-50 years with singleton pregnancies to constitute the prospective cohort. Cervicovaginal swabs were obtained at three time points: at gestational weeks 16-20, 20-24, and 24-28. Dr. Elovitz, professor of ob.gyn. at the University of Pennsylvania, Philadelphia, was the study adjudicator for determining preterm births.
Within the prospective cohort, Dr. Elovitz and her collaborators identified 83 cases of spontaneous preterm birth (SPTB), and frequency matched them by race to 336 patients who had term deliveries in a 4:1 ratio. The cervicovaginal microbiota of these patients was characterized by performing 165 rRNA gene analyses. Once the bacterial composition and structure had been identified, the investigators then calculated the effect of cervicovaginal bacterial composition on the risk of SPTB by using the log ratio between the mean relative abundance of a given phylotype for the SPTB, compared with the term birth samples.
A second prospective cohort of 616 women was formed for validation; cervicovaginal specimens in this cohort were collected between 22 and 32 weeks of gestation.
Taking both cohorts together, a total of 127 phylotypes were found in all samples. A total of 13 bacterial species were positively associated with an increased risk of spontaneous preterm birth in the primary cohort; 37 species were significantly associated with a decreased risk of spontaneous preterm birth.
“Bifidobacterium species were noted to be significantly protective against SPTB at all gestational time points,” wrote Dr. Elovitz and her collaborators in the abstract accompanying the presentation. On the other hand, they wrote, “BVAB2, BVAB3, and Mobiluncus were associated with a dramatic increase[d] risk of SPTB (all q-values less than 0.0001).”
Abundant Mobiluncus mulieris, in particular, was associated with significantly increased risk of SPTB at all time points during the study. The odds ratio for SPTB with a positive mobiluncus swab at visit one was 9.21.
Since the study examined both relative and absolute abundance of individual bacterial species, the investigators were able to determine that when Bifidobacterium breve was present, the incidence of BVAB3-associated preterm birth dropped from more than 30% to less than 10% (P = .006).
The notion that specific cervicovaginal bacterial species can be associated with increased rate of SPTB represents a different finding than most previous work in this field, said Dr. Elovitz, adding that much of the research on the vaginal microbiome during the reproductive years has focused on groupings of predominant bacteria, termed community state types (CSTs). “Classification of communities into CST, as performed in the nonpregnant woman, is not revealing for PTB,” Dr. Elovitz said.
Future research into cervicovaginal microbial communities and spontaneous preterm birth are likely to produce new methods to risk-stratify women and potential new therapeutics to reduce the rate of spontaneous preterm birth, she added.
The presentation won the conference’s March of Dimes award for best abstract in prematurity.
Dr. Elovitz reported having no relevant financial disclosures.
[email protected]
On Twitter @karioakes
LAS VEGAS – Certain cervicovaginal microbiota predispose women to spontaneous preterm birth, according to a new study, while other microbiota were found to be protective against preterm delivery.
The findings stand in contrast to previous clinical trials that “targeted uterine activity and/or uterine infection,” said Michal Elovitz, MD, the first author of a study presented at the annual Pregnancy Meeting sponsored by the Society for Maternal-Fetal Medicine.
To answer the question, Dr. Elovitz and her colleagues conducted a large prospective cohort and validation study, testing the hypothesis that cervicovaginal microbial communities in women “destined to have a preterm birth” would differ from those of control patients.
The Motherhood and the Microbiome study enrolled 1,500 women aged 13-50 years with singleton pregnancies to constitute the prospective cohort. Cervicovaginal swabs were obtained at three time points: at gestational weeks 16-20, 20-24, and 24-28. Dr. Elovitz, professor of ob.gyn. at the University of Pennsylvania, Philadelphia, was the study adjudicator for determining preterm births.
Within the prospective cohort, Dr. Elovitz and her collaborators identified 83 cases of spontaneous preterm birth (SPTB), and frequency matched them by race to 336 patients who had term deliveries in a 4:1 ratio. The cervicovaginal microbiota of these patients was characterized by performing 165 rRNA gene analyses. Once the bacterial composition and structure had been identified, the investigators then calculated the effect of cervicovaginal bacterial composition on the risk of SPTB by using the log ratio between the mean relative abundance of a given phylotype for the SPTB, compared with the term birth samples.
A second prospective cohort of 616 women was formed for validation; cervicovaginal specimens in this cohort were collected between 22 and 32 weeks of gestation.
Taking both cohorts together, a total of 127 phylotypes were found in all samples. A total of 13 bacterial species were positively associated with an increased risk of spontaneous preterm birth in the primary cohort; 37 species were significantly associated with a decreased risk of spontaneous preterm birth.
“Bifidobacterium species were noted to be significantly protective against SPTB at all gestational time points,” wrote Dr. Elovitz and her collaborators in the abstract accompanying the presentation. On the other hand, they wrote, “BVAB2, BVAB3, and Mobiluncus were associated with a dramatic increase[d] risk of SPTB (all q-values less than 0.0001).”
Abundant Mobiluncus mulieris, in particular, was associated with significantly increased risk of SPTB at all time points during the study. The odds ratio for SPTB with a positive mobiluncus swab at visit one was 9.21.
Since the study examined both relative and absolute abundance of individual bacterial species, the investigators were able to determine that when Bifidobacterium breve was present, the incidence of BVAB3-associated preterm birth dropped from more than 30% to less than 10% (P = .006).
The notion that specific cervicovaginal bacterial species can be associated with increased rate of SPTB represents a different finding than most previous work in this field, said Dr. Elovitz, adding that much of the research on the vaginal microbiome during the reproductive years has focused on groupings of predominant bacteria, termed community state types (CSTs). “Classification of communities into CST, as performed in the nonpregnant woman, is not revealing for PTB,” Dr. Elovitz said.
Future research into cervicovaginal microbial communities and spontaneous preterm birth are likely to produce new methods to risk-stratify women and potential new therapeutics to reduce the rate of spontaneous preterm birth, she added.
The presentation won the conference’s March of Dimes award for best abstract in prematurity.
Dr. Elovitz reported having no relevant financial disclosures.
[email protected]
On Twitter @karioakes
AT THE PREGNANCY MEETING
Key clinical point:
Major finding: Mobiluncus mulieris in the cervicovaginal space was associated with an odds ratio of 9.21 for spontaneous preterm birth.
Data source: Nested case-control study of 83 cases of spontaneous preterm birth matched with 336 term deliveries, drawn from 1,500 patients participating in the National Institute of Nursing Research–sponsored Motherhood and Microbiome study.
Disclosures: Dr. Elovitz reported having no relevant financial disclosures.
VIDEO: Despite promises of abstinence, isotretinoin-exposed pregnancies still occur
ORLANDO – Pregnancy prevention remains a challenge when prescribing isotretinoin to women of childbearing years with acne, Megha M. Tollefson, MD, said at the annual meeting of the American Academy of Dermatology.
Like so many promises having to do with love, a promise of sexual abstinence, however earnest, may at some point fall by the wayside, said Dr. Tollefson of the Mayo Clinic, Rochester, Minn., in a video interview.
The video associated with this article is no longer available on this site. Please view all of our videos on the MDedge YouTube channel
Despite the promises, the education, and the allegiance to the iPLEDGE program, exposed pregnancies still occur. iPLEDGE, with a 2.67 rate of fetal exposure over 1,000 treatment courses, was no more effective than its predecessor, SMART, with a 3.11 exposure rate. Altogether, there are still about 150 exposed pregnancies every year; 18 babies were exposed to the drug during SMART and 11 during iPLEDGE.
An anonymous survey of 75 iPLEDGE participants disclosed that 19% of those who chose abstinence were not, and that 34% of those who were sexually active did not comply with the promise to use two forms of birth control.
For some patients, Dr. Tollefson said, the best choice is a patient-independent form of birth control. That’s not an easy conversation to have sometimes, especially when parents are involved, but it’s an important one to have.
Dr. Tollefson had no financial disclosures.
[email protected]
On Twitter @Alz_Gal
AT AAD 17

Maternal vitamin E isoform levels possible marker for infant wheezing risk
ATLANTA – Increasing maternal postpartum–plasma alpha-tocopherol isoform concentration was associated with a decreased likelihood of wheezing at age 2 years, defined as wheezing in the past 12 months, use of asthma medications in the past 12 months, or diagnosis of asthma, results from a large analysis showed.
“For now, this is an association and not causation,” study author Cosby Stone, MD, MPH, said in an interview in advance of the annual meeting of the American Academy of Allergy, Asthma, and Immunology. “We need a clinical trial to evaluate the effect of giving more alpha-tocopherol to mothers during pregnancy before anyone should jump to giving supplements.”

The median age of children at the time of maternal sample collection was 50 days. 47% were female, and 61% were white. Of the 652 children, 167 (26%) met criteria for wheezing at age 2 years. These children had mothers with significantly lower postpartum concentrations of plasma alpha-tocopherol, compared with those who did not meet criteria for wheezing at 2 years (a mean of 69 micromol/L vs. 75 micromol/L, respectively; P = .02). In multivariable regression analysis, the researchers detected a significant interaction between gamma-tocopherol and alpha-tocopherol, where the highest amounts of maternal gamma-tocopherol modified and mitigated the protective association of maternal alpha-tocopherol with risk of wheezing at 2 years (P = .05).
Dr. Stone cautioned that, what is currently labeled as vitamin E or alpha-tocopherol in foods and supplements, “could be any of eight different isoforms, and alpha-tocopherol may not actually be the dominant isoform being provided. In addition, the oils that we eat are the main sources of tocopherols in our diet, and they vary widely in terms of their tocopherol isoforms. Sunflower and safflower oil, for example, provide predominantly alpha-tocopherol as their isoform of vitamin E, while corn and soy oil provide predominantly gamma-tocopherol.”
For now, he continued, correcting maternal alpha-tocopherol deficiency, currently defined by a serum alpha-tocopherol concentration less than 11.6 micromol/L, is certainly reasonable. Down the road, modification of maternal alpha-tocopherol or gamma-tocopherol concentrations through dietary counseling may provide clinicians with a tool to prevent wheezing or asthma in affected children. “In the future there may be a role for checking tocopherol isoforms in pregnant women and then modifying dietary oil consumption to protect the health of their children,” he said.
He acknowledged certain limitations of the study, including that researchers obtained maternal vitamin E isoform measurements at enrollment, when the infants were, on average, 6 weeks post partum, and not during pregnancy. “However, the literature has shown that postpartum vitamin E levels at this time point are very similar to those during the second trimester of pregnancy,” Dr. Stone said. “The literature has also shown that plasma vitamin E isoform concentrations are tightly tied to diet and body stores and do not change very rapidly (such that a woman would not be likely to go from the highest quartile to the lowest, or vice versa). People’s diets don’t tend to change that much, in general.”
INSPIRE is funded by the National Institutes of Health. Dr. Stone is funded by an NIH training grant through Vanderbilt University. He reported having no relevant financial disclosures.
ATLANTA – Increasing maternal postpartum–plasma alpha-tocopherol isoform concentration was associated with a decreased likelihood of wheezing at age 2 years, defined as wheezing in the past 12 months, use of asthma medications in the past 12 months, or diagnosis of asthma, results from a large analysis showed.
“For now, this is an association and not causation,” study author Cosby Stone, MD, MPH, said in an interview in advance of the annual meeting of the American Academy of Allergy, Asthma, and Immunology. “We need a clinical trial to evaluate the effect of giving more alpha-tocopherol to mothers during pregnancy before anyone should jump to giving supplements.”
The median age of children at the time of maternal sample collection was 50 days. 47% were female, and 61% were white. Of the 652 children, 167 (26%) met criteria for wheezing at age 2 years. These children had mothers with significantly lower postpartum concentrations of plasma alpha-tocopherol, compared with those who did not meet criteria for wheezing at 2 years (a mean of 69 micromol/L vs. 75 micromol/L, respectively; P = .02). In multivariable regression analysis, the researchers detected a significant interaction between gamma-tocopherol and alpha-tocopherol, where the highest amounts of maternal gamma-tocopherol modified and mitigated the protective association of maternal alpha-tocopherol with risk of wheezing at 2 years (P = .05).
Dr. Stone cautioned that, what is currently labeled as vitamin E or alpha-tocopherol in foods and supplements, “could be any of eight different isoforms, and alpha-tocopherol may not actually be the dominant isoform being provided. In addition, the oils that we eat are the main sources of tocopherols in our diet, and they vary widely in terms of their tocopherol isoforms. Sunflower and safflower oil, for example, provide predominantly alpha-tocopherol as their isoform of vitamin E, while corn and soy oil provide predominantly gamma-tocopherol.”
For now, he continued, correcting maternal alpha-tocopherol deficiency, currently defined by a serum alpha-tocopherol concentration less than 11.6 micromol/L, is certainly reasonable. Down the road, modification of maternal alpha-tocopherol or gamma-tocopherol concentrations through dietary counseling may provide clinicians with a tool to prevent wheezing or asthma in affected children. “In the future there may be a role for checking tocopherol isoforms in pregnant women and then modifying dietary oil consumption to protect the health of their children,” he said.
He acknowledged certain limitations of the study, including that researchers obtained maternal vitamin E isoform measurements at enrollment, when the infants were, on average, 6 weeks post partum, and not during pregnancy. “However, the literature has shown that postpartum vitamin E levels at this time point are very similar to those during the second trimester of pregnancy,” Dr. Stone said. “The literature has also shown that plasma vitamin E isoform concentrations are tightly tied to diet and body stores and do not change very rapidly (such that a woman would not be likely to go from the highest quartile to the lowest, or vice versa). People’s diets don’t tend to change that much, in general.”
INSPIRE is funded by the National Institutes of Health. Dr. Stone is funded by an NIH training grant through Vanderbilt University. He reported having no relevant financial disclosures.
AT THE 2017 AAAAI ANNUAL MEETING
Key clinical point:
Major finding: Increasing maternal postpartum–plasma alpha-tocopherol concentration was associated with a decreased likelihood of wheezing requiring asthma medications at 2 years (P = .02).
Data source: A prospective evaluation of 652 children with maternal postpartum–plasma vitamin E isoforms measured at study enrollment.
Disclosures: INSPIRE is funded by the National Institutes of Health. Dr. Stone is funded by an NIH training grant through Vanderbilt University. He reported having no relevant financial disclosures.
Birth defects in United States up 20-fold since Zika outbreak began
Birth defects potentially linked to cases of Zika virus in the United States have increased by a factor of nearly 20 since the virus first made its way into the country, according to new findings by the Centers for Disease Control and Prevention.
“The higher proportion of these defects among pregnancies with laboratory evidence of Zika infection in USZPR [U.S. Zika Pregnancy Registry] supports the relationship between congenital Zika virus infection and these birth defects,” wrote the authors of a new report led by Janet D. Cragan, MD, of the National Center on Birth Defects and Developmental Disabilities at the CDC (MMWR Morb Mortal Wkly Rep. 2017;66:219-22).![]()
[[{"attributes":{},"fields":{}}]]
Dr. Cragan and her coauthors retrospectively examined data on birth defects in three regions of the country: Massachusetts during 2013, North Carolina during 2013, and Atlanta during 2013-2014. The investigators focused on birth defects associated with prenatal Zika virus infections, mainly brain abnormalities and microcephaly.
The rate of total birth defects across the three regions was 2.86 per 1,000 live births, with 747 infants and fetuses identified as having one or more defects. Microcephaly and brain abnormalities alone occurred at a rate of 1.50 per 1,000 live births, with eye abnormalities and central nervous system dysfunction also occurring.
These numbers are relatively low when compared with data from Jan. 15 through Sept. 22, 2016. The birth defect rate jumped up to 58.8 per 1,000 live births, according to data from the USZPR, which found evidence of 26 infants and fetuses with brain or cranial defects in 442 completed pregnancies. These infants were all born to mothers with laboratory-confirmed Zika virus infections.
“Among 410 (55%) infants or fetuses with information on the earliest age a birth defect was recorded, 371 (90%) had evidence of a birth defect meeting the Zika definition before age 3 months,” the authors explained. “More than half of those with brain abnormalities or microcephaly or with neural tube defects and other early brain malformations had evidence of these defects noted prenatally (55% and 89%, respectively).”
Dr. Cragan and her colleagues hope that this evidence will further solidify the link between Zika virus and birth defects and pave the way for more population-based studies.
“These data demonstrate the critical contribution of population-based birth defects surveillance to understanding the impact of Zika virus infection during pregnancy,” the authors concluded. “In 2016, CDC provided funding for 45 local, state, and territorial health departments to conduct rapid population-based surveillance for defects potentially related to Zika virus infection, which will provide essential data to monitor the impact of Zika virus infection in the United States.”
ACOG stresses widespread prepregnancy carrier screening
The American College of Obstetricians and Gynecologists is calling on ob.gyns. to establish a standard carrier screening process that is consistently offered to all patients before pregnancy.
This a shift from previous ACOG policy, which recommended carrier screening based mainly on ethnicity.
In a pair of opinions from ACOG’s Committee on Genetics, they highlighted three acceptable screening methods: ethnic-specific screening, panethnic screening, and expanded-carrier screening (Obstet Gynecol. 2017;129:e35-40/Obstet Gynecol. 2017;129:e41-55).
Panethnic and expanded-carrier screening are especially helpful for patients with parents of different ethnic backgrounds or those who do not know their family history, situations that have become more common.

“In reality, over the last 5-7 years, the amount an obstetrician has to counsel patients on carrier screening and prenatal screening has grown immensely,” Dr. Biggio said in an interview. “Trying to find the time to do it and do it well, is a challenge. What is important is all practitioners have a way to approach offering carrier screening in their practice setting.”
While the committee advises crafting a process that fits individual practice needs, there are some general recommendations:
- Test only for diseases with a carrier frequency of 1 in 100 or greater, have a well-defined phenotype, have a detrimental effect on quality of life, cause cognitive or physical impairment, require surgical or medical intervention, or have an onset early in life.
- All patients, regardless of screening strategy and ethnicity, should be checked for cystic fibrosis and spinal muscular atrophy, and also undergo a complete blood count and screening for thalassemias and hemoglobinopathies.
- Prenatal carrier screening does not replace newborn screening, and at the same time, newborn screening does not diminish the potential benefits of prenatal carrier screening.
“Practitioners should be testing patients for these diseases as early as possible,” Dr. Biggio said. “A consistent approach to screening consultation will help with that immensely.”
[email protected]
On Twitter @EAZTweets
The American College of Obstetricians and Gynecologists is calling on ob.gyns. to establish a standard carrier screening process that is consistently offered to all patients before pregnancy.
This a shift from previous ACOG policy, which recommended carrier screening based mainly on ethnicity.
In a pair of opinions from ACOG’s Committee on Genetics, they highlighted three acceptable screening methods: ethnic-specific screening, panethnic screening, and expanded-carrier screening (Obstet Gynecol. 2017;129:e35-40/Obstet Gynecol. 2017;129:e41-55).
Panethnic and expanded-carrier screening are especially helpful for patients with parents of different ethnic backgrounds or those who do not know their family history, situations that have become more common.
“In reality, over the last 5-7 years, the amount an obstetrician has to counsel patients on carrier screening and prenatal screening has grown immensely,” Dr. Biggio said in an interview. “Trying to find the time to do it and do it well, is a challenge. What is important is all practitioners have a way to approach offering carrier screening in their practice setting.”
While the committee advises crafting a process that fits individual practice needs, there are some general recommendations:
- Test only for diseases with a carrier frequency of 1 in 100 or greater, have a well-defined phenotype, have a detrimental effect on quality of life, cause cognitive or physical impairment, require surgical or medical intervention, or have an onset early in life.
- All patients, regardless of screening strategy and ethnicity, should be checked for cystic fibrosis and spinal muscular atrophy, and also undergo a complete blood count and screening for thalassemias and hemoglobinopathies.
- Prenatal carrier screening does not replace newborn screening, and at the same time, newborn screening does not diminish the potential benefits of prenatal carrier screening.
“Practitioners should be testing patients for these diseases as early as possible,” Dr. Biggio said. “A consistent approach to screening consultation will help with that immensely.”
[email protected]
On Twitter @EAZTweets
FROM OBSTETRICS & GYNECOLOGY

Perinatal depression screening is just the start
Over the last decade, appreciation of the prevalence of perinatal depression – depression during pregnancy and/or the postpartum period – along with interest and willingness to diagnose and to treat these disorders across primary care, obstetric, and psychiatric clinical settings – has grown.
The passage of the Affordable Care Act in 2010 included the Melanie Blocker Stokes MOTHERS Act, which provides federal funding for programs to enhance awareness of postpartum depression and conduct research into its causes and treatment. At the same time, there has been increasing destigmatization associated with perinatal mood and anxiety disorders across many communities, and enhanced knowledge among clinicians and the public regarding evidence-based treatments, which mitigate suffering from untreated perinatal psychiatric illness.

The importance of identification of perinatal depression cannot be overestimated given the impact of untreated perinatal mood and anxiety disorders on women and families. Unfortunately, data describing the outcomes of these screening initiatives have been profoundly lacking.
There are many unanswered questions. What proportion of women get screened from state to state? What are the obstacles to screening across different sociodemographic populations? If screened, what proportion of women are referred for treatment and receive appropriate treatment? Of those who receive treatment, how many recover emotional well-being? These are all critically relevant questions and one has to wonder if they would be the same from other nonpsychiatric disease states. For example, would one screen for HIV or cervical cancer and not know the number of women who screened positive but failed to go on to receive referral or frank treatment?
This knowledge gap with respect to outcome of screening for perinatal depression was highlighted in one of the few studies that addresses this specific question. Published in 2016, the systematic review describes the so-called “perinatal depression treatment cascade” – the cumulative shortfalls in clinical recognition, initiation of treatment, adequacy of treatment, and treatment response among women with either depression during pregnancy or postpartum depression (J Clin Psychiatry. 2016 Sep;77[9]:1189-1200).
The investigators included 32 studies where they were able to look specifically at this question of what happens to women who are identified as having either antenatal depression or postpartum depression. In total, six studies examined the rate of treatment of women who had been diagnosed with antenatal depression, resulting in a weighted mean treatment rate of 13.6%. For women identified as having postpartum depression, four studies examined showed a weighted mean treatment rate of 15.8%. What that means is that even if we have a sensitive and specific screening tool and we look only at women who have screened positive, we still have just 14% and 16% of women receiving treatment of any kind.
Drilling down to the issue of treatment adequacy – defined in the review as at least 6 weeks of daily use of antidepressants or at least 6 weeks of psychotherapy – the picture is unfortunately worse. Among the entire population of women with diagnosed antenatal depression, 8.6% received an adequate trial of treatment. Similarly, 6.3% of women with diagnosed postpartum depression received an adequate trial of treatment.
Continuing down the treatment cascade, remission rates also were extremely low. The overall weighted mean remission rate – reflecting the percentage of women who actually ended up getting well – was just 4.8% for women with antenatal depression and 3.2% for women with postpartum depression. These are striking, although perhaps not surprising, data. It suggests, at least in part, the fundamental absence of adequate referral networks and systems for follow-up for those women who suffer from perinatal depression.
It is well established that postpartum depression is the most common complication in modern obstetrics. The data presented in this paper suggest that most women identified with perinatal depressive illness are not getting well. Assuming a prevalence of 10% for antenatal depression and 13% for postpartum depression, there are about 657,000 women with antenatal depression and about 550,000 women with postpartum depression in the United States. If this review is correct, more than 31,000 women with antenatal depression and almost 18,000 women with postpartum depression achieved remission. That leaves more than 600,000 women with undermanaged depression in pregnancy and more than 500,000 women with incompletely treated postpartum depression.
This is a wake-up call to consider a refocusing of effort. The importance of identification of women suffering from postpartum depression is clear and intuitive. We should certainly not abandon screening, but perhaps there has been an overemphasis on identification and incomplete attention to ensuring that referral networks and opportunities for clinical follow-up are in place following positive screening. There also has been inadequate focus on the obstacles to getting women in to see clinicians and getting those clinicians up to speed on the evidence base that supports treatment, both pharmacologic or nonpharmacologic.
Right now, we don’t even know for sure what obstacles exist to referral and treatment. Surveys of community clinicians suggest that collaborative care in managing reproductive-age women or pregnant and postpartum women has not evolved to the point where we have a clear, user-friendly system for getting patients referred and treated. In Massachusetts, where I practice, we have a state-funded effort (MCPAP [Massachusetts Child Psychiatry Access Program] for Moms) to train colleagues in obstetrics about how to identify and treat perinatal depression; perinatal psychiatrists also are available to consult with community-based clinicians. However, we do not have data to tell us if these efforts and the resources used to support them have yielded improvement in the overall symptom burden associated with perinatal mood disorders.
The bottom line is that even after identification of perinatal depression through screening programs, we still have women suffering in silence. It is so easy to get on the bandwagon regarding screening, but it seems even more challenging to design the systems that will accommodate the volume of women who are being identified. The fact that we do not have parallel efforts focusing on getting these women referred and treated, and a system to monitor improvement, conjures the image of setting off to sail without checking whether the boat is equipped with life preservers.
Dr. Cohen is the director of the Center for Women’s Mental Health at Massachusetts General Hospital in Boston, which provides information resources and conducts clinical care and research in reproductive mental health. He has been a consultant to manufacturers of psychiatric medications.
Over the last decade, appreciation of the prevalence of perinatal depression – depression during pregnancy and/or the postpartum period – along with interest and willingness to diagnose and to treat these disorders across primary care, obstetric, and psychiatric clinical settings – has grown.
The passage of the Affordable Care Act in 2010 included the Melanie Blocker Stokes MOTHERS Act, which provides federal funding for programs to enhance awareness of postpartum depression and conduct research into its causes and treatment. At the same time, there has been increasing destigmatization associated with perinatal mood and anxiety disorders across many communities, and enhanced knowledge among clinicians and the public regarding evidence-based treatments, which mitigate suffering from untreated perinatal psychiatric illness.
The importance of identification of perinatal depression cannot be overestimated given the impact of untreated perinatal mood and anxiety disorders on women and families. Unfortunately, data describing the outcomes of these screening initiatives have been profoundly lacking.
There are many unanswered questions. What proportion of women get screened from state to state? What are the obstacles to screening across different sociodemographic populations? If screened, what proportion of women are referred for treatment and receive appropriate treatment? Of those who receive treatment, how many recover emotional well-being? These are all critically relevant questions and one has to wonder if they would be the same from other nonpsychiatric disease states. For example, would one screen for HIV or cervical cancer and not know the number of women who screened positive but failed to go on to receive referral or frank treatment?
This knowledge gap with respect to outcome of screening for perinatal depression was highlighted in one of the few studies that addresses this specific question. Published in 2016, the systematic review describes the so-called “perinatal depression treatment cascade” – the cumulative shortfalls in clinical recognition, initiation of treatment, adequacy of treatment, and treatment response among women with either depression during pregnancy or postpartum depression (J Clin Psychiatry. 2016 Sep;77[9]:1189-1200).
The investigators included 32 studies where they were able to look specifically at this question of what happens to women who are identified as having either antenatal depression or postpartum depression. In total, six studies examined the rate of treatment of women who had been diagnosed with antenatal depression, resulting in a weighted mean treatment rate of 13.6%. For women identified as having postpartum depression, four studies examined showed a weighted mean treatment rate of 15.8%. What that means is that even if we have a sensitive and specific screening tool and we look only at women who have screened positive, we still have just 14% and 16% of women receiving treatment of any kind.
Drilling down to the issue of treatment adequacy – defined in the review as at least 6 weeks of daily use of antidepressants or at least 6 weeks of psychotherapy – the picture is unfortunately worse. Among the entire population of women with diagnosed antenatal depression, 8.6% received an adequate trial of treatment. Similarly, 6.3% of women with diagnosed postpartum depression received an adequate trial of treatment.
Continuing down the treatment cascade, remission rates also were extremely low. The overall weighted mean remission rate – reflecting the percentage of women who actually ended up getting well – was just 4.8% for women with antenatal depression and 3.2% for women with postpartum depression. These are striking, although perhaps not surprising, data. It suggests, at least in part, the fundamental absence of adequate referral networks and systems for follow-up for those women who suffer from perinatal depression.
It is well established that postpartum depression is the most common complication in modern obstetrics. The data presented in this paper suggest that most women identified with perinatal depressive illness are not getting well. Assuming a prevalence of 10% for antenatal depression and 13% for postpartum depression, there are about 657,000 women with antenatal depression and about 550,000 women with postpartum depression in the United States. If this review is correct, more than 31,000 women with antenatal depression and almost 18,000 women with postpartum depression achieved remission. That leaves more than 600,000 women with undermanaged depression in pregnancy and more than 500,000 women with incompletely treated postpartum depression.
This is a wake-up call to consider a refocusing of effort. The importance of identification of women suffering from postpartum depression is clear and intuitive. We should certainly not abandon screening, but perhaps there has been an overemphasis on identification and incomplete attention to ensuring that referral networks and opportunities for clinical follow-up are in place following positive screening. There also has been inadequate focus on the obstacles to getting women in to see clinicians and getting those clinicians up to speed on the evidence base that supports treatment, both pharmacologic or nonpharmacologic.
Right now, we don’t even know for sure what obstacles exist to referral and treatment. Surveys of community clinicians suggest that collaborative care in managing reproductive-age women or pregnant and postpartum women has not evolved to the point where we have a clear, user-friendly system for getting patients referred and treated. In Massachusetts, where I practice, we have a state-funded effort (MCPAP [Massachusetts Child Psychiatry Access Program] for Moms) to train colleagues in obstetrics about how to identify and treat perinatal depression; perinatal psychiatrists also are available to consult with community-based clinicians. However, we do not have data to tell us if these efforts and the resources used to support them have yielded improvement in the overall symptom burden associated with perinatal mood disorders.
The bottom line is that even after identification of perinatal depression through screening programs, we still have women suffering in silence. It is so easy to get on the bandwagon regarding screening, but it seems even more challenging to design the systems that will accommodate the volume of women who are being identified. The fact that we do not have parallel efforts focusing on getting these women referred and treated, and a system to monitor improvement, conjures the image of setting off to sail without checking whether the boat is equipped with life preservers.
Dr. Cohen is the director of the Center for Women’s Mental Health at Massachusetts General Hospital in Boston, which provides information resources and conducts clinical care and research in reproductive mental health. He has been a consultant to manufacturers of psychiatric medications.
How and when umbilical cord gas analysis can justify your obstetric management
Umbilical cord blood (cord) gas values can aid both in understanding the cause of an infant’s acidosis and in providing reassurance that acute acidosis or asphyxia is not responsible for a compromised infant with a low Apgar score. Together with other clinical measurements (including fetal heart rate [FHR] tracings, Apgar scores, newborn nucleated red cell counts, and neonatal imaging), cord gas analysis can be remarkably helpful in determining the cause for a depressed newborn. It can help us determine, for example, if infant compromise was a result of an asphyxial event, and we often can differentiate whether the event was acute, prolonged, or occurred prior to presentation in labor. We further can use cord gas values to assess whether a decision for operative intervention for nonreassuring fetal well-being was appropriate (see “Brain injury at birth: Cord gas values presented as evidence at trial”). In addition, cord gas analysis can complement methods for determining fetal acidosis changes during labor, enabling improved assessment of FHR tracings.1−3
At 40 weeks' gestation, a woman presented to the hospital because of decreased fetal movement. On arrival, an external fetal heart-rate (FHR) monitor showed nonreassuring tracings, evidenced by absent to minimal variability and subtle decelerations occurring at 10- to 15-minute intervals. The on-call ObGyn requested induction of labor with oxytocin, and a low-dose infusion (1 mU/min) was initiated. An internal FHR monitor was then placed and late decelerations were observed with the first 2 induced contractions. The oxytocin infusion was discontinued and the ObGyn performed an emergency cesarean delivery. The infant's Apgar scores were 1, 2, and 2 at 1, 5, and 10 minutes, respectively. Cord samples were obtained and values from the umbilical artery were as follows: pH, 6.86; Pco2, 55 mm Hg; Po2, 6 mm Hg; and BDECF, 21.1 mmol/L. Values from the umbilical vein were: pH, 6.94; Pco2, 45 mm Hg; Po2, 17 mm Hg; and BDECF, 20.0 mmol/L. The infant was later diagnosed with a hypoxic brain injury resulting in cerebral palsy. At trial years later, the boy had cognitive and physical limitations and required 24-hour care.
The parents claimed that the ObGyn should have performed a cesarean delivery earlier when the external FHR monitor showed nonreassuring tracings.
The hospital and physician claimed that, while tracings were consistently nonreassuring, they were stable. They maintained that the child's brain damage was not due to a delivery delay, as the severe level of acidosis in both the umbilical artery and vein could not be a result of the few heart rate decelerations during the 2-hour period of monitoring prior to delivery. They argued that the clinical picture indicated a pre-hospital hypoxic event associated with decreased fetal movement.
A defense verdict was returned.
Case assessment
Cord gas results, together with other measures (eg, infant nucleated red blood cells, brain imaging) can aid the ObGyn in medicolegal cases. However, they are not always protective of adverse judgment.
I recommend checking umbilical cord blood gas values on all operative vaginal deliveries, cesarean deliveries for fetal concern, abnormal FHR patterns, clinical chorioamnionitis, multifetal gestations, premature deliveries, and all infants with low Apgar scores at 1 or 5 minutes. If you think you may need a cord gas analysis, go ahead and obtain it. Cord gas analysis often will aid in justifying your management or provide insight into the infant’s status.
Controversy remains as to the benefit of universal cord gas analysis. Assuming a variable cost of $15 for 2 (artery and vein) blood gas samples per neonate,4 the annual cost in the United States would be approximately $60 million. This would likely be cost effective as a result of medicolegal and educational benefits as well as potential improvements in perinatal outcome5 and reductions in special care nursery admissions.4
CASE 1: A newborn with unexpected acidosis
A 29-year-old woman (G2P1) at 38 weeks’ gestation was admitted to the hospital following an office visit during which oligohydramnios (amniotic fluid index, 3.5 cm) was found. The patient had a history of a prior cesarean delivery for failure to progress, and she desired a repeat cesarean delivery. Fetal monitoring revealed a heart rate of 140 beats per minute with moderate variability and uterine contractions every 3 to 5 minutes associated with moderate variable decelerations. A decision was made to proceed with the surgery. Blood samples were drawn for laboratory analysis, monitoring was discontinued, and the patient was taken to the operating room. An epidural anesthetic was placed and the cesarean delivery proceeded.
On uterine incision, there was no evidence of abruption or uterine rupture, but thick meconium-stained amniotic fluid was observed. A depressed infant was delivered, the umbilical cord clamped, and the infant handed to the pediatric team. Cord samples were obtained and values from the umbilical artery were as follows: pH, 6.80; P
What happened?
Read how to use cord gas values in practice
Using cord gas values in practice
Before analyzing the circumstances in Case 1,it is important to consider several key questions, including:
- What are the normal levels of cord pH, O2, CO2, and base deficit (BD)?
- How does cord gas indicate what happened during labor?
- What are the preventable errors in cord gas sampling or interpretation?
For a review of fetal cord gas physiology, see “Physiology of fetal cord gases: The basics”.
A review of basic fetal cord gas physiology will assist in understanding how values are interpreted.
Umbilical cord O2 and CO2
Fetal cord gas values result from the rapid transfer of gases and the slow clearance of acid across the placenta. Approximately 10% of maternal blood flow supplies the uteroplacental circulation, with the near-term placenta receiving approximately 70% of the uterine blood flow.1 Of the oxygen delivered, a surprising 50% provides for placental metabolism and 50% for the fetus. On the fetal side, 40% of fetal cardiac output supplies the umbilical circulation. Oxygen and carbon dioxide pass readily across the placental layers; exchange is limited by the amount of blood flow on both the maternal and the fetal side (flow limited). In the human placenta, maternal blood and fetal blood effectively travel in the same direction (concurrent exchange); thus, umbilical vein O2 and CO2 equilibrate with that in the maternal uterine vein.
Most of the O2 in fetal blood is carried by hemoglobin. Because of the markedly greater affinity of fetal hemoglobin for O2, the saturation curve is shifted to the left, resulting in increased hemoglobin saturation at the relatively low levels of fetal Po2. This greater affinity for oxygen results from the unique fetal hemoglobin gamma (γ) subunit, as compared with the adult beta (ß) subunit. Fetal hemoglobin has a reduced interaction with 2,3-bisphosphoglycerate, which itself decreases the affinity of adult hemoglobin for oxygen.
The majority of CO2 (85%) is carried as part of the bicarbonate buffer system. Fetal CO2 is converted into carbonic acid (H2CO3) in the red cell and dissociates into hydrogen (H+) and bicarbonate (HCO3−) ions, which diffuse out of the cell. When fetal blood reaches the placenta, this process is reversed and CO2 diffuses across the placenta to the maternal circulation. The production of H+ ions from CO2 explains the development of respiratory acidosis from high Pco2. In contrast, anaerobic metabolism, which produces lactic acid, results in metabolic acidosis.
Difference between pH and BD
The pH is calculated as the inverse log of the H+ ion concentration; thus, the pH falls as the H+ ion concentration exponentially increases, whether due to respiratory or metabolic acidosis. To quantify the more important metabolic acidosis, we use BD, which is a measure of how much of bicarbonate buffer base has been used by (lactic) acid. The BD and the base excess (BE) may be used interchangeably, with BE representing a negative number. Although BD represents the metabolic component of acidosis, a correction may be required to account for high levels of fetal Pco2 (see Case 1). In this situation, a more accurate measure is BD extracellular fluid (BDECF).
Why not just use pH? There are 2 major limitations to using pH as a measure of fetal or newborn acidosis. First, pH may be influenced by both respiratory and metabolic alterations, although only metabolic acidosis is associated with fetal neurologic injury.2 Furthermore, as pH is a log function, it does not change linearly with the amount of acid produced. In contrast to pH, BD is a measure of metabolic acidosis and changes in direct proportion to fetal acid production.
What about lactate? Measurements of lactate may also be included in blood gas analyses. Under hypoxic conditions, excess pyruvate is converted into lactate and released from the cell along with H+, resulting in acidosis. However, levels of umbilical cord lactate associated with neonatal hypoxic injury have not been established to the same degree as have pH or BD. Nevertheless, lactate has been measured in fetal scalp blood samples and offers the potential as a marker of fetal hypoxemia and acidosis.3
References
- Assali NS. Dynamics of the uteroplacental circulation in health and disease. Am J Perinatol. 1989;6(2):105-109.
- Low JA, Panagiotopoulos C, Derrick EJ. Newborn complications after intrapartum asphyxia with metabolic acidosis in the term fetus. Am J Obstet Gynecol. 1994;170(4):1081-1087.
- Mancho JP, Gamboa SM, Gimenez OR, Esteras RC, Solanilla BR, Mateo SC. Diagnostic accuracy of fetal scalp lactate for intrapartum acidosis compared with scalp pH [published online ahead of print October 8, 2016]. J Perinatal Med. doi: 10.1515/jpm-2016-004.
Normal values: The “20, 30, 40, 50 rule”
Among the values reported for umbilical blood gas, the pH, P
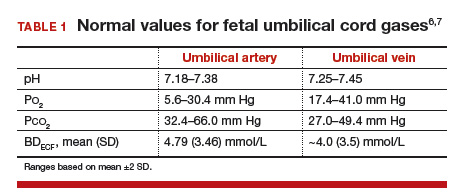
I recommend using the “20, 30, 40, 50 rule” as a simple tool for remembering normal umbilical artery and vein P
- P
o 2 values are lower than Pco 2 values; thus, the 20 and 30 represent Po 2 values - as fetal umbilical artery P
o 2 is lower than umbilical vein Po 2, 20 mm Hg represents the umbilical artery and 30 mm Hg represents the vein - P
co 2 values are higher in the umbilical artery than in the vein; thus, 50 mm Hg represents the umbilical artery and 40 mm Hg represents the umbilical vein.
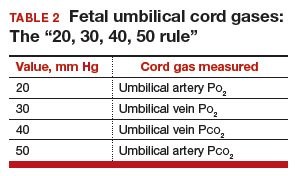
Umbilical cord BD values change in relation to labor and FHR decelerations.8 Prior to labor, the normal fetus has a slight degree of acidosis (BD, 2 mmol/L). During the latent phase of labor, fetal BD typically does not change. With the increased frequency of contractions, BD may increase 1 mmol/L for every 3 to 6 hours during the active phase and up to 1 mmol/L per hour during the second stage, depending on FHR responses. Thus, following vaginal delivery the average umbilical artery BD is approximately 5 mmol/L and the umbilical vein BD is approximately 4 mmol/L. As lactate crosses the placenta slowly, BD values are typically only 1 mmol/L less in the umbilical vein than in the artery, unless there has been an obstruction to placental flow (see Case 1).
For pH, the umbilical artery value is always lower than that of the vein, a result of both the higher umbilical artery P
Possible causes of abnormal cord gas values
Because of the nearly fully saturated maternal hemoglobin under normal conditions, fetal arterial and venous P
In contrast, reduced fetal P
Effect of maternal oxygen administration on fetal oxygenation
Although maternal oxygen administration is commonly used during labor and delivery, controversy remains as to the benefit of oxygen supplementation.10 In a normal mother with oxygen saturation above 95%, the administration of oxygen will increase maternal arterial P
However, maternal oxygen supplementation may have marked benefit in cases in which maternal arterial P
How did the Case 1 circumstances lead to newborn acidosis?
Most noticeable in this case is the large difference in BD between the umbilical artery and vein and the high P
Whereas BD normally is only about 1 mmol/L greater in the umbilical artery versus in the vein, occasionally the arterial value is markedly greater than the vein value. This can occur when there is a cessation of blood flow through the placenta, as a result of complete umbilical cord obstruction, or when there is a uterine abruption. In these situations, the umbilical vein (which has not had blood flow) represents the fetal status prior to the occlusion event. In contrast, despite bradycardia, fetal heart pulsations mix blood within the umbilical artery and therefore the artery generally represents the fetal status at the time of birth.
In response to complete cord occlusion, fetal BD increases by approximately 1 mmol/L every 2 minutes. Consequently, an 8 mmol/L difference in BD between the umbilical artery and vein is consistent with a 16-minute period of umbilical occlusion or placental abruption. Also in response to complete umbilical cord occlusion, P
The umbilical vein BD is also elevated for early labor. This value suggests that repetitive, intermittent cord occlusions (evident on the initial fetal monitor tracing) likely resulted in this moderate acidosis prior to the complete cord occlusion in the final 16 minutes.
Thus, BD and P
Read more cases plus procedures, equipment for cord sampling
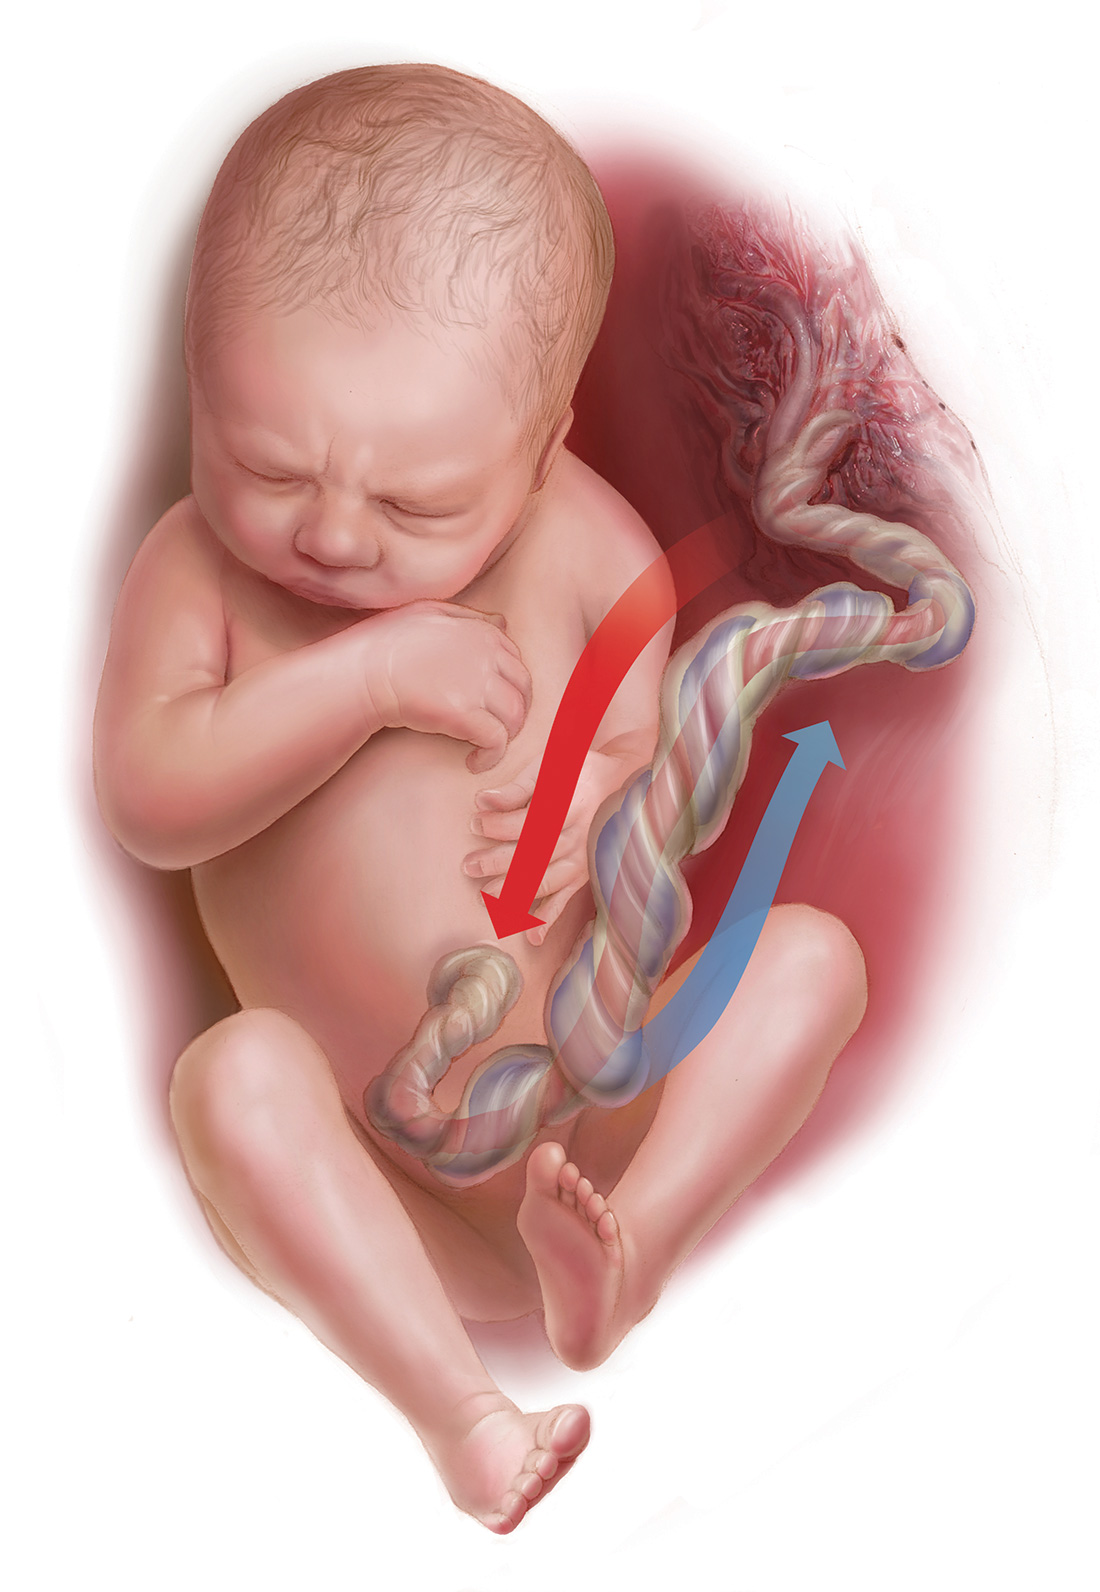
CASE 2: An infant with unusual umbilical artery values
An infant born via vacuum delivery for a prolonged second stage of labor had 1- and 5-minute Apgar scores of 8 and 9, respectively. Cord gas values were obtained, and analysis revealed that for the umbilical artery, the pH was 7.29; P
The resident asked, “How is the P
The curious Case 2 values suggest an air bubble
Although it is possible that the aberrant values in Case 2 could have resulted from switching the artery and vein samples, the pH is lower in the artery, and both the artery P
Related article:
Is neonatal injury more likely outside of a 30-minute decision-to-incision time interval for cesarean delivery?
CASE 3: A vigorous baby with significant acidosis
A baby with 1- and 5-minute Apgar scores of 9 and 9 was delivered by cesarean and remained vigorous. Umbilical cord analysis revealed an umbilical artery pH level of 7.15, with normal P
Was there a collection error in Case 3?
On occasion, a falsely low pH level and, thus, a falsely elevated BD may result from excessive heparin in the collection syringe. Heparin is acidotic and should be used only to coat the syringe. Although syringes in current use are often pre-heparinized, if one is drawing up heparin into the syringe, it should be coated and then fully expelled.
Umbilical cord sampling: Procedures and equipment
Many issues remain regarding the optimal storage of cord samples. Ideally, a doubly clamped section of the cord promptly should be sampled into glass syringes that can be placed on ice and rapidly measured for cord values.
Stability of umbilical cord samples within the cord is within 20 to 30 minutes. Delayed sampling of clamped cord sections generally has minimal effect on pH and P
Plastic syringes can introduce interference. Several studies have demonstrated that collection of samples in plastic may result in an increase in P
Use glass, and “ice” the sample if necessary. Although it has been suggested that placing samples on ice minimizes metabolism, the cooled plastic may in fact be more susceptible to oxygen diffusion. Thus, unless samples will be analyzed promptly, it is best to use glass syringes on ice.13,14
Related article:
Protecting the newborn brain—the final frontier in obstetric and neonatal care
What if the umbilical cord is torn?
Sometimes the umbilical cord is torn and discarded or cannot be accessed for other reasons. A sample can still be obtained, however, by aspirating the placental surface artery and vein vessels. Although there is some potential variance in pH, P
How do you obtain cord analysis when delaying cord clamping?
The American College of Obstetricians and Gynecologists (ACOG) now advises delayed cord clamping in term and preterm deliveries, which raises the question of how you obtain a blood sample in this setting. Importantly, ACOG recommends delayed cord clamping only in vigorous infants,16 whereas potentially compromised infants should be transferred rapidly for newborn care. Although several studies have demonstrated some variation in cord gas values with delayed cord clamping,17–21 clamping after pulsation has ceased or after the recommended 30 to 60 seconds following birth results in minimal change in BD values. Thus, do not hesitate to perform delayed cord clamping in vigorous infants.
Share your thoughts! Send your Letter to the Editor to [email protected]. Please include your name and the city and state in which you practice.
- Ross MG, Gala R. Use of umbilical artery base excess: algorithm for the timing of hypoxic injury. Am J Obstet Gynecol. 2002;187(1):1–9.
- Uccella S, Cromi A, Colombo G, et al. Prediction of fetal base excess values at birth using an algorithm to interpret fetal heart rate tracings: a retrospective validation. BJOG. 2012;119(13):1657–1664.
- Uccella S, Cromi A, Colombo GF, et al. Interobserver reliability to interpret intrapartum electronic fetal heart rate monitoring: does a standardized algorithm improve agreement among clinicians? J Obstet Gynaecol. 2015;35(3):241–245.
- White CR, Doherty DA, Cannon JW, Kohan R, Newnham JP, Pennell CE. Cost effectiveness of universal umbilical cord blood gas and lactate analysis in a tertiary level maternity unit. J Perinat Med. 2016;44(5):573–584.
- White CR, Doherty DA, Henderson JJ, Kohan R, Newnham JP, Pennell CE. Benefits of introducing universal umbilical cord blood gas and lactate analysis into an obstetric unit. Aust N Z J Obstet Gynaecol. 2010;50(4):318–328.
- Yeomans ER, Hauth JC, Gilstrap LC III, Strickland DM. Umbilical cord pH, Pco2, and bicarbonate following uncomplicated term vaginal deliveries. Am J Obstet Gynecol. 1985;151(6):798–800.
- Wiberg N, Källén K, Olofsson P. Base deficit estimation in umbilical cord blood is influenced by gestational age, choice of fetal fluid compartment, and algorithm for calculation. Am J Obstet Gynecol. 2006;195(6):1651–1656.
- Ross MG, Gala R. Use of umbilical artery base excess: algorithm for the timing of hypoxic injury. Am J Obstet Gynecol. 2002;187(1):1–9.
- Executive summary: Neonatal encephalopathy and neurologic outcome, second edition. Report of the American College of Obstetricians and Gynecologists’ Task Force on Neonatal Encephalopathy. Obstet Gynecol. 2014;123(4):896-901.
- Hamel MS, Anderson BL, Rouse DJ. Oxygen for intrauterine resuscitation: of unproved benefit and potentially harmful. Am J Obstet Gynecol. 2014;211(2):124–127.
- Owen P, Farrell TA, Steyn W. Umbilical cord blood gas analysis; a comparison of two simple methods of sample storage. Early Hum Dev. 1995;42(1):67–71.
- Armstrong L, Stenson B. Effect of delayed sampling on umbilical cord arterial and venous lactate and blood gases in clamped and unclamped vessels. Arch Dis Child Fetal Neonatal Ed. 2006;91(5):F342–F345.
- White CR, Mok T, Doherty DA, Henderson JJ, Newnham JP, Pennell CE. The effect of time, temperature and storage device on umbilical cord blood gas and lactate measurement: a randomized controlled trial. J Matern Fetal Neonatal Med. 2012;25(6):587–594.
- Knowles TP, Mullin RA, Hunter JA, Douce FH. Effects of syringe material, sample storage time, and temperature on blood gases and oxygen saturation in arterialized human blood samples. Respir Care. 2006;51(7):732–736.
- Nodwell A, Carmichael L, Ross M, Richardson B. Placental compared with umbilical cord blood to assess fetal blood gas and acid-base status. Obstet Gynecol. 2005;105(1):129–138.
- American College of Obstetricians and Gynecologists. ACOG Committee Opinion No. 684. Delayed umbilical cord clamping after birth. Obstet Gynecol. 2017;129(1):e5–e10.
- De Paco C, Florido J, Garrido MC, Prados S, Navarrete L. Umbilical cord blood acid-base and gas analysis after early versus delayed cord clamping in neonates at term. Arch Gynecol Obstet. 2011;283(5):1011–1014.
- Valero J, Desantes D, Perales-Puchalt A, Rubio J, Diago Almela VJ, Perales A. Effect of delayed umbilical cord clamping on blood gas analysis. Eur J Obstet Gynecol Reprod Biol. 2012;162(1): 21–23.
- Andersson O, Hellström-Westas L, Andersson D, Clausen J, Domellöf M. Effects of delayed compared with early umbilical cord clamping on maternal postpartum hemorrhage and cord blood gas sampling: a randomized trial. Acta Obstet Gynecol Scand. 2013;92(5):567–574.
- Wiberg N, Källén K, Olofsson P. Delayed umbilical cord clamping at birth has effects on arterial and venous blood gases and lactate concentrations. BJOG. 2008;115(6):697–703.
- Mokarami P, Wiberg N, Olofsson P. Hidden acidosis: an explanation of acid-base and lactate changes occurring in umbilical cord blood after delayed sampling. BJOG. 2013;120(8):996–1002.

Dr. Ross is Distinguished Professor of Obstetrics and Gynecology and Public Health, Geffen School of Medicine at UCLA, Fielding School of Public Health at UCLA, Department of Obstetrics and Gynecology, Harbor/UCLA Medical Center, Torrance, California.
The author reports no financial relationships relevant to this article.
Umbilical cord blood (cord) gas values can aid both in understanding the cause of an infant’s acidosis and in providing reassurance that acute acidosis or asphyxia is not responsible for a compromised infant with a low Apgar score. Together with other clinical measurements (including fetal heart rate [FHR] tracings, Apgar scores, newborn nucleated red cell counts, and neonatal imaging), cord gas analysis can be remarkably helpful in determining the cause for a depressed newborn. It can help us determine, for example, if infant compromise was a result of an asphyxial event, and we often can differentiate whether the event was acute, prolonged, or occurred prior to presentation in labor. We further can use cord gas values to assess whether a decision for operative intervention for nonreassuring fetal well-being was appropriate (see “Brain injury at birth: Cord gas values presented as evidence at trial”). In addition, cord gas analysis can complement methods for determining fetal acidosis changes during labor, enabling improved assessment of FHR tracings.1−3
At 40 weeks' gestation, a woman presented to the hospital because of decreased fetal movement. On arrival, an external fetal heart-rate (FHR) monitor showed nonreassuring tracings, evidenced by absent to minimal variability and subtle decelerations occurring at 10- to 15-minute intervals. The on-call ObGyn requested induction of labor with oxytocin, and a low-dose infusion (1 mU/min) was initiated. An internal FHR monitor was then placed and late decelerations were observed with the first 2 induced contractions. The oxytocin infusion was discontinued and the ObGyn performed an emergency cesarean delivery. The infant's Apgar scores were 1, 2, and 2 at 1, 5, and 10 minutes, respectively. Cord samples were obtained and values from the umbilical artery were as follows: pH, 6.86; Pco2, 55 mm Hg; Po2, 6 mm Hg; and BDECF, 21.1 mmol/L. Values from the umbilical vein were: pH, 6.94; Pco2, 45 mm Hg; Po2, 17 mm Hg; and BDECF, 20.0 mmol/L. The infant was later diagnosed with a hypoxic brain injury resulting in cerebral palsy. At trial years later, the boy had cognitive and physical limitations and required 24-hour care.
The parents claimed that the ObGyn should have performed a cesarean delivery earlier when the external FHR monitor showed nonreassuring tracings.
The hospital and physician claimed that, while tracings were consistently nonreassuring, they were stable. They maintained that the child's brain damage was not due to a delivery delay, as the severe level of acidosis in both the umbilical artery and vein could not be a result of the few heart rate decelerations during the 2-hour period of monitoring prior to delivery. They argued that the clinical picture indicated a pre-hospital hypoxic event associated with decreased fetal movement.
A defense verdict was returned.
Case assessment
Cord gas results, together with other measures (eg, infant nucleated red blood cells, brain imaging) can aid the ObGyn in medicolegal cases. However, they are not always protective of adverse judgment.
I recommend checking umbilical cord blood gas values on all operative vaginal deliveries, cesarean deliveries for fetal concern, abnormal FHR patterns, clinical chorioamnionitis, multifetal gestations, premature deliveries, and all infants with low Apgar scores at 1 or 5 minutes. If you think you may need a cord gas analysis, go ahead and obtain it. Cord gas analysis often will aid in justifying your management or provide insight into the infant’s status.
Controversy remains as to the benefit of universal cord gas analysis. Assuming a variable cost of $15 for 2 (artery and vein) blood gas samples per neonate,4 the annual cost in the United States would be approximately $60 million. This would likely be cost effective as a result of medicolegal and educational benefits as well as potential improvements in perinatal outcome5 and reductions in special care nursery admissions.4
CASE 1: A newborn with unexpected acidosis
A 29-year-old woman (G2P1) at 38 weeks’ gestation was admitted to the hospital following an office visit during which oligohydramnios (amniotic fluid index, 3.5 cm) was found. The patient had a history of a prior cesarean delivery for failure to progress, and she desired a repeat cesarean delivery. Fetal monitoring revealed a heart rate of 140 beats per minute with moderate variability and uterine contractions every 3 to 5 minutes associated with moderate variable decelerations. A decision was made to proceed with the surgery. Blood samples were drawn for laboratory analysis, monitoring was discontinued, and the patient was taken to the operating room. An epidural anesthetic was placed and the cesarean delivery proceeded.
On uterine incision, there was no evidence of abruption or uterine rupture, but thick meconium-stained amniotic fluid was observed. A depressed infant was delivered, the umbilical cord clamped, and the infant handed to the pediatric team. Cord samples were obtained and values from the umbilical artery were as follows: pH, 6.80; P
What happened?
Read how to use cord gas values in practice
Using cord gas values in practice
Before analyzing the circumstances in Case 1,it is important to consider several key questions, including:
- What are the normal levels of cord pH, O2, CO2, and base deficit (BD)?
- How does cord gas indicate what happened during labor?
- What are the preventable errors in cord gas sampling or interpretation?
For a review of fetal cord gas physiology, see “Physiology of fetal cord gases: The basics”.
A review of basic fetal cord gas physiology will assist in understanding how values are interpreted.
Umbilical cord O2 and CO2
Fetal cord gas values result from the rapid transfer of gases and the slow clearance of acid across the placenta. Approximately 10% of maternal blood flow supplies the uteroplacental circulation, with the near-term placenta receiving approximately 70% of the uterine blood flow.1 Of the oxygen delivered, a surprising 50% provides for placental metabolism and 50% for the fetus. On the fetal side, 40% of fetal cardiac output supplies the umbilical circulation. Oxygen and carbon dioxide pass readily across the placental layers; exchange is limited by the amount of blood flow on both the maternal and the fetal side (flow limited). In the human placenta, maternal blood and fetal blood effectively travel in the same direction (concurrent exchange); thus, umbilical vein O2 and CO2 equilibrate with that in the maternal uterine vein.
Most of the O2 in fetal blood is carried by hemoglobin. Because of the markedly greater affinity of fetal hemoglobin for O2, the saturation curve is shifted to the left, resulting in increased hemoglobin saturation at the relatively low levels of fetal Po2. This greater affinity for oxygen results from the unique fetal hemoglobin gamma (γ) subunit, as compared with the adult beta (ß) subunit. Fetal hemoglobin has a reduced interaction with 2,3-bisphosphoglycerate, which itself decreases the affinity of adult hemoglobin for oxygen.
The majority of CO2 (85%) is carried as part of the bicarbonate buffer system. Fetal CO2 is converted into carbonic acid (H2CO3) in the red cell and dissociates into hydrogen (H+) and bicarbonate (HCO3−) ions, which diffuse out of the cell. When fetal blood reaches the placenta, this process is reversed and CO2 diffuses across the placenta to the maternal circulation. The production of H+ ions from CO2 explains the development of respiratory acidosis from high Pco2. In contrast, anaerobic metabolism, which produces lactic acid, results in metabolic acidosis.
Difference between pH and BD
The pH is calculated as the inverse log of the H+ ion concentration; thus, the pH falls as the H+ ion concentration exponentially increases, whether due to respiratory or metabolic acidosis. To quantify the more important metabolic acidosis, we use BD, which is a measure of how much of bicarbonate buffer base has been used by (lactic) acid. The BD and the base excess (BE) may be used interchangeably, with BE representing a negative number. Although BD represents the metabolic component of acidosis, a correction may be required to account for high levels of fetal Pco2 (see Case 1). In this situation, a more accurate measure is BD extracellular fluid (BDECF).
Why not just use pH? There are 2 major limitations to using pH as a measure of fetal or newborn acidosis. First, pH may be influenced by both respiratory and metabolic alterations, although only metabolic acidosis is associated with fetal neurologic injury.2 Furthermore, as pH is a log function, it does not change linearly with the amount of acid produced. In contrast to pH, BD is a measure of metabolic acidosis and changes in direct proportion to fetal acid production.
What about lactate? Measurements of lactate may also be included in blood gas analyses. Under hypoxic conditions, excess pyruvate is converted into lactate and released from the cell along with H+, resulting in acidosis. However, levels of umbilical cord lactate associated with neonatal hypoxic injury have not been established to the same degree as have pH or BD. Nevertheless, lactate has been measured in fetal scalp blood samples and offers the potential as a marker of fetal hypoxemia and acidosis.3
References
- Assali NS. Dynamics of the uteroplacental circulation in health and disease. Am J Perinatol. 1989;6(2):105-109.
- Low JA, Panagiotopoulos C, Derrick EJ. Newborn complications after intrapartum asphyxia with metabolic acidosis in the term fetus. Am J Obstet Gynecol. 1994;170(4):1081-1087.
- Mancho JP, Gamboa SM, Gimenez OR, Esteras RC, Solanilla BR, Mateo SC. Diagnostic accuracy of fetal scalp lactate for intrapartum acidosis compared with scalp pH [published online ahead of print October 8, 2016]. J Perinatal Med. doi: 10.1515/jpm-2016-004.
Normal values: The “20, 30, 40, 50 rule”
Among the values reported for umbilical blood gas, the pH, P
I recommend using the “20, 30, 40, 50 rule” as a simple tool for remembering normal umbilical artery and vein P
- P
o 2 values are lower than Pco 2 values; thus, the 20 and 30 represent Po 2 values - as fetal umbilical artery P
o 2 is lower than umbilical vein Po 2, 20 mm Hg represents the umbilical artery and 30 mm Hg represents the vein - P
co 2 values are higher in the umbilical artery than in the vein; thus, 50 mm Hg represents the umbilical artery and 40 mm Hg represents the umbilical vein.
Umbilical cord BD values change in relation to labor and FHR decelerations.8 Prior to labor, the normal fetus has a slight degree of acidosis (BD, 2 mmol/L). During the latent phase of labor, fetal BD typically does not change. With the increased frequency of contractions, BD may increase 1 mmol/L for every 3 to 6 hours during the active phase and up to 1 mmol/L per hour during the second stage, depending on FHR responses. Thus, following vaginal delivery the average umbilical artery BD is approximately 5 mmol/L and the umbilical vein BD is approximately 4 mmol/L. As lactate crosses the placenta slowly, BD values are typically only 1 mmol/L less in the umbilical vein than in the artery, unless there has been an obstruction to placental flow (see Case 1).
For pH, the umbilical artery value is always lower than that of the vein, a result of both the higher umbilical artery P
Possible causes of abnormal cord gas values
Because of the nearly fully saturated maternal hemoglobin under normal conditions, fetal arterial and venous P
In contrast, reduced fetal P
Effect of maternal oxygen administration on fetal oxygenation
Although maternal oxygen administration is commonly used during labor and delivery, controversy remains as to the benefit of oxygen supplementation.10 In a normal mother with oxygen saturation above 95%, the administration of oxygen will increase maternal arterial P
However, maternal oxygen supplementation may have marked benefit in cases in which maternal arterial P
How did the Case 1 circumstances lead to newborn acidosis?
Most noticeable in this case is the large difference in BD between the umbilical artery and vein and the high P
Whereas BD normally is only about 1 mmol/L greater in the umbilical artery versus in the vein, occasionally the arterial value is markedly greater than the vein value. This can occur when there is a cessation of blood flow through the placenta, as a result of complete umbilical cord obstruction, or when there is a uterine abruption. In these situations, the umbilical vein (which has not had blood flow) represents the fetal status prior to the occlusion event. In contrast, despite bradycardia, fetal heart pulsations mix blood within the umbilical artery and therefore the artery generally represents the fetal status at the time of birth.
In response to complete cord occlusion, fetal BD increases by approximately 1 mmol/L every 2 minutes. Consequently, an 8 mmol/L difference in BD between the umbilical artery and vein is consistent with a 16-minute period of umbilical occlusion or placental abruption. Also in response to complete umbilical cord occlusion, P
The umbilical vein BD is also elevated for early labor. This value suggests that repetitive, intermittent cord occlusions (evident on the initial fetal monitor tracing) likely resulted in this moderate acidosis prior to the complete cord occlusion in the final 16 minutes.
Thus, BD and P
Read more cases plus procedures, equipment for cord sampling
CASE 2: An infant with unusual umbilical artery values
An infant born via vacuum delivery for a prolonged second stage of labor had 1- and 5-minute Apgar scores of 8 and 9, respectively. Cord gas values were obtained, and analysis revealed that for the umbilical artery, the pH was 7.29; P
The resident asked, “How is the P
The curious Case 2 values suggest an air bubble
Although it is possible that the aberrant values in Case 2 could have resulted from switching the artery and vein samples, the pH is lower in the artery, and both the artery P
Related article:
Is neonatal injury more likely outside of a 30-minute decision-to-incision time interval for cesarean delivery?
CASE 3: A vigorous baby with significant acidosis
A baby with 1- and 5-minute Apgar scores of 9 and 9 was delivered by cesarean and remained vigorous. Umbilical cord analysis revealed an umbilical artery pH level of 7.15, with normal P
Was there a collection error in Case 3?
On occasion, a falsely low pH level and, thus, a falsely elevated BD may result from excessive heparin in the collection syringe. Heparin is acidotic and should be used only to coat the syringe. Although syringes in current use are often pre-heparinized, if one is drawing up heparin into the syringe, it should be coated and then fully expelled.
Umbilical cord sampling: Procedures and equipment
Many issues remain regarding the optimal storage of cord samples. Ideally, a doubly clamped section of the cord promptly should be sampled into glass syringes that can be placed on ice and rapidly measured for cord values.
Stability of umbilical cord samples within the cord is within 20 to 30 minutes. Delayed sampling of clamped cord sections generally has minimal effect on pH and P
Plastic syringes can introduce interference. Several studies have demonstrated that collection of samples in plastic may result in an increase in P
Use glass, and “ice” the sample if necessary. Although it has been suggested that placing samples on ice minimizes metabolism, the cooled plastic may in fact be more susceptible to oxygen diffusion. Thus, unless samples will be analyzed promptly, it is best to use glass syringes on ice.13,14
Related article:
Protecting the newborn brain—the final frontier in obstetric and neonatal care
What if the umbilical cord is torn?
Sometimes the umbilical cord is torn and discarded or cannot be accessed for other reasons. A sample can still be obtained, however, by aspirating the placental surface artery and vein vessels. Although there is some potential variance in pH, P
How do you obtain cord analysis when delaying cord clamping?
The American College of Obstetricians and Gynecologists (ACOG) now advises delayed cord clamping in term and preterm deliveries, which raises the question of how you obtain a blood sample in this setting. Importantly, ACOG recommends delayed cord clamping only in vigorous infants,16 whereas potentially compromised infants should be transferred rapidly for newborn care. Although several studies have demonstrated some variation in cord gas values with delayed cord clamping,17–21 clamping after pulsation has ceased or after the recommended 30 to 60 seconds following birth results in minimal change in BD values. Thus, do not hesitate to perform delayed cord clamping in vigorous infants.
Share your thoughts! Send your Letter to the Editor to [email protected]. Please include your name and the city and state in which you practice.
- Ross MG, Gala R. Use of umbilical artery base excess: algorithm for the timing of hypoxic injury. Am J Obstet Gynecol. 2002;187(1):1–9.
- Uccella S, Cromi A, Colombo G, et al. Prediction of fetal base excess values at birth using an algorithm to interpret fetal heart rate tracings: a retrospective validation. BJOG. 2012;119(13):1657–1664.
- Uccella S, Cromi A, Colombo GF, et al. Interobserver reliability to interpret intrapartum electronic fetal heart rate monitoring: does a standardized algorithm improve agreement among clinicians? J Obstet Gynaecol. 2015;35(3):241–245.
- White CR, Doherty DA, Cannon JW, Kohan R, Newnham JP, Pennell CE. Cost effectiveness of universal umbilical cord blood gas and lactate analysis in a tertiary level maternity unit. J Perinat Med. 2016;44(5):573–584.
- White CR, Doherty DA, Henderson JJ, Kohan R, Newnham JP, Pennell CE. Benefits of introducing universal umbilical cord blood gas and lactate analysis into an obstetric unit. Aust N Z J Obstet Gynaecol. 2010;50(4):318–328.
- Yeomans ER, Hauth JC, Gilstrap LC III, Strickland DM. Umbilical cord pH, Pco2, and bicarbonate following uncomplicated term vaginal deliveries. Am J Obstet Gynecol. 1985;151(6):798–800.
- Wiberg N, Källén K, Olofsson P. Base deficit estimation in umbilical cord blood is influenced by gestational age, choice of fetal fluid compartment, and algorithm for calculation. Am J Obstet Gynecol. 2006;195(6):1651–1656.
- Ross MG, Gala R. Use of umbilical artery base excess: algorithm for the timing of hypoxic injury. Am J Obstet Gynecol. 2002;187(1):1–9.
- Executive summary: Neonatal encephalopathy and neurologic outcome, second edition. Report of the American College of Obstetricians and Gynecologists’ Task Force on Neonatal Encephalopathy. Obstet Gynecol. 2014;123(4):896-901.
- Hamel MS, Anderson BL, Rouse DJ. Oxygen for intrauterine resuscitation: of unproved benefit and potentially harmful. Am J Obstet Gynecol. 2014;211(2):124–127.
- Owen P, Farrell TA, Steyn W. Umbilical cord blood gas analysis; a comparison of two simple methods of sample storage. Early Hum Dev. 1995;42(1):67–71.
- Armstrong L, Stenson B. Effect of delayed sampling on umbilical cord arterial and venous lactate and blood gases in clamped and unclamped vessels. Arch Dis Child Fetal Neonatal Ed. 2006;91(5):F342–F345.
- White CR, Mok T, Doherty DA, Henderson JJ, Newnham JP, Pennell CE. The effect of time, temperature and storage device on umbilical cord blood gas and lactate measurement: a randomized controlled trial. J Matern Fetal Neonatal Med. 2012;25(6):587–594.
- Knowles TP, Mullin RA, Hunter JA, Douce FH. Effects of syringe material, sample storage time, and temperature on blood gases and oxygen saturation in arterialized human blood samples. Respir Care. 2006;51(7):732–736.
- Nodwell A, Carmichael L, Ross M, Richardson B. Placental compared with umbilical cord blood to assess fetal blood gas and acid-base status. Obstet Gynecol. 2005;105(1):129–138.
- American College of Obstetricians and Gynecologists. ACOG Committee Opinion No. 684. Delayed umbilical cord clamping after birth. Obstet Gynecol. 2017;129(1):e5–e10.
- De Paco C, Florido J, Garrido MC, Prados S, Navarrete L. Umbilical cord blood acid-base and gas analysis after early versus delayed cord clamping in neonates at term. Arch Gynecol Obstet. 2011;283(5):1011–1014.
- Valero J, Desantes D, Perales-Puchalt A, Rubio J, Diago Almela VJ, Perales A. Effect of delayed umbilical cord clamping on blood gas analysis. Eur J Obstet Gynecol Reprod Biol. 2012;162(1): 21–23.
- Andersson O, Hellström-Westas L, Andersson D, Clausen J, Domellöf M. Effects of delayed compared with early umbilical cord clamping on maternal postpartum hemorrhage and cord blood gas sampling: a randomized trial. Acta Obstet Gynecol Scand. 2013;92(5):567–574.
- Wiberg N, Källén K, Olofsson P. Delayed umbilical cord clamping at birth has effects on arterial and venous blood gases and lactate concentrations. BJOG. 2008;115(6):697–703.
- Mokarami P, Wiberg N, Olofsson P. Hidden acidosis: an explanation of acid-base and lactate changes occurring in umbilical cord blood after delayed sampling. BJOG. 2013;120(8):996–1002.
- Ross MG, Gala R. Use of umbilical artery base excess: algorithm for the timing of hypoxic injury. Am J Obstet Gynecol. 2002;187(1):1–9.
- Uccella S, Cromi A, Colombo G, et al. Prediction of fetal base excess values at birth using an algorithm to interpret fetal heart rate tracings: a retrospective validation. BJOG. 2012;119(13):1657–1664.
- Uccella S, Cromi A, Colombo GF, et al. Interobserver reliability to interpret intrapartum electronic fetal heart rate monitoring: does a standardized algorithm improve agreement among clinicians? J Obstet Gynaecol. 2015;35(3):241–245.
- White CR, Doherty DA, Cannon JW, Kohan R, Newnham JP, Pennell CE. Cost effectiveness of universal umbilical cord blood gas and lactate analysis in a tertiary level maternity unit. J Perinat Med. 2016;44(5):573–584.
- White CR, Doherty DA, Henderson JJ, Kohan R, Newnham JP, Pennell CE. Benefits of introducing universal umbilical cord blood gas and lactate analysis into an obstetric unit. Aust N Z J Obstet Gynaecol. 2010;50(4):318–328.
- Yeomans ER, Hauth JC, Gilstrap LC III, Strickland DM. Umbilical cord pH, Pco2, and bicarbonate following uncomplicated term vaginal deliveries. Am J Obstet Gynecol. 1985;151(6):798–800.
- Wiberg N, Källén K, Olofsson P. Base deficit estimation in umbilical cord blood is influenced by gestational age, choice of fetal fluid compartment, and algorithm for calculation. Am J Obstet Gynecol. 2006;195(6):1651–1656.
- Ross MG, Gala R. Use of umbilical artery base excess: algorithm for the timing of hypoxic injury. Am J Obstet Gynecol. 2002;187(1):1–9.
- Executive summary: Neonatal encephalopathy and neurologic outcome, second edition. Report of the American College of Obstetricians and Gynecologists’ Task Force on Neonatal Encephalopathy. Obstet Gynecol. 2014;123(4):896-901.
- Hamel MS, Anderson BL, Rouse DJ. Oxygen for intrauterine resuscitation: of unproved benefit and potentially harmful. Am J Obstet Gynecol. 2014;211(2):124–127.
- Owen P, Farrell TA, Steyn W. Umbilical cord blood gas analysis; a comparison of two simple methods of sample storage. Early Hum Dev. 1995;42(1):67–71.
- Armstrong L, Stenson B. Effect of delayed sampling on umbilical cord arterial and venous lactate and blood gases in clamped and unclamped vessels. Arch Dis Child Fetal Neonatal Ed. 2006;91(5):F342–F345.
- White CR, Mok T, Doherty DA, Henderson JJ, Newnham JP, Pennell CE. The effect of time, temperature and storage device on umbilical cord blood gas and lactate measurement: a randomized controlled trial. J Matern Fetal Neonatal Med. 2012;25(6):587–594.
- Knowles TP, Mullin RA, Hunter JA, Douce FH. Effects of syringe material, sample storage time, and temperature on blood gases and oxygen saturation in arterialized human blood samples. Respir Care. 2006;51(7):732–736.
- Nodwell A, Carmichael L, Ross M, Richardson B. Placental compared with umbilical cord blood to assess fetal blood gas and acid-base status. Obstet Gynecol. 2005;105(1):129–138.
- American College of Obstetricians and Gynecologists. ACOG Committee Opinion No. 684. Delayed umbilical cord clamping after birth. Obstet Gynecol. 2017;129(1):e5–e10.
- De Paco C, Florido J, Garrido MC, Prados S, Navarrete L. Umbilical cord blood acid-base and gas analysis after early versus delayed cord clamping in neonates at term. Arch Gynecol Obstet. 2011;283(5):1011–1014.
- Valero J, Desantes D, Perales-Puchalt A, Rubio J, Diago Almela VJ, Perales A. Effect of delayed umbilical cord clamping on blood gas analysis. Eur J Obstet Gynecol Reprod Biol. 2012;162(1): 21–23.
- Andersson O, Hellström-Westas L, Andersson D, Clausen J, Domellöf M. Effects of delayed compared with early umbilical cord clamping on maternal postpartum hemorrhage and cord blood gas sampling: a randomized trial. Acta Obstet Gynecol Scand. 2013;92(5):567–574.
- Wiberg N, Källén K, Olofsson P. Delayed umbilical cord clamping at birth has effects on arterial and venous blood gases and lactate concentrations. BJOG. 2008;115(6):697–703.
- Mokarami P, Wiberg N, Olofsson P. Hidden acidosis: an explanation of acid-base and lactate changes occurring in umbilical cord blood after delayed sampling. BJOG. 2013;120(8):996–1002.
She wanted to labor on hands and knees
She wanted to labor on hands and knees
During prenatal visits, a woman, pregnant with her fourth child, discussed undergoing labor and delivery in any position other than on her back; the ObGyn agreed. When she arrived at the hospital in labor, the patient told the nurse that she preferred to labor on her hands and knees. The nurse disagreed because of the fetal heart-rate monitor.
When the patient began hard labor, she turned herself over onto h
Two months later, the patient reported chronic severe pelvic pain and was found to have pudendal neuralgia. She underwent nerve blocks and takes medication for chronic pain.
PATIENT’S CLAIM:
The ObGyn did not assume responsibility when he arrived for the delivery. The nurses did not follow the standard of care. The patient’s injury was the result of tension and compression due to malpositioning of the patient’s legs during delivery.
DEFENDANTS’ DEFENSE:
There was no breach in the standard of care. The patient’s injury, if any, had not been caused by the delivery.
VERDICT:
A $16 million Alabama verdict was returned.
Related article:
10 tips for overcoming common challenges of intrapartum fetal monitoring
Late-term abortion: $1.4M award
Although genetic testing was scheduled for a 37-year-old woman’s 15-week prenatal visit, the ObGyn’s staff failed to draw blood. At 19 weeks’ gestation (April 24), blood was drawn. The ObGyn signed off on test results that showed a high risk for fetal anomaly on May 2, but the patient was not informed until May 22. The ObGyn scheduled amniocentesis for June 3. On May 30, the hospital, based in Illinois, cancelled the test, telling the ObGyn that it was because the patient was over 24 weeks’ pregnant and there was no labor and delivery unit to respond if complications arose. Instead of notifying the patient, the ObGyn arranged for amniocentesis to be performed elsewhere on June 3. The ObGyn saw the amniocentesis results on June 13, but did not tell the patient until July 3, when he advised her to terminate the pregnancy because the baby had severe cardiac defects and Down syndrome; he felt the child would not survive or have very poor quality of life. The ObGyn arranged for the patient to undergo a third-trimester abortion in Kansas and paid all expenses. On July 14, the patient began the 5-day abortion process at 30+ weeks’ gestation.
PATIENT’S CLAIM:
She was never offered additional genetic testing or expedited amniocentesis. She was not told that abortion is illegal in Illinois after 23 6/7 weeks’ gestation. The ObGyn had a motive for paying for her abortion. He never counseled her about options to keep the child. She endured extreme pain and emotional trauma during the abortion and was later found to have posttraumatic stress disorder, multidepressive disorder, and anxiety as a result of the experience. She countered the ObGyn’s contact information claim by saying that her phone number had not changed.
PHYSICIAN’S DEFENSE:
The ObGyn admitted negligence in failing to timely communicate test results but contended that the patient was more than 50% responsible for any delay by failing to update her contact information when she moved. The ObGyn denied causation of any injuries or damage.
VERDICT:
A $1,439,250 Illinois verdict was returned.
Related article:
4 Supreme Court decisions important to ObGyns from the 2015−2016 term
Did delay in delivery cause infant's death?
A woman presented to the hospital in labor. During delivery, the patient’s ObGyn encountered shoulder dystocia. The infant died shortly after birth.
PARENTS’ CLAIM:
The ObGyn and hospital nurses were negligent. The nurses failed to monitor labor and properly communicate with the ObGyn. The ObGyn failed to appreciate the baby’s large size and order a cesarean delivery. The infant’s death was due to a hypoxic event during delivery.
DEFENDANTS’ DEFENSE:
The baby gained an unexpected amount of weight between the last prenatal visit and labor. There was no reason to expect a complication to vaginal delivery. The nurses denied negligence. The child’s sudden death was caused by a genetic cardiac condition.
VERDICT:
A Tennessee defense verdict was returned.
Related article:
Shoulder dystocia: Taking the fear out of management
These cases were selected by the editors of OBG Management from Medical Malpractice Verdicts, Settlements & Experts, with permission of the editor, Lewis Laska (www.verdictslaska.com). The information available to the editors about the cases presented here is sometimes incomplete. Moreover, the cases may or may not have merit. Nevertheless, these cases represent the types of clinical situations that typically result in litigation and are meant to illustrate nationwide variation in jury verdicts and awards.
Share your thoughts! Send your Letter to the Editor to [email protected]. Please include your name and the city and state in which you practice.