User login
Bringing you the latest news, research and reviews, exclusive interviews, podcasts, quizzes, and more.
div[contains(@class, 'read-next-article')]
div[contains(@class, 'nav-primary')]
nav[contains(@class, 'nav-primary')]
section[contains(@class, 'footer-nav-section-wrapper')]
nav[contains(@class, 'nav-ce-stack nav-ce-stack__large-screen')]
header[@id='header']
div[contains(@class, 'header__large-screen')]
div[contains(@class, 'read-next-article')]
div[contains(@class, 'main-prefix')]
div[contains(@class, 'nav-primary')]
nav[contains(@class, 'nav-primary')]
section[contains(@class, 'footer-nav-section-wrapper')]
footer[@id='footer']
section[contains(@class, 'nav-hidden')]
div[contains(@class, 'ce-card-content')]
nav[contains(@class, 'nav-ce-stack')]
div[contains(@class, 'view-medstat-quiz-listing-panes')]
div[contains(@class, 'pane-article-sidebar-latest-news')]
Erythematous Plaque on the Groin and Buttocks
The Diagnosis: Pseudomonas Pyoderma
A skin swab confirmed the presence of a ciprofloxacinsusceptible Pseudomonas aeruginosa strain. Our patient received oral ciprofloxacin 500 mg twice daily for 10 days with remarkable clinical improvement. The remaining skin lesion was successfully treated with more frequent diaper changes and the use of topical corticosteroids and emollients.
The topographical location, cutaneous morphology, clinical context, and sometimes the type of exudate are fundamental for the diagnosis of eruptions in intertriginous areas. Cutaneous Candida infections are common in these locations. They classically present as markedly erythematous plaques that occasionally are erosive, accompanied by satellite papules and pustules.1 Tinea cruris is a dermatophyte infection of the groin, proximal medial thighs, perineum, and buttocks. It usually presents as an erythematous patch that spreads centrifugally with partial central clearing and a slightly elevated, scaly border. Although candidiasis was higher on the differential, it was less likely, as our patient had a concomitant exudate inconsistent with Candida infections. Also, the lack of response to antifungal agents made hypotheses of fungal infections improbable.1
Inverse psoriasis is a variant of psoriasis identified by the development of well-demarcated, nonscaly, shiny plaques on body folds.2 Psoriasis is a chronic disease with several other cutaneous manifestations, such as nail and scalp involvement, as well as erythematous scaly plaques on the extensor surfaces of the limbs. The absence of a history of psoriasis, lack of other cutaneous manifestations, and no response to topical corticosteroids made the diagnosis of inverse psoriasis unlikely in our patient.
Erythrasma is a common superficial cutaneous infection caused by Corynebacterium minutissimum, a grampositive bacillus. It typically presents as an intertriginous eruption characterized by small erythematous to brown patches or thin plaques with fine scaling and sharp borders.3 Erythrasma displays a coral red fluorescence on Wood lamp examination that can be useful in the distinction from other causes of intertrigo.1 Although this examination had not been performed in our patient, the striking exudate made erythrasma less likely, and the culture performed on skin swab material would help to rule out this diagnosis.
Pseudomonas aeruginosa is a gram-negative strict aerobic bacillus of ubiquitous distribution with a preference for humid environments.4,5 Pseudomonas aeruginosa infections were first reported in the 19th century by physicians who noticed a peculiar odorous condition that caused a blue-green discoloration on bandages. This coloration explains the species name aeruginosa which is derived from the Latin word for copper rust.4 It comes from several water-soluble pigments produced by this microorganism, the most prevalent of which are pyocyanin and pyoverdine. Pyocyanin has a greenish-blue color and is nonfluorescent, while pyoverdine is green-yellowish and fluoresces under Wood light.5 Other pigments, such as pyorubin and pyomelanin, can be produced by some Pseudomonas strains.4
Pseudomonas aeruginosa has become one of the main pathogens involved in hospital-acquired infections,6 especially in immunocompromised patients.6,7 It is a frequent cause of respiratory infections in patients with cystic fibrosis, as it is present in the airways of up to 70% of these patients in adulthood.7 Also, due to a variety of adaptive mechanisms with the development of resistance to a range of antibiotics, P aeruginosa has become a worldwide public health problem and is involved in several life-threatening nosocomial infections.7,8
Cutaneous P aeruginosa infections range from superficial to deep tissue involvement and can affect both immunocompromised and immunocompetent individuals.9 They are classified as primary when they originate directly from the skin or secondary when they occur in the context of bacteremia. Primary infections mostly are mild and often are seen in healthy individuals; they usually occur by inoculation and predominate in moist areas where skin breakdown is frequent. Secondary infections typically affect immunocompromised individuals and portend a poor prognosis.5,9
Denominated as Pseudomonas pyoderma, the superficial skin infection by P aeruginosa is described as a condition where the epidermis has a moth-eaten appearance with macerated or eroded borders.10 A blue-greenish exudate and a grape juice odor often are present. This infection usually occurs as a complication of several skin conditions such as tinea pedis, eczema, burns, wounds, and ulcers.5,10
We believe that our patient developed Pseudomonas pyoderma as a complication of diaper dermatitis. His extended hospital stay with the use of different antibiotic regimens for the treatment of several infectious complications may have contributed to the development of infection by P aeruginosa.11 Despite its great clinical relevance, there are few studies in the literature on primary skin infections caused by P aeruginosa, and clinical descriptions with images are rare. Our patient had a nonspecific noneczematous dermatitis, and the projections on the periphery of the lesion resembled the moth-eaten appearance of the classic description of Pseudomonas pyoderma.5,10 The presence of a greenish exudate should promptly raise suspicion for this entity. We believe that the presentation of this case can illustrate this finding and help physicians to recognize this infection.
- Kalra MG, Higgins KE, Kinney BS. Intertrigo and secondary skin infections. Am Fam Physician. 2014;89:569-573.
- Micali G, Verzi AE, Giuffrida G, et al. Inverse psoriasis: from diagnosis to current treatment options. Clin Cosmet Investig Dermatol. 2019; 12:953-959.
- Somerville DA. Erythrasma in normal young adults. J Med Microbiol. 1970;3:57-64.
- D’Agata E. Pseudomonas aeruginosa and other Pseudomonas species. In: Bennett JE, Dolin R, Blaser MJ, eds. Mandell, Douglas, and Bennett’s Principles and Practice of Infectious Diseases. Vol 2. 8th ed. Elsevier; 2015:2518-2531.
- Silvestre JF, Betlloch MI. Cutaneous manifestations due to Pseudomonas infection. Int J Dermatol. 1999;38:419-431.
- Young LS, Armstrong D. Pseudomonas aeruginosa infections. CRC Crit Rev Clin Lab Sci. 1972;3:291-347.
- Moradali MF, Ghods S, Rehm BH. Pseudomonas aeruginosa lifestyle: a paradigm for adaptation, survival, and persistence. Front Cell Infect Microbiol. 2017;7:39.
- Rosenthal VD, Bat-Erdene I, Gupta D, et al. International Nosocomial Infection Control Consortium (INICC) report, data summary of 45 countries for 2012-2017: device-associated module. Am J Infect Control. 2020;48:423-432.
- Wu DC, Chan WW, Metelitsa AI, et al. Pseudomonas skin infection: clinical features, epidemiology, and management. Am J Clin Dermatol. 2011;12:157-169.
- Hall JH, Callaway JL, Tindall JP, et al. Pseudomonas aeruginosa in dermatology. Arch Dermatol. 1968;97:312-324.
- Merchant S, Proudfoot EM, Quadri HN, et al. Risk factors for Pseudomonas aeruginosa infections in Asia-Pacific and consequences of inappropriate initial antimicrobial therapy: a systematic literature review and meta-analysis. J Glob Antimicrob Resist. 2018;14:33-44.
The Diagnosis: Pseudomonas Pyoderma
A skin swab confirmed the presence of a ciprofloxacinsusceptible Pseudomonas aeruginosa strain. Our patient received oral ciprofloxacin 500 mg twice daily for 10 days with remarkable clinical improvement. The remaining skin lesion was successfully treated with more frequent diaper changes and the use of topical corticosteroids and emollients.
The topographical location, cutaneous morphology, clinical context, and sometimes the type of exudate are fundamental for the diagnosis of eruptions in intertriginous areas. Cutaneous Candida infections are common in these locations. They classically present as markedly erythematous plaques that occasionally are erosive, accompanied by satellite papules and pustules.1 Tinea cruris is a dermatophyte infection of the groin, proximal medial thighs, perineum, and buttocks. It usually presents as an erythematous patch that spreads centrifugally with partial central clearing and a slightly elevated, scaly border. Although candidiasis was higher on the differential, it was less likely, as our patient had a concomitant exudate inconsistent with Candida infections. Also, the lack of response to antifungal agents made hypotheses of fungal infections improbable.1
Inverse psoriasis is a variant of psoriasis identified by the development of well-demarcated, nonscaly, shiny plaques on body folds.2 Psoriasis is a chronic disease with several other cutaneous manifestations, such as nail and scalp involvement, as well as erythematous scaly plaques on the extensor surfaces of the limbs. The absence of a history of psoriasis, lack of other cutaneous manifestations, and no response to topical corticosteroids made the diagnosis of inverse psoriasis unlikely in our patient.
Erythrasma is a common superficial cutaneous infection caused by Corynebacterium minutissimum, a grampositive bacillus. It typically presents as an intertriginous eruption characterized by small erythematous to brown patches or thin plaques with fine scaling and sharp borders.3 Erythrasma displays a coral red fluorescence on Wood lamp examination that can be useful in the distinction from other causes of intertrigo.1 Although this examination had not been performed in our patient, the striking exudate made erythrasma less likely, and the culture performed on skin swab material would help to rule out this diagnosis.
Pseudomonas aeruginosa is a gram-negative strict aerobic bacillus of ubiquitous distribution with a preference for humid environments.4,5 Pseudomonas aeruginosa infections were first reported in the 19th century by physicians who noticed a peculiar odorous condition that caused a blue-green discoloration on bandages. This coloration explains the species name aeruginosa which is derived from the Latin word for copper rust.4 It comes from several water-soluble pigments produced by this microorganism, the most prevalent of which are pyocyanin and pyoverdine. Pyocyanin has a greenish-blue color and is nonfluorescent, while pyoverdine is green-yellowish and fluoresces under Wood light.5 Other pigments, such as pyorubin and pyomelanin, can be produced by some Pseudomonas strains.4
Pseudomonas aeruginosa has become one of the main pathogens involved in hospital-acquired infections,6 especially in immunocompromised patients.6,7 It is a frequent cause of respiratory infections in patients with cystic fibrosis, as it is present in the airways of up to 70% of these patients in adulthood.7 Also, due to a variety of adaptive mechanisms with the development of resistance to a range of antibiotics, P aeruginosa has become a worldwide public health problem and is involved in several life-threatening nosocomial infections.7,8
Cutaneous P aeruginosa infections range from superficial to deep tissue involvement and can affect both immunocompromised and immunocompetent individuals.9 They are classified as primary when they originate directly from the skin or secondary when they occur in the context of bacteremia. Primary infections mostly are mild and often are seen in healthy individuals; they usually occur by inoculation and predominate in moist areas where skin breakdown is frequent. Secondary infections typically affect immunocompromised individuals and portend a poor prognosis.5,9
Denominated as Pseudomonas pyoderma, the superficial skin infection by P aeruginosa is described as a condition where the epidermis has a moth-eaten appearance with macerated or eroded borders.10 A blue-greenish exudate and a grape juice odor often are present. This infection usually occurs as a complication of several skin conditions such as tinea pedis, eczema, burns, wounds, and ulcers.5,10
We believe that our patient developed Pseudomonas pyoderma as a complication of diaper dermatitis. His extended hospital stay with the use of different antibiotic regimens for the treatment of several infectious complications may have contributed to the development of infection by P aeruginosa.11 Despite its great clinical relevance, there are few studies in the literature on primary skin infections caused by P aeruginosa, and clinical descriptions with images are rare. Our patient had a nonspecific noneczematous dermatitis, and the projections on the periphery of the lesion resembled the moth-eaten appearance of the classic description of Pseudomonas pyoderma.5,10 The presence of a greenish exudate should promptly raise suspicion for this entity. We believe that the presentation of this case can illustrate this finding and help physicians to recognize this infection.
- Kalra MG, Higgins KE, Kinney BS. Intertrigo and secondary skin infections. Am Fam Physician. 2014;89:569-573.
- Micali G, Verzi AE, Giuffrida G, et al. Inverse psoriasis: from diagnosis to current treatment options. Clin Cosmet Investig Dermatol. 2019; 12:953-959.
- Somerville DA. Erythrasma in normal young adults. J Med Microbiol. 1970;3:57-64.
- D’Agata E. Pseudomonas aeruginosa and other Pseudomonas species. In: Bennett JE, Dolin R, Blaser MJ, eds. Mandell, Douglas, and Bennett’s Principles and Practice of Infectious Diseases. Vol 2. 8th ed. Elsevier; 2015:2518-2531.
- Silvestre JF, Betlloch MI. Cutaneous manifestations due to Pseudomonas infection. Int J Dermatol. 1999;38:419-431.
- Young LS, Armstrong D. Pseudomonas aeruginosa infections. CRC Crit Rev Clin Lab Sci. 1972;3:291-347.
- Moradali MF, Ghods S, Rehm BH. Pseudomonas aeruginosa lifestyle: a paradigm for adaptation, survival, and persistence. Front Cell Infect Microbiol. 2017;7:39.
- Rosenthal VD, Bat-Erdene I, Gupta D, et al. International Nosocomial Infection Control Consortium (INICC) report, data summary of 45 countries for 2012-2017: device-associated module. Am J Infect Control. 2020;48:423-432.
- Wu DC, Chan WW, Metelitsa AI, et al. Pseudomonas skin infection: clinical features, epidemiology, and management. Am J Clin Dermatol. 2011;12:157-169.
- Hall JH, Callaway JL, Tindall JP, et al. Pseudomonas aeruginosa in dermatology. Arch Dermatol. 1968;97:312-324.
- Merchant S, Proudfoot EM, Quadri HN, et al. Risk factors for Pseudomonas aeruginosa infections in Asia-Pacific and consequences of inappropriate initial antimicrobial therapy: a systematic literature review and meta-analysis. J Glob Antimicrob Resist. 2018;14:33-44.
A 68-year-old man presented with an extensive erythematous plaque of 3 weeks’ duration that started in the groin and spread to the buttocks. It was associated with pruritus and a burning sensation. He was admitted to the palliative care unit 1 year prior for the management of terminal lung cancer. Despite the use of topical corticosteroids and antifungals, the lesions gradually worsened with dissemination to the back. Physical examination revealed an erythematous macerated plaque that extended from the buttocks and groin region to the scapular area (top). Its borders had an eroded appearance with projections compatible with radial spread (bottom). A greenish exudate soaked the diaper and sheets. No other cutaneous lesions were noted.


Pfizer recalls more quinapril because of potential carcinogen
, the company announced.
The Accupril recall comes one month after Pfizer recalled six lots of Accuretic (Quinapril HCI/hydrochlorathiazide) tablets for the same problem.
Accupril is indicated for the treatment of hypertension and management of heart failure when added to conventional therapy, including diuretics and/or digitalis.
To date, Pfizer is not aware of any reports of adverse events related to the Accupril recall, and the company believes the benefit/risk profile remains positive based on currently available data.
“Although long-term ingestion of N-nitroso-quinapril may be associated with a potential increased cancer risk in humans, there is no immediate risk to patients taking this medication,” the company said April 22 in a news release.
Patients currently taking the recalled products are asked to consult with their doctor about alternative treatment options.
The recalled Accupril tablets were sold in 90-count bottles distributed nationwide to wholesalers and distributors in the United States and Puerto Rico from December 2019 to April 2022.
National drug codes (NDC), lot numbers, and expiration dates are listed in the company announcement posted on the Food and Drug Administration’s website.
Patients who are taking this product should consult with their health care provider or pharmacy to determine if they have the affected product. Those with the affected tablets should contact claims management firm Sedgwick by phone at 888-345-0481 Monday through Friday from 8 AM to 5 PM ET for instructions on how to return the product and obtain reimbursement.
Healthcare providers with questions regarding the recall can contact Pfizer by telephone at 800-438-1985, option 3, Monday through Friday from 8 AM to 9 PM ET.
Adverse reactions or quality problems related to this recall should be reported to the FDA’s MedWatch program.
A version of this article first appeared on Medscape.com.
Lowering BP according to newest guidance would cut CV events
Using the 2021 Kidney Disease: Improving Global Outcomes (KDIGO) guideline target of systolic blood pressure (BP) < 120 mm Hg, 66% of adults with chronic kidney disease (CKD) would be eligible for BP lowering, according to a study from Korea.
This represents an added > 10% of patients compared with two earlier guidelines, and these patients have a high risk of cardiovascular disease (CVD), Hyeok-Hee Lee, MD, Yonsei University College of Medicine, Seoul, South Korea, and colleagues reported.
The study was published online in the Journal of the American College of Cardiology.
“New candidates for BP-lowering treatment per the 2021 KDIGO guideline account for a substantial proportion of the total CKD population and bear significantly high CVD risk,” the researchers concluded.
“Undoubtedly, a multipronged approach will be required to address the swelling number of people needing more intense treatment, especially against a background of falling rates of BP control in the general community,” Alexander G. Logan, MD, of Mount Sinai Hospital, Toronto, and the University of Toronto, wrote in an accompanying editorial.
“Let’s not forget hypertension is the number one killer today,” Valentin Fuster, MD, of Icahn School of Medicine at Mount Sinai, New York, who is editor-in-chief of the Journal of the American College of Cardiology, stressed in a podcast that accompanied the article.
“Only 50% of individuals know of their blood pressure, and from this, less than half are properly treated,” he said.
“Today the details of knowing blood pressure levels appear to dominate over the huge ignorance of not knowing about blood pressure at all. Let’s think more and more about this reality,” he urged.
Three guidelines, two study objectives
The researchers compared three guidelines:
- The 2021 KDIGO guidelines, with a target systolic BP of < 120 mm Hg (largely based on the SPRINT trial).
- The 2012 KDIGO guidelines, with a target BP of ≤ 130/80 mm Hg for patients with albuminuria and ≤ 140/90 mm Hg for patients without albuminuria.
- The 2017 American College of Cardiology/American Heart Association (ACC/AHA) BP guideline target of < 130/80 mm Hg.
The study had two objectives:
- To examine the proportions of concordance and discordance between the three guidelines among adults with CKD based on cross-sectional data from the Korea National Health and Nutrition Examination Survey (KNHANES).
- To evaluate the association of each concordance/discordance group with cardiovascular outcomes of patients in the Korean National Health Insurance Service (NHIS) database.
For the first objective, the researchers identified 1,939 adults with CKD from the 2011-2014 survey cycles of KNHANES. Patients were a median age of 59 and 51% were men.
Comparison of the KDIGO 2021 versus 2012 BP targets showed that 50% of patients had BP above both targets; 16% had BP above the KDIGO 2021 target only; 4% had BP above the KDIGO 2012 target only; and 30% had BP control within both targets.
Comparison of the KDIGO 2021 versus 2017 ACC/AHA BP targets showed that 55% of patients had BP above both targets; 11% had BP above the KDIGO 2021 target only; 5% had BP above the 2017 ACC/AHA target only; and 29% had BP control within both targets.
For the second objective, using the NHIS database, researchers identified 412,167 adults with CKD who had routine health examinations during 2009 and 2010. The patients were a median age of 65 and 44% were men.
During a median follow-up of 10 years, the patients had 37,912 incident CVD events, defined as the first hospitalization for myocardial infarction, stroke, or heart failure, or death from CVD.
The adjusted risk of a composite CVD event was higher in patients with BP above the 2021 KDIGO target only (HR, 1.28) or above both the 2012 and 2021 KDIGO targets (HR, 1.52), compared to patients who had BP within both targets.
The adjusted risk of a composite CVD event was also higher in patients with BP above the 2021 KDIGO target only (HR, 1.18) or above both the 2021 KDIGO target and the 2017 ACC/AHA target (HR, 1.41), compared with patients who had BP within both targets.
Editorialist highlights three study aspects
Dr. Fuster noted three main points made by Dr. Logan.
First, the KDIGO 2021 guideline is based on office blood pressure, measured according to the procedure used in the 2017 ACC/AHA guideline. However, the SPRINT ambulatory BP ancillary study found that daytime ambulatory systolic BP was 6.8 mm Hg higher in the < 120 mm Hg group than clinic systolic BP that was measured with an automated BP device, mostly without study personnel.
Second, Dr. Logan noted that “not surprisingly, the investigators showed that the weighted proportion of adults with CKD eligible for BP lowering was highest (66.1%) according to 2021 KDIGO guideline,” compared with the two earlier guidelines.
The findings by Dr. Lee and colleagues align with those of a study that used data from the 2015-2018 U.S. NHANES to estimate the proportion of U.S. adults with CKD eligible for BP lowering according to the 2021 KDIGO guidelines, Dr. Logan added. The study found that 69% of U.S. adults (roughly 24.5 million) should correct their BP.
Third, the study in Korea showed a small percentage of patients (3%-5% of the total) had elevated diastolic BP but controlled systolic BP (< 120 mm Hg) with no increased risk of CVD compared to a reference group of patients with well-controlled BP.
“There is a paucity of evidence examining the relationship between diastolic hypertension and outcomes independently from systolic BP level in CKD patients,” Dr. Logan wrote. Similarly, Dr. Lee and colleagues identified this as an area for further research.
This work was supported by the Korea Health Technology R&D Project through the Korea Health Industry Development Institute funded by the Ministry of Health and Welfare, Republic of Korea. The authors and editorialist have reported no relevant financial relationships.
A version of this article first appeared on Medscape.com.
FROM THE JOURNAL OF THE AMERICAN COLLEGE OF CARDIOLOGY
Shortage of ICU beds did not drive COVID-19 deaths
Contrary to popular belief, no association appeared between the number of intensive care unit beds and COVID-19 deaths, based on a review of data from all 50 states between March 1, 2020, and June 30, 2021.
One of the reasons for poor patient outcomes in the early months of the COVID-19 pandemic was the presumed scarcity of ICU beds, Omar Haider, MD, of Houston Methodist Hospital, and colleagues said. “We hypothesized that the states having a lower number of ICU beds had more COVID-related deaths when compared to the states that had a higher number of ICU beds,” they wrote in an abstract presented at the Critical Care Congress sponsored by the Society of Critical Care Medicine.
According to the researchers, the total number of ICU beds in the United States is approximately 85,000. Hawaii has the highest number of beds per 10,000 persons, and the District of Columbia has the lowest (6.0 vs. 1.6).
The researchers collected data on ICU bed totals from the Kaiser Family Foundation. Statistics on COVID-19 deaths were obtained from The New York Times database, which provided real-time information collected from the Department of Health & Human Services, the Centers for Disease Control and Prevention, and the Census Bureau.
The researchers used the Pearson Correlation Coefficient to compare ICU beds and COVID deaths per 10,000 persons in each state. The R value was 0.29, which indicates no inverse correlation. “Our value of R2, the coefficient of determination, was 0.0858,” they added. They confirmed the results using the Spearman’s Rho, which yielded an rs of 0.3, also a sign of no inverse correlation. No correlation was found between low numbers of ICU beds and high numbers of COVID-19 deaths for any states.
The study findings were limited by several factors, including the lack of standardized reporting timelines across states, differences in state-based vaccination rates, the emergence of the Delta variant during the study period, and time-lag in contemporaneous database updates, the researchers noted.
However, the results suggest that physical ICU beds do not play a role in determining the number of COVID-related deaths. Instead, “other constraints such as less staffing, lack of medical supplies (ventilators and [personal protective equipment]) should be evaluated for potential implications on poor patients’ outcomes,” they concluded.
Pandemic challenges can inform future plans
“As the health care system emerges from the effects of the pandemic, it is important to understand the factors that contributed to adverse outcomes to better prepare for future challenges and improve the delivery of care,” Suman Pal, MBBS, of the University of New Mexico, Albuquerque, said in an interview.
“The findings are not surprising considering what is known about the multitude of factors that determine outcomes for our patients from medical comorbidities, and social determinants of health to upstream structural factors such as systemic inequities and generational trauma,” said Dr. Pal, who was not involved with the study. “Thus, a simple correlation of the number of ICU beds to COVID-19 outcomes is not likely to capture the interplay of all these factors.”
The challenges of the pandemic offer insights to inform future planning, said Dr. Pal.
“In my opinion, a key factor to understand and address would be employee wellness for health care workers,” he said. “The problem of burnout leading to health care workers leaving the workforce has exacerbated the already acute shortages in personnel in recent years.
“In the long term, it may be prudent to reconsider the approach to health by increasing support for preventative and primary care, addressing social factors such as education, nutrition, and housing, to mitigate preventable aspects of diseases.”
Further research is needed to examine the multitude of factors associated with the pandemic, and their interplay, said Dr. Pal. The goals of such research “would be needed to develop a deeper understanding of the factors that contributed to mortality in COVID-19 and the disparities with this across different subpopulations.”
The study received no outside funding. The researchers and Dr. Pal disclosed no relevant financial relationships.
A version of this article first appeared on Medscape.com.
Children and COVID: Weekly cases rise again, but more slowly
New cases of COVID-19 in U.S. children went up for a second consecutive week, but the pace of increase slowed considerably, based on a report from the American Academy of Pediatrics and the Children’s Hospital Association.
The previous week’s count – about 33,000 new COVID cases for April 8-14 – was almost 30% higher than the week before and marked the first rise in incidence after 11 straight weeks of declines, the AAP and CHA said in their weekly COVID-19 report, which is based on data from state and territorial health departments.
The cumulative number of child COVID-19 cases since the start of the pandemic is now over 12.9 million, with children representing 19.0% of cases among all ages. The Centers for Disease Control and Prevention, which uses a different age range for children (0-17 years) than many states, reports corresponding figures of 12.4 million and 17.6%, along with 1,501 deaths.
ED visits show a similar rising trend over recent weeks, as the 7-day average of ED visits with confirmed COVID has crept up from 0.5% in late March/early April to 0.8% on April 22 for children aged 0-11 years, from 0.3% for 0.5% for those aged 12-15, and from 0.3% to 0.6% for 16- and 17-year-olds, based on CDC data.
The daily rate for new admissions for children with confirmed COVID has also moved up slightly, rising from 0.13 per 100,000 population as late as April 13 to 0.15 per 100,000 on April 23. For the number of actual admissions, the latest 7-day (April 17-23) average was 107 in children aged 0-17, compared with 102 for the week of April 10-16, the CDC reported.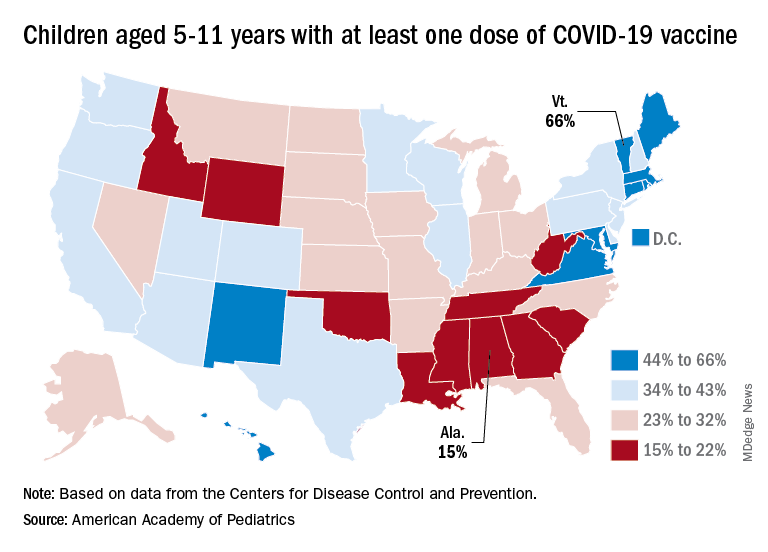
Uptake of the COVID vaccine, however, continued to slide since spiking in January. Initial vaccinations for the latest available week (April 14-20) were down to 48,000 from 59,000 the week before in children aged 5-11 years and 35,000 (vs. 47,000) for those aged 12-17. The weekly highs hit 500,000 and 331,000, respectively, during the Omicron surge, the AAP reported based on CDC data.
Among children aged 5-11, the CDC said that 35.0% had received at least one dose of COVID vaccine as of April 25 and that 28.3% are fully vaccinated, with corresponding figures of 68.8% and 58.8% for 12- to 17-year-olds on April 25.
Among the states, the highest vaccination rates generally are found in New England and the lowest in the Southeast. In Alabama, just 15% of children aged 5-11 have received an initial dose of the vaccine, compared with 66% in Vermont, while Wyoming is the lowest (41%) for children aged 12-17 and Massachusetts is the highest (96%), the AAP said in a separate report.
One in four feel fully recovered following COVID-19 hospitalization
One year after hospitalization for COVID-19 only a minority of people feel fully recovered, with being female, obesity, and having had mechanical ventilation in hospital risk factors for not feeling fully recovered.
In the new U.K. study of more than 2,000 patients, presented at this year’s European Congress of Clinical Microbiology & Infectious Diseases (ECCMID 2022), and published in The Lancet Respiratory Medicine, research showed that one in four patients feel fully well again 1 year after hospitalization for COVID-19.
For their study, researchers from the University of Leicester used data from the post-hospitalization COVID-19 (PHOSP-COVID) prospective, longitudinal cohort study, which assessed adults aged 18 years and over who had been hospitalized with COVID-19 across the United Kingdom and subsequently discharged. The researchers assessed the recovery of 2,320 participants discharged from 39 U.K. hospitals between March 7, 2020, and April 18, 2021, who were assessed via patient-reported outcome measures, physical performance, and organ function at 5 months and at 1 year after hospital discharge. Blood samples were taken at the 5-month visit to be analyzed for the presence of various inflammatory proteins.
All participants were assessed at 5 months after discharge and 807 participants (33%) completed both the 5-month and 1-year visits at the time of the analysis. The study is ongoing. The 807 patients were mean age of 59 years, 36% were women, and 28% received invasive mechanical ventilation. The proportion of patients reporting full recovery was similar between 5 months (26%) and 1 year (29%).
Female sex and obesity major risk factors for not recovering
Being female, obese, and having had mechanical ventilation in hospital makes someone 32%, 50%, and 58%, respectively, less likely to feel fully recovered 1 year after COVID-19 hospitalization, the authors said.
“We found female sex and obesity were major risk factors for not recovering at one year,” said the researchers, led by Rachael Evans, PhD, Louise V. Wain, and Christopher E. Brightling, PhD, National Institute for Health Research, Leicester Biomedical Research Centre, University of Leicester.
The authors said fatigue, muscle pain, physically slowing down, poor sleep, and breathlessness were most common ongoing long COVID symptoms. They noted how the total number and range of ongoing symptoms at 1 year was “striking,” positively associated with the severity of long COVID, and emphasizes the “multisystem nature of long COVID.”
Several inflammatory mediators increased
An earlier publication from this study identified four groups or “clusters” of symptom severity at 5 months, which were confirmed by this new study at 1 year, the authors said. They reported that 20% had very severe physical and mental health impairment, 30% had severe physical and mental health impairment, 11% had moderate physical health impairment with cognitive impairment, and 39% had mild mental and physical health impairment.
They added that having obesity, reduced exercise capacity, a greater number of symptoms, and increased levels of C-reactive protein were associated with the “more severe clusters.” In both the very severe and the moderate with cognitive impairment clusters, levels of interleukin-6 (IL-6) were higher when compared with the mild cluster.
“The limited recovery from 5 months to 1 year after hospitalisation in our study across symptoms, mental health, exercise capacity, organ impairment, and quality-of-life is striking,” the researchers noted.
“In our clusters, female sex and obesity were also associated with more severe ongoing health impairments including reduced exercise performance and health-related quality of life at one year,” and suggested that this potentially highlighted a group that “might need higher intensity interventions such as supervised rehabilitation,” they added.
There are no specific therapeutics for long COVID, the researchers said, noting that “effective interventions are urgently required.” The persistent systemic inflammation identified, particularly in those in the very severe and moderate with cognitive impairment clusters, suggested that these groups “might respond to anti-inflammatory strategies,” the authors wrote.
“We found that a minority of participants felt fully recovered 1 year after hospital discharge, with minimal improvement after a 5-month assessment,” they noted.
They added that the findings suggest the need for complex interventions that target both physical and mental health impairments to alleviate symptoms, and that specific therapeutic approaches to manage posttraumatic stress disorder might also be needed. The authors pointed out how “pharmacological and non-pharmacological interventions are urgently needed,” with a “precision-medicine approach with potential treatable traits of systemic inflammation and obesity.”
They said their study highlighted the “urgent need for health-care services to support the large and rapidly increasing patient population in whom a substantial burden of symptoms exist, including reduced exercise capacity and substantially decreased health-related quality of life one year after hospital discharge.”
They warned that without effective treatments, long COVID could become a “highly prevalent new long-term condition.”
A version of this article first appeared on Medscape UK.
FROM THE LANCET RESPIRATORY MEDICINE
2020 presidential election tied to spike in cardiac events
The analysis of nearly 6.4 million adults showed that the rate of hospitalization for acute cardiovascular disease (CVD) was 17% higher in the 5 days after the election than in a 5-day period 2 weeks earlier.
The rate of acute myocardial infarction (AMI) was 42% higher, with no significant difference for heart failure or stroke hospital admissions.
“These findings suggest that awareness of the heightened risk of CVD and strategies to mitigate risk during notable political events are needed,” write Matthew T. Mefford, PhD, of Kaiser Permanente Southern California, Pasadena, and colleagues.
The study was published in the April issue of JAMA Network Open.
Stress and the heart
In the American Psychological Association Stress in America 2020 survey conducted roughly 3 months before the 2020 presidential election, 77% of adults cited the future of the country as a substantial source of stress, enhanced by the ongoing COVID-19 pandemic, the authors note. More than two-thirds said the election was a substantial source of stress.
Dr. Mefford and colleagues compared CVD hospitalizations at Kaiser Permanente Southern and Northern California hospitals in the 5-day risk window of Nov. 4-8, 2020, with the control window of Oct. 21-25, 2020.
There were 666 CVD hospitalizations (760.47 per 100,000 person-years [PY]) in the risk window, compared with 569 (647.97 per 100,000 PY) in the control window (rate ratio, 1.17; 95% confidence interval, 1.05-1.31).
There were also significantly more hospitalizations for AMI immediately after the election than before (179 vs. 126 AMI hospitalizations; 204.4 vs. 143.5 per 100,000 PY; RR, 1.42; 95% CI, 1.13-1.79).
There was no significant difference between the risk and control periods for hospitalizations because of stroke or heart failure.
The study also suggests higher rates of acute CVD after the election in older adults, men, and White individuals. Political affiliation was not examined in the study.
“Importantly, results were consistent before and after excluding patients with confirmed COVID-19 infection,” the study team notes.
Yet, the potential influence of COVID-19 stressors on increasing CVD risk cannot be ruled out, they say.
However, COVID-19 stressors occurred over a much longer period and are less likely to explain the transient risks observed in the defined risk and control windows that are in close proximity to the 2020 election, the investigators point out.
There is growing evidence that psychological health contributes to CVD.
Previous studies shown a higher risk for acute CVD around population-wide psychosocial or environmental stressors, but less was known about acute CVD risk in relation to political events.
The researchers note future studies evaluating stress-relieving interventions may be important for understanding the intersection of political events, associated stress, and acute CVD risk.
Partial funding for the study was provided by a grant from the W.K. Kellogg Foundation. The authors have no relevant conflicts of interest.
A version of this article first appeared on Medscape.com.
FROM JAMA NETWORK OPEN
More antibodies with longer intervals between COVID vaccine doses
An overall ninefold increase in COVID-19 antibody levels can be seen with a longer interval between first and second doses of the Pfizer/BioNTech (BNT162b2) vaccine in people without prior infection, according to data from the U.K. government’s SIREN (SARS-CoV-2 Immunity and Reinfection Evaluation) study.
This interval-dependent antibody level varied by age, with those aged 45-54 years showing an 11-fold increase with a longer dosing interval (greater than 10 weeks vs. 2-4 weeks). People younger than age 25 years showed a 13-fold increase with the longer interval, but participant numbers were low in this sub-group.
Overall antibody levels in infection-naive participants were 1,268.72 Binding Antibody Units (BAU)/mL (1,043.25-1,542.91) in those with a 2-4–week interval, compared with 11,479.73 BAU/mL (10,742.78-12,267.24) (P < .0001), in those with at least a 10-week interval between doses.
The work is the latest analysis from SIREN, which measured antibody levels in the blood from nearly 6,000 health care workers from across the United Kingdom. Study lead Ashley Otter, PhD, technical lead for SIREN serology at the UK Health Security Agency (UKHSA), will present the work on Tuesday at the 2022 European Congress of Clinical Microbiology & Infectious Diseases (ECCMID), Lisbon.
In an interview, Dr. Otter noted that, “it is important to remember that antibody levels are only one aspect of the immune response, and in our recent vaccine effectiveness analysis, we found that dosing intervals did not affect protection against infection.”
The study, which appeared in the March issue of the New England Journal of Medicine, also found that after the second dose of vaccine, there was about a 2.5–fold difference in antibody levels between those who had prior infection of 16.052 (14.071-18.312) BAU/mL, compared with 7.050 (6.634-7.491) BAU/mL in infection-naive individuals (P < .0001).
Following the first dose only, antibody levels were up to 10 times higher in participants who were previously infected, compared with infection-naive individuals. This effect lasted up to 8 months and then began to plateau.
Natural infection increased antibody levels
Dr. Otter remarked that, “COVID-19 antibody levels are high in those people who were previously naturally infected and vaccinated, highlighting that vaccination provides an additional benefit to these individuals.”
This news organization asked Charlotte Thålin, PhD, an immunologist from the Karolinska Institute, Stockholm, to comment on the study. Dr. Thålin studies a cohort similar to SIREN, called the Swedish COMMUNITY health care worker cohort. “The new data from the SIREN emphasizes the importance of the number of antigenic exposures and the time interval between them, whether it be exposure through vaccination or exposure through infection.”
“We see similar data in our Swedish COMMUNITY health care worker cohort,” Dr. Thålin continued, “where infection prior to vaccination yields a more than twofold enhancement in antibodies, neutralizing breadth, and T cell responses, and an even larger increase with a longer time interval between infection and vaccination.”
However, she cautioned that they now see a high rate of Omicron vaccine breakthrough infections, and this is also true in people with previous infection and three vaccine doses.
“As we approach a second booster – a fourth vaccine dose – we need to consider that many individuals will have had up to five to six antigen exposures within a short period of time, sometimes within a year,” she pointed out. “This is a whole new scenario, with a lot of different combinations of vaccine and infection-induced immunity. We do not yet know the impact of these frequent immune exposures, and we now need to monitor immune responses following Omicron and booster doses closely.”
SIREN originally aimed to understand how much protection people got after developing a primary infection and why they might become reinfected with COVID-19. Following the rollout of the United Kingdom’s vaccination program, the protective effects of vaccination against COVID-19 were investigated, as well as why some people still become ill after being vaccinated, Dr. Otter explained.
In this latest analysis, Dr. Otter and colleagues assessed anti-spike binding antibodies in serum samples from a total of 5,871 health care workers, with 3,989 after one dose (at least 21 days) and 1,882 after two doses (at least 14 days).
Most participants were women (82.3%), of White ethnicity (87%), and came from across the United Kingdom.
Participants were also categorized into those who had evidence of natural COVID-19 infection (confirmed by a PCR test or assumed because of their antibody profile) or those who were infection-naive. Almost all (> 99%) of those who were infection-naive seroconverted after vaccination.
The primary outcome was anti-spike antibody levels assessed according to dose, previous infection, dosing interval, age, ethnicity, and comorbidities, including immunosuppressive disease such as immune system cancers, rheumatologic disease, chronic respiratory diseases, diabetes, obesity, and chronic neurologic disease.
In the infection-naive group, the mean antibody (anti-S titer) was 75.48 BAU/mL after the first vaccine dose, and this rose to 7,049.76 BAU/mL after the second dose.
The much higher antibody titer with the second dose in infection-naive individuals “is what gives you the most protection, as your antibody titers are at their peak. They then start to gradually wane from this peak,” said Dr. Otter.
In the post-infection group, antibody titers also rose (2,111.08 BAU/mL after first dose and 16,052.39 BAU/mL after second dose), although less so than in the infection-naive group, because of the additional exposure of infection, added Dr. Otter.
Antibody levels also varied according to time elapsed between natural infection and dose 1 of vaccination. With a 3-month interval, antibody levels were 1,970.83 (1,506.01-2,579.1) BAU/mL, compared with 13,759.31 (8,097.78-23,379.09) BAU/mL after a 9-month interval. Antibody levels after one dose in those previously infected are higher than the infection-naive because “previous infection, then vaccination, is likely explained by T-cell expansion upon a boost with a second antigen exposure, and then a maturing memory B-cell response that has been demonstrated up to 6 months,” explained Dr. Otter.
Timing of fourth dose
By March of this year, 86.2% of the U.K. population aged over 12 years had received at least two doses, but with rises in disease prevalence and the spread of variants of concern, further work is ongoing to understand the waning of the immune response, level of protection, and why some individuals develop COVID-19 even when double-vaccinated.
This news organization asked Susanna Dunachie, BMChB, professor of infectious diseases, University of Oxford, U.K., what the interval findings might mean for the timing of the fourth dose of vaccine across the U.K. population.
In the United Kingdom, fourth doses are being given to people who are 75 years and older, residents in care homes for older people, and those with weakened immune systems. “To make decisions about fourth doses for healthy people, we need to see how quickly antibody and T-cell responses drop,” said Ms. Dunachie, who is part of the large SIREN study team but was not involved in the analysis led by Dr. Otter. “Current research suggests that the T-cell response may be better maintained than the antibody response, and less affected by variants like Omicron.”
She explained the balance between antibody and T-cell responses to vaccination. “It is likely that antibodies that neutralize the virus are important for preventing any infection at all, and these unfortunately do fall in time, but T-cell responses are better sustained and help keep people out of [the] hospital,” she said.
Ms. Dunachie added that it was necessary to wait and observe what happens next with SARS-CoV-2 evolution, as well as wait for longer follow-up after the third dose in healthy people. “On current evidence, my estimate is we postpone decisions on fourth doses in healthy people to late summer/autumn.”
A version of this article first appeared on Medscape.com.
Substance use disorders increase risk for death from COVID-19
MADRID, Spain – – compared with the general population. Such are the findings of a line of research led by Mexican psychiatrist Nora Volkow, MD, director of the U.S. National Institute on Drug Abuse (NIDA).
A pioneer in the use of brain imaging to investigate how substance use affects brain functions and one of Time magazine’s “Top 100 People Who Shape Our World,” she led the Inaugural Conference at the XXXI Congress of the Spanish Society of Clinical Pharmacology “Drugs and Actions During the Pandemic.” Dr. Volkow spoke about the effects that the current health crisis has had on drug use and the social challenges that arose from lockdowns. She also presented and discussed the results of studies being conducted at NIDA that “are aimed at reviewing what we’ve learned and what the consequences of COVID-19 have been with respect to substance abuse disorder.”
As Dr. Volkow pointed out, drugs affect much more than just the brain. “In particular, the heart, the lungs, the immune system – all of these are significantly harmed by substances like tobacco, alcohol, cocaine, and methamphetamine. This is why, since the beginning of the pandemic, we’ve been worried about seeing what consequences SARS-CoV-2 was going to have on users of these substances, especially in light of the great toll this disease takes on the respiratory system and the vascular system.”
Pulmonary ‘predisposition’ and race
Dr. Volkow and her team launched several studies to get a more thorough understanding of the link between substance abuse disorders and poor COVID-19 prognoses. One of them was based on analyses from electronic health records in the United States. The purpose was to determine COVID-19 risk and outcomes in patients based on the type of use disorder (for example, alcohol, opioid, cannabis, cocaine).
“The results showed that regardless of the drug type, all users of these substances had both a higher risk of being infected by COVID-19 and a higher death rate in comparison with the rest of the population,” said Dr. Volkow. “This surprised us, because there’s no evidence that drugs themselves make the virus more infectious. However, what the results did clearly indicate to us was that using these substances was associated with behavior that put these individuals at a greater risk for infection,” Dr. Volkow explained.
“In addition,” she continued, “using, for example, tobacco or cannabis causes inflammation in the lungs. It seems that, as a result, they end up being more vulnerable to infection by COVID. And this has consequences, above all, in terms of mortality.”
Another finding was that, among patients with substance use disorders, race had the largest effect on COVID risk. “From the very start, we saw that, compared with White individuals, Black individuals showed a much higher risk of not only getting COVID, but also dying from it,” said Dr. Volkow. “Therefore, on the one hand, our data show that drug users are more vulnerable to COVID-19 and, on the other hand, they reflect that within this group, Black individuals are even more vulnerable.”
In her presentation, Dr. Volkow drew particular attention to the impact that social surroundings have on these patients and the decisive role they played in terms of vulnerability. “It’s a very complex issue, what with the various factors at play: family, social environment. ... A person living in an at-risk situation can more easily get drugs or even prescription medication, which can also be abused.”
The psychiatrist stressed that when it comes to addictive disorders (and related questions such as prevention, treatment, and social reintegration), one of the most crucial factors has to do with the individual’s social support structures. “The studies also brought to light the role that social interaction has as an inhibitory factor with regard to drug use,” said Dr. Volkow. “And indeed, adequate adherence to treatment requires that the necessary support systems be maintained.”
In the context of the pandemic, this social aspect was also key, especially concerning the high death rate among substance use disorder patients with COVID-19. “There are very significant social determinants, such as the stigma associated with these groups – a stigma that makes these individuals more likely to hesitate to seek out treatment for diseases that may be starting to take hold, in this case COVID-19.”
On that note, Dr. Volkow emphasized the importance of treating drug addicts as though they had a chronic disease in need of treatment. “In fact, the prevalence of pathologies such as hypertension, diabetes, cancer, and dementia is much higher in these individuals than in the general population,” she said. “However, this isn’t widely known. The data reflect that not only the prevalence of these diseases, but also the severity of the symptoms, is higher, and this has a lot to do with these individuals’ reticence when it comes to reaching out for medical care. Added to that are the effects of their economic situation and other factors, such as stress (which can trigger a relapse), lack of ready access to medications, and limited access to community support or other sources of social connection.”
Opioids and COVID-19
As for drug use during the pandemic, Dr. Volkow provided context by mentioning that in the United States, the experts and authorities have spent two decades fighting the epidemic of opioid-related drug overdoses, which has caused many deaths. “And on top of this epidemic – one that we still haven’t been able to get control of – there’s the situation brought about by COVID-19. So, we had to see the consequences of a pandemic crossing paths with an epidemic.”
The United States’s epidemic of overdose deaths started with the use of opioid painkillers, medications which are overprescribed. Another issue that the United States faces is that many drugs are contaminated with fentanyl. This contamination has caused an increase in deaths.
“In the United States, fentanyl is everywhere,” said Dr. Volkow. “And what’s more concerning: almost a third of this fentanyl comes in pills that are sold as benzodiazepines. With this comes a high risk for overdose. In line with this, we saw overdose deaths among adolescents nearly double in 1 year, an increase which is likely related to these contaminated pills. It’s a risk that’s just below the surface. We’ve got to be vigilant, because this phenomenon is expected to eventually spread to Europe. After all, these pills are very cheap, hence the rapid increase in their use.”
To provide figures on drug use and overdose deaths since the beginning of the pandemic, Dr. Volkow referred to COVID-19 data provided by the National Center for Health Statistics (NCHS) at the U.S. Centers for Disease Control and Prevention. The data indicate that of the 70,630 drug overdose deaths that occurred in 2019, 49,860 involved opioids (whether prescribed or illicit). “And these numbers have continued to rise, so much so that the current situation can be classified as catastrophic – because this increase has been even greater during the pandemic due to the rise in the use of all drugs,” said Dr. Volkow.
Dr. Volkow referred to an NCHS study that looked at the period between September 2020 and September 2021, finding a 15.9% increase in the number of drug overdose deaths. A breakdown of these data shows that the highest percentage corresponds to deaths from “other psychostimulants,” primarily methamphetamines (35.7%). This category is followed by deaths involving synthetic opioids, mostly illicit fentanyl (25.8%), and deaths from cocaine (13.4%).
“These figures indicate that, for the first time in history, the United States had over 100,000 overdose deaths in 1 year,” said Dr. Volkow. “This is something that has never happened. We can only infer that the pandemic had a hand in making the overdose crisis even worse than it already was.”
As Dr. Volkow explained, policies related to handling overdoses and prescribing medications have been changed in the context of COVID-19. Addiction treatment consequently has been provided through a larger number of telehealth services, and measures such as greater access to treatment for comorbid conditions, expanded access to behavioral treatments, and the establishment of mental health hotlines have been undertaken.
Children’s cognitive development
Dr. Volkow also spoke about another of NIDA’s current subjects of research: The role that damage or compromise from drugs has on the neural circuits involved in reinforcement systems. “It’s important that we make people aware of the significance of what’s at play there, because the greatest damage that can be inflicted on the brain comes from using any type of drug during adolescence. In these cases, the likelihood of having an addictive disorder as an adult significantly increases.”
Within this framework, her team has also investigated the impact of the pandemic on the cognitive development of infants under 1 year of age. One of these studies was a pilot program in which pregnant women participated. “We found that children born during the pandemic had lower cognitive development: n = 112 versus n = 554 of those born before January 2019.”
“None of the mothers or children in the study had been infected with SARS-CoV-2,” Dr. Volkow explained. “But the results clearly reflect the negative effect of the circumstances brought about by the pandemic, especially the high level of stress, the isolation, and the lack of stimuli. Another study, currently in preprint, is based on imaging. It analyzed the impact on myelination in children not exposed to COVID-19 but born during the pandemic, compared with pre-pandemic infants. The data showed significantly reduced areas of myelin development (P < .05) in those born after 2019. And the researchers didn’t find significant differences in gestation duration or birth weight.”
The longitudinal characteristics of these studies will let us see whether a change in these individuals’ social circumstances over time also brings to light cognitive changes, even the recovery of lost or underdeveloped cognitive processes, Dr. Volkow concluded.
Dr. Volkow has disclosed no relevant financial relationships.
A version of this article first appeared on Medscape.com.
FROM ANNUAL MEETING OF SPANISH SOCIETY OF CLINICAL PHARMACOLOGY
COVID-19 again the third-leading cause of U.S. deaths
the Centers for Disease Control and Prevention said April 22.
About 693,000 people died of heart disease in 2021, with 605,000 dying of cancer and 415,000 of COVID, the CDC said, citing provisional data that might be updated later.
Unintentional injuries were the fourth-leading cause of death, increasing to 219,000 in 2021 from 201,000 in 2020. Influenza and pneumonia dropped out of the top 10 leading causes of death and suicide moved into 10th place.
Overall, about 3,458,697 deaths were reported in the United States in 2021. The age-adjusted death rate was 841.6 deaths per 100,000 people, an increase of 0.7% from 2020. The 2021 death rate was the highest since 2003, the CDC said.
The overall number of COVID deaths in 2021 increased around 20% over 2020, when around 384,000 people died from the virus, the CDC said. COVID deaths in 2021 peaked for the weeks ending Jan. 16 and Sept. 11, following holiday periods.
The demographics of COVID mortality changed slightly, the CDC said in a second report.
Blacks accounted for 13.3% of COVID deaths in 2021 and Hispanics 16.5%, down several percentage points from 2020, the CDC said. Asians made up 3.1% of COVID deaths for 2021, a drop from 3.6% in 2020. White people accounted for 65.2% of COVID deaths in 2021, an increase from 59.6% in 2020.
Non-Hispanic American Indian/Alaskan Native and non-Hispanic Black or African American had the highest overall death rates for COVID, the CDC said.
Breaking the data down by age, the number of COVID deaths among people aged 75 years and older dropped to 178,000 in 2021 from around 207,000 in 2020. The numbers went up in other age groups. Among people aged 65-75, about 101,000 died of COVID in 2021, up from around 76,000 in 2020.
“The results of both studies highlight the need for greater effort to implement effective interventions,” the CDC said in a statement. “We must work to ensure equal treatment in all communities in proportion to their need for effective interventions that can prevent excess COVID-19 deaths.”
Since the pandemic began, about 991,000 people in the United States have died from COVID-related causes, the most among all nations in the world.
A version of this article first appeared on WebMD.com.
FROM THE MMWR