User login
Adaptive therapy borrows from nature to keep rhabdomyosarcoma in check
In 1859, Charles Darwin published “On the Origin of Species,” which outlined his world-shaking theory of evolution and its core principle of natural selection caused by environmental pressures that may determine whether an organism adapts and survives, or remains static, languishes, and eventually dies out.
The same forces that have influenced the size and shape of the beaks of finches in the Galapagos Islands, the length of giraffe necks in Africa, and the intestinal microbiomes of the nearly 8 billion human inhabitants of this planet also control whether malignant cells thrive and multiply, wither and die when assaulted by chemotherapy, or go into hiding, mutating and waiting for their next opportunity to erupt again and metastasize.
The ability of malignant cells to adapt to environmental pressures is “cancer’s most lethal and sophisticated property,” said Damon R. Reed, MD, program leader of the adolescent/young adult program at Moffitt Cancer Center in Tampa, Fla.
Dr. Reed and colleagues are developing methods to meet cancer on its own terms, applying evolutionary principles to the treatment of childhood fusion-positive rhabdomyosarcoma in an innovative, and some would say audacious, clinical trial.
Adaptive versus conventional therapy
The trial, now recruiting, is designed to evaluate each of four different strategies for chemotherapy schedules in patients with newly diagnosed metastatic fusion-positive rhabdomyosarcoma.
The trial contains four arms, three of which consist of either conventional chemotherapy based on published clinical trials, moving a second-line therapy to the first line, or adding maintenance therapy, all of which have the goal of inducing as many complete remissions as possible.
The remaining adaptive therapy arm, however, is entirely novel in approach, with therapy using a combination of chemotherapy drugs that will be started and interrupted based on tumor responses, with resumption of therapy on an adaptive schedule unique to each patient. The goal of treatment for patients enrolled in this arm will be prolongation of the time to disease progression, rather than complete remission.
Although some people might consider the adaptive therapy approach to be sacrificing the hope for a cure in exchange for palliation, the hard truth is that patients with fusion-positive rhabdomyosarcoma (in contrast to those with fusion-negative disease) have a dismal prognosis following relapse after up-front intensified therapy.
Instead, because a cure is exceedingly unlikely in patients with metastatic disease, the conventional idea of delivering the maximum tolerated dose of chemotherapy until disease progression could be replaced by an approach based on understanding of the evolution of cancer cells under selective pressures, Dr. Reed and colleagues contend.
“Although adaptive therapy would represent a major paradigm shift in pediatric oncology, this approach would exploit the chemotherapy-sensitive population to prevent the emergence of resistant populations, optimizing tumor control with less toxicity,” they wrote in a commentary published online in the journal Cancer.1
Poor survival with advanced disease
Childhood rhabdomyosarcoma (RMS) is a form of soft tissue sarcoma of mesenchymal origin. Approximately 25% of cases are parameningeal, arising from sites adjacent to the meninges of the nasopharynx, middle ear, paranasal sinuses, orbit, and other regions of the head and neck. Approximately 31% of cases arise in the genitourinary tract and 13% in the extremities, and other tumors occur less commonly in the trunk, chest wall, perineal/anal region, and abdomen.
The overall 5-year survival rate is approximately 71%.1
However, for patients with high-risk disease, a group that includes children 10 years of age or older with widespread disease with or without an activating PAX/FOX01 gene fusion, 5-year survival ranges from just 20% to 30% (Cancer Facts & Figures 2020).
“Among patients with metastatic disease, there is a clear difference in overall survival between those who have fusion-positive disease, where the 5-year overall survival is about 19%, and patients with fusion-negative disease,” said Douglas S. Hawkins, MD, chair of the children’s oncology group and professor of pediatrics at the University of Washington, Seattle, and associate chief in the division of hematology/oncology at Seattle Children’s Hospital.
Patients with fusion-negative disease can be further classified into those with multiple metastatic sites, with a 5-year overall survival rate of approximately 45%, and those with a single metastatic site, with a 5-year overall survival rate of 70%, he said in an interview.
“So when we talk about metastatic rhabdomyosarcoma, there actually is a diversity of outcomes, between really bad – those with fusion-positive disease – and not terrible – not great, but not terrible – for a selected group of patients with fusion-negative disease,” Dr. Hawkins said.
The poor prognosis for patients with metastatic fusion-positive disease prompted Dr. Reed and colleagues to rethink the entire approach to advanced cancers.
“If someone has a sarcoma, we know that we need to do surgery and radiation to the area, we know that localized disease does better than metastatic disease, and we generally hit it with some kind of chemotherapy that we call ‘standard of care,’ ” he said in an interview.
This approach is largely effective in some forms of cancer of bone and soft tissues, such as Ewing sarcoma, he notes, which has 5-year survival rates below 20% when treated with surgery and radiation only, but with the addition of chemotherapy has 5-year overall survival rates as high as 80%.
“At other times, with other sarcomas, the cure rate is abysmal, but we still call it standard of care,” Dr. Reed said.
For example, patients with metastatic fusion-positive RMS may have an initial response to chemotherapy, but most will eventually experience relapse and die of the disease.
“With some of the most common treatments, 70% of patients will have their cancers shrink by more than 50%, which is a major response, but the vast majority of them will have a recurrence later on,” Dr. Hawkins said.
He noted that the standard of care for patients with metastatic rhabdomyosarcoma, both with and without the PAX/FOX01 fusion, is chemotherapy, generally with the VAC regimen (vincristine, actinomycin D, and cyclophosphamide), although other agents such as doxorubicin, ifosfamide, etoposide, or irinotecan have also been tried, with little effect on event-free survival or overall survival rates.
A life too brief
Ricky Huff and his family know the course that the disease can take only too well. In 2015, his 5-month-old son, Theo, was diagnosed with metastatic rhabdomyosarcoma and put under the care of Damon Reed at Moffitt.
“During the whole course of treatment – I’m sure like many other parents – apart from relying on Damon and his treatment expertise to try to determine the best treatment options, I was reading everything under the sun to try to get a working knowledge of what Theo was up against, what his treatment and clinical trial options were, and what was the state of the science,” Mr. Huff says.
Unfortunately, the characteristics of Theo’s disease, including his very young age at onset and diagnosis of stage 4 metastatic disease, conspired against him, and despite undergoing 14 months of chemotherapy, Theo died of the disease in October 2016, 5 months shy of what would have been his second birthday.
In their grief, Mr. Huff, a real estate lawyer with a practice in Clearwater, Fla., and his wife, Leah, were determined to help other families of children with cancer and settled on the National Pediatric Cancer Foundation. Mr. Huff joined the board of directors of the foundation, which is collaborating with Moffitt Cancer Center on the adaptive therapy trial.
An evolutionary primer (cancer edition)
To get a better idea of just how adaptive therapy works, it is helpful to view cancer cells through the lens of species development, adaptation, extinction, and evolution.
“Cancer cells compete against each other in a dynamic environment. Their tumor ecosystems exhibit spatial and temporal fluctuations in blood-borne nutrients, oxygen, growth factors, immune cells, and hormones,” Dr. Reed and colleagues wrote.
These influences can affect genetically identical cancer cells, which may begin to diverge from one another depending on their location in a tumor and the availability of nutrients, which in turn can result in two once-identical cells exhibiting different transcription rates for growth factors.
“Ultimately, this may affect the rate of progression through the cell cycle, leading to distinct rates of proliferation and mutational acquisition,” they wrote.
The diverging subpopulations will begin to develop different methods for adapting to the tumor microenvironment, with unique strategies for both accelerating growth and avoiding hazards such as chemotherapy drugs or radiation, the investigators explained.
“By the time a cancer becomes clinically apparent, cancer cells have transformed from a single clone into a diverse community of cell types evolving in response to a spatially and temporally heterogeneous tumor environment. Theoretically, a 10-gram cancer may contain the same order of magnitude of cancer cells as there are humans on earth, with tremendous diversity of phenotypes and environments,” they wrote.
Survival of the fittest
The competition of individuals within and between species described by Darwin also applies to cancer cells, in their interactions both with each other and with stromal cells and immune cells resulting in “the progressive replacement of less fit phenotypes by those that are more fit,” Dr. Reed and colleagues explained.
And just like the old joke about two hikers trying to escape from a charging grizzly bear (one says, “This is futile – we can’t outrun a grizzly,” and the other says, “I only have to outrun you!”), cancer cells only need to be more resistant to therapeutic attack than normal cells that are critical to function.
“This may explain why initial responses in certain solid tumors (notably rhabdomyosarcoma) do not predict eventual survival. The sensitivities of the dominant cancer cell populations dictate the initial response, but it is the ecology and evolution of the rare and more resistant populations that determine cure or relapse,” they wrote.
The endangered species list
As with many types of cancer, the current approach to treating pediatric sarcomas with curative intent is with a “first strike” approach, treating patients with surgery, radiation, and cytotoxic chemotherapy at the maximum tolerated dose for as long as needed or until unacceptable toxicities occur, with the intention of wiping out all cancer cells without permanently injuring normal cells.
The evolutionary analogy to this approach is a mass extinction event such as the meteor strike that is believed to have wiped out the dinosaurs roughly 66 million years ago. Fossil evidence suggests that the cataclysmic event resulted in the atmosphere being blanketed with dust particles that blocked sunlight and caused massive die-off of plants that dinosaurs needed to survive and were ill-adapted to do without.
In contrast, populations of smaller, more adaptable species of microbes, insects, and animals, including our mammalian ancestors, were able to survive and eventually flourish.
Many patients with localized cancers may be cured with up-front therapy, but others will have residual disease from populations of cells that are intrinsically resistant to therapy or have developed new evasion strategies.
Strike two and the MVP
Dr. Reed and colleagues liken the approach of second-line therapy for treatment of relapsed or refractory disease to the concept of “background extinctions,” using the fate of the passenger pigeon as an example of how a second-strike therapeutic strategy works.
Although the popular conception is that the passenger pigeon was hunted to extinction by humans, the species in fact died out because of many different factors, including loss of habitat, isolation of populations leading to a loss of genetic diversity, and disruption of breeding habits.
“Once first strikes of deforestation and hunting reduced the birds to small, fragmented populations, a series of what would otherwise have been minor second strikes pushed the passenger pigeon below its extinction threshold, or minimum viable population,” they said.
The analogy, as it applies to cancer therapy, is the use of second-line or follow-on therapy with one or more agents that the residual cells are at least in theory not resistant to. In the case of fusion-positive rhabdomyosarcoma, the drug most commonly added in the second-strike approach is vinorelbine.2
“Second strikes should be timed to occur around the time when the first strike has achieved its greatest effect, presumably at the point when the disease becomes clinically undetectable or at a measurable nadir,” Dr. Reed and colleagues wrote. “Ideally, second-strike therapies should have modes of action that require different resistance strategies by the cancer cells than those needed for resistance to the first strike.”
Adaptive therapy
As Dr. Reed and colleagues note, despite optimal therapy, 94% of patients with metastatic fusion-positive rhabdomyosarcoma will experience a relapse within 3 years of diagnosis.1 Clearly the scorched earth or “throw everything you have it” approach no longer works, and that’s where adaptive therapy comes in.
Here again, the authors rely on nature, or rather human interaction with nature, to devise a strategy for keeping the disease at bay when extinction of all cancerous cells cannot be achieved.
They cite the example of agricultural integrated pest management, which seeks to keep harmful insects in check by treating them to suppress but not completely destroy a population, then stopping the use of pesticides, and resuming only when the insect population spikes and again becomes a threat to crops.
“The goal is to limit crop damage while retaining the sensitivity of the insects to the pesticides. Resistance most often comes at a cost. In the absence of the pesticide, sensitive individuals will outcompete resistant individuals,” they wrote.
Adaptive therapy uses the same approach to reduce selection pressures that foster resistance, with patients treated only until a specific, predetermined response is achieved in the dominant population of chemosensitive cells. The treatment is then interrupted and reintroduced only when the tumor rebounds to a certain predetermined size.
In this scenario, cells that retain sensitivity to chemotherapy will be able to reproduce and proliferate more rapidly than drug-resistant cells, and the therapy can then be reintroduced. This strategy is less likely to cause the development and proliferation of resistant cells than conventional intensified chemotherapy, Dr. Reed and colleagues contend.
Putting it to the test
The clinical trial that Dr. Reed and colleagues have initiated, officially titled “Evolutionary Inspired Therapy for Newly Diagnosed, Metastatic, Fusion Positive Rhabdomyosarcoma,” (NCT04388839) contains four arms: three experimental and one active comparator arm.
“We won’t randomize; we don’t feel that it would be fair to randomize patients, because these arms are so different from each other,” Dr. Reed said.
Arm A is the experimental first-strike arm, a 42-week course containing cyclophosphamide delivered intravenously over 60 minutes at a dose ranging from 220 mg to 1200 mg, vinorelbine delivered in an IV push over 6-10 minutes with a dose ranging from 4 mg to 25 mg, and actinomycin D administered via IV over 3-5 minutes at a dose ranging from 0.025 mg to 0.04 mg.
“The idea is that we take the standard of care, and we add a drug – vinorelbine – to make it stronger,” Dr. Reed said. “The idea is that the resistant cell, the cell that escapes, if we start hitting it on day 1 with vinorelbine, we might be able to drive it to extinction.”
Arm B, the second experimental arm, is the second-strike and maintenance arm, in which patients will receive conventional doses of vincristine, actinomycin D, and cyclophosphamide (VAC) until complete response (CR) for 12-42 weeks, and will then be switched to up to 2 years of maintenance with vinorelbine and oral cyclophosphamide.
“Vinorelbine will be added when the cancer is declining or first goes into remission. We try not to wait 42 weeks, which is too long we think, by which time the cancer may be fully adapted and resistant,” he explained.
Arm C is the adaptive therapy arm, in which patients will receive VAC that starts and stops based on response, with the goal of prolonging time to disease progression rather than achieving CR.
Arm D is the active comparator arm, consisting of conventional chemotherapy based on published clinical trials, such as VAC for 42 weeks, or other standard-of-care regimens that may include irinotecan, doxorubicin, ifosfamide, and/or etoposide.
A change in thinking
Dr. Reed acknowledges that Arm C, the adaptive therapy arm, “definitely represents a change in thinking for pediatric oncology.”
“The idea is that if you could do this perfectly well, you would be able to take a patient who is diagnosed today and essentially ‘pause’ their disease for a while. Then 5 years from now, if there is a better medicine, you would have gotten that patient to that medicine.”
The optimal approach to treating metastatic fusion-positive rhabdomyosarcoma may be similar to that used for treatment of acute lymphoblastic leukemia, with induction, consolidation, and maintenance and the option of delayed intensification, he said.
“But we’re so far away from knowing which series to do that we just need to show that any series – any changing it up – is helpful.”
Dr. Reed said that when he started presenting the concept of adaptive therapy in clinical meetings in 2017, “I was told to come up with a better idea. There were several people who instantly got it, but most people would instantly get angry.”
The common refrain was that adaptive therapy was “giving up.”
But minds began to change in 2018, following presentation at the annual meeting of the American Society of Clinical Oncology of a European study showing that adding 6 months of low-dose chemotherapy maintenance to standard therapy improved the 5-year overall survival rate of pediatric rhabdomyosarcoma from 73.7% to 86.6%.2
Before presenting the idea of adaptive therapy to his colleagues, he ran it by the parents of children with advanced sarcomas, and many were on board with it, he said.
Ricky Huff said that had the option of adaptive therapy been available for Theo, he and his wife would have been willing to try it.
“Of course, everyone has the ability in hindsight to apply critical thinking to decisions that you made or could have made,” he said. “I think is true for many parents, who if they’re presented with information about options will say ‘well if there’s a 1 percent chance, I want that chance for my child, especially for a 5-month-old.”
The decision to choose adaptive therapy is a difficult decision to make, whether for oneself or for one’s son, because it isn’t curative.
“My wife and I have since had a conversation about this, and I do think we would have considered it, although through a lot of difficult conversations,” he said.
“After we got the pathology, knowing that it was metastatic, fusion-positive, and given his age, just doing a brief literature review on my own, I knew what we were up against using 20-year-old treatments, and that the chance of a cure was very, very small.”
If parents of children with metastatic, poor-prognosis rhabdomyosarcoma could be made to understand that adaptive therapy would entail shorter and fewer hospital stays, and cumulatively less toxic chemotherapy, and could prolong the lives of their children, the option might be more acceptable, he said.
And as Dr. Reed mentioned, prolonging time to progression offers hope of additional therapies to come.
“The whole time that my son was being treated, I hoped that there was going to be something else that came out, that a new trial would be launched because they found a way to drug a mutation, or treat it with immunotherapy – something that was going to give us a better option.”
Asked whether he would be willing to share his experiences in this article, Mr. Huff said that “I am willing to, in whatever small way I can, make an impact, and hopefully save another family from what we experienced.”
References
1. Reed DR et al. Cancer. 2020 Jun 1;126(11):2577-87 2. Bisogno G et al. J Clin Oncol. 2018;36:18_suppl,LBA-2
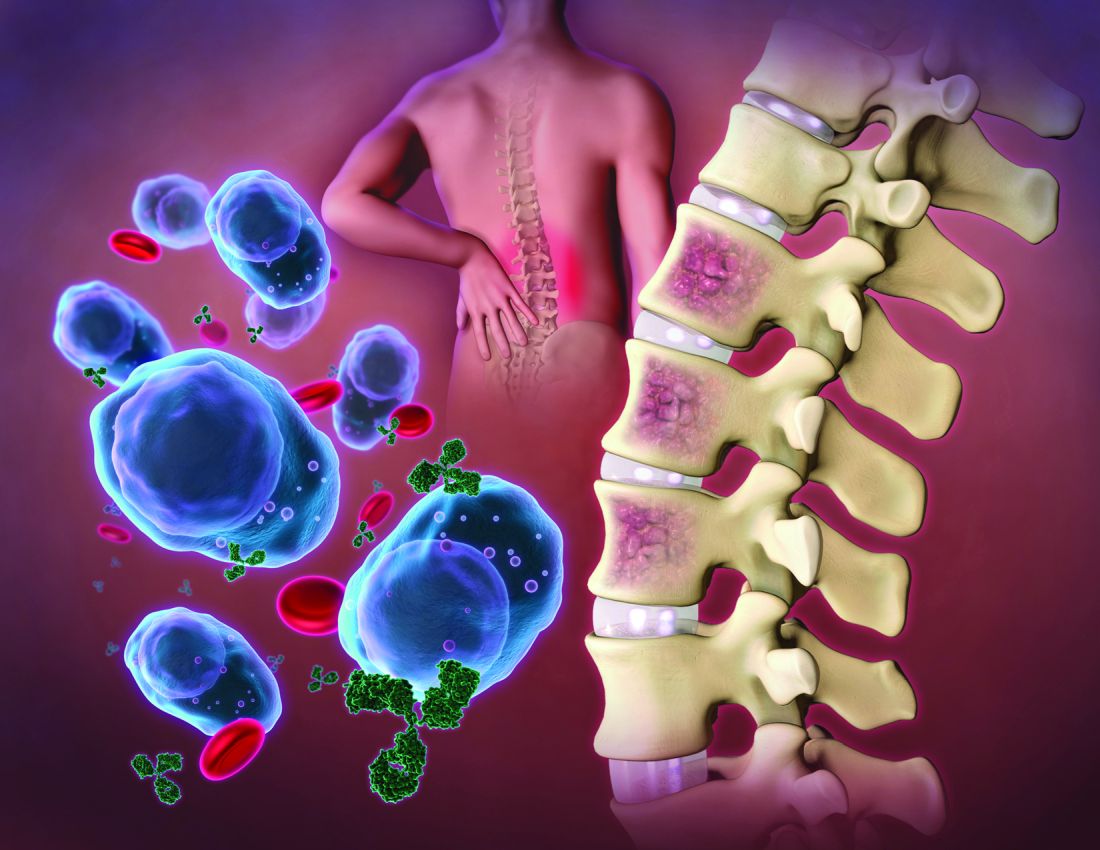
Meeting the unmet need in multiple myeloma
In multiple myeloma, survival has been very significantly improved by immunomodulatory drugs, proteasome inhibitors, and CD38-targeting antibodies. Despite these advances, multiple myeloma, which is characterized by malignant proliferation of clonal plasma cells in bone marrow, remains an incurable plasma cell disorder with near-certain relapse after successful treatment. Prognosis for patients who develop triple-class refractory disease is poor, with less than 1-year survival. The substantial unmet therapeutic need extends further to other poor survival multiple myeloma populations that include newly diagnosed patients with high cytogenic risk profiles and those with early relapse after first-line therapy. For all of these, interest in drugs with novel mechanisms of action is naturally high.
More specific, less toxic
Post allogeneic hematopoietic stem-cell transplantation and donor lymphocyte infusion sustained remissions reflect a graft-versus-myeloma effect mediated by donor T cells.1 The substantial morbidity and mortality associated with graft-versus-host disease and opportunistic infections, however, have spurred searches for alternative, more specific, and less toxic T-cell therapies with stronger antitumor activity.
Chimeric antigen receptors (CARs)
In CAR T-cell therapies for multiple myeloma, autologous T cells are harvested from the patient and reprogrammed to target multiple myeloma cells through the introduction of genes that encode CARs, which are fusion proteins coupling an antigen-recognition moiety and a transmembrane-spanning element to a T-cell activation domain (typically CD3 zeta [CD247]). The T cells are then expanded and reinfused to the patient following a lymphodepletion regimen. Five strategies using autologous CAR T cells are currently approved for diffuse large B-cell lymphomas, acute lymphoblastic leukemia, multiple myeloma, and other hematologic malignancies. Notably, in patients with heavily pretreated multiple myeloma, CAR T cells have demonstrated impressive activity.
BCMA-targeting CAR T cells
The B-cell maturation antigen (BCMA; TNFRSF17), which plays an important role in the survival of long-lived plasma cells in bone marrow, is an attractive target for CAR T-cell therapy because it is expressed on normal and malignant plasma cell surfaces and by mature B cells. When ligands (TNFSF 13B/TNFSF13) bind to BCMA expressed on multiple myeloma cell surfaces, survival and proliferation pathways and drug resistance are activated.
High-quality responses have been demonstrated in several trials of anti-BCMA CAR T cells, which kill multiple myeloma cell lines and primary multiple myeloma cells through degranulation of T cells and lysis of tumor cells, even those with low BCMA expression. Based on efficacy in triple-class exposed multiple myeloma that compared favorably to conventional care with improved health-related quality of life, the U.S. Food and Drug Administration gave breakthrough designation to ciltacabtagene autoleucel in December 2019 and approval for idecabtagene vicleucel in March 2021.
Idecabtagene vicleucel
Idecabtagene vicleucel expresses a murine BCMA-targeting single-chain variable fragment with a 4-1BB costimulatory motif. The phase 2 KarMMa study2 evaluated idecabtagene vicleucel (target dose of 450 × 106 CAR T cells; range 150 × 106 to 450 × 106) activity in 128 patients with triple-class exposed multiple myeloma. Partial responses or better were observed in 94 of 128 patients (73%) (95% confidence interval, 66-81); 42 (33%) had a complete response or better (95% CI, 25-41), with a median progression-free survival of 8.8 months (95% CI, 5.6-11.6). Outcomes were improved in the highest fixed-dose group, with partial response or better in 81% (44 of 55), complete response or better in 39% (21), and median overall survival of 12.1 months (95% CI, 8.8-12.3). Patients with high-risk cytogenetic profiles, extramedullary disease, and high tumor burden also had deep and durable responses. Outcomes were less favorable in patients with revised International Staging System stage 3 disease.
Ciltacabtagene autoleucel
Ciltacabtagene autoleucel, a 4-1BB–based CAR T-cell therapy with two BCMA-targeting domains, confers high-avidity binding. In the phase 1b/2 CARTITUDE-1 study, conducted in the United States and Europe, preliminary results in 97 patients showed a 97% response rate with ciltacabtagene autoleucel (target dose 0.75 × 10⁶ CAR T cells per kg), and in 65 patients, a complete response (67%). Progression-free survival at 12 months was 77% (95% CI, 66-84) and overall survival was 89% (95% CI, 80-94).3
In the phase 1 LEGEND-2 study4 that was conducted at four sites in China among less heavily pretreated multiple myeloma patients, while all used the same CAR construct, sites used variable conditioning regimens (split versus single). In the site using cyclophosphamide as the lymphodepletion therapy and three split CAR T-cell infusions, partial response or better was achieved in 50 patients (88%) with a median of three prior therapy lines. The complete response rate was high (74%) and minimal residual disease negativity was reached in 39 patients (68%). Median progression-free survival was 19.9 months (95% CI, 9.6-31.0), but 28.2 months among those with complete responses (95% CI, 19.9-not estimable). Median overall survival was also favorable at 36.1 months (95% CI, 26.4-not estimable); it was 35.0 months-not estimable among patients with complete responses. Results from the other three sites were comparable.
Noteworthy among other BCMA-targeting CAR T-cell products in earlier stages of clinical development is orvacabtagene autoleucel, which has a fully human BCMA-specific binding domain. At higher doses (300 × 106 to 600 × 106 CAR T cells) among 62 patients with triple-class–exposed multiple myeloma in the EVOLVE trial, 92% had a partial or better response, with complete responses or better in 36%, all with an encouraging safety profile.
BCMA-targeting CAR T cell toxicity
While van de Donk, Usmani, and Yong, in their review1 note a lack of evidence of off-target toxicity with BCMA-targeting CAR T-cell therapy in clinical studies so far, they do point to several clinical syndromes (cytokine release syndrome, infections, respiratory failure, neurotoxicity, pulmonary aspergillosis, gastrointestinal hemorrhage) caused by cytokines produced during CAR T-cell expansion and to cytopenias and infections arising from prior treatment, bridging therapy, and lymphodepleting conditioning. Deaths attributed to treatment in the above-mentioned trials underscore the need for careful monitoring and early intervention.
Cytokine release syndrome
In the BCMA-targeting CAR T-cell therapy studies, the frequency of cytokine release syndrome varies widely from 17% to 95% but is generally attributed to CAR T-cell activation and is associated with increased serum ferritin concentrations, high c-reactive proteins, and proinflammatory cytokines. High tumor load, in multiple myeloma patients receiving CD19-targeting CAR T cells, was associated with a higher incidence of severe cytokine release syndrome. In a small number of patients, macrophage activation syndrome and hemophagocytic lymphohistiocytosis, the most aggressive variants of cytokine release syndrome, are caused by severe immune activation and lead to multiorgan dysfunction.
Neurotoxicity
Immune effector cell–-associated neurotoxicity syndrome (ICANS) symptoms, in multiple myeloma patients treated with BCMA-targeting CAR T cells, may include delirium, transient confusion, aphasia, lethargy, tremor, dysgraphia, seizures, cerebral edema, and rarely, posterior reversible encephalopathy syndrome.1 While the pathophysiology of CAR T cell–related neurotoxicity is not well understood, high tumor load, higher peak concentrations of CAR T cells, and more severe cytokine release syndrome are more common in patients with severe neurotoxicity. “The frequency of neurotoxicities,” Dr. Yong noted in an interview, “has been reduced by steps taken to mitigate these risk factors.”
High interest in phase I study
A phase I study presented in Blood has attracted interest because the novel BCMA-targeting CAR agent (CT103A) being tested is fully human.4 In an accompanying editorial, Lee and Yong note that doubt for any real potential for durable CAR T therapy responses in multiple myeloma is raised by the poor persistence of multiple myeloma CAR T cells in multiple myeloma patients.3

In the earliest trials of BCMA CARs, while reported rates of objective antimyeloma responses were in the approximately 33%-88% range among patients with relapsed/refractory multiple myeloma (RRMM), persistence was typically 6 months or less. Lee and Yong point out, however, that while correlation between persistence and duration of response (DOR) has been variable, median persistence was 308 days in the phase I study. Wang and colleagues, the phase I study authors, state that levels of CAR T-cell proliferation and duration of cellular persistence may be determinants of DOR in CAR T therapy for multiple myeloma. They observe that the multiple mechanisms potentially responsible for the inability of some CAR T cells to survive in vivo, may include antigen escape, T-cell intrinsic mechanisms, tumor microenvironment–mediated suppression, and host anti-CAR immunity. CARs with humanized or fully human single-chain variable fragments (scFvs), prior studies suggest, may retain antitumor activity through bypassing potential host anti-CAR immunogenicity.
In the study, CT103A, a fully human scFv, was tested in an open-label, single-arm design for safety and preliminary efficacy in 18 patients (8 female; median age 53.5 years) with RRMM (at least three lines of prior therapies including a proteasome inhibitor and an immunomodulatory agent) who had undergone leukapheresis and had received lymphodepletion chemotherapy with fludarabine and cyclophosphamide. Four patients (22.2%) had been treated previously with murine anti-BCMA CAR T cells. Safety and tolerability (including dose-limiting toxicity) were the primary endpoints, with efficacy and pharmacokinetics secondary.
Rapid responses
Two weeks after infusion, the overall response rate (ORR) was 77.8% (14 of 18) and by 1 month it was 88.9% (16 of 18). Eventually, all responded and 72.2% (13 of 18) achieved a complete response (CR) or stringent complete response (sCR). All 17 patients evaluated for minimum residual disease (MRD) in bone marrow were MRD-negative at 10-4 nucleated cells by flow cytometry within 1 month. Median DOR was 325 days (range, 7-573 days) for all patients and 412 days (range, 213-573 days) for the 13 with CR/sCR. CAR transgenes were detectable at the cutoff date in 77.8% of patients, with a median CAR transgene persistence of 307.5 days.
During follow-up, four deaths were reported, including one patient with persistent sCR (sudden severe infection). Progression-free survival (PFS) and overall survival (OS) rates at 1 year were 58.3% and 75%, respectively. Extramedullary myeloma was associated with a shortened PFS (79.1% versus 20.0%, P = .015), but not OS (79.1% versus 60.0%, P = .328) at 1 year.
All patients experienced grade 3 or higher adverse events, most of which were expected hematologic effects of lymphodepleting chemotherapy and CT103A infusions. Grade 1 and 2 cytokine release syndromes occurred in 70.6% patients (17 of 18), with 1 grade 4 event (5.9%). The patients receiving a dose of up to 3.0 × 10⁶ CAR+ T cells/kg required less treatment of cytokine release syndrome than the patients who received a dose of 6.0 × 10⁶ CAR+ T cells/kg. No immune effector cell–associated neurotoxicity syndrome was observed. Antidrug antibody positivity occurred in only 1 patient.
Two characteristics of CT103A may contribute to its long persistence, stated study senior author Jianfeng Zhou, MD, PhD, chairman and professor of the department of hematology, Tongji Hospital in Wuhan, China. “One is the reduced immunogenicity achieved by the fully human construct; another is the relatively low binding affinity of the CAR binder. Notably, four patients who previously received murine BCMA CAR were included and still benefit from CT103A. It demonstrates the possibility of retreatment with a different CAR.” Dr. Zhou also emphasized that the lack of ICANS in the entire cohort reflects the excellent safety profile of CT103A.
The editorial commentary in Blood by Lydia Sarah Hui Lee, MD, and Kwee L. Yong, PhD, underscored impressive responses to CT103A, specifically to the median time to response of 15 days, the 100% ORR, and the not reached median progression-free survival at 394 days).5 The best results in other published nonhuman BCMA CAR T-cell trials, they note, were about 1 month (time to response), approximately 33%-88% (ORR), and median progression-free survival of 7-15 months.
Immune responses, Dr. Yong said in an interview, can guide subsequent treatment. “For example, if a patient previously exposed to BCMA CAR T cells in which the construct is either chimeric or humanized, but retains some murine elements, and had detectable antimurine antibodies, we may aim for a fully human one if we are considering treating with a different BCMA CAR T-cell product.” She added, “On the other hand, a similar patient whose serum did not contain such antibodies may be a candidate for a humanized product that retained some murine elements.”
Wang and colleagues concluded, “Altogether, CT103A is safe and highly active in patients with relapsed/refractory multiple myeloma and can be developed as a promising therapy for relapsed/refractory multiple myeloma.”4 An ongoing multicenter phase II trial with single-arm design is recruiting 100 patients. The infusion dosage, suggested by the phase I trial, is 1 × 10⁶ cells/kg. Endpoints include efficacy and safety.
Improving CAR T
Optimizing CAR design and adapting manufacturing processes to generate cell products enriched for T-cell subsets, such as early memory cells, are among strategies being explored to improve CAR T effectiveness.1 Also, dual-antigen targeting to interdict antigen escape and rational combination treatments to enhance persistence are under investigation, along with efforts to improve CAR T-cell therapy safety (for example, incorporation of a suicide gene safety system). They note further that several groups are researching use of induced pluripotent stem cells to generate large quantities of off-the-shelf CAR T-cell immunotherapies that would circumvent the complex, costly, and time-consuming process of manufacturing patient-specific autologous CAR T cells.
References
1. van de Donk N et al. Lancet Haematol. 2021 June;8(6):e446-61.
2. Munshi NC et al. N Engl J Med 2021; 384:705-716.
3. Berdeja JG et al. The Lancet. 2021 July; 398:314-24.
4. Wang D et al. Blood. 2021 May;137(21):2890-901.
5. Lee L and Yong K. Blood. 2021 May;137(21):2859-60.
In multiple myeloma, survival has been very significantly improved by immunomodulatory drugs, proteasome inhibitors, and CD38-targeting antibodies. Despite these advances, multiple myeloma, which is characterized by malignant proliferation of clonal plasma cells in bone marrow, remains an incurable plasma cell disorder with near-certain relapse after successful treatment. Prognosis for patients who develop triple-class refractory disease is poor, with less than 1-year survival. The substantial unmet therapeutic need extends further to other poor survival multiple myeloma populations that include newly diagnosed patients with high cytogenic risk profiles and those with early relapse after first-line therapy. For all of these, interest in drugs with novel mechanisms of action is naturally high.
More specific, less toxic
Post allogeneic hematopoietic stem-cell transplantation and donor lymphocyte infusion sustained remissions reflect a graft-versus-myeloma effect mediated by donor T cells.1 The substantial morbidity and mortality associated with graft-versus-host disease and opportunistic infections, however, have spurred searches for alternative, more specific, and less toxic T-cell therapies with stronger antitumor activity.
Chimeric antigen receptors (CARs)
In CAR T-cell therapies for multiple myeloma, autologous T cells are harvested from the patient and reprogrammed to target multiple myeloma cells through the introduction of genes that encode CARs, which are fusion proteins coupling an antigen-recognition moiety and a transmembrane-spanning element to a T-cell activation domain (typically CD3 zeta [CD247]). The T cells are then expanded and reinfused to the patient following a lymphodepletion regimen. Five strategies using autologous CAR T cells are currently approved for diffuse large B-cell lymphomas, acute lymphoblastic leukemia, multiple myeloma, and other hematologic malignancies. Notably, in patients with heavily pretreated multiple myeloma, CAR T cells have demonstrated impressive activity.
BCMA-targeting CAR T cells
The B-cell maturation antigen (BCMA; TNFRSF17), which plays an important role in the survival of long-lived plasma cells in bone marrow, is an attractive target for CAR T-cell therapy because it is expressed on normal and malignant plasma cell surfaces and by mature B cells. When ligands (TNFSF 13B/TNFSF13) bind to BCMA expressed on multiple myeloma cell surfaces, survival and proliferation pathways and drug resistance are activated.
High-quality responses have been demonstrated in several trials of anti-BCMA CAR T cells, which kill multiple myeloma cell lines and primary multiple myeloma cells through degranulation of T cells and lysis of tumor cells, even those with low BCMA expression. Based on efficacy in triple-class exposed multiple myeloma that compared favorably to conventional care with improved health-related quality of life, the U.S. Food and Drug Administration gave breakthrough designation to ciltacabtagene autoleucel in December 2019 and approval for idecabtagene vicleucel in March 2021.
Idecabtagene vicleucel
Idecabtagene vicleucel expresses a murine BCMA-targeting single-chain variable fragment with a 4-1BB costimulatory motif. The phase 2 KarMMa study2 evaluated idecabtagene vicleucel (target dose of 450 × 106 CAR T cells; range 150 × 106 to 450 × 106) activity in 128 patients with triple-class exposed multiple myeloma. Partial responses or better were observed in 94 of 128 patients (73%) (95% confidence interval, 66-81); 42 (33%) had a complete response or better (95% CI, 25-41), with a median progression-free survival of 8.8 months (95% CI, 5.6-11.6). Outcomes were improved in the highest fixed-dose group, with partial response or better in 81% (44 of 55), complete response or better in 39% (21), and median overall survival of 12.1 months (95% CI, 8.8-12.3). Patients with high-risk cytogenetic profiles, extramedullary disease, and high tumor burden also had deep and durable responses. Outcomes were less favorable in patients with revised International Staging System stage 3 disease.
Ciltacabtagene autoleucel
Ciltacabtagene autoleucel, a 4-1BB–based CAR T-cell therapy with two BCMA-targeting domains, confers high-avidity binding. In the phase 1b/2 CARTITUDE-1 study, conducted in the United States and Europe, preliminary results in 97 patients showed a 97% response rate with ciltacabtagene autoleucel (target dose 0.75 × 10⁶ CAR T cells per kg), and in 65 patients, a complete response (67%). Progression-free survival at 12 months was 77% (95% CI, 66-84) and overall survival was 89% (95% CI, 80-94).3
In the phase 1 LEGEND-2 study4 that was conducted at four sites in China among less heavily pretreated multiple myeloma patients, while all used the same CAR construct, sites used variable conditioning regimens (split versus single). In the site using cyclophosphamide as the lymphodepletion therapy and three split CAR T-cell infusions, partial response or better was achieved in 50 patients (88%) with a median of three prior therapy lines. The complete response rate was high (74%) and minimal residual disease negativity was reached in 39 patients (68%). Median progression-free survival was 19.9 months (95% CI, 9.6-31.0), but 28.2 months among those with complete responses (95% CI, 19.9-not estimable). Median overall survival was also favorable at 36.1 months (95% CI, 26.4-not estimable); it was 35.0 months-not estimable among patients with complete responses. Results from the other three sites were comparable.
Noteworthy among other BCMA-targeting CAR T-cell products in earlier stages of clinical development is orvacabtagene autoleucel, which has a fully human BCMA-specific binding domain. At higher doses (300 × 106 to 600 × 106 CAR T cells) among 62 patients with triple-class–exposed multiple myeloma in the EVOLVE trial, 92% had a partial or better response, with complete responses or better in 36%, all with an encouraging safety profile.
BCMA-targeting CAR T cell toxicity
While van de Donk, Usmani, and Yong, in their review1 note a lack of evidence of off-target toxicity with BCMA-targeting CAR T-cell therapy in clinical studies so far, they do point to several clinical syndromes (cytokine release syndrome, infections, respiratory failure, neurotoxicity, pulmonary aspergillosis, gastrointestinal hemorrhage) caused by cytokines produced during CAR T-cell expansion and to cytopenias and infections arising from prior treatment, bridging therapy, and lymphodepleting conditioning. Deaths attributed to treatment in the above-mentioned trials underscore the need for careful monitoring and early intervention.
Cytokine release syndrome
In the BCMA-targeting CAR T-cell therapy studies, the frequency of cytokine release syndrome varies widely from 17% to 95% but is generally attributed to CAR T-cell activation and is associated with increased serum ferritin concentrations, high c-reactive proteins, and proinflammatory cytokines. High tumor load, in multiple myeloma patients receiving CD19-targeting CAR T cells, was associated with a higher incidence of severe cytokine release syndrome. In a small number of patients, macrophage activation syndrome and hemophagocytic lymphohistiocytosis, the most aggressive variants of cytokine release syndrome, are caused by severe immune activation and lead to multiorgan dysfunction.
Neurotoxicity
Immune effector cell–-associated neurotoxicity syndrome (ICANS) symptoms, in multiple myeloma patients treated with BCMA-targeting CAR T cells, may include delirium, transient confusion, aphasia, lethargy, tremor, dysgraphia, seizures, cerebral edema, and rarely, posterior reversible encephalopathy syndrome.1 While the pathophysiology of CAR T cell–related neurotoxicity is not well understood, high tumor load, higher peak concentrations of CAR T cells, and more severe cytokine release syndrome are more common in patients with severe neurotoxicity. “The frequency of neurotoxicities,” Dr. Yong noted in an interview, “has been reduced by steps taken to mitigate these risk factors.”
High interest in phase I study
A phase I study presented in Blood has attracted interest because the novel BCMA-targeting CAR agent (CT103A) being tested is fully human.4 In an accompanying editorial, Lee and Yong note that doubt for any real potential for durable CAR T therapy responses in multiple myeloma is raised by the poor persistence of multiple myeloma CAR T cells in multiple myeloma patients.3
In the earliest trials of BCMA CARs, while reported rates of objective antimyeloma responses were in the approximately 33%-88% range among patients with relapsed/refractory multiple myeloma (RRMM), persistence was typically 6 months or less. Lee and Yong point out, however, that while correlation between persistence and duration of response (DOR) has been variable, median persistence was 308 days in the phase I study. Wang and colleagues, the phase I study authors, state that levels of CAR T-cell proliferation and duration of cellular persistence may be determinants of DOR in CAR T therapy for multiple myeloma. They observe that the multiple mechanisms potentially responsible for the inability of some CAR T cells to survive in vivo, may include antigen escape, T-cell intrinsic mechanisms, tumor microenvironment–mediated suppression, and host anti-CAR immunity. CARs with humanized or fully human single-chain variable fragments (scFvs), prior studies suggest, may retain antitumor activity through bypassing potential host anti-CAR immunogenicity.
In the study, CT103A, a fully human scFv, was tested in an open-label, single-arm design for safety and preliminary efficacy in 18 patients (8 female; median age 53.5 years) with RRMM (at least three lines of prior therapies including a proteasome inhibitor and an immunomodulatory agent) who had undergone leukapheresis and had received lymphodepletion chemotherapy with fludarabine and cyclophosphamide. Four patients (22.2%) had been treated previously with murine anti-BCMA CAR T cells. Safety and tolerability (including dose-limiting toxicity) were the primary endpoints, with efficacy and pharmacokinetics secondary.
Rapid responses
Two weeks after infusion, the overall response rate (ORR) was 77.8% (14 of 18) and by 1 month it was 88.9% (16 of 18). Eventually, all responded and 72.2% (13 of 18) achieved a complete response (CR) or stringent complete response (sCR). All 17 patients evaluated for minimum residual disease (MRD) in bone marrow were MRD-negative at 10-4 nucleated cells by flow cytometry within 1 month. Median DOR was 325 days (range, 7-573 days) for all patients and 412 days (range, 213-573 days) for the 13 with CR/sCR. CAR transgenes were detectable at the cutoff date in 77.8% of patients, with a median CAR transgene persistence of 307.5 days.
During follow-up, four deaths were reported, including one patient with persistent sCR (sudden severe infection). Progression-free survival (PFS) and overall survival (OS) rates at 1 year were 58.3% and 75%, respectively. Extramedullary myeloma was associated with a shortened PFS (79.1% versus 20.0%, P = .015), but not OS (79.1% versus 60.0%, P = .328) at 1 year.
All patients experienced grade 3 or higher adverse events, most of which were expected hematologic effects of lymphodepleting chemotherapy and CT103A infusions. Grade 1 and 2 cytokine release syndromes occurred in 70.6% patients (17 of 18), with 1 grade 4 event (5.9%). The patients receiving a dose of up to 3.0 × 10⁶ CAR+ T cells/kg required less treatment of cytokine release syndrome than the patients who received a dose of 6.0 × 10⁶ CAR+ T cells/kg. No immune effector cell–associated neurotoxicity syndrome was observed. Antidrug antibody positivity occurred in only 1 patient.
Two characteristics of CT103A may contribute to its long persistence, stated study senior author Jianfeng Zhou, MD, PhD, chairman and professor of the department of hematology, Tongji Hospital in Wuhan, China. “One is the reduced immunogenicity achieved by the fully human construct; another is the relatively low binding affinity of the CAR binder. Notably, four patients who previously received murine BCMA CAR were included and still benefit from CT103A. It demonstrates the possibility of retreatment with a different CAR.” Dr. Zhou also emphasized that the lack of ICANS in the entire cohort reflects the excellent safety profile of CT103A.
The editorial commentary in Blood by Lydia Sarah Hui Lee, MD, and Kwee L. Yong, PhD, underscored impressive responses to CT103A, specifically to the median time to response of 15 days, the 100% ORR, and the not reached median progression-free survival at 394 days).5 The best results in other published nonhuman BCMA CAR T-cell trials, they note, were about 1 month (time to response), approximately 33%-88% (ORR), and median progression-free survival of 7-15 months.
Immune responses, Dr. Yong said in an interview, can guide subsequent treatment. “For example, if a patient previously exposed to BCMA CAR T cells in which the construct is either chimeric or humanized, but retains some murine elements, and had detectable antimurine antibodies, we may aim for a fully human one if we are considering treating with a different BCMA CAR T-cell product.” She added, “On the other hand, a similar patient whose serum did not contain such antibodies may be a candidate for a humanized product that retained some murine elements.”
Wang and colleagues concluded, “Altogether, CT103A is safe and highly active in patients with relapsed/refractory multiple myeloma and can be developed as a promising therapy for relapsed/refractory multiple myeloma.”4 An ongoing multicenter phase II trial with single-arm design is recruiting 100 patients. The infusion dosage, suggested by the phase I trial, is 1 × 10⁶ cells/kg. Endpoints include efficacy and safety.
Improving CAR T
Optimizing CAR design and adapting manufacturing processes to generate cell products enriched for T-cell subsets, such as early memory cells, are among strategies being explored to improve CAR T effectiveness.1 Also, dual-antigen targeting to interdict antigen escape and rational combination treatments to enhance persistence are under investigation, along with efforts to improve CAR T-cell therapy safety (for example, incorporation of a suicide gene safety system). They note further that several groups are researching use of induced pluripotent stem cells to generate large quantities of off-the-shelf CAR T-cell immunotherapies that would circumvent the complex, costly, and time-consuming process of manufacturing patient-specific autologous CAR T cells.
References
1. van de Donk N et al. Lancet Haematol. 2021 June;8(6):e446-61.
2. Munshi NC et al. N Engl J Med 2021; 384:705-716.
3. Berdeja JG et al. The Lancet. 2021 July; 398:314-24.
4. Wang D et al. Blood. 2021 May;137(21):2890-901.
5. Lee L and Yong K. Blood. 2021 May;137(21):2859-60.
Pheochromocytoma: An Incidental Finding in an Asymptomatic Older Adult With Renal Oncocytoma
A high index of suspicion for pheochromocytoma is necessary during the workup of secondary hypertension as untreated pheochromocytoma may lead to significant morbidity and mortality, especially in patients who require any surgical treatment.
Pheochromocytoma is a rare catecholamine-secreting tumor of chromaffin cells of the adrenal medulla or sympathetic ganglia, occurring in about 0.2 to 0.5% of patients with hypertension.1-3 However, in a review of 54 autopsy-proven cases of pheochromocytoma, about 50% of the patients with hypertension were not clinically suspected for pheochromocytoma.4
Pheochromocytoma is usually diagnosed based on symptoms of hyperadrenergic spells, resistant hypertension, especially in the young, with a pressor response to the anesthesia stress test and adrenal incidentaloma.
The classic triad of symptoms associated with pheochromocytoma includes episodic headache (90%), sweating (60-70%), and palpitations (70%).2,5 Sustained or paroxysmal hypertension is the most common symptom reported in about 95% of patients with pheochromocytoma. Other symptoms include pallor, tremors, dyspnea, generalized weakness, orthostatic hypotension, cardiomyopathy, or hyperglycemia.6 However, about 10% of patients with pheochromocytoma are asymptomatic or mildly symptomatic.7 Secondary causes of hypertension are usually suspected in multidrug resistant or sudden early onset of hypertension.8
Approximately 10% of catecholamine-secreting tumors are malignant.9-11 Benign and malignant pheochromocytoma have a similar biochemical and histologic presentation and are differentiated based on local invasion into the surrounding tissues and organs (eg, kidney, liver) or distant metastasis.
A typical workup of a suspected patient with pheochromocytoma includes biochemical tests, including measurements of urinary and fractionated plasma metanephrines and catecholamine. Patients with positive biochemical tests should undergo localization of the tumor with an imaging study either with an adrenal/abdominal magnetic resonance imaging (MRI) or computed tomography (CT) scan. If a patient has paraganglioma or an adrenal mass > 10 cm or negative abdominal imaging with a positive biochemical test, further imaging with an iobenguane I-123 scan is needed (Figure 1).
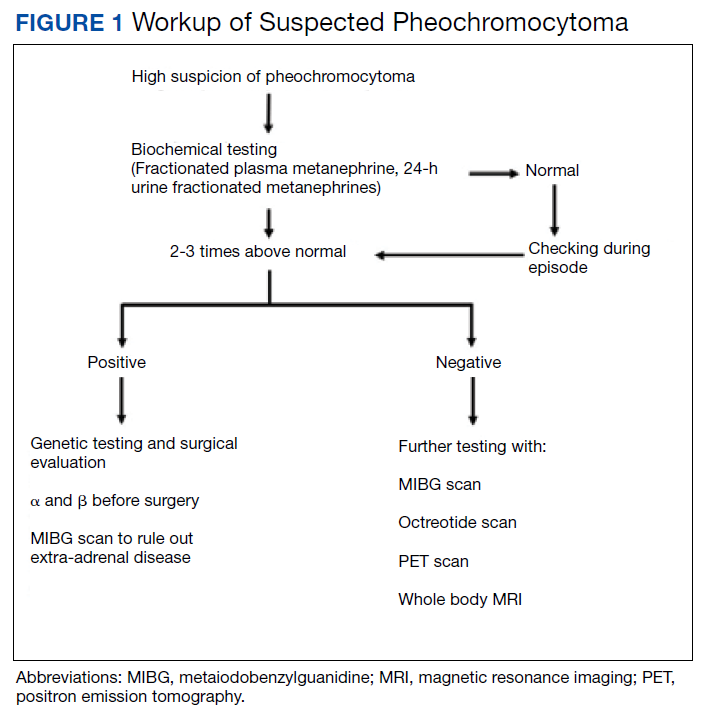
In this article, we present an unusual case of asymptomatic pheochromocytoma in a patient with right-sided renal oncocytoma who underwent an uneventful nephrectomy and adrenalectomy.
Case Presentation
A 72-year-old male with a medical history of diabetes, hypertension, sensory neuropathy, benign prostatic hypertrophy (BPH) status posttransurethral resection of the prostate, and chronic renal failure presented to establish care with the Arizona Kidney Disease and Hypertension Center. His medications included losartan 50 mg by mouth daily, diltiazem 180 mg extended-release by mouth daily, carvedilol 6.25 mg by mouth twice a day, and tamsulosin 0.4 mg by mouth daily. His presenting vitals were blood pressure (BP), 112/74 left arm sitting, pulse, 63/beats per min, and body mass index, 34. On physical examination, the patient was alert and oriented, and the chest was clear to auscultation without wheeze or rhonchi. On cardiac examination, heart rate and rhythm were regular; S1 and S2 were normal with no added murmurs, rubs or gallops, and no jugular venous distension. The abdomen was soft, nontender, with no palpable mass. His laboratory results showed sodium, 142 mmol/L; potassium, 5.3 mmol/L; chloride, 101 mmol/L; carbon dioxide, 24 mmol/L; albumin, 4.3 g/dL; creatinine, 1.89 mg/dL; blood urea nitrogen, 29 mg/dL; estimated glomerular filtration rate non-African American, 35 mL/min/1.73; 24-h urine creatinine clearance, 105 mL/min; protein, 1306 mg/24 h (Table).
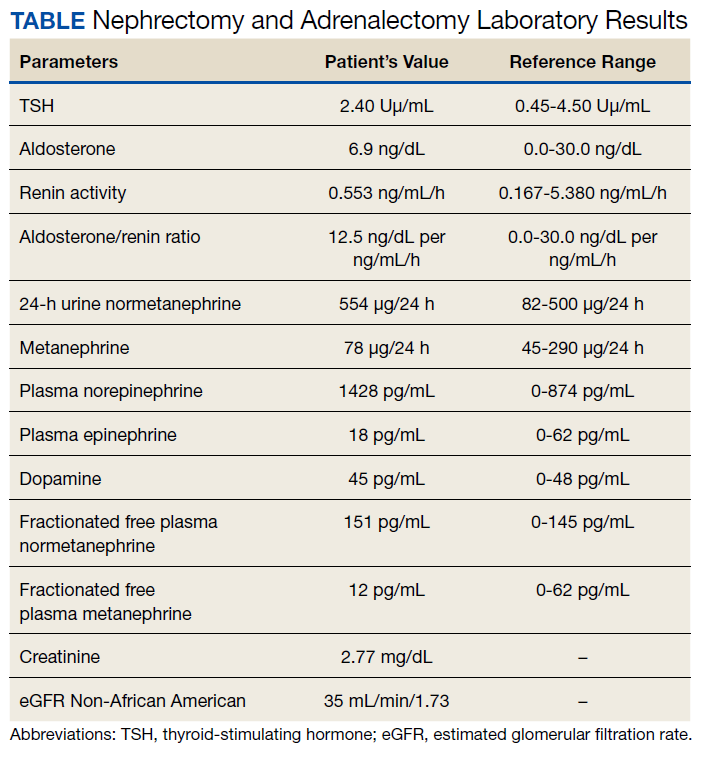
His renal ultrasound showed an exophytic isoechoic mass or complex cyst at the lateral aspect of the lower pole of the right kidney, measuring 45 mm in diameter. An MRI of the abdomen with and without contrast showed a solid partially exophytic mass of the posterolateral interpolar cortex of the right kidney, measuring 5.9 cm in the greatest dimension (Figure 2). No definite involvement of Gerota fascia was noted, a 1-cm metastasis to the right adrenal gland was present, renal veins were patent, and there was no upper retroperitoneal lymphadenopathy.
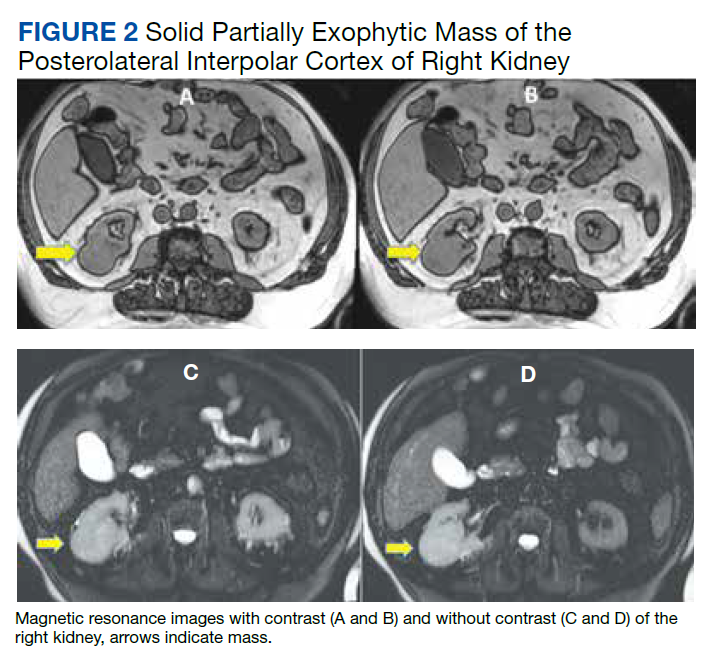
Treatment and Follow-up
The patient underwent right-hand-assisted lap-aroscopic radical nephrectomy and right adre-nalectomy without any complications. However, the surgical pathology report showed oncocytoma of the kidney (5.7 cm), pheochromocytoma of the adrenal gland (1.4 cm), and papillary adenoma of the kidney (0.7 cm). Right kidney nephrectomy showed non-neoplastic renal parenchyma, diabetic glomerulosclerosis (Renal Pathology Society 2010 diabetic nephropathy class IIb), severe mesangial expansion, moderate interstitial fibrosis, moderate arteriosclerosis, and mild arteriolosclerosis.
A fluorodeoxyglucose-positron emission tomography (FDG-PET) scan was significant for right nephrectomy and adrenalectomy and showed no significant evidence of residual neoplasm or local or distant metastases. A nuclear medicine (iobenguane I-123) tumor and single positron emission computed tomography (SPECT) scan showed normal activity throughout the body and no evidence of abnormal activity (Figure 3).
Discussion
Pheochromocytoma is a rare cause of secondary hypertension. However, the real numbers are thought to be > 0.2 to 0.5%.1,2,4 Patients with pheochromocytoma should undergo surgical adrenal resection after appropriate medical preparation. Patients with pheochromocytoma who are not diagnosed preoperatively have increased surgical mortality rates due to fatal hypertensive crises, malignant arrhythmia, and multiorgan failure as a result of hypertensive crisis.15 Anesthetic drugs during surgery also can exacerbate the cardiotoxic effects of catecholamines. Short-acting anesthetic agents, such as fentanyl, are used in patients with pheochromocytoma.16
This case of pheochromocytoma illustrated no classic symptoms of episodic headache, sweating, and tachycardia, and the patient was otherwise asymptomatic. BP was well controlled with losartan, diltiazem, and a β-blocker with α-blocking activity (carvedilol). As the patient was not known to have pheochromocytoma, he did not undergo preoperative medical therapy. Figure 4 illustrates the receptors stimulate catecholamines, and the drugs blocking these receptors prevent hypertensive crisis during surgery. However, the surgery was without potential complications (ie, hypertensive crisis, malignant arrhythmia, or multiorgan failure). The patient was diagnosed incidentally on histopathology after right radical nephrectomy and adrenalectomy due to solid partially exophytic right renal mass (5.9 cm) with right adrenal metastasis. About 10% of patients are asymptomatic or mildly symptomatic.7 Sometimes, the symptoms may be ignored because of the episodic nature. Other possible reasons can be small, nonfunctional tumors or the use of antihypertensive medications suppressing the symptoms.7
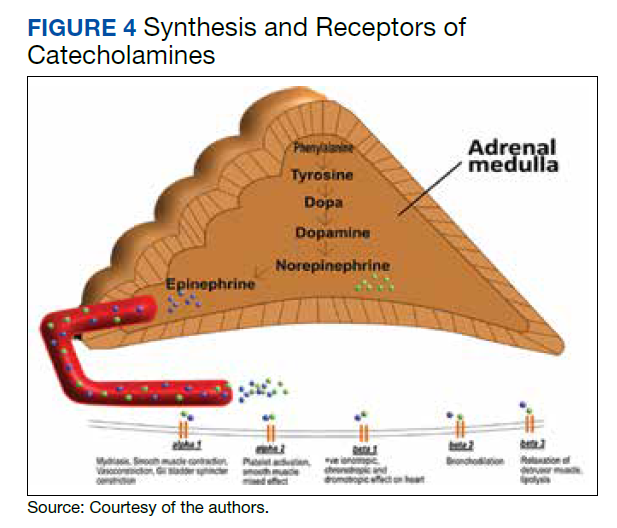
The adrenal mass that was initially thought to be a metastasis of right kidney mass was later confirmed as pheochromocytoma. One possible explanation for uneventful surgery could be the use of β-blocker with α-blocking activity (carvedilol), α-1 adrenergic blocker (tamsulosin) along with nondihydropyridine calcium channel blocker (diltiazem) as part of the patient’s antihypertensive and BPH medication regimen. Another possible explanation could be silent or episodically secreting pheochromocytoma with a small functional portion.
Subsequent workup after adrenalectomy, including urinary and fractionated plasma metanephrines and catecholamines, were not consistent with catecholamine hypersecretion. A 24-hour urine fractionated metanephrines test has about 98% sensitivity and 98% specificity. Elevated plasma norepinephrine was thought to be due to renal failure because it was < 3-fold the upper limit of normal, which is considered to be a possible indication of pheochromocytoma.17,18 The nuclear medicine (iobenguane I-123) tumor, SPECT, and FDG-PET CT studies were negative for residual pheochromocytoma. Other imaging studies to consider in patients with suspected catecholamine-secreting tumor with positive biochemical test and negative abdominal imaging are a whole-body MRI scan, 68-Ga DOTATATE (gallium 68 1,4,7,10-tetraazacyclododecane-1,4,7,10 tetraacetic acid-octreotate) or FDG-PET scan.19
In a review of 54 autopsy-proven pheochromocytoma cases by Sutton and colleagues in 1981, 74% of the patients were not clinically suspected for pheochromocytoma in their life.4 Similarly, in a retrospective study of hospital autopsies by McNeil and colleagues, one incidental pheochromocytoma was detected in every 2031 autopsies (0.05%).20 In another case series of 41 patients with pheochromocytoma-related adrenalectomy, almost 50% of the pheochromocytomas were detected incidentally on imaging studies.21 Although the number of incidental findings are decreasing due to advances in screening techniques, a significant number of patients remain undiagnosed. Multiple cases of diagnosis of pheochromocytoma on autopsy of patients who died of hemodynamic instability (ie, hypertensive crisis, hypotension crisis precipitated by surgery for adrenal or nonadrenal conditions) are reported.3 To the best of our knowledge, there are no case reports published on the diagnosis of pheochromocytoma after adrenalectomy in an asymptomatic patient without intraoperative complications.
The goal of preoperative medical therapy includes BP control, prevention of tachycardia, and volume expansion. The preoperative medications regimens are combined α- and β-adrenergic blockade, calcium channel blockers, and metyrosine. According to clinical practice guidelines of the Endocrine Society in 2014, the α-adrenergic blockers should be started first at least 7 days before surgery to control BP and to cause vasodilation. Early use of α-blockers is required to prevent cardiotoxicity. The β-adrenergic blockers should be started after the adequate α-adrenergic blockade, typically 2 to 3 days before surgery, as early use can cause vasoconstriction in patients with pheochromocytoma. The α-adrenergic blockers include phenoxybenzamine (nonselective long-acting nonspecific α-adrenergic blocking agent), and selective α-1 adrenergic blockers (doxazosin, prazosin, terazosin). The β-adrenergic blocker (ie, propranolol, metoprolol) should be started cautiously with a low dose and slowly titrated to control heart rate. A high sodium diet and increased fluid intake also are recommended 7 to 14 days before surgery. A sudden drop in catecholamines can cause hypotension during an operation. Continuous fluid infusions are given to prevent hypotension.22 Similarly, anesthetic agents also should be modified to prevent cardiotoxic effects. Rocuronium and vecuronium are less cardiotoxic compared with other sympathomimetic muscle relaxants. Short-acting anesthetic agents, such as fentanyl, are preferred. α-blockers are continued throughout the operation. Biochemical testing with fractionated metanephrines is performed about 1 to 2 weeks postoperatively to look for recurrence of the disease.23
Secondary causes of hypertension are suspected in multidrug resistant or sudden early onset of hypertension before aged 40 years. Pheochromocytoma is a rare cause of secondary hypertension, and older adult patients are rarely diagnosed with pheochromocytoma.24 In this report, pheochromocytoma was detected in a 72-year-old hypertensive patient. Therefore, a pheochromocytoma diagnosis should not be ignored in the older adult patient with adrenal mass and hypertension treated with more than one drug. The authors recommend any patient undergoing surgery with adrenal lesion should be considered for the screening of possible pheochromocytoma and prepared preoperatively, especially any patient with renal cell carcinoma with adrenal metastasis.
Conclusions
Asymptomatic pheochromocytoma is an unusual but serious condition, especially for patients undergoing a surgical procedure. An adrenal mass may be ignored in asymptomatic or mildly symptomatic older adult patients and is mostly considered as adrenal metastasis when present with other malignancies. Fortunately, the nephrectomy and adrenalectomy in our case of asymptomatic pheochromocytoma was uneventful, but pheochromocytoma should be ruled out before a surgical procedure, as an absence of medical pretreatment can lead to serious consequences. Therefore, we suggest a more careful screening of pheochromocytoma in patients with an adrenal mass (primary or metastatic) and hypertension treated with multiple antihypertensive drugs, even in older adult patients.
1. Omura M, Saito J, Yamaguchi K, Kakuta Y, Nishikawa T. Prospective study on the prevalence of secondary hypertension among hypertensive patients visiting a general outpatient clinic in Japan. Hypertens Res. 2004;27(3):193-202. doi:10.1291/hypres.27.193
2. Stein PP, Black HR. A simplified diagnostic approach to pheochromocytoma: a review of the literature and report of one institution’s experience. Medicine (Baltimore). 1991;70(1):46-66. doi:10.1097/00005792-199101000-00004
3. Beard CM, Sheps SG, Kurland LT, Carney JA, Lie JT. Occurrence of pheochromocytoma in Rochester, Minnesota, 1950 through 1979. Mayo Clin Proc. 1983;58(12):802-804.
4. Sutton MG, Sheps SG, Lie JT. Prevalence of clinically unsuspected pheochromocytoma: review of a 50-year autopsy series. Mayo Clin Proc. 1981;56(6):354-360.
5. Manger WM, Gifford RW Jr. Pheochromocytoma. J Clin Hypertens (Greenwich). 2002;4(1):62-72. doi:10.1111/j.1524-6175.2002.01452.x
6. Kassim TA, Clarke DD, Mai VQ, Clyde PW, Mohamed Shakir KM. Catecholamine-induced cardiomyopathy. Endocr Pract. 2008;14(9):1137-1149. doi:10.4158/EP.14.9.1137
7. Kudva YC, Young WF, Thompson GB, Grant CS, Van Heerden JA. Adrenal incidentaloma: an important component of the clinical presentation spectrum of benign sporadic adrenal pheochromocytoma. The Endocrinologist. 1999;9(2):77-80. doi:10.1097/00019616-199903000-00002
8. Puar TH, Mok Y, Debajyoti R, Khoo J, How CH, Ng AK. Secondary hypertension in adults. Singapore Med J. 2016;57(5):228-232. doi:10.11622/smedj.2016087
9. Bravo EL. Pheochromocytoma: new concepts and future trends. Kidney Int. 1991;40(3):544-556. doi:10.1038/ki.1991.244
10. Plouin PF, Chatellier G, Fofol I, Corvol P. Tumor recurrence and hypertension persistence after successful pheochromocytoma operation. Hypertension. 1997;29(5):1133-1139. doi:10.1161/01.hyp.29.5.1133
11. Hamidi O, Young WF Jr, Iñiguez-Ariza NM, et al. Malignant pheochromocytoma and paraganglioma: 272 patients over 55 years. J Clin Endocrinol Metab. 2017;102(9):3296-3305. doi:10.1210/jc.2017-00992
12. Kenny L, Rizzo V, Trevis J, Assimakopoulou E, Timon D. The unexpected diagnosis of phaeochromocytoma in the anaesthetic room. Ann Card Anaesth. 2018;21(3):307-310. doi:10.4103/aca.ACA_206_17
13. Johnston PC, Silversides JA, Wallace H, et al. Phaeochromocytoma crisis: two cases of undiagnosed phaeochromocytoma presenting after elective nonrelated surgical procedures. Case Rep Anesthesiol. 2013;2013:514714. doi:10.1155/2013/514714
14. Shen SJ, Cheng HM, Chiu AW, Chou CW, Chen JY. Perioperative hypertensive crisis in clinically silent pheochromocytomas: report of four cases. Chang Gung Med J. 2005;28(1):44-50.
15. Lo CY, Lam KY, Wat MS, Lam KS. Adrenal pheochromocytoma remains a frequently overlooked diagnosis. Am J Surg. 2000;179(3):212-215. doi:10.1016/s0002-9610(00)00296-8
16. Myklejord DJ. Undiagnosed pheochromocytoma: the anesthesiologist nightmare. Clin Med Res. 2004;2(1):59-62. doi:10.3121/cmr.2.1.59
17. Stumvoll M, Radjaipour M, Seif F. Diagnostic considerations in pheochromocytoma and chronic hemodialysis: case report and review of the literature. Am J Nephrol. 1995;15(2):147-151. doi:10.1159/000168820
18. Morioka M, Yuihama S, Nakajima T, et al. Incidentally discovered pheochromocytoma in long-term hemodialysis patients. Int J Urol. 2002;9(12):700-703. doi:10.1046/j.1442-2042.2002.00553.x
19. ˇCtvrtlík F, Koranda P, Schovánek J, Škarda J, Hartmann I, Tüdös Z. Current diagnostic imaging of pheochromocytomas and implications for therapeutic strategy. Exp Ther Med. 2018;15(4):3151-3160. doi:10.3892/etm.2018.5871
20. McNeil AR, Blok BH, Koelmeyer TD, Burke MP, Hilton JM. Phaeochromocytomas discovered during coronial autopsies in Sydney, Melbourne and Auckland. Aust N Z J Med. 2000;30(6):648-652. doi:10.1111/j.1445-5994.2000.tb04358.x
21. Baguet JP, Hammer L, Mazzuco TL, et al. Circumstances of discovery of phaeochromocytoma: a retrospective study of 41 consecutive patients. Eur J Endocrinol. 2004;150(5):681-686. doi:10.1530/eje.0.1500681
22. Lenders JW, Duh QY, Eisenhofer G, et al. Pheochromocytoma and paraganglioma: an endocrine society clinical practice guideline. J Clin Endocrinol Metab. 2014;99(6):1915-1942. doi:10.1210/jc.2014-1498
23. Dortzbach K, Gainsburg DM, Frost EA. Variants of pheochromocytoma and their anesthetic implications--a case report and literature review. Middle East J Anaesthesiol. 2010;20(6):897-905.
24. Januszewicz W, Chodakowska J, Styczy´nski G. Secondary hypertension in the elderly. J Hum Hypertens. 1998;12(9):603-606. doi:10.1038/sj.jhh.1000673
A high index of suspicion for pheochromocytoma is necessary during the workup of secondary hypertension as untreated pheochromocytoma may lead to significant morbidity and mortality, especially in patients who require any surgical treatment.
A high index of suspicion for pheochromocytoma is necessary during the workup of secondary hypertension as untreated pheochromocytoma may lead to significant morbidity and mortality, especially in patients who require any surgical treatment.
Pheochromocytoma is a rare catecholamine-secreting tumor of chromaffin cells of the adrenal medulla or sympathetic ganglia, occurring in about 0.2 to 0.5% of patients with hypertension.1-3 However, in a review of 54 autopsy-proven cases of pheochromocytoma, about 50% of the patients with hypertension were not clinically suspected for pheochromocytoma.4
Pheochromocytoma is usually diagnosed based on symptoms of hyperadrenergic spells, resistant hypertension, especially in the young, with a pressor response to the anesthesia stress test and adrenal incidentaloma.
The classic triad of symptoms associated with pheochromocytoma includes episodic headache (90%), sweating (60-70%), and palpitations (70%).2,5 Sustained or paroxysmal hypertension is the most common symptom reported in about 95% of patients with pheochromocytoma. Other symptoms include pallor, tremors, dyspnea, generalized weakness, orthostatic hypotension, cardiomyopathy, or hyperglycemia.6 However, about 10% of patients with pheochromocytoma are asymptomatic or mildly symptomatic.7 Secondary causes of hypertension are usually suspected in multidrug resistant or sudden early onset of hypertension.8
Approximately 10% of catecholamine-secreting tumors are malignant.9-11 Benign and malignant pheochromocytoma have a similar biochemical and histologic presentation and are differentiated based on local invasion into the surrounding tissues and organs (eg, kidney, liver) or distant metastasis.
A typical workup of a suspected patient with pheochromocytoma includes biochemical tests, including measurements of urinary and fractionated plasma metanephrines and catecholamine. Patients with positive biochemical tests should undergo localization of the tumor with an imaging study either with an adrenal/abdominal magnetic resonance imaging (MRI) or computed tomography (CT) scan. If a patient has paraganglioma or an adrenal mass > 10 cm or negative abdominal imaging with a positive biochemical test, further imaging with an iobenguane I-123 scan is needed (Figure 1).
In this article, we present an unusual case of asymptomatic pheochromocytoma in a patient with right-sided renal oncocytoma who underwent an uneventful nephrectomy and adrenalectomy.
Case Presentation
A 72-year-old male with a medical history of diabetes, hypertension, sensory neuropathy, benign prostatic hypertrophy (BPH) status posttransurethral resection of the prostate, and chronic renal failure presented to establish care with the Arizona Kidney Disease and Hypertension Center. His medications included losartan 50 mg by mouth daily, diltiazem 180 mg extended-release by mouth daily, carvedilol 6.25 mg by mouth twice a day, and tamsulosin 0.4 mg by mouth daily. His presenting vitals were blood pressure (BP), 112/74 left arm sitting, pulse, 63/beats per min, and body mass index, 34. On physical examination, the patient was alert and oriented, and the chest was clear to auscultation without wheeze or rhonchi. On cardiac examination, heart rate and rhythm were regular; S1 and S2 were normal with no added murmurs, rubs or gallops, and no jugular venous distension. The abdomen was soft, nontender, with no palpable mass. His laboratory results showed sodium, 142 mmol/L; potassium, 5.3 mmol/L; chloride, 101 mmol/L; carbon dioxide, 24 mmol/L; albumin, 4.3 g/dL; creatinine, 1.89 mg/dL; blood urea nitrogen, 29 mg/dL; estimated glomerular filtration rate non-African American, 35 mL/min/1.73; 24-h urine creatinine clearance, 105 mL/min; protein, 1306 mg/24 h (Table).
His renal ultrasound showed an exophytic isoechoic mass or complex cyst at the lateral aspect of the lower pole of the right kidney, measuring 45 mm in diameter. An MRI of the abdomen with and without contrast showed a solid partially exophytic mass of the posterolateral interpolar cortex of the right kidney, measuring 5.9 cm in the greatest dimension (Figure 2). No definite involvement of Gerota fascia was noted, a 1-cm metastasis to the right adrenal gland was present, renal veins were patent, and there was no upper retroperitoneal lymphadenopathy.
Treatment and Follow-up
The patient underwent right-hand-assisted lap-aroscopic radical nephrectomy and right adre-nalectomy without any complications. However, the surgical pathology report showed oncocytoma of the kidney (5.7 cm), pheochromocytoma of the adrenal gland (1.4 cm), and papillary adenoma of the kidney (0.7 cm). Right kidney nephrectomy showed non-neoplastic renal parenchyma, diabetic glomerulosclerosis (Renal Pathology Society 2010 diabetic nephropathy class IIb), severe mesangial expansion, moderate interstitial fibrosis, moderate arteriosclerosis, and mild arteriolosclerosis.
A fluorodeoxyglucose-positron emission tomography (FDG-PET) scan was significant for right nephrectomy and adrenalectomy and showed no significant evidence of residual neoplasm or local or distant metastases. A nuclear medicine (iobenguane I-123) tumor and single positron emission computed tomography (SPECT) scan showed normal activity throughout the body and no evidence of abnormal activity (Figure 3).
Discussion
Pheochromocytoma is a rare cause of secondary hypertension. However, the real numbers are thought to be > 0.2 to 0.5%.1,2,4 Patients with pheochromocytoma should undergo surgical adrenal resection after appropriate medical preparation. Patients with pheochromocytoma who are not diagnosed preoperatively have increased surgical mortality rates due to fatal hypertensive crises, malignant arrhythmia, and multiorgan failure as a result of hypertensive crisis.15 Anesthetic drugs during surgery also can exacerbate the cardiotoxic effects of catecholamines. Short-acting anesthetic agents, such as fentanyl, are used in patients with pheochromocytoma.16
This case of pheochromocytoma illustrated no classic symptoms of episodic headache, sweating, and tachycardia, and the patient was otherwise asymptomatic. BP was well controlled with losartan, diltiazem, and a β-blocker with α-blocking activity (carvedilol). As the patient was not known to have pheochromocytoma, he did not undergo preoperative medical therapy. Figure 4 illustrates the receptors stimulate catecholamines, and the drugs blocking these receptors prevent hypertensive crisis during surgery. However, the surgery was without potential complications (ie, hypertensive crisis, malignant arrhythmia, or multiorgan failure). The patient was diagnosed incidentally on histopathology after right radical nephrectomy and adrenalectomy due to solid partially exophytic right renal mass (5.9 cm) with right adrenal metastasis. About 10% of patients are asymptomatic or mildly symptomatic.7 Sometimes, the symptoms may be ignored because of the episodic nature. Other possible reasons can be small, nonfunctional tumors or the use of antihypertensive medications suppressing the symptoms.7
The adrenal mass that was initially thought to be a metastasis of right kidney mass was later confirmed as pheochromocytoma. One possible explanation for uneventful surgery could be the use of β-blocker with α-blocking activity (carvedilol), α-1 adrenergic blocker (tamsulosin) along with nondihydropyridine calcium channel blocker (diltiazem) as part of the patient’s antihypertensive and BPH medication regimen. Another possible explanation could be silent or episodically secreting pheochromocytoma with a small functional portion.
Subsequent workup after adrenalectomy, including urinary and fractionated plasma metanephrines and catecholamines, were not consistent with catecholamine hypersecretion. A 24-hour urine fractionated metanephrines test has about 98% sensitivity and 98% specificity. Elevated plasma norepinephrine was thought to be due to renal failure because it was < 3-fold the upper limit of normal, which is considered to be a possible indication of pheochromocytoma.17,18 The nuclear medicine (iobenguane I-123) tumor, SPECT, and FDG-PET CT studies were negative for residual pheochromocytoma. Other imaging studies to consider in patients with suspected catecholamine-secreting tumor with positive biochemical test and negative abdominal imaging are a whole-body MRI scan, 68-Ga DOTATATE (gallium 68 1,4,7,10-tetraazacyclododecane-1,4,7,10 tetraacetic acid-octreotate) or FDG-PET scan.19
In a review of 54 autopsy-proven pheochromocytoma cases by Sutton and colleagues in 1981, 74% of the patients were not clinically suspected for pheochromocytoma in their life.4 Similarly, in a retrospective study of hospital autopsies by McNeil and colleagues, one incidental pheochromocytoma was detected in every 2031 autopsies (0.05%).20 In another case series of 41 patients with pheochromocytoma-related adrenalectomy, almost 50% of the pheochromocytomas were detected incidentally on imaging studies.21 Although the number of incidental findings are decreasing due to advances in screening techniques, a significant number of patients remain undiagnosed. Multiple cases of diagnosis of pheochromocytoma on autopsy of patients who died of hemodynamic instability (ie, hypertensive crisis, hypotension crisis precipitated by surgery for adrenal or nonadrenal conditions) are reported.3 To the best of our knowledge, there are no case reports published on the diagnosis of pheochromocytoma after adrenalectomy in an asymptomatic patient without intraoperative complications.
The goal of preoperative medical therapy includes BP control, prevention of tachycardia, and volume expansion. The preoperative medications regimens are combined α- and β-adrenergic blockade, calcium channel blockers, and metyrosine. According to clinical practice guidelines of the Endocrine Society in 2014, the α-adrenergic blockers should be started first at least 7 days before surgery to control BP and to cause vasodilation. Early use of α-blockers is required to prevent cardiotoxicity. The β-adrenergic blockers should be started after the adequate α-adrenergic blockade, typically 2 to 3 days before surgery, as early use can cause vasoconstriction in patients with pheochromocytoma. The α-adrenergic blockers include phenoxybenzamine (nonselective long-acting nonspecific α-adrenergic blocking agent), and selective α-1 adrenergic blockers (doxazosin, prazosin, terazosin). The β-adrenergic blocker (ie, propranolol, metoprolol) should be started cautiously with a low dose and slowly titrated to control heart rate. A high sodium diet and increased fluid intake also are recommended 7 to 14 days before surgery. A sudden drop in catecholamines can cause hypotension during an operation. Continuous fluid infusions are given to prevent hypotension.22 Similarly, anesthetic agents also should be modified to prevent cardiotoxic effects. Rocuronium and vecuronium are less cardiotoxic compared with other sympathomimetic muscle relaxants. Short-acting anesthetic agents, such as fentanyl, are preferred. α-blockers are continued throughout the operation. Biochemical testing with fractionated metanephrines is performed about 1 to 2 weeks postoperatively to look for recurrence of the disease.23
Secondary causes of hypertension are suspected in multidrug resistant or sudden early onset of hypertension before aged 40 years. Pheochromocytoma is a rare cause of secondary hypertension, and older adult patients are rarely diagnosed with pheochromocytoma.24 In this report, pheochromocytoma was detected in a 72-year-old hypertensive patient. Therefore, a pheochromocytoma diagnosis should not be ignored in the older adult patient with adrenal mass and hypertension treated with more than one drug. The authors recommend any patient undergoing surgery with adrenal lesion should be considered for the screening of possible pheochromocytoma and prepared preoperatively, especially any patient with renal cell carcinoma with adrenal metastasis.
Conclusions
Asymptomatic pheochromocytoma is an unusual but serious condition, especially for patients undergoing a surgical procedure. An adrenal mass may be ignored in asymptomatic or mildly symptomatic older adult patients and is mostly considered as adrenal metastasis when present with other malignancies. Fortunately, the nephrectomy and adrenalectomy in our case of asymptomatic pheochromocytoma was uneventful, but pheochromocytoma should be ruled out before a surgical procedure, as an absence of medical pretreatment can lead to serious consequences. Therefore, we suggest a more careful screening of pheochromocytoma in patients with an adrenal mass (primary or metastatic) and hypertension treated with multiple antihypertensive drugs, even in older adult patients.
1. Omura M, Saito J, Yamaguchi K, Kakuta Y, Nishikawa T. Prospective study on the prevalence of secondary hypertension among hypertensive patients visiting a general outpatient clinic in Japan. Hypertens Res. 2004;27(3):193-202. doi:10.1291/hypres.27.193
2. Stein PP, Black HR. A simplified diagnostic approach to pheochromocytoma: a review of the literature and report of one institution’s experience. Medicine (Baltimore). 1991;70(1):46-66. doi:10.1097/00005792-199101000-00004
3. Beard CM, Sheps SG, Kurland LT, Carney JA, Lie JT. Occurrence of pheochromocytoma in Rochester, Minnesota, 1950 through 1979. Mayo Clin Proc. 1983;58(12):802-804.
4. Sutton MG, Sheps SG, Lie JT. Prevalence of clinically unsuspected pheochromocytoma: review of a 50-year autopsy series. Mayo Clin Proc. 1981;56(6):354-360.
5. Manger WM, Gifford RW Jr. Pheochromocytoma. J Clin Hypertens (Greenwich). 2002;4(1):62-72. doi:10.1111/j.1524-6175.2002.01452.x
6. Kassim TA, Clarke DD, Mai VQ, Clyde PW, Mohamed Shakir KM. Catecholamine-induced cardiomyopathy. Endocr Pract. 2008;14(9):1137-1149. doi:10.4158/EP.14.9.1137
7. Kudva YC, Young WF, Thompson GB, Grant CS, Van Heerden JA. Adrenal incidentaloma: an important component of the clinical presentation spectrum of benign sporadic adrenal pheochromocytoma. The Endocrinologist. 1999;9(2):77-80. doi:10.1097/00019616-199903000-00002
8. Puar TH, Mok Y, Debajyoti R, Khoo J, How CH, Ng AK. Secondary hypertension in adults. Singapore Med J. 2016;57(5):228-232. doi:10.11622/smedj.2016087
9. Bravo EL. Pheochromocytoma: new concepts and future trends. Kidney Int. 1991;40(3):544-556. doi:10.1038/ki.1991.244
10. Plouin PF, Chatellier G, Fofol I, Corvol P. Tumor recurrence and hypertension persistence after successful pheochromocytoma operation. Hypertension. 1997;29(5):1133-1139. doi:10.1161/01.hyp.29.5.1133
11. Hamidi O, Young WF Jr, Iñiguez-Ariza NM, et al. Malignant pheochromocytoma and paraganglioma: 272 patients over 55 years. J Clin Endocrinol Metab. 2017;102(9):3296-3305. doi:10.1210/jc.2017-00992
12. Kenny L, Rizzo V, Trevis J, Assimakopoulou E, Timon D. The unexpected diagnosis of phaeochromocytoma in the anaesthetic room. Ann Card Anaesth. 2018;21(3):307-310. doi:10.4103/aca.ACA_206_17
13. Johnston PC, Silversides JA, Wallace H, et al. Phaeochromocytoma crisis: two cases of undiagnosed phaeochromocytoma presenting after elective nonrelated surgical procedures. Case Rep Anesthesiol. 2013;2013:514714. doi:10.1155/2013/514714
14. Shen SJ, Cheng HM, Chiu AW, Chou CW, Chen JY. Perioperative hypertensive crisis in clinically silent pheochromocytomas: report of four cases. Chang Gung Med J. 2005;28(1):44-50.
15. Lo CY, Lam KY, Wat MS, Lam KS. Adrenal pheochromocytoma remains a frequently overlooked diagnosis. Am J Surg. 2000;179(3):212-215. doi:10.1016/s0002-9610(00)00296-8
16. Myklejord DJ. Undiagnosed pheochromocytoma: the anesthesiologist nightmare. Clin Med Res. 2004;2(1):59-62. doi:10.3121/cmr.2.1.59
17. Stumvoll M, Radjaipour M, Seif F. Diagnostic considerations in pheochromocytoma and chronic hemodialysis: case report and review of the literature. Am J Nephrol. 1995;15(2):147-151. doi:10.1159/000168820
18. Morioka M, Yuihama S, Nakajima T, et al. Incidentally discovered pheochromocytoma in long-term hemodialysis patients. Int J Urol. 2002;9(12):700-703. doi:10.1046/j.1442-2042.2002.00553.x
19. ˇCtvrtlík F, Koranda P, Schovánek J, Škarda J, Hartmann I, Tüdös Z. Current diagnostic imaging of pheochromocytomas and implications for therapeutic strategy. Exp Ther Med. 2018;15(4):3151-3160. doi:10.3892/etm.2018.5871
20. McNeil AR, Blok BH, Koelmeyer TD, Burke MP, Hilton JM. Phaeochromocytomas discovered during coronial autopsies in Sydney, Melbourne and Auckland. Aust N Z J Med. 2000;30(6):648-652. doi:10.1111/j.1445-5994.2000.tb04358.x
21. Baguet JP, Hammer L, Mazzuco TL, et al. Circumstances of discovery of phaeochromocytoma: a retrospective study of 41 consecutive patients. Eur J Endocrinol. 2004;150(5):681-686. doi:10.1530/eje.0.1500681
22. Lenders JW, Duh QY, Eisenhofer G, et al. Pheochromocytoma and paraganglioma: an endocrine society clinical practice guideline. J Clin Endocrinol Metab. 2014;99(6):1915-1942. doi:10.1210/jc.2014-1498
23. Dortzbach K, Gainsburg DM, Frost EA. Variants of pheochromocytoma and their anesthetic implications--a case report and literature review. Middle East J Anaesthesiol. 2010;20(6):897-905.
24. Januszewicz W, Chodakowska J, Styczy´nski G. Secondary hypertension in the elderly. J Hum Hypertens. 1998;12(9):603-606. doi:10.1038/sj.jhh.1000673
Mesothelioma trials: Moving toward improved survival
Although mesothelioma continues to be a very difficult disease to treat and one with a poor prognosis, new and emerging therapeutic developments hold the promise of extending survival for appropriately selected patients.
Following years of little to no movement, encouraging advances in treatment have been seen on the immunotherapy front. Immune checkpoint inhibitors have demonstrated acceptable safety and promising efficacy in the treatment of unresectable malignant pleural mesothelioma (MPM), including an overall survival advantage over standard-of-care first-line chemotherapy. Beyond systemic therapy, the development of new radiation techniques to complement current, more conservative surgical approaches is likewise encouraging, though further randomized clinical trial data is awaited to determine the potential impact on survival.
Longer survival would be good news for the estimated 3,000 individuals diagnosed with MPM each year in the United States. Overall, the outlook for patients with this rare cancer remains unfavorable, with a 5-year survival rate of about 11%, according to data from the U.S. Surveillance, Epidemiology and End Results (SEER) Program.
One factor underlying that grim survival statistic is a relative lack of investment in the development of drugs specific to rare cancers, as compared to more common malignancies, said Anne S. Tsao, MD, professor and director of the mesothelioma program at the University of Texas MD Anderson Cancer Center in Houston.
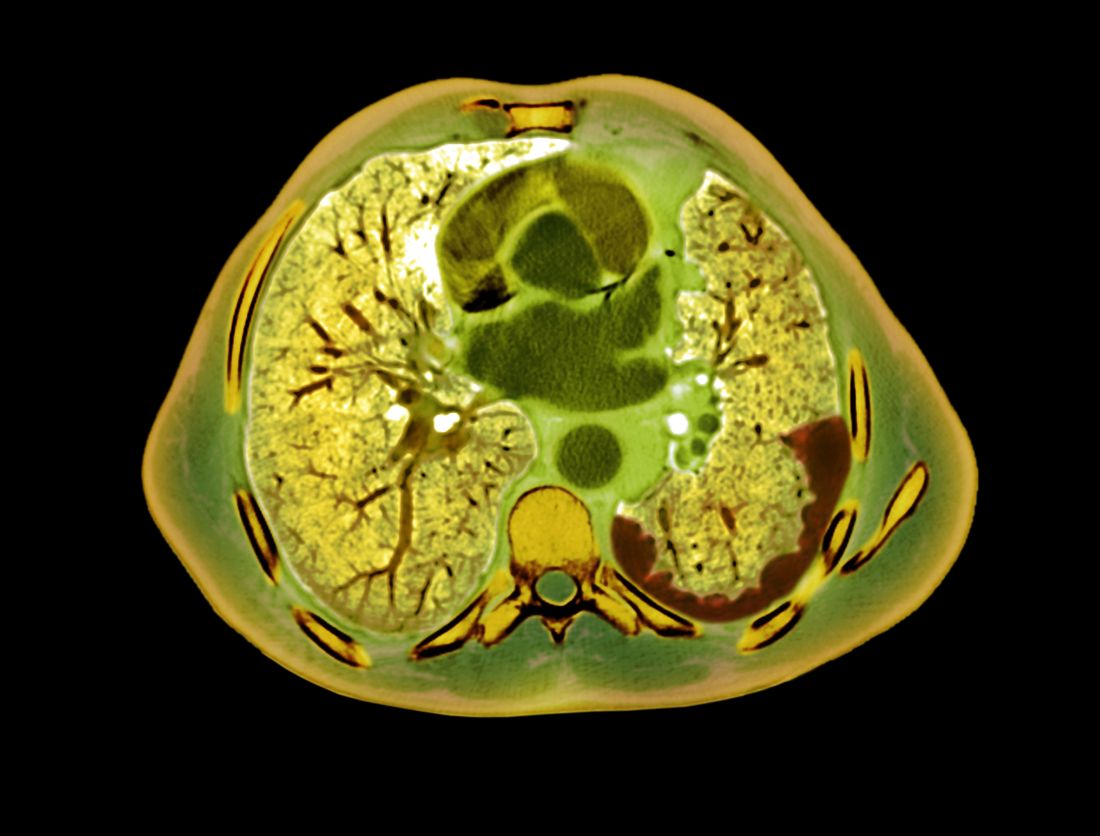
On the plus side, the wave of research for more common cancers has yielded a number of agents, including the immune checkpoint inhibitors such as nivolumab, ipilimumab, pembrolizumab, and durvalumab, that hold promise in rare tumor types as well.
“I think that mesothelioma has benefited from that, because these all are agents that have been developed for other solid tumors that are then brought into mesothelioma,” Dr. Tsao said in an interview. “So there’s always a lag time, but nevertheless, of course we are thrilled that we have additional treatment options for these patients.”
Checkpoint inhibitors
Multiple checkpoint inhibitors have received Food and Drug Administration approval for the treatment of non–small cell lung cancer (NSCLC) over the past few years. Because many mesothelioma doctors also treat NSCLC, bringing those agents into the mesothelioma sphere was not a very difficult jump, Dr. Tsao said.
Checkpoint inhibitors got a foothold in mesothelioma, much like in NSCLC, by demonstrating clear benefit in the salvage setting, according to Dr. Tsao.
Pembrolizumab, nivolumab, and avelumab were evaluated in phase 1b/2 clinical trials and real-world cohorts that demonstrated response rates of around 20%, median progression-free survival of 4 months, and median overall survival (OS) around 12 months in patients with previously treated MPM.
Although results of those early-stage studies had to be interpreted with caution, they nonetheless suggested a slight edge for these checkpoint inhibitors over historical data, according to the authors of a recent article in Cancer Treatment Reviews.1 On the basis of phase 1 and 2 data, current clinical practice guidelines from the National Comprehensive Cancer Network2 list pembrolizumab and the combination of nivolumab and ipilimumab as options for MPM patients who have received previous therapy. Phase 3 trials have also been launched, including PROMISE-meso, which is comparing pembrolizumab to single-agent chemotherapy in advanced, pretreated MPM3, and CONFIRM, which pits nivolumab against placebo in relapsed MPM.4
On the front lines
Encouraging results in previously treated MPM led to the evaluation of checkpoint inhibitors as first-line therapy. Notably, the FDA approved nivolumab given with ipilimumab for the treatment of patients with unresectable MPM in October 2020, making that combination the first immunotherapy regimen to receive an indication in this disease.
The FDA approval was based on prespecified interim analysis of CheckMate 743, a phase 3 study that included 605 patients randomly allocated to nivolumab plus ipilimumab or to placebo.
At the interim analysis, median OS was 18.1 months for nivolumab plus ipilimumab, versus just 14.1 months for placebo (hazard ratio, 0.74; 96.6% confidence interval, 0.60-0.91; P = 0.0020), according to results of the study published in the Lancet.5 The 2-year OS rate was 41% for the immunotherapy combination and 27% for placebo. Grade 3-4 treatment-related adverse events were seen in 30% of the immunotherapy-treated patients and 32% of the chemotherapy-treated patients.
The magnitude of nivolumab-ipilimumab benefit appeared to be largest among patients with non-epithelioid MPM subtypes (sarcomatoid and biphasic), owing to the inferior impact of chemotherapy in these patients, with a median OS of just 8.8 months, according to investigators.
That’s not to say that immunotherapy didn’t work for patients with epithelioid histology. The benefit of nivolumab-ipilimumab was consistent for non-epithelioid and epithelioid patient subsets, with median OS of 18.1 and 18.7 months, respectively, results of subgroup analysis showed.
According to Dr. Tsao, those results reflect the extremely poor prognosis and pressing need for effective therapy early in the course of treatment for patients with non-epithelioid histology.
“You have to get the most effective therapy into these patients as quickly as you can,” she explained. “If you can get the more effective treatment and early, then you’ll see a longer-term benefit for them.”
Role of the PD-L1 biomarker
Despite this progress, one key hurdle has been determining the role of the PD-L1 biomarker in mesothelioma. In NSCLC, PD-L1 is often used to determine which patients will benefit from immune checkpoint inhibitors. In mesothelioma, the correlations have been more elusive.
Among patients in the CheckMate 743 study treated with nivolumab plus ipilimumab, OS was not significantly different for those with PD-L1 expression levels of less than 1% and those with 1% or greater, investigators said. Moreover, PD-L1 expression wasn’t a stratification factor in the study.
“When looking at all of the studies, it appears that the checkpoint inhibitors can truly benefit a certain percentage of mesothelioma patients, but we can’t pick them out just yet,” Dr. Tsao said.
“So our recommendation is to offer [checkpoint inhibitor therapy] at some point in their treatment, whether it’s first, second, or third line,” she continued. “They can get some benefit, and even in those if you don’t get a great response, you can still get disease stabilization, which in and of itself can be highly beneficial.”
Future directions
Immune checkpoint inhibitor–based combination regimens and cellular therapy represent promising directions forward in MPM research. There are several notable phase 3 trials of checkpoint inhibitors plus chemotherapy and targeted therapy going forward, plus intriguing data emerging on the potential role of chimeric antigen receptor (CAR) T-cell therapy in this setting.
One phase 3 trial to watch is IND277, which is comparing pembrolizumab plus cisplatin/pemetrexed chemotherapy to cisplatin/pemetrexed alone; that trial has enrolled 520 participants and has an estimated primary completion date in July 2022, according to the ClinicalTrials.gov website. Another is BEAT-Meso, a comparison of atezolizumab plus bevacizumab and chemotherapy against bevacizumab and chemotherapy, which has an estimated enrollment of 400 participants and primary completion date of January 2024. A third trial of interest is DREAM3R, which compares durvalumab plus chemotherapy followed by durvalumab maintenance to standard chemotherapy followed by observation. That study should enroll 480 participants and has an estimated primary completion date of April 2025.
CAR T-cell therapy, while best known for its emerging role in the treatment of hematologic malignancies, may also have a place in mesothelioma therapy one day. In a recently published report, investigators described a first-in-human phase I study of a mesothelin-targeted CAR T-cell therapy given in combination with pembrolizumab. Among 18 MPM patients who received pembrolizumab safely, median OS from time of CAR T-cell infusion was 23.9 months and 1-year OS was 83%, according to investigators.6An OS of nearly 24 months is “very encouraging” and compares favorably with historical results with systemic therapy in this difficult-to-treat disease, said Jacques P. Fontaine, MD, a thoracic surgeon and section head of mesothelioma research and treatment center at Moffitt Cancer Center in Tampa, Fla.
“It’s huge, but you have to take into account that this [OS] is still less than 2 years,” Dr. Fontaine said in an interview. “There’s still a lot of work to be done.”
Radiotherapy making an IMPRINT
Meanwhile, new developments in the multimodality treatment of resectable MPM are progressing and have the potential to extend survival among patients who undergo lung-sparing surgery.
Less aggressive intervention is increasingly the preferred approach to surgery in this patient population. That shift is supported by studies showing that lung-sparing pleurectomy-decortication (P/D) resulted in less morbidity and potentially better survival outcomes than extrapleural pneumonectomy (EPP), according to Andreas Rimner, MD, associate attending physician and director of thoracic radiation oncology research at Memorial Sloan Kettering Cancer Center in New York.
However, it is more challenging to deliver radiotherapy safely in patients who have undergone P/D as compared with patients who have undergone EPP, according to Dr. Rimner.
“When there’s no lung in place [as in EPP], it’s pretty simple – you just treat the entire empty chest to kill any microscopic cells that may still be left behind,” he said in an interview. “But now we have a situation where both lungs are still in place, and they are very radiation sensitive, so that’s not an easy feat.”
Driven by the limitations of conventional radiation, Dr. Rimner and colleagues developed a novel technique known as hemithoracic intensity-modulated pleural radiation therapy (IMPRINT) that allows more precise application of radiotherapy.
In a phase 2 study published in 2016, IMPRINT was found to be safe, with an acceptable rate of radiation pneumonitis (30% grade 2 or 3), according to investigators.7
Subsequent studies have demonstrated encouraging clinical outcomes, including a 20.2-month median OS for IMPRINT versus 12.3 months for conventional adjuvant radiotherapy in a retrospective study of 209 patients who underwent P/D between 1975 and 2015.8 Those findings led to the development of a phase 3 trial known as NRG-LU006 that is evaluating P/D plus chemotherapy with or without adjuvant IMPRINT in an estimated 150 patients. The study has a primary endpoint of OS, and an estimated primary completion date in July 2025, according to ClinicalTrials.gov.
Dr. Rimner said he’s optimistic about the prospects of this study, particularly with recently published results of a phase 3 study in which Italian investigators demonstrated an OS benefit of IMPRINT over palliative radiation in patients with nonmetastatic MPM.9
“That’s more data and rationale that shows there is good reason to believe that we are adding something here with this radiation technique,” said Dr. Rimner.
Dr. Fontaine, the thoracic surgeon and mesothelioma research head at Moffitt Cancer Center, said he’s hoping to see a substantial impact of IMPRINT on disease-free survival (DFS) once results of NRG-LU006 are available.
“I think DFS plays a role that we’ve underestimated over the last few years for sure,” he said.
For a patient with MPM, a short DFS can be anxiety provoking and may have negative impacts on quality of life, even despite a long OS, he explained.
“In terms of your outlook on life, how many times you have to go see a doctor, and how you enjoy life, there’s a big difference between the two,” he said.
Dr. Tsao provided disclosures related to Ariad, AstraZeneca, BMS, Boehringer Ingelheim, Eli Lilly, EMD Serono, Epizyme, Genentech, Huron, Merck, Millennium, Novartis, Polaris, Roche, Seattle Genetics, SELLAS Life Sciences Group, and Takeda. Dr. Fontaine reported no relevant disclosures. Dr. Rimner reported disclosures related to Bristol-Myers Squibb, GE Healthcare, Varian Medical Systems, and Boehringer Ingelheim.
References
1. Parikh K et al. Cancer Treat Rev. 2021 Sept 1;99:102250.
2. National Comprehensive Cancer Network (NCCN) Guidelines. Malignant Pleural Mesothelioma. Version 2.2021, published 2021 Feb 16. Accessed 2021 Aug 30. https://www.nccn.org/professionals/physician_gls/pdf/mpm.pdf
3. Popat S et al. Ann Oncol. 2020;31(12):1734-45.
4. Fennell D et al. Journal of Thoracic Oncology. 2021 Mar 1;16(3):S62.
5. Baas P et al. [published correction appears in Lancet. 2021 Feb 20;397(10275):670]. Lancet. 2021 Jan 30;397(10272):375-86.
6. Adusumilli PS et al. Cancer Discov. 2021 Jul 15;candisc.0407.2021.
7. Rimner A et al. J Clin Oncol. 2016;34(23):2761-8.
8. Shaikh F et al. J Thorac Oncol. 2017;12(6):993-1000.
9. Trovo M et al. Int J Radiat Oncol Biol Phys. 2021;109(5):1368-76.
Although mesothelioma continues to be a very difficult disease to treat and one with a poor prognosis, new and emerging therapeutic developments hold the promise of extending survival for appropriately selected patients.
Following years of little to no movement, encouraging advances in treatment have been seen on the immunotherapy front. Immune checkpoint inhibitors have demonstrated acceptable safety and promising efficacy in the treatment of unresectable malignant pleural mesothelioma (MPM), including an overall survival advantage over standard-of-care first-line chemotherapy. Beyond systemic therapy, the development of new radiation techniques to complement current, more conservative surgical approaches is likewise encouraging, though further randomized clinical trial data is awaited to determine the potential impact on survival.
Longer survival would be good news for the estimated 3,000 individuals diagnosed with MPM each year in the United States. Overall, the outlook for patients with this rare cancer remains unfavorable, with a 5-year survival rate of about 11%, according to data from the U.S. Surveillance, Epidemiology and End Results (SEER) Program.
One factor underlying that grim survival statistic is a relative lack of investment in the development of drugs specific to rare cancers, as compared to more common malignancies, said Anne S. Tsao, MD, professor and director of the mesothelioma program at the University of Texas MD Anderson Cancer Center in Houston.
On the plus side, the wave of research for more common cancers has yielded a number of agents, including the immune checkpoint inhibitors such as nivolumab, ipilimumab, pembrolizumab, and durvalumab, that hold promise in rare tumor types as well.
“I think that mesothelioma has benefited from that, because these all are agents that have been developed for other solid tumors that are then brought into mesothelioma,” Dr. Tsao said in an interview. “So there’s always a lag time, but nevertheless, of course we are thrilled that we have additional treatment options for these patients.”
Checkpoint inhibitors
Multiple checkpoint inhibitors have received Food and Drug Administration approval for the treatment of non–small cell lung cancer (NSCLC) over the past few years. Because many mesothelioma doctors also treat NSCLC, bringing those agents into the mesothelioma sphere was not a very difficult jump, Dr. Tsao said.
Checkpoint inhibitors got a foothold in mesothelioma, much like in NSCLC, by demonstrating clear benefit in the salvage setting, according to Dr. Tsao.
Pembrolizumab, nivolumab, and avelumab were evaluated in phase 1b/2 clinical trials and real-world cohorts that demonstrated response rates of around 20%, median progression-free survival of 4 months, and median overall survival (OS) around 12 months in patients with previously treated MPM.
Although results of those early-stage studies had to be interpreted with caution, they nonetheless suggested a slight edge for these checkpoint inhibitors over historical data, according to the authors of a recent article in Cancer Treatment Reviews.1 On the basis of phase 1 and 2 data, current clinical practice guidelines from the National Comprehensive Cancer Network2 list pembrolizumab and the combination of nivolumab and ipilimumab as options for MPM patients who have received previous therapy. Phase 3 trials have also been launched, including PROMISE-meso, which is comparing pembrolizumab to single-agent chemotherapy in advanced, pretreated MPM3, and CONFIRM, which pits nivolumab against placebo in relapsed MPM.4
On the front lines
Encouraging results in previously treated MPM led to the evaluation of checkpoint inhibitors as first-line therapy. Notably, the FDA approved nivolumab given with ipilimumab for the treatment of patients with unresectable MPM in October 2020, making that combination the first immunotherapy regimen to receive an indication in this disease.
The FDA approval was based on prespecified interim analysis of CheckMate 743, a phase 3 study that included 605 patients randomly allocated to nivolumab plus ipilimumab or to placebo.
At the interim analysis, median OS was 18.1 months for nivolumab plus ipilimumab, versus just 14.1 months for placebo (hazard ratio, 0.74; 96.6% confidence interval, 0.60-0.91; P = 0.0020), according to results of the study published in the Lancet.5 The 2-year OS rate was 41% for the immunotherapy combination and 27% for placebo. Grade 3-4 treatment-related adverse events were seen in 30% of the immunotherapy-treated patients and 32% of the chemotherapy-treated patients.
The magnitude of nivolumab-ipilimumab benefit appeared to be largest among patients with non-epithelioid MPM subtypes (sarcomatoid and biphasic), owing to the inferior impact of chemotherapy in these patients, with a median OS of just 8.8 months, according to investigators.
That’s not to say that immunotherapy didn’t work for patients with epithelioid histology. The benefit of nivolumab-ipilimumab was consistent for non-epithelioid and epithelioid patient subsets, with median OS of 18.1 and 18.7 months, respectively, results of subgroup analysis showed.
According to Dr. Tsao, those results reflect the extremely poor prognosis and pressing need for effective therapy early in the course of treatment for patients with non-epithelioid histology.
“You have to get the most effective therapy into these patients as quickly as you can,” she explained. “If you can get the more effective treatment and early, then you’ll see a longer-term benefit for them.”
Role of the PD-L1 biomarker
Despite this progress, one key hurdle has been determining the role of the PD-L1 biomarker in mesothelioma. In NSCLC, PD-L1 is often used to determine which patients will benefit from immune checkpoint inhibitors. In mesothelioma, the correlations have been more elusive.
Among patients in the CheckMate 743 study treated with nivolumab plus ipilimumab, OS was not significantly different for those with PD-L1 expression levels of less than 1% and those with 1% or greater, investigators said. Moreover, PD-L1 expression wasn’t a stratification factor in the study.
“When looking at all of the studies, it appears that the checkpoint inhibitors can truly benefit a certain percentage of mesothelioma patients, but we can’t pick them out just yet,” Dr. Tsao said.
“So our recommendation is to offer [checkpoint inhibitor therapy] at some point in their treatment, whether it’s first, second, or third line,” she continued. “They can get some benefit, and even in those if you don’t get a great response, you can still get disease stabilization, which in and of itself can be highly beneficial.”
Future directions
Immune checkpoint inhibitor–based combination regimens and cellular therapy represent promising directions forward in MPM research. There are several notable phase 3 trials of checkpoint inhibitors plus chemotherapy and targeted therapy going forward, plus intriguing data emerging on the potential role of chimeric antigen receptor (CAR) T-cell therapy in this setting.
One phase 3 trial to watch is IND277, which is comparing pembrolizumab plus cisplatin/pemetrexed chemotherapy to cisplatin/pemetrexed alone; that trial has enrolled 520 participants and has an estimated primary completion date in July 2022, according to the ClinicalTrials.gov website. Another is BEAT-Meso, a comparison of atezolizumab plus bevacizumab and chemotherapy against bevacizumab and chemotherapy, which has an estimated enrollment of 400 participants and primary completion date of January 2024. A third trial of interest is DREAM3R, which compares durvalumab plus chemotherapy followed by durvalumab maintenance to standard chemotherapy followed by observation. That study should enroll 480 participants and has an estimated primary completion date of April 2025.
CAR T-cell therapy, while best known for its emerging role in the treatment of hematologic malignancies, may also have a place in mesothelioma therapy one day. In a recently published report, investigators described a first-in-human phase I study of a mesothelin-targeted CAR T-cell therapy given in combination with pembrolizumab. Among 18 MPM patients who received pembrolizumab safely, median OS from time of CAR T-cell infusion was 23.9 months and 1-year OS was 83%, according to investigators.6An OS of nearly 24 months is “very encouraging” and compares favorably with historical results with systemic therapy in this difficult-to-treat disease, said Jacques P. Fontaine, MD, a thoracic surgeon and section head of mesothelioma research and treatment center at Moffitt Cancer Center in Tampa, Fla.
“It’s huge, but you have to take into account that this [OS] is still less than 2 years,” Dr. Fontaine said in an interview. “There’s still a lot of work to be done.”
Radiotherapy making an IMPRINT
Meanwhile, new developments in the multimodality treatment of resectable MPM are progressing and have the potential to extend survival among patients who undergo lung-sparing surgery.
Less aggressive intervention is increasingly the preferred approach to surgery in this patient population. That shift is supported by studies showing that lung-sparing pleurectomy-decortication (P/D) resulted in less morbidity and potentially better survival outcomes than extrapleural pneumonectomy (EPP), according to Andreas Rimner, MD, associate attending physician and director of thoracic radiation oncology research at Memorial Sloan Kettering Cancer Center in New York.
However, it is more challenging to deliver radiotherapy safely in patients who have undergone P/D as compared with patients who have undergone EPP, according to Dr. Rimner.
“When there’s no lung in place [as in EPP], it’s pretty simple – you just treat the entire empty chest to kill any microscopic cells that may still be left behind,” he said in an interview. “But now we have a situation where both lungs are still in place, and they are very radiation sensitive, so that’s not an easy feat.”
Driven by the limitations of conventional radiation, Dr. Rimner and colleagues developed a novel technique known as hemithoracic intensity-modulated pleural radiation therapy (IMPRINT) that allows more precise application of radiotherapy.
In a phase 2 study published in 2016, IMPRINT was found to be safe, with an acceptable rate of radiation pneumonitis (30% grade 2 or 3), according to investigators.7
Subsequent studies have demonstrated encouraging clinical outcomes, including a 20.2-month median OS for IMPRINT versus 12.3 months for conventional adjuvant radiotherapy in a retrospective study of 209 patients who underwent P/D between 1975 and 2015.8 Those findings led to the development of a phase 3 trial known as NRG-LU006 that is evaluating P/D plus chemotherapy with or without adjuvant IMPRINT in an estimated 150 patients. The study has a primary endpoint of OS, and an estimated primary completion date in July 2025, according to ClinicalTrials.gov.
Dr. Rimner said he’s optimistic about the prospects of this study, particularly with recently published results of a phase 3 study in which Italian investigators demonstrated an OS benefit of IMPRINT over palliative radiation in patients with nonmetastatic MPM.9
“That’s more data and rationale that shows there is good reason to believe that we are adding something here with this radiation technique,” said Dr. Rimner.
Dr. Fontaine, the thoracic surgeon and mesothelioma research head at Moffitt Cancer Center, said he’s hoping to see a substantial impact of IMPRINT on disease-free survival (DFS) once results of NRG-LU006 are available.
“I think DFS plays a role that we’ve underestimated over the last few years for sure,” he said.
For a patient with MPM, a short DFS can be anxiety provoking and may have negative impacts on quality of life, even despite a long OS, he explained.
“In terms of your outlook on life, how many times you have to go see a doctor, and how you enjoy life, there’s a big difference between the two,” he said.
Dr. Tsao provided disclosures related to Ariad, AstraZeneca, BMS, Boehringer Ingelheim, Eli Lilly, EMD Serono, Epizyme, Genentech, Huron, Merck, Millennium, Novartis, Polaris, Roche, Seattle Genetics, SELLAS Life Sciences Group, and Takeda. Dr. Fontaine reported no relevant disclosures. Dr. Rimner reported disclosures related to Bristol-Myers Squibb, GE Healthcare, Varian Medical Systems, and Boehringer Ingelheim.
References
1. Parikh K et al. Cancer Treat Rev. 2021 Sept 1;99:102250.
2. National Comprehensive Cancer Network (NCCN) Guidelines. Malignant Pleural Mesothelioma. Version 2.2021, published 2021 Feb 16. Accessed 2021 Aug 30. https://www.nccn.org/professionals/physician_gls/pdf/mpm.pdf
3. Popat S et al. Ann Oncol. 2020;31(12):1734-45.
4. Fennell D et al. Journal of Thoracic Oncology. 2021 Mar 1;16(3):S62.
5. Baas P et al. [published correction appears in Lancet. 2021 Feb 20;397(10275):670]. Lancet. 2021 Jan 30;397(10272):375-86.
6. Adusumilli PS et al. Cancer Discov. 2021 Jul 15;candisc.0407.2021.
7. Rimner A et al. J Clin Oncol. 2016;34(23):2761-8.
8. Shaikh F et al. J Thorac Oncol. 2017;12(6):993-1000.
9. Trovo M et al. Int J Radiat Oncol Biol Phys. 2021;109(5):1368-76.
Metastatic uveal melanoma: New drugs in pipeline, but prognoses remain grim
No one’s quite sure what causes uveal melanoma (UM). Unlike skin cancers, UM doesn’t seem to have any link to exposure to ultraviolet rays, although it’s most likely to strike people who are vulnerable to sun damage, like Caucasians and people with lighter eyes and lighter skin (but not lighter hair), and an inability to tan. Up to half of those affected by the disease will recover after treatment. In the other half, the cancer spreads from the eye – typically to the liver – and patient prognoses remain extremely poor despite extensive efforts to develop effective treatments.
“The median survival is probably about 2 years, and there are a number of papers out there that talk about life expectancy as short as 6 months,” said Marlana Orloff, MD, an associate professor of medical oncology at Thomas Jefferson University Hospital, Philadelphia.
But there is hope on the horizon, even if it’s not as near as patients would prefer. “Just over the last 5-10 years, we’ve gained a lot more knowledge about this disease as we try to understand how distinctly different it is, how mutations drive it, and how we can approach it using immunotherapy,” Dr. Orloff said. “I hope we’ll come up with better options for prolonging survival.”
Tracking uveal melanoma’s dangerous course
All melanomas, including UM, strike the melanocytes (cells) that provide pigment. According to a 2017 report1 in the journal Eye, “uveal melanoma is the most common primary intraocular tumor in adults with a mean age-adjusted incidence of 5.1 cases per million per year. Tumors are located either in the iris (4%), ciliary body (6%), or choroid (90%) . … As in many other cancer indications, both early detection and early treatment could be critical for a positive long-term survival outcome in uveal melanoma.”
The median age of diagnosis is 59-62 years, the report says, although non-Whites seem to develop the disease earlier.
The vast majority of patients receive treatment by plaque brachytherapy via radioactive seeds. “It’s like brachytherapy of the prostate,” said medical oncologist Rino S. Seedor, MD, of Thomas Jefferson University Hospital. “If the eye tumor is too big or invasive, they’ll cut out the eye.”
As many as 50% of patients will develop metastasis, sometimes within 2-3 years in those who have large tumors and high genetic risk, said ophthalmologist and radiation oncologist Miguel Materin, MD, of Duke University Eye Center, Durham, N.C. “There’s probably micrometastasis early in the development of the tumor,” he said. “The metastasis might develop before we or the patient knows there’s a tumor.”
Some physicians question the value of prognostic testing in patients who don’t yet show signs of metastasis, Dr. Materin said, because the findings can be grim.
Unlike his more cautious colleagues, Dr. Materin prefers to pursue testing, he said. Most patients agree to it. “It’s up to them to decide if they want to know if they have a bad prognosis,” he said, and the findings can be helpful to physicians because they provide useful genetic information about tumors.
Monitoring for liver metastasis is key
UM metastases are most likely to strike the liver, and prognoses are especially poor when they do. According to a 2019 analysis of 175 patients with metastatic UM in the Netherlands, “the presence of liver metastases is negatively associated with survival (hazard ratio = 2.09; 95% confidence interval, 1.07-4.08). … In 154 (88%) patients, the liver was affected, and only 3 patients were reported to have brain metastases.”2
As a result, physicians recommend close monitoring in patients with UM. Thomas Jefferson University’s Dr. Orloff uses tumor stages and genetic risk profiles to guide surveillance. “Very large tumors and/or monosomy 3 and 8q amplification or a Class 2 gene signature would suggest a higher-risk tumor,” she said. “For these patients we recommend MRI of the abdomen every 3 months for 2 years, CT of the chest every 6 months for 2 years, labs every 3 months for 2 years, then MRI every 6 months until year 5 with chest imaging yearly, then at 5 years everything yearly. For lower- or intermediate-risk patients we recommend MRI of the abdomen every 6 months for 5 years, chest imaging yearly, labs every 6 months, then at 5 years everything yearly.”
In the United States, patients with metastatic disease are typically sent to referral centers at institutions such as Duke, Yale (New Haven, Conn.), and Thomas Jefferson universities.
Metastasis treatments offer limited relief
There are no FDA-approved treatments for metastatic MU, and the treatments that physicians do use don’t seem to have much of an effect on life span. A 2019 study examined 73 patients with MU metastasis to the liver who were treated from 2004 to 2011 and 2012 to 2016. Among both cohorts, those who had no treatment lived nearly as long (median of 15 months) as those treated with local therapy (median of 18.7 months). Median survival for the entire population was 15 months (95% CI: 11–18 months). There was no statistically significant difference between the periods.3
However, there are signs that a move away from first-line chemotherapy in recent decades has led to longer life spans. Dr. Seedor led a 2018 study4 that compared two cohorts of MU patients with liver metastasis at her university: 98 patients from 1971 to 1993 (81% received systemic chemotherapy as their initial therapy) and 574 from 2000 to 2017 (they received various liver-directed initial treatments such as chemoembolization, drug-eluting beads, immunoembolization, and radioembolization).
The patients in the second group lived longer after treatment of initial UM than the first group (5.1 years vs. 3.3 years, P < .001) and after the development of liver metastasis (16.4 months vs. 4.8 months, P < .001). A 2020 follow-up study reported similar findings and noted that a “combination of liver-directed and newly developed systemic treatments may further improve the survival of these patients.”5
At Thomas Jefferson Medical Center, liver-directed therapy includes radioembolization, chemomobilization, and microwave ablation, Dr. Seedor said. “Which one we choose is based on how big the tumors are.”
Treatments in development could make advances
Physicians are working on several fronts to develop new treatments. A 2021 review of clinical trials found numerous trials regarding checkpoint inhibition, one devoted to a vaccine, and several involving checkpoint inhibitors. The review author notes that “the low mutational burden and poor immunogenicity of UM tumors may underlie poor responses and resistance to [immune checkpoint inhibitors] alone.”6
Earlier this year, grant-funded researchers reported encouraging news on the G protein inhibitor front. Their study found that FR900359, a selective inhibitor of the Gq/11/14 subfamily of heterotrimeric G proteins, could hold promise for “treating UM and potentially other diseases caused by constitutively active Gq/11.”7
In another 2021 study, this one with no reported funding, researchers explored the tumor microenvironment of UM and reported that their findings “provided a robust gene-based prognostic signature for predicting prognosis of UM patients and proposed a potential targeted therapy for preventing UM metastasis.”8
Experimental drug may add months of life
Physicians often recommend that patients take part in clinical trials. Earlier this year, researchers reported that a drug called tebentafusp – a bispecific fusion protein – slightly boosted metastatic UM survival in an open-label, phase 3 clinical trial when used as a first-line treatment. Patients were randomly assigned to tebentafusp, 1 of 2 immunotherapy drugs (ipilimumab or pembrolizumab), or the chemotherapy drug dacarbazine. Those who took tebentafusp vs. the other options lived longer with an estimated 1-year overall rate of 73.2% (95% CI: 66.3-78.9) vs. 57.5% (95% CI: 47.0-66.6), respectively. Fewer than 4% of those on tebentafusp needed to stop it because of adverse effects, and no treatment-related deaths occurred.9
Dr. Orloff is one of the coauthors of this study.
The National Cancer Institute provided more details about the industry-funded research and noted that median overall survival for patients who received the drug was 21.7 months vs. 16 months for the control group.
Not every patient is eligible for this treatment, however. A coauthor told the American Association for Cancer Research that “the major limitation of tebentafusp is that it can only be used in patients who have a specific HLA [human leukocyte antigen] type.” Patients must be HLA-A*0201-positive.10
In August 2021, the FDA granted priority review for tebentafusp.11 And in September 2021, a company called TriSalus announced the first patient enrollment in a “clinical study evaluating the administration of SD-101, an investigational toll-like receptor 9 (TLR9) agonist in adults with metastatic uveal melanoma.”12
According to the company, the research “is designed to evaluate the intravascular administration of SD-101 into uveal melanoma liver metastasis lesions in combination with checkpoint inhibitors using the novel Pressure-Enabled Drug Delivery (PEDD) approach.” This strategy is “designed to overcome the inherent intratumoral pressure of solid tumors,” the company said.
Dr. Materin serves on a scientific advisory board for Castle Biosciences. Dr. Orloff is a consultant for Immunocore, which funded the tebentafusp study, and serves on a scientific advisory board for TriSalus. Dr. Seedor reports no disclosures.
References
1.Kaliki S and Shields C. Eye. 2017 Feb;31:241-57.
2.Jochems A et al. Cancers. 2019 July;11(7):1007.
3.Xu LT et al. Ocul Oncol Pathol. 2019;5:323-32.
4.Seedor RS et al. J Clin Oncol. 2018 May;36(15_suppl):9592.
5.Seedor RS et al. Cancers (Basel). 2020 Jan 1;12(1):117.
6.Orloff M. Ocul Oncol Pathol. 2021 July;7:168-76.
7.Onken MD et al. J Biol Chem. 2021;296:100403.
8.Lei S and Zhang Y. Int Immunopharmacol. 2021 July;96:107816.
9.Piperno-Neumann S et al. Proceedings of the 112th Annual Meeting of the American Association for Cancer Research; 2021 April 10-15. Philadelphia (Pa.): AACR; 2021. Abstract nr 5133.
10.National Cancer Institute: https://www.cancer.gov/news-events/cancer-currents-blog/2021/tebentafusp-uveal-melanoma-improves-survival
11.Immunocore press release: https://ir.immunocore.com/news-releases/news-release-details/immunocore-announces-us-food-and-drug-administration-and
12.Trisalus announcement: https://finance.yahoo.com/news/trisalus-life-sciences-announces-first-130000215.html?guccounter=1
Case report: ECT for delirious mania
Delirious mania is a diagnostic term used in variety of settings, including the emergency department and inpatient psychiatry, but it does not have formal criteria established in the DSM-5. Delirious mania was first described in the 1800s and was referred to as “Bell’s Mania.”

As the late Max Fink, MD, wrote in the journal Bipolar Disorders (2002 Feb 23. doi: 10.1034/j.1399-561.1999.10112.x), delirious mania is considered to be a syndrome of the acute onset of the excitement, grandiosity, emotional lability, delusions, and insomnia characteristic of mania, and the disorientation and altered consciousness characteristic of delirium.

Such patients can be considered as having a component of bipolar I disorder, comprising mania with psychotic features. Delirious mania is associated with higher rates of morbidity and mortality, and demonstrates limited response to conventional treatment guidelines. Therefore, early detection and decisive treatment are imperative. The concurrence of delirium and mania is not unusual, yet currently there are no universal accepted treatment guidelines for delirious mania (BMC Psychiatry. 2012 Jun 21. doi: 10.1186/1471-244X-12-65). The purpose of this case report is to inspire and support community psychiatric clinicians in managing such complex cases and to improve behavioral health care outcomes. To protect our patient’s identity, we changed several key identifiers.

The treatment plan emerges
This case is of a middle-aged man with an established diagnosis of bipolar disorder. He was referred to the ED because of worsening manic symptoms marked by mood lability, pressured speech, grandiose delusions, tangential thought processes, poor insight, and impaired sleep.
Laboratory studies in the ED revealed hyponatremia and serum sodium of 126meq/l (ref. range: 135-146). The patient’s toxicology screen was positive for benzodiazepines. He was stabilized on the medical floor and then transitioned to inpatient psychiatry.
Before his admission to psychiatry, the patient’s medications were alprazolam 1 mg at bed time, bupropion 100 mg twice daily, loxapine 25 mg morning and 50 mg at bed time, olanzapine 20 mg at bedtime and 5 mg twice daily, risperidone 2 mg twice daily and oxcarbazepine 900 mg twice daily.
The bupropion was discontinued because of manic behavior, and the patient’s dose of oxcarbazepine was lowered from 900 mg twice daily to 450 mg twice daily because of hyponatremia. Our team continued to administer risperidone, olanzapine, loxapine, and alprazolam to the patient. However, he was agitated and disorganized on the psychiatry floor. In addition, we noticed that the patient exhibited confusion, disorientation, an inability to connect with reality, and periods of profound agitation.
The patient was frequently restrained physically, and medications were administered to him for safety and containment. The use of benzodiazepines and anticholinergics was minimized. However, we noticed that the patient acted paranoid, disinhibited, and combative, and he became difficult to restrain. He seemed to have a high pain tolerance, responded to internal stimuli, and began hallucinating and displaying aggressive behavior toward staff persons.
It became apparent that the patient’s circadian rhythm had been altered. He slept for only a couple of hours during the day. During the course of treatment, in one incidence, the patient became agitated and charged at a nurse. Subsequently, the patient hit his head on a wall and fell – suffering a head strike and lacerations.
The team conducted investigations, including labs and neuroimaging, to make sure that the patient was OK. His CT head scan proved unremarkable. Liver function tests revealed mild transaminitis. His TSH, folate, B12, and B1 levels were normal.
We then placed the patient in a single room with continuous behavior monitoring. His recovery seemed to take a long time with trials of different antipsychotic medications, including olanzapine, loxapine, risperidone, and paliperidone. Because of his poor response to medications, the team considered using electroconvulsive therapy (ECT).
However, the patient was unable to give informed consent for ECT because of his impaired mental status. At this point, our team submitted a substitute treatment plan that included ECT to the court for approval, and the court approved our plan.
After receiving approximately four bilateral ECT procedures three times a week, the patient’s condition started to improve gradually. He received total of 11 procedures.
Our patient became alert to time, place, and person, and his circadian rhythm normalized. Soon, his delirium cleared, and he demonstrated marked improvement in both insight into his illness and behavioral control. His grandiose delusions were still present, but he was easily redirectable. In addition, our patient demonstrated improved reality testing. He was able to be discharged home following medication adjustments and with community supports within a few short weeks of receiving ECT.
As Bo-Shyan Lee, MD, and associates reported (BMC Psychiatry. 2012 Jun 21;12:65. doi: 10.1186/1471-244X-12-65), delirious mania is closely related to catatonia. Although there are different definitions for delirium and catatonia, even the most lethal form of catatonia meets the criteria for delirium. ECT is a well established first-line treatment for catatonia. This tool has been shown to be highly effective in the treatment of delirious mania. Delirious mania can be life-threatening and should be managed aggressively. The most common causes of death are heart failure from arrhythmias, cardiac arrest, and respiratory failure. ECT is a safe treatment, and, as Dr. Fink argued, the mortality rate is even less than that associated with normal pregnancies (World J Biol Psychiatry. 2001 Jan;2[1]:1-8). In light of the safety and effectiveness of ECT, we think the tool should be considered not only in university hospital settings but as an early intervention in community settings. This case warrants further research in exploring hyperactive delirium and delirious mania.
Dr. Lamba is BR-2 unit medical director at BayRidge Hospital in Lynn, Mass. Ms. Kennedy is an attending clinician at BayRidge. Dr. Vu is medical director at BayRidge. He also serves as associate chief of psychiatry at Beverly (Mass.) Hospital and at Addison Gilbert Hospital in Gloucester, Mass. Dr. Lamba, Ms. Kennedy, and Dr. Vu have no disclosures.
Delirious mania is a diagnostic term used in variety of settings, including the emergency department and inpatient psychiatry, but it does not have formal criteria established in the DSM-5. Delirious mania was first described in the 1800s and was referred to as “Bell’s Mania.”
As the late Max Fink, MD, wrote in the journal Bipolar Disorders (2002 Feb 23. doi: 10.1034/j.1399-561.1999.10112.x), delirious mania is considered to be a syndrome of the acute onset of the excitement, grandiosity, emotional lability, delusions, and insomnia characteristic of mania, and the disorientation and altered consciousness characteristic of delirium.
Such patients can be considered as having a component of bipolar I disorder, comprising mania with psychotic features. Delirious mania is associated with higher rates of morbidity and mortality, and demonstrates limited response to conventional treatment guidelines. Therefore, early detection and decisive treatment are imperative. The concurrence of delirium and mania is not unusual, yet currently there are no universal accepted treatment guidelines for delirious mania (BMC Psychiatry. 2012 Jun 21. doi: 10.1186/1471-244X-12-65). The purpose of this case report is to inspire and support community psychiatric clinicians in managing such complex cases and to improve behavioral health care outcomes. To protect our patient’s identity, we changed several key identifiers.
The treatment plan emerges
This case is of a middle-aged man with an established diagnosis of bipolar disorder. He was referred to the ED because of worsening manic symptoms marked by mood lability, pressured speech, grandiose delusions, tangential thought processes, poor insight, and impaired sleep.
Laboratory studies in the ED revealed hyponatremia and serum sodium of 126meq/l (ref. range: 135-146). The patient’s toxicology screen was positive for benzodiazepines. He was stabilized on the medical floor and then transitioned to inpatient psychiatry.
Before his admission to psychiatry, the patient’s medications were alprazolam 1 mg at bed time, bupropion 100 mg twice daily, loxapine 25 mg morning and 50 mg at bed time, olanzapine 20 mg at bedtime and 5 mg twice daily, risperidone 2 mg twice daily and oxcarbazepine 900 mg twice daily.
The bupropion was discontinued because of manic behavior, and the patient’s dose of oxcarbazepine was lowered from 900 mg twice daily to 450 mg twice daily because of hyponatremia. Our team continued to administer risperidone, olanzapine, loxapine, and alprazolam to the patient. However, he was agitated and disorganized on the psychiatry floor. In addition, we noticed that the patient exhibited confusion, disorientation, an inability to connect with reality, and periods of profound agitation.
The patient was frequently restrained physically, and medications were administered to him for safety and containment. The use of benzodiazepines and anticholinergics was minimized. However, we noticed that the patient acted paranoid, disinhibited, and combative, and he became difficult to restrain. He seemed to have a high pain tolerance, responded to internal stimuli, and began hallucinating and displaying aggressive behavior toward staff persons.
It became apparent that the patient’s circadian rhythm had been altered. He slept for only a couple of hours during the day. During the course of treatment, in one incidence, the patient became agitated and charged at a nurse. Subsequently, the patient hit his head on a wall and fell – suffering a head strike and lacerations.
The team conducted investigations, including labs and neuroimaging, to make sure that the patient was OK. His CT head scan proved unremarkable. Liver function tests revealed mild transaminitis. His TSH, folate, B12, and B1 levels were normal.
We then placed the patient in a single room with continuous behavior monitoring. His recovery seemed to take a long time with trials of different antipsychotic medications, including olanzapine, loxapine, risperidone, and paliperidone. Because of his poor response to medications, the team considered using electroconvulsive therapy (ECT).
However, the patient was unable to give informed consent for ECT because of his impaired mental status. At this point, our team submitted a substitute treatment plan that included ECT to the court for approval, and the court approved our plan.
After receiving approximately four bilateral ECT procedures three times a week, the patient’s condition started to improve gradually. He received total of 11 procedures.
Our patient became alert to time, place, and person, and his circadian rhythm normalized. Soon, his delirium cleared, and he demonstrated marked improvement in both insight into his illness and behavioral control. His grandiose delusions were still present, but he was easily redirectable. In addition, our patient demonstrated improved reality testing. He was able to be discharged home following medication adjustments and with community supports within a few short weeks of receiving ECT.
As Bo-Shyan Lee, MD, and associates reported (BMC Psychiatry. 2012 Jun 21;12:65. doi: 10.1186/1471-244X-12-65), delirious mania is closely related to catatonia. Although there are different definitions for delirium and catatonia, even the most lethal form of catatonia meets the criteria for delirium. ECT is a well established first-line treatment for catatonia. This tool has been shown to be highly effective in the treatment of delirious mania. Delirious mania can be life-threatening and should be managed aggressively. The most common causes of death are heart failure from arrhythmias, cardiac arrest, and respiratory failure. ECT is a safe treatment, and, as Dr. Fink argued, the mortality rate is even less than that associated with normal pregnancies (World J Biol Psychiatry. 2001 Jan;2[1]:1-8). In light of the safety and effectiveness of ECT, we think the tool should be considered not only in university hospital settings but as an early intervention in community settings. This case warrants further research in exploring hyperactive delirium and delirious mania.
Dr. Lamba is BR-2 unit medical director at BayRidge Hospital in Lynn, Mass. Ms. Kennedy is an attending clinician at BayRidge. Dr. Vu is medical director at BayRidge. He also serves as associate chief of psychiatry at Beverly (Mass.) Hospital and at Addison Gilbert Hospital in Gloucester, Mass. Dr. Lamba, Ms. Kennedy, and Dr. Vu have no disclosures.
Spice in breast milk could shape taste preferences later
They say you are what you eat, but scientists have long wondered whether breastfeeding babies are what their mothers eat, too. Their question: How much of a nursing mother’s diet eventually plays a role in a child’s food preferences later in life?
The aroma, taste, and makeup of breast milk change from day to day, based mostly on the mother’s diet. But previous research has already shown that the foods a mother eats do not directly translate into the same smells and tastes of that food in breast milk. Some substances from the mother’s diet enter her breast milk, some don’t, and even ones that do may have a different scent or flavor than what the mother experiences.
But a new study suggests that the active ingredient in black pepper makes its way into breast milk and may help the infant develop a tolerance to pepper later. The researchers published their findings in the journal Molecular Nutrition & Food Research.
Pinch of pepper
The study authors thought that maybe some food preferences could result from sensory programming that occurs through breast milk in the first few months of life. Though past studies have looked at which odor-producing substances transfer into breast milk, not many have explored specific substances that give food its distinctive flavor, or even what makes up the taste of breast milk. So they decided to investigate what happens when a mother consumes a meal containing three specific compounds: those that give pepper, chili, and ginger their particularly pungent flavors.
The researchers recruited 18 healthy, nonsmoking, nursing mothers who were producing more than enough milk for their baby’s needs. Their breastfeeding children ranged in age from 8 weeks to 1 year old. The women all ate a curry dish after having spent 2 days avoiding onion, garlic, and the spices in the curry. Then they provided pumped breast milk samples at 1, 2, and 3 hours after eating the curry.
Within an hour of the women eating the curry, the scientists were able to detect piperine, the compound that gives black pepper its bite, in the mothers’ breast milk. They did not find the compounds from ginger, chili, or curcumin – the main active ingredient in turmeric – in the breast milk. The piperine remained there for several hours, but there wasn’t enough for an adult to be able to taste it. It wasn’t possible to reliably tell whether the infants could consciously detect the flavor, but the researchers don’t think it’s likely they did.
But the scientists do suggest it’s possible that the piperine in breast milk could regularly activate a protein that detects pungent or potentially harmful substances. This is the same protein that produces the sensation of heat when eating a spicy food. If the piperine frequently activates that protein in a nursing baby at levels too low for the baby to notice, it may increase the baby’s tolerance for similar spicy substances later in life.
Ultimately, the findings suggest that .
A version of this story first appeared on WebMD.com.
FROM MOLECULAR NUTRITION & FOOD RESEARCH
Children and COVID: Weekly cases resume their climb
After a brief lull in activity, weekly COVID-19 cases in children returned to the upward trend that began in early November, based on data from the American Academy of Pediatrics and the Children’s Hospital Association.
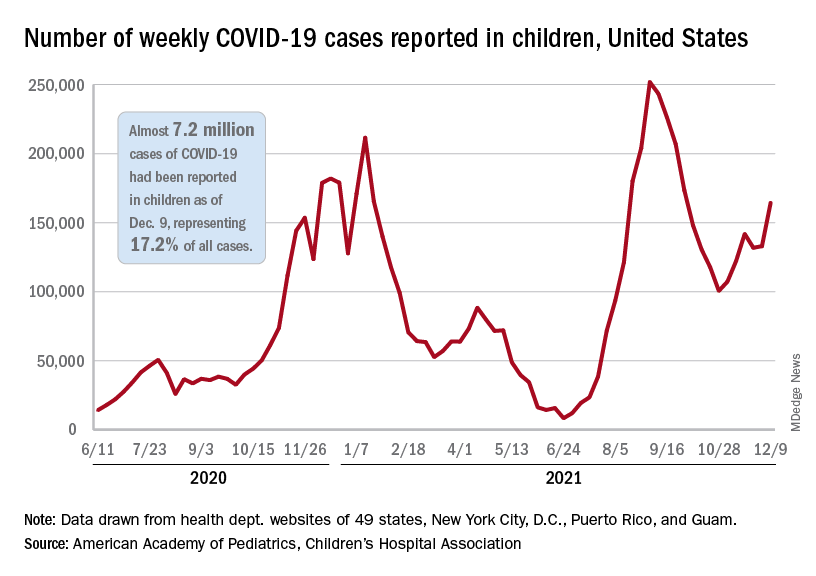
according to the Centers for Disease Control and Prevention.
New COVID-19 cases were up by 23.5% for the week of Dec. 3-9, after a 2-week period that saw a drop and then just a slight increase, the AAP and CHA said in their latest weekly COVID report. There were 164,000 new cases from Dec. 3 to Dec. 9 in 46 states (Alabama, Nebraska, and Texas stopped reporting over the summer of 2021 and New York has never reported by age), the District of Columbia, New York City, Puerto Rico, and Guam.
The increase occurred across all four regions of the country, but the largest share came in the Midwest, with over 65,000 new cases, followed by the West (just over 35,000), the Northeast (just under 35,000), and the South (close to 28,000), the AAP/CHA data show.
The 7.2 million cumulative cases in children as of Dec. 9 represent 17.2% of all cases reported in the United States since the start of the pandemic, with available state reports showing that proportion ranges from 12.3% in Florida to 26.1% in Vermont. Alaska has the highest incidence of COVID at 19,000 cases per 100,000 children, and Hawaii has the lowest (5,300 per 100,000) among the states currently reporting, the AAP and CHA said.
State reporting on vaccinations shows that 37% of children aged 5-11 years in Massachusetts have received at least one dose, the highest of any state, while West Virginia is lowest at just 4%. The highest vaccination rate for children aged 12-17 goes to Massachusetts at 84%, with Wyoming lowest at 37%, the AAP said in a separate report.
Nationally, new vaccinations fell by a third during the week of Dec. 7-13, compared with the previous week, with the largest decline (34.7%) coming from the 5- to 11-year-olds, who still represented the majority (almost 84%) of the 430,000 new child vaccinations received, according to the CDC’s COVID Data Tracker. Corresponding declines for the last week were 27.5% for 12- to 15-year-olds and 22.7% for those aged 16-17.
Altogether, 21.2 million children aged 5-17 had received at least one dose and 16.0 million were fully vaccinated as of Dec. 13. By age group, 19.2% of children aged 5-11 years have gotten at least one dose and 9.6% are fully vaccinated, compared with 62.1% and 52.3%, respectively, among children aged 12-17, the CDC said.
After a brief lull in activity, weekly COVID-19 cases in children returned to the upward trend that began in early November, based on data from the American Academy of Pediatrics and the Children’s Hospital Association.
according to the Centers for Disease Control and Prevention.
New COVID-19 cases were up by 23.5% for the week of Dec. 3-9, after a 2-week period that saw a drop and then just a slight increase, the AAP and CHA said in their latest weekly COVID report. There were 164,000 new cases from Dec. 3 to Dec. 9 in 46 states (Alabama, Nebraska, and Texas stopped reporting over the summer of 2021 and New York has never reported by age), the District of Columbia, New York City, Puerto Rico, and Guam.
The increase occurred across all four regions of the country, but the largest share came in the Midwest, with over 65,000 new cases, followed by the West (just over 35,000), the Northeast (just under 35,000), and the South (close to 28,000), the AAP/CHA data show.
The 7.2 million cumulative cases in children as of Dec. 9 represent 17.2% of all cases reported in the United States since the start of the pandemic, with available state reports showing that proportion ranges from 12.3% in Florida to 26.1% in Vermont. Alaska has the highest incidence of COVID at 19,000 cases per 100,000 children, and Hawaii has the lowest (5,300 per 100,000) among the states currently reporting, the AAP and CHA said.
State reporting on vaccinations shows that 37% of children aged 5-11 years in Massachusetts have received at least one dose, the highest of any state, while West Virginia is lowest at just 4%. The highest vaccination rate for children aged 12-17 goes to Massachusetts at 84%, with Wyoming lowest at 37%, the AAP said in a separate report.
Nationally, new vaccinations fell by a third during the week of Dec. 7-13, compared with the previous week, with the largest decline (34.7%) coming from the 5- to 11-year-olds, who still represented the majority (almost 84%) of the 430,000 new child vaccinations received, according to the CDC’s COVID Data Tracker. Corresponding declines for the last week were 27.5% for 12- to 15-year-olds and 22.7% for those aged 16-17.
Altogether, 21.2 million children aged 5-17 had received at least one dose and 16.0 million were fully vaccinated as of Dec. 13. By age group, 19.2% of children aged 5-11 years have gotten at least one dose and 9.6% are fully vaccinated, compared with 62.1% and 52.3%, respectively, among children aged 12-17, the CDC said.
Unrestricted prescribing of mifepristone: Safe and effective, says study
Abortion rates remained stable and adverse events were rare after removal of mifepristone prescribing restrictions in Canada, a new study shows.
“Our study is a signal to other countries that restrictions are not necessary to ensure patient safety,” senior author Wendy V. Norman, MD, professor in the department of family practice at the University of British Columbia, Vancouver, said in a press release.
“This is the strongest evidence yet that it is safe to provide the abortion pill like most other prescriptions – meaning any doctor or nurse practitioner can prescribe, any pharmacist can dispense, and patients can take the pills if, when, and where they choose,” said lead author Laura Schummers, ScD, a postdoctoral fellow in the same department.
The findings “add to the accumulating evidence that removing restrictions from medication abortion is safe, effective, and improves access,” agreed Eve Espey, MD, professor and chair of the department of obstetrics and gynecology at the University of New Mexico, Albuquerque, who was not part of the research team. “This is additional confirmation that it is safe for patients to receive abortion care medications in the ‘normal’ fashion, through a prescription available at a pharmacy,” she said in an interview.
The study, published in the New England Journal of Medicine, compared medical abortion use, safety, and effectiveness in the province of Ontario before the Canadian availability of mifepristone and after it became available without restrictions that are similar to the Risk Evaluation and Mitigation Strategy (REMS) restrictions in place for mifepristone in the United States.
Using linked administrative health data, the researchers created a population-based cohort of all Ontario residents aged 12-49 years who had received abortion services during the study period. In total, 195,183 abortions were performed in the period before mifepristone was approved (January 2012–December 2016), and 84,032 were performed after it was made available without restrictions (Nov. 7, 2017, through March 15, 2020). The vast majority of these abortions (89.3%) were surgical, with about 10% being medically induced, the authors reported.
The study found that, while the overall abortion rate declined over the study period (from 11.9 to 11.3 per 1,000 female residents), the proportion of medical abortions jumped sharply from 2.2% to 31.4%, and the rate of second-trimester abortions declined from 5.5% of all abortions to 5.1%.
Abortion safety outcomes within 6 weeks of abortion remained stable over the two study periods. This included severe adverse events (0.03% vs. 0.04%) such as blood transfusions, abdominal surgery, admission to an ICU, or sepsis during an abortion-related hospitalization; and complications (0.74% vs. 0.69%,) such as genital tract or pelvic infection, hemorrhage, embolism, shock, renal failure, damage to pelvic organs or tissues, and venous complications among other things.
There were slight declines in overall abortion effectiveness, but ongoing pregnancy rates “remained infrequent,” the authors noted. While there was a modest rise in the rates of subsequent uterine evacuation (from 1.0% to 2.2%), and ongoing intrauterine pregnancy continuing until delivery (from 0.03% to 0.08%), the rate of ectopic pregnancy diagnosed within 6 weeks after the abortion date remained stable (from 0.15% to 0.22%).
Canada was the first country in the world to remove all supplemental restrictions on the dispensing and administration of mifepristone, according to the press release. And while professional organizations have called for the removal of such restrictions “because they impede access to abortion services without improving safety,” high-quality data on this are lacking, they added.
The study’s finding are consistent with existing U.S. and U.K. data showing Food and Drug Administration REMS restrictions requiring abortion care medications to be dispensed in a clinic by a certified provider “are unnecessary and create obstacles to early abortion access,” said Dr. Espey. “For clinicians and patients in the U.S., it’s important to note that the increasing number of legislative restrictions on abortion, including medication abortion, are non–evidence based. Politically motivated false claims of safety concerns are countered by this study and others conducted during the pandemic when both the U.S. and U.K. removed REMS-type restrictions. These studies show that receiving abortion care through usual pharmacy channels and through telemedicine is safe, effective, and reduces barriers to care.”
Dr. Norman reported receiving grants from the Canadian Institutes of Health Research, providing expert witness services to the government of Ontario and Office of the Attorney General, and serving on the board of directors of the Society of Family Planning. No other researchers reported conflicts of interest. Dr. Espey reported no conflicts of interest. The Canadian Institutes of Health Research and the Women’s Health Research Institute with the support of ICES (formerly known as the Institute for Clinical Evaluative Sciences).
FROM THE NEW ENGLAND JOURNAL OF MEDICINE
Epilepsy linked to 1.5-fold higher COVID-19 mortality in hospital
according to a new study presented at the annual meeting of the American Epilepsy Society. While the findings are preliminary and not yet adjusted for various confounders, the authors say they are a warning sign that patients with epilepsy may face higher risks.
“These findings suggest that epilepsy may be a pre-existing condition that places patients at increased risk for death if hospitalized with a COVID-19 infection. It may offer neurologists guidance when counseling patients on critical preventative measures such as masking, social distancing, and most importantly, vaccination,” lead author Claire Ufongene, a student at Icahn School of Medicine at Mount Sinai, New York, said in an interview.
According to Ms. Ufongene, there’s sparse data about COVID-19 outcomes in patients with epilepsy, although she highlighted a 2021 meta-analysis of 13 studies that found a higher risk of severity (odds ratio, 1.69; 95% confidence interval, 1.11-2.59, P = .010) and mortality (OR, 1.71; 95% CI, 1.14-2.56, P = .010).
For the new study, researchers retrospectively tracked identified 334 patients with epilepsy and COVID-19 and 9,499 other patients with COVID-19 from March 15, 2020, to May 17, 2021. All were treated at hospitals within the New York–based Icahn School of Medicine at Mount Sinai.
The groups of patients with and without epilepsy were similar in some ways: 45% and 46%, respectively, were female (P = .674), and their ages were similar (average, 62 years and 65 years, respectively; P = .02). Racial makeup was also similar (non-Hispanic groups made up 27.8% of those with epilepsy and 24.5% of those without; the difference was not statistically significant).
“In addition, more of those with epilepsy were English speaking [83.2% vs. 77.9%] and had Medicaid insurance [50.9% vs. 38.9%], while fewer of those with epilepsy had private insurance [16.2% vs. 25.5%] or were Spanish speaking [14.0% vs. 9.3%],” study coauthor Nathalie Jette, MD, MSc, a neurologist at Icahn School of Medicine at Mount Sinai, said in an interview.
In terms of outcomes, patients with epilepsy were much more likely to need ventilator support (37.7% vs. 14.3%; P < .001), to be admitted to the ICU (39.2% vs. 17.7%; P < .001), and to die in the hospital (29.6% vs. 19.9%; P < .001).
“Most patients we follow in our practices with epilepsy who experienced COVID-19 in general have had symptoms similar to the general population,” Dr. Jette said. “There are rare instances where COVID-19 can result in an exacerbation of seizures in some with pre-existing epilepsy. This is not surprising as infections in particular can decrease the seizure threshold and result in breakthrough seizures in people living with epilepsy.”
Loss of seizure control
How might epilepsy be related to worse outcomes in COVID-19? Andrew Wilner, MD, a neurologist and internist at University of Tennessee Health Science Center, Memphis, who’s familiar with the study findings, said COVID-19 itself may not worsen epilepsy. “Evidence to suggest that COVID-19 directly affects the central nervous system is extremely limited. As such, one would not expect that a COVID-19 infection would cause epilepsy or exacerbate epilepsy,” he said. “However, patients with epilepsy who suffer from infections may be predisposed to decreased seizure control. Consequently, it would not be surprising if patients with epilepsy who also had COVID-19 had loss of seizure control and even status epilepticus, which could adversely affect their hospital course. However, there are no data on this potential phenomenon.”
Dr. Wilner suspected that comorbidities explain the higher mortality in patients with epilepsy. “The findings are probably most useful in that they call attention to the fact that epilepsy patients are more vulnerable to a host of comorbidities and resultant poorer outcomes due to any acute illness.”
As for treatment, Dr. Wilner urged colleagues to make sure that hospitalized patients with epilepsy “continue to receive their antiepileptic medications, which they may no longer be able to take orally. They may need to be switched temporarily to an intravenous formulation.”
In an interview, Selim Benbadis, MD, a neurologist from the University of South Florida, Tampa, suggested that antiseizure medications may play a role in the COVID-19 disease course because they can reduce the efficacy of other medications, although he noted that drug treatments for COVID-19 were limited early on. He recommended that neurologists “avoid old enzyme-inducing seizure medications, as is generally recommended.”
No study funding is reported. The study authors and Dr. Benbadis reported no relevant disclosures. Dr. Wilner is a medical adviser for the epilepsy disease management program for CVS/Health.
FROM AES 2021