User login
Midurethral slings have low reoperation rates for stress urinary incontinence
according to a study published in Obstetrics & Gynecology.
Alexander A. Berger, MD, MPH, of the division of female pelvic medicine and reconstructive surgery at Kaiser Permanente in San Diego, and colleagues performed a retrospective cohort study of 17,030 patients with stress urinary incontinence (SUI) who underwent midurethral sling surgery between 2005 and 2016, examining the reoperation rate at 1 year, 5 years, and 9 years after the procedure, as well as secondary outcomes of mesh revision, mesh removal, and recurrence of SUI.
Overall, the rate of reoperation at 1 year was 2.1% (95% confidence interval, 1.9%-2.4%), was 4.5% at 5 years (95% CI, 4.1%-4.8%) and 6.0% at 9 years (95% CI, 5.5%-6.5%). Compared with white patients, there was a lower rate of reoperation among Asian or Pacific Islander patients.
The rate of reoperation involving mesh removal was 0.7% at 1 year (95% CI, 0.6%-0.8%), 1.0% at 5 years (95% CI, 0.8%-1.1%) and 1.1% at 9 years (95% CI, 0.9%-1.3%).
The rate of recurrent SUI leading to operation was 1.6% at 1 year (95% CI, 1.4%-1.8%), 3.9% at 5 years (95% CI, 3.5%-4.2%) and 5.2% at 9 years (95% CI, 4.7%-5.7%), with more reoperations occurring for patients who received a single-incision sling, rather than a retropubic sling (adjusted hazard ratio, 1.5; 95% CI, 1.06-2.11; P = .03), Dr. Berger and associates wrote.

Urogynecologists, ob.gyns., and urologists who use mesh for slings and reconstructive surgery have struggled to recommend synthetic mesh slings to their patients with SUI, said Patrick J. Woodman, DO, MS, program director of obstetrics and gynecology residency at Providence Health Ascension Macomb-Oakland, Warren (Mich.) Campus, said in an interview. In 2008, the Food and Drug Administration issued a public health notification for transvaginal placement of surgical mesh in patients with pelvic organ prolapse and SUI.
“Although some of the recommendations first made by the FDA were reasoned and reasonable, such as the need for direct, premarket, patient studies instead of the mostly administrative 510(k) ‘similar-to’ process that had been used previously, physicians and patients had been eagerly awaiting the outcomes of some of these clinical studies that would help answer some of the safety and efficacy questions that had been dogging the transvaginal use of mesh material for years,” he said.
“But, to everyone’s surprise, in April [2019] they called for a recall of all vaginal mesh products, even before the study data could be analyzed, written up and released,” added Dr. Woodman. “Companies were forced to halt production, pull stocks from the shelves, and halt and reverse shipments.”
One reason the results by Berger et al. show midurethral slings have had a good safety record is because of a small incision size and low amount of mesh, noted Dr. Woodman, who was not involved with the study. “This article seems to underline and highlight the fact that reoperation is rare for midurethral slings (for all reasons), but particularly for mesh erosion or exposure. This is well within the experience of most female pelvic medicine and reconstructive surgery and urologic surgeons, and incredibly less than the 8%-24% of mesh exposures reported in the variety of mesh exposure literature on vaginal mesh procedures.”
Despite this safety record, some women may still experience adverse events with midurethral slings, admitted Dr. Woodman. “The fact remains, if a surgeon drags a large piece of synthetic fabric through a ‘clean-contaminated’ vaginal environment, and buries this mesh under the skin of the vagina, and then rests this mesh against a long incision, some women’s immune systems will not be able to handle the resultant inflammation and bacterial load, despite antibiotics, vaginal prepping, and any number of coatings or soakings of the mesh.”
The researchers noted the study’s retrospective nature is one potential limitation, and the data has not been compiled by surgeon type or skill, or considered patients with complications that did not choose reoperations.
“But, the flip side is also true,” said Dr. Woodman, an Ob.Gyn News editorial advisor. “There may have been a number of individuals who had a surgical removal who did not need or warrant it due to the societal, family, or legal ‘suggestion’ that the mesh is now ‘dangerous’ and must be removed at all costs.”
Berger et al. “hit the nail on the head” with the study, including a large amount of patients that demonstrates the safety of midurethral slings, he said. “We need a solid body of unquestioned evidence of safety and effectiveness from which to base solid, evidence-based medical decisions. If there is a way to effectively use mesh to reinforce a vaginal repair in a high-risk woman (for example, with previous failed surgeries), then we have to take the stigma away from its use: because no one wants to use it now, even if it could help.
“The best we can hope for, as physicians, is a rehabilitation of reputation for vaginal mesh,” he concluded.
The study was supported by a grant from the Regional Research Committee of Kaiser Permanente Southern California. One coauthor reported receiving royalties from UptoDate and the American Urogynecologic Society Board Member for travel for board meetings. The other authors reported no relevant conflicts of interest. Dr. Woodman said he had no relevant financial disclosures.*
SOURCE: Berger AA et al. Obstet Gynecol. 2019 Oct 10. doi:10.1097/AOG.0000000000003526.
* Updated 10/14/2019
according to a study published in Obstetrics & Gynecology.
Alexander A. Berger, MD, MPH, of the division of female pelvic medicine and reconstructive surgery at Kaiser Permanente in San Diego, and colleagues performed a retrospective cohort study of 17,030 patients with stress urinary incontinence (SUI) who underwent midurethral sling surgery between 2005 and 2016, examining the reoperation rate at 1 year, 5 years, and 9 years after the procedure, as well as secondary outcomes of mesh revision, mesh removal, and recurrence of SUI.
Overall, the rate of reoperation at 1 year was 2.1% (95% confidence interval, 1.9%-2.4%), was 4.5% at 5 years (95% CI, 4.1%-4.8%) and 6.0% at 9 years (95% CI, 5.5%-6.5%). Compared with white patients, there was a lower rate of reoperation among Asian or Pacific Islander patients.
The rate of reoperation involving mesh removal was 0.7% at 1 year (95% CI, 0.6%-0.8%), 1.0% at 5 years (95% CI, 0.8%-1.1%) and 1.1% at 9 years (95% CI, 0.9%-1.3%).
The rate of recurrent SUI leading to operation was 1.6% at 1 year (95% CI, 1.4%-1.8%), 3.9% at 5 years (95% CI, 3.5%-4.2%) and 5.2% at 9 years (95% CI, 4.7%-5.7%), with more reoperations occurring for patients who received a single-incision sling, rather than a retropubic sling (adjusted hazard ratio, 1.5; 95% CI, 1.06-2.11; P = .03), Dr. Berger and associates wrote.
Urogynecologists, ob.gyns., and urologists who use mesh for slings and reconstructive surgery have struggled to recommend synthetic mesh slings to their patients with SUI, said Patrick J. Woodman, DO, MS, program director of obstetrics and gynecology residency at Providence Health Ascension Macomb-Oakland, Warren (Mich.) Campus, said in an interview. In 2008, the Food and Drug Administration issued a public health notification for transvaginal placement of surgical mesh in patients with pelvic organ prolapse and SUI.
“Although some of the recommendations first made by the FDA were reasoned and reasonable, such as the need for direct, premarket, patient studies instead of the mostly administrative 510(k) ‘similar-to’ process that had been used previously, physicians and patients had been eagerly awaiting the outcomes of some of these clinical studies that would help answer some of the safety and efficacy questions that had been dogging the transvaginal use of mesh material for years,” he said.
“But, to everyone’s surprise, in April [2019] they called for a recall of all vaginal mesh products, even before the study data could be analyzed, written up and released,” added Dr. Woodman. “Companies were forced to halt production, pull stocks from the shelves, and halt and reverse shipments.”
One reason the results by Berger et al. show midurethral slings have had a good safety record is because of a small incision size and low amount of mesh, noted Dr. Woodman, who was not involved with the study. “This article seems to underline and highlight the fact that reoperation is rare for midurethral slings (for all reasons), but particularly for mesh erosion or exposure. This is well within the experience of most female pelvic medicine and reconstructive surgery and urologic surgeons, and incredibly less than the 8%-24% of mesh exposures reported in the variety of mesh exposure literature on vaginal mesh procedures.”
Despite this safety record, some women may still experience adverse events with midurethral slings, admitted Dr. Woodman. “The fact remains, if a surgeon drags a large piece of synthetic fabric through a ‘clean-contaminated’ vaginal environment, and buries this mesh under the skin of the vagina, and then rests this mesh against a long incision, some women’s immune systems will not be able to handle the resultant inflammation and bacterial load, despite antibiotics, vaginal prepping, and any number of coatings or soakings of the mesh.”
The researchers noted the study’s retrospective nature is one potential limitation, and the data has not been compiled by surgeon type or skill, or considered patients with complications that did not choose reoperations.
“But, the flip side is also true,” said Dr. Woodman, an Ob.Gyn News editorial advisor. “There may have been a number of individuals who had a surgical removal who did not need or warrant it due to the societal, family, or legal ‘suggestion’ that the mesh is now ‘dangerous’ and must be removed at all costs.”
Berger et al. “hit the nail on the head” with the study, including a large amount of patients that demonstrates the safety of midurethral slings, he said. “We need a solid body of unquestioned evidence of safety and effectiveness from which to base solid, evidence-based medical decisions. If there is a way to effectively use mesh to reinforce a vaginal repair in a high-risk woman (for example, with previous failed surgeries), then we have to take the stigma away from its use: because no one wants to use it now, even if it could help.
“The best we can hope for, as physicians, is a rehabilitation of reputation for vaginal mesh,” he concluded.
The study was supported by a grant from the Regional Research Committee of Kaiser Permanente Southern California. One coauthor reported receiving royalties from UptoDate and the American Urogynecologic Society Board Member for travel for board meetings. The other authors reported no relevant conflicts of interest. Dr. Woodman said he had no relevant financial disclosures.*
SOURCE: Berger AA et al. Obstet Gynecol. 2019 Oct 10. doi:10.1097/AOG.0000000000003526.
* Updated 10/14/2019
FROM OBSTETRICS & GYNECOLOGY
Short DAPT found noninferior to longer DAPT post stent implantation
In addition, P2Y12 inhibitor monotherapy was almost equivalent to aspirin monotherapy after 3 months in terms of both bleeding and thrombotic events.
“Recent guidelines recommend short DAPT up to 3 months, only in high bleeding risk patients,” lead investigator Ken Kozuma, MD, said during a media briefing at the Transcatheter Cardiovascular Therapeutics annual meeting. “However, short-term DAPT may be beneficial for any patients. Aspirin may be more associated with bleeding complication than P2Y12 receptor inhibitors.”
In a single-arm registry trial known as MODEL U-SES, Dr. Kozuma, of Teikyo University Hospital in Tokyo, and colleagues at 65 sites in Japan prospectively evaluated the safety of 3-month DAPT after implantation of the Ultimaster bioresorbable polymer sirolimus-eluting stent (BP-SES). The secondary objective was to investigate the appropriateness of P2Y12 receptor inhibitor monotherapy compared with aspirin monotherapy after 3 months. The researchers enrolled 1,695 patients with a mean age of 70 years who were treated with U-SES and considered appropriate for 3-month DAPT after implantation.
The primary endpoint was a composite endpoint of all-cause death, myocardial infarction, stroke (ischemic and hemorrhagic), Academic Research Consortium (ARC) definite/probable stent thrombosis, and serious bleeding (Bleeding Academic Research Consortium [BARC] 3 or 5) during the 12 months after stent implantation. Major secondary endpoints included a comparison of the incidence of each event for each continued antiplatelet drug.
Of the 1,695 patients enrolled, 1,686 completed 3-month clinical follow-up while 1,616 completed 1-year clinical follow-up. Patient-level adjusted historical data from 542 subjects in the CENTURY II cohort was used as the control group. Patients in that trial received the same stent but took DAPT for 1 year.
Dr. Kozuma reported that the primary endpoint occurred in 4.3% of patients in the MODEL U-SES group, compared with 5.7% of patients in the CENTURY II BP-SES group, a difference of –3.17%, which demonstrated noninferiority of the trial (P less than .001). At 3 months, P2Y12 inhibitor monotherapy was equivalent to aspirin monotherapy in terms of both bleeding and thrombotic events (2.5% in each modality; hazard ratio, 1.14; P = 0.71).
Dr. Kozuma acknowledged certain limitations of the trial, including the fact that propensity score adjusted analysis “may not compensate the selection bias of this study sufficiently, since considerable baseline difference was observed. Also, comparison between aspirin and P2Y12 receptor inhibitors was not randomized so that the safety and efficacy of each antiplatelet monotherapy cannot be conclusive.”
Despite these limitations, he concluded that the trial “demonstrated that 3-month DAPT was noninferior to an adjusted cohort of longer DAPT after BP-SES implantation in net adverse clinical events. Direct comparison between P2Y12 inhibitor and aspirin would be necessary to confirm the efficacy and safety of P2Y12 inhibitor monotherapy in a randomized fashion.”
The meeting was sponsored by the Cardiovascular Research Foundation.
Terumo sponsored the trial. Dr. Kozuma disclosed that he serves on the scientific advisory boards for and has received honoraria from Terumo, Abbott Vascular Japan, Boston Scientific Japan, Daiichi-Sankyo, Sanofi, Bayer, Boehringer Ingelheim and Bristol-Meyers Squibb.
SOURCE: Kozuma K et al. TCT 2019, late-breaking presentation.
AT TCT 2019
BP screening nearly universal among Medicare enrollees
and just under 90% saw a physician during the year, according to new data released by the Centers for Medicare & Medicaid Services.

The latest edition of Medicare Beneficiaries at a Glance takes a look at some of the services provided in 2017, and BP checks were high on the list, with 96% of enrollees getting screened. BP was also prominent on another list featured in the Medicare snapshot for 2017, as hypertension was the most common chronic condition among beneficiaries with a prevalence of 58%, the CMS said.
A second glance at the report shows that 41% of enrollees had high cholesterol that year, making it the next-most common chronic condition, with arthritis third at 33%, the CMS said. Diabetes was fourth and heart disease was fifth, but rounding gives them the same prevalence of 27%.
and just under 90% saw a physician during the year, according to new data released by the Centers for Medicare & Medicaid Services.
The latest edition of Medicare Beneficiaries at a Glance takes a look at some of the services provided in 2017, and BP checks were high on the list, with 96% of enrollees getting screened. BP was also prominent on another list featured in the Medicare snapshot for 2017, as hypertension was the most common chronic condition among beneficiaries with a prevalence of 58%, the CMS said.
A second glance at the report shows that 41% of enrollees had high cholesterol that year, making it the next-most common chronic condition, with arthritis third at 33%, the CMS said. Diabetes was fourth and heart disease was fifth, but rounding gives them the same prevalence of 27%.
ID Blog: The story of syphilis, part III
The tortured road to successful treatment
It is rare in this modern era for medicine to confront an infectious disease for which there is no cure. Today, there are comparatively few infectious diseases (in the developed world and in places where money is no object) for which medicine cannot offer at least a glimmer of hope to infected patients. Even at its most futile, modern medicine has achieved vast improvements in the efficacy of palliative care. But it wasn’t that long ago that HIV infection was a nearly inevitable death sentence from the complications of AIDS, with no available treatments. And however monstrous that suffering and death, which still continues in many areas of the developing world, it was decades rather than centuries before modern medicine came up with effective treatments. Recently, there is even significant hope on the Ebola virus front that curative treatments may soon become available.

Medicine has always been in the business of hope, even when true cures were not available. Today that hope is less often misplaced. But in previous centuries, the need to offer hope to – and perhaps to make money from – desperate patients was a hallmark of the doctor’s trade.
It was this need to give patients hope and for doctors to feel that they were being effective that led to some highly dubious and desperate efforts to cure syphilis throughout history. These efforts meant centuries of fruitless torture for countless patients until the rise of modern antibiotics.
For the most part, what we now look upon as horrors and insanity in treatment were the result of misguided scientific theories, half-baked folk wisdom, and the generally well-intentioned efforts of medical practitioners at a cure. There were the charlatans as well, seeking a quick buck from the truly hopeless.
However, the social stigma of syphilis as a venereal disease played a role in the courses of treatment.
By the 15th century, syphilis was recognized as being spread by sexual intercourse, and in a situation analogous with the early AIDS epidemic, “16th- and 17th-century writers and physicians were divided on the moral aspects of syphilis. Some thought it was a divine punishment for sin – and as such only harsh treatments would cure it – or that people with syphilis shouldn’t be treated at all.”
Mercury rising
In its earliest manifestations, syphilis was considered untreatable. In 1496, Sebastian Brandt, wrote a poem entitled “De pestilentiali Scorra sive mala de Franzos” detailing the disease’s early spread across Europe and how doctors had no remedy for it.

However, it wasn’t long before desperate physicians turned their quest for a cure to a reliable old standby treatment of the period – mercury, which had a history of being used for skin diseases. Mercury salves had been in use in the Arab world for leprosy and eczema, among other skin afflictions, and had been brought to Europe with the return of the medieval crusaders. Another way elemental mercury was administered was through the use of heated cinnabar (HgS), which gave off mercury vapors that could be absorbed by breathing and through the skin. In the 16th century, doctors would place a syphilis-infected individual inside an ovenlike chamber over pans of cinnabar, which were then heated at the person’s feet.
Oral mercury treatments were promoted by Paracelsus (1493?-1541), an alchemist and physician who prescribed calomel (HgCl), or mercury chloride, pills. Mercury treatment, administered at almost inevitably toxic doses, led to ulcerations of the lips, tongue, palate, and jaw; tooth loss; and fetid breath and excessive salivation. This last symptom was, in fact, considered the endpoint in mercury therapy for syphilis, which was “originally judged to be a copious secretion of saliva – ‘some few liters per diem.’ ” Even as recent as the late 19th century and early 20th century, syphilitic patients such as Oscar Wilde (whose teeth were blackened by the treatment), were prescribed calomel.
Looking to the “holy wood”
By 1519, an alternative treatment to mercury was available. In that year, Ulrich von Hutton, a German scholar who suffered from the “great pox,” described its treatment with guaiacum sanctum, or holy wood, in “De Morbo Gallico.” Four years later, despite such treatment, he was dead from the disease himself. But the lack of efficacy did not stop the faith that doctors placed in this botanical cure.

Holy wood was an herbal treatment derived from the bark of trees from the Guaiacum family. It was brought back on trading ships from the Caribbean and South America, the origin of syphilis’s foothold in Europe and the rest of the world. The use of holy wood matched a then-current theory that the cure to a disease could be found in the area from which it came. Other botanicals from around the world were also tried, but never came into routine use.
Guaiacum was the first treatment given to sufferers of syphilis in the Blatterhaus (pox hospital) in Augsburg after 1522, according to information from the archives at the Edward Worth Library in Dublin. The botanical therapy was given as a hot drink and followed by a sweating cure. Guaiacum extract acted as a sudorific, a compound which induces sweating when ingested. Even though the use of Guaiacum was initially popular, it was replaced almost exclusively by the use of mercury.
“Give me fever”
In the late 1800s, Julius Wagner von Jauregg (1857-1940), a Viennese neurologist, observed that Austrian army officers with neurosyphilis did not become partially paralyzed if they had also contracted malaria or relapsing fever. He initiated clinical trials in which he induced fever in syphilitics with tuberculin (1-10 mg) and observed in many the remissions their neuropsychiatric symptoms and signs. He also injected neurosyphilitic patients with a mild form of malaria to induce fever, which could then be suppressed with quinine treatment.
“Other physicians soon began using malariotherapy in uncontrolled studies of neurosyphilitics and reported clinical success rates of 33%-51% and only a 5% mortality. Persons with tabes dorsalis (the “wasting” paralysis of neurosyphilis) were hospitalized for 3 weeks of alternate-day fever therapy involving 5-hour long hot baths and extended periods wrapped in heavy blankets,” according to C.T. Ambrose, MD, of the University of Kentucky, Lexington.
A 1931 medical text summarizes in 35 studies involving 2,356 cases of general paresis treated with malaria and reported a 27.5% “full remission,” he added. A bacterial treatment developed in this period used a course of 18-23 injections of killed typhoid cells administered every 2-3 days in order to produce a fever of 103°–104°F. Animal studies of rabbits infected with syphilis showed that high temperatures could be curative.
Dr. Ambrose suggests that 16th-century syphilitics who had been subjected to mercury fumigation in ovenlike chambers endured severe sweating conditions and – for those who survived – the prolonged elevated body temperature (not the mercury) may have proved curative. Fever “was the common therapeutic denominator in the cinnabar-oven treatment, botanical sudorifics (guaiacum, China root), malarial infections (natural and iatrogenic), and bacterial (tuberculin) vaccine therapy.”
Prelude to modern antibiotics
German bacteriologist/immunologist Paul Ehrlich, MD, (1854-1915) investigated the use of atoxyl (sodium arsanilate) in syphilis, but the metallic drug had severe side effects, injuring the optic nerve and causing blindness. To overcome this problem, Ehrlich and his coworkers synthesized and tested related organic arsenicals. The antisyphilitic activity of arsphenamine (compound 606) was discovered by Sahachiro Hata, MD, (1879-1938) in 1909. This compound, known as Salvarsan, became “Dr. Ehrlich’s Magic Bullet,” for the treatment of syphilis in the 1910s, and it, and later, the less-toxic compound neoarsphenamine (compound 914) became mainstays of successful clinical treatment until the development and use of penicillin in the 1940s.
Selected sources
Ambrose, CT. Pre-antibiotic therapy of syphilis. NESSA J Infect Dis Immunology. 2016. 1(1);1-20.
Frith J. Syphilis: Its early history and treatment until penicillin and the debate on its origins. J Mil Veterans Health. 2012;20(4):49-58.
Tognotti B. The rise and fall of syphilis in Renaissance Italy. J Med Humanit. 2009 Jun;30(2):99-113.
Mark Lesney is the managing editor of MDedge.com/IDPractioner. He has a PhD in plant virology and a PhD in the history of science, with a focus on the history of biotechnology and medicine. He has served as an adjunct assistant professor in the department of biochemistry and molecular & cellular biology at Georgetown University, Washington.
The tortured road to successful treatment
The tortured road to successful treatment
It is rare in this modern era for medicine to confront an infectious disease for which there is no cure. Today, there are comparatively few infectious diseases (in the developed world and in places where money is no object) for which medicine cannot offer at least a glimmer of hope to infected patients. Even at its most futile, modern medicine has achieved vast improvements in the efficacy of palliative care. But it wasn’t that long ago that HIV infection was a nearly inevitable death sentence from the complications of AIDS, with no available treatments. And however monstrous that suffering and death, which still continues in many areas of the developing world, it was decades rather than centuries before modern medicine came up with effective treatments. Recently, there is even significant hope on the Ebola virus front that curative treatments may soon become available.
Medicine has always been in the business of hope, even when true cures were not available. Today that hope is less often misplaced. But in previous centuries, the need to offer hope to – and perhaps to make money from – desperate patients was a hallmark of the doctor’s trade.
It was this need to give patients hope and for doctors to feel that they were being effective that led to some highly dubious and desperate efforts to cure syphilis throughout history. These efforts meant centuries of fruitless torture for countless patients until the rise of modern antibiotics.
For the most part, what we now look upon as horrors and insanity in treatment were the result of misguided scientific theories, half-baked folk wisdom, and the generally well-intentioned efforts of medical practitioners at a cure. There were the charlatans as well, seeking a quick buck from the truly hopeless.
However, the social stigma of syphilis as a venereal disease played a role in the courses of treatment.
By the 15th century, syphilis was recognized as being spread by sexual intercourse, and in a situation analogous with the early AIDS epidemic, “16th- and 17th-century writers and physicians were divided on the moral aspects of syphilis. Some thought it was a divine punishment for sin – and as such only harsh treatments would cure it – or that people with syphilis shouldn’t be treated at all.”
Mercury rising
In its earliest manifestations, syphilis was considered untreatable. In 1496, Sebastian Brandt, wrote a poem entitled “De pestilentiali Scorra sive mala de Franzos” detailing the disease’s early spread across Europe and how doctors had no remedy for it.
However, it wasn’t long before desperate physicians turned their quest for a cure to a reliable old standby treatment of the period – mercury, which had a history of being used for skin diseases. Mercury salves had been in use in the Arab world for leprosy and eczema, among other skin afflictions, and had been brought to Europe with the return of the medieval crusaders. Another way elemental mercury was administered was through the use of heated cinnabar (HgS), which gave off mercury vapors that could be absorbed by breathing and through the skin. In the 16th century, doctors would place a syphilis-infected individual inside an ovenlike chamber over pans of cinnabar, which were then heated at the person’s feet.
Oral mercury treatments were promoted by Paracelsus (1493?-1541), an alchemist and physician who prescribed calomel (HgCl), or mercury chloride, pills. Mercury treatment, administered at almost inevitably toxic doses, led to ulcerations of the lips, tongue, palate, and jaw; tooth loss; and fetid breath and excessive salivation. This last symptom was, in fact, considered the endpoint in mercury therapy for syphilis, which was “originally judged to be a copious secretion of saliva – ‘some few liters per diem.’ ” Even as recent as the late 19th century and early 20th century, syphilitic patients such as Oscar Wilde (whose teeth were blackened by the treatment), were prescribed calomel.
Looking to the “holy wood”
By 1519, an alternative treatment to mercury was available. In that year, Ulrich von Hutton, a German scholar who suffered from the “great pox,” described its treatment with guaiacum sanctum, or holy wood, in “De Morbo Gallico.” Four years later, despite such treatment, he was dead from the disease himself. But the lack of efficacy did not stop the faith that doctors placed in this botanical cure.
Holy wood was an herbal treatment derived from the bark of trees from the Guaiacum family. It was brought back on trading ships from the Caribbean and South America, the origin of syphilis’s foothold in Europe and the rest of the world. The use of holy wood matched a then-current theory that the cure to a disease could be found in the area from which it came. Other botanicals from around the world were also tried, but never came into routine use.
Guaiacum was the first treatment given to sufferers of syphilis in the Blatterhaus (pox hospital) in Augsburg after 1522, according to information from the archives at the Edward Worth Library in Dublin. The botanical therapy was given as a hot drink and followed by a sweating cure. Guaiacum extract acted as a sudorific, a compound which induces sweating when ingested. Even though the use of Guaiacum was initially popular, it was replaced almost exclusively by the use of mercury.
“Give me fever”
In the late 1800s, Julius Wagner von Jauregg (1857-1940), a Viennese neurologist, observed that Austrian army officers with neurosyphilis did not become partially paralyzed if they had also contracted malaria or relapsing fever. He initiated clinical trials in which he induced fever in syphilitics with tuberculin (1-10 mg) and observed in many the remissions their neuropsychiatric symptoms and signs. He also injected neurosyphilitic patients with a mild form of malaria to induce fever, which could then be suppressed with quinine treatment.
“Other physicians soon began using malariotherapy in uncontrolled studies of neurosyphilitics and reported clinical success rates of 33%-51% and only a 5% mortality. Persons with tabes dorsalis (the “wasting” paralysis of neurosyphilis) were hospitalized for 3 weeks of alternate-day fever therapy involving 5-hour long hot baths and extended periods wrapped in heavy blankets,” according to C.T. Ambrose, MD, of the University of Kentucky, Lexington.
A 1931 medical text summarizes in 35 studies involving 2,356 cases of general paresis treated with malaria and reported a 27.5% “full remission,” he added. A bacterial treatment developed in this period used a course of 18-23 injections of killed typhoid cells administered every 2-3 days in order to produce a fever of 103°–104°F. Animal studies of rabbits infected with syphilis showed that high temperatures could be curative.
Dr. Ambrose suggests that 16th-century syphilitics who had been subjected to mercury fumigation in ovenlike chambers endured severe sweating conditions and – for those who survived – the prolonged elevated body temperature (not the mercury) may have proved curative. Fever “was the common therapeutic denominator in the cinnabar-oven treatment, botanical sudorifics (guaiacum, China root), malarial infections (natural and iatrogenic), and bacterial (tuberculin) vaccine therapy.”
Prelude to modern antibiotics
German bacteriologist/immunologist Paul Ehrlich, MD, (1854-1915) investigated the use of atoxyl (sodium arsanilate) in syphilis, but the metallic drug had severe side effects, injuring the optic nerve and causing blindness. To overcome this problem, Ehrlich and his coworkers synthesized and tested related organic arsenicals. The antisyphilitic activity of arsphenamine (compound 606) was discovered by Sahachiro Hata, MD, (1879-1938) in 1909. This compound, known as Salvarsan, became “Dr. Ehrlich’s Magic Bullet,” for the treatment of syphilis in the 1910s, and it, and later, the less-toxic compound neoarsphenamine (compound 914) became mainstays of successful clinical treatment until the development and use of penicillin in the 1940s.
Selected sources
Ambrose, CT. Pre-antibiotic therapy of syphilis. NESSA J Infect Dis Immunology. 2016. 1(1);1-20.
Frith J. Syphilis: Its early history and treatment until penicillin and the debate on its origins. J Mil Veterans Health. 2012;20(4):49-58.
Tognotti B. The rise and fall of syphilis in Renaissance Italy. J Med Humanit. 2009 Jun;30(2):99-113.
Mark Lesney is the managing editor of MDedge.com/IDPractioner. He has a PhD in plant virology and a PhD in the history of science, with a focus on the history of biotechnology and medicine. He has served as an adjunct assistant professor in the department of biochemistry and molecular & cellular biology at Georgetown University, Washington.
The law of unintended consequences
In this edition of “How I will treat my next patient,” I focus on a recent presentation at the American Society for Radiation Oncology meeting regarding the association of recent closures in women’s health clinics with cervical cancer outcomes and on a publication regarding guideline-concordant radiation exposure and organizational characteristics of lung cancer screening programs.
Cervical cancer screening and outcomes
Between 2010 and 2013, nearly 100 women’s health clinics closed in the United States because of a variety of factors, including concerns by state legislatures about reproductive services. Amar J. Srivastava, MD, and colleagues, performed a database search to determine the effect of closures on cervical cancer screening, stage, and mortality (ASTRO 2019, Abstract 202). The researchers used the Behavioral Risk Factors Surveillance Study, which provided data from 197,143 cases, to assess differences in screening availability in 2008-2009 (before the closures). They used the Surveillance, Epidemiology, and End Results (SEER) registry data from 2014-2015 (after) on 10,652 patients to compare stage at diagnosis and disease-specific mortality in states with women’s health clinic closures and states without closures.
They found that the cervical cancer screening rate in states that had a decline in the number of women’s health clinics was 1.63% lower than in states that did not lose clinics. The disparity was greater in medically underserved subgroups: Hispanic women, women aged 21-34 years, unmarried women, and uninsured women.

Early-stage diagnosis was also significantly less common in states that had a decreased number of women’s health clinics – a 13.2% drop – and the overall mortality rate from cervical cancer was 36% higher. The difference was even higher (40%) when comparing only metro residents. All of these differences between states with and without closures were statistically significant.
How these results influence clinical practice
The law of unintended consequences is that the actions of people, and especially of governments, will have effects that are unanticipated or unintended. All oncologists understand this law – we live it every day.
The data generated by Dr. Srivastava and colleagues bring to mind two presentations at the 2019 annual meeting of the American Society of Clinical Oncology: the impact of Medicaid Expansion on racial disparities in time to cancer treatment (LBA 1) and the impact of the Affordable Care Act on early-stage diagnosis and treatment for women with ovarian cancer (LBA 5563). Collectively, they remind us that health care policy changes influence the timeliness of cancer care delivery and disparities in cancer care. Of course, these analyses describe associations, not necessarily causation. Large databases have quality and completeness limitations. Nonetheless, these abstracts and the associated presentations and discussions support the concept that improved access can be associated with improved cancer care outcomes.
In 1936, American sociologist Robert K. Merton described “imperious immediacy of interest,” referring to instances in which an individual wants the intended consequence of an action so badly that he or she purposefully chooses to ignore unintended effects. As a clinical and research community, we are obliged to highlight those effects when they influence our patients’ suffering.
Lung cancer screening
As a component of the Centers for Medicare & Medicaid Services’ requirements for lung cancer screening payment, institutions performing screening must use low-dose techniques and participate in a dose registry. The American College of Radiology (ACR) recommends the dose levels per CT slice (CTDIvol; 3 mGy or lower) and the effective dose (ED; 1 mSr or lower) that would qualify an examination as “low dose,” thereby hoping to minimize the risk of radiation-induced cancers.
Joshua Demb, PhD, and colleagues prospectively collected lung cancer screening examination dose metrics at U.S. institutions in the University of California, San Francisco, International Dose Registry (JAMA Intern Med. 2019 Sep 23. doi: 10.1001/jamainternmed.2019.3893). Only U.S. institutions that performed more than 24 lung cancer screening scans from 2016-2017 were included in the survey (n = 72, more than 12,500 patients). Institution-level factors were collected via the Partnership for Dose trial, including how CT scans are performed and how CT protocols are established at the institutional level.
In a data-dense analysis, the authors found that 65% of institutions delivered, and more than half of patients received, radiation doses above ACR targets. This suggests that both the potential screening benefits and the margins of benefits over risks might be reduced for patients at those institutions. Factors associated with exceeding ACR guidelines for radiation dose were using an “external” medical physicist, although having a medical physicist of any type was more beneficial than not having one; allowing any radiologist to establish or modify the screening protocol, instead of limiting that role to “lead” radiologists; and updating CT protocols as needed, compared with updating the protocols annually.
How these results influence clinical practice
As with the ASTRO 2019 presentation, the law of unintended consequences applies here. Whenever potentially healthy people are subjected to medical procedures to prevent illness or detect disease at early stages, protecting safety is paramount. For that reason, National Comprehensive Cancer Network (NCCN) guidelines are explicit that all lung cancer screening and follow-up scans should use low-dose techniques, unless evaluating mediastinal abnormalities or adenopathy.
The study by Dr. Demb and colleagues critically examined the proportion of lung cancer screening participants receiving guideline-concordant, low-dose examinations and several factors that could influence conformance with ACR guidelines. The results are instructive despite some of the study’s limits including the fact that the database used did not enable long-term follow-up of screened individuals for lung cancer detection or mortality, the survey relied on self-reporting, and the institutional level data was not solely focused on lung cancer screening examinations.
The survey reminds us that the logistics, quality control, and periodic review of well-intentioned programs like lung cancer screening require the thoughtful, regular involvement of teams of professionals who are cognizant of, adherent to, and vigilant about the guidelines that protect the individuals who entrust their care to us.
Dr. Lyss has been a community-based medical oncologist and clinical researcher for more than 35 years, practicing in St. Louis. His clinical and research interests are in the prevention, diagnosis, and treatment of breast and lung cancers and in expanding access to clinical trials to medically underserved populations.
In this edition of “How I will treat my next patient,” I focus on a recent presentation at the American Society for Radiation Oncology meeting regarding the association of recent closures in women’s health clinics with cervical cancer outcomes and on a publication regarding guideline-concordant radiation exposure and organizational characteristics of lung cancer screening programs.
Cervical cancer screening and outcomes
Between 2010 and 2013, nearly 100 women’s health clinics closed in the United States because of a variety of factors, including concerns by state legislatures about reproductive services. Amar J. Srivastava, MD, and colleagues, performed a database search to determine the effect of closures on cervical cancer screening, stage, and mortality (ASTRO 2019, Abstract 202). The researchers used the Behavioral Risk Factors Surveillance Study, which provided data from 197,143 cases, to assess differences in screening availability in 2008-2009 (before the closures). They used the Surveillance, Epidemiology, and End Results (SEER) registry data from 2014-2015 (after) on 10,652 patients to compare stage at diagnosis and disease-specific mortality in states with women’s health clinic closures and states without closures.
They found that the cervical cancer screening rate in states that had a decline in the number of women’s health clinics was 1.63% lower than in states that did not lose clinics. The disparity was greater in medically underserved subgroups: Hispanic women, women aged 21-34 years, unmarried women, and uninsured women.
Early-stage diagnosis was also significantly less common in states that had a decreased number of women’s health clinics – a 13.2% drop – and the overall mortality rate from cervical cancer was 36% higher. The difference was even higher (40%) when comparing only metro residents. All of these differences between states with and without closures were statistically significant.
How these results influence clinical practice
The law of unintended consequences is that the actions of people, and especially of governments, will have effects that are unanticipated or unintended. All oncologists understand this law – we live it every day.
The data generated by Dr. Srivastava and colleagues bring to mind two presentations at the 2019 annual meeting of the American Society of Clinical Oncology: the impact of Medicaid Expansion on racial disparities in time to cancer treatment (LBA 1) and the impact of the Affordable Care Act on early-stage diagnosis and treatment for women with ovarian cancer (LBA 5563). Collectively, they remind us that health care policy changes influence the timeliness of cancer care delivery and disparities in cancer care. Of course, these analyses describe associations, not necessarily causation. Large databases have quality and completeness limitations. Nonetheless, these abstracts and the associated presentations and discussions support the concept that improved access can be associated with improved cancer care outcomes.
In 1936, American sociologist Robert K. Merton described “imperious immediacy of interest,” referring to instances in which an individual wants the intended consequence of an action so badly that he or she purposefully chooses to ignore unintended effects. As a clinical and research community, we are obliged to highlight those effects when they influence our patients’ suffering.
Lung cancer screening
As a component of the Centers for Medicare & Medicaid Services’ requirements for lung cancer screening payment, institutions performing screening must use low-dose techniques and participate in a dose registry. The American College of Radiology (ACR) recommends the dose levels per CT slice (CTDIvol; 3 mGy or lower) and the effective dose (ED; 1 mSr or lower) that would qualify an examination as “low dose,” thereby hoping to minimize the risk of radiation-induced cancers.
Joshua Demb, PhD, and colleagues prospectively collected lung cancer screening examination dose metrics at U.S. institutions in the University of California, San Francisco, International Dose Registry (JAMA Intern Med. 2019 Sep 23. doi: 10.1001/jamainternmed.2019.3893). Only U.S. institutions that performed more than 24 lung cancer screening scans from 2016-2017 were included in the survey (n = 72, more than 12,500 patients). Institution-level factors were collected via the Partnership for Dose trial, including how CT scans are performed and how CT protocols are established at the institutional level.
In a data-dense analysis, the authors found that 65% of institutions delivered, and more than half of patients received, radiation doses above ACR targets. This suggests that both the potential screening benefits and the margins of benefits over risks might be reduced for patients at those institutions. Factors associated with exceeding ACR guidelines for radiation dose were using an “external” medical physicist, although having a medical physicist of any type was more beneficial than not having one; allowing any radiologist to establish or modify the screening protocol, instead of limiting that role to “lead” radiologists; and updating CT protocols as needed, compared with updating the protocols annually.
How these results influence clinical practice
As with the ASTRO 2019 presentation, the law of unintended consequences applies here. Whenever potentially healthy people are subjected to medical procedures to prevent illness or detect disease at early stages, protecting safety is paramount. For that reason, National Comprehensive Cancer Network (NCCN) guidelines are explicit that all lung cancer screening and follow-up scans should use low-dose techniques, unless evaluating mediastinal abnormalities or adenopathy.
The study by Dr. Demb and colleagues critically examined the proportion of lung cancer screening participants receiving guideline-concordant, low-dose examinations and several factors that could influence conformance with ACR guidelines. The results are instructive despite some of the study’s limits including the fact that the database used did not enable long-term follow-up of screened individuals for lung cancer detection or mortality, the survey relied on self-reporting, and the institutional level data was not solely focused on lung cancer screening examinations.
The survey reminds us that the logistics, quality control, and periodic review of well-intentioned programs like lung cancer screening require the thoughtful, regular involvement of teams of professionals who are cognizant of, adherent to, and vigilant about the guidelines that protect the individuals who entrust their care to us.
Dr. Lyss has been a community-based medical oncologist and clinical researcher for more than 35 years, practicing in St. Louis. His clinical and research interests are in the prevention, diagnosis, and treatment of breast and lung cancers and in expanding access to clinical trials to medically underserved populations.
Urine Reveals Biomarker for Potential TBI
Even a mild blast to the brain can cause long-term, life-changing health problems, says Riyi Shi, professor of neuroscience and biomedical engineering at Purdue University in Lafayette, Indiana. However, the effects can be subtle: “The individual appears to be fine, and it’s difficult to tell if you just look at a person. But the fact is that these types of hits are multiplied over years and often ignored until someone reaches an age when other factors come into play.”
Treating the incidents sooner can help mitigate later-life issues, such as Parkinson disease (PD). Shi led a study that found checking the urine within 7 days following a blast incident—even a mild one—provides faster diagnosis when brain injury is suspected.
A simple urine analysis reveals elevations in the neurotoxin acrolein, Shi says, which is a biomarker for brain injury. In the study, the researchers evaluated the changes of α-synuclein and tyrosine hydroxylase, hallmarks of PD, and acrolein, a marker of oxidative stress. The researchers say in animal models of PD and traumatic brain injury (TBI), acrolein is “likely a point of pathogenic convergence.”
They found that after a single mild blast TBI, acrolein was elevated for up to a week, systemically in urine, and in whole brain tissue, specifically the substantia nigra and striatum. The elevation was accompanied by heightened α-synuclein oligomerization, dopaminergic dysregulation, and acrolein/α-synuclein interaction in the same brain regions. Taken together, the researchers say, the data suggest that acrolein likely plays a key role in inducing PD following blast TBI.
The presence of the biomarker “alerts us to the injury, creating an opportunity for intervention,” Shi says. “This early detection and subsequent treatment window could offer tremendous benefits for long-term patient neurologic health.”
Painless Round Ulcers on the Leg
The Diagnosis: Cutaneous Tuberculosis
The patient's medical history was notable for bone tuberculosis (TB) treated in childhood. Skin biopsy revealed neutrophilic infiltrates with necrosis without granulomas. A real-time polymerase chain reaction test detected Mycobacterium tuberculosis complex in the skin fragment, which was confirmed by culture of the biopsy specimen using a liquid growth medium that grew M tuberculosis. Tuberculotic foci were not present on the lungs, gastrointestinal tract, kidneys, and bones by radiologic, microbiologic, and ultrasonographic investigations. The patient was started on 4 antituberculotic drugs--isoniazid 300 mg, rifampicin 600 mg, ethambutol 1200 mg, pyrazinamide 1500 mg--once daily for 2 months followed by isoniazid 300 mg and rifampicin 600 mg once daily for another 4 months with resolution of the skin lesions.
Cutaneous TB is an infectious disease caused by M tuberculosis and accounts for only 1.5% of extrapulmonary TB cases.1,2 Similar to other forms of TB, a resurgence of cutaneous TB has been noted in parts of the world where human immunodeficiency virus infection is prevalent and remains to be one of the most elusive and more difficult diseases to diagnose.3 Thought to be a predominantly occupational disease, it is being encountered more frequently in healthy individuals where the source of infection remains unidentified in most cases.4 The clinical types depend on the method of infection, virulence of the bacillus, immune status of the host, and presence or absence of host sensitization to M tuberculosis.2 The route of infection is used to classify cutaneous mycobacteriosis.5 Inoculation from an exogenous source can produce TB verrucosa cutis in individuals who have previously been sensitized to M tuberculosis or tuberculous chancre in individuals without prior exposure to the bacterium.4 Cutaneous TB resulting from direct spread to the skin from an underlying contiguous structure in most cases spreads from lymph nodes and bone (scrofuloderma). Immunosuppressed patients with advanced TB of the lung, gastrointestinal tract, or the genitourinary tract may present with periorificial TB.4 Dissemination to the skin caused by hematogenous spread can occur in the form of lupus vulgaris, miliary TB, or metastatic tuberculous abscesses (gummas).4,5 A fourth category--cutaneous TB from paradoxical expansion--also was proposed. Paradoxical expansion is defined as the transient expansion of a preexisting lesion or the appearance of new lesions during appropriate anti-TB therapy.5
Although histopathology and protein chain reaction tests are useful, the gold standard for diagnosis is still the isolation of M tuberculosis on culture.3,6 Treatment regimens of cutaneous TB are similar to those of pulmonary TB, with a 4-agent regimen given for 2 months followed by a 2-drug regimen for the next 4 months.1,7 The differential diagnosis of leg ulcers includes stasis ulcer, necrobiotic xanthogranuloma, pyoderma gangrenosum, and squamous cell carcinoma, among others. Cutaneous biopsy, microbiological culture, and a high degree of suspicion are fundamental for the final diagnosis. Cutaneous TB should be suspected in immunocompetent as well as in immunosuppressed patients who present with ulcerated lesions that do not respond to antibacterial treatment.
- Karoney MJ, Kaumbuki EK, Koech MK, et al. Primary cutaneous tuberculosis in a 27-year-old medical intern from needle-stick injury: a case report. Clin Case Rep. 2015;3:39-42.
- Spelta K, Diniz LM. Cutaneous tuberculosis: a 26-year retrospective study in an endemic area of tuberculosis, Vitória, Espírito Santo, Brazil. Rev Inst Med Trop Sao Paulo. 2016;58:49.
- Sahin N, Aydin NE, Senol M, et al. Longstanding skin ulcers due to Mycobacterium tuberculosis in a healthy man. Trop Biomed. 2010;27:120-124.
- Semaan R, Traboulsi R, Kanj S. Primary Mycobacterium tuberculosis complex cutaneous infection: report of two cases and literature review. Int J Infect Dis. 2008;12:472-477.
- Ram R, Uppin S, Swarnalatha G, et al. Isolated skin ulcers due to Mycobacterium tuberculosis in a renal allograft recipient. Nat Clin Pract Nephrol. 2007;3:688-693.
- Bravo FG, Gotuzzo E. Cutaneous tuberculosis. Clin Dermatol. 2007;25:173-180.
- Handog EB, Gabriel TG, Pineda RT. Management of cutaneous tuberculosis. Dermatol Ther. 2008;21:154-161.
The Diagnosis: Cutaneous Tuberculosis
The patient's medical history was notable for bone tuberculosis (TB) treated in childhood. Skin biopsy revealed neutrophilic infiltrates with necrosis without granulomas. A real-time polymerase chain reaction test detected Mycobacterium tuberculosis complex in the skin fragment, which was confirmed by culture of the biopsy specimen using a liquid growth medium that grew M tuberculosis. Tuberculotic foci were not present on the lungs, gastrointestinal tract, kidneys, and bones by radiologic, microbiologic, and ultrasonographic investigations. The patient was started on 4 antituberculotic drugs--isoniazid 300 mg, rifampicin 600 mg, ethambutol 1200 mg, pyrazinamide 1500 mg--once daily for 2 months followed by isoniazid 300 mg and rifampicin 600 mg once daily for another 4 months with resolution of the skin lesions.
Cutaneous TB is an infectious disease caused by M tuberculosis and accounts for only 1.5% of extrapulmonary TB cases.1,2 Similar to other forms of TB, a resurgence of cutaneous TB has been noted in parts of the world where human immunodeficiency virus infection is prevalent and remains to be one of the most elusive and more difficult diseases to diagnose.3 Thought to be a predominantly occupational disease, it is being encountered more frequently in healthy individuals where the source of infection remains unidentified in most cases.4 The clinical types depend on the method of infection, virulence of the bacillus, immune status of the host, and presence or absence of host sensitization to M tuberculosis.2 The route of infection is used to classify cutaneous mycobacteriosis.5 Inoculation from an exogenous source can produce TB verrucosa cutis in individuals who have previously been sensitized to M tuberculosis or tuberculous chancre in individuals without prior exposure to the bacterium.4 Cutaneous TB resulting from direct spread to the skin from an underlying contiguous structure in most cases spreads from lymph nodes and bone (scrofuloderma). Immunosuppressed patients with advanced TB of the lung, gastrointestinal tract, or the genitourinary tract may present with periorificial TB.4 Dissemination to the skin caused by hematogenous spread can occur in the form of lupus vulgaris, miliary TB, or metastatic tuberculous abscesses (gummas).4,5 A fourth category--cutaneous TB from paradoxical expansion--also was proposed. Paradoxical expansion is defined as the transient expansion of a preexisting lesion or the appearance of new lesions during appropriate anti-TB therapy.5
Although histopathology and protein chain reaction tests are useful, the gold standard for diagnosis is still the isolation of M tuberculosis on culture.3,6 Treatment regimens of cutaneous TB are similar to those of pulmonary TB, with a 4-agent regimen given for 2 months followed by a 2-drug regimen for the next 4 months.1,7 The differential diagnosis of leg ulcers includes stasis ulcer, necrobiotic xanthogranuloma, pyoderma gangrenosum, and squamous cell carcinoma, among others. Cutaneous biopsy, microbiological culture, and a high degree of suspicion are fundamental for the final diagnosis. Cutaneous TB should be suspected in immunocompetent as well as in immunosuppressed patients who present with ulcerated lesions that do not respond to antibacterial treatment.
- Karoney MJ, Kaumbuki EK, Koech MK, et al. Primary cutaneous tuberculosis in a 27-year-old medical intern from needle-stick injury: a case report. Clin Case Rep. 2015;3:39-42.
- Spelta K, Diniz LM. Cutaneous tuberculosis: a 26-year retrospective study in an endemic area of tuberculosis, Vitória, Espírito Santo, Brazil. Rev Inst Med Trop Sao Paulo. 2016;58:49.
- Sahin N, Aydin NE, Senol M, et al. Longstanding skin ulcers due to Mycobacterium tuberculosis in a healthy man. Trop Biomed. 2010;27:120-124.
- Semaan R, Traboulsi R, Kanj S. Primary Mycobacterium tuberculosis complex cutaneous infection: report of two cases and literature review. Int J Infect Dis. 2008;12:472-477.
- Ram R, Uppin S, Swarnalatha G, et al. Isolated skin ulcers due to Mycobacterium tuberculosis in a renal allograft recipient. Nat Clin Pract Nephrol. 2007;3:688-693.
- Bravo FG, Gotuzzo E. Cutaneous tuberculosis. Clin Dermatol. 2007;25:173-180.
- Handog EB, Gabriel TG, Pineda RT. Management of cutaneous tuberculosis. Dermatol Ther. 2008;21:154-161.
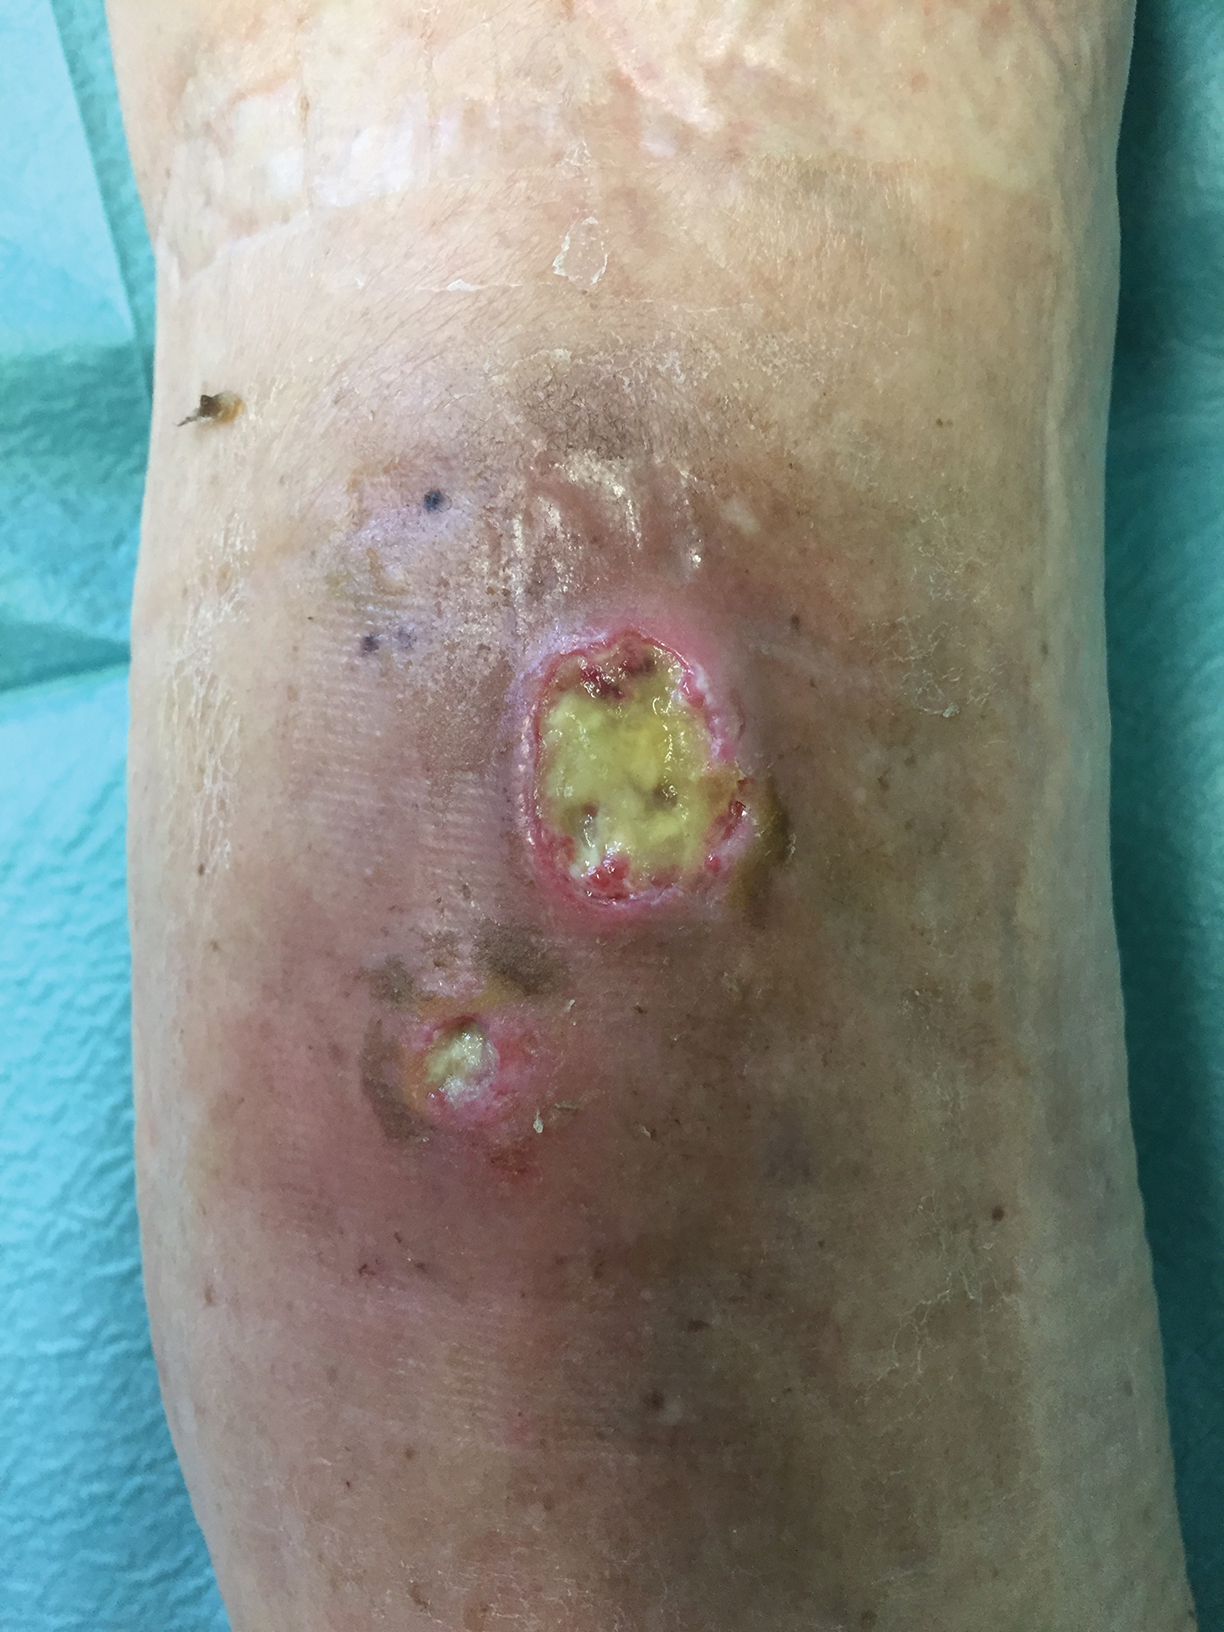
A 78-year-old man was referred to our clinic for evaluation of 2 painless round ulcers with an undermined edge and purulent discharge on the left posterior leg of 2 months' duration. The ulcers had appeared following a presumed trauma. He had received repeated courses of oral antibiotics and antifungals without improvement. No regional lymphadenopathy could be detected. Biochemical analyses were within reference range. Human immunodeficiency virus 1 and 2, hepatitis B and C antibodies, and a VDRL test were all negative.
Vaping-associated lung injury cases nears 1,300
according to a statement released by the Centers for Disease Control and Prevention.

These cases have been reported to the CDC from 49 states, the District of Columbia, and the U.S. Virgin Islands. The increase in lung injury cases from Oct. 1 (reported to be 1,080) represents both new patients and recent reporting of patients previously identified to the CDC.
Twenty-six deaths have been confirmed in 21 states and more deaths are currently being reviewed.
The causes of the injuries are still under investigation. The CDC stated, “The latest findings from the investigation into lung injuries associated with e-cigarette use, or vaping, suggest products containing THC play a role in the outbreak. All patients have a reported history of e-cigarette product use, or vaping, and no consistent evidence of an infectious cause has been discovered. Therefore, the suspected cause is a chemical exposure.” The specific chemical causing the lung injuries associated with vaping remains unknown at this time.
The CDC has created information hubs and resources for the public, for health care providers, and for state and local health department officials. The CDC has also provided additional resources to address the outbreak of vaping-associated lung injuries.
according to a statement released by the Centers for Disease Control and Prevention.
These cases have been reported to the CDC from 49 states, the District of Columbia, and the U.S. Virgin Islands. The increase in lung injury cases from Oct. 1 (reported to be 1,080) represents both new patients and recent reporting of patients previously identified to the CDC.
Twenty-six deaths have been confirmed in 21 states and more deaths are currently being reviewed.
The causes of the injuries are still under investigation. The CDC stated, “The latest findings from the investigation into lung injuries associated with e-cigarette use, or vaping, suggest products containing THC play a role in the outbreak. All patients have a reported history of e-cigarette product use, or vaping, and no consistent evidence of an infectious cause has been discovered. Therefore, the suspected cause is a chemical exposure.” The specific chemical causing the lung injuries associated with vaping remains unknown at this time.
The CDC has created information hubs and resources for the public, for health care providers, and for state and local health department officials. The CDC has also provided additional resources to address the outbreak of vaping-associated lung injuries.
REPORTING FROM CDC
Monthly and twice monthly emicizumab dosing safe for children with severe hemophilia A
Administration of twice-monthly or monthly emicizumab appears safe and effective for children with severe hemophilia A without inhibitors, according to a small cohort study.

After 24 weeks of treatment, only one moderate-intensity injection site reaction was reported, but no thrombotic microangiopathy or thromboembolic complications were observed.
The researchers evaluated the efficacy, safety, and pharmacokinetics of emicizumab in Japanese pediatric patients aged less than 12 years with severe hemophilia A without factor VIII inhibitors, wrote Midori Shima, MD, PhD, of Nara Medical University, Kashihara, Japan, and colleagues. The results were published in Haemophilia.
The open-label, nonrandomized study included 13 children who initially received weekly loading doses (3 mg/kg) of subcutaneous emicizumab for 4 weeks. Subsequently, patients received maintenance doses of 3 mg/kg every 2 weeks or 6 mg/kg every 4 weeks until week 24.
At baseline, the median age of patients in the 2- and 4-week dosing cohorts were 6.6 and 4.1 years, respectively. All participants had received factor VIII prophylaxis prior to starting emicizumab, with the exception of one patient.
Among six patients in the twice-monthly dosing cohort, two had no treated bleeding episodes, with an annualized bleeding rate for treated bleeding episodes of 1.3 (95% confidence interval, 0.6-2.9).
Among seven patients in the monthly dosing cohort, five had no treated bleeding episodes, with an annualized bleeding rate for treated bleeding episodes of 0.7 (95% CI, 0.2-2.6).
Caregivers completed a preference survey after the first 16 weeks of treatment, and “all reported a preference for emicizumab prophylaxis over the patient’s previous haemophilia treatment.” They cited the lower frequency of treatment and easier route of administration for favoring emicizumab.
With respect to pharmacokinetics, mean steady-state trough levels were within acceptable limits based on previous studies. No patients tested positive for anti-emicizumab antibodies.
The small sample size and nonrandomized design were key limitations of the study.
The results “confirm the appropriateness” of applying the every 2-week and every 4-week regimens of emicizumab in pediatric patients with hemophilia A without inhibitors, the researchers wrote.
The authors reported having financial affiliations with Chugai Pharmaceutical Co., which funded the study, and other companies.
SOURCE: Shima M et al. Haemophilia. 2019 Sep 12. doi: 10.1111/hae.13848.
Administration of twice-monthly or monthly emicizumab appears safe and effective for children with severe hemophilia A without inhibitors, according to a small cohort study.
After 24 weeks of treatment, only one moderate-intensity injection site reaction was reported, but no thrombotic microangiopathy or thromboembolic complications were observed.
The researchers evaluated the efficacy, safety, and pharmacokinetics of emicizumab in Japanese pediatric patients aged less than 12 years with severe hemophilia A without factor VIII inhibitors, wrote Midori Shima, MD, PhD, of Nara Medical University, Kashihara, Japan, and colleagues. The results were published in Haemophilia.
The open-label, nonrandomized study included 13 children who initially received weekly loading doses (3 mg/kg) of subcutaneous emicizumab for 4 weeks. Subsequently, patients received maintenance doses of 3 mg/kg every 2 weeks or 6 mg/kg every 4 weeks until week 24.
At baseline, the median age of patients in the 2- and 4-week dosing cohorts were 6.6 and 4.1 years, respectively. All participants had received factor VIII prophylaxis prior to starting emicizumab, with the exception of one patient.
Among six patients in the twice-monthly dosing cohort, two had no treated bleeding episodes, with an annualized bleeding rate for treated bleeding episodes of 1.3 (95% confidence interval, 0.6-2.9).
Among seven patients in the monthly dosing cohort, five had no treated bleeding episodes, with an annualized bleeding rate for treated bleeding episodes of 0.7 (95% CI, 0.2-2.6).
Caregivers completed a preference survey after the first 16 weeks of treatment, and “all reported a preference for emicizumab prophylaxis over the patient’s previous haemophilia treatment.” They cited the lower frequency of treatment and easier route of administration for favoring emicizumab.
With respect to pharmacokinetics, mean steady-state trough levels were within acceptable limits based on previous studies. No patients tested positive for anti-emicizumab antibodies.
The small sample size and nonrandomized design were key limitations of the study.
The results “confirm the appropriateness” of applying the every 2-week and every 4-week regimens of emicizumab in pediatric patients with hemophilia A without inhibitors, the researchers wrote.
The authors reported having financial affiliations with Chugai Pharmaceutical Co., which funded the study, and other companies.
SOURCE: Shima M et al. Haemophilia. 2019 Sep 12. doi: 10.1111/hae.13848.
FROM HAEMOPHILIA
Combined treatments provide control of pseudofolliculitis barbae in women
NEW YORK – For has been found highly effective, Wendy Roberts, MD, reported at the Skin of Color Update 2019.

“We didn’t have great treatments for this problem in the past, but the technology has evolved, and you can now get most women clear,” Dr. Roberts, a dermatologist who practices in Rancho Mirage, Calif., said at the meeting.
This approach is appropriate in all women, but Dr. Roberts focused on her experience with black patients, for whom an antioxidant cream is added to address the inflammatory-associated hyperpigmentation that often accompanies pseudofolliculitis barbae, a chronic inflammatory skin condition typically characterized by small, painful papules and pustules.
Start with microdermabrasion to treat the hypertrophic hair follicles and address keratin plugs, Dr. Roberts said. The microdermabrasion smooths the skin and increases penetration of subsequent creams and topics, she said.
“In the same session, I treat with Nd-YAG 1064 nm laser using short pulses,” she noted. For black women, she makes four passes with the laser at a level of moderate intensity. For those with lighter skin, she might perform as many as six passes with the laser set higher.
The microdermabrasion is repeated monthly for three or four treatments, but can be extended for those with persistent symptoms, Dr. Roberts pointed out. She presented a case of a patient who required seven treatments to achieve a satisfactory response.
Patients are instructed to avoid hair plucking and over the course of treatment nightly topical tretinoin is recommended for maintenance. Regular use of emollients is also recommended. For black women who have developed hyperpigmentation as a complication of pseudofolliculitis barbae, Dr. Roberts prescribes a lightening cream.
“I have pretty much moved away from hydroquinone,” said Dr. Roberts, explaining that she has achieved better results with topical cysteamine, a product that she has been using for about 3 years.
In outlining her treatment strategy, she employed case studies of two black women, both of whom achieved resolution of the problem and were satisfied with the results. She said that the same approach is suitable for women of other racial and ethnic groups.
Most commonly seen in black men, pseudofolliculitis barbae – also known as razor bumps – can occur as a complication of shaving in men or women from any racial and ethnic group. However, because of their embarrassment, women often fail to volunteer that they are struggling with this problem. Some women have been afflicted for years and have developed a regular routine of shaving or plucking hairs and then applying makeup for camouflage, Dr. Roberts said.
“This is a patient who rarely presents the problem to the dermatologist. Yet, she is in every one of our practices,” she added. Due to the frequency with which she has identified pseudofolliculitis barbae in patients who are being seen for a different complaint, she now routinely asks patients about this issue when taking a history. Early detection is useful because pseudofolliculitis barbae is more easily resolved in younger women than in older women.
When the problem is resolved, patient satisfaction is very high. For this reason, Dr. Roberts called diagnosis and treatment of pseudofolliculitis barbae “a practice builder.” Based on her approach, “you can really get these ladies clear.”
Dr. Roberts reports financial relationships with an extensive list of companies that market dermatologic and cosmetic products.
NEW YORK – For has been found highly effective, Wendy Roberts, MD, reported at the Skin of Color Update 2019.
“We didn’t have great treatments for this problem in the past, but the technology has evolved, and you can now get most women clear,” Dr. Roberts, a dermatologist who practices in Rancho Mirage, Calif., said at the meeting.
This approach is appropriate in all women, but Dr. Roberts focused on her experience with black patients, for whom an antioxidant cream is added to address the inflammatory-associated hyperpigmentation that often accompanies pseudofolliculitis barbae, a chronic inflammatory skin condition typically characterized by small, painful papules and pustules.
Start with microdermabrasion to treat the hypertrophic hair follicles and address keratin plugs, Dr. Roberts said. The microdermabrasion smooths the skin and increases penetration of subsequent creams and topics, she said.
“In the same session, I treat with Nd-YAG 1064 nm laser using short pulses,” she noted. For black women, she makes four passes with the laser at a level of moderate intensity. For those with lighter skin, she might perform as many as six passes with the laser set higher.
The microdermabrasion is repeated monthly for three or four treatments, but can be extended for those with persistent symptoms, Dr. Roberts pointed out. She presented a case of a patient who required seven treatments to achieve a satisfactory response.
Patients are instructed to avoid hair plucking and over the course of treatment nightly topical tretinoin is recommended for maintenance. Regular use of emollients is also recommended. For black women who have developed hyperpigmentation as a complication of pseudofolliculitis barbae, Dr. Roberts prescribes a lightening cream.
“I have pretty much moved away from hydroquinone,” said Dr. Roberts, explaining that she has achieved better results with topical cysteamine, a product that she has been using for about 3 years.
In outlining her treatment strategy, she employed case studies of two black women, both of whom achieved resolution of the problem and were satisfied with the results. She said that the same approach is suitable for women of other racial and ethnic groups.
Most commonly seen in black men, pseudofolliculitis barbae – also known as razor bumps – can occur as a complication of shaving in men or women from any racial and ethnic group. However, because of their embarrassment, women often fail to volunteer that they are struggling with this problem. Some women have been afflicted for years and have developed a regular routine of shaving or plucking hairs and then applying makeup for camouflage, Dr. Roberts said.
“This is a patient who rarely presents the problem to the dermatologist. Yet, she is in every one of our practices,” she added. Due to the frequency with which she has identified pseudofolliculitis barbae in patients who are being seen for a different complaint, she now routinely asks patients about this issue when taking a history. Early detection is useful because pseudofolliculitis barbae is more easily resolved in younger women than in older women.
When the problem is resolved, patient satisfaction is very high. For this reason, Dr. Roberts called diagnosis and treatment of pseudofolliculitis barbae “a practice builder.” Based on her approach, “you can really get these ladies clear.”
Dr. Roberts reports financial relationships with an extensive list of companies that market dermatologic and cosmetic products.
REPORTING FROM SOC 2019