User login
Targeting inactivity, mood, and cognition could be key to reducing OA mortality
LIVERPOOL, ENGLAND – Osteoarthritis is associated with an increased risk in mortality, but three factors – inactivity, low mood, and cognitive ability – could be important targets to reduce this risk, according to the results of a study presented at the World Congress on Osteoarthritis.
“There’s recently been increasing interest in whether osteoarthritis (OA) is associated with mortality as the literature has failed to find a consistent link,” said Simran Parmar, a third-year medical student at Keele University, Newcastle-Under-Lyme, U.K.

Three years later, data from another study (BMJ. 2011;342:d1165) suggested an increased risk, with standardized mortality ratios calculated to be 1.55 for all-cause mortality and 1.71 for cardiovascular-specific mortality when comparing those with OA to those without OA in the general population.
However, more recent meta-analyses, performed in 2016, have failed to show a relationship between mortality and OA (Semin Arthritis Rheum. 2016;46[2]:160–7; Sci Rep. 2016;6:24393).
“This could be because of heterogeneity among the studies,” Mr. Parmar reasoned, adding that there was still an unclear relationship between OA and mortality.
So the aim of the current study was not only to take another look at the association to determine its strength but also to see what factors might be mediating the association in order to perhaps explain why OA might be associated with an increased risk of death.
The analysis used data on more than 8,000 individuals participating in the NorStOP (North Staffordshire Osteoarthritis Project). This is a large, population-based, prospective cohort initiated in 2002 that includes adults aged 50 years or older who are registered at any of six general practices.
At baseline, the mean age of participants was 65 years, 51% were female, and just under 30% had OA. During 10 years of follow-up, 1,188 (14.7%) participants died.
Osteoarthritis was significantly associated with mortality in both unadjusted and adjusted analyses.
“For the average person presenting to general practice in North Staffordshire, there’s a 39.4% increased risk of mortality if they have osteoarthritis compared to if they don’t,” Mr. Parmar said.
After adjustment for potential confounding factors, such as age, NSAID use, and common comorbidities, the increased mortality risk remained, with around a 15% increased risk of death for those with OA versus those without.
“We proposed six different mediators of this relationship,” Mr. Parmar said. These were depression, anxiety, low walking frequency, cognitive impairment, insomnia, and obesity. “The reason we chose these is because they can be targets for therapy in primary care.”
Three mediators significantly affected the relationship: low walking frequency, depression, and cognitive impairment; the respective hazard ratios and 95% confidence intervals were 1.12 (1.09-1.15), 1.11 (1.08-1.15), and 1.06 (1.03-1.09).
“This tells us that these could possibly be on the pathway between osteoarthritis and mortality, and this could provide further evidence that they could be used for targeted therapy of osteoarthritis,” Mr. Parmar suggested.
“This type of mediation analysis has not been done in the osteoarthritis field before,” Mr. Parmar observed. He conceded that the mediators found might actually have contributed to the development of OA and that pain interference used in the definition of OA could have been caused by other factors.
Nevertheless, these data suggest that there may be actionable factors that could be used in primary care to reduce mortality in OA.
Mr. Parmar suggested that “encouraging physical activity and considering the impact of comorbidities can help reduce the risk of mortality in adults with osteoarthritis.”
The study was funded by Arthritis Research UK, the North Staffordshire Primary Care Consortium, and the Medical Research Council. Mr. Parmar had no conflicts of interest to disclose.
SOURCE: Parmar S et al. Osteoarthritis Cartilage. 2018;26(1):S14-15.
LIVERPOOL, ENGLAND – Osteoarthritis is associated with an increased risk in mortality, but three factors – inactivity, low mood, and cognitive ability – could be important targets to reduce this risk, according to the results of a study presented at the World Congress on Osteoarthritis.
“There’s recently been increasing interest in whether osteoarthritis (OA) is associated with mortality as the literature has failed to find a consistent link,” said Simran Parmar, a third-year medical student at Keele University, Newcastle-Under-Lyme, U.K.
Three years later, data from another study (BMJ. 2011;342:d1165) suggested an increased risk, with standardized mortality ratios calculated to be 1.55 for all-cause mortality and 1.71 for cardiovascular-specific mortality when comparing those with OA to those without OA in the general population.
However, more recent meta-analyses, performed in 2016, have failed to show a relationship between mortality and OA (Semin Arthritis Rheum. 2016;46[2]:160–7; Sci Rep. 2016;6:24393).
“This could be because of heterogeneity among the studies,” Mr. Parmar reasoned, adding that there was still an unclear relationship between OA and mortality.
So the aim of the current study was not only to take another look at the association to determine its strength but also to see what factors might be mediating the association in order to perhaps explain why OA might be associated with an increased risk of death.
The analysis used data on more than 8,000 individuals participating in the NorStOP (North Staffordshire Osteoarthritis Project). This is a large, population-based, prospective cohort initiated in 2002 that includes adults aged 50 years or older who are registered at any of six general practices.
At baseline, the mean age of participants was 65 years, 51% were female, and just under 30% had OA. During 10 years of follow-up, 1,188 (14.7%) participants died.
Osteoarthritis was significantly associated with mortality in both unadjusted and adjusted analyses.
“For the average person presenting to general practice in North Staffordshire, there’s a 39.4% increased risk of mortality if they have osteoarthritis compared to if they don’t,” Mr. Parmar said.
After adjustment for potential confounding factors, such as age, NSAID use, and common comorbidities, the increased mortality risk remained, with around a 15% increased risk of death for those with OA versus those without.
“We proposed six different mediators of this relationship,” Mr. Parmar said. These were depression, anxiety, low walking frequency, cognitive impairment, insomnia, and obesity. “The reason we chose these is because they can be targets for therapy in primary care.”
Three mediators significantly affected the relationship: low walking frequency, depression, and cognitive impairment; the respective hazard ratios and 95% confidence intervals were 1.12 (1.09-1.15), 1.11 (1.08-1.15), and 1.06 (1.03-1.09).
“This tells us that these could possibly be on the pathway between osteoarthritis and mortality, and this could provide further evidence that they could be used for targeted therapy of osteoarthritis,” Mr. Parmar suggested.
“This type of mediation analysis has not been done in the osteoarthritis field before,” Mr. Parmar observed. He conceded that the mediators found might actually have contributed to the development of OA and that pain interference used in the definition of OA could have been caused by other factors.
Nevertheless, these data suggest that there may be actionable factors that could be used in primary care to reduce mortality in OA.
Mr. Parmar suggested that “encouraging physical activity and considering the impact of comorbidities can help reduce the risk of mortality in adults with osteoarthritis.”
The study was funded by Arthritis Research UK, the North Staffordshire Primary Care Consortium, and the Medical Research Council. Mr. Parmar had no conflicts of interest to disclose.
SOURCE: Parmar S et al. Osteoarthritis Cartilage. 2018;26(1):S14-15.
REPORTING FROM OARSI 2018
Key clinical point:
Major finding: OA is associated with a 15% increased risk of mortality in the general population.
Study details: A large, prospective cohort study that included more than 8,000 adults older than 50 years in the general population who participated.
Disclosures: The study was funded by Arthritis Research UK, the North Staffordshire Primary Care Consortium, and the Medical Research Council. Mr. Parmar had no conflicts of interest to disclose.
Source: Parmar S et al. Osteoarthritis Cartilage. 2018;26(1):S14-15.
May 2018 - What's your diagnosis?
By Umberto G. Rossi, MD, Paolo Rigamonti, MD, and Maurizio Cariati, MD
Intraluminal gallbladder arterial hemorrhage as a complication of arteriosclerosis and anticoagulant therapy
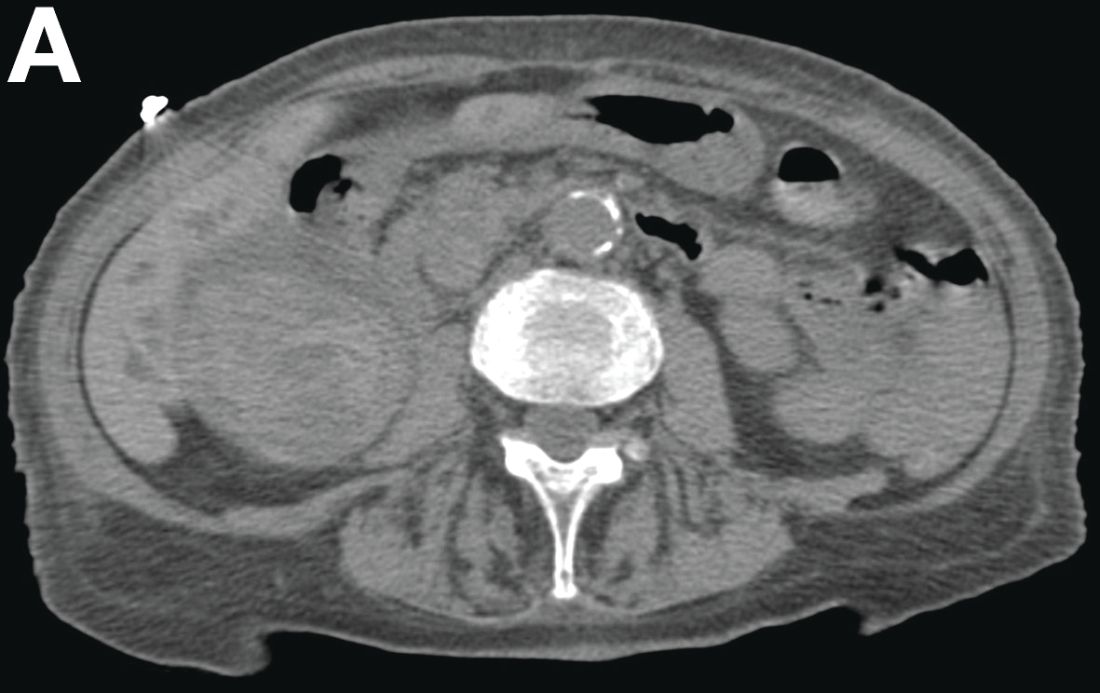
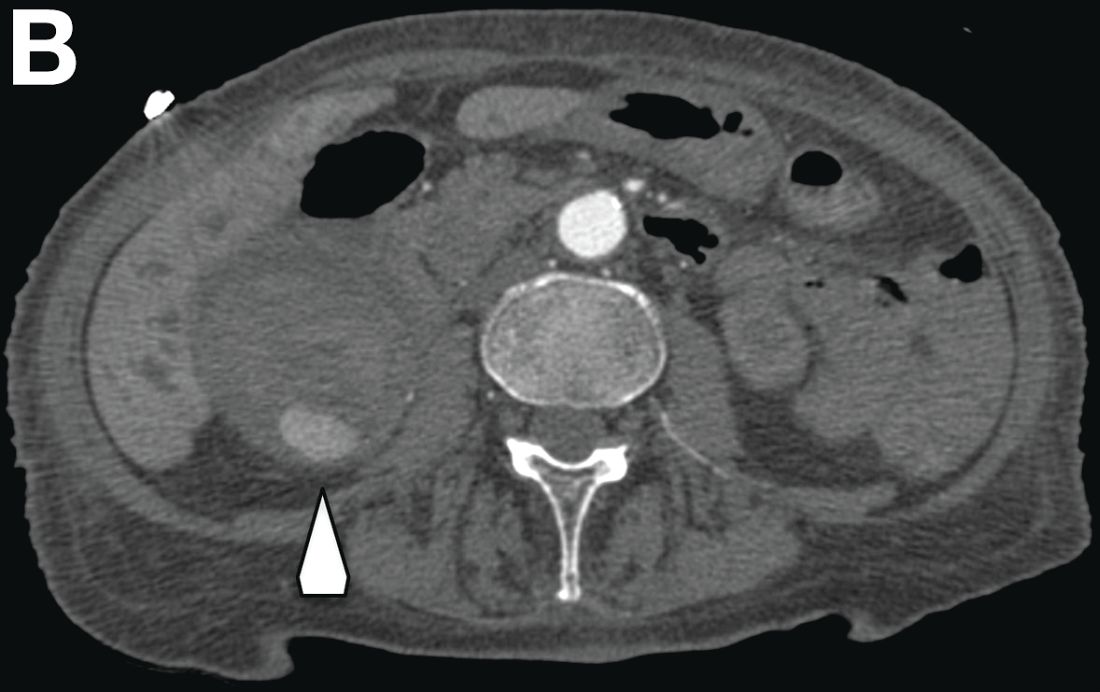
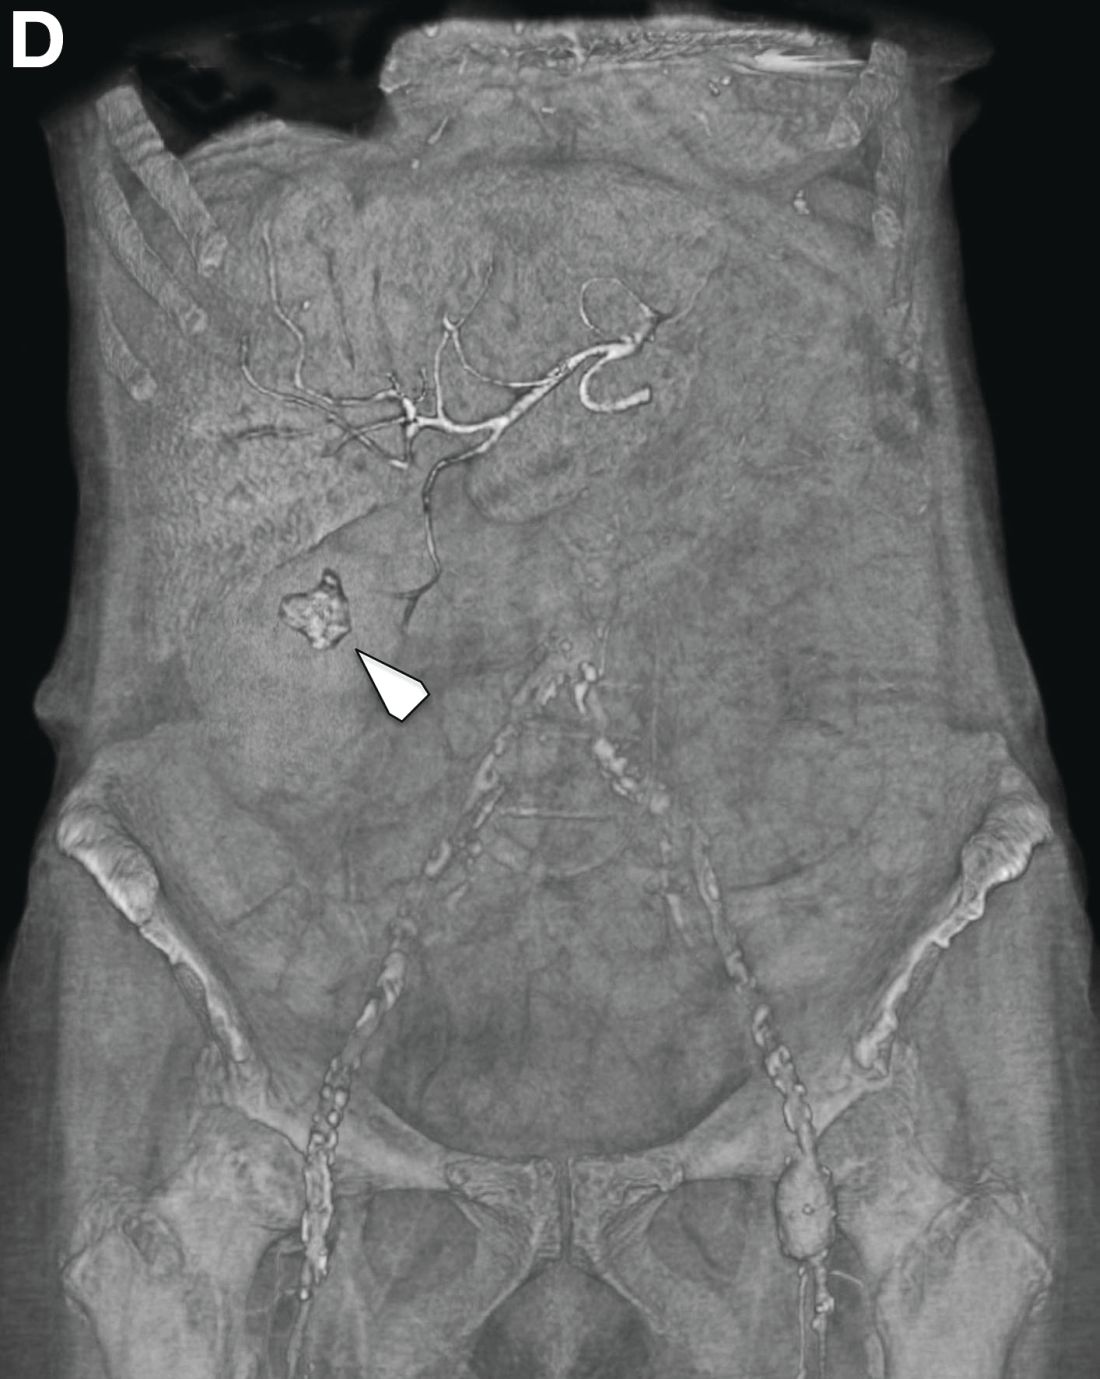
This radiologic sign on multiphasic contrast-enhanced multidetector computed tomography with axial images (Figure A-C), coronal multiplanar reconstruction (Figure D) and coronal volume rendering technique were indicative for active hemorrhage of gallbladder wall. During the urgent surgical treatment, there was confirmation of that distended gallbladder. Postoperatively, opening of the gallbladder revealed in its lumen the presence of bile mixed with dishomogeneous blood clots. Pathologic evaluation demonstrated arteriosclerosis of the cystic artery, with a pseudoaneurysmatic tear of one of its collateral branches with focal surround inflammatory tissue of gallbladder wall. The postoperative course was uneventful, and the patient was discharged on day 8.
Hemorrhage from the gallbladder is not a frequent event.1 The etiologies for hemorrhage of the gallbladder are trauma, neoplasms, inflammation of the wall with gallstones, aneurysms, varicose veins with portal hypertension, arteriosclerosis, and coagulopathy. However, isolated gallbladder arterial hemorrhage owing to anticoagulation therapy has been reported rarely. This pathologic state can be detected by contrast-enhanced ultrasound, contrast-enhanced computed tomography, and digital subtraction angiography.2,3
References
1. Hudson, P.B., Johnson, P.P. Hemorrhage from the gall bladder. N Engl J Med. 1946;234:438-41.
2. Krudy, A.G., Doppman, J.L., Bissonette, M.B., et al. Hemobilia: computed tomographic diagnosis. Radiology. 1983;148:785-9.
3. Pandya, R., O'Malley, C. Hemorrhagic cholecystitis as a complication of anticoagulant therapy: role of CT in its diagnosis. Abdom Imaging. 2008;33:652-3.
By Umberto G. Rossi, MD, Paolo Rigamonti, MD, and Maurizio Cariati, MD
Intraluminal gallbladder arterial hemorrhage as a complication of arteriosclerosis and anticoagulant therapy
This radiologic sign on multiphasic contrast-enhanced multidetector computed tomography with axial images (Figure A-C), coronal multiplanar reconstruction (Figure D) and coronal volume rendering technique were indicative for active hemorrhage of gallbladder wall. During the urgent surgical treatment, there was confirmation of that distended gallbladder. Postoperatively, opening of the gallbladder revealed in its lumen the presence of bile mixed with dishomogeneous blood clots. Pathologic evaluation demonstrated arteriosclerosis of the cystic artery, with a pseudoaneurysmatic tear of one of its collateral branches with focal surround inflammatory tissue of gallbladder wall. The postoperative course was uneventful, and the patient was discharged on day 8.
Hemorrhage from the gallbladder is not a frequent event.1 The etiologies for hemorrhage of the gallbladder are trauma, neoplasms, inflammation of the wall with gallstones, aneurysms, varicose veins with portal hypertension, arteriosclerosis, and coagulopathy. However, isolated gallbladder arterial hemorrhage owing to anticoagulation therapy has been reported rarely. This pathologic state can be detected by contrast-enhanced ultrasound, contrast-enhanced computed tomography, and digital subtraction angiography.2,3
References
1. Hudson, P.B., Johnson, P.P. Hemorrhage from the gall bladder. N Engl J Med. 1946;234:438-41.
2. Krudy, A.G., Doppman, J.L., Bissonette, M.B., et al. Hemobilia: computed tomographic diagnosis. Radiology. 1983;148:785-9.
3. Pandya, R., O'Malley, C. Hemorrhagic cholecystitis as a complication of anticoagulant therapy: role of CT in its diagnosis. Abdom Imaging. 2008;33:652-3.
She had a medical history of cardiac arrhythmia (atrial fibrillation) with pacemaker insertion and anticoagulant therapy (warfarin 2.5 mg/d).
There was no alteration in liver function tests.
She underwent abdominal multiphasic contrast-enhanced multidetector computed tomography.
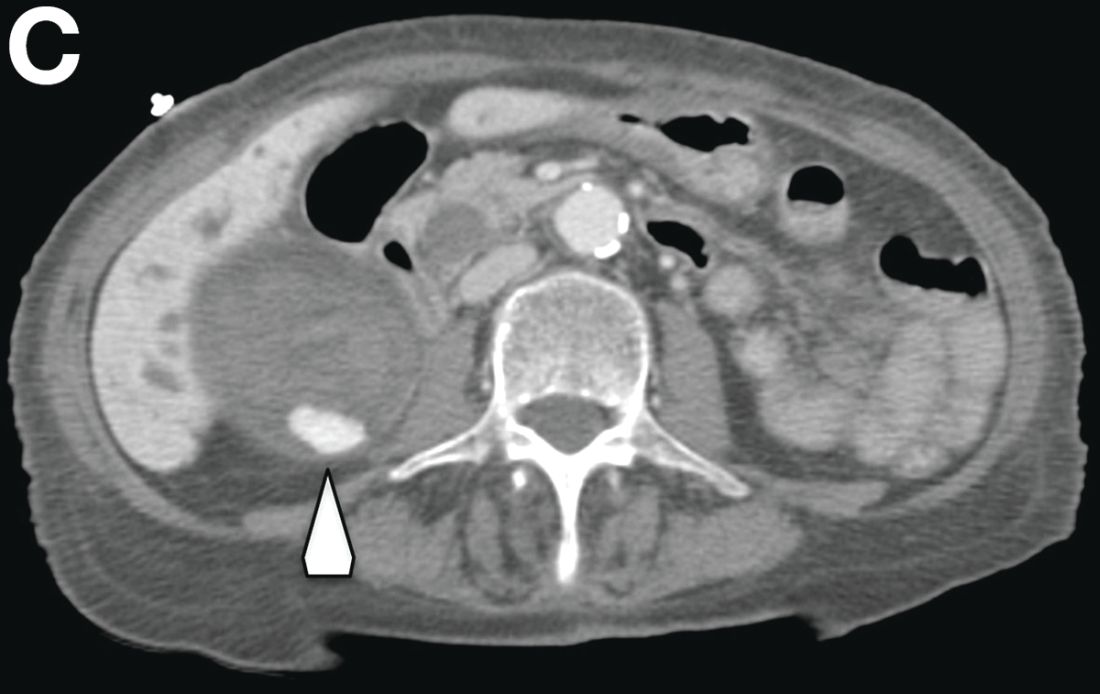
On the arterial phase (Figure B, arrowhead) it appeared inside the lumen of the gallbladder at the middle third of the inferior wall, a focal contrast media area, which become more evident on venous phase (Figure C, D, arrowhead).
CMS will release Medicare Advantage claims data to researchers
WASHINGTON – Centers for Medicare & Medicaid Services Administrator Seema Verma announced.

“We recognize that the Medicare Advantage data are not perfect, but we have determined that the quality of the available data is adequate enough to support research,” Ms. Verma told attendees April 26 at an annual conference on health data and innovation.
CMS is starting with the Medicare managed care plans’ encounter data from 2015, and Ms. Verma said the data will be updated annually.
In addition, she announced that in 2019 CMS will make Medicaid and Children’s Health Insurance Program data available. That will give researchers access to data from another 70 million patients.
Ms. Verma noted that the Medicaid population includes a range of people, including people with disabilities, pregnant women, children, and low-income adults. Those low-income adults “often experience multiple health issues and face challenges managing their care,” Ms. Verma noted. “Our hope is that these data will be used for critical research on this vulnerable population.”
CMS also will look to the health information technology developer community to create open application program interface tools “to modernize how we share data with our partners,” she said. That push is part of the overall MyHealthEData initiative to improve patient access to their health data and become more informed about their own health care.
“Who knows what knowledge, treatments, and cures are hidden in the reams of CMS data?” Ms. Verma said. “Help us use it securely. After all, this is knowledge that could change the life of a patient or the trajectory of a health care system.”
WASHINGTON – Centers for Medicare & Medicaid Services Administrator Seema Verma announced.
“We recognize that the Medicare Advantage data are not perfect, but we have determined that the quality of the available data is adequate enough to support research,” Ms. Verma told attendees April 26 at an annual conference on health data and innovation.
CMS is starting with the Medicare managed care plans’ encounter data from 2015, and Ms. Verma said the data will be updated annually.
In addition, she announced that in 2019 CMS will make Medicaid and Children’s Health Insurance Program data available. That will give researchers access to data from another 70 million patients.
Ms. Verma noted that the Medicaid population includes a range of people, including people with disabilities, pregnant women, children, and low-income adults. Those low-income adults “often experience multiple health issues and face challenges managing their care,” Ms. Verma noted. “Our hope is that these data will be used for critical research on this vulnerable population.”
CMS also will look to the health information technology developer community to create open application program interface tools “to modernize how we share data with our partners,” she said. That push is part of the overall MyHealthEData initiative to improve patient access to their health data and become more informed about their own health care.
“Who knows what knowledge, treatments, and cures are hidden in the reams of CMS data?” Ms. Verma said. “Help us use it securely. After all, this is knowledge that could change the life of a patient or the trajectory of a health care system.”
REPORTING FROM HEALTH DATAPALOOZA 2018
DDSEP8 Quick quiz May question 2
Correct Answer: B
Rationale
This patient has a neuroendocrine tumor (e.g., carcinoid). These tumors are derived from enterochromaffin-like cells and appear as nests or ribbons of endocrine cells. There are three types of carcinoids. Type 1 is the most common and has a benign course. Type 1 neuroendocrine tumors can be multifocal, well-differentiated and associated with type A chronic atrophic gastritis. Small tumors can be treated with endoscopic resection. Type 2 lesions tend to be multifocal and associated with Zollinger-Ellison syndrome (ZES) and multiple endocrine neoplasia 1 (MEN1). Up to 30% of type 2 tumors present with lymph node metastases. Type 3 gastric carcinoids are not associated with hypergastrinemia and have poor prognosis. Type 3 gastric carcinoids should be managed with surgery.
References
1. ASGE Standards of Practice Committee, Evans JA, Chandrasekhara V, et al. The role of endoscopy in the management of premalignant and malignant conditions of the stomach. Gastrointest Endosc. 2015;82(1):1-8.
2. Shaib YH, Rugge M, Graham DY, et al. Management of gastric polyps: an endoscopy-based approach. Clin Gastroenterol Hepatol. 2013;11(11):1374-84.
A 78-year-old woman presents with anemia and peripheral neuropathy. Laboratory evaluation reveals elevated MCV and vitamin B12 deficiency. Antiparietal and anti-intrinsic factor antibodies are positive. Endoscopy reveals atrophic-appearing mucosa and an 8-mm nodule in the gastric body. Complete endoscopic resection of the nodule is performed.
DDSEP8 Quick quiz May question 1
Correct Answer: C
Rationale
In a population study of U.S. veterans infected with hepatitis C (n = 110,484), a Cox proportional hazards model was used to determine risk of developing cirrhosis and hepatocellular carcinoma for genotypes 1-4, after adjusting for age, period of service, race, gender, human immunodeficiency virus (HIV) infection, alcohol use, diabetes, body mass index, and antiviral treatment. Despite genotype 3 patients being younger, their risk of developing cirrhosis was highest with hazard ratio = 1.30 (1.22, 1.39), compared to genotype 1 (reference, HR 1.0), genotype 2 with HR = 0.68 (0.64, 0.73), and genotype 4 with HR = 0.94 (0.78, 1.14). Likewise, the risk of development of hepatocellular carcinoma was highest for genotype 3 HCV with HR = 1.80 (1.60, 2.03), compared to a genotype 2 (HR = 0.55, 0.47, 0.63), and genotype 4 (0.99, 0.68, 1.45).
It is speculated that the hepatic steatosis that is a direct result of genotype 3 HCV may contribute to the accelerated progression to cirrhosis and HCC, but this has not been proven and was not evaluated in this Veteran Affairs study.
Reference
1. Kanwal F, Kramer JR, Ilyas J, et al. HCV genotype 3 is associated with an increased risk of cirrhosis and hepatocellular cancer in a national sample of U.S. veterans with HCV. Hepatology. 2014;60(1):98-105.
Which HCV genotype is associated with the highest risk of cirrhosis and hepatocellular carcinoma?
High Cajal cell count with gastric electrical stimulation improves symptoms for refractory gastroparesis patients
and researchers suggested patients with depleted Cajal cells who did not improve could have lost certain Cajal cells.
Thomas L. Abell, MD, from the department of medicine and division of gastroenterology, hepatology and nutrition at the University of Louisville (Ky.) and his colleagues recruited 23 patients with drug-refractory gastroparesis to undergo gastric electrical stimulation (GES) therapy for 12 months. Patients were white females with a mean age of 45.7 years. They performed a gastric-emptying test before therapy; the composite symptom scores were 23.89 plus or minus 34.10 for 4-hour gastric emptying in the group with interstitial cells of Cajal (ICC) less than 2.00 and a 22.62 plus or minus 25.51 in the group with ICC greater than or equal to 2.00.
“We believe neurostimulation might modify or augment the function of ICC cells. However, in patients with severe depletion, the ICC density might be too sparse to be augmented and hence contribute to suboptimal response to GES,” Dr. Abell and colleagues wrote in their study.
The GES system consisted of an “implanted pulse generator, two leads, and the stimulator programmer.” Patients used a trial GES system for 1-2 weeks, in which a “temporary lead is placed endoscopically through the nose and inserted into the gastric mucosa in the middle of the stomach.”
After the trial GES system, the researchers performed a gastric wall biopsy to determine ICC counts to divide the patients into two groups: those with less than 2 ICC and those with greater than or equal to 2 ICC (per high power field). Following the trial, a more permanent system was implanted and researchers analyzed results after 12 months with the Student t test, patient-reported symptom assessment, and Total Symptom Score (TSS) using a Likert scale.
After GES, 1-hour gastric emptying improved in the group with ICC greater than or equal to 2.00 from pretreatment (75.47 plus or minus 13.80) to posttreatment (57.97 plus or minus 21.34) with a mean between-group difference of 17.5% (95% confidence interval, 1.41-33.58; P = .035). Dr. Abell and colleagues noted a nonstatistically significant improvement in 2-hour (mean between-group difference, 8%) and 4-hour (4%) gastric emptying (P = .032). Compared with pretreatment, patients with an ICC count less that 2 showed no significant change at 1-hour (63.78 plus or minus 26.01 vs. 68.86 plus or minus 33.14; P = .646), 7% worsening at 2-hour (41.22 plus or minus 33.44 vs. 49.37 plus or minus 34.21; P = .343) and 7% worsening at 4-hour gastric emptying (23.89 plus or minus 34.10 vs. 30.82 plus or minus 30.82; P = .166).
Researchers found patients with “normal to moderate depletion of ICC counts” had a significantly higher change in serosal amplitude, with a mean amplitude change of 0.19 (P = .05). Patients with “severe depletion of ICC” showed no significant change in amplitude (mean amplitude change, 0.01; P = .79). Among patients with normal or moderate depletion of ICC, the pre-GES serosal frequency was 3.96 plus or minus 1.02 and the post-GES frequency was 3.83 plus or minus 1.36 (P = .79), while the patients with severe depletion of ICC had a pre-GES frequency of 4.67 plus or minus 1.57 and a post-GES frequency of 4.23 plus or minus 1.30 (P = .54).
Nausea and vomiting symptoms significantly improved in the group with ICC greater than or equal to 2.00 (vomiting change, –2.07; P less than .001 and bloating change, –1.80; P less than .001) with a weaker association with symptom improvement in the group with ICC less than 2.00 (vomiting change, –1.65; P =.035 and bloating change, –1.00; P = 0.86). TSS improved by 52% in the ICC group with greater than or equal to 2.00 (P = .002) and by 29.6% in the ICC less than 2.00 group (P = .047).
“The observation that some patients with severe depletion of ICC showed improvement in symptoms might indicate differential loss of specific type of ICC cells,” Dr. Abell and his colleagues wrote. “Better understanding of response to GES in patients with particular type of ICC loss might shed light on the mechanism of GES, as well as predicting and selecting patients who respond better. Future studies should focus on stratifying patients based on predominant type of ICC loss as it relates to severity of symptoms and response to GES.”
Dr. Abell is the founder of ADEPT-GI and has intellectual property rights related to the technology in this study. The other authors declare no relevant financial disclosures.
SOURCE: Omer E et al. J Clin Gastroenterol. 2018 Apr 18. doi: 10.1097/MCG.0000000000001025.
*This story was updated on 4/30/2018.
FROM JOURNAL OF CLINICAL GASTROENTEROLOGY
Key clinical point: Higher Cajal cell counts were linked to improved symptoms and gastric electrical activity in patients with drug-refractory gastroparesis who underwent neurostimulation.
Major finding: The rate of 1-hour gastric emptying significantly improved in patients with interstitial cells of Cajal greater than or equal to two after gastric electrical stimulation with a mean group difference of 17.5%, as well as a mean serosal amplitude change of 0.19.
Study details: A single-center study of 23 women with drug-refractory gastroparesis recruited from the gastric motility clinic at the University of Mississippi.
Disclosures: Dr. Abell is the founder of ADEPT-GI and has intellectual property rights related to the technology in this study. The other authors declare no relevant financial disclosures.
Source: Omer E et al. J Clin Gastroenterol. 2018 Apr 18. doi: 10.1097/MCG.0000000000001025.
Mixin’ it up
What percentage of your office visits are a response to an acute complaint? What percentage are prescheduled well-child visits? And how many are follow-ups to manage chronic conditions and behavioral problems?
You probably have a sense of how you are spending your time in the office, but do you really have the numbers to support your guesstimate of the patient mix? Does anyone in your organization have that data? You probably could come up with some numbers in a few hours with a pencil and your office schedule for the last 2 months. However, learning how much of your income is generated by each category of visit would be more difficult.
Before you run out to the front desk and ask the receptionist to delete your same-day slots and replace them with a few preventive and chronic care visits, we should question a few of Mr. Hart’s assertions.
Of course, like you, I never spent the time to learn which categories of office visit were driving my income. However, I do know that I saw a stimulating mix of acute and chronic visits, and the most important number, the bottom line, was more than adequate for my needs. To achieve this profitable balance of visits meant that I needed to be as efficient as the patients’ complaints would allow. There is an often-repeated myth that there is a direct correlation between the length of time a physician spends with the patient and the quality of the visit. In my experience, patients are more impressed by the physician’s level of attention and concern than the amount of time he spends in the exam room.

You might argue that you just don’t have the time to fit in all those acute visits. But have you had the courage to open up your schedule, maybe hire more staff, and give it a try? It takes a bit of shift in mindset and the acknowledgment that a large part of what we call preventive care has not proved effective. Immunizations? Yes, but the rest, not so much.
I know this is a heretical proposition but I found that I knew my patients better after seeing them when they were in need rather than in the less frequent but longer encounters of a health maintenance visit. It takes work, but there is room for both kinds of visit.
Dr. Wilkoff practiced primary care pediatrics in Brunswick, Maine for nearly 40 years. He has authored several books on behavioral pediatrics, including “How to Say No to Your Toddler.” Email him at [email protected].
What percentage of your office visits are a response to an acute complaint? What percentage are prescheduled well-child visits? And how many are follow-ups to manage chronic conditions and behavioral problems?
You probably have a sense of how you are spending your time in the office, but do you really have the numbers to support your guesstimate of the patient mix? Does anyone in your organization have that data? You probably could come up with some numbers in a few hours with a pencil and your office schedule for the last 2 months. However, learning how much of your income is generated by each category of visit would be more difficult.
Before you run out to the front desk and ask the receptionist to delete your same-day slots and replace them with a few preventive and chronic care visits, we should question a few of Mr. Hart’s assertions.
Of course, like you, I never spent the time to learn which categories of office visit were driving my income. However, I do know that I saw a stimulating mix of acute and chronic visits, and the most important number, the bottom line, was more than adequate for my needs. To achieve this profitable balance of visits meant that I needed to be as efficient as the patients’ complaints would allow. There is an often-repeated myth that there is a direct correlation between the length of time a physician spends with the patient and the quality of the visit. In my experience, patients are more impressed by the physician’s level of attention and concern than the amount of time he spends in the exam room.
You might argue that you just don’t have the time to fit in all those acute visits. But have you had the courage to open up your schedule, maybe hire more staff, and give it a try? It takes a bit of shift in mindset and the acknowledgment that a large part of what we call preventive care has not proved effective. Immunizations? Yes, but the rest, not so much.
I know this is a heretical proposition but I found that I knew my patients better after seeing them when they were in need rather than in the less frequent but longer encounters of a health maintenance visit. It takes work, but there is room for both kinds of visit.
Dr. Wilkoff practiced primary care pediatrics in Brunswick, Maine for nearly 40 years. He has authored several books on behavioral pediatrics, including “How to Say No to Your Toddler.” Email him at [email protected].
Nickel allergy common in children, significantly higher in girls
said Erin M. Warshaw, MD, MS, of the University of Minnesota, Minneapolis, and her associates.
“Although nickel sensitivity is reported to be problematic in children, the pediatric population is often underrepresented in large-scale epidemiologic studies,” they added.
In this retrospective, cross-sectional study of 1,894 children aged 18 years or younger tested by the North American Contact Dermatitis Group (NACDG) between 1994 and 2014, 23.7% of those patch tested were found to be sensitive to nickel. This included 6.5% who were 5 years or younger, 34.2% who were 6-12 years, and 59.4% who were 13-18 years.
Among all three patient groups, jewelry was the most common source of nickel sensitivity (36.4%), and this sensitivity was found to increase with age (5 years and younger, 20.7%; 6-12 years, 28.3%; and 13-18 years, 42.9%; P = .0006).
More than two-thirds of positive patch test reactions to nickel were found to be extreme or strong, Dr. Warshaw and her colleagues reported in the Journal of the American Academy of Dermatology.
Notably, girls were significantly more likely to exhibit nickel sensitivity than boys, a result the authors credit to “trends and social norms. ”
Citing a separate study conducted recently by NACDG on the correlation between piercing and nickel sensitivity across all ages, researchers found that females were significantly more likely to have piercings than were males, and with age, they speculated, “girls may be more likely to encounter high nickel release through piercing jewelry, bracelets, necklaces, hair clips, etc., resulting in higher proportions of girls than boys with nickel allergy.”
Nickel release, not nickel content, is an important factor in cases of nickel allergic contact dermatitis, the authors added. For nickel release to occur, prolonged skin contact is required. According to the European Chemicals Agency, prolonged exposure is defined as more than 10 minutes over three or more occasions within a 2-week period or more than 30 minutes over one or more occasion within the same 2 weeks.
The research was funded by the Minneapolis Veterans Affairs Medical Center, and in part, by the Nickel Producers Environmental Research Association. Three of the researchers have ties to various pharmaceutical companies and other organizations. Dr. Warshaw and the remaining researchers had no relevant financial disclosures.
SOURCE: Warshaw EM et al. J Am Acad Dermatol. 2018 Apr 14. doi: 10.1016/j.jaad.2018.02.071.
FROM THE JOURNAL OF THE AMERICAN ACADEMY OF DERMATOLOGY
Key clinical point: This U.S. study reinforces other recent investigations citing high occurrence of pediatric nickel-associated allergic contact dermatitis.
Major finding: Almost one-quarter (23.7%) of almost 2,000 children patch tested were found to have nickel sensitivity.
Study details: Retrospective, cross-sectional study of 1,894 pediatric patients.
Disclosures: The research was funded by the Minneapolis Veterans Affairs Medical Center, and in part by the Nickel Producers Environmental Research Association. Three of the researchers have ties to various pharmaceutical companies and other organizations. Dr. Warshaw and the remaining researchers had no relevant financial disclosures.
Source: Warshaw EM et al. J Am Acad Dermatol. 2018 Apr 14. doi: 10.1016/j.jaad.2018.02.071.

Leg lymphedema after gynecologic lymphadenectomy exceeds expectations
NEW ORLEANS – Leg lymphedema occurred in 19%-40% of women with a gynecologic cancer who underwent surgery with lymphadenectomy in a prospective study of 821 U.S. patients.
The incidence of lymphedema of the lower extremity (LLE) during 2 years of follow-up was 18% among 672 endometrial cancer patients, 25% among 124 cervical cancer patients, and 40% among 24 vulvar cancer patients, Jay W. Carlson, DO, said at the annual meeting of the Society of Gynecologic Oncology.
Although the study followed patients for 2 years after surgery, 84% of the LLE events occurred within the first 6 months after surgery, and 95% within the first 12 months. The robust incidence rates documented in this study contrasted with a general perception that LLE is relatively uncommon, leading Dr. Carlson to note that the new data show “the incidence of LLE is under recognized.” The findings also bucked conventional wisdom by showing no link between the incidence of LLE and number of lymph nodes dissected or with use of radiation treatment, said Dr. Carlson, a gynecologic oncologist at Mercy Clinic Women’s Oncology in Springfield, Mo.
To better define the incidence of LLE after lymphadenectomy for gynecologic cancers, the Gynecologic Oncology Group organized the Lymphedema and Gynecologic Cancer (LEG) study, run at more than 70 U.S. centers during June 2012–November 2014. The study enrolled patients scheduled for surgery to treat endometrial, cervical, or vulvar cancer, and applied systematic leg measurement to patients just before and at several prespecified times following surgery through 2 years of follow-up.
The study began with a total of 1,054 patients, but the final analysis that Dr. Carlson presented excluded patients who did not actually undergo lymphadenectomy during their surgery, did not have leg volume data available both before and after their surgery, or had a comorbidity or change in body mass that could have caused the change in leg size. The researchers also required patients identified with LLE to have completed the Gynecologic Cancer Lymphedema Questionnaire (Gynecol Oncol. 2010 May;117[2]:317-23) and tallied a score of at least 4, and to have at least a 10% increase in leg volume at the time of diagnosis, compared with the presurgical volume.
The exclusions yielded a total of 672 patients with endometrial cancer, including 127 who developed LLE (19%); 124 patients with cervical cancer, including 31 who developed LLE (25%); and 25 patients with vulvar cancer, including 10 who developed LLE (40%), Dr. Carlson reported.
Analysis of the patients who developed LLE showed no significant association with type of surgery (open, robotic, or laparoscopic), and no significant associations with several patient-specific factors including age, race, cancer stage, surgical blood loss, or serum albumin, he said.
[email protected]
On Twitter @mitchelzoler
SOURCE: Carlson J et al. SGO 2018, Abstract 11.
REPORTING FROM SGO 2018
Key clinical point: Leg lymphedema is common following lymphadenectomy for a gynecologic cancer.
Major finding: Leg lymphedema incidence was 19%-40% during 2-year follow-up after lymphadenectomy during gynecologic cancer surgery.
Study details: LEG, a multicenter, U.S. prospective study with 821 gynecologic cancer patients in the final analysis.
Disclosures: LEG had no commercial funding. Dr. Carlson had no disclosures.
Source: Carlson J et al. SGO 2018, Abstract 11.
Dasatinib activity prominent in subset of GIST patients
Dasatinib might have activity in some subsets of patients with imatinib-resistant gastrointestinal stromal tumors (GISTs), investigators have reported.
The tyrosine kinase inhibitor had a 29% rate of 6-month progression-free survival (PFS) in a nonrandomized, 50-patient study.
That PFS rate was well above the 10% threshold that would have constituted evidence of inactive treatment, but it “fell just short of our goal” of 30% that would have been considered evidence of drug activity, wrote Scott M. Schuetze, MD, PhD, of the department of internal medicine, University of Michigan, Ann Arbor, and his coauthors. The report was published in JAMA Oncology.
It was also higher than the 16% 6-month PFS rate reported in a randomized trial of sunitinib, which was approved for imatinib-resistant GIST treatment in 2006. However, it was lower than the 38% 6-month PFS rate reported for regorafenib, which was approved in 2013 for that indication, the researchers noted.
Exploratory analyses did identify a few biomarker-driven subsets that might particularly benefit from dasatinib therapy. Notably, the 6-month PFS rate was 50% for patients with tumors expressing phosphorylated SRC.
While intriguing, the results of the exploratory analyses are hampered by the small number of patients enrolled in the trial; only 14 patients in the study had phosphorylated SRC.
“Further studies should explore whether activated SRC is a prognostic biomarker of more indolent disease, or is a predictive biomarker of response to tyrosine kinase therapy,” the researchers wrote.
Patients in the study had imatinib refractory GIST. They received dasatinib 70 mg twice daily. They were enrolled in 2008-2009 and followed for at least 5 years.
In addition to previously receiving imatinib, most enrollees (80%) had already been treated with sunitinib as well. The study started before the approval of sunitinib in GIST, but after the approval of regorafenib, the investigators noted.
“Preclinical research suggested that dasatinib had higher potency against mutations in the activation domain of KIT and PDGFRA than imatinib and sunitinib,” the authors recounted.
This trial did provide some evidence in support of that preclinical data: One patient with a specific mutation in PDGFRA exhibited prolonged tumor control.
Bristol-Myers Squibb provided funding for the trial and dasatinib. Dr. Schuetze reported disclosures related to Novartis, Amgen, Janssen, Daiichi-Sankyo, Eli Lilly, and AB Science.
SOURCE: Schuetze SM et al. 2018 Apr 26. doi: 10.1001/jamaoncol.2018.0601.
FROM JAMA ONCOLOGY
Key clinical point: The efficacy of dasatinib in imatinib-resistant GIST was just short of what investigators considered evidence of an active drug.
Major finding: The estimated rate of 6-month progression-free survival was 29% overall, though it was 50% in one biomarker-defined patient subset.
Study details: A nonrandomized single-arm study of 50 patients with GIST treated with dasatinib 70 mg twice daily.
Disclosures: Bristol-Myers Squibb provided funding for the trial and dasatinib. Dr. Schuetze reported disclosures related to Novartis, Amgen, Janssen, Daiichi-Sankyo, Eli Lilly, and AB Science.
Source: Schuetze SM et al. JAMA Oncol. 2018 Apr 26. doi: 10.1001/jamaoncol.2018.0601.