User login
Sleep Duration Affects Likelihood of Insomnia and Depression Remission
BOSTON—Objective sleep duration moderates the probability of remission among patients with comorbid depression and insomnia, according to research presented at the 31st Annual Meeting of the Associated Professional Sleep Societies. Sleep durations of greater than five to six hours increase the likelihood that these patients will achieve insomnia remission with cognitive behavioral therapy for insomnia (CBT-I), but do not affect the likelihood of depression remission. Sleep durations of seven or more hours optimize the likelihood of insomnia remission and depression remission in response to CBT-I.
In a 2015 consensus statement, the Sleep Research Society recommended seven or more hours of sleep per night for adults younger than 60. Studies indicate that sleep durations of less than five hours and less than six hours are associated with increased morbidity and poor treatment response among patients with insomnia. “We wanted to know what [sleep-duration] cutoffs … might be better predictors of eventual insomnia and depression remission through treatment,” said Jack Edinger, PhD, Professor of Medicine at National Jewish Health in Denver.

An Analysis of the TRIAD Study
Dr. Edinger and colleagues conducted a secondary analysis of the TRIAD study, which examined whether combined treatment of depression and insomnia improves depression and sleep outcomes in participants with both disorders. Eligible participants met Diagnostic and Statistical Manual of Mental Disorders (4th ed.) criteria for major depression and primary insomnia, had a Hamilton Rating Scale for Depression (HAMD-17) score of 16 or greater, and had an Insomnia Severity Index (ISI) score of 11 or greater. People who had had psychotherapy in the previous four months, or had failed or could not tolerate previous adequate trials of the study medications, were excluded. Participants completed one night of baseline polysomnography before entering the treatment phase of the study.
The study population included 104 participants (75 women) with a mean age of 47. Mean baseline HAMD-17 score was 22, and mean baseline ISI score was 20.6. All participants received antidepressant medication (ie, citalopram, sertraline, or venlafaxine). Patients were randomized to CBT-I or sham (ie, a pseudodesensitization condition with sleep education). The investigators assessed participants biweekly with the HAMD-17 and the ISI. The treatment period lasted for 16 weeks.
CBT-I Provided Benefits
Participants with five or more hours of sleep were more likely to respond to CBT-I than participants with fewer than five hours of sleep. Among participants with sleep duration of five or more hours, insomnia remission was more likely with CBT-I than with the control condition. The five-hour cutoff had no association with depression remission.
Among participants with six or more hours of sleep, those who received CBT-I were more likely to achieve insomnia remission than controls. The six-hour cutoff did not affect the likelihood of depression remission, however.
Among participants with seven or more hours of sleep, those randomized to CBT-I were more likely to achieve insomnia remission and depression remission than controls.
“More research is needed to determine how best to achieve depression remission in those patients with less than seven hours of objective sleep duration prior to starting treatment,” Dr. Edinger concluded.
—Erik Greb
Suggested Reading
Bathgate CJ, Edinger JD, Krystal AD. Insomnia patients with objective short sleep duration have a blunted response to cognitive behavioral therapy for insomnia. Sleep. 2017;40(1).
Vgontzas AN, Liao D, Bixler EO, et al. Insomnia with objective short sleep duration is associated with a high risk for hypertension. Sleep. 2009;32(4):491-497.
Watson NF, Badr MS, Belenky G, et al. Recommended amount of sleep for a healthy adult: A joint consensus statement of the American Academy of Sleep Medicine and Sleep Research Society. Sleep. 2015;38(6):843-844.
BOSTON—Objective sleep duration moderates the probability of remission among patients with comorbid depression and insomnia, according to research presented at the 31st Annual Meeting of the Associated Professional Sleep Societies. Sleep durations of greater than five to six hours increase the likelihood that these patients will achieve insomnia remission with cognitive behavioral therapy for insomnia (CBT-I), but do not affect the likelihood of depression remission. Sleep durations of seven or more hours optimize the likelihood of insomnia remission and depression remission in response to CBT-I.
In a 2015 consensus statement, the Sleep Research Society recommended seven or more hours of sleep per night for adults younger than 60. Studies indicate that sleep durations of less than five hours and less than six hours are associated with increased morbidity and poor treatment response among patients with insomnia. “We wanted to know what [sleep-duration] cutoffs … might be better predictors of eventual insomnia and depression remission through treatment,” said Jack Edinger, PhD, Professor of Medicine at National Jewish Health in Denver.
An Analysis of the TRIAD Study
Dr. Edinger and colleagues conducted a secondary analysis of the TRIAD study, which examined whether combined treatment of depression and insomnia improves depression and sleep outcomes in participants with both disorders. Eligible participants met Diagnostic and Statistical Manual of Mental Disorders (4th ed.) criteria for major depression and primary insomnia, had a Hamilton Rating Scale for Depression (HAMD-17) score of 16 or greater, and had an Insomnia Severity Index (ISI) score of 11 or greater. People who had had psychotherapy in the previous four months, or had failed or could not tolerate previous adequate trials of the study medications, were excluded. Participants completed one night of baseline polysomnography before entering the treatment phase of the study.
The study population included 104 participants (75 women) with a mean age of 47. Mean baseline HAMD-17 score was 22, and mean baseline ISI score was 20.6. All participants received antidepressant medication (ie, citalopram, sertraline, or venlafaxine). Patients were randomized to CBT-I or sham (ie, a pseudodesensitization condition with sleep education). The investigators assessed participants biweekly with the HAMD-17 and the ISI. The treatment period lasted for 16 weeks.
CBT-I Provided Benefits
Participants with five or more hours of sleep were more likely to respond to CBT-I than participants with fewer than five hours of sleep. Among participants with sleep duration of five or more hours, insomnia remission was more likely with CBT-I than with the control condition. The five-hour cutoff had no association with depression remission.
Among participants with six or more hours of sleep, those who received CBT-I were more likely to achieve insomnia remission than controls. The six-hour cutoff did not affect the likelihood of depression remission, however.
Among participants with seven or more hours of sleep, those randomized to CBT-I were more likely to achieve insomnia remission and depression remission than controls.
“More research is needed to determine how best to achieve depression remission in those patients with less than seven hours of objective sleep duration prior to starting treatment,” Dr. Edinger concluded.
—Erik Greb
Suggested Reading
Bathgate CJ, Edinger JD, Krystal AD. Insomnia patients with objective short sleep duration have a blunted response to cognitive behavioral therapy for insomnia. Sleep. 2017;40(1).
Vgontzas AN, Liao D, Bixler EO, et al. Insomnia with objective short sleep duration is associated with a high risk for hypertension. Sleep. 2009;32(4):491-497.
Watson NF, Badr MS, Belenky G, et al. Recommended amount of sleep for a healthy adult: A joint consensus statement of the American Academy of Sleep Medicine and Sleep Research Society. Sleep. 2015;38(6):843-844.
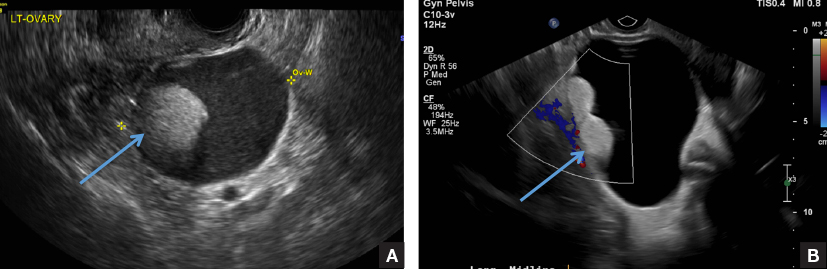
The many faces of dermoid
A) Dermoid plug CORRECT
The most common appearance of an ovarian dermoid is a cystic lesion with a focal echogenic nodule protruding into the cyst (Rokitansky nodule).1
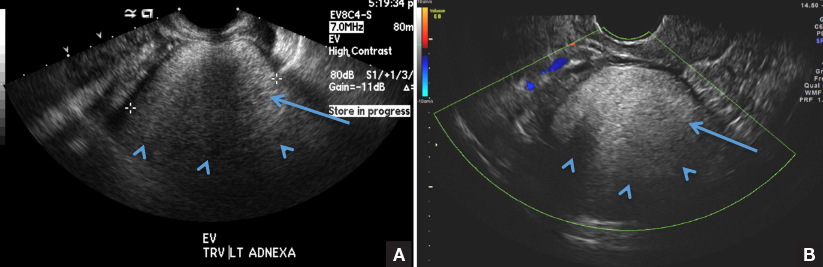
B) Tip-of-the-iceberg sign INCORRECT
The next most common appearance of an ovarian dermoid is a focal or diffuse hyperechoic mass with areas of sound attenuation from the sebaceous material and hair, often called the tip-of-the-iceberg sign.1
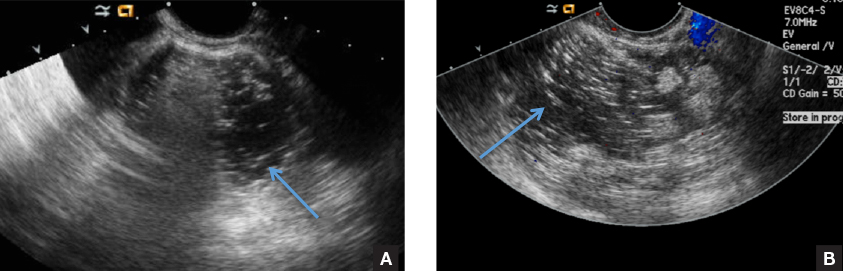
C) Dot-dash pattern INCORRECT
The 3rd most common appearance of an ovarian dermoid is a cystic lesion with multiple thin echogenic bands (lines and dots) that visualize hair floating within the cyst.1
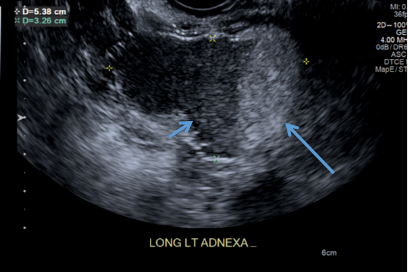
D) Fat-fluid level INCORRECT
The 4th most common appearance of an ovarian dermoid is a result of the echogenic sebum and hypoechoic serous fluid causing a fat-fluid level.1
- Outwater EK, Siegelman ES, Hunt JL. Ovarian teratomas: tumor types and imaging characteristics. RadioGraphics. 2001;21(2):475–490.

Dr. Kanmaniraja is Assistant Professor and Chief, Division of Abdominal Imaging, Department of Radiology, University of Florida College of Medicine-Jacksonville.

Dr. Kaunitz is University of Florida Term Professor and Associate Chairman, Department of Obstetrics and Gynecology, University of Florida College of Medicine-Jacksonville. He is Medical Director and Director of Menopause and Gynecologic Ultrasound Services at UF Women's Health Specialists-Emerson. He also serves on the OBG Management Board of Editors.
The authors report no additional financial relationships relevant to this quiz.
Dr. Kanmaniraja is Assistant Professor and Chief, Division of Abdominal Imaging, Department of Radiology, University of Florida College of Medicine-Jacksonville.
Dr. Kaunitz is University of Florida Term Professor and Associate Chairman, Department of Obstetrics and Gynecology, University of Florida College of Medicine-Jacksonville. He is Medical Director and Director of Menopause and Gynecologic Ultrasound Services at UF Women's Health Specialists-Emerson. He also serves on the OBG Management Board of Editors.
The authors report no additional financial relationships relevant to this quiz.
A) Dermoid plug CORRECT
The most common appearance of an ovarian dermoid is a cystic lesion with a focal echogenic nodule protruding into the cyst (Rokitansky nodule).1
B) Tip-of-the-iceberg sign INCORRECT
The next most common appearance of an ovarian dermoid is a focal or diffuse hyperechoic mass with areas of sound attenuation from the sebaceous material and hair, often called the tip-of-the-iceberg sign.1
C) Dot-dash pattern INCORRECT
The 3rd most common appearance of an ovarian dermoid is a cystic lesion with multiple thin echogenic bands (lines and dots) that visualize hair floating within the cyst.1
D) Fat-fluid level INCORRECT
The 4th most common appearance of an ovarian dermoid is a result of the echogenic sebum and hypoechoic serous fluid causing a fat-fluid level.1
- Outwater EK, Siegelman ES, Hunt JL. Ovarian teratomas: tumor types and imaging characteristics. RadioGraphics. 2001;21(2):475–490.
- Outwater EK, Siegelman ES, Hunt JL. Ovarian teratomas: tumor types and imaging characteristics. RadioGraphics. 2001;21(2):475–490.
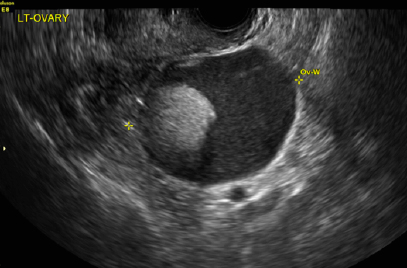
A 49-year-old woman with pelvic discomfort presents to her gynecologist. Physical exam suggests unilateral adnexal fullness; the gynecologist orders transvaginal pelvic ultrasonography.
How Does Cognitive Demand Affect Mobility in MS?
Patients with multiple sclerosis (MS) with an Expanded Disability Status Scale (EDSS) score between 4 and 6 have significantly slower times on the Timed Up and Go (TUG) test with the addition of a simple cognitive task, according to research published in the July–August issue of International Journal of MS Care. This reduction in performance “might have implications for a person’s more complex everyday activities,” the researchers said.
Patients with MS may develop cognitive impairment (eg, reduced processing speed or working memory), but standard cognitive assessments overlook how cognitive function affects mobility. To assess how the addition of a cognitive task affects mobility in patients with MS, George H. Kraft, MD, Emeritus Alvord Professor of MS Research at the University of Washington in Seattle, and colleagues conducted a study that included 52 adults with MS and 57 healthy controls. Participants had a mean age of about 47, and most were women.

The participants completed three versions of the TUG test: the standard test, the test plus reciting the alphabet, and the test plus subtracting from a number by threes. Times to complete the tests were compared between controls and three groups of participants with MS—those with an EDSS score of 0–3.5 (n = 26), those with an EDSS score of 4.0–5.5 (n = 11), and those with an EDSS score of 6 (n = 15).
Overall mean times for the four groups were 8.0, 8.2, 11.1, and 11.6 seconds, respectively. Controls did not differ from people with MS without mobility problems (ie, those with an EDSS score of 0–3.5), but did differ from the other two groups.
“Individuals with MS and no mobility problems have ... very little increase in time due to the addition of cognitive tasks to the TUG test. The two more severe groups perform similarly to each other, with a steeper increase in time to perform the test when the cognitive demand increases,” the researchers said. “Although we cannot automatically generalize the results to more complex everyday activities, such as walking or driving a car while talking on a cell phone, the reduction in performance is an important issue that should be discussed with the patient and his or her caregiver.”
—Jake Remaly
Suggested Reading
Ciol MA, Matsuda PN, Khurana SR, et al. Effect of cognitive demand on functional mobility in ambulatory individuals with multiple sclerosis. Int J MS Care. 2017;19(4):217-224.
Patients with multiple sclerosis (MS) with an Expanded Disability Status Scale (EDSS) score between 4 and 6 have significantly slower times on the Timed Up and Go (TUG) test with the addition of a simple cognitive task, according to research published in the July–August issue of International Journal of MS Care. This reduction in performance “might have implications for a person’s more complex everyday activities,” the researchers said.
Patients with MS may develop cognitive impairment (eg, reduced processing speed or working memory), but standard cognitive assessments overlook how cognitive function affects mobility. To assess how the addition of a cognitive task affects mobility in patients with MS, George H. Kraft, MD, Emeritus Alvord Professor of MS Research at the University of Washington in Seattle, and colleagues conducted a study that included 52 adults with MS and 57 healthy controls. Participants had a mean age of about 47, and most were women.
The participants completed three versions of the TUG test: the standard test, the test plus reciting the alphabet, and the test plus subtracting from a number by threes. Times to complete the tests were compared between controls and three groups of participants with MS—those with an EDSS score of 0–3.5 (n = 26), those with an EDSS score of 4.0–5.5 (n = 11), and those with an EDSS score of 6 (n = 15).
Overall mean times for the four groups were 8.0, 8.2, 11.1, and 11.6 seconds, respectively. Controls did not differ from people with MS without mobility problems (ie, those with an EDSS score of 0–3.5), but did differ from the other two groups.
“Individuals with MS and no mobility problems have ... very little increase in time due to the addition of cognitive tasks to the TUG test. The two more severe groups perform similarly to each other, with a steeper increase in time to perform the test when the cognitive demand increases,” the researchers said. “Although we cannot automatically generalize the results to more complex everyday activities, such as walking or driving a car while talking on a cell phone, the reduction in performance is an important issue that should be discussed with the patient and his or her caregiver.”
—Jake Remaly
Suggested Reading
Ciol MA, Matsuda PN, Khurana SR, et al. Effect of cognitive demand on functional mobility in ambulatory individuals with multiple sclerosis. Int J MS Care. 2017;19(4):217-224.
Opioid management protocol lowered trauma patient pain medication use
BALTIMORE – A pain management protocol implemented in a trauma service reduced opioid intake in trauma patients while improving patient satisfaction, according to a retrospective study.
The opioid epidemic continues to grow every day, partly as a result of irresponsible overprescribing of opioid medication, according to Jessica Gross, MB BAO BCh, FACS, a trauma surgeon from Wake Forest (N.C.) Baptist Health at the American Association for the Surgery of Trauma annual meeting. Dr. Gross and her colleagues developed a pain management protocol (PMP) to provide adequate pain control while using fewer opioids in the postdischarge setting. They tested their PMP through a retrospective chart review of 498 patients admitted to the trauma service between January 2015 and December 2016, half of which were admitted before the PMP was initiated and half of which were admitted afterward.
The PMP involved a stepped approach to treating pain, with acetaminophen or ibuprofen as needed for mild pain, one 5-mg tablet of oxycodone/acetaminophen every 6 hours for moderate pain, two tablets for severe pain, and 50-100 mg of tramadol every 6 hours for breakthrough pain.
Counseling services for patients who were found to be in danger of substance use were provided in the hospital, and at discharge, patients received a weaning plan for their medication, according to Dr. Gross.
If the short-acting medications were found to be inadequate to control pain, patients were given slow-release pain medication as needed.
Average total medication, including at discharge and for refills, prescribed after PMP initiation was 1,242 morphine milligram equivalents (MME), compared with 2,421 MME prior to the protocol (P less than .0001).
After the protocol was implemented, Dr. Gross and her colleagues found the number of patients prescribed a refill dropped from 39.7% to 28.1%, with the size of those refills dropping from 1,032 MME to 213 MME on average.
“By having a comprehensive pain management protocol, we can reduce the amount of pain medications we prescribe for outpatient use, from discharge from the trauma service,” said Dr. Gross. “Additionally, we have shown that by having a protocol in place, we not only decreased the number of refills we were providing, but also the amount of pain medications that was prescribed within these refills.”
Through a Press Ganey survey analysis of patients during the month before and the month after the PMP implementation, investigators found a significant increase in patient satisfaction and overall pain management, according to Dr. Gross,
In addition, the main trauma floor where the PMP was implemented was recognized for the most improvement in overall hospital rating and pain management, compared with the previous year.
Discussant Oscar Guillamondegui MD,FACS, medical director of the trauma ICU at Vanderbilt University, Nashville, Tenn., acknowledged the importance of PMPs and the work investigators presented.
“I would consider this the next generation of ERAS [enhanced recovery after surgery], or ERAT [enhanced recovery after trauma] in pain perception modification,” said Dr. Guillamondegui. “Dr. Gross and the multidisciplinary group at Wake Forest have provided compelling evidence to help alleviate [the opioid epidemic].”
In a question-and-answer session following the presentation, attendees voiced concern over how a PMP would be used among patients who are more familiar with hospital systems, in particular concerning self-reported pain levels.
“Most of us employed at acute care centers are not working in utopia. Many of our patients are heroin addicts, are very bright, and know how to identify 10 on those silly smiley faces so that they get more medicine,” said Charles Lucas, MD, FACS, professor of surgeon at Wayne State University, Detroit. Dr. Lucas also pointed out that even when patients report false levels of pain, doctors still are required to put it into the electronic medical record for fear of repercussions,
In response, Dr. Gross said doctors on the floor reviewed patients to make sure they were receiving all doses of pain medications. If doctors felt the patient’s pain regimen was adequate, despite the patient reporting otherwise, no changes were made.
Certain limitations include not being able to confirm whether patients received prescription medication elsewhere, nor any concrete data on patient satisfaction after discharge other than an inference based on fewer refills and lower refill MME.
Investigators reported no relevant financial disclosures.
[email protected]
On Twitter @eaztweets
AT THE AAST ANNUAL MEETING
Key clinical point:
Major finding: Average prescription fell to 1,242 morphine milligram equivalents (MME) per prescription, compared with 2,421 MME per prescription prior to the protocol.
Data Source: Retrospective chart review of 498 trauma patients from Jan. 1, 2015, and Dec. 31, 2016.
Disclosures: Investigators reported no relevant financial disclosures.
New and Noteworthy Information—October 2017
Is Vitamin D Deficiency a Risk Factor for MS?
Vitamin D deficiency is a risk factor for multiple sclerosis (MS), according to a study published online ahead of print September 13 in Neurology. Researchers conducted a prospective nested case-control study among more than 800,000 women in the Finnish Maternity Cohort who had blood samples taken during pregnancy. Investigators identified 1,092 women with MS diagnosed an average of nine years after giving the blood samples. Researchers compared their vitamin D levels with those of 2,123 women who did not develop MS. Each 50 nmol/L increase in vitamin D levels in the blood was associated with a 39% reduced risk of developing MS. In addition, women who had deficient levels of vitamin D (ie, < 30 nmol/L) had a 43% higher risk of MS, compared with women who had adequate levels of vitamin D (ie, ≥ 50 nmol/L).
Munger KL, Hongell K, Åivo J, et al. 25-Hydroxyvitamin D deficiency and risk of MS among women in the Finnish Maternity Cohort. Neurology. 2017 Sep 13 [Epub ahead of print].
Can Eye Changes Signal Frontotemporal Degeneration?
Frontotemporal degeneration (FTD) is associated with outer retina thinning, and this thinning correlates with disease severity, according to a cross-sectional study published online ahead of print September 8 in Neurology. Researchers examined retinal structure using standard spectral-domain optical coherence tomography in 38 consecutively enrolled patients with FTD and 44 controls. The researchers excluded patients with presumed Alzheimer’s disease, eyes with poor image quality, or confounding diseases. Adjusting for age, sex, and race, patients with FTD had a thinner outer retina, compared with controls. Patients with FTD also had a thinner outer nuclear layer and ellipsoid zone, compared with controls. The groups had similar thicknesses for inner retinal layers.
Kim BJ, Irwin DJ, Song D, et al. Optical coherence tomography identifies outer retina thinning in frontotemporal degeneration. Neurology. 2017 Sep 8 [Epub ahead of print].
A New Diagnostic Test for Alzheimer’s Disease
Blood sample analysis may help diagnose Alzheimer’s disease and distinguish between different types of neurodegenerative disorders, according to a study published online ahead of print September 5 in the Proceedings of the National Academy of Sciences. Investigators used attenuated total reflection FTIR spectroscopy combined with chemometric techniques to analyze blood plasma samples from 347 participants with neurodegenerative diseases and 202 age-matched healthy individuals. Alzheimer’s disease (n = 164) was identified with 70% sensitivity and specificity, which after the incorporation of APOE ε4 information, increased to 86% when individuals carried one or two alleles of ε4, and to 72% sensitivity and 77% specificity when individuals did not carry ε4 alleles. The test segregated Alzheimer’s disease from dementia with Lewy bodies (n = 34) with 90% sensitivity and specificity.
Paraskevaidi M, Morais CLM, Lima KMG, et al. Differential diagnosis of Alzheimer’s disease using spectrochemical analysis of blood. Proc Natl Acad Sci U S A. 2017 Sep 5 [Epub ahead of print].
New Indication for Briviact CV
The FDA has approved a supplemental new drug application for Briviact (brivaracetam) CV as monotherapy for partial-onset seizures in patients age 16 and older with epilepsy. Briviact previously was approved as adjunctive treatment for partial-onset seizures in this age group. UCB, which markets Briviact, applied for the monotherapy indication after the FDA advised that it is acceptable to extrapolate the efficacy and safety of drugs approved as adjunctive therapy for the treatment of partial-onset seizures to their use as monotherapy for the treatment of partial-onset seizures. Gradual dose escalation is not required when initiating treatment with Briviact for monotherapy or adjunctive therapy, which allows clinicians to initiate treatment at a therapeutic dose. Briviact formulations include film-coated tablets, oral solution, and injection. UCB is headquartered in Brussels.
Less REM Sleep Is Associated With Greater Dementia Risk
REM sleep may be associated with risk of dementia, according to a study published online ahead of print August 23 in Neurology. Researchers examined associations between sleep architecture and the prospective risk of incident dementia in a subset of 321 Framingham Heart Study Offspring participants who participated in the Sleep Heart Health Study between 1995 and 1998, and were older than 60 at the time of sleep assessment (mean age, 67; 50% male). Stages of sleep were quantified using home-based polysomnography. Participants were followed for up to 19 years for incident dementia. Researchers observed 32 cases of incident dementia. Each percentage reduction in REM sleep was associated with an approximately 9% increase in the risk of incident dementia (hazard ratio, 0.91).
Pase MP, Himali JJ, Grima NA, et al. Sleep architecture and the risk of incident dementia in the community. Neurology. 2017 Aug 23 [Epub ahead of print].
Mononucleosis May Increase Risk of MS
Epstein-Barr nuclear antigen-1 seropositivty is independently associated with increased risk of multiple sclerosis (MS) or clinically isolated syndrome (CIS), according to a study published online ahead of print August 30 in Neurology. Researchers recruited 1,090 black, Hispanic, and white people with MS or CIS and matched controls over a three-year period. Participants were tested for the Epstein-Barr virus antibody and were asked whether they had ever had mononucleosis. Blacks who had had mononucleosis were more than four times more likely to develop MS, compared with those who had not had mononucleosis. Hispanics and whites who had had mononucleosis were nearly four times and two times, respectively, more likely to develop MS or CIS, compared with those who had not had mononucleosis.
Langer-Gould A, Wu J, Lucas R, et al. Epstein-Barr virus, cytomegalovirus, and multiple sclerosis susceptibility: a multiethnic study. Neurology. 2017 Aug 30 [Epub ahead of print].
Asthma Medicine May Decrease Risk of Parkinson’s Disease
Salbutamol, a brain-penetrant asthma medication, is associated with reduced risk of Parkinson’s disease, according to a study published September 1 in Science. Researchers used an unbiased screen targeting endogenous gene expression to discover that the β2-adrenoreceptor (β2AR) is a regulator of the α-synuclein gene. Research has indicated that excess production of α-synuclein may be a causative factor in Parkinson’s disease. Over 11 years of follow-up in four million Norwegians, the β2AR agonist salbutamol was associated with reduced risk of Parkinson’s disease (rate ratio, 0.66). A β2AR antagonist correlated with increased risk.
Mittal S, Bjørnevik K, Im DS, et al. β2-Adrenoreceptor is a regulator of the α-synuclein gene driving risk of Parkinson’s disease. Science. 2017;357(6354):891-898 [Epub ahead of print].
Odds of Developing Alzheimer’s Disease Same for Men and Women With APOE Genotype
Men and women with the APOE ε3/ε4 genotype have nearly the same odds of developing Alzheimer’s disease from age 55 to 85, but women have an increased risk at younger ages, according to a study published online ahead of print August 28 in JAMA Neurology. Researchers analyzed data from 27 studies with nearly 58,000 participants. Homogeneous data sets were pooled in case-control analyses, and logistic regression models were used to compute risks. Age-adjusted odds ratios and 95% confidence intervals for developing mild cognitive impairment and Alzheimer’s disease were calculated for men and women across APOE genotypes. Men and women with the APOE ε3/ε4 genotype from ages 55 to 85 did not show a difference in Alzheimer’s disease risk. Women had an increased risk of Alzheimer’s disease compared with men between the ages of 65 and 75.
Neu SC, Pa J, Kukull W, et al. Apolipoprotein e genotype and sex risk factors for Alzheimer disease: a meta-analysis. JAMA Neurol. 2017 Aug 28 [Epub ahead of print].
Does Dimethyl Fumarate Prevent MS Reactivation After Natalizumab Discontinuation?
Dimethyl fumarate appears generally safe and may be a promising drug for patients at high risk of progressive multifocal leukoencephalopathy (PML) who discontinue natalizumab, according to an article published online ahead of print August 26 in the Journal of Neurology, Neurosurgery and Psychiatry. Thirty-nine patients with relapsing-remitting multiple sclerosis (MS) at high risk of PML were switched from natalizumab to dimethyl fumarate and underwent neurologic and 3T MRI monitoring for two years. Clinical and MRI data regarding the two-year period preceding natalizumab treatment, the two years of natalizumab treatment, and the two years of dimethyl fumarate treatment were collected. During the dimethyl fumarate phase, one or more relapses occurred in five patients (12.8%), increased disability progression occurred in four patients (10.3%), and MRI activity occurred in eight patients (20.5%). Post-natalizumab rebound effect was observed in one patient. Almost 80% of the patients had no evidence of disease activity after two years of dimethyl fumarate treatment. No carryover PML among investigated cases was observed.
Calabrese M, Pitteri M, Farina G, et al. Dimethyl fumarate: a possible exit strategy from natalizumab treatment in patients with multiple sclerosis at risk for severe adverse events. J Neurol Neurosurg Psychiatry. 2017 Aug 26 [Epub ahead of print].
Austedo Approved for Treatment of Tardive Dyskinesia in Adults
The FDA has approved Austedo (deutetrabenazine) tablets for the treatment of tardive dyskinesia in adults. The approval was based on results from two phase III randomized, double-blind, placebo-controlled, parallel group studies assessing the efficacy and safety of Austedo in reducing the severity of abnormal involuntary movements associated with tardive dyskinesia. Austedo was previously approved in April for the treatment of chorea associated with Huntington’s disease. The most common adverse reactions (ie, 4% of Austedo-treated patients and greater than placebo) in controlled clinical studies of patients with tardive dyskinesia were nasopharyngitis and insomnia. Teva Pharmaceutical Industries, which markets Austedo, is headquartered in Jerusalem.
Orphan Drug Designation Granted for EPX-300
The FDA has granted Orphan Drug Designation for EPX-300 for the treatment of patients with Dravet syndrome. EPX-300 is a repurposed antidepressant that acts via modulation of serotonin signaling pathways. Researchers discovered its potential as a treatment for patients with Dravet syndrome using a phenotype-based zebrafish drug screening platform. Using the zebrafish model for Dravet syndrome, investigators identified drug candidates from a screen of more than 3,000 drugs that suppress seizures and other symptoms associated with neurologic diseases. Epygenix Therapeutics, which is developing EPX-300, is headquartered in Paramus, New Jersey.
FDA Approves Expanded Indication for Aptiom
The FDA has approved a supplemental new drug application to expand the indication for Aptiom (eslicarbazepine acetate) to include treatment of partial-onset seizures in children age 4 to 17. The safety and efficacy of Aptiom as monotherapy and adjunctive therapy for the treatment of partial-onset seizures in adults was established in five multicenter, randomized, controlled clinical trials. Data from three clinical trials supported the safety and tolerability of Aptiom for the treatment of partial-onset seizures in pediatric patients. Pharmacokinetic analyses of adult and pediatric data supported its use in the pediatric population. Aptiom is a once-daily, immediate release drug that can be taken whole or crushed, with or without food. Sunovion Pharmaceuticals, which markets Aptiom, is headquartered in Marlborough, Massachusetts.
—Kimberly Williams

Romosozumab reduces fracture risk out to 36 months, with no signs of cardiovascular problems
DENVER – in an extended analysis of the FRAME study.
The combination had already proven effective at 12 months and 24 months (N Engl J Med. 2016 Oct 20;375[16]:1532-43).
Romosozumab binds sclerostin, leading to both increased bone formation and decreased bone resorption, though its activity favors formation, leading it to be classified as an anabolic agent. Denosumab is an antibody that targets receptor-activated nuclear factor–kappaB ligand (RANKL), interfering with osteoclast formation and the accompanied breakdown of bone.

In the FRAME study, women aged 55-90 years with a T score of –2.5 or less in the total hip or femoral neck received romosozumab or placebo for 12 months, and then all patients were switched to denosumab at 12 months to 24 months. At 24 months, women who initially received romosozumab had a 75% relative risk reduction in new vertebral fractures and a 33% reduction in clinical fractures, compared with those who began with placebo, Dr. Lewiecki said at the annual meeting of the American Society for Bone and Mineral Research.
Of 7,180 women initially enrolled, 5,743 (80%) completed the study out to 36 months, when women who initially received 12 months of romosozumab had lower rates of new vertebral fractures than did the placebo group (1.0% vs. 2.8%; P less than .001), clinical fractures (4.0% vs. 5.5%; P = .004), and nonvertebral fractures (3.9% vs. 4.9%; P = .039).
Bone mineral density also continued to improve at month 36, with an increase of 18.1% in the lumbar spine and 9.4% in the total hip in the romosozumab group, compared with 7.5% and 4.2%, respectively, in the group that initially received placebo.
Both the placebo and romosozumab groups had similar rates of adverse events. At month 24, there were two cases of osteonecrosis of the jaw and one case of atypical femoral fracture. No new cases of either condition were observed in months 24-36.
Notably, there was no difference in risk for cardiovascular disease, with rates of 3.6% in the romosozumab patients and 3.5% in the placebo patients at 36 months. The development of romosozumab ran into a snag earlier this year when researchers found an increased risk of cardiovascular disease in the romosozumab arm of the ARCH study, in which patients received either romosozumab or alendronate for the first 12 months and then switched to alendronate (N Engl J Med. 2017 Sep 11. doi: 10.1056/NEJMoa1708322). At the end of the first year, patients in the romosozumab group had a higher rate of cardiovascular events (2.5% vs. 1.9%). That finding led the Food and Drug Administration to reject the application. Amgen and UCB are refiling in hopes of a 2018 approval.
As to romosozumab’s place in a treatment landscape that already includes teriparatide and abaloparatide, Dr. Lewiecki said, “I think it will depend on the product label. It’s not a self-administered subcutaneous injection like teriparatide and abaloparatide: The patient would present to a doctor’s office once a month for a year to get an injection – and that may be preferable to some patients,” he said.
The study was sponsored by Amgen and UCB. Dr. Lewiecki has consulted for Amgen.
DENVER – in an extended analysis of the FRAME study.
The combination had already proven effective at 12 months and 24 months (N Engl J Med. 2016 Oct 20;375[16]:1532-43).
Romosozumab binds sclerostin, leading to both increased bone formation and decreased bone resorption, though its activity favors formation, leading it to be classified as an anabolic agent. Denosumab is an antibody that targets receptor-activated nuclear factor–kappaB ligand (RANKL), interfering with osteoclast formation and the accompanied breakdown of bone.
In the FRAME study, women aged 55-90 years with a T score of –2.5 or less in the total hip or femoral neck received romosozumab or placebo for 12 months, and then all patients were switched to denosumab at 12 months to 24 months. At 24 months, women who initially received romosozumab had a 75% relative risk reduction in new vertebral fractures and a 33% reduction in clinical fractures, compared with those who began with placebo, Dr. Lewiecki said at the annual meeting of the American Society for Bone and Mineral Research.
Of 7,180 women initially enrolled, 5,743 (80%) completed the study out to 36 months, when women who initially received 12 months of romosozumab had lower rates of new vertebral fractures than did the placebo group (1.0% vs. 2.8%; P less than .001), clinical fractures (4.0% vs. 5.5%; P = .004), and nonvertebral fractures (3.9% vs. 4.9%; P = .039).
Bone mineral density also continued to improve at month 36, with an increase of 18.1% in the lumbar spine and 9.4% in the total hip in the romosozumab group, compared with 7.5% and 4.2%, respectively, in the group that initially received placebo.
Both the placebo and romosozumab groups had similar rates of adverse events. At month 24, there were two cases of osteonecrosis of the jaw and one case of atypical femoral fracture. No new cases of either condition were observed in months 24-36.
Notably, there was no difference in risk for cardiovascular disease, with rates of 3.6% in the romosozumab patients and 3.5% in the placebo patients at 36 months. The development of romosozumab ran into a snag earlier this year when researchers found an increased risk of cardiovascular disease in the romosozumab arm of the ARCH study, in which patients received either romosozumab or alendronate for the first 12 months and then switched to alendronate (N Engl J Med. 2017 Sep 11. doi: 10.1056/NEJMoa1708322). At the end of the first year, patients in the romosozumab group had a higher rate of cardiovascular events (2.5% vs. 1.9%). That finding led the Food and Drug Administration to reject the application. Amgen and UCB are refiling in hopes of a 2018 approval.
As to romosozumab’s place in a treatment landscape that already includes teriparatide and abaloparatide, Dr. Lewiecki said, “I think it will depend on the product label. It’s not a self-administered subcutaneous injection like teriparatide and abaloparatide: The patient would present to a doctor’s office once a month for a year to get an injection – and that may be preferable to some patients,” he said.
The study was sponsored by Amgen and UCB. Dr. Lewiecki has consulted for Amgen.
AT ASBMR
Key clinical point: Romosozumab followed by denosumab significantly reduced fracture risk, compared with placebo followed by denosumab.
Major finding: 1.0% of patients on romosozumab had new vertebral fractures, compared with 2.8% of those in the placebo group.
Data source: A randomized, controlled trial of 7,180 postmenopausal women with osteoporosis.
Disclosures: The study was sponsored by Amgen and UCB. Dr. Lewiecki has consulted for Amgen.
How to Interpret the Results of Clinical Trials
BOSTON—The interpretation of clinical trial results can stray from the data in many ways. Creating spin (ie, stressing an experimental treatment’s advantages) may or may not be the intention of the researchers or of people who write press releases, but clinicians evaluating the results should not be distracted from the key characteristics of a meaningful trial. They can use several strategies to keep the facts in focus, according to a researcher.
“Here are some words that should put you on alert: ‘revolutionary,’ ‘groundbreaking,’ and ‘first-line.’ It is time to be cautious when you are hearing the spin and the results at the same time,” said Elizabeth W. Loder, MD, MPH, Professor of Neurology at Harvard Medical School in Boston. At the 59th Annual Scientific Meeting of the American Headache Society, Dr. Loder spoke about migraine prevention trials, but she allowed that her remarks are relevant to any clinical trial.

Guidelines Aim to Increase Objectivity
The potential for overinterpretation, misinterpretation, or misleading interpretation of trial results was reduced greatly in 2005. At that time, the International Committee of Medical Journal Editors agreed that trials accepted for publication should first be registered and have their methodology defined before study initiation. Establishing the trial design and primary end points in advance makes selective reporting and data manipulation more difficult. The approach, however, does not eliminate the potential for spin, said Dr. Loder. “The trial registrations on sites like ClinicalTrials.gov are easy to find, and it is worth looking back to compare what was registered to what was reported. There can be some surprises,” Dr. Loder explained.
One potential surprise may be a discrepancy between the prespecified outcomes and the outcomes that the researchers stress at the conclusion of the study. The peer-review process of a high-quality journal limits claims based on secondary outcomes, but press releases do not have similar constraints. In addition, favorable reporting on outcomes that did not appear in the trial registration should arouse suspicion. “It is fair to include data on outcomes that were not prespecified, but they should be flagged. These are hypothesis-generating and should not be given the same weight as those prespecified,” Dr. Loder explained.
Guidelines to improve the objectivity of data gathered and reported for trials are growing increasingly rigorous, according to Dr. Loder. For headache prevention trials, the International Headache Society has issued specific recommendations about trial conduct and the measurement of end points. Although Dr. Loder conceded that strict constraints may make reports of trial results formulaic or tedious, the consistency of the formula, which progresses from an introduction through methods, results, discussion, and conclusions, makes the findings easier to interpret and to place into context.
Data Should Guide Interpretation of Results
A paper’s discussion section may cloud the reader’s understanding of the trial’s findings, Dr. Loder cautioned. In a properly reported study, the results section confines itself to the facts. In the discussion section, interpretation of the facts varies with perspective, according to Dr. Loder. The authors’ perception of relative benefit following a favorable outcome or of the burden of an adverse event is subjective. The potential for intentional or unintentional spin is substantial.
“Examples of spin include focusing on an outcome [that] the trial was not designed to study, focusing on subgroups rather than [on] the overall population, and downplaying adverse safety data,” explained Dr. Loder. Dr. Loder cited several studies that compared reader reaction to abstracts with and without spin. The studies showed that spin was persuasive. Moreover, Dr. Loder noted that spin in abstracts is typically passed on in press releases, news stories, and other accounts of the studies.
One strategy for remaining circumspect about new data is to consult one of many watchdog organizations that monitor clinical data and evaluate data collection and analysis. One such organization is HealthNewsReview.org, which has an editorial team that routinely critiques claims made about drugs, devices, vitamins, and surgical procedures. According to Dr. Loder, the website has examined migraine therapies and provided a perspective that was fully independent of the trials’ sponsors, their authors, and sometimes of the prevailing view.
Pure objectivity may not be appealing for those who want to draw attention to their research, and spin is hard to resist in the desire to develop an engaging narrative. Whether or not those who focus on the most favorable findings of a trial are conscious of their disservice to scientific inquiry, spin has been found repeatedly in systematic reviews of study data. Dr. Loder cited one study that found spin in 47% of 498 press releases on scientific articles.
“There were various types of spin, but 19% of the press releases failed to acknowledge that the primary end point was not statistically significant,” Dr. Loder noted. When abstracts that provided the basis for the press releases were analyzed, 40% were found to contain spin.
The Value of Common Sense
Randomized controlled trials are considered the gold standard for objectively evaluating most treatment strategies, but Dr. Loder cautioned that this design by itself is not enough to ensure reproducible results. The results of the study should include not only how many patients were randomized, but also how many patients received treatment and how many were followed to the trial’s end. Low enrollment or high dropout rates are red flags. These problems can be detected by critical thinking.
“There really is no substitute for common sense,” Dr. Loder said. She suggested that studies that include all of the standard points of discussion, such as the generalizability of results, the limitations of the design, the statistical significance of the findings, and a fair interpretation of benefits and hazards, establish credibility and are generally recognizable with a discerning eye.
“For clinicians considering how to interpret results, one question to ask is whether the patients enrolled are representative of the ones that are in front of you,” Dr. Loder suggested.
A critical view of new data helps to avoid the fads that some critics have observed in the treatment of headaches and in clinical medicine overall. Typically, excessive enthusiasm about positive trial results is followed by a period of disillusionment until clinicians finally arrive at a realistic perspective of the strengths and weaknesses of a new therapeutic option. Warning of a coming brace of headache trial results, which will include studies of devices, apps, and new drugs, Dr. Loder urged clinicians to read the studies rather than the press releases, applying the criteria that define a well designed and fairly reported trial.
—Theodore Bosworth
Suggested Reading
Tfelt-Hansen P, Pascual J, Ramadan N, et al. Guidelines for controlled trials of drugs in migraine: third edition. A guide for investigators. Cephalalgia. 2012;32(1):6-38.
Yavchitz A, Boutron I, Bafeta A, et al. Misrepresentation of randomized controlled trials in press releases and news coverage: a cohort study. PLoS Med. 2012;9(9):e1001308.
BOSTON—The interpretation of clinical trial results can stray from the data in many ways. Creating spin (ie, stressing an experimental treatment’s advantages) may or may not be the intention of the researchers or of people who write press releases, but clinicians evaluating the results should not be distracted from the key characteristics of a meaningful trial. They can use several strategies to keep the facts in focus, according to a researcher.
“Here are some words that should put you on alert: ‘revolutionary,’ ‘groundbreaking,’ and ‘first-line.’ It is time to be cautious when you are hearing the spin and the results at the same time,” said Elizabeth W. Loder, MD, MPH, Professor of Neurology at Harvard Medical School in Boston. At the 59th Annual Scientific Meeting of the American Headache Society, Dr. Loder spoke about migraine prevention trials, but she allowed that her remarks are relevant to any clinical trial.
Guidelines Aim to Increase Objectivity
The potential for overinterpretation, misinterpretation, or misleading interpretation of trial results was reduced greatly in 2005. At that time, the International Committee of Medical Journal Editors agreed that trials accepted for publication should first be registered and have their methodology defined before study initiation. Establishing the trial design and primary end points in advance makes selective reporting and data manipulation more difficult. The approach, however, does not eliminate the potential for spin, said Dr. Loder. “The trial registrations on sites like ClinicalTrials.gov are easy to find, and it is worth looking back to compare what was registered to what was reported. There can be some surprises,” Dr. Loder explained.
One potential surprise may be a discrepancy between the prespecified outcomes and the outcomes that the researchers stress at the conclusion of the study. The peer-review process of a high-quality journal limits claims based on secondary outcomes, but press releases do not have similar constraints. In addition, favorable reporting on outcomes that did not appear in the trial registration should arouse suspicion. “It is fair to include data on outcomes that were not prespecified, but they should be flagged. These are hypothesis-generating and should not be given the same weight as those prespecified,” Dr. Loder explained.
Guidelines to improve the objectivity of data gathered and reported for trials are growing increasingly rigorous, according to Dr. Loder. For headache prevention trials, the International Headache Society has issued specific recommendations about trial conduct and the measurement of end points. Although Dr. Loder conceded that strict constraints may make reports of trial results formulaic or tedious, the consistency of the formula, which progresses from an introduction through methods, results, discussion, and conclusions, makes the findings easier to interpret and to place into context.
Data Should Guide Interpretation of Results
A paper’s discussion section may cloud the reader’s understanding of the trial’s findings, Dr. Loder cautioned. In a properly reported study, the results section confines itself to the facts. In the discussion section, interpretation of the facts varies with perspective, according to Dr. Loder. The authors’ perception of relative benefit following a favorable outcome or of the burden of an adverse event is subjective. The potential for intentional or unintentional spin is substantial.
“Examples of spin include focusing on an outcome [that] the trial was not designed to study, focusing on subgroups rather than [on] the overall population, and downplaying adverse safety data,” explained Dr. Loder. Dr. Loder cited several studies that compared reader reaction to abstracts with and without spin. The studies showed that spin was persuasive. Moreover, Dr. Loder noted that spin in abstracts is typically passed on in press releases, news stories, and other accounts of the studies.
One strategy for remaining circumspect about new data is to consult one of many watchdog organizations that monitor clinical data and evaluate data collection and analysis. One such organization is HealthNewsReview.org, which has an editorial team that routinely critiques claims made about drugs, devices, vitamins, and surgical procedures. According to Dr. Loder, the website has examined migraine therapies and provided a perspective that was fully independent of the trials’ sponsors, their authors, and sometimes of the prevailing view.
Pure objectivity may not be appealing for those who want to draw attention to their research, and spin is hard to resist in the desire to develop an engaging narrative. Whether or not those who focus on the most favorable findings of a trial are conscious of their disservice to scientific inquiry, spin has been found repeatedly in systematic reviews of study data. Dr. Loder cited one study that found spin in 47% of 498 press releases on scientific articles.
“There were various types of spin, but 19% of the press releases failed to acknowledge that the primary end point was not statistically significant,” Dr. Loder noted. When abstracts that provided the basis for the press releases were analyzed, 40% were found to contain spin.
The Value of Common Sense
Randomized controlled trials are considered the gold standard for objectively evaluating most treatment strategies, but Dr. Loder cautioned that this design by itself is not enough to ensure reproducible results. The results of the study should include not only how many patients were randomized, but also how many patients received treatment and how many were followed to the trial’s end. Low enrollment or high dropout rates are red flags. These problems can be detected by critical thinking.
“There really is no substitute for common sense,” Dr. Loder said. She suggested that studies that include all of the standard points of discussion, such as the generalizability of results, the limitations of the design, the statistical significance of the findings, and a fair interpretation of benefits and hazards, establish credibility and are generally recognizable with a discerning eye.
“For clinicians considering how to interpret results, one question to ask is whether the patients enrolled are representative of the ones that are in front of you,” Dr. Loder suggested.
A critical view of new data helps to avoid the fads that some critics have observed in the treatment of headaches and in clinical medicine overall. Typically, excessive enthusiasm about positive trial results is followed by a period of disillusionment until clinicians finally arrive at a realistic perspective of the strengths and weaknesses of a new therapeutic option. Warning of a coming brace of headache trial results, which will include studies of devices, apps, and new drugs, Dr. Loder urged clinicians to read the studies rather than the press releases, applying the criteria that define a well designed and fairly reported trial.
—Theodore Bosworth
Suggested Reading
Tfelt-Hansen P, Pascual J, Ramadan N, et al. Guidelines for controlled trials of drugs in migraine: third edition. A guide for investigators. Cephalalgia. 2012;32(1):6-38.
Yavchitz A, Boutron I, Bafeta A, et al. Misrepresentation of randomized controlled trials in press releases and news coverage: a cohort study. PLoS Med. 2012;9(9):e1001308.
Stop using codeine, oxycodone, hydrocodone, tramadol, and aspirin in women who are breastfeeding
In 2015 more than 30,000 deaths from opioid overdose were reported (FIGURE).1 More than 50% of the deaths were due to prescription opioids. The opioid crisis is a public health emergency and clinicians are diligently working to reduce both the number of opioid prescriptions and the doses prescribed per prescription.

In obstetrics, there is growing concern that narcotics used for the treatment of pain in women who are breastfeeding may increase the risk of adverse effects in newborns, including excessive sedation and respiratory depression. The American Academy of Pediatrics (AAP), the US Food and Drug Administration (FDA) and the American College of Obstetricians and Gynecologists (ACOG) recommend against the use of codeine and tramadol in women who are breastfeeding because their newborns may have adverse reactions, including excessive sleepiness, difficulty breathing, and potentially fatal breathing problems.2–4 In addition, there is growing concern that the use of oxycodone and hydrocodone should also be limited in women who are breastfeeding. In this article, I discuss the rationale for these recommendations.
Related article:
Landmark women’s health care remains law of the land
Codeine
Codeine is metabolized to morphine by CYP2D6 and CYP2D7. Both codeine and morphine are excreted into breast milk. Some women are ultrarapid metabolizers of codeine because of high levels of CYP2D6, resulting in higher concentrations of morphine in their breast milk and their breast fed newborn.2,5 In many women who are ultra-rapid metabolizers of codeine, CYP2D6 gene duplication or multiplication is the cause of the increased enzyme activity.6 Genotyping can identify some women who are ultrarapid metabolizers, but it is not currently utilized widely in clinical practice.
In the United States approximately 5% of women express high levels of CYP2D6 and are ultra-rapid metabolizers of codeine.4 In Ethiopia as many as 29% of women are ultrarapid metabolizers.7 Newborn central nervous system (CNS) depression is the most common adverse effect of fetal ingestion of excessive codeine and mor-phine from breast milk and may present as sedation, apnea, bradycardia, or cyanosis.8 Multiple newborn fatalities have been re-ported in the literature when lactating mothers who were ultrarapid metabolizers took co-deine. The FDA and ACOG recommend against the use of codeine in lactating women.
Hydrocodone
Hydrocodone, a hydrogenated ketone derivative of codeine, is metabolized by CYP2D6 to hydromorphone. Both hydrocodone and hydromorphone are present in breast milk. In lactating mothers taking hydrocodone, up to 9% of the dose may be ingested by the breastfeeding newborn.9 There is concern that hydrocodone use by women who are breastfeeding and are ultrarapid metabolizers may cause increased fetal consumption of hydromorphone resulting in adverse outcomes in the newborn. The AAP cautions against the use of hydrocodone.2
Oxycodone
Oxycodone is metabolized by CYP2D6 to oxymorphone and is concentrated into breast milk.10 Oxymorphone is more than 10 times more potent than oxycodone. In one study of lactating women taking oxycodone, codeine, or acetaminophen, the rates of neonate CNS depression were 20%, 17%, and 0.5%, respectively.11 The authors concluded that for mothers who are breastfeeding oxycodone was no safer than codeine because both medications were associated with a high rate of depression in the neonate. Newborns who develop CNS depression from exposure to oxycodone in breast milk will respond to naloxone treatment.12 The AAP recommends against prescribing oxycodone for women who are breastfeeding their infants.2
In a recent communication, the Society for Obstetric Anesthesia and Perinatology (SOAP) observed that in the United States, following cesarean delivery the majority of women receive oxycodone or hydrocodone.13 SOAP disagreed with the AAP recommendation against the use of oxycodone or hydrocodone in breastfeeding women. SOAP noted that all narcotics can produce adverse effects in newborns of breastfeeding women and that there are no good data that the prescription of oxycodone or hydrocodone is more risky than morphine or hydromorphone. However, based on their assessment of risk and benefit, pediatricians prioritize the use of acetaminophen and morphine and seldom use oxycodone or hydrocodone to treat moderate to severe pain in babies and children.
Tramadol
Tramadol is metabolized by CYP2D6 to O-desmethyltramadol. Both tramadol and O-desmethyltramadol are excreted into breast milk. In ultrarapid metabolizers, a greater concentration of O-desmethyltramadol is excreted into breast milk. The FDA reported that they identified no serious neonatal adverse events in the literature due to the use of tramadol by women who are breastfeeding. However, given that tramadol and its CYP2D6 metabolite enter breast milk and the potential for life-threatening respiratory de-pression in the infant, the FDA included tramadol in its warning about codeine.3
Codeine, hydrocodone, oxycodone, and tramadol are all metabolized to more potent metabolites by the CYP2D6 enzyme. Individuals with low CYP2D6 activity, representing about 5% of the US population, cannot fully activate these narcotics. Hence they may not get adequate pain relief when treated with codeine, oxycodone, hydrocodone, or tramadol. Given their resistance to these medications they may first be placed on a higher dose of the narcotic and then switched from a high ineffective dose of one of the agents activated by CYP2D6 to a high dose of morphine or hydromorphone. This can be dangerous because they may then receive an excessive dose of narcotic and develop respiratory depression.14
Read about how other pain medications affect breast milk.
Aspirin
There are very little high quality data about the use of aspirin in women breastfeeding and the effect on the neonate. If a mother takes aspirin, the drug will enter breast milk. It is estimated that the nursing baby receives about 4% to 8% of the mother’s dose. The World Health Organization recommends that aspirin is compatible with breastfeeding in occasional small doses, but repeated administration of aspirin in normal doses should be avoided in women who are breastfeeding. If chronic or high-dose aspirin therapy is recommended, the infant should be monitored for side effects including metabolic acidosis15 and coagulation disorders.16 The National Reye’s Syndrome Foundation recommends against the use of aspirin in women who are breastfeeding because of the theoretical risk of triggering Reye syndrome.17 Acetaminophen and ibuprofen are recommended by the WHO for chronic treatment of pain during breastfeeding.16
Acetaminophen and ibuprofen
For the medication treatment of pain in women who are breastfeeding, the WHO recommends the use of acetaminophen and ibuprofen.16 Acetaminophen is transferred from the maternal circulation into breast milk, but it is estimated that the dose to the nursing neonate is <0.3% of the maternal dose.18 In mothers taking ibuprofen 1600 mg daily, the concentration of ibuprofen in breast milk was below the level of laboratory detection (<1 mg/L).19 Ibuprofen treatment is thought to be safe for women who are breastfeeding because of its short half-life (2 hours), low excretion into milk, and few reported adverse effects in infants.
Morphine
Morphine is not metabolized by CYP2D6 and is excreted into breast milk. Many experts believe that women who are breastfeeding may take standard doses of oral morphine with few adverse effects in the newborn.20,21 For the treatment of moderate to severe pain in opioid-naive adults, morphine doses in the range of 10 mg orally every 4 hours up to 30 mg orally every 4 hours are prescribed. When using a solution of morphine, standard doses are 10 mg to 20 mg every 4 hours, as needed to treat pain. When using morphine tablets, standard doses are 15 mg to 30 mg every 4 hours. The WHO states that occasional doses of morphine are usually safe for women breastfeeding their newborn.16 The AAP recommends the use of morphine and hydromorphone when narcotic agents are needed to treat pain in breastfeeding women.2
Hydromorphone
Hydromorphone, a hydrogenated ketone derivative of morphine, is not metabolized by CYP2D6 and is excreted into breast milk. There are limited data on the safety of hydromorphone during breastfeeding. Breast milk concentrations of hydromorphone are low, and an occasional dose is likely associated with few adverse effects in the breastfeeding newborn.22 For the treatment of moderate to severe pain in opioid-naive adults, hydromorphone doses in the range of 2 mg orally every 4 hours up to 4 mg orally every 4 hours are prescribed. Like all narcotics, hydromorphone can result in central nervous system depression. If a mother ingests sufficient quantities of hydromorphone, respiratory depression in the breastfeeding newborn can occur. In one case report, a nursing mother was taking hydromorphone 4 mg every 4 hours for pain following a cesarean delivery. On day 6 following birth, her newborn was lethargic and she brought the infant to an emergency room. In the emergency room the infant became apneic and was successfully treated with naloxone, suggesting anarcotic overdose due to the presence of hydromorphone in breast milk.23 Hydromorphone should only be used at the lowest effective dose and for the shortest time possible.
Related article:
Should coffee consumption be added as an adjunct to the postoperative care of gynecologic oncology patients?
The bottom line
Pediatricians seldom prescribe codeine, oxycodone, hydrocodone, or tramadol for the treatment of pain in newborns or children. Pediatricians generally use acetaminophen and morphine for the treatment of pain in newborns. Although data from large, high quality clinical trials are not available, expert opinion recommends that acetaminophen and ibuprofen should be prescribed as first-line medications for the treatment of pain in women who are breastfeeding. Use of narcotics that are metabolized by CYP2D6 should be minimized or avoided in women who are breastfeeding. If narcotic medication is necessary, the lowest effective dose of morphine or hy-dromorphone should be prescribed for the shortest time possible. If morphine is prescribed to wo-men who are breastfeeding, they should be advised to observe their baby for signs of narcotic excess, including drowsiness, poor nursing, slow breathing, or low heart rate.
The goal of reducing morbidity and mortality from opioid use is a top public health priority. Obstetrician-gynecologists can contribute through the optimal use of opioid analgesics. Reducing the number of opioid prescriptions and the quantity of medication prescribed per prescription is an important first step in our effort to reduce opioid-related deaths.
Share your thoughts! Send your Letter to the Editor to [email protected]. Please include your name and the city and state in which you practice.
- National Overdose Deaths—Number of Deaths from Opioid Drugs. National Institute on Drug Abuse website. . Update January 2017. Accessed September 14, 2017.
- Sachs HC; Committee on Drugs. The transfer of drugs and therapeutics into human breast milk: an update on selected topics. Pediatrics. 2013;132(3):e796–e809.
- US Food and Drug Administration. FDA Drug Safety Communication. FDA restricts use of prescription codeine pain and cough medicines and tramadol pain medicines in children; recommends against use in breastfeeding women. Silver Spring, MD: US Food and Drug Administration. https://www.fda.gov/Drugs/DrugSafety/ucm118113.htm. Published April 2017. Accessed September 12, 2017.
- Practice advisory on codeine and tramadol for breast feeding women. American College of Obstetricians and Gynecologists website. https://www.acog.org/About-ACOG/News-Room/Practice-Advisories/Practice-Advisory-on-Codeine-and-Tramadol-for-Breastfeeding-Women. Published April 27, 2017. Accessed September 12, 2017.
- Madadi P, Shirazi F, Walter FG, Koren G. Establishing causality of CNS depression in breastfed infants following maternal codeine use. Paediatr Drugs. 2008;10(6):399–404.
- Langaee T, Hamadeh I, Chapman AB, Gums JG, Johnson JA. A novel simple method for determining CYP2D6 gene copy number and identifying allele(s) with duplication/multiplication. PLoS One. 2015;10(1):e0113808.
- Cascorbi I. Pharmacogenetics of cytochrome p4502D6: genetic background and clinical implication. Eur J Clin Invest. 2003;33(suppl 2):17–22.
- Naumburg EG, Meny RG. Breast milk opioids and neonatal apnea. Am J Dis Child. 1988;142(1):11–12.
- Sauberan JB, Anderson PO, Lane JR, et al. Breast milk hydrocodone and hydromorphone levels in mothers using hydrocodone for postpartum pain. Obstet Gynecol. 2011;117(3):611–617.
- Seaton S, Reeves M, McLean S. Oxycodone as a component of multimodal analgesia for lactating mothers after Cesarean section: relationships between maternal plasma, breast milk and neonatal plasma levels. Aust N Z J Obstet Gynaecol. 2007;47(3):181–185.
- Lam J, Kelly L, Ciszkowski C, et al. Central nervous system depression of neonates breastfed by mothers receiving oxycodone for postpartum analgesia. J Pediatr. 2012;160(1):33–37.e2.
- Timm NL. Maternal use of oxycodone resulting in opioid intoxication in her breastfed neonate. J Pediatr. 2013;162(2):421–422.
- The Society for Obstetric Anesthesia and Perinatology. Comments in response to the ACOG/SMFM Practice Advisory on Codeine and Tramadol for Breastfeeding Women. The Society for Obstetric Anesthesia and Perinatology website. https://soap.org/soap-response-acog-smfm-advisory.pdf. Published June 10, 2017. Accessed August 28, 2017.
- Banning AM. Respiratory depression following medication change from tramadol to morphine [article in Danish]. Ugeskr Laeger. 1999;161(47):6500–6501.
- Clark JH, Wilson WG. A 16-day old breast-fed infant with metabolic acidosis caused by salicylate. Clin Pediatr (Phila). 1981;20(1):53–54.
- World Health Organization. Breastfeeding and maternal medication. Recommendations for drugs in the 11th WHO model list of essential drugs. http://apps.who.int/iris/bitstream/10665/62435/1/55732.pdf. Published 2002. Accessed September 12, 2017.
- Reye’s syndrome. National Reye’s Syndrome Foundation website. http://www.reyessyndrome.org. Accessed September 12, 2017.
- Berline CM Jr, Yaffe SJ, Ragni M. Disposition of acetaminophen in milk, saliva, and plasma of lactating women. Pediatr Pharmacol (New York). 1980;1(2):135–141.
- Townsend RJ, Benedetti TJ, Erickson SH, et al. Excretion of ibuprofen into breast milk. Am J Obstet Gynecol. 1984;149(2):184–186.
- Spigset O, Hägg S. Analgesics and breast-feeding: safety considerations. Paediatr Drugs. 2000;2(3):223–238.
- Bar-OZ B, Bulkowstein M, Benyamini L, et al. Use of antibiotic and analgesic drugs during lactation. Drug Saf. 2003;26(13):925–935.
- Edwards JE, Rudy AC, Wermeling DP, Desai N, McNamara PJ. Hydromorphone transfer into breast milk after intranasal administration. Pharmacotherapy. 2003;23(2):153–158.
- Schultz ML, Kostic M, Kharasch S. A case of toxic breast-feeding [published online ahead of print January 6, 2017]. Pediatr Emerg Care. doi:10.1097/PEC.0000000000001009.

Dr. Barbieri is Editor in Chief, OBG Management; Chair, Obstetrics and Gynecology, Brigham and Women’s Hospital; and Kate Macy Ladd Professor of Obstetrics, Gynecology, and Reproductive Biology, Harvard Medical School, Boston, Massachusetts.
Dr. Barbieri reports no financial relationships relevant to this article.
In 2015 more than 30,000 deaths from opioid overdose were reported (FIGURE).1 More than 50% of the deaths were due to prescription opioids. The opioid crisis is a public health emergency and clinicians are diligently working to reduce both the number of opioid prescriptions and the doses prescribed per prescription.
In obstetrics, there is growing concern that narcotics used for the treatment of pain in women who are breastfeeding may increase the risk of adverse effects in newborns, including excessive sedation and respiratory depression. The American Academy of Pediatrics (AAP), the US Food and Drug Administration (FDA) and the American College of Obstetricians and Gynecologists (ACOG) recommend against the use of codeine and tramadol in women who are breastfeeding because their newborns may have adverse reactions, including excessive sleepiness, difficulty breathing, and potentially fatal breathing problems.2–4 In addition, there is growing concern that the use of oxycodone and hydrocodone should also be limited in women who are breastfeeding. In this article, I discuss the rationale for these recommendations.
Related article:
Landmark women’s health care remains law of the land
Codeine
Codeine is metabolized to morphine by CYP2D6 and CYP2D7. Both codeine and morphine are excreted into breast milk. Some women are ultrarapid metabolizers of codeine because of high levels of CYP2D6, resulting in higher concentrations of morphine in their breast milk and their breast fed newborn.2,5 In many women who are ultra-rapid metabolizers of codeine, CYP2D6 gene duplication or multiplication is the cause of the increased enzyme activity.6 Genotyping can identify some women who are ultrarapid metabolizers, but it is not currently utilized widely in clinical practice.
In the United States approximately 5% of women express high levels of CYP2D6 and are ultra-rapid metabolizers of codeine.4 In Ethiopia as many as 29% of women are ultrarapid metabolizers.7 Newborn central nervous system (CNS) depression is the most common adverse effect of fetal ingestion of excessive codeine and mor-phine from breast milk and may present as sedation, apnea, bradycardia, or cyanosis.8 Multiple newborn fatalities have been re-ported in the literature when lactating mothers who were ultrarapid metabolizers took co-deine. The FDA and ACOG recommend against the use of codeine in lactating women.
Hydrocodone
Hydrocodone, a hydrogenated ketone derivative of codeine, is metabolized by CYP2D6 to hydromorphone. Both hydrocodone and hydromorphone are present in breast milk. In lactating mothers taking hydrocodone, up to 9% of the dose may be ingested by the breastfeeding newborn.9 There is concern that hydrocodone use by women who are breastfeeding and are ultrarapid metabolizers may cause increased fetal consumption of hydromorphone resulting in adverse outcomes in the newborn. The AAP cautions against the use of hydrocodone.2
Oxycodone
Oxycodone is metabolized by CYP2D6 to oxymorphone and is concentrated into breast milk.10 Oxymorphone is more than 10 times more potent than oxycodone. In one study of lactating women taking oxycodone, codeine, or acetaminophen, the rates of neonate CNS depression were 20%, 17%, and 0.5%, respectively.11 The authors concluded that for mothers who are breastfeeding oxycodone was no safer than codeine because both medications were associated with a high rate of depression in the neonate. Newborns who develop CNS depression from exposure to oxycodone in breast milk will respond to naloxone treatment.12 The AAP recommends against prescribing oxycodone for women who are breastfeeding their infants.2
In a recent communication, the Society for Obstetric Anesthesia and Perinatology (SOAP) observed that in the United States, following cesarean delivery the majority of women receive oxycodone or hydrocodone.13 SOAP disagreed with the AAP recommendation against the use of oxycodone or hydrocodone in breastfeeding women. SOAP noted that all narcotics can produce adverse effects in newborns of breastfeeding women and that there are no good data that the prescription of oxycodone or hydrocodone is more risky than morphine or hydromorphone. However, based on their assessment of risk and benefit, pediatricians prioritize the use of acetaminophen and morphine and seldom use oxycodone or hydrocodone to treat moderate to severe pain in babies and children.
Tramadol
Tramadol is metabolized by CYP2D6 to O-desmethyltramadol. Both tramadol and O-desmethyltramadol are excreted into breast milk. In ultrarapid metabolizers, a greater concentration of O-desmethyltramadol is excreted into breast milk. The FDA reported that they identified no serious neonatal adverse events in the literature due to the use of tramadol by women who are breastfeeding. However, given that tramadol and its CYP2D6 metabolite enter breast milk and the potential for life-threatening respiratory de-pression in the infant, the FDA included tramadol in its warning about codeine.3
Codeine, hydrocodone, oxycodone, and tramadol are all metabolized to more potent metabolites by the CYP2D6 enzyme. Individuals with low CYP2D6 activity, representing about 5% of the US population, cannot fully activate these narcotics. Hence they may not get adequate pain relief when treated with codeine, oxycodone, hydrocodone, or tramadol. Given their resistance to these medications they may first be placed on a higher dose of the narcotic and then switched from a high ineffective dose of one of the agents activated by CYP2D6 to a high dose of morphine or hydromorphone. This can be dangerous because they may then receive an excessive dose of narcotic and develop respiratory depression.14
Read about how other pain medications affect breast milk.
Aspirin
There are very little high quality data about the use of aspirin in women breastfeeding and the effect on the neonate. If a mother takes aspirin, the drug will enter breast milk. It is estimated that the nursing baby receives about 4% to 8% of the mother’s dose. The World Health Organization recommends that aspirin is compatible with breastfeeding in occasional small doses, but repeated administration of aspirin in normal doses should be avoided in women who are breastfeeding. If chronic or high-dose aspirin therapy is recommended, the infant should be monitored for side effects including metabolic acidosis15 and coagulation disorders.16 The National Reye’s Syndrome Foundation recommends against the use of aspirin in women who are breastfeeding because of the theoretical risk of triggering Reye syndrome.17 Acetaminophen and ibuprofen are recommended by the WHO for chronic treatment of pain during breastfeeding.16
Acetaminophen and ibuprofen
For the medication treatment of pain in women who are breastfeeding, the WHO recommends the use of acetaminophen and ibuprofen.16 Acetaminophen is transferred from the maternal circulation into breast milk, but it is estimated that the dose to the nursing neonate is <0.3% of the maternal dose.18 In mothers taking ibuprofen 1600 mg daily, the concentration of ibuprofen in breast milk was below the level of laboratory detection (<1 mg/L).19 Ibuprofen treatment is thought to be safe for women who are breastfeeding because of its short half-life (2 hours), low excretion into milk, and few reported adverse effects in infants.
Morphine
Morphine is not metabolized by CYP2D6 and is excreted into breast milk. Many experts believe that women who are breastfeeding may take standard doses of oral morphine with few adverse effects in the newborn.20,21 For the treatment of moderate to severe pain in opioid-naive adults, morphine doses in the range of 10 mg orally every 4 hours up to 30 mg orally every 4 hours are prescribed. When using a solution of morphine, standard doses are 10 mg to 20 mg every 4 hours, as needed to treat pain. When using morphine tablets, standard doses are 15 mg to 30 mg every 4 hours. The WHO states that occasional doses of morphine are usually safe for women breastfeeding their newborn.16 The AAP recommends the use of morphine and hydromorphone when narcotic agents are needed to treat pain in breastfeeding women.2
Hydromorphone
Hydromorphone, a hydrogenated ketone derivative of morphine, is not metabolized by CYP2D6 and is excreted into breast milk. There are limited data on the safety of hydromorphone during breastfeeding. Breast milk concentrations of hydromorphone are low, and an occasional dose is likely associated with few adverse effects in the breastfeeding newborn.22 For the treatment of moderate to severe pain in opioid-naive adults, hydromorphone doses in the range of 2 mg orally every 4 hours up to 4 mg orally every 4 hours are prescribed. Like all narcotics, hydromorphone can result in central nervous system depression. If a mother ingests sufficient quantities of hydromorphone, respiratory depression in the breastfeeding newborn can occur. In one case report, a nursing mother was taking hydromorphone 4 mg every 4 hours for pain following a cesarean delivery. On day 6 following birth, her newborn was lethargic and she brought the infant to an emergency room. In the emergency room the infant became apneic and was successfully treated with naloxone, suggesting anarcotic overdose due to the presence of hydromorphone in breast milk.23 Hydromorphone should only be used at the lowest effective dose and for the shortest time possible.
Related article:
Should coffee consumption be added as an adjunct to the postoperative care of gynecologic oncology patients?
The bottom line
Pediatricians seldom prescribe codeine, oxycodone, hydrocodone, or tramadol for the treatment of pain in newborns or children. Pediatricians generally use acetaminophen and morphine for the treatment of pain in newborns. Although data from large, high quality clinical trials are not available, expert opinion recommends that acetaminophen and ibuprofen should be prescribed as first-line medications for the treatment of pain in women who are breastfeeding. Use of narcotics that are metabolized by CYP2D6 should be minimized or avoided in women who are breastfeeding. If narcotic medication is necessary, the lowest effective dose of morphine or hy-dromorphone should be prescribed for the shortest time possible. If morphine is prescribed to wo-men who are breastfeeding, they should be advised to observe their baby for signs of narcotic excess, including drowsiness, poor nursing, slow breathing, or low heart rate.
The goal of reducing morbidity and mortality from opioid use is a top public health priority. Obstetrician-gynecologists can contribute through the optimal use of opioid analgesics. Reducing the number of opioid prescriptions and the quantity of medication prescribed per prescription is an important first step in our effort to reduce opioid-related deaths.
Share your thoughts! Send your Letter to the Editor to [email protected]. Please include your name and the city and state in which you practice.
- National Overdose Deaths—Number of Deaths from Opioid Drugs. National Institute on Drug Abuse website. . Update January 2017. Accessed September 14, 2017.
- Sachs HC; Committee on Drugs. The transfer of drugs and therapeutics into human breast milk: an update on selected topics. Pediatrics. 2013;132(3):e796–e809.
- US Food and Drug Administration. FDA Drug Safety Communication. FDA restricts use of prescription codeine pain and cough medicines and tramadol pain medicines in children; recommends against use in breastfeeding women. Silver Spring, MD: US Food and Drug Administration. https://www.fda.gov/Drugs/DrugSafety/ucm118113.htm. Published April 2017. Accessed September 12, 2017.
- Practice advisory on codeine and tramadol for breast feeding women. American College of Obstetricians and Gynecologists website. https://www.acog.org/About-ACOG/News-Room/Practice-Advisories/Practice-Advisory-on-Codeine-and-Tramadol-for-Breastfeeding-Women. Published April 27, 2017. Accessed September 12, 2017.
- Madadi P, Shirazi F, Walter FG, Koren G. Establishing causality of CNS depression in breastfed infants following maternal codeine use. Paediatr Drugs. 2008;10(6):399–404.
- Langaee T, Hamadeh I, Chapman AB, Gums JG, Johnson JA. A novel simple method for determining CYP2D6 gene copy number and identifying allele(s) with duplication/multiplication. PLoS One. 2015;10(1):e0113808.
- Cascorbi I. Pharmacogenetics of cytochrome p4502D6: genetic background and clinical implication. Eur J Clin Invest. 2003;33(suppl 2):17–22.
- Naumburg EG, Meny RG. Breast milk opioids and neonatal apnea. Am J Dis Child. 1988;142(1):11–12.
- Sauberan JB, Anderson PO, Lane JR, et al. Breast milk hydrocodone and hydromorphone levels in mothers using hydrocodone for postpartum pain. Obstet Gynecol. 2011;117(3):611–617.
- Seaton S, Reeves M, McLean S. Oxycodone as a component of multimodal analgesia for lactating mothers after Cesarean section: relationships between maternal plasma, breast milk and neonatal plasma levels. Aust N Z J Obstet Gynaecol. 2007;47(3):181–185.
- Lam J, Kelly L, Ciszkowski C, et al. Central nervous system depression of neonates breastfed by mothers receiving oxycodone for postpartum analgesia. J Pediatr. 2012;160(1):33–37.e2.
- Timm NL. Maternal use of oxycodone resulting in opioid intoxication in her breastfed neonate. J Pediatr. 2013;162(2):421–422.
- The Society for Obstetric Anesthesia and Perinatology. Comments in response to the ACOG/SMFM Practice Advisory on Codeine and Tramadol for Breastfeeding Women. The Society for Obstetric Anesthesia and Perinatology website. https://soap.org/soap-response-acog-smfm-advisory.pdf. Published June 10, 2017. Accessed August 28, 2017.
- Banning AM. Respiratory depression following medication change from tramadol to morphine [article in Danish]. Ugeskr Laeger. 1999;161(47):6500–6501.
- Clark JH, Wilson WG. A 16-day old breast-fed infant with metabolic acidosis caused by salicylate. Clin Pediatr (Phila). 1981;20(1):53–54.
- World Health Organization. Breastfeeding and maternal medication. Recommendations for drugs in the 11th WHO model list of essential drugs. http://apps.who.int/iris/bitstream/10665/62435/1/55732.pdf. Published 2002. Accessed September 12, 2017.
- Reye’s syndrome. National Reye’s Syndrome Foundation website. http://www.reyessyndrome.org. Accessed September 12, 2017.
- Berline CM Jr, Yaffe SJ, Ragni M. Disposition of acetaminophen in milk, saliva, and plasma of lactating women. Pediatr Pharmacol (New York). 1980;1(2):135–141.
- Townsend RJ, Benedetti TJ, Erickson SH, et al. Excretion of ibuprofen into breast milk. Am J Obstet Gynecol. 1984;149(2):184–186.
- Spigset O, Hägg S. Analgesics and breast-feeding: safety considerations. Paediatr Drugs. 2000;2(3):223–238.
- Bar-OZ B, Bulkowstein M, Benyamini L, et al. Use of antibiotic and analgesic drugs during lactation. Drug Saf. 2003;26(13):925–935.
- Edwards JE, Rudy AC, Wermeling DP, Desai N, McNamara PJ. Hydromorphone transfer into breast milk after intranasal administration. Pharmacotherapy. 2003;23(2):153–158.
- Schultz ML, Kostic M, Kharasch S. A case of toxic breast-feeding [published online ahead of print January 6, 2017]. Pediatr Emerg Care. doi:10.1097/PEC.0000000000001009.

Where should a baby sleep after delivery?

Many hospitals across the country have received designation as “Baby Friendly”; many other hospitals are in the process of seeking this designation. In order to be Baby Friendly, a hospital or birth center must prove they have implemented a set of 10 rules to encourage breastfeeding. As Baby Friendly USA puts it in their byline, it has become the gold standard of care.
Importantly, Baby Friendly fails to recognize that there is another equally crucial participant in any childbirth experience—the woman. Although childbirth is natural and usually healthy, it is not easy. Women commonly lose up to 1 L of blood during childbirth.1 Labor can take 18 to 24 hours for a first-timer and about 12 to 18 hours for an encore performance, often disrupting at least1 entire night of sleep. The minimally invasive cesarean delivery continues to elude us, and women undergoing cesarean delivery must contend with a sizable incision and the additional pain and associated recovery.
Hospitals adopting the Baby Friendly rules must not allow formula, must prohibit pacifier use, and must go to great lengths to encourage rooming-in. Rooming-in means that the baby shares the same room as the new mother around-the-clock, which is reported to help the new mother distinguish sounds that indicate “feed me” from those that indicate a cool breeze. Rooming-in has been shown to be associated with a modest increase in breastfeeding2; however, women who are committed to breastfeeding likely room-in more often than women less committed to breastfeeding. Whether or not forcing the woman who is less committed to breastfeeding or the woman highly committed to breastfeeding who just wants a good night’s rest to room-in with her baby has a meaningful impact on breastfeeding remains unknown.
- Have written breastfeeding policy that is routinely communicated to all health care staff.
- Train all health care staff in skills necessary to implement this policy.
- Inform all pregnant women about benefits and management of breastfeeding.
- Help mothers initiate breastfeeding within 1 hour of birth.
- Show mothers how to breastfeed and how to maintain lactation, even if separated from their infants.
- Give infants no food or drink other than breast milk, unless medically indicated.
- Practice rooming in--allow mothers and infants to remain together 24 hours per day.
- Encourage breastfeeding on demand.
- Give no pacifiers or artificial nipples to breastfeeding infants.
- Foster the establishment of breastfeeding support groups and refer mothers to them on discharge.
Reference
- The ten steps to successful breastfeeding. Baby Friendly USA website. https://www.babyfriendlyusa.org/about-us/baby-friendly-hospital-initiative/the-ten-steps. Accessed September 14, 2017.
Are we violating ethics rules?
When hospitals adopt the Baby Friendly rules—policies that limit women’s choices for themselves and for their baby—we violate medical ethics principles regarding respect for autonomy, beneficence, and truthfulness. For instance, women are told that if they breastfeed their babies will be smarter, healthier, and have stronger emotional bonds. However, when research studies control for factors such as mothers’ education level or the amount of time spent talking to the baby, the effect of breastfeeding on intelligence “washes out.”3 Babies who are formula-fed but cuddled experience the same degree of bonding with their mothers as breast-fed babies.4,5
Although breast is best, the reported benefits that underlie Baby Friendly are overblown and oversold. When we explain to a woman why her newborn cannot spend a few hours in the nursery or why we cannot allow a pacifier, we are denying her the right to parent and make choices for herself and her baby, not acting in the best interest of the woman. We are in fact misrepresenting the truth. We are also acting paternalistic, propagating the long tradition of telling women that we know better about their reproductive health and choices.
Related article:
Women’s Preventive Services Initiative Guidelines provide consensus for practicing ObGyns
Breastfeeding still not fully accepted outside the hospital
The Baby Friendly rules restrict autonomy and prod women to breastfeed for the few days that they remain in the hospital postpartum. However, these women go home to societal and institutional systems that are deeply unsupportive of breastfeeding. In addition to being the birthplace for 98% of babies born in the United States, the health care industry is the single largest employer of US women.6,7 There are 5 academic hospitals in the Boston area. After contacting the human resources department at each, I found that only 1 has a policy for their breastfeeding employees.
Women should not be forced to choose between breastfeeding and working, between taking a longer maternity leave (often unpaid and professionally detrimental) and shelving the breast pump. What we invest in reveals our values. When we require women to room-in without respecting their choices or needs, and when workplaces fail to provide reasonable flexibility and private space for breast-pumping employees, our values as a society are revealed.
Women and men, hospital users and hospital employees, need to insist that the principles of autonomy, respect for persons, truthfulness, and justice guide breastfeeding policy both within our hospitals and within our workplaces. We need to respect women and the choices that they make for themselves and their families. We need to allow women to decide to recover from their delivery without their baby constantly in arms’ reach. We need to ensure that our counseling and our policies are rooted in sound science and not influenced by passionate but biased perspectives.
Share your thoughts! Send your Letter to the Editor to [email protected]. Please include your name and the city and state in which you practice.
- American Academy of Pediatrics, American College of Obstetricians and Gynecologists. Guidelines for perinatal care, 8th ed. AAP; Washington, DC: American College of Obstetricians and Gynecologists; 2017:272.
- Jaafar SH, Ho JJ, Lee KS. Rooming-in for new mother and infant versus separate care for increasing the duration of breastfeeding. Cochrane Database Syst Rev. 2016;(8):CD006641.
- Jain A, Concato J, Leventhal JM. How good is the evidence linking breastfeeding and intelligence? Pediatrics. 2002;109(6):1044-1053.
- Britton JR, Britton HL, Gronwaldt V. Breastfeeding, sensitivity, and attachment. Pediatrics. 2006;118(5):e1436-e1443.
- Jansen J, de Weerth C, Riksen-Walraven JM. Breastfeeding and the mother-infant relationship--a review. Dev Rev. 2008;28(4):503-521.
- MacDorman MF, Mathews TJ, Declercq E. Trends in out-of-hospital births in the United States, 1990-2012. CDC National Center for Health Statistics. https://www.cdc.gov/nchs/products/databriefs/db144.htm. Published March 4, 2014. Accessed September 11, 2017.
- US Bureau of Labor Statistics. Women in the labor force: a databook. BLS Reports. https://www.bls.gov/opub/reports/womens-databook/2016/home.htm. Published April 2017. Accessed September 11, 2017.

Dr. Baecher-Lind is Director, Division of General Obstetrics & Gynecology, Tufts Medical Center, and Clerkship Director, Obstetrics & Gynecology Clerkship, Tufts University School of Medicine.
The author reports no financial relationships relevant to this article.
Dr. Baecher-Lind is Director, Division of General Obstetrics & Gynecology, Tufts Medical Center, and Clerkship Director, Obstetrics & Gynecology Clerkship, Tufts University School of Medicine.
The author reports no financial relationships relevant to this article.
Dr. Baecher-Lind is Director, Division of General Obstetrics & Gynecology, Tufts Medical Center, and Clerkship Director, Obstetrics & Gynecology Clerkship, Tufts University School of Medicine.
The author reports no financial relationships relevant to this article.
Many hospitals across the country have received designation as “Baby Friendly”; many other hospitals are in the process of seeking this designation. In order to be Baby Friendly, a hospital or birth center must prove they have implemented a set of 10 rules to encourage breastfeeding. As Baby Friendly USA puts it in their byline, it has become the gold standard of care.
Importantly, Baby Friendly fails to recognize that there is another equally crucial participant in any childbirth experience—the woman. Although childbirth is natural and usually healthy, it is not easy. Women commonly lose up to 1 L of blood during childbirth.1 Labor can take 18 to 24 hours for a first-timer and about 12 to 18 hours for an encore performance, often disrupting at least1 entire night of sleep. The minimally invasive cesarean delivery continues to elude us, and women undergoing cesarean delivery must contend with a sizable incision and the additional pain and associated recovery.
Hospitals adopting the Baby Friendly rules must not allow formula, must prohibit pacifier use, and must go to great lengths to encourage rooming-in. Rooming-in means that the baby shares the same room as the new mother around-the-clock, which is reported to help the new mother distinguish sounds that indicate “feed me” from those that indicate a cool breeze. Rooming-in has been shown to be associated with a modest increase in breastfeeding2; however, women who are committed to breastfeeding likely room-in more often than women less committed to breastfeeding. Whether or not forcing the woman who is less committed to breastfeeding or the woman highly committed to breastfeeding who just wants a good night’s rest to room-in with her baby has a meaningful impact on breastfeeding remains unknown.
- Have written breastfeeding policy that is routinely communicated to all health care staff.
- Train all health care staff in skills necessary to implement this policy.
- Inform all pregnant women about benefits and management of breastfeeding.
- Help mothers initiate breastfeeding within 1 hour of birth.
- Show mothers how to breastfeed and how to maintain lactation, even if separated from their infants.
- Give infants no food or drink other than breast milk, unless medically indicated.
- Practice rooming in--allow mothers and infants to remain together 24 hours per day.
- Encourage breastfeeding on demand.
- Give no pacifiers or artificial nipples to breastfeeding infants.
- Foster the establishment of breastfeeding support groups and refer mothers to them on discharge.
Reference
- The ten steps to successful breastfeeding. Baby Friendly USA website. https://www.babyfriendlyusa.org/about-us/baby-friendly-hospital-initiative/the-ten-steps. Accessed September 14, 2017.
Are we violating ethics rules?
When hospitals adopt the Baby Friendly rules—policies that limit women’s choices for themselves and for their baby—we violate medical ethics principles regarding respect for autonomy, beneficence, and truthfulness. For instance, women are told that if they breastfeed their babies will be smarter, healthier, and have stronger emotional bonds. However, when research studies control for factors such as mothers’ education level or the amount of time spent talking to the baby, the effect of breastfeeding on intelligence “washes out.”3 Babies who are formula-fed but cuddled experience the same degree of bonding with their mothers as breast-fed babies.4,5
Although breast is best, the reported benefits that underlie Baby Friendly are overblown and oversold. When we explain to a woman why her newborn cannot spend a few hours in the nursery or why we cannot allow a pacifier, we are denying her the right to parent and make choices for herself and her baby, not acting in the best interest of the woman. We are in fact misrepresenting the truth. We are also acting paternalistic, propagating the long tradition of telling women that we know better about their reproductive health and choices.
Related article:
Women’s Preventive Services Initiative Guidelines provide consensus for practicing ObGyns
Breastfeeding still not fully accepted outside the hospital
The Baby Friendly rules restrict autonomy and prod women to breastfeed for the few days that they remain in the hospital postpartum. However, these women go home to societal and institutional systems that are deeply unsupportive of breastfeeding. In addition to being the birthplace for 98% of babies born in the United States, the health care industry is the single largest employer of US women.6,7 There are 5 academic hospitals in the Boston area. After contacting the human resources department at each, I found that only 1 has a policy for their breastfeeding employees.
Women should not be forced to choose between breastfeeding and working, between taking a longer maternity leave (often unpaid and professionally detrimental) and shelving the breast pump. What we invest in reveals our values. When we require women to room-in without respecting their choices or needs, and when workplaces fail to provide reasonable flexibility and private space for breast-pumping employees, our values as a society are revealed.
Women and men, hospital users and hospital employees, need to insist that the principles of autonomy, respect for persons, truthfulness, and justice guide breastfeeding policy both within our hospitals and within our workplaces. We need to respect women and the choices that they make for themselves and their families. We need to allow women to decide to recover from their delivery without their baby constantly in arms’ reach. We need to ensure that our counseling and our policies are rooted in sound science and not influenced by passionate but biased perspectives.
Share your thoughts! Send your Letter to the Editor to [email protected]. Please include your name and the city and state in which you practice.
- American Academy of Pediatrics, American College of Obstetricians and Gynecologists. Guidelines for perinatal care, 8th ed. AAP; Washington, DC: American College of Obstetricians and Gynecologists; 2017:272.
- Jaafar SH, Ho JJ, Lee KS. Rooming-in for new mother and infant versus separate care for increasing the duration of breastfeeding. Cochrane Database Syst Rev. 2016;(8):CD006641.
- Jain A, Concato J, Leventhal JM. How good is the evidence linking breastfeeding and intelligence? Pediatrics. 2002;109(6):1044-1053.
- Britton JR, Britton HL, Gronwaldt V. Breastfeeding, sensitivity, and attachment. Pediatrics. 2006;118(5):e1436-e1443.
- Jansen J, de Weerth C, Riksen-Walraven JM. Breastfeeding and the mother-infant relationship--a review. Dev Rev. 2008;28(4):503-521.
- MacDorman MF, Mathews TJ, Declercq E. Trends in out-of-hospital births in the United States, 1990-2012. CDC National Center for Health Statistics. https://www.cdc.gov/nchs/products/databriefs/db144.htm. Published March 4, 2014. Accessed September 11, 2017.
- US Bureau of Labor Statistics. Women in the labor force: a databook. BLS Reports. https://www.bls.gov/opub/reports/womens-databook/2016/home.htm. Published April 2017. Accessed September 11, 2017.

‘Multimorbidities’ in RA make impact on treatment efficacy, disease activity
While clinicians are accustomed to managing patients with rheumatoid arthritis and comorbidities, RA patients more frequently have “multimorbidities” – the simultaneous presence of two or more chronic conditions.
“For anyone who sees patients, this is the reality of our lives,” said Jeffrey R. Curtis, MD, at the annual Perspectives in Rheumatic Diseases held by Global Academy for Medical Education. Some conditions are “bystanders” that don’t impact RA, some are risk factors for RA, and some can be caused by RA treatments, said Dr. Curtis, professor of medicine and William J. Koopman Professor in Rheumatology and Immunology at the University of Alabama at Birmingham. He discussed several comorbid conditions and their interactions with RA.
Obesity’s toll on disease activity
It’s long been recognized that obesity along with RA makes things worse for patients, he said: “If you have a patient who is obese, with a BMI [body mass index] over 30-35, they’re less likely clinically to achieve low disease activity or remission.”

Obesity also affects biomarkers, he said. The multibiomarker disease activity test, marketed as Vectra DA, incorporates several adipokines in its score, but given any level of RA disease, that score is roughly 5 units higher if someone is obese (Sem Arthritis Rheum. 2017 Aug 2. doi: 10.1016/j.semarthrit.2017.07.010). “The company that manufactures the test is working on an adjustment factor to optimize the role of obesity and what those adipokines are doing to better predict x-ray progression to take this influence into account,” he said. “How we measure obesity and how we’re measuring RA are probably very much affected by this issue.”
RA and the somatization comorbidity phenotype
A second common co-occurrence is what Dr. Curtis calls a somatization comorbidity phenotype (SCP), defined as RA with several other ailments such as fibromyalgia, depression, anxiety, sleep apnea, or neuropathy. “The troubling thing about this is I could cure this patient’s RA tomorrow, but they actually wouldn’t feel better in their overall health because of other things dragging down their function,” he said, noting patients are more concerned about their fatigue and pain than their swollen joint count or DAS28 score.
Dr. Curtis and his colleagues completed a recent analysis that’s in press in Arthritis Research & Therapy of about 800 RA patients in the United States starting certolizumab pegol (Cimzia) to look for how well patients with this phenotype responded to a tumor necrosis factor (TNF) inhibitor. The percentage of patients with RA plus SCP who achieved American College of Rheumatology (ACR) 20/50/70 scores were all about 10% lower than for patients with RA alone, and about 15% fewer patients achieved remission using a score of less than 2.6 on the DAS28, based on erythrocyte sedimentation rate. There was about a 10% higher withdrawal rate among the RA plus SCP group, compared with those with RA alone, mainly for lack of efficacy, and the RA plus SCP patients had three times the rate of serious infections and twice the rate of nonserious infections of typical RA patients.
Impact on choice of therapy
Clinicians have questioned whether multimorbidities should affect the choice of RA therapy, Dr. Curtis said. One of the most vexing scenarios has been in patients with a history of cancer, he noted. There have been five studies worldwide looking at RA therapy in this population. One from Sweden (Ann Rheum Dis. 2015 Dec;74[12]:2137-43), of 240 breast cancer survivors, found no difference in the occurrence or hazard ratio of recurrent breast cancer between those treated with TNF inhibitors versus those who were not. Another study coauthored by Dr. Curtis found similar results (Arthritis Rheumatol. 2016 Dec;68[10]:2403–11).
According to the ACR’s 2015 treatment guidelines, “If your RA patient has a previously treated, solid organ malignancy, there’s no restrictions on what you and I should use,” he said. “Basically, treat them like they hadn’t had a history of cancer.” The exception is for patients with previously treated nonmelanoma skin cancer or melanoma, in whom conventional synthetic DMARDs are preferred over biologics or tofacitinib (Xeljanz). In addition, patients with previously treated lymphoproliferative disorders should be given rituximab (Rituxan) – or DMARDs, abatacept (Orencia), or tocilizumab (Actemra) – over TNF inhibitors. “This is good news,” Dr. Curtis said. “It really expands the range of options for patients, now supported by data, who have a history of cancer and bad RA.”
Global Academy for Medical Education and this news organization are owned by the same parent company. Dr. Curtis receives research support or serves as a consultant for Amgen, Bristol-Myers Squibb, Corrona, Lilly, Janssen, Myriad, Pfizer, and Sanofi/Regeneron.
While clinicians are accustomed to managing patients with rheumatoid arthritis and comorbidities, RA patients more frequently have “multimorbidities” – the simultaneous presence of two or more chronic conditions.
“For anyone who sees patients, this is the reality of our lives,” said Jeffrey R. Curtis, MD, at the annual Perspectives in Rheumatic Diseases held by Global Academy for Medical Education. Some conditions are “bystanders” that don’t impact RA, some are risk factors for RA, and some can be caused by RA treatments, said Dr. Curtis, professor of medicine and William J. Koopman Professor in Rheumatology and Immunology at the University of Alabama at Birmingham. He discussed several comorbid conditions and their interactions with RA.
Obesity’s toll on disease activity
It’s long been recognized that obesity along with RA makes things worse for patients, he said: “If you have a patient who is obese, with a BMI [body mass index] over 30-35, they’re less likely clinically to achieve low disease activity or remission.”
Obesity also affects biomarkers, he said. The multibiomarker disease activity test, marketed as Vectra DA, incorporates several adipokines in its score, but given any level of RA disease, that score is roughly 5 units higher if someone is obese (Sem Arthritis Rheum. 2017 Aug 2. doi: 10.1016/j.semarthrit.2017.07.010). “The company that manufactures the test is working on an adjustment factor to optimize the role of obesity and what those adipokines are doing to better predict x-ray progression to take this influence into account,” he said. “How we measure obesity and how we’re measuring RA are probably very much affected by this issue.”
RA and the somatization comorbidity phenotype
A second common co-occurrence is what Dr. Curtis calls a somatization comorbidity phenotype (SCP), defined as RA with several other ailments such as fibromyalgia, depression, anxiety, sleep apnea, or neuropathy. “The troubling thing about this is I could cure this patient’s RA tomorrow, but they actually wouldn’t feel better in their overall health because of other things dragging down their function,” he said, noting patients are more concerned about their fatigue and pain than their swollen joint count or DAS28 score.
Dr. Curtis and his colleagues completed a recent analysis that’s in press in Arthritis Research & Therapy of about 800 RA patients in the United States starting certolizumab pegol (Cimzia) to look for how well patients with this phenotype responded to a tumor necrosis factor (TNF) inhibitor. The percentage of patients with RA plus SCP who achieved American College of Rheumatology (ACR) 20/50/70 scores were all about 10% lower than for patients with RA alone, and about 15% fewer patients achieved remission using a score of less than 2.6 on the DAS28, based on erythrocyte sedimentation rate. There was about a 10% higher withdrawal rate among the RA plus SCP group, compared with those with RA alone, mainly for lack of efficacy, and the RA plus SCP patients had three times the rate of serious infections and twice the rate of nonserious infections of typical RA patients.
Impact on choice of therapy
Clinicians have questioned whether multimorbidities should affect the choice of RA therapy, Dr. Curtis said. One of the most vexing scenarios has been in patients with a history of cancer, he noted. There have been five studies worldwide looking at RA therapy in this population. One from Sweden (Ann Rheum Dis. 2015 Dec;74[12]:2137-43), of 240 breast cancer survivors, found no difference in the occurrence or hazard ratio of recurrent breast cancer between those treated with TNF inhibitors versus those who were not. Another study coauthored by Dr. Curtis found similar results (Arthritis Rheumatol. 2016 Dec;68[10]:2403–11).
According to the ACR’s 2015 treatment guidelines, “If your RA patient has a previously treated, solid organ malignancy, there’s no restrictions on what you and I should use,” he said. “Basically, treat them like they hadn’t had a history of cancer.” The exception is for patients with previously treated nonmelanoma skin cancer or melanoma, in whom conventional synthetic DMARDs are preferred over biologics or tofacitinib (Xeljanz). In addition, patients with previously treated lymphoproliferative disorders should be given rituximab (Rituxan) – or DMARDs, abatacept (Orencia), or tocilizumab (Actemra) – over TNF inhibitors. “This is good news,” Dr. Curtis said. “It really expands the range of options for patients, now supported by data, who have a history of cancer and bad RA.”
Global Academy for Medical Education and this news organization are owned by the same parent company. Dr. Curtis receives research support or serves as a consultant for Amgen, Bristol-Myers Squibb, Corrona, Lilly, Janssen, Myriad, Pfizer, and Sanofi/Regeneron.
EXPERT ANALYSIS FROM THE ANNUAL PERSPECTIVES IN RHEUMATIC DISEASES