User login
Levothyroxine: No benefit for subclinical hypothyroidism in elderly
Levothyroxine provided no benefits in older patients with subclinical hypothyroidism in the first large randomized clinical trial of the treatment for this indication, which was presented at the annual meeting of the Endocrine Society.
An estimated 8%-18% of people aged 65 and older have subclinical hypothyroidism, which is defined as an elevated serum thyrotropin level and a serum free-thyroxine level within the reference range. The condition is considered to be a possible contributor to many problems affecting numerous physiologic systems including the vascular tree, the heart, the brain, skeletal muscle, and bone, said David J. Stott, MD, of the academic section of geriatric medicine, Institute of Cardiovascular and Medical Sciences, University of Glasgow.
The mean age of the study participants was 74 years, and they were followed for a median of 18 months after initiating treatment. The active intervention did boost thyroid function as expected, compared with placebo.
The two primary outcome measures were change between baseline and 1 year in hypothyroid symptoms and in tiredness scores on the 100-point ThyPRO (Thyroid-Related Quality of Life Patient-Reported Outcome) measure. There were no significant differences between the two study groups in changes in either of these scores. The mean 1-year score for hypothyroid symptoms was 16.6 for levothyroxine and 16.7 for placebo, and the mean 1-year score for tiredness was 28.7 for levothyroxine and 28.6 for placebo.
Secondary outcomes also did not differ significantly between the two study groups, including general health-related quality of life; hand-grip strength (reflecting possible effects on skeletal muscle); executive cognitive function (reflecting possible effects on the brain); blood pressure, weight, body mass index, and waist circumference (reflecting possible effects on cardiovascular health); or activities of daily living. In addition, both fatal and nonfatal cardiovascular events were similar between the two study groups at 1 year and at extended 3-year follow-up.
Further analyses did not identify any subgroup of adults who benefited from active treatment. The lack of benefit extended across all older age groups, both genders, and all serum thyrotropin levels at baseline. In addition, all the sensitivity analyses confirmed the results of the main analysis.
Adverse events also were not significantly different between the two study groups. This included four serious adverse events of special interest: new-onset atrial fibrillation, heart failure, fracture, or osteoporosis. There also was no increase in symptoms of hyperthyroidism in the active-treatment group.
FROM ENDO 2017
Key clinical point: Levothyroxine provided no benefits in older patients with subclinical hypothyroidism in the first large randomized clinical trial of the therapy.
Major finding: The mean score for hypothyroid symptoms was 16.6 for levothyroxine and 16.7 for placebo after 1 year of treatment, and the mean score for tiredness was 28.7 for levothyroxine and 28.6 for placebo.
Data source: An international randomized double-blind placebo-controlled clinical trial involving 737 older patients with subclinical hypothyroidism.
Disclosures: This study was supported by the European Union and several foundations. The levothyroxine and matching placebo were provided free of charge by Merck, which played no role in the design, analysis, or reporting of the study. Dr. Stott reported having no relevant financial disclosures; one of his associates reported ties to Bristol/Myers Squibb, Pfizer, and Bayer.
U.S. thyroid cancer incidence, mortality on the upswing
ORLANDO – with incidence-based mortality increasing by 1.1% annually from 1994 to 2013, according to a study conducted by the National Cancer Institute.
In a study of 77,726 patients diagnosed with thyroid cancer between 1974 and 2013, incidence rates increased from 4.56 per 100,000 person-years during 1974-1977 to 14.42 per 100,000 person-years during 2010-2013, according to Hyeyeun Lim, PhD, a postdoctoral fellow at National Cancer Institute, and colleagues (JAMA. 2017;317[13]:1338-48).
A majority of patients in the sample were female (75%) and white (82%); average age was 48 years.
A notable trend was the increase in papillary thyroid cancer (PTC). PTC was the most common thyroid cancer at 83.6% of diagnoses, followed by follicular, medullary, anaplastic, and other at 10.8%, 2.2%, 1.3%, and 2.1%, respectively. PTC was associated with the highest annual percent change (4.4%) and the only positive incidence-based mortality annual percent change (1.7%) among all histologic types, according to the researchers.
Regional and distant tumors accounted for 53.2% and 29% of deaths, respectively, compared to 13.5% for local tumors.
Dr. Lim and colleagues interpret the increase in incidence to contradict a common idea among researchers that attributes rising rates to new methods of detection such as ultrasound imaging and fine-needle aspiration biopsies.
“Such changes could account for the rapid increases in the incidence rates for localized and small PTCs that have been previously observed,” the researchers reported. “However, the significant, albeit less-rapid increase in advanced-stage and larger PTC incidence rates and increasing thyroid cancer mortality rates among patients diagnosed with advanced-stage PTC is not consistent with the notion that over-diagnosis is solely responsible for the changing trends in PTC incidence.”
While the researchers reported increased mortality rates among all PTC demographics, statistical significance was found solely in patients with distant disease (annual percentage changes, 2.9% [95% confidence interval, 1.1%-4.7%]), stage IV disease (APC, 12.9%[95%CI, 7.2%-19.0%]), or both, according to researchers.
Researchers speculate increased rates of obesity, childhood ionizing radiation exposure, and increased exposure to pesticides may be possible sources for increased rates of PTC, however Dr. Lim and peers assert further research must be conducted.
Based on these findings, researchers suggest “renewed focus on aggressive transdisciplinary management that includes surgery, adjuvant radioactive iodine, and, when indicated for the 5%-10% of patients who develop progressive disease, systemic therapy,” for patients with advanced-stage PTC.
Due to the nature of the study, researchers were limited to speculating potential reasons for increase in thyroid cancer incidence. Information of tumor size and stage was limited to the years when this information began to be recorded, after the initial years included in the study.
[email protected]
On Twitter @EAZTweets
AT ENDO 2017
Key clinical point:
Major finding: Thyroid cancer incidence increased 3.6% from 1974 to 2013 and incidence-based mortality increased by 1.1% per year from 1994 to 2013.
Data source: A retrospective study of 77,726 patient records attained from Surveillance, Epidemiology, and End Results–9 cancer registry database, analyzed via log-linear regression.
Disclosures: Dr. Julie Sosa reported being on the Data Monitoring Committee of the Medullary Thyroid Cancer Consortium Registry, which is sponsored by AstraZeneca, Eli Lilly, GlaxoSmithKline, and Novo Nordisk.
Efinaconazole Solution 10% for Treatment of Toenail Onychomycosis in Latino Patients
Onychomycosis is a common progressive fungal infection of the nail bed, matrix, or plate leading to destruction and deformity of the toenails and fingernails.1,2 It represents up to 50% of all nail disorders1,3 with a notable increasing prevalence in the United States.4-6
Latinos represent the largest ethnic minority group in the United States,7 which is growing rapidly through immigration, particularly in the southern United States. Prevalence data are limited. An incidence of 9.3% secondary to dermatophytes was recorded in a dermatology clinic setting (N=2000).8 Onychomycosis was reported in 31.9% of a group of Latino immigrants in North Carolina (N=518), with higher prevalence in poultry workers, possibly due to the work environment.9
Efinaconazole solution 10% was shown to be well tolerated and more effective than a vehicle in a phase 2 study in Mexico.10 Two identical phase 3 studies of 1655 participants assessed the safety and efficacy of efinaconazole solution 10% in the treatment of onychomycosis.11 This post hoc analysis compares the data for Latino versus non-Latino populations.
Methods
We evaluated the results of 2 multicenter, randomized, double-blind, vehicle-controlled studies that included a total of 1655 participants with mild to moderate toenail onychomycosis (20%–50% clinical involvement). Participants were randomized to efinaconazole solu-tion 10% or vehicle once daily (3:1) for 48 weeks with a 4-week posttreatment follow-up period.11
Our post hoc analysis included 270 Latino patients, defined as an individual of Cuban, Mexican, Puerto Rican, or South or Central American origin or other Latino culture, regardless of race. In addition, data were compared to the 1380 non-Latino patients in the 2 studies. Patients who were randomized in error and never received treatment were excluded from the intention-to-treat analysis.
Efficacy Evaluation
The primary efficacy end point was complete cure rate (0% clinical involvement of target toenail, and both negative potassium hydroxide examination and fungal culture) at week 52. Secondary end points included mycologic cure, complete/almost complete cure (≤5% clinical involvement of target toenail, mycologic cure), and treatment success (≤10% clinical involvement of target toenail) at week 52.
Safety Evaluation
Safety assessments included monitoring and recording of adverse events (AEs) at every postbaseline study visit through week 52. All AEs were classified using the Medical Dictionary for Regulatory Activities (version 12.1). Treatment-emergent AEs (ie, events that began after the first application of study drug) that occurred during the study were summarized for each treatment group by the number of patients reporting each event, as well as by system organ class, preferred term, severity, seriousness, and relationship to the study drug.
Results
A total of 270 Latino participants with toenail onychomycosis (efinaconazole solution 10%, n=193; vehicle, n=77) were included in our study. The mean age of participants at baseline was 45.9 years. They were predominantly male (69.6%) and white Latinos (91.1%). The mean area of target toenail involvement was 36.6%, and the mean number of affected nontarget toenails was 2.5. Latino participants tended to be younger than non-Latino participants (45.9 vs 52.6 years), with a higher proportion of females (30.4% vs 21.3%). Disease severity was similar in both populations. Diabetes was reported in 7.0% and 6.7% of Latino and non-Latino participants, respectively, and mean weight was 83.6 and 86.6 kg, respectively.
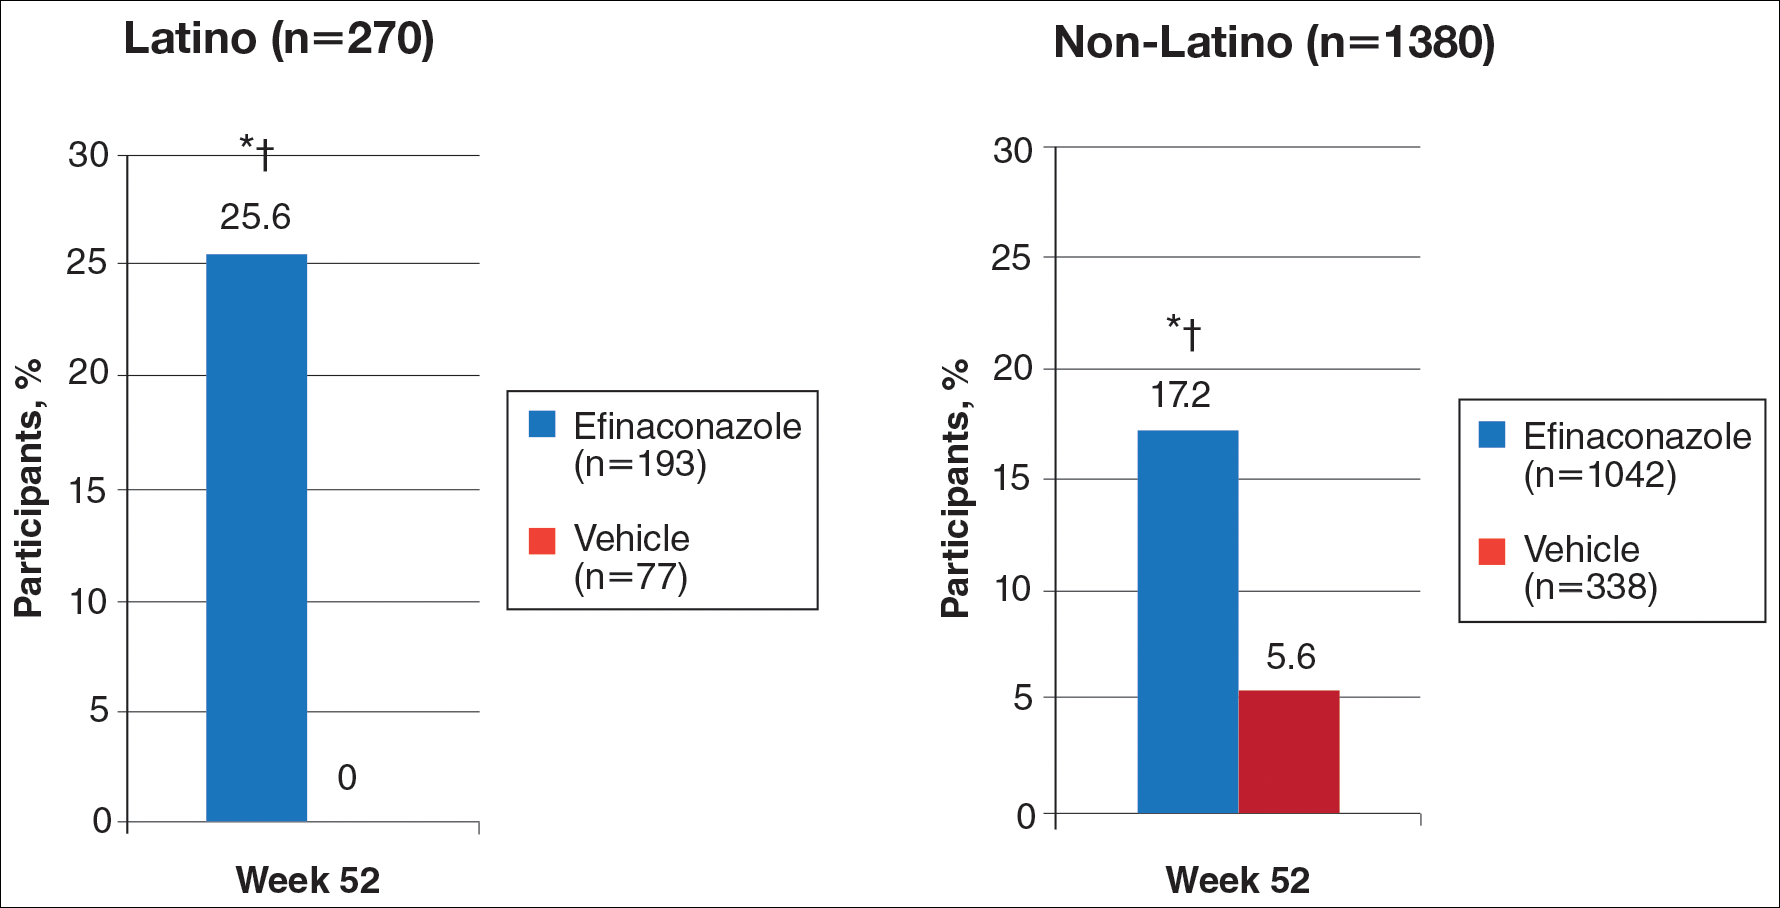
Primary Efficacy End Points (Observed Case [OC])
At week 52, 25.6% of Latino participants in the efinaconazole group achieved complete cure versus 0% in the vehicle group (P<.001)(Figure 1). The efficacy of efinaconazole was statistically superior in Latino participants versus non-Latino participants (17.2% [P=.012]). The net effect (calculated by active treatment minus vehicle) for Latino participants also was superior to non-Latino participants (25.6% vs 11.6%).
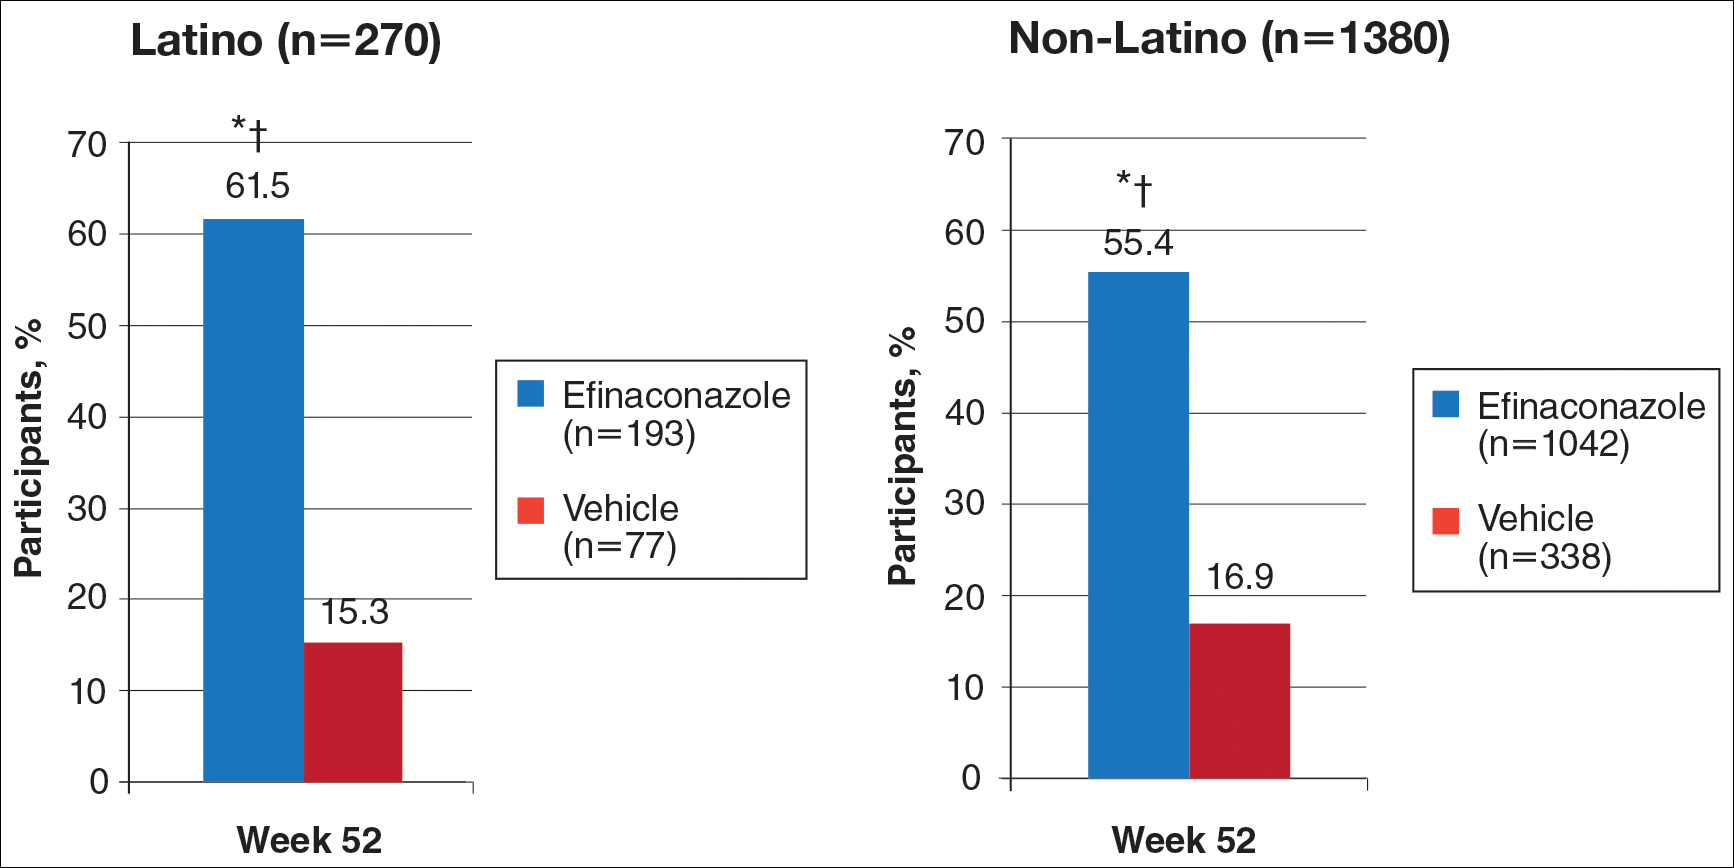
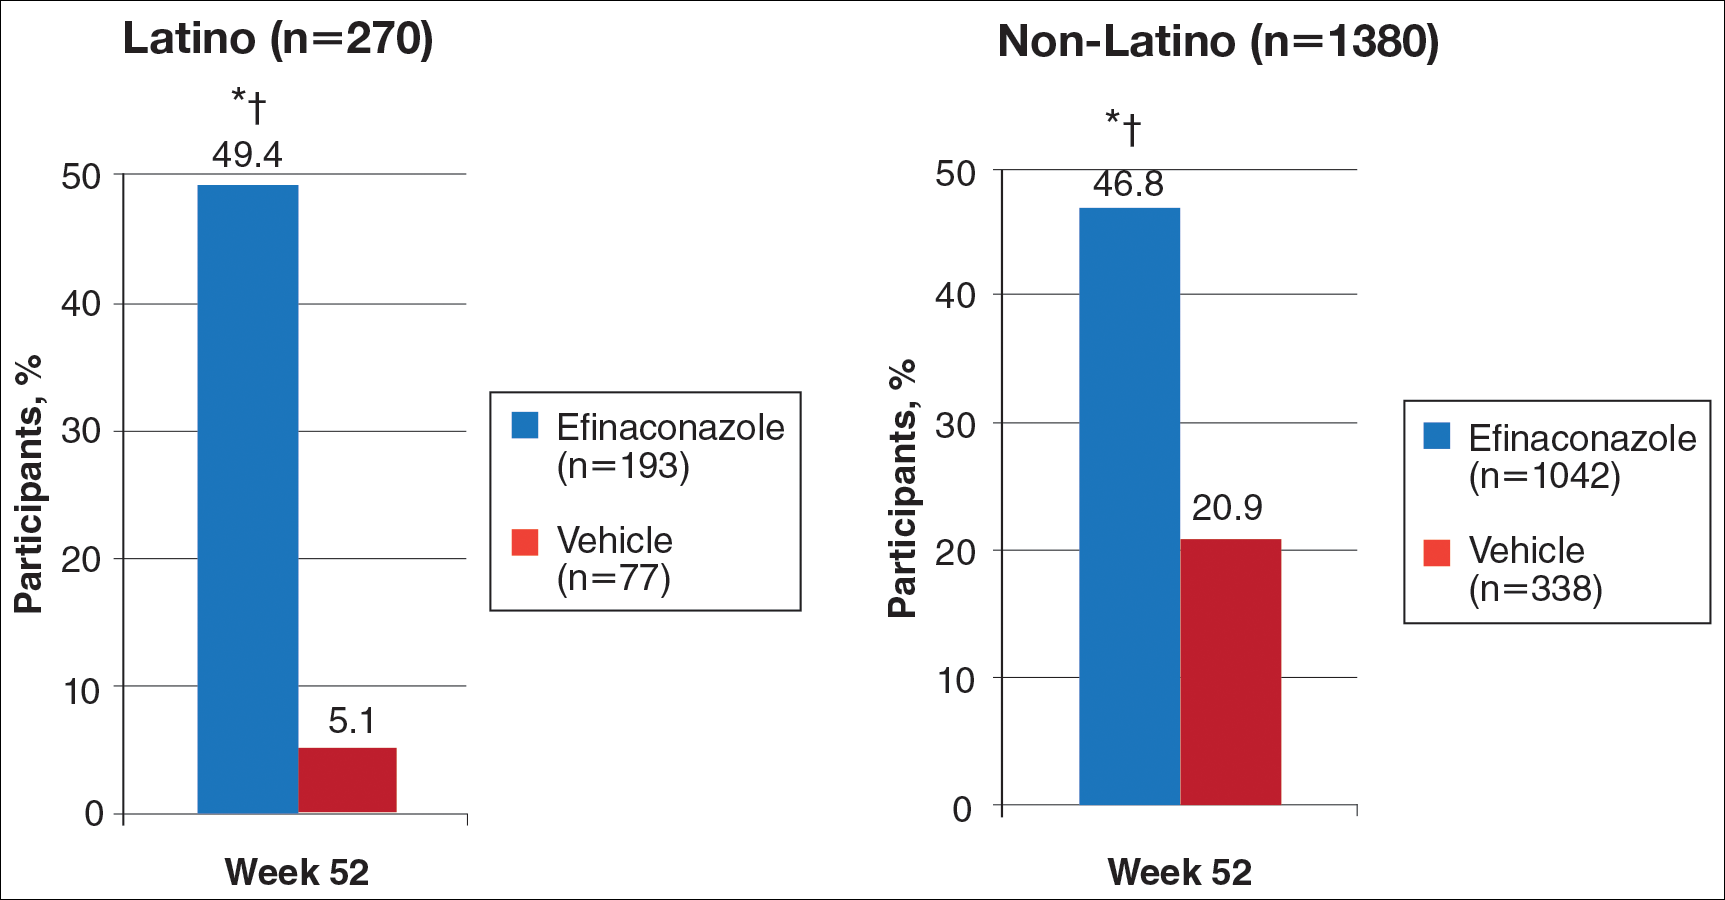
Secondary Efficacy End Points (OC)
At week 52, 61.5% of Latino participants in the efina-conazole group achieved mycologic cure versus 15.3% in the vehicle group (P<.001)(Figure 2). The net effect for Latino participants was superior to non-Latino participants (46.2% vs 38.5%). More Latino participants in the efinaconazole group compared to vehicle group achieved complete/almost complete cure (32.7% vs 1.7%) or treatment success (49.4% vs 5.1%)(all P<.001)(Figure 3). Although there was no significant difference between the 2 groups for secondary efficacy end points, the net effect of efinaconazole was greater for all end points.
Safety
Adverse event rates were higher in the efinaconazole group than the vehicle group (65.3% vs 54.4%) and were similar in both populations; they were generally mild (61.8% vs 54.5%) or moderate (35.3% vs 45.5%) in severity, not related to study medication (96.8% vs 98.0%), and resolved without sequelae. Only 3 Latino participants (1.6%) discontinued efinaconazole treatment compared to 29 (2.8%) in the non-Latino population.
Comment
With the continued growth of the Latino population in the United States and likely higher prevalence of onychomycosis,9 this post hoc analysis provides important insights into treatment of onychomycosis in this patient population.
Efinaconazole solution 10% was significantly more effective than vehicle in the Latino population (P<.001) and also appeared significantly more effective than the non-Latino population across the 2 phase 3 studies (P=.012). Interestingly, complete cure rates (25.6%) were identical to those reported in the phase 2 study of Mexican patients treated with efinaconazole for 36 weeks.10 Specific data with other topical therapies, such as tavaborole, in Latino patients are not available. One phase 3 study of tavaborole for onychomycosis included 89 Mexican patients (15% of the total study population), but complete cure rates for the overall active treatment group were higher in a second phase 3 study (6.5% vs 9.1%) that did not include participants outside the United States or Canada.12
It is not clear why phase 3 efficacy results with efinaconazole appear better in the Latino population. There are a number of predisposing factors for onychomycosis that are important treatment considerations in Latinos. Obesity is an important factor in the development of onychomycosis,13 with more than 42% of Latino adults in the United States reportedly obese compared to 32.6% of non-Latino adults.14 Obese patients reportedly have shown a poorer response to efinaconazole treatment15; however, in our analysis, the mean weight of the 2 subpopulations was similar at baseline. Diabetes also is associated with an increased risk for onychomycosis16,17 and may be a more important issue in Latinos perhaps due to differences in health care access, social and cultural factors, and/or genetics, as well as the greater incidence of obesity. Prior reports suggest the efficacy of efinaconazole is not substantially influenced by the presence of diabetes,18 and in our 2 subpopulations, baseline incidence of coexisting diabetes was similar. These factors are unlikely to account for the better treatment success seen in our analysis. Efinaconazole has been reported to be more effective in females,19 though the reasons are less clear. The higher proportion of female Latinos (30.4% vs 21.3%) in our study may have had an impact on the results reported, though this baseline characteristic cannot be considered in isolation.
When considering the net effect (active minus vehicle), the apparent benefits of efinaconazole in Latino patients with onychomycosis were more marked. Vehicle complete cure rates at week 52 were 0% compared with 5.6% of non-Latino participants. Vehicle cure rates in randomized controlled trials of toenail onychomycosis are relatively low and appear to be independent of the study characteristics.20 Vehicle cure rates of 2 topical treatments—efinaconazole and tavaborole—reported in their 2 respective phase 3 studies were 3.3% and 5.5% for efinaconzole11 and 0.5% and 1.5% for tavaborole.12 It has been suggested that the higher results seen with the efinaconazole vehicle relate to the formulation, though there is no reason to expect it to perform differently in a Latino population. It also has been suggested that baseline disease severity might impact vehicle treatment outcome.20 In our analysis, the percentage affected nail at baseline was higher in the Latino participants treated with vehicle (38.9% vs 36.2%).
Although the overall level of AEs was similar in Latino versus non-Latino participants treated with efinaconazole, events were generally milder in the Latino subpopulation and fewer participants discontinued because of AEs.
Our study had a number of limitations. A study period of 52 weeks may be too brief to evaluate clinical cure in onychomycosis, as continued improvement could occur with either longer treatment or follow-up. Also, the pivotal studies were not set up to specifically study Latino participants; the demographics and study disposition may not be representative of the general Latino population.
Conclusion
Once-daily treatment with efinaconazole solution 10% may provide a useful topical option in the treatment of Latino patients with toenail onychomycosis.
Acknowledgment
The authors would like to thank Brian Bulley, MSc (Konic Limited, West Sussex, United Kingdom), for medical writing support. Valeant Pharmaceuticals North America LLC funded Konic Limited’s activities pertaining to this manuscript. Dr. Cook-Bolden did not receive funding or any form of compensation for authorship of this publication.
- Scher RK, Coppa LM. Advances in the diagnosis and treatment of onychomycosis. Hosp Med. 1998;34:11-20.
- Crissey JT. Common dermatophyte infections. a simple diagnostic test and current management. Postgrad Med. 1998;103:191-192, 197-200, 205.
- Gupta AK, Jain HC, Lynde CW, et al. Prevalence and epidemiology of onychomycosis in patients visiting physicians’ offices: a multicenter Canadian survey of 15,000 patients. J Am Acad Dermatol. 2000;43:244-248.
- Scher RK, Rich P, Pariser D, et al. The epidemiology, etiology, and pathophysiology of onychomycosis. Semin Cutan Med Surg. 2013;32(2, suppl 1):S2-S4.
- Kumar S, Kimball AB. New antifungal therapies for the treatment of onychomycosis. Expert Opin Investig Drugs. 2009;18:727-734.
- Ghannoum MA, Hajjeh RA, Scher R, et al. A large-scale North American study of fungal isolates from nails: the frequency of onychomycosis, fungal distribution, and antifungal susceptibility patterns. J Am Acad Dermatol. 2000;43:641-648.
- Census 2010: 50 million Latinos. Hispanics account for more than half of nation’s growth in past decade. Pew Hispanic Center website. http://pewhispanic.org/files/reports/140.pdf. Published March 24, 2011. Accessed November 22, 2016.
- Sanchez MR. Cutaneous diseases in Latinos. Dermatol Clin. 2002;21:689-697.
- Pichardo-Geisinger R, Mun˜oz-Ali D, Arcury TA, et al. Dermatologist-diagnosed skin diseases among immigrant Latino poultry processors and other manual workers in North Carolina, USA. Int J Dermatol. 2013;52:1342-1348.
- Tschen EH, Bucko AD, Oizumi N, et al. Efinaconazole solution in the treatment of toenail onychomycosis: a phase 2, multicenter, randomized, double-blind study. J Drugs Dermatol. 2013;12:186-192.
- Elewski BE, Rich P, Pollak R, et al. Efinaconazole 10% solution in the treatment of toenail onychomycosis: two phase III multicenter, randomized, double-blind studies. J Am Acad Dermatol. 2013;68:600-608.
- Elewski BE, Aly R, Baldwin SL, et al. Efficacy and safety of tavaborole topical solution, 5%, a novel boron-based antifungal agent, for the treatment of toenail onychomycosis: results from 2 randomized phase-III studies. J Am Acad Dermatol. 2015;73:62-69.
- Chan MK, Chong LY. A prospective epidemiology survey of foot disease in Hong Kong. J Am Podiatr Med Assoc. 2002;92:450-456.
- Ogden CL, Carroll MD, Kit BK, et al. Prevalence of Obesity Among Adults: United States, 2011-2012. Hyattsville, MD: National Center for Health Statistics, 2013. NCHS data brief, no. 131.
- Elewski BE, Tosti A. Risk factors and comorbidities for onychomycosis: implications for treatment with topical therapy. J Clin Aesthet Dermatol. 2015;8:38-42.
- Tosti A, Hay R, Arenas-Guzmán R. Patients at risk of onychomycosis–risk factor identification and active prevention. J Eur Acad Dermatol Venereol. 2005;19(suppl 1):13-16.
- Sigurgeirsson B, Steingrímsson O. Risk factors associated with onychomycosis. J Eur Acad Dermatol Venereol. 2004;18:48-51.
- Vlahovic TC, Joseph WS. Efinaconazole topical, 10% for the treatment of toenail onychomycosis in patients with diabetes. J Drugs Dermatol. 2014;13:1186-1190.
- Rosen T. Evaluation of gender as a clinically relevant outcome variable in the treatment of onychomycosis with efinaconazole topical solution 10%. Cutis. 2015;96:197-201.
- Gupta AK, Paquet M. Placebo cure rates in the treatment of onychomycosis. J Am Podiatr Med Assoc. 2014;104:277-282.
Onychomycosis is a common progressive fungal infection of the nail bed, matrix, or plate leading to destruction and deformity of the toenails and fingernails.1,2 It represents up to 50% of all nail disorders1,3 with a notable increasing prevalence in the United States.4-6
Latinos represent the largest ethnic minority group in the United States,7 which is growing rapidly through immigration, particularly in the southern United States. Prevalence data are limited. An incidence of 9.3% secondary to dermatophytes was recorded in a dermatology clinic setting (N=2000).8 Onychomycosis was reported in 31.9% of a group of Latino immigrants in North Carolina (N=518), with higher prevalence in poultry workers, possibly due to the work environment.9
Efinaconazole solution 10% was shown to be well tolerated and more effective than a vehicle in a phase 2 study in Mexico.10 Two identical phase 3 studies of 1655 participants assessed the safety and efficacy of efinaconazole solution 10% in the treatment of onychomycosis.11 This post hoc analysis compares the data for Latino versus non-Latino populations.
Methods
We evaluated the results of 2 multicenter, randomized, double-blind, vehicle-controlled studies that included a total of 1655 participants with mild to moderate toenail onychomycosis (20%–50% clinical involvement). Participants were randomized to efinaconazole solu-tion 10% or vehicle once daily (3:1) for 48 weeks with a 4-week posttreatment follow-up period.11
Our post hoc analysis included 270 Latino patients, defined as an individual of Cuban, Mexican, Puerto Rican, or South or Central American origin or other Latino culture, regardless of race. In addition, data were compared to the 1380 non-Latino patients in the 2 studies. Patients who were randomized in error and never received treatment were excluded from the intention-to-treat analysis.
Efficacy Evaluation
The primary efficacy end point was complete cure rate (0% clinical involvement of target toenail, and both negative potassium hydroxide examination and fungal culture) at week 52. Secondary end points included mycologic cure, complete/almost complete cure (≤5% clinical involvement of target toenail, mycologic cure), and treatment success (≤10% clinical involvement of target toenail) at week 52.
Safety Evaluation
Safety assessments included monitoring and recording of adverse events (AEs) at every postbaseline study visit through week 52. All AEs were classified using the Medical Dictionary for Regulatory Activities (version 12.1). Treatment-emergent AEs (ie, events that began after the first application of study drug) that occurred during the study were summarized for each treatment group by the number of patients reporting each event, as well as by system organ class, preferred term, severity, seriousness, and relationship to the study drug.
Results
A total of 270 Latino participants with toenail onychomycosis (efinaconazole solution 10%, n=193; vehicle, n=77) were included in our study. The mean age of participants at baseline was 45.9 years. They were predominantly male (69.6%) and white Latinos (91.1%). The mean area of target toenail involvement was 36.6%, and the mean number of affected nontarget toenails was 2.5. Latino participants tended to be younger than non-Latino participants (45.9 vs 52.6 years), with a higher proportion of females (30.4% vs 21.3%). Disease severity was similar in both populations. Diabetes was reported in 7.0% and 6.7% of Latino and non-Latino participants, respectively, and mean weight was 83.6 and 86.6 kg, respectively.
Primary Efficacy End Points (Observed Case [OC])
At week 52, 25.6% of Latino participants in the efinaconazole group achieved complete cure versus 0% in the vehicle group (P<.001)(Figure 1). The efficacy of efinaconazole was statistically superior in Latino participants versus non-Latino participants (17.2% [P=.012]). The net effect (calculated by active treatment minus vehicle) for Latino participants also was superior to non-Latino participants (25.6% vs 11.6%).
Secondary Efficacy End Points (OC)
At week 52, 61.5% of Latino participants in the efina-conazole group achieved mycologic cure versus 15.3% in the vehicle group (P<.001)(Figure 2). The net effect for Latino participants was superior to non-Latino participants (46.2% vs 38.5%). More Latino participants in the efinaconazole group compared to vehicle group achieved complete/almost complete cure (32.7% vs 1.7%) or treatment success (49.4% vs 5.1%)(all P<.001)(Figure 3). Although there was no significant difference between the 2 groups for secondary efficacy end points, the net effect of efinaconazole was greater for all end points.
Safety
Adverse event rates were higher in the efinaconazole group than the vehicle group (65.3% vs 54.4%) and were similar in both populations; they were generally mild (61.8% vs 54.5%) or moderate (35.3% vs 45.5%) in severity, not related to study medication (96.8% vs 98.0%), and resolved without sequelae. Only 3 Latino participants (1.6%) discontinued efinaconazole treatment compared to 29 (2.8%) in the non-Latino population.
Comment
With the continued growth of the Latino population in the United States and likely higher prevalence of onychomycosis,9 this post hoc analysis provides important insights into treatment of onychomycosis in this patient population.
Efinaconazole solution 10% was significantly more effective than vehicle in the Latino population (P<.001) and also appeared significantly more effective than the non-Latino population across the 2 phase 3 studies (P=.012). Interestingly, complete cure rates (25.6%) were identical to those reported in the phase 2 study of Mexican patients treated with efinaconazole for 36 weeks.10 Specific data with other topical therapies, such as tavaborole, in Latino patients are not available. One phase 3 study of tavaborole for onychomycosis included 89 Mexican patients (15% of the total study population), but complete cure rates for the overall active treatment group were higher in a second phase 3 study (6.5% vs 9.1%) that did not include participants outside the United States or Canada.12
It is not clear why phase 3 efficacy results with efinaconazole appear better in the Latino population. There are a number of predisposing factors for onychomycosis that are important treatment considerations in Latinos. Obesity is an important factor in the development of onychomycosis,13 with more than 42% of Latino adults in the United States reportedly obese compared to 32.6% of non-Latino adults.14 Obese patients reportedly have shown a poorer response to efinaconazole treatment15; however, in our analysis, the mean weight of the 2 subpopulations was similar at baseline. Diabetes also is associated with an increased risk for onychomycosis16,17 and may be a more important issue in Latinos perhaps due to differences in health care access, social and cultural factors, and/or genetics, as well as the greater incidence of obesity. Prior reports suggest the efficacy of efinaconazole is not substantially influenced by the presence of diabetes,18 and in our 2 subpopulations, baseline incidence of coexisting diabetes was similar. These factors are unlikely to account for the better treatment success seen in our analysis. Efinaconazole has been reported to be more effective in females,19 though the reasons are less clear. The higher proportion of female Latinos (30.4% vs 21.3%) in our study may have had an impact on the results reported, though this baseline characteristic cannot be considered in isolation.
When considering the net effect (active minus vehicle), the apparent benefits of efinaconazole in Latino patients with onychomycosis were more marked. Vehicle complete cure rates at week 52 were 0% compared with 5.6% of non-Latino participants. Vehicle cure rates in randomized controlled trials of toenail onychomycosis are relatively low and appear to be independent of the study characteristics.20 Vehicle cure rates of 2 topical treatments—efinaconazole and tavaborole—reported in their 2 respective phase 3 studies were 3.3% and 5.5% for efinaconzole11 and 0.5% and 1.5% for tavaborole.12 It has been suggested that the higher results seen with the efinaconazole vehicle relate to the formulation, though there is no reason to expect it to perform differently in a Latino population. It also has been suggested that baseline disease severity might impact vehicle treatment outcome.20 In our analysis, the percentage affected nail at baseline was higher in the Latino participants treated with vehicle (38.9% vs 36.2%).
Although the overall level of AEs was similar in Latino versus non-Latino participants treated with efinaconazole, events were generally milder in the Latino subpopulation and fewer participants discontinued because of AEs.
Our study had a number of limitations. A study period of 52 weeks may be too brief to evaluate clinical cure in onychomycosis, as continued improvement could occur with either longer treatment or follow-up. Also, the pivotal studies were not set up to specifically study Latino participants; the demographics and study disposition may not be representative of the general Latino population.
Conclusion
Once-daily treatment with efinaconazole solution 10% may provide a useful topical option in the treatment of Latino patients with toenail onychomycosis.
Acknowledgment
The authors would like to thank Brian Bulley, MSc (Konic Limited, West Sussex, United Kingdom), for medical writing support. Valeant Pharmaceuticals North America LLC funded Konic Limited’s activities pertaining to this manuscript. Dr. Cook-Bolden did not receive funding or any form of compensation for authorship of this publication.
- Scher RK, Coppa LM. Advances in the diagnosis and treatment of onychomycosis. Hosp Med. 1998;34:11-20.
- Crissey JT. Common dermatophyte infections. a simple diagnostic test and current management. Postgrad Med. 1998;103:191-192, 197-200, 205.
- Gupta AK, Jain HC, Lynde CW, et al. Prevalence and epidemiology of onychomycosis in patients visiting physicians’ offices: a multicenter Canadian survey of 15,000 patients. J Am Acad Dermatol. 2000;43:244-248.
- Scher RK, Rich P, Pariser D, et al. The epidemiology, etiology, and pathophysiology of onychomycosis. Semin Cutan Med Surg. 2013;32(2, suppl 1):S2-S4.
- Kumar S, Kimball AB. New antifungal therapies for the treatment of onychomycosis. Expert Opin Investig Drugs. 2009;18:727-734.
- Ghannoum MA, Hajjeh RA, Scher R, et al. A large-scale North American study of fungal isolates from nails: the frequency of onychomycosis, fungal distribution, and antifungal susceptibility patterns. J Am Acad Dermatol. 2000;43:641-648.
- Census 2010: 50 million Latinos. Hispanics account for more than half of nation’s growth in past decade. Pew Hispanic Center website. http://pewhispanic.org/files/reports/140.pdf. Published March 24, 2011. Accessed November 22, 2016.
- Sanchez MR. Cutaneous diseases in Latinos. Dermatol Clin. 2002;21:689-697.
- Pichardo-Geisinger R, Mun˜oz-Ali D, Arcury TA, et al. Dermatologist-diagnosed skin diseases among immigrant Latino poultry processors and other manual workers in North Carolina, USA. Int J Dermatol. 2013;52:1342-1348.
- Tschen EH, Bucko AD, Oizumi N, et al. Efinaconazole solution in the treatment of toenail onychomycosis: a phase 2, multicenter, randomized, double-blind study. J Drugs Dermatol. 2013;12:186-192.
- Elewski BE, Rich P, Pollak R, et al. Efinaconazole 10% solution in the treatment of toenail onychomycosis: two phase III multicenter, randomized, double-blind studies. J Am Acad Dermatol. 2013;68:600-608.
- Elewski BE, Aly R, Baldwin SL, et al. Efficacy and safety of tavaborole topical solution, 5%, a novel boron-based antifungal agent, for the treatment of toenail onychomycosis: results from 2 randomized phase-III studies. J Am Acad Dermatol. 2015;73:62-69.
- Chan MK, Chong LY. A prospective epidemiology survey of foot disease in Hong Kong. J Am Podiatr Med Assoc. 2002;92:450-456.
- Ogden CL, Carroll MD, Kit BK, et al. Prevalence of Obesity Among Adults: United States, 2011-2012. Hyattsville, MD: National Center for Health Statistics, 2013. NCHS data brief, no. 131.
- Elewski BE, Tosti A. Risk factors and comorbidities for onychomycosis: implications for treatment with topical therapy. J Clin Aesthet Dermatol. 2015;8:38-42.
- Tosti A, Hay R, Arenas-Guzmán R. Patients at risk of onychomycosis–risk factor identification and active prevention. J Eur Acad Dermatol Venereol. 2005;19(suppl 1):13-16.
- Sigurgeirsson B, Steingrímsson O. Risk factors associated with onychomycosis. J Eur Acad Dermatol Venereol. 2004;18:48-51.
- Vlahovic TC, Joseph WS. Efinaconazole topical, 10% for the treatment of toenail onychomycosis in patients with diabetes. J Drugs Dermatol. 2014;13:1186-1190.
- Rosen T. Evaluation of gender as a clinically relevant outcome variable in the treatment of onychomycosis with efinaconazole topical solution 10%. Cutis. 2015;96:197-201.
- Gupta AK, Paquet M. Placebo cure rates in the treatment of onychomycosis. J Am Podiatr Med Assoc. 2014;104:277-282.
Practice Points
- Onychomycosis is a common disease of importance in the increasing Latino population of the United States, especially due to predisposing factors such as obesity and diabetes mellitus. Specific data on the treatment of this patient population are lacking.
- Two large phase 3 studies with topical efinaconazole treatment included a notable number of Latino patients.
- Complete cure rates with efinaconazole in Latino participants were notably greater than those observed in the non-Latino population, and treatment was well tolerated in both groups.
- Treatment of onychomycosis is important to possibly prevent a more serious infectious disease involving the lower extremities, especially in those with comorbidities such as obesity, diabetes, and peripheral vascular disease.
Write for Us, Right for You
In many parts of the country, spring is finally emerging from the long, hard, cold winter. In almost every culture, spring is associated with rebirth, the return of longer daylight hours, growth, and new life. Like seeds planted in the fall, many of the ideas we at Federal Practitioner sowed in 2016 are now blossoming—our new Historic Profiles and Mental Health Care Practice columns, among others. Just as many of us are engaging in spring cleaning in our homes and yards and opening windows to let in the warmth and the breezes, we at the journal are making room for inspiration and illumination—yours.
Our internal reorganization has enabled us to focus on what we enjoy most—publishing your work. We invite each of you to consider submitting a manuscript and encouraging your colleagues to do so. Almost every health care professional at some time in his or her career has thought of a study to write, read an article they wished they had written, or reviewed a topic they thought suitable for publication. Well, it is time to dust off those ideas and pull them out of the drawer or computer file, just like getting out the warm weather clothing.
In order to reflect the positive trend in federal health care toward multi- and interdisciplinary teams and practice, we welcome submissions from all our clinical constituents, including physicians, surgeons, chaplains, nurses, clinical pharmacists, advanced practice nurses, psychologists, physician assistants, administrators, allied health professionals, and any and all that my old brain cannot recall.
There is nothing like the feeling of seeing your work published in print or on the Internet for the first time in an esteemed journal. If you are a teacher or mentor, think about the gift of inviting a trainee or junior colleague to coauthor an article. This collaboration can be a wonderful shared creative endeavor for educators and their students.
If you have a good idea but are concerned that your writing may be too rough, we invite you to take a leap of faith. Although as a peer-reviewed journal we cannot guarantee acceptance of any manuscript, we can assure you that our editorial staff has smoothed more than a few bumps in our authors’ literary endeavors.
Federal Practitioner is a peer-reviewed journal that has a wide audience among federal health care professionals in the DoD, VA, and PHS. We at the journal are working to become indexed in PubMed, which will provide potential authors with an even wider and more prestigious exposure for their work. We invite you to visit our website and review this print journal to get an idea—if you don’t already have one—of the types of articles we publish. To jump-start your motivation, here is a brief description of the many types of articles we accept.
Feature Articles
Feature articles may be original research or comprehensive summaries of a clinically related topic. The possibilities are as endless as federal practice and could cover medications, other types of interventions (including psychosocial treatments), and reviews of diagnoses.
Original Research
We welcome empirical studies of completed research both biomedical and biobehavioral. More experienced and senior researchers might consider that publication in Federal Practitioner potentially can demonstrate their commitment to conducting research that benefits the members of the armed forces, public services, and veterans, to government funding agencies, increasingly a requirement for grants from those institutions. And for junior or new researchers, we offer a new option to publish pilot studies for research that is just getting launched or is on a smaller scale.
Case Reports
What health care professional has not had a case so memorable that he or she cannot forget it, or a patient encounter that made a lasting impression, or one in which they gained valuable medical knowledge or human wisdom? Ever thought of writing it up for your peers to learn from as well? Submit a case to Federal Practitioner and share your clinical pearls with your colleagues. The authoring process also gives you a chance to review the latest clinical literature on a diagnosis or treatment you wanted to know more about.
Program Profiles
This section of the journal reflects the unparalleled scope and resources of federal health care. Whether it is a national initiative or a local experiment, we want to know and let others read about the beneficial work that you are doing to care for service members, veterans, and the public. Submissions can be of innovative clinical or research projects or programs.
Guest Editorials
While usually members of the Editorial Advisory Association author guest editorials, we are pleased to consider high-quality, thought provoking editorials on themes of health care policy, organization, care delivery, ethics, and professionalism, among others.
Most of us have made the painful adjustment to daylight savings time. Use those extra hours of daylight to stimulate your creative brain. If writing a manuscript does not fit in to your busy schedule right now, think about becoming a peer reviewer or even a member of the Editorial Advisory Association. And last but not least, we are a friendly and open editorial team that is willing to entertain an imaginative suggestion for a manuscript that is novel and vital just like spring.
The Federal Practitioner submission guidelines, accessed at http://www.fedprac.com, include the journal’s style and format. If you need more information or have questions about submitting a manuscript to the journal, e-mail me at [email protected], Editor Reid Paul at [email protected],or Managing Editor Joyce Brody at [email protected].

Product News: 04 2017
Cutanea Life Sciences, Inc, launches Aktipak (erythromycin 3% and benzoyl peroxide 5%) Gel, a prescription combination therapy indicated for acne vulgaris. Aktipak is packaged in a pocket-sized, dual-chamber pouch that contains erythromycin and benzoyl peroxide in separate chambers to enable convenient on-the-go use. Immediately prior to use, the patient cuts or twists open the pouch, squeezes the 2 gels into the palm of the hand, mixes the gels together, and applies the mix to the area affected by acne. Aktipak has an 18-month shelf life and does not require refrigeration. Results can be seen within 8 weeks. For more information, visit www.aktipak.com.
Glytone Acne BPO Clearing Cleanser
Pierre Fabre Group introduces the Glytone Acne BPO Clearing Cleanser (4.5% encapsulated benzoyl peroxide [BPO]) with time-released technology to control the delivery of BPO and enhance penetration. The targeted delivery system adheres to the skin and penetrates the lipid layer while releasing the encapsulated BPO once warmed by the skin, providing optimal efficacy to inhibit the growth of acne-causing bacteria with minimal irritation. Glytone Acne BPO Clearing Cleanser is dispensed by physicians and can be used with other products in the Glytone acne product line for optimal results. For more information, visit www.glytone-usa.com.
Juvéderm Vollure XC
Allergan announces US Food and Drug Administration approval of Juvéderm Vollure XC for correction of moderate to severe facial wrinkles and folds such as the nasolabial folds in adults older than 21 years. It utilizes VYCROSS technology, which blends different weights of hyaluronic acid, contributing to the gel’s duration. Long-lasting results have been demonstrated up to 18 months. For more information, visit www.juvederm.com.
Neutrogena Light Therapy Acne Mask
Johnson & Johnson Consumer Inc presents the Neutrogena Light Therapy Acne Mask, an LED device utilizing red and blue light to treat acne at home. The mask contains 12 blue LED bulbs that kill Propionibacterium acnes bacteria and 9 red LED bulbs to penetrate deep into the skin to calm inflammation. The mask can be used for 10 minutes each night and shuts off automatically. Results have been seen in 1 week for mild to moderate acne. For more information, visit www.neutrogena.com.
3% Retinol Peel ProSystem
NeoStrata Company, Inc, introduces the 3% Retinol Peel ProSystem featuring Retinol Boosting Complex to exfoliate and improve the appearance of fine lines and winkles, help reduce acne, and improve skin laxity, while promoting a bright, even, and clear complexion. This physician-strength peel is applied in the office but is removed at home after 8 hours or overnight. This peel has demonstrated improvement in acne and skin texture as well as diminished pigmentation. For more information, visit www.neostrata.com.
Siliq
Valeant Pharmaceuticals International, Inc, announces US Food and Drug Administration approval of the Biologics License Application for Siliq (brodalumab) injection. Siliq, an IL-17 inhibitor, is indicated for the treatment of moderate to severe plaque psoriasis in adult patients who are candidates for systemic therapy or phototherapy and have failed to respond or have lost response to other systemic therapies. Siliq has a black box warning for patients with a history of suicidal thoughts or behavior and was approved with a Risk Evaluation and Mitigation Strategy involving a one-time enrollment for physicians and one-time informed consent for patients. Sales and marketing in the United States will begin in the second half of 2017. For more information, visit www.valeant.com.
Thermi
Thermi, an Almirall company, announces “The Art of Thermi” campaign focusing on 2 Thermi devices: ThermiRF and Thermi250. ThermiRF is temperature-controlled radiofrequency technology that uses heat to produce aesthetic outcomes for soft tissue applications. Thermi250 is a high-powered, temperature-controlled radiofrequency system emitting at 470 kHz designed with a user-friendly interface to offer versatility for targeting cellulite. For more information, visit www.thermi.com.
If you would like your product included in Product News, please email a press release to the Editorial Office at [email protected].

Eliminating hepatitis in the United States: A road map
An ambitious new report by the National Academies of Sciences, Engineering, and Medicine lays out a detailed path by which some 90,000 deaths from hepatitis B and C infection could be prevented by 2030.
The National Academies, a group of nongovernmental advisory bodies that includes the former Institute of Medicine, said that “the tools to prevent these deaths” exist – namely vaccination to prevent new hepatitis B infections and antiviral drugs, including new oral medications that can cure chronic hepatitis C infections within months.
The authors of the 200-plus-page report, led by Brian Strom, MD, MPH, of Rutgers University in Newark, NJ, calculate that deaths from hepatitis B infection could be halved by 2030 if 90% of patients are diagnosed, if 90% of those diagnosed are connected to care, and if 80% of those for whom treatment is indicated receive it. Treating everyone with chronic hepatitis C would reduce new infections by 90% by 2030, while reducing related deaths by 65%, Dr. Strom and his colleagues estimate.
But the authors also concede that drastic changes to current health policy would be required to reach these goals. These include the adoption of “aggressive testing, diagnosis, treatment, and prevention methods, such as needle exchange.”
They propose that the federal government seek a unique licensing arrangement with one or more manufacturers to bring down the notoriously high cost of direct-acting drugs used in hepatitis C, as a way of raising treatment rates. Currently, fewer than half the patients on Medicaid who are eligible for hepatitis C treatment receive it, and fewer than 1% of prisoners, who have high rates of infection.
Dr. Joseph Lim, director of the viral hepatitis program at Yale University in New Haven. Conn., who was not involved in the National Academies report, called it helpful in the sense that “it casts a spotlight on something that those of us involved in the care of people with viral hepatitis have long known – which is that this is a national and global public health burden that has been under the radar and in the shadow of other important health priorities.”
Both hepatitis B and C increase the risk of liver cancer and are associated with significant morbidity and mortality. Though approximately 4 million people in the United States are estimated to be infected with chronic hepatitis B (1.3 million) or C (2.7 million), these diseases account for less than 1% of the research budget at the National Institutes of Health, the report said. This compares unfavorably to funding for HIV, which affects about 1 million Americans.
As the report states, the tools to radically reduce hepatitis B and C deaths already exist. However, Dr. Lim cautioned in an interview, “the public health infrastructure to address viral hepatitis has been woefully inadequate.” In the United States, he noted, most states receive federal funding for at most a single person in charge of viral hepatitis epidemiology. “The resources currently available are in no way adequate to achieve the very aggressive goals described in the report,” he said.
Even among people with a known diagnosis of hepatitis B or C, only some receive confirmatory testing, Dr. Lim said. And of those with confirmed infections, “only a fraction are linked to care from the diagnosing clinician to a provider with the capacity to assess the state of liver disease and determine whether antiviral therapy is warranted.” Finally, he said, “many patients continue to face barriers to curative therapy due to cost and restrictions by public and private payers.”
Among the recommendations contained in the report is that unrestricted, mass treatment of hepatitis C infections be undertaken – regardless of disease stage. Currently, direct-acting antiviral agents remain costly and are poorly covered, notably by Medicaid. The National Academies advise that the government rectify this by purchasing “a license or assignment to the patent on a direct-acting antiviral drug, and use it only in those market segments where the government pays for treatment and access is now limited, such as Medicaid and prisons.”
Dr. Lim called the licensing proposal “very novel and bold,” but noted that there is no precedent in the United States for diseases such as hepatitis C. “If it could be done it would be an incredible model of government-pharma partnership for the public health good, and have a very significant impact.”
Steven Flamm, MD, chief of the liver transplantation program at Northwestern University in Chicago, who like Dr. Lim was not involved in the creation of the report, said in an interview that it contained innovative ideas and helped underscore the fact that “hepatitis has been given short shrift. The NIH and other agencies do not devote time and energy to this particular medical issue for reasons that are not completely clear.”
But “the problem with these kinds of analyses,” he said, “is that carrying them out is harder than making the recommendations.”
Dr. Flamm echoed Dr. Lim’s concerns about the practicability of implementing some of the recommendations in what he considers a resource-deprived health care environment for viral hepatitis.
“Is elimination possible or can you take a big bite out of it? The answer to that question is yes. We now have agents that can treat chronic viral hepatitis well, which we didn’t have a few years ago.”
Still, he emphasized, having the tools is only one part of the picture. Hepatitis C diagnostic tests have been available since the early 1990s. Yet, Dr. Flamm pointed out, fewer than half of patients have been diagnosed. “If the new CDC screening guidelines gain traction, we will do better than that.”
Dr. Flamm said that he considered the report’s call for a unique government licensing agreement for hepatitis C drugs a tall order. The drugs are already heavily discounted by manufacturers in many cases, he said, yet remain unavailable to those in need of them. In Illinois, Dr. Flamm said, few Medicaid patients with confirmed hepatitis C are given the short-acting antivirals that have revolutionized treatment. “The vast majority have no access to the therapy at all,” he said.
One of the report’s strengths, he said, is in detailing innovative prevention strategies such as delivering and promoting hepatitis B vaccinations to adults through local pharmacies, after the model of influenza vaccinations, and also conducting needle exchanges through pharmacies for intravenous drug users, who are at high risk of contracting both hepatitis B and C.
“Many of these strategies are not very costly,” he said. “The problem is you run into moral platitudes – to eliminate hepatitis, we will have to overcome that,” Dr. Flamm said, something that cannot be taken for granted in the current political environment.
But even if the goals outlined in the report seem ambitious, its authors have done an important service in underscoring the burden of viral hepatitis and laying out how some barriers to prevention, diagnosis, and treatment might be broken, he said.
Viral hepatitis “is a big deal, and it does cost a tremendous amount of money,” he added. “Everybody focuses on the therapeutic cost, but nobody focuses on the costs, direct and indirect, of all the sick people that are out there.”
FROM THE NATIONAL ACADEMIES OF SCIENCES, ENGINEERING, AND MEDICINE
Psoriasis on the Hands and Feet: How Patients Should Care for These Areas
What does your patient need to know at the first visit?
Patients with this condition need to avoid friction and excessive moisture. They should be counseled to use gloves for excessive wet work. I recommend they use cotton gloves on the hands, and then cover those with rubber gloves. Patients should use a hand emollient regularly, including after each time they wash their hands or have exposure to water. If the patient lifts weights, I recommend he/she use weight-lifting gloves to reduce friction.
What are your go to treatments? What are the side effects?
The first line of therapy for hand and foot psoriasis is a topical agent. I most often use a combination of topical steroids and a topical vitamin D analogue. If insurance is amenable, I may use a fixed combination of topical steroid and vitamin D analogue.
If topical therapies are not successful, I often consider using excimer laser therapy, which requires the patient to come to the office twice weekly, so it is important to determine if this therapy is compatible with the patient's schedule. Other options include oral and biological therapies. Apremilast is a reasonable first-line systemic therapy given that it is an oral therapy, requires no laboratory monitoring, and has a favorable safety profile. Alternatively, biologic agents can be utilized. There are several analyses available looking at the efficacy of different biologics in hand and foot psoriasis, but at this point there is no consensus first choice for a biologic in this condition. Many available biologics may have a notable impact though.
The side effects of therapies for psoriasis are well established. Topical therapies and excimer laser are relatively safe choices. Apremilast has been associated with early gastrointestinal tract side effects that tend to resolve over time. Each biologic has a unique safety profile, with a rare incidence of side effects that should be reviewed carefully with any prospective patients before starting therapy.
How do you keep patients compliant with treatment?
It is important to reinforce gentle hand care and foot care. Patients need to understand that lack of compliance with treatment will lead to recurrence of disease.
What do you do if patients refuse treatment?
I try to educate them as best as possible, and ask them to return and reconsider therapy if they find that this condition affects their quality of life.

Microneedling Therapy With and Without Platelet-Rich Plasma
Microneedling therapy, also known as collagen induction therapy or percutaneous collagen induction, is an increasingly popular treatment modality for skin rejuvenation. The approach employs small needles to puncture the skin and stimulate local collagen production in a minimally invasive manner. Recently, clinicians have incorporated the use of platelet-rich plasma (PRP) with the aim of augmenting cosmetic outcomes. In this article, we examine the utility of this approach by reviewing comparison studies of microneedling therapy with and without the application of PRP.
Dr. Gary Goldenberg demonstrates microneedling with platelet-rich plasma in a procedural video available here.
Microneedling Therapy
The use of microneedling first gained attention in the 1990s. Initially, Camirand and Doucet1 described tattooing without pigment for the treatment of achromatic and hypertrophic scars. Fernandes2 evolved this concept and developed a drum-shaped device with fine protruding needles to puncture the skin. Microneedling devices have expanded in recent years and now include both cord- and battery-powered pens and rollers, with needles ranging in length from 0.25 to 3.0 mm.
Treatment with microneedling promotes skin rejuvenation by creating small puncture wounds in the epidermis and dermis. This injury triggers the wound healing cascade and alters the modulation of growth factors to promote regenerative effects.3,4 Following microneedling therapy, increases occur in elastic fiber formation, collagen deposition, and dermal thickness (Figure).5 Of interesting histologic note, collagen is deposited in the normal lattice pattern following this treatment rather than in the parallel bundles typical of scars.6 Microneedling preserves the overall integrity of the epidermal layers and basement membrane, allowing the epidermis to heal without abnormality, verified on histology by a normal stratum corneum, enhanced stratum granulosum, and normal rete ridges.7
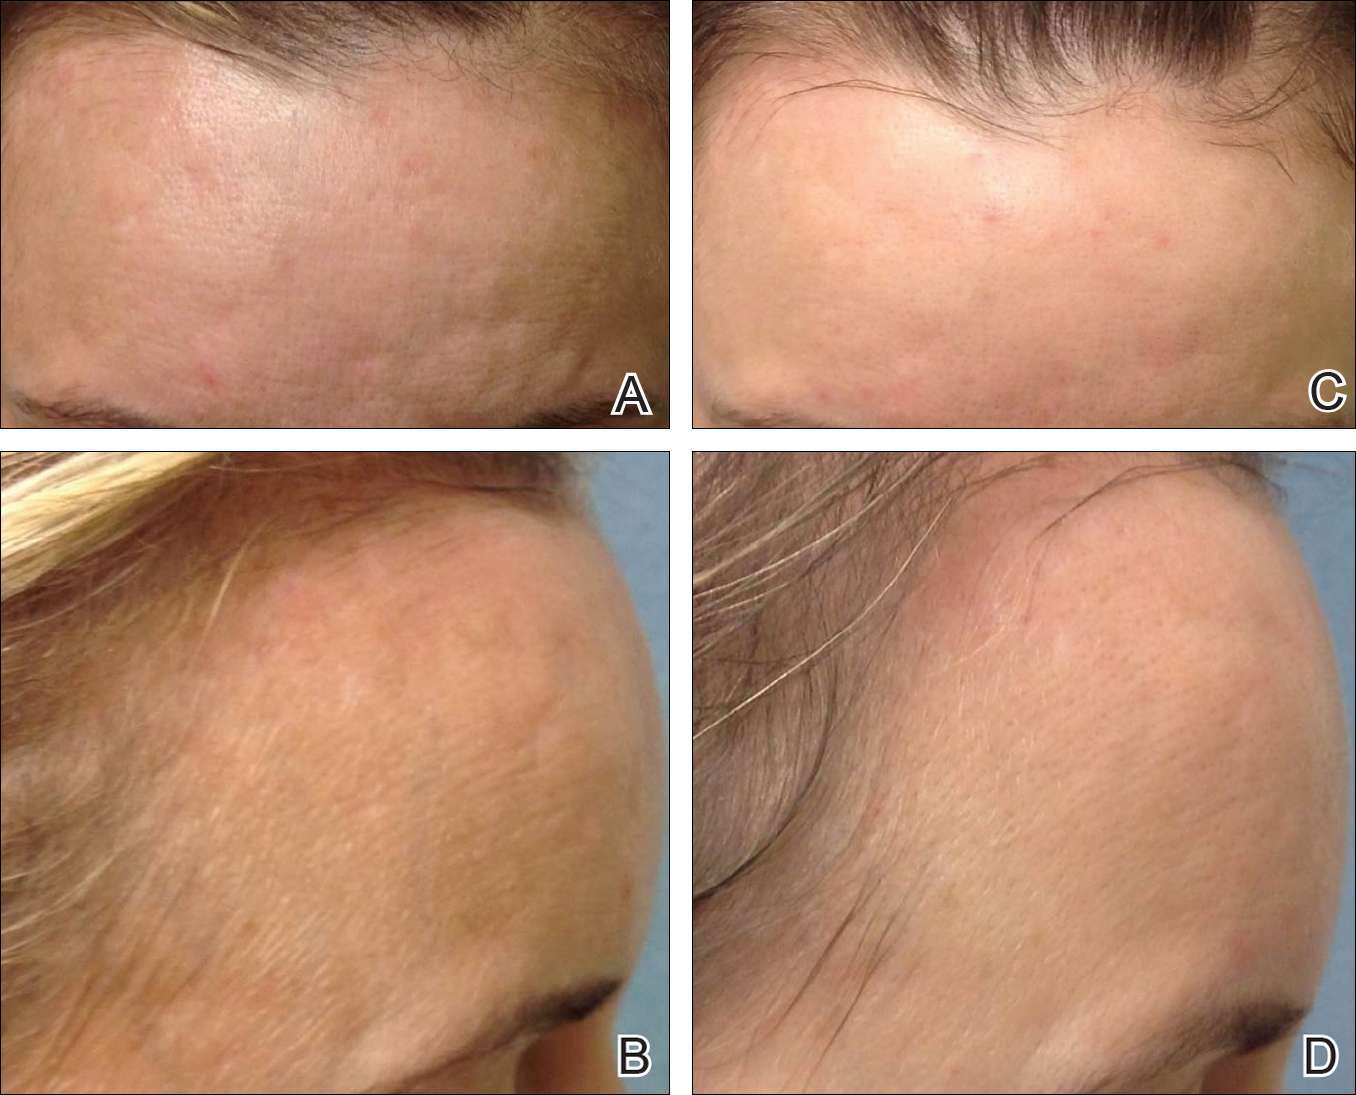
Microneedling has demonstrated several uses beyond general skin rejuvenation. In patients with atrophic acne scars, therapy can lead to improved scar appearance, skin texture, and patient satisfaction.8,9 Hypertrophic and dyspigmented burn scars on the body, face, arms, and legs have shown to be receptive to repeated treatments.10 Microneedling also has shown promise in treating androgenic alopecia, increasing hair regrowth in patients who previously showed poor response to conventional therapy with minoxidil and finasteride.11,12
Platelet-Rich Plasma
Platelet-rich plasma is developed by enriching blood with an autologous concentration of platelets. The preparation of PRP begins with whole blood, commonly obtained peripherally by venipuncture. Samples undergo centrifugation to allow separation of the blood into 3 layers: platelet-poor plasma, PRP, and erythrocytes.13 The typical platelet count of whole blood is approximately 200,000/µL; PRP aims to prepare a platelet count of at least 1,000,000/µL in a 5-mL volume.14
An attractive component of PRP is its high concentration of growth factors, including platelet-derived growth factor, transforming growth factor, vascular endothelial growth factor, and epithelial growth factor.15 Because of the regenerative effects of these proteins, PRP has been investigated as a modality to augment wound healing in a variety of clinical areas, such as maxillofacial surgery, orthopedics, cardiovascular surgery, and treatment of soft tissue ulcers.16
Combination Use of Microneedling and PRP
Several studies have compared the effects of microneedling with and without the application of PRP (Table).17-20 In an animal model, Akcal et al17 examined the effects of microneedling and PRP on skin flap survival. Eight rats were randomly divided into 5 groups: sham, control, microneedling alone, microneedling plus PRP, and microneedling plus platelet-poor plasma. Treatments were applied to skin flaps after 4 hours of induced ischemia. The surviving flap area was measured, with results demonstrating significantly higher viable areas in the microneedling plus PRP group relative to all other groups (P<.01). On histologic examination, the microneedling plus PRP group showed well-organized epidermal layers and a dermal integrity that matched the dermis of the sham group.17
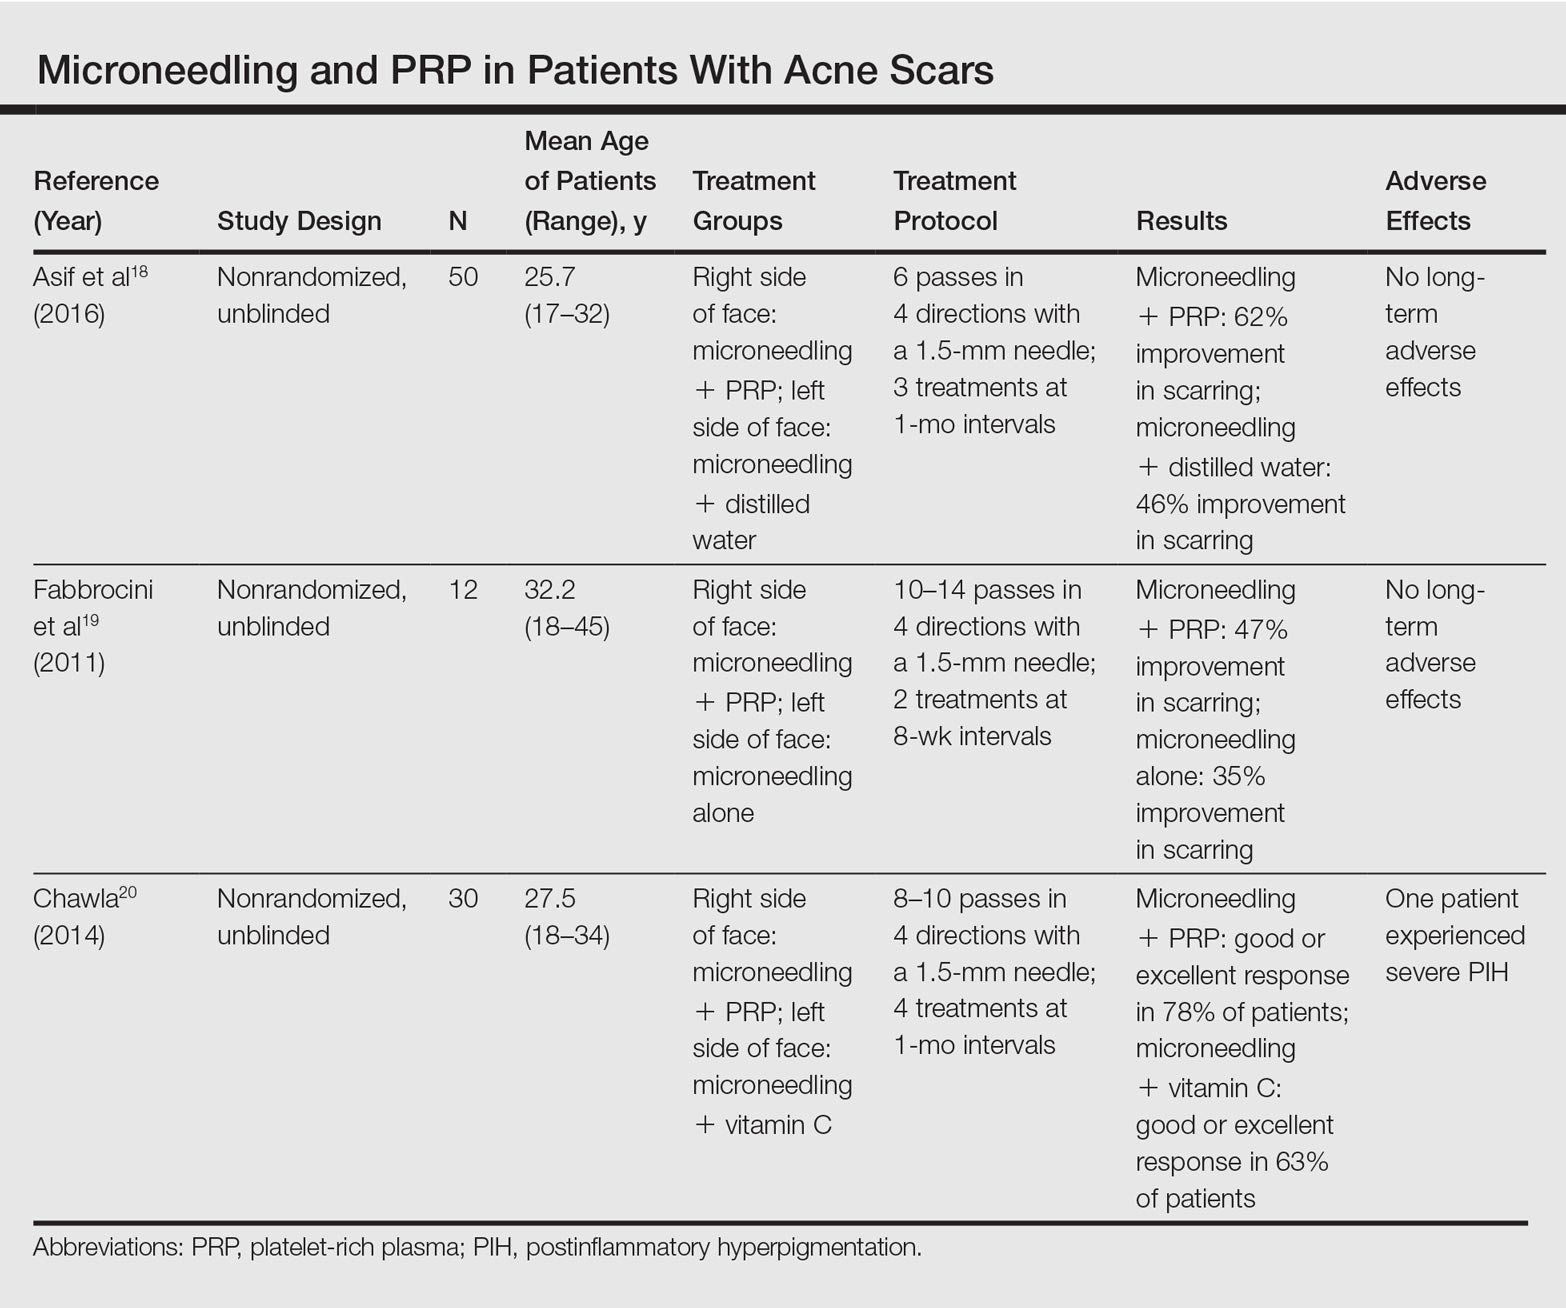
Asif et al18 performed a split-face comparison study of 50 patients with atrophic acne scars. On the right side, microneedling was performed followed by intradermal injections and topical application of PRP. On the left side, microneedling was performed followed by intradermal injections of distilled water. The study included 3 treatment sessions with 1 month between each session. Scars were assessed using the Goodman and Baron scale,21 which is designed to grade the morphology of postacne scarring. Scars on the right side improved by 62.2% and scars on the left side improved by 45.8%; prior to treatment, both sides demonstrated similar severity scores, but final severity scores were significantly reduced in the microneedling plus PRP group relative to the microneedling plus distilled water group (P<.00001). No residual side effects from treatment were reported.18
Examining the degree of improvement more carefully, microneedling plus PRP yielded excellent improvement in 40% (20/50) of patients and good improvement in 60% (30/50).18 Microneedling plus distilled water led to excellent improvement in 10% (5/50) and good improvement in 84% (42/50). Given that microneedling plus distilled water still provided good to excellent results in 94% of patients, the addition of PRP was helpful though not necessary in achieving meaningful benefit.18
In another split-face study, Fabbrocini et al19 evaluated 12 adult patients with acne scars. The right side of the face received microneedling plus PRP, while the left side received microneedling alone. Two treatments were performed 8 weeks apart. Severity scores (0=no lesions; 10=maximum severity) were used to assess patient outcomes throughout the study. Acne scars improved on both sides of the face following the treatment period, but the reduction in scar severity with microneedling plus PRP (3.5 points) was significantly greater than with microneedling alone (2.6 points)(P<.05). Patients tended to experience2 to 3 days of mild swelling and erythema after treatment regardless of PRP addition. With only 12 patients, the study was limited by a small sample size. The 10-point grading system differed from the Goodman and Baron scale in that it lacked corresponding qualitative markers, likely decreasing reproducibility.19
Chawla20 compared the effectiveness of combination therapy with microneedling plus PRP versus microneedling and vitamin C application. In a split-face study of 30 patients with atrophic acne scars, the right side of the face was treated with microneedling plus PRP and the left side was treated with microneedling plus vitamin C. Four sessions were performed with an interval of 1 month in between treatments. The Goodman and Baron Scale was used to assess treatment efficacy. Overall, both treatments led to improved outcomes, but in categorizing patients who demonstrated poor responses, a significantly larger percentage existed in the microneedling plus vitamin C group (37% [10/27]) versus the microneedling plus PRP group (22% [6/27])(P=.021). Additionally, aggregate patient satisfaction scores were higher with microneedling plus PRP relative to microneedling plus vitamin C (P=.01). Of note, assessments of improvement were performed by the treating physician and patient satisfaction reports were completed with knowledge of the therapies and cost factor, which may have influenced results.20
Conclusion
Microneedling therapy continues to evolve with a range of applications now emerging in dermatology. As PRP has gained popularity, there has been increased interest in its utilization to amplify the regenerative effects of microneedling. Although the number of direct comparisons examining microneedling with and without PRP is limited, the available evidence indicates that the addition of PRP may improve cosmetic outcomes. These results have been demonstrated primarily in the management of acne scars, but favorable effects may extend to other indications. Continued study is warranted to further quantify the degree of these benefits and to elucidate optimal treatment schedules.
In addition, it is important to consider a cost-benefit analysis of PRP. The price of PRP varies depending on the clinical site but in certain cases may double the cost of a microneedling treatment session. Although studies have demonstrated a statistically significant benefit to PRP, the clinical significance of this supplementary treatment must be weighed against the increased expense. A discussion should take place with the consideration that microneedling alone can provide a satisfactory result for some patients.
- Camirand A, Doucet J. Needle dermabrasion. Aesthetic Plast Surg. 1997;21:48-51.
- Fernandes D. Percutaneous collagen induction: an alternative to laser resurfacing. Aesthet Surg J. 2002;22:307-309.
- Fabbrocini G, Fardella N, Monfrecola A, et al. Acne scarring treatment using skin needling. Clin Exp Dermatol. 2009;34:874-879.
- Zeitter S, Sikora Z, Jahn S, et al. Microneedling: matching the results of medical needling and repetitive treatments to maximize potential for skin regeneration [published online February 7, 2014]. Burns. 2014;40:966-973.
- Schwarz M, Laaff H. A prospective controlled assessment of microneedling with the Dermaroller device. Plast Reconstr Surg. 2011;127:E146-E148.
- Fernandes D, Signorini M. Combating photoaging with percutaneous collagen induction. Clin Dermatol. 2008;26:192-199.
- Aust MC, Fernandes D, Kolokythas P, et al. Percutaneous collagen induction therapy: an alternative treatment for scars, wrinkles, and skin laxity. Plast Reconstr Surg. 2008;121:1421-1429.
- El-Domyati M, Barakat M, Awad S, et al. Microneedling therapy for atrophic acne scars: an objective evaluation. J Clin Aesthet Dermatol. 2015;8:36-42.
- Leheta T, El Tawdy A, Abdel Hay R, et al. Percutaneous collagen induction versus full-concentration trichloroacetic acid in the treatment of atrophic acne scars. Dermatol Surg. 2011;37:207-216.
- Aust MC, Knobloch K, Reimers K, et al. Percutaneous collagen induction therapy: an alternative treatment for burn scars. Burns. 2010;36:836-843.
- Dhurat R, Mathapati S. Response to microneedling treatment in men with androgenetic alopecia who failed to respond to conventional therapy. Indian J Dermatol. 2015;60:260-263.
- Dhurat R, Sukesh M, Avhad G, et al. A randomized evaluator blinded study of effect of microneedling in androgenetic alopecia: a pilot study. Int J Trichology. 2013;5:6-11.
- Wang HL, Avila G. Platelet rich plasma: myth or reality? Eur J Dent. 2007;1:192-194.
- Marx RE. Platelet-rich plasma (PRP): what is PRP and what is not PRP? Implant Dent. 2001;10:225-228.
- Lubkowska A, Dolegowska B, Banfi G. Growth factor content in PRP and their applicability in medicine. J Biol Regul Homeost Agents. 2012;26(2 suppl 1):3S-22S.
- Pietrzak WS, Eppley BL. Platelet rich plasma: biology and new technology. J Craniofac Surg. 2005;16:1043-1054.
- Akcal A, Savas SA, Gorgulu T, et al. The effect of platelete rich plasma combined with microneedling on full venous outflow compromise in a rat skin flap model. Plast Reconstr Surg. 2015;136(4 suppl):71-72.
- Asif M, Kanodia S, Singh K. Combined autologous platelet-rich plasma with microneedling verses microneedling with distilled water in the treatment of atrophic acne scars: a concurrent split-face study [published online January 8, 2016]. J Cosmet Dermatol. 2016;15:434-443.
- Fabbrocini G, De Vita V, Pastore F, et al. Combined use of skin needling and platelet-rich plasma in acne scarring treatment. Cosmet Dermatol. 2011;24:177-183.
- Chawla S. Split face comparative study of microneedling with PRP versus microneedling with vitamin C in treating atrophic post acne scars. J Cutan Aesthet Surg. 2014;7:209-212.
- Goodman GJ, Baron JA. Postacne scarring: a qualitative global scarring grading system. Dermatol Surg. 2006;32:1458-1466.
Microneedling therapy, also known as collagen induction therapy or percutaneous collagen induction, is an increasingly popular treatment modality for skin rejuvenation. The approach employs small needles to puncture the skin and stimulate local collagen production in a minimally invasive manner. Recently, clinicians have incorporated the use of platelet-rich plasma (PRP) with the aim of augmenting cosmetic outcomes. In this article, we examine the utility of this approach by reviewing comparison studies of microneedling therapy with and without the application of PRP.
Dr. Gary Goldenberg demonstrates microneedling with platelet-rich plasma in a procedural video available here.
Microneedling Therapy
The use of microneedling first gained attention in the 1990s. Initially, Camirand and Doucet1 described tattooing without pigment for the treatment of achromatic and hypertrophic scars. Fernandes2 evolved this concept and developed a drum-shaped device with fine protruding needles to puncture the skin. Microneedling devices have expanded in recent years and now include both cord- and battery-powered pens and rollers, with needles ranging in length from 0.25 to 3.0 mm.
Treatment with microneedling promotes skin rejuvenation by creating small puncture wounds in the epidermis and dermis. This injury triggers the wound healing cascade and alters the modulation of growth factors to promote regenerative effects.3,4 Following microneedling therapy, increases occur in elastic fiber formation, collagen deposition, and dermal thickness (Figure).5 Of interesting histologic note, collagen is deposited in the normal lattice pattern following this treatment rather than in the parallel bundles typical of scars.6 Microneedling preserves the overall integrity of the epidermal layers and basement membrane, allowing the epidermis to heal without abnormality, verified on histology by a normal stratum corneum, enhanced stratum granulosum, and normal rete ridges.7
Microneedling has demonstrated several uses beyond general skin rejuvenation. In patients with atrophic acne scars, therapy can lead to improved scar appearance, skin texture, and patient satisfaction.8,9 Hypertrophic and dyspigmented burn scars on the body, face, arms, and legs have shown to be receptive to repeated treatments.10 Microneedling also has shown promise in treating androgenic alopecia, increasing hair regrowth in patients who previously showed poor response to conventional therapy with minoxidil and finasteride.11,12
Platelet-Rich Plasma
Platelet-rich plasma is developed by enriching blood with an autologous concentration of platelets. The preparation of PRP begins with whole blood, commonly obtained peripherally by venipuncture. Samples undergo centrifugation to allow separation of the blood into 3 layers: platelet-poor plasma, PRP, and erythrocytes.13 The typical platelet count of whole blood is approximately 200,000/µL; PRP aims to prepare a platelet count of at least 1,000,000/µL in a 5-mL volume.14
An attractive component of PRP is its high concentration of growth factors, including platelet-derived growth factor, transforming growth factor, vascular endothelial growth factor, and epithelial growth factor.15 Because of the regenerative effects of these proteins, PRP has been investigated as a modality to augment wound healing in a variety of clinical areas, such as maxillofacial surgery, orthopedics, cardiovascular surgery, and treatment of soft tissue ulcers.16
Combination Use of Microneedling and PRP
Several studies have compared the effects of microneedling with and without the application of PRP (Table).17-20 In an animal model, Akcal et al17 examined the effects of microneedling and PRP on skin flap survival. Eight rats were randomly divided into 5 groups: sham, control, microneedling alone, microneedling plus PRP, and microneedling plus platelet-poor plasma. Treatments were applied to skin flaps after 4 hours of induced ischemia. The surviving flap area was measured, with results demonstrating significantly higher viable areas in the microneedling plus PRP group relative to all other groups (P<.01). On histologic examination, the microneedling plus PRP group showed well-organized epidermal layers and a dermal integrity that matched the dermis of the sham group.17
Asif et al18 performed a split-face comparison study of 50 patients with atrophic acne scars. On the right side, microneedling was performed followed by intradermal injections and topical application of PRP. On the left side, microneedling was performed followed by intradermal injections of distilled water. The study included 3 treatment sessions with 1 month between each session. Scars were assessed using the Goodman and Baron scale,21 which is designed to grade the morphology of postacne scarring. Scars on the right side improved by 62.2% and scars on the left side improved by 45.8%; prior to treatment, both sides demonstrated similar severity scores, but final severity scores were significantly reduced in the microneedling plus PRP group relative to the microneedling plus distilled water group (P<.00001). No residual side effects from treatment were reported.18
Examining the degree of improvement more carefully, microneedling plus PRP yielded excellent improvement in 40% (20/50) of patients and good improvement in 60% (30/50).18 Microneedling plus distilled water led to excellent improvement in 10% (5/50) and good improvement in 84% (42/50). Given that microneedling plus distilled water still provided good to excellent results in 94% of patients, the addition of PRP was helpful though not necessary in achieving meaningful benefit.18
In another split-face study, Fabbrocini et al19 evaluated 12 adult patients with acne scars. The right side of the face received microneedling plus PRP, while the left side received microneedling alone. Two treatments were performed 8 weeks apart. Severity scores (0=no lesions; 10=maximum severity) were used to assess patient outcomes throughout the study. Acne scars improved on both sides of the face following the treatment period, but the reduction in scar severity with microneedling plus PRP (3.5 points) was significantly greater than with microneedling alone (2.6 points)(P<.05). Patients tended to experience2 to 3 days of mild swelling and erythema after treatment regardless of PRP addition. With only 12 patients, the study was limited by a small sample size. The 10-point grading system differed from the Goodman and Baron scale in that it lacked corresponding qualitative markers, likely decreasing reproducibility.19
Chawla20 compared the effectiveness of combination therapy with microneedling plus PRP versus microneedling and vitamin C application. In a split-face study of 30 patients with atrophic acne scars, the right side of the face was treated with microneedling plus PRP and the left side was treated with microneedling plus vitamin C. Four sessions were performed with an interval of 1 month in between treatments. The Goodman and Baron Scale was used to assess treatment efficacy. Overall, both treatments led to improved outcomes, but in categorizing patients who demonstrated poor responses, a significantly larger percentage existed in the microneedling plus vitamin C group (37% [10/27]) versus the microneedling plus PRP group (22% [6/27])(P=.021). Additionally, aggregate patient satisfaction scores were higher with microneedling plus PRP relative to microneedling plus vitamin C (P=.01). Of note, assessments of improvement were performed by the treating physician and patient satisfaction reports were completed with knowledge of the therapies and cost factor, which may have influenced results.20
Conclusion
Microneedling therapy continues to evolve with a range of applications now emerging in dermatology. As PRP has gained popularity, there has been increased interest in its utilization to amplify the regenerative effects of microneedling. Although the number of direct comparisons examining microneedling with and without PRP is limited, the available evidence indicates that the addition of PRP may improve cosmetic outcomes. These results have been demonstrated primarily in the management of acne scars, but favorable effects may extend to other indications. Continued study is warranted to further quantify the degree of these benefits and to elucidate optimal treatment schedules.
In addition, it is important to consider a cost-benefit analysis of PRP. The price of PRP varies depending on the clinical site but in certain cases may double the cost of a microneedling treatment session. Although studies have demonstrated a statistically significant benefit to PRP, the clinical significance of this supplementary treatment must be weighed against the increased expense. A discussion should take place with the consideration that microneedling alone can provide a satisfactory result for some patients.
- Camirand A, Doucet J. Needle dermabrasion. Aesthetic Plast Surg. 1997;21:48-51.
- Fernandes D. Percutaneous collagen induction: an alternative to laser resurfacing. Aesthet Surg J. 2002;22:307-309.
- Fabbrocini G, Fardella N, Monfrecola A, et al. Acne scarring treatment using skin needling. Clin Exp Dermatol. 2009;34:874-879.
- Zeitter S, Sikora Z, Jahn S, et al. Microneedling: matching the results of medical needling and repetitive treatments to maximize potential for skin regeneration [published online February 7, 2014]. Burns. 2014;40:966-973.
- Schwarz M, Laaff H. A prospective controlled assessment of microneedling with the Dermaroller device. Plast Reconstr Surg. 2011;127:E146-E148.
- Fernandes D, Signorini M. Combating photoaging with percutaneous collagen induction. Clin Dermatol. 2008;26:192-199.
- Aust MC, Fernandes D, Kolokythas P, et al. Percutaneous collagen induction therapy: an alternative treatment for scars, wrinkles, and skin laxity. Plast Reconstr Surg. 2008;121:1421-1429.
- El-Domyati M, Barakat M, Awad S, et al. Microneedling therapy for atrophic acne scars: an objective evaluation. J Clin Aesthet Dermatol. 2015;8:36-42.
- Leheta T, El Tawdy A, Abdel Hay R, et al. Percutaneous collagen induction versus full-concentration trichloroacetic acid in the treatment of atrophic acne scars. Dermatol Surg. 2011;37:207-216.
- Aust MC, Knobloch K, Reimers K, et al. Percutaneous collagen induction therapy: an alternative treatment for burn scars. Burns. 2010;36:836-843.
- Dhurat R, Mathapati S. Response to microneedling treatment in men with androgenetic alopecia who failed to respond to conventional therapy. Indian J Dermatol. 2015;60:260-263.
- Dhurat R, Sukesh M, Avhad G, et al. A randomized evaluator blinded study of effect of microneedling in androgenetic alopecia: a pilot study. Int J Trichology. 2013;5:6-11.
- Wang HL, Avila G. Platelet rich plasma: myth or reality? Eur J Dent. 2007;1:192-194.
- Marx RE. Platelet-rich plasma (PRP): what is PRP and what is not PRP? Implant Dent. 2001;10:225-228.
- Lubkowska A, Dolegowska B, Banfi G. Growth factor content in PRP and their applicability in medicine. J Biol Regul Homeost Agents. 2012;26(2 suppl 1):3S-22S.
- Pietrzak WS, Eppley BL. Platelet rich plasma: biology and new technology. J Craniofac Surg. 2005;16:1043-1054.
- Akcal A, Savas SA, Gorgulu T, et al. The effect of platelete rich plasma combined with microneedling on full venous outflow compromise in a rat skin flap model. Plast Reconstr Surg. 2015;136(4 suppl):71-72.
- Asif M, Kanodia S, Singh K. Combined autologous platelet-rich plasma with microneedling verses microneedling with distilled water in the treatment of atrophic acne scars: a concurrent split-face study [published online January 8, 2016]. J Cosmet Dermatol. 2016;15:434-443.
- Fabbrocini G, De Vita V, Pastore F, et al. Combined use of skin needling and platelet-rich plasma in acne scarring treatment. Cosmet Dermatol. 2011;24:177-183.
- Chawla S. Split face comparative study of microneedling with PRP versus microneedling with vitamin C in treating atrophic post acne scars. J Cutan Aesthet Surg. 2014;7:209-212.
- Goodman GJ, Baron JA. Postacne scarring: a qualitative global scarring grading system. Dermatol Surg. 2006;32:1458-1466.
Practice Points
- Microneedling is an effective therapy for skin rejuvenation.
- Preliminary evidence indicates that the addition of platelet-rich plasma to microneedling improves cosmetic outcomes.
Elbasvir, grazoprevir beat HCV despite compensated cirrhosis
Twelve weeks of combination therapy with elbasvir and grazoprevir (EBR/GZR) achieved sustained virologic response in 98% of treatment-naive patients with compensated cirrhosis and chronic hepatitis C (HCV) genotype 1, 4, or 6 infections, and in 89% of treatment-experienced patients, according to a pooled analysis of six industry-sponsored trials.
Concomitant ribavirin offered “no incremental benefit” for treatment-naive patients, while 16 or 18 weeks of EBR and GZR with ribavirin achieved SVR12 in 100% of treatment-experienced patients, wrote Ira M. Jacobson, MD, of Mount Sinai Beth Israel and Icahn School of Medicine at Mount Sinai, New York, and his associates. The report was published in the May issue of Gastroenterology (doi: 10.1053/j.gastro.2017.01.050).
Regardless of treatment history, genotype 1a patients with resistance-associated variants (RAV) in HCV nonstructural protein 5A (NS5A) needed ribavirin to achieve sustained virologic response (SVR) rates above 90%, the researchers emphasized. “Both patients with HCV genotype 1a infection with baseline RAVs who received 16 or 18 weeks of EBR/GZR and ribavirin achieved SVR12,” the researchers noted. Elbasvir is an HCV NS5A inhibitor, and GZR is an HCV NS3/4A protease inhibitor. In 2016, the Food and Drug Administration approved them in combination (Zepatier) for chronic genotype 1 and genotype 4 HCV. Studies have confirmed the benefits of treating HCV even when patients have cirrhosis, but they can be challenging to treat, especially if they have already failed a regimen that included a direct-acting antiviral agent, the investigators noted.
To explore the efficacy of EBR/GZR in compensated, Child-Pugh A cirrhosis, they studied 402 such patients with HCV genotype 1, 4, or 6 infections whose baseline HCV RNA level exceeded 10,000 IU. Patients had participated in one of six phase II/III clinical trials and had received EBR/GZR 50 mg/100 mg once daily for 12-18 weeks, with or without ribavirin (800-1400 mg/day based on body weight). Treatment-naive patients received 12 weeks of treatment, while treatment-experienced patients received 12, 16, or 18 weeks of treatment.
Twelve weeks of ribavirin did not boost SVR for either treatment-naive (90%) or treatment-experienced patients (91%), the researchers said. However, all 49 treatment-experienced patients who received EBR/GZR plus ribavirin for 16 or 18 weeks achieved SVR12, compared to 94% of patients who received EBR/GZR without ribavirin for 16 or 18 weeks.
Virologic failure was more common with HCV genotype 1a infections than with genotype 1b or 4 infection, especially if patients previously had not responded to interferon, the researchers noted. Eight of 11 (73%) patients with HCV genotype 1a infection and baseline NS5A RAVs achieved SVR12, compared with 98% of GT1a-infected patients without RAVs at baseline. But EBR/GZR was effective in various other subgroups, including patients with less than 100,000 platelets per microL, serum albumin below 3.5 g/dL, and FibroScan scores below 25 kPa. These findings suggest that EBR/GZR remains effective in patients with advanced compensated cirrhosis, the investigators said.
Most patients tolerated therapy, but six stopped treatment because of adverse events, including one episode of severe, possibly treatment-related abdominal pain. Also, four patients had late, asymptomatic rises in alanine aminotransferase (ALT) after first normalizing on treatment, and one patient stopped treatment because of grade 4 ALT elevation with eosinophilia. “There were no decompensation events in this generally healthy cirrhotic population, and no other evidence of declining liver function while on treatment,” the researchers added.
The integrated analysis was not prespecified, nor was it powered to compare outcomes between treatment arms. Only three patients had genotype 6 infection, and all were treatment-experienced. Only 23 patients had genotype 4 infection. Also, most patients had well-compensated cirrhosis. Finally, the trials varied in terms of how they defined cirrhosis, the investigators noted.
Merck, which funded the study, makes elbasvir and grazoprevir. The investigators acknowledged medical writing and editorial assistance from ApotheCom, which Merck funded. Dr. Jacobson disclosed consulting relationships and grant funding from Merck, AbbVie, Bristol-Myers Squibb, Gilead, Intercept, Janssen, and Trek.
FROM GASTROENTEROLOGY
Key clinical point: Twelve weeks of combination therapy with elbasvir and grazoprevir was relatively well tolerated and achieved sustained viral response for most patients with chronic genotype 1, 4, or 6 hepatitis C virus infections and compensated cirrhosis.
Major finding: Rates of sustained virologic response were 98% for treatment-naive patients and 89% for treatment-experienced patients.
Data source: An integrated analysis of 402 patients with treatment-naive or treatment-experienced HCV GT1, 4, or 6 infection and compensated, Child-Pugh A cirrhosis.
Disclosures: Merck, which funded the study, makes elbasvir and grazoprevir. The investigators acknowledged medical writing and editorial assistance from ApotheCom, which Merck funded. Dr. Jacobson disclosed consulting relationships and grant funding from Merck, AbbVie, Bristol-Myers Squibb, Gilead, Intercept, Janssen, and Trek.
LGBT Access to Health Care: A Dermatologist’s Role in Building a Therapeutic Relationship
The last decade has been a period of advancement for the lesbian, gay, bisexual, and transgender (LGBT) community for legal protections and visibility. Although the journey to acceptance and equality is far from over, this progress has appropriately extended to medical academia as physicians search for ways to become more inclusive and effective care providers for their LGBT patients.1 In a recent cross-sectional study, Ginsberg et al2 examined the role for dermatologists in the care of transgender patients. The investigators concluded that dermatologists should play a larger role in a transgender patient’s physical transformation.2 It is our opinion that dermatologists need to be comfortable building rapport with LGBT patients and to become attuned to their specific needs to provide effective care.
When forging a relationship with an LGBT patient, assumptions can damage rapport. Two assumptions that should be avoided include presuming heterosexuality or, on the other hand, assuming risk for disease based on known LGBT status. A dermatologist who takes a cursory sexual history, or none at all, assuming his/her patient is heterosexual creates an environment in which a nonheterosexual patient feels uncomfortable being honest and open. Although there is enough literature to support the claim that some sexual minority groups have increased risk for sexually transmitted infections (STIs),3 it is dangerous to assume a patient’s risk based solely on sexual orientation. An abstinent patient or a patient in a long-term, monogamous, same-sex relationship, for instance, may feel stereotyped by a dermatologist who wants to screen him/her for an STI. The best step in building a therapeutic relationship is to cast out these assumptions and allow LGBT patients to be open about themselves and their sexual practices. Sexual histories should be asked in nonjudgmental ways that are related to the health of the patient, leading to relevant and useful information for their care. For example, ask patients, “Do you have sex with men, women, or both?” This question should be delivered in a matter-of-fact tone, which conveys to the patient that the provider merely wants an answer to guide patient care.
Dermatologists can tailor their encounters to the specific needs of sexual minority patients. The medical literature is rich with examples of conditions that occur at greater frequency in specific sexual minority groups. Sexually transmitted infections, particularly human immunodeficiency virus, are important causes of morbidity and mortality among sexual minorities, especially men who have sex with men (MSM).3,4 Anal and penile human papillomavirus (HPV) infection and HPV-associated anal carcinoma risk are increased in MSM.5,6 The literature has remained inconclusive on the use of anal Papanicolaou tests for diagnosis; however, dermatologists have a duty to at least examine the perianal and genital area of any patient at risk for HPV-related disease or STIs.7,8 For younger patients, the HPV vaccine can help prevent certain types of HPV infection and likely reduce a patient’s risk for condyloma acuminatum and other sequelae of the virus. Guidelines have been expanded to include men aged 13 to 21 years and up to 26 years.9 More research is needed to determine if detection and prevention of these types of HPV infection using the vaccine in MSM actually leads to a decreased incidence of anal carcinoma.
Certain LGBT groups may benefit from a dermatologist’s care outside the realm of infectious diseases. One study found that increased indoor tanning use in MSM correlated with increased risk for nonmelanoma skin cancer.10 Lesbians have been found to be less likely to pursue preventative health examinations in general, including skin checks.11 Finally, transgender patients can utilize dermatologists for help with transformative procedures and side effects of hormonal treatment such as androgenic acne.1,4
Cutaneous and beyond, the future of LGBT health care in the United States is affected by the institutions that train future physicians. There is a trend toward incorporating formal LGBT curricula into medical schools and academic centers.12 The Penn Medicine Program for LGBT Health (Philadelphia, Pennsylvania) is a pilot program geared toward both educating future clinicians and providing equal and unbiased care to LGBT patients.12 Programs such as this one give rise to a new generation of physicians who feel comfortable and aware of the needs of their LGBT patients.
In a time when LGBT patients are becoming more comfortable claiming their sexual and gender identities openly, there is a need for dermatologists to provide individualized unbiased care, which can best be achieved by building rapport through assumption-free history taking, performing thorough physical examinations that include the genital and perianal area, and passing these good practices on to trainees.
- Snyder JE. Trend analysis of medical publications about LGBT persons: 1950-2007. J Homosex. 2011;58:164-188.
- Ginsberg BA, Calderon M, Seminara NM, et al. A potential role for the dermatologist in the physical transformation of transgender people: a survey of attitudes and practices within the transgender community. J Am Acad Dermatol. 2016;74:303-308.
- Gee R. Primary care health issues among men who have sex with men. J Am Acad Nurse Pract. 2006;18:144-153.
- Katz KA, Furnish TJ. Dermatology-related epidemiologic and clinical concerns of men who have sex with men, women who have sex with women, and transgender individuals. Arch Dermatol. 2005;141:1303-1310.
- Fenkl EA, Jones SG, Schochet E, et al. HPV and anal cancer knowledge among HIV-infected and non-infected men who have sex with men [published online December 11, 2015]. LGBT Health. 2016;3:42-48. doi:10.1089/lgbt.2015.0086.
- Chin-Hong PV, Vittinghoff E, Cranston RD, et al. Age-related prevalence of anal cancer precursors in homosexual men: the EXPLORE Study. J Natl Cancer Inst. 2005;97:896-905.
- Schofield AM, Sadler L, Nelson L, et al. A prospective study of anal cancer screening in HIV-positive and negative MSM. AIDS. 2016;30:1375-1383.
- Katz MH, Katz KA, Bernestein KT, et al. We need data on anal screening effectiveness before focusing on increasing it [published online September 23, 2010]. Am J Public Health. 2010;100:2016.
- Petrosky E, Bocchini JA, Hariri S, et al. Use of 9-Valent human papillomavirus (HPV) vaccine: updated HPV vaccination recommendations of the advisory committee on immunization practices. MMWR Morb Mortal Wkly Rep. 2015;64:300-304.
- Mansh M, Katz KA, Linos E, et al. Association of skin cancer and indoor tanning in sexual minority men and women. JAMA Dermatol. 2015;151:1308-1316.
- Conron KJ, Mimiaga MJ, Landers SJ. A population-based study of sexual orientation identity and gender differences in adult health. Am J Public Health. 2010;100:1953-1960.
- Yehia BR, Calder D, Flesch JD, et al. Advancing LGBT health at an academic medical center: a case study. LGBT Health. 2015;2:362-366.
The last decade has been a period of advancement for the lesbian, gay, bisexual, and transgender (LGBT) community for legal protections and visibility. Although the journey to acceptance and equality is far from over, this progress has appropriately extended to medical academia as physicians search for ways to become more inclusive and effective care providers for their LGBT patients.1 In a recent cross-sectional study, Ginsberg et al2 examined the role for dermatologists in the care of transgender patients. The investigators concluded that dermatologists should play a larger role in a transgender patient’s physical transformation.2 It is our opinion that dermatologists need to be comfortable building rapport with LGBT patients and to become attuned to their specific needs to provide effective care.
When forging a relationship with an LGBT patient, assumptions can damage rapport. Two assumptions that should be avoided include presuming heterosexuality or, on the other hand, assuming risk for disease based on known LGBT status. A dermatologist who takes a cursory sexual history, or none at all, assuming his/her patient is heterosexual creates an environment in which a nonheterosexual patient feels uncomfortable being honest and open. Although there is enough literature to support the claim that some sexual minority groups have increased risk for sexually transmitted infections (STIs),3 it is dangerous to assume a patient’s risk based solely on sexual orientation. An abstinent patient or a patient in a long-term, monogamous, same-sex relationship, for instance, may feel stereotyped by a dermatologist who wants to screen him/her for an STI. The best step in building a therapeutic relationship is to cast out these assumptions and allow LGBT patients to be open about themselves and their sexual practices. Sexual histories should be asked in nonjudgmental ways that are related to the health of the patient, leading to relevant and useful information for their care. For example, ask patients, “Do you have sex with men, women, or both?” This question should be delivered in a matter-of-fact tone, which conveys to the patient that the provider merely wants an answer to guide patient care.
Dermatologists can tailor their encounters to the specific needs of sexual minority patients. The medical literature is rich with examples of conditions that occur at greater frequency in specific sexual minority groups. Sexually transmitted infections, particularly human immunodeficiency virus, are important causes of morbidity and mortality among sexual minorities, especially men who have sex with men (MSM).3,4 Anal and penile human papillomavirus (HPV) infection and HPV-associated anal carcinoma risk are increased in MSM.5,6 The literature has remained inconclusive on the use of anal Papanicolaou tests for diagnosis; however, dermatologists have a duty to at least examine the perianal and genital area of any patient at risk for HPV-related disease or STIs.7,8 For younger patients, the HPV vaccine can help prevent certain types of HPV infection and likely reduce a patient’s risk for condyloma acuminatum and other sequelae of the virus. Guidelines have been expanded to include men aged 13 to 21 years and up to 26 years.9 More research is needed to determine if detection and prevention of these types of HPV infection using the vaccine in MSM actually leads to a decreased incidence of anal carcinoma.
Certain LGBT groups may benefit from a dermatologist’s care outside the realm of infectious diseases. One study found that increased indoor tanning use in MSM correlated with increased risk for nonmelanoma skin cancer.10 Lesbians have been found to be less likely to pursue preventative health examinations in general, including skin checks.11 Finally, transgender patients can utilize dermatologists for help with transformative procedures and side effects of hormonal treatment such as androgenic acne.1,4
Cutaneous and beyond, the future of LGBT health care in the United States is affected by the institutions that train future physicians. There is a trend toward incorporating formal LGBT curricula into medical schools and academic centers.12 The Penn Medicine Program for LGBT Health (Philadelphia, Pennsylvania) is a pilot program geared toward both educating future clinicians and providing equal and unbiased care to LGBT patients.12 Programs such as this one give rise to a new generation of physicians who feel comfortable and aware of the needs of their LGBT patients.
In a time when LGBT patients are becoming more comfortable claiming their sexual and gender identities openly, there is a need for dermatologists to provide individualized unbiased care, which can best be achieved by building rapport through assumption-free history taking, performing thorough physical examinations that include the genital and perianal area, and passing these good practices on to trainees.
- Snyder JE. Trend analysis of medical publications about LGBT persons: 1950-2007. J Homosex. 2011;58:164-188.
- Ginsberg BA, Calderon M, Seminara NM, et al. A potential role for the dermatologist in the physical transformation of transgender people: a survey of attitudes and practices within the transgender community. J Am Acad Dermatol. 2016;74:303-308.
- Gee R. Primary care health issues among men who have sex with men. J Am Acad Nurse Pract. 2006;18:144-153.
- Katz KA, Furnish TJ. Dermatology-related epidemiologic and clinical concerns of men who have sex with men, women who have sex with women, and transgender individuals. Arch Dermatol. 2005;141:1303-1310.
- Fenkl EA, Jones SG, Schochet E, et al. HPV and anal cancer knowledge among HIV-infected and non-infected men who have sex with men [published online December 11, 2015]. LGBT Health. 2016;3:42-48. doi:10.1089/lgbt.2015.0086.
- Chin-Hong PV, Vittinghoff E, Cranston RD, et al. Age-related prevalence of anal cancer precursors in homosexual men: the EXPLORE Study. J Natl Cancer Inst. 2005;97:896-905.
- Schofield AM, Sadler L, Nelson L, et al. A prospective study of anal cancer screening in HIV-positive and negative MSM. AIDS. 2016;30:1375-1383.
- Katz MH, Katz KA, Bernestein KT, et al. We need data on anal screening effectiveness before focusing on increasing it [published online September 23, 2010]. Am J Public Health. 2010;100:2016.
- Petrosky E, Bocchini JA, Hariri S, et al. Use of 9-Valent human papillomavirus (HPV) vaccine: updated HPV vaccination recommendations of the advisory committee on immunization practices. MMWR Morb Mortal Wkly Rep. 2015;64:300-304.
- Mansh M, Katz KA, Linos E, et al. Association of skin cancer and indoor tanning in sexual minority men and women. JAMA Dermatol. 2015;151:1308-1316.
- Conron KJ, Mimiaga MJ, Landers SJ. A population-based study of sexual orientation identity and gender differences in adult health. Am J Public Health. 2010;100:1953-1960.
- Yehia BR, Calder D, Flesch JD, et al. Advancing LGBT health at an academic medical center: a case study. LGBT Health. 2015;2:362-366.