User login
Informed consent: The more you know, the more you and your patient are protected
CASE: Surgeon accused of performing tubal ligation without consent
A patient was scheduled for an elective cesarean delivery to be performed by her ObGyn (Dr. Surgeon) at the nearby medical center. The patient was asked to sign an electronic signature pad in her ObGyn’s office, which transposed her signature onto an electronic form that she could not see at the time. She signed it. The consent was not printed out in the office but was added to her electronic medical record, and a copy was sent to her via email. Among other things, the consent included, “[Name] hereby agrees that all appropriate medical and surgical procedures as determined by the physicians and others in this hospital are in my best interest. No further consent is required to any of the treatment in this hospital.”
In the hospital, Dr. Surgeon spoke preoper- atively with the patient about cesarean delivery, the various risks and benefits, and the possibility and risks of an alternative trial of labor. Dr. Surgeon noted the conversation in the patient’s chart.
A nurse brought a standard hard copy “Zee Hospital Surgical Consent Form” to the patient. In a relevant part it provided, “I hereby consent to the surgical procedure Dr. Surgeon has discussed with me: _______” (the blank was filled in with “cesarean delivery”). The form continued: “He/She has explained the risks and benefits. I also authorize Dr. Surgeon, and such assistants as he/she may select, to perform this procedure. In his/her medical judgment, if additional procedures are appropriate, I hereby consent to their performance, in addition to the procedures listed in this form.” The patient signed the form.
While Dr. Surgeon was scrubbing for the delivery, the patient’s husband (also a surgeon at the hospital; Dr. Husband), stopped by, thanked Dr. Surgeon, and said, “Oh, by the way, my wife would like you to do a tubal ligation as well—she really wants it for health reasons. Her chronic hypertension skyrocketed during this pregnancy, and we don’t want any more children.”
“She didn’t mention that a little earlier while I was talking with her,” replied Dr. Surgeon, “but I can see how it would have slipped her mind.”
Dr. Surgeon performed the cesarean delivery and tubal ligation. All went well, with a healthy baby and mother. Several months later, the patient and Dr. Husband separated and sought divorce.
The patient, surprised by the cost of the hospital bill (Dr. Surgeon did not bill for his surgical services as a professional courtesy), was astonished to see a charge related to tubal ligation. Knowing how common billing mistakes were at Zee Hospital, she called to have the bill corrected. The clerk informed her that her medical record showed that a tubal ligation had been performed and that the bill was correct.
The patient sued Dr. Surgeon, Zee Hospital, and her (now former) husband, Dr. Husband, both for the cesarean delivery and the tubal ligation. Her claims are primarily based on the lack of informed consent.
What’s the verdict?
The patient likely has a strong case regarding the tubal ligation claim, but a weak case related to the cesarean delivery claim.
Read the ethical, medical, and legal implications of this case
Ethical and medical considerations
Although this case seems too strange for fiction, the basic facts are taken from events that did occur at a major institution. The puzzling features of this case are meant to be a cautionary tale: it is easy in the rush with the pressure of clinical practice to view informed consent as a bothersome technical detail. Yet as the following discussion suggests, adhering closely to the tenets of informed consent protects not only the fundamental interests of the patient but also the physicians and medical institutions.
Informed consent serves as protective communication
Informed consent at its core is a “process of communication” that involves you as the health care provider and the patient. It provides authority for an activity based upon an understanding of what that activity entails.1,2 Aspects of informed consent, from the physician−patient perspective, include the following:
- disclosure
- comprehension
- voluntary choice
- authorization.
In one other sense, informed consent is based on a fiduciary relationship between the ObGyn and patient.3 Overall, the process consists of an educational communication by the physician to the patient. Ideally, providers perceive the process from an ethical point of view that has been formalized by cases and statutes.4
Informed consent protects one of the most basic values of medicine and society: autonomy. From the perspective of moral philosophers, the principle of autonomy establishes the moral right to choose and follow one’s own plan for life and action.5,6 For ObGyns, the patient’s autonomy and her ability to participate in the medical decision-making process is of paramount importance. Informed consent is also a reflection of trust inherent to the physician−patient relationship.4
Informed consent is too often viewed as a mere legal formality. In truth, it melds legal and ethical values and concerns. The President’s Commission reflected this, noting that informed consent is rooted in “the fundamental recognition that adults are entitled to accept or reject health care intervention(s) on the basis of their own personal values and in furtherance of their own personal goals.”7
The historic perspective of informed consent dates back to Egyptian, Greek, and Roman eras. Dhar and Dhar suggest that the concept of “physicians’ love for humanity—philantropia” dates back to Plato and is complemented by the term “philotechnia” (love of medicine), all of which have evolved into today’s use of the terms “risks, benefits, and alternatives.”8
We emphasize that informed consent is much more than a legal concept. It has strong clinical roots because it provides an opportunity for physicians to improve communication with their patients. Informed consent is not a form; it is a process to be taken seriously.
Legal principles of informed consent
The famous New York case of Mary Schloendorff v. Society of New York Hospital, in 1914, heralded a principle that remains central in American law. Justice Benjamin Cardozo, writing for the majority, held that, “Every human being of adult years and sound mind has a right to determine what shall be done with his own body; and a surgeon who performs an operation without his patient’s consent commits an assault for which he is liable in damages.”9 The surgeon in the Schloendorff case had undertaken a gynecologic procedure—removal of a fibroid tumor—without patient consent. (In that case the hospital rather than the physician was sued, but the principle clearly applied to the physician.)
Over the last century, the American law of informed consent has developed in a number of ways.10 Lack of informed consent is now almost always considered a form of negligence rather than an intentional tort of battery. The details of the legal requirements vary from state to state as a result of statutory changes and court decisions. But in one way or another, to be “informed,” consent generally must include 4 things:
- a description of the procedure or intervention that is proposed
- the risks and benefits of the proposal—the focus here is generally on the risks of the treatment
- alternatives, if there are any (eg, pharmacologic vs surgical treatment)
- the consequences of not undertaking the proposed treatment (eg, the refusal to have a Papanicolaou smear).
A fifth point might be added—the offer to answer any questions or provide additional information.
These 4 or 5 basic items and the expanded list are efforts to simply describe the information that a reasonable person would need in order to make a decision that represents the patient’s values, personality, and preferences. (Informed consent is in some ways an ongoing process—since a patient may withdraw his/her consent.)
Exceptions to the informed consent requirement
Before turning to the facts in the hypothetical case, it is worth noting that there are 2 common exceptions to the informed consent requirement. The first is an emergency exception. When someone requires immediate attention and the patient is not conscious or capable of consent (nor is a “next of kin” available), treatment may proceed.
The second is therapeutic exception. Its designation is narrow, and it is risky to rely on it except in extreme circumstances. But when the very process of informing the patient of all the risks of a proposed treatment would create significant additional risks for the patient, the consent process may be modified. For example, for an extremely suggestable patient, describing certain risks might, in a psychosomatic way, cause the risk to be realized. In such cases, the record must be clearly documented. It is generally best to discuss the matter with a family member or other surrogate decision maker.
Read what went wrong in this case
What went wrong with consent in this case?
Our case illustrates a number of problems that occur when informed consent is not properly completed.
The electronic signature on the broadly stated consent form the patient initially signed in the office was nearly useless. She did not know what she was signing, did not have any chance to read it before signing, and was provided no help with any of the information factors of informed consent.
The surgical consent form is among the most interesting elements of this case. The form itself was seriously flawed because it contained no real evidence that the patient received information about the risks and alternatives. If the form is all there was, it would be a problem. But the conversation that Dr. Surgeon documented with the patient seemed to provide the basic elements of informed consent, including discussion of risks and benefits.
Oral informed consent is recognized in most states. To his credit, Dr. Surgeon appropriately recorded the conversation in the record. The risk of oral informed consent not backed up by text signature is that, if a dispute arises about the consent, it is difficult to prove details of what was said. (There was, of course, no such dispute about the cesarean delivery as it turned out in this case.)
Technological add-ons to consent: Pros and cons
Video and computer software are increasingly becoming an integral part of the informed consent process, and may improve comprehension by patients.11 Electronic consent may be helpful in proving what the patient was told during the consent process. A difficulty can result from overreliance on the electronic aspect and forgetting the human part of the informed consent equation. The health care team often can be productive parts of the informed consent process, but the surgeon must take ultimate responsibility for the informed consent.12
Was there informed consent for the tubal ligation?
The major problem in this case, of course, was the tubal ligation. It does not take much of an understanding of the legal niceties of informed consent to know that there was no real consent to this procedure. Dr. Husband did not have authority to consent, and his comment to Dr. Surgeon did not qualify as consent.
The hospital consent form may appear to provide some legal protection (“In his medical judgment, if additional procedures are appropriate, I hereby consent to doing those….”). Such language was once common in informed consent forms, but it offered little real consent except for trivial incidental processes (removal of an appendix) or where there was a real medical necessity for doing an expanded procedure (removal of a previously unknown cancerous growth).
Thus, Dr. Surgeon performed the sterilization without consent and may well be liable for that part of the surgery even though it did not turn out badly in a medical sense. If not for the tubal ligation, the damages would probably have been trivial. The real loss here is not a medical injury; it is the loss of reproductive capacity.
Protecting reproductive capacity. Modern law has been especially sensitive to protecting decisions regarding reproductive capacity. Therefore, the absence of clear consent to permanent sterilization is legally problematic. Dr. Surgeon may claim that he reasonably believed that the husband could give surrogate consent and it was too late to check with the patient herself. This situation does not fit well with the emergency exception, and it appears from the facts that Dr. Surgeon acted without informed consent to the sterilization.
Was it negligence or battery?
Dr. Surgeon. The most likely basis for liability for Dr. Surgeon is negligence. There is some argument that the tort of battery is a possibility because there was no consent at all for the sterilization. The claim would be that it was not the “information” that was lacking; it was the consent itself. The fact that Dr. Surgeon did not charge for his services would not absolve him of liability.
Dr. Husband. The potential liability of Dr. Husband is complicated by questions of whether he was acting in the capacity of a physician (which would likely involve the question of whether his malpractice insurance would be available), the degree to which he was acting in good faith, and facts we do not have in this case. If Dr. Husband gave consent (and thereby “caused”) the sterilization knowing that his wife did not want to have it or because of animus toward her (they were about to be separated and divorced, after all), there is the possibility of liability. (In some states a form of interspousal liability might complicate some of these claims—but that is a topic for another day.) He essentially took action for the purpose of wrongly causing the sterilization—which may be a battery (an intentional offensive or harmful touching). The legal rules around battery allow punitive damages as well as compensatory damages. In addition, many malpractice insurance policies provide limited coverage for intentional torts. To complicate matters further, it is not clear that Dr. Husband’s actions were related to his practice of medicine in any event (although Dr. Surgeon might claim that Dr. Husband’s expressed concern about his wife’s hypertension was enough to create a malpractice issue if Dr. Surgeon did not perform the verbally requested tubal ligation).
If, as we have speculated, Dr. Husband’s actions were motivated by improper personal considerations at the expense of a patient, he may also face medical board complaints from the patient. It is plausible that a state law makes it a criminal offense to wrongfully (or fraudulently) consent to medical treatment, particularly if related to reproductive capacity.
The hospital may face liability on several grounds, depending in part on the relationships between the hospital, Dr. Surgeon, and Dr. Husband. If Dr. Surgeon is an employee or agent of the hospital, he would be liable for his negligence. Even if Dr. Surgeon is technically an independent contractor, the failure of the hospital to offer more oversight concerning the surgical procedures in its facilities could give rise to a claim of negligence.
As to Dr. Husband, many of the same considerations are present. In addition, even if he is an agent of the hospital, the hospital may claim that his actions (especially if motivated by personal considerations) were a “lark of his own” and not in the course of his employment by the hospital.
Read about the clinical opportunity of informed consent
The clinical opportunity of informed consent
More than a technical legal doctrine, informed consent provides ObGyns an important opportunity for better communications with patients, and is a chance to create reasonable expectations and a more therapeutic relationship that involves the patient in care and decision making. It is likely that engaging the patient in good informed consent processes can set the stage for improved outcomes.
Interactive dialogue with the patient is one advised approach.10 This undertaking in part reflects that, as patients have more ready access to information in the digital age, they are positioned to play a more active role in health care decision making.
The benefits of informed consent are likely to be greatest if you view the process not as a technical legal requirement but as an excellent opportunity to engage the patient in her own care and treatment. Planning, intervention, and evaluation of care options as well as education regarding the medical problem at hand are integral to the informed consent process. And, of course, the right to consent is a “basic patient right” that in a sense guarantees that he/she has the right to make informed decisions regarding one’s care.6
Special considerations
Informed consent most often is associated with but not limited to surgical procedures (often performed with the use of surgical instruments and/or devices). It applies to diagnostic interventions as well as treatment. The more invasive or risky an intervention, the more important it is that the information is thorough.14,15
Pharmaceuticals have informed consent issues. The theory has been that pharmaceutical companies inform physicians of the risks and instructions for the use of pharmaceuticals and the physicians inform the patients. Indeed, traditionally pharmaceutical companies have gained immunity for “failure to warn” patients because the physicians were the “learned intermediaries” providing information to the public. Patient package inserts and pharmacists have taken over the informational role, but informed consent does apply to pharmaceuticals.
It is also worth noting that informed consent in any formal research study or the trial of new techniques, compounds, or devices requires a special process of approval by an institutional review board.
Set the stage for best outcomes
The main objective of informed consent is promoting the autonomy of your patient. That requires that she understand the risks, benefits, and alternatives associated with the procedure and the risks associated with a refusal of treatment. Done properly, this can result in your patient gaining confidence and trust in you as her provider.
Informed consent is a process that reflects our interactions with our patients. It is part of the broader commitment by the medical profession to “first do no harm.”
Share your thoughts! Send your Letter to the Editor to [email protected]. Please include your name and the city and state in which you practice.
- Grady C. Enduring and emerging challenges of informed consent. N Engl J Med. 2015;372(22):855–862.
- Faden RR, Beauchamp TL. History and theory of informed consent. New York, New York: Oxford University Press; 1986.
- Paterick TJ, Carson G, Allen M, Paterick TE. Medical informed consent: general considerations for physicians. Mayo Clin Proc. 2008;83(3):313–319.
- American College of Obstetricians and Gynecologists Committee on Ethics. ACOG Committee Opinion No. 439: Informed consent (reaffirmed 2015). Obstet Gynecol. 2009;114(2 pt 1):401–408.
- Jonsen A, Siegler M, Winslade W. Clinical Ethics: A Practical Approach to Ethical Decisions in Clinical Medicine. New York, New York: McGraw Hill; 2010.
- Menendez J. Informed consent: essential legal and ethical principles for nurses. JONAS Healthc Law Ethics Regul. 2013;15(4):140–144.
- Abram MB, Ballantine HT, Dunlop GR, et al; President’s Commission for the Study of Ethical Problems in Medicine and Biomedical and Behavioral Research. Making Health Care Decisions: The Ethical and Legal Implications of Informed Consent in the Patient-Practitioner Relationship. Volume One: Report. https://repository.library.georgetown.edu/bitstream/handle/10822/559354/making_health_care_decisions.pdf?sequence=1. Published October 1982. Accessed January 9, 2017.
- Dhar H, Dhar D. Informed consent in clinical practice and literature overview. Arch Gynecol Obstet. 2012;286(3):649–651.
- NE Schloendorff v Society of New York Hospital, 211 NY 125, 106 NE 93 1914.
- Avery D. Summary of informed consent and refusal. Am J Clinical Med. 2009;6(3):28–29.
- Pallett A, Phippen N, Miller C, Barnett J. Informed consent for hysterectomy: Does a video presentation improve patient comprehension? [poster 17F]. Obstet Gynecol. 2016;127(suppl):55S.
- Cainzos M, Gonzalez-Vinagre S. Informed consent in surgery. World J Surg. 2014;38(7):1587–1593.
- Weaver J. A problem with informed consent. J Am Coll Surg. 2009;209(2):286–287.
- Bunch W. Informed consent. Clin Orthop Relat Res. 2000;378:71–77.
- Peltier LF. Orthopedics: a history and iconography (Norman Orthopedic, No. 3). San Francisco, California: Jeremy Norman Co; 1993.
In this quarterly column, these medical and legal experts and educators present a case-based discussion and provide clear teaching points and takeaways for your practice.

Mr. Smith is Professor of Law and Dean Emeritus at California Western School of Law, San Diego, California.

Dr. Sanfilippo is Professor, Department of Obstetrics, Gynecology, and Reproductive Sciences, University of Pittsburgh, and Director, Reproductive Endocrinology and Infertility, at Magee-Womens Hospital, Pittsburgh, Pennsylvania. He also serves on the
The authors report no financial relationships relevant to this article.
In this quarterly column, these medical and legal experts and educators present a case-based discussion and provide clear teaching points and takeaways for your practice.
Mr. Smith is Professor of Law and Dean Emeritus at California Western School of Law, San Diego, California.
Dr. Sanfilippo is Professor, Department of Obstetrics, Gynecology, and Reproductive Sciences, University of Pittsburgh, and Director, Reproductive Endocrinology and Infertility, at Magee-Womens Hospital, Pittsburgh, Pennsylvania. He also serves on the
The authors report no financial relationships relevant to this article.
CASE: Surgeon accused of performing tubal ligation without consent
A patient was scheduled for an elective cesarean delivery to be performed by her ObGyn (Dr. Surgeon) at the nearby medical center. The patient was asked to sign an electronic signature pad in her ObGyn’s office, which transposed her signature onto an electronic form that she could not see at the time. She signed it. The consent was not printed out in the office but was added to her electronic medical record, and a copy was sent to her via email. Among other things, the consent included, “[Name] hereby agrees that all appropriate medical and surgical procedures as determined by the physicians and others in this hospital are in my best interest. No further consent is required to any of the treatment in this hospital.”
In the hospital, Dr. Surgeon spoke preoper- atively with the patient about cesarean delivery, the various risks and benefits, and the possibility and risks of an alternative trial of labor. Dr. Surgeon noted the conversation in the patient’s chart.
A nurse brought a standard hard copy “Zee Hospital Surgical Consent Form” to the patient. In a relevant part it provided, “I hereby consent to the surgical procedure Dr. Surgeon has discussed with me: _______” (the blank was filled in with “cesarean delivery”). The form continued: “He/She has explained the risks and benefits. I also authorize Dr. Surgeon, and such assistants as he/she may select, to perform this procedure. In his/her medical judgment, if additional procedures are appropriate, I hereby consent to their performance, in addition to the procedures listed in this form.” The patient signed the form.
While Dr. Surgeon was scrubbing for the delivery, the patient’s husband (also a surgeon at the hospital; Dr. Husband), stopped by, thanked Dr. Surgeon, and said, “Oh, by the way, my wife would like you to do a tubal ligation as well—she really wants it for health reasons. Her chronic hypertension skyrocketed during this pregnancy, and we don’t want any more children.”
“She didn’t mention that a little earlier while I was talking with her,” replied Dr. Surgeon, “but I can see how it would have slipped her mind.”
Dr. Surgeon performed the cesarean delivery and tubal ligation. All went well, with a healthy baby and mother. Several months later, the patient and Dr. Husband separated and sought divorce.
The patient, surprised by the cost of the hospital bill (Dr. Surgeon did not bill for his surgical services as a professional courtesy), was astonished to see a charge related to tubal ligation. Knowing how common billing mistakes were at Zee Hospital, she called to have the bill corrected. The clerk informed her that her medical record showed that a tubal ligation had been performed and that the bill was correct.
The patient sued Dr. Surgeon, Zee Hospital, and her (now former) husband, Dr. Husband, both for the cesarean delivery and the tubal ligation. Her claims are primarily based on the lack of informed consent.
What’s the verdict?
The patient likely has a strong case regarding the tubal ligation claim, but a weak case related to the cesarean delivery claim.
Read the ethical, medical, and legal implications of this case
Ethical and medical considerations
Although this case seems too strange for fiction, the basic facts are taken from events that did occur at a major institution. The puzzling features of this case are meant to be a cautionary tale: it is easy in the rush with the pressure of clinical practice to view informed consent as a bothersome technical detail. Yet as the following discussion suggests, adhering closely to the tenets of informed consent protects not only the fundamental interests of the patient but also the physicians and medical institutions.
Informed consent serves as protective communication
Informed consent at its core is a “process of communication” that involves you as the health care provider and the patient. It provides authority for an activity based upon an understanding of what that activity entails.1,2 Aspects of informed consent, from the physician−patient perspective, include the following:
- disclosure
- comprehension
- voluntary choice
- authorization.
In one other sense, informed consent is based on a fiduciary relationship between the ObGyn and patient.3 Overall, the process consists of an educational communication by the physician to the patient. Ideally, providers perceive the process from an ethical point of view that has been formalized by cases and statutes.4
Informed consent protects one of the most basic values of medicine and society: autonomy. From the perspective of moral philosophers, the principle of autonomy establishes the moral right to choose and follow one’s own plan for life and action.5,6 For ObGyns, the patient’s autonomy and her ability to participate in the medical decision-making process is of paramount importance. Informed consent is also a reflection of trust inherent to the physician−patient relationship.4
Informed consent is too often viewed as a mere legal formality. In truth, it melds legal and ethical values and concerns. The President’s Commission reflected this, noting that informed consent is rooted in “the fundamental recognition that adults are entitled to accept or reject health care intervention(s) on the basis of their own personal values and in furtherance of their own personal goals.”7
The historic perspective of informed consent dates back to Egyptian, Greek, and Roman eras. Dhar and Dhar suggest that the concept of “physicians’ love for humanity—philantropia” dates back to Plato and is complemented by the term “philotechnia” (love of medicine), all of which have evolved into today’s use of the terms “risks, benefits, and alternatives.”8
We emphasize that informed consent is much more than a legal concept. It has strong clinical roots because it provides an opportunity for physicians to improve communication with their patients. Informed consent is not a form; it is a process to be taken seriously.
Legal principles of informed consent
The famous New York case of Mary Schloendorff v. Society of New York Hospital, in 1914, heralded a principle that remains central in American law. Justice Benjamin Cardozo, writing for the majority, held that, “Every human being of adult years and sound mind has a right to determine what shall be done with his own body; and a surgeon who performs an operation without his patient’s consent commits an assault for which he is liable in damages.”9 The surgeon in the Schloendorff case had undertaken a gynecologic procedure—removal of a fibroid tumor—without patient consent. (In that case the hospital rather than the physician was sued, but the principle clearly applied to the physician.)
Over the last century, the American law of informed consent has developed in a number of ways.10 Lack of informed consent is now almost always considered a form of negligence rather than an intentional tort of battery. The details of the legal requirements vary from state to state as a result of statutory changes and court decisions. But in one way or another, to be “informed,” consent generally must include 4 things:
- a description of the procedure or intervention that is proposed
- the risks and benefits of the proposal—the focus here is generally on the risks of the treatment
- alternatives, if there are any (eg, pharmacologic vs surgical treatment)
- the consequences of not undertaking the proposed treatment (eg, the refusal to have a Papanicolaou smear).
A fifth point might be added—the offer to answer any questions or provide additional information.
These 4 or 5 basic items and the expanded list are efforts to simply describe the information that a reasonable person would need in order to make a decision that represents the patient’s values, personality, and preferences. (Informed consent is in some ways an ongoing process—since a patient may withdraw his/her consent.)
Exceptions to the informed consent requirement
Before turning to the facts in the hypothetical case, it is worth noting that there are 2 common exceptions to the informed consent requirement. The first is an emergency exception. When someone requires immediate attention and the patient is not conscious or capable of consent (nor is a “next of kin” available), treatment may proceed.
The second is therapeutic exception. Its designation is narrow, and it is risky to rely on it except in extreme circumstances. But when the very process of informing the patient of all the risks of a proposed treatment would create significant additional risks for the patient, the consent process may be modified. For example, for an extremely suggestable patient, describing certain risks might, in a psychosomatic way, cause the risk to be realized. In such cases, the record must be clearly documented. It is generally best to discuss the matter with a family member or other surrogate decision maker.
Read what went wrong in this case
What went wrong with consent in this case?
Our case illustrates a number of problems that occur when informed consent is not properly completed.
The electronic signature on the broadly stated consent form the patient initially signed in the office was nearly useless. She did not know what she was signing, did not have any chance to read it before signing, and was provided no help with any of the information factors of informed consent.
The surgical consent form is among the most interesting elements of this case. The form itself was seriously flawed because it contained no real evidence that the patient received information about the risks and alternatives. If the form is all there was, it would be a problem. But the conversation that Dr. Surgeon documented with the patient seemed to provide the basic elements of informed consent, including discussion of risks and benefits.
Oral informed consent is recognized in most states. To his credit, Dr. Surgeon appropriately recorded the conversation in the record. The risk of oral informed consent not backed up by text signature is that, if a dispute arises about the consent, it is difficult to prove details of what was said. (There was, of course, no such dispute about the cesarean delivery as it turned out in this case.)
Technological add-ons to consent: Pros and cons
Video and computer software are increasingly becoming an integral part of the informed consent process, and may improve comprehension by patients.11 Electronic consent may be helpful in proving what the patient was told during the consent process. A difficulty can result from overreliance on the electronic aspect and forgetting the human part of the informed consent equation. The health care team often can be productive parts of the informed consent process, but the surgeon must take ultimate responsibility for the informed consent.12
Was there informed consent for the tubal ligation?
The major problem in this case, of course, was the tubal ligation. It does not take much of an understanding of the legal niceties of informed consent to know that there was no real consent to this procedure. Dr. Husband did not have authority to consent, and his comment to Dr. Surgeon did not qualify as consent.
The hospital consent form may appear to provide some legal protection (“In his medical judgment, if additional procedures are appropriate, I hereby consent to doing those….”). Such language was once common in informed consent forms, but it offered little real consent except for trivial incidental processes (removal of an appendix) or where there was a real medical necessity for doing an expanded procedure (removal of a previously unknown cancerous growth).
Thus, Dr. Surgeon performed the sterilization without consent and may well be liable for that part of the surgery even though it did not turn out badly in a medical sense. If not for the tubal ligation, the damages would probably have been trivial. The real loss here is not a medical injury; it is the loss of reproductive capacity.
Protecting reproductive capacity. Modern law has been especially sensitive to protecting decisions regarding reproductive capacity. Therefore, the absence of clear consent to permanent sterilization is legally problematic. Dr. Surgeon may claim that he reasonably believed that the husband could give surrogate consent and it was too late to check with the patient herself. This situation does not fit well with the emergency exception, and it appears from the facts that Dr. Surgeon acted without informed consent to the sterilization.
Was it negligence or battery?
Dr. Surgeon. The most likely basis for liability for Dr. Surgeon is negligence. There is some argument that the tort of battery is a possibility because there was no consent at all for the sterilization. The claim would be that it was not the “information” that was lacking; it was the consent itself. The fact that Dr. Surgeon did not charge for his services would not absolve him of liability.
Dr. Husband. The potential liability of Dr. Husband is complicated by questions of whether he was acting in the capacity of a physician (which would likely involve the question of whether his malpractice insurance would be available), the degree to which he was acting in good faith, and facts we do not have in this case. If Dr. Husband gave consent (and thereby “caused”) the sterilization knowing that his wife did not want to have it or because of animus toward her (they were about to be separated and divorced, after all), there is the possibility of liability. (In some states a form of interspousal liability might complicate some of these claims—but that is a topic for another day.) He essentially took action for the purpose of wrongly causing the sterilization—which may be a battery (an intentional offensive or harmful touching). The legal rules around battery allow punitive damages as well as compensatory damages. In addition, many malpractice insurance policies provide limited coverage for intentional torts. To complicate matters further, it is not clear that Dr. Husband’s actions were related to his practice of medicine in any event (although Dr. Surgeon might claim that Dr. Husband’s expressed concern about his wife’s hypertension was enough to create a malpractice issue if Dr. Surgeon did not perform the verbally requested tubal ligation).
If, as we have speculated, Dr. Husband’s actions were motivated by improper personal considerations at the expense of a patient, he may also face medical board complaints from the patient. It is plausible that a state law makes it a criminal offense to wrongfully (or fraudulently) consent to medical treatment, particularly if related to reproductive capacity.
The hospital may face liability on several grounds, depending in part on the relationships between the hospital, Dr. Surgeon, and Dr. Husband. If Dr. Surgeon is an employee or agent of the hospital, he would be liable for his negligence. Even if Dr. Surgeon is technically an independent contractor, the failure of the hospital to offer more oversight concerning the surgical procedures in its facilities could give rise to a claim of negligence.
As to Dr. Husband, many of the same considerations are present. In addition, even if he is an agent of the hospital, the hospital may claim that his actions (especially if motivated by personal considerations) were a “lark of his own” and not in the course of his employment by the hospital.
Read about the clinical opportunity of informed consent
The clinical opportunity of informed consent
More than a technical legal doctrine, informed consent provides ObGyns an important opportunity for better communications with patients, and is a chance to create reasonable expectations and a more therapeutic relationship that involves the patient in care and decision making. It is likely that engaging the patient in good informed consent processes can set the stage for improved outcomes.
Interactive dialogue with the patient is one advised approach.10 This undertaking in part reflects that, as patients have more ready access to information in the digital age, they are positioned to play a more active role in health care decision making.
The benefits of informed consent are likely to be greatest if you view the process not as a technical legal requirement but as an excellent opportunity to engage the patient in her own care and treatment. Planning, intervention, and evaluation of care options as well as education regarding the medical problem at hand are integral to the informed consent process. And, of course, the right to consent is a “basic patient right” that in a sense guarantees that he/she has the right to make informed decisions regarding one’s care.6
Special considerations
Informed consent most often is associated with but not limited to surgical procedures (often performed with the use of surgical instruments and/or devices). It applies to diagnostic interventions as well as treatment. The more invasive or risky an intervention, the more important it is that the information is thorough.14,15
Pharmaceuticals have informed consent issues. The theory has been that pharmaceutical companies inform physicians of the risks and instructions for the use of pharmaceuticals and the physicians inform the patients. Indeed, traditionally pharmaceutical companies have gained immunity for “failure to warn” patients because the physicians were the “learned intermediaries” providing information to the public. Patient package inserts and pharmacists have taken over the informational role, but informed consent does apply to pharmaceuticals.
It is also worth noting that informed consent in any formal research study or the trial of new techniques, compounds, or devices requires a special process of approval by an institutional review board.
Set the stage for best outcomes
The main objective of informed consent is promoting the autonomy of your patient. That requires that she understand the risks, benefits, and alternatives associated with the procedure and the risks associated with a refusal of treatment. Done properly, this can result in your patient gaining confidence and trust in you as her provider.
Informed consent is a process that reflects our interactions with our patients. It is part of the broader commitment by the medical profession to “first do no harm.”
Share your thoughts! Send your Letter to the Editor to [email protected]. Please include your name and the city and state in which you practice.
- Grady C. Enduring and emerging challenges of informed consent. N Engl J Med. 2015;372(22):855–862.
- Faden RR, Beauchamp TL. History and theory of informed consent. New York, New York: Oxford University Press; 1986.
- Paterick TJ, Carson G, Allen M, Paterick TE. Medical informed consent: general considerations for physicians. Mayo Clin Proc. 2008;83(3):313–319.
- American College of Obstetricians and Gynecologists Committee on Ethics. ACOG Committee Opinion No. 439: Informed consent (reaffirmed 2015). Obstet Gynecol. 2009;114(2 pt 1):401–408.
- Jonsen A, Siegler M, Winslade W. Clinical Ethics: A Practical Approach to Ethical Decisions in Clinical Medicine. New York, New York: McGraw Hill; 2010.
- Menendez J. Informed consent: essential legal and ethical principles for nurses. JONAS Healthc Law Ethics Regul. 2013;15(4):140–144.
- Abram MB, Ballantine HT, Dunlop GR, et al; President’s Commission for the Study of Ethical Problems in Medicine and Biomedical and Behavioral Research. Making Health Care Decisions: The Ethical and Legal Implications of Informed Consent in the Patient-Practitioner Relationship. Volume One: Report. https://repository.library.georgetown.edu/bitstream/handle/10822/559354/making_health_care_decisions.pdf?sequence=1. Published October 1982. Accessed January 9, 2017.
- Dhar H, Dhar D. Informed consent in clinical practice and literature overview. Arch Gynecol Obstet. 2012;286(3):649–651.
- NE Schloendorff v Society of New York Hospital, 211 NY 125, 106 NE 93 1914.
- Avery D. Summary of informed consent and refusal. Am J Clinical Med. 2009;6(3):28–29.
- Pallett A, Phippen N, Miller C, Barnett J. Informed consent for hysterectomy: Does a video presentation improve patient comprehension? [poster 17F]. Obstet Gynecol. 2016;127(suppl):55S.
- Cainzos M, Gonzalez-Vinagre S. Informed consent in surgery. World J Surg. 2014;38(7):1587–1593.
- Weaver J. A problem with informed consent. J Am Coll Surg. 2009;209(2):286–287.
- Bunch W. Informed consent. Clin Orthop Relat Res. 2000;378:71–77.
- Peltier LF. Orthopedics: a history and iconography (Norman Orthopedic, No. 3). San Francisco, California: Jeremy Norman Co; 1993.

Should coffee consumption be added as an adjunct to the postoperative care of gynecologic oncology patients?
EXPERT COMMENTARY
Postoperative ileus is a common complication following abdominal surgery, particularly for patients undergoing laparotomy. Ileus is frustrating for patients and providers alike, and its occurrence may prolong the length of hospital stay, increase the cost of care, worsen patient satisfaction, and potentially delay postoperative treatments, such as chemotherapy for patients with gynecologic malignancies. The etiology of ileus is multifactorial, but it is thought to be caused primarily by a local inflammatory response from mechanical handling and irritation of the bowel. Although various interventions, such as laxatives, peripheral mu antagonists, and chewing gum, have been shown to reduce the occurrence of ileus, the effectiveness of these interventions varies, and ileus remains a major source of morbidity.1
Details of the study
To investigate whether coffee consumption accelerates recovery of bowel function following surgery, Güngördük and colleagues conducted a randomized controlled trial of coffee consumption after laparotomy with hysterectomy and staging for patients with gynecologic malignancies. This intervention avoids costs associated with drugs such as oral mu antagonists.
The trial included 114 women; after surgery, 58 were assigned to consume coffee 3 times daily and 56 received routine postoperative care without coffee consumption. The primary outcome measure was the time to the first passage of flatus after surgery. Time to first bowel movement and time to tolerance of a solid diet were secondary outcomes.
The results of this trial are consistent with prior study findings in colorectal surgery.2 Güngördük and associates found that patients in the coffee-consumption group, compared with controls, had reduced the time to flatus by 12 hours (mean [SD] time to flatus, 30.2 [8.0] vs 40.2 [12.1] hours; P<.001), shortened time to full diet by 1.3 days (mean [SD] time to tolerate food, 3.4 [1.2] vs 4.7 [1.6] days; P<.001), reduced time to first bowel movement by 12 hours (43.1 [9.4] vs 58.5 [17.0] hours; P<.001), and shortened length of hospital stay by 1 day. Symptoms of ileus were reduced from 52% to 14% with coffee consumption.
Study limitation. An important weakness of this study is that although the authors defined the severity of ileus by time to resolution, they did not define what constituted a diagnosis of ileus in the first place.
Unanswered questions. Coffee is a known diarrhetic, so it is not unexpected that its use shortened time to flatus and first bowel movement. What is not known, however, is whether coffee consumption improves recovery. The significance of a 1-day reduction in hospital stay is unclear given the relatively prolonged hospitalization (6 to 7 days) seen in this investigation of patients with mixed gynecologic malignancies who underwent staging only. In contrast, another study showed that, for patients managed within an enhanced recovery pathway (a multimodal perioperative care enhancement protocol), median length of stay was 4 days for patients who underwent staging alone and 5 days for patients with ovarian cancer (40% underwent enteric resections).3 Thus, the effects of coffee consumption are unclear for patients managed with an optimized perioperative pathway.
The improvement in oral intake is also of questionable significance since these patients tolerated a solid diet 3 to 4 days after surgery, compared with the evening of surgery for most patients managed with enhanced recovery.
Incisional injection of liposomal bupivacaine has been associated with a reduction in the rate of ileus from 22% to 11% after complex cytoreduction for ovarian cancer when added to an existing enhanced recovery pathway; rates were only 5% for patients undergoing staging alone.4 These findings may be due to the significant reduction in opioid use that accompanied the use of liposomal bupivacaine.
--SEAN C. DOWDY, MD
Share your thoughts! Send your Letter to the Editor to [email protected]. Please include your name and the city and state in which you practice.
- Nelson G, Altman AD, Nick A, et al. Guidelines for post- operative care in gynecologic/oncology surgery: Enhanced Recovery After Surgery (ERAS) Society recommendations--part II. Gynecol Oncol. 2016;140(2):323-332.
- Müller SA, Rahbari NN, Schneider F, et al. Randomized clinical trial on the effect of coffee on postoperative ileus following elective colectomy. Br J Surg. 2012;99(11):1530-1538.
- Kalogera E, Bakkum-Gamez JN, Jankowski CJ, et al. Enhanced recovery in gynecologic surgery. Obstet Gynecol. 2013;122 (2 pt 1):319-328.
- Kalogera E, Bakkum-Gamez JN, Weaver AL, et al. Abdominal incision injection of liposomal bupivacaine and opioid use after laparotomy for gynecologic malignancies. Obstet Gynecol. 2016;128(5):1009-1017.
EXPERT COMMENTARY
Postoperative ileus is a common complication following abdominal surgery, particularly for patients undergoing laparotomy. Ileus is frustrating for patients and providers alike, and its occurrence may prolong the length of hospital stay, increase the cost of care, worsen patient satisfaction, and potentially delay postoperative treatments, such as chemotherapy for patients with gynecologic malignancies. The etiology of ileus is multifactorial, but it is thought to be caused primarily by a local inflammatory response from mechanical handling and irritation of the bowel. Although various interventions, such as laxatives, peripheral mu antagonists, and chewing gum, have been shown to reduce the occurrence of ileus, the effectiveness of these interventions varies, and ileus remains a major source of morbidity.1
Details of the study
To investigate whether coffee consumption accelerates recovery of bowel function following surgery, Güngördük and colleagues conducted a randomized controlled trial of coffee consumption after laparotomy with hysterectomy and staging for patients with gynecologic malignancies. This intervention avoids costs associated with drugs such as oral mu antagonists.
The trial included 114 women; after surgery, 58 were assigned to consume coffee 3 times daily and 56 received routine postoperative care without coffee consumption. The primary outcome measure was the time to the first passage of flatus after surgery. Time to first bowel movement and time to tolerance of a solid diet were secondary outcomes.
The results of this trial are consistent with prior study findings in colorectal surgery.2 Güngördük and associates found that patients in the coffee-consumption group, compared with controls, had reduced the time to flatus by 12 hours (mean [SD] time to flatus, 30.2 [8.0] vs 40.2 [12.1] hours; P<.001), shortened time to full diet by 1.3 days (mean [SD] time to tolerate food, 3.4 [1.2] vs 4.7 [1.6] days; P<.001), reduced time to first bowel movement by 12 hours (43.1 [9.4] vs 58.5 [17.0] hours; P<.001), and shortened length of hospital stay by 1 day. Symptoms of ileus were reduced from 52% to 14% with coffee consumption.
Study limitation. An important weakness of this study is that although the authors defined the severity of ileus by time to resolution, they did not define what constituted a diagnosis of ileus in the first place.
Unanswered questions. Coffee is a known diarrhetic, so it is not unexpected that its use shortened time to flatus and first bowel movement. What is not known, however, is whether coffee consumption improves recovery. The significance of a 1-day reduction in hospital stay is unclear given the relatively prolonged hospitalization (6 to 7 days) seen in this investigation of patients with mixed gynecologic malignancies who underwent staging only. In contrast, another study showed that, for patients managed within an enhanced recovery pathway (a multimodal perioperative care enhancement protocol), median length of stay was 4 days for patients who underwent staging alone and 5 days for patients with ovarian cancer (40% underwent enteric resections).3 Thus, the effects of coffee consumption are unclear for patients managed with an optimized perioperative pathway.
The improvement in oral intake is also of questionable significance since these patients tolerated a solid diet 3 to 4 days after surgery, compared with the evening of surgery for most patients managed with enhanced recovery.
Incisional injection of liposomal bupivacaine has been associated with a reduction in the rate of ileus from 22% to 11% after complex cytoreduction for ovarian cancer when added to an existing enhanced recovery pathway; rates were only 5% for patients undergoing staging alone.4 These findings may be due to the significant reduction in opioid use that accompanied the use of liposomal bupivacaine.
--SEAN C. DOWDY, MD
Share your thoughts! Send your Letter to the Editor to [email protected]. Please include your name and the city and state in which you practice.
- Nelson G, Altman AD, Nick A, et al. Guidelines for post- operative care in gynecologic/oncology surgery: Enhanced Recovery After Surgery (ERAS) Society recommendations--part II. Gynecol Oncol. 2016;140(2):323-332.
- Müller SA, Rahbari NN, Schneider F, et al. Randomized clinical trial on the effect of coffee on postoperative ileus following elective colectomy. Br J Surg. 2012;99(11):1530-1538.
- Kalogera E, Bakkum-Gamez JN, Jankowski CJ, et al. Enhanced recovery in gynecologic surgery. Obstet Gynecol. 2013;122 (2 pt 1):319-328.
- Kalogera E, Bakkum-Gamez JN, Weaver AL, et al. Abdominal incision injection of liposomal bupivacaine and opioid use after laparotomy for gynecologic malignancies. Obstet Gynecol. 2016;128(5):1009-1017.

Abatacept efficacy differs in trials of giant cell and Takayasu’s arteritis
A pair of new studies offer mixed results regarding the use of the rheumatoid arthritis drug abatacept to treat two forms of large-vessel vasculitis: It appears to help patients with giant cell arteritis but not those with the rarer Takayasu’s arteritis.
“The results from the GCA [giant cell arteritis] study found that treatment with abatacept [Orencia] combined with prednisone resulted in a lower rate of relapse than treatment with prednisone alone,” said Carol A. Langford, MD, lead author of both studies, which were conducted by the Vasculitis Clinical Research Consortium. She is chair in rheumatic and immunologic diseases and director of the Center for Vasculitis Care and Research at the Cleveland Clinic.

Both studies appear online Jan. 30 in Arthritis & Rheumatology.
“GCA is the most common form of vasculitis with an estimated incidence of 19.8 per 100,000,” she said. “It occurs in people over the age of 50 with the average age of onset in the 70s.” Women are most affected by a 2:1 ratio.
She said the disease affects the cranium (causing headaches, scalp tenderness, and a risk of blindness) and causes signs of systemic inflammation.
“Almost one-third of patients with GCA can have large vessel involvement that specifically include thoracic aortic aneurysms and stenosis of the cervical and subclavian arteries,” she said. Fatal thoracic aneurysms are possible, she said, but “studies have shown that in GCA overall, while short-term mortality may be increased, long-term survival is similar to the age-matched general population.”
TAK is much rarer, she said, affecting 3-9 people per 1,000,000. “TAK has an average age of onset in the 20s with an even stronger female predisposition of up to 9:1.”
The condition affects the aorta, its main branches, and pulmonary arteries, she said, “Some of the more frequent vascular symptoms/signs can include extremity claudication, hypertension, chest pain, and features associated with cerebral hypoperfusion. TAK is associated with substantial morbidity which is influenced by a low rate of sustained remission in 28%-50% of patients. Up to 47% of patients experience permanent disability, which has a significant impact on this young population.”
The mortality from TAK is unclear, she said.
Glucocorticoids are the main treatment for both GCA and TAK, Dr. Langford said, but “while glucocorticoids effectively control disease, they do not prevent relapse and they are associated with significant toxicity.”
For GCA, methotrexate has shown a mild benefit at best, she said, while two studies show promise for tocilizumab (Actemra). As for TAK, she said doctors often turn to the use of immunosuppressants and tumor necrosis factor inhibitors, although their use is based on retrospective studies and small, open-label trials.
Dr. Langford and her colleagues launched the two randomized, double-blind, placebo-controlled, multicenter studies in parallel with the same protocols.
In the GCA trial (doi: 10.1002/art.40044), researchers enrolled 49 patients with newly diagnosed GCA or disease that had relapsed within the 2 prior months to prednisone 40-60 mg/day followed by a standardized tapering schedule plus abatacept 10 mg/kg IV on days 1, 15, 29, and week 8. At 12 weeks, 8 patients had withdrawn, relapsed, or were not in remission, and so 41 were randomized to receive placebo or monthly abatacept until they met criteria for early termination or 12 months had passed after the last patient was enrolled. At the time of the randomization at 12 weeks, all patients were taking prednisone 20 mg/day, which was tapered until discontinuation at week 28.
At 12 months, 48% of those who took abatacept survived without relapse, compared with 31% of those who took placebo (P = .049), and the median remission period was longer for abatacept (9.9 months) than placebo (3.9 months; P = .023).
“This difference between groups is clinically meaningful to patients with GCA, corresponding to a prolonged duration of remission during which time they are not exposed to glucocorticoids and their potential toxicities that can impact quality of life,” Dr. Langford said.
No patients died during the trial, and 23 serious adverse events were reported in 15 patients. The frequency and severity of adverse events and infections didn’t differ between the treatment and placebo groups.
The drug may work in GCA patients by blocking T-cell activation, Dr. Langford said. Physicians could consider the drug in clinical practice, she said, although more research is needed to understand the long-term effects of using the medication.
In the other study (doi: 10.1002/art.40037), researchers used the same protocol to treat 34 patients with TAK; 26 reached the 12-week midpoint and were randomized to placebo or continuing abatacept on a monthly basis.
At 12 months, the relapse-free rate was 22% for the abatacept group and 40% for the placebo group (P = .853). The median duration of remission was similar for the groups at 5.5 months for abatacept and 5.7 months for placebo (P = .125).
The researchers reported no difference in frequency or severity of adverse events such as infection.
Based on the study results, Dr. Langford said abatacept is not appropriate in clinical practice to treat TAK.
The National Institute of Arthritis and Musculoskeletal and Skin Diseases funded the studies, and Bristol-Myers Squibb, which markets abatacept, provided the drug. Dr. Langford disclosed receiving research grants from Bristol-Myers Squibb, Genentech, and GlaxoSmithKline.
A pair of new studies offer mixed results regarding the use of the rheumatoid arthritis drug abatacept to treat two forms of large-vessel vasculitis: It appears to help patients with giant cell arteritis but not those with the rarer Takayasu’s arteritis.
“The results from the GCA [giant cell arteritis] study found that treatment with abatacept [Orencia] combined with prednisone resulted in a lower rate of relapse than treatment with prednisone alone,” said Carol A. Langford, MD, lead author of both studies, which were conducted by the Vasculitis Clinical Research Consortium. She is chair in rheumatic and immunologic diseases and director of the Center for Vasculitis Care and Research at the Cleveland Clinic.
Both studies appear online Jan. 30 in Arthritis & Rheumatology.
“GCA is the most common form of vasculitis with an estimated incidence of 19.8 per 100,000,” she said. “It occurs in people over the age of 50 with the average age of onset in the 70s.” Women are most affected by a 2:1 ratio.
She said the disease affects the cranium (causing headaches, scalp tenderness, and a risk of blindness) and causes signs of systemic inflammation.
“Almost one-third of patients with GCA can have large vessel involvement that specifically include thoracic aortic aneurysms and stenosis of the cervical and subclavian arteries,” she said. Fatal thoracic aneurysms are possible, she said, but “studies have shown that in GCA overall, while short-term mortality may be increased, long-term survival is similar to the age-matched general population.”
TAK is much rarer, she said, affecting 3-9 people per 1,000,000. “TAK has an average age of onset in the 20s with an even stronger female predisposition of up to 9:1.”
The condition affects the aorta, its main branches, and pulmonary arteries, she said, “Some of the more frequent vascular symptoms/signs can include extremity claudication, hypertension, chest pain, and features associated with cerebral hypoperfusion. TAK is associated with substantial morbidity which is influenced by a low rate of sustained remission in 28%-50% of patients. Up to 47% of patients experience permanent disability, which has a significant impact on this young population.”
The mortality from TAK is unclear, she said.
Glucocorticoids are the main treatment for both GCA and TAK, Dr. Langford said, but “while glucocorticoids effectively control disease, they do not prevent relapse and they are associated with significant toxicity.”
For GCA, methotrexate has shown a mild benefit at best, she said, while two studies show promise for tocilizumab (Actemra). As for TAK, she said doctors often turn to the use of immunosuppressants and tumor necrosis factor inhibitors, although their use is based on retrospective studies and small, open-label trials.
Dr. Langford and her colleagues launched the two randomized, double-blind, placebo-controlled, multicenter studies in parallel with the same protocols.
In the GCA trial (doi: 10.1002/art.40044), researchers enrolled 49 patients with newly diagnosed GCA or disease that had relapsed within the 2 prior months to prednisone 40-60 mg/day followed by a standardized tapering schedule plus abatacept 10 mg/kg IV on days 1, 15, 29, and week 8. At 12 weeks, 8 patients had withdrawn, relapsed, or were not in remission, and so 41 were randomized to receive placebo or monthly abatacept until they met criteria for early termination or 12 months had passed after the last patient was enrolled. At the time of the randomization at 12 weeks, all patients were taking prednisone 20 mg/day, which was tapered until discontinuation at week 28.
At 12 months, 48% of those who took abatacept survived without relapse, compared with 31% of those who took placebo (P = .049), and the median remission period was longer for abatacept (9.9 months) than placebo (3.9 months; P = .023).
“This difference between groups is clinically meaningful to patients with GCA, corresponding to a prolonged duration of remission during which time they are not exposed to glucocorticoids and their potential toxicities that can impact quality of life,” Dr. Langford said.
No patients died during the trial, and 23 serious adverse events were reported in 15 patients. The frequency and severity of adverse events and infections didn’t differ between the treatment and placebo groups.
The drug may work in GCA patients by blocking T-cell activation, Dr. Langford said. Physicians could consider the drug in clinical practice, she said, although more research is needed to understand the long-term effects of using the medication.
In the other study (doi: 10.1002/art.40037), researchers used the same protocol to treat 34 patients with TAK; 26 reached the 12-week midpoint and were randomized to placebo or continuing abatacept on a monthly basis.
At 12 months, the relapse-free rate was 22% for the abatacept group and 40% for the placebo group (P = .853). The median duration of remission was similar for the groups at 5.5 months for abatacept and 5.7 months for placebo (P = .125).
The researchers reported no difference in frequency or severity of adverse events such as infection.
Based on the study results, Dr. Langford said abatacept is not appropriate in clinical practice to treat TAK.
The National Institute of Arthritis and Musculoskeletal and Skin Diseases funded the studies, and Bristol-Myers Squibb, which markets abatacept, provided the drug. Dr. Langford disclosed receiving research grants from Bristol-Myers Squibb, Genentech, and GlaxoSmithKline.
FROM ARTHRITIS & RHEUMATOLOGY
Key clinical point:
Major finding: At 12 months, 48% of GCA patients who took abatacept survived without relapse, compared with 31% of those who took placebo (P = .049), and the median remission period was longer for abatacept (9.9 months) than placebo (3.9 months; P = .023) For TAK patients, the relapse-free rates were 22% for the abatacept group and 40% for the placebo group (P = .853). The median duration of remission was similar for the groups at 5.5 months for abatacept and 5.7 months for placebo (P = .125).
Data source: Two randomized, double-blinded, placebo-controlled, multicenter trials with identical protocols of prednisone plus abatacept 10 mg/kg IV on days 1, 15, 29, and week 8, then randomization to placebo or monthly abatacept until patients met criteria for early termination or 12 months passed after the last patient was enrolled.
Disclosures: The National Institute of Arthritis and Musculoskeletal and Skin Diseases funded the studies, and Bristol-Myers Squibb, which markets abatacept, provided the drug. Dr. Langford disclosed receiving research grants from Bristol-Myers Squibb, Genentech, and GlaxoSmithKline.
Women’s Preventive Services Initiative Guidelines provide consensus for practicing ObGyns
The Patient Protection and Affordable Care Act of 2010 (ACA) intended that women have access to critical preventive health services without a copay or deductible. The Institute of Medicine (IOM) was asked to help identify those critical preventive women’s health services. In 2011, the IOM Committee on Preventive Services for Women recommended that all women have access to 9 preventive services, among them1:
- screening for gestational diabetes mellitus (GDM)
- human papilloma virus testing
- contraceptive methods and counseling
- well-woman visits.
The Health Resources and Services Administration (HRSA) of the US Department of Health and Human Services agreed to update the recommended preventive services every 5 years.
In March 2016, HRSA entered into a 5-year cooperative agreement with the American College of Obstetricians and Gynecologists (ACOG) to update the guidelines and to develop additional recommendations to enhance women’s health.2 ACOG launched the Women’s Preventive Services Initiative (WPSI) to develop the 2016 update.
The 5-year grant with HRSA will address many more preventive health services for women across their lifespan as well as implementation strategies so that women receive consistent and appropriate care, regardless of the health care provider’s specialty. The WPSI recognizes that the selection of a provider for well-woman care will be determined as much by a woman’s needs and preferences as by her access to health care services and health plan availability.
The WPSI draft recommendations were released for public comment in September 2016,2 and HRSA approved the recommendations in December 2016.3 In this editorial, I provide a look at which organizations comprise the WPSI and a summary of the 9 recommended preventive health services.
Who makes up the Women’s Preventive Services Initiative?
The WPSI is a collaboration between professional societies and consumer organizations. The goal of the WPSI is “to promote health over the course of a woman’s lifetime through disease prevention and preventive healthcare.” The WPSI advisory panel provides oversight to the effort and the multidisciplinary steering committee develops the recommendations. The WPSI advisory panel includes leaders and experts from 4 major professional organizations, whose members provide the majority of women’s health care in the United States:
- ACOG
- American College of Physicians (ACP)
- American Academy of Family Physicians (AAFP)
- National Association of Nurse Practitioners in Women’s Health (NPWH).
The multidisciplinary steering committee includes the members of the advisory panel, representatives from 17 professional and consumer organizations, a patient representative, and representatives from 6 federal agencies. The WPSI is currently chaired by Jeanne Conry, MD, PhD, past president of ACOG. The steering committee used evidence-based best practices to develop the guidelines and relied heavily on the foundation provided by the 2011 IOM report.1
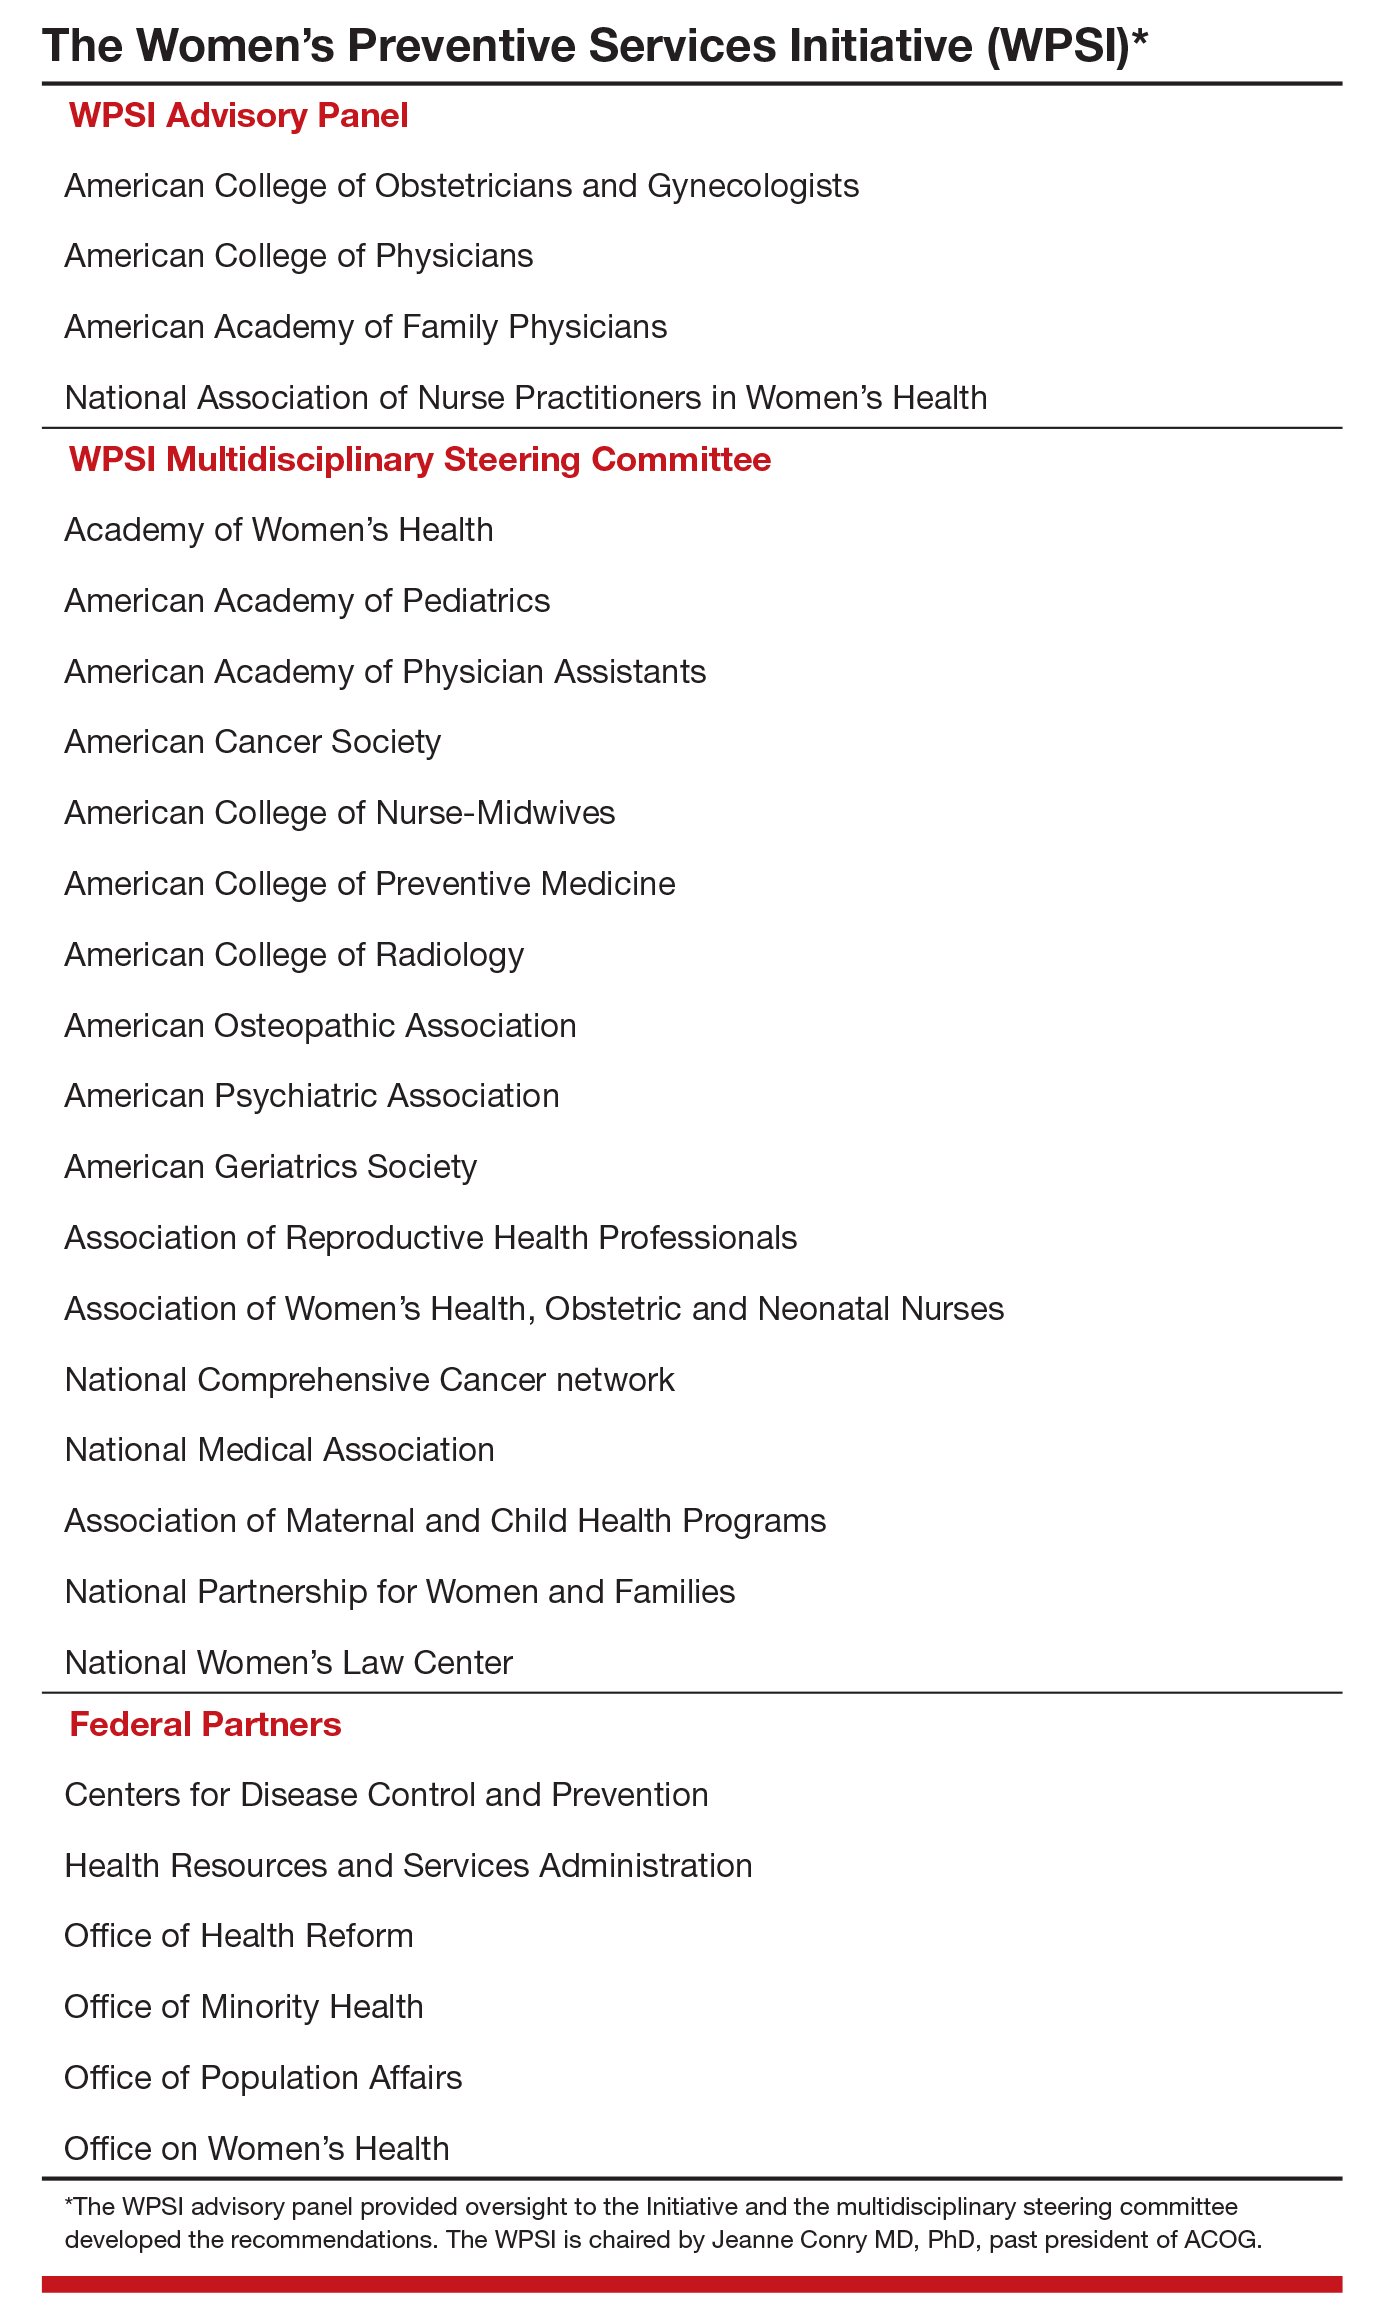
The 9 WPSI recommendations
Much of the text below is directly quoted from the final recommendations. When a recommendation is paraphrased it is not placed in quotations.
Recommendation 1: Breast cancer screening for average-risk women
“Average-risk women should initiate mammography screening for breast cancer no earlier than age 40 and no later than age 50 years. Screeningmammography should occur at least biennially and as frequently as annually. Screening should continue through at least age 74 years and age alone should not be the basis to stop screening.”
Decisions about when to initiate screening for women between 40 and 50 years of age, how often to screen, and when to stop screening should be based on shared decision making involving the woman and her clinician.
Recommendation 2: Breastfeeding services and supplies
Women should be provided “comprehensive lactation support services including counseling, education and breast feeding equipment and supplies during the antenatal, perinatal, and postpartum periods.” These services will support the successful initiation and maintenance of breastfeeding. Women should have access to double electric breast pumps.
Recommendation 3: Screening for cervical cancer
Average-risk women should initiate cervical cancer screening with cervical cytology at age 21 years and have cervical cytology testing every 3 years from 21 to 29 years of age. “Cotesting with cytology and human papillomavirus (HPV) testing is not recommended for women younger than 30 years. Women aged 30 to 65 years should be screened with cytology and HPV testing every 5 years or cytology alone every 3 years.” Women who have received the HPV vaccine should be screened using these guidelines. Cervical cancer screening is not recommended for women younger than 21 years or older than 65 years who have had adequate prior screening and are not at high risk for cervical cancer. Cervical cancer screening is also not recommended for women who have had a hysterectomy with removal of the cervix and no personal history of cervical intraepithelial neoplasia grade 2 or 3 within the past 20 years.
Recommendation 4: Contraception
Adolescent and adult women should have access to the full range of US Food and Drug Administration–approved female-controlled contraceptives to prevent unintended pregnancy and improve birth outcomes. Multiple visits with a clinician may be needed to select an optimal contraceptive.
Recommendation 5: Screening for gestational diabetes mellitus
Pregnant women should be screened for GDM between 24 and 28 weeks’ gestation to prevent adverse birth outcomes. Screening should be performed with a “50 gm oral glucose challenge test followed by a 3-hour 100 gm oral glucose tolerance test” if the results on the initial oral glucose tolerance test are abnormal. This testing sequence has high sensitivity and specificity. Women with risk factors for diabetes mellitus should be screened for diabetes at the first prenatal visit using current best clinical practice.
Recommendation 6: Screening for human immunodeficiency virus (HIV) infection
Adolescents and women should receive education and risk assessment for HIV annually and should be tested for HIV at least once during their lifetime. Based on assessed risk, screening annually may be appropriate. “Screening for HIV is recommended for all pregnant women upon initiation of prenatal care with retesting during pregnancy based on risk factors. Rapid HIV testing is recommended for pregnant women who present in active labor with an undocumented HIV status.” Risk-based screening does not identify approximately 20% of HIV-infected people. Hence screening annually may be reasonable.
Recommendation 7: Screening for interpersonal and domestic violence
All adolescents and women should be screened annually for both interpersonal violence (IPV) and domestic violence (DV). Intervention services should be available to all adolescents and women. IPV and DV are prevalent problems, and they are often undetected by clinicians. Hence annual screening is recommended.
Recommendation 8: Counseling for sexually transmitted infections
Adolescents and women should be assessed for sexually transmittedinfection (STI) risk. Risk factors include:
- “age younger than 25 years,
- a recent STI,
- a new sex partner,
- multiple partners,
- a partner with concurrent partners,
- a partner with an STI, and
- a lack of or inconsistent condom use.”
Women at increased risk for an STI should receive behavioral counseling.
Recommendation 9: Well-woman preventive visits
Women should “receive at least one preventive care visit per year beginning in adolescence and continuing across the lifespan to ensure that the recommended preventive services including preconception and many services necessary for prenatal and interconception care are obtained. The primary purpose of these visits is the delivery and coordination of recommended preventive services as determined by age and risk factors.”
- Abridged guidelines for the Women's Preventive Services Initiative can be found here: http://www.womenspreventivehealth.org/wp-content/uploads/2017/01/WPSI_2016AbridgedReport.pdf.
- Evidence-based summaries and appendices are available at this link: http://www.womenspreventivehealth.org/wp-content/uploads/2016/12/Evidence-Summaries-and-Appendices.pdf.
I plan on using these recommendations to guide my practice
Historically, many high-profile expert professional groups have developed their own women’s health services guidelines. The proliferation of conflicting guidelines confused both patients and clinicians. Dueling guidelines likely undermine public health because they result in confusion among patients and inconsistent care across the many disciplines that provide medical services to women.
The proliferation of conflicting guidelines for mammography screening for breast cancer is a good example of how dueling guidelines can undermine public health (TABLE).4−7 The WPSI has done a great service to women and clinicians by creating a shared framework for consistently providing critical services across a woman’s entire life. I plan on using these recommendations to guide my practice. Patients and clinicians will greatly benefit from the exceptionally thoughtful women’s preventive services guidelines provided by the WPSI.
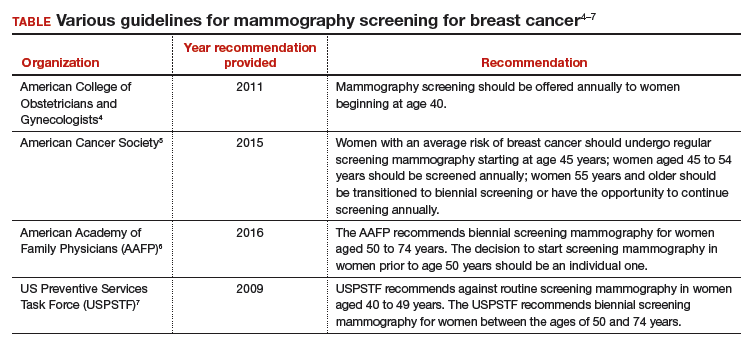
Share your thoughts! Send your Letter to the Editor to [email protected]. Please include your name and the city and state in which you practice.
- Institute of Medicine. Clinical preventive services for women: closing the gaps. Washington DC: The National Academies Press; 2011. http://nap.edu/13181. Accessed January 16, 2017.
- American Congress of Obstetricians and Gynecologists (ACOG). Women's Preventive Services Initiative (WPSI). http://www.acog.org/About-ACOG/ACOG-Departments/Annual-Womens-Health-Care/Womens-Preventive-Services-Initiative. Accessed January 16, 2017.
- Health Resources and Services Administration website. Women's preventive services guidelines. https://www.hrsa.gov/womensguidelines/. Accessed January 16, 2017.
- American College of Obstetricians and Gynecologists. Practice bulletin no. 122: breast cancer screening. Obstet Gynecol. 2011;118(2 pt 1):372-382.
- Oeffinger KC, Fontham ET, Etzioni R, et al. Breast cancer screening for women at average risk: 2015 guideline update from the American Cancer Society. JAMA. 2015;314(15):1599-1614.
- American Academy of Family Physicians website. Clinical preventive service recommendation: breast cancer. http://www.aafp.org/patient-care/clinical-recommendations/all/breast-cancer.html. Accessed January 16, 2017.
- US Preventive Services Task Force. Screening for breast cancer: U.S. Preventive Services Task Force recommendation statement. Ann Intern Med. 2009;151(10):716-726.

Dr. Barbieri is Editor in Chief, OBG Management; Chair, Obstetrics and Gynecology, Brigham and Women’s Hospital; and Kate Macy Ladd Professor of Obstetrics, Gynecology, and Reproductive Biology, Harvard Medical School, Boston, Massachusetts.
Dr. Barbieri reports no financial relationships relevant to this article.
The Patient Protection and Affordable Care Act of 2010 (ACA) intended that women have access to critical preventive health services without a copay or deductible. The Institute of Medicine (IOM) was asked to help identify those critical preventive women’s health services. In 2011, the IOM Committee on Preventive Services for Women recommended that all women have access to 9 preventive services, among them1:
- screening for gestational diabetes mellitus (GDM)
- human papilloma virus testing
- contraceptive methods and counseling
- well-woman visits.
The Health Resources and Services Administration (HRSA) of the US Department of Health and Human Services agreed to update the recommended preventive services every 5 years.
In March 2016, HRSA entered into a 5-year cooperative agreement with the American College of Obstetricians and Gynecologists (ACOG) to update the guidelines and to develop additional recommendations to enhance women’s health.2 ACOG launched the Women’s Preventive Services Initiative (WPSI) to develop the 2016 update.
The 5-year grant with HRSA will address many more preventive health services for women across their lifespan as well as implementation strategies so that women receive consistent and appropriate care, regardless of the health care provider’s specialty. The WPSI recognizes that the selection of a provider for well-woman care will be determined as much by a woman’s needs and preferences as by her access to health care services and health plan availability.
The WPSI draft recommendations were released for public comment in September 2016,2 and HRSA approved the recommendations in December 2016.3 In this editorial, I provide a look at which organizations comprise the WPSI and a summary of the 9 recommended preventive health services.
Who makes up the Women’s Preventive Services Initiative?
The WPSI is a collaboration between professional societies and consumer organizations. The goal of the WPSI is “to promote health over the course of a woman’s lifetime through disease prevention and preventive healthcare.” The WPSI advisory panel provides oversight to the effort and the multidisciplinary steering committee develops the recommendations. The WPSI advisory panel includes leaders and experts from 4 major professional organizations, whose members provide the majority of women’s health care in the United States:
- ACOG
- American College of Physicians (ACP)
- American Academy of Family Physicians (AAFP)
- National Association of Nurse Practitioners in Women’s Health (NPWH).
The multidisciplinary steering committee includes the members of the advisory panel, representatives from 17 professional and consumer organizations, a patient representative, and representatives from 6 federal agencies. The WPSI is currently chaired by Jeanne Conry, MD, PhD, past president of ACOG. The steering committee used evidence-based best practices to develop the guidelines and relied heavily on the foundation provided by the 2011 IOM report.1
The 9 WPSI recommendations
Much of the text below is directly quoted from the final recommendations. When a recommendation is paraphrased it is not placed in quotations.
Recommendation 1: Breast cancer screening for average-risk women
“Average-risk women should initiate mammography screening for breast cancer no earlier than age 40 and no later than age 50 years. Screeningmammography should occur at least biennially and as frequently as annually. Screening should continue through at least age 74 years and age alone should not be the basis to stop screening.”
Decisions about when to initiate screening for women between 40 and 50 years of age, how often to screen, and when to stop screening should be based on shared decision making involving the woman and her clinician.
Recommendation 2: Breastfeeding services and supplies
Women should be provided “comprehensive lactation support services including counseling, education and breast feeding equipment and supplies during the antenatal, perinatal, and postpartum periods.” These services will support the successful initiation and maintenance of breastfeeding. Women should have access to double electric breast pumps.
Recommendation 3: Screening for cervical cancer
Average-risk women should initiate cervical cancer screening with cervical cytology at age 21 years and have cervical cytology testing every 3 years from 21 to 29 years of age. “Cotesting with cytology and human papillomavirus (HPV) testing is not recommended for women younger than 30 years. Women aged 30 to 65 years should be screened with cytology and HPV testing every 5 years or cytology alone every 3 years.” Women who have received the HPV vaccine should be screened using these guidelines. Cervical cancer screening is not recommended for women younger than 21 years or older than 65 years who have had adequate prior screening and are not at high risk for cervical cancer. Cervical cancer screening is also not recommended for women who have had a hysterectomy with removal of the cervix and no personal history of cervical intraepithelial neoplasia grade 2 or 3 within the past 20 years.
Recommendation 4: Contraception
Adolescent and adult women should have access to the full range of US Food and Drug Administration–approved female-controlled contraceptives to prevent unintended pregnancy and improve birth outcomes. Multiple visits with a clinician may be needed to select an optimal contraceptive.
Recommendation 5: Screening for gestational diabetes mellitus
Pregnant women should be screened for GDM between 24 and 28 weeks’ gestation to prevent adverse birth outcomes. Screening should be performed with a “50 gm oral glucose challenge test followed by a 3-hour 100 gm oral glucose tolerance test” if the results on the initial oral glucose tolerance test are abnormal. This testing sequence has high sensitivity and specificity. Women with risk factors for diabetes mellitus should be screened for diabetes at the first prenatal visit using current best clinical practice.
Recommendation 6: Screening for human immunodeficiency virus (HIV) infection
Adolescents and women should receive education and risk assessment for HIV annually and should be tested for HIV at least once during their lifetime. Based on assessed risk, screening annually may be appropriate. “Screening for HIV is recommended for all pregnant women upon initiation of prenatal care with retesting during pregnancy based on risk factors. Rapid HIV testing is recommended for pregnant women who present in active labor with an undocumented HIV status.” Risk-based screening does not identify approximately 20% of HIV-infected people. Hence screening annually may be reasonable.
Recommendation 7: Screening for interpersonal and domestic violence
All adolescents and women should be screened annually for both interpersonal violence (IPV) and domestic violence (DV). Intervention services should be available to all adolescents and women. IPV and DV are prevalent problems, and they are often undetected by clinicians. Hence annual screening is recommended.
Recommendation 8: Counseling for sexually transmitted infections
Adolescents and women should be assessed for sexually transmittedinfection (STI) risk. Risk factors include:
- “age younger than 25 years,
- a recent STI,
- a new sex partner,
- multiple partners,
- a partner with concurrent partners,
- a partner with an STI, and
- a lack of or inconsistent condom use.”
Women at increased risk for an STI should receive behavioral counseling.
Recommendation 9: Well-woman preventive visits
Women should “receive at least one preventive care visit per year beginning in adolescence and continuing across the lifespan to ensure that the recommended preventive services including preconception and many services necessary for prenatal and interconception care are obtained. The primary purpose of these visits is the delivery and coordination of recommended preventive services as determined by age and risk factors.”
- Abridged guidelines for the Women's Preventive Services Initiative can be found here: http://www.womenspreventivehealth.org/wp-content/uploads/2017/01/WPSI_2016AbridgedReport.pdf.
- Evidence-based summaries and appendices are available at this link: http://www.womenspreventivehealth.org/wp-content/uploads/2016/12/Evidence-Summaries-and-Appendices.pdf.
I plan on using these recommendations to guide my practice
Historically, many high-profile expert professional groups have developed their own women’s health services guidelines. The proliferation of conflicting guidelines confused both patients and clinicians. Dueling guidelines likely undermine public health because they result in confusion among patients and inconsistent care across the many disciplines that provide medical services to women.
The proliferation of conflicting guidelines for mammography screening for breast cancer is a good example of how dueling guidelines can undermine public health (TABLE).4−7 The WPSI has done a great service to women and clinicians by creating a shared framework for consistently providing critical services across a woman’s entire life. I plan on using these recommendations to guide my practice. Patients and clinicians will greatly benefit from the exceptionally thoughtful women’s preventive services guidelines provided by the WPSI.
Share your thoughts! Send your Letter to the Editor to [email protected]. Please include your name and the city and state in which you practice.
- Institute of Medicine. Clinical preventive services for women: closing the gaps. Washington DC: The National Academies Press; 2011. http://nap.edu/13181. Accessed January 16, 2017.
- American Congress of Obstetricians and Gynecologists (ACOG). Women's Preventive Services Initiative (WPSI). http://www.acog.org/About-ACOG/ACOG-Departments/Annual-Womens-Health-Care/Womens-Preventive-Services-Initiative. Accessed January 16, 2017.
- Health Resources and Services Administration website. Women's preventive services guidelines. https://www.hrsa.gov/womensguidelines/. Accessed January 16, 2017.
- American College of Obstetricians and Gynecologists. Practice bulletin no. 122: breast cancer screening. Obstet Gynecol. 2011;118(2 pt 1):372-382.
- Oeffinger KC, Fontham ET, Etzioni R, et al. Breast cancer screening for women at average risk: 2015 guideline update from the American Cancer Society. JAMA. 2015;314(15):1599-1614.
- American Academy of Family Physicians website. Clinical preventive service recommendation: breast cancer. http://www.aafp.org/patient-care/clinical-recommendations/all/breast-cancer.html. Accessed January 16, 2017.
- US Preventive Services Task Force. Screening for breast cancer: U.S. Preventive Services Task Force recommendation statement. Ann Intern Med. 2009;151(10):716-726.

Letters to the Editor: Your patients are talking: Isn’t it time you take responsibility for your online reputation?
“YOUR PATIENTS ARE TALKING: ISN’T IT TIME YOU TAKE RESPONSIBILITY FOR YOUR ONLINE REPUTATION?”
RON ROMANO AND NEIL H. BAUM, MD (NOVEMBER 2016)
Eschews meaningless Internet obfuscation
As a practicing physician I don’t have time for social media and its accompanying advertising rationale; it’s a wasteland that replaces television. My patients and I go one-on-one, eye-to-eye, and eschew meaningless Internet obfuscation. Don’t we have better things to do with our physician/patient relationship than check online reviews?
Warren Kendall, MD
Grants Pass, Oregon
Share your thoughts! Send your Letter to the Editor to [email protected]. Please include your name and the city and state in which you practice.

Letters to the Editor: Should we change instruments and gloves after closing the uterus?
“PREVENTING INFECTION AFTER CESAREAN DELIVERY: 5 MORE EVIDENCE-BASED MEASURES TO CONSIDER”
KATHRYN E. PATRICK, MD; SARA L. DEATSMAN, MD; AND PATRICK DUFF, MD (DECEMEBER 2016)
Should we change instruments and gloves after closing the uterus?
In reference to the recent article series on preventing infection after cesarean delivery by Drs. Patrick, Deatsman, and Duff, what are the thoughts on using clean instruments and changing gloves after closing the uterus?
Gerrit J. Schipper, MD
Frederick, Maryland
❯❯ Drs. Patrick, Deatsman, and Duff respond:
We appreciate Dr. Schipper’s thoughtful question concerning our recent articles. At present, we are not aware of any rigorous studies that have evaluated the possible protective effect of changing to a different set of surgical instruments after closure of the uterus.
The second part of the question concerning the effect of changing gloves at a certain point in the operation is more intriguing. In an earlier report from our institution, we showed that the dominant hand of the operator becomes heavily contaminated with bacteria during the process of extracting the fetal head from the lower uterine segment.1 The contamination is particularly heavy when the patient has had an extended duration of labor in the presence of ruptured membranes. In a subsequent investigation, we showed that avoidance of manual extraction of the placenta, a process in which the now-contaminated glove of the operator is placed between the placenta and the uterine wall, significantly reduced the frequency of postcesarean endometritis even in patients who already were receiving systemic antibiotic prophylaxis.2 Whether changing gloves after delivery of the baby will further decrease the frequency of postcesarean endometritis, beyond that which can be achieved with systemic antibiotic prophylaxis combined with delivery of the placenta by traction on the cord, has not been studied in a systematic manner.
Given the low frequency of infection that can be achieved with these 2 methods, it would require a very large sample size to show that glove change offered an additional protective effect. Nevertheless, on a practical basis, we think it is very reasonable to change the glove on the dominant hand following a difficult extraction of the presenting part in a patient who has had an extended duration of labor and ruptured membranes. The glove change is particularly important if manual extraction of the placenta is contemplated.
Of note, we would like to acknowledge that the US Food and Drug Administration finalized a ban on the use of powdered surgical gloves effective January 18, 2017.3 The aerosolized glove powder on latex gloves contains proteins that can provoke severe respiratory allergic reactions in patients who are sensitive to latex. Even powdered synthetic gloves can cause airway inflammation, wound inflammation, and postoperative adhesions.
“DOES ONE PARTICULAR CESAREAN TECHNIQUE CONFER BETTER MATERNAL AND NEONATAL OUTCOMES?”
JOHN M. THORP JR, MD (EXAMINING THE EVIDENCE; NOVEMBER 2016)
Choosing a cesarean technique based on “evidence”
I appreciate the commentary by Dr. Thorp concerning cesarean delivery techniques. I have always thought that there was no difference in the outcomes of the various techniques. However, we will continue to waver to the peer pressure of this evidence-based stuff—until we find out later, like now—until things change again. “The more things change, the more they remain the same.”
Dr. Smart Ebinne
Port Harcourt, Nigeria
Share your thoughts! Send your Letter to the Editor to [email protected]. Please include your name and the city and state in which you practice.
- Yancey MK, Clark P, Duff P. The frequency of glove contamination during cesarean delivery. Obstet Gynecol. 1994;83(4):538–542.
- Lasley DS, Eblen A, Yancey MK, Duff P. The effect of placental removal method on the incidence of postcesarean infections. Am J Obstet Gynecol. 1997;176(6):1250–1254.
- US Food and Drug Administration. Banned devices; powdered surgeon’s gloves, powdered patient examination gloves, and absorbable powder for lubricating a surgeon’s glove. Final rule. Fed Regist. 2016;81(243):91722–91731.
“PREVENTING INFECTION AFTER CESAREAN DELIVERY: 5 MORE EVIDENCE-BASED MEASURES TO CONSIDER”
KATHRYN E. PATRICK, MD; SARA L. DEATSMAN, MD; AND PATRICK DUFF, MD (DECEMEBER 2016)
Should we change instruments and gloves after closing the uterus?
In reference to the recent article series on preventing infection after cesarean delivery by Drs. Patrick, Deatsman, and Duff, what are the thoughts on using clean instruments and changing gloves after closing the uterus?
Gerrit J. Schipper, MD
Frederick, Maryland
❯❯ Drs. Patrick, Deatsman, and Duff respond:
We appreciate Dr. Schipper’s thoughtful question concerning our recent articles. At present, we are not aware of any rigorous studies that have evaluated the possible protective effect of changing to a different set of surgical instruments after closure of the uterus.
The second part of the question concerning the effect of changing gloves at a certain point in the operation is more intriguing. In an earlier report from our institution, we showed that the dominant hand of the operator becomes heavily contaminated with bacteria during the process of extracting the fetal head from the lower uterine segment.1 The contamination is particularly heavy when the patient has had an extended duration of labor in the presence of ruptured membranes. In a subsequent investigation, we showed that avoidance of manual extraction of the placenta, a process in which the now-contaminated glove of the operator is placed between the placenta and the uterine wall, significantly reduced the frequency of postcesarean endometritis even in patients who already were receiving systemic antibiotic prophylaxis.2 Whether changing gloves after delivery of the baby will further decrease the frequency of postcesarean endometritis, beyond that which can be achieved with systemic antibiotic prophylaxis combined with delivery of the placenta by traction on the cord, has not been studied in a systematic manner.
Given the low frequency of infection that can be achieved with these 2 methods, it would require a very large sample size to show that glove change offered an additional protective effect. Nevertheless, on a practical basis, we think it is very reasonable to change the glove on the dominant hand following a difficult extraction of the presenting part in a patient who has had an extended duration of labor and ruptured membranes. The glove change is particularly important if manual extraction of the placenta is contemplated.
Of note, we would like to acknowledge that the US Food and Drug Administration finalized a ban on the use of powdered surgical gloves effective January 18, 2017.3 The aerosolized glove powder on latex gloves contains proteins that can provoke severe respiratory allergic reactions in patients who are sensitive to latex. Even powdered synthetic gloves can cause airway inflammation, wound inflammation, and postoperative adhesions.
“DOES ONE PARTICULAR CESAREAN TECHNIQUE CONFER BETTER MATERNAL AND NEONATAL OUTCOMES?”
JOHN M. THORP JR, MD (EXAMINING THE EVIDENCE; NOVEMBER 2016)
Choosing a cesarean technique based on “evidence”
I appreciate the commentary by Dr. Thorp concerning cesarean delivery techniques. I have always thought that there was no difference in the outcomes of the various techniques. However, we will continue to waver to the peer pressure of this evidence-based stuff—until we find out later, like now—until things change again. “The more things change, the more they remain the same.”
Dr. Smart Ebinne
Port Harcourt, Nigeria
Share your thoughts! Send your Letter to the Editor to [email protected]. Please include your name and the city and state in which you practice.
- Yancey MK, Clark P, Duff P. The frequency of glove contamination during cesarean delivery. Obstet Gynecol. 1994;83(4):538–542.
- Lasley DS, Eblen A, Yancey MK, Duff P. The effect of placental removal method on the incidence of postcesarean infections. Am J Obstet Gynecol. 1997;176(6):1250–1254.
- US Food and Drug Administration. Banned devices; powdered surgeon’s gloves, powdered patient examination gloves, and absorbable powder for lubricating a surgeon’s glove. Final rule. Fed Regist. 2016;81(243):91722–91731.
Disrupted placenta: Infant anemia
Disrupted placenta: Infant anemia
An Obgyn recommended an elective transverse low incision cesarean delivery at a prenatal visit. Due to severe weather, the ObGyn was unable to come to the hospital; an on-call ObGyn consulted with the ObGyn by phone. Cesarean delivery resulted in disruption of the placenta. When the infant’s blood gasses test results were abnormal, he was transferred to the neonatal intensive care unit, where anemia was diagnosed. The infant was hospitalized for 31 days.
PARENTS’ CLAIM:
The on-call ObGyn caused the child’s injury by performing a transverse low incision. A testifying radiology expert said that ultrasonography (US) taken 5 weeks before delivery showed an anterior low-lying placenta but a clear field existed that would have allowed a vertical incision without placental disruption.
PHYSICIAN’S DEFENSE:
The delivery was within the standard of care. The ObGyn did not have access to the US cited by the testifying radiologist; standard of care did not require that she have access to them. A transverse incision minimizes blood loss; a vertical incision would have disrupted a larger area of placenta. The infant had normal blood gasses at delivery; any injury was not related to placental disruption.
VERDICT:
A Virginia defense verdict was returned.
Child has spastic CP after long labor
A 17-year-old woman's baby was delivered using vacuum extraction after a prolonged labor. Two days after birth, US results revealed diffuse brain edema in the baby. Magnetic resonance imaging demonstrated an absence of brain parenchyma in the left and right hemispheres. The baby received a diagnosis of spastic cerebral palsy (CP). She has little voluntary movement and requires a feeding tube, a portable aspiration device, and in-home attendant care.
PARENT’S CLAIM:
The baby underwent a hypoxic ischemic event during labor. Four hospital physicians
DEFENDANTS’ DEFENSE:
The fetus did not have a fetal heart rate pattern that would have required an earlier delivery. The injury sustained by the baby was not compatible with a prolonged hypoxic event and was more likely caused by a genetic defect. The infant suffered a subacute brain injury at least 1 week before delivery.
VERDICT:
The hospital settled for $1.25 million. A California defense verdict was returned for the physicians.
Misdiagnosed ectopic pregnancy
After a home pregnancy test was positive, a 27-year-old woman reported vaginal spotting and cramping to her ObGyn. When no uterine contents showed on US, the ObGyn suspected an ectopic pregnancy and recommended termination of pregnancy. The woman requested another US; an appointment was scheduled for the next day. Instead of waiting, the woman went to an emergency department (ED) that night. Bloodwork confirmed the pregnancy but US results showed no evidence of an intrauterine pregnancy. The ED physician diagnosed an ectopic pregnancy. The on-call ObGyn concurred and recommended termination of pregnancy by surgical intervention or methotrexate. The patient chose methotrexate, which was administered, and she was discharged.
In the on-call ObGyn’s office a week later, the patient’s beta-hGC levels had not decreased. US revealed 2 intrauterine pregnancies, one with a heartbeat. The on-call ObGyn immediately referred the patient to a maternal-fetal medicine specialist. New US results showed evidence of an abnormal intrauterine pregnancy and a second gestational sac with no embryo. Two days later US showed a twin pregnancy: a 6-week fetal pole with no heartbeat and the other with no fetal pole or yolk sac. A dilation and curettage was performed.
PARENTS’ CLAIM:
The on-call ObGyn misdiagnosed an ectopic pregnancy, failed to order additional testing, and failed to observe the patient for 48 to 72 hours before administering methotrexate. This led to the loss of twins.
DEFENDANTS’ DEFENSE:
An ectopic pregnancy is an emergency that requires prompt diagnosis and treatment. There were sufficient signs for the on-call ObGyn to diagnose an ectopic pregnancy. She would have violated the standard of care if she had not administered treatment.
VERDICT:
The hospital settled for $127,000 before trial. An Illinois defense verdict was returned.
These cases were selected by the editors of OBG Management from Medical Malpractice Verdicts, Settlements & Experts, with permission of the editor, Lewis Laska (www.verdictslaska.com). The information available to the editors about the cases presented here is sometimes incomplete. Moreover, the cases may or may not have merit. Nevertheless, these cases represent the types of clinical situations that typically result in litigation and are meant to illustrate nationwide variation in jury verdicts and awards.
Share your thoughts! Send your Letter to the Editor to [email protected]. Please include your name and the city and state in which you practice.

Dementia Evaluation, Management, and Outreach
Dementia is a common, multifaceted problem with significant implications for function and quality of life among older individuals. Current demographic shifts are magnifying this problem. Particularly troubling are neuropsychiatric symptoms, which, in addition to creating caregiver distress, also are linked to functional decline, institutionalization, higher health care costs, and mortality (even after controlling for other potential confounders and severity of cognitive impairment). Furthermore, dementia is often unrecognized and underdiagnosed, and patients with dementia historically have poor access to care, particularly those living in rural areas.
The Geriatrics/Dementia Clinic at the Baltimore Veterans Affairs Medical Center (BVAMC) is a referral resource that provides extensive, multidisciplinary evaluations as well as coordinated subspecialist and interprofessional case review. A diverse group of clinicians (representing geriatrics, geriatric psychiatry, neuropsychology, clinical pharmacy, nursing, and social work) perform a half-day evaluation, followed by a meeting of the interdisciplinary team, and feedback session where patients and their families are given the results of the testing and diagnostic impressions as well as plans for further evaluation and treatment. Finally, in addition to the benefits it provides to veterans and their families, this clinic has proven to be an important resource for professional trainees.
Yet this model can be difficult to access, and those living in more remote regions had challenges availing themselves of this resource. Often, they would have to wake before dawn to drive 2 to 4 hours to the medical center. Furthermore, despite the many obvious benefits of this comprehensive approach, veterans and their families often left the clinic with a staggering amount of information and numerous recommendations for future care but without the assurance of integrated follow-up (a burden borne particularly by those living remotely).
The DEMO Program
In response to the dual challenges of access to and coordination of care, existing resources were leveraged with about $250,000 of VA T21 funds (adding both a full-time geriatric nurse practitioner and a psychology technician to the multidisciplinary team) to design and implement the novel DEMO (Dementia Evaluation, Management and Outreach) program. This program aimed to (1) extend dementia evaluations to regional community-based outpatient clinics (CBOCs) that serve veterans in outlying regions; and (2) improve the management and the follow-up that these veterans receive, with a focus on containing costs, while improving both the quality of and veterans’ (and their families’) satisfaction with health care.
Methods
Dementia evaluations were conducted by a geriatric nurse practitioner and psychology technician teamlet at the CBOCs. In addition to neuropsychological testing, medical records were reviewed, caregivers were interviewed, and the patients were examined. The data were then brought back to the full BVAMC Geriatrics/Dementia Clinic multidisciplinary team for discussion. The team reached a consensus diagnosis and then made a comprehensive plan for the further evaluation and management of these complex patients. The plan was entered into the Computerized Patient Record System and communicated to the patient and caregiver during a follow-up CBOC visit.
The teamlet frequently provided informal education during CBOC visits in addition to formal lectures given by experts from the BVAMC and the University of Maryland. The DEMO program was introduced to providers at the CBOCs by e-mail with follow-up information sessions provided on site.
Rather than having patients simply return to their CBOC primary care providers (PCPs) and exposing patients to the risks of poor communication/coordination of care, services were expanded to include regular phone follow-up calls with case management services that augmented those of their PCPs. The goal was to improve outcomes for these patients and provide alternatives to institutionalization.
Standardized instruments were used to gauge patient and caregiver satisfaction, obtain cost data from the VA and the Centers for Medicare & Medicaid Services, and medication data from the Pharmacy Benefits files.
The institutional review board provided approval to collect data on participants to assess the program’s clinical and economic impacts. Since all patients were suspected to have dementia, the informed consent procedures included additional protections. The patient’s understanding of the pertinent information related to participation in the study was assessed to help ensure that participants with dementia truly understood the conditions to which they were consenting. If the potential participant could not provide informed consent, it was obtained from a surrogate with durable power of attorney (the person recognized by Maryland law as the substitute decision maker or the veteran’s legal guardian). Consent was assessed on an ongoing basis regardless of the patient’s capacity to give informed consent, and those willing to have their data collected were enrolled in a “research” arm. These participants were compared with veterans in the dementia clinic during the enrollment period but who did not consent to participate in the research arm, controlling for sociodemographic characteristics and prior health care utilization.
Data Analysis
Patterns of health care utilization may fluctuate with time, and enrollment may identify potential problems that otherwise would not have been found. The authors looked at health care use over 6-month and 1-year intervals before and after enrollment, examining Occupational Physical Assessment Test (OPAT) data and fee-based outpatient data for both inpatient events (including nursing home utilization and hospitalization events) and outpatient visits (including primary, specialty and mental health care services; home care visits, and emergency department [ED]). The total cost incurred by outpatient visits and inpatient care was then adjusted to 2011 dollars. The relationship between program enrollment and health care use and costs was examined with a multivariate regression analyses, controlling for age and health care use in the prior year among veterans who were in the “consent” group or “nonconsent” group.
Outcome variables included the number of primary care, ED, specialty care, home health care, mental health care clinic, and inpatient visits; total inpatient bed days; and the total costs of all the events. The authors fit different multivariate models for these events according to their distributions. Specifically, the Poisson model was used if the distribution of the outcome variable was not overdispersed (eg, ED, primary care).
A negative binomial was used if the distribution of these events was overdispersed (eg, specialty care visits). Further, because the occurrence of inpatient events is relatively rare, a logit model was used to examine the relationship between enrollment status and probability of any inpatient events, regardless of the number of events. Generalized estimating equation (GEE) model with gamma distribution and log link function was used to examine the relationship between cost and program enrollment. The authors also examined the program’s effect on medication use, focusing on high-risk medications in older adults, comparing both the number of unique medications, as well as frequency such medications prescribed 1 year before and after the enrollment.1
Results
Two hundred ninety-eight (298) veterans were referred to DEMO from a 150-mile radius of Baltimore. Of these veterans, 132 consented to participate in this study. The study participants largely were representative of the total group as well as both the overall veteran population and the more general population of community-dwelling individuals with dementia (Table). 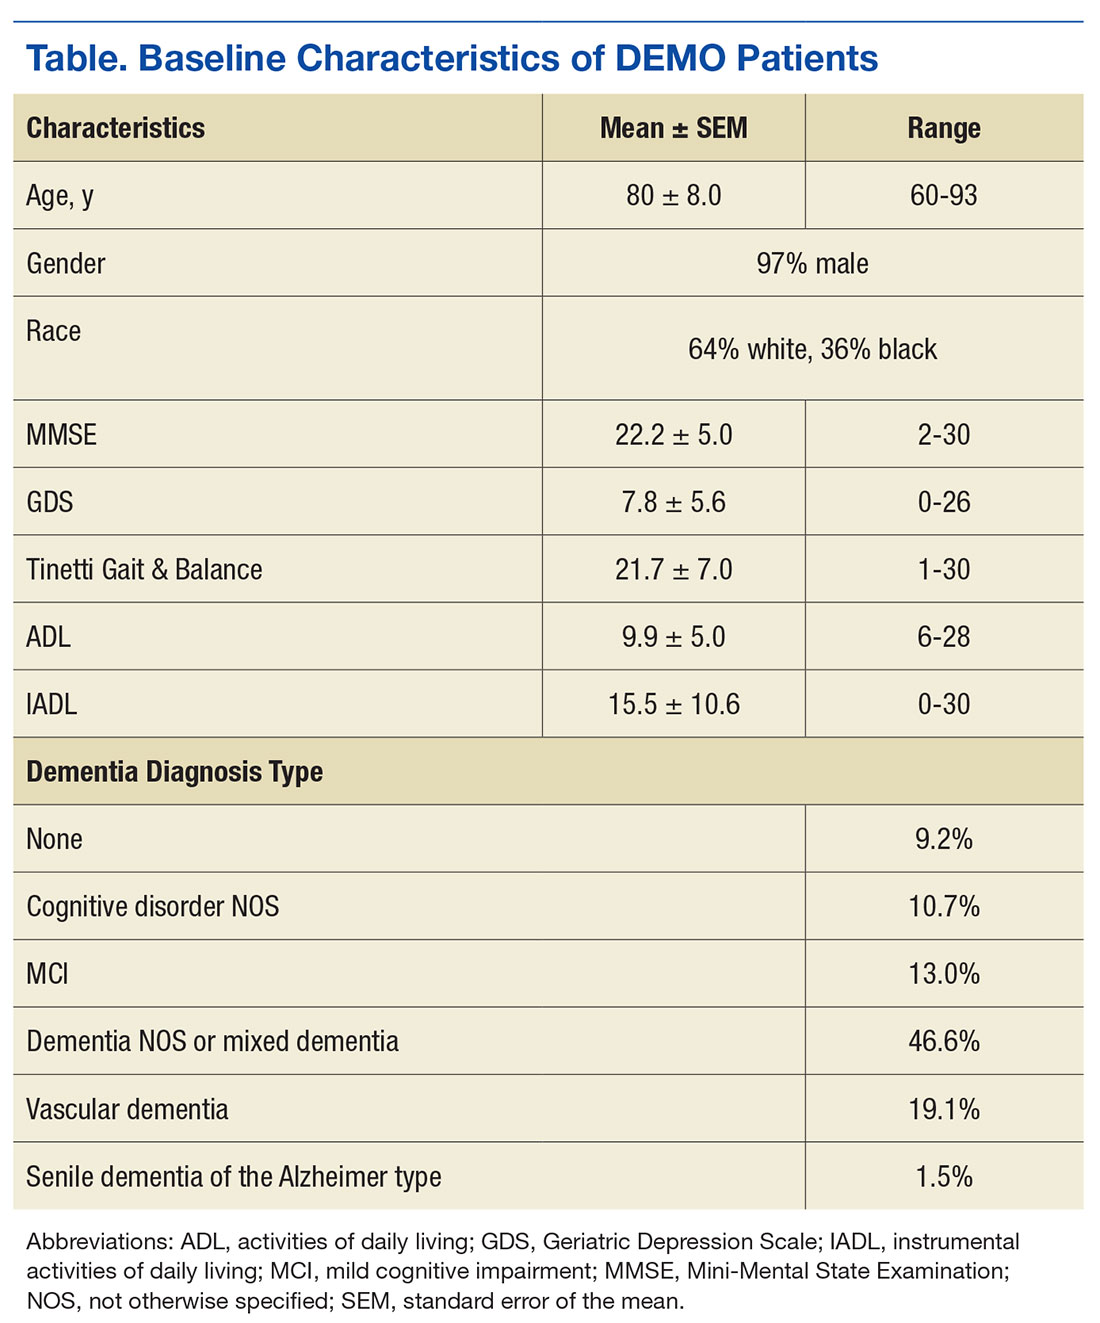
Veterans in the DEMO program largely had mild-to-moderate cognitive impairment with mean Mini-Mental State Examination (MMSE) score of 22 and significant functional limitations (Table). Only 3% displayed a pattern of “pure” dementia typical of Alzheimer disease, and 11% of those referred did not have significant abnormalities on neurocognitive testing.
The team averaged 10.3 recommendations (range 3-22), which focused on a diverse set of issues related to additional diagnostic and therapeutic concerns. Although screening data, including basic laboratory results and imaging, was requested in the referral form, in 71% of cases further diagnostic investigations were suggested. With regard to therapeutic suggestions, not surprisingly, medicines were cited as targets in a majority of cases (eg, discontinuing high-risk medications, initiating/titrating medications to minimize cardiovascular risk). While remaining mindful of the time to benefit and competing morbidities, measures to modify cardiovascular risk factors were suggested in more than half and treatment of depression in 15% of cases. Similarly, addressing poor sensory input was suggested in 38% of cases, with other common recommendations focusing on multiple environmental and social interventions (> 50%) as well as supports/outlets/respite for the caregivers.
The full multidisciplinary DEMO group met only weekly to review cases, and due to travel and scheduling difficulties, feedback to the patients and their families often was delayed for weeks. Although initial plans included regularly scheduled follow-up phone calls, demand quickly outstripped program resources. Nonetheless, chart reviews and abstracted adherence and utilization data revealed that PCPs successfully implemented 52% of recommendations within 2 weeks, rising to > 60% by 3 months. When patients were reevaluated at 1 year, they were remarkably stable: Mini–Mental State Examination (baseline 22.2 ± 5.0 → 22.3 ± 5.7 at follow-up) and Instrumental Activities of Daily Living scores (15.5 ± 10.6 → 17.7 ± 11.4).
Feedback
This program was enthusiastically received by both patients and their caregivers—100% and 98%, respectively—reporting overall satisfaction with the services received and 93% of caregivers indicating satisfaction with how the program met their needs. Caregivers were happy with the amount of time the provider took to answer questions (100% satisfied with the amount of time the DEMO provider spent and that they explained “what they wanted to know,” with 98% responding “good” or “great” for both), as well as with services and amount of help received (83% and 77% “very satisfied,” respectively).
In the survey, 98% of caregivers and patients felt that the program helped them deal more effectively with their problems, 97% would recommend the program to a friend in need of similar help, and 100% would come back if they were to seek help again. In keeping with DEMO’s initial aim of increasing access, there was favorable feedback on the ability to get in and be seen and convenience of location. In addition, referring providers universally expressed satisfaction with the referral process (referrals increased linearly); timeliness of scheduling; usefulness of the recommendations; and they planned on continuing to refer patients.
Although there was great variability, controlling for age and prior utilization, veterans in DEMO had statistically significant (all P < .05) fewer ED and specialty care visits and more mental health care clinic visits 183 to 365 daysafter referral dates compared with those in the nonconsented group. Veterans in the consented group also were less likely to use inpatient care than were veterans in the nonconsented group 183 to 365 days after referral dates. These trends were similarly reflected after controlling for age and prior utilization as well as when examining health care costs (data not shown). Nonetheless, DEMO did not seem to have any effect on overall inpatient bed days, primary/home-based care visits, or total costs. In fact, utilization of mental health care resources increased (Figures 1, 2, and 3).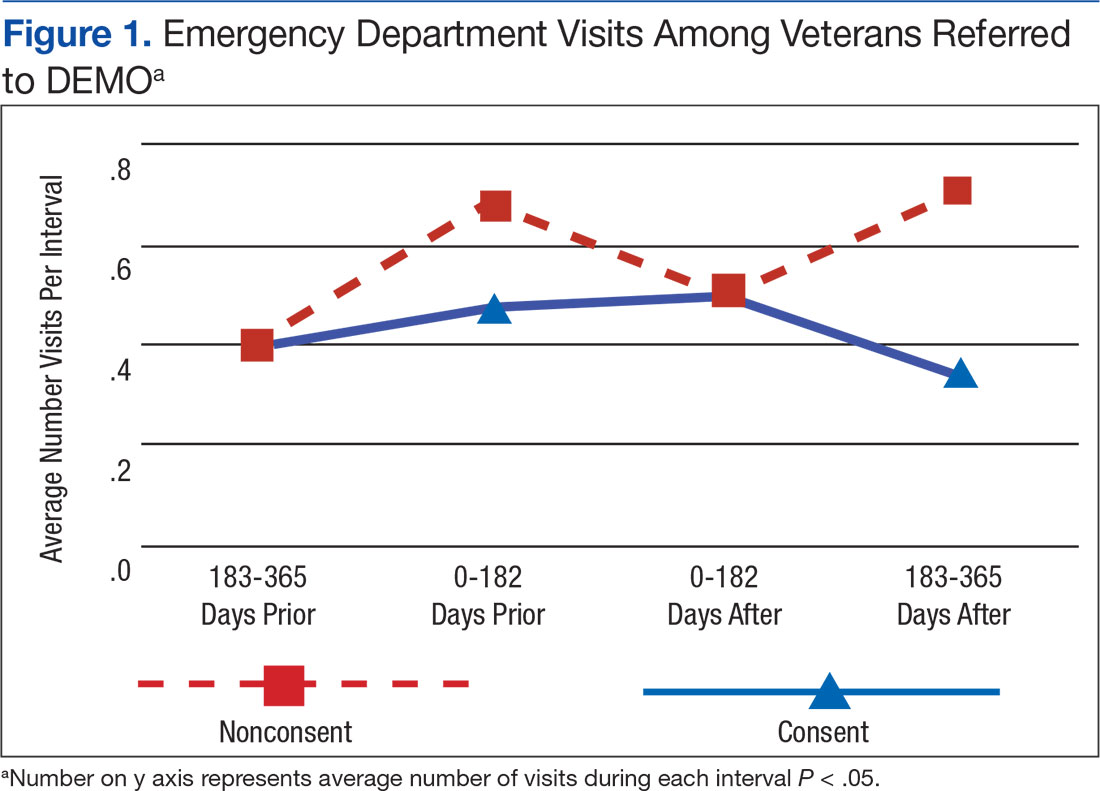
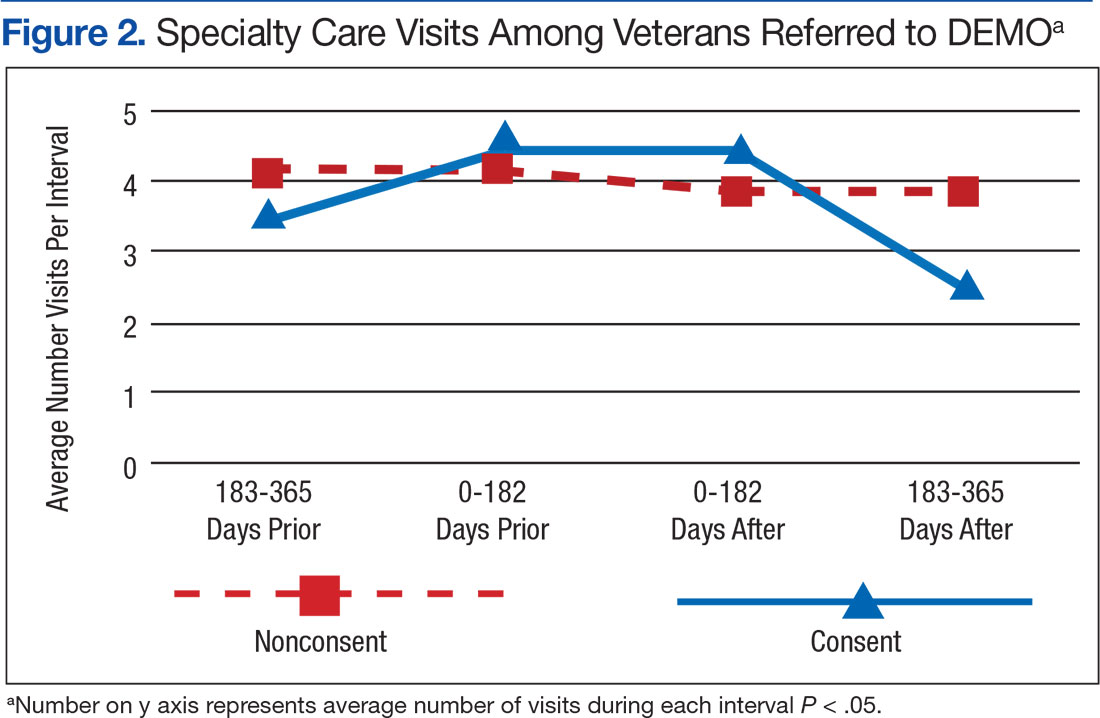
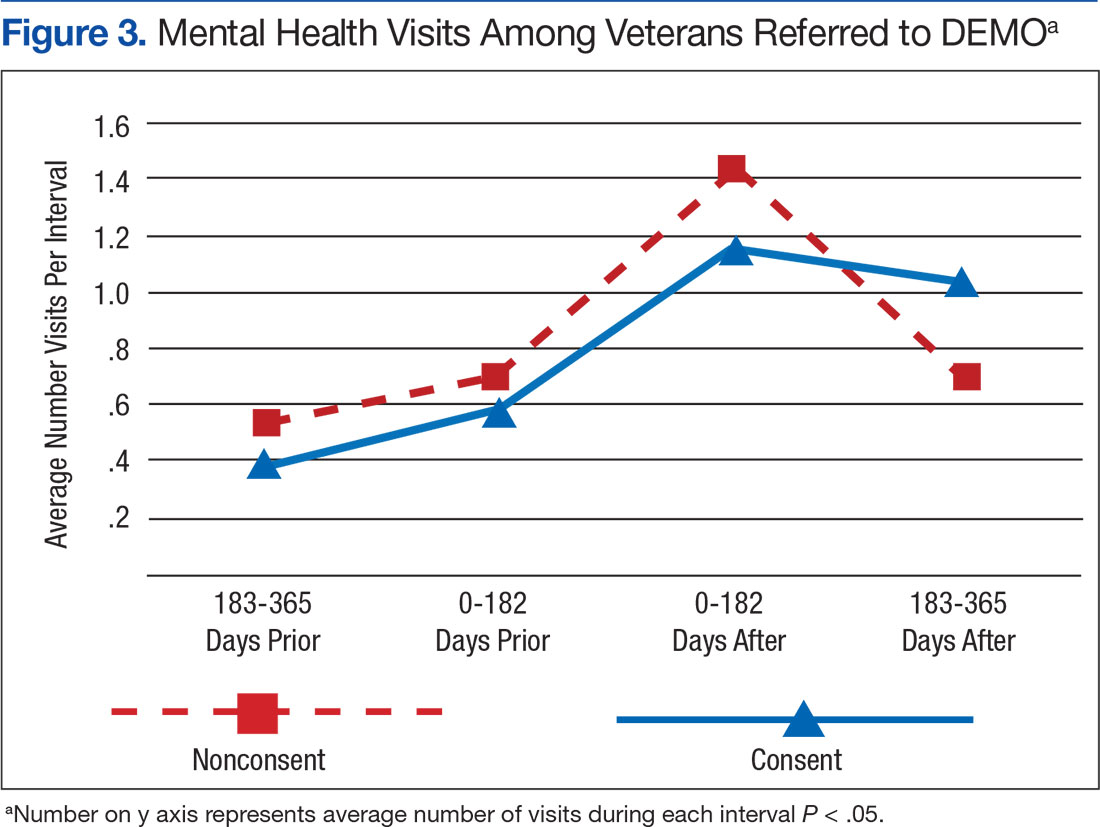
Discussion
Cognitive issues in patients within the general population are common, and the patients cared for by the VA are no exception. Dementia is more common in rural compared with urban areas, and those living in more remote locations have reduced access to specialized evaluation, management, and support services.2 The authors describe a novel program that dramatically increased patient access, bringing the normally tertiary referral services to geographically remote CBOCs at a minimal investment. These services were well received by patients, caregivers, and PCPs. As anticipated, patients and their caregivers especially appreciated the ease and convenience of access. Considering the already significant burden(s) borne every day by those caring for patients with dementia, the benefit of this approach is evident.
Clinicians often feel uncomfortable in evaluating and managing patients with cognitive deficits. Nonetheless, the role of specialized clinics in diagnosing dementia has been demonstrated previously, and the present results are in agreement with previous studies.3 The novelty here is the provision of specialized care usually found only in large, academic medical centers to local CBOCs. By bringing specialized services to geographically isolated patients, the DEMO program was able to increase both access and utilization. Furthermore, providing coordination and ongoing, focused follow-up provided increases in satisfaction and efficiency.
An additional benefit of this approach is the opportunity for PCP education. The authors even found anecdotal reductions in ED usage as well as acute hospitalization and long-term placement—although it was not a statistical significant difference. The relatively high use of mental health care services in this population is in line with previous reports in similar populations, and greater utilization of mental health care services may be one explanation why overall costs did not differ between the 2 groups.4 Nonetheless, this intimates that such a program may yield savings over a longer term, as has been demonstrated in patients with a variety of other psychiatric diagnoses cared for in the community rather than in institutions.5,6
The prevalence of dementia and its associated costs are nearly $50,000 per year per person—suggesting a total cost in the hundreds of billions of dollars.7 Similarly, the importance of caregiver support (including psychosocial interventions, such as the one piloted here) has been demonstrated in a variety of settings (even without improvement in caregiver burden itself).8
There were a number of challenges in the rollout and delivery of DEMO. Although CBOC PCPs
Unfortunately, DEMO was underresourced to provide either real-time feedback true or first responder services. Misunderstandings concerning this were an early challenge to PCP acceptance. However, the longitudinal presence and close working relationships of the DEMO teamlet in each CBOC allowed their use as an adjunct to primary care, and increased the efficacy of both.
Limitations
A number of additional caveats must be made. First, this study had a relatively small number of participants, and there was great variability in health care utilization. This is particularly germane in this population of patients with dementia, which typically has an asymmetrically high use of health care resources. Additionally, the relatively limited follow-up period may have blunted the programs true effect(s). Further, although veterans in the nonconsented group were not officially enrolled in the program, there was likely spillover of the effects of the program on practice patterns, leading to an underestimation of the program’s impact.
Conclusion
With minimal resources, DEMO successfully brought expert evaluation (usually tertiary referral) services, and provided specialized case management in coordination with existing primary care to remote patients. Although there were a number of features rather unique to this setting (eg, infrastructural support; close working interdisciplinary and interprofessional relationships, buy-in at all levels, relative geographic density/demographic homogeneity of participants), specialized case management is increasingly being adopted throughout the VA (and elsewhere). Although the value of collaborative, interdisciplinary interventions has been shown in a variety of settings and conditions—nursing homes,9 chronic low back pain,10 safety among hospital inpatients11—its utility for dementia care is relatively underexplored.
Yet the effectiveness of team-based care for individuals has been demonstrated in a number of settings, including Alzheimer disease.12,13 In addition to involving a number of disciplines, collaborative care is marked by coordination. A number of recent systematic reviews have found that behavioral and multicomponent interventions directed towards the caregiver as well as case management were beneficial in improving some outcomes, although there is considerable heterogeneity in the effects.14,15 Future work will focus on examining methods to focus/optimize interventions based on individual patient characteristics.
Given the epidemiologic trends, care for patients with dementia is expected to grow. Novel interventions, like DEMO, are a particularly promising option to meet this challenge. In fact, just such a collaborative practice-ready workforce has been identified by the World Health Organization as crucial to meeting the challenges of the health needs in the 21st century.16 With the feasibility of such an approach in this population now evident, further studies (including larger sample sizes, across greater geographic regions, as well as among more diverse populations) should be undertaken. These results, if replicated, suggest a novel approach to the particularly vexing problem of caring for patients with dementia with potentially far-reaching public health implications.
Acknowledgments
Supported with T21 funds from VA to expand noninstitutional alternatives to institutional extended care for veterans, as well as the Geriatrics Research and Clinical Center (GRECC) at the Baltimore VAMC.
1. National Committee for Quality Assurance. 2011 HEDIS List. http://www.ncqa.org/tabid/1274/Default.aspx. Accessed December 16, 2016.
2. Russ TC, Batty GD, Hearnshaw GF, Fenton C, Starr JM. Geographical variation in dementia: systemic review with meta-analysis. Int J Epidemiol. 2012;41(4):1012-1032.
3. Wolfs CA, Kessels A, Dirksen CD, Severens JL, Verhey FR. Integrated multidisciplinary diagnostic approach for dementia care: randomized controlled trial. Br J Psychiatry. 2008;192(4):300-305.
4. King PR, Vair CL, Wade M, et al. Outpatient health care utilization in a sample of cognitively impaired veterans receiving care in VHA geriatric evaluation and management clinics. Psychol Serv. 2015;12(1):66-72.
5. Tam-Tham H, Cepoiu-Martin M, Ronksley PE, Maxwell CJ, Hemmelgarn BR. Dementia case management and risk of long-term care placement: a systemic review and meta-analysis. Int J Geriatr Psychiatr. 2013;28(9):889-902.
6. Rothbard AB, Kuno E, Schinnar AP, Hadley TR, Turk R. Service utilization and cost of community care for discharged state hospital patients: a 3-year follow-up study. Am J Psychiatry. 1999;156(6):920-927.
7. Hurd MD, Martorell P, Delavande A, Mullen KJ, Langa KM. Monetary costs of dementia in the United States. N Engl J Med. 2013;368(14):1326-1334.
8. Adelman RD, Tmanova LL, Delgado D, Dion S, Lachs MS. Caregiver burden: a clinical review. JAMA. 2014;311(10):1052-1060.
9. Nazir A, Unroe K, Tegeler M, Khan B, Azar J, Boustani M. Systematic review of interdisciplinary interventions in nursing homes. J Am Med Dir Assoc. 2013;14(7):471-478.
10. Kamper SJ, Apeldoorn AT, Chiarotto A, et al. Multidisciplinary biopsychosocial rehabilitation for chronic low back pain: Cochrane systematic review and meta-analysis. BMJ. 2015;350:h444.
11. O’Leary KJ, Buck R, Fligiel HM, et al. Structured interdisciplinary rounds in a medical teaching unit: improving patient safety. Arch Intern Med. 2011;171(7):678-684.
12. Counsell SR, Callahan CM, Clark DO, et al. Geriatric care management for low-income seniors: a randomized controlled trial. JAMA. 2007;298(22):2623-2633.
13. Callahan CM, Boustani MA, Unverzagt FW, et al. Effectiveness of collaborative care for older adults with Alzheimer disease in primary care: a randomized controlled trial. JAMA. 2006;295(18):2148-2157.
14. Health Quality Ontario. Caregiver- and patient-directed interventions for dementia: an evidence-based analysis. Ont Health Technol Assess Ser. 2008;8(4):1-98.
15. Reilly S, Miranda-Castillo C, Malouf R, et al. Case management approaches to home support for people with dementia. Cochrane Database Syst Rev. 2015;1:CD008345.
16. World Health Organization. Framework for action on interprofessional education and collaborative practice. http://apps.who.int/iris/bitstream/10665/70185/1/WHO_HRH_HPN_10.3_eng.pdf?ua=1. Published 2010. Accessed November 17, 2016.
Dementia is a common, multifaceted problem with significant implications for function and quality of life among older individuals. Current demographic shifts are magnifying this problem. Particularly troubling are neuropsychiatric symptoms, which, in addition to creating caregiver distress, also are linked to functional decline, institutionalization, higher health care costs, and mortality (even after controlling for other potential confounders and severity of cognitive impairment). Furthermore, dementia is often unrecognized and underdiagnosed, and patients with dementia historically have poor access to care, particularly those living in rural areas.
The Geriatrics/Dementia Clinic at the Baltimore Veterans Affairs Medical Center (BVAMC) is a referral resource that provides extensive, multidisciplinary evaluations as well as coordinated subspecialist and interprofessional case review. A diverse group of clinicians (representing geriatrics, geriatric psychiatry, neuropsychology, clinical pharmacy, nursing, and social work) perform a half-day evaluation, followed by a meeting of the interdisciplinary team, and feedback session where patients and their families are given the results of the testing and diagnostic impressions as well as plans for further evaluation and treatment. Finally, in addition to the benefits it provides to veterans and their families, this clinic has proven to be an important resource for professional trainees.
Yet this model can be difficult to access, and those living in more remote regions had challenges availing themselves of this resource. Often, they would have to wake before dawn to drive 2 to 4 hours to the medical center. Furthermore, despite the many obvious benefits of this comprehensive approach, veterans and their families often left the clinic with a staggering amount of information and numerous recommendations for future care but without the assurance of integrated follow-up (a burden borne particularly by those living remotely).
The DEMO Program
In response to the dual challenges of access to and coordination of care, existing resources were leveraged with about $250,000 of VA T21 funds (adding both a full-time geriatric nurse practitioner and a psychology technician to the multidisciplinary team) to design and implement the novel DEMO (Dementia Evaluation, Management and Outreach) program. This program aimed to (1) extend dementia evaluations to regional community-based outpatient clinics (CBOCs) that serve veterans in outlying regions; and (2) improve the management and the follow-up that these veterans receive, with a focus on containing costs, while improving both the quality of and veterans’ (and their families’) satisfaction with health care.
Methods
Dementia evaluations were conducted by a geriatric nurse practitioner and psychology technician teamlet at the CBOCs. In addition to neuropsychological testing, medical records were reviewed, caregivers were interviewed, and the patients were examined. The data were then brought back to the full BVAMC Geriatrics/Dementia Clinic multidisciplinary team for discussion. The team reached a consensus diagnosis and then made a comprehensive plan for the further evaluation and management of these complex patients. The plan was entered into the Computerized Patient Record System and communicated to the patient and caregiver during a follow-up CBOC visit.
The teamlet frequently provided informal education during CBOC visits in addition to formal lectures given by experts from the BVAMC and the University of Maryland. The DEMO program was introduced to providers at the CBOCs by e-mail with follow-up information sessions provided on site.
Rather than having patients simply return to their CBOC primary care providers (PCPs) and exposing patients to the risks of poor communication/coordination of care, services were expanded to include regular phone follow-up calls with case management services that augmented those of their PCPs. The goal was to improve outcomes for these patients and provide alternatives to institutionalization.
Standardized instruments were used to gauge patient and caregiver satisfaction, obtain cost data from the VA and the Centers for Medicare & Medicaid Services, and medication data from the Pharmacy Benefits files.
The institutional review board provided approval to collect data on participants to assess the program’s clinical and economic impacts. Since all patients were suspected to have dementia, the informed consent procedures included additional protections. The patient’s understanding of the pertinent information related to participation in the study was assessed to help ensure that participants with dementia truly understood the conditions to which they were consenting. If the potential participant could not provide informed consent, it was obtained from a surrogate with durable power of attorney (the person recognized by Maryland law as the substitute decision maker or the veteran’s legal guardian). Consent was assessed on an ongoing basis regardless of the patient’s capacity to give informed consent, and those willing to have their data collected were enrolled in a “research” arm. These participants were compared with veterans in the dementia clinic during the enrollment period but who did not consent to participate in the research arm, controlling for sociodemographic characteristics and prior health care utilization.
Data Analysis
Patterns of health care utilization may fluctuate with time, and enrollment may identify potential problems that otherwise would not have been found. The authors looked at health care use over 6-month and 1-year intervals before and after enrollment, examining Occupational Physical Assessment Test (OPAT) data and fee-based outpatient data for both inpatient events (including nursing home utilization and hospitalization events) and outpatient visits (including primary, specialty and mental health care services; home care visits, and emergency department [ED]). The total cost incurred by outpatient visits and inpatient care was then adjusted to 2011 dollars. The relationship between program enrollment and health care use and costs was examined with a multivariate regression analyses, controlling for age and health care use in the prior year among veterans who were in the “consent” group or “nonconsent” group.
Outcome variables included the number of primary care, ED, specialty care, home health care, mental health care clinic, and inpatient visits; total inpatient bed days; and the total costs of all the events. The authors fit different multivariate models for these events according to their distributions. Specifically, the Poisson model was used if the distribution of the outcome variable was not overdispersed (eg, ED, primary care).
A negative binomial was used if the distribution of these events was overdispersed (eg, specialty care visits). Further, because the occurrence of inpatient events is relatively rare, a logit model was used to examine the relationship between enrollment status and probability of any inpatient events, regardless of the number of events. Generalized estimating equation (GEE) model with gamma distribution and log link function was used to examine the relationship between cost and program enrollment. The authors also examined the program’s effect on medication use, focusing on high-risk medications in older adults, comparing both the number of unique medications, as well as frequency such medications prescribed 1 year before and after the enrollment.1
Results
Two hundred ninety-eight (298) veterans were referred to DEMO from a 150-mile radius of Baltimore. Of these veterans, 132 consented to participate in this study. The study participants largely were representative of the total group as well as both the overall veteran population and the more general population of community-dwelling individuals with dementia (Table).
Veterans in the DEMO program largely had mild-to-moderate cognitive impairment with mean Mini-Mental State Examination (MMSE) score of 22 and significant functional limitations (Table). Only 3% displayed a pattern of “pure” dementia typical of Alzheimer disease, and 11% of those referred did not have significant abnormalities on neurocognitive testing.
The team averaged 10.3 recommendations (range 3-22), which focused on a diverse set of issues related to additional diagnostic and therapeutic concerns. Although screening data, including basic laboratory results and imaging, was requested in the referral form, in 71% of cases further diagnostic investigations were suggested. With regard to therapeutic suggestions, not surprisingly, medicines were cited as targets in a majority of cases (eg, discontinuing high-risk medications, initiating/titrating medications to minimize cardiovascular risk). While remaining mindful of the time to benefit and competing morbidities, measures to modify cardiovascular risk factors were suggested in more than half and treatment of depression in 15% of cases. Similarly, addressing poor sensory input was suggested in 38% of cases, with other common recommendations focusing on multiple environmental and social interventions (> 50%) as well as supports/outlets/respite for the caregivers.
The full multidisciplinary DEMO group met only weekly to review cases, and due to travel and scheduling difficulties, feedback to the patients and their families often was delayed for weeks. Although initial plans included regularly scheduled follow-up phone calls, demand quickly outstripped program resources. Nonetheless, chart reviews and abstracted adherence and utilization data revealed that PCPs successfully implemented 52% of recommendations within 2 weeks, rising to > 60% by 3 months. When patients were reevaluated at 1 year, they were remarkably stable: Mini–Mental State Examination (baseline 22.2 ± 5.0 → 22.3 ± 5.7 at follow-up) and Instrumental Activities of Daily Living scores (15.5 ± 10.6 → 17.7 ± 11.4).
Feedback
This program was enthusiastically received by both patients and their caregivers—100% and 98%, respectively—reporting overall satisfaction with the services received and 93% of caregivers indicating satisfaction with how the program met their needs. Caregivers were happy with the amount of time the provider took to answer questions (100% satisfied with the amount of time the DEMO provider spent and that they explained “what they wanted to know,” with 98% responding “good” or “great” for both), as well as with services and amount of help received (83% and 77% “very satisfied,” respectively).
In the survey, 98% of caregivers and patients felt that the program helped them deal more effectively with their problems, 97% would recommend the program to a friend in need of similar help, and 100% would come back if they were to seek help again. In keeping with DEMO’s initial aim of increasing access, there was favorable feedback on the ability to get in and be seen and convenience of location. In addition, referring providers universally expressed satisfaction with the referral process (referrals increased linearly); timeliness of scheduling; usefulness of the recommendations; and they planned on continuing to refer patients.
Although there was great variability, controlling for age and prior utilization, veterans in DEMO had statistically significant (all P < .05) fewer ED and specialty care visits and more mental health care clinic visits 183 to 365 daysafter referral dates compared with those in the nonconsented group. Veterans in the consented group also were less likely to use inpatient care than were veterans in the nonconsented group 183 to 365 days after referral dates. These trends were similarly reflected after controlling for age and prior utilization as well as when examining health care costs (data not shown). Nonetheless, DEMO did not seem to have any effect on overall inpatient bed days, primary/home-based care visits, or total costs. In fact, utilization of mental health care resources increased (Figures 1, 2, and 3).
Discussion
Cognitive issues in patients within the general population are common, and the patients cared for by the VA are no exception. Dementia is more common in rural compared with urban areas, and those living in more remote locations have reduced access to specialized evaluation, management, and support services.2 The authors describe a novel program that dramatically increased patient access, bringing the normally tertiary referral services to geographically remote CBOCs at a minimal investment. These services were well received by patients, caregivers, and PCPs. As anticipated, patients and their caregivers especially appreciated the ease and convenience of access. Considering the already significant burden(s) borne every day by those caring for patients with dementia, the benefit of this approach is evident.
Clinicians often feel uncomfortable in evaluating and managing patients with cognitive deficits. Nonetheless, the role of specialized clinics in diagnosing dementia has been demonstrated previously, and the present results are in agreement with previous studies.3 The novelty here is the provision of specialized care usually found only in large, academic medical centers to local CBOCs. By bringing specialized services to geographically isolated patients, the DEMO program was able to increase both access and utilization. Furthermore, providing coordination and ongoing, focused follow-up provided increases in satisfaction and efficiency.
An additional benefit of this approach is the opportunity for PCP education. The authors even found anecdotal reductions in ED usage as well as acute hospitalization and long-term placement—although it was not a statistical significant difference. The relatively high use of mental health care services in this population is in line with previous reports in similar populations, and greater utilization of mental health care services may be one explanation why overall costs did not differ between the 2 groups.4 Nonetheless, this intimates that such a program may yield savings over a longer term, as has been demonstrated in patients with a variety of other psychiatric diagnoses cared for in the community rather than in institutions.5,6
The prevalence of dementia and its associated costs are nearly $50,000 per year per person—suggesting a total cost in the hundreds of billions of dollars.7 Similarly, the importance of caregiver support (including psychosocial interventions, such as the one piloted here) has been demonstrated in a variety of settings (even without improvement in caregiver burden itself).8
There were a number of challenges in the rollout and delivery of DEMO. Although CBOC PCPs
Unfortunately, DEMO was underresourced to provide either real-time feedback true or first responder services. Misunderstandings concerning this were an early challenge to PCP acceptance. However, the longitudinal presence and close working relationships of the DEMO teamlet in each CBOC allowed their use as an adjunct to primary care, and increased the efficacy of both.
Limitations
A number of additional caveats must be made. First, this study had a relatively small number of participants, and there was great variability in health care utilization. This is particularly germane in this population of patients with dementia, which typically has an asymmetrically high use of health care resources. Additionally, the relatively limited follow-up period may have blunted the programs true effect(s). Further, although veterans in the nonconsented group were not officially enrolled in the program, there was likely spillover of the effects of the program on practice patterns, leading to an underestimation of the program’s impact.
Conclusion
With minimal resources, DEMO successfully brought expert evaluation (usually tertiary referral) services, and provided specialized case management in coordination with existing primary care to remote patients. Although there were a number of features rather unique to this setting (eg, infrastructural support; close working interdisciplinary and interprofessional relationships, buy-in at all levels, relative geographic density/demographic homogeneity of participants), specialized case management is increasingly being adopted throughout the VA (and elsewhere). Although the value of collaborative, interdisciplinary interventions has been shown in a variety of settings and conditions—nursing homes,9 chronic low back pain,10 safety among hospital inpatients11—its utility for dementia care is relatively underexplored.
Yet the effectiveness of team-based care for individuals has been demonstrated in a number of settings, including Alzheimer disease.12,13 In addition to involving a number of disciplines, collaborative care is marked by coordination. A number of recent systematic reviews have found that behavioral and multicomponent interventions directed towards the caregiver as well as case management were beneficial in improving some outcomes, although there is considerable heterogeneity in the effects.14,15 Future work will focus on examining methods to focus/optimize interventions based on individual patient characteristics.
Given the epidemiologic trends, care for patients with dementia is expected to grow. Novel interventions, like DEMO, are a particularly promising option to meet this challenge. In fact, just such a collaborative practice-ready workforce has been identified by the World Health Organization as crucial to meeting the challenges of the health needs in the 21st century.16 With the feasibility of such an approach in this population now evident, further studies (including larger sample sizes, across greater geographic regions, as well as among more diverse populations) should be undertaken. These results, if replicated, suggest a novel approach to the particularly vexing problem of caring for patients with dementia with potentially far-reaching public health implications.
Acknowledgments
Supported with T21 funds from VA to expand noninstitutional alternatives to institutional extended care for veterans, as well as the Geriatrics Research and Clinical Center (GRECC) at the Baltimore VAMC.
1. National Committee for Quality Assurance. 2011 HEDIS List. http://www.ncqa.org/tabid/1274/Default.aspx. Accessed December 16, 2016.
2. Russ TC, Batty GD, Hearnshaw GF, Fenton C, Starr JM. Geographical variation in dementia: systemic review with meta-analysis. Int J Epidemiol. 2012;41(4):1012-1032.
3. Wolfs CA, Kessels A, Dirksen CD, Severens JL, Verhey FR. Integrated multidisciplinary diagnostic approach for dementia care: randomized controlled trial. Br J Psychiatry. 2008;192(4):300-305.
4. King PR, Vair CL, Wade M, et al. Outpatient health care utilization in a sample of cognitively impaired veterans receiving care in VHA geriatric evaluation and management clinics. Psychol Serv. 2015;12(1):66-72.
5. Tam-Tham H, Cepoiu-Martin M, Ronksley PE, Maxwell CJ, Hemmelgarn BR. Dementia case management and risk of long-term care placement: a systemic review and meta-analysis. Int J Geriatr Psychiatr. 2013;28(9):889-902.
6. Rothbard AB, Kuno E, Schinnar AP, Hadley TR, Turk R. Service utilization and cost of community care for discharged state hospital patients: a 3-year follow-up study. Am J Psychiatry. 1999;156(6):920-927.
7. Hurd MD, Martorell P, Delavande A, Mullen KJ, Langa KM. Monetary costs of dementia in the United States. N Engl J Med. 2013;368(14):1326-1334.
8. Adelman RD, Tmanova LL, Delgado D, Dion S, Lachs MS. Caregiver burden: a clinical review. JAMA. 2014;311(10):1052-1060.
9. Nazir A, Unroe K, Tegeler M, Khan B, Azar J, Boustani M. Systematic review of interdisciplinary interventions in nursing homes. J Am Med Dir Assoc. 2013;14(7):471-478.
10. Kamper SJ, Apeldoorn AT, Chiarotto A, et al. Multidisciplinary biopsychosocial rehabilitation for chronic low back pain: Cochrane systematic review and meta-analysis. BMJ. 2015;350:h444.
11. O’Leary KJ, Buck R, Fligiel HM, et al. Structured interdisciplinary rounds in a medical teaching unit: improving patient safety. Arch Intern Med. 2011;171(7):678-684.
12. Counsell SR, Callahan CM, Clark DO, et al. Geriatric care management for low-income seniors: a randomized controlled trial. JAMA. 2007;298(22):2623-2633.
13. Callahan CM, Boustani MA, Unverzagt FW, et al. Effectiveness of collaborative care for older adults with Alzheimer disease in primary care: a randomized controlled trial. JAMA. 2006;295(18):2148-2157.
14. Health Quality Ontario. Caregiver- and patient-directed interventions for dementia: an evidence-based analysis. Ont Health Technol Assess Ser. 2008;8(4):1-98.
15. Reilly S, Miranda-Castillo C, Malouf R, et al. Case management approaches to home support for people with dementia. Cochrane Database Syst Rev. 2015;1:CD008345.
16. World Health Organization. Framework for action on interprofessional education and collaborative practice. http://apps.who.int/iris/bitstream/10665/70185/1/WHO_HRH_HPN_10.3_eng.pdf?ua=1. Published 2010. Accessed November 17, 2016.
Brentuximab vedotin bests standard of care in CTCL

Photo by Larry Young
SAN FRANCISCO—The phase 3 ALCANZA trial is the first to convincingly demonstrate that a new systemic agent can be more effective than standard of care (SOC) options for cutaneous T-cell lymphoma (CTCL), according to a speaker at the 9th Annual T-cell Lymphoma Forum.
The trial showed significant improvements in response, symptom burden, and progression-free survival (PFS) in patients with CD30-expressing CTCL who received brentuximab vedotin (BV), as compared to patients who received either bexarotene or methotrexate.
“[These are] compelling results that potentially may have practice-changing implications for the use of brentuximab in managing CD30-expressing CTCL patients who require systemic therapy,” said Youn H. Kim, MD, of Stanford University School of Medicine in California.
Dr Kim presented these results at this year’s T-cell Lymphoma Forum. The data were also presented at the recent ASH Annual Meeting (abstract 182).
The ALCANZA trial was sponsored by Millennium Pharmaceuticals, Inc. (now a part of Takeda Pharmaceutical Company Limited) and Seattle Genetics, Inc.
The study was designed to compare BV to the SOC options of methotrexate or bexarotene in patients with CD30-positive CTCL, including mycosis fungoides (MF) and primary cutaneous anaplastic large-cell lymphoma (pcALCL).
There were 128 patients in the intent-to-treat and safety populations. Sixty-four patients (48 with MF and 16 with pcALCL) were randomized to receive BV at 1.8 mg/kg IV every 3 weeks for up to 48 weeks.
The other 64 patients (49 with MF and 15 with pcALCL) were randomized to receive methotrexate at 5 mg to 50 mg PO weekly or bexarotene at a target dose of 300 mg/m² PO daily for up to 48 weeks.
Patients received BV for a median of 36 weeks (12 cycles), bexarotene for a median of 17 weeks, and methotrexate for a median of 9 weeks. Three patients in the BV arm were still on treatment at the time of analysis.
Patient characteristics
The median age was 62 (range, 22-83) in the BV am and 59 (range, 22-83) in the SOC arm. More than half of patients in each arm were male—52% and 58%, respectively. And most patients in both arms had an ECOG performance status of 0-1—95% and 97%, respectively.
The median number of prior therapies was 4 (range, 0-13) in the BV arm and 3.5 (range, 1-15) in the SOC arm. The median number of systemic therapies was 2 in the BV arm (range, 0-11) and the SOC arm (range, 1-8).
“It was pretty well balanced in terms of baseline characteristics between the 2 arms,” Dr Kim said. “The brentuximab arm had more stage IV patients—in fact, 7 stage IVB in brentuximab and none in the standard of care. And more patients with ALCL [treated with BV] had extracutaneous disease.”
Among pcALCL patients, 44% in the BV arm had extracutaneous disease, compared to 27% in the SOC arm. Among MF patients, 67% in the BV arm had stage IIB-IVB disease, compared to 61% in the SOC arm.
Response
The study’s primary endpoint was the rate of objective response lasting at least 4 months (ORR4).
“[ORR4] was felt to be more meaningful than ORR because it includes not only the response rate but also a duration element in a single endpoint,” Dr Kim said.
ORR4 was significantly higher with BV than with SOC—56.3% and 12.5%, respectively (P<0.0001).
For patients with MF, the ORR4 was 50% with BV and 10% with SOC. For patients with pcALCL, the ORR4 was 75% with BV and 20% with SOC.
Overall, the complete response (CR) rates were 15.6% in the BV arm and 1.6% in the SOC arm (P=0.0046).
For patients with MF, the CR rate was 10% with BV and 0% with SOC. For patients with pcALCL, the CR rate was 31% with BV and 7% with SOC.
Symptoms
“In CTCL, there’s significant quality of life issues that are not captured adequately by objective response measures, and this patient outcome is very important,” Dr Kim said. “[Quality of life in this study] was captured by Skindex-29, which is an established quality of life measure in skin diseases.”
Patients in the BV arm had a significantly higher reduction in symptom burden according to Skindex-29 than patients receiving SOC. The mean maximum reduction in Skindex-29 symptom domain was -27.96 points in the BV arm and -8.62 points in the SOC arm (P<0.0001).
PFS
PFS was significantly longer in the BV arm than the SOC arm. The median PFS was 16.7 months and 3.5 months, respectively. The hazard ratio was 0.270 (P<0.0001).
For patients with MF, the median PFS was 15.9 months with BV and 3.5 months with SOC. For patients with pcALCL, the median PFS was 27.5 months with BV and 5.3 months with SOC.
Safety
The overall rate of adverse events (AEs) was 95% in the BV arm and 90% in the SOC arm. The rate of grade 3 or higher AEs was 41% and 47%, respectively. And the rate of serious AEs was 29% in both arms.
AEs resulting in discontinuation occurred in 24% of patients in the BV arm and 8% in the SOC arm. In the BV arm, this included peripheral neuropathy (n=9), skin-related hypersensitivity (n=3), E coli infection (n=1), impetigo (n=1), pulmonary embolism (n=1), urticaria (n=1), and vertigo (n=1).
In the SOC arm, AEs leading to discontinuation included maculo-papular rash (n=1), asthenia (n=1), hematuria (n=1), hypernatremia (n=1), neutropenia (n=1), periorbital infection (n=1), and somnolence (n=1). One patient in each arm experienced more than 1 AE resulting in discontinuation.
The most common AEs of any grade (occurring in 15% or more of patients in the BV and SOC arms, respectively) were peripheral neuropathy (67% and 6%), nausea (36% and 13%), diarrhea (29% and 6%), fatigue (29% and 27%), vomiting (17% and 5%), alopecia (15% and 3%), pruritus (17% and 13%), pyrexia (17% and 18%), decreased appetite (15% and 5%), and hypertriglyceridemia (2% and 18%).
The majority of the peripheral neuropathy events in the BV arm were grade 1 or 2—26% and 32%, respectively. The rate of grade 3 peripheral neuropathy events was 9%, and there were no grade 4 events.
Eighty-two percent of patients reported resolution or improvement in peripheral neuropathy events in the BV arm at a median of 22.9 months of follow-up.
There were no on-study deaths (occurring within 30 days of the last dose) in the SOC arm, but there were 4 in the BV arm. Three of the BV deaths were considered unrelated to the drug.
The 1 BV-related death was a result of multiple organ dysfunction syndrome attributed to tumor necrosis at visceral disease sites in a patient with T3bN0M1 pcALCL. The other 3 deaths were due to lymphoma progression, pulmonary embolism, and sepsis. ![]()
CHMP recommends hybrid drug for ALL, other disorders

The European Medicines Agency’s Committee for Medicinal Products for Human Use (CHMP) has recommended marketing authorization for an oral formulation of methotrexate (Jylamvo) as a treatment for acute lymphoblastic leukemia (ALL) and other disorders.
Jylamvo is a hybrid medicine of Methotrexat “Lederle” 25 mg-Stechampulle and Methotrexate “Lederle” 2.5 mg tablets, which have been authorized in the European Union since 1984 and 1959, respectively.
Jylamvo contains the same active substance as these reference medicines—the antineoplastic and immunomodulating agent methotrexate—but is given by mouth as a solution (2 mg/mL).
Jylamvo is intended for use as maintenance treatment in ALL patients age 3 and older.
The drug is also intended to treat:
- Active rheumatoid arthritis in adults
- Polyarthritic forms of active, severe juvenile idiopathic arthritis in adolescents and children age 3 and older when the response to non-steroidal anti-inflammatory drugs has been inadequate
- Severe, treatment-refractory, disabling psoriasis that does not respond sufficiently to other forms of treatment (such as phototherapy, retinoids, and psoralen and ultraviolet A radiation therapy) and severe psoriatic arthritis in adults.
The applicant for Jylamvo is Therakind Limited. Applications for hybrid medicines rely, in part, on the results of preclinical tests and clinical trials for a reference product and, in part, on new data.
The CHMP said studies have demonstrated the satisfactory quality of Jylamvo and its bioequivalence to Methotrexate “Lederle” 2.5 mg tablets and a third product, Ebetrexat 10 mg tablets, which is authorized for similar indications.
The CHMP has proposed that Jylamvo be prescribed by physicians with experience of the various properties of the medicinal product and its mode of action.
Detailed recommendations for the use of Jylamvo will be described in the summary of product characteristics, which will be published in the European public assessment report and made available in all official European Union languages if the European Commission grants marketing authorization for Jylamvo.
The European Commission typically makes a decision on a product within 67 days of the time the CHMP adopts its opinion. ![]()