User login
October 21 Is Deadline for NORD Research Grant Abstracts
The deadline has been extended to October 21 to submit letters of intent and abstracts for National Organization for Rare Disorders (NORD) research grants for studies related to the following rare diseases:
- Alveolar capillary dysplasia with misalignment of the pulmonary veins (ACD/MPV)
- Appendix cancer and pseudomyxoma peritonei (PMP)
- Autoimmune polyglandular syndrome type 1 (APS Type 1)
- Homocystinuria due to cystathionine beta-synthase deficiency
- Malonic aciduria
- Stiff person syndrome
The NORD Research Grant Program encourages meritorious scientific and clinical research toward new diagnostics, treatments, and/or cures for rare diseases. NORD’s program provides seed grants to clinicians and academic scientists for translational or clinical studies. Data generated in these studies may then be used by researchers to obtain additional funding from government or industry sponsors. Two of NORD’s previous research grants have resulted in FDA-approved orphan products to treat rare diseases. Submissions should be sent to [email protected]. Click here to view each Request for Proposal in full.
A tool to help limit patients’ sodium intake
The average American consumes about 3400 mg/d of sodium, which is more than double the 1500 mg recommended by the American Heart Association.1 Excess sodium added to foods during commercial processing and preparation represents the main source of sodium intake in American diets.2 Nevertheless, adding salt at the table is still very common, and people who add salt at the table have 1.5 g higher salt intakes than those who do not add salt.3 And as we know, high sodium intake has been associated with elevated blood pressure and an increased rate of cardiovascular disease.4
I have designed a self-produced “Salt Awareness—Limit Today” (SALT) label (FIGURE). This label is attached to the cap of a salt shaker in such a way that less salt flows through the openings of the cap. Moreover, the label serves as a reminder to limit salt intake in general. The feedback I have received from my patients has been extremely positive; they report increased awareness and decreased sodium intake. I mention it here so that others may benefit.

Zvi Weizman, MD
Beer-Sheva, Israel
1. Cobb LK, Anderson CA, Elliott P, et al; American Heart Association Council on Lifestyle and Metabolic Health. Methodological issues in cohort studies that relate sodium intake to cardiovascular disease outcomes: a science advisory from the American Heart Association. Circulation. 2014;129:1173-1186.
2. Jackson SL, King SM, Zhao L, et al. Prevalence of excess sodium intake in the United States - NHANES, 2009-2012. MMWR Morb Mortal Wkly Rep. 2016;64:1393-1397.
3. Webster J, Su’a SA, Ieremia M, et al. Salt intakes, knowledge, and behavior in Samoa: Monitoring salt-consumption patterns through the World Health Organization’s surveillance of noncommunicable disease risk factors (STEPS). J Clin Hypertens (Greenwich). 2016.
4. Mozaffarian D, Fahimi S, Singh GM, et al; Global Burden of Diseases Nutrition and Chronic Diseases Expert Group. Global sodium consumption and death from cardiovascular causes. N Engl J Med. 2014;371:624-634.
The average American consumes about 3400 mg/d of sodium, which is more than double the 1500 mg recommended by the American Heart Association.1 Excess sodium added to foods during commercial processing and preparation represents the main source of sodium intake in American diets.2 Nevertheless, adding salt at the table is still very common, and people who add salt at the table have 1.5 g higher salt intakes than those who do not add salt.3 And as we know, high sodium intake has been associated with elevated blood pressure and an increased rate of cardiovascular disease.4
I have designed a self-produced “Salt Awareness—Limit Today” (SALT) label (FIGURE). This label is attached to the cap of a salt shaker in such a way that less salt flows through the openings of the cap. Moreover, the label serves as a reminder to limit salt intake in general. The feedback I have received from my patients has been extremely positive; they report increased awareness and decreased sodium intake. I mention it here so that others may benefit.
Zvi Weizman, MD
Beer-Sheva, Israel
1. Cobb LK, Anderson CA, Elliott P, et al; American Heart Association Council on Lifestyle and Metabolic Health. Methodological issues in cohort studies that relate sodium intake to cardiovascular disease outcomes: a science advisory from the American Heart Association. Circulation. 2014;129:1173-1186.
2. Jackson SL, King SM, Zhao L, et al. Prevalence of excess sodium intake in the United States - NHANES, 2009-2012. MMWR Morb Mortal Wkly Rep. 2016;64:1393-1397.
3. Webster J, Su’a SA, Ieremia M, et al. Salt intakes, knowledge, and behavior in Samoa: Monitoring salt-consumption patterns through the World Health Organization’s surveillance of noncommunicable disease risk factors (STEPS). J Clin Hypertens (Greenwich). 2016.
4. Mozaffarian D, Fahimi S, Singh GM, et al; Global Burden of Diseases Nutrition and Chronic Diseases Expert Group. Global sodium consumption and death from cardiovascular causes. N Engl J Med. 2014;371:624-634.
Point-of-care ultrasound: It’s no replacement for the stethoscope
In his August editorial, Dr. Hickner noted that an article in the issue prompted him to “wonder whether ultrasound might become the stethoscope of the future” (J Fam Pract. 2016;65:516). To that I say that we need to avoid conflating the stethoscope with point-of-care ultrasound (POCUS).
It is well documented that auscultation skills rapidly deteriorate (specifically in the cardiology realm) in clinical practice.1 This may occur because many physicians already think ultrasound can replace actually listening to their patients’ hearts. The motto has become, “I’ll just order an echo.”
POCUS is an imaging modality. Period. It can be used to auscultate, but Doppler ultrasound is not as precise as the stethoscope when used by a practiced listener for identifying the source and subtle characteristics of murmurs.2 The stethoscope remains an outstanding, inexpensive, and convenient screening tool and its use needs to be emphasized.
I strongly believe in training all medical students in POCUS—but as a complementary and adjunctive tool—not as something to replace a perfectly functional piece of equipment used around the world to provide good care.
Todd Fredricks, DO
Athens, Ohio
1. Vukanovic-Criley JM, Hovanesyan A, Criley SR, et al. Confidential testing of cardiac examination competency in cardiology and noncardiology faculty and trainees: a multicenter study. Clin Cardiol. 2010;33:738-745.
2. Tavel ME. Cardiac auscultation. A glorious past—but does it have a future? Circulation. 1996;93:1250-1253.
In his August editorial, Dr. Hickner noted that an article in the issue prompted him to “wonder whether ultrasound might become the stethoscope of the future” (J Fam Pract. 2016;65:516). To that I say that we need to avoid conflating the stethoscope with point-of-care ultrasound (POCUS).
It is well documented that auscultation skills rapidly deteriorate (specifically in the cardiology realm) in clinical practice.1 This may occur because many physicians already think ultrasound can replace actually listening to their patients’ hearts. The motto has become, “I’ll just order an echo.”
POCUS is an imaging modality. Period. It can be used to auscultate, but Doppler ultrasound is not as precise as the stethoscope when used by a practiced listener for identifying the source and subtle characteristics of murmurs.2 The stethoscope remains an outstanding, inexpensive, and convenient screening tool and its use needs to be emphasized.
I strongly believe in training all medical students in POCUS—but as a complementary and adjunctive tool—not as something to replace a perfectly functional piece of equipment used around the world to provide good care.
Todd Fredricks, DO
Athens, Ohio
1. Vukanovic-Criley JM, Hovanesyan A, Criley SR, et al. Confidential testing of cardiac examination competency in cardiology and noncardiology faculty and trainees: a multicenter study. Clin Cardiol. 2010;33:738-745.
2. Tavel ME. Cardiac auscultation. A glorious past—but does it have a future? Circulation. 1996;93:1250-1253.
Rethinking A1C targets for patients with mental illness?
The article, “Diabetes update: Your guide to the latest ADA standards,” by Shubrook, et al (J Fam Pract. 2016;65:310-318) is a precise review of current recommendations for diabetes. We would like to draw attention, however, to comorbid diabetes and mental illness.
Diabetes and serious mental illness often coincide, making the treatment of both conditions difficult and leading to higher rates of complications.1
The American Diabetes Association (ADA)’s “Standards of Medical Care in Diabetes” recognizes that hemoglobin A1C targets for patients should be individualized.2 We consider it important to discus
For example, a more lenient A1C goal may be appropriate when:
- the assessment of the patient shows that he or she is struggling with active symptoms of mental illness
- new medications with undesirable metabolic effects are prescribed or titrated
- social support is poor
- patients have limited confidence in their ability to accomplish tasks and goals
- patients have cognitive limitations
- patients abuse substances.
We suggest that when factors are favorable (eg, younger patient, well-controlled serious mental illness, adequate support, good cognitive skills, no hazardous use of substances, good level of confidence in the ability to control diabetes), the A1C target can be set lower. When the factors are less favorable (eg, older patient, poorly controlled mental illness, abusing substances, cognitive impairment), the target should be set higher and incrementally reduced as care engagement, circumstances, and symptom control improve.
There is a need for further research to investigate the factors that can impact diabetes self-management in patients with comorbid mental illness.
Corinna Falck-Ytter, MD
Stephanie W. Kanuch, MEd
Richard McCormick, PhD
Michael Purdum, PhD
Neal V. Dawson, MD
Shari D. Bolen, MD, MPH
Martha Sajatovic, MD
Cleveland, Ohio
1. Ducat L, Philipson LH, Anderson BJ. The mental health comorbidities of diabetes. JAMA. 2014;312:691-692.
2. American Diabetes Association. Standards of Medical Care in Diabetes—2016. Diabetes Care. 2016;39(Suppl 1). Available at: http://care.diabetesjournals.org/content/diacare/suppl/2015/12/21/39.Supplement_1.DC2/2016-Standards-of-Care.pdf. Accessed May 18, 2016.
The article, “Diabetes update: Your guide to the latest ADA standards,” by Shubrook, et al (J Fam Pract. 2016;65:310-318) is a precise review of current recommendations for diabetes. We would like to draw attention, however, to comorbid diabetes and mental illness.
Diabetes and serious mental illness often coincide, making the treatment of both conditions difficult and leading to higher rates of complications.1
The American Diabetes Association (ADA)’s “Standards of Medical Care in Diabetes” recognizes that hemoglobin A1C targets for patients should be individualized.2 We consider it important to discus
For example, a more lenient A1C goal may be appropriate when:
- the assessment of the patient shows that he or she is struggling with active symptoms of mental illness
- new medications with undesirable metabolic effects are prescribed or titrated
- social support is poor
- patients have limited confidence in their ability to accomplish tasks and goals
- patients have cognitive limitations
- patients abuse substances.
We suggest that when factors are favorable (eg, younger patient, well-controlled serious mental illness, adequate support, good cognitive skills, no hazardous use of substances, good level of confidence in the ability to control diabetes), the A1C target can be set lower. When the factors are less favorable (eg, older patient, poorly controlled mental illness, abusing substances, cognitive impairment), the target should be set higher and incrementally reduced as care engagement, circumstances, and symptom control improve.
There is a need for further research to investigate the factors that can impact diabetes self-management in patients with comorbid mental illness.
Corinna Falck-Ytter, MD
Stephanie W. Kanuch, MEd
Richard McCormick, PhD
Michael Purdum, PhD
Neal V. Dawson, MD
Shari D. Bolen, MD, MPH
Martha Sajatovic, MD
Cleveland, Ohio
1. Ducat L, Philipson LH, Anderson BJ. The mental health comorbidities of diabetes. JAMA. 2014;312:691-692.
2. American Diabetes Association. Standards of Medical Care in Diabetes—2016. Diabetes Care. 2016;39(Suppl 1). Available at: http://care.diabetesjournals.org/content/diacare/suppl/2015/12/21/39.Supplement_1.DC2/2016-Standards-of-Care.pdf. Accessed May 18, 2016.
Recurrent right upper quadrant abdominal pain
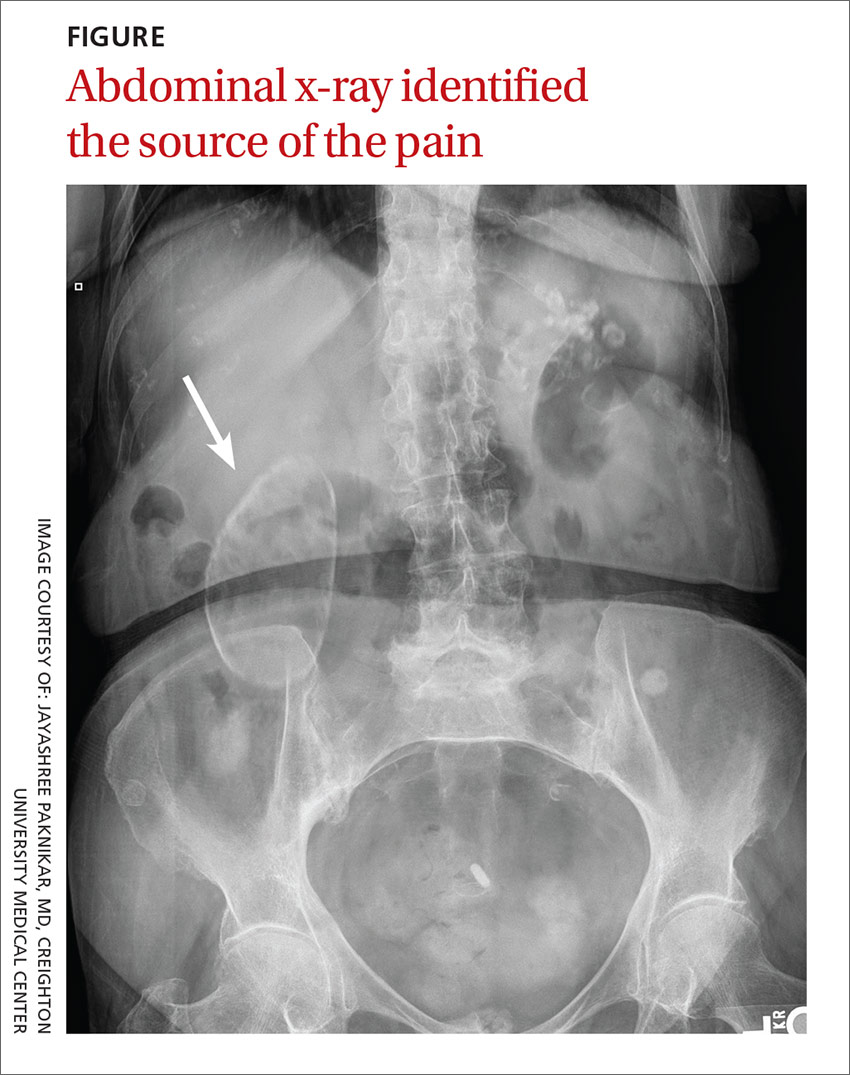
An 88-year-old woman presented to our primary care clinic with recurrent right upper quadrant abdominal pain. Her history was negative for nausea, fever, vomiting, chest pain, heartburn, back pain, or changes in bowel movement patterns. There was no association between the pain and her eating patterns. She described the pain as dull, and rated it as a 4 to 5 out of 10. A physical examination was unremarkable except for a minimally tender mass in the right upper quadrant that was detected during palpation of the abdomen. A Murphy’s test was negative. A comprehensive metabolic panel, complete blood count, lipase test, amylase test, abdominal ultrasound, and abdominal x-ray (FIGURE) were ordered.
WHAT IS YOUR DIAGNOSIS?
HOW WOULD YOU TREAT THIS PATIENT?
Diagnosis: Porcelain gallbladder
We diagnosed this patient with porcelain gallbladder based on her history, physical exam, and x-ray, which revealed a well-defined air gas bubble encased in a calcified pouch. (The patient’s lab work was unremarkable and the ultrasound revealed the same findings as seen on the x-ray.)
Porcelain gallbladder is a rare condition.1 It is characterized by intramural calcifications of the gallbladder wall, which is rarely seen with chronic cholecystitis.2
There are a few theories behind the etiology of porcelain gallbladder. One theory is that gallstones can irritate the gallbladder wall, leading to inflammation and then calcification. Others believe that porcelain gallbladder is due to the obstruction of cystic ducts, which leads to bile stasis in the gallbladder, followed by the accumulation of calcium carbonate salts.3
Patients may present with biliary pain or a firm palpable mass in the right upper quadrant. However, patients are often asymptomatic.4
Cancer risk. There is about a 2% to 3% risk of gallbladder cancer in patients with porcelain gallbladder.5 The nature of the calcification has been linked to the probability that a patient will develop gallbladder cancer. Specifically, there is a higher probability of gallbladder cancer if discontinuous calcification is noted, or if only some portion of the gallbladder wall has calcified.6 About 80% of all gallbladder cancers are adenocarcinomas.6
Differential diagnosis includes GERD, cholecystitis
Right upper quadrant pain is associated with acute hepatitis, acute cholecystitis, acute pancreatitis, gastroesophageal reflex disease (GERD), ulcers, and umbilical hernias. In this patient’s case, her history and physical examination made a number of diagnoses less likely, including acute cholecystitis, GERD, ulcers, and an umbilical hernia. In addition, normal values on the patient’s lipase and amylase tests ruled out pancreatitis.
Imaging brought things into focus. The most significant finding in this case was the abdominal x-ray, which showed a well-defined air gas bubble encased in a calcified pouch.
In addition to an x-ray or an ultrasound, a computed tomography scan can confirm the diagnosis of porcelain gallbladder.
For most patients, cholecystectomy is recommended
Treatment and management is based on the pattern of calcification and the patient’s current health status. If there is incomplete calcification, cholecystectomy is warranted. Cholecystectomy may also be warranted when a patient is symptomatic and has complete calcification of the gallbladder. Regardless of the pattern of calcification, imaging surveillance of the patient is necessary. Moreover, cholecystectomy is preferred regardless of the status of the calcification if the patient is a good surgical candidate.7
It is important to send the gallbladder for histopathological examination after it is removed to determine the likelihood of malignancy.7 If cancer is ruled out, then no further work-up is necessary. If cancer is detected, then further evaluation, including additional surgery, may be necessary.
Our patient was a good surgical candidate, so we recommended cholecystectomy. The patient underwent surgery and the pathology report was negative for cancer.
CORRESPONDENCE
Pradeepa Vimalachandran, MD, MPH, 601 North 30th Street, Suite 6720, Omaha, NE 68131; [email protected].
1. Kane RA, Jacobs R, Katz J, et al. Porcelain gallbladder: ultrasound and CT appearance. Radiology. 1984;152:137-141.
2. Ochsner SF, Carrera GM. Calcification of the gallbladder (“porcelain gallbladder”). Am J Roentgenol Radium Ther Nucl Med. 1963;89:847-853.
3. Stephen AE, Berger DL. Carcinoma in the porcelain gallbladder: a relationship revisited. Surgery. 2001;129:699-703.
4. Geller SA, de Campos FP. Porcelain gallbladder. Autops Case Rep. 2015;5:5-7.
5. Towfigh S, McFadden DW, Cortina GR, et al. Porcelain gallbladder is not associated with gallbladder carcinoma. Am Surg. 2001;67:7-10.
6. Brown KM, Geller DA. Porcelain gallbladder and risk of gallbladder cancer. Arch Surg. 2011;146:1148.
7. Khan ZS, Livingston EH, Huerta S. Reassessing the need for prophylactic surgery in patients with porcelain gallbladder: case series and systematic review of the literature. Arch Surg. 2011;146:1143-1147.
An 88-year-old woman presented to our primary care clinic with recurrent right upper quadrant abdominal pain. Her history was negative for nausea, fever, vomiting, chest pain, heartburn, back pain, or changes in bowel movement patterns. There was no association between the pain and her eating patterns. She described the pain as dull, and rated it as a 4 to 5 out of 10. A physical examination was unremarkable except for a minimally tender mass in the right upper quadrant that was detected during palpation of the abdomen. A Murphy’s test was negative. A comprehensive metabolic panel, complete blood count, lipase test, amylase test, abdominal ultrasound, and abdominal x-ray (FIGURE) were ordered.
WHAT IS YOUR DIAGNOSIS?
HOW WOULD YOU TREAT THIS PATIENT?
Diagnosis: Porcelain gallbladder
We diagnosed this patient with porcelain gallbladder based on her history, physical exam, and x-ray, which revealed a well-defined air gas bubble encased in a calcified pouch. (The patient’s lab work was unremarkable and the ultrasound revealed the same findings as seen on the x-ray.)
Porcelain gallbladder is a rare condition.1 It is characterized by intramural calcifications of the gallbladder wall, which is rarely seen with chronic cholecystitis.2
There are a few theories behind the etiology of porcelain gallbladder. One theory is that gallstones can irritate the gallbladder wall, leading to inflammation and then calcification. Others believe that porcelain gallbladder is due to the obstruction of cystic ducts, which leads to bile stasis in the gallbladder, followed by the accumulation of calcium carbonate salts.3
Patients may present with biliary pain or a firm palpable mass in the right upper quadrant. However, patients are often asymptomatic.4
Cancer risk. There is about a 2% to 3% risk of gallbladder cancer in patients with porcelain gallbladder.5 The nature of the calcification has been linked to the probability that a patient will develop gallbladder cancer. Specifically, there is a higher probability of gallbladder cancer if discontinuous calcification is noted, or if only some portion of the gallbladder wall has calcified.6 About 80% of all gallbladder cancers are adenocarcinomas.6
Differential diagnosis includes GERD, cholecystitis
Right upper quadrant pain is associated with acute hepatitis, acute cholecystitis, acute pancreatitis, gastroesophageal reflex disease (GERD), ulcers, and umbilical hernias. In this patient’s case, her history and physical examination made a number of diagnoses less likely, including acute cholecystitis, GERD, ulcers, and an umbilical hernia. In addition, normal values on the patient’s lipase and amylase tests ruled out pancreatitis.
Imaging brought things into focus. The most significant finding in this case was the abdominal x-ray, which showed a well-defined air gas bubble encased in a calcified pouch.
In addition to an x-ray or an ultrasound, a computed tomography scan can confirm the diagnosis of porcelain gallbladder.
For most patients, cholecystectomy is recommended
Treatment and management is based on the pattern of calcification and the patient’s current health status. If there is incomplete calcification, cholecystectomy is warranted. Cholecystectomy may also be warranted when a patient is symptomatic and has complete calcification of the gallbladder. Regardless of the pattern of calcification, imaging surveillance of the patient is necessary. Moreover, cholecystectomy is preferred regardless of the status of the calcification if the patient is a good surgical candidate.7
It is important to send the gallbladder for histopathological examination after it is removed to determine the likelihood of malignancy.7 If cancer is ruled out, then no further work-up is necessary. If cancer is detected, then further evaluation, including additional surgery, may be necessary.
Our patient was a good surgical candidate, so we recommended cholecystectomy. The patient underwent surgery and the pathology report was negative for cancer.
CORRESPONDENCE
Pradeepa Vimalachandran, MD, MPH, 601 North 30th Street, Suite 6720, Omaha, NE 68131; [email protected].
1. Kane RA, Jacobs R, Katz J, et al. Porcelain gallbladder: ultrasound and CT appearance. Radiology. 1984;152:137-141.
2. Ochsner SF, Carrera GM. Calcification of the gallbladder (“porcelain gallbladder”). Am J Roentgenol Radium Ther Nucl Med. 1963;89:847-853.
3. Stephen AE, Berger DL. Carcinoma in the porcelain gallbladder: a relationship revisited. Surgery. 2001;129:699-703.
4. Geller SA, de Campos FP. Porcelain gallbladder. Autops Case Rep. 2015;5:5-7.
5. Towfigh S, McFadden DW, Cortina GR, et al. Porcelain gallbladder is not associated with gallbladder carcinoma. Am Surg. 2001;67:7-10.
6. Brown KM, Geller DA. Porcelain gallbladder and risk of gallbladder cancer. Arch Surg. 2011;146:1148.
7. Khan ZS, Livingston EH, Huerta S. Reassessing the need for prophylactic surgery in patients with porcelain gallbladder: case series and systematic review of the literature. Arch Surg. 2011;146:1143-1147.
Does knuckle popping lead to arthritis?
EVIDENCE-BASED ANSWER:
No, habitual knuckle popping, or cracking (over the course of several decades) isn’t associated with clinical or radiographic evidence of osteoarthritis (strength of recommendation [SOR]: B, retrospective cohort and case control studies). However, attempting to pop the knuckles can produce acute soft tissue injury (SOR: C, case reports).
Evidence summary
A cross-sectional study found no correlation between knuckle popping and osteoarthritis (OA) of the hand.1 Investigators recruited 300 consecutive patients (ages 45 years and older, mean age 63 years) and evaluated them for a history of habitual knuckle popping (74 of 300 patients, mean duration 35 years) and hand arthritis or dysfunction. Investigators excluded patients with neuromuscular, inflammatory, or malignant diseases.
Investigators found OA equally in both patients who did and didn’t pop their knuckles (12 of 74 vs 36 of 226, respectively; P nonsignificant); joint swelling was more common in participants with a history of knuckle popping (84% vs 6%; P<.01). Investigators didn’t describe how OA was diagnosed or specify which joints were affected.
Another cross-sectional study also found no correlation between habitual knuckle popping of the metacarpal phalangeal joint and the prevalence of OA in that joint.2 Investigators recruited 28 patients (mean age 78.5 years; 23 women and 5 men) from a Jewish home for the aged and asked them whether they had habitually cracked their knuckles during their lifetime. They then performed clinical and radiographic hand examinations (excluding patients with a history of traumatic injury, rheumatoid arthritis, gout, chondrocalcinosis, and hemochromatosis).
Knuckle popping didn’t correlate with OA of the metacarpal phalanges (1 of 15 knuckle popping patients vs 5 of 13 patients who didn’t pop their knuckles; P=.06). All 6 patients with radiographic evidence of OA showed involvement at the metacarpal phalangeal and distal interphalangeal joints, whether or not they popped their knuckles.
Years spent cracking knuckles doesn’t predict OA
A case control study found no correlation between OA in the hands and habitual knuckle popping.3 Investigators recruited 215 patients 50 to 89 years old who had received a radiograph of their right hand during the previous 5 years and divided them into cases with OA (135 patients), and controls without OA (80 patients). Patients completed questionnaires assessing the prevalence (20%), frequency (1 to 20 times per day), and duration (26 to 36 years) of knuckle popping.
Patients most commonly popped proximal interphalangeal joints (15.9%) followed by metacarpal phalangeal joints (13.5%), distal interphalangeal joints (6.1%), and first carpal metacarpal joints (2.3%). OA most often affected the distal interphalangeal joint (68.4%), followed by the first carpal metacarpal (57.1%), proximal interphalangeal (54.1%), and metacarpal phalangeal joints (28.6%). Investigators found no difference in the prevalence of knuckle popping between cases and controls (18% in cases vs 23.2% in controls; P=.361).
When investigators evaluated total knuckle popping exposure in “crack years” (number of times per day multiplied by years) in the distal interphalangeal or metacarpal phalangeal joints, they found no significant association between crack years and OA (distal interphalangeal joint, mean 108 crack years; metacarpal phalangeal joint, mean 75 crack years).
50 years of knuckle popping without ill effects
An n-of-1 case control study found similar results.4 The researcher, a physician, popped only the knuckles of his left hand, twice a day, for 50 years. He compared his hands at the end of the trial and found no arthritis in either hand and no visible differences.
But knuckle popping does have a downside
A paper described 2 case reports of acute injuries sustained during attempted knuckle popping—a partial tear of the ulnar collateral ligament of the thumb and subluxation of the extensor tendon of the fifth digit.5 Both injuries were associated with forceful manipulation of the digits, and both resolved with conservative management within 4 weeks.
1. Castellanos J, Axelrod D. Effect of habitual knuckle cracking on hand function. Ann Rheum Dis. 1990;49:308-309.
2. Swezey RL, Swezey SE. The consequences of habitual knuckle cracking. West J Med. 1975;122:377-379.
3. Deweber K, Olszewski M, Ortolano R. Knuckle cracking and hand osteoarthritis. J Am Board Fam Med. 2011;24:169-174.
4. Unger DL. Does knuckle cracking lead to arthritis of the fingers? Arthritis Rheum. 1998;41:949-950.
5. Chan PS, Steinberg DR, Bozentka DJ. Consequences of knuckle cracking: a report of two acute injuries. Am J Orthop (Belle Mead NJ). 1999;28:113-114.
EVIDENCE-BASED ANSWER:
No, habitual knuckle popping, or cracking (over the course of several decades) isn’t associated with clinical or radiographic evidence of osteoarthritis (strength of recommendation [SOR]: B, retrospective cohort and case control studies). However, attempting to pop the knuckles can produce acute soft tissue injury (SOR: C, case reports).
Evidence summary
A cross-sectional study found no correlation between knuckle popping and osteoarthritis (OA) of the hand.1 Investigators recruited 300 consecutive patients (ages 45 years and older, mean age 63 years) and evaluated them for a history of habitual knuckle popping (74 of 300 patients, mean duration 35 years) and hand arthritis or dysfunction. Investigators excluded patients with neuromuscular, inflammatory, or malignant diseases.
Investigators found OA equally in both patients who did and didn’t pop their knuckles (12 of 74 vs 36 of 226, respectively; P nonsignificant); joint swelling was more common in participants with a history of knuckle popping (84% vs 6%; P<.01). Investigators didn’t describe how OA was diagnosed or specify which joints were affected.
Another cross-sectional study also found no correlation between habitual knuckle popping of the metacarpal phalangeal joint and the prevalence of OA in that joint.2 Investigators recruited 28 patients (mean age 78.5 years; 23 women and 5 men) from a Jewish home for the aged and asked them whether they had habitually cracked their knuckles during their lifetime. They then performed clinical and radiographic hand examinations (excluding patients with a history of traumatic injury, rheumatoid arthritis, gout, chondrocalcinosis, and hemochromatosis).
Knuckle popping didn’t correlate with OA of the metacarpal phalanges (1 of 15 knuckle popping patients vs 5 of 13 patients who didn’t pop their knuckles; P=.06). All 6 patients with radiographic evidence of OA showed involvement at the metacarpal phalangeal and distal interphalangeal joints, whether or not they popped their knuckles.
Years spent cracking knuckles doesn’t predict OA
A case control study found no correlation between OA in the hands and habitual knuckle popping.3 Investigators recruited 215 patients 50 to 89 years old who had received a radiograph of their right hand during the previous 5 years and divided them into cases with OA (135 patients), and controls without OA (80 patients). Patients completed questionnaires assessing the prevalence (20%), frequency (1 to 20 times per day), and duration (26 to 36 years) of knuckle popping.
Patients most commonly popped proximal interphalangeal joints (15.9%) followed by metacarpal phalangeal joints (13.5%), distal interphalangeal joints (6.1%), and first carpal metacarpal joints (2.3%). OA most often affected the distal interphalangeal joint (68.4%), followed by the first carpal metacarpal (57.1%), proximal interphalangeal (54.1%), and metacarpal phalangeal joints (28.6%). Investigators found no difference in the prevalence of knuckle popping between cases and controls (18% in cases vs 23.2% in controls; P=.361).
When investigators evaluated total knuckle popping exposure in “crack years” (number of times per day multiplied by years) in the distal interphalangeal or metacarpal phalangeal joints, they found no significant association between crack years and OA (distal interphalangeal joint, mean 108 crack years; metacarpal phalangeal joint, mean 75 crack years).
50 years of knuckle popping without ill effects
An n-of-1 case control study found similar results.4 The researcher, a physician, popped only the knuckles of his left hand, twice a day, for 50 years. He compared his hands at the end of the trial and found no arthritis in either hand and no visible differences.
But knuckle popping does have a downside
A paper described 2 case reports of acute injuries sustained during attempted knuckle popping—a partial tear of the ulnar collateral ligament of the thumb and subluxation of the extensor tendon of the fifth digit.5 Both injuries were associated with forceful manipulation of the digits, and both resolved with conservative management within 4 weeks.
1. Castellanos J, Axelrod D. Effect of habitual knuckle cracking on hand function. Ann Rheum Dis. 1990;49:308-309.
2. Swezey RL, Swezey SE. The consequences of habitual knuckle cracking. West J Med. 1975;122:377-379.
3. Deweber K, Olszewski M, Ortolano R. Knuckle cracking and hand osteoarthritis. J Am Board Fam Med. 2011;24:169-174.
4. Unger DL. Does knuckle cracking lead to arthritis of the fingers? Arthritis Rheum. 1998;41:949-950.
5. Chan PS, Steinberg DR, Bozentka DJ. Consequences of knuckle cracking: a report of two acute injuries. Am J Orthop (Belle Mead NJ). 1999;28:113-114.
Evidence-based answers from the Family Physicians Inquiries Network

Epistaxis, mass in right nostril • Dx?
THE CASE
A 49-year-old woman visited our family medicine clinic because she’d had 3 episodes of epistaxis during the previous month. She’d already visited the emergency department, and the doctor there had treated her symptomatically and referred her to our clinic.
On physical examination, we noted a whitish mass in the patient’s right nostril that was attached to the nasal septum. The patient’s vital signs were within normal limits. She had a history of hypertension, depression, anxiety, gastroesophageal reflux disease, and post-traumatic stress disorder. Her medications included amlodipine-benazepril, atenolol-chlorthalidone, citalopram, clonazepam, prazosin, and omeprazole. The patient lived alone and denied using tobacco or illicit drugs, but she drank one to 2 glasses of brandy every day. She denied any past medical or family history of similar complaints, autoimmune disorders, or skin rashes.
A complete blood count, international normalized ratio, sedimentation rate, anti-nuclear antibody test, and an anti-neutrophil cytoplasmic antibody panel were normal.
THE DIAGNOSIS
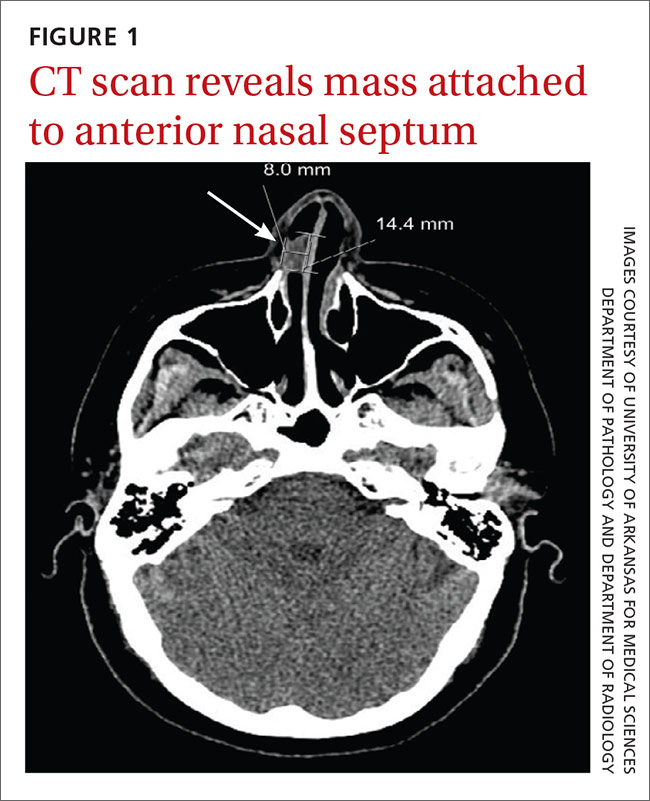
We referred the patient to an ear, nose, and throat doctor for a nasal endoscopy and a biopsy, which showed granulation tissue. A maxillofacial computed tomography (CT) scan revealed a 1.44 cm x 0.8 cm polypoid soft tissue mass in the right nasal cavity adherent to the nasal septum with no posterior extension (FIGURE 1).
DISCUSSION
Pyogenic granuloma (PG) is a benign vascular tumor of the skin and mucous membranes that is not associated with an infection. Rather, it is a hyperplastic, neovascular, inflammatory response to an angiogenic stimulus. Several enhancers and inhibitors of angiogenesis have been shown to play a role in PG, including hormones, medications, and local injury. In fact, a local injury or hormonal factor is identified as a stimulus in more than half of PG patients.1
The hormone connection. Estrogen promotes production of nerve growth factor, granulocyte-macrophage colony-stimulating factor, basic fibroblast growth factor, vascular endothelial growth factor, and transforming growth factor beta 1. Progesterone enhances inflammatory mediators as well. Although there are no direct receptors for estrogen and progesterone in the oral and nasal mucosa, some of these pro-inflammatory effects create an environment conducive to the development of PG. This is supported by several studies documenting an increased incidence of PGs with oral contraceptive use and regression of PGs after childbirth.2-4
Medication may play a role. Drug-induced PG has also been described in several studies.5,6 Offending medications include systemic and topical retinoids, capecitabine, etoposide, 5-fluorouracil, cyclosporine, docetaxel, and human immunodeficiency virus protease inhibitors.
Local injury may also be a culprit. Nasal PGs are commonly attached to the anterior septum and typically result from nasal packing, habitual picking, or nose boring.7 In this particular case, however, we were unable to identify the irritant.
The classic presentation
PG classically presents as a painless mass that spontaneously develops over days to weeks. The mass can be sessile or pedunculated, and is frequently hemorrhagic. Intranasal PG usually presents with epiphora.7 While the prevalence of intraoral PG was found to be one in 25,000 individuals3, data for nasal lesions is scarce. Most cases of PG are seen in the second and third decades of life.1,3 In children, PG is slightly more predominant in males.1,3 Mucosal lesions, however, have a higher incidence in females.1,3 Granuloma gravidarum, the term used to describe mucosal PG in pregnant females, was found in 0.2% to 5% of pregnancies.2,3,8
Differential Dx includes warts, squamous cell carcinoma
The differential diagnosis of PG includes Spitz nevus, glomus tumors, common warts, amelanotic melanoma, squamous cell carcinoma, basal cell carcinoma, Kaposi’s sarcoma, bacillary angiomatosis, infantile hemangioma, and angiolymphoid hyperplasia, among others.3,5 Foreign bodies, nasal polyps, angiofibroma, meningocele, Wegener’s granulomatosis, and sarcoidosis should also be considered.
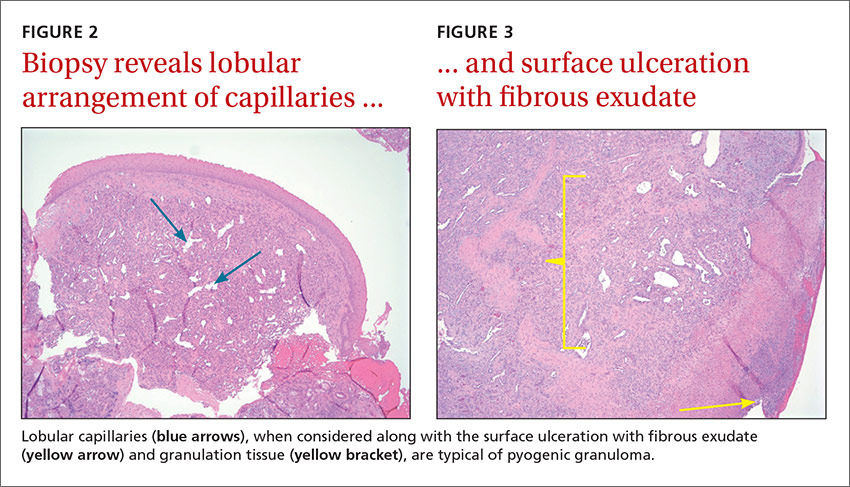
Radiologic evaluation may be beneficial—especially with nasal lesions—when looking for findings suggestive of malignancy. Both CT and magnetic resonance imaging with contrast identify PG as a soft tissue mass with lobulated contours,9,10 but histopathologic analysis is required to confirm the diagnosis. The histopathologic appearance of PG is characterized by a polypoid lesion with circumscribed anastomosing networks of capillaries arranged in one or more lobules at the base in an edematous and fibroblastic stroma.
Treatment is determined by the location and size of the lesion
The most suitable treatment is determined by considering the location of the lesion, the characteristics of the lesion (morphology/size), its amenability to surgery, risk of scar formation, and the presence or absence of a causative irritant. Excision is often preferred because it yields a specimen for pathologic analysis. Alternative treatments include electrocautery, cryotherapy, laser therapy, and intralesional and topical agents,3,6,7 but the recurrence rate is higher (up to 15%) with some of these modalities, when compared with excision (3.6%).3
Our patient underwent excision of the mass and was seen for an annual follow-up appointment. All of her symptoms resolved and no recurrence was noted.
THE TAKEAWAY
Although PG is a common and benign condition, it is rarely seen in the nasal cavity without an obvious history of a possible irritant. PG should be considered as a diagnosis for rapidly growing cutaneous or mucosal hemorrhagic lesions. Appropriate tissue pathology is essential to rule out malignancy and other serious conditions, such as bacillary angiomatosis and Wegener’s granulomatosis.
Treatment is usually required to avoid the frequent complications of ulceration and bleeding. Surgical treatments are preferred. The location of the lesion largely determines whether referral to a specialist is necessary.
1. Harris MN, Desai R, Chuang TY, et al. Lobular capillary hemangiomas: An epidemiologic report, with emphasis on cutaneous lesions. J Am Acad Dermatol. 2000;42:1012-1016.
2. Yuan K, Jin YT, Lin MT. The detection and comparison of angiogenesis-associated factors in pyogenic granuloma by immunohistochemistry. J Periodontol. 2000;71:701-709.
3. Giblin AV, Clover AJ, Athanassopoulos A, et al. Pyogenic granuloma–the quest for optimum treatment: audit of treatment of 408 cases. J Plast Reconstr Aesthet Surg. 2007;60:1030-1035.
4. Steelman R, Holmes D. Pregnancy tumor in a 16-year-old: case report and treatment considerations. J Clin Pediatr Dent. 1992;16:217-218.
5. Jafarzadeh H, Sanatkhani M, Mohtasham N. Oral pyogenic granuloma: a review. J Oral Sci. 2006;48:167-175.
6. Piraccini BM, Bellavista S, Misciali C, et al. Periungual and subungual pyogenic granuloma. Br J Dermatol. 2010;163:941-953.
7. Ozcan C, Apa DD, Görür K. Pediatric lobular capillary hemangioma of the nasal cavity. Eur Arch Otorhinolaryngol. 2004;261:449-451.
8. Henry F, Quatresooz P, Valverde-Lopez JC, et al. Blood vessel changes during pregnancy: a review. Am J Clin Dermatol. 2006;7:65-69.
9. Puxeddu R, Berlucchi M, Ledda GP, et al. Lobular capillary hemangioma of the nasal cavity: A retrospective study on 40 patients. Am J Rhinol. 2006;20:480-484.
10. Maroldi R, Berlucchi M, Farina D, et al. Benign neoplasms and tumor-like lesions. In: Maroldi R, Nicolai P, eds. Imaging in Treatment Planning for Sinonasal Diseases. Berlin, Heidelberg, New York: Springer-Verlag; 2005:107-158.
THE CASE
A 49-year-old woman visited our family medicine clinic because she’d had 3 episodes of epistaxis during the previous month. She’d already visited the emergency department, and the doctor there had treated her symptomatically and referred her to our clinic.
On physical examination, we noted a whitish mass in the patient’s right nostril that was attached to the nasal septum. The patient’s vital signs were within normal limits. She had a history of hypertension, depression, anxiety, gastroesophageal reflux disease, and post-traumatic stress disorder. Her medications included amlodipine-benazepril, atenolol-chlorthalidone, citalopram, clonazepam, prazosin, and omeprazole. The patient lived alone and denied using tobacco or illicit drugs, but she drank one to 2 glasses of brandy every day. She denied any past medical or family history of similar complaints, autoimmune disorders, or skin rashes.
A complete blood count, international normalized ratio, sedimentation rate, anti-nuclear antibody test, and an anti-neutrophil cytoplasmic antibody panel were normal.
THE DIAGNOSIS
We referred the patient to an ear, nose, and throat doctor for a nasal endoscopy and a biopsy, which showed granulation tissue. A maxillofacial computed tomography (CT) scan revealed a 1.44 cm x 0.8 cm polypoid soft tissue mass in the right nasal cavity adherent to the nasal septum with no posterior extension (FIGURE 1).
DISCUSSION
Pyogenic granuloma (PG) is a benign vascular tumor of the skin and mucous membranes that is not associated with an infection. Rather, it is a hyperplastic, neovascular, inflammatory response to an angiogenic stimulus. Several enhancers and inhibitors of angiogenesis have been shown to play a role in PG, including hormones, medications, and local injury. In fact, a local injury or hormonal factor is identified as a stimulus in more than half of PG patients.1
The hormone connection. Estrogen promotes production of nerve growth factor, granulocyte-macrophage colony-stimulating factor, basic fibroblast growth factor, vascular endothelial growth factor, and transforming growth factor beta 1. Progesterone enhances inflammatory mediators as well. Although there are no direct receptors for estrogen and progesterone in the oral and nasal mucosa, some of these pro-inflammatory effects create an environment conducive to the development of PG. This is supported by several studies documenting an increased incidence of PGs with oral contraceptive use and regression of PGs after childbirth.2-4
Medication may play a role. Drug-induced PG has also been described in several studies.5,6 Offending medications include systemic and topical retinoids, capecitabine, etoposide, 5-fluorouracil, cyclosporine, docetaxel, and human immunodeficiency virus protease inhibitors.
Local injury may also be a culprit. Nasal PGs are commonly attached to the anterior septum and typically result from nasal packing, habitual picking, or nose boring.7 In this particular case, however, we were unable to identify the irritant.
The classic presentation
PG classically presents as a painless mass that spontaneously develops over days to weeks. The mass can be sessile or pedunculated, and is frequently hemorrhagic. Intranasal PG usually presents with epiphora.7 While the prevalence of intraoral PG was found to be one in 25,000 individuals3, data for nasal lesions is scarce. Most cases of PG are seen in the second and third decades of life.1,3 In children, PG is slightly more predominant in males.1,3 Mucosal lesions, however, have a higher incidence in females.1,3 Granuloma gravidarum, the term used to describe mucosal PG in pregnant females, was found in 0.2% to 5% of pregnancies.2,3,8
Differential Dx includes warts, squamous cell carcinoma
The differential diagnosis of PG includes Spitz nevus, glomus tumors, common warts, amelanotic melanoma, squamous cell carcinoma, basal cell carcinoma, Kaposi’s sarcoma, bacillary angiomatosis, infantile hemangioma, and angiolymphoid hyperplasia, among others.3,5 Foreign bodies, nasal polyps, angiofibroma, meningocele, Wegener’s granulomatosis, and sarcoidosis should also be considered.
Radiologic evaluation may be beneficial—especially with nasal lesions—when looking for findings suggestive of malignancy. Both CT and magnetic resonance imaging with contrast identify PG as a soft tissue mass with lobulated contours,9,10 but histopathologic analysis is required to confirm the diagnosis. The histopathologic appearance of PG is characterized by a polypoid lesion with circumscribed anastomosing networks of capillaries arranged in one or more lobules at the base in an edematous and fibroblastic stroma.
Treatment is determined by the location and size of the lesion
The most suitable treatment is determined by considering the location of the lesion, the characteristics of the lesion (morphology/size), its amenability to surgery, risk of scar formation, and the presence or absence of a causative irritant. Excision is often preferred because it yields a specimen for pathologic analysis. Alternative treatments include electrocautery, cryotherapy, laser therapy, and intralesional and topical agents,3,6,7 but the recurrence rate is higher (up to 15%) with some of these modalities, when compared with excision (3.6%).3
Our patient underwent excision of the mass and was seen for an annual follow-up appointment. All of her symptoms resolved and no recurrence was noted.
THE TAKEAWAY
Although PG is a common and benign condition, it is rarely seen in the nasal cavity without an obvious history of a possible irritant. PG should be considered as a diagnosis for rapidly growing cutaneous or mucosal hemorrhagic lesions. Appropriate tissue pathology is essential to rule out malignancy and other serious conditions, such as bacillary angiomatosis and Wegener’s granulomatosis.
Treatment is usually required to avoid the frequent complications of ulceration and bleeding. Surgical treatments are preferred. The location of the lesion largely determines whether referral to a specialist is necessary.
1. Harris MN, Desai R, Chuang TY, et al. Lobular capillary hemangiomas: An epidemiologic report, with emphasis on cutaneous lesions. J Am Acad Dermatol. 2000;42:1012-1016.
2. Yuan K, Jin YT, Lin MT. The detection and comparison of angiogenesis-associated factors in pyogenic granuloma by immunohistochemistry. J Periodontol. 2000;71:701-709.
3. Giblin AV, Clover AJ, Athanassopoulos A, et al. Pyogenic granuloma–the quest for optimum treatment: audit of treatment of 408 cases. J Plast Reconstr Aesthet Surg. 2007;60:1030-1035.
4. Steelman R, Holmes D. Pregnancy tumor in a 16-year-old: case report and treatment considerations. J Clin Pediatr Dent. 1992;16:217-218.
5. Jafarzadeh H, Sanatkhani M, Mohtasham N. Oral pyogenic granuloma: a review. J Oral Sci. 2006;48:167-175.
6. Piraccini BM, Bellavista S, Misciali C, et al. Periungual and subungual pyogenic granuloma. Br J Dermatol. 2010;163:941-953.
7. Ozcan C, Apa DD, Görür K. Pediatric lobular capillary hemangioma of the nasal cavity. Eur Arch Otorhinolaryngol. 2004;261:449-451.
8. Henry F, Quatresooz P, Valverde-Lopez JC, et al. Blood vessel changes during pregnancy: a review. Am J Clin Dermatol. 2006;7:65-69.
9. Puxeddu R, Berlucchi M, Ledda GP, et al. Lobular capillary hemangioma of the nasal cavity: A retrospective study on 40 patients. Am J Rhinol. 2006;20:480-484.
10. Maroldi R, Berlucchi M, Farina D, et al. Benign neoplasms and tumor-like lesions. In: Maroldi R, Nicolai P, eds. Imaging in Treatment Planning for Sinonasal Diseases. Berlin, Heidelberg, New York: Springer-Verlag; 2005:107-158.

One lab finding, 2 vastly different causes
CASE 1
A 13-month-old boy who was recently adopted from Ethiopia presented to a primary care physician with a 3-week history of bloody diarrhea accompanied by flatulence and bloating. Stool cultures were positive for Campylobacter and Shigella. He was prescribed azithromycin but saw only moderate improvement. He was then referred to the Infectious Diseases Department. Neonatal, pregnancy, and immunization histories were unknown and a review of systems was unremarkable. On exam, the child looked well; he weighed 9.6 kg (15th percentile), was 69.5 cm long (<3rd percentile), and his head circumference was 45 cm (10th percentile). Head and neck, cardiorespiratory, and abdominal examinations were unremarkable.
A complete blood count (CBC) showed an elevated white blood cell (WBC) count of 26 x 109/L (normal: 4-10 x 109/L) with predominant eosinophilia (10.4 x 10⁹/L or 40.1% of WBCs; normal: <0.45 x 10⁹/L or 0%-8%). Hemoglobin and platelets were within normal limits. Stool testing for ova and parasites showed Strongyloides stercoralis larvae. Strongyloides serology was negative and Filaria serology was equivocal.
CASE 2
A 15-year-old boy was assessed for a 3-week history of fever and eosinophilia. He had enlarged cervical lymph nodes, a new rash, and had lost 4 pounds. He denied gastrointestinal symptoms, dyspnea, headaches, or chest pain. His past medical and family histories were unremarkable and he reported no drug use or allergies. He had traveled to Cuba with his family for 15 days 3 months prior to presentation. He recalled diarrhea while traveling, which resolved spontaneously. He and his family had traveled “off the beaten track,” eating foods prepared at local establishments and swimming in local rivers. He received pre-travel immunizations.
On examination, he appeared unwell, though his vital signs were normal. He had diffuse lymphadenopathy and a petechial rash on his chest, back, upper buttocks, legs, and feet. Cardiorespiratory and abdominal examinations were unremarkable. A CBC revealed an elevated WBC count of 76.9 x 10⁹/L with predominant eosinophilia (71.5 x 10⁹/L or 92% of WBCs). Hemoglobin, platelets, electrolytes, and liver function tests were normal. The patient was referred to a tertiary care center and was admitted to the hospital. Stool testing for ova and parasites, as well as serology for parasitic infections, was negative. A bone marrow aspiration and biopsy were performed and revealed the diagnosis of acute lymphoblastic leukemia (ALL).
DISCUSSION
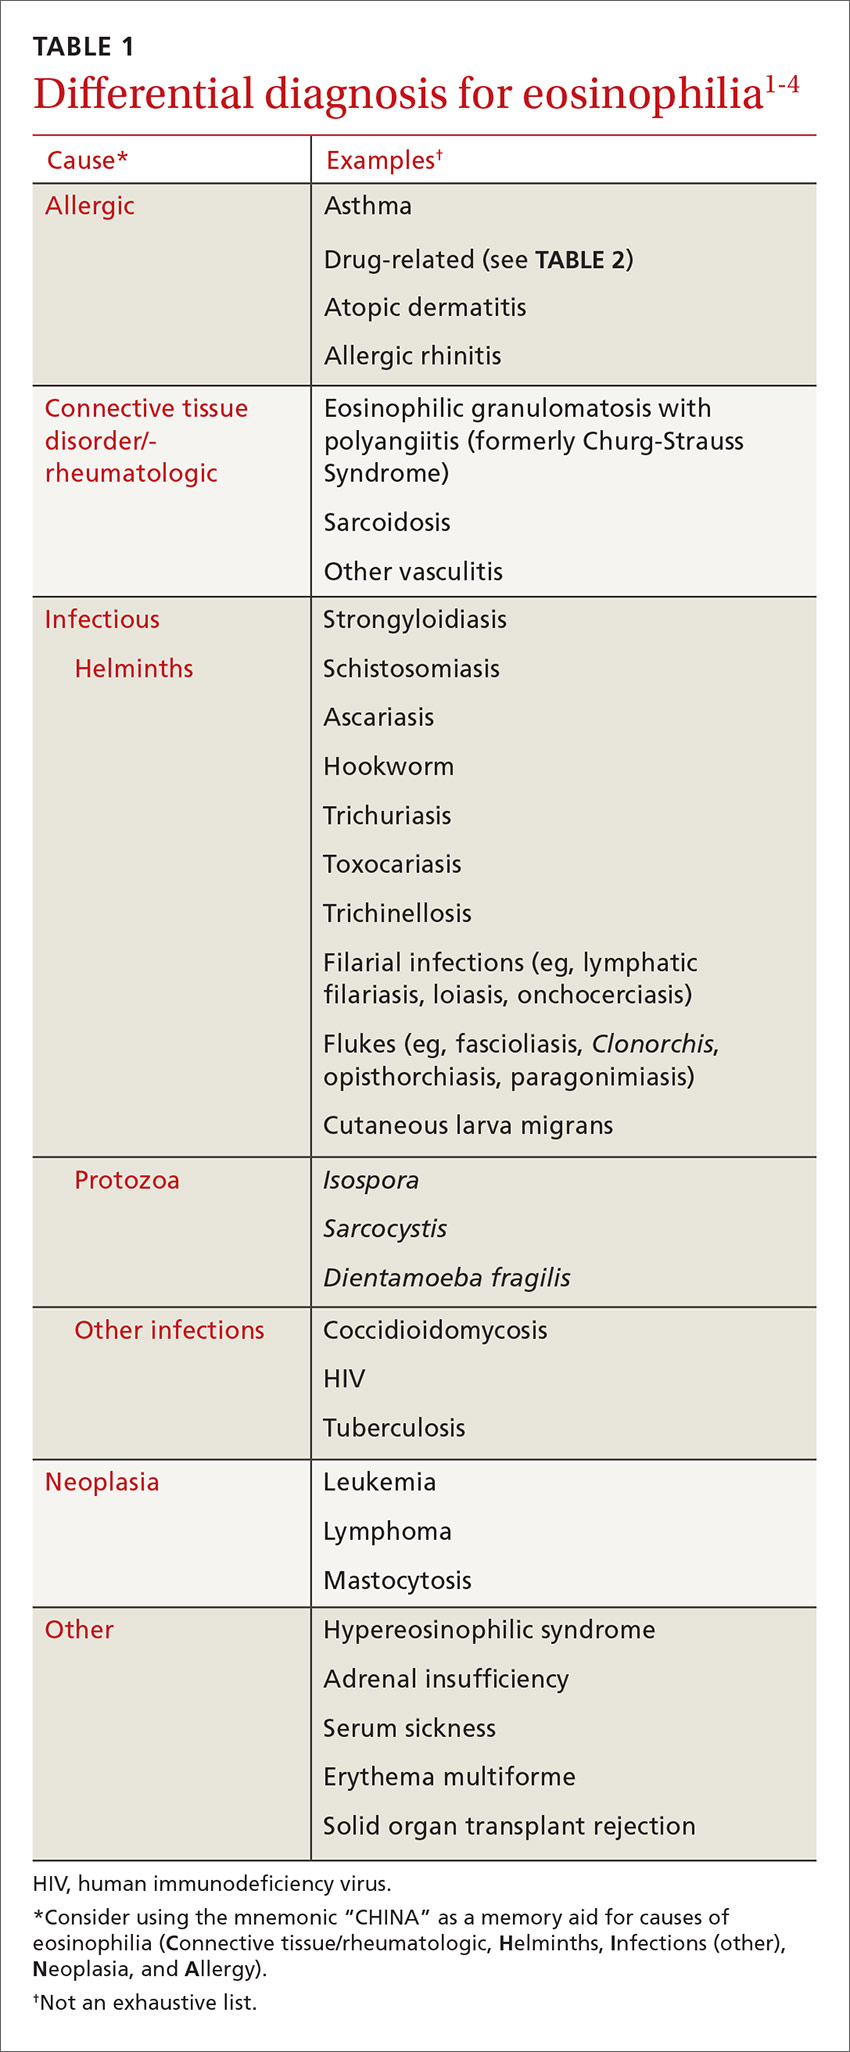
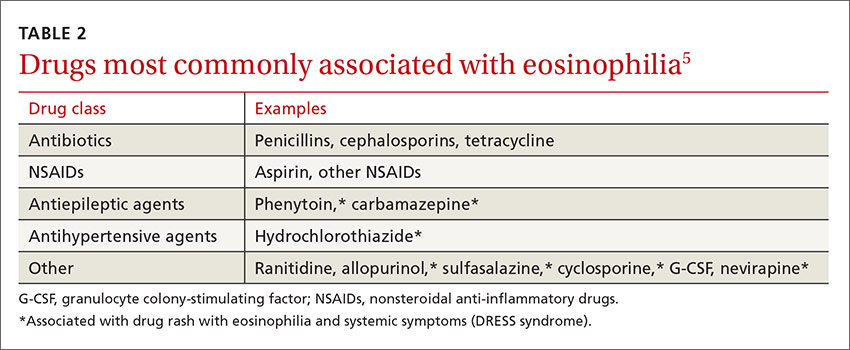
These 2 cases highlight how the presentation of eosinophilia can vary and how important it is to maintain a broad differential diagnosis (TABLE 11-4). Causes of eosinophilia are numerous and can be divided into 3 categories: primary, secondary, and idiopathic.1,5 Hematologic malignancy, where eosinophilia is clonal, is an example of a primary etiology. Causes of secondary eosinophilia include infectious diseases, drugs (TABLE 25), autoimmune disorders, and allergic conditions. Prolonged eosinophilia that is >3 x 10⁹/L is associated with end-organ damage. Dermatologic, pulmonary, gastrointestinal, and cardiac involvement is most common.2
Eosinophilia associated with parasitic infection
In returning travelers and international adoptees, multicellular helminthic parasites are the most common causes of eosinophilia, with eosinophilia occurring during tissue migration or penetration.1,3
Schistosomiasis is a chronic parasitic infection of the human vascular system. It is transmitted by contact with contaminated fresh water, where cercariae penetrate the skin. High prevalence areas include Africa and Southeast Asia. Acute infection can result in Katayama fever—a febrile illness with prominent eosinophilia that occurs 4 to 7 weeks after exposure.4 Diagnosis is primarily clinical with appropriate epidemiology, as serology may be negative early in infection. Praziquantel is the treatment of choice, though dosing varies by species, so expert consultation should be considered.
Soil-transmitted helminths, such as Ascaris (Ascaris lumbricoides), whipworm (Trichuris trichiura), and hookworm (Ancyclostoma duodenale and Necator americanus), can also cause eosinophilia during larval tissue migration. Following infection by ingestion or skin penetration, an acute respiratory illness, termed Löffler’s syndrome, can develop with associated eosinophilia.1 Once the helminths reach the adult stage, eosinophilia subsides. Patients are most commonly treated with albendazole 400 mg orally for 3 days.4
Fascioliasis is common in sheep-rearing areas. Humans are infected through ingestion of aquatic plants (eg, watercress). Parasitic migration through the duodenal wall and liver parenchyma can lead to fever, right upper quadrant pain, and eosinophilia. The incubation period is 6 to 12 weeks. Diagnosis during acute infection is by serology.4
Filarial infections, eg lymphatic filariasis, loiasis, and onchocerciasis, can also cause eosinophilia. The rise in eosinophils can be triggered by either the adult worms or circulating microfilariae.4 Treatment of fascioliasis and filarial infections varies and expert consultation is recommended.
Eosinophilia associated with primary hematologic malignancy
Eosinophilia is a rare presentation of hematologic malignancy. Acute myeloid leukemia, acute lymphoblastic leukemia (ALL), chronic myeloid leukemia, and myeloproliferative disorders have all been associated with eosinophilia. Hepatosplenomegaly, generalized lymphadenopathy, and cytopenias in other cell lines are often noted. Also, the degree of eosinophilia is often more pronounced (>5 x 10⁹/L). Patients with suspected hematologic malignancy should be urgently referred for expert consultation.5
A systematic approach to patients with eosinophilia
Consider the following approach in the assessment of patients with eosinophilia seen in the ambulatory care setting. Inpatients or patients being seen in developing areas may require a modified approach.
History. All patients with eosinophilia should have a thorough history taken, with particular attention paid to travel history. A travel history should make note of dates, duration and location of travel, and any relevant exposures, such as arthropod bites or swimming in freshwater. Dietary habits, such as ingestion of seafood, game, or undercooked meat can also be helpful in making a diagnosis.3,4
Physical exam. In addition to a general physical examination, the following features may be helpful in determining the etiology of eosinophilia. Wheeze is characteristic of parasites in a lung migration phase (eg, strongyloidiasis and ascariasis) or asthma. Hepatomegaly can be seen with liver flukes, visceral larva migrans, or schistosomiasis. Periorbital edema can be observed with Trichinella infection. Loa loa, a type of filarial infection, produces a transient, migratory angioedema, often localized to the wrists and large joints (termed Calabar swelling). Dermatitis of varying intensity may suggest filarial infection, schistosomiasis, or atopy. Perianal dermatitis is observed with strongyloidiasis. Cutaneous larva migrans is characterized by a linear, serpiginous rash.3,4
Laboratory investigations. Investigation will vary depending on the patient’s history, exposures, exam findings, and degree of eosinophilia. Any patient who is unwell or has significant eosinophilia (≥3 x 10⁹/L) may warrant more urgent referral to infectious disease, travel medicine, or hematology. Basic laboratory investigations should include a CBC with differential, routine serum chemistries, and liver enzymes. In the setting of significant eosinophilia, an electrocardiogram, cardiac enzyme levels, and a chest x-ray should be obtained to screen for end-organ damage related to eosinophilia.3-5
In patients in whom you suspect hematologic malignancy, bone marrow aspiration and biopsy are often needed to make the diagnosis.5
Parasitic infections are most often diagnosed on stool examination for ova and parasites or by serology. Stool should be collected on 3 separate days to increase diagnostic yield. Certain species of Schistosoma can also be diagnosed on direct microscopy of urine specimens. Serologic assays are available for schistosomiasis, strongyloidiasis, Toxocara, fascioliasis, filariasis, and Trichinella. Further investigations for filiariasis, including blood films, eye exam, and skin snips will vary with filarial species, so expert consultation should be considered.3,4
Our patients. The first patient with strongyloidiasis was treated with ivermectin 200 µg/kg/day orally for 2 days and experienced symptomatic improvement and resolution of eosinophilia. The second patient with ALL was admitted and referred to hematology and received induction chemotherapy. Treatment was well tolerated and the patient was discharged one week later, with appropriate follow-up.
THE TAKEAWAY
Eosinophilia is commonly encountered in primary care. The approach to eosinophilia and the differential diagnosis can be challenging. The correct diagnosis was reached in both cases by maintaining a broad differential diagnosis. Obtaining a travel and exposure history is fundamental, although noninfectious causes, including allergy, malignancy, and drug reaction, must always be considered.
1. Moore TA, Nutman TB. Eosinophilia in the returning traveler. Infect Dis Clin North Am. 1998;12:503-521.
2. Tefferi A, Gotlib J, Pardanani A. Hypereosinophilic syndrome and clonal eosinophilia: point-of-care diagnostic algorithm and treatment update. Mayo Clin Proc. 2010;85:158-164.
3. Schulte C, Krebs B, Jelinek T, et al. Diagnostic significance of blood eosinophilia in returning travelers. Clin Infect Dis. 2002;34:407-411.
4. Checkley AM, Chiodini PL, Dockrell DH, et al; British Infection Society and Hospital for Tropical Diseases. Eosinophilia in returning travellers and migrants from the tropics: UK recommendations for investigation and initial management. J Infect. 2010;60:1-20.
5. Tefferi A, Patnaik MM, Pardanani A. Eosinophilia: secondary, clonal and idiopathic. Br J Haematol. 2006;133:468-492.
CASE 1
A 13-month-old boy who was recently adopted from Ethiopia presented to a primary care physician with a 3-week history of bloody diarrhea accompanied by flatulence and bloating. Stool cultures were positive for Campylobacter and Shigella. He was prescribed azithromycin but saw only moderate improvement. He was then referred to the Infectious Diseases Department. Neonatal, pregnancy, and immunization histories were unknown and a review of systems was unremarkable. On exam, the child looked well; he weighed 9.6 kg (15th percentile), was 69.5 cm long (<3rd percentile), and his head circumference was 45 cm (10th percentile). Head and neck, cardiorespiratory, and abdominal examinations were unremarkable.
A complete blood count (CBC) showed an elevated white blood cell (WBC) count of 26 x 109/L (normal: 4-10 x 109/L) with predominant eosinophilia (10.4 x 10⁹/L or 40.1% of WBCs; normal: <0.45 x 10⁹/L or 0%-8%). Hemoglobin and platelets were within normal limits. Stool testing for ova and parasites showed Strongyloides stercoralis larvae. Strongyloides serology was negative and Filaria serology was equivocal.
CASE 2
A 15-year-old boy was assessed for a 3-week history of fever and eosinophilia. He had enlarged cervical lymph nodes, a new rash, and had lost 4 pounds. He denied gastrointestinal symptoms, dyspnea, headaches, or chest pain. His past medical and family histories were unremarkable and he reported no drug use or allergies. He had traveled to Cuba with his family for 15 days 3 months prior to presentation. He recalled diarrhea while traveling, which resolved spontaneously. He and his family had traveled “off the beaten track,” eating foods prepared at local establishments and swimming in local rivers. He received pre-travel immunizations.
On examination, he appeared unwell, though his vital signs were normal. He had diffuse lymphadenopathy and a petechial rash on his chest, back, upper buttocks, legs, and feet. Cardiorespiratory and abdominal examinations were unremarkable. A CBC revealed an elevated WBC count of 76.9 x 10⁹/L with predominant eosinophilia (71.5 x 10⁹/L or 92% of WBCs). Hemoglobin, platelets, electrolytes, and liver function tests were normal. The patient was referred to a tertiary care center and was admitted to the hospital. Stool testing for ova and parasites, as well as serology for parasitic infections, was negative. A bone marrow aspiration and biopsy were performed and revealed the diagnosis of acute lymphoblastic leukemia (ALL).
DISCUSSION
These 2 cases highlight how the presentation of eosinophilia can vary and how important it is to maintain a broad differential diagnosis (TABLE 11-4). Causes of eosinophilia are numerous and can be divided into 3 categories: primary, secondary, and idiopathic.1,5 Hematologic malignancy, where eosinophilia is clonal, is an example of a primary etiology. Causes of secondary eosinophilia include infectious diseases, drugs (TABLE 25), autoimmune disorders, and allergic conditions. Prolonged eosinophilia that is >3 x 10⁹/L is associated with end-organ damage. Dermatologic, pulmonary, gastrointestinal, and cardiac involvement is most common.2
Eosinophilia associated with parasitic infection
In returning travelers and international adoptees, multicellular helminthic parasites are the most common causes of eosinophilia, with eosinophilia occurring during tissue migration or penetration.1,3
Schistosomiasis is a chronic parasitic infection of the human vascular system. It is transmitted by contact with contaminated fresh water, where cercariae penetrate the skin. High prevalence areas include Africa and Southeast Asia. Acute infection can result in Katayama fever—a febrile illness with prominent eosinophilia that occurs 4 to 7 weeks after exposure.4 Diagnosis is primarily clinical with appropriate epidemiology, as serology may be negative early in infection. Praziquantel is the treatment of choice, though dosing varies by species, so expert consultation should be considered.
Soil-transmitted helminths, such as Ascaris (Ascaris lumbricoides), whipworm (Trichuris trichiura), and hookworm (Ancyclostoma duodenale and Necator americanus), can also cause eosinophilia during larval tissue migration. Following infection by ingestion or skin penetration, an acute respiratory illness, termed Löffler’s syndrome, can develop with associated eosinophilia.1 Once the helminths reach the adult stage, eosinophilia subsides. Patients are most commonly treated with albendazole 400 mg orally for 3 days.4
Fascioliasis is common in sheep-rearing areas. Humans are infected through ingestion of aquatic plants (eg, watercress). Parasitic migration through the duodenal wall and liver parenchyma can lead to fever, right upper quadrant pain, and eosinophilia. The incubation period is 6 to 12 weeks. Diagnosis during acute infection is by serology.4
Filarial infections, eg lymphatic filariasis, loiasis, and onchocerciasis, can also cause eosinophilia. The rise in eosinophils can be triggered by either the adult worms or circulating microfilariae.4 Treatment of fascioliasis and filarial infections varies and expert consultation is recommended.
Eosinophilia associated with primary hematologic malignancy
Eosinophilia is a rare presentation of hematologic malignancy. Acute myeloid leukemia, acute lymphoblastic leukemia (ALL), chronic myeloid leukemia, and myeloproliferative disorders have all been associated with eosinophilia. Hepatosplenomegaly, generalized lymphadenopathy, and cytopenias in other cell lines are often noted. Also, the degree of eosinophilia is often more pronounced (>5 x 10⁹/L). Patients with suspected hematologic malignancy should be urgently referred for expert consultation.5
A systematic approach to patients with eosinophilia
Consider the following approach in the assessment of patients with eosinophilia seen in the ambulatory care setting. Inpatients or patients being seen in developing areas may require a modified approach.
History. All patients with eosinophilia should have a thorough history taken, with particular attention paid to travel history. A travel history should make note of dates, duration and location of travel, and any relevant exposures, such as arthropod bites or swimming in freshwater. Dietary habits, such as ingestion of seafood, game, or undercooked meat can also be helpful in making a diagnosis.3,4
Physical exam. In addition to a general physical examination, the following features may be helpful in determining the etiology of eosinophilia. Wheeze is characteristic of parasites in a lung migration phase (eg, strongyloidiasis and ascariasis) or asthma. Hepatomegaly can be seen with liver flukes, visceral larva migrans, or schistosomiasis. Periorbital edema can be observed with Trichinella infection. Loa loa, a type of filarial infection, produces a transient, migratory angioedema, often localized to the wrists and large joints (termed Calabar swelling). Dermatitis of varying intensity may suggest filarial infection, schistosomiasis, or atopy. Perianal dermatitis is observed with strongyloidiasis. Cutaneous larva migrans is characterized by a linear, serpiginous rash.3,4
Laboratory investigations. Investigation will vary depending on the patient’s history, exposures, exam findings, and degree of eosinophilia. Any patient who is unwell or has significant eosinophilia (≥3 x 10⁹/L) may warrant more urgent referral to infectious disease, travel medicine, or hematology. Basic laboratory investigations should include a CBC with differential, routine serum chemistries, and liver enzymes. In the setting of significant eosinophilia, an electrocardiogram, cardiac enzyme levels, and a chest x-ray should be obtained to screen for end-organ damage related to eosinophilia.3-5
In patients in whom you suspect hematologic malignancy, bone marrow aspiration and biopsy are often needed to make the diagnosis.5
Parasitic infections are most often diagnosed on stool examination for ova and parasites or by serology. Stool should be collected on 3 separate days to increase diagnostic yield. Certain species of Schistosoma can also be diagnosed on direct microscopy of urine specimens. Serologic assays are available for schistosomiasis, strongyloidiasis, Toxocara, fascioliasis, filariasis, and Trichinella. Further investigations for filiariasis, including blood films, eye exam, and skin snips will vary with filarial species, so expert consultation should be considered.3,4
Our patients. The first patient with strongyloidiasis was treated with ivermectin 200 µg/kg/day orally for 2 days and experienced symptomatic improvement and resolution of eosinophilia. The second patient with ALL was admitted and referred to hematology and received induction chemotherapy. Treatment was well tolerated and the patient was discharged one week later, with appropriate follow-up.
THE TAKEAWAY
Eosinophilia is commonly encountered in primary care. The approach to eosinophilia and the differential diagnosis can be challenging. The correct diagnosis was reached in both cases by maintaining a broad differential diagnosis. Obtaining a travel and exposure history is fundamental, although noninfectious causes, including allergy, malignancy, and drug reaction, must always be considered.
1. Moore TA, Nutman TB. Eosinophilia in the returning traveler. Infect Dis Clin North Am. 1998;12:503-521.
2. Tefferi A, Gotlib J, Pardanani A. Hypereosinophilic syndrome and clonal eosinophilia: point-of-care diagnostic algorithm and treatment update. Mayo Clin Proc. 2010;85:158-164.
3. Schulte C, Krebs B, Jelinek T, et al. Diagnostic significance of blood eosinophilia in returning travelers. Clin Infect Dis. 2002;34:407-411.
4. Checkley AM, Chiodini PL, Dockrell DH, et al; British Infection Society and Hospital for Tropical Diseases. Eosinophilia in returning travellers and migrants from the tropics: UK recommendations for investigation and initial management. J Infect. 2010;60:1-20.
5. Tefferi A, Patnaik MM, Pardanani A. Eosinophilia: secondary, clonal and idiopathic. Br J Haematol. 2006;133:468-492.

Monitoring home BP readings just got easier
PRACTICE CHANGER
Use this easy “3 out of 10 rule” to quickly sift through home blood pressure readings and identify patients with uncontrolled hypertension who require pharmacologic management.1
Strength of recommendation
B: Based on a single, good quality, multicenter trial.
Sharman JE, Blizzard L, Kosmala W, et al. Pragmatic method using blood pressure diaries to assess blood pressure control. Ann Fam Med. 2016;14:63-69.
ILLUSTRATIVE CASE
A 64-year-old woman presents to your office for a follow-up visit for her hypertension. She is currently managed on lisinopril 20 mg/d and hydrochlorothiazide 25 mg/d without any problems. The patient’s blood pressure (BP) in the office today is 148/84 mm Hg, but her home blood pressure (HBP) readings are much lower (see TABLE). Should you increase her lisinopril dose today?
Hypertension has been diagnosed on the basis of office readings of BP for almost a century, but the readings can be so inaccurate that they are not useful.2 The US Preventive Services Task Force recommends the use of ambulatory blood pressure monitoring (ABPM) to accurately diagnose hypertension in all patients, while The Seventh Report of the Joint National Committee on Prevention, Detection, Evaluation, and Treatment of High Blood Pressure (JNC 7) recommends ABPM for patients suspected of having white-coat hypertension and any patient with resistant hypertension,3,4 but ABPM is not always acceptable to patients.5
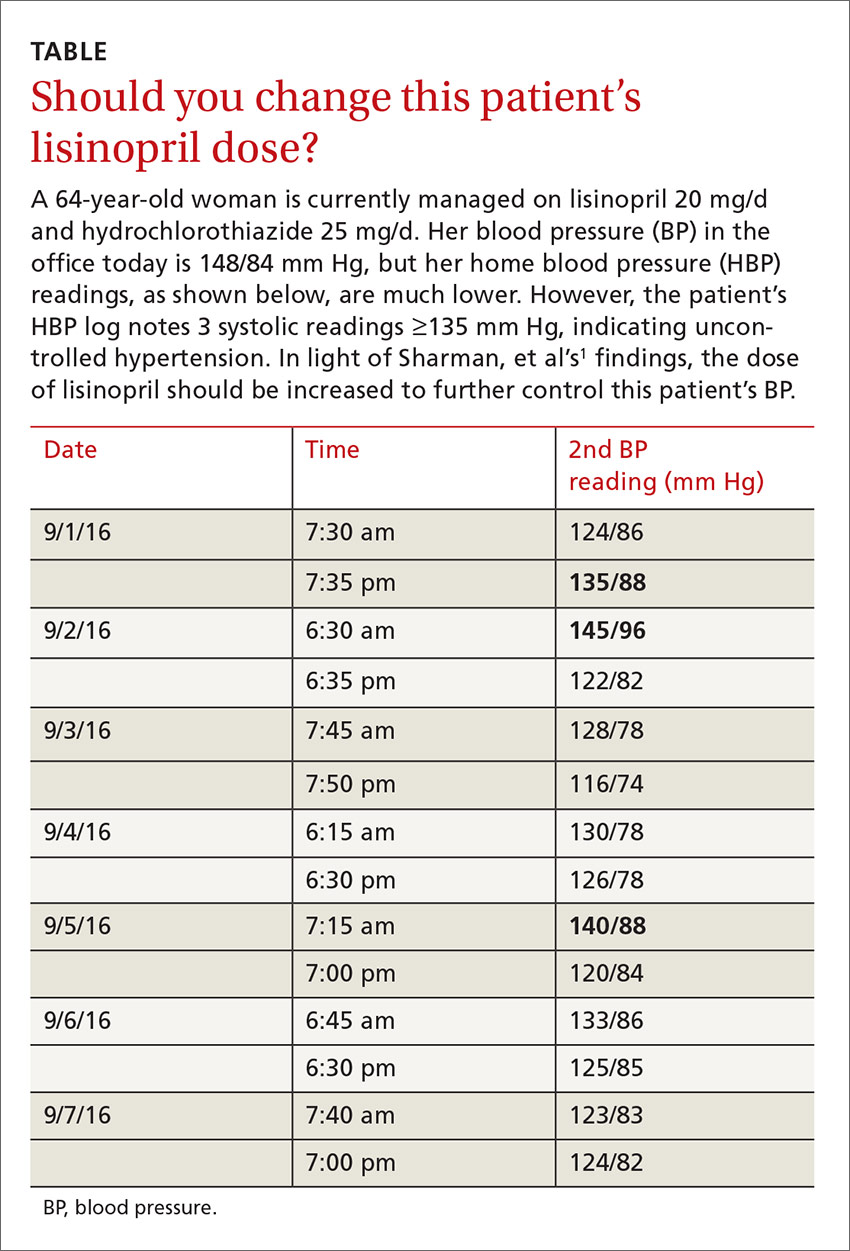
Guidelines recommend HBP monitoring for long-term follow-up of hypertension
The European Society of Hypertension practice guideline on HBP monitoring suggests that HBP values <130/80 mm Hg may be considered normal, while a mean HBP ≥135/85 mm Hg is considered elevated.9 The guideline recommends HBP monitoring for 3 to 7 days prior to a patient’s follow-up appointment with 2 readings taken one to 2 minutes apart in the morning and evening.9 In a busy clinic, averaging all of these home values can be time-consuming.
So how can primary care physicians accurately and efficiently streamline the process? This study sought to answer that question.
STUDY SUMMARY
When 3 of 10 readings are elevated, it’s predictive
This multicenter trial compared HBP monitoring to 24-hour ABPM in 286 patients with uncomplicated essential hypertension to determine the optimal percentage of HBP readings needed to diagnose uncontrolled BP (HBP ≥135/85 mm Hg). Patients were included if they were diagnosed with uncomplicated hypertension, not pregnant, ≥18 years of age, and taking ≤3 antihypertensive medications. Medication compliance was verified by a study nurse at a clinic visit. Patients were excluded if they had a significant abnormal left ventricular mass index (women >59 g/m2; men >64 g/m2), coronary artery or renal disease, secondary hypertension, serum creatinine exceeding 1.6 mg/dL, aortic valve stenosis, upper limb obstructive atherosclerosis, or BP >180/100 mm Hg.
Approximately half of the participants were women (53%), average body mass index was 29.4 kg/m2, and the average number of hypertension medications being taken was 2.4. The patients were instructed to take 2 BP readings (one minute apart) at home 3 times daily, in the morning (between 6 am and 10 am), at noon, and in the evening (between 6 pm and 10 pm), and to record only the second reading for 7 days. Only the morning and evening readings were used for analysis in the study. The 24-hour ABP was measured every 30 minutes during the daytime hours and every 60 minutes overnight. The primary outcome was to determine the optimal number of systolic HBP readings above goal (135 mm Hg), from the last 10 recordings, that would best predict elevated 24-hour ABP. Secondary outcomes were various cardiovascular markers of target end-organ damage.
The researchers found that if at least 3 of the last 10 HBP readings were elevated (≥135 mm Hg systolic), the patient was likely to have hypertension on 24-hour ABPM (≥130 mm Hg). When patients had <3 HBP elevations out of 10 readings, their mean (±standard deviation [SD]) 24-hour ambulatory daytime systolic BP was 132.7 (±11.1) mm Hg and their mean systolic HBP value was 120.4 (±9.8) mm Hg. When patients had ≥3 HBP elevations, their mean 24-hour ambulatory daytime systolic BP was 143.4 (±11.2) mm Hg and their mean systolic HBP value was 147.4 (±10.5) mm Hg.
The positive and negative predictive values of ≥3 HBP elevations were 0.85 (95% confidence interval [CI], 0.78-0.91) and 0.56 (95% CI, 0.48-0.64), respectively, for a 24-hour systolic ABP of ≥130 mm Hg. Three elevations or more in HBP, out of the last 10 readings, was also an indicator for target organ disease assessed by aortic stiffness and increased left ventricular mass and decreased function.
The sensitivity and specificity of ≥3 elevations for mean 24-hour ABP systolic readings ≥130 mm Hg were 62% and 80%, respectively, and for 24-hour ABP daytime systolic readings ≥135 mm Hg were 65% and 77%, respectively.
WHAT’S NEW
Monitoring home BP can be simplified
The researchers found that HBP monitoring correlates well with ABPM and that their method provides clinicians with a simple way (3 of the past 10 measurements ≥135 mm Hg systolic) to use HBP readings to make clinical decisions regarding BP management.
CAVEATS
Ideal BP goals are hazy, and a lot of patient education is required
Conflicting information and opinions remain regarding the ideal intensive and standard BP goals in different populations.10,11 Systolic BP goals in this study (≥130 mm Hg for overall 24-hour ABP and ≥135 mm Hg for 24-hour ABP daytime readings) are recommended by some experts, but are not commonly recognized goals in the United States. This study found good correlation between HBP and ABPM at these goals, and it seems likely that this correlation could be extrapolated for similar BP goals.
Other limitations are that: 1) The study focused only on systolic BP goals; 2) Patients in the study adhered to precise instructions on BP monitoring. HBP monitoring requires significant patient education on the proper use of the equipment and the monitoring schedule; and 3) While end-organ complication outcomes showed numerical decreases in function, the clinical significance of these reductions for patients is unclear.
CHALLENGES TO IMPLEMENTATION
Cost of device and improper cuff sizes could be barriers
The cost of HBP monitors ($40-$60) has decreased significantly over time, but the devices are not always covered by insurance and may be unobtainable for some people. Additionally, patients should be counseled on how to determine the appropriate cuff size to ensure the accuracy of the measurements.
The British Hypertensive Society maintains a list of validated BP devices on their Web site: http://bhsoc.org/bp-monitors/bp-monitors.12
ACKNOWLEDGEMENT
The PURLs Surveillance System was supported in part by Grant Number UL1RR024999 from the National Center For Research Resources, a Clinical Translational Science Award to the University of Chicago. The content is solely the responsibility of the authors and does not necessarily represent the official views of the National Center For Research Resources or the National Institutes of Health.
1. Sharman JE, Blizzard L, Kosmala W, et al. Pragmatic method using blood pressure diaries to assess blood pressure control. Ann Fam Med. 2016;14:63-69.
2. Sebo P, Pechère-Bertschi A, Herrmann FR, et al. Blood pressure measurements are unreliable to diagnose hypertension in primary care. J Hypertens. 2014;32:509-517.
3. Siu AL; U.S. Preventive Services Task Force. Screening for high blood pressure in adults: US Preventive Services Task Force Recommendation Statement. Ann Int Med. 2015;163:778-786. Available at: http://www.uspreventiveservicestaskforce.org/Page/Document/RecommendationStatementFinal/high-blood-pressure-in-adults-screening. Accessed June 16, 2016.
4. Chobanian AV, Bakris GL, Black HR, et al. The Seventh Report of the Joint National Committee on Prevention, Detection, Evaluation, and Treatment of High Blood Pressure. JAMA. 2003;289:2560-2572.
5. Mallion JM, de Gaudemaris R, Baguet JP, et al. Acceptability and tolerance of ambulatory blood pressure measurement in the hypertensive patient. Blood Press Monit. 1996;1:197-203.
6. Gaborieau V, Delarche N, Gosse P. Ambulatory blood pressure monitoring versus self-measurement of blood pressure at home: correlation with target organ damage. J Hypertens. 2008;26:1919-1927.
7. Ward AM, Takahashi O, Stevens R, et al. Home measurement of blood pressure and cardiovascular disease: systematic review and meta-analysis of prospective studies. J Hypertens. 2012;30:449-456.
8. Pickering TG, Miller NH, Ogedegbe G, et al. Call to action on use and reimbursement for home blood pressure monitoring: executive summary. A joint scientific statement from the American Heart Association, American Society of Hypertension, and Preventive Cardiovascular Nurses Association. Hypertension. 2008;52:1-9.
9. Parati G, Stergiou GS, Asmar R, et al; ESH Working Group on Blood Pressure Monitoring. European Society of Hypertension practice guidelines for home blood pressure monitoring. J Hum Hypertens. 2010;24:779-785.
10. The SPRINT Research Group. A randomized trial of intensive versus standard blood-pressure control. N Engl J Med. 2015;373:2103-2116.
11. Brunström M, Carlberg B. Effect of antihypertensive treatment at different blood pressure levels in patients with diabetes mellitus: systematic review and meta-analyses. BMJ. 2016;352:i717.
12. British Hypertensive Society. BP Monitors. Available at: http://bhsoc.org/bp-monitors/bp-monitors. Accessed June 27, 2016.
PRACTICE CHANGER
Use this easy “3 out of 10 rule” to quickly sift through home blood pressure readings and identify patients with uncontrolled hypertension who require pharmacologic management.1
Strength of recommendation
B: Based on a single, good quality, multicenter trial.
Sharman JE, Blizzard L, Kosmala W, et al. Pragmatic method using blood pressure diaries to assess blood pressure control. Ann Fam Med. 2016;14:63-69.
ILLUSTRATIVE CASE
A 64-year-old woman presents to your office for a follow-up visit for her hypertension. She is currently managed on lisinopril 20 mg/d and hydrochlorothiazide 25 mg/d without any problems. The patient’s blood pressure (BP) in the office today is 148/84 mm Hg, but her home blood pressure (HBP) readings are much lower (see TABLE). Should you increase her lisinopril dose today?
Hypertension has been diagnosed on the basis of office readings of BP for almost a century, but the readings can be so inaccurate that they are not useful.2 The US Preventive Services Task Force recommends the use of ambulatory blood pressure monitoring (ABPM) to accurately diagnose hypertension in all patients, while The Seventh Report of the Joint National Committee on Prevention, Detection, Evaluation, and Treatment of High Blood Pressure (JNC 7) recommends ABPM for patients suspected of having white-coat hypertension and any patient with resistant hypertension,3,4 but ABPM is not always acceptable to patients.5
Guidelines recommend HBP monitoring for long-term follow-up of hypertension
The European Society of Hypertension practice guideline on HBP monitoring suggests that HBP values <130/80 mm Hg may be considered normal, while a mean HBP ≥135/85 mm Hg is considered elevated.9 The guideline recommends HBP monitoring for 3 to 7 days prior to a patient’s follow-up appointment with 2 readings taken one to 2 minutes apart in the morning and evening.9 In a busy clinic, averaging all of these home values can be time-consuming.
So how can primary care physicians accurately and efficiently streamline the process? This study sought to answer that question.
STUDY SUMMARY
When 3 of 10 readings are elevated, it’s predictive
This multicenter trial compared HBP monitoring to 24-hour ABPM in 286 patients with uncomplicated essential hypertension to determine the optimal percentage of HBP readings needed to diagnose uncontrolled BP (HBP ≥135/85 mm Hg). Patients were included if they were diagnosed with uncomplicated hypertension, not pregnant, ≥18 years of age, and taking ≤3 antihypertensive medications. Medication compliance was verified by a study nurse at a clinic visit. Patients were excluded if they had a significant abnormal left ventricular mass index (women >59 g/m2; men >64 g/m2), coronary artery or renal disease, secondary hypertension, serum creatinine exceeding 1.6 mg/dL, aortic valve stenosis, upper limb obstructive atherosclerosis, or BP >180/100 mm Hg.
Approximately half of the participants were women (53%), average body mass index was 29.4 kg/m2, and the average number of hypertension medications being taken was 2.4. The patients were instructed to take 2 BP readings (one minute apart) at home 3 times daily, in the morning (between 6 am and 10 am), at noon, and in the evening (between 6 pm and 10 pm), and to record only the second reading for 7 days. Only the morning and evening readings were used for analysis in the study. The 24-hour ABP was measured every 30 minutes during the daytime hours and every 60 minutes overnight. The primary outcome was to determine the optimal number of systolic HBP readings above goal (135 mm Hg), from the last 10 recordings, that would best predict elevated 24-hour ABP. Secondary outcomes were various cardiovascular markers of target end-organ damage.
The researchers found that if at least 3 of the last 10 HBP readings were elevated (≥135 mm Hg systolic), the patient was likely to have hypertension on 24-hour ABPM (≥130 mm Hg). When patients had <3 HBP elevations out of 10 readings, their mean (±standard deviation [SD]) 24-hour ambulatory daytime systolic BP was 132.7 (±11.1) mm Hg and their mean systolic HBP value was 120.4 (±9.8) mm Hg. When patients had ≥3 HBP elevations, their mean 24-hour ambulatory daytime systolic BP was 143.4 (±11.2) mm Hg and their mean systolic HBP value was 147.4 (±10.5) mm Hg.
The positive and negative predictive values of ≥3 HBP elevations were 0.85 (95% confidence interval [CI], 0.78-0.91) and 0.56 (95% CI, 0.48-0.64), respectively, for a 24-hour systolic ABP of ≥130 mm Hg. Three elevations or more in HBP, out of the last 10 readings, was also an indicator for target organ disease assessed by aortic stiffness and increased left ventricular mass and decreased function.
The sensitivity and specificity of ≥3 elevations for mean 24-hour ABP systolic readings ≥130 mm Hg were 62% and 80%, respectively, and for 24-hour ABP daytime systolic readings ≥135 mm Hg were 65% and 77%, respectively.
WHAT’S NEW
Monitoring home BP can be simplified
The researchers found that HBP monitoring correlates well with ABPM and that their method provides clinicians with a simple way (3 of the past 10 measurements ≥135 mm Hg systolic) to use HBP readings to make clinical decisions regarding BP management.
CAVEATS
Ideal BP goals are hazy, and a lot of patient education is required
Conflicting information and opinions remain regarding the ideal intensive and standard BP goals in different populations.10,11 Systolic BP goals in this study (≥130 mm Hg for overall 24-hour ABP and ≥135 mm Hg for 24-hour ABP daytime readings) are recommended by some experts, but are not commonly recognized goals in the United States. This study found good correlation between HBP and ABPM at these goals, and it seems likely that this correlation could be extrapolated for similar BP goals.
Other limitations are that: 1) The study focused only on systolic BP goals; 2) Patients in the study adhered to precise instructions on BP monitoring. HBP monitoring requires significant patient education on the proper use of the equipment and the monitoring schedule; and 3) While end-organ complication outcomes showed numerical decreases in function, the clinical significance of these reductions for patients is unclear.
CHALLENGES TO IMPLEMENTATION
Cost of device and improper cuff sizes could be barriers
The cost of HBP monitors ($40-$60) has decreased significantly over time, but the devices are not always covered by insurance and may be unobtainable for some people. Additionally, patients should be counseled on how to determine the appropriate cuff size to ensure the accuracy of the measurements.
The British Hypertensive Society maintains a list of validated BP devices on their Web site: http://bhsoc.org/bp-monitors/bp-monitors.12
ACKNOWLEDGEMENT
The PURLs Surveillance System was supported in part by Grant Number UL1RR024999 from the National Center For Research Resources, a Clinical Translational Science Award to the University of Chicago. The content is solely the responsibility of the authors and does not necessarily represent the official views of the National Center For Research Resources or the National Institutes of Health.
1. Sharman JE, Blizzard L, Kosmala W, et al. Pragmatic method using blood pressure diaries to assess blood pressure control. Ann Fam Med. 2016;14:63-69.
2. Sebo P, Pechère-Bertschi A, Herrmann FR, et al. Blood pressure measurements are unreliable to diagnose hypertension in primary care. J Hypertens. 2014;32:509-517.
3. Siu AL; U.S. Preventive Services Task Force. Screening for high blood pressure in adults: US Preventive Services Task Force Recommendation Statement. Ann Int Med. 2015;163:778-786. Available at: http://www.uspreventiveservicestaskforce.org/Page/Document/RecommendationStatementFinal/high-blood-pressure-in-adults-screening. Accessed June 16, 2016.
4. Chobanian AV, Bakris GL, Black HR, et al. The Seventh Report of the Joint National Committee on Prevention, Detection, Evaluation, and Treatment of High Blood Pressure. JAMA. 2003;289:2560-2572.
5. Mallion JM, de Gaudemaris R, Baguet JP, et al. Acceptability and tolerance of ambulatory blood pressure measurement in the hypertensive patient. Blood Press Monit. 1996;1:197-203.
6. Gaborieau V, Delarche N, Gosse P. Ambulatory blood pressure monitoring versus self-measurement of blood pressure at home: correlation with target organ damage. J Hypertens. 2008;26:1919-1927.
7. Ward AM, Takahashi O, Stevens R, et al. Home measurement of blood pressure and cardiovascular disease: systematic review and meta-analysis of prospective studies. J Hypertens. 2012;30:449-456.
8. Pickering TG, Miller NH, Ogedegbe G, et al. Call to action on use and reimbursement for home blood pressure monitoring: executive summary. A joint scientific statement from the American Heart Association, American Society of Hypertension, and Preventive Cardiovascular Nurses Association. Hypertension. 2008;52:1-9.
9. Parati G, Stergiou GS, Asmar R, et al; ESH Working Group on Blood Pressure Monitoring. European Society of Hypertension practice guidelines for home blood pressure monitoring. J Hum Hypertens. 2010;24:779-785.
10. The SPRINT Research Group. A randomized trial of intensive versus standard blood-pressure control. N Engl J Med. 2015;373:2103-2116.
11. Brunström M, Carlberg B. Effect of antihypertensive treatment at different blood pressure levels in patients with diabetes mellitus: systematic review and meta-analyses. BMJ. 2016;352:i717.
12. British Hypertensive Society. BP Monitors. Available at: http://bhsoc.org/bp-monitors/bp-monitors. Accessed June 27, 2016.
Copyright © 2016. The Family Physicians Inquiries Network. All rights reserved.

A step-wise approach to exertional leg pain
PRACTICE RECOMMENDATIONS
› Consider the possibility of vascular and neurologic problems as the source of exertional leg pain (ELP). C
› Order magnetic resonance imaging to evaluate patients with ELP and negative x-rays for stress fractures. C
› Measure lower extremity intracompartmental pressures both before and after exercise when you suspect chronic exertional compartmental syndrome. Doing so is the gold standard for the diagnosis of this condition. B
Strength of recommendation (SOR)
A Good-quality patient-oriented evidence
B Inconsistent or limited-quality patient-oriented evidence
C Consensus, usual practice, opinion, disease-oriented evidence, case series
Most family physicians are accustomed to treating active patients with shin splints and stress fractures. But many are less familiar with, and slower to recognize, other sources of exertional leg pain (ELP), defined as exercise-related pain that localizes in the lower extremity distal to the knee and proximal to the talocrural joint.1
ELP has a broad differential diagnosis that includes other musculoskeletal conditions—most notably chronic exertional compartment syndrome (CECS), which has been found to affect 33% of athletes with chronic ELP1—as well as a number of vascular and neurologic causes.2-4 In addition, etiologies may overlap. Greater awareness of the many causes of ELP can help you to avoid the unnecessary use of expensive diagnostic tests as well as delayed diagnosis and treatment.
A thorough medical and activity history, symptom review, and physical examination are your most important tools when patients present with ELP. When the cause is not obvious or the patient fails to respond to conservative measures, x-rays, magnetic resonance imaging (MRI), vascular studies, electromyography and nerve conduction studies, and/or intracompartmental pressure testing may be needed to find the source of the symptoms. In the text that follows, we review both common and relatively uncommon sources of ELP, using a stepwise diagnostic approach. You’ll find a diagnostic challenge, in which you can test your skills and a more comprehensive differential diagnosis in the TABLE.1-3,5-9
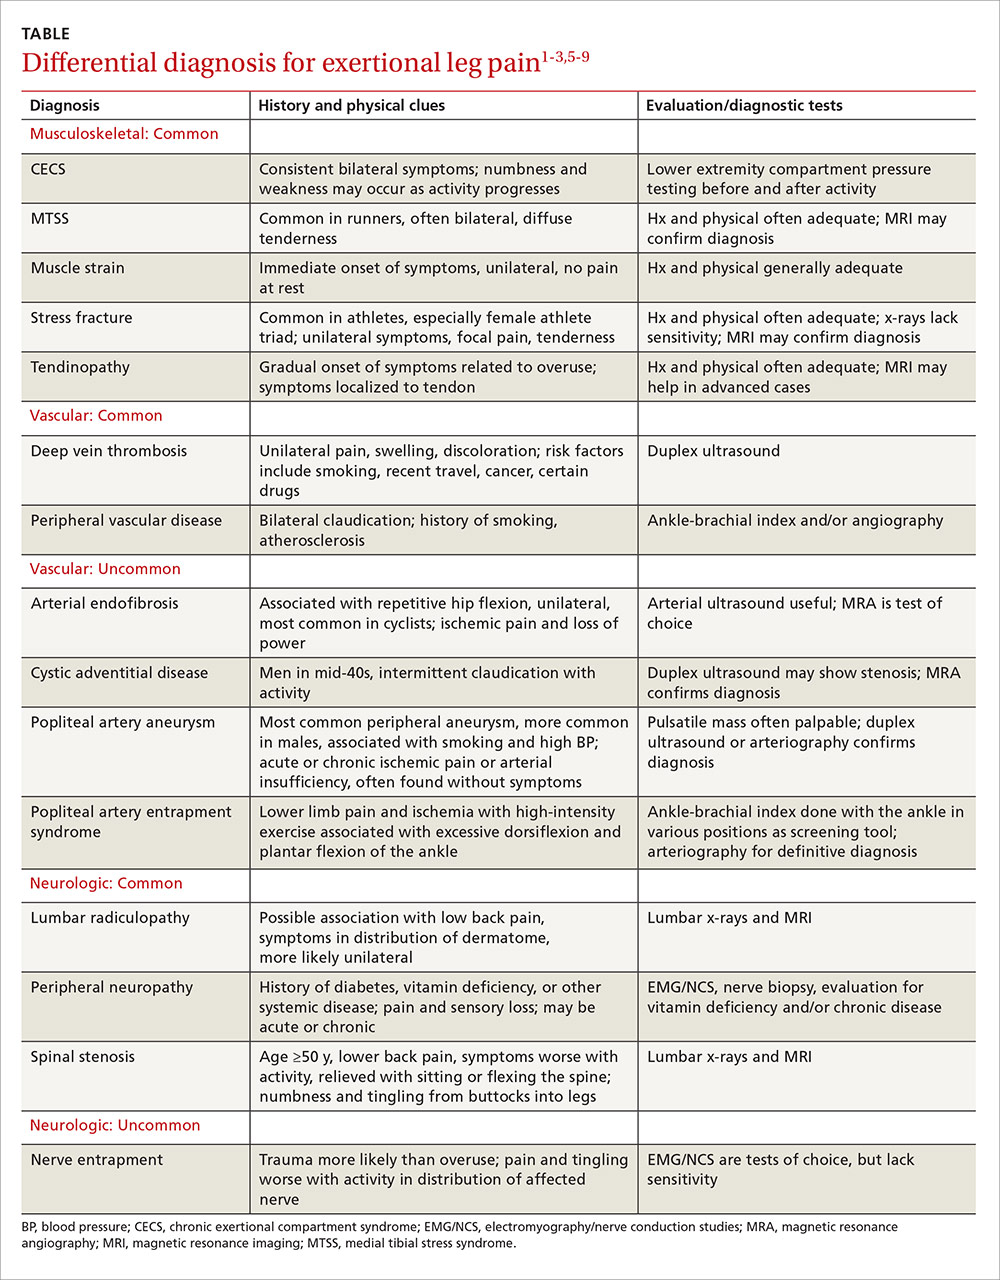
Musculoskeletal injuries: Shin splints and beyond
Medial tibial stress syndrome (MTSS), commonly known as shin splints, is characterized by pain and tenderness over the posteromedial aspect of the distal tibia.3 It typically results in diffuse pain that occurs with exercise, but may persist at rest in severe cases.3-6 Less often, localized swelling may also be present.2
MTSS accounts for between 6% and 16% of all running injuries.2,10 It is associated with a spectrum of tibial stress injuries, including periostitis, tendinopathy, and stress reaction, with dysfunction of the tibialis posterior, tibialis anterior, and soleus muscles thought to be contributing factors.2,11 Intrinsic factors include high body mass index (BMI), female sex, excessive internal and external hip rotation, hyperpronation, and hyper plantar flexion.2,10,12
X-rays of the leg are typically normal in patients with MTSS and should be considered only if the clinical presentation suggests the possibility of an alternative diagnosis, such as a stress fracture or tumor.2-4,13 Advanced imaging such as MRI or triple phase bone scans (TPBS) are useful when the diagnosis is in question and will reveal an abnormally high signal along the posterior medial tibial surface or the classic train-track appearance of nucleotide uptake in patients with MTSS.2 MRI readily shows periosteal reaction and bony edema and has a sensitivity of 78% to 89% and a specificity of 33% to 100% for the diagnosis of MTSS.14,15
Initial management of MTSS is conservative, with the mainstay of treatment consisting of rest, ice, and nonsteroidal anti-inflammatory drugs (NSAIDs).3,13,16 While ice, NSAIDs, proper conditioning, physical therapy to stretch and strengthen the calf musculature, rigid orthotics to correct foot hyperpronation, and activity modification are all appropriate treatments, randomized controlled trials have shown none of these interventions to be more effective than rest alone.2 Non-operative treatment is usually successful, but surgery may be required for severe or refractory cases. Procedures include posteromedial fasciotomy, release of the medial soleus fascial bridge, deep compartment fasciotomy, or removal of a section of the distal tibia periosteum.3,4
Lower extremity stress fracture. Stress fractures are caused by repetitive loading that results in microtrauma, including bony microfractures. The vast majority of cases—80% to 95% of stress fractures—affect the lower extremities, and most involve the tibia.2-4,6,13,17 The most common presentation is an insidious onset of pain over a specific bony area with a normal appearance, although localized swelling or erythema may occasionally be present.3,14,17,18 The pain may be reproduced or worsened by weight-bearing activities and relieved by rest.14,18
Consider the female athlete triad. In evaluating a patient with a stress fracture, pay close attention to dietary history, BMI, and, in female athletes, take a detailed menstrual history. Such patients are at risk for amenorrhea, low bone mineral density, and nutritional deficits—the “female athlete triad,” which carries an increased risk of stress fractures.3,14,17-19
Stress fractures can often be diagnosed with a thorough medical history and physical, with imaging used for confirmation.6,14,17,18 Historical features of a stress fracture that may differentiate it from MTSS include pain that is unilateral and absent at rest and occurs with more prolonged activity, as well as post-exercise and/or nocturnal pain. Notable physical exam features include pain that is reproduced in a focal area with a single leg hop or percussion with a tuning fork or ultrasound.5,11,17
Initially, sensitivity for a plain radiograph is as low as 10%.2,11 Abnormalities on x-ray are usually seen after 2 to 8 weeks of symptoms2,7,11 and may include a faint periosteal reaction, a fluffy area of callus, or a cortical lucency sometimes referred to as the “dreaded black line.”3,6,17 If a radiographic exam shows evidence of a stress fracture, further imaging is typically unnecessary. MRI or TPBS is suggested, however, when x-rays appear normal but suspicion of a stress fracture remains.3,17,18 MRI may show edema within 3 days of symptom onset and is more sensitive and specific than computed tomography (CT) or TPBS for diagnosing stress fractures of the tibia.2,16
Treatment of tibial stress fractures is typically non-operative and consists of alterations in activity (eg, non weight-bearing), correction of nutritional deficits, such as inadequate caloric intake or too little calcium or iron, and addressing problems with footwear, training regimen, and/or running surface.3,14,18 Fibular and posteromedial tibial stress fractures are considered low risk and heal with weight-bearing restrictions and rest, initially for a minimum of 2 to 4 weeks.3
Posteromedial tibia injuries tend to heal well because they are on the compression side of the bone. Anterior tibia stress fractures, which are located on the tension side of the bone2,7 and account for approximately 5% of all tibia stress fractures, are more prone to non-union or progression to a complete fracture.7,20 Thus, anterior tibia stress injuries warrant a more aggressive approach, with treatment options including non-weight bearing status that may last longer than 8 weeks, pneumatic brace casting, and/or orthopedic referral to evaluate for surgical intervention.7,20-22 Time for radiographic evidence of healing may exceed 8 months, so early surgical intervention should be considered, especially for high-level athletes.7,20,21
Test your skills: A diagnostic challenge
Janine T, a 24-year-old long-distance runner, presents with left lower leg pain that occurs with activity. There was no injury, Ms. T reports; the pain began about 6 weeks ago, shortly after she began training for a marathon and running more than 30 miles per week. The pain is not relieved with intermittent rest or over-the-counter analgesics, she says. But it usually abates within 15 to 30 minutes after she completes her run.
Ms. T is underweight, with a body mass index <17 kg/m2. She denies any dietary restrictions and has normal menstrual cycles. The patient reports taking oral contraceptives, but no other medications. An initial x-ray is normal, as is magnetic resonance imaging to evaluate for a stress fracture.
You suspect Ms. T has shin splints, advise her to rest for a few weeks and to consider getting orthotics for her running shoes, and schedule a follow-up visit.
When she comes in 6 weeks later, the patient reports that she resumed running after a 3-week rest; shortly after, she noticed pain in both legs. What’s more, she now experiences tingling in her feet after running a few miles.
What’s wrong with this patient?
Ms. T’s symptoms—bilateral persistent leg pain, with tingling in both feet, and little improvement with rest—strongly suggest that she has chronic exertional compartment syndrome. Intracompartmental pressure testing, which reveals pre-exercise values ≥15 mm Hg and post-exercise values of ≥30 mm Hg at one minute, confirms the diagnosis.
Activity avoidance or modification will allow Ms. T’s symptoms to subside, but they’re highly likely to recur when she resumes running. The definitive treatment is intracompartmental fasciotomy, which has a success rate of approximately 80%.1,28
When to suspect chronic exertional compartment syndrome
Leg pain in CECS results from increased pressure within the lower extremity fascial compartments temporally related to exercise.2,23,24 Its incidence in the general population is unknown, but CECS has been found to range from 14% to 27% in patients with previously undiagnosed leg pain1,14,25 and to affect about a third of athletes with chronic ELP. In addition, CECS has been found in 90% of patients who have both diabetes and ELP with normal findings on vascular studies.1,3,4,26
The anterior compartment is most commonly affected, followed by the lateral, deep posterior, and superficial posterior compartments.3,13,23,27 Symptoms are bilateral 60% to 95% of the time.2,13,14,25 Factors contributing to CECS include fixed muscular compartment constraints, muscle swelling, thickened fascia, muscle hypertrophy related to resistance training, dynamic muscular contraction patterns, and low muscle capillary supply. Stretching of fascial pain receptors and pressure fibers and inadequate myocyte response to increased metabolism may play a role, as well.14,28
The initial clinical presentation is usually predictable leg pain—ie, pain that begins at about the same time, distance, or intensity of a workout and resolves with rest; numbness and weakness may occur as the workout progresses. In time, leg pain associated with CECS may be present with everyday activity or at rest. The physical exam may be normal or reveal swelling, tenderness over the involved compartments, pain with passive digit or ankle motion, and palpable muscle herniation.14
Measurement of intracompartmental pressure before and after exercise is the gold standard for diagnosis of CECS.2,14,27 Pre-exercise values ≥15 mm Hg and post-exercise values ≥30 mm Hg at one minute or ≥20 mm Hg at 5 minutes are all considered diagnostic of CECS,11 although these widely accepted criteria for bilateral testing of all compartments yields a false-positive rate of 5%.27 CECS is almost always bilateral,29 and some clinicians advocate limiting the number of needle insertions by taking only post-exercise measurements and testing only symptomatic compartments in one limb.
Imaging has limited value, as both x-rays and MRIs are usually normal.14 However, post-exertional T2-weighted MRI findings of muscular edema correspond to increased intracompartmental pressures, with a sensitivity of 87% and a specificity of 62%.14,24,30,31 Infrared spectroscopy, which measures levels of oxygenated and deoxygenated blood, is sensitive for CECS when the post-exercise ratio of deoxygenated to oxygenated blood remains elevated.14,24 Neither of these screening modalities is routinely obtained or considered diagnostic, however. Their chief role is to exclude an alternative diagnosis.14
Treatment and symptom relief. Discontinuing or modifying the aggravating activity typically brings relief of CECS. But this is not a long-term solution, as symptoms are likely to recur when the patient returns to the activity in question.1 The definitive treatment is compartment release via fasciotomy. Success rates for anterior and lateral compartment releases are >80%.1,28 The success of fasciotomy of posterior compartments, however, is <50%—a finding attributed to more complex anatomy, difficult visualization, and the presence of additional compartments.1,32
When the cause is vascular
Arterial endofibrosis—the fibrotic thickening of the intima of an artery—is thought to be caused by repetitive hip flexion.8 This results in hyperplasia, wall thickening, and eventual stenosis of the vessel, with 90% of cases affecting the external iliac artery.8,33 The condition is most common in activities such as cycling, but is also seen in such activities as running, skiing, soccer, and rugby. Symptoms are typically unilateral, but an estimated 15% of patients experience bilateral symptoms.8,33
Loss of power in the affected leg, with intermittent claudication and pain due to presumed ischemia from the vascular defect, is the usual presentation, although some patients develop cramping of the buttocks and/or paresthesia of the affected leg and foot during uphill running or cycling.8,33 The physical exam is often normal, but there may be a post-exercise arterial bruit over the femoral artery when the hip is flexed.8,34
Pre-exercise ankle-brachial index (ABI) <0.5 and post-exercise ABI <0.66 at one minute is suggestive of moderate arterial endofibrosis, with 90% sensitivity and 87% specificity.8,33,34 Arterial ultrasound and color Doppler may also be used for diagnosis, but are often operator dependent. Magnetic resonance angiography (MRA), while more expensive, can detect excessive kinking or compression of the vessel and is not operator dependent.8,33 Angioplastic balloon catheter dilation and stenting, bypass surgery, vascular reconstruction and endarterectomy with vein patch are the options for treatment. The success rates of the various interventions are unknown due to a lack of head-to-head studies and long-term follow-up.8,33
Popliteal artery entrapment syndrome (PAES) is a constellation of symptoms caused by vascular impingement in the popliteal fossa of the knee.8,34 The typical presenting symptoms are lower limb ischemia and pain caused by intense exercise that resolves quickly afterwards. Symptoms correlate more with the intensity than the duration of exercise.3,8
PAES is usually caused by a variant of the gastrocnemius muscle in which a medial head passes behind the popliteal artery in males younger than 30 years.8,33-35 Less commonly, it is the result of an overuse or acute orthopedic injury that irritates structures surrounding the popliteal fossa.8,34 PAES affects football, basketball, and soccer players, as well as runners because of excessive dorsiflexion and plantar flexion of the ankle.3,4
The physical exam for a patient with PAES is typically normal, but a post-exercise popliteal bruit with weak peripheral pulses may be elicited.8,33 An ABI in the neutral, forced dorsiflexion and forced plantar flexion positions can serve as a useful screening tool. An ABI <0.9 is abnormal, with a sensitivity and specificity of 90% and 98%, respectively, for stenosis >50%.2,36
Arteriography is the gold standard for diagnosis of PAES. Contrast arteriography is most commonly used because of its availability and cost. But MRA better differentiates functional from anatomic entrapment—a differentiation that less invasive tests, such as duplex ultrasound studies, lack the specificity to reveal.8,34 Treatment requires either surgical removal of the offending musculotendinous structures or arterial bypass and grafting of the chronically impinged area, as conservative therapies lack efficacy.2,8,34
Cystic adventitial disease (CAD) is the narrowing of an artery by mucoid cysts in the arterial wall or adventitia.8,9 It is a rare condition, accounting for just 0.1% of all vascular diseases, most commonly occurring in men in their mid-40s.8,33 CAD is thought to be the result of mucin-producing cells being haphazardly incorporated into the adventitia during arterial development. About 85% of patients whose popliteal artery is affected in this way will experience intermittent claudication with activity.8,9
On exam, such patients often have diminished ankle-brachial pressure indices, and duplex ultrasound often reveals stenosis in the affected artery, as well as a collection of mucoid cysts in the adventitia.8,9
Diagnosis can be confirmed by MRA.8,37 Evidence for the treatment of CAD is largely anecdotal.9 Cysts may be aspirated but tend to recur, and stenting does not correct the cystic-induced narrowing of the vessel. Surgical removal of the cysts is the only successful treatment.8,9
Neurologic causes to consider
Spinal stenosis is caused by central canal narrowing secondary to congenital abnormalities, trauma, or, most commonly, degenerative changes in the lumbar spine. Spinal stenosis is generally seen in men or women ages 50 to 70 years.38 Patients experience unilateral or bilateral claudication that improves with sitting or flexion of the spine5 and may develop bilateral lower extremity numbness and tingling from the buttocks that radiates down the legs. Diagnosis is typically made with a combination of a lumbar x-ray and an MRI, which will show nerve compression and bony overgrowth.38 CT myelogram, another imaging option, isless sensitive in the acute phase, but can be used to monitor the disease course.
Initial treatment includes physical therapy and NSAIDs.5 If conservative therapy fails, epidural or nerve root corticosteroid injections and surgical decompression or laminectomy are options.38
Nerve entrapment is a less common source of lower extremity pain in which the superficial peroneal nerve is most often affected.4,12,17,39 Trauma is the usual cause of nerve entrapment, but it may also be associated with overuse, most notably related to dance, soccer, or tennis.2,14,40,41 The most likely anatomic site is where the nerve exits the deep fascia within the lateral compartment in the lower third of the leg.39,40 Less frequently, the common peroneal nerve at the fibular neck, the saphenous nerve as it passes through Hunter’s canal, the posterior tibial nerve at the tarsal tunnel, and the sural nerve in the posterior calf may be affected.3,4,12,17,20,40,41 Entrapment of the peroneal nerve may be associated with activities involving repetitive inversion and eversion, such as running and cycling. Injury of the saphenous nerve is seen in sports involving repetitive knee flexion like rowing and cycling. Sural nerve entrapment is a result of crural fascia compression of the nerve during activities like running and track.3,14,40,42,43
Patients typically experience burning, tingling, and radiation of pain with activity. Symptoms worsen with continued exercise. The physical exam is often normal, especially early in the disease process, but may reveal sensory loss, motor weakness, and a loss of reflexes.2,40 Patients with superficial peroneal nerve involvement may have distal lateral leg pain that radiates into the dorsum of the foot, often exacerbated by lower leg percussion and resulting in diminished sensation.1 Common peroneal nerve involvement may alter sensation of the lateral leg, as well, but may also cause foot drop.2 The saphenous nerve can cause medial knee or leg symptoms, while the sural nerve can yield pain in the lateral ankle and foot.2
To diagnose nerve entrapment, electromyography and nerve conduction velocities at the level of the lesion may yield positive results 3 to 4 weeks after symptom onset.2,13,40 There are wide ranges of sensitivity and specificity for these studies, but they are nonetheless considered the tests of choice for nerve entrapment.1,44 Conservative treatment with activity modification, physical therapy, massage, and NSAIDs is often sufficient,2 with surgical management warranted only for refractory cases.2,14,40,41
CORRESPONDENCE
Jonathan A. Becker, MD, CAQSM, University of Louisville Department of Family and Geriatric Medicine, 201 Abraham Flexner Way, Suite 690, Louisville, KY 40202; jon.becker@louisville@edu.
1. Rajasekaran S, Kvinlaug K, Finnoff JT. Exertional leg pain in the athlete. PM R. 2012;4:985-1000.
2. Brewer RB, Gregory AJ. Chronic lower leg pain in athletes: a guide for the differential diagnosis, evaluation, and treatment. Sports Health. 2012;4:121-127.
3. Edwards PH Jr, Wright ML, Hartman JF. A practical approach for the differential diagnosis of chronic leg pain in the athlete. Am J Sports Med. 2005;33:1241-1249.
4. Clanton TO, Solcher BW. Chronic leg pain in the athlete. Clin Sports Med. 1994;13:743-759.
5. Fredericson M, Wun C. Differential diagnosis of leg pain in the athlete. J Am Podiatr Med Assoc. 2003;93:321-324.
6. Pell RF 4th, Khanuja HS, Cooley GR. Leg pain in the running athlete. J Am Acad Orthop Surg. 2004;12:396-404.
7. Boden BP, Osbahr DC. High-risk stress fractures: evaluation and treatment. J Am Acad Orthop Surg. 2000;8:344-353.
8. Pham TT, Kapur R, Harwood MI. Exertional leg pain: teasing out arterial entrapments. Curr Sports Med Rep. 2007;6:371-375.
9. Wright LB, Matchett WJ, Cruz CP, et al. Popliteal artery disease: diagnosis and treatment. Radiographics. 2004;24:467-479.
10. Yates B, White S. The incidence and risk factors in the development of medial tibial stress syndrome among naval recruits. Am J Sports Med. 2004;32:772-780.
11. Fredericson M, Jennings F, Beaulieu C, et al. Stress fractures in athletes. Top Magn Reson Imaging. 2006;17:309-325.
12. Plisky MS, Rauh MJ, Heiderscheit B, et al. Medial tibial stress syndrome in high school cross-country runners: incidence and risk factors. J Orthop Sports Phys Ther. 2007;37:40-47.
13. Touliopolous S, Hershman EB. Lower leg pain. Diagnosis and treatment of compartment syndromes and other pain syndromes of the leg. Sports Med. 1999;27:193-204.
14. Burrus MT, Werner BC, Starman JS, et al. Chronic leg pain in athletes. Am J Sports Med. 2015;43:1538-1547.
15. Batt ME, Ugalde V, Anderson MW, et al. A prospective controlled study of diagnostic imaging for acute shin splints. Med Sci Sports Exerc. 1998;30:1564-1571.
16. Gaeta M, Minutoli F, Scribano E, et al. CT and MR imaging findings in athletes with early tibial stress injuries: comparison with bone scintigraphy findings and emphasis on cortical abnormalities. Radiology. 2005;235:553-561.
17. Sterling JC, Edelstein DW, Calvo RD, et al. Stress fractures in the athlete. Diagnosis and management. Sports Med. 1992;14:336-346.
18. Brukner P. Exercise-related lower leg pain: bone. Med Sci Sports Exerc. 2000;32:S15-S26.
19. Tuan K, Wu S, Sennett B. Stress fractures in athletes: risk factors, diagnosis, and management. Orthopedics. 2004;27:583-591.
20. Harrast MA, Colonno D. Stress fractures in runners. Clin Sports Med. 2010;29:399-416.
21. Varner KE, Younas SA, Lintner DM, et al. Chronic anterior midtibial stress fractures in athletes treated with reamed intramedullary nailing. Am J Sports Med. 2005;33:1071-1076.
22. Kaeding CC, Yu JR, Wright R, et al. Management and return to play of stress fractures. Clin J Sport Med. 2005;15:442-447.
23. Blackman PG. A review of chronic exertional compartment syndrome in the lower leg. Med Sci Sports Exerc. 2000;32:S4-S10.
24. Brennan FH Jr, Kane SF. Diagnosis, treatment options, and rehabilitation of chronic lower leg exertional compartment syndrome. Curr Sports Med Rep. 2003;2:247-250.
25. Davis DE, Raikin S, Garras DN, et al. Characteristics of patients with chronic exertional compartment syndrome. Foot Ankle Int. 2013;34:1349-1354.
26. Edmundsson D, Toolanen G. Chronic exertional compartment syndrome in diabetes mellitus. Diabet Med. 2011;28:81-85.
27. Pedowitz RA, Hargens AR, Mubarak SJ, et al. Modified criteria for the objective diagnosis of chronic compartment syndrome of the leg. Am J Sports Med. 1990;18:35-40.
28. Bong MR, Polatsch DB, Jazrawi LM, et al. Chronic exertional compartment syndrome: diagnosis and management. Bull Hosp Jt Dis. 2005;62:77-84.
29. Hislop M, Batt ME. Chronic exertional compartment syndrome testing: a minimalist approach. Br J Sports Med. 2011;45:954-955.
30. Brown RR, Rosenberg ZS. MR imaging of exercise-induced lower leg pain. Magn Reson Imaging Clin N Am. 2001;9:533-552.
31. Ringler MD, Litwiller DV, Felmlee JP, et al. MRI accurately detects chronic exertional compartment syndrome: a validation study. Skeletal Radiol. 2013;42:385-392.
32. Schepsis AA, Martini D, Corbett M. Surgical management of exertional compartment syndrome of the lower leg. Long-term followup. Am J Sports Med. 1993;21:811-817.
33. Ehsan O, Darwish A, Edmundson C, et al. Non-traumatic lower limb vascular complications in endurance athletes. Review of literature. Eur J Vasc Endovasc Surg. 2004;28:1-8.
34. Turnipseed WD. Popliteal entrapment syndrome. J Vasc Surg. 2002;35:910-915.
35. Baltopoulos P, Filippou DK, Sigala F. Popliteal artery entrapment syndrome: anatomic or functional syndrome? Clin J Sport Med. 2004;14:8-12.
36. McDermott MM, Criqui MH, Liu K, et al. Lower ankle/brachial index, as calculated by averaging the dorsalis pedis and posterior tibial arterial pressures, and association with leg functioning in peripheral arterial disease. J Vasc Surg. 2000;32:1164-1171.
37. Elias DA, White LM, Rubenstein JD, et al. Clinical evaluation and MR imaging features of popliteal artery entrapment and cystic adventitial disease. AJR Am J Roentgenol. 2003;180:627-632.
38. Genevay S, Atlas SJ. Lumbar spinal stenosis. Best Pract Res Clin Rheumatol. 2010;24:253-265.
39. Korkola M, Amendola A. Exercise-induced leg pain: sifting through a broad differential. Phys Sportsmed. 2001;29:35-50.
40. McCrory P, Bell S, Bradshaw C. Nerve entrapments of the lower leg, ankle and foot in sport. Sports Med. 2002;32:371-391.
41. Schon LC. Nerve entrapment, neuropathy, and nerve dysfunction in athletes. Orthop Clin North Am. 1994;25:47-59.
42. Anselmi SJ. Common peroneal nerve compression. J Am Podiatr Med Assoc. 2006;96:413-417.
43. Maalla R, Youssef M, Ben Lassoued N, et al. Peroneal nerve entrapment at the fibular head: outcomes of neurolysis. Orthop Traumatol Surg Res. 2013;99:719-722.
44. Marciniak C, Armon C, Wilson J, et al. Practice parameter: utility of electrodiagnostic techniques in evaluating patients with suspected peroneal neuropathy: an evidence-based review. Muscle Nerve. 2005;31:520-527.
PRACTICE RECOMMENDATIONS
› Consider the possibility of vascular and neurologic problems as the source of exertional leg pain (ELP). C
› Order magnetic resonance imaging to evaluate patients with ELP and negative x-rays for stress fractures. C
› Measure lower extremity intracompartmental pressures both before and after exercise when you suspect chronic exertional compartmental syndrome. Doing so is the gold standard for the diagnosis of this condition. B
Strength of recommendation (SOR)
A Good-quality patient-oriented evidence
B Inconsistent or limited-quality patient-oriented evidence
C Consensus, usual practice, opinion, disease-oriented evidence, case series
Most family physicians are accustomed to treating active patients with shin splints and stress fractures. But many are less familiar with, and slower to recognize, other sources of exertional leg pain (ELP), defined as exercise-related pain that localizes in the lower extremity distal to the knee and proximal to the talocrural joint.1
ELP has a broad differential diagnosis that includes other musculoskeletal conditions—most notably chronic exertional compartment syndrome (CECS), which has been found to affect 33% of athletes with chronic ELP1—as well as a number of vascular and neurologic causes.2-4 In addition, etiologies may overlap. Greater awareness of the many causes of ELP can help you to avoid the unnecessary use of expensive diagnostic tests as well as delayed diagnosis and treatment.
A thorough medical and activity history, symptom review, and physical examination are your most important tools when patients present with ELP. When the cause is not obvious or the patient fails to respond to conservative measures, x-rays, magnetic resonance imaging (MRI), vascular studies, electromyography and nerve conduction studies, and/or intracompartmental pressure testing may be needed to find the source of the symptoms. In the text that follows, we review both common and relatively uncommon sources of ELP, using a stepwise diagnostic approach. You’ll find a diagnostic challenge, in which you can test your skills and a more comprehensive differential diagnosis in the TABLE.1-3,5-9
Musculoskeletal injuries: Shin splints and beyond
Medial tibial stress syndrome (MTSS), commonly known as shin splints, is characterized by pain and tenderness over the posteromedial aspect of the distal tibia.3 It typically results in diffuse pain that occurs with exercise, but may persist at rest in severe cases.3-6 Less often, localized swelling may also be present.2
MTSS accounts for between 6% and 16% of all running injuries.2,10 It is associated with a spectrum of tibial stress injuries, including periostitis, tendinopathy, and stress reaction, with dysfunction of the tibialis posterior, tibialis anterior, and soleus muscles thought to be contributing factors.2,11 Intrinsic factors include high body mass index (BMI), female sex, excessive internal and external hip rotation, hyperpronation, and hyper plantar flexion.2,10,12
X-rays of the leg are typically normal in patients with MTSS and should be considered only if the clinical presentation suggests the possibility of an alternative diagnosis, such as a stress fracture or tumor.2-4,13 Advanced imaging such as MRI or triple phase bone scans (TPBS) are useful when the diagnosis is in question and will reveal an abnormally high signal along the posterior medial tibial surface or the classic train-track appearance of nucleotide uptake in patients with MTSS.2 MRI readily shows periosteal reaction and bony edema and has a sensitivity of 78% to 89% and a specificity of 33% to 100% for the diagnosis of MTSS.14,15
Initial management of MTSS is conservative, with the mainstay of treatment consisting of rest, ice, and nonsteroidal anti-inflammatory drugs (NSAIDs).3,13,16 While ice, NSAIDs, proper conditioning, physical therapy to stretch and strengthen the calf musculature, rigid orthotics to correct foot hyperpronation, and activity modification are all appropriate treatments, randomized controlled trials have shown none of these interventions to be more effective than rest alone.2 Non-operative treatment is usually successful, but surgery may be required for severe or refractory cases. Procedures include posteromedial fasciotomy, release of the medial soleus fascial bridge, deep compartment fasciotomy, or removal of a section of the distal tibia periosteum.3,4
Lower extremity stress fracture. Stress fractures are caused by repetitive loading that results in microtrauma, including bony microfractures. The vast majority of cases—80% to 95% of stress fractures—affect the lower extremities, and most involve the tibia.2-4,6,13,17 The most common presentation is an insidious onset of pain over a specific bony area with a normal appearance, although localized swelling or erythema may occasionally be present.3,14,17,18 The pain may be reproduced or worsened by weight-bearing activities and relieved by rest.14,18
Consider the female athlete triad. In evaluating a patient with a stress fracture, pay close attention to dietary history, BMI, and, in female athletes, take a detailed menstrual history. Such patients are at risk for amenorrhea, low bone mineral density, and nutritional deficits—the “female athlete triad,” which carries an increased risk of stress fractures.3,14,17-19
Stress fractures can often be diagnosed with a thorough medical history and physical, with imaging used for confirmation.6,14,17,18 Historical features of a stress fracture that may differentiate it from MTSS include pain that is unilateral and absent at rest and occurs with more prolonged activity, as well as post-exercise and/or nocturnal pain. Notable physical exam features include pain that is reproduced in a focal area with a single leg hop or percussion with a tuning fork or ultrasound.5,11,17
Initially, sensitivity for a plain radiograph is as low as 10%.2,11 Abnormalities on x-ray are usually seen after 2 to 8 weeks of symptoms2,7,11 and may include a faint periosteal reaction, a fluffy area of callus, or a cortical lucency sometimes referred to as the “dreaded black line.”3,6,17 If a radiographic exam shows evidence of a stress fracture, further imaging is typically unnecessary. MRI or TPBS is suggested, however, when x-rays appear normal but suspicion of a stress fracture remains.3,17,18 MRI may show edema within 3 days of symptom onset and is more sensitive and specific than computed tomography (CT) or TPBS for diagnosing stress fractures of the tibia.2,16
Treatment of tibial stress fractures is typically non-operative and consists of alterations in activity (eg, non weight-bearing), correction of nutritional deficits, such as inadequate caloric intake or too little calcium or iron, and addressing problems with footwear, training regimen, and/or running surface.3,14,18 Fibular and posteromedial tibial stress fractures are considered low risk and heal with weight-bearing restrictions and rest, initially for a minimum of 2 to 4 weeks.3
Posteromedial tibia injuries tend to heal well because they are on the compression side of the bone. Anterior tibia stress fractures, which are located on the tension side of the bone2,7 and account for approximately 5% of all tibia stress fractures, are more prone to non-union or progression to a complete fracture.7,20 Thus, anterior tibia stress injuries warrant a more aggressive approach, with treatment options including non-weight bearing status that may last longer than 8 weeks, pneumatic brace casting, and/or orthopedic referral to evaluate for surgical intervention.7,20-22 Time for radiographic evidence of healing may exceed 8 months, so early surgical intervention should be considered, especially for high-level athletes.7,20,21
Test your skills: A diagnostic challenge
Janine T, a 24-year-old long-distance runner, presents with left lower leg pain that occurs with activity. There was no injury, Ms. T reports; the pain began about 6 weeks ago, shortly after she began training for a marathon and running more than 30 miles per week. The pain is not relieved with intermittent rest or over-the-counter analgesics, she says. But it usually abates within 15 to 30 minutes after she completes her run.
Ms. T is underweight, with a body mass index <17 kg/m2. She denies any dietary restrictions and has normal menstrual cycles. The patient reports taking oral contraceptives, but no other medications. An initial x-ray is normal, as is magnetic resonance imaging to evaluate for a stress fracture.
You suspect Ms. T has shin splints, advise her to rest for a few weeks and to consider getting orthotics for her running shoes, and schedule a follow-up visit.
When she comes in 6 weeks later, the patient reports that she resumed running after a 3-week rest; shortly after, she noticed pain in both legs. What’s more, she now experiences tingling in her feet after running a few miles.
What’s wrong with this patient?
Ms. T’s symptoms—bilateral persistent leg pain, with tingling in both feet, and little improvement with rest—strongly suggest that she has chronic exertional compartment syndrome. Intracompartmental pressure testing, which reveals pre-exercise values ≥15 mm Hg and post-exercise values of ≥30 mm Hg at one minute, confirms the diagnosis.
Activity avoidance or modification will allow Ms. T’s symptoms to subside, but they’re highly likely to recur when she resumes running. The definitive treatment is intracompartmental fasciotomy, which has a success rate of approximately 80%.1,28
When to suspect chronic exertional compartment syndrome
Leg pain in CECS results from increased pressure within the lower extremity fascial compartments temporally related to exercise.2,23,24 Its incidence in the general population is unknown, but CECS has been found to range from 14% to 27% in patients with previously undiagnosed leg pain1,14,25 and to affect about a third of athletes with chronic ELP. In addition, CECS has been found in 90% of patients who have both diabetes and ELP with normal findings on vascular studies.1,3,4,26
The anterior compartment is most commonly affected, followed by the lateral, deep posterior, and superficial posterior compartments.3,13,23,27 Symptoms are bilateral 60% to 95% of the time.2,13,14,25 Factors contributing to CECS include fixed muscular compartment constraints, muscle swelling, thickened fascia, muscle hypertrophy related to resistance training, dynamic muscular contraction patterns, and low muscle capillary supply. Stretching of fascial pain receptors and pressure fibers and inadequate myocyte response to increased metabolism may play a role, as well.14,28
The initial clinical presentation is usually predictable leg pain—ie, pain that begins at about the same time, distance, or intensity of a workout and resolves with rest; numbness and weakness may occur as the workout progresses. In time, leg pain associated with CECS may be present with everyday activity or at rest. The physical exam may be normal or reveal swelling, tenderness over the involved compartments, pain with passive digit or ankle motion, and palpable muscle herniation.14
Measurement of intracompartmental pressure before and after exercise is the gold standard for diagnosis of CECS.2,14,27 Pre-exercise values ≥15 mm Hg and post-exercise values ≥30 mm Hg at one minute or ≥20 mm Hg at 5 minutes are all considered diagnostic of CECS,11 although these widely accepted criteria for bilateral testing of all compartments yields a false-positive rate of 5%.27 CECS is almost always bilateral,29 and some clinicians advocate limiting the number of needle insertions by taking only post-exercise measurements and testing only symptomatic compartments in one limb.
Imaging has limited value, as both x-rays and MRIs are usually normal.14 However, post-exertional T2-weighted MRI findings of muscular edema correspond to increased intracompartmental pressures, with a sensitivity of 87% and a specificity of 62%.14,24,30,31 Infrared spectroscopy, which measures levels of oxygenated and deoxygenated blood, is sensitive for CECS when the post-exercise ratio of deoxygenated to oxygenated blood remains elevated.14,24 Neither of these screening modalities is routinely obtained or considered diagnostic, however. Their chief role is to exclude an alternative diagnosis.14
Treatment and symptom relief. Discontinuing or modifying the aggravating activity typically brings relief of CECS. But this is not a long-term solution, as symptoms are likely to recur when the patient returns to the activity in question.1 The definitive treatment is compartment release via fasciotomy. Success rates for anterior and lateral compartment releases are >80%.1,28 The success of fasciotomy of posterior compartments, however, is <50%—a finding attributed to more complex anatomy, difficult visualization, and the presence of additional compartments.1,32
When the cause is vascular
Arterial endofibrosis—the fibrotic thickening of the intima of an artery—is thought to be caused by repetitive hip flexion.8 This results in hyperplasia, wall thickening, and eventual stenosis of the vessel, with 90% of cases affecting the external iliac artery.8,33 The condition is most common in activities such as cycling, but is also seen in such activities as running, skiing, soccer, and rugby. Symptoms are typically unilateral, but an estimated 15% of patients experience bilateral symptoms.8,33
Loss of power in the affected leg, with intermittent claudication and pain due to presumed ischemia from the vascular defect, is the usual presentation, although some patients develop cramping of the buttocks and/or paresthesia of the affected leg and foot during uphill running or cycling.8,33 The physical exam is often normal, but there may be a post-exercise arterial bruit over the femoral artery when the hip is flexed.8,34
Pre-exercise ankle-brachial index (ABI) <0.5 and post-exercise ABI <0.66 at one minute is suggestive of moderate arterial endofibrosis, with 90% sensitivity and 87% specificity.8,33,34 Arterial ultrasound and color Doppler may also be used for diagnosis, but are often operator dependent. Magnetic resonance angiography (MRA), while more expensive, can detect excessive kinking or compression of the vessel and is not operator dependent.8,33 Angioplastic balloon catheter dilation and stenting, bypass surgery, vascular reconstruction and endarterectomy with vein patch are the options for treatment. The success rates of the various interventions are unknown due to a lack of head-to-head studies and long-term follow-up.8,33
Popliteal artery entrapment syndrome (PAES) is a constellation of symptoms caused by vascular impingement in the popliteal fossa of the knee.8,34 The typical presenting symptoms are lower limb ischemia and pain caused by intense exercise that resolves quickly afterwards. Symptoms correlate more with the intensity than the duration of exercise.3,8
PAES is usually caused by a variant of the gastrocnemius muscle in which a medial head passes behind the popliteal artery in males younger than 30 years.8,33-35 Less commonly, it is the result of an overuse or acute orthopedic injury that irritates structures surrounding the popliteal fossa.8,34 PAES affects football, basketball, and soccer players, as well as runners because of excessive dorsiflexion and plantar flexion of the ankle.3,4
The physical exam for a patient with PAES is typically normal, but a post-exercise popliteal bruit with weak peripheral pulses may be elicited.8,33 An ABI in the neutral, forced dorsiflexion and forced plantar flexion positions can serve as a useful screening tool. An ABI <0.9 is abnormal, with a sensitivity and specificity of 90% and 98%, respectively, for stenosis >50%.2,36
Arteriography is the gold standard for diagnosis of PAES. Contrast arteriography is most commonly used because of its availability and cost. But MRA better differentiates functional from anatomic entrapment—a differentiation that less invasive tests, such as duplex ultrasound studies, lack the specificity to reveal.8,34 Treatment requires either surgical removal of the offending musculotendinous structures or arterial bypass and grafting of the chronically impinged area, as conservative therapies lack efficacy.2,8,34
Cystic adventitial disease (CAD) is the narrowing of an artery by mucoid cysts in the arterial wall or adventitia.8,9 It is a rare condition, accounting for just 0.1% of all vascular diseases, most commonly occurring in men in their mid-40s.8,33 CAD is thought to be the result of mucin-producing cells being haphazardly incorporated into the adventitia during arterial development. About 85% of patients whose popliteal artery is affected in this way will experience intermittent claudication with activity.8,9
On exam, such patients often have diminished ankle-brachial pressure indices, and duplex ultrasound often reveals stenosis in the affected artery, as well as a collection of mucoid cysts in the adventitia.8,9
Diagnosis can be confirmed by MRA.8,37 Evidence for the treatment of CAD is largely anecdotal.9 Cysts may be aspirated but tend to recur, and stenting does not correct the cystic-induced narrowing of the vessel. Surgical removal of the cysts is the only successful treatment.8,9
Neurologic causes to consider
Spinal stenosis is caused by central canal narrowing secondary to congenital abnormalities, trauma, or, most commonly, degenerative changes in the lumbar spine. Spinal stenosis is generally seen in men or women ages 50 to 70 years.38 Patients experience unilateral or bilateral claudication that improves with sitting or flexion of the spine5 and may develop bilateral lower extremity numbness and tingling from the buttocks that radiates down the legs. Diagnosis is typically made with a combination of a lumbar x-ray and an MRI, which will show nerve compression and bony overgrowth.38 CT myelogram, another imaging option, isless sensitive in the acute phase, but can be used to monitor the disease course.
Initial treatment includes physical therapy and NSAIDs.5 If conservative therapy fails, epidural or nerve root corticosteroid injections and surgical decompression or laminectomy are options.38
Nerve entrapment is a less common source of lower extremity pain in which the superficial peroneal nerve is most often affected.4,12,17,39 Trauma is the usual cause of nerve entrapment, but it may also be associated with overuse, most notably related to dance, soccer, or tennis.2,14,40,41 The most likely anatomic site is where the nerve exits the deep fascia within the lateral compartment in the lower third of the leg.39,40 Less frequently, the common peroneal nerve at the fibular neck, the saphenous nerve as it passes through Hunter’s canal, the posterior tibial nerve at the tarsal tunnel, and the sural nerve in the posterior calf may be affected.3,4,12,17,20,40,41 Entrapment of the peroneal nerve may be associated with activities involving repetitive inversion and eversion, such as running and cycling. Injury of the saphenous nerve is seen in sports involving repetitive knee flexion like rowing and cycling. Sural nerve entrapment is a result of crural fascia compression of the nerve during activities like running and track.3,14,40,42,43
Patients typically experience burning, tingling, and radiation of pain with activity. Symptoms worsen with continued exercise. The physical exam is often normal, especially early in the disease process, but may reveal sensory loss, motor weakness, and a loss of reflexes.2,40 Patients with superficial peroneal nerve involvement may have distal lateral leg pain that radiates into the dorsum of the foot, often exacerbated by lower leg percussion and resulting in diminished sensation.1 Common peroneal nerve involvement may alter sensation of the lateral leg, as well, but may also cause foot drop.2 The saphenous nerve can cause medial knee or leg symptoms, while the sural nerve can yield pain in the lateral ankle and foot.2
To diagnose nerve entrapment, electromyography and nerve conduction velocities at the level of the lesion may yield positive results 3 to 4 weeks after symptom onset.2,13,40 There are wide ranges of sensitivity and specificity for these studies, but they are nonetheless considered the tests of choice for nerve entrapment.1,44 Conservative treatment with activity modification, physical therapy, massage, and NSAIDs is often sufficient,2 with surgical management warranted only for refractory cases.2,14,40,41
CORRESPONDENCE
Jonathan A. Becker, MD, CAQSM, University of Louisville Department of Family and Geriatric Medicine, 201 Abraham Flexner Way, Suite 690, Louisville, KY 40202; jon.becker@louisville@edu.
1. Rajasekaran S, Kvinlaug K, Finnoff JT. Exertional leg pain in the athlete. PM R. 2012;4:985-1000.
2. Brewer RB, Gregory AJ. Chronic lower leg pain in athletes: a guide for the differential diagnosis, evaluation, and treatment. Sports Health. 2012;4:121-127.
3. Edwards PH Jr, Wright ML, Hartman JF. A practical approach for the differential diagnosis of chronic leg pain in the athlete. Am J Sports Med. 2005;33:1241-1249.
4. Clanton TO, Solcher BW. Chronic leg pain in the athlete. Clin Sports Med. 1994;13:743-759.
5. Fredericson M, Wun C. Differential diagnosis of leg pain in the athlete. J Am Podiatr Med Assoc. 2003;93:321-324.
6. Pell RF 4th, Khanuja HS, Cooley GR. Leg pain in the running athlete. J Am Acad Orthop Surg. 2004;12:396-404.
7. Boden BP, Osbahr DC. High-risk stress fractures: evaluation and treatment. J Am Acad Orthop Surg. 2000;8:344-353.
8. Pham TT, Kapur R, Harwood MI. Exertional leg pain: teasing out arterial entrapments. Curr Sports Med Rep. 2007;6:371-375.
9. Wright LB, Matchett WJ, Cruz CP, et al. Popliteal artery disease: diagnosis and treatment. Radiographics. 2004;24:467-479.
10. Yates B, White S. The incidence and risk factors in the development of medial tibial stress syndrome among naval recruits. Am J Sports Med. 2004;32:772-780.
11. Fredericson M, Jennings F, Beaulieu C, et al. Stress fractures in athletes. Top Magn Reson Imaging. 2006;17:309-325.
12. Plisky MS, Rauh MJ, Heiderscheit B, et al. Medial tibial stress syndrome in high school cross-country runners: incidence and risk factors. J Orthop Sports Phys Ther. 2007;37:40-47.
13. Touliopolous S, Hershman EB. Lower leg pain. Diagnosis and treatment of compartment syndromes and other pain syndromes of the leg. Sports Med. 1999;27:193-204.
14. Burrus MT, Werner BC, Starman JS, et al. Chronic leg pain in athletes. Am J Sports Med. 2015;43:1538-1547.
15. Batt ME, Ugalde V, Anderson MW, et al. A prospective controlled study of diagnostic imaging for acute shin splints. Med Sci Sports Exerc. 1998;30:1564-1571.
16. Gaeta M, Minutoli F, Scribano E, et al. CT and MR imaging findings in athletes with early tibial stress injuries: comparison with bone scintigraphy findings and emphasis on cortical abnormalities. Radiology. 2005;235:553-561.
17. Sterling JC, Edelstein DW, Calvo RD, et al. Stress fractures in the athlete. Diagnosis and management. Sports Med. 1992;14:336-346.
18. Brukner P. Exercise-related lower leg pain: bone. Med Sci Sports Exerc. 2000;32:S15-S26.
19. Tuan K, Wu S, Sennett B. Stress fractures in athletes: risk factors, diagnosis, and management. Orthopedics. 2004;27:583-591.
20. Harrast MA, Colonno D. Stress fractures in runners. Clin Sports Med. 2010;29:399-416.
21. Varner KE, Younas SA, Lintner DM, et al. Chronic anterior midtibial stress fractures in athletes treated with reamed intramedullary nailing. Am J Sports Med. 2005;33:1071-1076.
22. Kaeding CC, Yu JR, Wright R, et al. Management and return to play of stress fractures. Clin J Sport Med. 2005;15:442-447.
23. Blackman PG. A review of chronic exertional compartment syndrome in the lower leg. Med Sci Sports Exerc. 2000;32:S4-S10.
24. Brennan FH Jr, Kane SF. Diagnosis, treatment options, and rehabilitation of chronic lower leg exertional compartment syndrome. Curr Sports Med Rep. 2003;2:247-250.
25. Davis DE, Raikin S, Garras DN, et al. Characteristics of patients with chronic exertional compartment syndrome. Foot Ankle Int. 2013;34:1349-1354.
26. Edmundsson D, Toolanen G. Chronic exertional compartment syndrome in diabetes mellitus. Diabet Med. 2011;28:81-85.
27. Pedowitz RA, Hargens AR, Mubarak SJ, et al. Modified criteria for the objective diagnosis of chronic compartment syndrome of the leg. Am J Sports Med. 1990;18:35-40.
28. Bong MR, Polatsch DB, Jazrawi LM, et al. Chronic exertional compartment syndrome: diagnosis and management. Bull Hosp Jt Dis. 2005;62:77-84.
29. Hislop M, Batt ME. Chronic exertional compartment syndrome testing: a minimalist approach. Br J Sports Med. 2011;45:954-955.
30. Brown RR, Rosenberg ZS. MR imaging of exercise-induced lower leg pain. Magn Reson Imaging Clin N Am. 2001;9:533-552.
31. Ringler MD, Litwiller DV, Felmlee JP, et al. MRI accurately detects chronic exertional compartment syndrome: a validation study. Skeletal Radiol. 2013;42:385-392.
32. Schepsis AA, Martini D, Corbett M. Surgical management of exertional compartment syndrome of the lower leg. Long-term followup. Am J Sports Med. 1993;21:811-817.
33. Ehsan O, Darwish A, Edmundson C, et al. Non-traumatic lower limb vascular complications in endurance athletes. Review of literature. Eur J Vasc Endovasc Surg. 2004;28:1-8.
34. Turnipseed WD. Popliteal entrapment syndrome. J Vasc Surg. 2002;35:910-915.
35. Baltopoulos P, Filippou DK, Sigala F. Popliteal artery entrapment syndrome: anatomic or functional syndrome? Clin J Sport Med. 2004;14:8-12.
36. McDermott MM, Criqui MH, Liu K, et al. Lower ankle/brachial index, as calculated by averaging the dorsalis pedis and posterior tibial arterial pressures, and association with leg functioning in peripheral arterial disease. J Vasc Surg. 2000;32:1164-1171.
37. Elias DA, White LM, Rubenstein JD, et al. Clinical evaluation and MR imaging features of popliteal artery entrapment and cystic adventitial disease. AJR Am J Roentgenol. 2003;180:627-632.
38. Genevay S, Atlas SJ. Lumbar spinal stenosis. Best Pract Res Clin Rheumatol. 2010;24:253-265.
39. Korkola M, Amendola A. Exercise-induced leg pain: sifting through a broad differential. Phys Sportsmed. 2001;29:35-50.
40. McCrory P, Bell S, Bradshaw C. Nerve entrapments of the lower leg, ankle and foot in sport. Sports Med. 2002;32:371-391.
41. Schon LC. Nerve entrapment, neuropathy, and nerve dysfunction in athletes. Orthop Clin North Am. 1994;25:47-59.
42. Anselmi SJ. Common peroneal nerve compression. J Am Podiatr Med Assoc. 2006;96:413-417.
43. Maalla R, Youssef M, Ben Lassoued N, et al. Peroneal nerve entrapment at the fibular head: outcomes of neurolysis. Orthop Traumatol Surg Res. 2013;99:719-722.
44. Marciniak C, Armon C, Wilson J, et al. Practice parameter: utility of electrodiagnostic techniques in evaluating patients with suspected peroneal neuropathy: an evidence-based review. Muscle Nerve. 2005;31:520-527.