User login
Can anesthesia in infants affect IQ scores?
About 10,000 newborns receive general anesthesia for congenital heart defects every year, and the more exposure they have to inhaled anesthetic agents, the greater effect it may have on their neurologic development, investigators at Children’s Hospital of Philadelphia reported in a study of newborns with hypoplastic left heart syndrome.
While previous studies have linked worse neurodevelopment to patient factors like prematurity and genetics, this is the first study to show a consistent relationship between neurodevelopment outcomes and modifiable factors during cardiac surgery in infants, Laura K. Diaz, MD, and her colleagues reported in the August issue of the Journal of Thoracic and Cardiovascular Surgery (J Thorac Cardiovasc Surg. 2016;152:482-9).
They studied 96 patients with hypoplastic left heart syndrome (HLHS) or similar syndromes who received volatile anesthetic agents (VAA) at their institution from 1998 to 2003. The patients underwent a battery of neurodevelopmental tests between the ages of 4 and 5 years that included full-scale IQ (FSIQ), verbal IQ (VIQ), performance IQ (PIQ), and processing speed.
“This study provides evidence that in children undergoing staged reconstructive surgery for HLHS, increasing cumulative exposure to VAAs beginning in infancy is associated with worse performance for FSIQ and VIQ, suggesting that VAA exposure may be a modifiable risk factor for adverse neurodevelopment outcomes,” Dr. Diaz and her colleagues wrote.
While survival has improved significantly in recent years for infants with hypoplastic left heart syndrome, physicians have harbored concerns that these children encounter neurodevelopmental issues later on. Dr. Diaz and her colleagues acknowledged that previous studies have shown factors, such as the use of cardiopulmonary bypass (CPB) and hospital length of stay, that could affect neurodevelopment in these children, but the findings have been inconsistent. Instead, those studies have shown such patient-specific factors as birth weight, ethnicity, and hereditary disorders were strong determinants of neurodevelopment in infants who have cardiac surgery, Dr. Diaz and her coauthors pointed out.
Their own previous study of patients with single-ventricle congenital heart disease concurred with the findings of those other studies, but it did not evaluate exposure to anesthesia (J. Thorac. Cardiovasc. Surg. 2014;147:1276-82). That was the focus of their current study.
Among the study group, 94 patients had an initial operation with CPB in their first 30 days of life. All 96 infants in the study group had additional operations, whether cardiac or noncardiac. The study tracked all anesthetic exposures up until the neurodevelopment evaluation in February 2008. All but 2 patients had initial VAA exposure at less than 1 year of age, and 45 at less than 1 month of age. Deep hypothermic circulatory arrest was used uniformly for aortic arch reconstruction.
The study used four different generalized linear models to evaluate anesthesia exposure and neurodevelopment.
For both FSIQ and PIQ, total minimum alveolar concentration hours were deemed to be statistically significant factors for lower scores. For PIQ, birth weight and length of postoperative hospital stay were statistically significant. For processing speed, gestational age and length of hospital stay were statistically significant.
Dr. Diaz and her colleagues said their findings are preliminary and do not justify a change in practice. “Prospective randomized, controlled multicenter clinical trials are indicated to continue to clarify the effects of early and repetitive exposure to VAA in this and other pediatric populations,” the study authors concluded.
Dr. Diaz and the study authors had no financial relationships to disclose.
The study by Dr. Diaz and her colleagues makes all the more clear the need for a prospective randomized trial on the effect inhaled anesthetic agents in infants can have on their neurologic development, Richard A. Jonas, MD, of Children’s National Heart Institute, Children’s National Medical Center, Washington, said in his invited commentary (J. Thorac. Cardiovasc. Surg. 2016;152:490).

|
Dr. Richard A. Jonas |
However, besides the study limitations that Dr. Diaz and her colleagues pointed out in their study, another “problem” Dr. Jonas noted with the study subjects was that they had staged reconstruction for hypoplastic left heart syndrome. “Not only is this group of patients at risk for prenatal effects of their abnormal in utero circulation, but in addition, they all underwent additional cardiac or noncardiac procedures after their initial cardiac surgery,” he said. These factors, along with some degree of cyanosis in their formative years, may help explain why this study is an outlier in that it did not implicate nonoperative factors that other studies implicated, Dr. Jonas said.
Nonetheless, the study is “an important contribution that adds further evidence to the observation that volatile agents can affect neurodevelopmental outcome,” Dr. Jonas said. Hence the need for a prospective randomized trial.
Dr. Jonas had no financial relationships to disclose.
The study by Dr. Diaz and her colleagues makes all the more clear the need for a prospective randomized trial on the effect inhaled anesthetic agents in infants can have on their neurologic development, Richard A. Jonas, MD, of Children’s National Heart Institute, Children’s National Medical Center, Washington, said in his invited commentary (J. Thorac. Cardiovasc. Surg. 2016;152:490).
|
|
Dr. Richard A. Jonas |
However, besides the study limitations that Dr. Diaz and her colleagues pointed out in their study, another “problem” Dr. Jonas noted with the study subjects was that they had staged reconstruction for hypoplastic left heart syndrome. “Not only is this group of patients at risk for prenatal effects of their abnormal in utero circulation, but in addition, they all underwent additional cardiac or noncardiac procedures after their initial cardiac surgery,” he said. These factors, along with some degree of cyanosis in their formative years, may help explain why this study is an outlier in that it did not implicate nonoperative factors that other studies implicated, Dr. Jonas said.
Nonetheless, the study is “an important contribution that adds further evidence to the observation that volatile agents can affect neurodevelopmental outcome,” Dr. Jonas said. Hence the need for a prospective randomized trial.
Dr. Jonas had no financial relationships to disclose.
About 10,000 newborns receive general anesthesia for congenital heart defects every year, and the more exposure they have to inhaled anesthetic agents, the greater effect it may have on their neurologic development, investigators at Children’s Hospital of Philadelphia reported in a study of newborns with hypoplastic left heart syndrome.
While previous studies have linked worse neurodevelopment to patient factors like prematurity and genetics, this is the first study to show a consistent relationship between neurodevelopment outcomes and modifiable factors during cardiac surgery in infants, Laura K. Diaz, MD, and her colleagues reported in the August issue of the Journal of Thoracic and Cardiovascular Surgery (J Thorac Cardiovasc Surg. 2016;152:482-9).
They studied 96 patients with hypoplastic left heart syndrome (HLHS) or similar syndromes who received volatile anesthetic agents (VAA) at their institution from 1998 to 2003. The patients underwent a battery of neurodevelopmental tests between the ages of 4 and 5 years that included full-scale IQ (FSIQ), verbal IQ (VIQ), performance IQ (PIQ), and processing speed.
“This study provides evidence that in children undergoing staged reconstructive surgery for HLHS, increasing cumulative exposure to VAAs beginning in infancy is associated with worse performance for FSIQ and VIQ, suggesting that VAA exposure may be a modifiable risk factor for adverse neurodevelopment outcomes,” Dr. Diaz and her colleagues wrote.
While survival has improved significantly in recent years for infants with hypoplastic left heart syndrome, physicians have harbored concerns that these children encounter neurodevelopmental issues later on. Dr. Diaz and her colleagues acknowledged that previous studies have shown factors, such as the use of cardiopulmonary bypass (CPB) and hospital length of stay, that could affect neurodevelopment in these children, but the findings have been inconsistent. Instead, those studies have shown such patient-specific factors as birth weight, ethnicity, and hereditary disorders were strong determinants of neurodevelopment in infants who have cardiac surgery, Dr. Diaz and her coauthors pointed out.
Their own previous study of patients with single-ventricle congenital heart disease concurred with the findings of those other studies, but it did not evaluate exposure to anesthesia (J. Thorac. Cardiovasc. Surg. 2014;147:1276-82). That was the focus of their current study.
Among the study group, 94 patients had an initial operation with CPB in their first 30 days of life. All 96 infants in the study group had additional operations, whether cardiac or noncardiac. The study tracked all anesthetic exposures up until the neurodevelopment evaluation in February 2008. All but 2 patients had initial VAA exposure at less than 1 year of age, and 45 at less than 1 month of age. Deep hypothermic circulatory arrest was used uniformly for aortic arch reconstruction.
The study used four different generalized linear models to evaluate anesthesia exposure and neurodevelopment.
For both FSIQ and PIQ, total minimum alveolar concentration hours were deemed to be statistically significant factors for lower scores. For PIQ, birth weight and length of postoperative hospital stay were statistically significant. For processing speed, gestational age and length of hospital stay were statistically significant.
Dr. Diaz and her colleagues said their findings are preliminary and do not justify a change in practice. “Prospective randomized, controlled multicenter clinical trials are indicated to continue to clarify the effects of early and repetitive exposure to VAA in this and other pediatric populations,” the study authors concluded.
Dr. Diaz and the study authors had no financial relationships to disclose.
FROM THE JOURNAL OF THORACIC AND CARDIOVASCULAR SURGERY
Key clinical point: Volatile inhaled anesthesia may affect neurodevelopment in infants with hypoplastic left heart syndrome.
Major finding: Different generalized linear models determined an association between minimum alveolar concentration hours and hospital length of stay with lower IQ scores and processing speed.
Data source: Meta-analysis reviewed a subgroup of 96 patients with hypoplastic left heart syndrome who had neurodevelopmental testing at a single center between 1998 and 2003.
Disclosures: The authors have no financial relationships to disclose.

Appeals court ruling protects marijuana doctors from prosecution
A new appellate ruling protects doctors from federal prosecution when they recommend medical marijuana in accordance with state law.
In an Aug. 16 opinion, the 9th U.S. Circuit Court of Appeals ruled that the U.S. Department of Justice cannot spend funding to prosecute physicians and patients who allegedly violate federal drug laws if their actions comply with state medical cannabis statutes.

The decision supports the longstanding policies of several medical specialty societies.
“The conflict between state and federal law regarding medical marijuana can be concerning for patients and physicians who may consider using or recommending marijuana as a treatment option,” Hilary Daniel, senior health policy analyst for the American College of Physicians, said in an interview. “We are encouraged that the decision by the 9th U.S. Circuit Court of Appeals may help to address some of these conflicts and remain cognizant of the potential challenges faced by physicians and patients outside the jurisdiction of the 9th Circuit.”
The ruling stems from a 2014 federal appropriations law that banned the Justice Department from interfering with state implementation of marijuana laws. Short-term measures since then have extended the prohibition, which now continues through Sept. 30, 2016. Defendants in 10 criminal cases sued the federal government, requesting their prosecutions be dismissed on the grounds that the Justice Department is prevented from spending funds to prosecute them. The parties were accused of various federal marijuana offenses, including conspiracy to manufacture and possession with intent to distribute. The Justice Department argued it is not preventing states from operating their medical marijuana laws by prosecuting private individuals. Three district courts declined to halt the prosecutions from proceeding.
But the appeals court ruled that the Justice Department is prohibited from spending funds from relevant federal appropriation to prosecute the defendants if their conduct was permitted by state medical marijuana laws. Judges remanded the cases to the district courts with instructions that if the Justice Department wishes to continue the cases, the appellants are entitled to hearings to determine whether their actions were authorized by state laws.
The decision is significant because it establishes an appellate level precedent regarding enforcement of the Congressional budget requirements, said Joshua Prober, general counsel and senior vice president for the American Osteopathic Association. However, the decision does not overturn federal criminal laws regarding marijuana use and is limited to the impact of Congress’ specific budgetary authorization measure, he said.
“As noted in the court’s opinion, it is quite possible that a future Congress will not put the same restrictions in place on federal prosecutorial activity,” Mr. Prober said in an interview. “And obviously there are the procedural limitations, i.e., the decision is only the view of one appellate circuit. It is possible that a different appellate court might find the Department of Justice’s arguments to be more persuasive.”
The appeals ruling comes less than a week after the U.S. Drug Enforcement Agency refused to reclassify marijuana under the Controlled Substances Act. Marijuana remains a schedule I controlled substance, noting in its decision that marijuana does not meet the criteria for currently accepted medical use in the United States, that there is a lack of accepted safety for its use under medical supervision, and that it has a high potential for abuse.
“The DEA and FDA continue to believe that scientifically valid and well-controlled clinical trials conducted under investigational new drug applications are the proper way to research all potential new medicines, including marijuana,” DEA Acting Administrator Chuck Rosenberg wrote in a letter to state governors. “Furthermore, we believe that the drug approval process is the proper way to assess whether a product derived from marijuana or its constituent parts is safe and effective for medical use.”
While tension between state and federal law regarding marijuana lingers, more states continue to approve marijuana for recreational and medical use, noted John A. DiNome, a health law attorney based in Philadelphia. So far, Oregon, Colorado, Washington, and Alaska allow recreational marijuana use, while 25 states have approved marijuana for medical use. At least 9 more states will consider recreational marijuana use in November.
“For the time being, the problem still exists,” Mr. DiNome said in an interview. “This temporarily keeps doctors off the hook from prosecution, but it doesn’t solve the underlying problem, which is: Is federal law going to change?”
On Twitter @legal_med
A new appellate ruling protects doctors from federal prosecution when they recommend medical marijuana in accordance with state law.
In an Aug. 16 opinion, the 9th U.S. Circuit Court of Appeals ruled that the U.S. Department of Justice cannot spend funding to prosecute physicians and patients who allegedly violate federal drug laws if their actions comply with state medical cannabis statutes.
The decision supports the longstanding policies of several medical specialty societies.
“The conflict between state and federal law regarding medical marijuana can be concerning for patients and physicians who may consider using or recommending marijuana as a treatment option,” Hilary Daniel, senior health policy analyst for the American College of Physicians, said in an interview. “We are encouraged that the decision by the 9th U.S. Circuit Court of Appeals may help to address some of these conflicts and remain cognizant of the potential challenges faced by physicians and patients outside the jurisdiction of the 9th Circuit.”
The ruling stems from a 2014 federal appropriations law that banned the Justice Department from interfering with state implementation of marijuana laws. Short-term measures since then have extended the prohibition, which now continues through Sept. 30, 2016. Defendants in 10 criminal cases sued the federal government, requesting their prosecutions be dismissed on the grounds that the Justice Department is prevented from spending funds to prosecute them. The parties were accused of various federal marijuana offenses, including conspiracy to manufacture and possession with intent to distribute. The Justice Department argued it is not preventing states from operating their medical marijuana laws by prosecuting private individuals. Three district courts declined to halt the prosecutions from proceeding.
But the appeals court ruled that the Justice Department is prohibited from spending funds from relevant federal appropriation to prosecute the defendants if their conduct was permitted by state medical marijuana laws. Judges remanded the cases to the district courts with instructions that if the Justice Department wishes to continue the cases, the appellants are entitled to hearings to determine whether their actions were authorized by state laws.
The decision is significant because it establishes an appellate level precedent regarding enforcement of the Congressional budget requirements, said Joshua Prober, general counsel and senior vice president for the American Osteopathic Association. However, the decision does not overturn federal criminal laws regarding marijuana use and is limited to the impact of Congress’ specific budgetary authorization measure, he said.
“As noted in the court’s opinion, it is quite possible that a future Congress will not put the same restrictions in place on federal prosecutorial activity,” Mr. Prober said in an interview. “And obviously there are the procedural limitations, i.e., the decision is only the view of one appellate circuit. It is possible that a different appellate court might find the Department of Justice’s arguments to be more persuasive.”
The appeals ruling comes less than a week after the U.S. Drug Enforcement Agency refused to reclassify marijuana under the Controlled Substances Act. Marijuana remains a schedule I controlled substance, noting in its decision that marijuana does not meet the criteria for currently accepted medical use in the United States, that there is a lack of accepted safety for its use under medical supervision, and that it has a high potential for abuse.
“The DEA and FDA continue to believe that scientifically valid and well-controlled clinical trials conducted under investigational new drug applications are the proper way to research all potential new medicines, including marijuana,” DEA Acting Administrator Chuck Rosenberg wrote in a letter to state governors. “Furthermore, we believe that the drug approval process is the proper way to assess whether a product derived from marijuana or its constituent parts is safe and effective for medical use.”
While tension between state and federal law regarding marijuana lingers, more states continue to approve marijuana for recreational and medical use, noted John A. DiNome, a health law attorney based in Philadelphia. So far, Oregon, Colorado, Washington, and Alaska allow recreational marijuana use, while 25 states have approved marijuana for medical use. At least 9 more states will consider recreational marijuana use in November.
“For the time being, the problem still exists,” Mr. DiNome said in an interview. “This temporarily keeps doctors off the hook from prosecution, but it doesn’t solve the underlying problem, which is: Is federal law going to change?”
On Twitter @legal_med

VIDEO: Is Hospital Medicine a Career Choice or a Pit Stop?
Dr. Scott Krugman, Chair of Pediatrics and Director of Medical Education at MedStar Franklin Square Medical Center in Baltimore, and Dr. Miguel Villagra, Medical Director of the Hospitalist Department at White River Medical Center in Batesville, AR talk about how residents and early career MDs process that decision.
The video associated with this article is no longer available on this site. Please view all of our videos on the MDedge YouTube channel

Zika in pregnant women: CDC reports 189 new cases
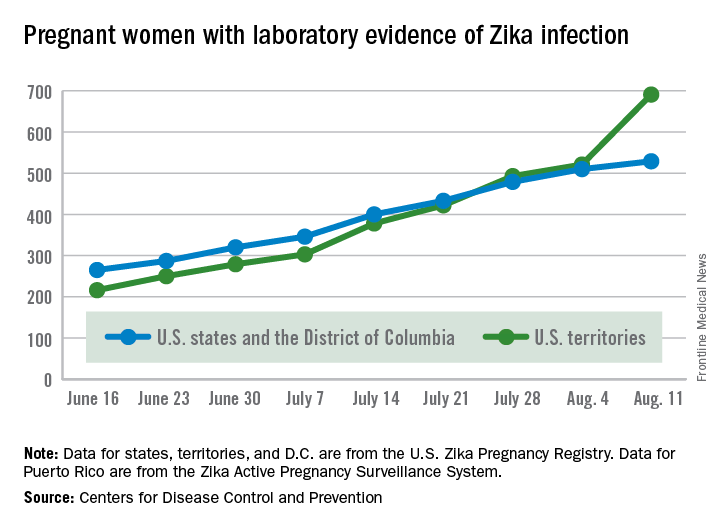
The number of pregnant women with laboratory evidence of Zika virus infection jumped by 189 during the week ending Aug. 11, with most of the increase coming in the U.S. territories, according to the Centers for Disease Control and Prevention.
The territories reported 170 new cases of Zika infection for that week, while the 50 states and the District of Columbia had 19 new cases in pregnant women. There have been 1,220 cases in pregnant women in the United States so far: 691 in the territories and 529 in the states and D.C. Among all Americans, there have been 10,295 cases of Zika: 8,035 in the territories and 2,260 in the states/D.C., the CDC reported.

The number of Zika-related poor outcomes did not change during the week ending Aug. 11. The number of liveborn infants born with birth defects stayed at 16 in the states/D.C. and 1 in the territories, and the number of pregnancy losses with birth defects held at 5 in the states/D.C. and 1 in the territories, the CDC said. State- or territorial-level data are not being reported to protect the privacy of affected women and children.
The figures for states, territories, and D.C. reflect reporting to the U.S. Zika Pregnancy Registry; data for Puerto Rico are reported to the U.S. Zika Active Pregnancy Surveillance System.
Zika virus–related birth defects recorded by the CDC could include microcephaly, calcium deposits in the brain indicating possible brain damage, excess fluid in the brain cavities and surrounding the brain, absent or poorly formed brain structures, abnormal eye development, or other problems resulting from brain damage that affect nerves, muscles, and bones. The pregnancy losses encompass any miscarriage, stillbirth, and termination with evidence of birth defects.
The number of pregnant women with laboratory evidence of Zika virus infection jumped by 189 during the week ending Aug. 11, with most of the increase coming in the U.S. territories, according to the Centers for Disease Control and Prevention.
The territories reported 170 new cases of Zika infection for that week, while the 50 states and the District of Columbia had 19 new cases in pregnant women. There have been 1,220 cases in pregnant women in the United States so far: 691 in the territories and 529 in the states and D.C. Among all Americans, there have been 10,295 cases of Zika: 8,035 in the territories and 2,260 in the states/D.C., the CDC reported.
The number of Zika-related poor outcomes did not change during the week ending Aug. 11. The number of liveborn infants born with birth defects stayed at 16 in the states/D.C. and 1 in the territories, and the number of pregnancy losses with birth defects held at 5 in the states/D.C. and 1 in the territories, the CDC said. State- or territorial-level data are not being reported to protect the privacy of affected women and children.
The figures for states, territories, and D.C. reflect reporting to the U.S. Zika Pregnancy Registry; data for Puerto Rico are reported to the U.S. Zika Active Pregnancy Surveillance System.
Zika virus–related birth defects recorded by the CDC could include microcephaly, calcium deposits in the brain indicating possible brain damage, excess fluid in the brain cavities and surrounding the brain, absent or poorly formed brain structures, abnormal eye development, or other problems resulting from brain damage that affect nerves, muscles, and bones. The pregnancy losses encompass any miscarriage, stillbirth, and termination with evidence of birth defects.
Anal cancer in HIV-infected patients: to screen or not?
DURBAN, SOUTH AFRICA – Screening for anal cancer in HIV-infected men or women should not be part of routine clinical practice at this time, Andrew Grulich, MBBS, PhD, declared at the 21st International AIDS Conference.
Some experts recommend anal cytologic screening or high-resolution anoscopy for HIV-positive men and women, but it’s worth noting that strategy hasn’t been incorporated into any national practice guidelines.

“And for very good reason: When we have a condition with a prevalence that’s so high and a treatment with recurrence rates that are so high, I think we need to question our approach,” said Dr. Grulich, professor of medicine and head of the HIV epidemiology and prevention program at the University of New South Wales in Sydney, Australia.
Screening proponents point to the high incidence of anal cancer in persons with HIV infection. It’s the fourth most common cancer in HIV patients in the United States, behind the AIDS-defining cancers and lung cancer. Indeed, the anal cancer rate is 10-fold greater in HIV-positive women, heterosexual men, and injection drug users than in the HIV-negative general population, and 50-fold higher in HIV-positive gay and bisexual men. Screening proponents also draw an analogy between anal cancer screening and the screening and treatment of cervical intraepithelial neoplasia (CIN), which has been enormously successful in preventing cervical cancer. But Dr. Grulich said he believes the cervical cancer screening analogy is faulty.
Colposcopy has a mean 90% specificity for diagnosis of HPV-related high-grade squamous intraepithelial lesions (HSIL) or cervical cancer, while high-resolution anoscopy as a diagnostic test has a specificity as low as 37% in HIV-positive persons. The prevalence of HSIL is 30%-40% in anal samples from HIV-infected homosexual men, compared with 1%-2% in cervical samples from HIV-negative women.
The rate of progression from CIN-3 to cervical cancer in women in the general population is about 1 in 80 per year. In contrast, the rate of progression from anal intraepithelial neoplasia (AIN)-2 or AIN-3 to anal cancer in HIV-infected homosexual men is estimated at only 1 in 400-600 per year, probably because regression of anal lesions is quite common.
Moreover, while a single treatment of high-grade CIN is typically curative and entails little morbidity, destruction of AIN by means of heat, cold, or electricity has a 70% failure rate, carries substantial morbidity, and is not supported by any evidence that it actually reduces the incidence of anal cancer, he continued.
“We’re in a bit of a quandary regarding what to do about anal cancer prevention. We really need research in order to move this field forward,” Dr. Grulich said.
He added that it’s worth keeping an eye on two ongoing studies addressing key questions surrounding anal cancer in HIV-positive persons. The U.S. National Cancer Institute–funded randomized ANCHOR trial is examining ablative therapy versus watchful waiting in HIV-infected patients with anal HSIL lesions; however, results of this large study aren’t expected until 2022 or 2023. And Dr. Grulich heads the Study of the Prevention of Anal Cancer, aimed at identifying biomarkers that predict persistence of HSIL as a marker of anal cancer risk.
A study he would very much like to see funded is a randomized, placebo-controlled, adequately powered trial of the 9-valent HPV vaccine in HIV-infected gay or bisexual men over age 26. At the 2016 meeting of the Conference on Retroviruses and Opportunistic Infections (CROI), Timothy J. Wilkin, MD, of Cornell University, New York, presented the results of the phase III ACTG A5298 trial of the quadrivalent HPV vaccine in HIV-infected adults over age 26. The vaccine group had a 27% reduction in risk of persistent anal HPV compared with placebo, which wasn’t statistically significant because of the small study size. The 9-valent vaccine would prevent a broader range of oncogenic HPV types.
Dr. Grulich reported receiving research funding from CSL Australia, Gilead Sciences, Viiv, and Hologic.
DURBAN, SOUTH AFRICA – Screening for anal cancer in HIV-infected men or women should not be part of routine clinical practice at this time, Andrew Grulich, MBBS, PhD, declared at the 21st International AIDS Conference.
Some experts recommend anal cytologic screening or high-resolution anoscopy for HIV-positive men and women, but it’s worth noting that strategy hasn’t been incorporated into any national practice guidelines.
“And for very good reason: When we have a condition with a prevalence that’s so high and a treatment with recurrence rates that are so high, I think we need to question our approach,” said Dr. Grulich, professor of medicine and head of the HIV epidemiology and prevention program at the University of New South Wales in Sydney, Australia.
Screening proponents point to the high incidence of anal cancer in persons with HIV infection. It’s the fourth most common cancer in HIV patients in the United States, behind the AIDS-defining cancers and lung cancer. Indeed, the anal cancer rate is 10-fold greater in HIV-positive women, heterosexual men, and injection drug users than in the HIV-negative general population, and 50-fold higher in HIV-positive gay and bisexual men. Screening proponents also draw an analogy between anal cancer screening and the screening and treatment of cervical intraepithelial neoplasia (CIN), which has been enormously successful in preventing cervical cancer. But Dr. Grulich said he believes the cervical cancer screening analogy is faulty.
Colposcopy has a mean 90% specificity for diagnosis of HPV-related high-grade squamous intraepithelial lesions (HSIL) or cervical cancer, while high-resolution anoscopy as a diagnostic test has a specificity as low as 37% in HIV-positive persons. The prevalence of HSIL is 30%-40% in anal samples from HIV-infected homosexual men, compared with 1%-2% in cervical samples from HIV-negative women.
The rate of progression from CIN-3 to cervical cancer in women in the general population is about 1 in 80 per year. In contrast, the rate of progression from anal intraepithelial neoplasia (AIN)-2 or AIN-3 to anal cancer in HIV-infected homosexual men is estimated at only 1 in 400-600 per year, probably because regression of anal lesions is quite common.
Moreover, while a single treatment of high-grade CIN is typically curative and entails little morbidity, destruction of AIN by means of heat, cold, or electricity has a 70% failure rate, carries substantial morbidity, and is not supported by any evidence that it actually reduces the incidence of anal cancer, he continued.
“We’re in a bit of a quandary regarding what to do about anal cancer prevention. We really need research in order to move this field forward,” Dr. Grulich said.
He added that it’s worth keeping an eye on two ongoing studies addressing key questions surrounding anal cancer in HIV-positive persons. The U.S. National Cancer Institute–funded randomized ANCHOR trial is examining ablative therapy versus watchful waiting in HIV-infected patients with anal HSIL lesions; however, results of this large study aren’t expected until 2022 or 2023. And Dr. Grulich heads the Study of the Prevention of Anal Cancer, aimed at identifying biomarkers that predict persistence of HSIL as a marker of anal cancer risk.
A study he would very much like to see funded is a randomized, placebo-controlled, adequately powered trial of the 9-valent HPV vaccine in HIV-infected gay or bisexual men over age 26. At the 2016 meeting of the Conference on Retroviruses and Opportunistic Infections (CROI), Timothy J. Wilkin, MD, of Cornell University, New York, presented the results of the phase III ACTG A5298 trial of the quadrivalent HPV vaccine in HIV-infected adults over age 26. The vaccine group had a 27% reduction in risk of persistent anal HPV compared with placebo, which wasn’t statistically significant because of the small study size. The 9-valent vaccine would prevent a broader range of oncogenic HPV types.
Dr. Grulich reported receiving research funding from CSL Australia, Gilead Sciences, Viiv, and Hologic.
EXPERT ANALYSIS FROM AIDS 2016

New treatment option for relapsed/refractory NHL

Results of the phase 3 GADOLIN trial have revealed a new treatment option for patients with relapsed/refractory non-Hodgkin lymphoma (NHL), according to researchers.
The trial showed that obinutuzumab plus bendamustine, followed by obinutuzumab maintenance, can ward off disease progression in NHL patients who have relapsed after rituximab-based
therapy or stopped responding to it.
The obinutuzumab regimen significantly improved progression-free survival (PFS) when compared to bendamustine alone (without maintenance).
However, there was no significant difference between the 2 treatment arms with regard to overall survival (OS).
Still, the trial was stopped before its protocol-specified final analysis because of the PFS benefit in the obinutuzumab arm.
Laurie Sehn, MD, of the BC Cancer Agency in Vancouver, British Columbia, Canada, and her colleagues reported the results of this trial in The Lancet. The research was funded by F. Hoffmann-La Roche Ltd.
Patients and treatment
GADOLIN enrolled patients with relapsed/refractory follicular lymphoma (FL), marginal zone lymphoma (MZL), small lymphocytic lymphoma (SLL), and Waldenstrom’s macroglobulinemia (WM).
The patients were randomized to receive one of the following treatments:
- bendamustine alone (120 mg/m2/day on days 1 and 2 for up to six 28-day cycles)
- bendamustine (90 mg/m2/day on days 1 and 2 for up to six 28-day cycles) plus obinutuzumab (1000 mg on days 1, 8, and 15 for cycle 1, followed by 1 dose for up to six 28-day cycles), followed by obinutuzumab maintenance (1000 mg every 2 months for 2 years or until progression).
The investigators said baseline characteristics were well-balanced between the treatment arms. Patients in both arms had received a median of 2 prior treatments, and the median time from last treatment was about 4 months.
Of the 194 patients randomized to the obinutuzumab arm, 155 had FL, 27 had MZL, and 12 had SLL. Of the 202 patients randomized to the bendamustine (control) arm, 166 had FL, 19 had MZL, 16 had SLL, and 1 had WM.
Ultimately, 156 patients completed induction in the obinutuzumab arm, as did 129 patients in the control arm. Thirty-six patients completed maintenance with obinutuzumab, and 46 were still receiving maintenance at the time of analysis.
The median follow-up was 21.9 months in the obinutuzumab arm and 20.3 months in the control arm.
Safety
Nearly all patients in both arms experienced at least 1 adverse event (AE).
Grade 3-5 AEs occurred in 68% of patients in the obinutuzumab arm and 62% in the control arm. The most frequent of these were neutropenia (33% vs 26%), thrombocytopenia (11% vs 16%), anemia (8% vs 10%), and infusion-related reactions (11% vs 6%).
Serious AEs occurred in 38% of patients in the obinutuzumab arm and 33% in the control arm. The most common were febrile neutropenia (4% vs 3%), infusion-related reactions (4% vs 2%), and pneumonia (3% vs 5%).
Response
According to an independent review committee, the overall response rate at the end of induction was 69% in the obinutuzumab arm and 63% in the control arm. The complete response rates were 11% and 12%, respectively.
The median duration of response was not reached in the obinutuzumab arm and was 13.2 months in the control arm.
Survival
The median PFS was not reached in the obinutuzumab arm and was 14.9 months in the control arm (P=0.0001), according to the independent review committee.
According to investigators, the median PFS was 29.2 months and 14 months, respectively (P<0.0001).
At last follow-up, the median OS had not been reached in either arm (P=0.40).
There were 34 deaths in the obinutuzumab arm and 41 in the control arm (18% and 20%, respectively). Most patients died of disease progression (65% and 71%, respectively).
Twelve patients in each arm (6%) died of AEs. Three of these deaths were treatment-related in the obinutuzumab arm (acute myeloid leukemia, vascular pseudoaneurysm, and pseudomonal sepsis).
Five of the 12 AE deaths in the control arm were treatment-related (sepsis, 2 cases of leukemia, and 2 cases of Pneumocystis jirovecii pneumonia).
Taking these results together, the investigators said the obinutuzumab regimen had a manageable toxicity profile, and it produced a “clinically meaningful and significant” improvement in PFS when compared to bendamustine alone. ![]()
FDA rejects antidote to factor Xa inhibitors

Photo courtesy of Pfizer
and Bristol-Myers Squibb
The US Food and Drug Administration (FDA) has issued a complete response letter regarding the biologics license application for andexanet alfa (AndexXa™).
Andexanet alfa is being developed as a reversal agent for the factor Xa inhibitors apixaban, rivaroxaban, edoxaban, and enoxaparin.
The agent is intended to be used when reversal of anticoagulation is needed due to life-threatening or uncontrolled bleeding.
In the complete response letter, the FDA requested that Portola Pharmaceuticals Inc., the company developing andexanet alfa, provide additional information related to manufacturing.
Portola said it could not provide many details on this request but stressed that the FDA did not question the company’s ability to manufacture the drug.
The FDA also asked Portola for additional data to support the inclusion of edoxaban and enoxaparin on andexanet alfa’s label.
The completed phase 3 studies of andexanet alfa were designed to assess the drug’s ability to reverse the effects of apixaban and rivaroxaban—but not edoxaban or enoxaparin—in healthy volunteers. Andexanet alfa’s effects on edoxaban and enoxaparin have been investigated in phase 2 studies, however.
Portola had assumed these studies would be sufficient because, overall, the research suggests andexanet alfa has broad activity against factor Xa inhibitors, according to Bill Lis, chief executive officer of Portola.
Lis also noted that the primary use of andexanet alfa, once approved, would be in patients receiving rivaroxaban or apixaban because fewer patients take edoxaban and enoxaparin.
The final issue the FDA mentioned in the complete response letter was the need to finalize its review of the clinical amendments to Portola’s post-marketing commitments.
“Because AndexXa addresses an urgent unmet medical need, we and the FDA are committed to resolving the outstanding questions and determining appropriate next steps,” Lis said.
“Portola’s goal is to define the most expedient path to approval so we can meet the needs of these patients who have no alternative. We plan to meet with the FDA as soon as possible.”
About andexanet alfa
Andexanet alfa is a modified human factor Xa molecule that acts as a decoy to target and sequester both oral and injectable factor Xa inhibitors in the blood. Once bound, the factor Xa inhibitors are unable to bind to and inhibit native factor Xa, thus potentially allowing for the restoration of normal hemostatic processes.
The FDA granted andexanet alfa orphan drug designation last year and breakthrough therapy designation in 2013.
Portola’s biologics license application for andexanet alfa was based on data from a pair of phase 3 studies of healthy volunteers—ANNEXA-A and ANNEXA-R.
In the ANNEXA-R trial, andexanet alfa successfully reversed the anticoagulant activity of rivaroxaban. In the ANNEXA-A trial, andexanet alfa reversed the anticoagulant activity of apixaban.
Results from these studies were published in NEJM last year.
The biologics license application also included limited adjudicated efficacy and safety data from initial patients enrolled in the ongoing ANNEXA-4 study.
In this phase 3b/4 study, researchers are evaluating andexanet alfa in patients receiving apixaban, rivaroxaban, edoxaban, or enoxaparin who present with an acute major bleed. ![]()
Predicting drug’s efficacy in relapsed DLBCL
The histone deacetylase inhibitor panobinostat can produce durable responses in certain patients with relapsed diffuse large B-cell lymphoma (DLBCL), according to a phase 2 trial.
Though less than 30% of the patients in this trial responded to treatment, the median duration of response was 14.5 months, and the longest ongoing response has lasted more than 3.5 years.
In addition, researchers found the presence of mutations in MEF2B and levels of circulating tumor DNA (ctDNA) could be used to predict response.
Sarit Assouline, MD, of Jewish General Hospital in Montreal, Quebec, Canada, and her colleagues reported these findings in Blood.
“DLBCL is one of the more common forms of lymphoma and is highly aggressive,” Dr Assouline noted. “Following relapse, there are no effective standards of treatment, and life expectancy averages 6 months.”
“Our challenge is to identify new biomarkers and target specific mutations in order to improve the prognosis. While many clinical trials simply report on how patients respond to a therapy, we devised this study to reveal the mechanisms on which the therapy works in order to understand which patients would benefit.”
The trial enrolled 40 patients with relapsed or refractory de novo (n=27) or transformed (n=13) DLBCL. The patients’ median age was 59.8 (range, 28.9-78.6). They received a median of 3 prior therapies (range, 1-9), and 75% of patients (n=30) were refractory to their most recent therapy.
The patients received panobinostat at 30 mg three times a week, with rituximab (n=19) or without (n=21).
Adverse events
The most common grade 3 or higher adverse events (AEs) that were thought to be related to panobinostat (with and without rituximab, respectively) were thrombocytopenia (68% and 71%) and neutropenia (11% and 24%).
Twenty-three patients (58%) required dose reductions, and 22 (55%) required dose interruptions. All of these were due to AEs, and there was no difference between patients who received rituximab and those who did not.
All 19 serious AEs were a result of disease progression.
Response
Twenty-eight percent of the patients (11/40) responded to treatment, and receiving rituximab did not increase the likelihood of response. Six patients (29%) responded to panobinostat alone, and 5 (26%) responded to panobinostat and rituximab.
There were 7 complete responses—5 of them among patients who received panobinostat alone. And there were 4 partial responses—3 among the patients who received panobinostat plus rituximab.
The median duration of response was 14.5 months overall, 9.4 months among patients who received panobinostat plus rituximab, and it was not reached among patients who received panobinostat alone.
At the data cutoff, 6 of the 11 responders had not progressed. The longest response had lasted more than 43 months and was ongoing at the cutoff point.
Predicting response
The researchers performed genome and exome sequencing in relapsed tumor biopsies and quantified ctDNA in serial plasma samples.
They found that mutations in MEF2B were significantly associated with response to panobinostat. The likelihood ratio for response was 3.67 for patients with MEF2B mutations.
On the other hand, increased levels of ctDNA were strongly associated with treatment failure. A significant increase in ctDNA at day 15 after treatment initiation could predict a lack of response with a sensitivity of 71.4% and a specificity of 100%.
“This trial has generated considerable data regarding methodology for processing samples from a clinical study, the genetic mutations associated with DLBCL and how they evolve over time, on ctDNA, and mechanisms of resistance to histone deacetylase inhibitors,” Dr Assouline concluded.
Novartis provided panobinostat and financial support for this trial, and Hoffman-LaRoche supplied rituximab. ![]()
Hospitalist Staffing Affects 30-Day All-Cause Readmission Rates

Background: The Centers for Medicare & Medicaid Services (CMS) tracks 30-day all-cause readmission rates as a quality measure. Prior studies have looked at various hospital factors associated with lower readmission rates but have not looked at hospitalist staffing levels, level of physician integration with the hospital, and the adoption of a medical home model.
Study design: Retrospective cohort study.
Setting: Private hospitals.
Synopsis: Using the American Hospital Association Annual Survey of Hospitals, CMS Hospital Compare, and Area Health Resources File of private hospitals with no missing data, the study reviewed data from 1,756 hospitals and found the median 30-day all-cause readmission rate to be 16%, with the middle 50% of hospitals’ readmission rate between 15.2% and 16.5%. All hospitals used hospitalists to provide care. Fifty-one percent of hospitals reported fully integrated, or employed, physicians. Twenty-nine percent reported establishment of a medical home.
The study found that higher hospitalist staffing levels were associated with significantly lower readmission rates. Fully integrated hospitals had a lower readmission rate than not fully integrated (15.86% versus 15.93%). Also, physician-owned hospitals had a lower readmission rate than non-physician-owned hospitals, and hospitals that had adopted a medical home model had significantly lower readmission rates. Readmission rates were significantly higher for major teaching hospitals (16.9% versus 15.76% minor teaching versus 15.83% nonteaching).
Bottom line: High hospitalist staffing levels, full integration of the hospitalists, and physician-owned hospitals were associated with lower 30-day all-cause readmission rates for private hospitals.
Citation: Al-Amin M. Hospital characteristics and 30-day all-cause readmission rates [published online ahead of print May 17, 2016]. J Hosp Med. doi:10.1002/jhm.2606

Oral Antibiotics for Infective Endocarditis May Be Safe in Low-Risk Patients
Background: Treating infective endocarditis with four to six weeks of intravenous antibiotics carries a high cost. There are data to support oral antibiotics for right-sided endocarditis due to methicillin-sensitive Staphylococcus aureus (with ciprofloxacin and rifampicin), but experience in using oral antibiotics for infective endocarditis is limited.
Study design: Cohort study.
Setting: Large academic hospital in France.
Synopsis: The researchers included 426 patients with definitive or probable endocarditis by Duke criteria. After an initial period of treatment with intravenous (IV) antibiotics, 50% of the identified group was transitioned to oral antibiotics (amoxicillin alone in 50% and combinations of fluoroquinolones, rifampicin, amoxicillin, and clindamycin in the others).
The risk of death was not increased in the group treated with oral antibiotics when adjusted for the four biggest predictors of death (age >65, type 1 diabetes mellitus, disinsertion of prosthetic valve, and endocarditis due to S. aureus). Nine patients treated with IV antibiotics experienced relapsed endocarditis compared to two patients treated with oral antibiotics.
Patients selected for treatment with oral antibiotics were less likely to have severe disease, significant comorbidities, or infection with S. aureus. The length of treatment with IV antibiotics before switching to oral antibiotics varied widely.
Bottom line: It’s possible low-risk patients with infective endocarditis may be treated with oral antibiotics, but more data are needed.
Citation: Mzabi A, Kernéis S, Richaud C, Podglajen I, Fernandez-Gerlinger MP, Mainardi, JL. Switch to oral antibiotics in the treatment of infective endocarditis is not associated with increased risk of mortality in non-severely ill patients [published online ahead of print April 16, 2016]. Clin Microbiol Infect. doi:10.1016/j.cmi.2016.04.003.