User login
Pharmacy board redux
The struggles with the State of Ohio Board of Pharmacy continue. The pharmacy board reopened its comment period for 2 weeks and received many comments from multiple physicians, organizations, and patients who would be adversely affected by the Board’s move to hold physicians’ offices to the same standard as compounding pharmacies. This was the topic of my recent column, in which I pointed out that as a result, “any practitioners who reconstitute any drug in their offices is considered to be a compounding pharmacy, ordered to pay compounding pharmacy registration fees ($112 yearly), and to undergo the same inspections as compounding pharmacies”.
At their last meeting, the pharmacy board members made a few minor changes, but practitioners will still have to throw out their neurotoxins after 1-6 hours (the exact time is still under debate). Incidentally, I have spoken to all three neurotoxin manufacturers, and they have no interest in adding preservative to their products or in bringing out smaller unit dose packaging. These regulations will have broad impact across the house of medicine because many specialties use neurotoxin.

You should know the back story behind all of this, and how the house of medicine came to this sad place.
About 20 years ago, pain control became a cause célèbre in medicine championed by no less than the World Health Organization. Numerous publications, thought leaders, and policy wonks decried the inadequacy of pain control both in and out of the hospital. It was explained loud and long that patients should have their pain controlled and that physicians fell short if they did not do so, never mind that there is no quantifiable way to measure pain. Further, it was explained that patients in severe pain did not become addicted to narcotics. And the Joint Commission heralded pain control as “the fifth vital sign.”
Where are these thought leaders now?
Graded on responsiveness to patients’ pain and the results of patient surveys on pain control, physicians grudgingly opened the narcotic floodgates and large quantities of prescription narcotics hit the streets. Admittedly, some were written by bad doctors running “pill mills,” but other supplies were diverted by producers, pharmacists, pharmacies, and pharmacy technicians. Hundreds of thousands of Americans became addicted to prescription narcotics, but overdoses were infrequent because there was a unit dose on the street.
Then the medical pendulum swung back, and it was decided that there was too much pain medicine on the streets. The narcotic supply spigots were tightened sharply by the Drug Enforcement Administration, medical boards, and legislatures. It became hard for drug-seeking patients to fill multiple prescriptions, pill mills were shut down, doctors were encouraged to prescribe minimum dosages of narcotic pain relievers, and the price of the unit dose shot up on the street. The patterns of abuse and addiction shifted as heroin became cheaper and more readily available, but hard to dose, particularly when Mexican fentanyl was being sold as “heroin.” Unable to judge the dose of illicitly obtained drugs, addicts began overdosing and dying all over America.
Angry, bereaved family members demanded an accounting for the addiction and deaths of their relatives. Heat was applied to politicians, and a “culprit” was found, physicians! Physicians had made these drugs available and caused all of these people to be addicted!
And thus began the political ascendancy of the pharmacy board, whose members claimed clean hands in this affair. Keen to expand their scope of practice, pharmacists have been trying to find a way into clinical medicine for years. The pharmacy board offered their expertise, and politicians angry at doctors were willing to give the pharmacists’ recommendations a try.
Last year in Ohio, the legislature passed a huge budget reconciliation bill with language tucked in it that authorized the pharmacy board to regulate buprenorphine and other dangerous drugs. The obvious reading of this authority would be that pharmacists were supposed to regulate compounding pharmacies, like the one that produced tainted steroid injections that resulted in 64 deaths in 2012.The regulation is so vague, however, that it could be construed that pharmacists were supposed to regulate everyone in the state, especially since the pharmacy board unilaterally moved to define “dangerous” as any prescription drug. This puts all of medicine in play. The board then declared that it would apply U.S. Pharmacopeial Convention standards (those used for compounding pharmacies) to all physician offices and declared that reconstitution of any drug is considered to be compounding.
To consider physician’s offices as compounding pharmacies is absurd and will degrade patient care by increasing expense and denying access to treatments. Physicians have made and applied individual customized medications to their patients since Galen. It is an integral part of the practice of medicine and has not suddenly become the practice of pharmacy. Using this logic, pharmacists, who have recently won the right to administer vaccinations, should obtain special licenses from the state medical board, since injecting medications is clearly in the purview of medical practice. Physicians have not been killing patients by running dirty compounding pharmacies, pharmacists have. Good, clean up the compounding pharmacies! But applying these compounding rules to physicians’ offices will not save any lives.
This battle has just been joined. The American Medical Association recently passed a resolution declaring that physician compounding should be regulated by state medical boards. This action is most helpful, and another reason for you to join and support the AMA. If you practice in Ohio, you should join the Ohio State Medical Association post haste. They are a big dog in the Ohio legislature, and your membership will influence their efforts.
I hope the Ohio governor’s Common Sense Initiative Office will convene a joint meeting that allows physicians, especially dermatologists, to demonstrate the absurdity of these rules, and their potentially destructive effects on patient care. However, I do not expect the pharmacy board to readily give up this power. Ultimately, the language in the legislative code must add two words after the word “compounding.” The words to be added are “by pharmacists.”
These rules may have to be stayed by a legal injunction. If the legislation is not clarified, a lawsuit against the pharmacy board based on restraint of trade should be successful.
Be vigilant, and watch your state legislatures. Just recently, the pharmacy board of North Dakota has made the same power grab. Stay tuned, as this struggle has national implications.
Dr. Coldiron is past president of the American Academy of Dermatology. He is currently in private practice, but maintains a clinical assistant professorship at the University of Cincinnati. He cares for patients, teaches medical students and residents, and has several active clinical research projects. Dr. Coldiron is the author of more than 80 scientific letters, papers, and several book chapters, and he speaks frequently on a variety of topics. Write to him at [email protected].
The struggles with the State of Ohio Board of Pharmacy continue. The pharmacy board reopened its comment period for 2 weeks and received many comments from multiple physicians, organizations, and patients who would be adversely affected by the Board’s move to hold physicians’ offices to the same standard as compounding pharmacies. This was the topic of my recent column, in which I pointed out that as a result, “any practitioners who reconstitute any drug in their offices is considered to be a compounding pharmacy, ordered to pay compounding pharmacy registration fees ($112 yearly), and to undergo the same inspections as compounding pharmacies”.
At their last meeting, the pharmacy board members made a few minor changes, but practitioners will still have to throw out their neurotoxins after 1-6 hours (the exact time is still under debate). Incidentally, I have spoken to all three neurotoxin manufacturers, and they have no interest in adding preservative to their products or in bringing out smaller unit dose packaging. These regulations will have broad impact across the house of medicine because many specialties use neurotoxin.
You should know the back story behind all of this, and how the house of medicine came to this sad place.
About 20 years ago, pain control became a cause célèbre in medicine championed by no less than the World Health Organization. Numerous publications, thought leaders, and policy wonks decried the inadequacy of pain control both in and out of the hospital. It was explained loud and long that patients should have their pain controlled and that physicians fell short if they did not do so, never mind that there is no quantifiable way to measure pain. Further, it was explained that patients in severe pain did not become addicted to narcotics. And the Joint Commission heralded pain control as “the fifth vital sign.”
Where are these thought leaders now?
Graded on responsiveness to patients’ pain and the results of patient surveys on pain control, physicians grudgingly opened the narcotic floodgates and large quantities of prescription narcotics hit the streets. Admittedly, some were written by bad doctors running “pill mills,” but other supplies were diverted by producers, pharmacists, pharmacies, and pharmacy technicians. Hundreds of thousands of Americans became addicted to prescription narcotics, but overdoses were infrequent because there was a unit dose on the street.
Then the medical pendulum swung back, and it was decided that there was too much pain medicine on the streets. The narcotic supply spigots were tightened sharply by the Drug Enforcement Administration, medical boards, and legislatures. It became hard for drug-seeking patients to fill multiple prescriptions, pill mills were shut down, doctors were encouraged to prescribe minimum dosages of narcotic pain relievers, and the price of the unit dose shot up on the street. The patterns of abuse and addiction shifted as heroin became cheaper and more readily available, but hard to dose, particularly when Mexican fentanyl was being sold as “heroin.” Unable to judge the dose of illicitly obtained drugs, addicts began overdosing and dying all over America.
Angry, bereaved family members demanded an accounting for the addiction and deaths of their relatives. Heat was applied to politicians, and a “culprit” was found, physicians! Physicians had made these drugs available and caused all of these people to be addicted!
And thus began the political ascendancy of the pharmacy board, whose members claimed clean hands in this affair. Keen to expand their scope of practice, pharmacists have been trying to find a way into clinical medicine for years. The pharmacy board offered their expertise, and politicians angry at doctors were willing to give the pharmacists’ recommendations a try.
Last year in Ohio, the legislature passed a huge budget reconciliation bill with language tucked in it that authorized the pharmacy board to regulate buprenorphine and other dangerous drugs. The obvious reading of this authority would be that pharmacists were supposed to regulate compounding pharmacies, like the one that produced tainted steroid injections that resulted in 64 deaths in 2012.The regulation is so vague, however, that it could be construed that pharmacists were supposed to regulate everyone in the state, especially since the pharmacy board unilaterally moved to define “dangerous” as any prescription drug. This puts all of medicine in play. The board then declared that it would apply U.S. Pharmacopeial Convention standards (those used for compounding pharmacies) to all physician offices and declared that reconstitution of any drug is considered to be compounding.
To consider physician’s offices as compounding pharmacies is absurd and will degrade patient care by increasing expense and denying access to treatments. Physicians have made and applied individual customized medications to their patients since Galen. It is an integral part of the practice of medicine and has not suddenly become the practice of pharmacy. Using this logic, pharmacists, who have recently won the right to administer vaccinations, should obtain special licenses from the state medical board, since injecting medications is clearly in the purview of medical practice. Physicians have not been killing patients by running dirty compounding pharmacies, pharmacists have. Good, clean up the compounding pharmacies! But applying these compounding rules to physicians’ offices will not save any lives.
This battle has just been joined. The American Medical Association recently passed a resolution declaring that physician compounding should be regulated by state medical boards. This action is most helpful, and another reason for you to join and support the AMA. If you practice in Ohio, you should join the Ohio State Medical Association post haste. They are a big dog in the Ohio legislature, and your membership will influence their efforts.
I hope the Ohio governor’s Common Sense Initiative Office will convene a joint meeting that allows physicians, especially dermatologists, to demonstrate the absurdity of these rules, and their potentially destructive effects on patient care. However, I do not expect the pharmacy board to readily give up this power. Ultimately, the language in the legislative code must add two words after the word “compounding.” The words to be added are “by pharmacists.”
These rules may have to be stayed by a legal injunction. If the legislation is not clarified, a lawsuit against the pharmacy board based on restraint of trade should be successful.
Be vigilant, and watch your state legislatures. Just recently, the pharmacy board of North Dakota has made the same power grab. Stay tuned, as this struggle has national implications.
Dr. Coldiron is past president of the American Academy of Dermatology. He is currently in private practice, but maintains a clinical assistant professorship at the University of Cincinnati. He cares for patients, teaches medical students and residents, and has several active clinical research projects. Dr. Coldiron is the author of more than 80 scientific letters, papers, and several book chapters, and he speaks frequently on a variety of topics. Write to him at [email protected].

Support young investigators through the AGA Research Foundation
Decades of research have revolutionized the care of many digestive disease patients. These patients, as well as everyone in the GI field – clinicians and researchers alike, have benefited from the discoveries of dedicated investigators, past and present. Creative young investigators are poised to make groundbreaking discoveries that will shape the future of gastroenterology. As the charitable arm of the AGA, the AGA Research Foundation provides a key source of funding at a critical juncture in a young researcher’s career.
“To continue to improve the diagnosis and treatment of digestive disease, we need innovative researchers with new approaches. This kind of scientific exploration has the potential to make a tremendous impact on the future of health care,” states Dr. Robert S. Sandler, chair of the AGA Research Foundation and AGA Legacy Society member.
By joining others in supporting the AGA Research Foundation, you will ensure that young investigators have opportunities to continue their life-saving work. Learn more or make a contribution at the AGA Research Foundation web site.
Join the AGA Legacy Society
The AGA Legacy Society honors individuals who have chosen to benefit the AGA Research Foundation through a significant current or planned gift. Research is made possible through their support. AGA Legacy Society members are showing their gratitude for what funding and research has brought to our specialty by giving back. Members of the AGA Legacy Society contribute $5,000 or more annually for five years to the AGA Research Foundation. Learn more about the AGA Legacy Society on the foundation’s website.
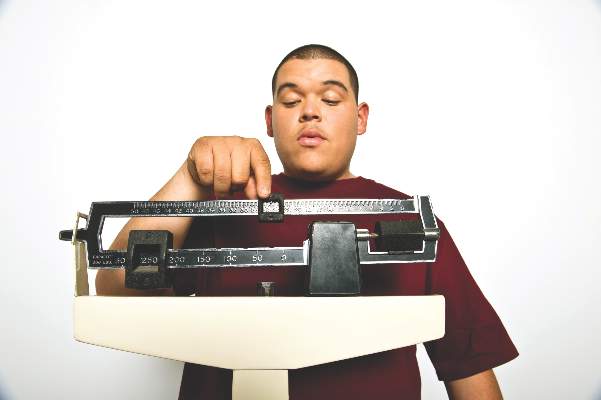
Office-based evidence-informed tools guide obesity and eating disorder counseling
Avoid weight-based language, use motivational interviewing techniques, and promote healthy family-based lifestyle modifications to prevent and manage obesity without predisposing adolescents to eating disorders, according to new recommendations in an American Academy of Pediatrics clinical report.
Obesity and eating disorders are becoming increasingly prevalent in adolescents. In 2012, 20.5% of 12- to 19-year-olds met sex-specific body mass index (BMI) criteria for obesity, according to data from the National Health and Nutrition Examination survey. From 1999 to 2006, there was a 119% increase in hospitalizations due to eating disorders among children younger than 12 years, according to a 2011 study by the Agency for Healthcare Research and Quality.

Most adolescents who develop eating disorders are not obese, lead coauthor Neville H. Golden, MD, of Stanford (Calif.) University and his associates noted in the report by the AAP Committee on Nutrition, the Committee on Adolescence, and the Section on Obesity (Pediatrics. 2016 Aug. doi: 10.1542/peds.2016-1649).
However, in some adolescents, obesity prevention or management and initial attempts to lose weight can spiral into the development of an eating disorder, they said. “In one study in adolescents seeking treatment of an [eating disorder], 36.7% had a previous weight greater than the 85th percentile for age and sex.”
Cross-sectional and longitudinal observational studies identified dieting, body dissatisfaction, and talking about or teasing a child about his or her weight as risk factors for obesity and eating disorders. Conversely, family meals have been associated with improved dietary quality and a reduction in eating disorders among adolescent girls.
As pediatricians are often the first professional consulted by a parent when eating disorders or obesity are a concern, the investigators recommended the following office-based, evidence-informed tools to provide guidance about obesity and eating disorders:
• Discourage dieting, skipping of meals, or the use of diet pills.
• Encourage healthy eating and physical activity.
• Promote a positive body image; do not focus on body dissatisfaction as a reason for dieting.
• Encourage family meals.
• Encourage families not to talk about weight, but rather to talk about healthy eating and being active to stay healthy.
• Inquire about a history of mistreatment or bullying in overweight and obese teenagers and address this issue with patients and their families.
• Monitor weight loss in adolescents who need to lose weight.
The American Academy of Pediatrics supported this clinical report. The authors had no relevant disclosures to report.
On Twitter @jessnicolecraig
Avoid weight-based language, use motivational interviewing techniques, and promote healthy family-based lifestyle modifications to prevent and manage obesity without predisposing adolescents to eating disorders, according to new recommendations in an American Academy of Pediatrics clinical report.
Obesity and eating disorders are becoming increasingly prevalent in adolescents. In 2012, 20.5% of 12- to 19-year-olds met sex-specific body mass index (BMI) criteria for obesity, according to data from the National Health and Nutrition Examination survey. From 1999 to 2006, there was a 119% increase in hospitalizations due to eating disorders among children younger than 12 years, according to a 2011 study by the Agency for Healthcare Research and Quality.
Most adolescents who develop eating disorders are not obese, lead coauthor Neville H. Golden, MD, of Stanford (Calif.) University and his associates noted in the report by the AAP Committee on Nutrition, the Committee on Adolescence, and the Section on Obesity (Pediatrics. 2016 Aug. doi: 10.1542/peds.2016-1649).
However, in some adolescents, obesity prevention or management and initial attempts to lose weight can spiral into the development of an eating disorder, they said. “In one study in adolescents seeking treatment of an [eating disorder], 36.7% had a previous weight greater than the 85th percentile for age and sex.”
Cross-sectional and longitudinal observational studies identified dieting, body dissatisfaction, and talking about or teasing a child about his or her weight as risk factors for obesity and eating disorders. Conversely, family meals have been associated with improved dietary quality and a reduction in eating disorders among adolescent girls.
As pediatricians are often the first professional consulted by a parent when eating disorders or obesity are a concern, the investigators recommended the following office-based, evidence-informed tools to provide guidance about obesity and eating disorders:
• Discourage dieting, skipping of meals, or the use of diet pills.
• Encourage healthy eating and physical activity.
• Promote a positive body image; do not focus on body dissatisfaction as a reason for dieting.
• Encourage family meals.
• Encourage families not to talk about weight, but rather to talk about healthy eating and being active to stay healthy.
• Inquire about a history of mistreatment or bullying in overweight and obese teenagers and address this issue with patients and their families.
• Monitor weight loss in adolescents who need to lose weight.
The American Academy of Pediatrics supported this clinical report. The authors had no relevant disclosures to report.
On Twitter @jessnicolecraig
FROM PEDIATRICS
Mindfulness: Is It Relevant to My Work Life?
In preparation for a presentation at the 58th Annual Meeting of the Noah Worcester Dermatological Society (April 6-10, 2016; Marana, Arizona) entitled “Burnout: The New Epidemic,” I sent out a brief survey with 4 questions, one of which asked what changes members planned to make to deal with burnout symptoms. I offered the following list of possibilities: retire early, go to more dermatology meetings, work fewer hours, see fewer patients, change jobs, leave dermatology, leave the profession of medicine altogether, restrict practice to previous patients, restrict patients to certain types of insurances only, restrict practice to self-pay patients only, and hire additional help. One of my colleagues tested the survey and suggested that I add both practicing mindfulness at work and volunteering in underprivileged settings. Mindfulness? Interesting, but it seemed unlikely that anyone would select that answer. Needing some filler answers, I added both to the list on the final survey.
Burnout is defined by episodes of emotional fatigue; development of a negative, callous, or cynical attitude toward patients; and a decreased sense of personal accomplishment.1 Survey responses showed that 58% of 48 respondents indicated that they experienced a symptom of burnout and stated that their primary issues were helplessness in the ability to shape their role or their practice, difficulty in obtaining medications that they prescribed for their patients, and too many hours at work. What did they choose as their primary actions to deal with burnout? Forty-two percent of respondents said they would work fewer hours, 38% said they would retire early, and a startling 35% said they would practice mindfulness at work.2 Because one-third of these practicing dermatologists thought they would find value in practicing mindfulness, I decided to explore this topic for its relevance in our work lives.
Mindfulness is a purposeful activity that involves being acutely aware of what is happening now as opposed to thinking about the past or worrying about the future. Jon Kabat-Zinn, PhD, developer of the practice called mindfulness-based stress reduction, phrases it this way: “Mindfulness is awareness, cultivated by paying attention in a sustained and particular way: on purpose, in the present moment, and non-judgmentally.”3 It is being rather than becoming; it is noticing internal experiences and external events rather than reacting; and it is intentional, not accidental.
Mindfulness practices include meditation, yoga, and tai chi. Buddhist monks listen to bells chime, Sufis spin by putting one foot in front of the other, and fly fishermen watch the ripples in the river. My son, a jazz musician, gets into the zone playing his bass and even senses color changes while completely losing track of time and space. I enjoy walking with my camera, looking intently for little things in the right light that will make interesting photographs. Then, I work on the right framing for that view before I take the photograph. The process keeps me in the moment, visually appreciating what I see, with no room for anxiety about my long must-do list.
Is mindfulness relevant to our work lives? The Boston Globe highlighted how mindfulness has become mainstream, reporting that major companies including Google, Aetna, the Huffington Post, Eileen Fisher, and the Massachusetts General Hospital build in opportunities during the work day for an employee to utilize practices that promote mindfulness.4 In the corporate setting, the stated objective is to contribute to the well-being of the employee, but the major motivation by the company is to reduce stress, which is one of the most costly employee health issues for absenteeism, turnover, and diminished creativity and productivity.
The medical literature supports the worth of mindfulness practices. A study of Brazilian primary care professionals showed a strong negative correlation between mindfulness and perceived stress.5 Irving et al6 showed that an 8-week formal mindfulness program reduced stress in health care professionals and produced remarkable evidence of better physical and mental health. In Australia, where medical students have much higher levels of depression and anxiety compared to the general adult population, medical students with higher levels of mindfulness traits, especially the nonjudgmental subscale, had lower levels of distress.7 Shapiro et al8 found notable decreases in distress for medical students who participated in a mindfulness program.
And mindfulness matters to patient care. A multicenter observational study of 45 clinicians caring for patients with human immunodeficiency virus found that clinicians with the highest mindfulness scores displayed a more positive emotional tone with patients and their patients reported higher ratings on clinician communication. The researchers hypothesized that these better clinical interactions may have a profound effect on quality, safety, and efficacy of the patient’s care.9
How can we incorporate mindfulness in our daily work lives? For some it is a cognitive style that regularly facilitates nonjudgmental awareness, but there are regular practices that induce mindfulness as temporary states and help build it as a persistent style. A common exercise is to take a raisin, hold it in your hand and appreciate its color and shape, roll it in between your fingers for a tactile sensation that you describe in words to yourself, then put it on your tongue to feel its sensation there, and finally chew it noticing the texture and the taste. Another practice has been highlighted by respected Buddhist monk Thich Nhat Hanh who reminds us to concentrate on our breath, observing what happens as we breathe in and out.10 Kabat-Zinn3 challenges us to “hear what is here to be heard. . . . letting sounds arrive at our door, letting them come to us.” He points out it is relatively easy to be intently aware of the external and physical world, but the real difficulty is being aware and examining our thoughts and internal experiences without being drawn into judging them, which then leads us to be carried away on an emotional path.3
When I am preoccupied or distracted at work, I find it helpful to stop at the door I am about to enter, hold the knob, and take a deep breath, concentrating on the next single task in front of me. Then I open the door and see a patient or deal with an administrative issue. My mindfulness in action at the workplace, helping me have a good and productive day. Yes, mindfulness is relevant to our work lives.
- Olbricht SM. Embracing change: is it possible? Cutis. 2015;95:299-300.
- Olbricht SM. Burnout: the new epidemic. Presented at: 58th Annual Meeting of the Noah Worcester Dermatological Society; April 6-10, 2016; Marana, AZ.
- Kabat-Zinn J. Mindfulness for Beginners. Boulder, CO: Sounds True; 2012:1.
- English B. Mindful movement makes its way into the office. Boston Globe. August 7, 2015. https://www.bostonglobe.com/metro/2015/08/06/mindfulness-takes-hold-corporate-setting/3Kxojy6XFt6oW4h9nLq7kN/story.html. Accessed July 12, 2016.
- Antanes AC, Andreoni S, Hirayama MS, et al. Mindfulness, perceived stress, and subjective well-being: a correlational study in primary care health professionals. BMC Complement Altern Med. 2015;15:303.
- Irving JA, Dobkin PL, Park J. Cultivating mindfulness in health care professionals: a review of empirical studies of mindfulness-based stress reduction (MBSR). Complement Ther Clin Pract. 2009;15:61-66.
- Slonim J, Kienhuis M, Di Benedetto M, et al. The relationships among self-care, dispositional mindfulness, and psychological distress in medical students. Med Educ Online. 2015;20:27924.
- Shapiro SL, Schwartz GE, Bonner G. Effects of mindfulness-based stress reduction on medical and premedical students. J Behav Med. 1998;21:581-599.
- Beach MC, Roter D, Korthuis PT, et al. A multicenter study of physician mindfulness and health care quality. Ann Fam Med. 2013;11:421-428.
- Hanh TH. Peace Is Every Breath: A Practice for Our Busy Lives. New York, NY: HarperCollins Publishers; 2012.
In preparation for a presentation at the 58th Annual Meeting of the Noah Worcester Dermatological Society (April 6-10, 2016; Marana, Arizona) entitled “Burnout: The New Epidemic,” I sent out a brief survey with 4 questions, one of which asked what changes members planned to make to deal with burnout symptoms. I offered the following list of possibilities: retire early, go to more dermatology meetings, work fewer hours, see fewer patients, change jobs, leave dermatology, leave the profession of medicine altogether, restrict practice to previous patients, restrict patients to certain types of insurances only, restrict practice to self-pay patients only, and hire additional help. One of my colleagues tested the survey and suggested that I add both practicing mindfulness at work and volunteering in underprivileged settings. Mindfulness? Interesting, but it seemed unlikely that anyone would select that answer. Needing some filler answers, I added both to the list on the final survey.
Burnout is defined by episodes of emotional fatigue; development of a negative, callous, or cynical attitude toward patients; and a decreased sense of personal accomplishment.1 Survey responses showed that 58% of 48 respondents indicated that they experienced a symptom of burnout and stated that their primary issues were helplessness in the ability to shape their role or their practice, difficulty in obtaining medications that they prescribed for their patients, and too many hours at work. What did they choose as their primary actions to deal with burnout? Forty-two percent of respondents said they would work fewer hours, 38% said they would retire early, and a startling 35% said they would practice mindfulness at work.2 Because one-third of these practicing dermatologists thought they would find value in practicing mindfulness, I decided to explore this topic for its relevance in our work lives.
Mindfulness is a purposeful activity that involves being acutely aware of what is happening now as opposed to thinking about the past or worrying about the future. Jon Kabat-Zinn, PhD, developer of the practice called mindfulness-based stress reduction, phrases it this way: “Mindfulness is awareness, cultivated by paying attention in a sustained and particular way: on purpose, in the present moment, and non-judgmentally.”3 It is being rather than becoming; it is noticing internal experiences and external events rather than reacting; and it is intentional, not accidental.
Mindfulness practices include meditation, yoga, and tai chi. Buddhist monks listen to bells chime, Sufis spin by putting one foot in front of the other, and fly fishermen watch the ripples in the river. My son, a jazz musician, gets into the zone playing his bass and even senses color changes while completely losing track of time and space. I enjoy walking with my camera, looking intently for little things in the right light that will make interesting photographs. Then, I work on the right framing for that view before I take the photograph. The process keeps me in the moment, visually appreciating what I see, with no room for anxiety about my long must-do list.
Is mindfulness relevant to our work lives? The Boston Globe highlighted how mindfulness has become mainstream, reporting that major companies including Google, Aetna, the Huffington Post, Eileen Fisher, and the Massachusetts General Hospital build in opportunities during the work day for an employee to utilize practices that promote mindfulness.4 In the corporate setting, the stated objective is to contribute to the well-being of the employee, but the major motivation by the company is to reduce stress, which is one of the most costly employee health issues for absenteeism, turnover, and diminished creativity and productivity.
The medical literature supports the worth of mindfulness practices. A study of Brazilian primary care professionals showed a strong negative correlation between mindfulness and perceived stress.5 Irving et al6 showed that an 8-week formal mindfulness program reduced stress in health care professionals and produced remarkable evidence of better physical and mental health. In Australia, where medical students have much higher levels of depression and anxiety compared to the general adult population, medical students with higher levels of mindfulness traits, especially the nonjudgmental subscale, had lower levels of distress.7 Shapiro et al8 found notable decreases in distress for medical students who participated in a mindfulness program.
And mindfulness matters to patient care. A multicenter observational study of 45 clinicians caring for patients with human immunodeficiency virus found that clinicians with the highest mindfulness scores displayed a more positive emotional tone with patients and their patients reported higher ratings on clinician communication. The researchers hypothesized that these better clinical interactions may have a profound effect on quality, safety, and efficacy of the patient’s care.9
How can we incorporate mindfulness in our daily work lives? For some it is a cognitive style that regularly facilitates nonjudgmental awareness, but there are regular practices that induce mindfulness as temporary states and help build it as a persistent style. A common exercise is to take a raisin, hold it in your hand and appreciate its color and shape, roll it in between your fingers for a tactile sensation that you describe in words to yourself, then put it on your tongue to feel its sensation there, and finally chew it noticing the texture and the taste. Another practice has been highlighted by respected Buddhist monk Thich Nhat Hanh who reminds us to concentrate on our breath, observing what happens as we breathe in and out.10 Kabat-Zinn3 challenges us to “hear what is here to be heard. . . . letting sounds arrive at our door, letting them come to us.” He points out it is relatively easy to be intently aware of the external and physical world, but the real difficulty is being aware and examining our thoughts and internal experiences without being drawn into judging them, which then leads us to be carried away on an emotional path.3
When I am preoccupied or distracted at work, I find it helpful to stop at the door I am about to enter, hold the knob, and take a deep breath, concentrating on the next single task in front of me. Then I open the door and see a patient or deal with an administrative issue. My mindfulness in action at the workplace, helping me have a good and productive day. Yes, mindfulness is relevant to our work lives.
- Olbricht SM. Embracing change: is it possible? Cutis. 2015;95:299-300.
- Olbricht SM. Burnout: the new epidemic. Presented at: 58th Annual Meeting of the Noah Worcester Dermatological Society; April 6-10, 2016; Marana, AZ.
- Kabat-Zinn J. Mindfulness for Beginners. Boulder, CO: Sounds True; 2012:1.
- English B. Mindful movement makes its way into the office. Boston Globe. August 7, 2015. https://www.bostonglobe.com/metro/2015/08/06/mindfulness-takes-hold-corporate-setting/3Kxojy6XFt6oW4h9nLq7kN/story.html. Accessed July 12, 2016.
- Antanes AC, Andreoni S, Hirayama MS, et al. Mindfulness, perceived stress, and subjective well-being: a correlational study in primary care health professionals. BMC Complement Altern Med. 2015;15:303.
- Irving JA, Dobkin PL, Park J. Cultivating mindfulness in health care professionals: a review of empirical studies of mindfulness-based stress reduction (MBSR). Complement Ther Clin Pract. 2009;15:61-66.
- Slonim J, Kienhuis M, Di Benedetto M, et al. The relationships among self-care, dispositional mindfulness, and psychological distress in medical students. Med Educ Online. 2015;20:27924.
- Shapiro SL, Schwartz GE, Bonner G. Effects of mindfulness-based stress reduction on medical and premedical students. J Behav Med. 1998;21:581-599.
- Beach MC, Roter D, Korthuis PT, et al. A multicenter study of physician mindfulness and health care quality. Ann Fam Med. 2013;11:421-428.
- Hanh TH. Peace Is Every Breath: A Practice for Our Busy Lives. New York, NY: HarperCollins Publishers; 2012.

Metabolic tumor volume predicts outcome in follicular lymphoma
The total metabolic tumor volume, as quantified on PET scanning at the time that follicular lymphoma is diagnosed, is a strong independent predictor of treatment response and patient outcome, according to a report published online in Journal of Clinical Oncology.
Until now, no study has specifically examined the prognostic possibilities of PET-derived total metabolic tumor volume (TMTV) for this malignancy, either on its own or in combination with any of several existing prognostic indices. Those tools use a variety of surrogates to estimate tumor burden. Now that PET is recommended at diagnosis for all cases of follicular lymphoma and anatomic CT data are also available, it is much easier to estimate total tumor burden than it was when those indices were developed, said Michel Meignan, MD, PhD, of Hôpital Henri Mondor, Crétiel (France) and his associates.
It is crucial to identify patients likely to have a poor response to standard treatment, both to spare them the considerable adverse effects of that treatment and to select them for alternative first-line approaches. Even though patient survival has improved markedly during the past decade with the introduction of combined treatment using rituximab plus chemotherapy, approximately 20% of patients still show disease progression within 2 years, and the 5-year overall survival is only 50%, the investigators noted.
To assess the prognostic value of TMTV as assessed by PET, they pooled data from three multicenter prospective studies involving 185 patients with either a high tumor burden or advanced-stage follicular lymphoma. These participants were followed for a median of 63.5 months at 56 medical centers in France, Belgium, Australia, and Italy.
A TMTV threshold of 510 cm3 was found to have the optimal sensitivity (0.46), specificity (0.83), positive predictive value (0.67), and negative predictive value (0.67) for predicting both progression-free and overall survival. The 30% of patients who had a TMTV greater than that cutoff point had markedly inferior 5-year progression-free survival (less than 3 years), while the 70% who had a smaller TMTV had median progression-free survival of more than 6 years, Dr. Meignan and his associates said (J Clin Oncol. 2016 Aug 22. doi:10.1200/JCO.2016.66.9440).
Combining TMTV with other prognostic measures improved predictions even further. Patients who had both a high TMTV and an intermediate to high score on the Follicular Lymphoma International Prognostic Index 2 showed extremely poor outcomes, with a median progression-free survival of only 19 months. “This population can no longer be characterized as having an indolent lymphoma,” the investigators said.
No sponsor or funding source was cited for this study. Dr. Meignan reported receiving fees for travel and expenses from Roche; his associates reported ties to numerous industry sources.
FROM JOURNAL OF CLINICAL ONCOLOGY
Key clinical point: At diagnosis, the total metabolic tumor volume of follicular lymphoma predicts treatment response and patient outcome.
Major finding: A TMTV threshold of 510 cm3 was found to have the optimal sensitivity (0.46), specificity (0.83), positive predictive value (0.67), and negative predictive value (0.67) for predicting both progression-free and overall survival.
Data source: A pooled analysis of three multicenter prospective studies involving 185 patients with a high burden of disease.
Disclosures: No sponsor or funding source was cited for this study. Dr. Meignan reported receiving fees for travel and expenses from Roche; his associates reported ties to numerous industry sources.
AHA: Limit children’s added sugar intake to 25 g/day
The American Heart Association has set its sights on the high levels of sugar in children’s diets, recommending that consumption of added sugars be limited to 25 grams or less per day to minimize the increased risk of cardiovascular disease, according to a scientific statement published Aug. 22 in Circulation.
“In part because of the lack of clarity and consensus on how much sugar is considered safe for children, sugars remain a commonly added ingredient in foods and drinks, and overall consumption by children and adults remains high,” wrote Miriam B. Vos, MD, of Emory University, Atlanta, and her coauthors.

The group conducted a literature search of the available evidence on sugar intake and its effects on blood pressure, lipids, insulin resistance and diabetes mellitus, nonalcoholic fatty liver disease, and obesity. They also used dietary data from the 2009-2012 National Health and Nutrition Examination Survey (NHANES) to estimate added sugar consumption (Circulation 2016 Aug 22. doi: 10.1161/cir.0000000000000439).
The NHANES data revealed that on average, 2- to 5-year-olds consume 53.3 g of added sugar, defined as all sugars used as ingredients in processed and prepared foods, eaten separately or added to foods at the table, per day; 6- to 11-year-olds consume 78.7 grams a day; and 12- to 19-year-olds consume 92.9 grams per day.
The writing group found there was evidence supporting links between added sugars and increased energy intake, adiposity, central adiposity, and dyslipidemia, which are all known risk factors for cardiovascular disease. They also found that added sugars were particularly harmful when introduced during infancy.
In particular, they found that consumption of sugar-sweetened beverages was strongly associated with an increased risk of obesity across all ages, and there was also a clear dose-response relationship between increased sugar consumption and increased cardiovascular risk.
Based on this, they recommended that children and adolescents drink no more than one 8-oz. sugar-sweetened beverage per week, and limit their overall added sugar intake to 25 g (around 6 teaspoons) or less per day, while added sugars should be avoided entirely for children aged under 2 years.
The group also identified significant gaps in the literature around certain issues such as whether there is a lower threshold for added sugars below which there is no negative impact on cardiovascular health, whether added sugars in food are better or worse than added sugars in drinks, and whether the sugars in 100% fruit juice have biological and cardiovascular effects in children that are similar to those of added sugars in sugar-sweetened beverages.
“Although added sugars can mostly likely be safely consumed in low amounts as part of a healthy diet, little research has been done to establish a threshold between adverse effects and health, making this an important future research topic,” wrote Dr. Vos and her colleagues.
One author reported a consultancy to the Milk Processor Education Program, and another reported having advised the Sugar Board. No other conflicts of interest were declared.
The American Heart Association has set its sights on the high levels of sugar in children’s diets, recommending that consumption of added sugars be limited to 25 grams or less per day to minimize the increased risk of cardiovascular disease, according to a scientific statement published Aug. 22 in Circulation.
“In part because of the lack of clarity and consensus on how much sugar is considered safe for children, sugars remain a commonly added ingredient in foods and drinks, and overall consumption by children and adults remains high,” wrote Miriam B. Vos, MD, of Emory University, Atlanta, and her coauthors.
The group conducted a literature search of the available evidence on sugar intake and its effects on blood pressure, lipids, insulin resistance and diabetes mellitus, nonalcoholic fatty liver disease, and obesity. They also used dietary data from the 2009-2012 National Health and Nutrition Examination Survey (NHANES) to estimate added sugar consumption (Circulation 2016 Aug 22. doi: 10.1161/cir.0000000000000439).
The NHANES data revealed that on average, 2- to 5-year-olds consume 53.3 g of added sugar, defined as all sugars used as ingredients in processed and prepared foods, eaten separately or added to foods at the table, per day; 6- to 11-year-olds consume 78.7 grams a day; and 12- to 19-year-olds consume 92.9 grams per day.
The writing group found there was evidence supporting links between added sugars and increased energy intake, adiposity, central adiposity, and dyslipidemia, which are all known risk factors for cardiovascular disease. They also found that added sugars were particularly harmful when introduced during infancy.
In particular, they found that consumption of sugar-sweetened beverages was strongly associated with an increased risk of obesity across all ages, and there was also a clear dose-response relationship between increased sugar consumption and increased cardiovascular risk.
Based on this, they recommended that children and adolescents drink no more than one 8-oz. sugar-sweetened beverage per week, and limit their overall added sugar intake to 25 g (around 6 teaspoons) or less per day, while added sugars should be avoided entirely for children aged under 2 years.
The group also identified significant gaps in the literature around certain issues such as whether there is a lower threshold for added sugars below which there is no negative impact on cardiovascular health, whether added sugars in food are better or worse than added sugars in drinks, and whether the sugars in 100% fruit juice have biological and cardiovascular effects in children that are similar to those of added sugars in sugar-sweetened beverages.
“Although added sugars can mostly likely be safely consumed in low amounts as part of a healthy diet, little research has been done to establish a threshold between adverse effects and health, making this an important future research topic,” wrote Dr. Vos and her colleagues.
One author reported a consultancy to the Milk Processor Education Program, and another reported having advised the Sugar Board. No other conflicts of interest were declared.
FROM CIRCULATION
Key clinical point: The American Heart Association has recommended that children consume no more than 25 grams of added sugar per day and that added sugars be avoided altogether for children aged under 2 years to limit the consequences for cardiovascular health.
Major finding: On average, American children consume 80 grams of added sugar per day, and increased added sugar consumption is associated with increased adiposity, central adiposity, and dyslipidemia.
Data source: Scientific statement from the American Heart Association.
Disclosures: One author reported a consultancy to the Milk Processor Education Program, and another reported having advised the Sugar Board. No other conflicts of interest were declared.

AGA launches PatientINFO Center, partners with My GiHealth app
To help our members and their patients come together on the goal of high-quality patient care, the AGA has launched a new patient education initiative.
AGA’s new digital library of patient education materials covers 25 GI-related topics and conditions to help make patient care more efficient and valuable. The resources provide easy-to-read, practical information for gastroenterologists to use with their patients before, during, and after their appointments.
Key components of the initiative are a digital PatientINFO Center and partnership with the MyGiHealth app.
“As a gastroenterologist in a busy practice, I know how hard it is to ensure that patients have the credible and unbiased information they need to manage their care,” said J. Sumner Bell, MD, AGAF, AGA patient initiative adviser. “While getting a patient up to speed is an important part of high-quality care, it’s often complicated by language barriers and low education levels.”
The AGA patient education materials were reviewed by gastroenterology and hepatology experts, so health care providers and their patients can be assured of medical accuracy. To improve patient understanding and conversations, all AGA patient education materials were written at a low reading level and are available in both English and Spanish.
AGA patient education materials on GI and hepatology conditions, procedures, and diet and medication can be viewed in the AGA PatientINFO Center.
In addition, through a new partnership, AGA and MyGiHealth hope to bring increased value to AGA members and their patients. The MyGiHealth app, developed by researchers at Cedars-Sinai and the University of Michigan, is a web and mobile app that was built by GI doctors to strengthen the interaction between GIs and their patients. The app uses validated questionnaires to measure GI symptoms and collect a full history of presenting illness prior to the patient visit. Once completed, the information is transformed into a symptom report that is sent to the gastroenterologist’s clinic for review.
Innovative Pearls for Therapeutic Success: Report From the AAD Meeting
At the Summer Meeting of the American Academy of Dermatology, Dr. Ted Rosen provides therapeutic pearls on vitamin D for chronic idiopathic urticaria and the quadrivalent human papillomavirus vaccine as a treatment of chronic refractory common warts. Here he reviews anecdotes about successes with both and recommended amounts of vitamin D.
The video associated with this article is no longer available on this site. Please view all of our videos on the MDedge YouTube channel

Biomechanical Consequences of Anterior Femoral Notching in Cruciate-Retaining Versus Posterior-Stabilized Total Knee Arthroplasty
Although rare, periprosthetic fractures remain a significant complication after total knee arthroplasty (TKA), occurring in 0.3% to 2.5% of cases.1-4 Hirsh and colleagues5 were among the first to suggest that anterior femoral notching during TKA was a potential risk factor for postoperative periprosthetic femoral fracture because notching may weaken the anterior femoral cortex. Anterior femoral notching, a cortex violation occurring during an anterior bone cut, occurs in up to 30% of cases.6 Using a theoretical biomechanical model, Culp and colleagues1 found that increasing the depth of the notch defect into the cortex led to reduced torsional strength. In more recent, cadaveric biomechanical studies, notching of the anterior femoral cortex decreased torsional strength by up to 39%.7,8 Contrary to these biomechanical studies, a retrospective study evaluating 1089 TKAs using 2 implant designs (Anatomic Graduated Component, Biomet and Legacy, Zimmer) demonstrated no significant effect of anterior femoral notching with respect to incidence of supracondylar femur fractures.6 That study, however, did not address whether implant design is associated with a differential risk for fracture in the presence of anterior notching.
Previous biomechanical studies have primarily investigated cruciate-retaining (CR) femoral components and properties with respect to anterior notching, even though the posterior-stabilized (PS) design is used more often in the United States.1,7 According to a Mayo Clinic survey, TKAs with a PS design increased from <10% in 1990 to almost 75% by 1997.9 Today, there is little to no consensus about which implant is better, and use of one or the other depends largely on the surgeon and varies widely between countries and regions.10 PS designs require more bone resection and demonstrate prosthesis-controlled rollback during flexion, whereas CR designs preserve more bone and achieve posterior stabilization via the posterior cruciate ligament.11 Despite these differences in design and mechanics, a 2013 Cochrane review of TKA design found no clinically significant differences between CR and PS with respect to pain, range of motion, or clinical and radiologic outcomes.10 The reviewers did not specifically address periprosthetic fractures associated with either femoral notching or TKA design, as they could not quantitatively analyze postoperative complications because of the diversity of reports. Given the limited number of reported cases, a review of radiographic findings pertaining to the characteristics of supracondylar fractures in anterior femoral notching was unsuccessful.12 As the previous biomechanical studies of anterior notching used primarily CR models or no prostheses at all, a study of biomechanical differences between CR and PS designs in the presence of anterior notching is warranted.1,7,8 Therefore, we conducted a study to assess the effect of anterior femoral notching on torsional strength and load to failure in CR and PS femoral components.
Materials and Methods
Twelve fourth-generation composite adult left femur synthetic sawbones (Sawbones; Pacific Research Laboratories) were selected for their consistent biomechanical properties, vs those of cadaveric specimens; in addition, low intersample variability made them preferable to cadaveric bones given the small sample used in this study.13,14 All bones were from the same lot. All were visually inspected for defects and found to be acceptable. In each sample, an anterior cortical defect was created by making an anterior cut with an undersized (size 4) posterior referencing guide. In addition, the distance from the proximal end of the notch to the implant fell within 15 mm, as that is the maximum distance from the implant a notch can be placed using a standard femoral cutting jig.15 Six femora were instrumented with CR implants and 6 with PS implants (DePuy Synthes). Implants were placed using standardized cuts. Before testing, each implant was inspected for proper fit and found to be securely fastened to the femur. In addition, precision calipers were used to measure notch depth and distance from notch to implant before loading. A custom polymethylmethacrylate torsion jig was used to fix each instrumented femur proximally and distally on the femoral implant (Figure 1). Care was taken to ensure the distal jig engaged only the implant, thus isolating the notch as a stress riser. Each femur was loaded in external rotation through the proximal femoral jig along the anatomical axis. Use of external rotation was based on study findings implicating external rotation of the tibia as the most likely mechanism for generating a fracture in the event of a fall.12 Furthermore, distal femur fractures are predominantly spiral as opposed to butterfly or bending—an indication that torsion is the most likely mechanism of failure.16 With no axial rotation possible within the prosthesis, increased torsional stress is undoubtedly generated within adjacent bone. Each specimen underwent torsional stiffness testing and then load to failure. Torsional stiffness was measured by slowly loading each femur in external rotation, from 1 to 18 Nm for 3 cycles at a displacement rate of 0.5° per second. Each specimen then underwent torsional load-to-failure testing on an Instron 5800R machine at a rate of 0.5° per second. Failure was defined as the moment of fracture and subsequent decrease in torsional load—determined graphically by the peak torsional load followed immediately by a sharp decrease in load. Stiffness was determined as the slope of torque to the displacement curve for each cycle, and torque to failure was the highest recorded torque before fracture. Fracture pattern was noted after failure. A sample size of 6 specimens per group provided 80% power to detect a between-group difference of 1 Nm per degree in stiffness, using an estimated SD of 0.7 Nm per degree. In our statistical analysis, continuous variables are reported as means and SDs. Data from our torsional stiffness and load-to-failure testing were analyzed with unpaired 2-sample t tests, and P < .05 was considered statistically significant.
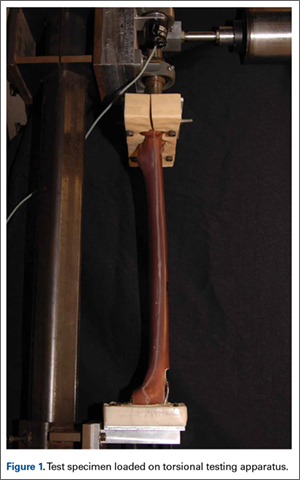
Results
We did not detect a statistical difference in notch depth, notch-to-implant distance, or femoral length between the CR and PS groups. Mean (SD) notch depth was 6.0 (1.3) mm for CR and 4.9 (1.0) mm for PS (P = .13); mean (SD) distance from the proximal end of the notch to the implant was 13.8 (1.7) mm for CR and 11.1 (3.2) mm for PS (P = .08); and mean (SD) femoral length was 46.2 (0.1) cm for CR and 46.2 (0.1) cm for PS (P = .60).
Mean (SD) torsional stiffness for the first 3 precycles was 6.2 (1.2), 8.7 (1.5), and 8.8 (1.4) Nm per degree for the CR group and 6.0 (0.7), 8.4 (1.4), and 8.6 (1.4) Nm per degree for the PS group; the differences were not statistically significant (Figure 2A). In addition, there were no statistically significant differences in mean (SD) stiffness at failure between CR, 6.5 (0.7) Nm per degree, and PS, 7.1 (0.9) Nm per degree (P = .24; Figure 2B) or in mean (SD) final torque at failure between CR, 62.4 (9.4) Nm, and PS, 62.7 (12.2) Nm (P = .95; Figure 2C).
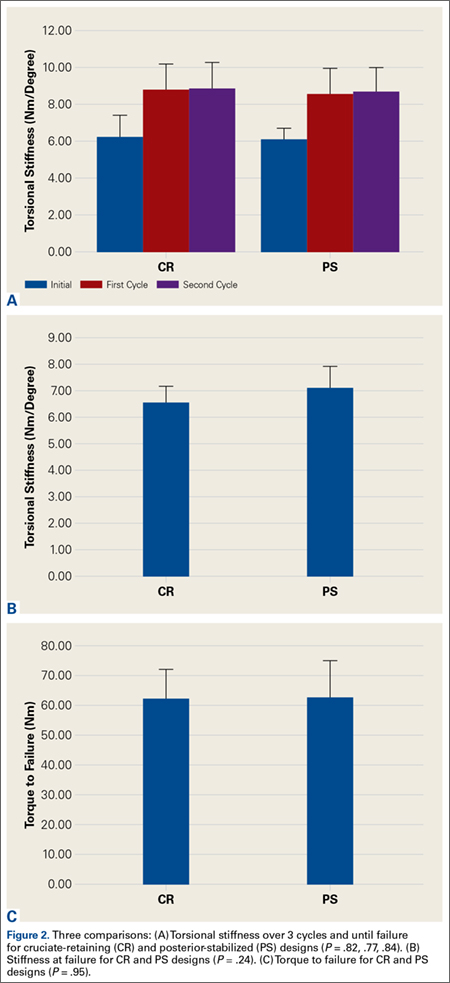
All fractures in both groups were oblique fractures originating at the proximal angle of the notch and extended proximally. None extended distally into the box. Fracture locations and patterns were identical in the CR and PS groups of femurs (Figure 3).

Discussion
Periprosthetic fractures after TKA remain rare. However, these fractures can significantly increase morbidity and complications. Anterior femoral notching occurs inadvertently in 30% to 40% of TKAs.6,17 The impact of femoral notching on supracondylar femur fracture is inconsistent between biomechanical and retrospective clinical studies. Retrospective studies failed to find a significant correlation between anterior femoral notching and supracondylar femur fractures.6,17 However, findings of biomechanical studies have suggested that a notch 3 mm deep will reduce the torsional strength of the femur by 29%.7 Another study, using 3-dimensional finite element analysis, showed a significant increase in local stress with a notch deeper than 3 mm.15
To our knowledge, no clinical studies, including the aforementioned Cochrane review,10 have specifically evaluated the difference in risk for periprosthetic fracture between different TKA models in the presence of notching.11 The biomechanical differences between implant designs could be a confounding factor in the results of past studies. More bone resection is required in PS designs than in CR designs. The position of the PS intercondylar cutout, much lower than the top of the patella flange, should not increase susceptibility to fractures more than in CR designs, but this hypothesis, though accepted, has not been validated biomechanically or addressed specifically in prospective or retrospective clinical analysis. In the present study, we used a biomechanical model to replicate an external rotation failure mechanism and quantify the differences in torsional strength and load to failure between CR TKA and PS TKA models in the presence of anterior femoral notching. Our results showed no significant differences in torsional stiffness, stiffness at failure, or torque at failure between the CR and PS design groups in the presence of anterior femoral notching.
In this study, all femoral fractures were oblique, and they all originated at the site of the cortical defect, not the notch—a situation markedly different from having bending forces applied to the femur. Previous biomechanical data indicated that bending forces applied to a notched femur cause fractures originating at the notch, whereas torsional forces applied to a notched femur cause fractures originating at the anterior aspect of the bone–component interface.7 The difference is attributable to study design. Our femurs were held fixed at their proximal end, which may have exacerbated any bending forces applied during external rotation, but we thought constraining the proximal femur would better replicate a fall involving external rotation.
More important for our study, an oblique fracture pattern was noted for both design groups (CR and PS), indicating the fracture pattern was unrelated to the area from which bone was resected for the PS design. All femur fractures in both design groups occurred proximal to a well-fixed prosthesis, indicating they should be classified as Vancouver C fractures. This is significant because intercondylar fossa resection (PS group) did not convert the fractures into Vancouver B2 fractures, which involve prosthesis loosening caused by pericomponent fracture.18 This simple observation validated our hypothesis that there would be no biomechanical differences between CR and PS designs with respect to the effects of anterior femoral notching. This lack of a significant difference may be attributed to the PS intercondylar cutout being much lower than the top of the anterior flange shielding the resected bone deep to the anterior flange.7 In addition, given the rarity of supracondylar fractures and the lack of sufficient relevant clinical data, it is difficult to speculate on the fracture patterns observed in clinical cases versus biomechanical studies.12
The use of synthetic bone models instead of cadaveric specimens could be seen as a limitation. Although synthetic bones may not reproduce the mechanism of failure in living and cadaveric femurs, the mechanical properties of synthetic bones have previously been found to fall within the range of those of cadaveric bones under axial loading, bending, and torsion testing.13,14 As a uniform testing material, synthetic bones allow removal of the confounding variations in bone size and quality that plague biomechanical studies in cadaveric bones.13,14 Interfemoral variability was 20 to 200 times higher in cadaveric femurs than in synthetic bones, which makes synthetic femurs preferable to cadaveric femurs, especially in studies with a small sample size.13,14 In addition, a uniform specimen provides consistent, reproducible osteotomies, which were crucial for consistent mechanical evaluation of each configuration in this study.
The long-term clinical significance of anterior femoral notching in periprosthetic fractures is equivocal, possibly because most studies predominantly use CR implants.6 This may not be an issue if it is shown that CR and PS implants have the same mechanical properties. Despite the differences between clinical studies and our biomechanical study, reevaluation of clinical data is not warranted given the biomechanical data we present here. Results of biomechanical studies like ours still suggest an increased immediate postoperative risk for supracondylar fracture after anterior cortical notching of the femur.5,7 Ultimately, this study found that, compared with a CR design, a PS design did not alter the torsional biomechanical properties or fracture pattern of an anteriorly notched femur.
1. Culp RW, Schmidt RG, Hanks G, Mak A, Esterhai JL Jr, Heppenstall RB. Supracondylar fracture of the femur following prosthetic knee arthroplasty. Clin Orthop Relat Res. 1987;(222):212-222.
2. Delport PH, Van Audekercke R, Martens M, Mulier JC. Conservative treatment of ipsilateral supracondylar femoral fracture after total knee arthroplasty. J Trauma. 1984;24(9):846-849.
3. Figgie MP, Goldberg VM, Figgie HE 3rd, Sobel M. The results of treatment of supracondylar fracture above total knee arthroplasty. J Arthroplasty. 1990;5(3):267-276.
4. Rorabeck CH, Taylor JW. Periprosthetic fractures of the femur complicating total knee arthroplasty. Orthop Clin North Am. 1999;30(2):265-277.
5. Hirsh DM, Bhalla S, Roffman M. Supracondylar fracture of the femur following total knee replacement. Report of four cases. J Bone Joint Surg Am. 1981;63(1):162-163.
6. Ritter MA, Thong AE, Keating EM, et al. The effect of femoral notching during total knee arthroplasty on the prevalence of postoperative femoral fractures and on clinical outcome. J Bone Joint Surg Am. 2005;87(11):2411-2414.
7. Lesh ML, Schneider DJ, Deol G, Davis B, Jacobs CR, Pellegrini VD Jr. The consequences of anterior femoral notching in total knee arthroplasty. A biomechanical study. J Bone Joint Surg Am. 2000;82(8):1096-1101.
8. Shawen SB, Belmont PJ Jr, Klemme WR, Topoleski LD, Xenos JS, Orchowski JR. Osteoporosis and anterior femoral notching in periprosthetic supracondylar femoral fractures: a biomechanical analysis. J Bone Joint Surg Am. 2003;85(1):115-121.
9. Scuderi GR, Pagnano MW. Review article: the rationale for posterior cruciate substituting total knee arthroplasty. J Orthop Surg (Hong Kong). 2001;9(2):81-88.
10. Verra WC, van den Boom LG, Jacobs W, Clement DJ, Wymenga AA, Nelissen RG. Retention versus sacrifice of the posterior cruciate ligament in total knee arthroplasty for treating osteoarthritis. Cochrane Database Syst Rev. 2013;10:CD004803.
11. Kolisek FR, McGrath MS, Marker DR, et al. Posterior-stabilized versus posterior cruciate ligament-retaining total knee arthroplasty. Iowa Orthop J. 2009;29:23-27.
12. Dennis DA. Periprosthetic fractures following total knee arthroplasty. Instr Course Lect. 2001;50:379-389.
13. Cristofolini L, Viceconti M, Cappello A, Toni A. Mechanical validation of whole bone composite femur models. J Biomech. 1996;29(4):525-535.
14. Heiner AD, Brown TD. Structural properties of a new design of composite replicate femurs and tibias. J Biomech. 2001;34(6):773-781.
15. Beals RK, Tower SS. Periprosthetic fractures of the femur. An analysis of 93 fractures. Clin Orthop Relat Res. 1996;(327):238-246.
16. Gujarathi N, Putti AB, Abboud RJ, MacLean JG, Espley AJ, Kellett CF. Risk of periprosthetic fracture after anterior femoral notching. Acta Orthop. 2009;80(5):553-556.
17. Zalzal P, Backstein D, Gross AE, Papini M. Notching of the anterior femoral cortex during total knee arthroplasty: characteristics that increase local stresses. J Arthroplasty. 2006;21(5):737-743.
18. Gaski GE, Scully SP. In brief: classifications in brief: Vancouver classification of postoperative periprosthetic femur fractures. Clin Orthop Relat Res. 2011;469(5):1507-1510.
Although rare, periprosthetic fractures remain a significant complication after total knee arthroplasty (TKA), occurring in 0.3% to 2.5% of cases.1-4 Hirsh and colleagues5 were among the first to suggest that anterior femoral notching during TKA was a potential risk factor for postoperative periprosthetic femoral fracture because notching may weaken the anterior femoral cortex. Anterior femoral notching, a cortex violation occurring during an anterior bone cut, occurs in up to 30% of cases.6 Using a theoretical biomechanical model, Culp and colleagues1 found that increasing the depth of the notch defect into the cortex led to reduced torsional strength. In more recent, cadaveric biomechanical studies, notching of the anterior femoral cortex decreased torsional strength by up to 39%.7,8 Contrary to these biomechanical studies, a retrospective study evaluating 1089 TKAs using 2 implant designs (Anatomic Graduated Component, Biomet and Legacy, Zimmer) demonstrated no significant effect of anterior femoral notching with respect to incidence of supracondylar femur fractures.6 That study, however, did not address whether implant design is associated with a differential risk for fracture in the presence of anterior notching.
Previous biomechanical studies have primarily investigated cruciate-retaining (CR) femoral components and properties with respect to anterior notching, even though the posterior-stabilized (PS) design is used more often in the United States.1,7 According to a Mayo Clinic survey, TKAs with a PS design increased from <10% in 1990 to almost 75% by 1997.9 Today, there is little to no consensus about which implant is better, and use of one or the other depends largely on the surgeon and varies widely between countries and regions.10 PS designs require more bone resection and demonstrate prosthesis-controlled rollback during flexion, whereas CR designs preserve more bone and achieve posterior stabilization via the posterior cruciate ligament.11 Despite these differences in design and mechanics, a 2013 Cochrane review of TKA design found no clinically significant differences between CR and PS with respect to pain, range of motion, or clinical and radiologic outcomes.10 The reviewers did not specifically address periprosthetic fractures associated with either femoral notching or TKA design, as they could not quantitatively analyze postoperative complications because of the diversity of reports. Given the limited number of reported cases, a review of radiographic findings pertaining to the characteristics of supracondylar fractures in anterior femoral notching was unsuccessful.12 As the previous biomechanical studies of anterior notching used primarily CR models or no prostheses at all, a study of biomechanical differences between CR and PS designs in the presence of anterior notching is warranted.1,7,8 Therefore, we conducted a study to assess the effect of anterior femoral notching on torsional strength and load to failure in CR and PS femoral components.
Materials and Methods
Twelve fourth-generation composite adult left femur synthetic sawbones (Sawbones; Pacific Research Laboratories) were selected for their consistent biomechanical properties, vs those of cadaveric specimens; in addition, low intersample variability made them preferable to cadaveric bones given the small sample used in this study.13,14 All bones were from the same lot. All were visually inspected for defects and found to be acceptable. In each sample, an anterior cortical defect was created by making an anterior cut with an undersized (size 4) posterior referencing guide. In addition, the distance from the proximal end of the notch to the implant fell within 15 mm, as that is the maximum distance from the implant a notch can be placed using a standard femoral cutting jig.15 Six femora were instrumented with CR implants and 6 with PS implants (DePuy Synthes). Implants were placed using standardized cuts. Before testing, each implant was inspected for proper fit and found to be securely fastened to the femur. In addition, precision calipers were used to measure notch depth and distance from notch to implant before loading. A custom polymethylmethacrylate torsion jig was used to fix each instrumented femur proximally and distally on the femoral implant (Figure 1). Care was taken to ensure the distal jig engaged only the implant, thus isolating the notch as a stress riser. Each femur was loaded in external rotation through the proximal femoral jig along the anatomical axis. Use of external rotation was based on study findings implicating external rotation of the tibia as the most likely mechanism for generating a fracture in the event of a fall.12 Furthermore, distal femur fractures are predominantly spiral as opposed to butterfly or bending—an indication that torsion is the most likely mechanism of failure.16 With no axial rotation possible within the prosthesis, increased torsional stress is undoubtedly generated within adjacent bone. Each specimen underwent torsional stiffness testing and then load to failure. Torsional stiffness was measured by slowly loading each femur in external rotation, from 1 to 18 Nm for 3 cycles at a displacement rate of 0.5° per second. Each specimen then underwent torsional load-to-failure testing on an Instron 5800R machine at a rate of 0.5° per second. Failure was defined as the moment of fracture and subsequent decrease in torsional load—determined graphically by the peak torsional load followed immediately by a sharp decrease in load. Stiffness was determined as the slope of torque to the displacement curve for each cycle, and torque to failure was the highest recorded torque before fracture. Fracture pattern was noted after failure. A sample size of 6 specimens per group provided 80% power to detect a between-group difference of 1 Nm per degree in stiffness, using an estimated SD of 0.7 Nm per degree. In our statistical analysis, continuous variables are reported as means and SDs. Data from our torsional stiffness and load-to-failure testing were analyzed with unpaired 2-sample t tests, and P < .05 was considered statistically significant.
Results
We did not detect a statistical difference in notch depth, notch-to-implant distance, or femoral length between the CR and PS groups. Mean (SD) notch depth was 6.0 (1.3) mm for CR and 4.9 (1.0) mm for PS (P = .13); mean (SD) distance from the proximal end of the notch to the implant was 13.8 (1.7) mm for CR and 11.1 (3.2) mm for PS (P = .08); and mean (SD) femoral length was 46.2 (0.1) cm for CR and 46.2 (0.1) cm for PS (P = .60).
Mean (SD) torsional stiffness for the first 3 precycles was 6.2 (1.2), 8.7 (1.5), and 8.8 (1.4) Nm per degree for the CR group and 6.0 (0.7), 8.4 (1.4), and 8.6 (1.4) Nm per degree for the PS group; the differences were not statistically significant (Figure 2A). In addition, there were no statistically significant differences in mean (SD) stiffness at failure between CR, 6.5 (0.7) Nm per degree, and PS, 7.1 (0.9) Nm per degree (P = .24; Figure 2B) or in mean (SD) final torque at failure between CR, 62.4 (9.4) Nm, and PS, 62.7 (12.2) Nm (P = .95; Figure 2C).
All fractures in both groups were oblique fractures originating at the proximal angle of the notch and extended proximally. None extended distally into the box. Fracture locations and patterns were identical in the CR and PS groups of femurs (Figure 3).
Discussion
Periprosthetic fractures after TKA remain rare. However, these fractures can significantly increase morbidity and complications. Anterior femoral notching occurs inadvertently in 30% to 40% of TKAs.6,17 The impact of femoral notching on supracondylar femur fracture is inconsistent between biomechanical and retrospective clinical studies. Retrospective studies failed to find a significant correlation between anterior femoral notching and supracondylar femur fractures.6,17 However, findings of biomechanical studies have suggested that a notch 3 mm deep will reduce the torsional strength of the femur by 29%.7 Another study, using 3-dimensional finite element analysis, showed a significant increase in local stress with a notch deeper than 3 mm.15
To our knowledge, no clinical studies, including the aforementioned Cochrane review,10 have specifically evaluated the difference in risk for periprosthetic fracture between different TKA models in the presence of notching.11 The biomechanical differences between implant designs could be a confounding factor in the results of past studies. More bone resection is required in PS designs than in CR designs. The position of the PS intercondylar cutout, much lower than the top of the patella flange, should not increase susceptibility to fractures more than in CR designs, but this hypothesis, though accepted, has not been validated biomechanically or addressed specifically in prospective or retrospective clinical analysis. In the present study, we used a biomechanical model to replicate an external rotation failure mechanism and quantify the differences in torsional strength and load to failure between CR TKA and PS TKA models in the presence of anterior femoral notching. Our results showed no significant differences in torsional stiffness, stiffness at failure, or torque at failure between the CR and PS design groups in the presence of anterior femoral notching.
In this study, all femoral fractures were oblique, and they all originated at the site of the cortical defect, not the notch—a situation markedly different from having bending forces applied to the femur. Previous biomechanical data indicated that bending forces applied to a notched femur cause fractures originating at the notch, whereas torsional forces applied to a notched femur cause fractures originating at the anterior aspect of the bone–component interface.7 The difference is attributable to study design. Our femurs were held fixed at their proximal end, which may have exacerbated any bending forces applied during external rotation, but we thought constraining the proximal femur would better replicate a fall involving external rotation.
More important for our study, an oblique fracture pattern was noted for both design groups (CR and PS), indicating the fracture pattern was unrelated to the area from which bone was resected for the PS design. All femur fractures in both design groups occurred proximal to a well-fixed prosthesis, indicating they should be classified as Vancouver C fractures. This is significant because intercondylar fossa resection (PS group) did not convert the fractures into Vancouver B2 fractures, which involve prosthesis loosening caused by pericomponent fracture.18 This simple observation validated our hypothesis that there would be no biomechanical differences between CR and PS designs with respect to the effects of anterior femoral notching. This lack of a significant difference may be attributed to the PS intercondylar cutout being much lower than the top of the anterior flange shielding the resected bone deep to the anterior flange.7 In addition, given the rarity of supracondylar fractures and the lack of sufficient relevant clinical data, it is difficult to speculate on the fracture patterns observed in clinical cases versus biomechanical studies.12
The use of synthetic bone models instead of cadaveric specimens could be seen as a limitation. Although synthetic bones may not reproduce the mechanism of failure in living and cadaveric femurs, the mechanical properties of synthetic bones have previously been found to fall within the range of those of cadaveric bones under axial loading, bending, and torsion testing.13,14 As a uniform testing material, synthetic bones allow removal of the confounding variations in bone size and quality that plague biomechanical studies in cadaveric bones.13,14 Interfemoral variability was 20 to 200 times higher in cadaveric femurs than in synthetic bones, which makes synthetic femurs preferable to cadaveric femurs, especially in studies with a small sample size.13,14 In addition, a uniform specimen provides consistent, reproducible osteotomies, which were crucial for consistent mechanical evaluation of each configuration in this study.
The long-term clinical significance of anterior femoral notching in periprosthetic fractures is equivocal, possibly because most studies predominantly use CR implants.6 This may not be an issue if it is shown that CR and PS implants have the same mechanical properties. Despite the differences between clinical studies and our biomechanical study, reevaluation of clinical data is not warranted given the biomechanical data we present here. Results of biomechanical studies like ours still suggest an increased immediate postoperative risk for supracondylar fracture after anterior cortical notching of the femur.5,7 Ultimately, this study found that, compared with a CR design, a PS design did not alter the torsional biomechanical properties or fracture pattern of an anteriorly notched femur.
1. Culp RW, Schmidt RG, Hanks G, Mak A, Esterhai JL Jr, Heppenstall RB. Supracondylar fracture of the femur following prosthetic knee arthroplasty. Clin Orthop Relat Res. 1987;(222):212-222.
2. Delport PH, Van Audekercke R, Martens M, Mulier JC. Conservative treatment of ipsilateral supracondylar femoral fracture after total knee arthroplasty. J Trauma. 1984;24(9):846-849.
3. Figgie MP, Goldberg VM, Figgie HE 3rd, Sobel M. The results of treatment of supracondylar fracture above total knee arthroplasty. J Arthroplasty. 1990;5(3):267-276.
4. Rorabeck CH, Taylor JW. Periprosthetic fractures of the femur complicating total knee arthroplasty. Orthop Clin North Am. 1999;30(2):265-277.
5. Hirsh DM, Bhalla S, Roffman M. Supracondylar fracture of the femur following total knee replacement. Report of four cases. J Bone Joint Surg Am. 1981;63(1):162-163.
6. Ritter MA, Thong AE, Keating EM, et al. The effect of femoral notching during total knee arthroplasty on the prevalence of postoperative femoral fractures and on clinical outcome. J Bone Joint Surg Am. 2005;87(11):2411-2414.
7. Lesh ML, Schneider DJ, Deol G, Davis B, Jacobs CR, Pellegrini VD Jr. The consequences of anterior femoral notching in total knee arthroplasty. A biomechanical study. J Bone Joint Surg Am. 2000;82(8):1096-1101.
8. Shawen SB, Belmont PJ Jr, Klemme WR, Topoleski LD, Xenos JS, Orchowski JR. Osteoporosis and anterior femoral notching in periprosthetic supracondylar femoral fractures: a biomechanical analysis. J Bone Joint Surg Am. 2003;85(1):115-121.
9. Scuderi GR, Pagnano MW. Review article: the rationale for posterior cruciate substituting total knee arthroplasty. J Orthop Surg (Hong Kong). 2001;9(2):81-88.
10. Verra WC, van den Boom LG, Jacobs W, Clement DJ, Wymenga AA, Nelissen RG. Retention versus sacrifice of the posterior cruciate ligament in total knee arthroplasty for treating osteoarthritis. Cochrane Database Syst Rev. 2013;10:CD004803.
11. Kolisek FR, McGrath MS, Marker DR, et al. Posterior-stabilized versus posterior cruciate ligament-retaining total knee arthroplasty. Iowa Orthop J. 2009;29:23-27.
12. Dennis DA. Periprosthetic fractures following total knee arthroplasty. Instr Course Lect. 2001;50:379-389.
13. Cristofolini L, Viceconti M, Cappello A, Toni A. Mechanical validation of whole bone composite femur models. J Biomech. 1996;29(4):525-535.
14. Heiner AD, Brown TD. Structural properties of a new design of composite replicate femurs and tibias. J Biomech. 2001;34(6):773-781.
15. Beals RK, Tower SS. Periprosthetic fractures of the femur. An analysis of 93 fractures. Clin Orthop Relat Res. 1996;(327):238-246.
16. Gujarathi N, Putti AB, Abboud RJ, MacLean JG, Espley AJ, Kellett CF. Risk of periprosthetic fracture after anterior femoral notching. Acta Orthop. 2009;80(5):553-556.
17. Zalzal P, Backstein D, Gross AE, Papini M. Notching of the anterior femoral cortex during total knee arthroplasty: characteristics that increase local stresses. J Arthroplasty. 2006;21(5):737-743.
18. Gaski GE, Scully SP. In brief: classifications in brief: Vancouver classification of postoperative periprosthetic femur fractures. Clin Orthop Relat Res. 2011;469(5):1507-1510.

Sleep doctor: Less than 7 hours can worsen diabetes
SAN DIEGO – A sleep specialist told an audience of diabetes educators that quality sleep is “profoundly important” to the health of their patients, and regularly sleeping fewer than 7 hours a night can wreak havoc on glucose levels and insulin resistance.
There’s even evidence of a link between lack of sleep, diabetes, and heart disease, according to Terese C. Hammond, MD, medical director of the Keck Hospital of the University of Southern California Sleep Disorders Center in Los Angeles. “We don’t know which way the cause goes, but we know there’s a connection,” she said.

Dr. Hammond, who spoke at the annual meeting of the American Association of Diabetes Educators, noted that the vast majority of adults need 7-9 hours of sleep a night.
If you repeatedly don’t reach 7 hours, “there is ample evidence that some metabolic and biologic things happen to your body. Glucose goes up and insulin is secreted. Leptin decreases – the protein that tells us when we’re sated, when our hunger is satisfied. It’s a pretty potent combination, and this is associated with increases in weight and carbohydrate intake,” Dr. Hammond said.
Indeed, findings from one small study suggest a link between chronic insufficient sleep to consumption of more calories, mostly carbohydrates. The study authors speculated this may be because people eat extra food to account for being awake more but take in more than they need (Proc Natl Acad Sci USA. 2013 Apr;110[14]:5695-700).
It is possible for people to pay off a “sleep debt” by catching up on sleep, Dr. Hammond said, but only if the sleep is lost temporarily, as during a heavy medical rotation or after a personal tragedy. When sleep loss is chronic, she said, “it’s becoming apparent that the end-organ consequences are not fully recoverable.”
In regard to diabetes specifically, she said, research has linked insufficient sleep to higher rates of central obesity, higher rates of diabetes in blacks and whites, impaired glucose tolerance, decreased insulin, metabolic syndrome, and high lipids. Too much sleep has also been linked to poor health outcomes.
How can medical professionals help patients improve sleep? “The most important thing to remember about sleep is that it’s a very primitive process,” according to Dr. Hammond. “You can’t think yourself into better sleep. You have to act yourself into better sleep through light, temperature, sound, and repetitive behaviors.”
Controversial research has linked sleeping pills to higher mortality rates, she says.“I try to avoid them long term for insomnia, and not only because there’s probably an increased risk. They stop working eventually.”
Another approach, cognitive behavioral therapy (CBT), is “the most potent way to change behavior,” she said.
“CBT improves sleep efficiency in a vast majority of chronic medical diseases,” she said. “It does just as well as drugs and better than most sleeping pills.”
According to Dr. Hammond, CBT focuses on several strategies:
• Education about sleep hygiene, such as limiting the bedroom to nighttime sleep and intimacy, going to bed at the same time every night, and focusing on a dark, cool, quiet environment.
• Increasing the “sleep drive” through temporary sleep deprivation.
• Relaxation training through techniques like guided imagery, biofeedback, progressive muscle relaxation, and self-hypnosis.
Dr. Hammond reported having no relevant financial disclosures.
SAN DIEGO – A sleep specialist told an audience of diabetes educators that quality sleep is “profoundly important” to the health of their patients, and regularly sleeping fewer than 7 hours a night can wreak havoc on glucose levels and insulin resistance.
There’s even evidence of a link between lack of sleep, diabetes, and heart disease, according to Terese C. Hammond, MD, medical director of the Keck Hospital of the University of Southern California Sleep Disorders Center in Los Angeles. “We don’t know which way the cause goes, but we know there’s a connection,” she said.
Dr. Hammond, who spoke at the annual meeting of the American Association of Diabetes Educators, noted that the vast majority of adults need 7-9 hours of sleep a night.
If you repeatedly don’t reach 7 hours, “there is ample evidence that some metabolic and biologic things happen to your body. Glucose goes up and insulin is secreted. Leptin decreases – the protein that tells us when we’re sated, when our hunger is satisfied. It’s a pretty potent combination, and this is associated with increases in weight and carbohydrate intake,” Dr. Hammond said.
Indeed, findings from one small study suggest a link between chronic insufficient sleep to consumption of more calories, mostly carbohydrates. The study authors speculated this may be because people eat extra food to account for being awake more but take in more than they need (Proc Natl Acad Sci USA. 2013 Apr;110[14]:5695-700).
It is possible for people to pay off a “sleep debt” by catching up on sleep, Dr. Hammond said, but only if the sleep is lost temporarily, as during a heavy medical rotation or after a personal tragedy. When sleep loss is chronic, she said, “it’s becoming apparent that the end-organ consequences are not fully recoverable.”
In regard to diabetes specifically, she said, research has linked insufficient sleep to higher rates of central obesity, higher rates of diabetes in blacks and whites, impaired glucose tolerance, decreased insulin, metabolic syndrome, and high lipids. Too much sleep has also been linked to poor health outcomes.
How can medical professionals help patients improve sleep? “The most important thing to remember about sleep is that it’s a very primitive process,” according to Dr. Hammond. “You can’t think yourself into better sleep. You have to act yourself into better sleep through light, temperature, sound, and repetitive behaviors.”
Controversial research has linked sleeping pills to higher mortality rates, she says.“I try to avoid them long term for insomnia, and not only because there’s probably an increased risk. They stop working eventually.”
Another approach, cognitive behavioral therapy (CBT), is “the most potent way to change behavior,” she said.
“CBT improves sleep efficiency in a vast majority of chronic medical diseases,” she said. “It does just as well as drugs and better than most sleeping pills.”
According to Dr. Hammond, CBT focuses on several strategies:
• Education about sleep hygiene, such as limiting the bedroom to nighttime sleep and intimacy, going to bed at the same time every night, and focusing on a dark, cool, quiet environment.
• Increasing the “sleep drive” through temporary sleep deprivation.
• Relaxation training through techniques like guided imagery, biofeedback, progressive muscle relaxation, and self-hypnosis.
Dr. Hammond reported having no relevant financial disclosures.
AT AADE 16