User login
IL-2 adds only toxicity to neuroblastoma antibody tx
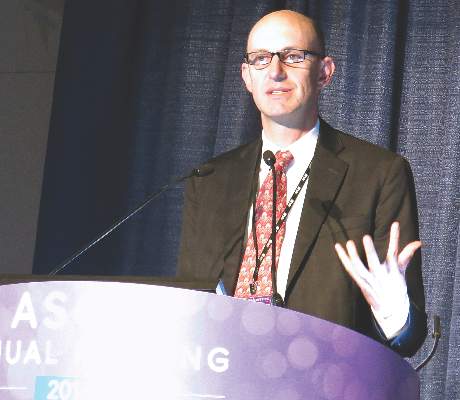
CHICAGO – Adding the cytokine IL-2 to front-line therapy with the anti-GD2 antibody ch14.18/CHO provided no additional survival benefit and only added to toxicity in the treatment of pediatric patients with high-risk neuroblastoma (NB), Dr. Ruth Ladenstein reported at the annual meeting of the American Society of Clinical Oncology.
A form of the antibody (dinutuximab) is approved for use in combination with granulocyte-macrophage colony stimulating factor, IL-2, and 13-cis-retinoic acid (RA) to treat high risk NB. A previous study (N Engl J Med. 2010;363:1324-34) showed that a combination of ch14.18 and the cytokines improved event free survival to 66% at 2 years, but the role of cytokines in this context remained unclear. Dr. Ladenstein and associates therefore performed a phase III trial that randomized patients to the antibody with or without subcutaneous (sc) IL-2.

High-risk NB was defined as patients with International Neuroblastoma Staging System stage 4 disease 1 year old or older, stage 4 less than 1 year old with MYCN amplification, or stage 2,3 patients up to age 21 years with MYCN amplification. Patients underwent a rapid induction therapy, followed by peripheral stem cell harvest, local control with complete tumor resection, myeloablative therapy with peripheral stem cell transplant, local control with radiotherapy, and then ch14.18 anti-GD2 monoclonal immunotherapy with RA, with or without sc IL-2.
Inclusion criteria were a complete response or partial response with three or fewer skeletal metastatic spots and no positive bone marrow biopsies on two aspirates. Randomization occurred between day 60 and 90 post stem cell infusion. RA was given on days 1-14 post randomization. For the arm receiving IL-2, it was given as 5 daily injections of 6 x 10⁶ IU/m2 per day over 8 hours on days 15-19. IL-2 was repeated on days 22-26. Both groups also received the ch14.18 antibody on days 22-26. All patients received high-dose morphine for pain management.
For event free survival (EFS), the primary endpoint of the trial, “if we look at 3 years, we see with antibody alone it’s 57%. With IL-2, it’s 60%. It’s completely clear that there’s no superiority for the IL-2 arm,” said Dr. Ladenstein, professor of pediatrics at the Children’s Cancer Research Institute, Austria.
At 5 years, the EFS was no different for the two treatment arms, at 51% for antibody alone and 56% for antibody plus IL-2 (P = .561). There were 199/200 patients in the antibody-alone arm with follow-up after randomization and 203/206 in the antibody plus IL-2 arm. The same was true for the secondary endpoint of overall survival, with 66% survival with antibody-alone and 58% in the antibody plus IL-2 at 5 years.
The EFS for patients with a complete response prior to immunotherapy was 66% at 3 years and was 50% for patients with less than a complete response, a significant difference (P = .003) in favor of those with a complete response. IL-2 administration had no effect on the EFS of the patients with a complete response if it was given with the immunotherapy. Similarly, IL-2 made no difference for patients who had had a very good partial response or a partial response prior to immunotherapy. For complete, very good partial, or partial responses prior to immunotherapy, the overall response to immunotherapy was 51%.
“However, feasibility is a concern, particularly in the IL-2 arm. Only 61% of the cycles were completed whereas it was 85% in the antibody-only arm, and the interruptions are definitely related mainly to the IL-2 component,” Dr. Ladenstein said.
Toxicity was higher for those patients receiving IL-2 compared to those getting antibody alone: Lansky performance status of 30% or less was 41% vs. 17%, early termination of therapy was 39% vs. 15%, and Common Terminology Criteria grade 3/4 fever was 41% vs. 14%, respectively (all P less than .001). There were also significantly more grade 3/4 allergic reactions and incidences of capillary leak, as well as diarrhea, hypotension, central nervous toxicity, and pain with IL-2.
The outcomes were favorable with antibody immunotherapy alone, but the higher toxicity with IL-2 shows that “a less toxic treatment schedule therefore is needed for this late treatment phase,” Dr. Ladenstein said.
Commenting on the trial, Dr. Barbara Hero of University Children’s Hospital in Cologne, Germany, asked whether cytokines are a useful part of the regimen “because we know the cytokines add quite a lot of toxicity to the regimens.” Even if they are potentially useful, researchers still do not know which cytokines, route of administration, and at what doses and timing would be best. Also, it is not known if a different induction regimen or antibody treatment could make a difference in using cytokines.
Another question is whether cytokines may be of benefit in patients with a higher tumor burden, e.g., more than three skeletal spots, used as the eligibility cut-off in this trial, Dr. Hero said.
CHICAGO – Adding the cytokine IL-2 to front-line therapy with the anti-GD2 antibody ch14.18/CHO provided no additional survival benefit and only added to toxicity in the treatment of pediatric patients with high-risk neuroblastoma (NB), Dr. Ruth Ladenstein reported at the annual meeting of the American Society of Clinical Oncology.
A form of the antibody (dinutuximab) is approved for use in combination with granulocyte-macrophage colony stimulating factor, IL-2, and 13-cis-retinoic acid (RA) to treat high risk NB. A previous study (N Engl J Med. 2010;363:1324-34) showed that a combination of ch14.18 and the cytokines improved event free survival to 66% at 2 years, but the role of cytokines in this context remained unclear. Dr. Ladenstein and associates therefore performed a phase III trial that randomized patients to the antibody with or without subcutaneous (sc) IL-2.
High-risk NB was defined as patients with International Neuroblastoma Staging System stage 4 disease 1 year old or older, stage 4 less than 1 year old with MYCN amplification, or stage 2,3 patients up to age 21 years with MYCN amplification. Patients underwent a rapid induction therapy, followed by peripheral stem cell harvest, local control with complete tumor resection, myeloablative therapy with peripheral stem cell transplant, local control with radiotherapy, and then ch14.18 anti-GD2 monoclonal immunotherapy with RA, with or without sc IL-2.
Inclusion criteria were a complete response or partial response with three or fewer skeletal metastatic spots and no positive bone marrow biopsies on two aspirates. Randomization occurred between day 60 and 90 post stem cell infusion. RA was given on days 1-14 post randomization. For the arm receiving IL-2, it was given as 5 daily injections of 6 x 10⁶ IU/m2 per day over 8 hours on days 15-19. IL-2 was repeated on days 22-26. Both groups also received the ch14.18 antibody on days 22-26. All patients received high-dose morphine for pain management.
For event free survival (EFS), the primary endpoint of the trial, “if we look at 3 years, we see with antibody alone it’s 57%. With IL-2, it’s 60%. It’s completely clear that there’s no superiority for the IL-2 arm,” said Dr. Ladenstein, professor of pediatrics at the Children’s Cancer Research Institute, Austria.
At 5 years, the EFS was no different for the two treatment arms, at 51% for antibody alone and 56% for antibody plus IL-2 (P = .561). There were 199/200 patients in the antibody-alone arm with follow-up after randomization and 203/206 in the antibody plus IL-2 arm. The same was true for the secondary endpoint of overall survival, with 66% survival with antibody-alone and 58% in the antibody plus IL-2 at 5 years.
The EFS for patients with a complete response prior to immunotherapy was 66% at 3 years and was 50% for patients with less than a complete response, a significant difference (P = .003) in favor of those with a complete response. IL-2 administration had no effect on the EFS of the patients with a complete response if it was given with the immunotherapy. Similarly, IL-2 made no difference for patients who had had a very good partial response or a partial response prior to immunotherapy. For complete, very good partial, or partial responses prior to immunotherapy, the overall response to immunotherapy was 51%.
“However, feasibility is a concern, particularly in the IL-2 arm. Only 61% of the cycles were completed whereas it was 85% in the antibody-only arm, and the interruptions are definitely related mainly to the IL-2 component,” Dr. Ladenstein said.
Toxicity was higher for those patients receiving IL-2 compared to those getting antibody alone: Lansky performance status of 30% or less was 41% vs. 17%, early termination of therapy was 39% vs. 15%, and Common Terminology Criteria grade 3/4 fever was 41% vs. 14%, respectively (all P less than .001). There were also significantly more grade 3/4 allergic reactions and incidences of capillary leak, as well as diarrhea, hypotension, central nervous toxicity, and pain with IL-2.
The outcomes were favorable with antibody immunotherapy alone, but the higher toxicity with IL-2 shows that “a less toxic treatment schedule therefore is needed for this late treatment phase,” Dr. Ladenstein said.
Commenting on the trial, Dr. Barbara Hero of University Children’s Hospital in Cologne, Germany, asked whether cytokines are a useful part of the regimen “because we know the cytokines add quite a lot of toxicity to the regimens.” Even if they are potentially useful, researchers still do not know which cytokines, route of administration, and at what doses and timing would be best. Also, it is not known if a different induction regimen or antibody treatment could make a difference in using cytokines.
Another question is whether cytokines may be of benefit in patients with a higher tumor burden, e.g., more than three skeletal spots, used as the eligibility cut-off in this trial, Dr. Hero said.
AT THE 2016 ASCO ANNUAL MEETING
Key clinical point: IL-2 adds no benefit, only toxicity, to neuroblastoma antibody therapy.
Major finding: Only 61% of treatment cycles were completed with IL-2.
Data source: Phase III, randomized, two-arm study of 402 pediatric/adolescent neuroblastoma patients.
Disclosures: Dr. Ladenstein has received honoraria and has had a consulting or advisory role with Apeiron Biologics and Boehringer Ingelheim, and has research funding from, patents with, has provided expert testimony for, and has received travel expenses from Apeiron. Dr. Hero had no disclosures.

Nearly 20,000 Comment on Controversial APRN Rule
The VA has proposed a significant rule change that would grant full practice authority to advanced practice registered nurses (APRNs). According to the VA, this stated goal will “increase veterans’ access to VA health care by expanding the pool of qualified health care professionals who are authorized to provide primary health care and other related health care services.” The change permits APRNs, nurse practitioners who have completed at least a master’s degree in nursing, to assess and diagnose patients, prescribe medications, and interpret diagnostic tests.
“This is good news for our APRNs, who will be able to perform functions that their colleagues in the private sector are already doing,” Under Secretary of Health David J. Shulkin, said in a statement.
The proposed role of APRNs is not unique in federal health care systems. The Army, Navy, Air Force, and Indian Health Service already give APRNs full practice authority.
The rule is open for comment through July 25, 2016, and has already received nearly 20,000 comments. Physician organizations have been particularly critical of the proposed change. “We believe that providing physician-led, patient-centered, team-based patient care is the best approach to improving quality care for our country's veterans. We feel this proposal will significantly undermine the delivery of care within the VA,” the American Medical Association noted in a statement.
Many of the most critical comments concerned the role of certified nurse anesthetists (CRNAs). The American Society of Anesthesiologists strongly criticized the rule, and of the comments to date, 15,906 specifically reference anesthesia.
Dr. Shulkin suggested that much of the criticism was misinformed. “I do not believe they [physicians] understand what our intent in going into this rule-making is,” he told The Washington Post. “We have embraced team-based health care. We believe in the model. We are not looking to destroy that. We are looking to add to our ability to deliver heath care to veterans in places that don’t frankly have health care for them right now.”
Echoing Dr. Shulkin’s comments, the Nurses Organization of Veteran Affairs (NOVA) and other nursing organizations fully support the rule. “The recognition of APRNs as full practice providers will continue to support the current VA team model of care,” Teresa Morris, NOVA director of advocacy & government relations explained. “In this model, each team member is working at the top of his or her education, training and expertise.”
According to Morris, the expanded role for APRNs also may help address disparities in care within the VA system. “There has been a lack of uniformity between VA networks, which can lead to confusion throughout the system and can contribute to issues in relationship to access,” she said. “We believe that this proposed change is resource driven and will help to decrease the variability in care provided by APRNs throughout the VA system.”
Tips and Tools for Melanoma Diagnosis

What does your patient need to know at the first visit? Does it apply to all patients?
All patients should have a total-body skin examination at least once per year; however, the frequency may change based on a prior history of melanoma or skin cancer, number of nevi or dysplastic nevi, and a family history of melanoma.
Patients should be completely undressed, and all nail polish or artificial nails should be removed prior to the examination. A complete cutaneous examination involves inspecting all skin surfaces, scalp, ocular and oral mucosa, fingernails/toenails, and genitalia if the patient agrees. Melanoma can occur in non–UV-exposed areas and the patient should be educated. Explain the ABCDEs of melanoma diagnosis to all patients and discuss concerns of any new or changing lesions, pigmented or not.
The patient should be made aware that a series of digital images will be taken for any suspicious lesions for possible short-term monitoring. The patient also may be offered full-body photography or 3D body imaging if the number of nevi warrants it.
Different patient populations have different risks for melanoma. Although melanoma predominately afflicts patients with a light skin type, there are certain types of melanoma, such as acral melanoma, that can be more common in darker skin types.
If a patient has a history of cutaneous melanoma, then the site should be checked for any local recurrence as well as palpation of the draining lymph nodes and regional lymph nodes.
I also let patients know that I will be using tools such as dermoscopy and/or reflectance confocal microscopy to better diagnose equivocal lesions before pursuing a biopsy. A biopsy may be done if there is a level of suspicion for atypia.
The use of dermoscopy, digital imaging, and reflectance confocal microscopy has changed the way we can detect, monitor, and evaluate atypical nevi. These tools can augment practice and possibly cut down on the rate of biopsies. They also are great for equivocal lesions or lesions that are in cosmetically sensitive areas. I use these tools in my everyday practice.
How do you keep patients compliant?
Empowering patients to perform self-examinations as well as examinations with his/her partner may help to reinforce monitoring by a dermatologist.
Provide patients with reading materials on self-examination while they wait in the office for your examination.
What do you do if they refuse treatment?
If patients defer a full-body skin examination, then I try to educate them about risks for UV exposure and the risk factors for both melanoma and nonmelanoma skin cancer. I also provide information on self-examinations so they can check at home for any irregularly shaped or changing moles.
What resources do you recommend to patients for more information?
It is important for patients to understand the risk factors for melanoma and the long-term prognosis of melanoma. I direct them to the American Academy of Dermatology’s website (http://www.AAD.org) for education and background about melanoma. Also, the Skin Cancer Foundation has inspiring patient stories (http://www.SkinCancer.org).

Maintenance rituximab extends progression-free but not overall survival in CLL
CHICAGO – After 2 years of maintenance immunotherapy with rituximab, elderly patients with chronic lymphocytic leukemia had better rates of progression-free survival than did patients in an observation group, based on results of the CLL 2007 SA trial from the French FILO (French Innovative Leukemia Organisation) Group.
The two groups did not significantly differ in overall survival, however, with 92.6% estimated 3-year overall survival in the rituximab group and 87.2% in the observation group. Further, the patients given rituximab had more adverse events, based on data presented by Dr. Caroline Dartigeas of the University Hospital in Tours, France, at the annual meeting of the American Society of Clinical Oncology.

Given the cost and risk for events with rituximab, the findings raise the question of whether there are any meaningful benefits for maintenance rituximab after induction therapy, Dr. Jonathan W. Friedberg of the University of Rochester, N.Y., who was the discussant of the paper, remarked after the presentation. He asked whether there is any evidence that patients feel better if they’re in remission and, thus, their quality of life is improved.
The study included fit, treatment-naive patients aged 65 years and older with B-cell CLL who lacked del17p. Median patient age was 71.3 years, and two-thirds of the patients were men.
Patients received four cycles of induction therapy with fludarabine, cyclophosphamide, and rituximab on a shortened schedule chosen to reduce the risk of cumulative toxicity. At randomization, patients were stratified for immunoglobulin heavy chain variable (IGHV) status (54.8% of patients had unmutated status) and del11q (21.3% of patients had the deletion). Patients who had complete (25.7% of patients) or partial (62.8% of patients) responses were randomly allocated to either maintenance rituximab (202 patients given 500 mg/m2 twice per month for 2 years) or to observation (207 patients). Median follow-up from randomization was 43.6 months.
Median progression-free survival in the rituximab arm was 59.3 months (95% confidence interval, 49.6; not reached), compared with 49 months (95% CI, 40.9-60.5) in the observation group (hazard ratio, 0.597; 95% CI, 0.437-0.814; P = .0011), corresponding to 3-year progression-free survival of 83% and 64.2% in each arm, respectively.
Estimated overall survival at 3 years was 92.6% with rituximab maintenance and 87.2% in the observation group. Rituximab maintenance significantly improved progression-free survival in patients with and without del11q and in those with unmutated IGHV.
Serious adverse events for hematologic toxicity were seen in 6.9% of rituximab-treated patients and 1.9% of patients in the observation group (P = .027). Serious adverse events for infectious toxicity occurred in 18.8% of rituximab-treated patients and 10.1% of the observation group (P = .036). There were 69 deaths post randomization: 32 in the rituximab-treated group and 37 in the observation group. Secondary cancers, excluding basal cell carcinomas of the skin, occurred in 15.3% of the rituximab arm, including five cases of myelodysplastic syndrome, and in 11.1% of the observation group, including three cases of myelodysplastic syndrome.
Dr. Dartigeas is a consultant to Gilead Sciences and has provided expert testimony for Roche/Genentech. Genentech and Biogen jointly market rituximab (Rituxan).
On Twitter @maryjodales
CHICAGO – After 2 years of maintenance immunotherapy with rituximab, elderly patients with chronic lymphocytic leukemia had better rates of progression-free survival than did patients in an observation group, based on results of the CLL 2007 SA trial from the French FILO (French Innovative Leukemia Organisation) Group.
The two groups did not significantly differ in overall survival, however, with 92.6% estimated 3-year overall survival in the rituximab group and 87.2% in the observation group. Further, the patients given rituximab had more adverse events, based on data presented by Dr. Caroline Dartigeas of the University Hospital in Tours, France, at the annual meeting of the American Society of Clinical Oncology.
Given the cost and risk for events with rituximab, the findings raise the question of whether there are any meaningful benefits for maintenance rituximab after induction therapy, Dr. Jonathan W. Friedberg of the University of Rochester, N.Y., who was the discussant of the paper, remarked after the presentation. He asked whether there is any evidence that patients feel better if they’re in remission and, thus, their quality of life is improved.
The study included fit, treatment-naive patients aged 65 years and older with B-cell CLL who lacked del17p. Median patient age was 71.3 years, and two-thirds of the patients were men.
Patients received four cycles of induction therapy with fludarabine, cyclophosphamide, and rituximab on a shortened schedule chosen to reduce the risk of cumulative toxicity. At randomization, patients were stratified for immunoglobulin heavy chain variable (IGHV) status (54.8% of patients had unmutated status) and del11q (21.3% of patients had the deletion). Patients who had complete (25.7% of patients) or partial (62.8% of patients) responses were randomly allocated to either maintenance rituximab (202 patients given 500 mg/m2 twice per month for 2 years) or to observation (207 patients). Median follow-up from randomization was 43.6 months.
Median progression-free survival in the rituximab arm was 59.3 months (95% confidence interval, 49.6; not reached), compared with 49 months (95% CI, 40.9-60.5) in the observation group (hazard ratio, 0.597; 95% CI, 0.437-0.814; P = .0011), corresponding to 3-year progression-free survival of 83% and 64.2% in each arm, respectively.
Estimated overall survival at 3 years was 92.6% with rituximab maintenance and 87.2% in the observation group. Rituximab maintenance significantly improved progression-free survival in patients with and without del11q and in those with unmutated IGHV.
Serious adverse events for hematologic toxicity were seen in 6.9% of rituximab-treated patients and 1.9% of patients in the observation group (P = .027). Serious adverse events for infectious toxicity occurred in 18.8% of rituximab-treated patients and 10.1% of the observation group (P = .036). There were 69 deaths post randomization: 32 in the rituximab-treated group and 37 in the observation group. Secondary cancers, excluding basal cell carcinomas of the skin, occurred in 15.3% of the rituximab arm, including five cases of myelodysplastic syndrome, and in 11.1% of the observation group, including three cases of myelodysplastic syndrome.
Dr. Dartigeas is a consultant to Gilead Sciences and has provided expert testimony for Roche/Genentech. Genentech and Biogen jointly market rituximab (Rituxan).
On Twitter @maryjodales
AT 2016 ASCO ANNUAL MEETING
Key clinical point: Progression-free survival, but not overall survival, was improved after 2 years of maintenance immunotherapy with rituximab.
Major finding: Median progression-free survival in the rituximab arm was 59.3 months (95% CI, 49.6; not reached), compared with 49 months (95% CI, 40.9-60.5) in the observation group (HR, 0.597; 95% CI, 0.437-0.814; P = .0011), corresponding to a 3-year progression-free survival of 83% and 64.2% in each arm, respectively.
Data source: Maintenance rituximab (202 patients given 500 mg/m2 twice a month for 2 years) and observation (207 patients) in the CLL 2007 SA trial from the French FILO Group.
Disclosures: Dr. Dartigeas is a consultant to Gilead Sciences and has provided expert testimony for Roche/Genentech. Genentech and Biogen jointly market rituximab (Rituxan).

Keys to alopecia areata might lie in gut microbiome
SCOTTSDALE, ARIZ. – Wiping out the gut microbiome with antibiotics prevented alopecia areata in a study of mice, providing evidence that the gut microbiome may play a role in alopecia, Dr. James Chen reported at the annual meeting of the Society for Investigative Dermatology.
The finding shows that the bacterial culprits in alopecia “reside in the gut microbiome, and not in the skin,” said Dr. Chen, a postdoctoral research fellow in medical genetics at Columbia University, New York.
Alopecia areata is mediated by autoreactive NKG2D+ CD8+ T cells. Aberrations in the human microbiome underlie several other autoimmune diseases, including rheumatoid arthritis, multiple sclerosis, and type I diabetes, Dr. Chen noted. “The gut microbiome also has been linked to skin conditions, such as acne, psoriasis, and atopic dermatitis,” he added. “So we asked, if we deplete this microbiome with an antibiotic cocktail, do we see an effect on alopecia?”
To find out, he and his coinvestigators grafted skin from C3H/Hej mice, which spontaneously develop alopecia, onto healthy younger mice, causing them to develop alopecia 6-10 weeks later. “Strikingly, we found that treating unaffected mice with an oral antibiotic cocktail prior to grafting completely prevented the development of alopecia areata, and this remained true through 15 weeks,” he said. “This is the first evidence that the gut microbiome could be implicated in alopecia, based on the absence of the phenotype that we see in treated mice.”
The researchers also evaluated whether the skin microbiomes of antibiotic-treated and control mice differed, and determined that the skin samples resembled each other in terms of overall bacterial load and bacterial taxonomic clustering patterns. That suggests that the skin microbiome is not involved in alopecia areata, Dr. Chen said.
Finally, the investigators transferred NKG2D+ CD8+ T cells from the cutaneous lymph nodes of alopecic mice to normal mice that had been pretreated with antibiotics. The treated mice had little infiltration of these T cells into the skin, and lower overall T-cell levels than control mice, Dr. Chen reported.
The investigators are now testing combinations of antibiotics and fecal transplants to pinpoint which gut bacteria make mice susceptible to hair loss. Doing so “will have significant implications on both our understanding of alopecia areata susceptibility, as well as actionable therapeutic targets for treatment” in humans, Dr. Chen said.
The study was funded by the National Institutes of Health, the Medical Research Council, the Dermatology Foundation, Locks of Love Foundation, and NYSTEM (New York State Stem Cell Science). Dr. Chen had no financial disclosures.
AT THE 2016 SID ANNUAL MEETING
Key clinical point: Using antibiotics to eliminate the gut microbiome in mice prevented them from developing alopecia.
Major finding: The mice also had lower levels of cytotoxic T-cell infiltration into the skin, compared with alopecic controls.
Data source: A study of C3H/Hej (alopecic) mice and healthy young mice that received skin grafts from the alopecic phenotype.
Disclosures: The study was funded by the National Institutes of Health, the Medical Research Council, the Dermatology Foundation, Locks of Love Foundation, and NYSTEM (New York State Stem Cell Science). Dr. Chen had no financial disclosures.
VIDEO: How to treat vascular birthmarks
NEWPORT BEACH, CALIF. – A combination of propranolol and laser is more effective than propranolol alone for infantile hemangiomas, and rapamycin can improve pulse die laser results for port wine stains.
Meanwhile, lasers hurt, so general anesthesia is in order for children as long as they’re older than 6 months.
Those are just a few of the pearls Dr. Kristen Kelly, a University of California, Irvine, professor of dermatology and surgery, shared at the Summit in Aesthetic Medicine. Dr. Kelly explained the latest developments in an interview at the conference, held by Global Academy for Medical Education.
Global Academy and this news organization are owned the same company.
The video associated with this article is no longer available on this site. Please view all of our videos on the MDedge YouTube channel
EXPERT ANALYSIS FROM THE SUMMIT IN AESTHETIC MEDICINE

Electronic Health Records, Autocoding, and Ewe: Don’t Be a Sheep!
Sheep are thought of as nervous animals, a good target for predators. You do not want to be a sheep. Unfortunately, many electronic health record (EHR) programs make you a target for audits and requests for the return of payments for a variety of reasons. Although you likely are aware of the uses of modifier -25, it is the abuses—either intentional or accidental—that can bring an audit your way. The use of modifier -25 was previously reviewed in Cutis.1 Despite the availability of this excellent review, I have found that there is still great confusion about both the use of modifier -25 and the selection of the correct evaluation and management (E&M) code when used.
When to Bill for E&M
Based on recent discussions with colleagues in the New York area who have been audited, an easy way to bring on a request for medical records is to report an E&M 100% of the time with a procedure. In these instances, every single E&M was performed on the same visit as a dermatologic procedure, most commonly biopsies(Current Procedural Terminology [CPT] code 11100, 11101) and premalignant destructions (CPT code 17000, 17003, 17004), which is in contrast with typical practitioners who perform an E&M approximately 70% of the time (RUC rationale; American Medical Association RBRVS Data Manager; May 12, 2016). One circumstance involved the reporting of E&M services 100% of the time when performed during the same visit as Mohs micrographic surgery (CPT code 17311–17315), a surprising frequency considering that the typical same day use of a code for this procedure with an E&M in the Medicare population is less than 25%.
According to the National Correct Coding Initiative Policy Manual for Medicare Services, procedures with a global period of 90 days are defined as major surgical procedures,2 which only include adjacent tissue transfers and grafts for dermatology. If an E&M is performed on the same date of service as one of these procedures to decide whether to perform the procedure, the E&M can be reported separately using modifier -57. Other preoperative E&M services provided on the same date of service as a major surgical procedure are included in the global payment for the procedure and are not reported separately.2
All other procedures dermatologists perform generally are considered minor, which are defined as having a global period of 0 or 10 days. Because the decision to perform a minor procedure is included in the payment for the procedure, E&M services should not be reported separately from the minor procedure. However, “a significant and separately identifiable E&M service unrelated to the decision to perform the minor surgical procedure is separately reportable with modifier 25. The E&M service and minor surgical procedure do not require different diagnoses. If a minor surgical procedure is performed on a new patient, the same rules for reporting E&M services apply.”2
Documentation Guidelines
These guidelines seem straightforward, but as with so much else where the government is involved, the devil is in the details. When making coding decisions, you may consult the documentation guidelines from either 19953 or 1997,4 which are available for download on the Centers for Medicare & Medicaid Services (CMS) website (https://www.cms.gov/outreach-and-education/medicare-learning-network-MLN/MLNedwebguide/emdoc.html). The 1995 guidelines are less empiric and offer more flexibility, while the 1997 guidelines rely on number of “bullets” as examination elements.
1995 Guidelines
According to the 1995 documentation guidelines, the levels of E&M services are based on 4 types of examination that are defined as follows: (1) problem focused, a limited examination of the affected body area or organ system; (2) expanded problem focused, a limited examination of the affected body area or organ system and other symptomatic or related organ system(s); (3) detailed, an extended examination of the affected body area(s) and other symptomatic or related organ system(s); and (4) comprehensive, a general multisystem examination or complete examination of a single organ system.3 Detailed history is the fuzziest part of the coding universe. Some insurers take an approach that you need to examine 2 to 7 organ systems and 4 distinct lesions in 4 body areas, which is discussed in audit tools available from some Medicare intermediaries (Advancing the Business of Healthcare forum; April 10, 2014). As a result, the 12-bullet examination from the 1997 documentation guidelines may be more suitable for a new level 3 or established level 4 visit. For a comprehensive examination, the 1995 criteria allow for a complete examination of a single organ system such as the full-body skin examination with the patient completely undressed, which is medically necessary in our melanoma patients.
For purposes of examination, 9 body areas are recognized in the 1995 guidelines,3 along with more than a dozen organ systems of which the skin is of most interest to dermatologists.
According to the 1995 guidelines,3 the extent of examinations performed and documented is dependent upon clinical judgment and the nature of the presenting problem(s) and range from focused examinations of single body areas to general multisystem or complete single organ system examinations. Specific abnormal and relevant negative findings of the examination of the affected or symptomatic body area(s) or organ system(s) should be documented. Although a notation of normal is sufficient, abnormal without elaboration is insufficient, and abnormal or unexpected findings of the examination of the unaffected or asymptomatic body area(s) or organ system(s) should be described. The medical record for a general multisystem examination should include findings involving approximately 8 or more of the 12 organ systems.
An expanded problem focused examination under the 1995 guidelines could be as simple as “Scar on cancer excision site on left cheek soft and supple. No cervical adenopathy.” There is some confusion regarding detailed examinations, and one consultant went as far as calling the guidelines “vague,”5 while others such as a Medicare intermediary make a quantum leap that if a comprehensive general system examination includes 8 to 12 organ systems, one step below should include 2 to 7 organ systems.6 In essence, the payer makes the rules here.
1997 Guidelines
According to the 1997 documentation guidelines, count bullets that are examination elements, which can be either general or single organ system.4 (A table showing the bullets for the examination elements is available from the CMS.4) For each type of examination, apply the following: problem focused examination requires 1 to 5 elements identified by a bullet, expanded problem focused examination needs at least 6, detailed examination requires at least 12, and comprehensive examination requires all elements identified by a bullet with documentation of every element in each box with a shaded border and at least 1 element in each box with an unshaded border.4 Although you may do more writing when using the 1997 guidelines, you can easily count up bullets and these guidelines are amenable to template examinations on paper and obviously easily coded into EHR software that will do the bullet counting for you.
Unfortunately, this is where a ewe becomes a sheep, ripe for hunting for a number of reasons. First, just because you documented an E&M service does not mean it is medically necessary. Do you really need vital signs for every visit? If you are a meaningful EHR user working on penalty avoidance, you may capture examination data for meaningful use that is not medically necessary but cannot be parsed out by the autocoder in your EHR. As a result, simply do a quick manual audit of your notes to see if you are overcoding, which becomes second nature if you do it often.
The second trap, which brings us back to modifier -25, is when you perform a procedure the same day as your E&M or vice versa. Every procedure we do within the Resource-Based Relative Value Scale contains preservice time, which includes review of materials relevant to the procedure, examination of the area, and all preparation (eg, marking, time out, anesthesia, scrub and drape) before the surgery begins. The detailed vignettes are available to those involved in the Relative Value Scale Update Committee process and to the rest of the world in a subscription product called the RBRVS DataManager Online, which is produced by the American Medical Association. Unfortunately, the American Medical Association is not accepting new subscriptions to this product, as it has decided to outsource most of its coding resources to Optum360, one of the many arms of UnitedHealth Group, and will not have a replacement product until after June 30, 2016.7
In essence, if you (and your EHR) are counting bullets and then treating the body area in question, you are double-dipping, as the examination of the area is included in the procedure. So if you are heading toward a CPT 99213-25 with 6 bullets, one of which is on the left arm, and you perform a 0- or 10-day global procedure on that arm, you are down to 5 bullets, which drops your level of examination to problem focused. Remember, you need only 2 of 3—history, examination, and decision making—to be at or above that need for that particular level of reporting. If only one of your history or decision making is at or above the needed level for a 99213, the loss of a single bullet drops you down to a 99212! An audit where a handful of medical records are pulled and a request for money back on the universe of payments the insurer has paid is always unpleasant and you should, if you get a request for same, follow all the rules and timelines outlined by the payer. If you knowingly behaved in a risky fashion, consult a good attorney.
Of course, you may argue that the effort needed for the E&M work for the procedure was above and beyond what is typical for the service, which can be a hard standard to meet. Although the CMS requires a “significant and separately identifiable E&M service” as noted above and a separate diagnosis is not needed, the onus is on you to prove it. It is much easier to have a separate diagnosis that stands on its own, which will probably make an audit less common (unless you do it too often).
Final Thoughts
In summary, document what you do, do what you document, and report what is medically necessary. Keep watch over your EHR to be sure it is not overcoding for you. You do not want to be a ewe!
- Alam M. Modifier -25 use in dermatology. Cutis. 2015;95:76-77.
- National Correct Coding Initiative Policy Manual for Medicare Services. Baltimore, MD: Centers for Medicare & Medicaid Services; 2016. https://www.cms.gov/Medicare/Coding/NationalCorrectCodInitEd/Downloads/2016-NCCI-Policy-Manual.zip. Accessed May 6, 2016.
- 1995 Documentation Guidelines for Evaluation and Management Services. Baltimore, MD: Centers for Medicare & Medicaid Services; 1995. https://www.cms.gov/Outreach-and-Education/Medicare-Learning-Network-MLN/MLNEdWebGuideDownloads/95Docguidelines.pdf. Accessed May 6, 2016.
- 1997 Documentation Guidelines for Evaluation and Management Services. Baltimore, MD: Centers for Medicare & Medicaid Services; 1997. https://www.cms.gov/Outreach-and-Education/Medicare-Learning-Network-MLN/MLNEdWebGuide/Downloads/97Docguidelines.pdf. Accessed May 6, 2016.
- E/M FAQ #19. E/M University website. http://www.emuniversity.com/FAQ/EMFAQ19.html. Accessed May 4, 2016.
- In the E/M documentation guidelines, what does “more detail” regarding the exam mean, and what is the difference between an expanded problem-focused exam and detailed exam? Palmetto GBA website. http://www.palmettogba.com/palmetto/providers.nsf/DocsCat/Providers~Railroad%2Medicare~Resources~FAQs~EM%20Help%20Center~8EELQD7181?open&navmenu=%7C%7C. Updated March 2, 2016. Accessed May 4, 2016.
- AMA website. http://info.commerce.ama-assn.org/online-coding-home. Accessed May 4, 2016.
Sheep are thought of as nervous animals, a good target for predators. You do not want to be a sheep. Unfortunately, many electronic health record (EHR) programs make you a target for audits and requests for the return of payments for a variety of reasons. Although you likely are aware of the uses of modifier -25, it is the abuses—either intentional or accidental—that can bring an audit your way. The use of modifier -25 was previously reviewed in Cutis.1 Despite the availability of this excellent review, I have found that there is still great confusion about both the use of modifier -25 and the selection of the correct evaluation and management (E&M) code when used.
When to Bill for E&M
Based on recent discussions with colleagues in the New York area who have been audited, an easy way to bring on a request for medical records is to report an E&M 100% of the time with a procedure. In these instances, every single E&M was performed on the same visit as a dermatologic procedure, most commonly biopsies(Current Procedural Terminology [CPT] code 11100, 11101) and premalignant destructions (CPT code 17000, 17003, 17004), which is in contrast with typical practitioners who perform an E&M approximately 70% of the time (RUC rationale; American Medical Association RBRVS Data Manager; May 12, 2016). One circumstance involved the reporting of E&M services 100% of the time when performed during the same visit as Mohs micrographic surgery (CPT code 17311–17315), a surprising frequency considering that the typical same day use of a code for this procedure with an E&M in the Medicare population is less than 25%.
According to the National Correct Coding Initiative Policy Manual for Medicare Services, procedures with a global period of 90 days are defined as major surgical procedures,2 which only include adjacent tissue transfers and grafts for dermatology. If an E&M is performed on the same date of service as one of these procedures to decide whether to perform the procedure, the E&M can be reported separately using modifier -57. Other preoperative E&M services provided on the same date of service as a major surgical procedure are included in the global payment for the procedure and are not reported separately.2
All other procedures dermatologists perform generally are considered minor, which are defined as having a global period of 0 or 10 days. Because the decision to perform a minor procedure is included in the payment for the procedure, E&M services should not be reported separately from the minor procedure. However, “a significant and separately identifiable E&M service unrelated to the decision to perform the minor surgical procedure is separately reportable with modifier 25. The E&M service and minor surgical procedure do not require different diagnoses. If a minor surgical procedure is performed on a new patient, the same rules for reporting E&M services apply.”2
Documentation Guidelines
These guidelines seem straightforward, but as with so much else where the government is involved, the devil is in the details. When making coding decisions, you may consult the documentation guidelines from either 19953 or 1997,4 which are available for download on the Centers for Medicare & Medicaid Services (CMS) website (https://www.cms.gov/outreach-and-education/medicare-learning-network-MLN/MLNedwebguide/emdoc.html). The 1995 guidelines are less empiric and offer more flexibility, while the 1997 guidelines rely on number of “bullets” as examination elements.
1995 Guidelines
According to the 1995 documentation guidelines, the levels of E&M services are based on 4 types of examination that are defined as follows: (1) problem focused, a limited examination of the affected body area or organ system; (2) expanded problem focused, a limited examination of the affected body area or organ system and other symptomatic or related organ system(s); (3) detailed, an extended examination of the affected body area(s) and other symptomatic or related organ system(s); and (4) comprehensive, a general multisystem examination or complete examination of a single organ system.3 Detailed history is the fuzziest part of the coding universe. Some insurers take an approach that you need to examine 2 to 7 organ systems and 4 distinct lesions in 4 body areas, which is discussed in audit tools available from some Medicare intermediaries (Advancing the Business of Healthcare forum; April 10, 2014). As a result, the 12-bullet examination from the 1997 documentation guidelines may be more suitable for a new level 3 or established level 4 visit. For a comprehensive examination, the 1995 criteria allow for a complete examination of a single organ system such as the full-body skin examination with the patient completely undressed, which is medically necessary in our melanoma patients.
For purposes of examination, 9 body areas are recognized in the 1995 guidelines,3 along with more than a dozen organ systems of which the skin is of most interest to dermatologists.
According to the 1995 guidelines,3 the extent of examinations performed and documented is dependent upon clinical judgment and the nature of the presenting problem(s) and range from focused examinations of single body areas to general multisystem or complete single organ system examinations. Specific abnormal and relevant negative findings of the examination of the affected or symptomatic body area(s) or organ system(s) should be documented. Although a notation of normal is sufficient, abnormal without elaboration is insufficient, and abnormal or unexpected findings of the examination of the unaffected or asymptomatic body area(s) or organ system(s) should be described. The medical record for a general multisystem examination should include findings involving approximately 8 or more of the 12 organ systems.
An expanded problem focused examination under the 1995 guidelines could be as simple as “Scar on cancer excision site on left cheek soft and supple. No cervical adenopathy.” There is some confusion regarding detailed examinations, and one consultant went as far as calling the guidelines “vague,”5 while others such as a Medicare intermediary make a quantum leap that if a comprehensive general system examination includes 8 to 12 organ systems, one step below should include 2 to 7 organ systems.6 In essence, the payer makes the rules here.
1997 Guidelines
According to the 1997 documentation guidelines, count bullets that are examination elements, which can be either general or single organ system.4 (A table showing the bullets for the examination elements is available from the CMS.4) For each type of examination, apply the following: problem focused examination requires 1 to 5 elements identified by a bullet, expanded problem focused examination needs at least 6, detailed examination requires at least 12, and comprehensive examination requires all elements identified by a bullet with documentation of every element in each box with a shaded border and at least 1 element in each box with an unshaded border.4 Although you may do more writing when using the 1997 guidelines, you can easily count up bullets and these guidelines are amenable to template examinations on paper and obviously easily coded into EHR software that will do the bullet counting for you.
Unfortunately, this is where a ewe becomes a sheep, ripe for hunting for a number of reasons. First, just because you documented an E&M service does not mean it is medically necessary. Do you really need vital signs for every visit? If you are a meaningful EHR user working on penalty avoidance, you may capture examination data for meaningful use that is not medically necessary but cannot be parsed out by the autocoder in your EHR. As a result, simply do a quick manual audit of your notes to see if you are overcoding, which becomes second nature if you do it often.
The second trap, which brings us back to modifier -25, is when you perform a procedure the same day as your E&M or vice versa. Every procedure we do within the Resource-Based Relative Value Scale contains preservice time, which includes review of materials relevant to the procedure, examination of the area, and all preparation (eg, marking, time out, anesthesia, scrub and drape) before the surgery begins. The detailed vignettes are available to those involved in the Relative Value Scale Update Committee process and to the rest of the world in a subscription product called the RBRVS DataManager Online, which is produced by the American Medical Association. Unfortunately, the American Medical Association is not accepting new subscriptions to this product, as it has decided to outsource most of its coding resources to Optum360, one of the many arms of UnitedHealth Group, and will not have a replacement product until after June 30, 2016.7
In essence, if you (and your EHR) are counting bullets and then treating the body area in question, you are double-dipping, as the examination of the area is included in the procedure. So if you are heading toward a CPT 99213-25 with 6 bullets, one of which is on the left arm, and you perform a 0- or 10-day global procedure on that arm, you are down to 5 bullets, which drops your level of examination to problem focused. Remember, you need only 2 of 3—history, examination, and decision making—to be at or above that need for that particular level of reporting. If only one of your history or decision making is at or above the needed level for a 99213, the loss of a single bullet drops you down to a 99212! An audit where a handful of medical records are pulled and a request for money back on the universe of payments the insurer has paid is always unpleasant and you should, if you get a request for same, follow all the rules and timelines outlined by the payer. If you knowingly behaved in a risky fashion, consult a good attorney.
Of course, you may argue that the effort needed for the E&M work for the procedure was above and beyond what is typical for the service, which can be a hard standard to meet. Although the CMS requires a “significant and separately identifiable E&M service” as noted above and a separate diagnosis is not needed, the onus is on you to prove it. It is much easier to have a separate diagnosis that stands on its own, which will probably make an audit less common (unless you do it too often).
Final Thoughts
In summary, document what you do, do what you document, and report what is medically necessary. Keep watch over your EHR to be sure it is not overcoding for you. You do not want to be a ewe!
- Alam M. Modifier -25 use in dermatology. Cutis. 2015;95:76-77.
- National Correct Coding Initiative Policy Manual for Medicare Services. Baltimore, MD: Centers for Medicare & Medicaid Services; 2016. https://www.cms.gov/Medicare/Coding/NationalCorrectCodInitEd/Downloads/2016-NCCI-Policy-Manual.zip. Accessed May 6, 2016.
- 1995 Documentation Guidelines for Evaluation and Management Services. Baltimore, MD: Centers for Medicare & Medicaid Services; 1995. https://www.cms.gov/Outreach-and-Education/Medicare-Learning-Network-MLN/MLNEdWebGuideDownloads/95Docguidelines.pdf. Accessed May 6, 2016.
- 1997 Documentation Guidelines for Evaluation and Management Services. Baltimore, MD: Centers for Medicare & Medicaid Services; 1997. https://www.cms.gov/Outreach-and-Education/Medicare-Learning-Network-MLN/MLNEdWebGuide/Downloads/97Docguidelines.pdf. Accessed May 6, 2016.
- E/M FAQ #19. E/M University website. http://www.emuniversity.com/FAQ/EMFAQ19.html. Accessed May 4, 2016.
- In the E/M documentation guidelines, what does “more detail” regarding the exam mean, and what is the difference between an expanded problem-focused exam and detailed exam? Palmetto GBA website. http://www.palmettogba.com/palmetto/providers.nsf/DocsCat/Providers~Railroad%2Medicare~Resources~FAQs~EM%20Help%20Center~8EELQD7181?open&navmenu=%7C%7C. Updated March 2, 2016. Accessed May 4, 2016.
- AMA website. http://info.commerce.ama-assn.org/online-coding-home. Accessed May 4, 2016.
Practice Points
- Know when to bill for evaluation and management (E&M) services performed on the same visit as a dermatologic procedure.
- Consult documentation guidelines from the Centers for Medicare & Medicaid Services when making coding decisions about E&M services.
- Watch that your electronic health record program is not overcoding.

JAK inhibitor improves alopecia, with caveats
SCOTTSDALE, ARIZ. – The Janus kinase (JAK) inhibitor tofacitinib dramatically improved several cases of alopecia areata (AA), although some patients relapsed to worse than baseline after completing treatment in a small open label pilot trial.
“Regrowth was demonstrated in 11 out of 12 patients on tofacitinib. Seven out of 12 patients achieved more than 50% regrowth,” Dr. Shawn Sidharthan reported at the annual meeting of the Society for Investigative Dermatology.
Worldwide, alopecia areata, which is caused by immune-mediated destruction of hair follicles, has a lifetime incidence of about 2% (Clin Cosmet Investig Dermatol. 2015;8:397-403). But there are no Food and Drug Administration–approved treatments for AA. Tofacitinib (Xeljanz), which is approved by the FDA for moderate to severe rheumatoid arthritis in adults, is a JAK1 and JAK3 inhibitor that curbs the interferon-gamma response inflammatory pathway, said Dr. Sidharthan of the department of dermatology and genetics at Columbia University, New York.
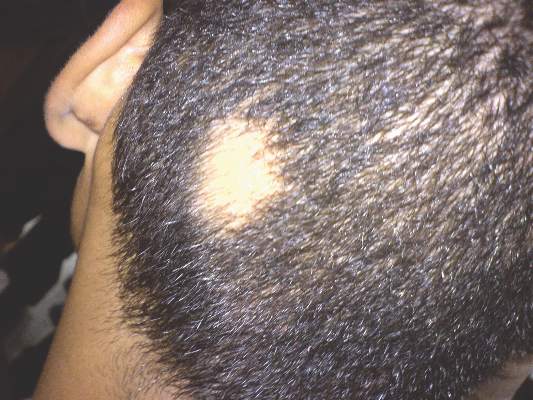
AA shares the same interferon response pathway, and tofacitinib prevented alopecia in mice and led to hair regrowth in a patient with alopecia universalis, he noted.
The single-arm trial included seven patients with moderate to severe patchy AA and five patients with alopecia totalis or alopecia universalis. Patients were treated for 6 months. They initially received 5 mg tofacitinib orally twice daily, which was increased to 10 mg twice daily to improve response. The investigators evaluated patients based on SALT (Severity of Alopecia Tool) scores and the Alopecia Areata Disease Activity Index (ALADIN), which uses three-dimensional bioinformatics to identify groups of genes linked to alopecia.
Seven of 12 patients experienced at least 50% regrowth, including six patients who only improved on 10 mg tofacitinib twice daily, Dr. Sidharthan said. Three additional patients “had good regrowth, but not 50%,” he reported. Among the two remaining patients, one had full regrowth, but dropped out of the study because of uncontrolled hypertension, and one patient with alopecia universalis had little or no regrowth.
Notably, two patients began shedding hair after stopping tofacitinib during the observation period of the study, and their final SALT scores were worse than baseline, Dr. Sidharthan said.
Laboratory monitoring of the cohort revealed no severe adverse events, but one patient paused treatment because of thrombocytopenia. The patient’s platelet count normalized after 2 weeks off tofacitinib, and remained normal when the dose was gradually increased to 10 mg twice daily. Another patient developed leukocytosis that resolved during the off-treatment observation period. One patient who did not comply with instructions to avoid alcohol had elevated liver function tests and was taken off the study. Two patients experienced self-limiting diarrhea, and one patient developed trace hematuria, Dr. Sidharthan noted.
In the study, ALADIN scores correlated with clinical response, he said.
He and his coinvestigators concluded that the overall results “provide a strong rationale for larger clinical trials using JAK inhibitors in alopecia areata,” he said.
Dr. Sidharthan noted that another oral JAK inhibitor, ruxolitinib (Jakafi), led to nearly full hair regrowth in three patients with alopecia in a Columbia University study (Nat Med. 2014 Sep; 20[9]:1043-9).
The Locks of Love Foundation funded the research. Dr. Sidharthan, a clinical research fellow in dermatology at Columbia, had no disclosures.
SCOTTSDALE, ARIZ. – The Janus kinase (JAK) inhibitor tofacitinib dramatically improved several cases of alopecia areata (AA), although some patients relapsed to worse than baseline after completing treatment in a small open label pilot trial.
“Regrowth was demonstrated in 11 out of 12 patients on tofacitinib. Seven out of 12 patients achieved more than 50% regrowth,” Dr. Shawn Sidharthan reported at the annual meeting of the Society for Investigative Dermatology.
Worldwide, alopecia areata, which is caused by immune-mediated destruction of hair follicles, has a lifetime incidence of about 2% (Clin Cosmet Investig Dermatol. 2015;8:397-403). But there are no Food and Drug Administration–approved treatments for AA. Tofacitinib (Xeljanz), which is approved by the FDA for moderate to severe rheumatoid arthritis in adults, is a JAK1 and JAK3 inhibitor that curbs the interferon-gamma response inflammatory pathway, said Dr. Sidharthan of the department of dermatology and genetics at Columbia University, New York.
AA shares the same interferon response pathway, and tofacitinib prevented alopecia in mice and led to hair regrowth in a patient with alopecia universalis, he noted.
The single-arm trial included seven patients with moderate to severe patchy AA and five patients with alopecia totalis or alopecia universalis. Patients were treated for 6 months. They initially received 5 mg tofacitinib orally twice daily, which was increased to 10 mg twice daily to improve response. The investigators evaluated patients based on SALT (Severity of Alopecia Tool) scores and the Alopecia Areata Disease Activity Index (ALADIN), which uses three-dimensional bioinformatics to identify groups of genes linked to alopecia.
Seven of 12 patients experienced at least 50% regrowth, including six patients who only improved on 10 mg tofacitinib twice daily, Dr. Sidharthan said. Three additional patients “had good regrowth, but not 50%,” he reported. Among the two remaining patients, one had full regrowth, but dropped out of the study because of uncontrolled hypertension, and one patient with alopecia universalis had little or no regrowth.
Notably, two patients began shedding hair after stopping tofacitinib during the observation period of the study, and their final SALT scores were worse than baseline, Dr. Sidharthan said.
Laboratory monitoring of the cohort revealed no severe adverse events, but one patient paused treatment because of thrombocytopenia. The patient’s platelet count normalized after 2 weeks off tofacitinib, and remained normal when the dose was gradually increased to 10 mg twice daily. Another patient developed leukocytosis that resolved during the off-treatment observation period. One patient who did not comply with instructions to avoid alcohol had elevated liver function tests and was taken off the study. Two patients experienced self-limiting diarrhea, and one patient developed trace hematuria, Dr. Sidharthan noted.
In the study, ALADIN scores correlated with clinical response, he said.
He and his coinvestigators concluded that the overall results “provide a strong rationale for larger clinical trials using JAK inhibitors in alopecia areata,” he said.
Dr. Sidharthan noted that another oral JAK inhibitor, ruxolitinib (Jakafi), led to nearly full hair regrowth in three patients with alopecia in a Columbia University study (Nat Med. 2014 Sep; 20[9]:1043-9).
The Locks of Love Foundation funded the research. Dr. Sidharthan, a clinical research fellow in dermatology at Columbia, had no disclosures.
AT THE 2016 SID ANNUAL MEETING
Key clinical point: Tofacitinib dramatically improved several cases of alopecia areata, but some patients relapsed after stopping treatment.
Major finding: Eleven of 12 patients experienced regrowth, including seven with at least 50% regrowth, but two patients relapsed to worse than baseline after stopping treatment.
Data source: The single-center open-label pilot trial evaluated tofacitinib in 12 patients with alopecia areata, totalis, or universalis.
Disclosures: The Locks of Love Foundation funded the research. Dr. Shawn Sidharthan had no disclosures.

Special Events on Tap at VAM Thursday
Special activities are everywhere today at the Vascular Annual Meeting, including the official welcome and an opening reception, not to mention the opening of the Exhibit Hall.
Activities include:
• The Opening Ceremony, 8 to 8:30 a.m. in Potomac Ballroom A/B.
• The SVS Awards Ceremony, 2:50 to 3 p.m., Potomac Ballroom A/B. Who will receive SVS’ highest honor, the Lifetime Achievement Award? Find out at the ceremony.
• Opening of the Exhibit Hall at 12 p.m. Exhibits will close at 6 p.m.
• The Opening Reception, 5:30 to 6:30 p.m., Exhibit Halls A-C.
• Alumni receptions. Alums from many institutions – Harvard, Yale, UCLA, Montefiore, Cleveland Clinic, Mayo Clinic, Baylor and many others – will catch up with former classmates and other graduates at receptions Thursday evening. The full list can be found in the Mobile App. Only the Baylor reception is off-site; all others are held at the Gaylord National Resort & Convention Center.

Enjoy Invited Speakers and Special Lectures
Thursday’s lineup includes special lectures and invited speakers, including:
John Homans Lecture, 10 to 10:30 a.m., Potomac Ballroom A/B. Dr. Frank Veith will take “A Look at the Future of Vascular Surgery."
E. Stanley Crawford Critical Issues Forum, Potomac Ballroom A/B, will discuss “In Search of Clarity: SFA-Popliteal Interventions for Claudication.”
Roy Greenberg Distinguished Lecture, 3 to 3:30 p.m., Potomac Ballroom A/B. Dr. Timothy A. Resch will present a talk on “Aortic Disease – The Quest to Improve Patient Outcomes.”