User login
Join SHM, JHM on Twitter for #JHMChat on Monday, July 11

During the chat, we invite you to join the conversation with Robert Mahoney, MD, associate professor of medicine at the Washington University School of Medicine, and Vinny Arora, MD, #JHMChat moderator and JHM deputy editor, to discuss the recent JHM publication “As-Needed Intravenous Antihypertensive Therapy and Blood Pressure Control.”
Participating in a #JHMChat allows you to have a dialogue with experts in the field conducting research with implications for your daily practice, network with fellow hospital medicine professionals, and lend your expertise to help others improve patient care. As you get ready for the chat, follow us and our Twitter partners:
- @JHospMedicine (Journal of Hospital Medicine)
- @SHMLive (Society of Hospital Medicine)
- @mahoneyr (Dr. Mahoney)
- @FutureDocs (Dr. Arora)
- @CostsofCare and @ABIMFoundation (#JHMChat partners)
On chat day, don’t forget to include #JHMChat in each of your tweets related to the chat to make sure all participants see them and are able to respond. To learn more, read the featured paper, and check out transcripts from our first three chats, visit www.hospitalmedicine.org/jhmchat.
See you on Twitter!
Brett Radler is SHM’s communications coordinator.

Ingredient in aspirin may help fight leukemia

Photo credit: Jill Watson
Researchers say they may have found a new use for an ancient anti-inflammatory drug, salicylate, which was first described by the Greek physician Hippocrates.
“Salicylic acid is one of the oldest drugs on the planet,” said senior author Eric Verdin, MD, of the Gladstone Institutes/UCSF, “dating back to the Egyptians and the Greeks, but we're still discovering new things about it.”
Its derivatives, acetylsalicylic acid, or aspirin, and diflunisal suppress 2 key proteins, CREB-binding protein (CBP) and p300, which control levels of proteins that cause inflammation or are involved in cell growth.
By inhibiting p300 and CBP, salicylic acid and diflunisal block the activation of these proteins and prevent cellular damage caused by inflammation. The research team believes that both p300 and CBP can be targeted by drugs, which would have important clinical implications.
Earlier research conducted by coauthor Stephen D. Nimer, MD, of the University of Miami Miller School of Medicine in Florida, and colleagues found a link between p300 and the leukemia-promoting protein AML1-ETO.
In the current study, published in eLife, researchers tested whether suppressing p300 with diflunisal would suppress leukemia growth in mice.
The research team inoculated SCID mice with Kasumi-1 cells, an AML cell line with the t(8;21) translocation, which represents one of the subtypes of CBF leukemia.
Three weeks later, they started treating the mice with diflunisal. Diflunisal reduced tumor size in a dose-dependent manner, and after 3 weeks of treatment, the tumors were significantly smaller than in the vehicle-treated control mice.
In fact, the researchers noted most tumors disappeared in mice treated with higher doses of diflunisal. The researchers also pointed out that diflunisal, an FDA-approved drug containing a salicylic acid substructure, inhibited CBP/p300 more potently than salicylate.
The researchers concluded that diflunisal and salicylate have promise as an oral therapy for AML patients with a t(8;21) translocation, and called it “an exciting potential application” for this new characterization of older drugs.
“Uncovering this pathway of inflammation that salicylic acid acts upon opens up a host of new clinical possibilities for these drugs,” Dr Verdin added.
The scientists are now pursuing a clinical trial to test whether salicylic acid can treat patients with leukemia as part of novel combination therapies. ![]()
Long-Term Mortality Benefits With Coronary Artery Bypass Grafting for Ischemic Cardiomyopathy
Clinical question: Does coronary artery bypass grafting added to medical therapy decrease mortality in patients with coronary artery disease and systolic heart failure?
Bottom line: Coronary artery bypass grafting (CABG) plus medical therapy decreases mortality as compared with medical therapy alone in patients with ischemic cardiomyopathy. You would need to treat 14 patients with CABG to prevent one death. (LOE = 1b)
Reference: Velazquez EJ, Lee KL, Jones RH, et al, for the STICHES Investigators. Coronary-artery bypass surgery in patients with ischemic cardiomyopathy. N Engl J Med 2016;374(16):1511-1520.
Study design: Randomized controlled trial (nonblinded)
Funding source: Government
Allocation: Concealed
Setting: Inpatient (any location) with outpatient follow-up
Synopsis: Using concealed allocation, these investigators randomized patients with heart failure with ejection fraction of 35% or less and coronary artery disease amenable to CABG to receive either guideline-directed medical therapy plus CABG (n = 610) or guideline-directed medical therapy alone (n = 602). The 2 groups were similar at baseline and the majority was categorized as New York Heart Failure Association class II. Overall, 91% of the CABG group underwent the procedure within the first year following randomization. Notably, 20% of the medical therapy group also underwent CABG during the long-term follow-up period (11% crossed over to CABG within the first year). The medial duration for follow-up was 9.8 years and analysis was by intention to treat. CABG plus medical therapy resulted in fewer deaths over 10 years as compared with medical therapy alone (59% vs 66%; hazard ratio [HR] = 0.84; 95% CI 0.73 - 0.97; P = .02). The CABG group also had fewer deaths specifically from cardiovascular causes (40% vs 49%; P = .006). A per-protocol analysis showed an even greater benefit with CABG (HR = 0.77; 0.67 - 0.90; P = .001) suggesting that the crossovers in this trial may have diluted the observed effect of CABG.
Dr. Kulkarni is an assistant professor of hospital medicine at Northwestern University in Chicago.
Stent Retriever Therapy Added to tPA Effective for Treating Acute Ischemic Stroke
Clinical question: Does the use of stent retrievers in conjunction with tissue plasminogen activator improve outcomes in patients with acute ischemic stroke?
Bottom line: The use of stent retriever devices in addition to tissue plasminogen activator (tPA) in patients with anterior circulation acute ischemic stroke results in more patients with functional independence at 90 days. Based on data from the studies included in this review, the American Heart Association/American Stroke Association guidelines now strongly recommend the use of stent retrievers with class 1a level of evidence. (LOE = 1a)
Reference: Touma L, Filion KB, Sterling LH, Atallah R, Windle SB, Eisenberg MJ. Stent retrievers for the treatment of acute ischemic stroke. JAMA Neurol 2016;73(3):275-281.
Study design: Meta-analysis (randomized controlled trials)
Funding source: Unknown/not stated
Allocation: Uncertain
Setting: Inpatient (any location) with outpatient follow-up
Synopsis: Intra-arterial therapy using stent retriever devices for thrombectomy added to standard therapy with tPA is a promising treatment for acute ischemic stroke. Four recent randomized controlled trials examining the effectiveness of stent retrievers have been terminated early because of the strong benefit seen with this therapy.
In this study, investigators searched MEDLINE, EMBASE, and the Cochrane Library, as well as trial registries and references of included studies, to find randomized controlled trials that compared stent retrievers plus tPA with tPA alone. Two authors independently extracted data from the 5 included studies (N = 1287) and assessed study quality using the Cochrane Collaboration Risk of Bias Tool.
All studies included patients with imaging-confirmed anterior circulation strokes and used the modified Rankin Scale (mRS) to assess for improvement in functional status at 90 days. Four of the 5 studies only included patients with excellent pre-stroke functional independence. Additionally, 4 of the 5 studies restricted stent retriever therapy to patients who presented within 6 hours of onset of stroke symptoms. The studies had a low risk of bias overall.
The pooled 90-day outcomes showed that patients who received stent retriever therapy plus tPA were more likely to achieve greater functional independence, defined as an mRS score of 0 to 2, than patients who received tPA alone (relative risk 1.72; 95% CI 1.38 - 1.99). You would need to treat 6 patients with stent retriever therapy to have one patient achieve functional independence. There were no significant differences detected in mortality or in the rates of intracranial bleeds or parenchymal hematomas.
Dr. Kulkarni is an assistant professor of hospital medicine at Northwestern University in Chicago.
VIDEO: Accelerated infliximab dosing halved colectomy rate in severe ulcerative colitis
SAN DIEGO – Inpatient infliximab rescue for severe, steroid-refractory ulcerative colitis is more likely to work if patients receive a second infusion 3 days after the first, according to a review of 55 University of Michigan, Ann Arbor, patients.
The traditional approach is one inpatient 5-mg/kg infusion, followed by either colectomy or subsequent outpatient infusions, depending on response. In 2013, physicians at the university began offering a second infusion at 72 hours to patients whose C-reactive protein (CRP) levels did not drop below 0.7 mg/dL after their first infusion, and they also began opting more often for 10-mg/kg dosing.
The review found that 90-day colectomy-free survival was 50% in the 16 accelerated-dosing patients, up from 10.2% in the 36 patients treated with the traditional approach (P less than .001). The finding has led to a new, more aggressive infliximab protocol for inpatient ulcerative colitis.
Among patients who did undergo colectomies, postoperative complications were similar between the two groups. But for reasons that are not clear, 30-day postoperative readmission rates were higher in accelerated patients (58% vs. 25%).
In an interview at the annual Digestive Disease Week, lead investigator Dr. Shail Govani of the University of Michigan explained the thinking behind the new approach, how CRP/albumin ratios come into play, and how to counsel patients in light of the findings.
The video associated with this article is no longer available on this site. Please view all of our videos on the MDedge YouTube channel
AT DDW 2016
2016 Update on infectious disease

Chlorhexidine-alcohol is superior to iodine-alcohol for reducing SSIs after cesarean deliveryTuuli Mg, Liu J, Stout Mj, et al. A randomized trial comparing skin antiseptic agents at cesarean delivery. N Engl J Med. 2016;374(7):647-655.
In the United States, cesarean delivery is the most commonly performed major surgical procedure, with 32.7% of births--or 1.3 million--occurring in this fashion in 2013.1,2 In general, for all surgical procedures, the SSI rate is 2% to 5%, with the rate rising to 5% to 12% for cesarean delivery, especially in obese patients.3-6 Not only do SSIs increase morbidity for the patient but they also contribute to high medical costs, with an estimated additional expense of $3,529 per cesarean-associated infection.7
Skin pathogens are a major source of SSIs. Choosing the proper antiseptic has the potential to decrease infection risk. While current guidelines recommend use of an antiseptic containing alcohol, it is unclear which disinfectant is the most effective agent to combine with the alcohol.3
Most trials evaluating preoperative antiseptic skin preparation have studied patients undergoing general surgery procedures. A well-designed trial by Darouiche and coauthors demonstrated that chlorhexidine was superior to iodine when used as an antiseptic for skin preparation.8 Interestingly, however, this trial, like most others, compared chlorhexidine-alcohol to iodine without alcohol. It is therefore unclear whether the chlorhexidine or the alcohol is responsible for the enhanced antiseptic effect.
Details of the studyIn the single-center randomized trial conducted by Tuuli and colleagues, patients were assigned to preoperative skin antisepsis with either chlorhexidine-alcohol (2% chlorhexidine gluconate with 70% isopropyl alcohol) or iodine-alcohol (8.3% povidone-iodine with 72.5% isopropyl alcohol). Antiseptic was applied according to the manufacturer's instructions, with a standard wait time of 3 minutes between application and skin incision. However, wait time was eliminated for patients undergoing emergency cesarean delivery. Additionally, patients received standard, weight-based preoperative antibiotic prophylaxis (agent not specified).
The authors estimated the necessary sample size for the trial by assuming an 8% baseline SSI rate and an anticipated 50% reduction of infection in the chlorhexidine-alcohol group. Exclusion criteria included a known allergy to chlorhexidine, alcohol, iodine, or shellfish or a preexisting skin infection adjacent to the operative site.
In addition to assessing the primary outcome of SSI with the 2 preparations, the authors conducted 4 prespecified subgroup analyses. These subgroups were based on: type of cesarean delivery (scheduled vs unscheduled), body weight (obese vs nonobese), type of skin closure (subcuticular suture vs staples), and presence or absence of chronic medical conditions (diabetes, hypertension, renal disease). Additionally, a post hoc analysis was performed, comparing women with diabetes (gestational and pregestational) to those without diabetes.
A total of 1,636 pregnant women were screened for eligibility. Of these, 489 women were excluded because they did not meet inclusion criteria or declined to participate or because informed consent could not be obtained. Baseline characteristics were similar across both groups.
Patients were followed for 30 days after surgery. A total of 1,082 women (94.3% of sample size) completed the follow-up. Among these patients, the rate of SSI was significantly lower in the chlorhexidine-alcohol group (4.3%) compared with the iodine-alcohol group (7.7%, P = .02).
In the subgroup analyses, the frequency of SSI remained lower for the chlorhexidine-alcohol group than for the iodine-alcohol group. These reductions were not affected by whether the cesarean was scheduled or unscheduled, the presence or absence of obesity, the type of skin closure, the presence of chronic disease, or diabetes status.
Several secondary outcomes also were examined in this study. There were no significant differences between the 2 antiseptic groups with respect to rates of endometritis, hospital readmission for infection-related complications, length of hospital stay, use of other health care services (such as emergency department visits, additional wound surgery, and home health services), and rates of other wound complications (seroma, hematoma, and cellulitis). Patients in the chlorhexidine-alcohol group were significantly less likely than those in the iodine-alcohol group to have physician office visits for concerns about possible wound complications (P = .009).
The authors concluded that the use of chlorhexidine-alcohol was superior to iodine-alcohol in preventing SSI after cesarean delivery.
Study strengths and limitations The authors acknowledged that their study had some minor limitations. First, the trial was conducted at a single site, which may limit the generalizability of the findings. However, the study population was racially and economically diverse. Second, the lack of blinding among providers and participants may have introduced bias, although, as the authors explain, we would expect this bias to be largely nondirectional.
A major strength of this study is its randomized design. Another strength is that the authors included emergency cesarean deliveries in their analysis. Emergency procedures represent a substantial proportion of cesarean deliveries, and they place the patient at increased risk for SSIs because of limited time available to prepare the skin before surgery begins. Thus, it is of great interest that chlorhexidine-alcohol was so effective even in the highest-risk patients.
Several properties may make chlorhexidine superior to iodine as an antiseptic: high binding affinity for the skin, high antibacterial activity against both gram-positive and gram-negative bacteria, and longer residual effects than iodine. Additionally, iodine is inactivated by organic matter, such as body fluids, whereas chlorhexidine is not.
A recent study by Ngai and colleagues9 compared chlorhexidine-alcohol with iodine-alcohol for skin preparation before cesarean delivery. These authors found no difference in SSI when comparing the 2 solutions used separately or sequentially, except in morbidly obese women. In these women, sequential application of both solutions reduced the infection rate. However, this study specifically excluded emergency cesarean deliveries, making the generalizability of the results questionable.9
What this evidence means for practiceThis large, randomized study found chlorhexidine-alcohol to be superior to iodine-alchol in reducing the risk of SSIs after cesarean delivery. These results confirm those of previous studies from both the obstetric and general surgery literature. Although chlorhexidine-alcohol is more expensive than iodine-alcohol, we strongly recommend its use in patients having cesarean delivery.
Five effective oral and intramuscular antibiotic regimens for treating postpartum endometritisMeaney-Delman D, Bartlett LA, Gravett MG, Jamieson DJ. Oral and intramuscular treatment options for early postpartum endometritis in low-resource settings: a systematic review. Obstet Gynecol. 2015;125(4):789-800.
The authors of this excellent systematic review on antibiotic treatments for early postpartum endometritis conducted their study in 3 phases. Initially, Meaney-Delman and colleagues searched the literature for reports of prospective studies that evaluated the use of oral and intramuscular (IM) antibiotics for treatment of patients who developed endometritis following either cesarean or vaginal delivery. When they discovered that these initial trials were few in number and of relatively poor quality, they reviewed more rigorous trials of intravenous (IV) antibiotics. Finally, they evaluated clinical trials that specifically identified microorganisms isolated from the uterus in patients with endometritis and used this information to help inform their recommendations for treatment options.
Details of the studyIn evaluating the trials of oral and IM antibiotics, the authors set as a standard for effectiveness a cure rate of 85%, a figure comparable to that generally achieved with IV antibiotics. They identified 2 oral antibiotic regimens that met this standard of effectiveness: amoxicillin-clavulanate (100% cure in 36 patients; 95% confidence interval [CI], 90-100) and ampicillin plus metronidazole (97% cure in 37 patients; 95% CI, 86-100).
Two studies demonstrated acceptable levels of cure with single-agent IM antibiotics: aztreonam (100% cure in 16 patients; 95% CI, 81-100) and imipenem (91% cure in 23 patients; 95% CI, 73-98). One additional trial demonstrated an acceptable clinical response rate when IV clindamycin was combined with IM gentamicin (100% cure in 54 patients; 95% CI, 94-100). By contrast, the authors noted, many different IV regimens--either as a single agent or as a drug combination--provided cure rates that equaled or exceeded 85%.
In the study's final phase, the authors provided an excellent overview of the polymicrobial nature of puerperal endometritis. As documented in multiple prior reports, the most common pathogens are the gram-negative anaerobic bacilli, such as Bacteroides and Prevotella species; the anaerobic gram-positive organisms, including Peptococcus and Peptostreptococcus species; aerobic gram-negative bacilli, such as Escherichia coli, Klebsiella pneumoniae, and Proteus species; and aerobic gram-positive cocci, such as group B streptococci, enterococci, and staphylococci.
Recommended regimens. Based on their review of clinical and microbiological studies, the authors proposed 5 oral or combined oral-IM treatment regimens that could be used in low-resource settings:
- oral clindamycin (600 mg every 6 hours)
- plus IM gentamicin (4.5 g every 24 hours)
- oral amoxicillin-clavulanic acid (875 mg every 12 hours)
- IM cefotetan (2 g every 8 hours)
- IM meropenem or imipenem-cilastatin (500 mg every 8 hours)
- oral amoxicillin (500 mg every 8 hours) plus oral metronidazole (500 mg every 8 hours).
Typical endometritis treamentEndometritis is the single most common complication following cesarean delivery. The frequency of its occurrence depends on several factors, including: the socioeconomic characteristics of the patient population, length of labor, length of ruptured membranes, number of internal vaginal examinations, presence of preexisting lower genital tract infection, type of anesthesia, surgical technique, and use of prophylactic antibiotics. Endometritis is much less common after vaginal delivery but still may occur in 3% to 5% of patients.10
Endometritis is clearly a polymicrobial infection that includes multiple aerobic and anaerobic organisms. Accordingly, antibiotic therapy must target all the major groups of pathogens. The usual standard of care for treatment of early-onset endometritis is IV antibiotics, and patients typically are treated until they have been afebrile and asymptomatic for a minimum of 24 hours. Several different IV regimens provide acceptable treatment10:
- clindamycin plus gentamicin
- metronidazole plus ampicillin plus gentamicin
- extended-spectrum cephalosporins, such as cefepime, cefotetan, and cefoxitin
- extended-spectrum penicillins, such as ampicillin-sulbactam, piperacillin- tazobactam, and ticarcillin-clavulanic acid
- carbapenems, such as imipenem-cilastatin and meropenem.
What this evidence means for practiceClearly, IV antibiotics, even generic drugs, are more expensive than oral agents. They also are more difficult to administer than oral or IM drugs. The systematic review by Meaney-Delman and co-workers is therefore a very important contribution to the literature and should reassure clinicians practicing in low-resource settings that oral and oral-IM regimens can provide safe and effective treatment for endometritis. Until more rigorous comparative trials are conducted, however, we agree with the authors' caveat that, for now, such treatment should be limited to individuals whose infection occurred after vaginal delivery or who have evidence of only mild postcesarean endometritis.
Treatment options for chlamydia infection: How does azithromycin compare with doxycycline?Geisler WM, Uniyal A, Lee JY, et al. Azithromycin versus doxycycline for urogenital Chlamydia trachomatis infection. N Engl J Med. 2015;373(26):2512-2521.
The Centers for Disease Control and Prevention recommendations for treatment of chlamydia genital tract infection are either oral doxycycline, 100 mg twice daily for 7 days, or azithromycin, 1,000 mg in a single dose.11 Recent reports have raised questions about the relative effectiveness of single-dose azithromycin compared with the multiple-day doxycycline regimen. Accordingly, Geisler and colleagues conducted an interesting randomized controlled trial to determine if azithromycin is noninferior to doxycycline.
Details of the studyThe study took place in a unique institutional setting--the Los Angeles County youth correctional facilities. Participants were young men and women, aged 12 to 21 years, who tested positive for chlamydia infection by a nucleic acid amplification test on entry to the correctional facility. Participants then were randomly assigned to receive either doxycycline or azithromycin in the doses described above. The primary outcome was the percent of individuals who still tested positive for chlamydia 28 days after treatment.
Of note, all patients took their medication under direct observation of corrections officers and, with rare exceptions, did not engage in sexual activity during the period of observation. Because this was a noninferiority trial, Geisler and colleagues analyzed the outcomes only of the individuals who actually took their medication in accordance with the assigned protocol. A priori, the authors established a 95% CI of <5% difference in effectiveness as indicative of noninferiority.
Overall, 155 patients in each treatment group completed the trial according to the assigned protocol. No treatment failures occurred in the doxycycline group (0%; 95% CI, 0.0-2.4). Five treatment failures occurred in the azithromycin group (3.2%; 95% CI, 0.4-7.4), in 1 female and 4 male participants. Because the 95% CI for the difference in treatment outcome exceeded 5%, the authors were unable to conclude that azithromycin was noninferior to doxycycline.
Consider real-world treatment adherence in these resultsFor several reasons, we do not conclude from this article that ObGyns should now stop using azithromycin to treat patients with chlamydia infection. First, the actual per protocol sample size was still relatively small. If there had been just 2 fewer failures in the azithromycin group, the 95% CI for the difference in outcomes would have been less than 5%, and the authors would have concluded that the 2 drug regimens were noninferior. Second, 4 of the 5 treatment failures in the azithromycin group were in male rather than female participants. Third, the unique study design resulted in almost perfect adherence with the 7-day doxycycline treatment regimen. Such adherence is very unlikely in other practice settings, and patients who do not complete their treatment regimen are significantly more likely to fail therapy. Finally, azithromycin is definitely preferred in pregnancy because we try to avoid maternal/fetal exposure to drugs such as tetracycline and doxycycline.
What this evidence means for practiceIn this study, both doxycycline and azithromycin were highly effective (100% and 97%, respectively) for treating chlamydia genital tract infection, and they are comparable in cost. In our opinion, the improved adherence that is possible with single-dose azithromycin, the greater safety in pregnancy, and the excellent tolerability of this drug outweigh its slightly deceased rate of microbiologic cure.
Vaccine effective against hepatitis E for 4+ yearsZhang J, Zhang XF, Huang SJ, et al. Long-term efficacy of a hepatitis E vaccine. N Engl J Med. 2015;372(10):914-922.
This study conducted by Zhang and colleagues in Dongtai, China, is an extended follow-up study of the hepatitis E virus (HEV) vaccine (Hecolin; Xiamen Innovax Biotech). A recombinant vaccine directed against HEV genotype 1, Hecolin has been used in China since 2012.
In the initial efficacy study, healthy adults aged 16 to 65 years were randomly assigned to receive either the hepatitis E vaccine (vaccine group, 56,302 participants) or the hepatitis B vaccine (control group, 56,302 participants). Vaccine administration occurred at 0, 1, and 6 months, and participants were followed for a total of 19 months.
Details of the studyThe follow-up study was designed to assess the efficacy, immunogenicity, and safety of the HEV vaccine up to 4.5 years postvaccination. All health care centers (205 village and private clinics) in the study area were enrolled in the program. The treatment assignments of all patients remained double blinded. Unblinding occurred only after the data on safety, efficacy, and immunogenicity had been locked.
A diagnosis of HEV infection was made if at least 2 of the following markers were present: a positive test for immunoglobulin M antibodies against HEV, a positive test for HEV RNA, or a serum concentration of immunoglobulin G (IgG) antibodies against HEV that was at least 4 times higher than previously measured at any time during the same illness. Vaccine immunogenicity was assessed by testing serum samples for IgG antibodies against HEV at regular intervals after the vaccination was given.
Over the 4.5-year study period, 7 cases of hepatitis E occurred in the vaccine group, and 53 in the control group. Vaccine efficacy was 86.8% (P<.001) in the modified intention-to-treat analysis. Among patients who received 3 doses of HEV vaccine and who were seronegative at the start of the study, 87% maintained antibodies against HEV for 4.5 years. Within the control group, HEV titers developed in 9% of participants. The vaccine and control groups had similar rates of adverse events.
The authors concluded that the HEV vaccine induced antibodies against hepatitis E that lasted up to 4.5 years. Additionally, 2 doses of vaccine induced slightly lower levels of antibody than those produced by 3 doses of the vaccine. Finally, all participants in the vaccine group who developed HEV had antibodies with high or moderate avidity, indicating an anamnestic response from previous immunity. Most participants in the control group who developed HEV, however, had antibodies with low avidity, indicating no previous immunity.
The burden of HEVHepatitis E is a serious infection and is the most common waterborne illness in the world. It occurs mainly in developing countries with limited resources. HEV infection is caused by genotypes 1, 2, 3, or 4, although all 4 genotypes belong to the same serotype. Genotypes 1 and 2 are typically waterborne, and genotypes 3 and 4 are typically transmitted from animals and humans. In general, the case fatality rate associated with HEV infection is 1% to 3%.12 In pregnancy, this rate increases to 5% to 25%.13,14 In Bangladesh, for example, hepatitis E is responsible for more than 1,000 deaths per year among pregnant women.15
Clinical presentation of HEV infection is a spectrum, with most symptomatic patients presenting with acute, self-limited hepatitis. Severe cases may be associated with pancreatitis, arthritis, aplastic anemia, and neurologic complications, such as seizures. Populations at risk for more severe cases include pregnant women, elderly men, and patients with pre‑ existing, chronic liver disease.
What this evidence means for practiceStandard sanitary precautions, such as clean drinking water, traditionally have been considered the mainstay of hepatitis E prevention. However, as the study authors indicate, recent severe outbreaks of HEV infection in Sudan and Uganda have occurred despite these measures. Thus, an effective vaccine that produces long-standing immunity has great potential for reducing morbidity and mortality in these countries. The present vaccine appears to be highly effective and safe. The principal unanswered question is the duration of immunity.
My patients are asking, "What is the best insect repellent to try to avoid Zika virus?"
With summer upon us we have received questions from colleagues about the best over-the-counter insect repellents to advise their pregnant patients to use.
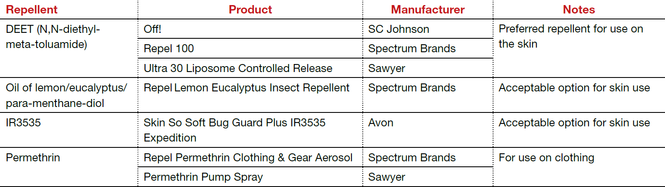
The preferred insect repellent for skin coverage is DEET (N,N-diethyl-meta-toluamide) (TABLE). Oil of lemon/eucalyptus/para-menthane-diol and IR3535 are also acceptable repellents to use on the skin that are safe for use in pregnancy. In addition, instruct patients to spray permethrin on their clothing or to buy clothing (boots, pants, socks) that has been pretreated with permethrin.1,2
Anushka Chelliah, MD, and Patrick Duff, MD.
Abbreviation: OTC, over the counter.
Coming soon to OBG Management
Drs. Chelliah and Duff follow-up on their March 2016 examination of Zika virus infection with:
- Latest information on Zika virus-associated birth defects
- Ultrasonographic and radiologic evidence of abnormalities in the fetus and newborn exposed to Zika virus infection
- Link between Zika virus infection and serious neurologic complications in adults
- New recommendations for preventing sexual transmission of Zika virus infection
Dr. Chelliah is a Maternal Fetal Medicine-Fellow in the Division of Maternal Fetal Medicine, Department of Obstetrics and Gynecology, University of Florida College of Medicine, Gainesville.
Dr. Duff is Associate Dean for Student Affairs and Professor of Obstetrics and Gynecology in the Division of Maternal-Fetal Medicine, University of Florida College of Medicine.
The author reports no financial relationships relevant to this article.
References
- Peterson EE, Staples JE, Meaney-Delman D, et al. Interim guidelines for pregnant women during a Zika virus outbreak--United States, 2016. MMWR Morb Mortal Wkly Rep. 2016;65(2):30-33.
- Centers for Disease Control and Prevention. CDC Features: Avoid mosquito bites. http://www.cdc.gov/Features/stopmosquitoes/index.html. Updated March 18, 2016. Accessed May 10, 2016.
Share your thoughts! Send your Letter to the Editor to [email protected]. Please include your name and the city and state in which you practice.
- DeFrances CJ, Cullen KA, Kozak LJ. National Hospital Discharge Survey: 2005 annual summary with detailed diagnosis and procedure data. Vital Health Stat 13. 2007:165:1–209.
- Martin JA, Hamilton BE, Osterman MJK, Curtin SC, Mathews TJ. Births: final data for 2013. Natl Vital Stat Rep. 2015;64(1):1–65.
- Anderson DJ, Podgorny K, Berrios-Torres SI, et al. Strategies to prevent surgical site infections in acute care hospitals: 2014 update. Infect Control Hosp Epidemiol. 2014;35(6):605–627.
- Conroy K, Koenig AF, Yu YH, Courtney A, Lee HJ, Norwitz ER. Infectious morbidity after cesarean delivery: 10 strategies to reduce risk. Rev Obstet Gynecol. 2012;5(2):69–77.
- Scifres CM, Leighton BL, Fogertey PJ, Macones GA, Stamilio DM. Supplemental oxygen for the prevention of postcesarean infectious morbidity: a randomized controlled trial. Am J Obstet Gynecol. 2011;205(3)267.e1–e9.
- Wloch C, Wilson J, Lamagni T, Harrington P, Charlett A, Sheridan E. Risk factors for surgical site infection following cesarean section in England: results from a multicenter cohort study. BJOG. 2012;119(11):1324–1333.
- Olsen MA, Butler AM, Willers DM, Gross GA, Hamilton BH, Fraser VJ. Attributable costs of surgical site infection and endometritis after low transverse cesarean delivery. Infect Control Hosp Epidemiol. 2010;31(3):276–282.
- Darouiche RO, Wall MJ Jr, Itani KM, et al. Chlorhexidine-alcohol versus povidone-iodine for surgical-site antisepsis. N Engl J Med. 2010;362(1):18–26.
- Ngai IM, Van Arsdale A, Govindappagari S, et al. Skin preparation for prevention of surgical site infection after cesarean delivery: a randomized controlled trial. Obstet Gynecol. 2015;126(6):1251–1257.
- Duff P. Maternal and perinatal infection—bacterial. In: Gabbe SG, Niebyl JR, Simpson JL, et al, eds. Obstetrics: normal and problem pregnancies. 6th ed. Philadelphia, PA: Elsevier/Saunders; 2012.
- Workowski KA, Bolan GH; Centers for Disease Control and Prevention. Sexually transmitted diseases treatment guidelines, 2015. MMWR Recomm Rep. 2015;64(RR-03):1−137. Erratum in: MMWR Recomm Rep. 2015;64(33):924.
- Emerson SU, Purcell RH. Hepatitis E virus. Rev Med Virol. 2003;13(3):145–154.
- Khuroo MS, Teli MR, Skidmore S, Sofi MA, Khuroo MI. Incidence and severity of viral hepatitis in pregnancy. Am J Med. 1981;70(2):252–255.
- Khuroo MS, Kamili S. Aetiology, clinical course and outcome of sporadic acute viral hepatitis in pregnancy. J Viral Hepat. 2003;10(1):61–69.
- Labrique AB, Sikder SS, Krain IJ, et al. Hepatitis E, a vaccine-preventable cause of maternal deaths. Emerg Infect Dis. 2012;18(9):1401–1404.

Dr. Jackson is a Maternal-Fetal Medicine Fellow in the Division of Maternal-Fetal Medicine, Department of Obstetrics and Gynecology, University of Florida College of Medicine, Gainesville.

Dr. Duff is Associate Dean for Student Affairs and Professor of Obstetrics and Gynecology in the Division of Maternal-Fetal Medicine, University of Florida College of Medicine.
The authors report no financial relationships relevant to this article.
Dr. Jackson is a Maternal-Fetal Medicine Fellow in the Division of Maternal-Fetal Medicine, Department of Obstetrics and Gynecology, University of Florida College of Medicine, Gainesville.
Dr. Duff is Associate Dean for Student Affairs and Professor of Obstetrics and Gynecology in the Division of Maternal-Fetal Medicine, University of Florida College of Medicine.
The authors report no financial relationships relevant to this article.
Chlorhexidine-alcohol is superior to iodine-alcohol for reducing SSIs after cesarean deliveryTuuli Mg, Liu J, Stout Mj, et al. A randomized trial comparing skin antiseptic agents at cesarean delivery. N Engl J Med. 2016;374(7):647-655.
In the United States, cesarean delivery is the most commonly performed major surgical procedure, with 32.7% of births--or 1.3 million--occurring in this fashion in 2013.1,2 In general, for all surgical procedures, the SSI rate is 2% to 5%, with the rate rising to 5% to 12% for cesarean delivery, especially in obese patients.3-6 Not only do SSIs increase morbidity for the patient but they also contribute to high medical costs, with an estimated additional expense of $3,529 per cesarean-associated infection.7
Skin pathogens are a major source of SSIs. Choosing the proper antiseptic has the potential to decrease infection risk. While current guidelines recommend use of an antiseptic containing alcohol, it is unclear which disinfectant is the most effective agent to combine with the alcohol.3
Most trials evaluating preoperative antiseptic skin preparation have studied patients undergoing general surgery procedures. A well-designed trial by Darouiche and coauthors demonstrated that chlorhexidine was superior to iodine when used as an antiseptic for skin preparation.8 Interestingly, however, this trial, like most others, compared chlorhexidine-alcohol to iodine without alcohol. It is therefore unclear whether the chlorhexidine or the alcohol is responsible for the enhanced antiseptic effect.
Details of the studyIn the single-center randomized trial conducted by Tuuli and colleagues, patients were assigned to preoperative skin antisepsis with either chlorhexidine-alcohol (2% chlorhexidine gluconate with 70% isopropyl alcohol) or iodine-alcohol (8.3% povidone-iodine with 72.5% isopropyl alcohol). Antiseptic was applied according to the manufacturer's instructions, with a standard wait time of 3 minutes between application and skin incision. However, wait time was eliminated for patients undergoing emergency cesarean delivery. Additionally, patients received standard, weight-based preoperative antibiotic prophylaxis (agent not specified).
The authors estimated the necessary sample size for the trial by assuming an 8% baseline SSI rate and an anticipated 50% reduction of infection in the chlorhexidine-alcohol group. Exclusion criteria included a known allergy to chlorhexidine, alcohol, iodine, or shellfish or a preexisting skin infection adjacent to the operative site.
In addition to assessing the primary outcome of SSI with the 2 preparations, the authors conducted 4 prespecified subgroup analyses. These subgroups were based on: type of cesarean delivery (scheduled vs unscheduled), body weight (obese vs nonobese), type of skin closure (subcuticular suture vs staples), and presence or absence of chronic medical conditions (diabetes, hypertension, renal disease). Additionally, a post hoc analysis was performed, comparing women with diabetes (gestational and pregestational) to those without diabetes.
A total of 1,636 pregnant women were screened for eligibility. Of these, 489 women were excluded because they did not meet inclusion criteria or declined to participate or because informed consent could not be obtained. Baseline characteristics were similar across both groups.
Patients were followed for 30 days after surgery. A total of 1,082 women (94.3% of sample size) completed the follow-up. Among these patients, the rate of SSI was significantly lower in the chlorhexidine-alcohol group (4.3%) compared with the iodine-alcohol group (7.7%, P = .02).
In the subgroup analyses, the frequency of SSI remained lower for the chlorhexidine-alcohol group than for the iodine-alcohol group. These reductions were not affected by whether the cesarean was scheduled or unscheduled, the presence or absence of obesity, the type of skin closure, the presence of chronic disease, or diabetes status.
Several secondary outcomes also were examined in this study. There were no significant differences between the 2 antiseptic groups with respect to rates of endometritis, hospital readmission for infection-related complications, length of hospital stay, use of other health care services (such as emergency department visits, additional wound surgery, and home health services), and rates of other wound complications (seroma, hematoma, and cellulitis). Patients in the chlorhexidine-alcohol group were significantly less likely than those in the iodine-alcohol group to have physician office visits for concerns about possible wound complications (P = .009).
The authors concluded that the use of chlorhexidine-alcohol was superior to iodine-alcohol in preventing SSI after cesarean delivery.
Study strengths and limitations The authors acknowledged that their study had some minor limitations. First, the trial was conducted at a single site, which may limit the generalizability of the findings. However, the study population was racially and economically diverse. Second, the lack of blinding among providers and participants may have introduced bias, although, as the authors explain, we would expect this bias to be largely nondirectional.
A major strength of this study is its randomized design. Another strength is that the authors included emergency cesarean deliveries in their analysis. Emergency procedures represent a substantial proportion of cesarean deliveries, and they place the patient at increased risk for SSIs because of limited time available to prepare the skin before surgery begins. Thus, it is of great interest that chlorhexidine-alcohol was so effective even in the highest-risk patients.
Several properties may make chlorhexidine superior to iodine as an antiseptic: high binding affinity for the skin, high antibacterial activity against both gram-positive and gram-negative bacteria, and longer residual effects than iodine. Additionally, iodine is inactivated by organic matter, such as body fluids, whereas chlorhexidine is not.
A recent study by Ngai and colleagues9 compared chlorhexidine-alcohol with iodine-alcohol for skin preparation before cesarean delivery. These authors found no difference in SSI when comparing the 2 solutions used separately or sequentially, except in morbidly obese women. In these women, sequential application of both solutions reduced the infection rate. However, this study specifically excluded emergency cesarean deliveries, making the generalizability of the results questionable.9
What this evidence means for practiceThis large, randomized study found chlorhexidine-alcohol to be superior to iodine-alchol in reducing the risk of SSIs after cesarean delivery. These results confirm those of previous studies from both the obstetric and general surgery literature. Although chlorhexidine-alcohol is more expensive than iodine-alcohol, we strongly recommend its use in patients having cesarean delivery.
Five effective oral and intramuscular antibiotic regimens for treating postpartum endometritisMeaney-Delman D, Bartlett LA, Gravett MG, Jamieson DJ. Oral and intramuscular treatment options for early postpartum endometritis in low-resource settings: a systematic review. Obstet Gynecol. 2015;125(4):789-800.
The authors of this excellent systematic review on antibiotic treatments for early postpartum endometritis conducted their study in 3 phases. Initially, Meaney-Delman and colleagues searched the literature for reports of prospective studies that evaluated the use of oral and intramuscular (IM) antibiotics for treatment of patients who developed endometritis following either cesarean or vaginal delivery. When they discovered that these initial trials were few in number and of relatively poor quality, they reviewed more rigorous trials of intravenous (IV) antibiotics. Finally, they evaluated clinical trials that specifically identified microorganisms isolated from the uterus in patients with endometritis and used this information to help inform their recommendations for treatment options.
Details of the studyIn evaluating the trials of oral and IM antibiotics, the authors set as a standard for effectiveness a cure rate of 85%, a figure comparable to that generally achieved with IV antibiotics. They identified 2 oral antibiotic regimens that met this standard of effectiveness: amoxicillin-clavulanate (100% cure in 36 patients; 95% confidence interval [CI], 90-100) and ampicillin plus metronidazole (97% cure in 37 patients; 95% CI, 86-100).
Two studies demonstrated acceptable levels of cure with single-agent IM antibiotics: aztreonam (100% cure in 16 patients; 95% CI, 81-100) and imipenem (91% cure in 23 patients; 95% CI, 73-98). One additional trial demonstrated an acceptable clinical response rate when IV clindamycin was combined with IM gentamicin (100% cure in 54 patients; 95% CI, 94-100). By contrast, the authors noted, many different IV regimens--either as a single agent or as a drug combination--provided cure rates that equaled or exceeded 85%.
In the study's final phase, the authors provided an excellent overview of the polymicrobial nature of puerperal endometritis. As documented in multiple prior reports, the most common pathogens are the gram-negative anaerobic bacilli, such as Bacteroides and Prevotella species; the anaerobic gram-positive organisms, including Peptococcus and Peptostreptococcus species; aerobic gram-negative bacilli, such as Escherichia coli, Klebsiella pneumoniae, and Proteus species; and aerobic gram-positive cocci, such as group B streptococci, enterococci, and staphylococci.
Recommended regimens. Based on their review of clinical and microbiological studies, the authors proposed 5 oral or combined oral-IM treatment regimens that could be used in low-resource settings:
- oral clindamycin (600 mg every 6 hours)
- plus IM gentamicin (4.5 g every 24 hours)
- oral amoxicillin-clavulanic acid (875 mg every 12 hours)
- IM cefotetan (2 g every 8 hours)
- IM meropenem or imipenem-cilastatin (500 mg every 8 hours)
- oral amoxicillin (500 mg every 8 hours) plus oral metronidazole (500 mg every 8 hours).
Typical endometritis treamentEndometritis is the single most common complication following cesarean delivery. The frequency of its occurrence depends on several factors, including: the socioeconomic characteristics of the patient population, length of labor, length of ruptured membranes, number of internal vaginal examinations, presence of preexisting lower genital tract infection, type of anesthesia, surgical technique, and use of prophylactic antibiotics. Endometritis is much less common after vaginal delivery but still may occur in 3% to 5% of patients.10
Endometritis is clearly a polymicrobial infection that includes multiple aerobic and anaerobic organisms. Accordingly, antibiotic therapy must target all the major groups of pathogens. The usual standard of care for treatment of early-onset endometritis is IV antibiotics, and patients typically are treated until they have been afebrile and asymptomatic for a minimum of 24 hours. Several different IV regimens provide acceptable treatment10:
- clindamycin plus gentamicin
- metronidazole plus ampicillin plus gentamicin
- extended-spectrum cephalosporins, such as cefepime, cefotetan, and cefoxitin
- extended-spectrum penicillins, such as ampicillin-sulbactam, piperacillin- tazobactam, and ticarcillin-clavulanic acid
- carbapenems, such as imipenem-cilastatin and meropenem.
What this evidence means for practiceClearly, IV antibiotics, even generic drugs, are more expensive than oral agents. They also are more difficult to administer than oral or IM drugs. The systematic review by Meaney-Delman and co-workers is therefore a very important contribution to the literature and should reassure clinicians practicing in low-resource settings that oral and oral-IM regimens can provide safe and effective treatment for endometritis. Until more rigorous comparative trials are conducted, however, we agree with the authors' caveat that, for now, such treatment should be limited to individuals whose infection occurred after vaginal delivery or who have evidence of only mild postcesarean endometritis.
Treatment options for chlamydia infection: How does azithromycin compare with doxycycline?Geisler WM, Uniyal A, Lee JY, et al. Azithromycin versus doxycycline for urogenital Chlamydia trachomatis infection. N Engl J Med. 2015;373(26):2512-2521.
The Centers for Disease Control and Prevention recommendations for treatment of chlamydia genital tract infection are either oral doxycycline, 100 mg twice daily for 7 days, or azithromycin, 1,000 mg in a single dose.11 Recent reports have raised questions about the relative effectiveness of single-dose azithromycin compared with the multiple-day doxycycline regimen. Accordingly, Geisler and colleagues conducted an interesting randomized controlled trial to determine if azithromycin is noninferior to doxycycline.
Details of the studyThe study took place in a unique institutional setting--the Los Angeles County youth correctional facilities. Participants were young men and women, aged 12 to 21 years, who tested positive for chlamydia infection by a nucleic acid amplification test on entry to the correctional facility. Participants then were randomly assigned to receive either doxycycline or azithromycin in the doses described above. The primary outcome was the percent of individuals who still tested positive for chlamydia 28 days after treatment.
Of note, all patients took their medication under direct observation of corrections officers and, with rare exceptions, did not engage in sexual activity during the period of observation. Because this was a noninferiority trial, Geisler and colleagues analyzed the outcomes only of the individuals who actually took their medication in accordance with the assigned protocol. A priori, the authors established a 95% CI of <5% difference in effectiveness as indicative of noninferiority.
Overall, 155 patients in each treatment group completed the trial according to the assigned protocol. No treatment failures occurred in the doxycycline group (0%; 95% CI, 0.0-2.4). Five treatment failures occurred in the azithromycin group (3.2%; 95% CI, 0.4-7.4), in 1 female and 4 male participants. Because the 95% CI for the difference in treatment outcome exceeded 5%, the authors were unable to conclude that azithromycin was noninferior to doxycycline.
Consider real-world treatment adherence in these resultsFor several reasons, we do not conclude from this article that ObGyns should now stop using azithromycin to treat patients with chlamydia infection. First, the actual per protocol sample size was still relatively small. If there had been just 2 fewer failures in the azithromycin group, the 95% CI for the difference in outcomes would have been less than 5%, and the authors would have concluded that the 2 drug regimens were noninferior. Second, 4 of the 5 treatment failures in the azithromycin group were in male rather than female participants. Third, the unique study design resulted in almost perfect adherence with the 7-day doxycycline treatment regimen. Such adherence is very unlikely in other practice settings, and patients who do not complete their treatment regimen are significantly more likely to fail therapy. Finally, azithromycin is definitely preferred in pregnancy because we try to avoid maternal/fetal exposure to drugs such as tetracycline and doxycycline.
What this evidence means for practiceIn this study, both doxycycline and azithromycin were highly effective (100% and 97%, respectively) for treating chlamydia genital tract infection, and they are comparable in cost. In our opinion, the improved adherence that is possible with single-dose azithromycin, the greater safety in pregnancy, and the excellent tolerability of this drug outweigh its slightly deceased rate of microbiologic cure.
Vaccine effective against hepatitis E for 4+ yearsZhang J, Zhang XF, Huang SJ, et al. Long-term efficacy of a hepatitis E vaccine. N Engl J Med. 2015;372(10):914-922.
This study conducted by Zhang and colleagues in Dongtai, China, is an extended follow-up study of the hepatitis E virus (HEV) vaccine (Hecolin; Xiamen Innovax Biotech). A recombinant vaccine directed against HEV genotype 1, Hecolin has been used in China since 2012.
In the initial efficacy study, healthy adults aged 16 to 65 years were randomly assigned to receive either the hepatitis E vaccine (vaccine group, 56,302 participants) or the hepatitis B vaccine (control group, 56,302 participants). Vaccine administration occurred at 0, 1, and 6 months, and participants were followed for a total of 19 months.
Details of the studyThe follow-up study was designed to assess the efficacy, immunogenicity, and safety of the HEV vaccine up to 4.5 years postvaccination. All health care centers (205 village and private clinics) in the study area were enrolled in the program. The treatment assignments of all patients remained double blinded. Unblinding occurred only after the data on safety, efficacy, and immunogenicity had been locked.
A diagnosis of HEV infection was made if at least 2 of the following markers were present: a positive test for immunoglobulin M antibodies against HEV, a positive test for HEV RNA, or a serum concentration of immunoglobulin G (IgG) antibodies against HEV that was at least 4 times higher than previously measured at any time during the same illness. Vaccine immunogenicity was assessed by testing serum samples for IgG antibodies against HEV at regular intervals after the vaccination was given.
Over the 4.5-year study period, 7 cases of hepatitis E occurred in the vaccine group, and 53 in the control group. Vaccine efficacy was 86.8% (P<.001) in the modified intention-to-treat analysis. Among patients who received 3 doses of HEV vaccine and who were seronegative at the start of the study, 87% maintained antibodies against HEV for 4.5 years. Within the control group, HEV titers developed in 9% of participants. The vaccine and control groups had similar rates of adverse events.
The authors concluded that the HEV vaccine induced antibodies against hepatitis E that lasted up to 4.5 years. Additionally, 2 doses of vaccine induced slightly lower levels of antibody than those produced by 3 doses of the vaccine. Finally, all participants in the vaccine group who developed HEV had antibodies with high or moderate avidity, indicating an anamnestic response from previous immunity. Most participants in the control group who developed HEV, however, had antibodies with low avidity, indicating no previous immunity.
The burden of HEVHepatitis E is a serious infection and is the most common waterborne illness in the world. It occurs mainly in developing countries with limited resources. HEV infection is caused by genotypes 1, 2, 3, or 4, although all 4 genotypes belong to the same serotype. Genotypes 1 and 2 are typically waterborne, and genotypes 3 and 4 are typically transmitted from animals and humans. In general, the case fatality rate associated with HEV infection is 1% to 3%.12 In pregnancy, this rate increases to 5% to 25%.13,14 In Bangladesh, for example, hepatitis E is responsible for more than 1,000 deaths per year among pregnant women.15
Clinical presentation of HEV infection is a spectrum, with most symptomatic patients presenting with acute, self-limited hepatitis. Severe cases may be associated with pancreatitis, arthritis, aplastic anemia, and neurologic complications, such as seizures. Populations at risk for more severe cases include pregnant women, elderly men, and patients with pre‑ existing, chronic liver disease.
What this evidence means for practiceStandard sanitary precautions, such as clean drinking water, traditionally have been considered the mainstay of hepatitis E prevention. However, as the study authors indicate, recent severe outbreaks of HEV infection in Sudan and Uganda have occurred despite these measures. Thus, an effective vaccine that produces long-standing immunity has great potential for reducing morbidity and mortality in these countries. The present vaccine appears to be highly effective and safe. The principal unanswered question is the duration of immunity.
My patients are asking, "What is the best insect repellent to try to avoid Zika virus?"
With summer upon us we have received questions from colleagues about the best over-the-counter insect repellents to advise their pregnant patients to use.
The preferred insect repellent for skin coverage is DEET (N,N-diethyl-meta-toluamide) (TABLE). Oil of lemon/eucalyptus/para-menthane-diol and IR3535 are also acceptable repellents to use on the skin that are safe for use in pregnancy. In addition, instruct patients to spray permethrin on their clothing or to buy clothing (boots, pants, socks) that has been pretreated with permethrin.1,2
Anushka Chelliah, MD, and Patrick Duff, MD.
Abbreviation: OTC, over the counter.
Coming soon to OBG Management
Drs. Chelliah and Duff follow-up on their March 2016 examination of Zika virus infection with:
- Latest information on Zika virus-associated birth defects
- Ultrasonographic and radiologic evidence of abnormalities in the fetus and newborn exposed to Zika virus infection
- Link between Zika virus infection and serious neurologic complications in adults
- New recommendations for preventing sexual transmission of Zika virus infection
Dr. Chelliah is a Maternal Fetal Medicine-Fellow in the Division of Maternal Fetal Medicine, Department of Obstetrics and Gynecology, University of Florida College of Medicine, Gainesville.
Dr. Duff is Associate Dean for Student Affairs and Professor of Obstetrics and Gynecology in the Division of Maternal-Fetal Medicine, University of Florida College of Medicine.
The author reports no financial relationships relevant to this article.
References
- Peterson EE, Staples JE, Meaney-Delman D, et al. Interim guidelines for pregnant women during a Zika virus outbreak--United States, 2016. MMWR Morb Mortal Wkly Rep. 2016;65(2):30-33.
- Centers for Disease Control and Prevention. CDC Features: Avoid mosquito bites. http://www.cdc.gov/Features/stopmosquitoes/index.html. Updated March 18, 2016. Accessed May 10, 2016.
Share your thoughts! Send your Letter to the Editor to [email protected]. Please include your name and the city and state in which you practice.
- DeFrances CJ, Cullen KA, Kozak LJ. National Hospital Discharge Survey: 2005 annual summary with detailed diagnosis and procedure data. Vital Health Stat 13. 2007:165:1–209.
- Martin JA, Hamilton BE, Osterman MJK, Curtin SC, Mathews TJ. Births: final data for 2013. Natl Vital Stat Rep. 2015;64(1):1–65.
- Anderson DJ, Podgorny K, Berrios-Torres SI, et al. Strategies to prevent surgical site infections in acute care hospitals: 2014 update. Infect Control Hosp Epidemiol. 2014;35(6):605–627.
- Conroy K, Koenig AF, Yu YH, Courtney A, Lee HJ, Norwitz ER. Infectious morbidity after cesarean delivery: 10 strategies to reduce risk. Rev Obstet Gynecol. 2012;5(2):69–77.
- Scifres CM, Leighton BL, Fogertey PJ, Macones GA, Stamilio DM. Supplemental oxygen for the prevention of postcesarean infectious morbidity: a randomized controlled trial. Am J Obstet Gynecol. 2011;205(3)267.e1–e9.
- Wloch C, Wilson J, Lamagni T, Harrington P, Charlett A, Sheridan E. Risk factors for surgical site infection following cesarean section in England: results from a multicenter cohort study. BJOG. 2012;119(11):1324–1333.
- Olsen MA, Butler AM, Willers DM, Gross GA, Hamilton BH, Fraser VJ. Attributable costs of surgical site infection and endometritis after low transverse cesarean delivery. Infect Control Hosp Epidemiol. 2010;31(3):276–282.
- Darouiche RO, Wall MJ Jr, Itani KM, et al. Chlorhexidine-alcohol versus povidone-iodine for surgical-site antisepsis. N Engl J Med. 2010;362(1):18–26.
- Ngai IM, Van Arsdale A, Govindappagari S, et al. Skin preparation for prevention of surgical site infection after cesarean delivery: a randomized controlled trial. Obstet Gynecol. 2015;126(6):1251–1257.
- Duff P. Maternal and perinatal infection—bacterial. In: Gabbe SG, Niebyl JR, Simpson JL, et al, eds. Obstetrics: normal and problem pregnancies. 6th ed. Philadelphia, PA: Elsevier/Saunders; 2012.
- Workowski KA, Bolan GH; Centers for Disease Control and Prevention. Sexually transmitted diseases treatment guidelines, 2015. MMWR Recomm Rep. 2015;64(RR-03):1−137. Erratum in: MMWR Recomm Rep. 2015;64(33):924.
- Emerson SU, Purcell RH. Hepatitis E virus. Rev Med Virol. 2003;13(3):145–154.
- Khuroo MS, Teli MR, Skidmore S, Sofi MA, Khuroo MI. Incidence and severity of viral hepatitis in pregnancy. Am J Med. 1981;70(2):252–255.
- Khuroo MS, Kamili S. Aetiology, clinical course and outcome of sporadic acute viral hepatitis in pregnancy. J Viral Hepat. 2003;10(1):61–69.
- Labrique AB, Sikder SS, Krain IJ, et al. Hepatitis E, a vaccine-preventable cause of maternal deaths. Emerg Infect Dis. 2012;18(9):1401–1404.
In this article
• Azithromycin vs doxycycline for chlamydia
• Insect repellents to prevent Zika virus

Déjà vu: An FDA warning about oral ketoconazole ... again
The Food and Drug Administration issued a health warning on May 16th, 2016, regarding the use of oral ketoconazole for the treatment of skin and nail dermatophyte and candidal infections – wait what? Why is this even an active discussion? Let’s take a step back: In July 2013, the FDA strengthened its warnings and withdrew FDA indications for ketoconazole, specifically stating that its use for Candida and dermatophyte infections is no longer indicated and that it should only be considered in fungal infections, such as blastomycosis, coccidioidomycosis, histoplasmosis, chromomycosis, and paracoccidioidomycosis, when other antifungals are not available.
The reality is that for, most clinicians, it has been well accepted for years that this drug has significant toxicities, probably the most among the azole class, especially in terms of liver issues and drug interactions being one of the most potent inhibitors of the hepatic CYP (cytochrome P450) system.
Endocrinologists have been preaching that the drug can impair adrenal function, causing insufficiency. So this warning begs the question … who is still actively prescribing this medication? Sadly, this advisory was in response to data showing that this drug was still being prescribed for skin and nail fungal infections in 2015, as well as one documented death associated with its use for this indication. Seriously? Terbinafine (250 mg daily for 6 weeks for fingernails, 12 weeks for toenails) and fluconazole (300 mg weekly for 6 months for fingernails and 9 months for toenails) are both safe and cheap means to treat onychomycosis. If you can get it covered, we even have effective topical treatments for onychomycosis, not to mention we have ALWAYS had topical options for superficial cutaneous mycoses. This is a no brainer. Just say NO to oral ketoconazole.
Dr. Adam Friedman is the residency program director and director of translational research in the department of dermatology, George Washington University, Washington. He is on the editorial advisory board of Dermatology News. He has no related disclosures.
Tissue extraction: Can the pendulum change direction?
On April 17, 2014, the US Food and Drug Administration (FDA) released a safety communication that discouraged the use of laparoscopic power morcellation during hysterectomy or myomectomy for the treatment of women with uterine fibroids. This recommendation was based mainly on the premise that fibroids may contain an underlying malignancy (in 1 in 350 women) that laparoscopic power morcellation could spread, thereby potentially worsening a cancer prognosis.1 Whether we liked it or not, minimally invasive gynecologic surgery as we knew it had changed forever on that fateful day.
During the last 2 years, the implications of that initial safety communication, along with its update in November of 2014,2 have been far reaching. From a health care industry perspective, the largest manufacturer of power morcellators, Johnson & Johnson, completely pulled its device out of the market within months of the initial FDA safety communication.3 Although several other companies remained in the market, health insurers such as Highmark and Aetna took the stance of not paying for the routine use of a power morcellator.4,5 Soon government officials became involved in the campaign against power morcellators and trial lawyers made this surgical device the latest “hot target.”6,7
The power morcellator’s absence impactFor clinicians, the narrative painted had moved the pendulum so far against power morcellation that it did not come as a surprise that practice patterns were significantly impacted. Harris and colleagues recently measured that impact by evaluating practice patterns and postoperative complications before and after the FDA safety communication on power morcellation. In their retrospective cohort study of patients within the Michigan Surgical Quality Collaborative, utilization of minimally invasive hysterectomy decreased and major surgical, nontransfusion complications and 30-day hospital readmission rates increased after release of the safety communication.8
Further support of this change in practice patterns was demonstrated in a recent survey conducted by the AAGL and American College of Obstetricians and Gynecologists Collaborative Ambulatory Research Network (ACOG CARN). In this survey study, Lum and colleagues were able to show that power morcellation use decreased among AAGL and ACOG CARN members after the FDA warnings, and rates of laparotomy increased.9
Critical to the discussion, yet apparently overlooked during the formulation of the initial FDA warning, was the potential clinical significance of the downstream impact of converting minimally invasive surgical cases to more invasive laparotomies. A decision-tree analysis published by Siedhoff and colleagues highlighted this point by predicting fewer overall deaths for laparoscopic hysterectomy with morcellation compared with abdominal hysterectomy.10 An ability to weigh the benefits and risks of procedure-related complications that are associated with laparotomy, including death, should have been part of the conversation from the beginning.
There is a silver lining emergingBased on this domino effect, it would seem that the damage done to minimally invasive gynecologic surgery over the past 2 years is irreparable. So is there any silver lining to the current state of affairs in tissue extraction? I would argue yes.
We have updated estimates for incidence of unsuspected leiomyosarcoma. First of all, discussions surrounding the FDA’s estimated 1 in 350 risk of encountering an unsuspected uterine sarcoma during the treatment of fibroids prompted a more critical evaluation of the scientific literature. In fact, Parker and colleagues, in a commentary published in Obstetrics & Gynecology, summarized very nicely the flawed methodology in the FDA’s determination of risk and in turn presented several updated calculations and studies that placed the prevalence somewhere in the range of 2 in 8,720 (0.023%) to 1 in 1,550 (0.064%).11
We are speaking with the FDA. Channels of communication with the FDA have since been developed and societies such as the AAGL were invited by the Center for Devices and Radiological Health (CDRH) at the FDA to serve in their Network of Experts. This Network of Experts is an FDA-vetted group of non−FDA affiliated scientists, clinicians, and engineers who provide the CDRH at the FDA with rapid access to scientific, engineering, and medical expertise when it is needed to supplement existing knowledge and expertise within the CDRH. By developing these lines of communication, the CDRH is able to broaden its exposure to scientific viewpoints without the influence of external, or non−FDA, policy advice or opinions.
We have been innovating our techniques. Clinicians also began to develop innovative techniques for tissue extraction that also included contained, in-bag power morcellation. Vargas and colleagues showed similar perioperative outcomes when comparing open power morcellation with contained power morcellation within an insufflated isolation bag. The mean operative time was prolonged by only 26 minutes with in-bag morcellation.12
Although the initial experience of surgeons involved various containment systems that were off label in their usage and not designed to be paired with a power morcellator, it allowed for the identification of potential limitations, such as the risk of leakage. Cohen and colleagues, in their published experience, demonstrated a 9.2% spillage in 76 patients who underwent contained power morcellation.13
Could a new FDA approval turn the tide?In an interesting turn of events, the FDA, on April 7, 2016, nearly 2 years after their initial warning about power morcellation, gave de novo classification clearance to Advanced Surgical Concepts for its PneumoLiner device.14 This first-of-a-kind medical device was developed for the purpose of completely containing fluid, cells, and tissue fragments during laparoscopic power morcellation, isolating uterine tissue that is not suspected to contain cancer (FIGURES 1 and 2). It is important to note, however, that it has not been shown to reduce the risk of spreading cancer during this procedure. Although a surprise to some, the approval of such a product is in keeping with the FDA’s safety communication update in November 2014 that encouraged the development of containment systems designed specifically for gynecologic surgery.
| FIGURE 1 PneumoLiner tissue containment device | FIGURE 2 PneumoLiner device placement | |

| 
|
Currently, the PneumoLiner is not yet available for purchase until Olympus, who will be the exclusive distributor, finalizes its formal training program rollout for ensuring safe and effective use of the device by gynecologic surgeons. As part of the FDA approval process, a training protocol was validated in a laboratory setting by surgeons with varying levels of experience in order to demonstrate that adherence to this process showed no damage to any of the containment systems used during the study.
As I look forward to the opportunity to learn more about this new containment system and potentially incorporate it into my surgical armamentarium, several questions immediately come to mind.
- Will hospitals, many of which pulled morcellators off their shelves in the wake of the FDA safety communication, be willing to embrace such innovative new containment technology and make it available to their surgeons?
- Will the litigious landscape painted by trial lawyers prevent surgeons from offering this option to their patients?
- Can surgeons undo much of the misinformation being propagated by the media as it relates to tissue extraction and the risk of encountering a malignancy?
I hope the answer to all of these questions is yes.
I do believe the pendulum can change directionAs surgeons it is our duty to evaluate potentially innovative solutions to the surgical challenges we face in clinical practice while maintaining an evidence-based approach. Most importantly, all of this must be balanced by sound clinical judgment that no technology can replace. With these guiding principles in mind, I believe that the pendulum regarding tissue extraction can change direction.
Share your thoughts! Send your Letter to the Editor to [email protected]. Please include your name and the city and state in which you practice.
- US Food and Drug Administration. Laparoscopic uterine power morcellation in hysterectomy and myomectomy: FDA safety communication. April 17, 2014. http://www.fda.gov/MedicalDevices/Safety/AlertsandNotices/ucm393576.htm. Updated November 24, 2014. Accessed May 24, 2016.
- Updated laparoscopic uterine power morcellation in hysterectomy and myomectomy: FDA safety communication. November 24, 2014. http://www.fda.gov/MedicalDevices/Safety/AlertsandNotices/ucm424443.htm. Updated April 7, 2014. Accessed May 24, 2016.
- Kamp J, Levitz J. Johnson & Johnson pulls hysterectomy device from hospitals. The Wall Street Journal. July 30, 2014. http://www.wsj.com/articles/johnson-johnson-to-call-for-voluntary-return-of-morcellators-1406754350. Accessed May 25, 2016.
- Levitz J. Health insurer to stop covering uterine procedure. The Wall Street Journal. August 2, 2014. http://www.wsj.com/articles/health-insurer-to-stop-covering-uterine-procedure-1406999176. Accessed May 25, 2016.
- Kamp J. Aetna to stop covering routine use of power morcellator. The Wall Street Journal. May 5, 2015. http://www.wsj.com/articles/aetna-to-stop-covering-routine-use-of-power-morcellator-1430838666. Accessed May 25, 2016.
- Kamp J. Senators want more companies to pull surgical device from market. The Wall Street Journal. August 19, 2014. http://www.wsj.com/articles/senators-want-more-companies-to-pull-surgical-device-from-market-1408405349. Accessed May 25, 2016.
- Silverman E. Power morcellators are the latest hot target among trial lawyers. The Wall Street Journal. December 2, 2014. http://blogs.wsj.com/pharmalot/2014/12/02/power-morcellators-are-the-latest-hot-target-among-trial-lawyers/. Accessed May 25, 2016.
- Harris JA, Swenson CW, Uppal S, et al. Practice patterns and postoperative complications before and after the US Food and Drug Administration safety communication on power morcellation. Am J Obstet Gynecol. 2016;214(1):98.e1−e13.
- Lum DA, Sokol ER, Berek JS, et al. Impact of the 2014 Food and Drug Administration warnings against power morcellation. J Minim Invasiv Gynecol. 2016;23(4):548−556.
- Siedhoff M, Wheeler SB, Rutstein SE, et al. Laparoscopic hysterectomy with morcellation vs abdominal hysterectomy for presumed fibroid tumors in premenopausal women: a decision analysis. Am J Obstet Gynecol. 2015;212(5):591.e1−e8.
- Parker WH, Kaunitz AM, Pritts EA, et al; Leiomyoma Morcellation Review Group. US Food and Drug Administration’s guidance regarding morcellation of leiomyomas: well-intentioned, but is it harmful for women? Obstet Gynecol. 2016;127(1):18−22.
- Vargas MV, Cohen SL, Fuchs-Weizman N, et al. Open power morcellation versus contained power morcellation within an insufflated isolation bag: comparison of perioperative outcomes. J Minim Invasiv Gynecol. 2015;22(3):433−438.
- Cohen SL, Morris SN, Brown DN, et al. Contained tissue extraction using power morcellation: prospective evaluation of leakage parameters. Am J Obstet Gynecol. 2016;214(2):257.e1−e6.
- US Food and Drug Administration. FDA allows marketing of first-of-kind tissue containment system for use with certain laparoscopic power morcellators in select patients. April 7, 2016. http://www.fda.gov/NewsEvents/Newsroom/PressAnnouncements/ucm494650.htm. Updated April 7, 2016. Accessed May 24, 2016.

Dr. Advincula is the Levine Family Professor, Vice-Chair of Women’s Health, and Chief of Gynecology at Sloane Women’s Hospital, Columbia University Medical Center/New York-Presbyterian Hospital, New York, New York. He serves on the OBG Management Board of Editors.
Dr. Advincula reports being a consultant to Applied Medical, Blue Endo, Cooper Surgical, Intuitive Surgical, and Titan Medical.
On April 17, 2014, the US Food and Drug Administration (FDA) released a safety communication that discouraged the use of laparoscopic power morcellation during hysterectomy or myomectomy for the treatment of women with uterine fibroids. This recommendation was based mainly on the premise that fibroids may contain an underlying malignancy (in 1 in 350 women) that laparoscopic power morcellation could spread, thereby potentially worsening a cancer prognosis.1 Whether we liked it or not, minimally invasive gynecologic surgery as we knew it had changed forever on that fateful day.
During the last 2 years, the implications of that initial safety communication, along with its update in November of 2014,2 have been far reaching. From a health care industry perspective, the largest manufacturer of power morcellators, Johnson & Johnson, completely pulled its device out of the market within months of the initial FDA safety communication.3 Although several other companies remained in the market, health insurers such as Highmark and Aetna took the stance of not paying for the routine use of a power morcellator.4,5 Soon government officials became involved in the campaign against power morcellators and trial lawyers made this surgical device the latest “hot target.”6,7
The power morcellator’s absence impactFor clinicians, the narrative painted had moved the pendulum so far against power morcellation that it did not come as a surprise that practice patterns were significantly impacted. Harris and colleagues recently measured that impact by evaluating practice patterns and postoperative complications before and after the FDA safety communication on power morcellation. In their retrospective cohort study of patients within the Michigan Surgical Quality Collaborative, utilization of minimally invasive hysterectomy decreased and major surgical, nontransfusion complications and 30-day hospital readmission rates increased after release of the safety communication.8
Further support of this change in practice patterns was demonstrated in a recent survey conducted by the AAGL and American College of Obstetricians and Gynecologists Collaborative Ambulatory Research Network (ACOG CARN). In this survey study, Lum and colleagues were able to show that power morcellation use decreased among AAGL and ACOG CARN members after the FDA warnings, and rates of laparotomy increased.9
Critical to the discussion, yet apparently overlooked during the formulation of the initial FDA warning, was the potential clinical significance of the downstream impact of converting minimally invasive surgical cases to more invasive laparotomies. A decision-tree analysis published by Siedhoff and colleagues highlighted this point by predicting fewer overall deaths for laparoscopic hysterectomy with morcellation compared with abdominal hysterectomy.10 An ability to weigh the benefits and risks of procedure-related complications that are associated with laparotomy, including death, should have been part of the conversation from the beginning.
There is a silver lining emergingBased on this domino effect, it would seem that the damage done to minimally invasive gynecologic surgery over the past 2 years is irreparable. So is there any silver lining to the current state of affairs in tissue extraction? I would argue yes.
We have updated estimates for incidence of unsuspected leiomyosarcoma. First of all, discussions surrounding the FDA’s estimated 1 in 350 risk of encountering an unsuspected uterine sarcoma during the treatment of fibroids prompted a more critical evaluation of the scientific literature. In fact, Parker and colleagues, in a commentary published in Obstetrics & Gynecology, summarized very nicely the flawed methodology in the FDA’s determination of risk and in turn presented several updated calculations and studies that placed the prevalence somewhere in the range of 2 in 8,720 (0.023%) to 1 in 1,550 (0.064%).11
We are speaking with the FDA. Channels of communication with the FDA have since been developed and societies such as the AAGL were invited by the Center for Devices and Radiological Health (CDRH) at the FDA to serve in their Network of Experts. This Network of Experts is an FDA-vetted group of non−FDA affiliated scientists, clinicians, and engineers who provide the CDRH at the FDA with rapid access to scientific, engineering, and medical expertise when it is needed to supplement existing knowledge and expertise within the CDRH. By developing these lines of communication, the CDRH is able to broaden its exposure to scientific viewpoints without the influence of external, or non−FDA, policy advice or opinions.
We have been innovating our techniques. Clinicians also began to develop innovative techniques for tissue extraction that also included contained, in-bag power morcellation. Vargas and colleagues showed similar perioperative outcomes when comparing open power morcellation with contained power morcellation within an insufflated isolation bag. The mean operative time was prolonged by only 26 minutes with in-bag morcellation.12
Although the initial experience of surgeons involved various containment systems that were off label in their usage and not designed to be paired with a power morcellator, it allowed for the identification of potential limitations, such as the risk of leakage. Cohen and colleagues, in their published experience, demonstrated a 9.2% spillage in 76 patients who underwent contained power morcellation.13
Could a new FDA approval turn the tide?In an interesting turn of events, the FDA, on April 7, 2016, nearly 2 years after their initial warning about power morcellation, gave de novo classification clearance to Advanced Surgical Concepts for its PneumoLiner device.14 This first-of-a-kind medical device was developed for the purpose of completely containing fluid, cells, and tissue fragments during laparoscopic power morcellation, isolating uterine tissue that is not suspected to contain cancer (FIGURES 1 and 2). It is important to note, however, that it has not been shown to reduce the risk of spreading cancer during this procedure. Although a surprise to some, the approval of such a product is in keeping with the FDA’s safety communication update in November 2014 that encouraged the development of containment systems designed specifically for gynecologic surgery.
| FIGURE 1 PneumoLiner tissue containment device | FIGURE 2 PneumoLiner device placement | |
|
|
|
Currently, the PneumoLiner is not yet available for purchase until Olympus, who will be the exclusive distributor, finalizes its formal training program rollout for ensuring safe and effective use of the device by gynecologic surgeons. As part of the FDA approval process, a training protocol was validated in a laboratory setting by surgeons with varying levels of experience in order to demonstrate that adherence to this process showed no damage to any of the containment systems used during the study.
As I look forward to the opportunity to learn more about this new containment system and potentially incorporate it into my surgical armamentarium, several questions immediately come to mind.
- Will hospitals, many of which pulled morcellators off their shelves in the wake of the FDA safety communication, be willing to embrace such innovative new containment technology and make it available to their surgeons?
- Will the litigious landscape painted by trial lawyers prevent surgeons from offering this option to their patients?
- Can surgeons undo much of the misinformation being propagated by the media as it relates to tissue extraction and the risk of encountering a malignancy?
I hope the answer to all of these questions is yes.
I do believe the pendulum can change directionAs surgeons it is our duty to evaluate potentially innovative solutions to the surgical challenges we face in clinical practice while maintaining an evidence-based approach. Most importantly, all of this must be balanced by sound clinical judgment that no technology can replace. With these guiding principles in mind, I believe that the pendulum regarding tissue extraction can change direction.
Share your thoughts! Send your Letter to the Editor to [email protected]. Please include your name and the city and state in which you practice.
- US Food and Drug Administration. Laparoscopic uterine power morcellation in hysterectomy and myomectomy: FDA safety communication. April 17, 2014. http://www.fda.gov/MedicalDevices/Safety/AlertsandNotices/ucm393576.htm. Updated November 24, 2014. Accessed May 24, 2016.
- Updated laparoscopic uterine power morcellation in hysterectomy and myomectomy: FDA safety communication. November 24, 2014. http://www.fda.gov/MedicalDevices/Safety/AlertsandNotices/ucm424443.htm. Updated April 7, 2014. Accessed May 24, 2016.
- Kamp J, Levitz J. Johnson & Johnson pulls hysterectomy device from hospitals. The Wall Street Journal. July 30, 2014. http://www.wsj.com/articles/johnson-johnson-to-call-for-voluntary-return-of-morcellators-1406754350. Accessed May 25, 2016.
- Levitz J. Health insurer to stop covering uterine procedure. The Wall Street Journal. August 2, 2014. http://www.wsj.com/articles/health-insurer-to-stop-covering-uterine-procedure-1406999176. Accessed May 25, 2016.
- Kamp J. Aetna to stop covering routine use of power morcellator. The Wall Street Journal. May 5, 2015. http://www.wsj.com/articles/aetna-to-stop-covering-routine-use-of-power-morcellator-1430838666. Accessed May 25, 2016.
- Kamp J. Senators want more companies to pull surgical device from market. The Wall Street Journal. August 19, 2014. http://www.wsj.com/articles/senators-want-more-companies-to-pull-surgical-device-from-market-1408405349. Accessed May 25, 2016.
- Silverman E. Power morcellators are the latest hot target among trial lawyers. The Wall Street Journal. December 2, 2014. http://blogs.wsj.com/pharmalot/2014/12/02/power-morcellators-are-the-latest-hot-target-among-trial-lawyers/. Accessed May 25, 2016.
- Harris JA, Swenson CW, Uppal S, et al. Practice patterns and postoperative complications before and after the US Food and Drug Administration safety communication on power morcellation. Am J Obstet Gynecol. 2016;214(1):98.e1−e13.
- Lum DA, Sokol ER, Berek JS, et al. Impact of the 2014 Food and Drug Administration warnings against power morcellation. J Minim Invasiv Gynecol. 2016;23(4):548−556.
- Siedhoff M, Wheeler SB, Rutstein SE, et al. Laparoscopic hysterectomy with morcellation vs abdominal hysterectomy for presumed fibroid tumors in premenopausal women: a decision analysis. Am J Obstet Gynecol. 2015;212(5):591.e1−e8.
- Parker WH, Kaunitz AM, Pritts EA, et al; Leiomyoma Morcellation Review Group. US Food and Drug Administration’s guidance regarding morcellation of leiomyomas: well-intentioned, but is it harmful for women? Obstet Gynecol. 2016;127(1):18−22.
- Vargas MV, Cohen SL, Fuchs-Weizman N, et al. Open power morcellation versus contained power morcellation within an insufflated isolation bag: comparison of perioperative outcomes. J Minim Invasiv Gynecol. 2015;22(3):433−438.
- Cohen SL, Morris SN, Brown DN, et al. Contained tissue extraction using power morcellation: prospective evaluation of leakage parameters. Am J Obstet Gynecol. 2016;214(2):257.e1−e6.
- US Food and Drug Administration. FDA allows marketing of first-of-kind tissue containment system for use with certain laparoscopic power morcellators in select patients. April 7, 2016. http://www.fda.gov/NewsEvents/Newsroom/PressAnnouncements/ucm494650.htm. Updated April 7, 2016. Accessed May 24, 2016.

Improvement needed for U.S. acute care hospitals implementing ASPs
There is more room for improving U.S. acute care hospitals’ antibiotic stewardship programs (ASPs) and implementing the seven core elements, according to findings from the 2014 National Healthcare Safety Network (NHSN) Annual Hospital Survey.
In univariate analyses, Dr. Lori A. Pollack, of the Division of Cancer Prevention and Control at the Centers for Disease Control and Prevention, and her associates looked at 4,184 acute care hospitals. Of those acute care hospitals, 1,642 (39%) reported implementing all seven CDC-defined core elements – leadership commitment, a single program leader responsible for outcomes, a pharmacy leader, specific interventions to improve prescribing, tracking antibiotic use and resistance, reporting data back to provider, and education – for hospital ASPs. In the hospitals with more than 200 beds, 775 (56%) were more likely to report all seven core elements, compared with 672 (39%) hospitals with 51-200 beds, and 328 (22%) of hospitals with 50 or fewer beds.
The hospitals with 50 or fewer beds were less likely to report leadership support (40%) or antibiotic stewardship education (46%), compared with facilities with greater than 50 beds (69% leadership, 69% education). Also, the major teaching hospitals were more likely to report all seven core elements (54%) than were hospitals that had only undergraduate education or no teaching affiliation (34%).
The study also conducted a final multivariate model and found that the strongest predictor for meeting all seven core elements was support from the facility administration (adjusted relative risk, 7.2; P less than .0001).
“Our findings suggest that many hospitals need to add infrastructure and measurement support to their current actions to improve antibiotic use,” the researchers concluded. “CDC is committed to on-going work with partners to help all hospitals implement effective antibiotic stewardship programs, and future years of this survey will help monitor progress toward that goal.”
Read the full study in Clinical Infectious Diseases (doi: 10.1093/cid/ciw323).
FROM CLINICAL INFECTIOUS DISEASES
Peter Kramer returns to his role in defending antidepressants in ‘Ordinarily Well’
With his 1993 landmark book, “Listening to Prozac,” psychiatrist Peter D. Kramer became one of the most famous psychiatrists in America – second perhaps only to the fictional Frasier Crane of primetime TV. Since then, Dr. Kramer has continued to write – including a novel, books on other psychiatric topics, a blog, and articles for mainstream media, including the New York Times. In his latest book, “Ordinarily Well: The Case for Antidepressants,” Dr. Kramer will return to the role he left behind 23 years ago: defending the use of antidepressants.
Dr. Kramer notes that he doesn’t do this easily. In the preface, with a bit of dismay, he talks about how reviewers have called him “Dr. Prozac.” He’s felt stuck on a wave that didn’t reflect his diverse interests, and he didn’t want to be covered by the spreading stain of Big Pharma.

“Against all indications, I remained hopeful that I might walk free by day, alter my obituary,” Dr. Kramer tells the reader.
With “Ordinarily Well,” Peter Kramer is back as Dr. Prozac. The book is written as a response to the “research”– now seen so often in headlines – that antidepressants are as effective as sugar pills for mild to moderate depression, and they should be prescribed only for severe major depression. He gets even more specific: The book is written partly in response to an article by Dr. Marcia Angell, former editor in chief of the New England Journal of Medicine, published in June 2011 in the New York Review of Books, and Dr. Angell’s assertion that psychiatric medications are no more effective than placebo. Since psychotropics come with more side effects than placebos, the next logical conclusion is that they are not only ineffective – they are harmful.
As a clinical psychiatrist, I’ve found this evidence-based stance to be perplexing. People get better on antidepressants, even if you aren’t measuring Hamilton rating scores and even if you aren’t limiting treatment to those with severe major depression. I would estimate that at least some of the people, some of the time, get better, and when you progress to strategies of switching and augmenting, most of the the people, most of the time, get significant relief from their major depression.
Obviously, this is my clinical impression and not research, and Dr. Kramer takes a more ardent stance: Most patients with depression, be it mild, moderate, severe, or long-standing dysthymia, have a good response to antidepressants. It’s the minority who don’t respond.
Dr. Kramer goes through the “science” that would suggest that antidepressants are not effective for milder forms of depression, dysthymia, and neuroticism. He does a systematic and comprehensive review of how pharmaceutical studies are conducted, and what factors might skew results, and there is plenty here to fill the pages. He explains complex issues – such as meta-analyses and numbers needed to treat – such that the lay reader can follow.
As just one example, Dr. Kramer talks about screening research subjects for participation in antidepressant studies: “If raters have a sense of the minimum Hamilton score for admission to a study, and if they are under pressure to fill an enrollment quota, they will be inclined to tack on questionable Hamilton points. The boost will not be uniform. There’s no need to raise rating in the very ill. Scores for least afflicted participants will be most inflated.
“When off-site raters, with no stake in the pace of enrollment, analyze tapes of admission interviews,” he continues, “they find patients to be much healthier than the on-site Hamilton scores suggest. According to off-site assessments, many patients admitted to drug studies simply are not depressed.”
Dr. Kramer methodically marches through problems with finding patients for the studies, shortcomings of the Hamilton rating scale, which gives suicidal ideation the same point as a somatic symptom; the bias some studies have of excluding people with severe depression; substance abuse, or comorbid disorders; and “the floor effect,” which underestimates efficacy in patients with fewer symptoms.
He follows subjects at an unnamed for-profit research center and praises the skills of everyone who comes in contact with the research subjects, including the friendly van driver who fetches patients from their homes.
In a chapter titled “How We’re Doing,” Dr. Kramer goes into detail about specific studies, including the STAR*D trials, where patients were recruited from primary care and psychiatric clinics with the guarantee that they would be provided active medication, and those with comorbid conditions were not excluded.
“Only the sickest came. For nearly 80% of the participants (more than 2,800 were tested), the disorder was chronic. The average length of the current depressive episode was more than 2 years, generally despite attempts at treatment. The average enrollee had lived with depression on and off for more than15 years and was now in a seventh episode. Most patients were alcoholics or had other forms of mental illness.
“In the first phase, patients were put on Celexa [citalopram], managed by their own doctors. About 30% of patients achieved remission within weeks – with virtually no symptoms. Responses (including remissions) ran at just under 50%.
“Commentators considered this outcome disappointing, but is it?”
So this is Dr. Kramer’s strength: He writes an engaging book about a complex topic, arguing throughout that antidepressants work well and have been given a bum rap by flawed research and careless journalism that enjoy the sensationalism of villainizing psychotropics. There are no headlines, he points out, singing the praises of antidepressants for milder forms of depression, even when the evidence is there. Despite the complexity of the topic and the breadth of his research reviews, Dr. Kramer tells the story of antidepressant research in a way that a lay reader can follow. There are no mice or moleculars, no genetic loci, and no explanations of cytochrome P450 metabolism, neurotransmission, or synaptic blockade. The complexities are explained without medical lingo and, in the end, he concludes what psychiatrists see every day: Antidepressants work. They work for the sickest of the sick, and they work for those who are suffering from less-severe forms of depression.
Dr. Kramer ends the book with a discussion of his own clinical experiences, which are not always in tune with what the “science” declares to be true. He cites studies that show that psychotherapy adds nothing to the treatment of depression, yet still, he treats his own patients with psychotherapy. He notes studies that show maximal efficacy when medications are used at high doses and continue for the long haul at these high doses, yet in his own practice, he sometimes uses lower doses and weans patients off medications. He does a wonderful job of pointing out the disconnect of the promise of evidence-based medicine and how its usefulness has limits in clinical practice.
In our communications, Dr. Kramer wrote to me: “There were many reasons not to write this book, and I was reluctant. I took up the topic only after declining a series of opportunities to weigh in. This book is the only one of mine that I wrote primarily out of a sense of duty. The debunking of antidepressants had gone too far and been too widely accepted, and I believed that the underlying research was shaky.”
He worried that I saw his view of antidepressants as more favorable than he intended it to be, and in fact, his perception is correct: While I prescribe antidepressants and see their benefits (as well as their side effects) with many of my patients, I believe Peter Kramer is more enthusiastic than I am about the efficacy of antidepressants for milder forms of depression, dysthymia, and neuroticism.
“My view is the one expressed in the title,” Dr. Kramer countered, “Our medications work ordinarily well, and they bring patients to a state of ordinary wellness.”
“Ordinarily Well” will be available on June 7; it is available for preorder on Amazon now.
Dr. Miller is a coauthor of “Shrink Rap: Three Psychiatrists Explain Their Work” (Baltimore: Johns Hopkins University Press, 2011).
With his 1993 landmark book, “Listening to Prozac,” psychiatrist Peter D. Kramer became one of the most famous psychiatrists in America – second perhaps only to the fictional Frasier Crane of primetime TV. Since then, Dr. Kramer has continued to write – including a novel, books on other psychiatric topics, a blog, and articles for mainstream media, including the New York Times. In his latest book, “Ordinarily Well: The Case for Antidepressants,” Dr. Kramer will return to the role he left behind 23 years ago: defending the use of antidepressants.
Dr. Kramer notes that he doesn’t do this easily. In the preface, with a bit of dismay, he talks about how reviewers have called him “Dr. Prozac.” He’s felt stuck on a wave that didn’t reflect his diverse interests, and he didn’t want to be covered by the spreading stain of Big Pharma.
“Against all indications, I remained hopeful that I might walk free by day, alter my obituary,” Dr. Kramer tells the reader.
With “Ordinarily Well,” Peter Kramer is back as Dr. Prozac. The book is written as a response to the “research”– now seen so often in headlines – that antidepressants are as effective as sugar pills for mild to moderate depression, and they should be prescribed only for severe major depression. He gets even more specific: The book is written partly in response to an article by Dr. Marcia Angell, former editor in chief of the New England Journal of Medicine, published in June 2011 in the New York Review of Books, and Dr. Angell’s assertion that psychiatric medications are no more effective than placebo. Since psychotropics come with more side effects than placebos, the next logical conclusion is that they are not only ineffective – they are harmful.
As a clinical psychiatrist, I’ve found this evidence-based stance to be perplexing. People get better on antidepressants, even if you aren’t measuring Hamilton rating scores and even if you aren’t limiting treatment to those with severe major depression. I would estimate that at least some of the people, some of the time, get better, and when you progress to strategies of switching and augmenting, most of the the people, most of the time, get significant relief from their major depression.
Obviously, this is my clinical impression and not research, and Dr. Kramer takes a more ardent stance: Most patients with depression, be it mild, moderate, severe, or long-standing dysthymia, have a good response to antidepressants. It’s the minority who don’t respond.
Dr. Kramer goes through the “science” that would suggest that antidepressants are not effective for milder forms of depression, dysthymia, and neuroticism. He does a systematic and comprehensive review of how pharmaceutical studies are conducted, and what factors might skew results, and there is plenty here to fill the pages. He explains complex issues – such as meta-analyses and numbers needed to treat – such that the lay reader can follow.
As just one example, Dr. Kramer talks about screening research subjects for participation in antidepressant studies: “If raters have a sense of the minimum Hamilton score for admission to a study, and if they are under pressure to fill an enrollment quota, they will be inclined to tack on questionable Hamilton points. The boost will not be uniform. There’s no need to raise rating in the very ill. Scores for least afflicted participants will be most inflated.
“When off-site raters, with no stake in the pace of enrollment, analyze tapes of admission interviews,” he continues, “they find patients to be much healthier than the on-site Hamilton scores suggest. According to off-site assessments, many patients admitted to drug studies simply are not depressed.”
Dr. Kramer methodically marches through problems with finding patients for the studies, shortcomings of the Hamilton rating scale, which gives suicidal ideation the same point as a somatic symptom; the bias some studies have of excluding people with severe depression; substance abuse, or comorbid disorders; and “the floor effect,” which underestimates efficacy in patients with fewer symptoms.
He follows subjects at an unnamed for-profit research center and praises the skills of everyone who comes in contact with the research subjects, including the friendly van driver who fetches patients from their homes.
In a chapter titled “How We’re Doing,” Dr. Kramer goes into detail about specific studies, including the STAR*D trials, where patients were recruited from primary care and psychiatric clinics with the guarantee that they would be provided active medication, and those with comorbid conditions were not excluded.
“Only the sickest came. For nearly 80% of the participants (more than 2,800 were tested), the disorder was chronic. The average length of the current depressive episode was more than 2 years, generally despite attempts at treatment. The average enrollee had lived with depression on and off for more than15 years and was now in a seventh episode. Most patients were alcoholics or had other forms of mental illness.
“In the first phase, patients were put on Celexa [citalopram], managed by their own doctors. About 30% of patients achieved remission within weeks – with virtually no symptoms. Responses (including remissions) ran at just under 50%.
“Commentators considered this outcome disappointing, but is it?”
So this is Dr. Kramer’s strength: He writes an engaging book about a complex topic, arguing throughout that antidepressants work well and have been given a bum rap by flawed research and careless journalism that enjoy the sensationalism of villainizing psychotropics. There are no headlines, he points out, singing the praises of antidepressants for milder forms of depression, even when the evidence is there. Despite the complexity of the topic and the breadth of his research reviews, Dr. Kramer tells the story of antidepressant research in a way that a lay reader can follow. There are no mice or moleculars, no genetic loci, and no explanations of cytochrome P450 metabolism, neurotransmission, or synaptic blockade. The complexities are explained without medical lingo and, in the end, he concludes what psychiatrists see every day: Antidepressants work. They work for the sickest of the sick, and they work for those who are suffering from less-severe forms of depression.
Dr. Kramer ends the book with a discussion of his own clinical experiences, which are not always in tune with what the “science” declares to be true. He cites studies that show that psychotherapy adds nothing to the treatment of depression, yet still, he treats his own patients with psychotherapy. He notes studies that show maximal efficacy when medications are used at high doses and continue for the long haul at these high doses, yet in his own practice, he sometimes uses lower doses and weans patients off medications. He does a wonderful job of pointing out the disconnect of the promise of evidence-based medicine and how its usefulness has limits in clinical practice.
In our communications, Dr. Kramer wrote to me: “There were many reasons not to write this book, and I was reluctant. I took up the topic only after declining a series of opportunities to weigh in. This book is the only one of mine that I wrote primarily out of a sense of duty. The debunking of antidepressants had gone too far and been too widely accepted, and I believed that the underlying research was shaky.”
He worried that I saw his view of antidepressants as more favorable than he intended it to be, and in fact, his perception is correct: While I prescribe antidepressants and see their benefits (as well as their side effects) with many of my patients, I believe Peter Kramer is more enthusiastic than I am about the efficacy of antidepressants for milder forms of depression, dysthymia, and neuroticism.
“My view is the one expressed in the title,” Dr. Kramer countered, “Our medications work ordinarily well, and they bring patients to a state of ordinary wellness.”
“Ordinarily Well” will be available on June 7; it is available for preorder on Amazon now.
Dr. Miller is a coauthor of “Shrink Rap: Three Psychiatrists Explain Their Work” (Baltimore: Johns Hopkins University Press, 2011).