User login
Arrange for VAM Housing by May 11
Special room rates at the VAM headquarters hotel, the Gaylord National Resort & Convention Center, are good through Thursday, May 11. Enjoy the stunning 19-story glass atrium, with views of the Potomac River, on-site restaurants, luxury spa and fitness center and more. It’s just steps from National Harbor’s entertainment and shopping district and only eight miles from Washington, D.C.
Special room rates at the VAM headquarters hotel, the Gaylord National Resort & Convention Center, are good through Thursday, May 11. Enjoy the stunning 19-story glass atrium, with views of the Potomac River, on-site restaurants, luxury spa and fitness center and more. It’s just steps from National Harbor’s entertainment and shopping district and only eight miles from Washington, D.C.
Special room rates at the VAM headquarters hotel, the Gaylord National Resort & Convention Center, are good through Thursday, May 11. Enjoy the stunning 19-story glass atrium, with views of the Potomac River, on-site restaurants, luxury spa and fitness center and more. It’s just steps from National Harbor’s entertainment and shopping district and only eight miles from Washington, D.C.

Register for VAM Hands-on Workshops
Register today for hands-on training at the Vascular Annual Meeting’s hands-on-workshop (limit 15 participants each) on Wednesday, June 8. Twelve topics -- with tips, tricks, tools and more -- are offered during four 90-minute sessions.
The workshops are $100 each (preregistration is required) and are not included in the VAM registration fee. Simply add the desired workshops when registering. Already registered? Just return to the registration page and add the workshops separately.
Learn more here.

Apply For VAM 2017 International Scholarships by June 17
Up to four $5,000 scholarships to attend the 2017 Vascular Annual Meeting in San Diego are available to qualified young vascular surgeons living outside of North America.
In addition to the meeting, scholars also will visit clinical, teaching and research programs in the United States and Canada. Applications can be completed online.
The application deadline is June 17, 2016. For questions, email [email protected] or call 312-334-2300. More information is available here.

Vascular Quality Initiative plans first annual meeting at 2016 VAM near Washington DC
Vascular surgeons, clinicians, data managers and quality personnel will find helpful techniques and useful information on using data at the first-ever, day-long meeting of the Vascular Quality Initiative (VQI) June 8, 2016 at the Gaylord National Resort and Convention Center in National Harbor, MD.
Dubbed “VQI@VAM” since it will be held during the larger, 2016 Vascular Annual Meeting (VAM) in the same location, the event will bring a day of programming aimed at helping attendees better understand the data registries and quality improvement skills that will help improve vascular care.
“The intent of VQI@VAM is to bring the physicians, quality officers and data managers together in a team environment where they can learn more about the use of VQI data to promote quality improvement, with practical tools that can be used in their own health system,” said Dr. Jack Cronenwett, VQI’s medical director.
Morning sessions will focus on information for data managers, including vascular anatomy, a review of data definitions, examples of case abstraction and how to produce and interpret reports. In the afternoon, sessions will feature topics such as case studies of successful vascular quality improvement projects and practical training on techniques.
During lunch, Dr. Englesbe, of the University of Michigan and associate director of the Michigan Surgical Quality Collaborative, will provide a keynote speech entitled, “From Registry Report to Bedside: Leveraging Your Quality Data.” This presentation will address challenges and opportunities in using registry data.
Registration is available through the Vascular Annual Meeting’s registration website. Registrants can sign up for both meetings or only VQI, for which there is a $100 fee. Select the box for “Postgraduate Courses, VQI Annual Meeting, and/or RPVI Exam Review Course.” You will see the rates on the next page. Select the “VQI Annual Meeting” box (ID-10) from the list of four options. You should see that the meeting fee of $100 has been added to your cart.
Register now by clicking here.

Start offering aspirin to pregnant women at high risk for preeclampsia
Obstetricians work diligently to anticipate, diagnose, and treat preeclampsia because the maternal and perinatal health burden of the disease is enormous. Many meta-analyses have reported that aspirin treatment of women at high risk for preeclampsia reduces the risk of developing the disease by about 10% to 23%.1–5 In addition, for women at high risk for preeclampsia, aspirin treatment reduces the risk of preterm birth and intrauterine growth restriction (IUGR). In your practice you should start offering aspirin to pregnant women at high risk for preeclampsia.
Aspirin reduces the risk of preeclampsia, preterm birth, and IUGRBased on the results of multiple meta-analyses of clinical trials involving more than 35,000 women, investigators consistently have concluded that aspirin treatment reduces the risk of preeclampsia in women at high risk for the disease.1–5 The magnitude of the effect is difficult to define with precision, but the risk reduction is likely in the range of 10% to 23%.1
In addition to reducing the risk of preeclampsia, aspirin also reduces the risk of 2 associated problems: preterm birth and IUGR. For preterm birth, the risk reduction is estimated to be in the range of 11% to 31%. For IUGR, the estimation for risk reduction is in the range of 7% to 24%.1 Although these benefits are modest, the burden of maternal and perinatal morbidity associated with preeclampsia is great, making even a modest benefit clinically significant.
Potential harms of aspirin treatmentIn the most recent meta-analysis from the US Preventive Services Task Force (USPSTF),1 low-dose aspirin treatment was associated with no significant perinatal or maternal harms, but rare harms could not be ruled out. A small increase in the risk of placental abruption was noted, but this increase did not reach significance (relative risk [RR], 1.17; 95% confidence interval [CI], 0.93–1.48).1 There was no increased risk of maternal postpartum hemorrhage or blood loss at delivery.1 In one meta-analysis, aspirin treatment did not increase the risk of newborn intracranial hemorrhage.1
Other potential adverse effects of aspirin treatment include maternal gastrointestinal bleeding and exacerbation of respiratory disorders such as asthma, but these effects have not been reported as significant associations in clinical trials of preeclampsia prevention.
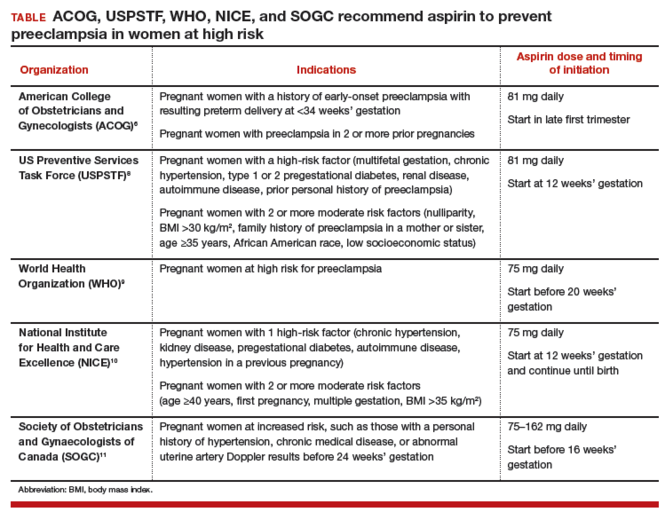
Dueling recommendations: Restrictive or liberal use of aspirin?The American College of Obstetricians and Gynecologists (ACOG) recommends use of aspirin to prevent preeclampsia in women who have a personal history of early-onset preeclampsia with delivery before 34 weeks of gestation and in women with preeclampsia in 2 or more prior pregnancies.6 The restrictive ACOG guideline recommends aspirin treatment for a very small group of women. In one analysis, using the ACOG guideline, only 0.35% of all pregnant women would be eligible for treatment with aspirin to prevent preeclampsia.7
The USPSTF recommends that all pregnant women with one major risk factor for preeclampsia—including multifetal gestation, chronic hypertension, type 1 or 2 pregestational diabetes, renal disease, autoimmune disease, or prior personal history of preeclampsia—receive treatment with aspirin to prevent preeclampsia.8 The Task Force also recommends that women with multiple moderate risk factors for preeclampsia, such as nulliparity, body mass index greater than 30 kg/m2, family history of preeclampsia in a mother or sister, age 35 years or older, and certain sociodemographic risk factors (African American race, low socioeconomic status) also be offered aspirin treatment.
The USPSTF guideline advises aspirin treatment for many women. According to one analysis, the USPSTFguideline would result in approximately 24% of all pregnant women being offered aspirin treatment.7
The USPSTF guideline would result in 67 times more pregnant women being treated with aspirin than the ACOG guideline. The narrowly focused ACOG recommendation is problematic because it recommends against aspirin treatment in women who are at very high risk for developing preeclampsia, for example, a 41-year-old woman in her first pregnancy with twins and pregestational diabetes. In addition, the ACOG recommendation is not consistent with the recommendations of most other major health organizations.
The World Health Organization,9 the United Kingdom’s National Institute for Health and Care Excellence (NICE),10 and the Society of Obstetricians and Gynaecologists of Canada11 all recommend aspirin treatment to prevent preeclampsia in pregnant women at high risk for the disease and utilize an expanded definition of “high risk” (TABLE). Some experts have observed that, in actual clinical practice, it is often difficult to consistently implement a prevention plan based on a complex assessment of clinical risk factors.7
An alternative to guidelines that use clinical risk factors to identify women at high risk is universal treatment. With universal treatment all pregnant women are prescribed aspirin, thereby maximizing the clinical benefit but unnecessarily treating many women with aspirin.7 Universal treatment of pregnant women with aspirin appears to be cost-effective and would be associated with annual health care savings of $365 million.7
Timing of aspirin initiationIn one meta-analysis, initiating aspirin before 16 weeks’ gestation resulted in a greater reduction in preeclampsia than starting aspirin after 16 weeks.12 The USPSTF cautions that meta-analysis of the available data is not well suited for identifying the optimal time to initiate aspirin therapy.13 ACOG, USPSTF, and NICE recommend initiating aspirin therapy at approximately 12 weeks’ gestation—the end of the first trimester.
Ideal aspirin doseThe optimal dose of aspirin to prevent preeclampsia is not precisely defined. Aspirin doses ranging from 50 mg to 162 mg have been proposed for the prevention of preeclampsia. Most authorities recommend a daily dose between 80 mg and less than 300 mg to prevent preeclampsia.14 ACOG and USPSTF recommend aspirin at a dose of 81 mg daily,6,8 because this dose is widely available in the United States.
Let’s close the gap between current and optimal practiceAccording to the USPSTF guidelines, approximately 24% of the pregnant women in our practices have risk factors that would justify the initiation of aspirin treatment for the prevention of preeclampsia.8 This approach would modestly reduce the rate of preeclampsia and the associated problems of preterm birth and IUGR with little cost and few adverse effects. Yet relatively few pregnant women in the United States are currently receiving aspirin therapy. We could close this clinical gap between current and optimal practice by reflecting on the USPSTF recommendations and implementing them in our practices, as appropriate.
Tell us…What are your thoughts about the use of aspirin in pregnant women who are at high risk for preeclampsia?
Send your letter to the editor to [email protected]. Please include the city and state in which you practice.
- Henderson JT, Whitlock EP, O'Connor E, Senger CA, Thompson JH, Rowland MG. Low-dose aspirin for prevention of morbidity and mortality from preeclampsia: a systematic evidence review for the U.S. Preventive Services Task Force. Ann Intern Med. 2014;160(10):695-703.
- Roberge S, Nicolaides KH, Demers S, Villa P, Bujold E. Prevention of perinatal death and adverse perinatal outcome using low-dose aspirin: a meta-analysis. Ultrasound Obstet Gynecol. 2013;41(5):491-499.
- Bujold E, Roberge S, Lacasse Y, et al. Prevention of preeclampsia and intrauterine growth restriction with aspirin started in early pregnancy: a meta-analysis. Obstet Gynecol. 2010;116(2 pt 1):402-414.
- Duley L, Henderson-Smart DJ, Meher S, King JF. Antiplatelet agents for preventing pre-eclampsia and its complications. Cochrane Database Syst Rev. 2007;(2):CD004659.
- Askie LM, Duley L, Henderson-Smart DJ, Stewart LA; PARIS Collaborative Group. Antiplatelet agents for prevention of pre-eclampsia: a meta-analysis of individual patient data. Lancet. 2007;369(9575):1791-1798.
- American College of Obstetricians and Gynecologists, Task Force on Hypertension in Pregnancy. Hypertension in pregnancy. Report of the American College of Obstetricians and Gynecologists' Task Force on Hypertension in Pregnancy. Obstet Gynecol. 2013;122(5):1122-1131.
- Werner EF, Hauspurg AK, Rouse DJ. A cost-benefit analysis of low-dose aspirin prophylaxis for the prevention of preeclampsia in the United States. Obstet Gynecol. 2015;126(6):1242-1250.
- LeFevre ML; US Preventive Services Task Force. Low-dose aspirin use for the prevention of morbidity and mortality from preeclampsia: U.S. Preventive Services Task Force recommendation statement. Ann Intern Med. 2014;161(11):819-826.
- World Health Organization. WHO recommendations for prevention and treatment of pre-eclampsia and eclampsia. Geneva, Switzerland: WHO; 2011:13-15. https://www.preeclampsia.org/images/pdf/2011c-who_pe_final.pdf. Accessed January 4, 2016.
- National Institute for Health and Care Excellence. Hypertension in pregnancy: diagnosis and management. Clinical guideline 107. Manchester, United Kingdom: NICE; 2010:7. https://www.nice.org.uk/guidance/cg107/resources/hypertension-in-pregnancy-diagnosis-and-management-35109334009285. Accessed April 4, 2016.
- Magee LA, Pels A, Helewa M, Rey E, von Dadelszen P; Canadian Hypertensive Disorders of Pregnancy Working Group. Diagnosis, evaluation, and management of hypertensive disorders of pregnancy: executive summary. J Obstet Gynaecol Can. 2014;36(5):416-441.
- Roberge S, Demers S, Bujold E. Low-dose aspirin for prevention of morbidity and mortality from preeclampsia [letter to the editor]. Ann Intern Med. 2014;161(8):613.
- Henderson JT, O'Connor E, Whitlock EP. Low-dose aspirin for prevention of morbidity and mortality from preeclampsia [letter to the editor]. Ann Intern Med. 2014;161(8):613-614.
- Bujold E, Roberge S, Nicolaides KH. Low-dose aspirin for prevention of adverse outcomes related to abnormal placentation. Prenat Diagn. 2014;34(7):642-648.

Dr. Barbieri is Editor in Chief, OBG Management; Chair, Obstetrics and Gynecology, Brigham and Women’s Hospital; and Kate Macy Ladd Professor of Obstetrics, Gynecology, and Reproductive Biology, Harvard Medical School, Boston, Massachusetts.
Dr. Barbieri reports no financial relationships relevant to this article.
Obstetricians work diligently to anticipate, diagnose, and treat preeclampsia because the maternal and perinatal health burden of the disease is enormous. Many meta-analyses have reported that aspirin treatment of women at high risk for preeclampsia reduces the risk of developing the disease by about 10% to 23%.1–5 In addition, for women at high risk for preeclampsia, aspirin treatment reduces the risk of preterm birth and intrauterine growth restriction (IUGR). In your practice you should start offering aspirin to pregnant women at high risk for preeclampsia.
Aspirin reduces the risk of preeclampsia, preterm birth, and IUGRBased on the results of multiple meta-analyses of clinical trials involving more than 35,000 women, investigators consistently have concluded that aspirin treatment reduces the risk of preeclampsia in women at high risk for the disease.1–5 The magnitude of the effect is difficult to define with precision, but the risk reduction is likely in the range of 10% to 23%.1
In addition to reducing the risk of preeclampsia, aspirin also reduces the risk of 2 associated problems: preterm birth and IUGR. For preterm birth, the risk reduction is estimated to be in the range of 11% to 31%. For IUGR, the estimation for risk reduction is in the range of 7% to 24%.1 Although these benefits are modest, the burden of maternal and perinatal morbidity associated with preeclampsia is great, making even a modest benefit clinically significant.
Potential harms of aspirin treatmentIn the most recent meta-analysis from the US Preventive Services Task Force (USPSTF),1 low-dose aspirin treatment was associated with no significant perinatal or maternal harms, but rare harms could not be ruled out. A small increase in the risk of placental abruption was noted, but this increase did not reach significance (relative risk [RR], 1.17; 95% confidence interval [CI], 0.93–1.48).1 There was no increased risk of maternal postpartum hemorrhage or blood loss at delivery.1 In one meta-analysis, aspirin treatment did not increase the risk of newborn intracranial hemorrhage.1
Other potential adverse effects of aspirin treatment include maternal gastrointestinal bleeding and exacerbation of respiratory disorders such as asthma, but these effects have not been reported as significant associations in clinical trials of preeclampsia prevention.
Dueling recommendations: Restrictive or liberal use of aspirin?The American College of Obstetricians and Gynecologists (ACOG) recommends use of aspirin to prevent preeclampsia in women who have a personal history of early-onset preeclampsia with delivery before 34 weeks of gestation and in women with preeclampsia in 2 or more prior pregnancies.6 The restrictive ACOG guideline recommends aspirin treatment for a very small group of women. In one analysis, using the ACOG guideline, only 0.35% of all pregnant women would be eligible for treatment with aspirin to prevent preeclampsia.7
The USPSTF recommends that all pregnant women with one major risk factor for preeclampsia—including multifetal gestation, chronic hypertension, type 1 or 2 pregestational diabetes, renal disease, autoimmune disease, or prior personal history of preeclampsia—receive treatment with aspirin to prevent preeclampsia.8 The Task Force also recommends that women with multiple moderate risk factors for preeclampsia, such as nulliparity, body mass index greater than 30 kg/m2, family history of preeclampsia in a mother or sister, age 35 years or older, and certain sociodemographic risk factors (African American race, low socioeconomic status) also be offered aspirin treatment.
The USPSTF guideline advises aspirin treatment for many women. According to one analysis, the USPSTFguideline would result in approximately 24% of all pregnant women being offered aspirin treatment.7
The USPSTF guideline would result in 67 times more pregnant women being treated with aspirin than the ACOG guideline. The narrowly focused ACOG recommendation is problematic because it recommends against aspirin treatment in women who are at very high risk for developing preeclampsia, for example, a 41-year-old woman in her first pregnancy with twins and pregestational diabetes. In addition, the ACOG recommendation is not consistent with the recommendations of most other major health organizations.
The World Health Organization,9 the United Kingdom’s National Institute for Health and Care Excellence (NICE),10 and the Society of Obstetricians and Gynaecologists of Canada11 all recommend aspirin treatment to prevent preeclampsia in pregnant women at high risk for the disease and utilize an expanded definition of “high risk” (TABLE). Some experts have observed that, in actual clinical practice, it is often difficult to consistently implement a prevention plan based on a complex assessment of clinical risk factors.7
An alternative to guidelines that use clinical risk factors to identify women at high risk is universal treatment. With universal treatment all pregnant women are prescribed aspirin, thereby maximizing the clinical benefit but unnecessarily treating many women with aspirin.7 Universal treatment of pregnant women with aspirin appears to be cost-effective and would be associated with annual health care savings of $365 million.7
Timing of aspirin initiationIn one meta-analysis, initiating aspirin before 16 weeks’ gestation resulted in a greater reduction in preeclampsia than starting aspirin after 16 weeks.12 The USPSTF cautions that meta-analysis of the available data is not well suited for identifying the optimal time to initiate aspirin therapy.13 ACOG, USPSTF, and NICE recommend initiating aspirin therapy at approximately 12 weeks’ gestation—the end of the first trimester.
Ideal aspirin doseThe optimal dose of aspirin to prevent preeclampsia is not precisely defined. Aspirin doses ranging from 50 mg to 162 mg have been proposed for the prevention of preeclampsia. Most authorities recommend a daily dose between 80 mg and less than 300 mg to prevent preeclampsia.14 ACOG and USPSTF recommend aspirin at a dose of 81 mg daily,6,8 because this dose is widely available in the United States.
Let’s close the gap between current and optimal practiceAccording to the USPSTF guidelines, approximately 24% of the pregnant women in our practices have risk factors that would justify the initiation of aspirin treatment for the prevention of preeclampsia.8 This approach would modestly reduce the rate of preeclampsia and the associated problems of preterm birth and IUGR with little cost and few adverse effects. Yet relatively few pregnant women in the United States are currently receiving aspirin therapy. We could close this clinical gap between current and optimal practice by reflecting on the USPSTF recommendations and implementing them in our practices, as appropriate.
Tell us…What are your thoughts about the use of aspirin in pregnant women who are at high risk for preeclampsia?
Send your letter to the editor to [email protected]. Please include the city and state in which you practice.
- Henderson JT, Whitlock EP, O'Connor E, Senger CA, Thompson JH, Rowland MG. Low-dose aspirin for prevention of morbidity and mortality from preeclampsia: a systematic evidence review for the U.S. Preventive Services Task Force. Ann Intern Med. 2014;160(10):695-703.
- Roberge S, Nicolaides KH, Demers S, Villa P, Bujold E. Prevention of perinatal death and adverse perinatal outcome using low-dose aspirin: a meta-analysis. Ultrasound Obstet Gynecol. 2013;41(5):491-499.
- Bujold E, Roberge S, Lacasse Y, et al. Prevention of preeclampsia and intrauterine growth restriction with aspirin started in early pregnancy: a meta-analysis. Obstet Gynecol. 2010;116(2 pt 1):402-414.
- Duley L, Henderson-Smart DJ, Meher S, King JF. Antiplatelet agents for preventing pre-eclampsia and its complications. Cochrane Database Syst Rev. 2007;(2):CD004659.
- Askie LM, Duley L, Henderson-Smart DJ, Stewart LA; PARIS Collaborative Group. Antiplatelet agents for prevention of pre-eclampsia: a meta-analysis of individual patient data. Lancet. 2007;369(9575):1791-1798.
- American College of Obstetricians and Gynecologists, Task Force on Hypertension in Pregnancy. Hypertension in pregnancy. Report of the American College of Obstetricians and Gynecologists' Task Force on Hypertension in Pregnancy. Obstet Gynecol. 2013;122(5):1122-1131.
- Werner EF, Hauspurg AK, Rouse DJ. A cost-benefit analysis of low-dose aspirin prophylaxis for the prevention of preeclampsia in the United States. Obstet Gynecol. 2015;126(6):1242-1250.
- LeFevre ML; US Preventive Services Task Force. Low-dose aspirin use for the prevention of morbidity and mortality from preeclampsia: U.S. Preventive Services Task Force recommendation statement. Ann Intern Med. 2014;161(11):819-826.
- World Health Organization. WHO recommendations for prevention and treatment of pre-eclampsia and eclampsia. Geneva, Switzerland: WHO; 2011:13-15. https://www.preeclampsia.org/images/pdf/2011c-who_pe_final.pdf. Accessed January 4, 2016.
- National Institute for Health and Care Excellence. Hypertension in pregnancy: diagnosis and management. Clinical guideline 107. Manchester, United Kingdom: NICE; 2010:7. https://www.nice.org.uk/guidance/cg107/resources/hypertension-in-pregnancy-diagnosis-and-management-35109334009285. Accessed April 4, 2016.
- Magee LA, Pels A, Helewa M, Rey E, von Dadelszen P; Canadian Hypertensive Disorders of Pregnancy Working Group. Diagnosis, evaluation, and management of hypertensive disorders of pregnancy: executive summary. J Obstet Gynaecol Can. 2014;36(5):416-441.
- Roberge S, Demers S, Bujold E. Low-dose aspirin for prevention of morbidity and mortality from preeclampsia [letter to the editor]. Ann Intern Med. 2014;161(8):613.
- Henderson JT, O'Connor E, Whitlock EP. Low-dose aspirin for prevention of morbidity and mortality from preeclampsia [letter to the editor]. Ann Intern Med. 2014;161(8):613-614.
- Bujold E, Roberge S, Nicolaides KH. Low-dose aspirin for prevention of adverse outcomes related to abnormal placentation. Prenat Diagn. 2014;34(7):642-648.

Physicians and Patients Lack a Common Understanding of Seizure Clusters
Health care professionals and patients with epilepsy lack a common understanding of seizure clusters, according to research published in the April issue of Epilepsy & Behavior. Physicians and patients have differing ideas about the diagnosis, impact, and management of seizure clusters, and communication between these groups consequently is difficult. Investigators also cite a gap in the understanding of seizure clusters among health care providers as a group, and among patients as a group.
“An accepted, simple working definition of [seizure] clusters is needed that can be translated into consumer-friendly language,” said, Janice Buelow, RN, PhD, Associate Professor Emeritus at Indiana University School of Nursing in Annapolis, and colleagues. “This requires a common clinical lexicon to describe seizure clusters to facilitate communication among consumers, as well as between consumers and clinicians.” She defines consumers as including patients and caregivers.

Seizure clusters are not part of the International League Against Epilepsy Commission on Classification and Terminology, and neurologists have used inconsistent terminology to describe these events. Dr. Buelow and colleagues sought to describe and compare physicians’ and patients’ understanding of seizure clusters and to determine how these groups communicate about them. They reviewed websites with community forums such as those of the Epilepsy Foundation, Seizure Tracker, and Patients Like Me to describe patients’ understanding of seizure clusters. To describe clinicians’ understanding of seizure clusters, the investigators searched the literature for relevant articles.
Posts on community forums indicated that patients were confused about the meaning of a diagnosis of seizure clusters. Some patients thought that their physicians did not believe them when they reported having seizure clusters, which could reflect “a larger communication gap,” said Dr. Buelow. Patients also lacked confidence that physicians acknowledged their concerns about the events.
Clinicians viewed seizure clusters as a clinical event and discussed them in terms of frequency, duration, and appropriate treatment. In contrast, patients’ definitions focused on how seizure clusters affected their lives and showed little understanding of frequency.
The investigators observed that patients described seizure clusters as different from their usual seizures. Patients also remarked that a pattern of seizure clusters has a significant impact on their daily lives. Recurrent seizures contribute to a heightened sense of severity among patients, and misperceptions about the distinction between seizure clusters and status epilepticus can cause confusion, said the researchers.
The literature search revealed a lack of consensus among neurologists about what constitutes a seizure cluster. The literature also contained few discussions about risk factors, in contrast with community forums. Physicians’ discussions of severity focused on complications of seizure clusters such as status epilepticus or postictal psychosis. Professional discussions of the impact of seizure clusters mentioned progression to status epilepticus, emergency room visits, and hospital admissions rather than their influence on daily life. Neither patients nor physicians discussed how the groups communicate about seizure clusters.
—Erik Greb
Suggested Reading
Buelow JM, Shafer P, Shinnar R, et al. Perspectives on seizure clusters: Gaps in lexicon, awareness, and treatment. Epilepsy Behav. 2016;57(Pt A):16-22.
Health care professionals and patients with epilepsy lack a common understanding of seizure clusters, according to research published in the April issue of Epilepsy & Behavior. Physicians and patients have differing ideas about the diagnosis, impact, and management of seizure clusters, and communication between these groups consequently is difficult. Investigators also cite a gap in the understanding of seizure clusters among health care providers as a group, and among patients as a group.
“An accepted, simple working definition of [seizure] clusters is needed that can be translated into consumer-friendly language,” said, Janice Buelow, RN, PhD, Associate Professor Emeritus at Indiana University School of Nursing in Annapolis, and colleagues. “This requires a common clinical lexicon to describe seizure clusters to facilitate communication among consumers, as well as between consumers and clinicians.” She defines consumers as including patients and caregivers.
Seizure clusters are not part of the International League Against Epilepsy Commission on Classification and Terminology, and neurologists have used inconsistent terminology to describe these events. Dr. Buelow and colleagues sought to describe and compare physicians’ and patients’ understanding of seizure clusters and to determine how these groups communicate about them. They reviewed websites with community forums such as those of the Epilepsy Foundation, Seizure Tracker, and Patients Like Me to describe patients’ understanding of seizure clusters. To describe clinicians’ understanding of seizure clusters, the investigators searched the literature for relevant articles.
Posts on community forums indicated that patients were confused about the meaning of a diagnosis of seizure clusters. Some patients thought that their physicians did not believe them when they reported having seizure clusters, which could reflect “a larger communication gap,” said Dr. Buelow. Patients also lacked confidence that physicians acknowledged their concerns about the events.
Clinicians viewed seizure clusters as a clinical event and discussed them in terms of frequency, duration, and appropriate treatment. In contrast, patients’ definitions focused on how seizure clusters affected their lives and showed little understanding of frequency.
The investigators observed that patients described seizure clusters as different from their usual seizures. Patients also remarked that a pattern of seizure clusters has a significant impact on their daily lives. Recurrent seizures contribute to a heightened sense of severity among patients, and misperceptions about the distinction between seizure clusters and status epilepticus can cause confusion, said the researchers.
The literature search revealed a lack of consensus among neurologists about what constitutes a seizure cluster. The literature also contained few discussions about risk factors, in contrast with community forums. Physicians’ discussions of severity focused on complications of seizure clusters such as status epilepticus or postictal psychosis. Professional discussions of the impact of seizure clusters mentioned progression to status epilepticus, emergency room visits, and hospital admissions rather than their influence on daily life. Neither patients nor physicians discussed how the groups communicate about seizure clusters.
—Erik Greb
Suggested Reading
Buelow JM, Shafer P, Shinnar R, et al. Perspectives on seizure clusters: Gaps in lexicon, awareness, and treatment. Epilepsy Behav. 2016;57(Pt A):16-22.
Suggested Reading
Buelow JM, Shafer P, Shinnar R, et al. Perspectives on seizure clusters: Gaps in lexicon, awareness, and treatment. Epilepsy Behav. 2016;57(Pt A):16-22.
With no budge in more than 20 years, are US unintended pregnancy rates finally on the decline?
Expert Commentary The unintended pregnancy rate has hovered around 50% for at least 20 years despite vigorous efforts to educate both the public and health care providers on the importance of using effective contraceptive methods. During that time, new contraceptives were developed and older methods were improved to reduce risk and adverse effects. Despite these efforts, however, an estimated 48% of all unintended pregnancies in the United States occurred among contraceptive users.1 Results of the study by Finer and Zolna on the recent decline in unintended pregnancies suggest there may be some light at the end of the tunnel.
Details of the studyThe study authors used data from the National Survey of Family Growth (NSFG) and other sources to calculate rates of pregnancy in the United States for 2008 and 2011, including rates based on pregnancy intentions and outcome. About 45% of pregnancies in 2011 were unintended, compared with 51% in 2008. The rate in 2011 represents the lowest rate of unintended pregnancy in more than 3 decades.
Rates reduced in many population subgroupsThe percentage of unintended pregnancies ending in abortion remained stable at 40% in 2008 and 42% in 2011. The largest changes in rate of unintended pregnancy from 2008 to 2011 occurred in women aged 15 to 17 years (−44%), women cohabiting (−29%), those with incomes at 100% to 199% of the federal poverty level (−32%), women who were not high school graduates (−28%), and Hispanic women (−26%). Other population subgroups also showed improvement but to a lesser extent than those described here.
The study authors concede that some of the reduction in unintended pregnancies can be attributed to the economic recession that occurred during the study time frame, when many women intentionally reduced or delayed childbearing. The more likely explanation, they point out, is the increased use of long-acting reversible contraception (LARC), particularly the intrauterine device (IUD). Notably, among US women using contraception, the rates of IUD use increased from 4% in 2007 to 12% in 2012.2
Nevertheless, while the unintended pregnancy rate has shown improvement, the rate in the United States still lags considerably behind that of other industrialized nations. In Western Europe, for example, the unintended pregnancy rate was 34% in 2012.3
What this evidence means for practiceAs the study data suggest, use of contraceptive methods that do not rely on a frequent activity by the user, such as LARC methods, is associated with improved adherence. Consequently, all LARC methods, including the IUD, are associated with a pregnancy rate of about 1% or less; this rate is equal to or better than the rates seen with many forms of tubal sterilization, and it is superior to that seen with other methods, such as oral contraceptives, which have a contraceptive failure rate of about 9%.4
Finally, to correct disparities noted in this study that may be related particularly to access to contraceptive methods, the Affordable Care Act contains provisions that should lead to greater availability of contraceptive services in the United States.
—Ronald T. Burkman, MD
Share your thoughts! Send your Letter to the Editor to [email protected]. Please include your name and the city and state in which you practice.
- Finer LB, Henshaw SK. Disparities in rates of unintended pregnancy in the United States, 1994 and 2001. Perspect Sex Reprod Health. 2006;38(2):90–96.
- Use of highly effective contraceptives in the US continues to rise, with likely implications for declines in unintended pregnancy and abortion. New York: Guttmacher Institute, 2014. http://www.guttmacher.org/media/inthenews/2014/12/12/index.html. Published December 12, 2014. Accessed April 21, 2016.
- Sedgh G, Singh S, Hussain R. Intended and unintended pregnancies worldwide in 2012 and recent trends. Stud Fam Plann. 2014;45(3):301–314.
- Trussell J, Henry N, Hassan F, Prezioso A, Law A, Filonenko A. Burden of unintended pregnancy in the United States: potential savings with increased use of long-acting reversible contraception. Contraception. 2013;87(2):154-161.
Expert Commentary The unintended pregnancy rate has hovered around 50% for at least 20 years despite vigorous efforts to educate both the public and health care providers on the importance of using effective contraceptive methods. During that time, new contraceptives were developed and older methods were improved to reduce risk and adverse effects. Despite these efforts, however, an estimated 48% of all unintended pregnancies in the United States occurred among contraceptive users.1 Results of the study by Finer and Zolna on the recent decline in unintended pregnancies suggest there may be some light at the end of the tunnel.
Details of the studyThe study authors used data from the National Survey of Family Growth (NSFG) and other sources to calculate rates of pregnancy in the United States for 2008 and 2011, including rates based on pregnancy intentions and outcome. About 45% of pregnancies in 2011 were unintended, compared with 51% in 2008. The rate in 2011 represents the lowest rate of unintended pregnancy in more than 3 decades.
Rates reduced in many population subgroupsThe percentage of unintended pregnancies ending in abortion remained stable at 40% in 2008 and 42% in 2011. The largest changes in rate of unintended pregnancy from 2008 to 2011 occurred in women aged 15 to 17 years (−44%), women cohabiting (−29%), those with incomes at 100% to 199% of the federal poverty level (−32%), women who were not high school graduates (−28%), and Hispanic women (−26%). Other population subgroups also showed improvement but to a lesser extent than those described here.
The study authors concede that some of the reduction in unintended pregnancies can be attributed to the economic recession that occurred during the study time frame, when many women intentionally reduced or delayed childbearing. The more likely explanation, they point out, is the increased use of long-acting reversible contraception (LARC), particularly the intrauterine device (IUD). Notably, among US women using contraception, the rates of IUD use increased from 4% in 2007 to 12% in 2012.2
Nevertheless, while the unintended pregnancy rate has shown improvement, the rate in the United States still lags considerably behind that of other industrialized nations. In Western Europe, for example, the unintended pregnancy rate was 34% in 2012.3
What this evidence means for practiceAs the study data suggest, use of contraceptive methods that do not rely on a frequent activity by the user, such as LARC methods, is associated with improved adherence. Consequently, all LARC methods, including the IUD, are associated with a pregnancy rate of about 1% or less; this rate is equal to or better than the rates seen with many forms of tubal sterilization, and it is superior to that seen with other methods, such as oral contraceptives, which have a contraceptive failure rate of about 9%.4
Finally, to correct disparities noted in this study that may be related particularly to access to contraceptive methods, the Affordable Care Act contains provisions that should lead to greater availability of contraceptive services in the United States.
—Ronald T. Burkman, MD
Share your thoughts! Send your Letter to the Editor to [email protected]. Please include your name and the city and state in which you practice.
- Finer LB, Henshaw SK. Disparities in rates of unintended pregnancy in the United States, 1994 and 2001. Perspect Sex Reprod Health. 2006;38(2):90–96.
- Use of highly effective contraceptives in the US continues to rise, with likely implications for declines in unintended pregnancy and abortion. New York: Guttmacher Institute, 2014. http://www.guttmacher.org/media/inthenews/2014/12/12/index.html. Published December 12, 2014. Accessed April 21, 2016.
- Sedgh G, Singh S, Hussain R. Intended and unintended pregnancies worldwide in 2012 and recent trends. Stud Fam Plann. 2014;45(3):301–314.
- Trussell J, Henry N, Hassan F, Prezioso A, Law A, Filonenko A. Burden of unintended pregnancy in the United States: potential savings with increased use of long-acting reversible contraception. Contraception. 2013;87(2):154-161.

Valve hemodynamic deterioration 2.5% at 1 year
CHICAGO – The incidence of valve hemodynamic deterioration in the first year after transcatheter aortic valve replacement is about 2.5%, but this event wasn’t clearly associated with adverse clinical outcomes out to 18 months of follow-up in an analysis of the large U.S. registry collaboratively maintained by the Society of Thoracic Surgeons and the American College of Cardiology.
“These findings, especially the patient and procedural predictors of valve hemodynamic deterioration we identified, may help to inform TAVR care, including patient selection, surveillance, and preventive strategies,” Dr. Sreekanth Vemulapalli reported at the annual meeting of the American College of Cardiology.

Recent reports have linked TAVR to subsequent development of leaflet abnormalities and valve thrombosis, with widely ranging estimates of incidence. Definitive answers as to the true rate of these adverse events and the underlying mechanisms will come from ongoing prospective studies using advanced imaging via four-dimensional CT or transesophageal echocardiography, but those studies will take years to complete, noted Dr. Vemulapalli of the Duke Clinical Research Institute in Durham, N.C.
In the meantime, he continued, the STS/ACC Transcatheter Valve Therapy Registry provides a unique opportunity to shed light on the incidence and consequences of valve hemodynamic deterioration (VHD) in real-world clinical practice. The registry includes all commercial TAVR procedures performed in the United States, with transthoracic echocardiograms obtained pre- and post-TAVR, at 30 days, and at 1 year after the procedure.
To examine the short- and longer-term rates of VHD, which Dr. Vemulapalli and his coinvestigators defined as an increase in the mean aortic valve gradient of 10 mm or more, the researchers assembled two separate patient cohorts. They comprised a short-term–risk group of 10,095 patients who underwent TAVR at 334 sites, with an incidence of VHD of 2.1% during the first 30 days after the procedure, and 3,175 patients at 254 sites, whose incidence of VHD from day 30 through 1 year post TAVR was 2.5%.
The combined rate of VHD and all-cause mortality during the first 30 days was 7.1%. For the long-term cohort, the combined endpoint rate from day 30 to 1 year was 23.5%.
Importantly, the occurrence of VHD was not associated with an excess of the composite endpoint of mortality, stroke, heart failure hospitalization, or aortic valve reintervention at 1 year in either the short- or long-term cohort. The same held true in an analysis covering the period of 12-18 months post TAVR, according to Dr. Vemulapalli.
In a multivariate analysis, the significant predictors of VHD in the short-term cohort were male sex; increased body mass index, with the risk rising stepwise with every additional 5 kg/m above normal weight; baseline severe chronic lung disease; a valve-in-valve procedure; a larger baseline aortic valve gradient; a TAVR valve size of 23 mm or less; and severe patient/prosthesis mismatch.
In the long-term cohort, the risk factors for VHD were hospital discharge on a factor Xa inhibitor and a larger predischarge aortic valve gradient.
Change in left ventricular ejection fraction over the course of the study bore no relation to VHD risk. Neither did which of the two commercially available TAVR valves a patient received.
This study was funded by the American College of Cardiology’s National Cardiovascular Data Registry. Dr. Vemulapalli reported serving as a consultant to Novella and Premiere and receiving research grants from the Agency for Healthcare Research and Quality, Boston Scientific, Abbott Vascular, and the ACC.
CHICAGO – The incidence of valve hemodynamic deterioration in the first year after transcatheter aortic valve replacement is about 2.5%, but this event wasn’t clearly associated with adverse clinical outcomes out to 18 months of follow-up in an analysis of the large U.S. registry collaboratively maintained by the Society of Thoracic Surgeons and the American College of Cardiology.
“These findings, especially the patient and procedural predictors of valve hemodynamic deterioration we identified, may help to inform TAVR care, including patient selection, surveillance, and preventive strategies,” Dr. Sreekanth Vemulapalli reported at the annual meeting of the American College of Cardiology.
Recent reports have linked TAVR to subsequent development of leaflet abnormalities and valve thrombosis, with widely ranging estimates of incidence. Definitive answers as to the true rate of these adverse events and the underlying mechanisms will come from ongoing prospective studies using advanced imaging via four-dimensional CT or transesophageal echocardiography, but those studies will take years to complete, noted Dr. Vemulapalli of the Duke Clinical Research Institute in Durham, N.C.
In the meantime, he continued, the STS/ACC Transcatheter Valve Therapy Registry provides a unique opportunity to shed light on the incidence and consequences of valve hemodynamic deterioration (VHD) in real-world clinical practice. The registry includes all commercial TAVR procedures performed in the United States, with transthoracic echocardiograms obtained pre- and post-TAVR, at 30 days, and at 1 year after the procedure.
To examine the short- and longer-term rates of VHD, which Dr. Vemulapalli and his coinvestigators defined as an increase in the mean aortic valve gradient of 10 mm or more, the researchers assembled two separate patient cohorts. They comprised a short-term–risk group of 10,095 patients who underwent TAVR at 334 sites, with an incidence of VHD of 2.1% during the first 30 days after the procedure, and 3,175 patients at 254 sites, whose incidence of VHD from day 30 through 1 year post TAVR was 2.5%.
The combined rate of VHD and all-cause mortality during the first 30 days was 7.1%. For the long-term cohort, the combined endpoint rate from day 30 to 1 year was 23.5%.
Importantly, the occurrence of VHD was not associated with an excess of the composite endpoint of mortality, stroke, heart failure hospitalization, or aortic valve reintervention at 1 year in either the short- or long-term cohort. The same held true in an analysis covering the period of 12-18 months post TAVR, according to Dr. Vemulapalli.
In a multivariate analysis, the significant predictors of VHD in the short-term cohort were male sex; increased body mass index, with the risk rising stepwise with every additional 5 kg/m above normal weight; baseline severe chronic lung disease; a valve-in-valve procedure; a larger baseline aortic valve gradient; a TAVR valve size of 23 mm or less; and severe patient/prosthesis mismatch.
In the long-term cohort, the risk factors for VHD were hospital discharge on a factor Xa inhibitor and a larger predischarge aortic valve gradient.
Change in left ventricular ejection fraction over the course of the study bore no relation to VHD risk. Neither did which of the two commercially available TAVR valves a patient received.
This study was funded by the American College of Cardiology’s National Cardiovascular Data Registry. Dr. Vemulapalli reported serving as a consultant to Novella and Premiere and receiving research grants from the Agency for Healthcare Research and Quality, Boston Scientific, Abbott Vascular, and the ACC.
AT ACC 16
Key clinical point: The incidence of valve hemodynamic deterioration after transaortic valve replacement is 2.5% from day 30 through 12 months post procedure.
Major finding: Patients who experienced valve hemodynamic deterioration had a rate of adverse clinical outcomes similar to those without valve deterioration.
Data source: This was a retrospective study of 18-month outcomes in the Society of Thoracic Surgeons/American College of Cardiology Transcatheter Valve Therapy Registry, which covers all commercial transcatheter valve replacements done in the United States.
Disclosures: This study was funded by the American College of Cardiology’s National Cardiovascular Data Registry. The presenter reported serving as a consultant to Novella and Premiere and receiving research grants from the Agency for Healthcare Research and Quality, Boston Scientific, Abbott Vascular, and the ACC.

Stand up for research benefiting our patients, and more

Focus on decreasing unintended pregnanciesI found the letters in response to Dr. Barbieri’s Editorial on inadequate contraception to be much overwrought. Dr. Will’s suggestion to have “automatic contraception … for all reproductive-age women including ‘children’ who are … menstruating” is excessive. Shouldn’t parents have the final decision making in their minor children’s health care?
An anonymous clinician ex-presses frustration with a Catholichealth care system for not allowing prescription of contraceptives, which does actually stay true to the religious beliefs of the institution, and proposes decreased reimbursements to these facilities across the board as a form of financial punishment for these practices. Not only would that be illegal and unconstitutional but it also demonstrates a lack of understanding of our First Amendment protections.
Overall, these letters and Dr. Barbieri’s response show a very narrow understanding of the issues involved. I think we can and should be focused on decreasing unintended pregnancies while also respecting the rights of all without resorting to Draconian and totalitarian solutions.
Myles Dotto, MD
Oradell, New Jersey
Dr. Barbieri respondsI share Dr. Dotto’s concern that government mandates regarding health care are potentially very dangerous. It is better for communities of clinicians and patients to develop optimal approaches to health care, without government interference.
“THE CRUSHING OF INNOVATION FOR TREATING FEMALE PELVIC FLOOR DISORDERS: A STORY OF ‘LEAD OR BE LED’”ANDREW CASSIDENTI, MD (GUEST EDITORIAL; APRIL 2016)Stand up for research benefiting our patientsI salute Dr. Cassidenti’s courage to call surgeons and the respective professional organizations to step up to defend the research and expose inappropriate expert testimony. We should be ashamed to be scattered like dogs because of fear and lack of courage to be advocates for what is in the best interest of our patients. Please continue the campaign to encourage physicians and surgeons to stand up.
Cleve Waters, MD
Chattanooga, Tennessee
Caving to class action litigation is a mistakeIn his Guest Editorial Dr. Cassidenti clarifies the importance of looking forward regarding mesh devices for pelvic organ prolapse (POP) treatment. As an advocate for women with POP and Founder/Executive Director of the Association for Pelvic Organ Prolapse Support—a US-based 501(c)(3)advocacy agency with global arms focused on generating awareness of POP and providing guidance and support to women navigating POP treatment—I found Endo International’s decision to close its Astora Women’s Health division extremely unsettling.
The nature of medicine is to continually advance, and that includes learning from experience and recognizing paths to evolution. Caving to class action litigation is a mistake. Research findings frequently indicate that up to half of the female population will experience POP and/or comorbid conditions.1 It is imperative that health care, industry, research, academia, policy, and advocacy agencies continue to shine a light on this much needed field in women’s health.
Sherrie Palm
Milwaukee, Wisconsin
Reference
- Barber MD, Maher C. Epidemiology and outcome assessment of pelvic organ prolapse. Int Urogynecol J. 2013;24(11):1783–1790.
Avoidance: the greatest tool to address shoulder dystociaAlthough avoiding endometrial injury at cesarean delivery, including the possibility of later pathologic implantation, can be attained with vaginal delivery, vaginal birth at all cost leads to a dangerous situation. The emergency environment of shoulder dystocia is not a preferable or safer stratagem.
It is granted that shoulder dystocia will happen at some point but avoidance, by employing cesarean delivery when it is indicated, is the greatest tool for addressing this very dangerous problem.
J. Michael Arnold, MD
Oconto Falls, Wisconsin
Another suggestion for shoulder dystociaMy senior partner taught me a technique that works well, although I do not know its name. After suprapubic and McRoberts maneuvers fail and the shoulders do not deliver with gentle downward guidance in one direction, I rotate the head 180° and try again. Usually this works. I have taught this technique to several midwives, and they swear by it.
Annette Fineberg, MD
Davis, California
Dr. Barbieri respondsI thank Drs. Arnold and Fineberg for sharing their perspective and experience with our readers. Dr. Arnold notes that recommending cesarean delivery in high-risk situations such as cases in which the mother has diabetes and the fetus is macrosomic would surely reduce the frequency of shoulder dystocia. I respect Dr. Fineberg’s recommendation, based on extensive clinical experience, that by rotating the fetal head the shoulder dystocia may be resolved. My concern with this technique is that the torque transmitted to the neck might cause fetal damage. I think that rotating the shoulders (Rubin or Wood maneuver) would be less likely to result in fetal injury.
Share your thoughts! Send your Letter to the Editor to [email protected]. Please include your name and the city and state in which you practice.

Examining the fetal origins of obesity
The figures and trends behind the obesity epidemic are alarming: More than one-third of all adults in the United States are obese, as are 34% of women aged 20-39, and 17% of youth aged 2-19, according to data for 2011-2014 from the National Health and Nutrition Examination Survey.
In our ob.gyn. practices, many of us have witnessed the significant climb in national obesity rates over the past several decades. We’ve seen a continued increase in the prevalence of obesity among childbearing women, and a steady increase in the incidence of high-birth-weight babies. The percentage of women weighing 200 pounds has more than doubled since 1980, and up to 3-4 times as many children and teens in various age subsets are obese today as in the 1970s.

The obesity epidemic is often attributed to a high-fat and/or calorie-dense diet and decreased activity levels. However, this is only part of the picture. There has been growing recognition in recent years that obesity may be programmed by the in utero and newborn environment, particularly as it relates to nutritional permutations. We now have evidence, in fact, that developmental programming is likely a primary cause of the obesity epidemic.
Exposure to maternal obesity and being born with a low birth weight – especially a low birth weight paired with rapid catch-up growth – are both associated with a significantly increased risk of childhood and adult obesity.
Research has demonstrated that newborns may be programmed, in both of these scenarios, with an increased appetite and a predisposition to storing calories as fat. In addition, data are accumulating that exposure to bisphenol A and other endocrine-disruptive chemicals, other environmental toxins, and corticosteroids may exert similar programming effects.
This window into the origins of obesity has significant implications for the practice of ob.gyn., where we have the opportunity to address the programming effects of the in utero and early life environment. Most importantly, we must counsel women before pregnancy about the importance of losing weight, guide them during pregnancy to achieve optimal pregnancy nutrition and weight gain, and prepare them to adopt optimal newborn feeding strategies that will guard against overconsumption.
Programming of obesity
The current obesity epidemic is only minimally due to genetics. Although select genetic mutations may be associated with obesity, these mutations account for an exceedingly small proportion of the obese population. Instead, much of the obesity epidemic involves epigenetic change – in this case, largely epigenetic deregulation of gene expression – and more broadly what we call gestational, or developmental, programming.
Developmental programming is a process by which a stress or stimulus at a critical or sensitive period of development has long-term effects. The major part of the developmental process pertaining to cell division occurs during intrauterine life; more than 90% of the cell divisions necessary to make an adult human occur before birth. Although there are important effects of the early newborn period, developmental programming is therefore largely gestational programming. Depending on when an in utero stress or perturbation occurs, it may permanently change cell number and/or cell differentiation, organ structure, metabolic set points, and gene expression.

The late physician Dr. David Barker got us thinking about in utero programming when he demonstrated an association between low birth weight, rapid weight gain in early life, and adult cardiovascular mortality. His theory about how nutrition and growth before birth may affect cardiovascular health later on, as well as other adult chronic diseases and conditions, became known as the Barker Hypothesis.
Many studies, both animal research and human epidemiological studies, have since confirmed and expanded our understanding of this phenomena. Research has demonstrated associations, for instance, between low birth weight and later risks of insulin resistance, diabetes, fatty liver, and the often-underlying metabolic syndrome.
Obesity is also central to the development of the metabolic syndrome, and we now have irrefutable evidence to show that low birth weight infants have a higher risk of obesity than do normal weight infants. We also know, as Dr. Barker and his colleagues had surmised, that the greatest risks occur when there is rapid catch-up growth of low-birth-weight infants in the early years of life.
Moreover, we now understand that maternal obesity has programming effects that are similar to those of an in utero environment of undernutrition and growth restriction. In the past several decades, the marked increase in maternal obesity has resulted in this programming process having an ever-increasing impact.
Both animal and human studies have shown that infants born to obese mothers have the same increased risks for adult chronic disease – including the risk of becoming obese – as those of low birth weight infants. This increased risk is often, but not always, associated with high birth weight, and it is independent of whether the mother has gestational diabetes mellitus (GDM). Having a high birth weight is more likely in the setting of maternal obesity and itself raises the risk of eventual obesity (as does GDM), but an infant’s exposure to maternal obesity in and of itself is a risk factor.
The mechanisms
The programming mechanisms that predispose offspring to obesity are similar in infants of obese mothers and intrauterine growth restricted newborns, though they involve different epigenetic signals. Both involve dysregulation of appetite/satiety and of adipogenesis.
Appetite is primarily controlled by a complex circuit of neurons in the hypothalamus of the brain called the hypothalamic arcuate nucleus. Some neurons are orexigenic and stimulate or increase appetite, while others are anorexigenic and suppress appetite by promoting satiety.
During fetal development, hypothalamic neural stem cells proliferate and differentiate into various cell types. Neurons destined for the arcuate nucleus then differentiate into these so-called appetite neurons and satiety neurons. Though there is continued neural development and maturation during newborn life, hypothalamic control of appetite and satiety is largely set during this period.
Differentiation to appetite or satiety neurons is regulated by a complex interplay of pathways that may be significantly altered by the nutrient environment. Research in our laboratory and others has shown that both limited and excess nutrition can program the structure and function of the arcuate nucleus – changing its wiring, in essence – such that there is an increased ratio of appetite to satiety neurons (Clin Obstet Gynecol. 2013 Sep;56[3]:529-36).
There also appears to be a programmed down-regulation in the reward pathway of the brain, and some studies have shown that children of obese mothers and children who were born with low birth weights have a higher preference for sweet and high-calorie foods. This all begins at the neural stem cell level.

With more appetite neurons and fewer satiety neurons, as well as a down-regulation of reward – and an abundance of available food – a newborn is at high risk of becoming obese. Eating for this child will not only be pleasurable; it will be driven by an enhanced appetite, an inability to feel full after reasonable amounts of food, and a down-regulation of reward (potentially requiring greater amounts of food or a shift in preference for high fat/sweet food to achieve the pleasure from eating).
In addition to alterations in appetite/satiety, the nutrition environment in utero can alter adipose tissue development and function.
Like neural development, adipogenesis – the process by which preadipocytes proliferate and differentiate into mature adipocytes – is tightly regulated by a cascade of transcription factors that are expressed in response to stimuli, including nutrients. In animal studies we have found an up-regulation of adipogenic and lipogenic transcription factors in intrauterine growth restricted offspring as well as in offspring of obese mothers (Reprod Sci. 2008 Oct;15[8]:785-96 and Curr Diab Rep. 2013 Feb;13[1]:27-33).
This up-regulation leads to greater proliferation of preadipocytes and greater lipid synthesis and storage in mature adipocytes. Not only will the newborn have an increased number of adipocytes, but he or she will have an increased number of hypertrophic lipid-filled fat cells. The enhanced adipogenesis will contribute to the newborn’s programmed propensity for obesity, and the directive to “just eat less” will likely be ineffective throughout childhood and beyond.
Programmed offspring are resistant to both central and peripheral effects of leptin and insulin, resulting in impaired satiety (i.e., overeating) and manifestations of GDM. Responses to an array of additional energy regulatory factors (e.g., ghrelin) demonstrate a similar programmed dysfunction.
In practice
There are several approaches that ob.gyns. can take to prevent childhood and lifelong obesity. Most importantly, we must counsel our obese patients to lose weight before pregnancy. In doing so, it may be meaningful and effective to ask the patient to think about her baby’s future as an obese adult.
Patients who have experienced the challenges of trying to lose weight, and who are told about the developmental origins of obesity and how obesity can be programmed, may be more motivated to lose weight to avoid passing on to their children the burden and challenges that they’ve experienced. We can tell obese patients that their children may well be predisposed through the current in utero environment to have an increased appetite and a propensity to store body fat, and that they subsequently will face higher risks of diabetes and other serious chronic conditions.
We should also appropriately counsel women on healthy weight gain during pregnancy, and urge them not to gain excessive weight.
Newborn feeding strategies are also important for babies exposed to gestational programming of obesity, but especially small babies given the high risk of obesity when there is rapid catch-up growth. We must encourage good growth of both the low-birth-weight and macrosomic infant during the newborn period, but not overgrowth.
The importance of breastfeeding cannot be overestimated, as it has been demonstrated to reduce the occurrence of excessive newborn weight gain and improve long term infant health. We should encourage breastfeeding for the natural opportunity it provides to avoid excessive feeding, in addition to its other benefits. And for newborns who are bottle fed, we should counsel the new mother on optimal feeding and strategies for comforting a crying baby, which will protect against overfeeding.
Regarding environmental exposures, this area of developmental programming is continuing to evolve at a rapid rate. Both animal research and epidemiological studies support the association of developmental exposure to BPA and other chemicals with obesity.
For the present, we should educate our patients regarding optimal nutrition prior to and during pregnancy, and the avoidance of potentially toxic or metabolically-active chemicals or drugs. We look forward to continued research into the mechanisms and preventive/therapeutic strategies for optimization of childhood and adult health.
Dr. Ross is professor of obstetrics and gynecology at the University of California, Los Angeles. Dr. Desai is assistant professor of ob.gyn. at the university. They reported having no relevant financial disclosures.
The figures and trends behind the obesity epidemic are alarming: More than one-third of all adults in the United States are obese, as are 34% of women aged 20-39, and 17% of youth aged 2-19, according to data for 2011-2014 from the National Health and Nutrition Examination Survey.
In our ob.gyn. practices, many of us have witnessed the significant climb in national obesity rates over the past several decades. We’ve seen a continued increase in the prevalence of obesity among childbearing women, and a steady increase in the incidence of high-birth-weight babies. The percentage of women weighing 200 pounds has more than doubled since 1980, and up to 3-4 times as many children and teens in various age subsets are obese today as in the 1970s.
The obesity epidemic is often attributed to a high-fat and/or calorie-dense diet and decreased activity levels. However, this is only part of the picture. There has been growing recognition in recent years that obesity may be programmed by the in utero and newborn environment, particularly as it relates to nutritional permutations. We now have evidence, in fact, that developmental programming is likely a primary cause of the obesity epidemic.
Exposure to maternal obesity and being born with a low birth weight – especially a low birth weight paired with rapid catch-up growth – are both associated with a significantly increased risk of childhood and adult obesity.
Research has demonstrated that newborns may be programmed, in both of these scenarios, with an increased appetite and a predisposition to storing calories as fat. In addition, data are accumulating that exposure to bisphenol A and other endocrine-disruptive chemicals, other environmental toxins, and corticosteroids may exert similar programming effects.
This window into the origins of obesity has significant implications for the practice of ob.gyn., where we have the opportunity to address the programming effects of the in utero and early life environment. Most importantly, we must counsel women before pregnancy about the importance of losing weight, guide them during pregnancy to achieve optimal pregnancy nutrition and weight gain, and prepare them to adopt optimal newborn feeding strategies that will guard against overconsumption.
Programming of obesity
The current obesity epidemic is only minimally due to genetics. Although select genetic mutations may be associated with obesity, these mutations account for an exceedingly small proportion of the obese population. Instead, much of the obesity epidemic involves epigenetic change – in this case, largely epigenetic deregulation of gene expression – and more broadly what we call gestational, or developmental, programming.
Developmental programming is a process by which a stress or stimulus at a critical or sensitive period of development has long-term effects. The major part of the developmental process pertaining to cell division occurs during intrauterine life; more than 90% of the cell divisions necessary to make an adult human occur before birth. Although there are important effects of the early newborn period, developmental programming is therefore largely gestational programming. Depending on when an in utero stress or perturbation occurs, it may permanently change cell number and/or cell differentiation, organ structure, metabolic set points, and gene expression.
The late physician Dr. David Barker got us thinking about in utero programming when he demonstrated an association between low birth weight, rapid weight gain in early life, and adult cardiovascular mortality. His theory about how nutrition and growth before birth may affect cardiovascular health later on, as well as other adult chronic diseases and conditions, became known as the Barker Hypothesis.
Many studies, both animal research and human epidemiological studies, have since confirmed and expanded our understanding of this phenomena. Research has demonstrated associations, for instance, between low birth weight and later risks of insulin resistance, diabetes, fatty liver, and the often-underlying metabolic syndrome.
Obesity is also central to the development of the metabolic syndrome, and we now have irrefutable evidence to show that low birth weight infants have a higher risk of obesity than do normal weight infants. We also know, as Dr. Barker and his colleagues had surmised, that the greatest risks occur when there is rapid catch-up growth of low-birth-weight infants in the early years of life.
Moreover, we now understand that maternal obesity has programming effects that are similar to those of an in utero environment of undernutrition and growth restriction. In the past several decades, the marked increase in maternal obesity has resulted in this programming process having an ever-increasing impact.
Both animal and human studies have shown that infants born to obese mothers have the same increased risks for adult chronic disease – including the risk of becoming obese – as those of low birth weight infants. This increased risk is often, but not always, associated with high birth weight, and it is independent of whether the mother has gestational diabetes mellitus (GDM). Having a high birth weight is more likely in the setting of maternal obesity and itself raises the risk of eventual obesity (as does GDM), but an infant’s exposure to maternal obesity in and of itself is a risk factor.
The mechanisms
The programming mechanisms that predispose offspring to obesity are similar in infants of obese mothers and intrauterine growth restricted newborns, though they involve different epigenetic signals. Both involve dysregulation of appetite/satiety and of adipogenesis.
Appetite is primarily controlled by a complex circuit of neurons in the hypothalamus of the brain called the hypothalamic arcuate nucleus. Some neurons are orexigenic and stimulate or increase appetite, while others are anorexigenic and suppress appetite by promoting satiety.
During fetal development, hypothalamic neural stem cells proliferate and differentiate into various cell types. Neurons destined for the arcuate nucleus then differentiate into these so-called appetite neurons and satiety neurons. Though there is continued neural development and maturation during newborn life, hypothalamic control of appetite and satiety is largely set during this period.
Differentiation to appetite or satiety neurons is regulated by a complex interplay of pathways that may be significantly altered by the nutrient environment. Research in our laboratory and others has shown that both limited and excess nutrition can program the structure and function of the arcuate nucleus – changing its wiring, in essence – such that there is an increased ratio of appetite to satiety neurons (Clin Obstet Gynecol. 2013 Sep;56[3]:529-36).
There also appears to be a programmed down-regulation in the reward pathway of the brain, and some studies have shown that children of obese mothers and children who were born with low birth weights have a higher preference for sweet and high-calorie foods. This all begins at the neural stem cell level.
With more appetite neurons and fewer satiety neurons, as well as a down-regulation of reward – and an abundance of available food – a newborn is at high risk of becoming obese. Eating for this child will not only be pleasurable; it will be driven by an enhanced appetite, an inability to feel full after reasonable amounts of food, and a down-regulation of reward (potentially requiring greater amounts of food or a shift in preference for high fat/sweet food to achieve the pleasure from eating).
In addition to alterations in appetite/satiety, the nutrition environment in utero can alter adipose tissue development and function.
Like neural development, adipogenesis – the process by which preadipocytes proliferate and differentiate into mature adipocytes – is tightly regulated by a cascade of transcription factors that are expressed in response to stimuli, including nutrients. In animal studies we have found an up-regulation of adipogenic and lipogenic transcription factors in intrauterine growth restricted offspring as well as in offspring of obese mothers (Reprod Sci. 2008 Oct;15[8]:785-96 and Curr Diab Rep. 2013 Feb;13[1]:27-33).
This up-regulation leads to greater proliferation of preadipocytes and greater lipid synthesis and storage in mature adipocytes. Not only will the newborn have an increased number of adipocytes, but he or she will have an increased number of hypertrophic lipid-filled fat cells. The enhanced adipogenesis will contribute to the newborn’s programmed propensity for obesity, and the directive to “just eat less” will likely be ineffective throughout childhood and beyond.
Programmed offspring are resistant to both central and peripheral effects of leptin and insulin, resulting in impaired satiety (i.e., overeating) and manifestations of GDM. Responses to an array of additional energy regulatory factors (e.g., ghrelin) demonstrate a similar programmed dysfunction.
In practice
There are several approaches that ob.gyns. can take to prevent childhood and lifelong obesity. Most importantly, we must counsel our obese patients to lose weight before pregnancy. In doing so, it may be meaningful and effective to ask the patient to think about her baby’s future as an obese adult.
Patients who have experienced the challenges of trying to lose weight, and who are told about the developmental origins of obesity and how obesity can be programmed, may be more motivated to lose weight to avoid passing on to their children the burden and challenges that they’ve experienced. We can tell obese patients that their children may well be predisposed through the current in utero environment to have an increased appetite and a propensity to store body fat, and that they subsequently will face higher risks of diabetes and other serious chronic conditions.
We should also appropriately counsel women on healthy weight gain during pregnancy, and urge them not to gain excessive weight.
Newborn feeding strategies are also important for babies exposed to gestational programming of obesity, but especially small babies given the high risk of obesity when there is rapid catch-up growth. We must encourage good growth of both the low-birth-weight and macrosomic infant during the newborn period, but not overgrowth.
The importance of breastfeeding cannot be overestimated, as it has been demonstrated to reduce the occurrence of excessive newborn weight gain and improve long term infant health. We should encourage breastfeeding for the natural opportunity it provides to avoid excessive feeding, in addition to its other benefits. And for newborns who are bottle fed, we should counsel the new mother on optimal feeding and strategies for comforting a crying baby, which will protect against overfeeding.
Regarding environmental exposures, this area of developmental programming is continuing to evolve at a rapid rate. Both animal research and epidemiological studies support the association of developmental exposure to BPA and other chemicals with obesity.
For the present, we should educate our patients regarding optimal nutrition prior to and during pregnancy, and the avoidance of potentially toxic or metabolically-active chemicals or drugs. We look forward to continued research into the mechanisms and preventive/therapeutic strategies for optimization of childhood and adult health.
Dr. Ross is professor of obstetrics and gynecology at the University of California, Los Angeles. Dr. Desai is assistant professor of ob.gyn. at the university. They reported having no relevant financial disclosures.