User login
Robotic vascular surgery: Ready for prime time?
A single-center experience using the da Vinci robotic system to perform vascular procedures demonstrated the safety and feasibility of this technique in different areas of vascular surgery.
Dr. Petr Štádler and his colleagues at the No Homolce Hospital in Prague reported on 310 robotic-assisted vascular procedures performed between November 2005 and May 2014 with the aid of the da Vinci system. They concluded that robotic-assisted vascular procedures added to the speed and relative simplicity of construction of vascular anastomoses.
The patient cohort had procedures consisting of 224 robotic occlusive disease treatments (group 1), 65 robotic aorto-illiac aneurysm surgeries (group II), and 21 other robotic procedures (group III) as reported online in the European Journal of Vascular and Endovascular Surgery (2016. doi: 10.1016/j.ejvs.2016.02.016).
A total of 298 cases (96.1%) were successfully completed robotically, with conversion required in 10 cases; 2 patients were inoperable. The overall 30-day mortality rate was 0.3% for the entire cohort, and only two (0.6%) late prosthetic infections were seen. The median operating time was 204 min, the median anastomosis time was 29 min, and median blood loss was 571 mL.
In comparing groups I and II, group I required an operative time of 194 min, compared with 253 min in group II. Mean aortic cross-clamp time was 37 min in group I and 93 min in group II, while the mean blood loss was greater in group II (1,210 mL) as compared with group 1 (320 mL).
“The robotic system provides a real opportunity for minimally invasive surgery in the field of vascular surgery ... with all its advantages. Robotic AAA [abdominal aortic aneurysm] and aortofemoral bypass represent the standard operations in vascular surgery and they are not only possible, but safe and effective,” said Dr. Štádler and his colleagues. They added, however, that “further randomized studies are needed to ensure its benefits and the cost-effectiveness of robotic vascular surgery, compared with open and laparoscopic repair.”
Dr, Štádler and his colleagues reported that they had no disclosures.
When we examine the data presented by the authors of this paper closely, we see vast differences between the group I patients (bypasses for aortoiliac occlusive disease) and the group II patients (repair of aortoiliac aneurysms). In the occlusive group (group I), the operative time averaged 194 minutes. However, in the aneurysm group, the surgical repair of an aneurysm took over 4 hours. Another broad discrepancy between groups I and II is evident in examining cross-clamp time. In the occlusive group, the cross-clamp was 37 minutes; however, aneurysm patients required 93 minutes of cross-clamp to complete the proximal anastomosis. Similar disparities are seen in mean blood loss. Patients with occlusive disease lost an average of 320 mL of blood, while aneurysm patients lost 1,210 mL

|
Dr. Mark A. Adelman |
The authors have been clever in combining these two groups as a single cohort.
However, I might argue that by segregating the groups, we might find that occlusive disease is well treated with robotically assisted surgery, but aneurysm repair should be left to open or endovascular techniques.
In addition to the data disparities, there are several practical limitations to performing robotic aortic surgery. Learning robotic techniques requires significant additional surgical training that is typically not within the skill set of a vascular surgeon. Who will devote the time and resources toward training vascular surgeons? Presently, there are increased hardware and operating room times associated with robotic-assisted surgeries. Because of the bulkiness of the robotic system and need for space for mechanical arms, large operating rooms must be utilized to perform robotic procedures.
Although I have not performed robotic surgery, I understand the tactile feedback, or haptics are significantly reduced when operating with the robot. Lastly, during this era of value-based medicine, is robotic surgery too expensive? The current cost of a robot approaches $2 million, and robotic arms have a limited life expectancy.
In summary, the authors have not demonstrated that this procedure is safe in aneurysm patients, or generalizable across all vascular surgeons given the lack of training paradigm. Further, robotic procedures are probably not cost effective in this very cost-sensitive health care environment. When I was training under Dr. Frank Cole Spencer in general surgery, he was fond of saying “just because you can teach a dog to ride a bicycle, it does not mean that you should.” As Dr. Juan Parodi will remind us, if the technology becomes more affordable, and changes significantly, we must all remain open minded. But currently, this technology is not yet ready for prime time. In its current state, this dog will not be learning to ride this robotic bike.
Dr. Mark A. Adelman is the Frank J. Veith, MD Professor, chief of vascular and endovascular surgery, and vice chair for strategy and business development, department of surgery, NYU Langone Medical Center, New York.
When we examine the data presented by the authors of this paper closely, we see vast differences between the group I patients (bypasses for aortoiliac occlusive disease) and the group II patients (repair of aortoiliac aneurysms). In the occlusive group (group I), the operative time averaged 194 minutes. However, in the aneurysm group, the surgical repair of an aneurysm took over 4 hours. Another broad discrepancy between groups I and II is evident in examining cross-clamp time. In the occlusive group, the cross-clamp was 37 minutes; however, aneurysm patients required 93 minutes of cross-clamp to complete the proximal anastomosis. Similar disparities are seen in mean blood loss. Patients with occlusive disease lost an average of 320 mL of blood, while aneurysm patients lost 1,210 mL
|
|
Dr. Mark A. Adelman |
The authors have been clever in combining these two groups as a single cohort.
However, I might argue that by segregating the groups, we might find that occlusive disease is well treated with robotically assisted surgery, but aneurysm repair should be left to open or endovascular techniques.
In addition to the data disparities, there are several practical limitations to performing robotic aortic surgery. Learning robotic techniques requires significant additional surgical training that is typically not within the skill set of a vascular surgeon. Who will devote the time and resources toward training vascular surgeons? Presently, there are increased hardware and operating room times associated with robotic-assisted surgeries. Because of the bulkiness of the robotic system and need for space for mechanical arms, large operating rooms must be utilized to perform robotic procedures.
Although I have not performed robotic surgery, I understand the tactile feedback, or haptics are significantly reduced when operating with the robot. Lastly, during this era of value-based medicine, is robotic surgery too expensive? The current cost of a robot approaches $2 million, and robotic arms have a limited life expectancy.
In summary, the authors have not demonstrated that this procedure is safe in aneurysm patients, or generalizable across all vascular surgeons given the lack of training paradigm. Further, robotic procedures are probably not cost effective in this very cost-sensitive health care environment. When I was training under Dr. Frank Cole Spencer in general surgery, he was fond of saying “just because you can teach a dog to ride a bicycle, it does not mean that you should.” As Dr. Juan Parodi will remind us, if the technology becomes more affordable, and changes significantly, we must all remain open minded. But currently, this technology is not yet ready for prime time. In its current state, this dog will not be learning to ride this robotic bike.
Dr. Mark A. Adelman is the Frank J. Veith, MD Professor, chief of vascular and endovascular surgery, and vice chair for strategy and business development, department of surgery, NYU Langone Medical Center, New York.
A single-center experience using the da Vinci robotic system to perform vascular procedures demonstrated the safety and feasibility of this technique in different areas of vascular surgery.
Dr. Petr Štádler and his colleagues at the No Homolce Hospital in Prague reported on 310 robotic-assisted vascular procedures performed between November 2005 and May 2014 with the aid of the da Vinci system. They concluded that robotic-assisted vascular procedures added to the speed and relative simplicity of construction of vascular anastomoses.
The patient cohort had procedures consisting of 224 robotic occlusive disease treatments (group 1), 65 robotic aorto-illiac aneurysm surgeries (group II), and 21 other robotic procedures (group III) as reported online in the European Journal of Vascular and Endovascular Surgery (2016. doi: 10.1016/j.ejvs.2016.02.016).
A total of 298 cases (96.1%) were successfully completed robotically, with conversion required in 10 cases; 2 patients were inoperable. The overall 30-day mortality rate was 0.3% for the entire cohort, and only two (0.6%) late prosthetic infections were seen. The median operating time was 204 min, the median anastomosis time was 29 min, and median blood loss was 571 mL.
In comparing groups I and II, group I required an operative time of 194 min, compared with 253 min in group II. Mean aortic cross-clamp time was 37 min in group I and 93 min in group II, while the mean blood loss was greater in group II (1,210 mL) as compared with group 1 (320 mL).
“The robotic system provides a real opportunity for minimally invasive surgery in the field of vascular surgery ... with all its advantages. Robotic AAA [abdominal aortic aneurysm] and aortofemoral bypass represent the standard operations in vascular surgery and they are not only possible, but safe and effective,” said Dr. Štádler and his colleagues. They added, however, that “further randomized studies are needed to ensure its benefits and the cost-effectiveness of robotic vascular surgery, compared with open and laparoscopic repair.”
Dr, Štádler and his colleagues reported that they had no disclosures.
FROM EUROPEAN JOURNAL OF VASCULAR AND ENDOVASCULAR SURGERY
Key clinical point: Robotic-assisted vascular surgery procedures appeared safe and provided benefits in speed and simplicity for vascular anastomoses.
Major finding: A total of 298 (96.1%) cases were successfully completed robotically, with a 30-day mortality of 0.3% and two (0.6%) late prosthetic infections seen.
Data source: A prospective study was performed assessing 310 robotic-assisted vascular procedures.
Disclosures: The authors reported that they had no disclosures.

10 tips for overcoming common challenges of intrapartum fetal monitoring
Interpreting continuous fetal heart rate (FHR) monitoring is one of the most common tasks obstetricians perform during the course of intrapartum care. Notably, many providers do not seek ongoing training to optimize their ability to reliably and accurately interpret the FHR. Yet FHR interpretation is one of the most frequent causes of litigation in the modern obstetric practice. Failure to interpret continuous FHR monitoring appropriately is estimated to account for 75% of obstetric-related litigation.1
Continuous FHR monitoring during labor was introduced to identify infants at risk for developing hypoxic-ischemic encephalopathy (HIE). The rate of HIE has not declined, however, despite almost universal adoption of continuous FHR monitoring.2 Numerous reasons account for this failure, including ad hoc interpretation of terminology, lack of standardized protocols for management and intervention, and the oftentimes challenging patterns that must be interpreted.3 The confusion about and dissatisfaction with the current state of FHR monitoring has led to attempts to enhance our ability to identify infants at risk with additional approaches (such as fetal pulse oximetry and fetal ST-segment evaluation), and some have called for a complete overhaul of our approach to interpreting the FHR. Clark and colleagues stated recently, "It is time to start over and establish some common language, standard interpretation, and reasonable management principles and guidelines."3
We must recognize that, as a stand-alone tool, continuous FHR monitoring is ineffective for avoiding preventable adverse outcomes. It is most likely to be effective when used in accordance with published standard guidelines by professionals skilled in interpretation and when timely, appropriate interventions are performed based on that interpretation. Optimal FHR monitoring requires a collaborative perinatal team that performs the monitoring correctly, interprets it appropriately, and communicates the findings effectively, and in a timely fashion, to all members of the care team when a high-risk pattern is detected.
In this article we review some common challenges that clinicians encounter during intrapartum FHR monitoring and we offer 10 simple tips to help overcome these challenges. The clinical scenarios described are derived from published reports in the medical literature, published malpractice claims, and from our personal experience working in a major health care system as part of a team charged with overseeing ongoing certification and training of labor and delivery nurses.
Challenge: Signal ambiguity
CASE 1 Young woman in labor with first pregnancy
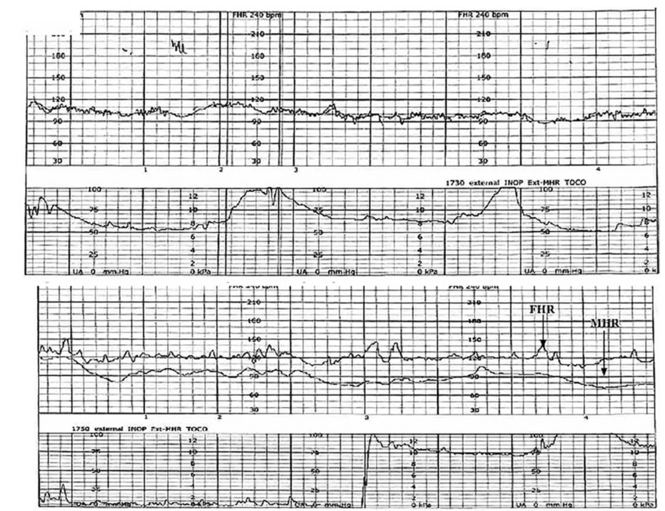
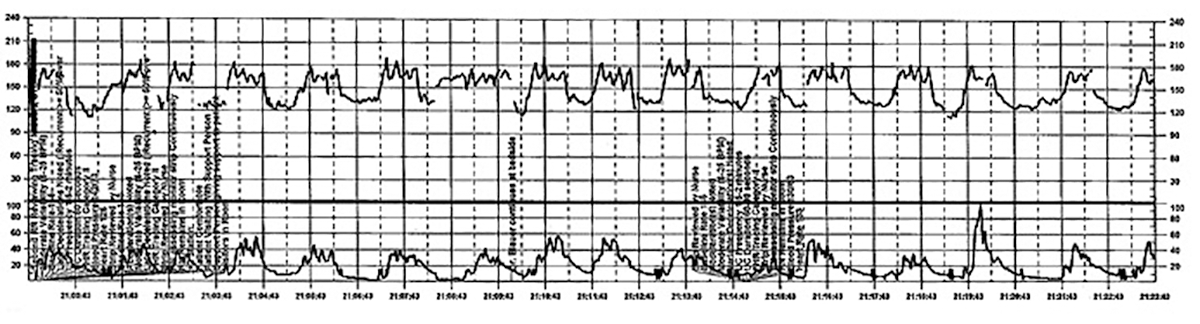
A 19-year-old woman presents in spontaneous labor with her first pregnancy, which has been uncomplicated. During the course of her care, it is noted that the FHR changes to a lower baseline than previously recorded. Evaluation reveals that the external monitor is tracking the maternal heart rate and not the FHR (FIGURE 1). After the monitor is adjusted, both the fetal and maternal rates are documented for a short period. Ultimately, continuous monitoring of the maternal heart rate is discontinued. After delivery of the infant several hours later, it is noted that the FHR continues to register on the monitor, and it is determined that for the last few hours the maternal heart rate has been traced.
| FIGURE 1 FHR tracing indicates signal ambiguity | ||
| ||
As described in Case 1, the upper panel of this tracing demonstrates the maternal heart rate confused as the fetal heart rate, while the segment in the lower panel shows a clear distinction between the maternal and fetal heart rates. | ||
TIP #10: Ensure the FHR monitor is tracking the fetal, not the maternal, heart rate
Confusing the maternal and the fetal heart rate with external cardiotocography is common. When the mix-up is noted and corrected expeditiously, it is unlikely to result in an adverse outcome. Signal ambiguity may arise from faulty Doppler equipment or the inability of the cardiotocograph to differentiate between maternal and fetal heart rates. It commonly occurs after repositioning the patient, after fetal movement, or during pushing in the second stage when the maternal heart rate may increase to a baseline that is similar to that of the fetus.
Signal ambiguity should be suspected when the FHR runs in the low-normal range or when FHR accelerations are noted with greater than 50% of contractions (especially when pushing).4 Signal ambiguity also should be ruled out when there is an apparent FHR deceleration to the maternal range that does not recover.
Evaluating for suspected signal ambiguity involves 2 key steps: (1) documentation and verification of the maternal heart rate and (2) definitive documentation of the true FHR. To document the maternal heart rate, manually count the radial pulse for 1 minute or use a pulse oximeter for continuous monitoring. Using a pulse oximeter is a less labor-intensive approach and has the advantage of allowing continuous assessment of the maternal heart rate for comparison. Recording the maternal pulse continuously on the same screen as the FHR enables ongoing differentiation of the mother and fetus in difficult cases, particularly if internal fetal monitoring is not an option (because of maternal infectious disease, low suspicion for an abnormal FHR pattern, or strong maternal preference against internal monitoring, for example).
When clinically appropriate, use of a fetal scalp electrode (FSE) can document the FHR. If intrauterine fetal death has occurred, however, the FSE may transmit the maternal heart rate.5 Using ultrasonography to confirm the FHR prior to placing the FSE is a reliable method of definitive differentiation. If a newly placed FSE shows a clear differentiation of 5 to 10 beats per minute from a continuously assessed maternal pulse rate, then this is also a reliable way to assure that the FHR monitoring represents the fetus, particularly if ultrasonography is not immediately available.
Ultimately, before intervening based on an abnormal FHR tracing, it is paramount to confirm that the data are adequate for interpretation and represent the actual FHR. If signal ambiguity is identified or suspected, correct it by using ultrasonography to locate the FHR and replace the external monitor until a rate that is at least 5 to 10 beats per minute different from the maternal rate is obtained. Alternatively, this is an indication for internal fetal monitoring with an FSE.
Challenge: Inadequate FHR tracing, poor communication, lack of clinical context
CASE 2 Woman with uncomplicated postdates pregnancy presents for induction
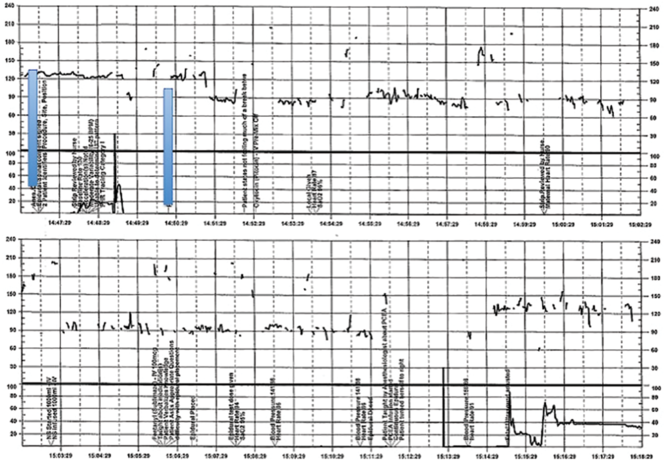
A 28-year-old woman (G3P2) at 41 weeks 0 days of gestation presents to labor and delivery for induction of labor for the indication of postdates. There have been no complications with the current pregnancy. The initial cervical exam reveals 1+ cm dilation, 90% effacement, and −3 station, and the patient is started on oxytocin per the hospital protocol. What is your interpretation of the continuous FHR tracing shown in FIGURE 2?
| FIGURE 2 Inadequate, uninterpretable FHR tracing | ||
| ||
This FHR tracing, from the patient described in Case 2, is unusable because of the absence of data. | ||
TIP #9: Check that the monitors are providing useful data
The ability to accurately interpret a continuous FHR tracing depends on the quality of data recorded. Unfortunately, the absence of data makes interpretation impossible. This includes both FHR and tocometry data, since both pieces of information are required for appropriate interpretation of a continuous FHR tracing.
Prolonged periods of uninterpretable FHR and uterine activity tracings imply that no one was attending the mother and fetus.6 If it is difficult to obtain an interpretable FHR tracing, document in the medical record that you made ongoing efforts to maintain an adequate tracing, including the amount of time spent holding the external monitor, use of ultrasonography to document the FHR, and plans for potential internal monitoring.
CASE 2 Continued
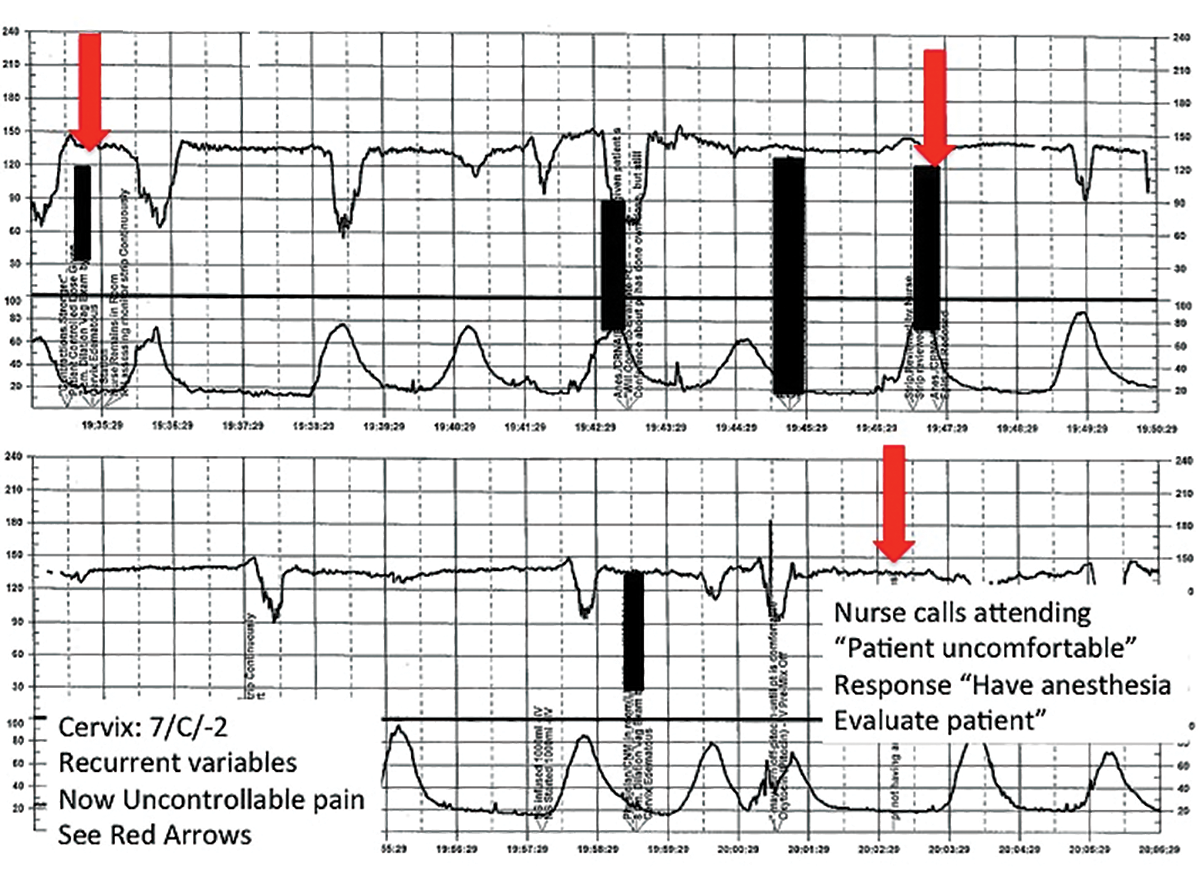
After several hours, the patient requests an epidural for pain management and one is placed without difficulty. She reports adequate pain relief and is comfortable for the next 1 to 2 hours. Subsequently, the patient reports a sudden onset of increasing pain that does not respond to additional patient-administered doses of anesthesia over a 30-minute period. The labor and delivery nurse becomes concerned about the patient's pain level and contacts the attending physician to discuss her concerns. The physician, who is currently attending to patients in clinic, listens to the nurse and asks her to contact the anesthesia department with her concerns (FIGURE 3).
| FIGURE 3 FHR tracing reveals recurrent variables in a patient with evolving clinical concerns | ||
| ||
This tracing, from the patient described in Case 2, shows variables in the FHR while the patient experiences increasing discomfort. Each of the red arrows indicates documentation by the nurse of increasing pain reported by the patient. The black bars are used to cover names of caregivers. | ||
TIP #8: Clearly communicate an urgent situation to the care team
Poor communication underlies many preventable adverse outcomes in medicine.7 Effective communication requires an adequate description of the clinical scenario or problem. A root cause analysis of a series of intrapartum adverse events involving fetal death or injury showed that poor communication about a concerning FHR tracing played a role in 72% of cases.1
In this clinical scenario, the nurse believed that the patient's pain level was unusual or more than anticipated. The person who is communicating his or her concern (the sender) must be sure that the person receiving the message (the responder) clearly understands the sender's level of concern. In this case, it would have been appropriate for the sender to state clearly that she felt the patient's pain was outside of normal expectations and to request that the attending physician come to evaluate the patient.
Clear and effective communication includes (1) an appropriate description of the urgency of the situation and (2) an indication by the sender as to the desired response to this information ("please come evaluate the patient").8 In all cases, both steps are necessary to elicit an appropriate response.
CASE 2 Continued
Over the next 2 hours, recurrent variable decelerations develop, and then sudden, prolonged fetal bradycardia leads to urgent cesarean delivery. At delivery, a uterine rupture is diagnosed and a fetal hand is observed protruding through a lower-uterine segment defect into the maternal abdomen.
TIP #7: Always consider the entire clinical scenario
In this case, the team caring for the patient was not aware that her previous pregnancy had ended with a low transverse cesarean delivery. How does this information change your interpretation of the clinical scenario? The importance of understanding the entire clinical context when interpreting individual characteristics of cardiotocography cannot be overstated. For example, the sudden onset of recurrent, significant variable decelerations is more concerning in the context of a prior cesarean delivery, and late decelerations are more concerning in a patient with placental abruption, fetal growth restriction, or poorly controlled maternal diabetes.
An estimated 70% of fetuses will have an indeterminate FHR pattern (category II) at some time during labor.9 To appropriately interpret the FHR tracing, it is crucial to know the a priori risk for fetal hypoxia and metabolic acidosis (the precursor of fetal injury) due to such identified clinical risk factors as placental insufficiency, medical comorbidities (hypertension, diabetes), or postdates gestational age.
It is well established that cardiotocography has a good negative predictive value for the absence of fetal metabolic acidosis when there is moderate variability and spontaneous or induced accelerations. When attempting to risk stratify the fetus with a category II (indeterminate) FHR tracing, consider these 3 important questions:
- What are the risk factors for this particular patient and her fetus?
- What is the state of the fetus right now, and when was the last time metabolic acidosis could be excluded reasonably (by the presence of moderate variability and accelerations)?
- What is the risk that the fetus will develop acidemia prior to delivery?
The presence of decelerations indicates interruption of oxygen delivery to the fetus, and recurrent decelerations may indicate an evolving process of accumulated oxygen deprivation, hypoxia, and eventually, metabolic acidosis. Most authorities agree that, for the fetus with a previously normal FHR tracing, the onset of significant, recurrent decelerations with slowly cumulative oxygen deficit can lead to fetal acidemia over the course of approximately 1 hour.10 Of course, acidosis also can occur much more quickly with acute events, such as placental abruption or uterine rupture. In deciding whether or not to intervene based on an FHR tracing, the clinician must take into account the clinical context to determine if delivery is likely to occur before significant acidemia develops.
Challenge: Lack of situational awareness, failure to address nursing concerns, reluctance to initiate the chain of command
CASE 3 Spontaneous labor in a second pregnancy
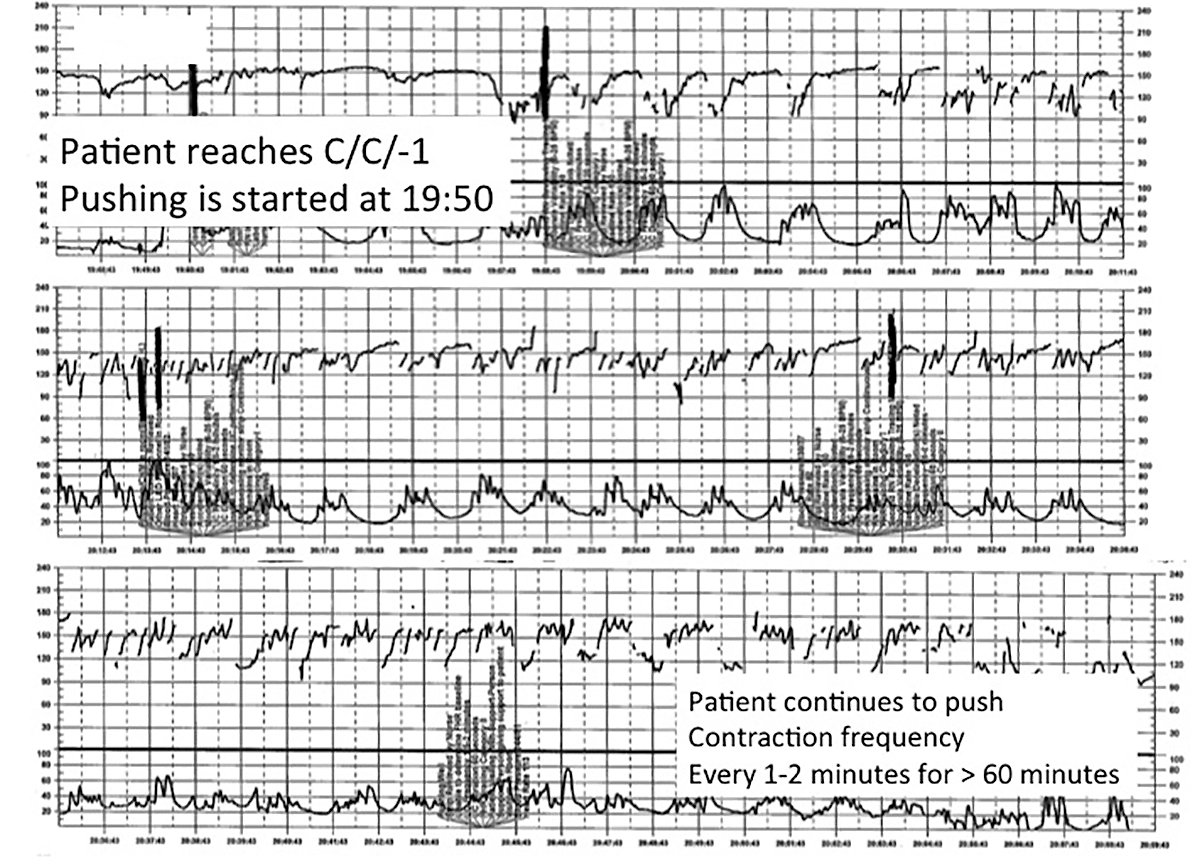
A 28-year-old woman (G2P1) at 40 weeks' gestation presents in spontaneous labor. She has a history of a previous uncomplicated vaginal delivery. After 6 hours she reaches complete dilation with the fetus at −1 station and begins pushing. After 60 minutes, the patient has only progressed to +1 station. She is contracting every 1 to 2 minutes with recurrent variable decelerations (FIGURE 4).
| FIGURE 4 FHR tracing shows time points for initiation and continuation of pushing | ||
| ||
This tracing, from the patient described in Case 3, documents contraction frequency every 1-2 minutes for more than 60 minutes while the patient continues to push. The fetal heart rate demonstrates repetitive moderate variable decelerations with every push. | ||
TIP #6: Maintain situational awareness
A state of situational awareness exists when caregivers have a clear understanding of all of the factors at play in a clinical situation.11 This can be lost when caregivers focus too intensely on one aspect of care. It often happens when the patient is pushing in the second stage and the provider, focused on the progress of fetal descent, loses track of the amount of time that has passed without reassuring features (such as variability and induced or spontaneous accelerations) in the FHR tracing. The nurse, seeing the physician at the bedside, presumes he or she is aware of the tracing and is thus reluctant to point out the concerning features for fear of appearing insubordinate.
Situational awareness also may be lost at the time of patient hand off between providers wherein critical information, such as a history of previous cesarean delivery, is not communicated to the next care team. When receiving an intrapartum patient hand off, providers must have heightened vigilance to ensure they quickly reach situational awareness and are cognizant of the entire clinical context. Maintaining an environment in which all members of the care team, regardless of their training level, are encouraged to voice their concerns is another way to promote ongoing situational awareness.
CASE 3 Continued
The patient continues pushing for another 20 minutes without delivery, and the nurse raises a concern about the FHR tracing to the physician, who remains in the room but does not respond (FIGURE 5).
| FIGURE 5 FHR tracing reveals ongoing repetitive variable decelerations | ||
| ||
This tracing, from the patient described in Case 2, shows variables in the FHR while the patient experiences increasing discomfort. Each of the red arrows indicates documentation by the nurse of increasing pain reported by the patient. The black bars are used to cover names of caregivers. | ||
TIP #5: Acknowledge and respond to other caregivers' concerns
A team approach to patient care is essential in all areas of medicine, perhaps none more so than in obstetrics. Each member of the team is engaged in trying to provide optimal patient care and the concerns of every team member--regardless of title or level of training--must be acknowledged and addressed. Good communication requires creating a safe environment wherein each member of the team feels comfortable raising concerns without fear of reprisal. Rather than becoming angry or frustrated when questioned, providers should remain cognizant that these are ongoing efforts to maintain situational awareness and ensure the best possible outcome for mother and baby.
CASE 3 Continued
Pushing continues for another 30 minutes despite the nurse's repeated effort to express concern to the physician about the FHR tracing. After more than 2 hours of pushing, the infant is delivered; Apgar scores are 1, 5, and 7. No cord gas is obtained.
TIP #4: Initiate the chain of command when necessary
Any caregiver, regardless of job title, has a duty to initiate the institution's chain-of-command policy and procedure if he or she has a concern about patient well-being that is not being addressed adequately. It can be uncomfortable for a nurse, midwife, or resident physician to question an attending physician, particularly if that person responds in a dismissive, condescending, or angry manner. If a caregiver has made several attempts to engage the attending physician and feels the concerns are being inadequately addressed, then he or she must respectfully initiate the chain of command to seek additional objective review of the clinical situation.
Failure to follow oxytocin protocols, inadequate surveillance, poor documentation
CASE 4 Induction of an uncomplicated pregnancy due to postdates
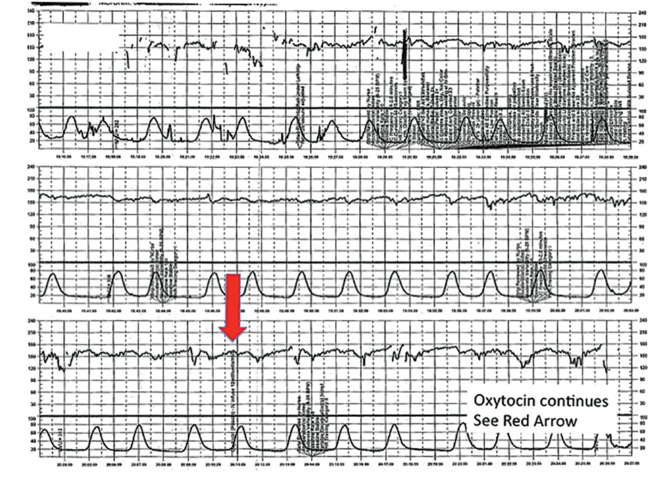
A 20-year-old woman (G1P0) at 42 weeks' gestation with an otherwise uncomplicated first pregnancy presents for postdates induction with oxytocin. After 6 hours, she develops uterine tachysystole with recurrent variable decelerations but the oxytocin infusion is continued at the same rate (FIGURE 6).
| FIGURE 6 FHR tracing indicates uterine tachysystole | ||
| ||
The patient in Case 4 received oxytocin for induction of postdates pregnancy. The red arrow shown on the FHR tracing points out that oxytocin augmentation continues despite the presence of uterine contractions that are too frequent and initial changes, including subtle late decelerations in the FHR, that suggest early fetal compromise. | ||
TIP #3: Manage oxytocin infusion according to protocol
Inappropriate use of oxytocin is common, including the improper management of oxytocin infusion in the setting of uterine tachysystole (defined as the presence of >5 contractions over a 10-minute period averaged over 30 minutes) and/or an abnormal FHR tracing. The mismanagement of uterine tachysystole is cited in more than two-thirds of obstetric malpractice cases.12
Uterine contractions alter blood flow through the spiral arteries and transiently reduce placental perfusion. Prolonged uterine tachysystole can lead to fetal oxygen debt and early signs of hypoxia, including the loss of spontaneous accelerations, tachycardia, and reduced variability. Continuing or increasing the oxytocin in the setting of such changes is hard to justify. One study found that the use of oxytocin in the setting of tachysystole was significantly associated with signs of fetal asphyxia (odds ratio [OR], 5.6).13 When the FHR pattern suggests significant interruption of fetal oxygen delivery and possible hypoxia, continuing or increasing an oxytocin infusion suggests a lack of understanding of the physiology that is the basis for FHR interpretation.
Appropriate management of tachysystole depends on the accompanying FHR.14 In the setting of a category I (normal) FHR tracing, tachysystole can be treated first with maternal repositioning (left or right lateral) and administration of a 500-cm3 maternal IV fluid bolus. If uterine activity does not return to normal after 10 to 15 minutes, decrease the oxytocin rate by at least half. If it does not return to normal after another 10 to 15 minutes, discontinue oxytocin until the tachysystole has resolved.
In the setting of a concerning category IIFHR tracing, discontinuation of oxytocin should be the first step along with maternal repositioning and administration of a fluid bolus. If these measures do not improve the FHR tracing and tachysystole persists, administration of an acute uterine relaxant, such as terbutaline, should be considered to slow contraction frequency.
If interventions result in normalization of the FHR tracing and resolution of tachysystole for 20 to 30 minutes, then oxytocin may be restarted if necessary for labor progress at no more than half the rate that produced tachysystole.
TIP #2: Recognize an abnormal FHR tracing--and what it means
Misinterpretation of the FHR tracing occurs when there is a failure to recognize characteristics that should raise concern about fetal well-being. Failure to recognize an abnormal FHR tracing occurred in 77% of sentinel cases involving intrapartum birth injury or death.1,12,13 To limit misinterpretation of the FHR tracing, it is critical for nurses and physicians to use standardized terminology for clear, effective communication.
In 2008, the Eunice Kennedy Schriver National Institute of Child Health and Human Development (NICHD) published guidelines standardizing the terminology used to describe cardiotocography and to create consensus around its interpretation.15 Any description of an intrapartum FHR tracing should include a designation of category (I, II, or III). Fetal well-being is reasonably established with a category I FHR tracing. A category III tracing indicates the high likelihood of fetal acidemia and the need for immediate intervention. A category II FHR tracing is considered indeterminate, and further characterization is required to reasonably exclude fetal metabolic acidosis and a risk of fetal injury.
The presence of moderate variability and fetal response to scalp stimulation are considered reassuring findings that reasonably exclude significant metabolic acidosis. In assessing variability, one pitfall is mistaking the appearance of "variability" within a deceleration (including during return to baseline) for baseline FHR variability. In the event of a persistent category II FHR tracing (>30 minutes), nursing staff should request direct physician review of the FHR tracing. In any case in which fetal well-being is uncertain, nursing staff should request direct physician evaluation of the mother in person and also the FHR tracing, with clear documentation of the findings, interpretation, and plan of care.16
TIP #1: Document, document, document
Nursing and physician documentation about the FHR tracing within the patient-specific clinical context is crucial for effective caregiver communication and patient safety. Thoughtful documentation also reduces liability exposure for providers by demonstrating maternal-fetal surveillance, early identification and treatment of an abnormal or indeterminate FHR tracing, and timely intervention on fetal behalf when necessary.
When the medical record aligns with the electronic FHR tracing and includes appropriate descriptions, interpretations, and interventions in line with national guidelines and institutional policy, the record demonstrates that the providers have a thorough understanding of the physiology behind cardiotocography and, more importantly, that they are able to apply that knowledge in clinical practice.6
Minimizing missteps
Several straightforward interventions can help clinicians overcome the most common pitfalls during FHR monitoring. These include accurate and high-quality cardiotocography, a collaborative team-based approach to patient care, and sustained situational awareness among providers. The consistent use of common language for the description and interpretation of FHR monitoring, adherence to hospital oxytocin protocols, and well-defined expectations for fetal surveillance and provider communication are critical to overcoming these challenges. Regularly scheduled nursing and physician education sessions and interdisciplinary case review can promote the adoption and sustained incorporation of these simple techniques into daily practice.3
Some have advocated for an "electronic fetal monitoring bundle," which would serve as a checklist of clinical evaluation steps that should occur every time a given process occurs.17 This approach would ensure that all providers on labor and delivery are qualified to read, accurately interpret, and respond to FHR tracings. It would require a credentialing process to confirm the competency of team members and reinforce the presence of a common language. It would also include an explicit escalation policy for rapid initiation of the chain of command in cases wherein there is a disagreement among team members about the FHR interpretation. Finally, each patient would be required to have, at all times, an identified responsible provider capable of a rapid response.
Although continuous FHR monitoring may not effectively reduce intrapartum fetal asphyxia, it is clearly here to stay. Recognizing--and addressing--the most common challenges encountered during intrapartum FHR monitoring may reduce unnecessary morbidity and potential liability for caregivers.
Share your thoughts! Send your Letter to the Editor to [email protected]. Please include your name and the city and state in which you practice.
- Sentinel event alert issue 30--July 21, 2004. Preventing infant death and injury during delivery. Adv Neonatal Care. 2004;4(4):180–181.
- Shy KK, Luthy DA, Bennett FC, et al. Effects of electronic fetal-heart-rate monitoring, as compared with periodic auscultation, on the neurologic development of premature infants. N Engl J Med. 1990;322(9):588–593.
- Clark SL, Nageotte MP, Garite TJ, et al. Intrapartum management of category II fetal heart rate tracings: towards standardization of care. Am J Obstet Gynecol. 2013;209(2):89–97.
- Neilson DR Jr, Freeman RK, Mangan S. Signal ambiguity resulting in unexpected outcome with external fetal heart rate monitoring. Am J Obstet Gynecol. 2008;198(6):717–724.
- McWhinney NA, Knowles S, Green HL, Gordon H. Transmission of the maternal electrocardiograph via a fetal scalp electrode in the presence of intrauterine death. Case report. Br J Obstet Gynaecol. 1984;91(10):1046–1048.
- Simpson KR, Knox GE. Risk management and electronic fetal monitoring: decreasing risk of adverse outcomes and liability exposure. J Perinat Neonatal Nurs. 2000;14(3):40–52.
- Gluck PA. Patient safety in women's health care: a framework for progress. Best Pract Res Clin Obstet Gynaecol. 2007;21(4):525–536.
- Lyndon A, Zlatnik MG, Wachter RM. Effective physician-nurse communication: a patient safety essential for labor and delivery. Am J Obstet Gynecol. 2011;205(2):91–96.
- Jackson M, Holmgren CM, Esplin MS, Henry E, Varner MW. Frequency of fetal heart rate categories and short-term neonatal outcome. Obstet Gynecol. 2011;118(4):803–808.
- Parer JT, Ikeda T. A framework for standardized management of intrapartum fetal heart rate patterns. Am J Obstet Gynecol. 2007;197(1):26.e1-e6.
- MacEachin SR, Lopez CM, Powell KJ, Corbett NL. The fetal heart rate collaborative practice project: situational awareness in electronic fetal monitoring--a Kaiser Permanente Perinatal Patient Safety Program Initiative. J Perinat Neonatal Nurs. 2009;23(4):314–323; quiz 24–25.
- Jonsson M, Norden SL, Hanson U. Analysis of malpractice claims with a focus on oxytocin use in labour. Acta Obstet Gynecol Scand. 2007;86(3):315–319.
- Berglund S, Pettersson H, Cnattingius S, Grunewald C. How often is a low Apgar score the result of substandard care during labour? BJOG. 2010;117(8):968–978.
- Doyle J, Kenny TH, Burkett AM, von Gruenigen VE. A performance improvement process to tackle tachysystole. J Obstet Gynecol Neonatal Nurs. 2011;40(5):512–519.
- Macones GA, Hankins GD, Spong CY, Hauth J, Moore T. The 2008 National Institute of Child Health and Human Development workshop report on electronic fetal monitoring: update on definitions, interpretation, and research guidelines. Obstet Gynecol. 2008;112(3):661–666.
- Knox GE, Simpson KR, Garite TJ. High reliability perinatal units: an approach to the prevention of patient injury and medical malpractice claims. J Healthc Risk Manag. 1999;19(2):24–32.
- Minkoff H, Berkowitz R; Greater New York Hospital Association's Perinatal Safety C. Fetal monitoring bundle. Obstet Gynecol. 2009;114(6):1332–1335.
M. Sean Esplin, MD, and Alexandra G. Eller, MD, MPH

Dr. Esplin is an obstetrician-gynecologist in the Division of Maternal Fetal Medicine, Intermountain Healthcare, and the University of Utah Health Sciences Center, Salt Lake City, Utah.

Dr. Eller is an obstetrician-gynecologist in the Division of Maternal Fetal Medicine, Intermountain Healthcare, and the University of Utah Health Sciences Center, Salt Lake City.
The authors report no financial relationships relevant to this article.
M. Sean Esplin, MD, and Alexandra G. Eller, MD, MPH
Dr. Esplin is an obstetrician-gynecologist in the Division of Maternal Fetal Medicine, Intermountain Healthcare, and the University of Utah Health Sciences Center, Salt Lake City, Utah.
Dr. Eller is an obstetrician-gynecologist in the Division of Maternal Fetal Medicine, Intermountain Healthcare, and the University of Utah Health Sciences Center, Salt Lake City.
The authors report no financial relationships relevant to this article.
Interpreting continuous fetal heart rate (FHR) monitoring is one of the most common tasks obstetricians perform during the course of intrapartum care. Notably, many providers do not seek ongoing training to optimize their ability to reliably and accurately interpret the FHR. Yet FHR interpretation is one of the most frequent causes of litigation in the modern obstetric practice. Failure to interpret continuous FHR monitoring appropriately is estimated to account for 75% of obstetric-related litigation.1
Continuous FHR monitoring during labor was introduced to identify infants at risk for developing hypoxic-ischemic encephalopathy (HIE). The rate of HIE has not declined, however, despite almost universal adoption of continuous FHR monitoring.2 Numerous reasons account for this failure, including ad hoc interpretation of terminology, lack of standardized protocols for management and intervention, and the oftentimes challenging patterns that must be interpreted.3 The confusion about and dissatisfaction with the current state of FHR monitoring has led to attempts to enhance our ability to identify infants at risk with additional approaches (such as fetal pulse oximetry and fetal ST-segment evaluation), and some have called for a complete overhaul of our approach to interpreting the FHR. Clark and colleagues stated recently, "It is time to start over and establish some common language, standard interpretation, and reasonable management principles and guidelines."3
We must recognize that, as a stand-alone tool, continuous FHR monitoring is ineffective for avoiding preventable adverse outcomes. It is most likely to be effective when used in accordance with published standard guidelines by professionals skilled in interpretation and when timely, appropriate interventions are performed based on that interpretation. Optimal FHR monitoring requires a collaborative perinatal team that performs the monitoring correctly, interprets it appropriately, and communicates the findings effectively, and in a timely fashion, to all members of the care team when a high-risk pattern is detected.
In this article we review some common challenges that clinicians encounter during intrapartum FHR monitoring and we offer 10 simple tips to help overcome these challenges. The clinical scenarios described are derived from published reports in the medical literature, published malpractice claims, and from our personal experience working in a major health care system as part of a team charged with overseeing ongoing certification and training of labor and delivery nurses.
Challenge: Signal ambiguity
CASE 1 Young woman in labor with first pregnancy
A 19-year-old woman presents in spontaneous labor with her first pregnancy, which has been uncomplicated. During the course of her care, it is noted that the FHR changes to a lower baseline than previously recorded. Evaluation reveals that the external monitor is tracking the maternal heart rate and not the FHR (FIGURE 1). After the monitor is adjusted, both the fetal and maternal rates are documented for a short period. Ultimately, continuous monitoring of the maternal heart rate is discontinued. After delivery of the infant several hours later, it is noted that the FHR continues to register on the monitor, and it is determined that for the last few hours the maternal heart rate has been traced.
| FIGURE 1 FHR tracing indicates signal ambiguity | ||
|
| ||
As described in Case 1, the upper panel of this tracing demonstrates the maternal heart rate confused as the fetal heart rate, while the segment in the lower panel shows a clear distinction between the maternal and fetal heart rates. | ||
TIP #10: Ensure the FHR monitor is tracking the fetal, not the maternal, heart rate
Confusing the maternal and the fetal heart rate with external cardiotocography is common. When the mix-up is noted and corrected expeditiously, it is unlikely to result in an adverse outcome. Signal ambiguity may arise from faulty Doppler equipment or the inability of the cardiotocograph to differentiate between maternal and fetal heart rates. It commonly occurs after repositioning the patient, after fetal movement, or during pushing in the second stage when the maternal heart rate may increase to a baseline that is similar to that of the fetus.
Signal ambiguity should be suspected when the FHR runs in the low-normal range or when FHR accelerations are noted with greater than 50% of contractions (especially when pushing).4 Signal ambiguity also should be ruled out when there is an apparent FHR deceleration to the maternal range that does not recover.
Evaluating for suspected signal ambiguity involves 2 key steps: (1) documentation and verification of the maternal heart rate and (2) definitive documentation of the true FHR. To document the maternal heart rate, manually count the radial pulse for 1 minute or use a pulse oximeter for continuous monitoring. Using a pulse oximeter is a less labor-intensive approach and has the advantage of allowing continuous assessment of the maternal heart rate for comparison. Recording the maternal pulse continuously on the same screen as the FHR enables ongoing differentiation of the mother and fetus in difficult cases, particularly if internal fetal monitoring is not an option (because of maternal infectious disease, low suspicion for an abnormal FHR pattern, or strong maternal preference against internal monitoring, for example).
When clinically appropriate, use of a fetal scalp electrode (FSE) can document the FHR. If intrauterine fetal death has occurred, however, the FSE may transmit the maternal heart rate.5 Using ultrasonography to confirm the FHR prior to placing the FSE is a reliable method of definitive differentiation. If a newly placed FSE shows a clear differentiation of 5 to 10 beats per minute from a continuously assessed maternal pulse rate, then this is also a reliable way to assure that the FHR monitoring represents the fetus, particularly if ultrasonography is not immediately available.
Ultimately, before intervening based on an abnormal FHR tracing, it is paramount to confirm that the data are adequate for interpretation and represent the actual FHR. If signal ambiguity is identified or suspected, correct it by using ultrasonography to locate the FHR and replace the external monitor until a rate that is at least 5 to 10 beats per minute different from the maternal rate is obtained. Alternatively, this is an indication for internal fetal monitoring with an FSE.
Challenge: Inadequate FHR tracing, poor communication, lack of clinical context
CASE 2 Woman with uncomplicated postdates pregnancy presents for induction
A 28-year-old woman (G3P2) at 41 weeks 0 days of gestation presents to labor and delivery for induction of labor for the indication of postdates. There have been no complications with the current pregnancy. The initial cervical exam reveals 1+ cm dilation, 90% effacement, and −3 station, and the patient is started on oxytocin per the hospital protocol. What is your interpretation of the continuous FHR tracing shown in FIGURE 2?
| FIGURE 2 Inadequate, uninterpretable FHR tracing | ||
|
| ||
This FHR tracing, from the patient described in Case 2, is unusable because of the absence of data. | ||
TIP #9: Check that the monitors are providing useful data
The ability to accurately interpret a continuous FHR tracing depends on the quality of data recorded. Unfortunately, the absence of data makes interpretation impossible. This includes both FHR and tocometry data, since both pieces of information are required for appropriate interpretation of a continuous FHR tracing.
Prolonged periods of uninterpretable FHR and uterine activity tracings imply that no one was attending the mother and fetus.6 If it is difficult to obtain an interpretable FHR tracing, document in the medical record that you made ongoing efforts to maintain an adequate tracing, including the amount of time spent holding the external monitor, use of ultrasonography to document the FHR, and plans for potential internal monitoring.
CASE 2 Continued
After several hours, the patient requests an epidural for pain management and one is placed without difficulty. She reports adequate pain relief and is comfortable for the next 1 to 2 hours. Subsequently, the patient reports a sudden onset of increasing pain that does not respond to additional patient-administered doses of anesthesia over a 30-minute period. The labor and delivery nurse becomes concerned about the patient's pain level and contacts the attending physician to discuss her concerns. The physician, who is currently attending to patients in clinic, listens to the nurse and asks her to contact the anesthesia department with her concerns (FIGURE 3).
| FIGURE 3 FHR tracing reveals recurrent variables in a patient with evolving clinical concerns | ||
|
| ||
This tracing, from the patient described in Case 2, shows variables in the FHR while the patient experiences increasing discomfort. Each of the red arrows indicates documentation by the nurse of increasing pain reported by the patient. The black bars are used to cover names of caregivers. | ||
TIP #8: Clearly communicate an urgent situation to the care team
Poor communication underlies many preventable adverse outcomes in medicine.7 Effective communication requires an adequate description of the clinical scenario or problem. A root cause analysis of a series of intrapartum adverse events involving fetal death or injury showed that poor communication about a concerning FHR tracing played a role in 72% of cases.1
In this clinical scenario, the nurse believed that the patient's pain level was unusual or more than anticipated. The person who is communicating his or her concern (the sender) must be sure that the person receiving the message (the responder) clearly understands the sender's level of concern. In this case, it would have been appropriate for the sender to state clearly that she felt the patient's pain was outside of normal expectations and to request that the attending physician come to evaluate the patient.
Clear and effective communication includes (1) an appropriate description of the urgency of the situation and (2) an indication by the sender as to the desired response to this information ("please come evaluate the patient").8 In all cases, both steps are necessary to elicit an appropriate response.
CASE 2 Continued
Over the next 2 hours, recurrent variable decelerations develop, and then sudden, prolonged fetal bradycardia leads to urgent cesarean delivery. At delivery, a uterine rupture is diagnosed and a fetal hand is observed protruding through a lower-uterine segment defect into the maternal abdomen.
TIP #7: Always consider the entire clinical scenario
In this case, the team caring for the patient was not aware that her previous pregnancy had ended with a low transverse cesarean delivery. How does this information change your interpretation of the clinical scenario? The importance of understanding the entire clinical context when interpreting individual characteristics of cardiotocography cannot be overstated. For example, the sudden onset of recurrent, significant variable decelerations is more concerning in the context of a prior cesarean delivery, and late decelerations are more concerning in a patient with placental abruption, fetal growth restriction, or poorly controlled maternal diabetes.
An estimated 70% of fetuses will have an indeterminate FHR pattern (category II) at some time during labor.9 To appropriately interpret the FHR tracing, it is crucial to know the a priori risk for fetal hypoxia and metabolic acidosis (the precursor of fetal injury) due to such identified clinical risk factors as placental insufficiency, medical comorbidities (hypertension, diabetes), or postdates gestational age.
It is well established that cardiotocography has a good negative predictive value for the absence of fetal metabolic acidosis when there is moderate variability and spontaneous or induced accelerations. When attempting to risk stratify the fetus with a category II (indeterminate) FHR tracing, consider these 3 important questions:
- What are the risk factors for this particular patient and her fetus?
- What is the state of the fetus right now, and when was the last time metabolic acidosis could be excluded reasonably (by the presence of moderate variability and accelerations)?
- What is the risk that the fetus will develop acidemia prior to delivery?
The presence of decelerations indicates interruption of oxygen delivery to the fetus, and recurrent decelerations may indicate an evolving process of accumulated oxygen deprivation, hypoxia, and eventually, metabolic acidosis. Most authorities agree that, for the fetus with a previously normal FHR tracing, the onset of significant, recurrent decelerations with slowly cumulative oxygen deficit can lead to fetal acidemia over the course of approximately 1 hour.10 Of course, acidosis also can occur much more quickly with acute events, such as placental abruption or uterine rupture. In deciding whether or not to intervene based on an FHR tracing, the clinician must take into account the clinical context to determine if delivery is likely to occur before significant acidemia develops.
Challenge: Lack of situational awareness, failure to address nursing concerns, reluctance to initiate the chain of command
CASE 3 Spontaneous labor in a second pregnancy
A 28-year-old woman (G2P1) at 40 weeks' gestation presents in spontaneous labor. She has a history of a previous uncomplicated vaginal delivery. After 6 hours she reaches complete dilation with the fetus at −1 station and begins pushing. After 60 minutes, the patient has only progressed to +1 station. She is contracting every 1 to 2 minutes with recurrent variable decelerations (FIGURE 4).
| FIGURE 4 FHR tracing shows time points for initiation and continuation of pushing | ||
|
| ||
This tracing, from the patient described in Case 3, documents contraction frequency every 1-2 minutes for more than 60 minutes while the patient continues to push. The fetal heart rate demonstrates repetitive moderate variable decelerations with every push. | ||
TIP #6: Maintain situational awareness
A state of situational awareness exists when caregivers have a clear understanding of all of the factors at play in a clinical situation.11 This can be lost when caregivers focus too intensely on one aspect of care. It often happens when the patient is pushing in the second stage and the provider, focused on the progress of fetal descent, loses track of the amount of time that has passed without reassuring features (such as variability and induced or spontaneous accelerations) in the FHR tracing. The nurse, seeing the physician at the bedside, presumes he or she is aware of the tracing and is thus reluctant to point out the concerning features for fear of appearing insubordinate.
Situational awareness also may be lost at the time of patient hand off between providers wherein critical information, such as a history of previous cesarean delivery, is not communicated to the next care team. When receiving an intrapartum patient hand off, providers must have heightened vigilance to ensure they quickly reach situational awareness and are cognizant of the entire clinical context. Maintaining an environment in which all members of the care team, regardless of their training level, are encouraged to voice their concerns is another way to promote ongoing situational awareness.
CASE 3 Continued
The patient continues pushing for another 20 minutes without delivery, and the nurse raises a concern about the FHR tracing to the physician, who remains in the room but does not respond (FIGURE 5).
| FIGURE 5 FHR tracing reveals ongoing repetitive variable decelerations | ||
|
| ||
This tracing, from the patient described in Case 2, shows variables in the FHR while the patient experiences increasing discomfort. Each of the red arrows indicates documentation by the nurse of increasing pain reported by the patient. The black bars are used to cover names of caregivers. | ||
TIP #5: Acknowledge and respond to other caregivers' concerns
A team approach to patient care is essential in all areas of medicine, perhaps none more so than in obstetrics. Each member of the team is engaged in trying to provide optimal patient care and the concerns of every team member--regardless of title or level of training--must be acknowledged and addressed. Good communication requires creating a safe environment wherein each member of the team feels comfortable raising concerns without fear of reprisal. Rather than becoming angry or frustrated when questioned, providers should remain cognizant that these are ongoing efforts to maintain situational awareness and ensure the best possible outcome for mother and baby.
CASE 3 Continued
Pushing continues for another 30 minutes despite the nurse's repeated effort to express concern to the physician about the FHR tracing. After more than 2 hours of pushing, the infant is delivered; Apgar scores are 1, 5, and 7. No cord gas is obtained.
TIP #4: Initiate the chain of command when necessary
Any caregiver, regardless of job title, has a duty to initiate the institution's chain-of-command policy and procedure if he or she has a concern about patient well-being that is not being addressed adequately. It can be uncomfortable for a nurse, midwife, or resident physician to question an attending physician, particularly if that person responds in a dismissive, condescending, or angry manner. If a caregiver has made several attempts to engage the attending physician and feels the concerns are being inadequately addressed, then he or she must respectfully initiate the chain of command to seek additional objective review of the clinical situation.
Failure to follow oxytocin protocols, inadequate surveillance, poor documentation
CASE 4 Induction of an uncomplicated pregnancy due to postdates
A 20-year-old woman (G1P0) at 42 weeks' gestation with an otherwise uncomplicated first pregnancy presents for postdates induction with oxytocin. After 6 hours, she develops uterine tachysystole with recurrent variable decelerations but the oxytocin infusion is continued at the same rate (FIGURE 6).
| FIGURE 6 FHR tracing indicates uterine tachysystole | ||
|
| ||
The patient in Case 4 received oxytocin for induction of postdates pregnancy. The red arrow shown on the FHR tracing points out that oxytocin augmentation continues despite the presence of uterine contractions that are too frequent and initial changes, including subtle late decelerations in the FHR, that suggest early fetal compromise. | ||
TIP #3: Manage oxytocin infusion according to protocol
Inappropriate use of oxytocin is common, including the improper management of oxytocin infusion in the setting of uterine tachysystole (defined as the presence of >5 contractions over a 10-minute period averaged over 30 minutes) and/or an abnormal FHR tracing. The mismanagement of uterine tachysystole is cited in more than two-thirds of obstetric malpractice cases.12
Uterine contractions alter blood flow through the spiral arteries and transiently reduce placental perfusion. Prolonged uterine tachysystole can lead to fetal oxygen debt and early signs of hypoxia, including the loss of spontaneous accelerations, tachycardia, and reduced variability. Continuing or increasing the oxytocin in the setting of such changes is hard to justify. One study found that the use of oxytocin in the setting of tachysystole was significantly associated with signs of fetal asphyxia (odds ratio [OR], 5.6).13 When the FHR pattern suggests significant interruption of fetal oxygen delivery and possible hypoxia, continuing or increasing an oxytocin infusion suggests a lack of understanding of the physiology that is the basis for FHR interpretation.
Appropriate management of tachysystole depends on the accompanying FHR.14 In the setting of a category I (normal) FHR tracing, tachysystole can be treated first with maternal repositioning (left or right lateral) and administration of a 500-cm3 maternal IV fluid bolus. If uterine activity does not return to normal after 10 to 15 minutes, decrease the oxytocin rate by at least half. If it does not return to normal after another 10 to 15 minutes, discontinue oxytocin until the tachysystole has resolved.
In the setting of a concerning category IIFHR tracing, discontinuation of oxytocin should be the first step along with maternal repositioning and administration of a fluid bolus. If these measures do not improve the FHR tracing and tachysystole persists, administration of an acute uterine relaxant, such as terbutaline, should be considered to slow contraction frequency.
If interventions result in normalization of the FHR tracing and resolution of tachysystole for 20 to 30 minutes, then oxytocin may be restarted if necessary for labor progress at no more than half the rate that produced tachysystole.
TIP #2: Recognize an abnormal FHR tracing--and what it means
Misinterpretation of the FHR tracing occurs when there is a failure to recognize characteristics that should raise concern about fetal well-being. Failure to recognize an abnormal FHR tracing occurred in 77% of sentinel cases involving intrapartum birth injury or death.1,12,13 To limit misinterpretation of the FHR tracing, it is critical for nurses and physicians to use standardized terminology for clear, effective communication.
In 2008, the Eunice Kennedy Schriver National Institute of Child Health and Human Development (NICHD) published guidelines standardizing the terminology used to describe cardiotocography and to create consensus around its interpretation.15 Any description of an intrapartum FHR tracing should include a designation of category (I, II, or III). Fetal well-being is reasonably established with a category I FHR tracing. A category III tracing indicates the high likelihood of fetal acidemia and the need for immediate intervention. A category II FHR tracing is considered indeterminate, and further characterization is required to reasonably exclude fetal metabolic acidosis and a risk of fetal injury.
The presence of moderate variability and fetal response to scalp stimulation are considered reassuring findings that reasonably exclude significant metabolic acidosis. In assessing variability, one pitfall is mistaking the appearance of "variability" within a deceleration (including during return to baseline) for baseline FHR variability. In the event of a persistent category II FHR tracing (>30 minutes), nursing staff should request direct physician review of the FHR tracing. In any case in which fetal well-being is uncertain, nursing staff should request direct physician evaluation of the mother in person and also the FHR tracing, with clear documentation of the findings, interpretation, and plan of care.16
TIP #1: Document, document, document
Nursing and physician documentation about the FHR tracing within the patient-specific clinical context is crucial for effective caregiver communication and patient safety. Thoughtful documentation also reduces liability exposure for providers by demonstrating maternal-fetal surveillance, early identification and treatment of an abnormal or indeterminate FHR tracing, and timely intervention on fetal behalf when necessary.
When the medical record aligns with the electronic FHR tracing and includes appropriate descriptions, interpretations, and interventions in line with national guidelines and institutional policy, the record demonstrates that the providers have a thorough understanding of the physiology behind cardiotocography and, more importantly, that they are able to apply that knowledge in clinical practice.6
Minimizing missteps
Several straightforward interventions can help clinicians overcome the most common pitfalls during FHR monitoring. These include accurate and high-quality cardiotocography, a collaborative team-based approach to patient care, and sustained situational awareness among providers. The consistent use of common language for the description and interpretation of FHR monitoring, adherence to hospital oxytocin protocols, and well-defined expectations for fetal surveillance and provider communication are critical to overcoming these challenges. Regularly scheduled nursing and physician education sessions and interdisciplinary case review can promote the adoption and sustained incorporation of these simple techniques into daily practice.3
Some have advocated for an "electronic fetal monitoring bundle," which would serve as a checklist of clinical evaluation steps that should occur every time a given process occurs.17 This approach would ensure that all providers on labor and delivery are qualified to read, accurately interpret, and respond to FHR tracings. It would require a credentialing process to confirm the competency of team members and reinforce the presence of a common language. It would also include an explicit escalation policy for rapid initiation of the chain of command in cases wherein there is a disagreement among team members about the FHR interpretation. Finally, each patient would be required to have, at all times, an identified responsible provider capable of a rapid response.
Although continuous FHR monitoring may not effectively reduce intrapartum fetal asphyxia, it is clearly here to stay. Recognizing--and addressing--the most common challenges encountered during intrapartum FHR monitoring may reduce unnecessary morbidity and potential liability for caregivers.
Share your thoughts! Send your Letter to the Editor to [email protected]. Please include your name and the city and state in which you practice.
- Sentinel event alert issue 30--July 21, 2004. Preventing infant death and injury during delivery. Adv Neonatal Care. 2004;4(4):180–181.
- Shy KK, Luthy DA, Bennett FC, et al. Effects of electronic fetal-heart-rate monitoring, as compared with periodic auscultation, on the neurologic development of premature infants. N Engl J Med. 1990;322(9):588–593.
- Clark SL, Nageotte MP, Garite TJ, et al. Intrapartum management of category II fetal heart rate tracings: towards standardization of care. Am J Obstet Gynecol. 2013;209(2):89–97.
- Neilson DR Jr, Freeman RK, Mangan S. Signal ambiguity resulting in unexpected outcome with external fetal heart rate monitoring. Am J Obstet Gynecol. 2008;198(6):717–724.
- McWhinney NA, Knowles S, Green HL, Gordon H. Transmission of the maternal electrocardiograph via a fetal scalp electrode in the presence of intrauterine death. Case report. Br J Obstet Gynaecol. 1984;91(10):1046–1048.
- Simpson KR, Knox GE. Risk management and electronic fetal monitoring: decreasing risk of adverse outcomes and liability exposure. J Perinat Neonatal Nurs. 2000;14(3):40–52.
- Gluck PA. Patient safety in women's health care: a framework for progress. Best Pract Res Clin Obstet Gynaecol. 2007;21(4):525–536.
- Lyndon A, Zlatnik MG, Wachter RM. Effective physician-nurse communication: a patient safety essential for labor and delivery. Am J Obstet Gynecol. 2011;205(2):91–96.
- Jackson M, Holmgren CM, Esplin MS, Henry E, Varner MW. Frequency of fetal heart rate categories and short-term neonatal outcome. Obstet Gynecol. 2011;118(4):803–808.
- Parer JT, Ikeda T. A framework for standardized management of intrapartum fetal heart rate patterns. Am J Obstet Gynecol. 2007;197(1):26.e1-e6.
- MacEachin SR, Lopez CM, Powell KJ, Corbett NL. The fetal heart rate collaborative practice project: situational awareness in electronic fetal monitoring--a Kaiser Permanente Perinatal Patient Safety Program Initiative. J Perinat Neonatal Nurs. 2009;23(4):314–323; quiz 24–25.
- Jonsson M, Norden SL, Hanson U. Analysis of malpractice claims with a focus on oxytocin use in labour. Acta Obstet Gynecol Scand. 2007;86(3):315–319.
- Berglund S, Pettersson H, Cnattingius S, Grunewald C. How often is a low Apgar score the result of substandard care during labour? BJOG. 2010;117(8):968–978.
- Doyle J, Kenny TH, Burkett AM, von Gruenigen VE. A performance improvement process to tackle tachysystole. J Obstet Gynecol Neonatal Nurs. 2011;40(5):512–519.
- Macones GA, Hankins GD, Spong CY, Hauth J, Moore T. The 2008 National Institute of Child Health and Human Development workshop report on electronic fetal monitoring: update on definitions, interpretation, and research guidelines. Obstet Gynecol. 2008;112(3):661–666.
- Knox GE, Simpson KR, Garite TJ. High reliability perinatal units: an approach to the prevention of patient injury and medical malpractice claims. J Healthc Risk Manag. 1999;19(2):24–32.
- Minkoff H, Berkowitz R; Greater New York Hospital Association's Perinatal Safety C. Fetal monitoring bundle. Obstet Gynecol. 2009;114(6):1332–1335.
In this article
• Communicate urgency
• Situational awareness
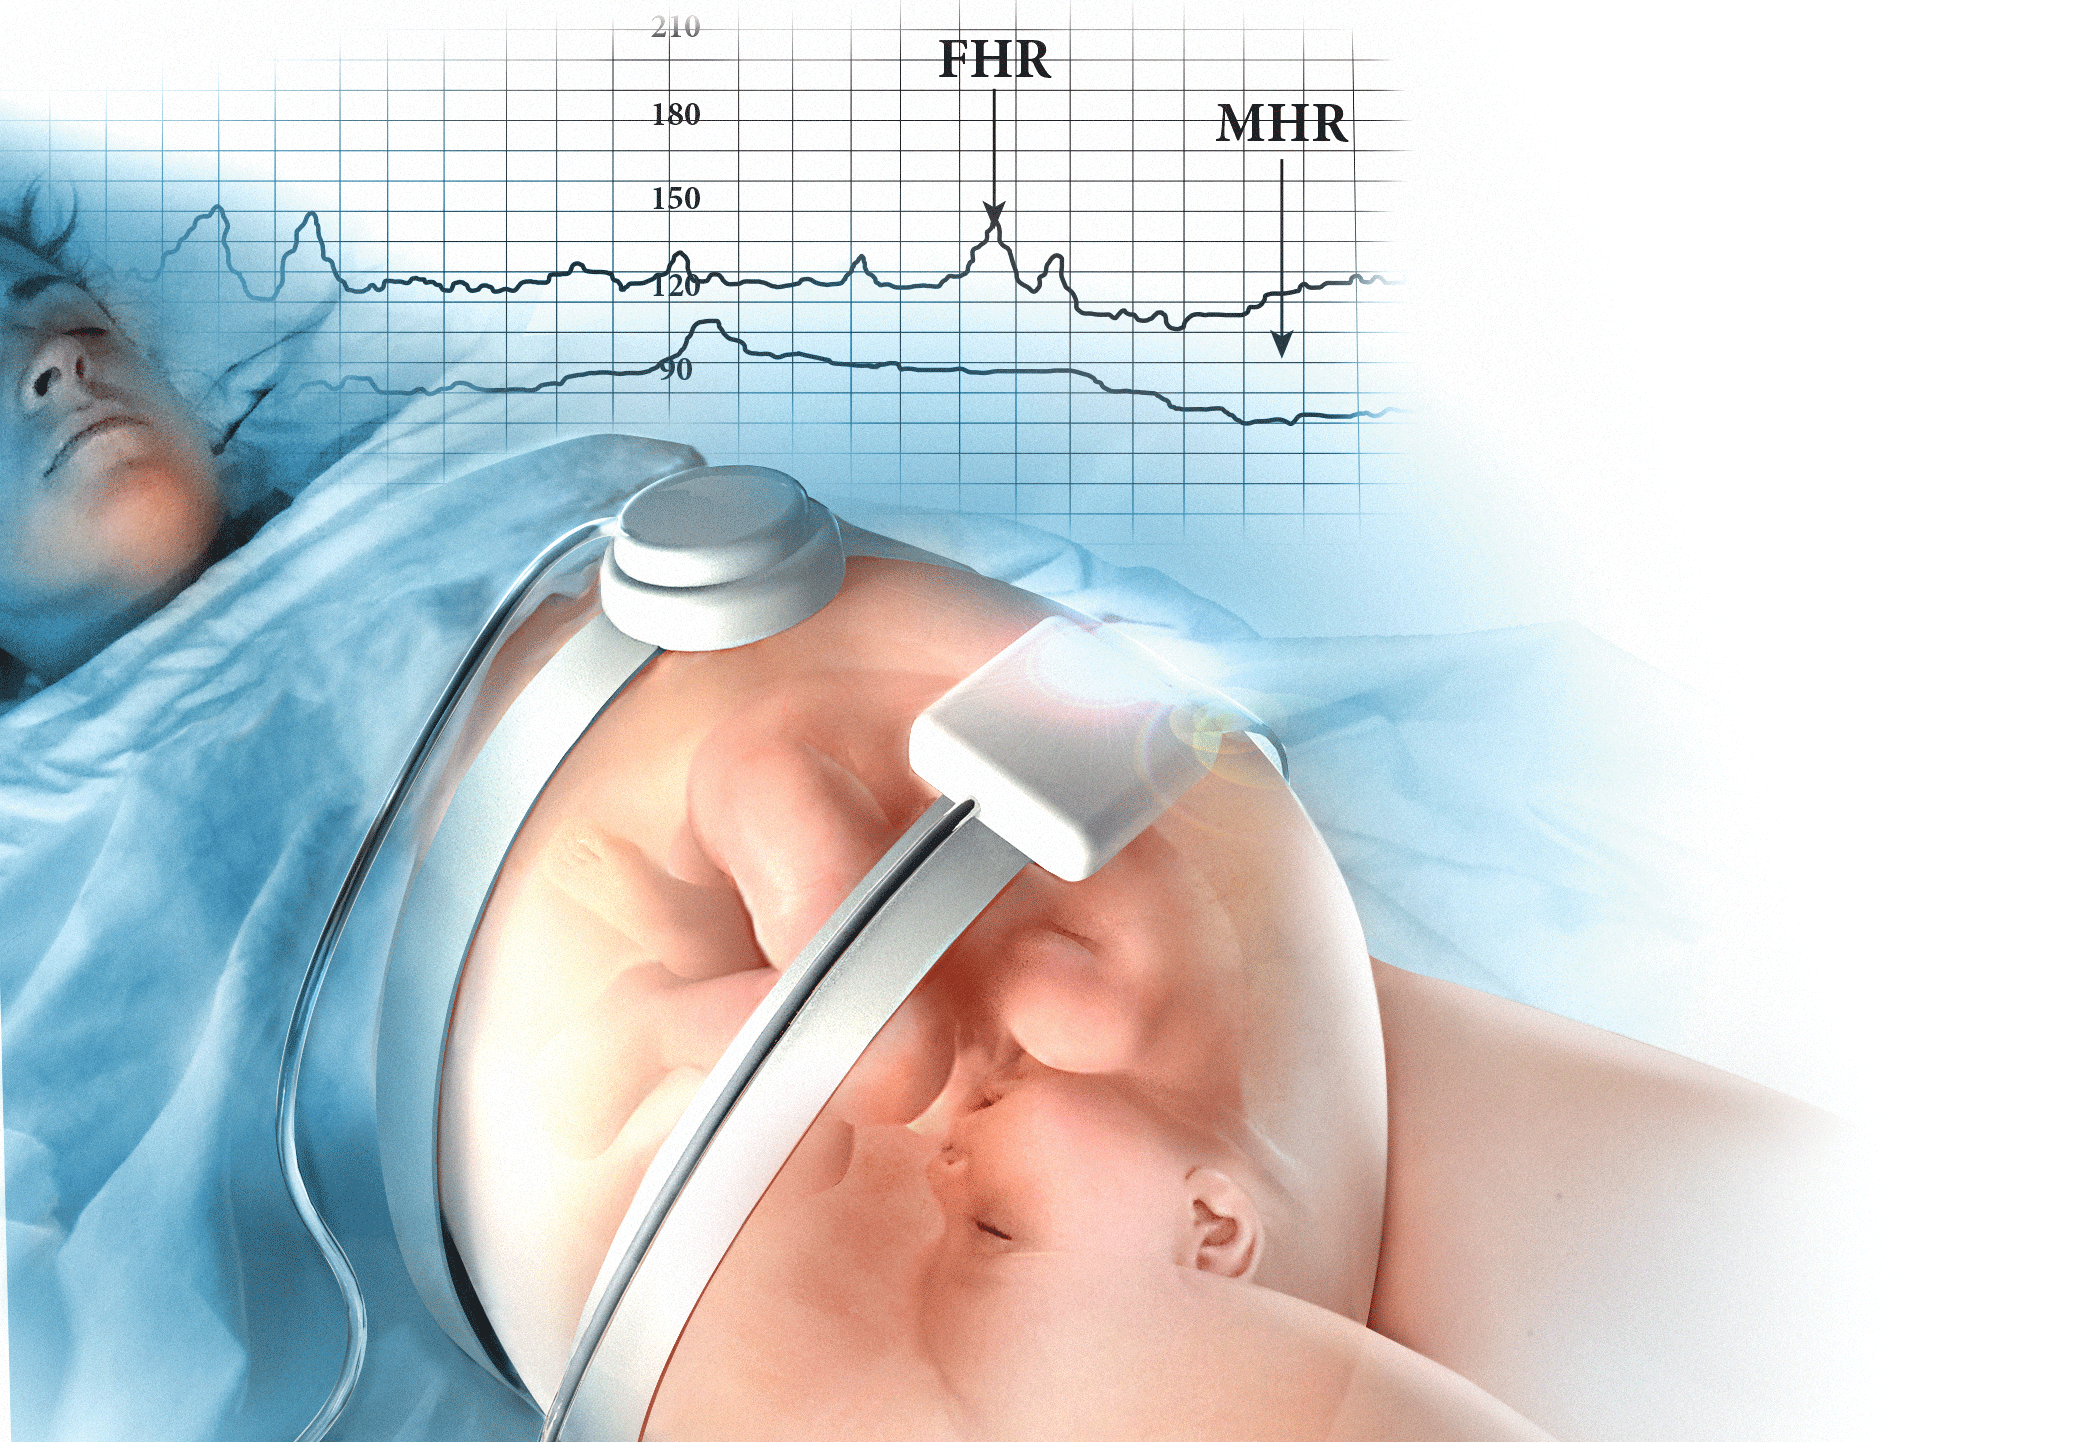
Benefits of Earlier Palliative Care
Offering palliative care early to hospitalized patients with multiple serious conditions could improve care and help reduce healthcare spending, according to “Palliative Care Teams’ Cost-Saving Effect Is Larger for Cancer Patients with Higher Numbers of Comorbidities,” published in Health Affairs. When adults with advanced cancer (excluding those with dementia) received a palliative care consultation within two days of admission, costs were 22% lower for patients with a comorbidity score of 2 to 3 and 32% lower for those with a score of 4 or higher.
Reference
- May P, Garrido MM, Cassel JB, et al. Palliative care teams’ cost-saving effect is larger for cancer patients with higher numbers of comorbidities. Health Aff. 2016;35(1):44-53.
Quick Byte
Efforts to shift provider payment from fee-for-service to more risk-based alternatives are proceeding slowly: Nearly 95% of all 2013 physician office visits were reimbursed as fee-for-service.
Reference
- Zuvekas SH, Cohen JW. Fee-for-service, while much maligned, remains the dominant payment method for physician visits. Health Aff. 2016;35(3):411-414. doi:10.1377/hlthaff.2015.1291.
Email Alerts Can Help Improve Quality in a Hospital
Alert emails can be a simple, low-cost means of improving quality in a hospital, as the Department of Medicine at Massachusetts General Hospital in Boston learned. The trial there is summarized in “Alert Emails Improve Quality in a Large Academic Hospitalist Group,” an abstract by Warren Chuang, MD, and Bijay Acharya, MD.
When each of the hospital’s divisions was asked to designate important quality goals, the Hospital Medicine Division chose pre-noon discharge rate and discharge summary completion timeliness. Group emails were deployed first: Monthly alerts went to the entire unit emphasizing target numbers, reporting the group’s current performance, and outlining future performance needed to meet the targets. This led to an improvement in discharge summary completion rate from 89.1% to 94.8%.
The same improvement was not seen in the pre-noon discharge rate, so the next step was to send individual emails to every attending whose pre-noon discharge rate was below target levels. This resulted in dramatic improvement: Having fallen to 16.0%, the rate rose to 19.5% after the email campaign.
The authors’ conclusion? Periodic individual email alerts that make individual performance transparent may prove to be the most effective way to achieve quality improvement in operational measures.
Reference
- Chuang W, Acharya B. Alert emails improve quality in a large academic hospitalist group [abstract]. J Hosp Med. 2015;10(suppl2). Available at: http://www.shmabstracts.com/abstract/alert-emails-improve-quality-in-a-large-academic-hospitalist-group/. Accessed February 14, 2016.
Pre-treatment gut bacteria may predict risk of BSI

A new study suggests the composition of a cancer patient’s intestinal microbiome before treatment may predict his risk of developing a bloodstream infection (BSI) after treatment.
Researchers analyzed fecal samples from patients with non-Hodgkin lymphoma who were set to receive an allogeneic hematopoietic stem cell transplant (allo-HSCT) with myeloablative conditioning.
The team found that patients with less diversity in their fecal samples before this treatment were more likely to develop a BSI after.
Emmanuel Montassier, MD, PhD, of Nantes University Hospital in France, and his colleagues conducted this study and reported the result in Genome Medicine.
A previous study suggested that intestinal domination—when a single bacterial taxon occupies at least 30% of the microbiota—is associated with BSIs in patients undergoing allo-HSCT. However, the role of the intestinal microbiome before treatment was not clear.
So Dr Montassier and his colleagues set out to characterize the fecal microbiome before treatment. To do this, they sequenced the bacterial DNA of fecal samples from 28 patients with non-Hodgkin lymphoma.
The team collected the samples before patients began a 5-day myeloablative conditioning regimen (high-dose carmustine, etoposide, aracytine, and melphalan), followed by allo-HSCT on the seventh day.
Eleven of these patients developed a BSI at a mean of 12 days after sample collection. Two patients (18.2%) developed Enterococcus BSI, 4 (36.4%) developed Escherichia coli BSI, and 5 (45.5%) developed other Gammaproteobacteria BSI.
The researchers said that alpha diversity in samples from these patients was significantly lower than alpha diversity from patients who did not develop a BSI, with reduced evenness (Shannon index, Monte Carlo permuted t-test two-sided P value = 0.004) and reduced richness (Observed species, Monte Carlo permuted t-test two-sided P value = 0.001)
The team also noted that, compared to patients who did not develop a BSI, those who did had decreased abundance of Barnesiellaceae, Coriobacteriaceae, Faecalibacterium, Christensenella, Dehalobacterium, Desulfovibrio, and Sutterella.
Using this information, the researchers developed a BSI risk index that could predict the likelihood of a BSI with 90% sensitivity and specificity.
“This method worked even better than we expected because we found a consistent difference between the gut bacteria in those who developed infections and those who did not,” said study author Dan Knights, PhD, of the University of Minnesota in Minneapolis.
“This research is an early demonstration that we may be able to use the bugs in our gut to predict infections and possibly develop new prognostic models in other diseases.”
Still, the researchers said these findings are based on a limited number of patients treated with the same regimen at a single clinic. So the next step for this research is to validate the findings in a much larger cohort including patients with different cancer types, different treatment types, and from multiple treatment centers.
“We still need to determine if these bacteria are playing any kind of causal role in the infections or if they are simply acting as biomarkers for some other predisposing condition in the patient,” Dr Montassier said. ![]()
Current cancer drug discovery method flawed, team says

Image courtesy of PNAS
The primary method used to test compounds for anticancer activity in vitro may produce inaccurate results, according to researchers.
Therefore, they have developed a new metric to evaluate a compound’s effect on cell proliferation—the drug-induced proliferation (DIP) rate.
They believe this metric, described in Nature Methods, overcomes the time-dependent bias of traditional proliferation assays.
“More than 90% of candidate cancer drugs fail in late-stage clinical trials, costing hundreds of millions of dollars,” said study author Vito Quaranta, MD, of Vanderbilt University School of Medicine in Nashville, Tennessee.
“The flawed in vitro drug discovery metric may not be the only responsible factor, but it may be worth pursuing an estimate of its impact.”
For more than 30 years, scientists have evaluated the ability of a compound to kill cells by adding the compound and counting how many cells are alive after 72 hours.
However, these proliferation assays, which measure cell number at a single time point, don’t take into account the bias introduced by exponential cell proliferation, even in the presence of the drug, said study author Darren Tyson, PhD, of Vanderbilt University School of Medicine.
“Cells are not uniform,” added Dr Quaranta. “They all proliferate exponentially but at different rates. At 72 hours, some cells will have doubled 3 times, and others will not have doubled at all.”
In addition, he noted, drugs don’t all behave the same way on every cell line. For example, a drug might have an immediate effect on one cell line and a delayed effect on another.
Therefore, he and his colleagues used a systems biology approach to demonstrate the time-dependent bias in static proliferation assays and to develop the time-independent DIP rate metric.
The researchers evaluated the responses of 4 different melanoma cell lines to the drug vemurafenib, currently used to treat melanoma, with the standard metric and with the DIP rate.
In one cell line, the team found a stark disagreement between the two metrics.
“The static metric says that the cell line is very sensitive to vemurafenib,” said Leonard Harris, PhD, of Vanderbilt University School of Medicine.
“However, our analysis shows this is not the case. A brief period of drug sensitivity, quickly followed by rebound, fools the static metric but not the DIP rate.”
The findings “suggest we should expect melanoma tumors treated with this drug to come back, and that’s what has happened, puzzling investigators,” Dr Quaranta said. “DIP rate analyses may help solve this conundrum, leading to better treatment strategies.”
These findings have particular importance in light of recent international efforts to generate data sets that include the responses of “thousands of cell lines to hundreds of compounds,” Dr Quaranta said.
The Cancer Cell Line Encyclopedia (CCLE) and Genomics of Drug Sensitivity in Cancer (GDSC) databases include drug response data along with genomic and proteomic data that detail each cell line’s molecular makeup.
“The idea is to look for statistical correlations—these particular cell lines with this particular makeup are sensitive to these types of compounds—to use these large databases as discovery tools for new therapeutic targets in cancer,” Dr Quaranta said. “If the metric by which you’ve evaluated the drug sensitivity of the cells is wrong, your statistical correlations are basically no good.” ![]()
Therapy may reduce memory problems related to chemo

patient and her father
Photo by Rhoda Baer
A type of cognitive behavioral therapy may help prevent some of the long-term memory issues caused by chemotherapy, according to research published in Cancer.
The therapy is called “Memory and Attention Adaptation Training” (MAAT).
It’s designed to help cancer survivors increase awareness of situations where memory problems can arise and develop skills to either prevent memory failure or compensate for memory dysfunction.
MAAT was developed by Robert Ferguson, PhD, of the University of Pittsburgh Cancer Institute in Pennsylvania, and his colleagues.
The researchers tested MAAT in a small, randomized study of 47 Caucasian breast cancer survivors who were an average of 4 years post-chemotherapy.
The patients were assigned to 8 visits of MAAT (30 to 45 minutes each visit) or supportive talk therapy for an identical time span. The intent of the supportive therapy was to control for the simple effects of interacting with a supportive clinician, or “behavioral placebo.”
Both treatments were delivered over a videoconference network between health centers to minimize patient travel.
All participants completed questionnaires assessing perceived memory difficulty and anxiety about memory problems. They were also tested over the phone with neuropsychological tests of verbal memory and processing speed, or the ability to automatically and fluently perform relatively easy cognitive tasks.
Participants were evaluated again after the 8 MAAT and supportive therapy videoconference visits, as well as 2 months after the conclusion of these therapies.
Compared with participants who received supportive therapy, MAAT participants reported significantly fewer memory problems (P=0.02) and improved processing speed post-treatment (P=0.03).
MAAT participants also reported less anxiety about cognitive problems compared with supportive therapy participants 2 months after MAAT concluded, but this was not a statistically significant finding.
“This is what we believe is the first randomized study with an active control condition that demonstrates improvement in cognitive symptoms in breast cancer survivors with long-term memory complaints,” Dr Ferguson said. “MAAT participants reported reduced anxiety and high satisfaction with this cognitive behavioral, non-drug approach.”
“Because treatment was delivered over videoconference device, this study demonstrates MAAT can be delivered electronically and survivors can reduce or eliminate travel to a cancer center. This can improve access to survivorship care.”
Dr Ferguson also noted that more research on MAAT is needed using a larger number of individuals with varied ethnic and cultural backgrounds and multiple clinicians delivering treatment. ![]()
Current cancer drug discovery method flawed, team says
Image courtesy of PNAS
The primary method used to test compounds for anticancer activity in vitro may produce inaccurate results, according to researchers.
Therefore, they have developed a new metric to evaluate a compound’s effect on cell proliferation—the drug-induced proliferation (DIP) rate.
They believe this metric, described in Nature Methods, overcomes the time-dependent bias of traditional proliferation assays.
“More than 90% of candidate cancer drugs fail in late-stage clinical trials, costing hundreds of millions of dollars,” said study author Vito Quaranta, MD, of Vanderbilt University School of Medicine in Nashville, Tennessee.
“The flawed in vitro drug discovery metric may not be the only responsible factor, but it may be worth pursuing an estimate of its impact.”
For more than 30 years, scientists have evaluated the ability of a compound to kill cells by adding the compound and counting how many cells are alive after 72 hours.
However, these proliferation assays, which measure cell number at a single time point, don’t take into account the bias introduced by exponential cell proliferation, even in the presence of the drug, said study author Darren Tyson, PhD, of Vanderbilt University School of Medicine.
“Cells are not uniform,” added Dr Quaranta. “They all proliferate exponentially but at different rates. At 72 hours, some cells will have doubled 3 times, and others will not have doubled at all.”
In addition, he noted, drugs don’t all behave the same way on every cell line. For example, a drug might have an immediate effect on one cell line and a delayed effect on another.
Therefore, he and his colleagues used a systems biology approach to demonstrate the time-dependent bias in static proliferation assays and to develop the time-independent DIP rate metric.
The researchers evaluated the responses of 4 different melanoma cell lines to the drug vemurafenib, currently used to treat melanoma, with the standard metric and with the DIP rate.
In one cell line, the team found a stark disagreement between the two metrics.
“The static metric says that the cell line is very sensitive to vemurafenib,” said Leonard Harris, PhD, of Vanderbilt University School of Medicine.
“However, our analysis shows this is not the case. A brief period of drug sensitivity, quickly followed by rebound, fools the static metric but not the DIP rate.”
The findings “suggest we should expect melanoma tumors treated with this drug to come back, and that’s what has happened, puzzling investigators,” Dr Quaranta said. “DIP rate analyses may help solve this conundrum, leading to better treatment strategies.”
These findings have particular importance in light of recent international efforts to generate data sets that include the responses of “thousands of cell lines to hundreds of compounds,” Dr Quaranta said.
The Cancer Cell Line Encyclopedia (CCLE) and Genomics of Drug Sensitivity in Cancer (GDSC) databases include drug response data along with genomic and proteomic data that detail each cell line’s molecular makeup.
“The idea is to look for statistical correlations—these particular cell lines with this particular makeup are sensitive to these types of compounds—to use these large databases as discovery tools for new therapeutic targets in cancer,” Dr Quaranta said. “If the metric by which you’ve evaluated the drug sensitivity of the cells is wrong, your statistical correlations are basically no good.” ![]()
Radiotherapy trial results going unpublished
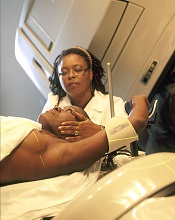
woman for radiotherapy
Photo by Rhoda Baer
TURIN, ITALY—Results from many phase 3 radiotherapy trials conducted in the US are not being published on ClincalTrials.gov, according to a study presented at ESTRO 35.
Since 2007, it has been mandatory to publish the results of clinical trials carried out in the US on ClinicalTrials.gov within 12 months of trial completion.
However, an analysis of more than 800 radiotherapy trials revealed that more than 80% did not meet this requirement.
Jaime Pérez-Alija, of Hospital Plató in Barcelona, Spain, and his colleagues presented these results at ESTRO 35 as abstract PV-0087.
In 2007, the Food and Drug Administration Amendments Act (FDAAA) mandated that sponsors of most US trials begin registering and reporting basic summary results on ClinicalTrials.gov so the American public could have access to the resulting data.
The requirement covers non-phase-1 trials of drugs, medical devices, or biologics that had at least 1 US research site. Trial results are to be reported by the sponsor within a year of completing data collection.
To investigate how well this mandate has been followed by sponsors of phase 3 radiotherapy trials, Pérez-Alija and his colleagues analyzed 802 trials with a primary completion date prior to January 1, 2013.
The team found that 81.7% of these trials (n=655) did not have even summary results published on ClinicalTrials.gov.
The researchers also looked specifically at those trials that began after the 2007 act was passed and found that 76.4% of these trials (422/552) did not have results published.
When the researchers looked at publication by cancer type, they found that 78% of lymphoma trial results were unpublished.
The most-published cancer type was glioblastoma, with 62.5% of results unpublished. And the least-published cancer types were anal and testicular cancers, for which 100% of trial results were unpublished.
“These findings came as a surprise for many reasons, not least of which was that many of the trials had been funded by the US National Institutes of Health,” Pérez-Alija said.
“Interestingly, we found that company-funded trials are far better at complying with the rules than academic trials—55% and 30% respectively. However, only one-third of all the trials we studied were company trials. Since we know that clinical trials produce the best data for decision-making in modern evidenced-based medicine, it is particularly worrying that the law is being ignored on such a wide scale.”
One possible reason for non-publication, according to the researchers, is that some of the trials may have been granted a deadline extension. However, if this is the case, it is not publicly known.
“Therefore, our first problem is that we do not know with any certainty whether a trial is truly overdue,” Pérez-Alija said. “The registry says clearly that all dates must be updated if an extension has been allowed, but it seems likely that this is not happening in many cases.”
The researchers are investigating the issue further to see, for example, how many of the trials registered in ClinicalTrials.gov or in other databases are being published in medical journals.
They intend to email principal investigators to ask why the mandatory deposition of results did not take place and to enquire about the reasons for non-publication in medical journals of those trials where there is a published deposition.
“We have shown that a large number of study participants are routinely exposed to the risks of trial participation without the benefits that sharing and publishing results would have for patients in the future,” Pérez-Alija said.
“Information about what was done and what was found in these trials could be lost forever, leading to bad treatment decisions, missed opportunities for good medicine, and trials being repeated unnecessarily. This situation should not be allowed to continue.” ![]()
One-time AMH level predicts rapid perimenopausal bone loss
BOSTON – Anti-Müllerian hormone levels strongly predict the rate of perimenopausal loss of bone mineral density and might help identify women who need early intervention to prevent future osteoporotic fractures, according to data from a review of 474 perimenopausal women that was presented at the annual meeting of the Endocrine Society.
The team matched anti-Müllerian hormone (AMH) levels and bone mineral density (BMD) measurements taken 2-4 years before the final menstrual period to BMD measurements taken 3 years later. The women were part of the Study of Women’s Health Across the Nation (SWAN), an ongoing multicenter study of women during their middle years.

When perimenopausal AMH “goes below 250 pg/mL, you are beginning to lose bone, and, when it goes below 200 pg/mL, you are losing bone fast, so that’s when you might want to intervene.” The finding “opens up the possibility of identifying women who are going to lose the most bone mass during the transition and targeting them before they have lost a substantial amount,” said lead investigator Dr. Arun Karlamangla of the department of geriatrics at the University of California, Los Angeles.
BMD loss is normal during menopause but rates of decline vary among women. AMH is a product of ovarian granulosa cells commonly used in fertility clinics to gauge ovarian reserve, but AMH levels also decline during menopause, and in a fairly stable fashion, he explained.
The women in SWAN were 42-52 years old at baseline with an intact uterus, at least one ovary, and no use of exogenous hormones. Blood was drawn during the early follicular phase of the menstrual cycle.
The median rate of BMD decline was 1.26% per year in the lumbar spine and 1.03% per year in the femoral neck. The median AMH was 49 pg/mL but varied widely.
Adjusted for age, body mass index, smoking, race, and study site, the team found that for each 75% (or fourfold) decrement in AMH level, there was a 0.15% per year faster decline in spine BMD and 0.13% per year faster decline in femoral neck BMD. Each fourfold decrement was also associated with an 18% increase in the odds of faster than median decline in spine BMD and 17% increase in the odds of faster than median decline in femoral neck BMD. The fast losers lost more than 2% of their BMD per year in both the lumbar spine and femoral neck.
The results were the same after adjustment for follicle-stimulating hormone and estrogen levels, “so AMH provides information that cannot be obtained from estrogen and FSH,” Dr. Karlamangla said.
He cautioned that the technique needs further development and validation before it’s ready for the clinic. The team used the PicoAMH test from Ansh Labs in Webster, Tex.
The investigators had no disclosures. Ansh provided the assays for free. SWAN is funded by the National Institutes of Health.
The current recommendation is to start bone mineral density screening in women at age 65 years. All of us who see patients in the menopause years worry that we are missing someone with faster than normal bone loss. Fast losers are critical to identify because if we wait until they are 65 years old, it’s too late. A clinical test such as this to identify fast losers for earlier BMD measurement would be a tremendous benefit.
Dr. Cynthia Stuenkel is a clinical professor of endocrinology at the University of California, San Diego. She moderated the presentation and was not involved in the research.
BOSTON – Anti-Müllerian hormone levels strongly predict the rate of perimenopausal loss of bone mineral density and might help identify women who need early intervention to prevent future osteoporotic fractures, according to data from a review of 474 perimenopausal women that was presented at the annual meeting of the Endocrine Society.
The team matched anti-Müllerian hormone (AMH) levels and bone mineral density (BMD) measurements taken 2-4 years before the final menstrual period to BMD measurements taken 3 years later. The women were part of the Study of Women’s Health Across the Nation (SWAN), an ongoing multicenter study of women during their middle years.
When perimenopausal AMH “goes below 250 pg/mL, you are beginning to lose bone, and, when it goes below 200 pg/mL, you are losing bone fast, so that’s when you might want to intervene.” The finding “opens up the possibility of identifying women who are going to lose the most bone mass during the transition and targeting them before they have lost a substantial amount,” said lead investigator Dr. Arun Karlamangla of the department of geriatrics at the University of California, Los Angeles.
BMD loss is normal during menopause but rates of decline vary among women. AMH is a product of ovarian granulosa cells commonly used in fertility clinics to gauge ovarian reserve, but AMH levels also decline during menopause, and in a fairly stable fashion, he explained.
The women in SWAN were 42-52 years old at baseline with an intact uterus, at least one ovary, and no use of exogenous hormones. Blood was drawn during the early follicular phase of the menstrual cycle.
The median rate of BMD decline was 1.26% per year in the lumbar spine and 1.03% per year in the femoral neck. The median AMH was 49 pg/mL but varied widely.
Adjusted for age, body mass index, smoking, race, and study site, the team found that for each 75% (or fourfold) decrement in AMH level, there was a 0.15% per year faster decline in spine BMD and 0.13% per year faster decline in femoral neck BMD. Each fourfold decrement was also associated with an 18% increase in the odds of faster than median decline in spine BMD and 17% increase in the odds of faster than median decline in femoral neck BMD. The fast losers lost more than 2% of their BMD per year in both the lumbar spine and femoral neck.
The results were the same after adjustment for follicle-stimulating hormone and estrogen levels, “so AMH provides information that cannot be obtained from estrogen and FSH,” Dr. Karlamangla said.
He cautioned that the technique needs further development and validation before it’s ready for the clinic. The team used the PicoAMH test from Ansh Labs in Webster, Tex.
The investigators had no disclosures. Ansh provided the assays for free. SWAN is funded by the National Institutes of Health.
AT ENDO 2016
Key clinical point: Anti-Müllerian hormone levels strongly predict the rate of perimenopausal bone mineral density loss and might help identify women who need early intervention to prevent future osteoporotic fractures, according to a review of 474 perimenopausal women that was presented at the Endocrine Society annual meeting.
Major finding: Adjusted for age, body mass index, smoking, race, and study site, the team found that for each 75% (or fourfold) decrement in AMH level, there was a 0.15% per year faster decline in lumbar spine BMD and 0.13% per year faster decline in femoral neck BMD.
Data source: Review of 474 perimenopausal women in the Study of Women’s Health Across the Nation.
Disclosures: The investigators had no disclosures. Ansh Labs provided the assays for free. SWAN is funded by the National Institutes of Health.