User login
FDA calls for more safety data, patient counseling for Essure
The Food and Drug Administration has ordered Bayer to conduct a 2,000-patient postmarketing study of the Essure implantable birth control device, to explore the risks it may pose to some women and examine how it is being employed in clinical practice.
Bayer, which manufactures the device, will also be required to add a boxed warning to the label, describing potential adverse events, and a “Patient Decision Checklist” to help guide preimplantation discussions, under draft guidance issued by the FDA on Feb. 29.
The 3-year observational study will compare data on complications, pregnancy, and pregnancy loss in Essure patients and in women who undergo bilateral tubal ligation, according to Dr. William Maisel, chief scientist at the FDA’s Center for Devices and Radiological Health.
“This will be a large observational study,” he said during an FDA press briefing on Feb. 29. “The specific questions will relate to overall complications rates; perforation, migration, and expulsion; chronic pelvic pain; abnormal uterine bleeding; allergy and hypersensitivity,” and obstetric outcomes.
Because FDA is requiring such a large patient cohort with long-term follow-up, final study results will be years away. Therefore, Bayer will be required to release data intermittently to keep the public well informed as research progresses, Dr. Maisel said.

The requested study will also examine why some patients don’t have a confirmation test to ensure that Essure has been properly placed 3 months after insertion – a key area that seems related to a number of reported adverse events, including pregnancy and device migration.
Despite the push for additional data, the FDA still believes that Essure is an appropriate and safe permanent option for the majority of women who want permanent birth control, Dr. Maisel said.
“It’s the only nonincisional form of permanent birth control. It requires no general anesthetic to insert, and most women go back to work in a day,” he said. “It is highly effective at preventing pregnancy, and it contains no drugs or hormones. Essure should remain an option for women seeking permanent birth control who are informed of its risks.”
Bayer officials said they will continue to work closely with the FDA to support the safe and effective use of the device.
“Patient safety and appropriate use of Essure are our greatest priorities,” Dr. Dario Mirski, senior vice president and head of medical affairs Americas at Bayer said in a statement. “A woman’s decision to choose a birth control method is a very important and personal one, and Bayer is committed to providing physicians with resources, tools, and information to help them counsel women about Essure.”
The boxed warning announced by the FDA will outline the adverse events that may be associated with Essure, including those that might occur during insertion and removal. The “Patient Decision Checklist” will be designed to help doctors stress the importance of the 3-month confirmation test to determine that it is correctly placed and that sufficient scar tissue has formed to prevent pregnancy. Both patient and physician will have to sign off on the checklist before the device is employed.
The FDA is seeking public comments on the proposed language for the warnings. The docket will be open for 60 days.
“The actions we are taking today will encourage important conversations between women and their doctors to help patients make more informed decisions about whether or not Essure is right for them,” said Dr. Maisel. “They also reflect our recognition that more rigorous research is needed to better understand if certain women are at heightened risk of complications.”
The draft guidance solidifies discussions that occurred last fall during a meeting of the FDA Obstetrics and Gynecology Devices Panel. During that meeting, the 19-member panel heard testimony from dozens of women who developed pain and other serious problems, including autoimmune diseases, after receiving Essure.
Since the device was approved in 2002, the FDA has received more than 5,000 complaints of such adverse reactions. These include 631 pregnancies and 294 pregnancy losses.
Between the September meeting and the FDA’s draft guidance announcement, the agency has received even more information from patients. A 22,000-person support group called Essure Problems collected and submitted a large amount of personal and clinical data. The package was submitted to the FDA on Feb. 22 and includes surgical notes and photos; letters from doctors and surgeons; pregnancy records; data on fetal death, ectopic pregnancies and miscarriage; and a series of electromicrographic images purporting to show defects of the coils’ metal ribbons.
The administrators of the Essure Problems groups blasted the FDA for requiring studies, rather than removing the device from the market. “These studies could take several years, and leaving the device on the market will only put more women’s lives at risk,” they wrote.
Rep. Mike Fitzpatrick (R-Pa.), who has been critical of Essure, said that the FDA’s actions are inadequate and said he will push for congressional action, including blocking government agencies from purchasing the device and revoking the FDA’s approval of Essure.
The Food and Drug Administration has ordered Bayer to conduct a 2,000-patient postmarketing study of the Essure implantable birth control device, to explore the risks it may pose to some women and examine how it is being employed in clinical practice.
Bayer, which manufactures the device, will also be required to add a boxed warning to the label, describing potential adverse events, and a “Patient Decision Checklist” to help guide preimplantation discussions, under draft guidance issued by the FDA on Feb. 29.
The 3-year observational study will compare data on complications, pregnancy, and pregnancy loss in Essure patients and in women who undergo bilateral tubal ligation, according to Dr. William Maisel, chief scientist at the FDA’s Center for Devices and Radiological Health.
“This will be a large observational study,” he said during an FDA press briefing on Feb. 29. “The specific questions will relate to overall complications rates; perforation, migration, and expulsion; chronic pelvic pain; abnormal uterine bleeding; allergy and hypersensitivity,” and obstetric outcomes.
Because FDA is requiring such a large patient cohort with long-term follow-up, final study results will be years away. Therefore, Bayer will be required to release data intermittently to keep the public well informed as research progresses, Dr. Maisel said.
The requested study will also examine why some patients don’t have a confirmation test to ensure that Essure has been properly placed 3 months after insertion – a key area that seems related to a number of reported adverse events, including pregnancy and device migration.
Despite the push for additional data, the FDA still believes that Essure is an appropriate and safe permanent option for the majority of women who want permanent birth control, Dr. Maisel said.
“It’s the only nonincisional form of permanent birth control. It requires no general anesthetic to insert, and most women go back to work in a day,” he said. “It is highly effective at preventing pregnancy, and it contains no drugs or hormones. Essure should remain an option for women seeking permanent birth control who are informed of its risks.”
Bayer officials said they will continue to work closely with the FDA to support the safe and effective use of the device.
“Patient safety and appropriate use of Essure are our greatest priorities,” Dr. Dario Mirski, senior vice president and head of medical affairs Americas at Bayer said in a statement. “A woman’s decision to choose a birth control method is a very important and personal one, and Bayer is committed to providing physicians with resources, tools, and information to help them counsel women about Essure.”
The boxed warning announced by the FDA will outline the adverse events that may be associated with Essure, including those that might occur during insertion and removal. The “Patient Decision Checklist” will be designed to help doctors stress the importance of the 3-month confirmation test to determine that it is correctly placed and that sufficient scar tissue has formed to prevent pregnancy. Both patient and physician will have to sign off on the checklist before the device is employed.
The FDA is seeking public comments on the proposed language for the warnings. The docket will be open for 60 days.
“The actions we are taking today will encourage important conversations between women and their doctors to help patients make more informed decisions about whether or not Essure is right for them,” said Dr. Maisel. “They also reflect our recognition that more rigorous research is needed to better understand if certain women are at heightened risk of complications.”
The draft guidance solidifies discussions that occurred last fall during a meeting of the FDA Obstetrics and Gynecology Devices Panel. During that meeting, the 19-member panel heard testimony from dozens of women who developed pain and other serious problems, including autoimmune diseases, after receiving Essure.
Since the device was approved in 2002, the FDA has received more than 5,000 complaints of such adverse reactions. These include 631 pregnancies and 294 pregnancy losses.
Between the September meeting and the FDA’s draft guidance announcement, the agency has received even more information from patients. A 22,000-person support group called Essure Problems collected and submitted a large amount of personal and clinical data. The package was submitted to the FDA on Feb. 22 and includes surgical notes and photos; letters from doctors and surgeons; pregnancy records; data on fetal death, ectopic pregnancies and miscarriage; and a series of electromicrographic images purporting to show defects of the coils’ metal ribbons.
The administrators of the Essure Problems groups blasted the FDA for requiring studies, rather than removing the device from the market. “These studies could take several years, and leaving the device on the market will only put more women’s lives at risk,” they wrote.
Rep. Mike Fitzpatrick (R-Pa.), who has been critical of Essure, said that the FDA’s actions are inadequate and said he will push for congressional action, including blocking government agencies from purchasing the device and revoking the FDA’s approval of Essure.

Stronger evidence links Zika to Guillain-Barré syndrome
Serological evidence from French Polynesia links an outbreak of Zika virus to a spike in cases of Guillain-Barré syndrome seen there in 2013-2014.
The research, published online Feb. 29 in The Lancet, is the first to use a case-control design to demonstrate that Zika, a mosquito-borne flavivirus, is associated with Guillain-Barré syndrome (Lancet. 2016 Feb 29. doi: 10.1016/S0140-6736(16)00562-6).
Guillain-Barré syndrome (GBS) is an immune-mediated flaccid paralysis that can follow viral or bacterial infections. Most patients with GBS recover with intensive care in hospitals, although the syndrome can be permanently debilitating or, in rare cases, fatal.

As a large outbreak of Zika continues in Central and South America, hospitals should be prepared for excess GBS cases, the authors of the study say, and assure adequate intensive-care capacity to treat them. Based on the 66% attack rate of Zika during the French Polynesia outbreak, investigators estimated the incidence of GBS at 0.24 per 1,000 Zika infections, but noted that it could be different in the current outbreak.
Dr. Van-Mai Cao-Lormeau of the Unit of Emerging Infectious Diseases at Institut Louis Malardé in Papeete, French Polynesia, alongside colleagues in France and French Polynesia, used a case-control design to compare serological samples from 42 patients (74% male) diagnosed at a Tahiti hospital with GBS with samples from age-and sex-matched patients who presented at the same hospital, also during the time of the outbreak, with a nonfebrile illness (n = 98) or with acute Zika disease without neurological symptoms (n = 70).
The investigators found that all but one patient with GBS had Zika virus antibodies, and all of them had neutralizing antibodies to Zika virus. By comparison, only 56% (n = 54) of the control group admitted with nonfebrile illness had neutralizing antibodies (P less than .0001).
Also, 93% of the GBS patients had Zika virus immunoglobulin M (IgM) and 88% reported symptoms consistent with Zika infection a mean of 6 days before onset of neurological symptoms. Acute Zika infection is usually characterized by rash, fever, and conjunctivitis.
Past dengue virus infection, which had been considered a possible risk factor for Zika-mediated GBS, did not differ significantly between patients in the control groups and those with GBS.
The investigators were also able to subtype the clinical characteristics of the GBS cases as consistent with acute motor axonal neuropathy, or AMAN, phenotype. However, the antibodies typically seen associated with AMAN were not seen in these patients, leading investigators to suspect that a different biological pathway was responsible.
More than a third of the GBS patients in the study required intensive care, most of these also with respiratory support, though none died.
The government of France, the European Union, and the Wellcome Trust funded the study. The researchers declared that they had no competing interests.
Zika virus can be added to our list of viruses that can cause Guillain-Barré syndrome, and investigation of these cases should include tests for Zika when there is a possibility of infection by that virus. Whether Zika will be proven to pose a greater threat in causing Guillain-Barré syndrome than its various flavivirus cousins remains to be determined. A little caution should be taken because the data are still scarce and we do not know whether the current Zika virus is identical to that in previous outbreaks, whether it will behave exactly the same in a different population with a different genetic and immunity background, or whether a cofactor or co-infection is responsible. Reassuringly, the investigators did not find any evidence that previous dengue infection enhanced the severity of the disease, which could substantially have increased the threat in areas of regular activity.
Dr. David W. Smith is a clinical professor of pathology and laboratory medicine at the University of Western Australia in Perth. John Mackenzie, Ph.D., is a professor of tropical and infectious diseases at Curtin University in Bentley, Australia. They had no competing interests to disclose.
Serological evidence from French Polynesia links an outbreak of Zika virus to a spike in cases of Guillain-Barré syndrome seen there in 2013-2014.
The research, published online Feb. 29 in The Lancet, is the first to use a case-control design to demonstrate that Zika, a mosquito-borne flavivirus, is associated with Guillain-Barré syndrome (Lancet. 2016 Feb 29. doi: 10.1016/S0140-6736(16)00562-6).
Guillain-Barré syndrome (GBS) is an immune-mediated flaccid paralysis that can follow viral or bacterial infections. Most patients with GBS recover with intensive care in hospitals, although the syndrome can be permanently debilitating or, in rare cases, fatal.
As a large outbreak of Zika continues in Central and South America, hospitals should be prepared for excess GBS cases, the authors of the study say, and assure adequate intensive-care capacity to treat them. Based on the 66% attack rate of Zika during the French Polynesia outbreak, investigators estimated the incidence of GBS at 0.24 per 1,000 Zika infections, but noted that it could be different in the current outbreak.
Dr. Van-Mai Cao-Lormeau of the Unit of Emerging Infectious Diseases at Institut Louis Malardé in Papeete, French Polynesia, alongside colleagues in France and French Polynesia, used a case-control design to compare serological samples from 42 patients (74% male) diagnosed at a Tahiti hospital with GBS with samples from age-and sex-matched patients who presented at the same hospital, also during the time of the outbreak, with a nonfebrile illness (n = 98) or with acute Zika disease without neurological symptoms (n = 70).
The investigators found that all but one patient with GBS had Zika virus antibodies, and all of them had neutralizing antibodies to Zika virus. By comparison, only 56% (n = 54) of the control group admitted with nonfebrile illness had neutralizing antibodies (P less than .0001).
Also, 93% of the GBS patients had Zika virus immunoglobulin M (IgM) and 88% reported symptoms consistent with Zika infection a mean of 6 days before onset of neurological symptoms. Acute Zika infection is usually characterized by rash, fever, and conjunctivitis.
Past dengue virus infection, which had been considered a possible risk factor for Zika-mediated GBS, did not differ significantly between patients in the control groups and those with GBS.
The investigators were also able to subtype the clinical characteristics of the GBS cases as consistent with acute motor axonal neuropathy, or AMAN, phenotype. However, the antibodies typically seen associated with AMAN were not seen in these patients, leading investigators to suspect that a different biological pathway was responsible.
More than a third of the GBS patients in the study required intensive care, most of these also with respiratory support, though none died.
The government of France, the European Union, and the Wellcome Trust funded the study. The researchers declared that they had no competing interests.
FROM THE LANCET
Key clinical point: Acute infection with Zika virus in French Polynesia was associated with Guillain-Barré syndrome.
Major finding: Among GBS patients admitted to hospitals during an 2013-2014 outbreak of Zika virus, nearly all had antibodies or neutralizing antibodies to Zika, vs. 56% of age and sex-matched controls (P less than .0001).
Data source: A case-cohort study comparing blood results from 42 GBS cases and two cohorts of controls, one with acute Zika infection without GBS (n = 70) and another admitted during the outbreak for other illnesses (n = 98).
Disclosures: The French government, the European Union, and the Wellcome Trust sponsored the study. Investigators disclosed no conflicts of interest.

Increase in Blood Pressure May Improve Survival in TBI
SAN DIEGO—In the setting of traumatic brain injury (TBI), increases in systolic blood pressure after the blood pressure nadir are independently associated with improved survival in patients with hypotension. In addition, even substantial blood pressure increases do not seem to harm patients with normal blood pressure. These findings come from a subanalysis of the ongoing Excellence in Prehospital Injury Care (EPIC) TBI study.
“Little is known about the patterns of blood pressure in TBI in the field,” said Daniel W. Spaite, MD, Professor and Virginia Piper Endowed Chair of Emergency Medicine at the University of Arizona in Tucson, at the Annual Meeting of the National Association of EMS Physicians (NAEMSP). “For instance, nobody knows whether it’s better to have your blood pressure increasing, stable, or decreasing in the field with regard to outcome, especially mortality. Typical studies that do have EMS data linked only have a single blood pressure measurement documented, so there’s no knowledge of trends in EMS blood pressure in TBI.”

Dr. Spaite and his colleagues evaluated the association between mortality and increases in prehospital systolic blood pressure after the lowest recorded measurement in patients with major TBI who are part of the EPIC study, the statewide implementation of TBI guidelines from the Brain Trauma Foundation and the NAEMSP. Data sources include the Arizona State Trauma Registry, which has comprehensive hospital outcome data. “The cases are then linked, and the EMS patient care reports are carefully abstracted by the EPIC data team,” Dr. Spaite explained. “This included major TBI (which is, clinically, both moderate and severe) and all patients whose lowest systolic blood pressure was between 40 and 300 mmHg.”
The researchers used logistic regression to examine the association between the increase in EMS systolic blood pressure after the lowest EMS blood pressure recorded and its association with adjusted probability of death. They then separated the study population into four cohorts, based on each patient’s prehospital systolic blood pressure (ie, 40–89 mmHg, 90–139 mmHg, 140–159 mmHg, and 160–300 mmHg). In each cohort, they identified the independent association between the magnitude of increase in systolic blood pressure and the adjusted probability of death.
Dr. Spaite reported findings from 14,567 patients with TBI. More than two-thirds (68%) of participants were male, and their mean age was 45. The researchers observed that in the hypotensive cohort, mortality dropped significantly if the systolic blood pressure increased after the lowest recorded systolic blood pressure. “Improvements were dramatic with increases of 40–80 mmHg,” he said. In the normotensive group, increases in systolic blood pressure were associated with slight reductions in mortality. Large increases in systolic blood pressure, such as in the range of 70–90 mmHg, did not appear to be detrimental.In the mildly hypertensive group, large systolic increases were associated with higher mortality. “Interestingly, even if your lowest [systolic blood pressure] is between 140 and 159 mmHg, until you get above an increase of 40 mmHg above that, you don’t start seeing increases in mortality,” said Dr. Spaite. In the severely hypertensive group, mortality was higher with any subsequent increase in systolic blood pressure, “which doesn’t surprise any of us,” he said. “It’s dramatically higher if the increase is large.”
Dr. Spaite emphasized that the current analysis is based on observational data, “so this does not prove that treating hypotension improves outcome. … That direct question is part of the EPIC study itself and awaits the final analysis, hopefully in mid-2017. This is the first large report of blood pressure trends in the prehospital management of TBI.”
He concluded that the current findings in the hypotensive and normotensive cohorts “support guideline recommendations for restoring and optimizing cerebral perfusion in EMS TBI management. What is fascinating about the literature is that the focus in TBI has always been on hypotension, but there’s very little information about what’s the best or the optimal blood pressure.”
—Doug Brunk
SAN DIEGO—In the setting of traumatic brain injury (TBI), increases in systolic blood pressure after the blood pressure nadir are independently associated with improved survival in patients with hypotension. In addition, even substantial blood pressure increases do not seem to harm patients with normal blood pressure. These findings come from a subanalysis of the ongoing Excellence in Prehospital Injury Care (EPIC) TBI study.
“Little is known about the patterns of blood pressure in TBI in the field,” said Daniel W. Spaite, MD, Professor and Virginia Piper Endowed Chair of Emergency Medicine at the University of Arizona in Tucson, at the Annual Meeting of the National Association of EMS Physicians (NAEMSP). “For instance, nobody knows whether it’s better to have your blood pressure increasing, stable, or decreasing in the field with regard to outcome, especially mortality. Typical studies that do have EMS data linked only have a single blood pressure measurement documented, so there’s no knowledge of trends in EMS blood pressure in TBI.”
Dr. Spaite and his colleagues evaluated the association between mortality and increases in prehospital systolic blood pressure after the lowest recorded measurement in patients with major TBI who are part of the EPIC study, the statewide implementation of TBI guidelines from the Brain Trauma Foundation and the NAEMSP. Data sources include the Arizona State Trauma Registry, which has comprehensive hospital outcome data. “The cases are then linked, and the EMS patient care reports are carefully abstracted by the EPIC data team,” Dr. Spaite explained. “This included major TBI (which is, clinically, both moderate and severe) and all patients whose lowest systolic blood pressure was between 40 and 300 mmHg.”
The researchers used logistic regression to examine the association between the increase in EMS systolic blood pressure after the lowest EMS blood pressure recorded and its association with adjusted probability of death. They then separated the study population into four cohorts, based on each patient’s prehospital systolic blood pressure (ie, 40–89 mmHg, 90–139 mmHg, 140–159 mmHg, and 160–300 mmHg). In each cohort, they identified the independent association between the magnitude of increase in systolic blood pressure and the adjusted probability of death.
Dr. Spaite reported findings from 14,567 patients with TBI. More than two-thirds (68%) of participants were male, and their mean age was 45. The researchers observed that in the hypotensive cohort, mortality dropped significantly if the systolic blood pressure increased after the lowest recorded systolic blood pressure. “Improvements were dramatic with increases of 40–80 mmHg,” he said. In the normotensive group, increases in systolic blood pressure were associated with slight reductions in mortality. Large increases in systolic blood pressure, such as in the range of 70–90 mmHg, did not appear to be detrimental.In the mildly hypertensive group, large systolic increases were associated with higher mortality. “Interestingly, even if your lowest [systolic blood pressure] is between 140 and 159 mmHg, until you get above an increase of 40 mmHg above that, you don’t start seeing increases in mortality,” said Dr. Spaite. In the severely hypertensive group, mortality was higher with any subsequent increase in systolic blood pressure, “which doesn’t surprise any of us,” he said. “It’s dramatically higher if the increase is large.”
Dr. Spaite emphasized that the current analysis is based on observational data, “so this does not prove that treating hypotension improves outcome. … That direct question is part of the EPIC study itself and awaits the final analysis, hopefully in mid-2017. This is the first large report of blood pressure trends in the prehospital management of TBI.”
He concluded that the current findings in the hypotensive and normotensive cohorts “support guideline recommendations for restoring and optimizing cerebral perfusion in EMS TBI management. What is fascinating about the literature is that the focus in TBI has always been on hypotension, but there’s very little information about what’s the best or the optimal blood pressure.”
—Doug Brunk

The microbiome in celiac disease: Beyond diet-genetic interactions
Evidence points to the mix of bacteria that make the gut their home, collectively called the microbiome.
INHERITING THE WRONG GENES and eating the wrong food (ie, gluten) are necessary for celiac disease to develop, but are not enough by themselves. Something else must be contributing, and evidence is pointing to the mix of bacteria that make our guts their home, collectively called the microbiome.
Celiac disease is a highly prevalent, chronic, immune-mediated form of enteropathy.1 It affects 0.5% to 1% of the population, and although it is mostly seen in people of northern European descent, those in other populations can develop the disease as well. Historically, celiac disease was classified as an infant condition. However, it now commonly presents later in life (between ages 10 and 40) and often with extraintestinal manifestations.2
In this issue of Cleveland Clinic Journal of Medicine, Kochhar et al provide a comprehensive updated review of celiac disease.3
GENES AND GLUTEN ARE NECESSARY BUT NOT SUFFICIENT
Although genetic factors and exposure to gluten in the diet are proven to be necessary for celiac disease to develop, they are not sufficient. Evidence of this is in the numbers; although one-third of the general population carries the HLA susceptibility genes (specifically HLA-DQ2 and DQ8),4 only 2% to 5% of people with these genes develop clinically evident celiac disease.
Additional environmental factors must be contributing to disease development, but these other factors are poorly understood. Some of the possible culprits that might influence the risk of disease occurrence and the timing of its onset include5:
- The amount and quality of gluten ingested—the higher the concentration of gluten, the higher the risk, and different grains have gluten varieties with more or less immunogenic capabilities, ie, T-cell activation properties
- The pattern of infant feeding—the risk may be lower with breastfeeding than with formula
- The age at which gluten is introduced into the diet—the risk may be higher if gluten is introduced earlier.6
More recently, studies of the pathogenesis of celiac disease and gene-environmental interactions have expanded beyond host predisposition and dietary factors.
OUR BODIES, OUR MICROBIOMES: A SYMBIOTIC RELATIONSHIP
The role of the human microbiome in autoimmune disease is now being elucidated.7 Remarkably, the microorganisms living in our bodies outnumber our body cells by a factor of 10, and their genomes vastly exceed our own protein-coding genome capabilities by a factor of 100.
The gut microbiome is now considered a true bioreactor with enzymatic and immunologic capabilities beyond (and complementary to) those of its host. The commensal microbiome of the host intestine provides benefits that can be broken down into three broad categories:
- Nutritional—producing essential amino acids and vitamins
- Metabolic—degrading complex polysaccharides from dietary fibers
- Immunologic—shaping the host immune system while cooperating with it against pathogenic microorganisms.
The immunologic function is highly relevant. We have coevolved with our bacteria in a mutually beneficial, symbiotic relationship in which we maintain an active state of low inflammation so that a constant bacterial and dietary antigenic load can be tolerated.
Is there a core human microbiome shared by all individuals? And what is the impact of altering the relative microbial composition (dysbiosis) in physiologic and disease states? To find out, the National Institutes of Health launched the Human Microbiome Project8 in 2008. Important tools in this work include novel culture-independent approaches (high-throughput DNA sequencing and whole-microbiome “shotgun” sequencing with metagenomic analysis) and computational analytical tools.9
An accumulating body of evidence is now available from animal models and human studies correlating states of intestinal dysbiosis (disruption in homeostatic community composition) with various disease processes. These have ranged from inflammatory bowel disease to systemic autoimmune disorders such as psoriasis, inflammatory arthropathies, and demyelinating central nervous system diseases.10–14
RESEARCH INTO THE MICROBIOME IN CELIAC DISEASE
Celiac disease has also served as a unique model for studying this biologic relationship, and the microbiome has been postulated to have a role in its pathogenesis.15 Multiple clinical studies demonstrate that a state of intestinal dysbiosis is indeed associated with celiac disease.
Specifically, decreases in the abundance of Firmicutes spp and increases in Proteobacteria spp have been detected in both children and adults with active celiac disease.16,17 Intriguingly, overrepresentation of Proteobacteria was also correlated with disease activity. Other studies have reported decreases in the proportion of reportedly protective, anti-inflammatory bacteria such as Bifidobacterium and increases in the proportion of Bacteroides and Escherichia coli in patients with active disease.18,19 Altered diversity and altered metabolic function, ie, decreased concentration of protective short-chain fatty acids of the microbiota, have also been reported in patients with celiac disease.19,20
To move beyond correlative studies and mechanistically address the possibility of causation, multiple groups have used a gnotobiotic approach, ie, maintaining animals under germ-free conditions and incorporating microbes of interest. This approach is highly relevant in studying whether the bacterial community composition is capable of modulating loss of tolerance to gluten in genetically susceptible hosts. A few notable examples have been published.
In germ-free rats, long-term feeding of gliadin, but not albumin, from birth until 2 months of age induced moderate small-intestinal damage.21 Similarly, germ-free nonobese diabetic-DQ8 mice developed more severe gluten-induced disease than mice with normal intestinal bacteria.22
These findings suggest that the normal gut microbiome may have intrinsic beneficial properties capable of reducing the inflammatory effects associated with gluten ingestion. Notably, the specific composition of the intestinal microbiome can define the fate of gluten-induced pathology. Mice colonized with commensal microbiota are indeed protected from gluten-induced pathology, while mice colonized with Proteobacteria spp develop a moderate degree of gluten-induced disease. When Escherichia coli derived from patients with celiac disease is added to commensal colonization, the celiac disease-like phenotype develops.23
Taken together, these studies support the hypothesis that the intestinal microbiome may be another environmental factor involved in the development of celiac disease.
QUESTIONS AND CHALLENGES REMAIN
The results of clinical studies are not necessarily consistent at the taxonomy level. The fields of metagenomics, which investigates all genes and their enzymatic function in a given community, and metabolomics, which identifies bacterial end-products, characterizing their functional capabilities, are still in their infancy and will be required to further investigate functionality of the altered microbiome in celiac disease.
Second, the directionality—the causality or consequences of this dysbiosis—and timing—the moment at which changes occur, ie, after introducing gluten or at the time when symptoms appear—remain elusive, and prospective studies in humans will be essential.
Finally, more mechanistic studies in animal models are needed to dissect the host immune response to dietary gluten and perturbation of intestinal community composition. This may lead to the possibility of future interventions in the form of prebiotics, probiotics, or specific metabolites, complementary to gluten avoidance.
In the meantime, increasing disease awareness and rapid diagnosis and treatment continue to be of utmost importance to address the clinical consequences of celiac disease in both children and adults.
Supported by: Grant No. K23AR064318 from NIAMS to Dr. Scher; The Colton Center for Autoimmunity; The Riley Family Foundation.
- Guandalini S, Assiri A. Celiac disease: a review. JAMA Pediatr 2014; 168:272–278.
- Green PH, Cellier C. Celiac disease. N Engl J Med 2007; 357:1731–1743.
- Kochhar GS, Singh T, Gill A, Kirby DF. Celiac disease: an internist’s perspective. Cleve Clin J Med 2016; 83:217–227.
- Gutierrez-Achury J, Zhernakova A, Pulit SL, et al. Fine mapping in the MHC region accounts for 18% additional genetic risk for celiac disease. Nat Genet 2015; 47:577–578.
- Catassi C, Kryszak D, Bhatti B, et al. Natural history of celiac disease autoimmunity in a USA cohort followed since 1974. Ann Med 2010; 42:530–538.
- Norris JM, Barriga K, Hoffenberg EJ, et al. Risk of celiac disease autoimmunity and timing of gluten introduction in the diet of infants at increased risk of disease. JAMA 2005; 293:2343–2351.
- Turnbaugh PJ, Ley RE, Hamady M, Fraser-Liggett CM, Knight R, Gordon JI. The human microbiome project. Nature 2007; 449:804–810.
- NIH HMP Working Group; Peterson J, Garges S, Giovanni M, et al. The NIH Human Microbiome Project. Genome Res 2009; 19:2317–2323.
- Qin J, Li R, Raes J, et al. A human gut microbial gene catalogue established by metagenomic sequencing. Nature 2010; 464:59–65.
- Scher JU, Sczesnak A, Longman RS, et al. Expansion of intestinal Prevotella copri correlates with enhanced susceptibility to arthritis. Elife 2013; 2:e01202.
- Scher JU, Ubeda C, Artacho A, et al. Decreased bacterial diversity characterizes the altered gut microbiota in patients with psoriatic arthritis, resembling dysbiosis in inflammatory bowel disease. Arthritis Rheumatol 2015; 67:128–139.
- Gao Z, Tseng CH, Strober BE, Pei Z, Blaser MJ. Substantial alterations of the cutaneous bacterial biota in psoriatic lesions. PLoS One 2008; 3:e2719.
- Hsiao EY, McBride SW, Hsien S, et al. Microbiota modulate behavioral and physiological abnormalities associated with neurodevelopmental disorders. Cell 2013; 155:1451–1463.
- Gevers D, Kugathasan S, Denson LA, et al. The treatment-naive microbiome in new-onset Crohn‘s disease. Cell Host Microbe 2014; 15:382–392.
- Verdu EF, Galipeau HJ, Jabri B. Novel players in coeliac disease pathogenesis: role of the gut microbiota. Nat Rev Gastroenterol Hepatol 2015; 12:497–506.
- Sanchez E, Donat E, Ribes-Koninckx C, Fernandez-Murga ML, Sanz Y. Duodenal-mucosal bacteria associated with celiac disease in children. Appl Environ Microbiol 2013; 79:5472–5479.
- Wacklin P, Kaukinen K, Tuovinen E, et al. The duodenal microbiota composition of adult celiac disease patients is associated with the clinical manifestation of the disease. Inflamm Bowel Dis 2013; 19:934–941.
- Collado MC, Donat E, Ribes-Koninckx C, Calabuig M, Sanz Y. Specific duodenal and faecal bacterial groups associated with paediatric coeliac disease. J Clin Pathol 2009; 62:264–269.
- Di Cagno R, De Angelis M, De Pasquale I, et al. Duodenal and faecal microbiota of celiac children: molecular, phenotype and metabolome characterization. BMC Microbiol 2011; 11:219.
- Schippa S, Iebba V, Barbato M, et al. A distinctive ‘microbial signature’ in celiac pediatric patients. BMC Microbiol 2010; 10:175.
- Stepankova R, Tlaskalova-Hogenova H, Sinkora J, Jodl J, Fric P. Changes in jejunal mucosa after long-term feeding of germfree rats with gluten. Scand J Gastroenterol 1996; 31:551–557.
- Galipeau HJ, Rulli NE, Jury J, et al. Sensitization to gliadin induces moderate enteropathy and insulitis in nonobese diabetic-DQ8 mice. J Immunol 2011; 187:4338–4346.
- Galipeau HJ, Verdu EF. Gut microbes and adverse food reactions: focus on gluten related disorders. Gut Microbes 2014; 5:594–605.
Evidence points to the mix of bacteria that make the gut their home, collectively called the microbiome.
Evidence points to the mix of bacteria that make the gut their home, collectively called the microbiome.
INHERITING THE WRONG GENES and eating the wrong food (ie, gluten) are necessary for celiac disease to develop, but are not enough by themselves. Something else must be contributing, and evidence is pointing to the mix of bacteria that make our guts their home, collectively called the microbiome.
Celiac disease is a highly prevalent, chronic, immune-mediated form of enteropathy.1 It affects 0.5% to 1% of the population, and although it is mostly seen in people of northern European descent, those in other populations can develop the disease as well. Historically, celiac disease was classified as an infant condition. However, it now commonly presents later in life (between ages 10 and 40) and often with extraintestinal manifestations.2
In this issue of Cleveland Clinic Journal of Medicine, Kochhar et al provide a comprehensive updated review of celiac disease.3
GENES AND GLUTEN ARE NECESSARY BUT NOT SUFFICIENT
Although genetic factors and exposure to gluten in the diet are proven to be necessary for celiac disease to develop, they are not sufficient. Evidence of this is in the numbers; although one-third of the general population carries the HLA susceptibility genes (specifically HLA-DQ2 and DQ8),4 only 2% to 5% of people with these genes develop clinically evident celiac disease.
Additional environmental factors must be contributing to disease development, but these other factors are poorly understood. Some of the possible culprits that might influence the risk of disease occurrence and the timing of its onset include5:
- The amount and quality of gluten ingested—the higher the concentration of gluten, the higher the risk, and different grains have gluten varieties with more or less immunogenic capabilities, ie, T-cell activation properties
- The pattern of infant feeding—the risk may be lower with breastfeeding than with formula
- The age at which gluten is introduced into the diet—the risk may be higher if gluten is introduced earlier.6
More recently, studies of the pathogenesis of celiac disease and gene-environmental interactions have expanded beyond host predisposition and dietary factors.
OUR BODIES, OUR MICROBIOMES: A SYMBIOTIC RELATIONSHIP
The role of the human microbiome in autoimmune disease is now being elucidated.7 Remarkably, the microorganisms living in our bodies outnumber our body cells by a factor of 10, and their genomes vastly exceed our own protein-coding genome capabilities by a factor of 100.
The gut microbiome is now considered a true bioreactor with enzymatic and immunologic capabilities beyond (and complementary to) those of its host. The commensal microbiome of the host intestine provides benefits that can be broken down into three broad categories:
- Nutritional—producing essential amino acids and vitamins
- Metabolic—degrading complex polysaccharides from dietary fibers
- Immunologic—shaping the host immune system while cooperating with it against pathogenic microorganisms.
The immunologic function is highly relevant. We have coevolved with our bacteria in a mutually beneficial, symbiotic relationship in which we maintain an active state of low inflammation so that a constant bacterial and dietary antigenic load can be tolerated.
Is there a core human microbiome shared by all individuals? And what is the impact of altering the relative microbial composition (dysbiosis) in physiologic and disease states? To find out, the National Institutes of Health launched the Human Microbiome Project8 in 2008. Important tools in this work include novel culture-independent approaches (high-throughput DNA sequencing and whole-microbiome “shotgun” sequencing with metagenomic analysis) and computational analytical tools.9
An accumulating body of evidence is now available from animal models and human studies correlating states of intestinal dysbiosis (disruption in homeostatic community composition) with various disease processes. These have ranged from inflammatory bowel disease to systemic autoimmune disorders such as psoriasis, inflammatory arthropathies, and demyelinating central nervous system diseases.10–14
RESEARCH INTO THE MICROBIOME IN CELIAC DISEASE
Celiac disease has also served as a unique model for studying this biologic relationship, and the microbiome has been postulated to have a role in its pathogenesis.15 Multiple clinical studies demonstrate that a state of intestinal dysbiosis is indeed associated with celiac disease.
Specifically, decreases in the abundance of Firmicutes spp and increases in Proteobacteria spp have been detected in both children and adults with active celiac disease.16,17 Intriguingly, overrepresentation of Proteobacteria was also correlated with disease activity. Other studies have reported decreases in the proportion of reportedly protective, anti-inflammatory bacteria such as Bifidobacterium and increases in the proportion of Bacteroides and Escherichia coli in patients with active disease.18,19 Altered diversity and altered metabolic function, ie, decreased concentration of protective short-chain fatty acids of the microbiota, have also been reported in patients with celiac disease.19,20
To move beyond correlative studies and mechanistically address the possibility of causation, multiple groups have used a gnotobiotic approach, ie, maintaining animals under germ-free conditions and incorporating microbes of interest. This approach is highly relevant in studying whether the bacterial community composition is capable of modulating loss of tolerance to gluten in genetically susceptible hosts. A few notable examples have been published.
In germ-free rats, long-term feeding of gliadin, but not albumin, from birth until 2 months of age induced moderate small-intestinal damage.21 Similarly, germ-free nonobese diabetic-DQ8 mice developed more severe gluten-induced disease than mice with normal intestinal bacteria.22
These findings suggest that the normal gut microbiome may have intrinsic beneficial properties capable of reducing the inflammatory effects associated with gluten ingestion. Notably, the specific composition of the intestinal microbiome can define the fate of gluten-induced pathology. Mice colonized with commensal microbiota are indeed protected from gluten-induced pathology, while mice colonized with Proteobacteria spp develop a moderate degree of gluten-induced disease. When Escherichia coli derived from patients with celiac disease is added to commensal colonization, the celiac disease-like phenotype develops.23
Taken together, these studies support the hypothesis that the intestinal microbiome may be another environmental factor involved in the development of celiac disease.
QUESTIONS AND CHALLENGES REMAIN
The results of clinical studies are not necessarily consistent at the taxonomy level. The fields of metagenomics, which investigates all genes and their enzymatic function in a given community, and metabolomics, which identifies bacterial end-products, characterizing their functional capabilities, are still in their infancy and will be required to further investigate functionality of the altered microbiome in celiac disease.
Second, the directionality—the causality or consequences of this dysbiosis—and timing—the moment at which changes occur, ie, after introducing gluten or at the time when symptoms appear—remain elusive, and prospective studies in humans will be essential.
Finally, more mechanistic studies in animal models are needed to dissect the host immune response to dietary gluten and perturbation of intestinal community composition. This may lead to the possibility of future interventions in the form of prebiotics, probiotics, or specific metabolites, complementary to gluten avoidance.
In the meantime, increasing disease awareness and rapid diagnosis and treatment continue to be of utmost importance to address the clinical consequences of celiac disease in both children and adults.
Supported by: Grant No. K23AR064318 from NIAMS to Dr. Scher; The Colton Center for Autoimmunity; The Riley Family Foundation.
- Guandalini S, Assiri A. Celiac disease: a review. JAMA Pediatr 2014; 168:272–278.
- Green PH, Cellier C. Celiac disease. N Engl J Med 2007; 357:1731–1743.
- Kochhar GS, Singh T, Gill A, Kirby DF. Celiac disease: an internist’s perspective. Cleve Clin J Med 2016; 83:217–227.
- Gutierrez-Achury J, Zhernakova A, Pulit SL, et al. Fine mapping in the MHC region accounts for 18% additional genetic risk for celiac disease. Nat Genet 2015; 47:577–578.
- Catassi C, Kryszak D, Bhatti B, et al. Natural history of celiac disease autoimmunity in a USA cohort followed since 1974. Ann Med 2010; 42:530–538.
- Norris JM, Barriga K, Hoffenberg EJ, et al. Risk of celiac disease autoimmunity and timing of gluten introduction in the diet of infants at increased risk of disease. JAMA 2005; 293:2343–2351.
- Turnbaugh PJ, Ley RE, Hamady M, Fraser-Liggett CM, Knight R, Gordon JI. The human microbiome project. Nature 2007; 449:804–810.
- NIH HMP Working Group; Peterson J, Garges S, Giovanni M, et al. The NIH Human Microbiome Project. Genome Res 2009; 19:2317–2323.
- Qin J, Li R, Raes J, et al. A human gut microbial gene catalogue established by metagenomic sequencing. Nature 2010; 464:59–65.
- Scher JU, Sczesnak A, Longman RS, et al. Expansion of intestinal Prevotella copri correlates with enhanced susceptibility to arthritis. Elife 2013; 2:e01202.
- Scher JU, Ubeda C, Artacho A, et al. Decreased bacterial diversity characterizes the altered gut microbiota in patients with psoriatic arthritis, resembling dysbiosis in inflammatory bowel disease. Arthritis Rheumatol 2015; 67:128–139.
- Gao Z, Tseng CH, Strober BE, Pei Z, Blaser MJ. Substantial alterations of the cutaneous bacterial biota in psoriatic lesions. PLoS One 2008; 3:e2719.
- Hsiao EY, McBride SW, Hsien S, et al. Microbiota modulate behavioral and physiological abnormalities associated with neurodevelopmental disorders. Cell 2013; 155:1451–1463.
- Gevers D, Kugathasan S, Denson LA, et al. The treatment-naive microbiome in new-onset Crohn‘s disease. Cell Host Microbe 2014; 15:382–392.
- Verdu EF, Galipeau HJ, Jabri B. Novel players in coeliac disease pathogenesis: role of the gut microbiota. Nat Rev Gastroenterol Hepatol 2015; 12:497–506.
- Sanchez E, Donat E, Ribes-Koninckx C, Fernandez-Murga ML, Sanz Y. Duodenal-mucosal bacteria associated with celiac disease in children. Appl Environ Microbiol 2013; 79:5472–5479.
- Wacklin P, Kaukinen K, Tuovinen E, et al. The duodenal microbiota composition of adult celiac disease patients is associated with the clinical manifestation of the disease. Inflamm Bowel Dis 2013; 19:934–941.
- Collado MC, Donat E, Ribes-Koninckx C, Calabuig M, Sanz Y. Specific duodenal and faecal bacterial groups associated with paediatric coeliac disease. J Clin Pathol 2009; 62:264–269.
- Di Cagno R, De Angelis M, De Pasquale I, et al. Duodenal and faecal microbiota of celiac children: molecular, phenotype and metabolome characterization. BMC Microbiol 2011; 11:219.
- Schippa S, Iebba V, Barbato M, et al. A distinctive ‘microbial signature’ in celiac pediatric patients. BMC Microbiol 2010; 10:175.
- Stepankova R, Tlaskalova-Hogenova H, Sinkora J, Jodl J, Fric P. Changes in jejunal mucosa after long-term feeding of germfree rats with gluten. Scand J Gastroenterol 1996; 31:551–557.
- Galipeau HJ, Rulli NE, Jury J, et al. Sensitization to gliadin induces moderate enteropathy and insulitis in nonobese diabetic-DQ8 mice. J Immunol 2011; 187:4338–4346.
- Galipeau HJ, Verdu EF. Gut microbes and adverse food reactions: focus on gluten related disorders. Gut Microbes 2014; 5:594–605.

L-Selectin May Not Predict PML Risk Accurately
The expression of L-selectin (CD62L) on specific T cells in peripheral blood in patients with relapsing forms of multiple sclerosis (MS) does not predict the risk of progressive multifocal leukoencephalopathy (PML) during natalizumab treatment reliably, according to findings published January 26 in Neurology.
These findings contradict those of a previous preliminary study that used a different analytical technique. Investigators in the earlier study found a decrease in the percentage of CD4- and CD3-positive T cells expressing CD62L at least four months and often two years before PML diagnosis. They concluded that measuring the percentage of CD4- and CD3-positive T cells expressing CD62L “may improve stratification of patients taking natalizumab who are at risk for developing PML.”
Linda A. Lieberman, PhD, a research scientist at Biogen in Cambridge, Massachusetts, and colleagues sought to confirm the findings, enhance the reproducibility of the CD62L assay, “and potentially enable the deployment of CD62L as a biomarker for PML in a global setting.” The investigators, however, did not find a significant difference in the percentage of CD62L in cryopreserved peripheral blood mononuclear cells between 104 patients with relapsing forms of MS who received natalizumab and did not develop PML, and 21 patients who developed PML.
In the current study, the investigators detected a large range of CD62L (ie, 0.31% to 68.4%) in a subset of natalizumab-treated MS patients without PML at two time points at least six months apart. Because CD62L and the chemokine receptor CCR7 are coexpressed on CD4- and CD3-positive T cells, the researchers also examined the level of variation in simultaneous measurements of CD62L and CCR7 on the same cells at two separate time points in the same patients. They found that CD62L expression varied substantially, whereas CCR7 varied little, and the difference between the two was significant, “signifying that CD62L is not a stable outcome measure,” they wrote.
Dr. Lieberman and her colleagues also confirmed a positive correlation between lymphocyte viability and CD62L expression, which highlights the “technique-driven variability of the assay” used in the preliminary study.
In patient samples collected at least six months before PML diagnosis, the percentage of CD62L did not discriminate significantly between non-PML and active PML (defined as 0 to 6 months prior to diagnosis). The median percentage of CD62L varied according to the viability of cryopreserved CD4- and CD3-positive T cells. Median percentage of CD62L was no different between non-PML and pre-PML samples with lymphocyte viability greater than 75% (25.9% vs 26.3%, respectively), but was significantly lower than with non-PML and pre-PML samples with lymphocyte viability less than 75% (10.55% and 5.41%). There was no difference in lymphocyte viability between non-PML and pre-PML samples.
In a case–control comparison of patients receiving natalizumab who had multiple pre-PML samples, nine patients who developed PML had CD62L levels that in most samples were similar to those of nine matched control patients without PML.
Examination of samples from healthy controls demonstrated that CD62L also varied significantly in various disease states, such as after influenza vaccination and during hospitalization for total knee replacement surgery or methicillin-resistant Staphylococcus aureus infection, the researchers found.
—Jeff Evans
Suggested Reading
Lieberman LA, Zeng W, Singh C, et al. CD62L is not a reliable biomarker for predicting PML risk in natalizumab-treated R-MS patients. Neurology. 2016;86(4):375-381.
The expression of L-selectin (CD62L) on specific T cells in peripheral blood in patients with relapsing forms of multiple sclerosis (MS) does not predict the risk of progressive multifocal leukoencephalopathy (PML) during natalizumab treatment reliably, according to findings published January 26 in Neurology.
These findings contradict those of a previous preliminary study that used a different analytical technique. Investigators in the earlier study found a decrease in the percentage of CD4- and CD3-positive T cells expressing CD62L at least four months and often two years before PML diagnosis. They concluded that measuring the percentage of CD4- and CD3-positive T cells expressing CD62L “may improve stratification of patients taking natalizumab who are at risk for developing PML.”
Linda A. Lieberman, PhD, a research scientist at Biogen in Cambridge, Massachusetts, and colleagues sought to confirm the findings, enhance the reproducibility of the CD62L assay, “and potentially enable the deployment of CD62L as a biomarker for PML in a global setting.” The investigators, however, did not find a significant difference in the percentage of CD62L in cryopreserved peripheral blood mononuclear cells between 104 patients with relapsing forms of MS who received natalizumab and did not develop PML, and 21 patients who developed PML.
In the current study, the investigators detected a large range of CD62L (ie, 0.31% to 68.4%) in a subset of natalizumab-treated MS patients without PML at two time points at least six months apart. Because CD62L and the chemokine receptor CCR7 are coexpressed on CD4- and CD3-positive T cells, the researchers also examined the level of variation in simultaneous measurements of CD62L and CCR7 on the same cells at two separate time points in the same patients. They found that CD62L expression varied substantially, whereas CCR7 varied little, and the difference between the two was significant, “signifying that CD62L is not a stable outcome measure,” they wrote.
Dr. Lieberman and her colleagues also confirmed a positive correlation between lymphocyte viability and CD62L expression, which highlights the “technique-driven variability of the assay” used in the preliminary study.
In patient samples collected at least six months before PML diagnosis, the percentage of CD62L did not discriminate significantly between non-PML and active PML (defined as 0 to 6 months prior to diagnosis). The median percentage of CD62L varied according to the viability of cryopreserved CD4- and CD3-positive T cells. Median percentage of CD62L was no different between non-PML and pre-PML samples with lymphocyte viability greater than 75% (25.9% vs 26.3%, respectively), but was significantly lower than with non-PML and pre-PML samples with lymphocyte viability less than 75% (10.55% and 5.41%). There was no difference in lymphocyte viability between non-PML and pre-PML samples.
In a case–control comparison of patients receiving natalizumab who had multiple pre-PML samples, nine patients who developed PML had CD62L levels that in most samples were similar to those of nine matched control patients without PML.
Examination of samples from healthy controls demonstrated that CD62L also varied significantly in various disease states, such as after influenza vaccination and during hospitalization for total knee replacement surgery or methicillin-resistant Staphylococcus aureus infection, the researchers found.
—Jeff Evans
Suggested Reading
Lieberman LA, Zeng W, Singh C, et al. CD62L is not a reliable biomarker for predicting PML risk in natalizumab-treated R-MS patients. Neurology. 2016;86(4):375-381.
Suggested Reading
Lieberman LA, Zeng W, Singh C, et al. CD62L is not a reliable biomarker for predicting PML risk in natalizumab-treated R-MS patients. Neurology. 2016;86(4):375-381.
Celiac disease: Managing a multisystem disorder
This autoimmune disorder can cause symptoms that involve not only the gastrointestinal tract but also the skin and bones.
CELIAC DISEASE is an autoimmune disorder that occurs in genetically predisposed individuals in response to ingestion of gluten. Its prevalence is about 0.7% of the US population.1
The gold standard for diagnosis is duodenal biopsy, in which the histologic features may include varying gradations of flattening of intestinal villi, crypt hyperplasia, and infiltration of the lamina propria by lymphocytes. Many patients have no symptoms at the time of diagnosis, but presenting symptoms can include diarrhea along with features of malabsorption,2 and, in about 25% of patients (mainly adults), a bullous cutaneous disorder called dermatitis herpetiformis.3,4 The pathogenesis of celiac disease and that of dermatitis herpetiformis are similar in that in both, ingestion of gluten induces an inflammatory reaction leading to the clinical manifestations.
The mainstay of treatment of celiac disease remains avoidance of gluten in the diet.
GENETIC PREDISPOSITION AND DIETARY TRIGGER
The pathogenesis of celiac disease has been well studied in both humans and animals. The disease is thought to develop by an interplay of genetic and autoimmune factors and the ingestion of gluten (ie, an environmental factor).
Celiac disease occurs in genetically predisposed individuals, ie, those who carry the HLA alleles DQ2 (DQA1*05, DQB1*02), DQ8 (DQA1*03, DQB1*0302), or both.5
Ingestion of gluten is necessary for the disease to develop. Gluten, the protein component of wheat, barley, and rye, contains proteins called prolamins, which vary among the different types of grain. In wheat, the prolamin is gliadin, which is alcohol-soluble. In barley the prolamin is hordein, and in rye it is secalin.4 The prolamin content in gluten makes it resistant to degradation by gastric, pancreatic, and intestinal brush border proteases.6 Gluten crosses the epithelial barrier and promotes an inflammatory reaction by both the innate and adaptive immune systems that can ultimately result in flattening of villi and crypt hyperplasia (Figure 1).7
Tissue transglutaminase also plays a central role in the pathogenesis, as it further deaminates gliadin and increases its immunogenicity by causing it to bind to receptors on antigen-presenting cells with stronger affinity. Furthermore, gliadin-tissue transglutaminase complexes formed by protein cross-linkages generate an autoantibody response (predominantly immunoglobulin A [IgA] type) that can exacerbate the inflammatory process.8,9
Certain viral infections during childhood, such as rotavirus and adenovirus infection, can increase the risk of celiac disease.10–13 Although earlier studies reported that breast-feeding seemed to have a protective effect,14 as did introducing grains in the diet in the 4th to 6th months of life as opposed to earlier or later,15 more recent studies have not confirmed these benefits.16,17
CLINICAL FEATURES
Most adults diagnosed with celiac disease are in their 30s, 40s, or 50s, and most are women.
Diarrhea remains a common presenting symptom, although the percentage of patients with celiac disease who present with diarrhea has decreased over time.18,19
Abdominal pain and weight loss are also common.20
Pallor or decreased exercise tolerance can develop due to anemia from iron malabsorption, and some patients have easy bruising due to vitamin K malabsorption.
Osteoporosis and osteopenia due to malabsorption of vitamin D are common and are seen in two-thirds of patients presenting with celiac disease.23 A meta-analysis and position statement from Canada concluded that dual-energy x-ray absorptiometry should be done at the time of diagnosis of celiac disease if the patient is at risk of osteoporosis.24 If the scan is abnormal, it should be repeated 1 to 2 years after initiation of a gluten-free diet and vitamin D supplementation to ensure that the osteopenia has improved.24
OTHER DISEASE ASSOCIATIONS
Celiac disease is associated with various other autoimmune diseases (Table 1), including Hashimoto thyroiditis,25 type 1 diabetes mellitus,26 primary biliary cirrhosis,27 primary sclerosing cholangitis,28 and Addison disease.29
Dermatitis herpetiformis
Dermatitis herpetiformis is one of the most common cutaneous manifestations of celiac disease. It presents between ages 10 and 50, and unlike celiac disease, it is more common in males.30
The characteristic lesions are pruritic, grouped erythematous papules surmounted by vesicles distributed symmetrically over the extensor surfaces of the upper and lower extremities, elbows, knees, scalp, nuchal area, and buttocks31 (Figures 2 and 3). In addition, some patients also present with vesicles, erythematous macules, and erosions in the oral mucosa32 or purpura on the palms and soles.33–35
The pathogenesis of dermatitis herpetiformis in the skin is related to the pathogenesis of celiac disease in the gut. Like celiac disease, dermatitis herpetiformis is more common in genetically predisposed individuals carrying either the HLA-DQ2 or the HLA-DQ8 haplotype. In the skin, there is an analogue of tissue transglutaminase called epidermal transglutaminase, which helps in maintaining the integrity of cornified epithelium.36 In patients with celiac disease, along with formation of IgA antibodies to tissue transglutaminase, there is also formation of IgA antibodies to epidermal transglutaminase. IgA antibodies are deposit- ed in the tips of dermal papillae and along the basement membrane.37–39 These deposits then initiate an inflammatory response that is predominantly neutrophilic and results in formation of vesicles and bullae in the skin.40 Also supporting the linkage between celiac disease and dermatitis herpetiformis, if patients adhere to a gluten-free diet, the deposits of immune complexes in the skin disappear.41
CELIAC DISEASE-ASSOCIATED MALIGNANCY
Patients with celiac disease have a higher risk of developing enteric malignancies, particularly intestinal T-cell lymphoma, and they have smaller increased risk of colon, oropharyngeal, esophageal, pancreatic, and hepatobiliary cancer.42–45 For all of these cancers, the risk is higher than in the general public in the first year after celiac disease is diagnosed, but after the first year, the risk is increased only for small-bowel and hepatobiliary malignancies.46
T-cell lymphoma
T-cell lymphoma is a rare but serious complication that has a poor prognosis.47 Its prevalence has been increasing with time and is currently estimated to be around 0.01 to 0.02 per 100,000 people in the population as a whole.48,49 The risk of developing lymphoma is 2.5 times higher in people with celiac disease than in the general population.50 T-cell lymphoma is seen more commonly in patients with refractory celiac disease and DQ2 homozygosity.51
This disease is difficult to detect clinically, but sometimes it presents as an acute exacerbation of celiac disease symptoms despite strict adherence to a gluten-free diet. Associated alarm symptoms include fever, night sweats, and laboratory abnormalities such as low albumin and high lactate dehydrogenase levels.
Strict adherence to a gluten-free diet remains the only way to prevent intestinal T-cell lymphoma.52
Other malignancies
Some earlier studies reported an increased risk of thyroid cancer and malignant melanoma, but two newer studies have refuted this finding.53,54 Conversely, celiac disease appears to have a protective effect against breast, ovarian, and endometrial cancers.55
DIAGNOSIS: SEROLOGY, BIOPSY, GENETIC TESTING
Serologic tests
Patients strongly suspected of having celiac disease should be screened for IgA antibodies to tissue transglutaminase while on a gluten-containing diet, according to recommendations of the American College of Gastroenterology (Figure 4).56 The sensitivity and specificity of this test are around 95%. If the patient has an IgA deficiency, screening should be done by checking the level of IgG antibodies to tissue transglutaminase.
Biopsy for confirmation
If testing for IgA to tissue transglutaminase is positive, upper endoscopy with biopsy is needed. Ideally, one to two samples should be taken from the duodenal bulb and at least four samples from the rest of the duodenum, preferably from two different locations.56
Celiac disease has a broad spectrum of pathologic expressions, from mild distortion of crypt architecture to total villous atrophy and infiltration of lamina propria by lymphocytes57 (Figures 5 and 6). Because these changes can be seen in a variety of diarrheal diseases, their reversal after adherence to a gluten-free diet is part of the current diagnostic criteria for the diagnosis of celiac disease.56
Genetic testing
Although the combination of positive serologic tests and pathologic changes confirms the diagnosis of celiac disease, in some cases one type of test is positive and the other is negative. In this situation, genetic testing for HLA-DQ2 and HLA-DQ8 can help rule out the diagnosis, as a negative genetic test rules out celiac disease in more than 99% of cases.58
Genetic testing is also useful in patients who are already adhering to a gluten-free diet at the time of presentation to the clinic and who have had no testing done for celiac disease in the past. Here again, a negative test for both HLA-DQ2 and HLA-DQ8 makes a diagnosis of celiac disease highly unlikely.
If the test is positive, further testing needs to be done, as a positive genetic test cannot differentiate celiac disease from nonceliac gluten sensitivity. In this case, a gluten challenge needs to be done, ideally for 8 weeks, but for at least 2 weeks if the patient cannot tolerate gluten-containing food for a longer period of time. The gluten challenge is to be followed by testing for antibodies to tissue transglutaminase or obtaining duodenal biopsies to confirm the presence or absence of celiac disease.
Standard laboratory tests
Standard laboratory tests do not help much in diagnosing celiac disease, but they should include a complete blood chemistry along with a complete metabolic panel. Usually, serum albumin levels are normal.
Due to malabsorption of iron, patients may have iron deficiency anemia,59 but anemia can also be due to a deficiency of folate or vitamin B12. In patients undergoing endoscopic evaluation of iron deficiency anemia of unknown cause, celiac disease was discovered in approximately 15%.60 Therefore, some experts believe that any patient presenting with unexplained iron deficiency anemia should be screened for celiac disease.
Because of malabsorption of vitamin D, levels of vitamin D can be low.
Elevations in levels of aminotransferases are also fairly common and usually resolve after the start of a gluten-free diet. If they persist despite adherence to a gluten-free diet, then an alternate cause of liver disease should be sought.61
Diagnosis of dermatitis herpetiformis
When trying to diagnose dermatitis herpetiformis, antibodies against epidermal transglutaminase can also be checked if testing for antibody against tissue transglutaminase is negative. A significant number of patients with biopsy-confirmed dermatitis herpetiformis are positive for epidermal transglutaminase antibodies but not for tissue transglutaminase antibodies.62
The confirmatory test for dermatitis herpetiformis remains skin biopsy. Ideally, the sample should be taken while the patient is on a gluten-containing diet and from an area of normal-appearing skin around the lesions.63 On histopathologic study, neutrophilic infiltrates are seen in dermal papillae and a perivascular lymphocytic infiltrate can also be seen in the superficial zones.64 This presentation can also be seen in other bullous disorders, however. To differentiate dermatitis herpetiformis from other disorders, direct immunofluorescence is needed, which will detect granular IgA deposits in the dermal papillae or along the basement membrane, a finding pathognomic of dermatitis herpetiformis.63
A GLUTEN-FREE DIET IS THE MAINSTAY OF TREATMENT
The mainstay of treatment is lifelong adherence to a gluten-free diet. Most patients report improvement in abdominal pain within days of starting this diet and improvement of diarrhea within 4 weeks.65
The maximum amount of gluten that can be tolerated is debatable. A study established that intake of less than 10 mg a day is associated with fewer histologic abnormalities,66 and an earlier study noted that intake of less than 50 mg a day was clinically well tolerated.67 But patients differ in their tolerance for gluten, and it is hard to predict what the threshold of tolerance for gluten will be for a particular individual. Thus, it is better to avoid gluten completely.
Gluten-free if it is inherently gluten-free. If the food has a gluten-containing grain, then it should be processed to remove the gluten, and the resultant food product should not contain more than 20 parts per million of gluten. Gluten-free products that have gluten-containing grain that has been processed usually have a label indicating the gluten content in the food in parts per million.
Patients who understand the need to adhere to a gluten-free diet and the implications of not adhering to it are generally more compliant. Thus, patients need to be strongly educated that they need to adhere to a gluten-free diet and that nonadherence can cause further damage to the gut and can pose a higher risk of malignancy. Even though patients are usually concerned about the cost of gluten-free food and worry about adherence to the diet, these factors do not generally limit diet adherence.68 All patients diagnosed with celiac disease should meet with a registered dietitian to discuss diet options based on their food preferences and to better address all their concerns.
With increasing awareness of celiac disease and with increasing numbers of patients being diagnosed with it, the food industry has recognized the need to produce gluten-free items. There are now plenty of food products available for these patients, who no longer have to forgo cakes, cookies, and other such items. Table 2 lists some common foods that patients with celiac disease can consume.
Nutritional supplements for some
If anemia is due purely to iron deficiency, it may resolve after starting a gluten-free diet, and no additional supplementation may be needed. However, if it is due to a combination of iron plus folate or vitamin B12 deficiency, then folate, vitamin B12, or both should be given.
In addition, if the patient is found to have a deficiency of vitamin D, then a vitamin D supplement should be given.69 At the time of diagnosis, all patients with celiac disease should be screened for deficiencies of vitamins A, B12, D, E, and K, as well as copper, zinc, folic acid, and iron.
Follow-up at 3 to 6 months
A follow-up visit should be scheduled for 3 to 6 months after the diagnosis and after that on an annual basis, and many of the abnormal laboratory tests will need to be repeated.
If intestinal or extraintestinal symptoms or nutrient deficiencies persist, then the patient’s adherence to the gluten-free diet needs to be checked. Adherence to a gluten-free diet can be assessed by checking for serologic markers of celiac disease. A decrease in baseline values can be seen within a few months of starting the diet.70 Failure of serologic markers to decrease by the end of 1 year of a gluten-free diet usually indicates gluten contamination.71 If adherence is confirmed (ie, if baseline values fall) but symptoms persist, then further workup needs to be done to find the cause of refractory disease.
Skin lesions should also respond to a gluten-free diet
The first and foremost therapy for the skin lesions in dermatitis herpetiformis is the same as that for the intestinal manifestations in celiac disease, ie, adherence to a gluten-free diet. Soon after patients begin a gluten-free diet, the itching around the skin lesions goes away, and over time, most patients have complete resolution of the skin manifestations.
Dapsone is also frequently used to treat dermatitis herpetiformis if there is an incomplete response to a gluten-free diet or as an adjunct to diet to treat the pruritus. Patients often have a good response to dapsone.72
The recommended starting dosage is 100 to 200 mg a day, and a response is usually seen within a few days. If the symptoms do not improve, the dose can be increased. Once the lesions resolve, the dose can be tapered and patients may not require any further medication. In some cases, patients may need to be chronically maintained on the lowest dose possible, due to the side effects of the drug.3
Dapsone is associated with significant adverse effects. Methemoglobinemia is the most common and is seen particularly in dosages exceeding 200 mg a day. Hemolytic anemia, another common adverse effect, is seen with dosages of more than 100 mg a day. Patients with a deficiency of glucose-6-phosphate dehydrogenase (G6PD) are at increased risk of hemolysis, and screening for G6PD deficiency is usually done before starting dapsone. Other rare adverse effects of dapsone include agranulocytosis, peripheral neuropathy, psychosis,73 pancreatitis, cholestatic jaundice, bullous and exfoliative dermatitis, Stevens-Johnson syndrome, toxic epidermal necrolysis, nephrotic syndrome, and renal papillary necrosis.
Besides testing for G6PD deficiency, a complete blood cell count, a reticulocyte count, a hepatic function panel, renal function tests, and urinalysis should be done before starting dapsone therapy and repeated while on therapy. The complete blood cell count and reticulocyte count should be checked weekly for the first month, twice a month for the next 2 months, and then once every 3 months. Liver and renal function tests are to be done once every 3 months.74
NOVEL THERAPIES BEING TESTED
Research is under way for other treatments for celiac disease besides a gluten-free diet.
Larazotide (Alba Therapeutics, Baltimore, MD) is being tested in a randomized, placebo-controlled trial. Early results indicate that it is effective in controlling both gastrointestinal and nongastrointestinal symptoms of celiac disease, but it still has to undergo phase 3 clinical trials.
Sorghum is a grain commonly used in Asia and Africa. The gluten in sorghum is different from that in wheat and is not immunogenic. In a small case series in patients with known celiac disease, sorghum did not induce diarrhea or change in levels of antibodies to tissue transglutaminase.75
Nonimmunogenic wheat that does not contain the immunogenic gluten is being developed.
Oral enzyme supplements called glutenases are being developed. Glutenases can cleave gluten, particularly the proline and glutamine residues that make gluten resistant to degradation by gastric, pancreatic, and intestinal brush border proteases. A phase 2 trial of one of these oral enzyme supplements showed that it appeared to attenuate mucosal injury in patients with biopsy-proven celiac disease.76
These novel therapies look promising, but for now the best treatment is lifelong adherence to the gluten-free diet.
NONRESPONSIVE AND REFRACTORY CELIAC DISEASE
Celiac disease is considered nonresponsive if its symptoms or laboratory abnormalities persist after the patient is on a gluten-free diet for 6 to 12 months. It is considered refractory if symptoms persist or recur along with villous atrophy despite adherence to the diet for more than 12 months in the absence of other causes of the symptoms. Refractory celiac disease can be further classified either as type 1 if there are typical intraepithelial lymphocytes, or as type 2 if there are atypical intraepithelial lymphocytes.
Celiac disease is nonresponsive in about 10% to 19% of cases,76 and it is refractory in 1% to 2%.77
Managing nonresponsive celiac disease
The first step in managing a patient with nonresponsive celiac disease is to confirm the diagnosis by reviewing the serologic tests and the biopsy samples from the time of diagnosis. If celiac disease is confirmed, then one should re-evaluate for gluten ingestion, the most common cause of nonresponsiveness.78 If strict adherence is confirmed, then check for other causes of symptoms such as lactose or fructose intolerance. If no other cause is found, then repeat the duodenal biopsies with flow cytometry to look for CD3 and CD8 expression in T cells in the small-bowel mucosa.79 Presence or absence of villous atrophy can point to possible other causes of malabsorption including pancreatic insufficiency, small intestinal bowel overgrowth, and microscopic colitis.
Managing refractory celiac disease
Traditionally, corticosteroids have been shown to be beneficial in alleviating symptoms in patients with refractory celiac disease but do not improve the histologic findings.80 Because of the adverse effects associated with long-term corticosteroid use, azathioprine has been successfully used to maintain remission of the disease after induction with corticosteroids in patients with type 1 refractory celiac disease.81
Cladribine, a chemotherapeutic agent used to treat hairy cell leukemia, has shown some benefit in treating type 2 refractory celiac disease.82
In type 2 refractory celiac disease, use of an immunomodulator agent carries an increased risk of transformation to lymphoma.
Because of the lack of a satisfactory response to the agents available so far to treat refractory celiac disease, more treatment options acting at the molecular level are being explored.
NONCELIAC GLUTEN SENSITIVITY DISORDER
Nonceliac gluten sensitivity disorder is an evolving concept. The clinical presentation of this disorder is similar to celiac disease in that patients may have diarrhea or other extraintestinal symptoms when on a regular diet and have resolution of symptoms on a gluten-free diet. But unlike celiac disease, there is no serologic or histologic evidence of celiac disease even when patients are on a regular diet.
One of every 17 patients who presents with clinical features suggestive of celiac disease is found to have nonceliac gluten sensitivity disorder, not celiac disease.83 In contrast to celiac disease, in which the adaptive immune system is thought to contribute to the disease process, in nonceliac gluten sensitivity disorder the innate immune system is believed to play the dominant role,84 but the exact pathogenesis of the disease is still unclear.
The diagnosis of nonceliac gluten sensitivity disorder is one of exclusion. Celiac disease needs to be ruled out by serologic testing and by duodenal biopsy while the patient is on a regular diet, and then a trial of a gluten-free diet needs to be done to confirm resolution of symptoms before the diagnosis of nonceliac gluten sensitivity disorder can be established.
As with celiac disease, the treatment involves adhering to a gluten-free diet, but it is still not known if patients need to stay on it for the rest of their life, or if they will be able to tolerate gluten-containing products after a few years.
- Rubio-Tapia A, Ludvigsson JF, Bratner TL, Murray JA, Everhart JE. The prevalence of celiac disease in the United States. Am J Gastroenterol 2012; 107:1538–1544.
- Dewar DH, Ciclitira PJ. Clinical features and diagnosis of celiac disease. Gastroenterology 2005; 128(suppl 1):S19–S24.
- Mendes FB, Hissa-Elian A, Abreu MA, Goncalves VS. Review: dermatitis herpetiformis. An Bras Dermatol 2013; 88:594–599.
- Lauret E, Rodrigo L. Celiac disease and autoimmune-associated conditions. Biomed Res Int 2013; 2013:127589.
- Sollid LM, Lie BA. Celiac disease genetics: current concepts and practical applications. Clin Gastroenterol Hepatol 2005; 3:843–851.
- Hausch F, Shan L, Santiago NA, Gray GM, Khosla C. Intestinal digestive resistance of immunodominant gliadin peptides. Am J Physiol Gastrointest Liver Physiol 2002; 283:G996–G1003.
- Green PH, Cellier C. Celiac disease. N Engl J Med 2007; 357:1731–1743.
- Caputo I, Barone MV, Martucciello S, Lepretti M, Esposito C. Tissue transglutaminase in celiac disease: role of autoantibodies. Amino Acids 2009; 36:693–699.
- Schuppan D, Dieterich W, Riecken EO. Exposing gliadin as a tasty food for lymphocytes. Nat Med 1998; 4:666–667.
- Stene LC, Honeyman MC, Hoffenberg EJ, et al. Rotavirus infection frequency and risk of celiac disease autoimmunity in early childhood: a longitudinal study. Am J Gastroenterol 2006; 101:2333–2340.
- Kagnoff MF, Austin RK, Hubert JJ, Bernardin JE, Kasarda DD. Possible role for a human adenovirus in the pathogenesis of celiac disease. J Exp Med 1984; 160:1544–1557.
- Ruggeri C, LaMasa AT, Rudi S, et al. Celiac disease and non-organ-specific autoantibodies in patients with chronic hepatitis C virus infection. Dig Dis Sci 2008; 53:2151–2155.
- Sjoberg K, Lindgren S, Eriksson S. Frequent occurrence of non-specific gliadin antibodies in chronic liver disease. Endomysial but not gliadin antibodies predict coelic disease in patients with chronic liver disease. Scand J Gastroenterol 1997; 32:1162–1167.
- Persson LA, Ivarsson A, Hernell O. Breast-feeding protects against celiac disease in childhood—epidemiological evidence. Adv Exp Med Biol 2002; 503:115–123.
- Norris JM, Barriga K, Hoffenberg EJ, et al. Risk of celiac disease autoimmunity and timing of gluten introduction in the diet of infants at increased risk of disease. JAMA 2005; 293:2343–2351.
- Vriezinga SL, Auricchio R, Bravi E, et al. Randomized feeding intervention in infants at high risk for celiac disease. N Engl J Med 2014; 371:1304–1315.
- Lionetti E, Castelaneta S, Francavilla R, et al. Introduction of gluten, HLA status, and the risk of celiac disease in children. N Engl J Med 2014; 371:1295–1303
- Green PH. The many faces of celiac disease: clinical presentation of celiac disease in the adult population. Gastroenterology 2005; 128:S74–S78.
- Rampertab SD, Pooran N, Brar P, Singh P, Green PH. Trends in the presentation of celiac disease. Am J Med 2006; 119:355 e9–e14.
- Rashid M, Cranney A, Zarkadas M, et al. Celiac disease: evaluation of the diagnosis and dietary compliance in Canadian children. Pediatrics 2005; 116:e754–e759.
- Molteni N, Bardella MT, Bianchi PA. Obstetric and gynecological problems in women with untreated celiac sprue. J Clin Gastroenterol 1990; 12:37–39.
- Tersigni C, Castellani R, de Waure C, et al. Celiac disease and reproductive disorders: meta-analysis of epidemiologic associations and potential pathogenic mechanisms. Hum Reprod Update 2014; 20:582–593.
- Meyer D, Stravropolous S, Diamond B, Shane E, Green PH. Osteoporosis in a North American adult population with celiac disease. Am J Gastroenterol 2001; 96:112–119.
- Fouda MA, Khan AA, Sultan MS, Rios LP, McAssey K, Armstrong D. Evaluation and management of skeletal health in celiac disease: position statement. Can J Gastroenterol 2012; 26:819–829.
- van der Pals M, Ivarsson A, Norström F, Högberg L, Svensson J, Carlsson A. Prevalence of thyroid autoimmunity in children with celiac disease compared to healthy 12-year olds. Autoimmune Dis 2014; 2014:417356.
- Mahmud FH, Murray JA, Kudva YC, et al. Celiac disease in type 1 diabetes mellitus in a North American community: prevalence, serologic screening, and clinical features. Mayo Clin Proc 2005; 80:1429–1434.
- Sorensen HT, Thulstrup AM, Blomqvist P, Nørgaard B, Fonager K, Ekbom A. Risk of primary biliary liver cirrhosis in patients with coeliac disease: Danish and Swedish cohort data. Gut 1999; 44:736–738.
- Volta U, Rodrigo L, Granito A, et al. Celiac disease in autoimmune cholestatic liver disorders. Am J Gastroenterol 2002; 97:2609–2613.
- Elfstrom P, Montgomery SM, Kämpe O, Ekbom A, Ludvigsson JF. Risk of primary adrenal insufficiency in patients with celiac disease. J Clin Endocrinol Metab 2007; 92:3595–3598.
- Younus J, Ahmed AR. Clinical features of dermatitis herpetiformis. Clin Dermatol 1991; 9:279–281.
- Bolotin D, Petronic-Rosic V. Dermatitis herpetiformis. Part I. Epidemiology, pathogenesis, and clinical presentation. J Am Acad Dermatol 2011; 64:1017–1026.
- Lahteenoja H, Irjala K, Viander M, Vainio E, Toivanen A, Syrjänen S. Oral mucosa is frequently affected in patients with dermatitis herpetiformis. Arch Dermatol 1998; 134:756–758.
- Marks R, Jones EW. Purpura in dermatitis herpetiformis. Br J Dermatol 1971; 84:386–388.
- McGovern TW, Bennion SD. Palmar purpura: an atypical presentation of childhood dermatitis herpetiformis. Pediatr Dermatol 1994; 11:319–322.
- Pierce DK, Purcell SM, Spielvogel RL. Purpuric papules and vesicles of the palms in dermatitis herpetiformis. J Am Acad Dermatol 1987; 16:1274–1276.
- Lorand L, Graham RM. Transglutaminases: crosslinking enzymes with pleiotropic functions. Nat Rev Mol Cell Biol 2003; 4:140–156.
- Hull CM, Liddle M, Hansen N, et al. Elevation of IgA anti-epidermal transglutaminase antibodies in dermatitis herpetiformis. Br J Dermatol 2008; 159:120–124.
- Kawana S, Segawa A. Confocal laser scanning microscopic and immunoelectron microscopic studies of the anatomical distribution of fibrillar IgA deposits in dermatitis herpetiformis. Arch Dermatol 1993; 129:456–459.
- Sárdy M, Kárpáti S, Merkl B, Paulsson M, Smyth N. Epidermal transglutaminase (TGase 3) is the autoantigen of dermatitis herpetiformis. J Exp Med 2002; 195:747–757.
- Nicolas ME, Krause PK, Gibson LE, Murray JA. Dermatitis herpetiformis. Int J Dermatol 2003; 42:588–600.
- Leonard J, Haffenden G, Tucker W, et al. Gluten challenge in dermatitis herpetiformis. N Engl J Med 1983; 308:816–819.
- Summaries for patients. Risk for lymphoma and the results of follow-up gut biopsies in patients with celiac disease. Ann Intern Med 2013; 159:I–20.
- Lebwohl B, Granath F, Ekbom A, et al. Mucosal healing and risk for lymphoproliferative malignancy in celiac disease: a population-based cohort study. Ann Intern Med 2013; 159:169–175.
- Volta U, Vincentini O, Quintarelli F, Felli C, Silano M; Collaborating Centres of the Italian Registry of the Complications of Celiac Disease. Low risk of colon cancer in patients with celiac disease. Scand J Gastroenterol 2014; 49:564–568.
- Askling J, Linet M, Gridley G, Halstensen TS, Ekström K, Ekbom A. Cancer incidence in a population-based cohort of individuals hospitalized with celiac disease or dermatitis herpetiformis. Gastroenterology 2002; 123:1428–1435.
- Elfström P, Granath F, Ye W, Ludvigsson JF. Low risk of gastrointestinal cancer among patients with celiac disease, inflammation, or latent celiac disease. Clin Gastroenterol Hepatol 2012; 10:30–36.
- Al-Toma A, Verbeek WH, Hadithi M, von Blomberg BM, Mulder CJ. Survival in refractory coeliac disease and enteropathy-associated T-cell lymphoma: retrospective evaluation of single-centre experience. Gut 2007; 56:1373–1378.
- Verbeek WH, Van De Water JM, Al-Toma A, Oudejans JJ, Mulder CJ, Coupé VM. Incidence of enteropathy—associated T-cell lymphoma: a nation-wide study of a population-based registry in The Netherlands. Scand J Gastroenterol 2008; 43:1322–1328.
- Sharaiha RZ, Lebwohl B, Reimers L, Bhagat G, Green PH, Neugut AI. Increasing incidence of enteropathy-associated T-cell lymphoma in the United States, 1973-2008. Cancer 2012; 118:3786–3792.
- Mearin ML, Catassi C, Brousse N, et al; Biomed Study Group on Coeliac Disease and Non-Hodgkin Lymphoma. European multi-centre study on coeliac disease and non-Hodgkin lymphoma. Eur J Gastroenterol Hepatol 2006; 18:187–194.
- Al-Toma A, Goerres MS, Meijer JW, Pena AS, Crusius JB, Mulder CJ. Human leukocyte antigen-DQ2 homozygosity and the development of refractory celiac disease and enteropathy-associated T-cell lymphoma. Clin Gastroenterol Hepatol 2006; 4:315–319.
- Sieniawski MK, Lennard AL. Enteropathy-associated T-cell lymphoma: epidemiology, clinical features, and current treatment strategies. Curr Hematol Malig Rep 2011; 6:231–240.
- Lebwohl B, Eriksson H, Hansson J, Green PH, Ludvigsson JF. Risk of cutaneous malignant melanoma in patients with celiac disease: a population-based study. J Am Acad Dermatol 2014; 71:245–248.
- Ludvigsson JF, Lebwohl B, Kämpe O, Murray JA, Green PH, Ekbom A. Risk of thyroid cancer in a nationwide cohort of patients with biopsy-verified celiac disease. Thyroid 2013; 23:971–976.
- Ludvigsson JF, West J, Ekbom A, Stephansson O. Reduced risk of breast, endometrial and ovarian cancer in women with celiac disease. Int J Cancer 2012; 13:E244–E250.
- Rubio-Tapia A, Hill ID, Kelly CP, Calderwood AH, Murray JA; American College of Gastroenterology. ACG clinical guidelines: diagnosis and management of celiac disease. Am J Gastroenterol 2013; 108:656–677.
- Marsh MN. Gluten, major histocompatibility complex, and the small intestine. A molecular and immunobiologic approach to the spectrum of gluten sensitivity (‘celiac sprue’). Gastroenterology 1992; 102:330–354.
- Hadithi M, von Blomberg BM, Crusius JB, et al. Accuracy of serologic tests and HLA-DQ typing for diagnosing celiac disease. Ann Intern Med 2007; 147:294–302.
- Lo W, Sano K, Lebwohl B, Diamond B, Green PH. Changing presentation of adult celiac disease. Dig Dis Sci 2003; 48:395–398.
- Oxentenko AS, Grisolano SW, Murray JA, Burgart LJ, Dierkhising RA, Alexander JA. The insensitivity of endoscopic markers in celiac disease. Am J Gastroenterol 2002; 97:933–938.
- Casella G, Antonelli E, Di Bella C, et al. Prevalence and causes of abnormal liver function in patients with coeliac disease. Liver Int 2013; 33:1128–1131.
- Jaskowski TD, Hamblin T, Wilson AR, et al. IgA anti-epidermal transglutaminase antibodies in dermatitis herpetiformis and pediatric celiac disease. J Invest Dermatol 2009; 129:2728–2730.
- Zone JJ, Meyer LJ, Petersen MJ. Deposition of granular IgA relative to clinical lesions in dermatitis herpetiformis. Arch Dermatol 1996; 132:912–918.
- Plotnikova N, Miller JL. Dermatitis herpetiformis. Skin Ther Lett 2013; 18:1–3.
- Murray JA, Watson T, Clearman B, Mitros F. Effect of a gluten-free diet on gastrointestinal symptoms in celiac disease. Am J Clin Nutr 2004; 79:669–673.
- Akobeng AK, Thomas AG. Systematic review: tolerable amount of gluten for people with coeliac disease. Aliment Pharmacol Ther 2008; 27:1044–1052.
- Catassi C, Fabiani E, Iacono G, et al. A prospective, double-blind, placebo-controlled trial to establish a safe gluten threshold for patients with celiac disease. Am J Clin Nutr 2007; 85:160–166.
- Leffler DA, Edwards-George J, Dennis M, et al. Factors that influence adherence to a gluten-free diet in adults with celiac disease. Dig Dis Sci 2008; 53:1573–1581.
- Caruso R, Pallone F, Stasi E, Romeo S, Monteleone G. Appropriate nutrient supplementation in celiac disease. Ann Med 2013; 45:522–531.
- Nachman F, Sugai E, Vazquez H, et al. Serological tests for celiac disease as indicators of long-term compliance with the gluten-free diet. Eur J Gastroenterol Hepatol 2011; 23:473–480.
- Abdulkarim AS, Burgart LJ, See J, Murray JA. Etiology of nonresponsive celiac disease: results of a systemic approach. Am J Gastroenterol 2002; 97:2016–2021.
- Fry L, Seah PP, Hoffbrand AV. Dermatitis herpetiformis. Clin Gastroenterol 1974; 3:145–157.
- Zhu YI, Stiller MJ. Dapsone and sulfones in dermatology: overview and update. J Am Acad Dermatol 2001; 45:420-434.
- Wolf R, Matz H, Orion E, Tuzun B, Tuzun Y. Dapsone. Dermatol Online J 2002; 8:2.
- Ciacci C, Maiuri L, Caporaso N, et al. Celiac disease: in vitro and in vivo safety and palatability of wheat-free sorghum food products. Clin Nutr 2007; 26:799–805.
- Lähdeaho ML, Kaukinen K, Laurila K, et al. Glutenase ALV003 attenuates gluten-induced mucosal injury in patients with celiac disease. Gastroenterology 2014; 146:1649–1658.
- Roshan B, Leffler DA, Jamma S, et al. The incidence and clinical spectrum of refractory celiac disease in a North American referral center. Am J Gastroenterol 2011; 106:923–928.
- Leffler DA, Dennis M, Hyett B, Kelly E, Schuppan D, Kelly CP. Etiologies and predictors of diagnosis in nonresponsive celiac disease. Clin Gastroenterol Hepatol 2007; 5:445–450.
- Cellier C, Delabesse E, Helmer C, et al. Refractory sprue, coeliac disease, and enteropathy-associated T-cell lymphoma. French Coeliac Disease Study Group. Lancet 2000; 356:203–208.
- Malamut G, Afchain P, Verkarre V, et al. Presentation and long-term follow-up of refractory celiac disease: comparison of type I with type II. Gastroenterology 2009; 136:81–90.
- Goerres MS, Meijer JW, Wahab PJ, et al. Azathioprine and prednisone combination therapy in refractory celiac disease. Aliment Pharmacol Ther 2003; 18:487–494.
- Tack GJ, Verbeek WH, Al-Toma A, et al. Evaluation of cladribine treatment in refractory celiac disease type II. World J Gastroenterol 2011; 17:506–513.
- Sapone A, Bai JC, Dolinsek J, et al. Spectrum of gluten-related disorders: consensus on new nomenclature and classification. BMC Med 2012; 7:10–13.
- Sapone A, Lammers KM, Casolaro V, et al. Divergence of gut permeability and mucosal immune gene expression in two gluten-associated conditions: celiac disease and gluten sensitivity. BMC Med 2011; 9:9–23.
This autoimmune disorder can cause symptoms that involve not only the gastrointestinal tract but also the skin and bones.
This autoimmune disorder can cause symptoms that involve not only the gastrointestinal tract but also the skin and bones.
CELIAC DISEASE is an autoimmune disorder that occurs in genetically predisposed individuals in response to ingestion of gluten. Its prevalence is about 0.7% of the US population.1
The gold standard for diagnosis is duodenal biopsy, in which the histologic features may include varying gradations of flattening of intestinal villi, crypt hyperplasia, and infiltration of the lamina propria by lymphocytes. Many patients have no symptoms at the time of diagnosis, but presenting symptoms can include diarrhea along with features of malabsorption,2 and, in about 25% of patients (mainly adults), a bullous cutaneous disorder called dermatitis herpetiformis.3,4 The pathogenesis of celiac disease and that of dermatitis herpetiformis are similar in that in both, ingestion of gluten induces an inflammatory reaction leading to the clinical manifestations.
The mainstay of treatment of celiac disease remains avoidance of gluten in the diet.
GENETIC PREDISPOSITION AND DIETARY TRIGGER
The pathogenesis of celiac disease has been well studied in both humans and animals. The disease is thought to develop by an interplay of genetic and autoimmune factors and the ingestion of gluten (ie, an environmental factor).
Celiac disease occurs in genetically predisposed individuals, ie, those who carry the HLA alleles DQ2 (DQA1*05, DQB1*02), DQ8 (DQA1*03, DQB1*0302), or both.5
Ingestion of gluten is necessary for the disease to develop. Gluten, the protein component of wheat, barley, and rye, contains proteins called prolamins, which vary among the different types of grain. In wheat, the prolamin is gliadin, which is alcohol-soluble. In barley the prolamin is hordein, and in rye it is secalin.4 The prolamin content in gluten makes it resistant to degradation by gastric, pancreatic, and intestinal brush border proteases.6 Gluten crosses the epithelial barrier and promotes an inflammatory reaction by both the innate and adaptive immune systems that can ultimately result in flattening of villi and crypt hyperplasia (Figure 1).7
Tissue transglutaminase also plays a central role in the pathogenesis, as it further deaminates gliadin and increases its immunogenicity by causing it to bind to receptors on antigen-presenting cells with stronger affinity. Furthermore, gliadin-tissue transglutaminase complexes formed by protein cross-linkages generate an autoantibody response (predominantly immunoglobulin A [IgA] type) that can exacerbate the inflammatory process.8,9
Certain viral infections during childhood, such as rotavirus and adenovirus infection, can increase the risk of celiac disease.10–13 Although earlier studies reported that breast-feeding seemed to have a protective effect,14 as did introducing grains in the diet in the 4th to 6th months of life as opposed to earlier or later,15 more recent studies have not confirmed these benefits.16,17
CLINICAL FEATURES
Most adults diagnosed with celiac disease are in their 30s, 40s, or 50s, and most are women.
Diarrhea remains a common presenting symptom, although the percentage of patients with celiac disease who present with diarrhea has decreased over time.18,19
Abdominal pain and weight loss are also common.20
Pallor or decreased exercise tolerance can develop due to anemia from iron malabsorption, and some patients have easy bruising due to vitamin K malabsorption.
Osteoporosis and osteopenia due to malabsorption of vitamin D are common and are seen in two-thirds of patients presenting with celiac disease.23 A meta-analysis and position statement from Canada concluded that dual-energy x-ray absorptiometry should be done at the time of diagnosis of celiac disease if the patient is at risk of osteoporosis.24 If the scan is abnormal, it should be repeated 1 to 2 years after initiation of a gluten-free diet and vitamin D supplementation to ensure that the osteopenia has improved.24
OTHER DISEASE ASSOCIATIONS
Celiac disease is associated with various other autoimmune diseases (Table 1), including Hashimoto thyroiditis,25 type 1 diabetes mellitus,26 primary biliary cirrhosis,27 primary sclerosing cholangitis,28 and Addison disease.29
Dermatitis herpetiformis
Dermatitis herpetiformis is one of the most common cutaneous manifestations of celiac disease. It presents between ages 10 and 50, and unlike celiac disease, it is more common in males.30
The characteristic lesions are pruritic, grouped erythematous papules surmounted by vesicles distributed symmetrically over the extensor surfaces of the upper and lower extremities, elbows, knees, scalp, nuchal area, and buttocks31 (Figures 2 and 3). In addition, some patients also present with vesicles, erythematous macules, and erosions in the oral mucosa32 or purpura on the palms and soles.33–35
The pathogenesis of dermatitis herpetiformis in the skin is related to the pathogenesis of celiac disease in the gut. Like celiac disease, dermatitis herpetiformis is more common in genetically predisposed individuals carrying either the HLA-DQ2 or the HLA-DQ8 haplotype. In the skin, there is an analogue of tissue transglutaminase called epidermal transglutaminase, which helps in maintaining the integrity of cornified epithelium.36 In patients with celiac disease, along with formation of IgA antibodies to tissue transglutaminase, there is also formation of IgA antibodies to epidermal transglutaminase. IgA antibodies are deposit- ed in the tips of dermal papillae and along the basement membrane.37–39 These deposits then initiate an inflammatory response that is predominantly neutrophilic and results in formation of vesicles and bullae in the skin.40 Also supporting the linkage between celiac disease and dermatitis herpetiformis, if patients adhere to a gluten-free diet, the deposits of immune complexes in the skin disappear.41
CELIAC DISEASE-ASSOCIATED MALIGNANCY
Patients with celiac disease have a higher risk of developing enteric malignancies, particularly intestinal T-cell lymphoma, and they have smaller increased risk of colon, oropharyngeal, esophageal, pancreatic, and hepatobiliary cancer.42–45 For all of these cancers, the risk is higher than in the general public in the first year after celiac disease is diagnosed, but after the first year, the risk is increased only for small-bowel and hepatobiliary malignancies.46
T-cell lymphoma
T-cell lymphoma is a rare but serious complication that has a poor prognosis.47 Its prevalence has been increasing with time and is currently estimated to be around 0.01 to 0.02 per 100,000 people in the population as a whole.48,49 The risk of developing lymphoma is 2.5 times higher in people with celiac disease than in the general population.50 T-cell lymphoma is seen more commonly in patients with refractory celiac disease and DQ2 homozygosity.51
This disease is difficult to detect clinically, but sometimes it presents as an acute exacerbation of celiac disease symptoms despite strict adherence to a gluten-free diet. Associated alarm symptoms include fever, night sweats, and laboratory abnormalities such as low albumin and high lactate dehydrogenase levels.
Strict adherence to a gluten-free diet remains the only way to prevent intestinal T-cell lymphoma.52
Other malignancies
Some earlier studies reported an increased risk of thyroid cancer and malignant melanoma, but two newer studies have refuted this finding.53,54 Conversely, celiac disease appears to have a protective effect against breast, ovarian, and endometrial cancers.55
DIAGNOSIS: SEROLOGY, BIOPSY, GENETIC TESTING
Serologic tests
Patients strongly suspected of having celiac disease should be screened for IgA antibodies to tissue transglutaminase while on a gluten-containing diet, according to recommendations of the American College of Gastroenterology (Figure 4).56 The sensitivity and specificity of this test are around 95%. If the patient has an IgA deficiency, screening should be done by checking the level of IgG antibodies to tissue transglutaminase.
Biopsy for confirmation
If testing for IgA to tissue transglutaminase is positive, upper endoscopy with biopsy is needed. Ideally, one to two samples should be taken from the duodenal bulb and at least four samples from the rest of the duodenum, preferably from two different locations.56
Celiac disease has a broad spectrum of pathologic expressions, from mild distortion of crypt architecture to total villous atrophy and infiltration of lamina propria by lymphocytes57 (Figures 5 and 6). Because these changes can be seen in a variety of diarrheal diseases, their reversal after adherence to a gluten-free diet is part of the current diagnostic criteria for the diagnosis of celiac disease.56
Genetic testing
Although the combination of positive serologic tests and pathologic changes confirms the diagnosis of celiac disease, in some cases one type of test is positive and the other is negative. In this situation, genetic testing for HLA-DQ2 and HLA-DQ8 can help rule out the diagnosis, as a negative genetic test rules out celiac disease in more than 99% of cases.58
Genetic testing is also useful in patients who are already adhering to a gluten-free diet at the time of presentation to the clinic and who have had no testing done for celiac disease in the past. Here again, a negative test for both HLA-DQ2 and HLA-DQ8 makes a diagnosis of celiac disease highly unlikely.
If the test is positive, further testing needs to be done, as a positive genetic test cannot differentiate celiac disease from nonceliac gluten sensitivity. In this case, a gluten challenge needs to be done, ideally for 8 weeks, but for at least 2 weeks if the patient cannot tolerate gluten-containing food for a longer period of time. The gluten challenge is to be followed by testing for antibodies to tissue transglutaminase or obtaining duodenal biopsies to confirm the presence or absence of celiac disease.
Standard laboratory tests
Standard laboratory tests do not help much in diagnosing celiac disease, but they should include a complete blood chemistry along with a complete metabolic panel. Usually, serum albumin levels are normal.
Due to malabsorption of iron, patients may have iron deficiency anemia,59 but anemia can also be due to a deficiency of folate or vitamin B12. In patients undergoing endoscopic evaluation of iron deficiency anemia of unknown cause, celiac disease was discovered in approximately 15%.60 Therefore, some experts believe that any patient presenting with unexplained iron deficiency anemia should be screened for celiac disease.
Because of malabsorption of vitamin D, levels of vitamin D can be low.
Elevations in levels of aminotransferases are also fairly common and usually resolve after the start of a gluten-free diet. If they persist despite adherence to a gluten-free diet, then an alternate cause of liver disease should be sought.61
Diagnosis of dermatitis herpetiformis
When trying to diagnose dermatitis herpetiformis, antibodies against epidermal transglutaminase can also be checked if testing for antibody against tissue transglutaminase is negative. A significant number of patients with biopsy-confirmed dermatitis herpetiformis are positive for epidermal transglutaminase antibodies but not for tissue transglutaminase antibodies.62
The confirmatory test for dermatitis herpetiformis remains skin biopsy. Ideally, the sample should be taken while the patient is on a gluten-containing diet and from an area of normal-appearing skin around the lesions.63 On histopathologic study, neutrophilic infiltrates are seen in dermal papillae and a perivascular lymphocytic infiltrate can also be seen in the superficial zones.64 This presentation can also be seen in other bullous disorders, however. To differentiate dermatitis herpetiformis from other disorders, direct immunofluorescence is needed, which will detect granular IgA deposits in the dermal papillae or along the basement membrane, a finding pathognomic of dermatitis herpetiformis.63
A GLUTEN-FREE DIET IS THE MAINSTAY OF TREATMENT
The mainstay of treatment is lifelong adherence to a gluten-free diet. Most patients report improvement in abdominal pain within days of starting this diet and improvement of diarrhea within 4 weeks.65
The maximum amount of gluten that can be tolerated is debatable. A study established that intake of less than 10 mg a day is associated with fewer histologic abnormalities,66 and an earlier study noted that intake of less than 50 mg a day was clinically well tolerated.67 But patients differ in their tolerance for gluten, and it is hard to predict what the threshold of tolerance for gluten will be for a particular individual. Thus, it is better to avoid gluten completely.
Gluten-free if it is inherently gluten-free. If the food has a gluten-containing grain, then it should be processed to remove the gluten, and the resultant food product should not contain more than 20 parts per million of gluten. Gluten-free products that have gluten-containing grain that has been processed usually have a label indicating the gluten content in the food in parts per million.
Patients who understand the need to adhere to a gluten-free diet and the implications of not adhering to it are generally more compliant. Thus, patients need to be strongly educated that they need to adhere to a gluten-free diet and that nonadherence can cause further damage to the gut and can pose a higher risk of malignancy. Even though patients are usually concerned about the cost of gluten-free food and worry about adherence to the diet, these factors do not generally limit diet adherence.68 All patients diagnosed with celiac disease should meet with a registered dietitian to discuss diet options based on their food preferences and to better address all their concerns.
With increasing awareness of celiac disease and with increasing numbers of patients being diagnosed with it, the food industry has recognized the need to produce gluten-free items. There are now plenty of food products available for these patients, who no longer have to forgo cakes, cookies, and other such items. Table 2 lists some common foods that patients with celiac disease can consume.
Nutritional supplements for some
If anemia is due purely to iron deficiency, it may resolve after starting a gluten-free diet, and no additional supplementation may be needed. However, if it is due to a combination of iron plus folate or vitamin B12 deficiency, then folate, vitamin B12, or both should be given.
In addition, if the patient is found to have a deficiency of vitamin D, then a vitamin D supplement should be given.69 At the time of diagnosis, all patients with celiac disease should be screened for deficiencies of vitamins A, B12, D, E, and K, as well as copper, zinc, folic acid, and iron.
Follow-up at 3 to 6 months
A follow-up visit should be scheduled for 3 to 6 months after the diagnosis and after that on an annual basis, and many of the abnormal laboratory tests will need to be repeated.
If intestinal or extraintestinal symptoms or nutrient deficiencies persist, then the patient’s adherence to the gluten-free diet needs to be checked. Adherence to a gluten-free diet can be assessed by checking for serologic markers of celiac disease. A decrease in baseline values can be seen within a few months of starting the diet.70 Failure of serologic markers to decrease by the end of 1 year of a gluten-free diet usually indicates gluten contamination.71 If adherence is confirmed (ie, if baseline values fall) but symptoms persist, then further workup needs to be done to find the cause of refractory disease.
Skin lesions should also respond to a gluten-free diet
The first and foremost therapy for the skin lesions in dermatitis herpetiformis is the same as that for the intestinal manifestations in celiac disease, ie, adherence to a gluten-free diet. Soon after patients begin a gluten-free diet, the itching around the skin lesions goes away, and over time, most patients have complete resolution of the skin manifestations.
Dapsone is also frequently used to treat dermatitis herpetiformis if there is an incomplete response to a gluten-free diet or as an adjunct to diet to treat the pruritus. Patients often have a good response to dapsone.72
The recommended starting dosage is 100 to 200 mg a day, and a response is usually seen within a few days. If the symptoms do not improve, the dose can be increased. Once the lesions resolve, the dose can be tapered and patients may not require any further medication. In some cases, patients may need to be chronically maintained on the lowest dose possible, due to the side effects of the drug.3
Dapsone is associated with significant adverse effects. Methemoglobinemia is the most common and is seen particularly in dosages exceeding 200 mg a day. Hemolytic anemia, another common adverse effect, is seen with dosages of more than 100 mg a day. Patients with a deficiency of glucose-6-phosphate dehydrogenase (G6PD) are at increased risk of hemolysis, and screening for G6PD deficiency is usually done before starting dapsone. Other rare adverse effects of dapsone include agranulocytosis, peripheral neuropathy, psychosis,73 pancreatitis, cholestatic jaundice, bullous and exfoliative dermatitis, Stevens-Johnson syndrome, toxic epidermal necrolysis, nephrotic syndrome, and renal papillary necrosis.
Besides testing for G6PD deficiency, a complete blood cell count, a reticulocyte count, a hepatic function panel, renal function tests, and urinalysis should be done before starting dapsone therapy and repeated while on therapy. The complete blood cell count and reticulocyte count should be checked weekly for the first month, twice a month for the next 2 months, and then once every 3 months. Liver and renal function tests are to be done once every 3 months.74
NOVEL THERAPIES BEING TESTED
Research is under way for other treatments for celiac disease besides a gluten-free diet.
Larazotide (Alba Therapeutics, Baltimore, MD) is being tested in a randomized, placebo-controlled trial. Early results indicate that it is effective in controlling both gastrointestinal and nongastrointestinal symptoms of celiac disease, but it still has to undergo phase 3 clinical trials.
Sorghum is a grain commonly used in Asia and Africa. The gluten in sorghum is different from that in wheat and is not immunogenic. In a small case series in patients with known celiac disease, sorghum did not induce diarrhea or change in levels of antibodies to tissue transglutaminase.75
Nonimmunogenic wheat that does not contain the immunogenic gluten is being developed.
Oral enzyme supplements called glutenases are being developed. Glutenases can cleave gluten, particularly the proline and glutamine residues that make gluten resistant to degradation by gastric, pancreatic, and intestinal brush border proteases. A phase 2 trial of one of these oral enzyme supplements showed that it appeared to attenuate mucosal injury in patients with biopsy-proven celiac disease.76
These novel therapies look promising, but for now the best treatment is lifelong adherence to the gluten-free diet.
NONRESPONSIVE AND REFRACTORY CELIAC DISEASE
Celiac disease is considered nonresponsive if its symptoms or laboratory abnormalities persist after the patient is on a gluten-free diet for 6 to 12 months. It is considered refractory if symptoms persist or recur along with villous atrophy despite adherence to the diet for more than 12 months in the absence of other causes of the symptoms. Refractory celiac disease can be further classified either as type 1 if there are typical intraepithelial lymphocytes, or as type 2 if there are atypical intraepithelial lymphocytes.
Celiac disease is nonresponsive in about 10% to 19% of cases,76 and it is refractory in 1% to 2%.77
Managing nonresponsive celiac disease
The first step in managing a patient with nonresponsive celiac disease is to confirm the diagnosis by reviewing the serologic tests and the biopsy samples from the time of diagnosis. If celiac disease is confirmed, then one should re-evaluate for gluten ingestion, the most common cause of nonresponsiveness.78 If strict adherence is confirmed, then check for other causes of symptoms such as lactose or fructose intolerance. If no other cause is found, then repeat the duodenal biopsies with flow cytometry to look for CD3 and CD8 expression in T cells in the small-bowel mucosa.79 Presence or absence of villous atrophy can point to possible other causes of malabsorption including pancreatic insufficiency, small intestinal bowel overgrowth, and microscopic colitis.
Managing refractory celiac disease
Traditionally, corticosteroids have been shown to be beneficial in alleviating symptoms in patients with refractory celiac disease but do not improve the histologic findings.80 Because of the adverse effects associated with long-term corticosteroid use, azathioprine has been successfully used to maintain remission of the disease after induction with corticosteroids in patients with type 1 refractory celiac disease.81
Cladribine, a chemotherapeutic agent used to treat hairy cell leukemia, has shown some benefit in treating type 2 refractory celiac disease.82
In type 2 refractory celiac disease, use of an immunomodulator agent carries an increased risk of transformation to lymphoma.
Because of the lack of a satisfactory response to the agents available so far to treat refractory celiac disease, more treatment options acting at the molecular level are being explored.
NONCELIAC GLUTEN SENSITIVITY DISORDER
Nonceliac gluten sensitivity disorder is an evolving concept. The clinical presentation of this disorder is similar to celiac disease in that patients may have diarrhea or other extraintestinal symptoms when on a regular diet and have resolution of symptoms on a gluten-free diet. But unlike celiac disease, there is no serologic or histologic evidence of celiac disease even when patients are on a regular diet.
One of every 17 patients who presents with clinical features suggestive of celiac disease is found to have nonceliac gluten sensitivity disorder, not celiac disease.83 In contrast to celiac disease, in which the adaptive immune system is thought to contribute to the disease process, in nonceliac gluten sensitivity disorder the innate immune system is believed to play the dominant role,84 but the exact pathogenesis of the disease is still unclear.
The diagnosis of nonceliac gluten sensitivity disorder is one of exclusion. Celiac disease needs to be ruled out by serologic testing and by duodenal biopsy while the patient is on a regular diet, and then a trial of a gluten-free diet needs to be done to confirm resolution of symptoms before the diagnosis of nonceliac gluten sensitivity disorder can be established.
As with celiac disease, the treatment involves adhering to a gluten-free diet, but it is still not known if patients need to stay on it for the rest of their life, or if they will be able to tolerate gluten-containing products after a few years.
- Rubio-Tapia A, Ludvigsson JF, Bratner TL, Murray JA, Everhart JE. The prevalence of celiac disease in the United States. Am J Gastroenterol 2012; 107:1538–1544.
- Dewar DH, Ciclitira PJ. Clinical features and diagnosis of celiac disease. Gastroenterology 2005; 128(suppl 1):S19–S24.
- Mendes FB, Hissa-Elian A, Abreu MA, Goncalves VS. Review: dermatitis herpetiformis. An Bras Dermatol 2013; 88:594–599.
- Lauret E, Rodrigo L. Celiac disease and autoimmune-associated conditions. Biomed Res Int 2013; 2013:127589.
- Sollid LM, Lie BA. Celiac disease genetics: current concepts and practical applications. Clin Gastroenterol Hepatol 2005; 3:843–851.
- Hausch F, Shan L, Santiago NA, Gray GM, Khosla C. Intestinal digestive resistance of immunodominant gliadin peptides. Am J Physiol Gastrointest Liver Physiol 2002; 283:G996–G1003.
- Green PH, Cellier C. Celiac disease. N Engl J Med 2007; 357:1731–1743.
- Caputo I, Barone MV, Martucciello S, Lepretti M, Esposito C. Tissue transglutaminase in celiac disease: role of autoantibodies. Amino Acids 2009; 36:693–699.
- Schuppan D, Dieterich W, Riecken EO. Exposing gliadin as a tasty food for lymphocytes. Nat Med 1998; 4:666–667.
- Stene LC, Honeyman MC, Hoffenberg EJ, et al. Rotavirus infection frequency and risk of celiac disease autoimmunity in early childhood: a longitudinal study. Am J Gastroenterol 2006; 101:2333–2340.
- Kagnoff MF, Austin RK, Hubert JJ, Bernardin JE, Kasarda DD. Possible role for a human adenovirus in the pathogenesis of celiac disease. J Exp Med 1984; 160:1544–1557.
- Ruggeri C, LaMasa AT, Rudi S, et al. Celiac disease and non-organ-specific autoantibodies in patients with chronic hepatitis C virus infection. Dig Dis Sci 2008; 53:2151–2155.
- Sjoberg K, Lindgren S, Eriksson S. Frequent occurrence of non-specific gliadin antibodies in chronic liver disease. Endomysial but not gliadin antibodies predict coelic disease in patients with chronic liver disease. Scand J Gastroenterol 1997; 32:1162–1167.
- Persson LA, Ivarsson A, Hernell O. Breast-feeding protects against celiac disease in childhood—epidemiological evidence. Adv Exp Med Biol 2002; 503:115–123.
- Norris JM, Barriga K, Hoffenberg EJ, et al. Risk of celiac disease autoimmunity and timing of gluten introduction in the diet of infants at increased risk of disease. JAMA 2005; 293:2343–2351.
- Vriezinga SL, Auricchio R, Bravi E, et al. Randomized feeding intervention in infants at high risk for celiac disease. N Engl J Med 2014; 371:1304–1315.
- Lionetti E, Castelaneta S, Francavilla R, et al. Introduction of gluten, HLA status, and the risk of celiac disease in children. N Engl J Med 2014; 371:1295–1303
- Green PH. The many faces of celiac disease: clinical presentation of celiac disease in the adult population. Gastroenterology 2005; 128:S74–S78.
- Rampertab SD, Pooran N, Brar P, Singh P, Green PH. Trends in the presentation of celiac disease. Am J Med 2006; 119:355 e9–e14.
- Rashid M, Cranney A, Zarkadas M, et al. Celiac disease: evaluation of the diagnosis and dietary compliance in Canadian children. Pediatrics 2005; 116:e754–e759.
- Molteni N, Bardella MT, Bianchi PA. Obstetric and gynecological problems in women with untreated celiac sprue. J Clin Gastroenterol 1990; 12:37–39.
- Tersigni C, Castellani R, de Waure C, et al. Celiac disease and reproductive disorders: meta-analysis of epidemiologic associations and potential pathogenic mechanisms. Hum Reprod Update 2014; 20:582–593.
- Meyer D, Stravropolous S, Diamond B, Shane E, Green PH. Osteoporosis in a North American adult population with celiac disease. Am J Gastroenterol 2001; 96:112–119.
- Fouda MA, Khan AA, Sultan MS, Rios LP, McAssey K, Armstrong D. Evaluation and management of skeletal health in celiac disease: position statement. Can J Gastroenterol 2012; 26:819–829.
- van der Pals M, Ivarsson A, Norström F, Högberg L, Svensson J, Carlsson A. Prevalence of thyroid autoimmunity in children with celiac disease compared to healthy 12-year olds. Autoimmune Dis 2014; 2014:417356.
- Mahmud FH, Murray JA, Kudva YC, et al. Celiac disease in type 1 diabetes mellitus in a North American community: prevalence, serologic screening, and clinical features. Mayo Clin Proc 2005; 80:1429–1434.
- Sorensen HT, Thulstrup AM, Blomqvist P, Nørgaard B, Fonager K, Ekbom A. Risk of primary biliary liver cirrhosis in patients with coeliac disease: Danish and Swedish cohort data. Gut 1999; 44:736–738.
- Volta U, Rodrigo L, Granito A, et al. Celiac disease in autoimmune cholestatic liver disorders. Am J Gastroenterol 2002; 97:2609–2613.
- Elfstrom P, Montgomery SM, Kämpe O, Ekbom A, Ludvigsson JF. Risk of primary adrenal insufficiency in patients with celiac disease. J Clin Endocrinol Metab 2007; 92:3595–3598.
- Younus J, Ahmed AR. Clinical features of dermatitis herpetiformis. Clin Dermatol 1991; 9:279–281.
- Bolotin D, Petronic-Rosic V. Dermatitis herpetiformis. Part I. Epidemiology, pathogenesis, and clinical presentation. J Am Acad Dermatol 2011; 64:1017–1026.
- Lahteenoja H, Irjala K, Viander M, Vainio E, Toivanen A, Syrjänen S. Oral mucosa is frequently affected in patients with dermatitis herpetiformis. Arch Dermatol 1998; 134:756–758.
- Marks R, Jones EW. Purpura in dermatitis herpetiformis. Br J Dermatol 1971; 84:386–388.
- McGovern TW, Bennion SD. Palmar purpura: an atypical presentation of childhood dermatitis herpetiformis. Pediatr Dermatol 1994; 11:319–322.
- Pierce DK, Purcell SM, Spielvogel RL. Purpuric papules and vesicles of the palms in dermatitis herpetiformis. J Am Acad Dermatol 1987; 16:1274–1276.
- Lorand L, Graham RM. Transglutaminases: crosslinking enzymes with pleiotropic functions. Nat Rev Mol Cell Biol 2003; 4:140–156.
- Hull CM, Liddle M, Hansen N, et al. Elevation of IgA anti-epidermal transglutaminase antibodies in dermatitis herpetiformis. Br J Dermatol 2008; 159:120–124.
- Kawana S, Segawa A. Confocal laser scanning microscopic and immunoelectron microscopic studies of the anatomical distribution of fibrillar IgA deposits in dermatitis herpetiformis. Arch Dermatol 1993; 129:456–459.
- Sárdy M, Kárpáti S, Merkl B, Paulsson M, Smyth N. Epidermal transglutaminase (TGase 3) is the autoantigen of dermatitis herpetiformis. J Exp Med 2002; 195:747–757.
- Nicolas ME, Krause PK, Gibson LE, Murray JA. Dermatitis herpetiformis. Int J Dermatol 2003; 42:588–600.
- Leonard J, Haffenden G, Tucker W, et al. Gluten challenge in dermatitis herpetiformis. N Engl J Med 1983; 308:816–819.
- Summaries for patients. Risk for lymphoma and the results of follow-up gut biopsies in patients with celiac disease. Ann Intern Med 2013; 159:I–20.
- Lebwohl B, Granath F, Ekbom A, et al. Mucosal healing and risk for lymphoproliferative malignancy in celiac disease: a population-based cohort study. Ann Intern Med 2013; 159:169–175.
- Volta U, Vincentini O, Quintarelli F, Felli C, Silano M; Collaborating Centres of the Italian Registry of the Complications of Celiac Disease. Low risk of colon cancer in patients with celiac disease. Scand J Gastroenterol 2014; 49:564–568.
- Askling J, Linet M, Gridley G, Halstensen TS, Ekström K, Ekbom A. Cancer incidence in a population-based cohort of individuals hospitalized with celiac disease or dermatitis herpetiformis. Gastroenterology 2002; 123:1428–1435.
- Elfström P, Granath F, Ye W, Ludvigsson JF. Low risk of gastrointestinal cancer among patients with celiac disease, inflammation, or latent celiac disease. Clin Gastroenterol Hepatol 2012; 10:30–36.
- Al-Toma A, Verbeek WH, Hadithi M, von Blomberg BM, Mulder CJ. Survival in refractory coeliac disease and enteropathy-associated T-cell lymphoma: retrospective evaluation of single-centre experience. Gut 2007; 56:1373–1378.
- Verbeek WH, Van De Water JM, Al-Toma A, Oudejans JJ, Mulder CJ, Coupé VM. Incidence of enteropathy—associated T-cell lymphoma: a nation-wide study of a population-based registry in The Netherlands. Scand J Gastroenterol 2008; 43:1322–1328.
- Sharaiha RZ, Lebwohl B, Reimers L, Bhagat G, Green PH, Neugut AI. Increasing incidence of enteropathy-associated T-cell lymphoma in the United States, 1973-2008. Cancer 2012; 118:3786–3792.
- Mearin ML, Catassi C, Brousse N, et al; Biomed Study Group on Coeliac Disease and Non-Hodgkin Lymphoma. European multi-centre study on coeliac disease and non-Hodgkin lymphoma. Eur J Gastroenterol Hepatol 2006; 18:187–194.
- Al-Toma A, Goerres MS, Meijer JW, Pena AS, Crusius JB, Mulder CJ. Human leukocyte antigen-DQ2 homozygosity and the development of refractory celiac disease and enteropathy-associated T-cell lymphoma. Clin Gastroenterol Hepatol 2006; 4:315–319.
- Sieniawski MK, Lennard AL. Enteropathy-associated T-cell lymphoma: epidemiology, clinical features, and current treatment strategies. Curr Hematol Malig Rep 2011; 6:231–240.
- Lebwohl B, Eriksson H, Hansson J, Green PH, Ludvigsson JF. Risk of cutaneous malignant melanoma in patients with celiac disease: a population-based study. J Am Acad Dermatol 2014; 71:245–248.
- Ludvigsson JF, Lebwohl B, Kämpe O, Murray JA, Green PH, Ekbom A. Risk of thyroid cancer in a nationwide cohort of patients with biopsy-verified celiac disease. Thyroid 2013; 23:971–976.
- Ludvigsson JF, West J, Ekbom A, Stephansson O. Reduced risk of breast, endometrial and ovarian cancer in women with celiac disease. Int J Cancer 2012; 13:E244–E250.
- Rubio-Tapia A, Hill ID, Kelly CP, Calderwood AH, Murray JA; American College of Gastroenterology. ACG clinical guidelines: diagnosis and management of celiac disease. Am J Gastroenterol 2013; 108:656–677.
- Marsh MN. Gluten, major histocompatibility complex, and the small intestine. A molecular and immunobiologic approach to the spectrum of gluten sensitivity (‘celiac sprue’). Gastroenterology 1992; 102:330–354.
- Hadithi M, von Blomberg BM, Crusius JB, et al. Accuracy of serologic tests and HLA-DQ typing for diagnosing celiac disease. Ann Intern Med 2007; 147:294–302.
- Lo W, Sano K, Lebwohl B, Diamond B, Green PH. Changing presentation of adult celiac disease. Dig Dis Sci 2003; 48:395–398.
- Oxentenko AS, Grisolano SW, Murray JA, Burgart LJ, Dierkhising RA, Alexander JA. The insensitivity of endoscopic markers in celiac disease. Am J Gastroenterol 2002; 97:933–938.
- Casella G, Antonelli E, Di Bella C, et al. Prevalence and causes of abnormal liver function in patients with coeliac disease. Liver Int 2013; 33:1128–1131.
- Jaskowski TD, Hamblin T, Wilson AR, et al. IgA anti-epidermal transglutaminase antibodies in dermatitis herpetiformis and pediatric celiac disease. J Invest Dermatol 2009; 129:2728–2730.
- Zone JJ, Meyer LJ, Petersen MJ. Deposition of granular IgA relative to clinical lesions in dermatitis herpetiformis. Arch Dermatol 1996; 132:912–918.
- Plotnikova N, Miller JL. Dermatitis herpetiformis. Skin Ther Lett 2013; 18:1–3.
- Murray JA, Watson T, Clearman B, Mitros F. Effect of a gluten-free diet on gastrointestinal symptoms in celiac disease. Am J Clin Nutr 2004; 79:669–673.
- Akobeng AK, Thomas AG. Systematic review: tolerable amount of gluten for people with coeliac disease. Aliment Pharmacol Ther 2008; 27:1044–1052.
- Catassi C, Fabiani E, Iacono G, et al. A prospective, double-blind, placebo-controlled trial to establish a safe gluten threshold for patients with celiac disease. Am J Clin Nutr 2007; 85:160–166.
- Leffler DA, Edwards-George J, Dennis M, et al. Factors that influence adherence to a gluten-free diet in adults with celiac disease. Dig Dis Sci 2008; 53:1573–1581.
- Caruso R, Pallone F, Stasi E, Romeo S, Monteleone G. Appropriate nutrient supplementation in celiac disease. Ann Med 2013; 45:522–531.
- Nachman F, Sugai E, Vazquez H, et al. Serological tests for celiac disease as indicators of long-term compliance with the gluten-free diet. Eur J Gastroenterol Hepatol 2011; 23:473–480.
- Abdulkarim AS, Burgart LJ, See J, Murray JA. Etiology of nonresponsive celiac disease: results of a systemic approach. Am J Gastroenterol 2002; 97:2016–2021.
- Fry L, Seah PP, Hoffbrand AV. Dermatitis herpetiformis. Clin Gastroenterol 1974; 3:145–157.
- Zhu YI, Stiller MJ. Dapsone and sulfones in dermatology: overview and update. J Am Acad Dermatol 2001; 45:420-434.
- Wolf R, Matz H, Orion E, Tuzun B, Tuzun Y. Dapsone. Dermatol Online J 2002; 8:2.
- Ciacci C, Maiuri L, Caporaso N, et al. Celiac disease: in vitro and in vivo safety and palatability of wheat-free sorghum food products. Clin Nutr 2007; 26:799–805.
- Lähdeaho ML, Kaukinen K, Laurila K, et al. Glutenase ALV003 attenuates gluten-induced mucosal injury in patients with celiac disease. Gastroenterology 2014; 146:1649–1658.
- Roshan B, Leffler DA, Jamma S, et al. The incidence and clinical spectrum of refractory celiac disease in a North American referral center. Am J Gastroenterol 2011; 106:923–928.
- Leffler DA, Dennis M, Hyett B, Kelly E, Schuppan D, Kelly CP. Etiologies and predictors of diagnosis in nonresponsive celiac disease. Clin Gastroenterol Hepatol 2007; 5:445–450.
- Cellier C, Delabesse E, Helmer C, et al. Refractory sprue, coeliac disease, and enteropathy-associated T-cell lymphoma. French Coeliac Disease Study Group. Lancet 2000; 356:203–208.
- Malamut G, Afchain P, Verkarre V, et al. Presentation and long-term follow-up of refractory celiac disease: comparison of type I with type II. Gastroenterology 2009; 136:81–90.
- Goerres MS, Meijer JW, Wahab PJ, et al. Azathioprine and prednisone combination therapy in refractory celiac disease. Aliment Pharmacol Ther 2003; 18:487–494.
- Tack GJ, Verbeek WH, Al-Toma A, et al. Evaluation of cladribine treatment in refractory celiac disease type II. World J Gastroenterol 2011; 17:506–513.
- Sapone A, Bai JC, Dolinsek J, et al. Spectrum of gluten-related disorders: consensus on new nomenclature and classification. BMC Med 2012; 7:10–13.
- Sapone A, Lammers KM, Casolaro V, et al. Divergence of gut permeability and mucosal immune gene expression in two gluten-associated conditions: celiac disease and gluten sensitivity. BMC Med 2011; 9:9–23.
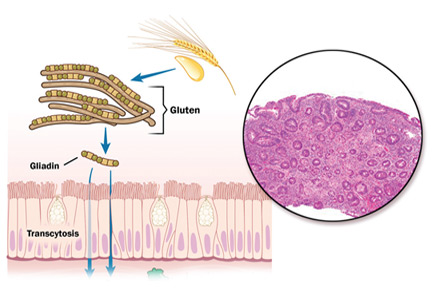
Ki-67 bests cytology, growth pattern as prognostic factor for MCL
Evaluating routinely available histopathological prognostic features from more than 500 MCL patients in prospective trials, researchers found that the Ki-67 index is a better prognostic factor than are cytology and growth pattern in mantle-cell lymphoma (MCL). In addition, the combination of the Ki-67 index with the Mantle Cell Lymphoma International Prognostic Index [MIPI] defined four prognostic groups with better discrimination than did MIPI or the two-category biologic MIPI (MIPI-b) alone.
Higher Ki-67 index was associated with poorer overall survival (OS) (hazard ratio [HR], 1.24 per 10% increase; P less than .001) and progression-free survival (PFS) (HR, 1.17; P less than .001). Consistent with an earlier, population-based study, results showed prognostic value for a 30% cutoff of the Ki-67 index. Quantitative levels below 30% provided no additional prognostic information.
“The Ki-67 index remains the only routinely available independent prognostic factor in addition to MIPI. In contrast to cytology and growth pattern, the Ki-67 evaluation has been standardized for routine application,” wrote Dr. Eva Hoster of University Hospital Munich, and colleagues. “The modified combination of Ki-67 index and MIPI integrates the most important clinical and biologic markers currently available in clinical routine and was shown to allow a simple and powerful risk stratification superior to MIPI and MIPI-b in our evaluation,” they added (J Clin Oncol. 2016 Feb. 29. doi: 10.1200/jco.63.8387).
Blastoid cytology was associated with inferior 5-year OS compared with nonblastoid cytology (35% vs. 68%; HR, 2.35; P less than .001) and PFS (29% vs. 44%; HR, 1.58; P = .007), but the effect was largely accounted for by a generally higher Ki-67 index in blastoid MCL. Diffuse growth pattern was associated slightly worse 5-year OS (61% vs. 72%; HR, 1.38; P = .048) and PFS (38% vs. 49%; HR, 1.25; P = .087), but the effect was largely explained by MIPI score.
Combining dichotomized Ki-67 (above or below 30%) with MIPI risk groups defined four prognostic groups by the sum of weights (total 0 to 3): Ki-67 of 30% or more (weight 1), intermediate-risk MIPI (weight 1), and high-risk MIPI (weight 2). The 5-year OS rates for the four groups ranged from 17% to 85%, with OS hazard ratios greater than 2 between adjacent risk groups.
The study analyzed pooled data from two randomized trials initiated in 2004 by the European Mantle Cell Lymphoma Network, MCL Younger and MCL Elderly. In total, 508 patients of median age 62 years were included. The proportion of low-risk, intermediate-risk, and high-risk MIPI were 41%, 35%, and 24%, respectively.
Research was supported in part by Roche. Dr. Hoster reported receiving funding from Roche Pharma AG and Celgene. Several of her coauthors reported ties to industry.
FROM JOURNAL OF CLINICAL ONCOLOGY
Key clinical point: The Ki-67 index was superior to cytology and growth pattern as a prognostic factor in mantle-cell lymphoma (MCL).
Major finding: Higher Ki-67 index was associated with poorer overall survival (hazard ratio [HR], 1.24 per 10% increase; P less than .001) and progression-free survival (HR, 1.17; P less than .001).
Data source: Pooled data from two randomized trials initiated in 2004 by the European Mantle Cell Lymphoma Network, MCL Younger and MCL Elderly, included 508 patients.
Disclosures: Research was supported in part by Roche. Dr. Hoster reported receiving funding from Roche Pharma AG and Celgene. Several of her coauthors reported ties to industry.
Intellectual disability impedes decision-making in organ transplantation
CASE REPORT Evaluation for renal transplant
Mr. B, age 21, who has a diagnosis of autism spectrum disorder and an IQ comparable to that of a 4-year-old, is referred for evaluation of his candidacy for renal transplant.
A few months earlier, Mr. B pulled out his temporary dialysis catheter. Now, he receives hemodialysis through an arteriovenous fistula in the arm, but requires constant supervision during dialysis.
At evaluation, Mr. B is accompanied by his parents and his older sister, who have been providing day-to-day care for him. They appear fully committed to his well-being.
Mr. B does not have a living donor.
Needed: Assessment of adaptive functioning
DSM-5 defines intellectual disability as a disorder with onset during the developmental period. It includes deficits of intellectual and adaptive functioning in conceptual, social, and practical domains.
Regrettably, many authors focus exclusively on intellectual functioning and IQ, classifying patients as having intellectual disability based on intelligence tests alone.1,2 Adaptive capabilities are insufficiently taken into consideration; there is an urgent need to supplement IQ testing with neuropsychological testing of a patient’s cognitive and adaptive functioning.
Landmark case
In 1995, Sandra Jensen, age 34, with trisomy 21 (Down syndrome) was denied a heart and lung transplant at 2 prominent academic institutions. The denial created a national debate; Jensen’s advocates persuaded one of the hospitals to reconsider.3,4
In 1996, Jensen received the transplant, but she died 18 months later from complications of immunosuppressive therapy. Her surgery was a landmark event; previously, no patient with trisomy 21 or intellectual disability had undergone organ transplantation.
Although attitudes and practices have changed in the past 2 decades, intellectual disability is still considered a relative contraindication to certain organ transplants.5
Why is intellectual disability still a contraindication?
Allocation of transplant organs is based primarily on the ethical principle of utilitarianism: ie, a morally good action is one that helps the greatest number of people. “Benefit” might take the form of the number of lives saved or the number of years added to a patient’s life.
There is little consensus on the definition of quality of life, with its debatable ideological standpoint that stands, at times, in contrast to distributive justice. Studies have shown that the long-term outcome for patients with intellectual disability who received a kidney transplant is comparable to the outcome after renal transplant for patients who are not intellectually disabled. In other studies, patients with intellectual disability and their caregivers report improvement in quality of life after transplant.
The goal of successful transplantation is improvement in quality of life and an increase in longevity. Compliance with all aspects of post-transplant treatment is essential—which is why intellectual disability remains a relative contraindication to heart transplantation in the guidelines of the International Society for Heart and Lung Transplantation. The society’s position is based on a theoretical rationale: ie, “concerns about compliance.”
Only 7 cases of successful long-term outcome after cardiac transplantation have been reported in patients with intellectual disability, and these were marked by the presence of the social and cognitive support necessary for post-transplant compliance with treatment.5 One of these 7 patients had a lengthy hospitalization 4 years after transplantation because of poor adherence to his medication regimen, following the functional decline of his primary caregiver.
Two-pronged evaluation is needed. Most patients undergoing organ transplantation receive a psychosocial assessment that varies from institution to institution. Intellectual disability can add complexity to the task of assessing candidacy for transplantation, however. In these patients, the availability and adequacy of caregivers is as important a part of decision-making as assessment of the patients themselves—yet studies of the assessment of caregivers are limited. The patient’s caregivers should be present during evaluation so that their knowledge, ability, and willingness to take on post-transplant responsibilities can be assessed. More research is needed on long-term outcomes of successful transplantation in patients with intellectual disability.
CASE CONTINUED Placement on hold
The transplant committee decides to postpone placing Mr. B on the transplant waiting list. Consensus is to revisit the question of placing him on the list at a later date.
What led to this decision?
The committee had several concerns about approving Mr. B for a transplant:
- His history of pulling out the catheter meant that he would require closer postoperative monitoring, because he would likely have drains and a urinary catheter inserted.
- Maintaining adequate oral hydration with a new kidney could be a challenge because Mr. B would not be able to comprehend how dehydration can destroy a new kidney.
- His parents believed that, after transplant, Mr. B would not be dependent on them; they failed to understand that he requires lifelong supervision to ensure compliance with immunosuppressive medications and return for follow-up.
The committee’s decision was aided by the rationale that dialysis is readily available and is a sustainable alternative to transplantation.
Mr. B’s case raises an ethical question
We speculate what the team’s decision about transplantation would have been if Mr. B (1) had a living donor or (2) was being considered for a heart, lung, or liver transplant—for which there is no analogous procedure to dialysis to sustain the patient.
1. Arciniegas DB, Filley CM. Implications of impaired cognition for organ transplant candidacy. Curr Opin Organ Transplant. 1999;4(2):168-172.
2. Dobbels F. Intellectual disability in pediatric transplantation: pitfalls and opportunities. Pediatr Transplant. 2014;18(7):658-660.
3. Martens MA, Jones L, Reiss S. Organ transplantation, organ donation and mental retardation. Pediatr Transplant. 2006;10(6):658-664.
4. Panocchia N, Bossola M, Vivanti G. Transplantation and mental retardation: what is the meaning of a discrimination? Am J Transplant. 2010;10(4):727-730.
5. Samelson-Jones E, Mancini D, Shapiro PA. Cardiac transplantation in adult patients with mental retardation: do outcomes support consensus guidelines? Psychosomatics. 2012;53(2):133-138.
CASE REPORT Evaluation for renal transplant
Mr. B, age 21, who has a diagnosis of autism spectrum disorder and an IQ comparable to that of a 4-year-old, is referred for evaluation of his candidacy for renal transplant.
A few months earlier, Mr. B pulled out his temporary dialysis catheter. Now, he receives hemodialysis through an arteriovenous fistula in the arm, but requires constant supervision during dialysis.
At evaluation, Mr. B is accompanied by his parents and his older sister, who have been providing day-to-day care for him. They appear fully committed to his well-being.
Mr. B does not have a living donor.
Needed: Assessment of adaptive functioning
DSM-5 defines intellectual disability as a disorder with onset during the developmental period. It includes deficits of intellectual and adaptive functioning in conceptual, social, and practical domains.
Regrettably, many authors focus exclusively on intellectual functioning and IQ, classifying patients as having intellectual disability based on intelligence tests alone.1,2 Adaptive capabilities are insufficiently taken into consideration; there is an urgent need to supplement IQ testing with neuropsychological testing of a patient’s cognitive and adaptive functioning.
Landmark case
In 1995, Sandra Jensen, age 34, with trisomy 21 (Down syndrome) was denied a heart and lung transplant at 2 prominent academic institutions. The denial created a national debate; Jensen’s advocates persuaded one of the hospitals to reconsider.3,4
In 1996, Jensen received the transplant, but she died 18 months later from complications of immunosuppressive therapy. Her surgery was a landmark event; previously, no patient with trisomy 21 or intellectual disability had undergone organ transplantation.
Although attitudes and practices have changed in the past 2 decades, intellectual disability is still considered a relative contraindication to certain organ transplants.5
Why is intellectual disability still a contraindication?
Allocation of transplant organs is based primarily on the ethical principle of utilitarianism: ie, a morally good action is one that helps the greatest number of people. “Benefit” might take the form of the number of lives saved or the number of years added to a patient’s life.
There is little consensus on the definition of quality of life, with its debatable ideological standpoint that stands, at times, in contrast to distributive justice. Studies have shown that the long-term outcome for patients with intellectual disability who received a kidney transplant is comparable to the outcome after renal transplant for patients who are not intellectually disabled. In other studies, patients with intellectual disability and their caregivers report improvement in quality of life after transplant.
The goal of successful transplantation is improvement in quality of life and an increase in longevity. Compliance with all aspects of post-transplant treatment is essential—which is why intellectual disability remains a relative contraindication to heart transplantation in the guidelines of the International Society for Heart and Lung Transplantation. The society’s position is based on a theoretical rationale: ie, “concerns about compliance.”
Only 7 cases of successful long-term outcome after cardiac transplantation have been reported in patients with intellectual disability, and these were marked by the presence of the social and cognitive support necessary for post-transplant compliance with treatment.5 One of these 7 patients had a lengthy hospitalization 4 years after transplantation because of poor adherence to his medication regimen, following the functional decline of his primary caregiver.
Two-pronged evaluation is needed. Most patients undergoing organ transplantation receive a psychosocial assessment that varies from institution to institution. Intellectual disability can add complexity to the task of assessing candidacy for transplantation, however. In these patients, the availability and adequacy of caregivers is as important a part of decision-making as assessment of the patients themselves—yet studies of the assessment of caregivers are limited. The patient’s caregivers should be present during evaluation so that their knowledge, ability, and willingness to take on post-transplant responsibilities can be assessed. More research is needed on long-term outcomes of successful transplantation in patients with intellectual disability.
CASE CONTINUED Placement on hold
The transplant committee decides to postpone placing Mr. B on the transplant waiting list. Consensus is to revisit the question of placing him on the list at a later date.
What led to this decision?
The committee had several concerns about approving Mr. B for a transplant:
- His history of pulling out the catheter meant that he would require closer postoperative monitoring, because he would likely have drains and a urinary catheter inserted.
- Maintaining adequate oral hydration with a new kidney could be a challenge because Mr. B would not be able to comprehend how dehydration can destroy a new kidney.
- His parents believed that, after transplant, Mr. B would not be dependent on them; they failed to understand that he requires lifelong supervision to ensure compliance with immunosuppressive medications and return for follow-up.
The committee’s decision was aided by the rationale that dialysis is readily available and is a sustainable alternative to transplantation.
Mr. B’s case raises an ethical question
We speculate what the team’s decision about transplantation would have been if Mr. B (1) had a living donor or (2) was being considered for a heart, lung, or liver transplant—for which there is no analogous procedure to dialysis to sustain the patient.
1. Arciniegas DB, Filley CM. Implications of impaired cognition for organ transplant candidacy. Curr Opin Organ Transplant. 1999;4(2):168-172.
2. Dobbels F. Intellectual disability in pediatric transplantation: pitfalls and opportunities. Pediatr Transplant. 2014;18(7):658-660.
3. Martens MA, Jones L, Reiss S. Organ transplantation, organ donation and mental retardation. Pediatr Transplant. 2006;10(6):658-664.
4. Panocchia N, Bossola M, Vivanti G. Transplantation and mental retardation: what is the meaning of a discrimination? Am J Transplant. 2010;10(4):727-730.
5. Samelson-Jones E, Mancini D, Shapiro PA. Cardiac transplantation in adult patients with mental retardation: do outcomes support consensus guidelines? Psychosomatics. 2012;53(2):133-138.

Proposal Requires Three Lesions for Diagnosis of MS
A European expert group has proposed several revisions to the 2010 McDonald criteria for the use of MRI in diagnosing multiple sclerosis (MS). In the January 25 online issue of Lancet Neurology, the MAGNIMS collaborative research network asserted that new data on the application of MRI, as well as improvements in MRI technology, demanded changes to the MS diagnostic criteria.
The first proposed recommendation is that three or more focal lesions, rather than a single lesion, should be present for a physician to diagnose the involvement of the periventricular region and to show disease dissemination in space. “A single lesion was deemed not sufficiently specific to determine whether involvement of the periventricular region is due to a demyelinating inflammatory event, and the use of one periventricular lesion for assessing dissemination in space has never been formally validated,” said Massimo Filippi, MD, Professor of Neurology at Vita-Salute San Raffaele University in Milan, and his coauthors. The authors also pointed out that incidental periventricular lesions are observed in as much as 30% of patients with migraine, and in individuals with other neurologic disorders.
In addition, the group recommended that optic nerve lesions be added to the criteria for dissemination in space. “Clinical documentation of optic nerve atrophy or pallor, neurophysiological confirmation of optic nerve dysfunction (slowed conduction), or imaging features of clinically silent optic nerve inflammation (MRI lesions or retinal nerve fiber layer thinning) support dissemination in space and, in patients without concurrent visual symptoms, dissemination in time.”
According to the new recommendations, disease dissemination in space can be shown by the involvement of at least two areas from a list of the following five possibilities: three or more periventricular lesions, one or more infratentorial lesions, one or more spinal cord lesions, one or more optic nerve lesions, or one or more cortical or juxtacortical lesions.
The group did not propose any significant changes to the criteria for dissemination in time. They did note, however, that the presence of nonenhancing black holes should not be considered as a potential alternative criterion to show dissemination in time in adult patients.
The committee also supported the existing recommendations that children age 11 or older with nonacute disseminated encephalomyelitis-like presentation should be diagnosed with the same criteria for dissemination in time and space as are applied to adults. “Several studies have confirmed that the 2010 McDonald criteria perform better than or similarly to previously proposed pediatric MS criteria for diagnosis of children with nonacute disseminated encephalomyelitis presentations and pediatric patients older than 11 years, and the consensus group therefore recommend caution when using these criteria in children younger than 11 years,” they said.
Other recommendations include that there be no distinction required between symptomatic and asymptomatic MRI lesions for diagnosing dissemination in time or space; that the whole spinal cord be imaged to define dissemination in space, particularly in patients who do not fulfill the brain MRI criteria; and that the same criteria for dissemination in space be used for primary progressive MS and relapse-onset MS, with CSF results considered for clinically uncertain cases of primary progressive MS.
—Bianca Nogrady
Suggested Reading
Filippi M, Rocca MA, Ciccarelli O, et al. MRI criteria for the diagnosis of multiple sclerosis: MAGNIMS consensus guidelines. Lancet Neurol. 2016 Jan 25 [Epub ahead of print].
A European expert group has proposed several revisions to the 2010 McDonald criteria for the use of MRI in diagnosing multiple sclerosis (MS). In the January 25 online issue of Lancet Neurology, the MAGNIMS collaborative research network asserted that new data on the application of MRI, as well as improvements in MRI technology, demanded changes to the MS diagnostic criteria.
The first proposed recommendation is that three or more focal lesions, rather than a single lesion, should be present for a physician to diagnose the involvement of the periventricular region and to show disease dissemination in space. “A single lesion was deemed not sufficiently specific to determine whether involvement of the periventricular region is due to a demyelinating inflammatory event, and the use of one periventricular lesion for assessing dissemination in space has never been formally validated,” said Massimo Filippi, MD, Professor of Neurology at Vita-Salute San Raffaele University in Milan, and his coauthors. The authors also pointed out that incidental periventricular lesions are observed in as much as 30% of patients with migraine, and in individuals with other neurologic disorders.
In addition, the group recommended that optic nerve lesions be added to the criteria for dissemination in space. “Clinical documentation of optic nerve atrophy or pallor, neurophysiological confirmation of optic nerve dysfunction (slowed conduction), or imaging features of clinically silent optic nerve inflammation (MRI lesions or retinal nerve fiber layer thinning) support dissemination in space and, in patients without concurrent visual symptoms, dissemination in time.”
According to the new recommendations, disease dissemination in space can be shown by the involvement of at least two areas from a list of the following five possibilities: three or more periventricular lesions, one or more infratentorial lesions, one or more spinal cord lesions, one or more optic nerve lesions, or one or more cortical or juxtacortical lesions.
The group did not propose any significant changes to the criteria for dissemination in time. They did note, however, that the presence of nonenhancing black holes should not be considered as a potential alternative criterion to show dissemination in time in adult patients.
The committee also supported the existing recommendations that children age 11 or older with nonacute disseminated encephalomyelitis-like presentation should be diagnosed with the same criteria for dissemination in time and space as are applied to adults. “Several studies have confirmed that the 2010 McDonald criteria perform better than or similarly to previously proposed pediatric MS criteria for diagnosis of children with nonacute disseminated encephalomyelitis presentations and pediatric patients older than 11 years, and the consensus group therefore recommend caution when using these criteria in children younger than 11 years,” they said.
Other recommendations include that there be no distinction required between symptomatic and asymptomatic MRI lesions for diagnosing dissemination in time or space; that the whole spinal cord be imaged to define dissemination in space, particularly in patients who do not fulfill the brain MRI criteria; and that the same criteria for dissemination in space be used for primary progressive MS and relapse-onset MS, with CSF results considered for clinically uncertain cases of primary progressive MS.
—Bianca Nogrady
Suggested Reading
Filippi M, Rocca MA, Ciccarelli O, et al. MRI criteria for the diagnosis of multiple sclerosis: MAGNIMS consensus guidelines. Lancet Neurol. 2016 Jan 25 [Epub ahead of print].
Suggested Reading
Filippi M, Rocca MA, Ciccarelli O, et al. MRI criteria for the diagnosis of multiple sclerosis: MAGNIMS consensus guidelines. Lancet Neurol. 2016 Jan 25 [Epub ahead of print].
Phenytoin May Offer Neuroprotection to Patients With Optic Neuritis
Patients with acute demyelinating optic neuritis who received phenytoin lost 30% less of their retinal nerve fiber layer (RNFL) than did placebo-treated patients in a randomized phase II study published online ahead of print January 25 in Lancet Neurology. “The results of this clinical trial support the concept of neuroprotection using phenytoin to inhibit voltage-gated sodium channels in patients with acute optic neuritis,” said Rhian Raftopoulos, MD, of the National Hospital for Neurology and Neurosurgery in London, and coauthors.
In the study of 86 people with acute optic neuritis, investigators randomized 29 participants to receive 4 mg/kg/day of oral phenytoin, 13 participants to receive 6 mg/kg/day of oral phenytoin, and 44 participants to receive placebo for three months. All participants were randomized within 14 days of vision loss. One-third of the patients had previously been diagnosed with multiple sclerosis or was diagnosed at presentation, and 74% had at least one brain lesion on MRI.
Treatment with phenytoin was associated with a decline of mean RNFL thickness in the affected eye from 130.62 μm at baseline to 81.46 μm at six months, compared with a decline from 125.20 μm to 74.29 μm in the placebo group, representing a statistically significant adjusted mean difference of 7.15 μm.
The researchers also noted a significant 34% reduction in macular volume loss in the treatment arm, compared with placebo, representing an adjusted mean difference of 0.20 mm3. However, the treatment had no significant effect on low-contrast visual acuity and visual evoked potentials.
The most common adverse event in the treatment arm was maculopapular rash, which was judged as severe in one patient treated with phenytoin.
“The absence of regular, early outcome assessments around one to two months after initiation of treatment makes it hard to interpret the results because they would have helped to rule out a primarily anti-inflammatory effect of the treatment by tracking RNFL swelling and possible optic nerve inflammation, especially given that there was higher baseline RNFL thickness and worse low-contrast visual acuity in the patients who received phenytoin,” said Shiv Saidha, MBBCh, Assistant Professor of Neurology, and Peter A. Calabresi, MD, Director of the Division of Neuroimmunology, both at Johns Hopkins University in Baltimore, in an accompanying editorial. “If the true RNFL thickness at baseline in the affected eye of patients in the phenytoin group was higher than those in the placebo group, it could have accounted for the findings, even though the investigators made a prespecified adjustment for it.
“Although the results of this study are a major advancement and undeniably encouraging, future studies need to include more frequent optical coherence tomography (OCT) sampling, as well as more detailed OCT-segmentation-derived retinal measures such as ganglion cell plus inner plexiform layer thickness, which do not swell during acute optic neuritis, mitigating the need for statistical corrections involving the unaffected eye,” they concluded.
—Bianca Nogrady
Suggested Reading
Raftopoulos R, Hickman SJ, Toosy A, et al. Phenytoin for neuroprotection in patients with acute optic neuritis: a randomised, placebo-controlled, phase 2 trial. Lancet Neurol. 2016 Jan 25 [Epub ahead of print].
Saidha S, Calabresi PA. Phenytoin in acute optic neuritis: neuroprotective or not? Lancet Neurol. 2016 Jan 25 [Epub ahead of print].
Patients with acute demyelinating optic neuritis who received phenytoin lost 30% less of their retinal nerve fiber layer (RNFL) than did placebo-treated patients in a randomized phase II study published online ahead of print January 25 in Lancet Neurology. “The results of this clinical trial support the concept of neuroprotection using phenytoin to inhibit voltage-gated sodium channels in patients with acute optic neuritis,” said Rhian Raftopoulos, MD, of the National Hospital for Neurology and Neurosurgery in London, and coauthors.
In the study of 86 people with acute optic neuritis, investigators randomized 29 participants to receive 4 mg/kg/day of oral phenytoin, 13 participants to receive 6 mg/kg/day of oral phenytoin, and 44 participants to receive placebo for three months. All participants were randomized within 14 days of vision loss. One-third of the patients had previously been diagnosed with multiple sclerosis or was diagnosed at presentation, and 74% had at least one brain lesion on MRI.
Treatment with phenytoin was associated with a decline of mean RNFL thickness in the affected eye from 130.62 μm at baseline to 81.46 μm at six months, compared with a decline from 125.20 μm to 74.29 μm in the placebo group, representing a statistically significant adjusted mean difference of 7.15 μm.
The researchers also noted a significant 34% reduction in macular volume loss in the treatment arm, compared with placebo, representing an adjusted mean difference of 0.20 mm3. However, the treatment had no significant effect on low-contrast visual acuity and visual evoked potentials.
The most common adverse event in the treatment arm was maculopapular rash, which was judged as severe in one patient treated with phenytoin.
“The absence of regular, early outcome assessments around one to two months after initiation of treatment makes it hard to interpret the results because they would have helped to rule out a primarily anti-inflammatory effect of the treatment by tracking RNFL swelling and possible optic nerve inflammation, especially given that there was higher baseline RNFL thickness and worse low-contrast visual acuity in the patients who received phenytoin,” said Shiv Saidha, MBBCh, Assistant Professor of Neurology, and Peter A. Calabresi, MD, Director of the Division of Neuroimmunology, both at Johns Hopkins University in Baltimore, in an accompanying editorial. “If the true RNFL thickness at baseline in the affected eye of patients in the phenytoin group was higher than those in the placebo group, it could have accounted for the findings, even though the investigators made a prespecified adjustment for it.
“Although the results of this study are a major advancement and undeniably encouraging, future studies need to include more frequent optical coherence tomography (OCT) sampling, as well as more detailed OCT-segmentation-derived retinal measures such as ganglion cell plus inner plexiform layer thickness, which do not swell during acute optic neuritis, mitigating the need for statistical corrections involving the unaffected eye,” they concluded.
—Bianca Nogrady
Suggested Reading
Raftopoulos R, Hickman SJ, Toosy A, et al. Phenytoin for neuroprotection in patients with acute optic neuritis: a randomised, placebo-controlled, phase 2 trial. Lancet Neurol. 2016 Jan 25 [Epub ahead of print].
Saidha S, Calabresi PA. Phenytoin in acute optic neuritis: neuroprotective or not? Lancet Neurol. 2016 Jan 25 [Epub ahead of print].